Union County, NC
Union County Map
Union County Overview
240,109
TOTAL POPULATION
119,375
MALE POPULATION
120,734
FEMALE POPULATION
98.87
MALES / 100 FEMALES
101.14
FEMALES / 100 MALES
38.9
MEDIAN AGE
3.3
AVG FAMILY SIZE
3.0
AVG HOUSEHOLD SIZE
$43,957
PER CAPITA INCOME
$111,518
AVG FAMILY INCOME
$95,533
AVG HOUSEHOLD INCOME
31.8%
WAGE / INCOME GAP [ % ]
68.2¢/ $1
WAGE / INCOME GAP [ $ ]
$11,455
FAMILY INCOME DEFICIT
0.45
INEQUALITY / GINI INDEX
126,311
LABOR FORCE [ PEOPLE ]
67.7%
PERCENT IN LABOR FORCE
4.3%
UNEMPLOYMENT RATE
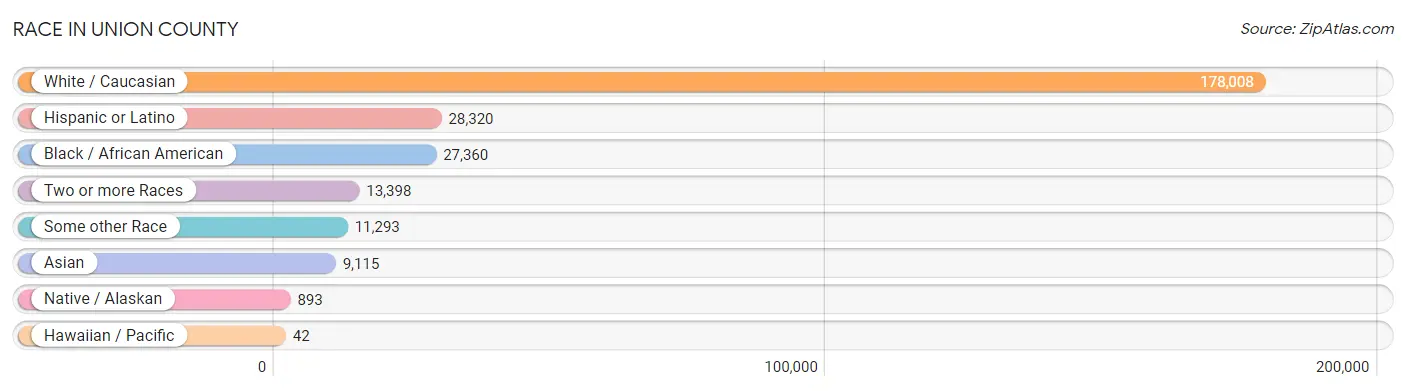
Race in Union County
The most populous races in Union County are White / Caucasian (178,008 | 74.1%), Hispanic or Latino (28,320 | 11.8%), and Black / African American (27,360 | 11.4%).
| Race | # Population | % Population |
| Asian | 9,115 | 3.8% |
| Black / African American | 27,360 | 11.4% |
| Hawaiian / Pacific | 42 | 0.0% |
| Hispanic or Latino | 28,320 | 11.8% |
| Native / Alaskan | 893 | 0.4% |
| White / Caucasian | 178,008 | 74.1% |
| Two or more Races | 13,398 | 5.6% |
| Some other Race | 11,293 | 4.7% |
| Total | 240,109 | 100.0% |
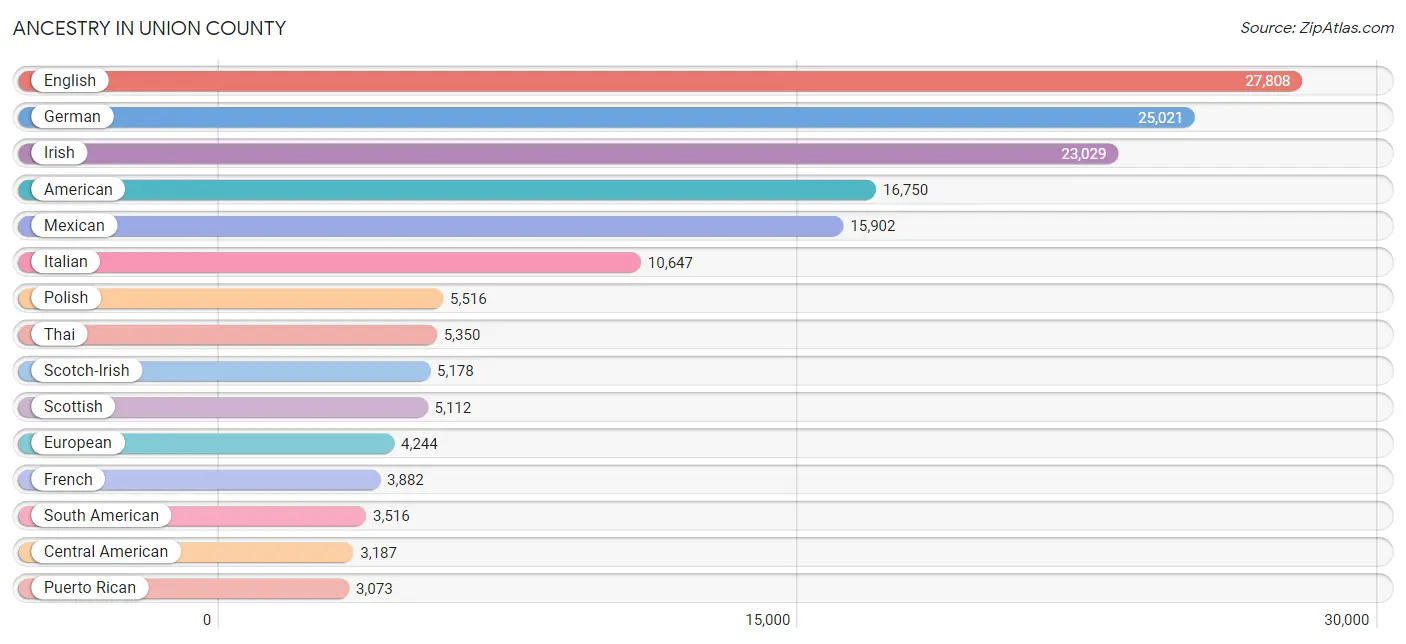
Ancestry in Union County
The most populous ancestries reported in Union County are English (27,808 | 11.6%), German (25,021 | 10.4%), Irish (23,029 | 9.6%), American (16,750 | 7.0%), and Mexican (15,902 | 6.6%), together accounting for 45.2% of all Union County residents.
| Ancestry | # Population | % Population |
| African | 639 | 0.3% |
| Albanian | 38 | 0.0% |
| American | 16,750 | 7.0% |
| Apache | 11 | 0.0% |
| Arab | 798 | 0.3% |
| Argentinean | 43 | 0.0% |
| Armenian | 110 | 0.1% |
| Assyrian / Chaldean / Syriac | 13 | 0.0% |
| Australian | 15 | 0.0% |
| Austrian | 467 | 0.2% |
| Bangladeshi | 391 | 0.2% |
| Barbadian | 79 | 0.0% |
| Basque | 10 | 0.0% |
| Belgian | 142 | 0.1% |
| Belizean | 16 | 0.0% |
| Bhutanese | 475 | 0.2% |
| Blackfeet | 102 | 0.0% |
| Bolivian | 18 | 0.0% |
| Brazilian | 673 | 0.3% |
| British | 1,549 | 0.6% |
| British West Indian | 45 | 0.0% |
| Bulgarian | 208 | 0.1% |
| Burmese | 652 | 0.3% |
| Cambodian | 28 | 0.0% |
| Canadian | 180 | 0.1% |
| Celtic | 1 | 0.0% |
| Central American | 3,187 | 1.3% |
| Central American Indian | 184 | 0.1% |
| Cherokee | 734 | 0.3% |
| Chickasaw | 15 | 0.0% |
| Chilean | 26 | 0.0% |
| Chippewa | 19 | 0.0% |
| Choctaw | 33 | 0.0% |
| Colombian | 940 | 0.4% |
| Costa Rican | 132 | 0.1% |
| Creek | 14 | 0.0% |
| Croatian | 144 | 0.1% |
| Crow | 5 | 0.0% |
| Cuban | 717 | 0.3% |
| Cypriot | 23 | 0.0% |
| Czech | 530 | 0.2% |
| Czechoslovakian | 85 | 0.0% |
| Danish | 215 | 0.1% |
| Dominican | 402 | 0.2% |
| Dutch | 1,872 | 0.8% |
| Dutch West Indian | 39 | 0.0% |
| Eastern European | 444 | 0.2% |
| Ecuadorian | 1,009 | 0.4% |
| Egyptian | 50 | 0.0% |
| English | 27,808 | 11.6% |
| Estonian | 18 | 0.0% |
| Ethiopian | 120 | 0.1% |
| European | 4,244 | 1.8% |
| Filipino | 76 | 0.0% |
| Finnish | 226 | 0.1% |
| French | 3,882 | 1.6% |
| French American Indian | 1 | 0.0% |
| French Canadian | 900 | 0.4% |
| German | 25,021 | 10.4% |
| Ghanaian | 52 | 0.0% |
| Greek | 1,388 | 0.6% |
| Guamanian / Chamorro | 15 | 0.0% |
| Guatemalan | 1,246 | 0.5% |
| Guyanese | 99 | 0.0% |
| Haitian | 313 | 0.1% |
| Honduran | 707 | 0.3% |
| Hungarian | 1,496 | 0.6% |
| Icelander | 11 | 0.0% |
| Indian (Asian) | 1,146 | 0.5% |
| Indonesian | 216 | 0.1% |
| Inupiat | 15 | 0.0% |
| Iranian | 125 | 0.1% |
| Irish | 23,029 | 9.6% |
| Iroquois | 6 | 0.0% |
| Italian | 10,647 | 4.4% |
| Jamaican | 522 | 0.2% |
| Japanese | 4 | 0.0% |
| Jordanian | 113 | 0.1% |
| Kenyan | 7 | 0.0% |
| Korean | 1,261 | 0.5% |
| Laotian | 40 | 0.0% |
| Latvian | 113 | 0.1% |
| Lebanese | 310 | 0.1% |
| Liberian | 137 | 0.1% |
| Lithuanian | 447 | 0.2% |
| Lumbee | 504 | 0.2% |
| Malaysian | 36 | 0.0% |
| Maltese | 24 | 0.0% |
| Mexican | 15,902 | 6.6% |
| Mexican American Indian | 294 | 0.1% |
| Moroccan | 61 | 0.0% |
| Native Hawaiian | 75 | 0.0% |
| Nicaraguan | 66 | 0.0% |
| Nigerian | 451 | 0.2% |
| Northern European | 273 | 0.1% |
| Norwegian | 1,046 | 0.4% |
| Okinawan | 14 | 0.0% |
| Pakistani | 45 | 0.0% |
| Palestinian | 38 | 0.0% |
| Panamanian | 93 | 0.0% |
| Pennsylvania German | 14 | 0.0% |
| Peruvian | 607 | 0.3% |
| Polish | 5,516 | 2.3% |
| Portuguese | 400 | 0.2% |
| Puerto Rican | 3,073 | 1.3% |
| Romanian | 566 | 0.2% |
| Russian | 1,851 | 0.8% |
| Salvadoran | 943 | 0.4% |
| Scandinavian | 571 | 0.2% |
| Scotch-Irish | 5,178 | 2.2% |
| Scottish | 5,112 | 2.1% |
| Serbian | 22 | 0.0% |
| Sierra Leonean | 101 | 0.0% |
| Sioux | 49 | 0.0% |
| Slavic | 120 | 0.1% |
| Slovak | 419 | 0.2% |
| Slovene | 119 | 0.1% |
| South African | 239 | 0.1% |
| South American | 3,516 | 1.5% |
| South American Indian | 71 | 0.0% |
| Spaniard | 425 | 0.2% |
| Spanish | 296 | 0.1% |
| Sri Lankan | 888 | 0.4% |
| Subsaharan African | 2,087 | 0.9% |
| Swedish | 1,595 | 0.7% |
| Swiss | 781 | 0.3% |
| Syrian | 77 | 0.0% |
| Thai | 5,350 | 2.2% |
| Tongan | 43 | 0.0% |
| Trinidadian and Tobagonian | 80 | 0.0% |
| Turkish | 387 | 0.2% |
| Ugandan | 113 | 0.1% |
| Ukrainian | 1,670 | 0.7% |
| Venezuelan | 840 | 0.4% |
| Vietnamese | 10 | 0.0% |
| Welsh | 1,157 | 0.5% |
| West Indian | 129 | 0.1% |
| Yugoslavian | 228 | 0.1% |
| Zimbabwean | 33 | 0.0% | View All 139 Rows |
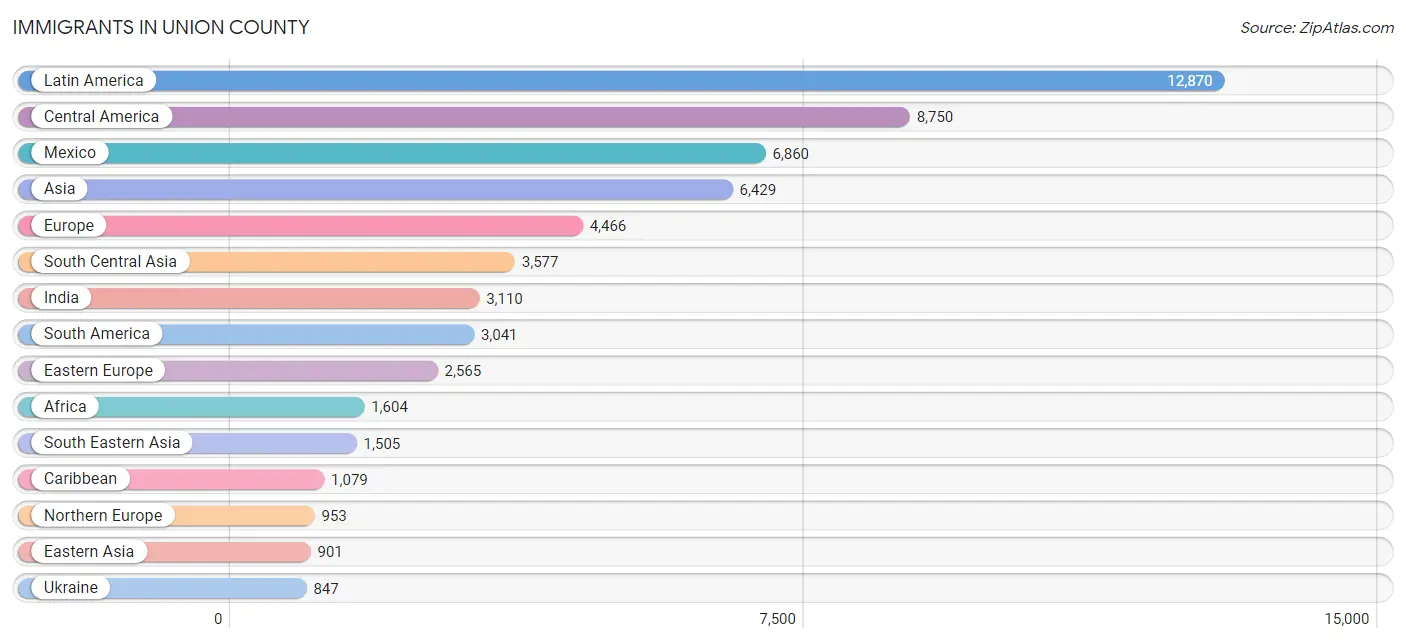
Immigrants in Union County
The most numerous immigrant groups reported in Union County came from Latin America (12,870 | 5.4%), Central America (8,750 | 3.6%), Mexico (6,860 | 2.9%), Asia (6,429 | 2.7%), and Europe (4,466 | 1.9%), together accounting for 16.4% of all Union County residents.
| Immigration Origin | # Population | % Population |
| Africa | 1,604 | 0.7% |
| Albania | 88 | 0.0% |
| Argentina | 57 | 0.0% |
| Armenia | 13 | 0.0% |
| Asia | 6,429 | 2.7% |
| Australia | 23 | 0.0% |
| Bangladesh | 3 | 0.0% |
| Barbados | 32 | 0.0% |
| Belarus | 121 | 0.1% |
| Belgium | 74 | 0.0% |
| Belize | 25 | 0.0% |
| Bolivia | 13 | 0.0% |
| Bosnia and Herzegovina | 108 | 0.0% |
| Brazil | 666 | 0.3% |
| Bulgaria | 64 | 0.0% |
| Cameroon | 13 | 0.0% |
| Canada | 582 | 0.2% |
| Caribbean | 1,079 | 0.4% |
| Central America | 8,750 | 3.6% |
| Chile | 27 | 0.0% |
| China | 639 | 0.3% |
| Colombia | 528 | 0.2% |
| Costa Rica | 112 | 0.1% |
| Croatia | 7 | 0.0% |
| Cuba | 214 | 0.1% |
| Czechoslovakia | 53 | 0.0% |
| Denmark | 22 | 0.0% |
| Dominican Republic | 199 | 0.1% |
| Eastern Africa | 299 | 0.1% |
| Eastern Asia | 901 | 0.4% |
| Eastern Europe | 2,565 | 1.1% |
| Ecuador | 461 | 0.2% |
| Egypt | 15 | 0.0% |
| El Salvador | 612 | 0.3% |
| England | 335 | 0.1% |
| Eritrea | 68 | 0.0% |
| Ethiopia | 65 | 0.0% |
| Europe | 4,466 | 1.9% |
| France | 62 | 0.0% |
| Germany | 259 | 0.1% |
| Ghana | 74 | 0.0% |
| Greece | 131 | 0.1% |
| Grenada | 29 | 0.0% |
| Guatemala | 829 | 0.4% |
| Guyana | 116 | 0.1% |
| Haiti | 179 | 0.1% |
| Honduras | 229 | 0.1% |
| Hong Kong | 61 | 0.0% |
| Hungary | 17 | 0.0% |
| India | 3,110 | 1.3% |
| Indonesia | 25 | 0.0% |
| Iran | 69 | 0.0% |
| Ireland | 65 | 0.0% |
| Israel | 27 | 0.0% |
| Italy | 79 | 0.0% |
| Jamaica | 344 | 0.1% |
| Japan | 58 | 0.0% |
| Jordan | 108 | 0.0% |
| Kazakhstan | 52 | 0.0% |
| Kenya | 53 | 0.0% |
| Korea | 204 | 0.1% |
| Kuwait | 25 | 0.0% |
| Laos | 167 | 0.1% |
| Latin America | 12,870 | 5.4% |
| Latvia | 65 | 0.0% |
| Lebanon | 88 | 0.0% |
| Liberia | 170 | 0.1% |
| Malaysia | 109 | 0.1% |
| Mexico | 6,860 | 2.9% |
| Middle Africa | 249 | 0.1% |
| Moldova | 129 | 0.1% |
| Morocco | 17 | 0.0% |
| Nepal | 84 | 0.0% |
| Netherlands | 36 | 0.0% |
| Nicaragua | 68 | 0.0% |
| Nigeria | 218 | 0.1% |
| Northern Africa | 32 | 0.0% |
| Northern Europe | 953 | 0.4% |
| Oceania | 23 | 0.0% |
| Pakistan | 30 | 0.0% |
| Panama | 15 | 0.0% |
| Peru | 527 | 0.2% |
| Philippines | 437 | 0.2% |
| Poland | 221 | 0.1% |
| Portugal | 102 | 0.0% |
| Romania | 120 | 0.1% |
| Russia | 569 | 0.2% |
| Saudi Arabia | 44 | 0.0% |
| Scotland | 76 | 0.0% |
| Sierra Leone | 120 | 0.1% |
| Singapore | 26 | 0.0% |
| South Africa | 278 | 0.1% |
| South America | 3,041 | 1.3% |
| South Central Asia | 3,577 | 1.5% |
| South Eastern Asia | 1,505 | 0.6% |
| Southern Europe | 508 | 0.2% |
| Spain | 196 | 0.1% |
| Sweden | 13 | 0.0% |
| Switzerland | 9 | 0.0% |
| Syria | 13 | 0.0% |
| Taiwan | 111 | 0.1% |
| Thailand | 43 | 0.0% |
| Trinidad and Tobago | 50 | 0.0% |
| Turkey | 99 | 0.0% |
| Uganda | 15 | 0.0% |
| Ukraine | 847 | 0.4% |
| Uzbekistan | 172 | 0.1% |
| Venezuela | 626 | 0.3% |
| Vietnam | 547 | 0.2% |
| Western Africa | 650 | 0.3% |
| Western Asia | 446 | 0.2% |
| Western Europe | 440 | 0.2% |
| Yemen | 3 | 0.0% |
| Zaire | 236 | 0.1% |
| Zimbabwe | 33 | 0.0% | View All 115 Rows |
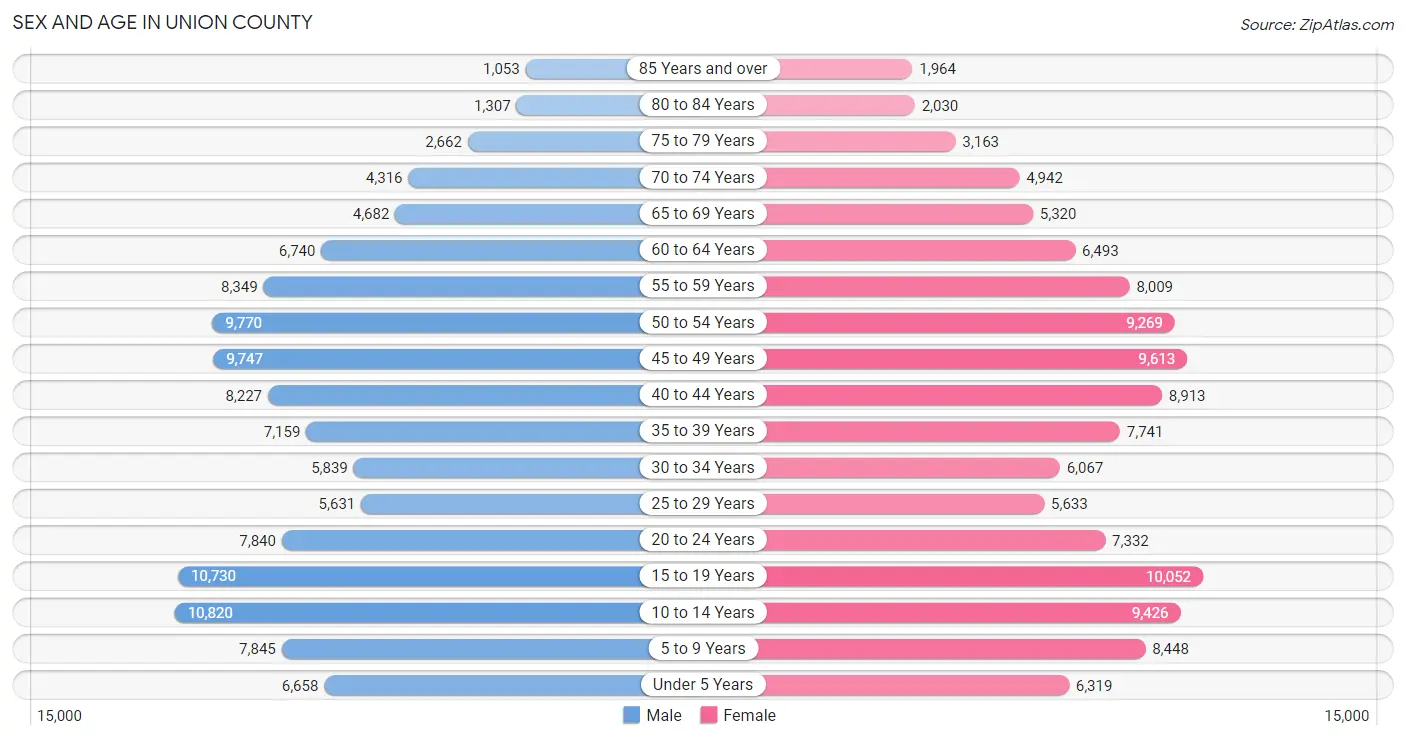
Sex and Age in Union County
Sex and Age in Union County
The most populous age groups in Union County are 10 to 14 Years (10,820 | 9.1%) for men and 15 to 19 Years (10,052 | 8.3%) for women.
| Age Bracket | Male | Female |
| Under 5 Years | 6,658 (5.6%) | 6,319 (5.2%) |
| 5 to 9 Years | 7,845 (6.6%) | 8,448 (7.0%) |
| 10 to 14 Years | 10,820 (9.1%) | 9,426 (7.8%) |
| 15 to 19 Years | 10,730 (9.0%) | 10,052 (8.3%) |
| 20 to 24 Years | 7,840 (6.6%) | 7,332 (6.1%) |
| 25 to 29 Years | 5,631 (4.7%) | 5,633 (4.7%) |
| 30 to 34 Years | 5,839 (4.9%) | 6,067 (5.0%) |
| 35 to 39 Years | 7,159 (6.0%) | 7,741 (6.4%) |
| 40 to 44 Years | 8,227 (6.9%) | 8,913 (7.4%) |
| 45 to 49 Years | 9,747 (8.2%) | 9,613 (8.0%) |
| 50 to 54 Years | 9,770 (8.2%) | 9,269 (7.7%) |
| 55 to 59 Years | 8,349 (7.0%) | 8,009 (6.6%) |
| 60 to 64 Years | 6,740 (5.7%) | 6,493 (5.4%) |
| 65 to 69 Years | 4,682 (3.9%) | 5,320 (4.4%) |
| 70 to 74 Years | 4,316 (3.6%) | 4,942 (4.1%) |
| 75 to 79 Years | 2,662 (2.2%) | 3,163 (2.6%) |
| 80 to 84 Years | 1,307 (1.1%) | 2,030 (1.7%) |
| 85 Years and over | 1,053 (0.9%) | 1,964 (1.6%) |
| Total | 119,375 (100.0%) | 120,734 (100.0%) |
Families and Households in Union County
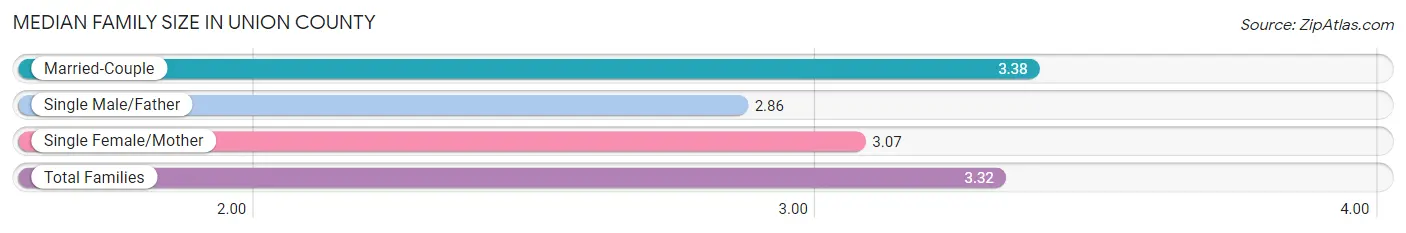
Median Family Size in Union County
The median family size in Union County is 3.32 persons per family, with married-couple families (53,139 | 82.6%) accounting for the largest median family size of 3.38 persons per family. On the other hand, single male/father families (3,530 | 5.5%) represent the smallest median family size with 2.86 persons per family.
| Family Type | # Families | Family Size |
| Married-Couple | 53,139 (82.6%) | 3.38 |
| Single Male/Father | 3,530 (5.5%) | 2.86 |
| Single Female/Mother | 7,641 (11.9%) | 3.07 |
| Total Families | 64,310 (100.0%) | 3.32 |
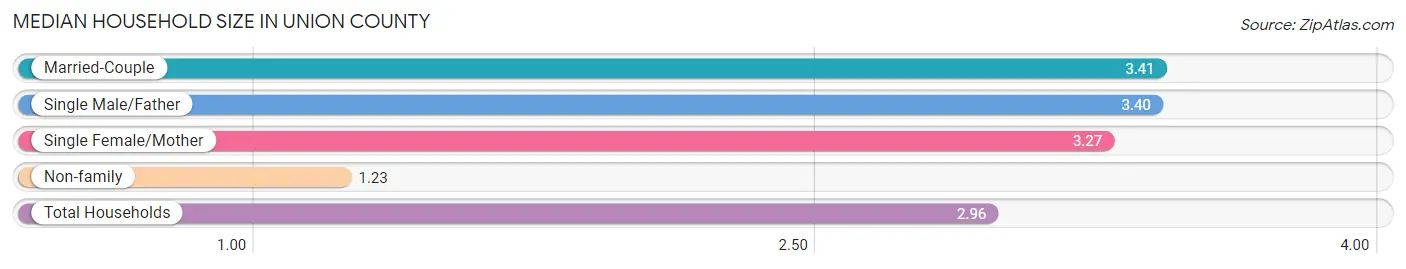
Median Household Size in Union County
The median household size in Union County is 2.96 persons per household, with married-couple households (53,139 | 66.2%) accounting for the largest median household size of 3.41 persons per household. non-family households (15,961 | 19.9%) represent the smallest median household size with 1.23 persons per household.
| Household Type | # Households | Household Size |
| Married-Couple | 53,139 (66.2%) | 3.41 |
| Single Male/Father | 3,530 (4.4%) | 3.40 |
| Single Female/Mother | 7,641 (9.5%) | 3.27 |
| Non-family | 15,961 (19.9%) | 1.23 |
| Total Households | 80,271 (100.0%) | 2.96 |
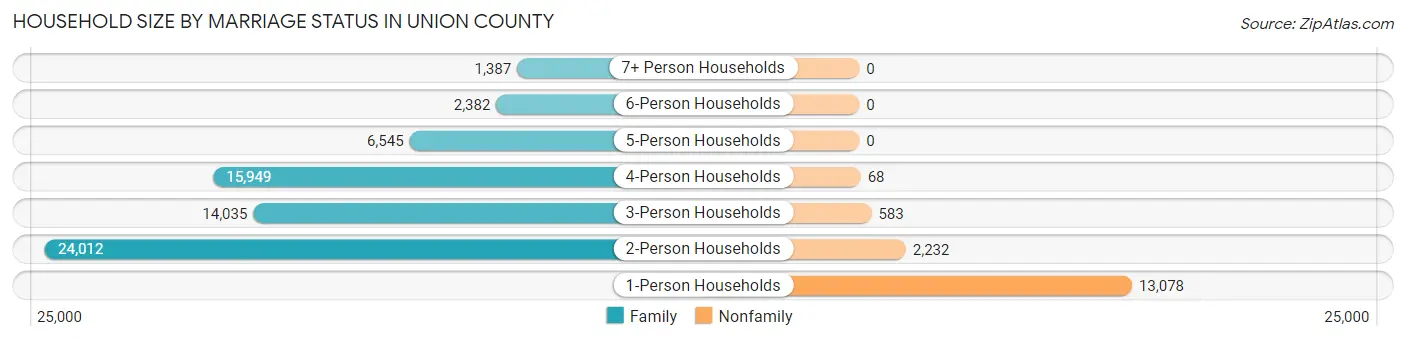
Household Size by Marriage Status in Union County
Out of a total of 80,271 households in Union County, 64,310 (80.1%) are family households, while 15,961 (19.9%) are nonfamily households. The most numerous type of family households are 2-person households, comprising 24,012, and the most common type of nonfamily households are 1-person households, comprising 13,078.
| Household Size | Family Households | Nonfamily Households |
| 1-Person Households | - | 13,078 (16.3%) |
| 2-Person Households | 24,012 (29.9%) | 2,232 (2.8%) |
| 3-Person Households | 14,035 (17.5%) | 583 (0.7%) |
| 4-Person Households | 15,949 (19.9%) | 68 (0.1%) |
| 5-Person Households | 6,545 (8.2%) | 0 (0.0%) |
| 6-Person Households | 2,382 (3.0%) | 0 (0.0%) |
| 7+ Person Households | 1,387 (1.7%) | 0 (0.0%) |
| Total | 64,310 (80.1%) | 15,961 (19.9%) |
Female Fertility in Union County
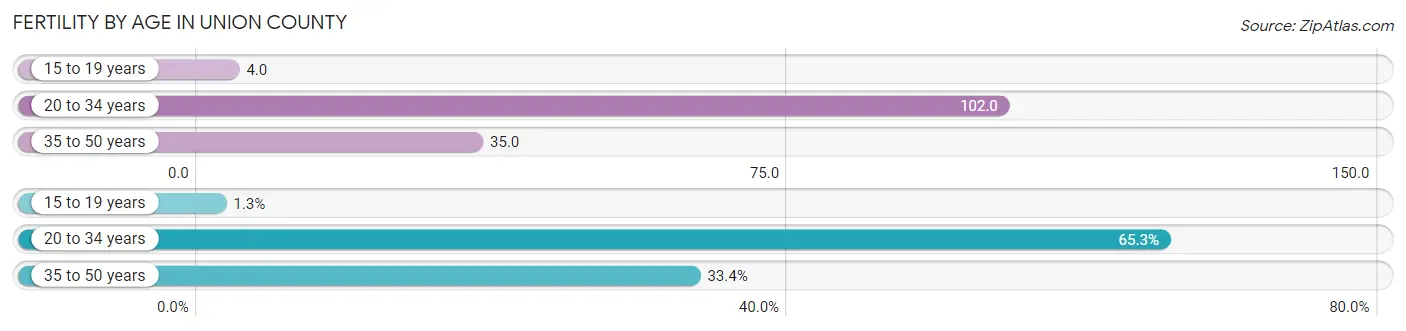
Fertility by Age in Union County
Average fertility rate in Union County is 52.0 births per 1,000 women. Women in the age bracket of 20 to 34 years have the highest fertility rate with 102.0 births per 1,000 women. Women in the age bracket of 20 to 34 years acount for 65.3% of all women with births.
| Age Bracket | Women with Births | Births / 1,000 Women |
| 15 to 19 years | 37 (1.3%) | 4.0 |
| 20 to 34 years | 1,937 (65.3%) | 102.0 |
| 35 to 50 years | 991 (33.4%) | 35.0 |
| Total | 2,965 (100.0%) | 52.0 |
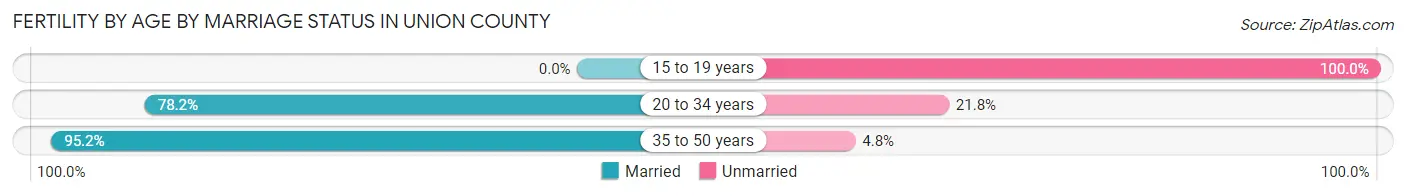
Fertility by Age by Marriage Status in Union County
82.9% of women with births (2,965) in Union County are married. The highest percentage of unmarried women with births falls into 15 to 19 years age bracket with 100.0% of them unmarried at the time of birth, while the lowest percentage of unmarried women with births belong to 35 to 50 years age bracket with 4.8% of them unmarried.
| Age Bracket | Married | Unmarried |
| 15 to 19 years | 0 (0.0%) | 37 (100.0%) |
| 20 to 34 years | 1,515 (78.2%) | 422 (21.8%) |
| 35 to 50 years | 943 (95.2%) | 48 (4.8%) |
| Total | 2,458 (82.9%) | 507 (17.1%) |
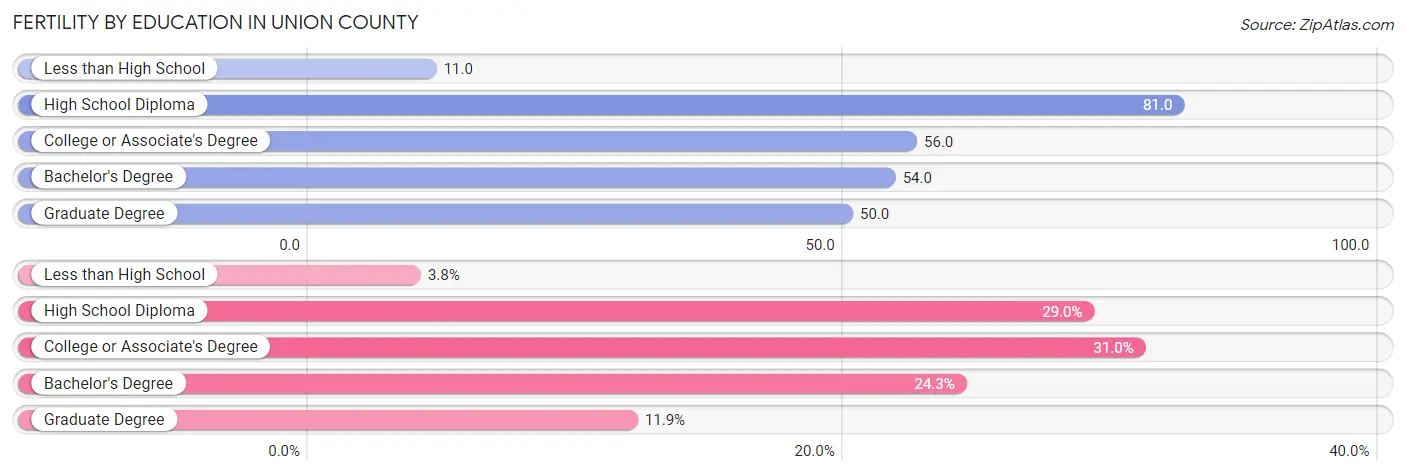
Fertility by Education in Union County
Average fertility rate in Union County is 52.0 births per 1,000 women. Women with the education attainment of high school diploma have the highest fertility rate of 81.0 births per 1,000 women, while women with the education attainment of less than high school have the lowest fertility at 11.0 births per 1,000 women. Women with the education attainment of college or associate's degree represent 31.0% of all women with births.
| Educational Attainment | Women with Births | Births / 1,000 Women |
| Less than High School | 113 (3.8%) | 11.0 |
| High School Diploma | 861 (29.0%) | 81.0 |
| College or Associate's Degree | 918 (31.0%) | 56.0 |
| Bachelor's Degree | 719 (24.2%) | 54.0 |
| Graduate Degree | 354 (11.9%) | 50.0 |
| Total | 2,965 (100.0%) | 52.0 |
Fertility by Education by Marriage Status in Union County
17.1% of women with births in Union County are unmarried. Women with the educational attainment of graduate degree are most likely to be married with 98.0% of them married at childbirth, while women with the educational attainment of high school diploma are least likely to be married with 33.3% of them unmarried at childbirth.

| Educational Attainment | Married | Unmarried |
| Less than High School | 96 (85.0%) | 17 (15.0%) |
| High School Diploma | 574 (66.7%) | 287 (33.3%) |
| College or Associate's Degree | 748 (81.5%) | 170 (18.5%) |
| Bachelor's Degree | 692 (96.2%) | 27 (3.8%) |
| Graduate Degree | 347 (98.0%) | 7 (2.0%) |
| Total | 2,458 (82.9%) | 507 (17.1%) |
Income in Union County
Income Overview in Union County
Per Capita Income in Union County is $43,957, while median incomes of families and households are $111,518 and $95,533 respectively.
| Characteristic | Number | Measure |
| Per Capita Income | 240,109 | $43,957 |
| Median Family Income | 64,310 | $111,518 |
| Mean Family Income | 64,310 | $143,992 |
| Median Household Income | 80,271 | $95,533 |
| Mean Household Income | 80,271 | $129,144 |
| Income Deficit | 64,310 | $11,455 |
| Wage / Income Gap (%) | 240,109 | 31.80% |
| Wage / Income Gap ($) | 240,109 | 68.20¢ per $1 |
| Gini / Inequality Index | 240,109 | 0.45 |
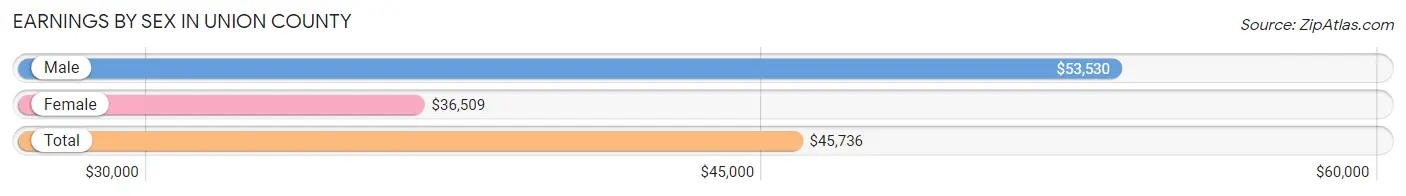
Earnings by Sex in Union County
Average Earnings in Union County are $45,736, $53,530 for men and $36,509 for women, a difference of 31.8%.
| Sex | Number | Average Earnings |
| Male | 71,073 (53.8%) | $53,530 |
| Female | 60,943 (46.2%) | $36,509 |
| Total | 132,016 (100.0%) | $45,736 |
Earnings by Sex by Income Bracket in Union County
The most common earnings brackets in Union County are $100,000+ for men (18,220 | 25.6%) and $100,000+ for women (6,622 | 10.9%).
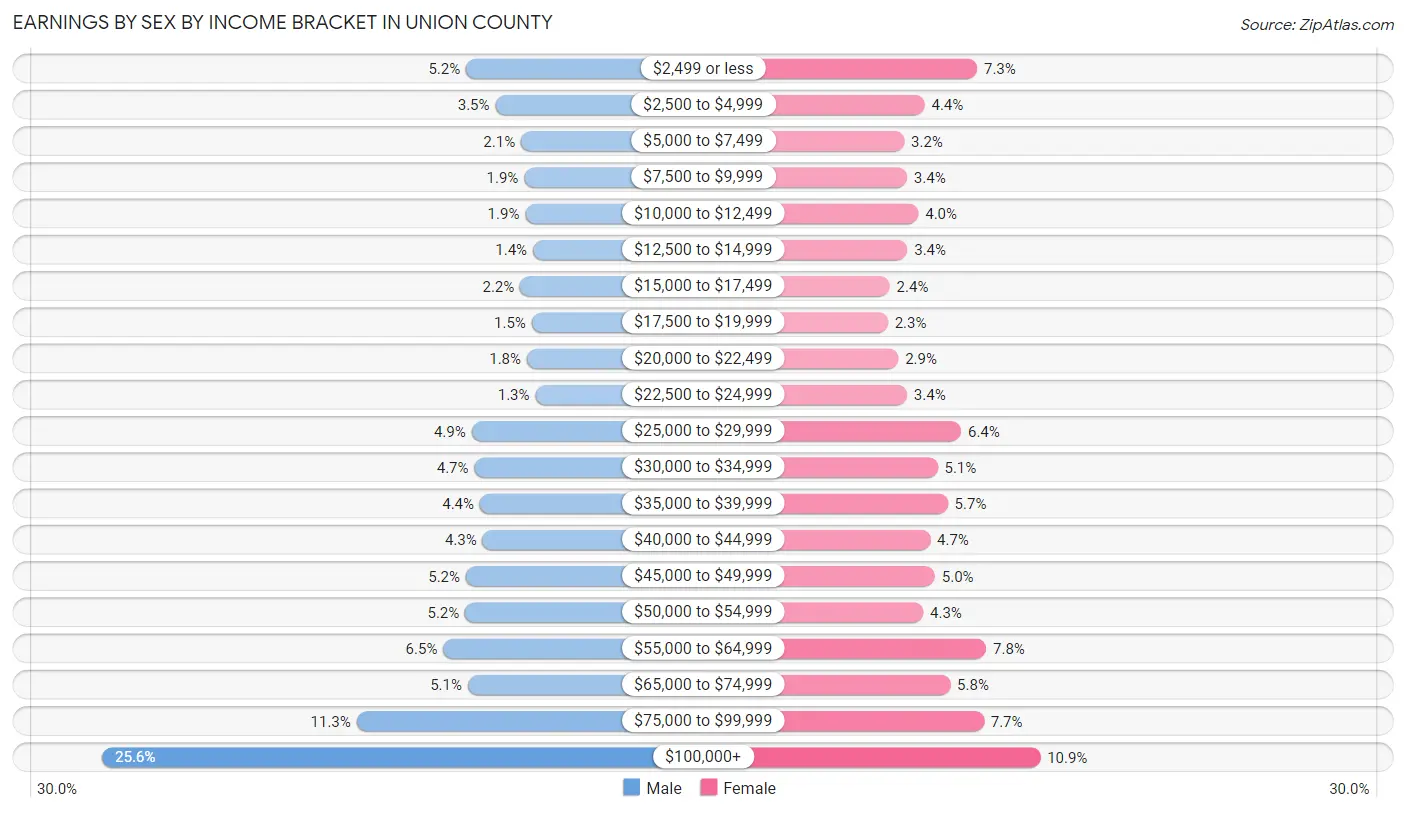
| Income | Male | Female |
| $2,499 or less | 3,689 (5.2%) | 4,460 (7.3%) |
| $2,500 to $4,999 | 2,517 (3.5%) | 2,666 (4.4%) |
| $5,000 to $7,499 | 1,495 (2.1%) | 1,964 (3.2%) |
| $7,500 to $9,999 | 1,362 (1.9%) | 2,061 (3.4%) |
| $10,000 to $12,499 | 1,324 (1.9%) | 2,448 (4.0%) |
| $12,500 to $14,999 | 1,013 (1.4%) | 2,074 (3.4%) |
| $15,000 to $17,499 | 1,527 (2.1%) | 1,470 (2.4%) |
| $17,500 to $19,999 | 1,067 (1.5%) | 1,403 (2.3%) |
| $20,000 to $22,499 | 1,258 (1.8%) | 1,760 (2.9%) |
| $22,500 to $24,999 | 916 (1.3%) | 2,057 (3.4%) |
| $25,000 to $29,999 | 3,466 (4.9%) | 3,914 (6.4%) |
| $30,000 to $34,999 | 3,356 (4.7%) | 3,109 (5.1%) |
| $35,000 to $39,999 | 3,133 (4.4%) | 3,453 (5.7%) |
| $40,000 to $44,999 | 3,031 (4.3%) | 2,851 (4.7%) |
| $45,000 to $49,999 | 3,695 (5.2%) | 3,014 (5.0%) |
| $50,000 to $54,999 | 3,726 (5.2%) | 2,615 (4.3%) |
| $55,000 to $64,999 | 4,596 (6.5%) | 4,774 (7.8%) |
| $65,000 to $74,999 | 3,621 (5.1%) | 3,538 (5.8%) |
| $75,000 to $99,999 | 8,061 (11.3%) | 4,690 (7.7%) |
| $100,000+ | 18,220 (25.6%) | 6,622 (10.9%) |
| Total | 71,073 (100.0%) | 60,943 (100.0%) |
Earnings by Sex by Educational Attainment in Union County
Average earnings in Union County are $64,337 for men and $44,434 for women, a difference of 30.9%. Men with an educational attainment of graduate degree enjoy the highest average annual earnings of $136,506, while those with less than high school education earn the least with $39,324. Women with an educational attainment of graduate degree earn the most with the average annual earnings of $63,672, while those with less than high school education have the smallest earnings of $23,417.
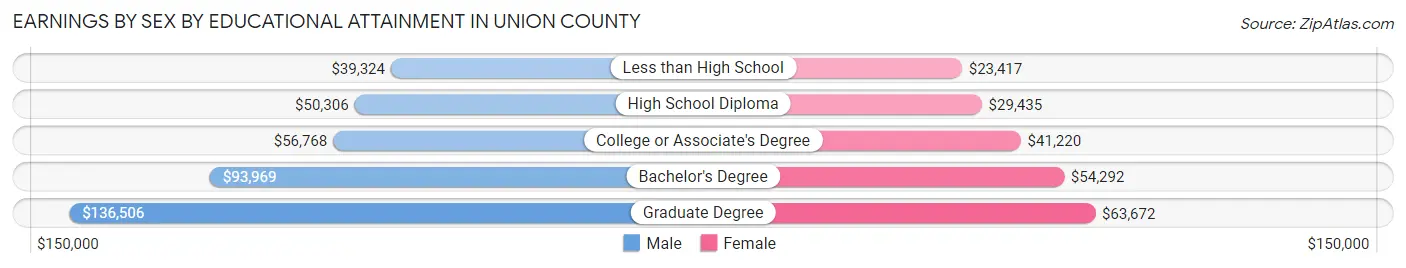
| Educational Attainment | Male Income | Female Income |
| Less than High School | $39,324 | $23,417 |
| High School Diploma | $50,306 | $29,435 |
| College or Associate's Degree | $56,768 | $41,220 |
| Bachelor's Degree | $93,969 | $54,292 |
| Graduate Degree | $136,506 | $63,672 |
| Total | $64,337 | $44,434 |
Family Income in Union County
Family Income Brackets in Union County
According to the Union County family income data, there are 14,020 families falling into the $100,000 to $149,999 income range, which is the most common income bracket and makes up 21.8% of all families. Conversely, the $10,000 to $14,999 income bracket is the least frequent group with only 450 families (0.7%) belonging to this category.
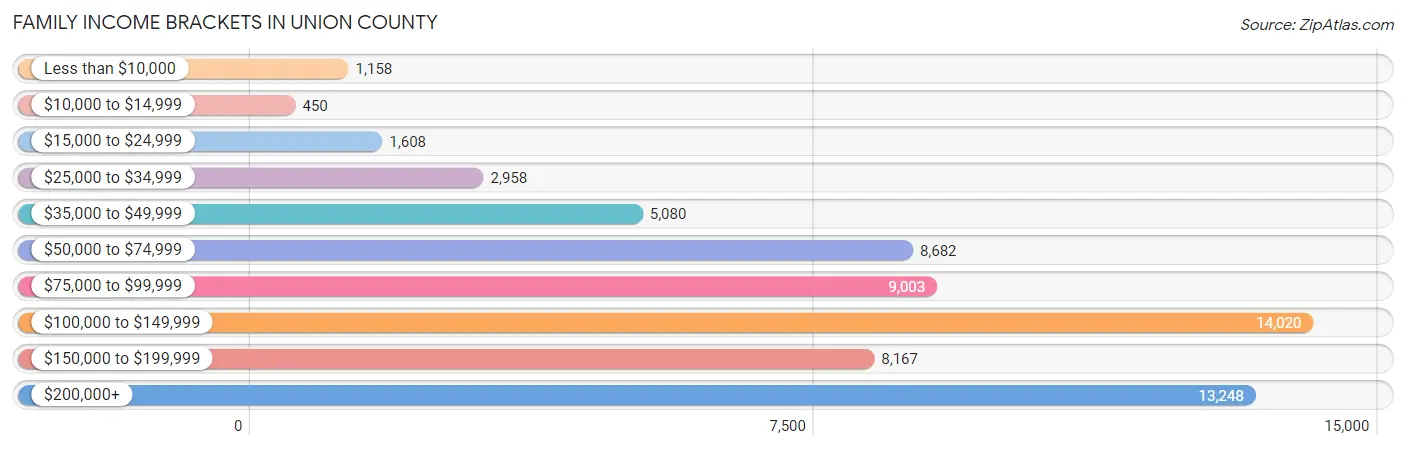
| Income Bracket | # Families | % Families |
| Less than $10,000 | 1,158 | 1.8% |
| $10,000 to $14,999 | 450 | 0.7% |
| $15,000 to $24,999 | 1,608 | 2.5% |
| $25,000 to $34,999 | 2,958 | 4.6% |
| $35,000 to $49,999 | 5,080 | 7.9% |
| $50,000 to $74,999 | 8,682 | 13.5% |
| $75,000 to $99,999 | 9,003 | 14.0% |
| $100,000 to $149,999 | 14,020 | 21.8% |
| $150,000 to $199,999 | 8,167 | 12.7% |
| $200,000+ | 13,248 | 20.6% |
Family Income by Famaliy Size in Union County
6-person families (2,209 | 3.4%) account for the highest median family income in Union County with $148,675 per family, while 2-person families (25,779 | 40.1%) have the highest median income of $43,719 per family member.
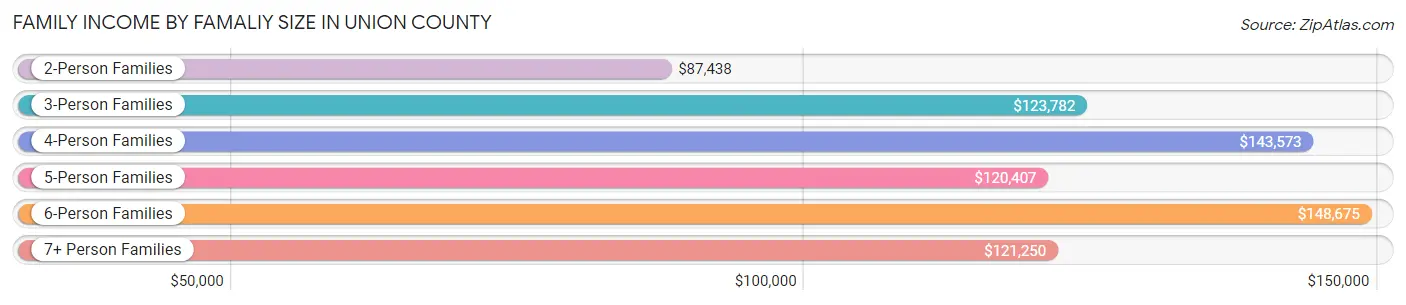
| Income Bracket | # Families | Median Income |
| 2-Person Families | 25,779 (40.1%) | $87,438 |
| 3-Person Families | 13,367 (20.8%) | $123,782 |
| 4-Person Families | 15,463 (24.0%) | $143,573 |
| 5-Person Families | 6,389 (9.9%) | $120,407 |
| 6-Person Families | 2,209 (3.4%) | $148,675 |
| 7+ Person Families | 1,103 (1.7%) | $121,250 |
| Total | 64,310 (100.0%) | $111,518 |
Family Income by Number of Earners in Union County
The median family income in Union County is $111,518, with families comprising 3+ earners (10,220) having the highest median family income of $152,079, while families with no earners (7,288) have the lowest median family income of $50,821, accounting for 15.9% and 11.3% of families, respectively.
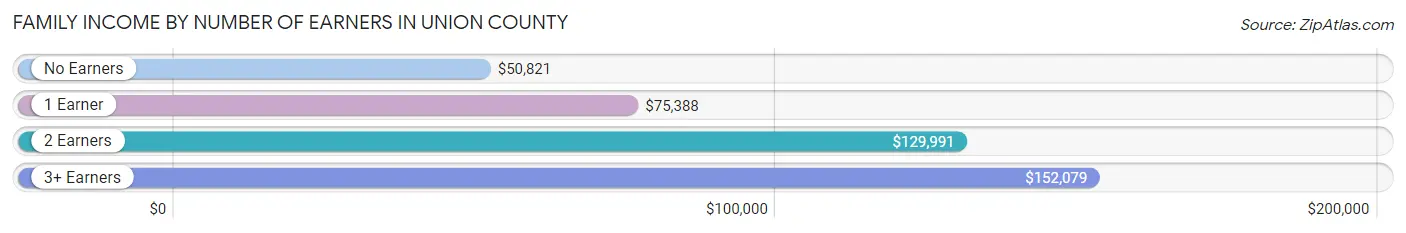
| Number of Earners | # Families | Median Income |
| No Earners | 7,288 (11.3%) | $50,821 |
| 1 Earner | 17,085 (26.6%) | $75,388 |
| 2 Earners | 29,717 (46.2%) | $129,991 |
| 3+ Earners | 10,220 (15.9%) | $152,079 |
| Total | 64,310 (100.0%) | $111,518 |
Household Income in Union County
Household Income Brackets in Union County
With 15,813 households falling in the category, the $100,000 to $149,999 income range is the most frequent in Union County, accounting for 19.7% of all households. In contrast, only 1,204 households (1.5%) fall into the $10,000 to $14,999 income bracket, making it the least populous group.
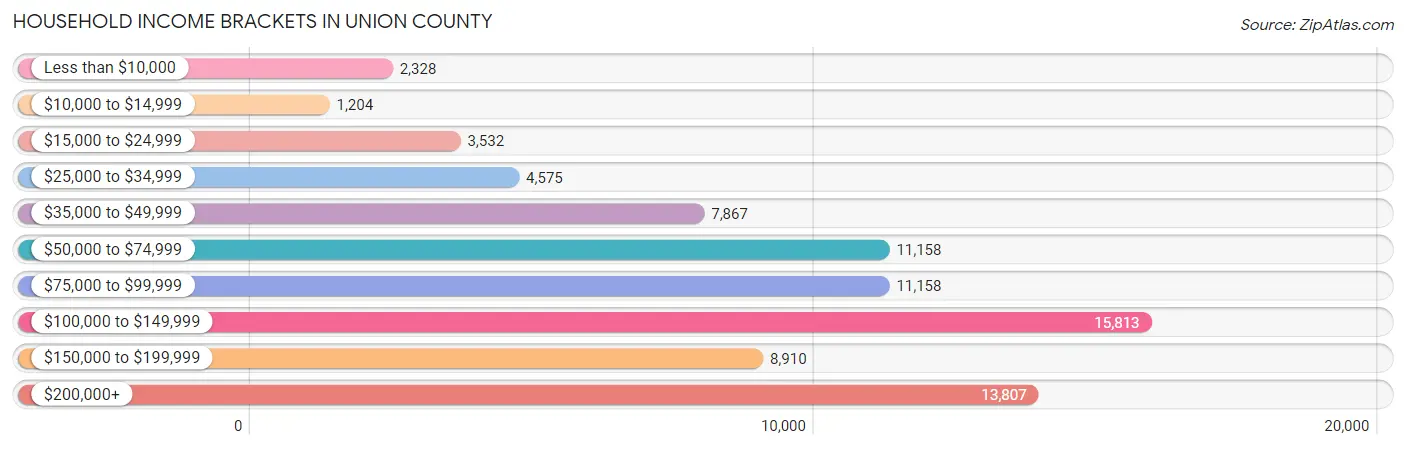
| Income Bracket | # Households | % Households |
| Less than $10,000 | 2,328 | 2.9% |
| $10,000 to $14,999 | 1,204 | 1.5% |
| $15,000 to $24,999 | 3,532 | 4.4% |
| $25,000 to $34,999 | 4,575 | 5.7% |
| $35,000 to $49,999 | 7,867 | 9.8% |
| $50,000 to $74,999 | 11,158 | 13.9% |
| $75,000 to $99,999 | 11,158 | 13.9% |
| $100,000 to $149,999 | 15,813 | 19.7% |
| $150,000 to $199,999 | 8,910 | 11.1% |
| $200,000+ | 13,807 | 17.2% |
Household Income by Householder Age in Union County
The median household income in Union County is $95,533, with the highest median household income of $118,032 found in the 45 to 64 years age bracket for the primary householder. A total of 36,515 households (45.5%) fall into this category. Meanwhile, the 15 to 24 years age bracket for the primary householder has the lowest median household income of $46,854, with 1,555 households (1.9%) in this group.
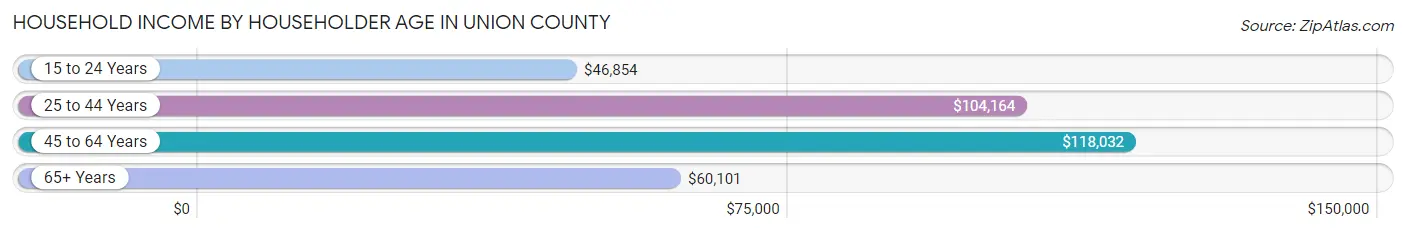
| Income Bracket | # Households | Median Income |
| 15 to 24 Years | 1,555 (1.9%) | $46,854 |
| 25 to 44 Years | 24,590 (30.6%) | $104,164 |
| 45 to 64 Years | 36,515 (45.5%) | $118,032 |
| 65+ Years | 17,611 (21.9%) | $60,101 |
| Total | 80,271 (100.0%) | $95,533 |
Poverty in Union County
Income Below Poverty by Sex and Age in Union County
With 6.3% poverty level for males and 7.3% for females among the residents of Union County, under 5 year old males and 75 year old and over females are the most vulnerable to poverty, with 812 males (12.3%) and 829 females (12.2%) in their respective age groups living below the poverty level.

| Age Bracket | Male | Female |
| Under 5 Years | 812 (12.3%) | 584 (9.3%) |
| 5 Years | 85 (6.7%) | 50 (3.2%) |
| 6 to 11 Years | 993 (9.5%) | 1,065 (10.2%) |
| 12 to 14 Years | 422 (6.5%) | 268 (4.7%) |
| 15 Years | 212 (10.1%) | 72 (3.7%) |
| 16 and 17 Years | 482 (10.5%) | 236 (5.4%) |
| 18 to 24 Years | 827 (7.4%) | 1,049 (10.1%) |
| 25 to 34 Years | 537 (4.7%) | 990 (8.5%) |
| 35 to 44 Years | 840 (5.5%) | 1,310 (7.9%) |
| 45 to 54 Years | 756 (3.9%) | 802 (4.3%) |
| 55 to 64 Years | 800 (5.3%) | 914 (6.3%) |
| 65 to 74 Years | 453 (5.1%) | 501 (4.9%) |
| 75 Years and over | 236 (4.9%) | 829 (12.2%) |
| Total | 7,455 (6.3%) | 8,670 (7.3%) |
Income Above Poverty by Sex and Age in Union County
According to the poverty statistics in Union County, males aged 45 to 54 years and females aged 5 years are the age groups that are most secure financially, with 96.1% of males and 96.8% of females in these age groups living above the poverty line.
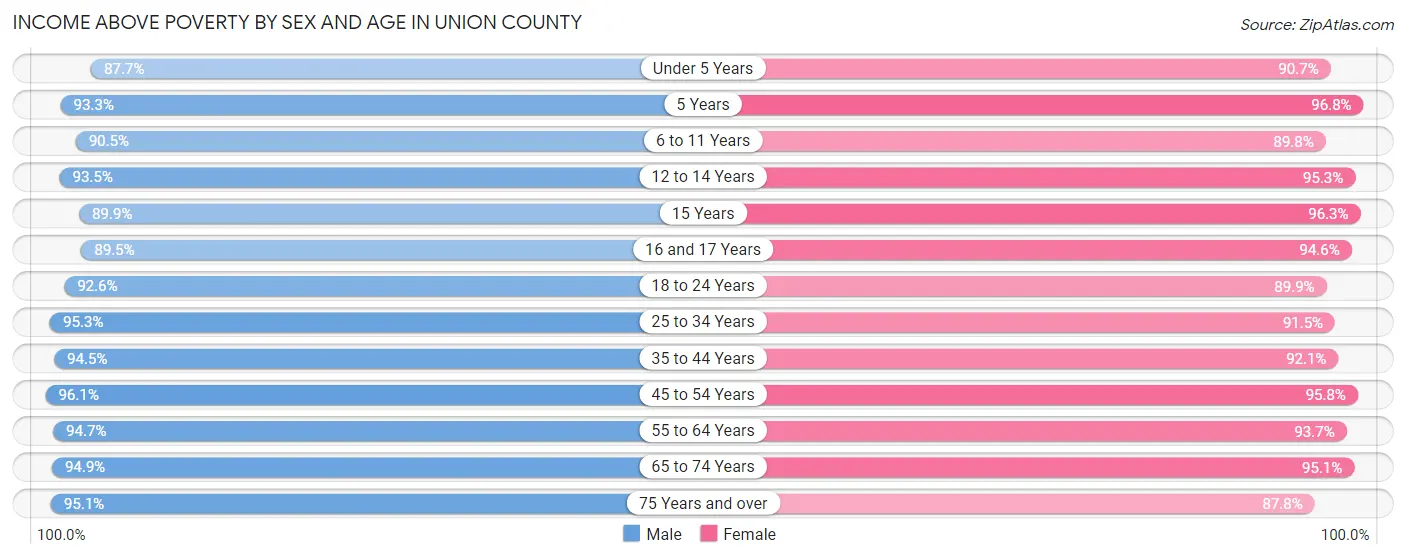
| Age Bracket | Male | Female |
| Under 5 Years | 5,776 (87.7%) | 5,696 (90.7%) |
| 5 Years | 1,187 (93.3%) | 1,519 (96.8%) |
| 6 to 11 Years | 9,466 (90.5%) | 9,364 (89.8%) |
| 12 to 14 Years | 6,079 (93.5%) | 5,398 (95.3%) |
| 15 Years | 1,886 (89.9%) | 1,849 (96.3%) |
| 16 and 17 Years | 4,090 (89.5%) | 4,140 (94.6%) |
| 18 to 24 Years | 10,405 (92.6%) | 9,378 (89.9%) |
| 25 to 34 Years | 10,817 (95.3%) | 10,698 (91.5%) |
| 35 to 44 Years | 14,518 (94.5%) | 15,335 (92.1%) |
| 45 to 54 Years | 18,716 (96.1%) | 18,062 (95.8%) |
| 55 to 64 Years | 14,271 (94.7%) | 13,533 (93.7%) |
| 65 to 74 Years | 8,468 (94.9%) | 9,700 (95.1%) |
| 75 Years and over | 4,589 (95.1%) | 5,940 (87.7%) |
| Total | 110,268 (93.7%) | 110,612 (92.7%) |
Income Below Poverty Among Married-Couple Families in Union County
The poverty statistics for married-couple families in Union County show that 2.6% or 1,401 of the total 53,139 families live below the poverty line. Families with 3 or 4 children have the highest poverty rate of 6.5%, comprising of 322 families. On the other hand, families with 1 or 2 children have the lowest poverty rate of 2.2%, which includes 468 families.
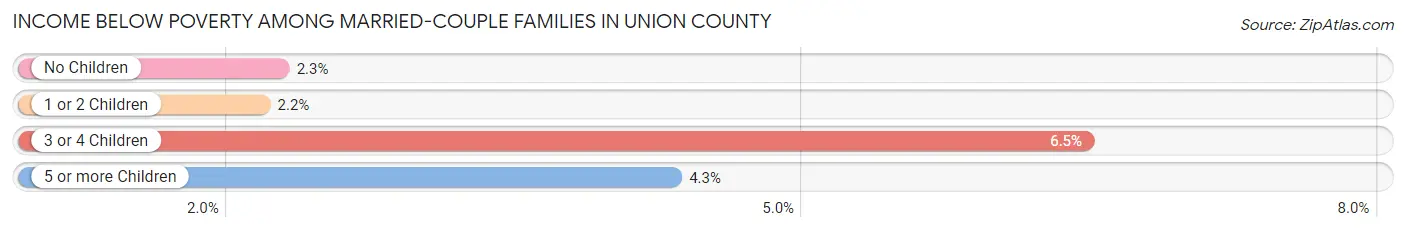
| Children | Above Poverty | Below Poverty |
| No Children | 25,715 (97.7%) | 597 (2.3%) |
| 1 or 2 Children | 21,060 (97.8%) | 468 (2.2%) |
| 3 or 4 Children | 4,653 (93.5%) | 322 (6.5%) |
| 5 or more Children | 310 (95.7%) | 14 (4.3%) |
| Total | 51,738 (97.4%) | 1,401 (2.6%) |
Income Below Poverty Among Single-Parent Households in Union County
According to the poverty data in Union County, 9.8% or 344 single-father households and 19.4% or 1,485 single-mother households are living below the poverty line. Among single-father households, those with 3 or 4 children have the highest poverty rate, with 70 households (30.3%) experiencing poverty. Likewise, among single-mother households, those with 3 or 4 children have the highest poverty rate, with 459 households (52.3%) falling below the poverty line.
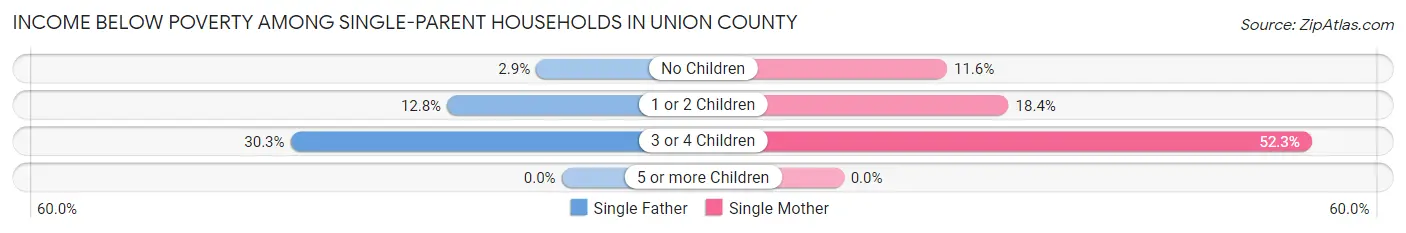
| Children | Single Father | Single Mother |
| No Children | 42 (2.9%) | 352 (11.6%) |
| 1 or 2 Children | 232 (12.8%) | 674 (18.4%) |
| 3 or 4 Children | 70 (30.3%) | 459 (52.3%) |
| 5 or more Children | 0 (0.0%) | 0 (0.0%) |
| Total | 344 (9.8%) | 1,485 (19.4%) |
Income Below Poverty Among Married-Couple vs Single-Parent Households in Union County
The poverty data for Union County shows that 1,401 of the married-couple family households (2.6%) and 1,829 of the single-parent households (16.4%) are living below the poverty level. Within the married-couple family households, those with 3 or 4 children have the highest poverty rate, with 322 households (6.5%) falling below the poverty line. Among the single-parent households, those with 3 or 4 children have the highest poverty rate, with 529 household (47.7%) living below poverty.
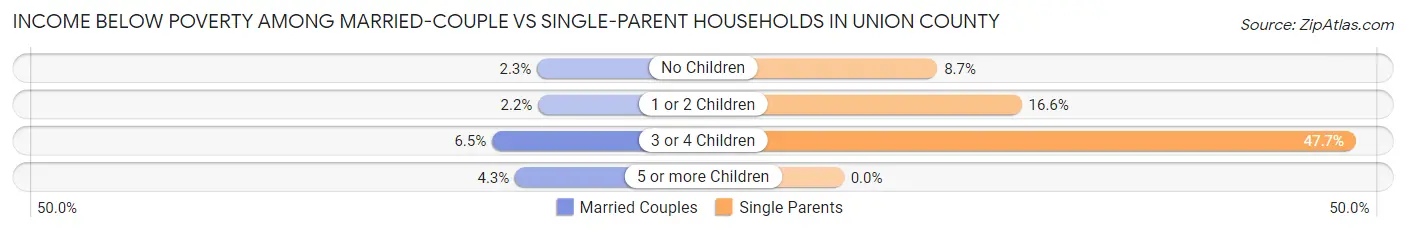
| Children | Married-Couple Families | Single-Parent Households |
| No Children | 597 (2.3%) | 394 (8.7%) |
| 1 or 2 Children | 468 (2.2%) | 906 (16.6%) |
| 3 or 4 Children | 322 (6.5%) | 529 (47.7%) |
| 5 or more Children | 14 (4.3%) | 0 (0.0%) |
| Total | 1,401 (2.6%) | 1,829 (16.4%) |
Employment Characteristics in Union County
Employment by Class of Employer in Union County
Among the 119,069 employed individuals in Union County, private company employees (85,455 | 71.8%), not-for-profit organizations (8,266 | 6.9%), and local government employees (8,021 | 6.7%) make up the most common classes of employment.
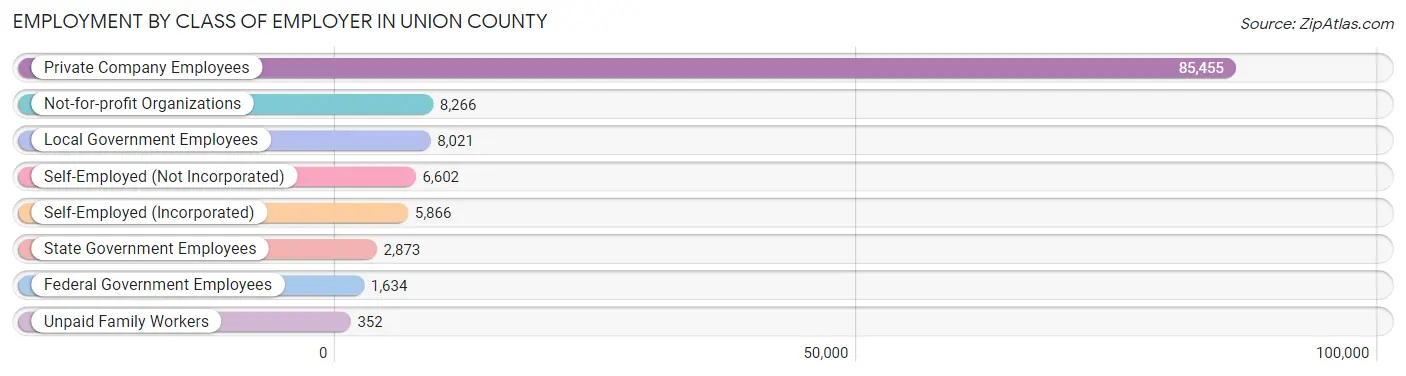
| Employer Class | # Employees | % Employees |
| Private Company Employees | 85,455 | 71.8% |
| Self-Employed (Incorporated) | 5,866 | 4.9% |
| Self-Employed (Not Incorporated) | 6,602 | 5.5% |
| Not-for-profit Organizations | 8,266 | 6.9% |
| Local Government Employees | 8,021 | 6.7% |
| State Government Employees | 2,873 | 2.4% |
| Federal Government Employees | 1,634 | 1.4% |
| Unpaid Family Workers | 352 | 0.3% |
| Total | 119,069 | 100.0% |
Employment Status by Age in Union County
According to the labor force statistics for Union County, out of the total population over 16 years of age (186,574), 67.7% or 126,311 individuals are in the labor force, with 4.3% or 5,431 of them unemployed. The age group with the highest labor force participation rate is 45 to 54 years, with 85.5% or 32,831 individuals in the labor force. Within the labor force, the 16 to 19 years age range has the highest percentage of unemployed individuals, with 11.3% or 869 of them being unemployed.
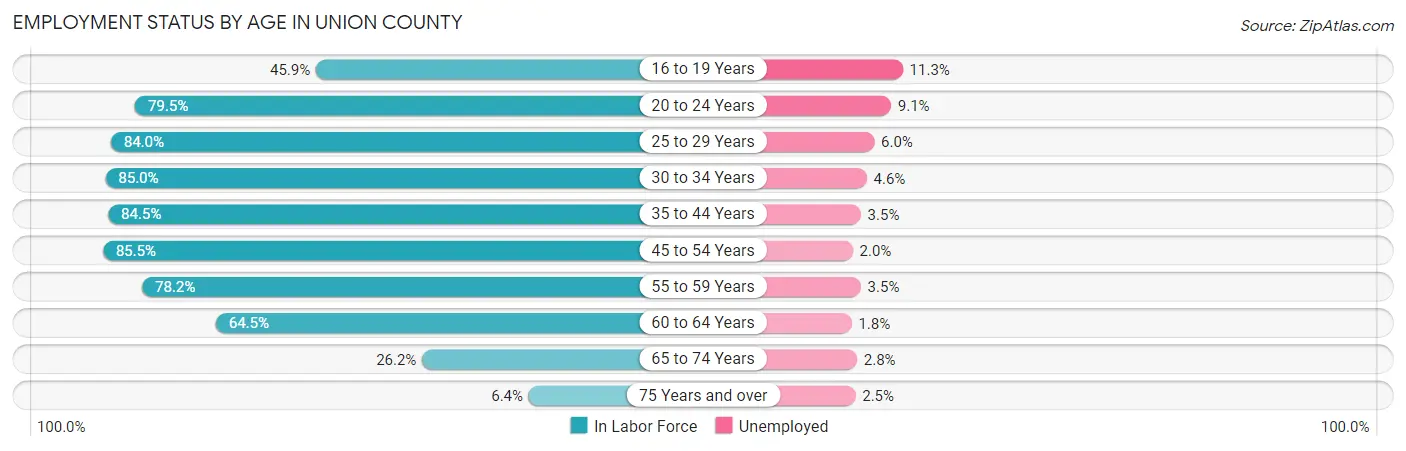
| Age Bracket | In Labor Force | Unemployed |
| 16 to 19 Years | 7,694 (45.9%) | 869 (11.3%) |
| 20 to 24 Years | 12,062 (79.5%) | 1,098 (9.1%) |
| 25 to 29 Years | 9,462 (84.0%) | 568 (6.0%) |
| 30 to 34 Years | 10,120 (85.0%) | 466 (4.6%) |
| 35 to 44 Years | 27,074 (84.5%) | 948 (3.5%) |
| 45 to 54 Years | 32,831 (85.5%) | 657 (2.0%) |
| 55 to 59 Years | 12,792 (78.2%) | 448 (3.5%) |
| 60 to 64 Years | 8,535 (64.5%) | 154 (1.8%) |
| 65 to 74 Years | 5,046 (26.2%) | 141 (2.8%) |
| 75 Years and over | 779 (6.4%) | 19 (2.5%) |
| Total | 126,311 (67.7%) | 5,431 (4.3%) |
Employment Status by Educational Attainment in Union County
According to labor force statistics for Union County, 81.8% of individuals (100,778) out of the total population between 25 and 64 years of age (123,200) are in the labor force, with 3.2% or 3,225 of them being unemployed. The group with the highest labor force participation rate are those with the educational attainment of bachelor's degree or higher, with 88.1% or 44,934 individuals in the labor force. Within the labor force, individuals with less than high school education have the highest percentage of unemployment, with 5.7% or 411 of them being unemployed.
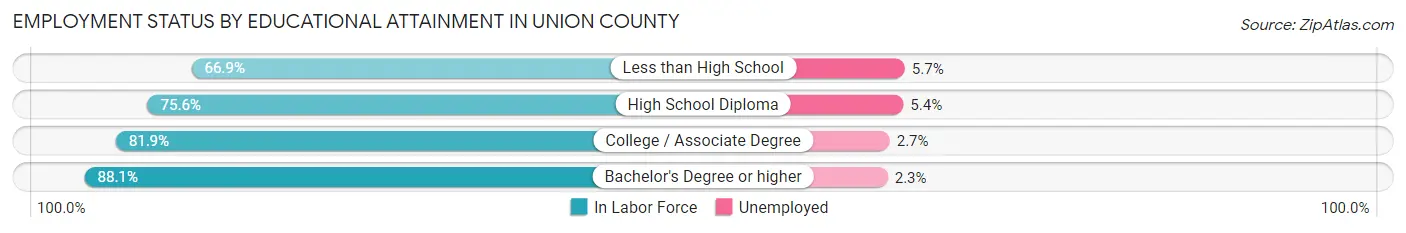
| Educational Attainment | In Labor Force | Unemployed |
| Less than High School | 7,219 (66.9%) | 615 (5.7%) |
| High School Diploma | 19,177 (75.6%) | 1,370 (5.4%) |
| College / Associate Degree | 29,517 (81.9%) | 973 (2.7%) |
| Bachelor's Degree or higher | 44,934 (88.1%) | 1,173 (2.3%) |
| Total | 100,778 (81.8%) | 3,942 (3.2%) |
Employment Occupations by Sex in Union County
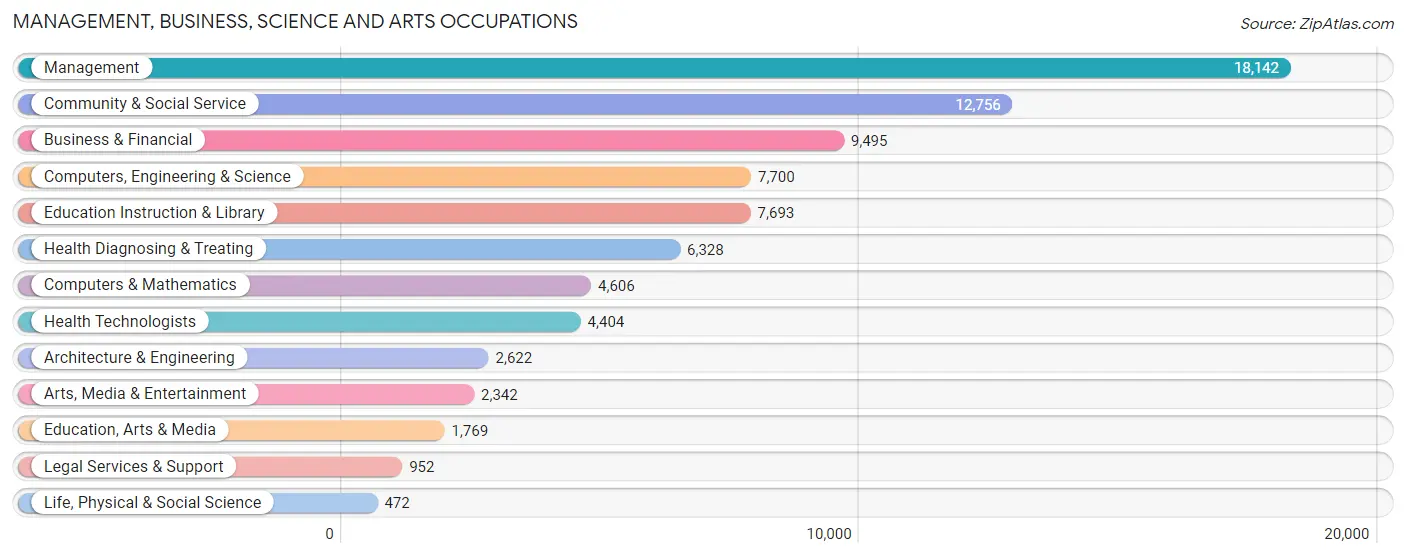
Management, Business, Science and Arts Occupations
The most common Management, Business, Science and Arts occupations in Union County are Management (18,142 | 15.0%), Community & Social Service (12,756 | 10.5%), Business & Financial (9,495 | 7.9%), Computers, Engineering & Science (7,700 | 6.4%), and Education Instruction & Library (7,693 | 6.4%).
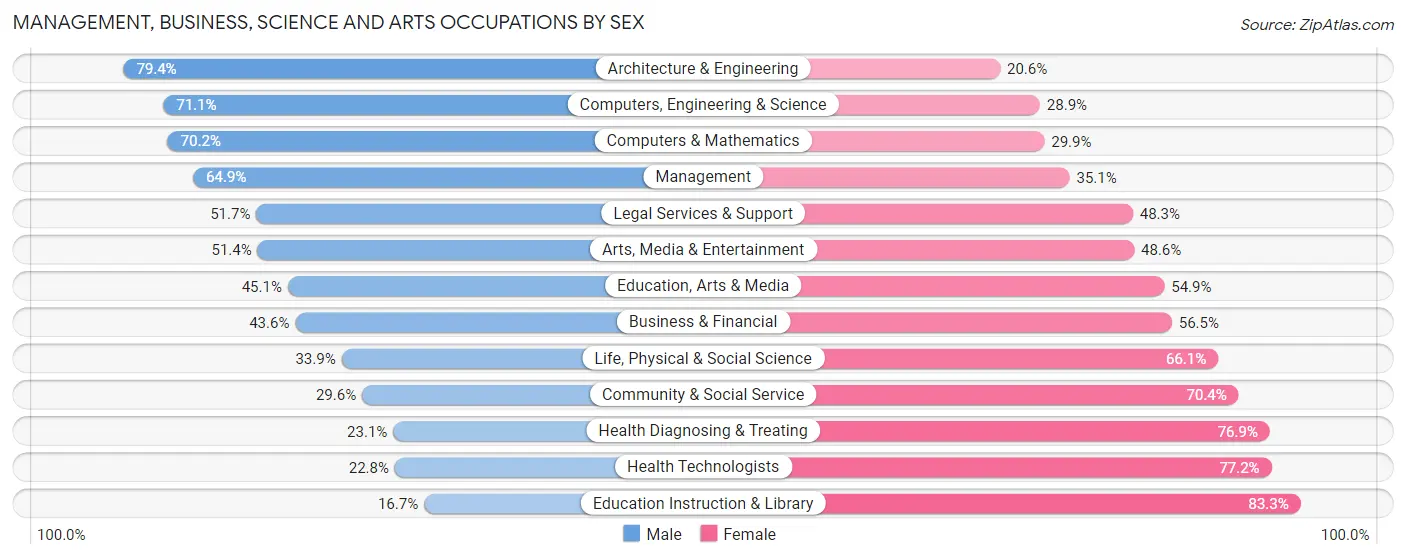
Management, Business, Science and Arts Occupations by Sex
Within the Management, Business, Science and Arts occupations in Union County, the most male-oriented occupations are Architecture & Engineering (79.4%), Computers, Engineering & Science (71.1%), and Computers & Mathematics (70.2%), while the most female-oriented occupations are Education Instruction & Library (83.3%), Health Technologists (77.2%), and Health Diagnosing & Treating (76.9%).
| Occupation | Male | Female |
| Management | 11,769 (64.9%) | 6,373 (35.1%) |
| Business & Financial | 4,135 (43.5%) | 5,360 (56.5%) |
| Computers, Engineering & Science | 5,472 (71.1%) | 2,228 (28.9%) |
| Computers & Mathematics | 3,231 (70.2%) | 1,375 (29.8%) |
| Architecture & Engineering | 2,081 (79.4%) | 541 (20.6%) |
| Life, Physical & Social Science | 160 (33.9%) | 312 (66.1%) |
| Community & Social Service | 3,778 (29.6%) | 8,978 (70.4%) |
| Education, Arts & Media | 798 (45.1%) | 971 (54.9%) |
| Legal Services & Support | 492 (51.7%) | 460 (48.3%) |
| Education Instruction & Library | 1,284 (16.7%) | 6,409 (83.3%) |
| Arts, Media & Entertainment | 1,204 (51.4%) | 1,138 (48.6%) |
| Health Diagnosing & Treating | 1,463 (23.1%) | 4,865 (76.9%) |
| Health Technologists | 1,003 (22.8%) | 3,401 (77.2%) |
| Total (Category) | 26,617 (48.9%) | 27,804 (51.1%) |
| Total (Overall) | 66,001 (54.6%) | 54,937 (45.4%) |
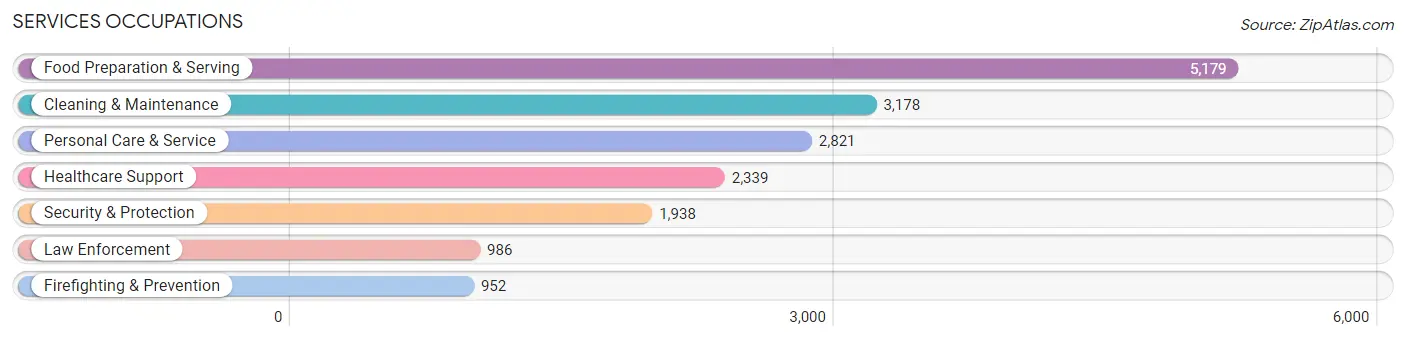
Services Occupations
The most common Services occupations in Union County are Food Preparation & Serving (5,179 | 4.3%), Cleaning & Maintenance (3,178 | 2.6%), Personal Care & Service (2,821 | 2.3%), Healthcare Support (2,339 | 1.9%), and Security & Protection (1,938 | 1.6%).
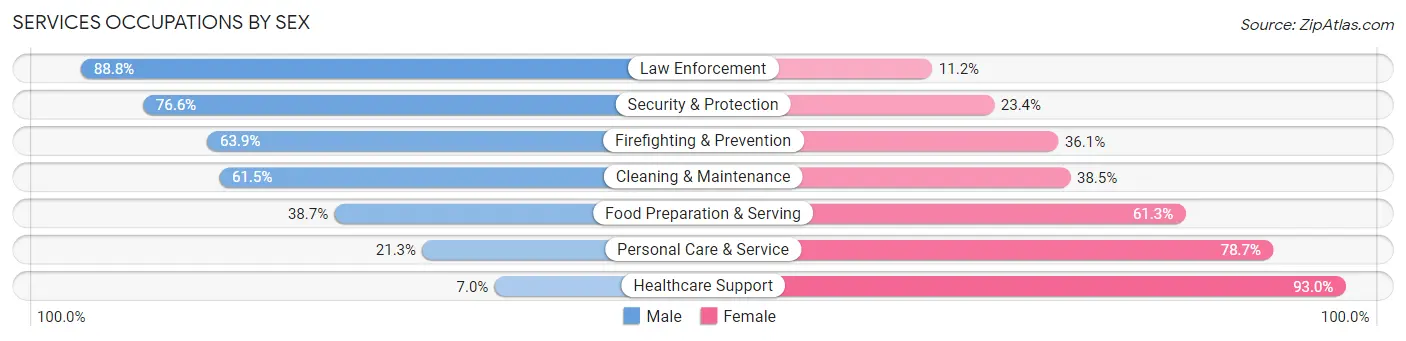
Services Occupations by Sex
Within the Services occupations in Union County, the most male-oriented occupations are Law Enforcement (88.8%), Security & Protection (76.6%), and Firefighting & Prevention (63.9%), while the most female-oriented occupations are Healthcare Support (93.0%), Personal Care & Service (78.7%), and Food Preparation & Serving (61.3%).
| Occupation | Male | Female |
| Healthcare Support | 164 (7.0%) | 2,175 (93.0%) |
| Security & Protection | 1,484 (76.6%) | 454 (23.4%) |
| Firefighting & Prevention | 608 (63.9%) | 344 (36.1%) |
| Law Enforcement | 876 (88.8%) | 110 (11.2%) |
| Food Preparation & Serving | 2,006 (38.7%) | 3,173 (61.3%) |
| Cleaning & Maintenance | 1,954 (61.5%) | 1,224 (38.5%) |
| Personal Care & Service | 602 (21.3%) | 2,219 (78.7%) |
| Total (Category) | 6,210 (40.2%) | 9,245 (59.8%) |
| Total (Overall) | 66,001 (54.6%) | 54,937 (45.4%) |
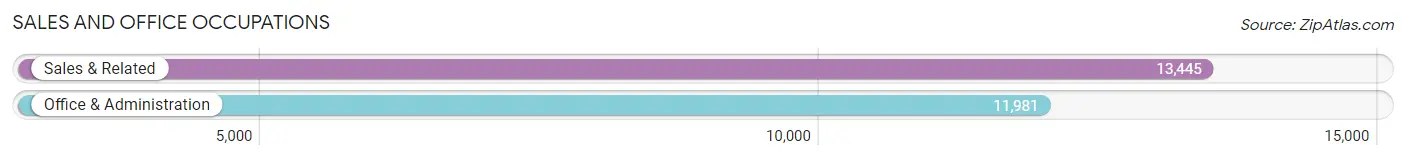
Sales and Office Occupations
The most common Sales and Office occupations in Union County are Sales & Related (13,445 | 11.1%), and Office & Administration (11,981 | 9.9%).
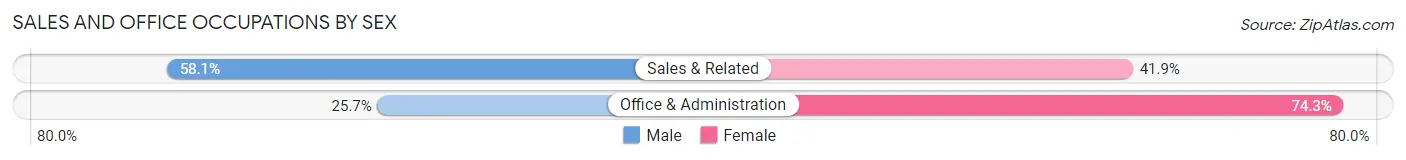
Sales and Office Occupations by Sex
| Occupation | Male | Female |
| Sales & Related | 7,815 (58.1%) | 5,630 (41.9%) |
| Office & Administration | 3,078 (25.7%) | 8,903 (74.3%) |
| Total (Category) | 10,893 (42.8%) | 14,533 (57.2%) |
| Total (Overall) | 66,001 (54.6%) | 54,937 (45.4%) |
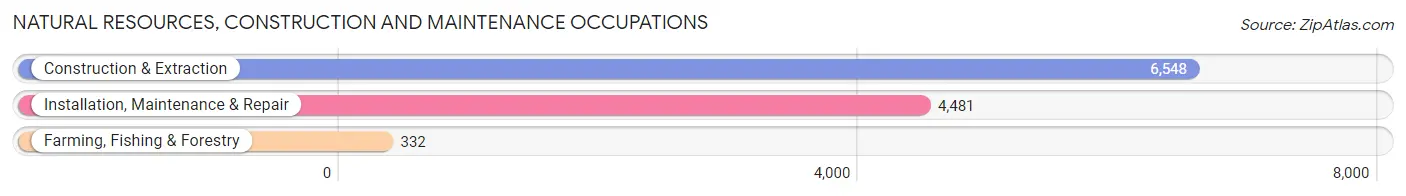
Natural Resources, Construction and Maintenance Occupations
The most common Natural Resources, Construction and Maintenance occupations in Union County are Construction & Extraction (6,548 | 5.4%), Installation, Maintenance & Repair (4,481 | 3.7%), and Farming, Fishing & Forestry (332 | 0.3%).
Natural Resources, Construction and Maintenance Occupations by Sex
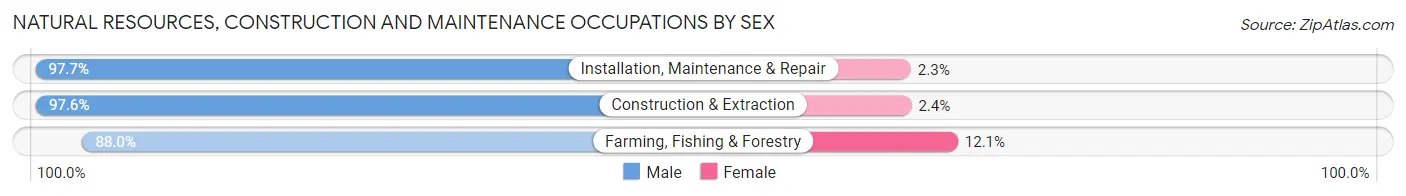
| Occupation | Male | Female |
| Farming, Fishing & Forestry | 292 (87.9%) | 40 (12.0%) |
| Construction & Extraction | 6,391 (97.6%) | 157 (2.4%) |
| Installation, Maintenance & Repair | 4,379 (97.7%) | 102 (2.3%) |
| Total (Category) | 11,062 (97.4%) | 299 (2.6%) |
| Total (Overall) | 66,001 (54.6%) | 54,937 (45.4%) |
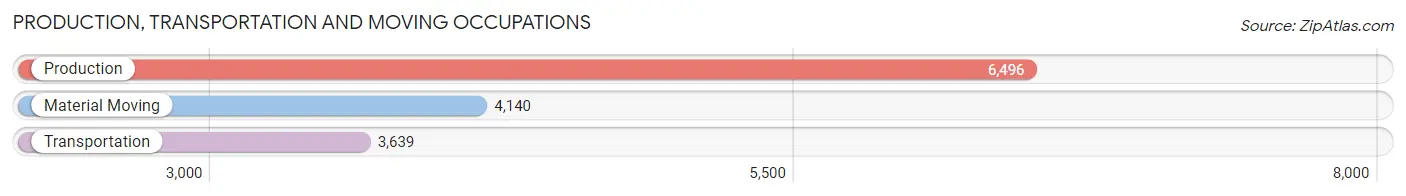
Production, Transportation and Moving Occupations
The most common Production, Transportation and Moving occupations in Union County are Production (6,496 | 5.4%), Material Moving (4,140 | 3.4%), and Transportation (3,639 | 3.0%).
Production, Transportation and Moving Occupations by Sex
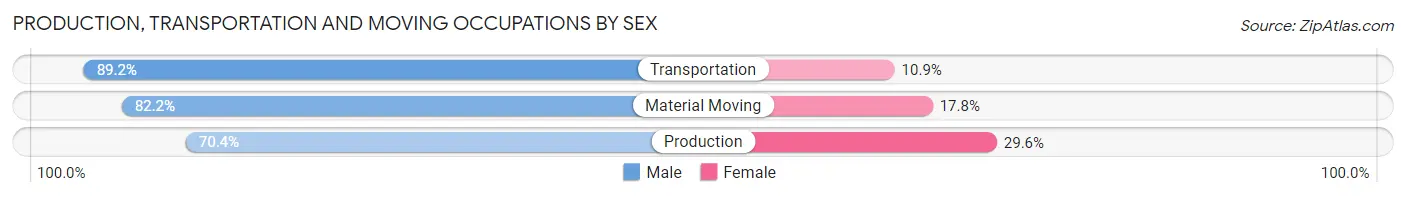
| Occupation | Male | Female |
| Production | 4,573 (70.4%) | 1,923 (29.6%) |
| Transportation | 3,244 (89.1%) | 395 (10.8%) |
| Material Moving | 3,402 (82.2%) | 738 (17.8%) |
| Total (Category) | 11,219 (78.6%) | 3,056 (21.4%) |
| Total (Overall) | 66,001 (54.6%) | 54,937 (45.4%) |
Employment Industries by Sex in Union County
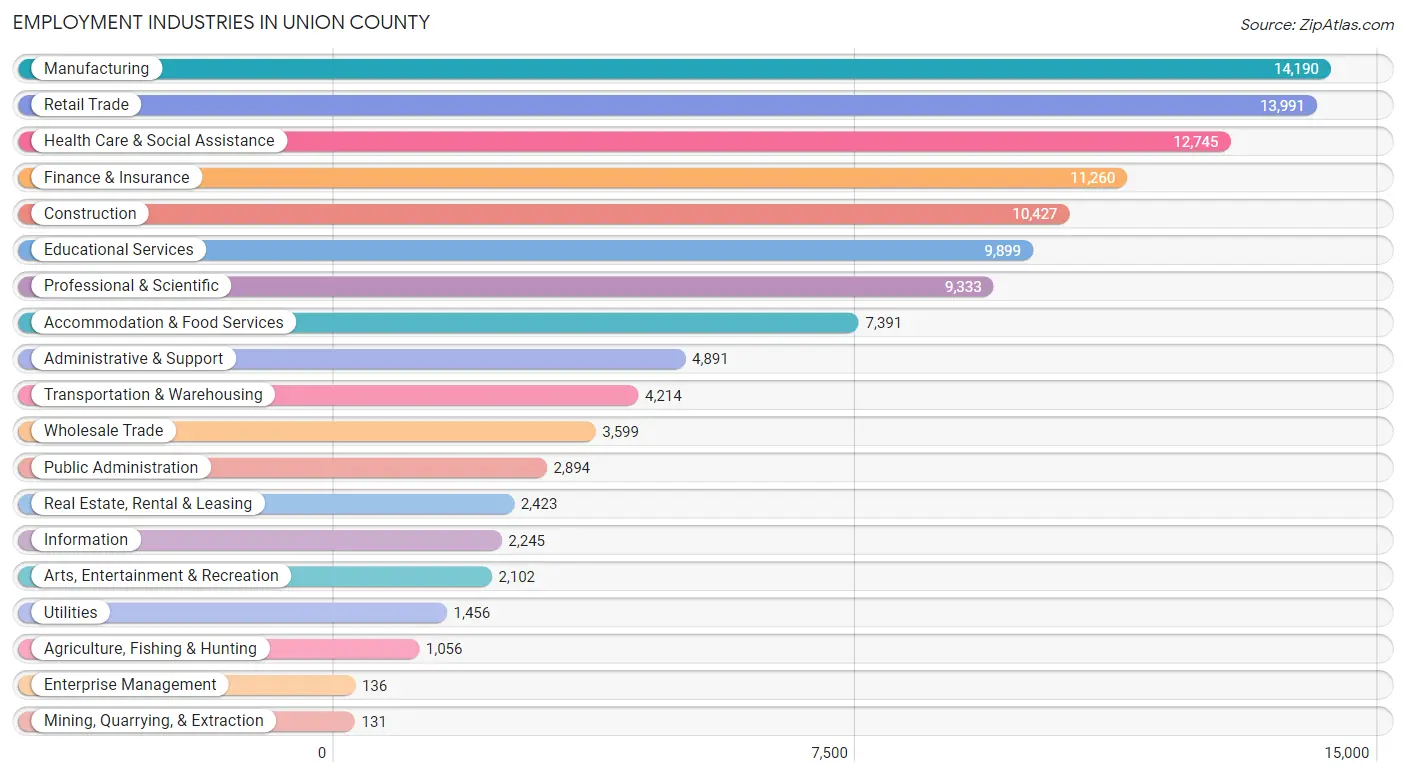
Employment Industries in Union County
The major employment industries in Union County include Manufacturing (14,190 | 11.7%), Retail Trade (13,991 | 11.6%), Health Care & Social Assistance (12,745 | 10.5%), Finance & Insurance (11,260 | 9.3%), and Construction (10,427 | 8.6%).
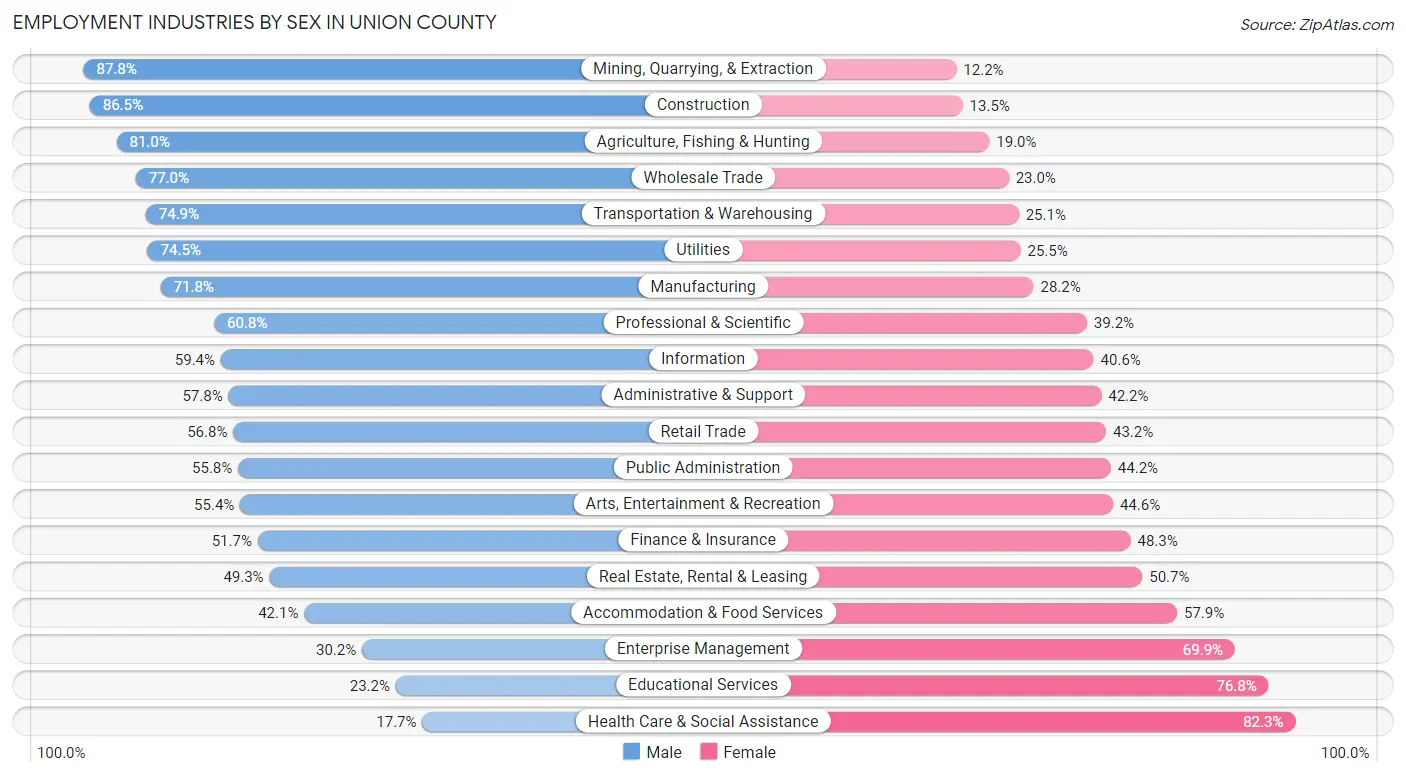
Employment Industries by Sex in Union County
The Union County industries that see more men than women are Mining, Quarrying, & Extraction (87.8%), Construction (86.5%), and Agriculture, Fishing & Hunting (81.0%), whereas the industries that tend to have a higher number of women are Health Care & Social Assistance (82.3%), Educational Services (76.8%), and Enterprise Management (69.9%).
| Industry | Male | Female |
| Agriculture, Fishing & Hunting | 855 (81.0%) | 201 (19.0%) |
| Mining, Quarrying, & Extraction | 115 (87.8%) | 16 (12.2%) |
| Construction | 9,019 (86.5%) | 1,408 (13.5%) |
| Manufacturing | 10,193 (71.8%) | 3,997 (28.2%) |
| Wholesale Trade | 2,770 (77.0%) | 829 (23.0%) |
| Retail Trade | 7,949 (56.8%) | 6,042 (43.2%) |
| Transportation & Warehousing | 3,156 (74.9%) | 1,058 (25.1%) |
| Utilities | 1,085 (74.5%) | 371 (25.5%) |
| Information | 1,333 (59.4%) | 912 (40.6%) |
| Finance & Insurance | 5,826 (51.7%) | 5,434 (48.3%) |
| Real Estate, Rental & Leasing | 1,195 (49.3%) | 1,228 (50.7%) |
| Professional & Scientific | 5,673 (60.8%) | 3,660 (39.2%) |
| Enterprise Management | 41 (30.1%) | 95 (69.9%) |
| Administrative & Support | 2,827 (57.8%) | 2,064 (42.2%) |
| Educational Services | 2,294 (23.2%) | 7,605 (76.8%) |
| Health Care & Social Assistance | 2,252 (17.7%) | 10,493 (82.3%) |
| Arts, Entertainment & Recreation | 1,164 (55.4%) | 938 (44.6%) |
| Accommodation & Food Services | 3,113 (42.1%) | 4,278 (57.9%) |
| Public Administration | 1,615 (55.8%) | 1,279 (44.2%) |
| Total | 66,001 (54.6%) | 54,937 (45.4%) |
Education in Union County
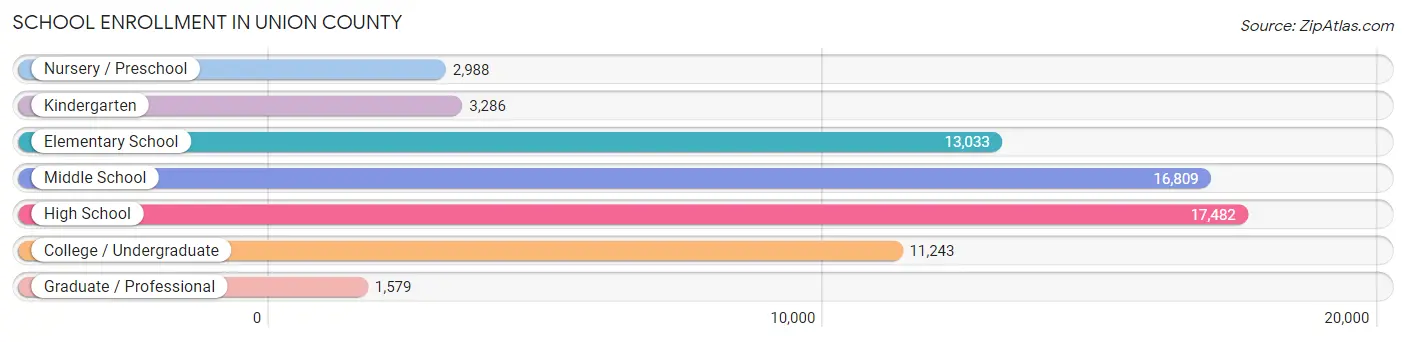
School Enrollment in Union County
The most common levels of schooling among the 66,420 students in Union County are high school (17,482 | 26.3%), middle school (16,809 | 25.3%), and elementary school (13,033 | 19.6%).
| School Level | # Students | % Students |
| Nursery / Preschool | 2,988 | 4.5% |
| Kindergarten | 3,286 | 5.0% |
| Elementary School | 13,033 | 19.6% |
| Middle School | 16,809 | 25.3% |
| High School | 17,482 | 26.3% |
| College / Undergraduate | 11,243 | 16.9% |
| Graduate / Professional | 1,579 | 2.4% |
| Total | 66,420 | 100.0% |
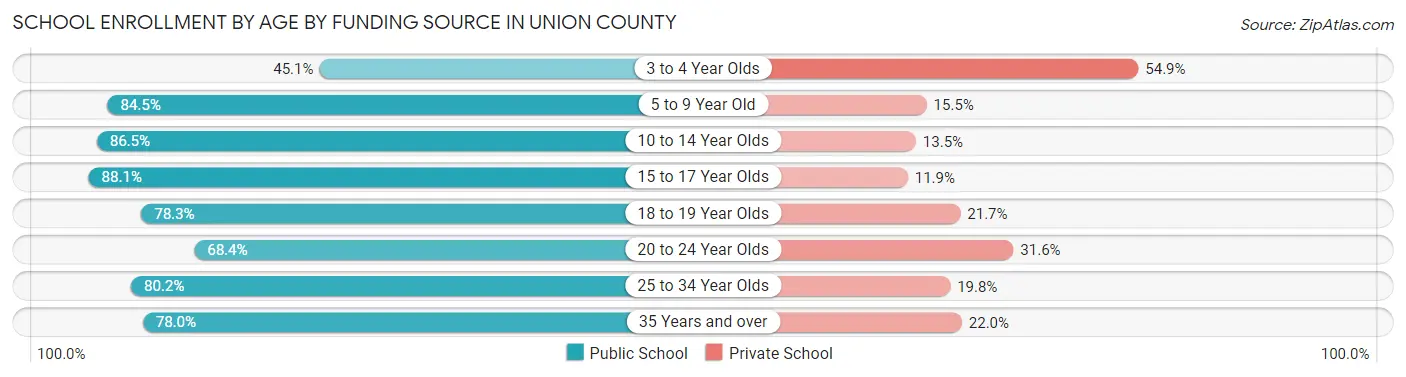
School Enrollment by Age by Funding Source in Union County
Out of a total of 66,420 students who are enrolled in schools in Union County, 11,823 (17.8%) attend a private institution, while the remaining 54,597 (82.2%) are enrolled in public schools. The age group of 3 to 4 year olds has the highest likelihood of being enrolled in private schools, with 1,273 (54.9% in the age bracket) enrolled. Conversely, the age group of 15 to 17 year olds has the lowest likelihood of being enrolled in a private school, with 11,251 (88.1% in the age bracket) attending a public institution.
| Age Bracket | Public School | Private School |
| 3 to 4 Year Olds | 1,046 (45.1%) | 1,273 (54.9%) |
| 5 to 9 Year Old | 13,019 (84.5%) | 2,381 (15.5%) |
| 10 to 14 Year Olds | 17,293 (86.5%) | 2,689 (13.5%) |
| 15 to 17 Year Olds | 11,251 (88.1%) | 1,526 (11.9%) |
| 18 to 19 Year Olds | 4,895 (78.3%) | 1,360 (21.7%) |
| 20 to 24 Year Olds | 3,626 (68.4%) | 1,677 (31.6%) |
| 25 to 34 Year Olds | 1,184 (80.2%) | 293 (19.8%) |
| 35 Years and over | 2,267 (78.0%) | 640 (22.0%) |
| Total | 54,597 (82.2%) | 11,823 (17.8%) |
Educational Attainment by Field of Study in Union County
Business (16,789 | 26.4%), education (7,203 | 11.3%), science & technology (6,106 | 9.6%), engineering (4,850 | 7.6%), and social sciences (4,196 | 6.6%) are the most common fields of study among 63,723 individuals in Union County who have obtained a bachelor's degree or higher.
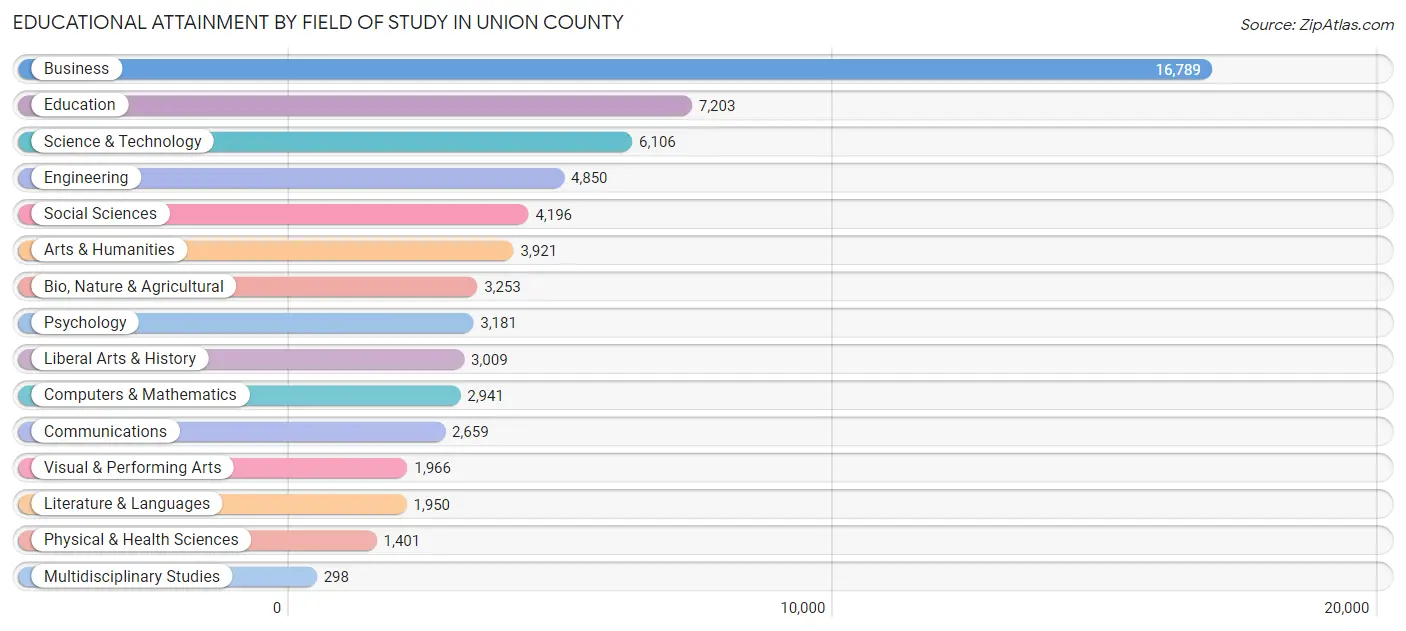
| Field of Study | # Graduates | % Graduates |
| Computers & Mathematics | 2,941 | 4.6% |
| Bio, Nature & Agricultural | 3,253 | 5.1% |
| Physical & Health Sciences | 1,401 | 2.2% |
| Psychology | 3,181 | 5.0% |
| Social Sciences | 4,196 | 6.6% |
| Engineering | 4,850 | 7.6% |
| Multidisciplinary Studies | 298 | 0.5% |
| Science & Technology | 6,106 | 9.6% |
| Business | 16,789 | 26.4% |
| Education | 7,203 | 11.3% |
| Literature & Languages | 1,950 | 3.1% |
| Liberal Arts & History | 3,009 | 4.7% |
| Visual & Performing Arts | 1,966 | 3.1% |
| Communications | 2,659 | 4.2% |
| Arts & Humanities | 3,921 | 6.1% |
| Total | 63,723 | 100.0% |
Transportation & Commute in Union County
Vehicle Availability by Sex in Union County
The most prevalent vehicle ownership categories in Union County are males with 2 vehicles (25,811, accounting for 39.6%) and females with 2 vehicles (21,430, making up 48.2%).
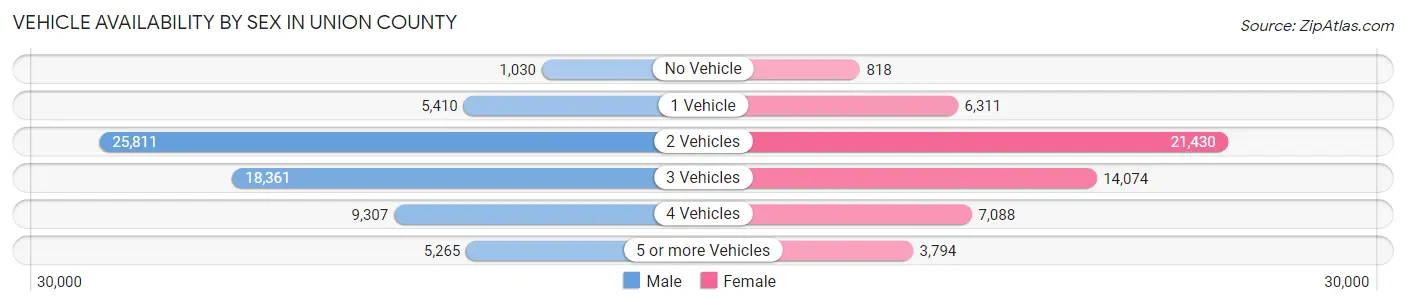
| Vehicles Available | Male | Female |
| No Vehicle | 1,030 (1.6%) | 818 (1.5%) |
| 1 Vehicle | 5,410 (8.3%) | 6,311 (11.8%) |
| 2 Vehicles | 25,811 (39.6%) | 21,430 (40.0%) |
| 3 Vehicles | 18,361 (28.2%) | 14,074 (26.3%) |
| 4 Vehicles | 9,307 (14.3%) | 7,088 (13.2%) |
| 5 or more Vehicles | 5,265 (8.1%) | 3,794 (7.1%) |
| Total | 65,184 (100.0%) | 53,515 (100.0%) |
Commute Time in Union County
The most frequently occuring commute durations in Union County are 30 to 34 minutes (14,947 commuters, 14.9%), 15 to 19 minutes (13,070 commuters, 13.0%), and 45 to 59 minutes (12,875 commuters, 12.8%).
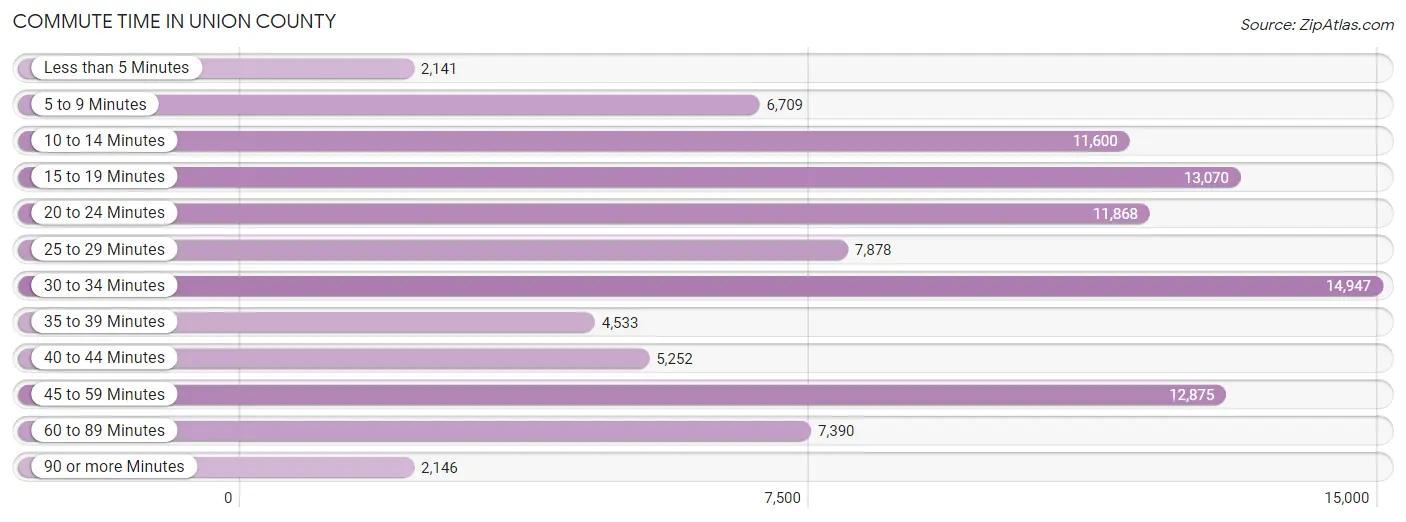
| Commute Time | # Commuters | % Commuters |
| Less than 5 Minutes | 2,141 | 2.1% |
| 5 to 9 Minutes | 6,709 | 6.7% |
| 10 to 14 Minutes | 11,600 | 11.6% |
| 15 to 19 Minutes | 13,070 | 13.0% |
| 20 to 24 Minutes | 11,868 | 11.8% |
| 25 to 29 Minutes | 7,878 | 7.9% |
| 30 to 34 Minutes | 14,947 | 14.9% |
| 35 to 39 Minutes | 4,533 | 4.5% |
| 40 to 44 Minutes | 5,252 | 5.2% |
| 45 to 59 Minutes | 12,875 | 12.8% |
| 60 to 89 Minutes | 7,390 | 7.4% |
| 90 or more Minutes | 2,146 | 2.1% |
Commute Time by Sex in Union County
The most common commute times in Union County are 30 to 34 minutes (8,756 commuters, 15.7%) for males and 30 to 34 minutes (6,191 commuters, 13.9%) for females.

| Commute Time | Male | Female |
| Less than 5 Minutes | 1,260 (2.3%) | 881 (2.0%) |
| 5 to 9 Minutes | 3,377 (6.1%) | 3,332 (7.5%) |
| 10 to 14 Minutes | 5,563 (10.0%) | 6,037 (13.5%) |
| 15 to 19 Minutes | 6,911 (12.4%) | 6,159 (13.8%) |
| 20 to 24 Minutes | 6,291 (11.3%) | 5,577 (12.5%) |
| 25 to 29 Minutes | 4,159 (7.5%) | 3,719 (8.3%) |
| 30 to 34 Minutes | 8,756 (15.7%) | 6,191 (13.9%) |
| 35 to 39 Minutes | 2,558 (4.6%) | 1,975 (4.4%) |
| 40 to 44 Minutes | 3,468 (6.2%) | 1,784 (4.0%) |
| 45 to 59 Minutes | 7,250 (13.0%) | 5,625 (12.6%) |
| 60 to 89 Minutes | 4,715 (8.5%) | 2,675 (6.0%) |
| 90 or more Minutes | 1,412 (2.5%) | 734 (1.6%) |
Time of Departure to Work by Sex in Union County
The most frequent times of departure to work in Union County are 7:00 AM to 7:29 AM (9,498, 17.1%) for males and 7:00 AM to 7:29 AM (7,595, 17.0%) for females.
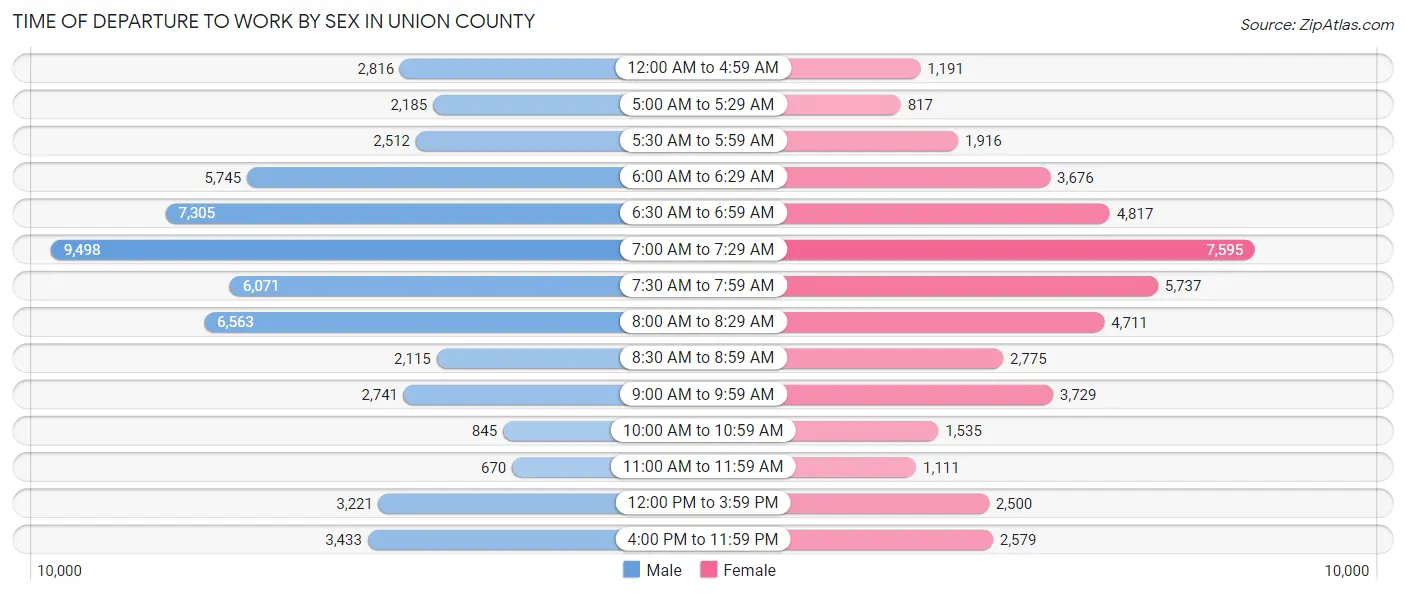
| Time of Departure | Male | Female |
| 12:00 AM to 4:59 AM | 2,816 (5.1%) | 1,191 (2.7%) |
| 5:00 AM to 5:29 AM | 2,185 (3.9%) | 817 (1.8%) |
| 5:30 AM to 5:59 AM | 2,512 (4.5%) | 1,916 (4.3%) |
| 6:00 AM to 6:29 AM | 5,745 (10.3%) | 3,676 (8.2%) |
| 6:30 AM to 6:59 AM | 7,305 (13.1%) | 4,817 (10.8%) |
| 7:00 AM to 7:29 AM | 9,498 (17.1%) | 7,595 (17.0%) |
| 7:30 AM to 7:59 AM | 6,071 (10.9%) | 5,737 (12.8%) |
| 8:00 AM to 8:29 AM | 6,563 (11.8%) | 4,711 (10.5%) |
| 8:30 AM to 8:59 AM | 2,115 (3.8%) | 2,775 (6.2%) |
| 9:00 AM to 9:59 AM | 2,741 (4.9%) | 3,729 (8.3%) |
| 10:00 AM to 10:59 AM | 845 (1.5%) | 1,535 (3.4%) |
| 11:00 AM to 11:59 AM | 670 (1.2%) | 1,111 (2.5%) |
| 12:00 PM to 3:59 PM | 3,221 (5.8%) | 2,500 (5.6%) |
| 4:00 PM to 11:59 PM | 3,433 (6.2%) | 2,579 (5.8%) |
| Total | 55,720 (100.0%) | 44,689 (100.0%) |
Housing Occupancy in Union County
Occupancy by Ownership in Union County
Of the total 80,271 dwellings in Union County, owner-occupied units account for 66,252 (82.5%), while renter-occupied units make up 14,019 (17.5%).
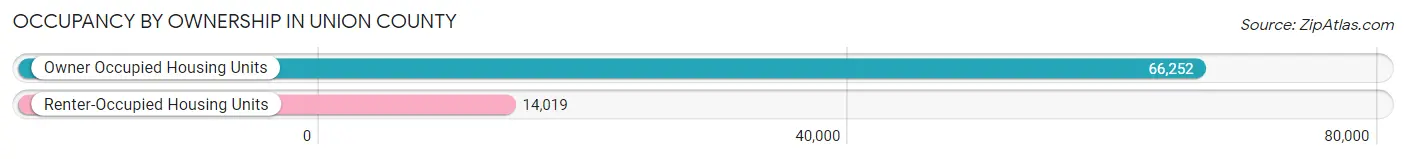
| Occupancy | # Housing Units | % Housing Units |
| Owner Occupied Housing Units | 66,252 | 82.5% |
| Renter-Occupied Housing Units | 14,019 | 17.5% |
| Total Occupied Housing Units | 80,271 | 100.0% |
Occupancy by Household Size in Union County
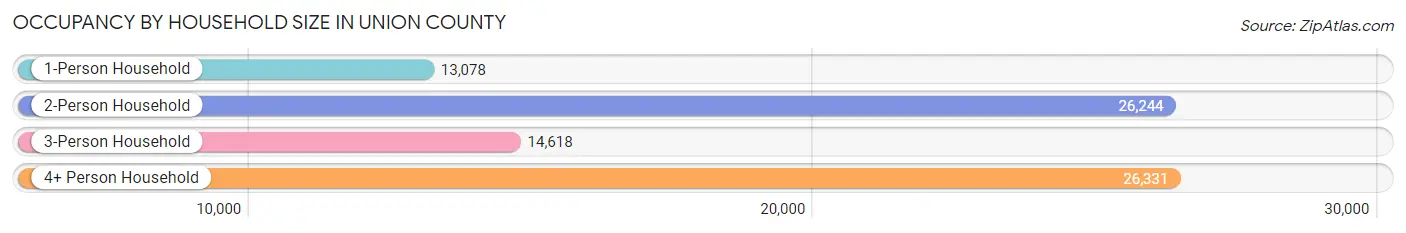
| Household Size | # Housing Units | % Housing Units |
| 1-Person Household | 13,078 | 16.3% |
| 2-Person Household | 26,244 | 32.7% |
| 3-Person Household | 14,618 | 18.2% |
| 4+ Person Household | 26,331 | 32.8% |
| Total Housing Units | 80,271 | 100.0% |
Occupancy by Ownership by Household Size in Union County
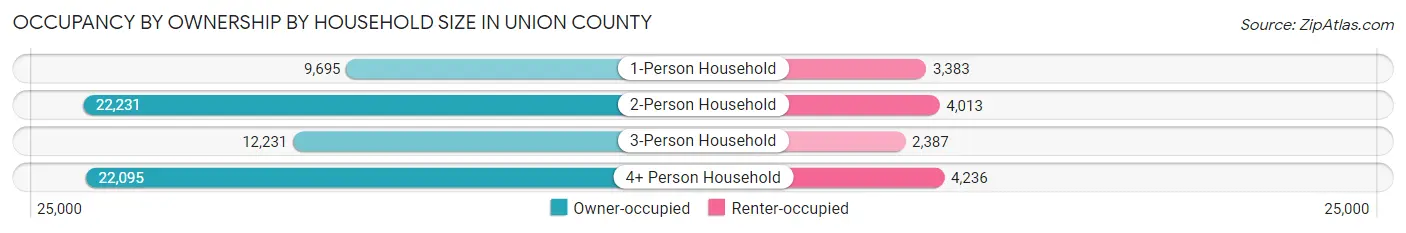
| Household Size | Owner-occupied | Renter-occupied |
| 1-Person Household | 9,695 (74.1%) | 3,383 (25.9%) |
| 2-Person Household | 22,231 (84.7%) | 4,013 (15.3%) |
| 3-Person Household | 12,231 (83.7%) | 2,387 (16.3%) |
| 4+ Person Household | 22,095 (83.9%) | 4,236 (16.1%) |
| Total Housing Units | 66,252 (82.5%) | 14,019 (17.5%) |
Occupancy by Educational Attainment in Union County
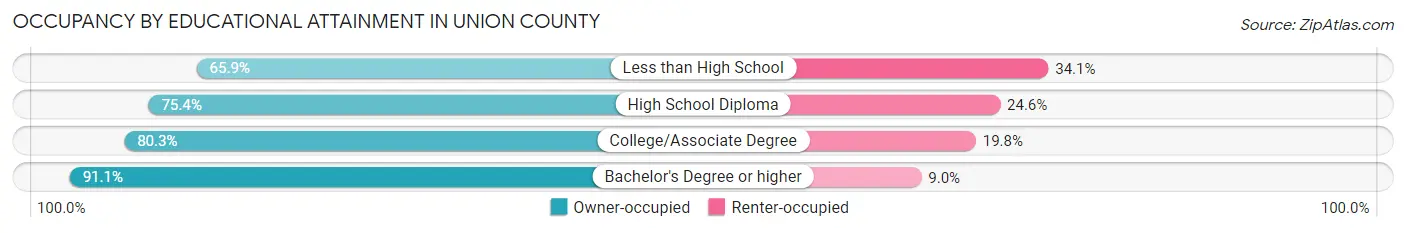
| Household Size | Owner-occupied | Renter-occupied |
| Less than High School | 4,330 (65.9%) | 2,243 (34.1%) |
| High School Diploma | 12,729 (75.4%) | 4,147 (24.6%) |
| College/Associate Degree | 18,898 (80.2%) | 4,650 (19.8%) |
| Bachelor's Degree or higher | 30,295 (91.0%) | 2,979 (8.9%) |
Occupancy by Age of Householder in Union County
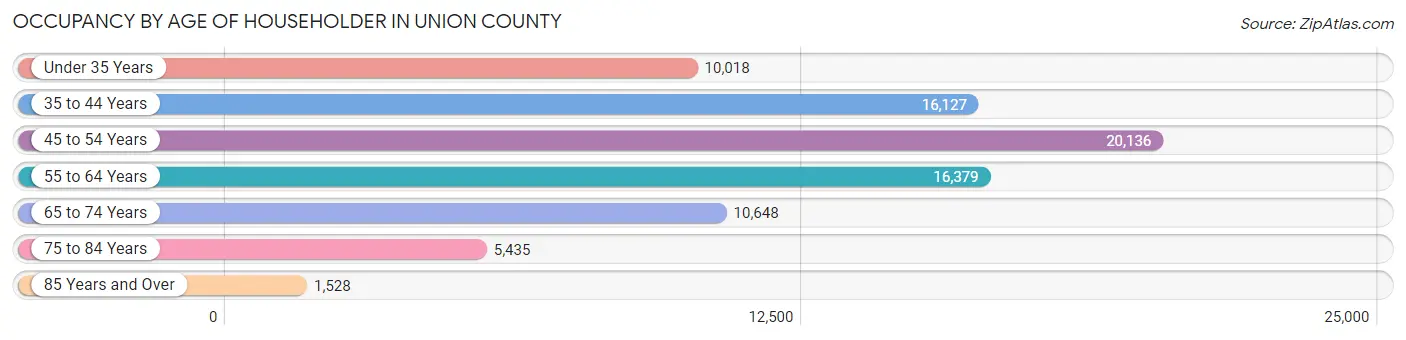
| Age Bracket | # Households | % Households |
| Under 35 Years | 10,018 | 12.5% |
| 35 to 44 Years | 16,127 | 20.1% |
| 45 to 54 Years | 20,136 | 25.1% |
| 55 to 64 Years | 16,379 | 20.4% |
| 65 to 74 Years | 10,648 | 13.3% |
| 75 to 84 Years | 5,435 | 6.8% |
| 85 Years and Over | 1,528 | 1.9% |
| Total | 80,271 | 100.0% |
Housing Finances in Union County
Median Income by Occupancy in Union County

| Occupancy Type | # Households | Median Income |
| Owner-Occupied | 66,252 (82.5%) | $107,330 |
| Renter-Occupied | 14,019 (17.5%) | $56,888 |
| Average | 80,271 (100.0%) | $95,533 |
Occupancy by Householder Income Bracket in Union County
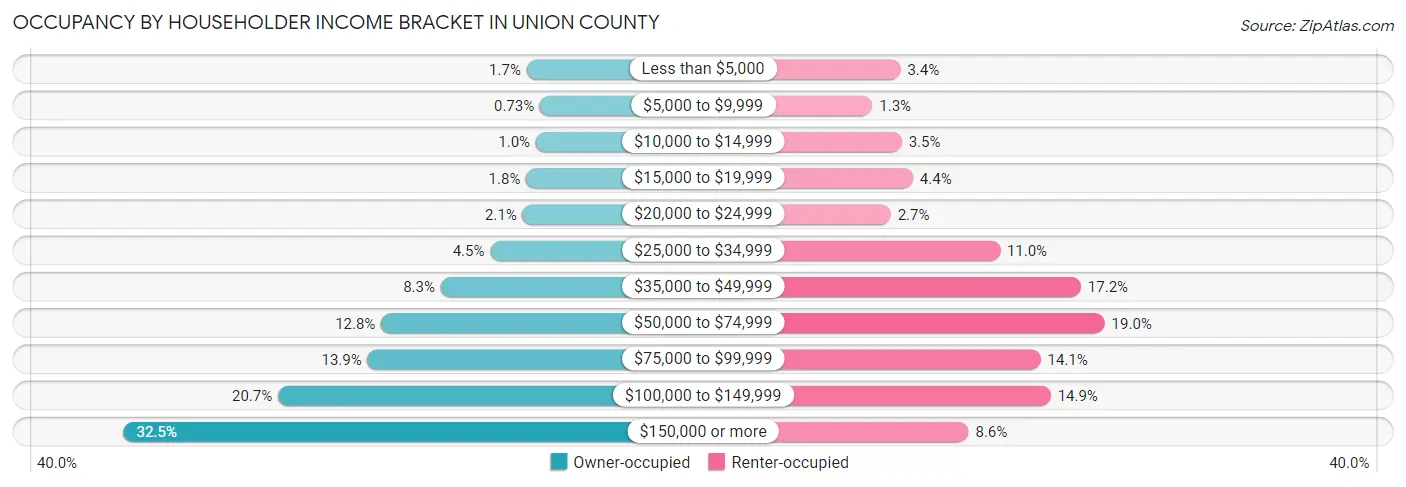
| Income Bracket | Owner-occupied | Renter-occupied |
| Less than $5,000 | 1,153 (1.7%) | 479 (3.4%) |
| $5,000 to $9,999 | 486 (0.7%) | 180 (1.3%) |
| $10,000 to $14,999 | 691 (1.0%) | 493 (3.5%) |
| $15,000 to $19,999 | 1,178 (1.8%) | 612 (4.4%) |
| $20,000 to $24,999 | 1,357 (2.1%) | 376 (2.7%) |
| $25,000 to $34,999 | 2,994 (4.5%) | 1,542 (11.0%) |
| $35,000 to $49,999 | 5,493 (8.3%) | 2,407 (17.2%) |
| $50,000 to $74,999 | 8,500 (12.8%) | 2,661 (19.0%) |
| $75,000 to $99,999 | 9,190 (13.9%) | 1,977 (14.1%) |
| $100,000 to $149,999 | 13,707 (20.7%) | 2,085 (14.9%) |
| $150,000 or more | 21,503 (32.5%) | 1,207 (8.6%) |
| Total | 66,252 (100.0%) | 14,019 (100.0%) |
Monthly Housing Cost Tiers in Union County
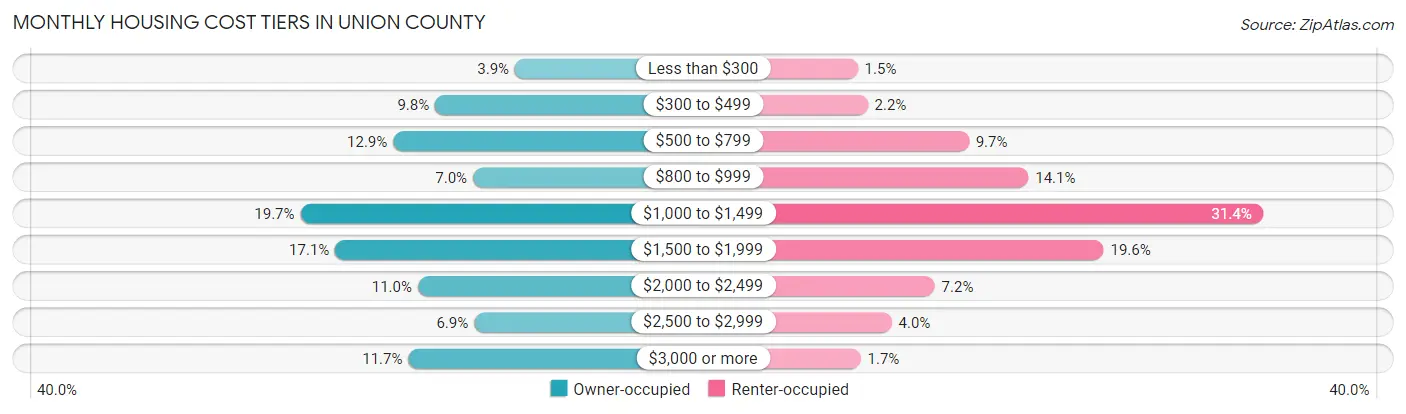
| Monthly Cost | Owner-occupied | Renter-occupied |
| Less than $300 | 2,576 (3.9%) | 209 (1.5%) |
| $300 to $499 | 6,474 (9.8%) | 311 (2.2%) |
| $500 to $799 | 8,521 (12.9%) | 1,355 (9.7%) |
| $800 to $999 | 4,624 (7.0%) | 1,971 (14.1%) |
| $1,000 to $1,499 | 13,045 (19.7%) | 4,401 (31.4%) |
| $1,500 to $1,999 | 11,347 (17.1%) | 2,748 (19.6%) |
| $2,000 to $2,499 | 7,315 (11.0%) | 1,004 (7.2%) |
| $2,500 to $2,999 | 4,574 (6.9%) | 560 (4.0%) |
| $3,000 or more | 7,776 (11.7%) | 240 (1.7%) |
| Total | 66,252 (100.0%) | 14,019 (100.0%) |
Physical Housing Characteristics in Union County
Housing Structures in Union County
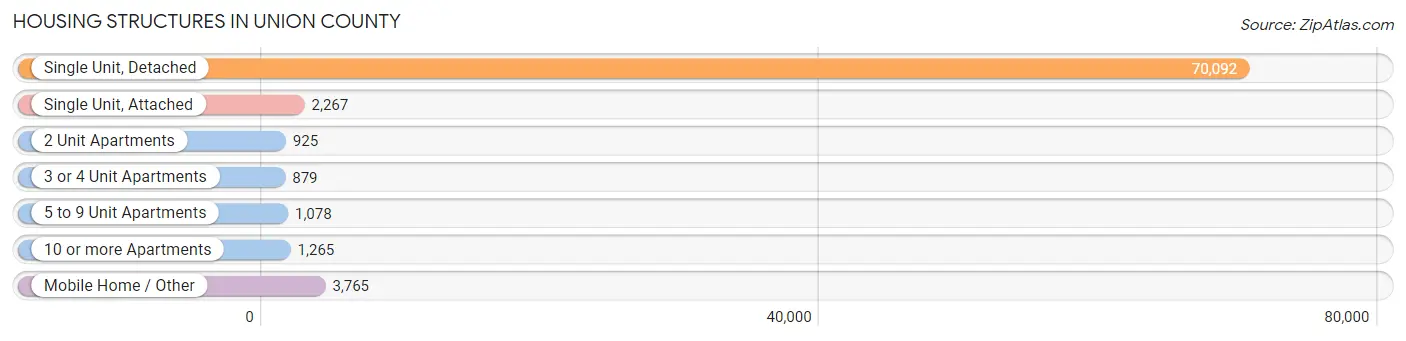
| Structure Type | # Housing Units | % Housing Units |
| Single Unit, Detached | 70,092 | 87.3% |
| Single Unit, Attached | 2,267 | 2.8% |
| 2 Unit Apartments | 925 | 1.1% |
| 3 or 4 Unit Apartments | 879 | 1.1% |
| 5 to 9 Unit Apartments | 1,078 | 1.3% |
| 10 or more Apartments | 1,265 | 1.6% |
| Mobile Home / Other | 3,765 | 4.7% |
| Total | 80,271 | 100.0% |
Housing Structures by Occupancy in Union County
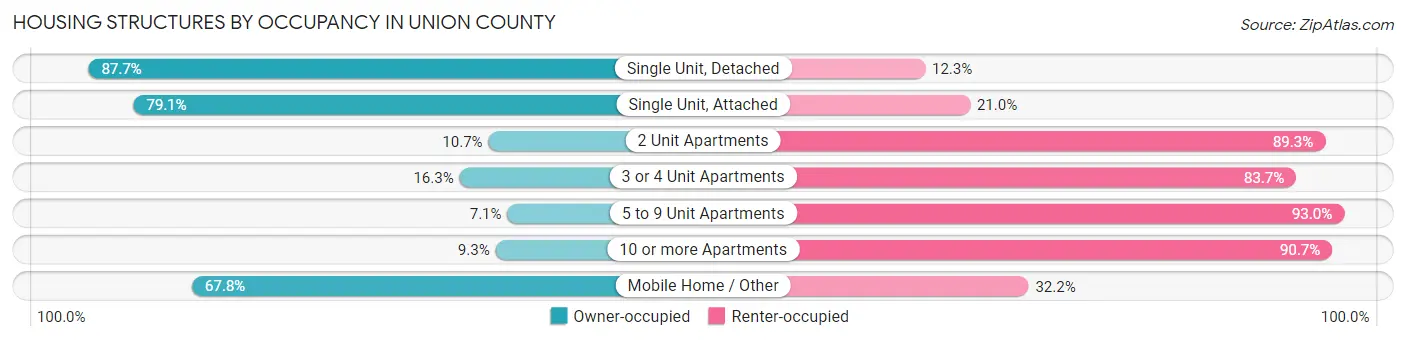
| Structure Type | Owner-occupied | Renter-occupied |
| Single Unit, Detached | 61,472 (87.7%) | 8,620 (12.3%) |
| Single Unit, Attached | 1,792 (79.0%) | 475 (20.9%) |
| 2 Unit Apartments | 99 (10.7%) | 826 (89.3%) |
| 3 or 4 Unit Apartments | 143 (16.3%) | 736 (83.7%) |
| 5 to 9 Unit Apartments | 76 (7.0%) | 1,002 (92.9%) |
| 10 or more Apartments | 118 (9.3%) | 1,147 (90.7%) |
| Mobile Home / Other | 2,552 (67.8%) | 1,213 (32.2%) |
| Total | 66,252 (82.5%) | 14,019 (17.5%) |
Housing Structures by Number of Rooms in Union County
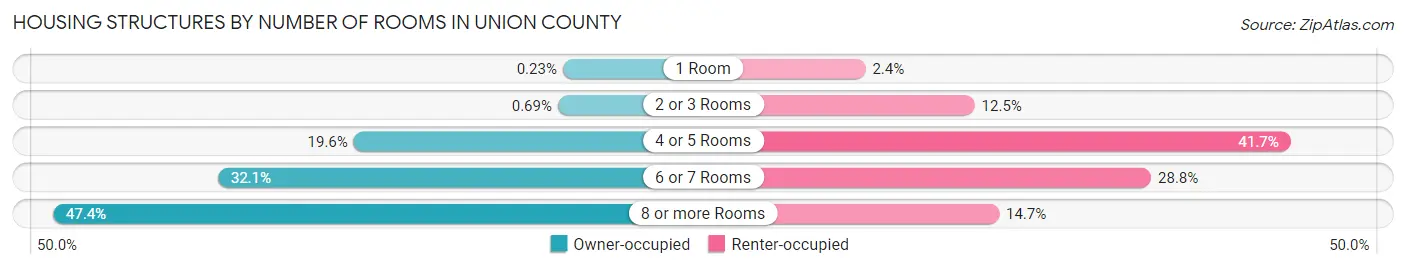
| Number of Rooms | Owner-occupied | Renter-occupied |
| 1 Room | 150 (0.2%) | 331 (2.4%) |
| 2 or 3 Rooms | 459 (0.7%) | 1,747 (12.5%) |
| 4 or 5 Rooms | 12,966 (19.6%) | 5,843 (41.7%) |
| 6 or 7 Rooms | 21,289 (32.1%) | 4,034 (28.8%) |
| 8 or more Rooms | 31,388 (47.4%) | 2,064 (14.7%) |
| Total | 66,252 (100.0%) | 14,019 (100.0%) |
Housing Structure by Heating Type in Union County
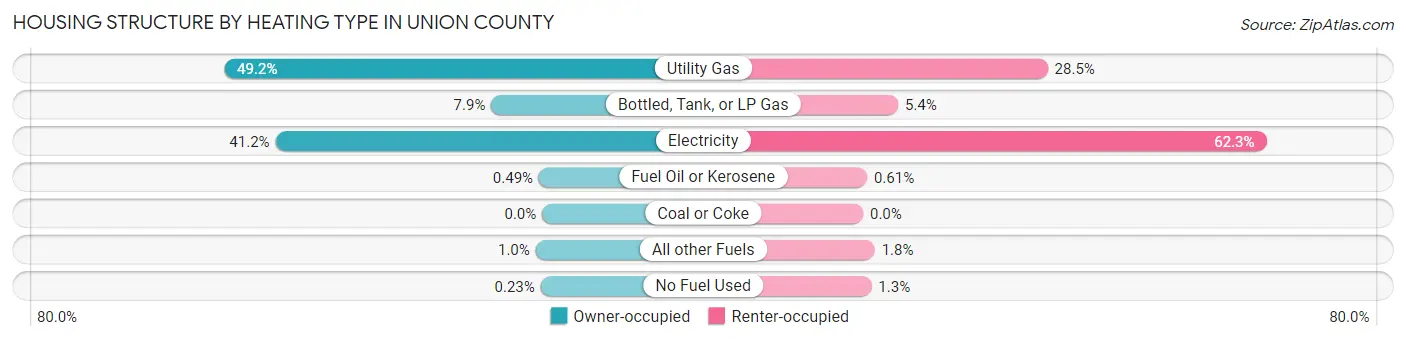
| Heating Type | Owner-occupied | Renter-occupied |
| Utility Gas | 32,578 (49.2%) | 4,001 (28.5%) |
| Bottled, Tank, or LP Gas | 5,210 (7.9%) | 759 (5.4%) |
| Electricity | 27,319 (41.2%) | 8,740 (62.3%) |
| Fuel Oil or Kerosene | 326 (0.5%) | 85 (0.6%) |
| Coal or Coke | 0 (0.0%) | 0 (0.0%) |
| All other Fuels | 664 (1.0%) | 253 (1.8%) |
| No Fuel Used | 155 (0.2%) | 181 (1.3%) |
| Total | 66,252 (100.0%) | 14,019 (100.0%) |
Household Vehicle Usage in Union County
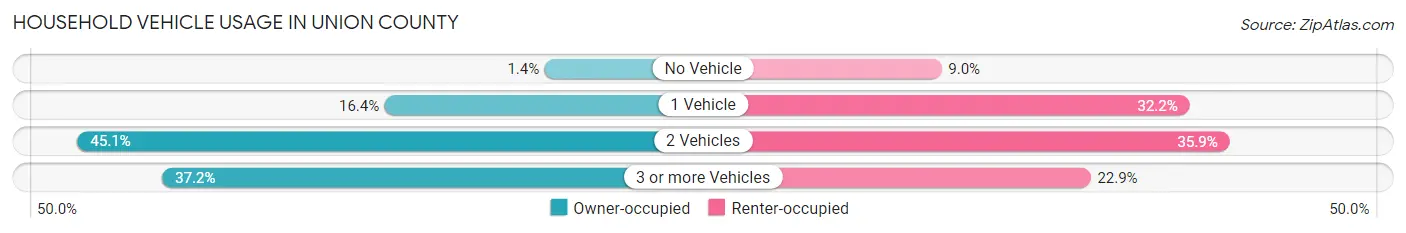
| Vehicles per Household | Owner-occupied | Renter-occupied |
| No Vehicle | 943 (1.4%) | 1,262 (9.0%) |
| 1 Vehicle | 10,829 (16.4%) | 4,510 (32.2%) |
| 2 Vehicles | 29,862 (45.1%) | 5,034 (35.9%) |
| 3 or more Vehicles | 24,618 (37.2%) | 3,213 (22.9%) |
| Total | 66,252 (100.0%) | 14,019 (100.0%) |
Real Estate & Mortgages in Union County
Real Estate and Mortgage Overview in Union County
| Characteristic | Without Mortgage | With Mortgage |
| Housing Units | 18,528 | 47,724 |
| Median Property Value | $286,200 | $354,600 |
| Median Household Income | $73,382 | $17,897 |
| Monthly Housing Costs | $515 | $7,707 |
| Real Estate Taxes | $1,914 | $901 |
Property Value by Mortgage Status in Union County
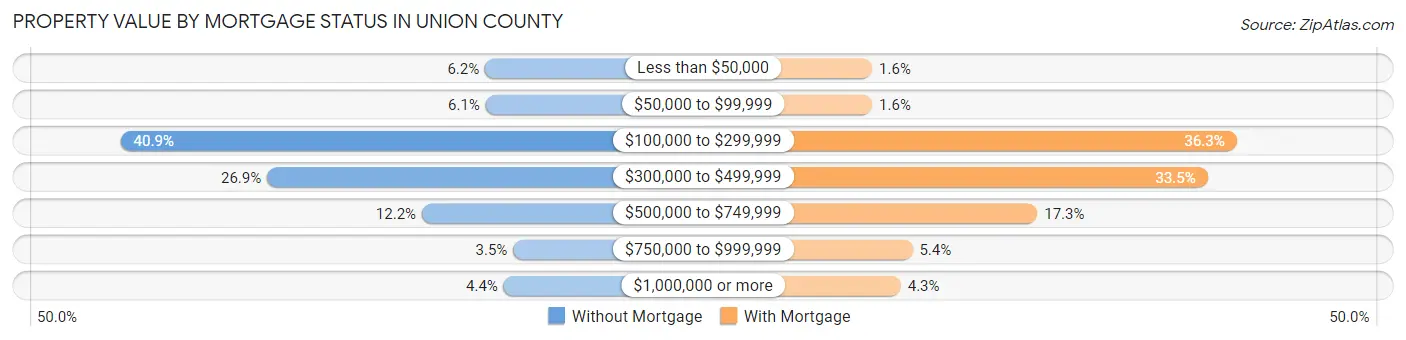
| Property Value | Without Mortgage | With Mortgage |
| Less than $50,000 | 1,139 (6.1%) | 752 (1.6%) |
| $50,000 to $99,999 | 1,129 (6.1%) | 752 (1.6%) |
| $100,000 to $299,999 | 7,568 (40.8%) | 17,317 (36.3%) |
| $300,000 to $499,999 | 4,986 (26.9%) | 15,996 (33.5%) |
| $500,000 to $749,999 | 2,253 (12.2%) | 8,261 (17.3%) |
| $750,000 to $999,999 | 643 (3.5%) | 2,589 (5.4%) |
| $1,000,000 or more | 810 (4.4%) | 2,057 (4.3%) |
| Total | 18,528 (100.0%) | 47,724 (100.0%) |
Household Income by Mortgage Status in Union County
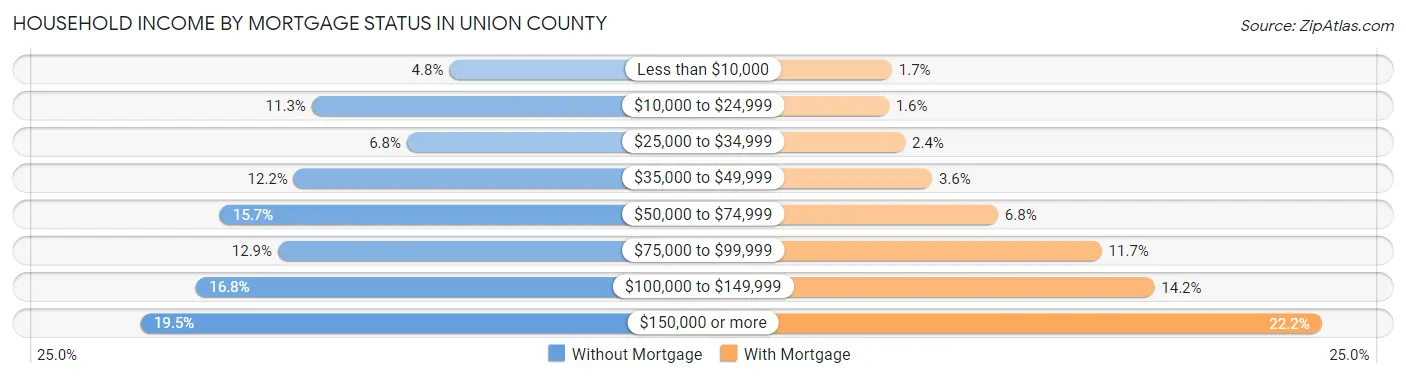
| Household Income | Without Mortgage | With Mortgage |
| Less than $10,000 | 885 (4.8%) | 825 (1.7%) |
| $10,000 to $24,999 | 2,099 (11.3%) | 754 (1.6%) |
| $25,000 to $34,999 | 1,259 (6.8%) | 1,127 (2.4%) |
| $35,000 to $49,999 | 2,258 (12.2%) | 1,735 (3.6%) |
| $50,000 to $74,999 | 2,908 (15.7%) | 3,235 (6.8%) |
| $75,000 to $99,999 | 2,397 (12.9%) | 5,592 (11.7%) |
| $100,000 to $149,999 | 3,116 (16.8%) | 6,793 (14.2%) |
| $150,000 or more | 3,606 (19.5%) | 10,591 (22.2%) |
| Total | 18,528 (100.0%) | 47,724 (100.0%) |
Property Value to Household Income Ratio in Union County
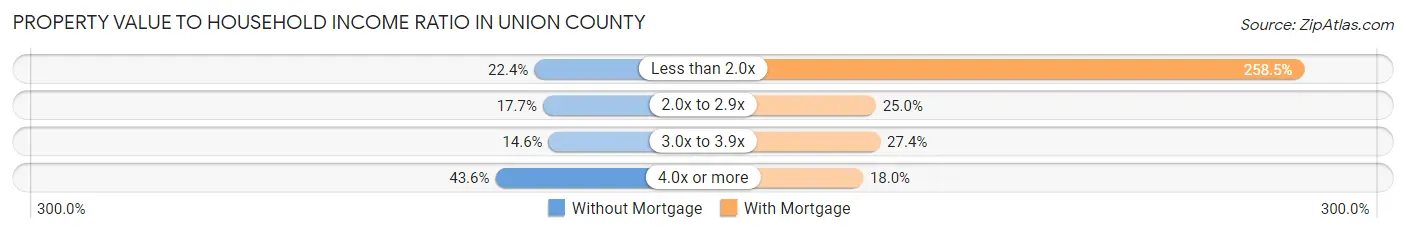
| Value-to-Income Ratio | Without Mortgage | With Mortgage |
| Less than 2.0x | 4,146 (22.4%) | 123,362 (258.5%) |
| 2.0x to 2.9x | 3,280 (17.7%) | 11,915 (25.0%) |
| 3.0x to 3.9x | 2,705 (14.6%) | 13,067 (27.4%) |
| 4.0x or more | 8,071 (43.6%) | 8,590 (18.0%) |
| Total | 18,528 (100.0%) | 47,724 (100.0%) |
Real Estate Taxes by Mortgage Status in Union County
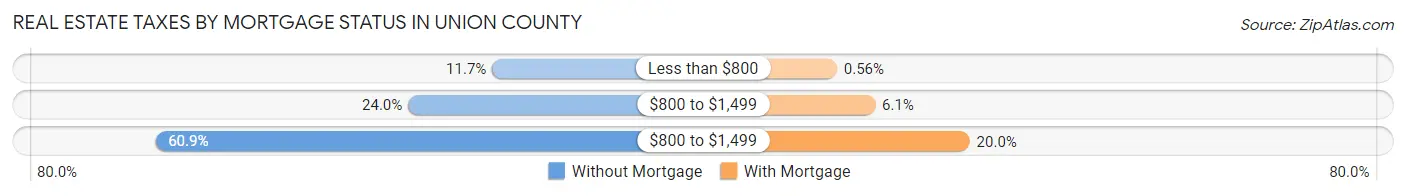
| Property Taxes | Without Mortgage | With Mortgage |
| Less than $800 | 2,164 (11.7%) | 268 (0.6%) |
| $800 to $1,499 | 4,440 (24.0%) | 2,928 (6.1%) |
| $800 to $1,499 | 11,286 (60.9%) | 9,527 (20.0%) |
| Total | 18,528 (100.0%) | 47,724 (100.0%) |
Health & Disability in Union County
Health Insurance Coverage by Age in Union County
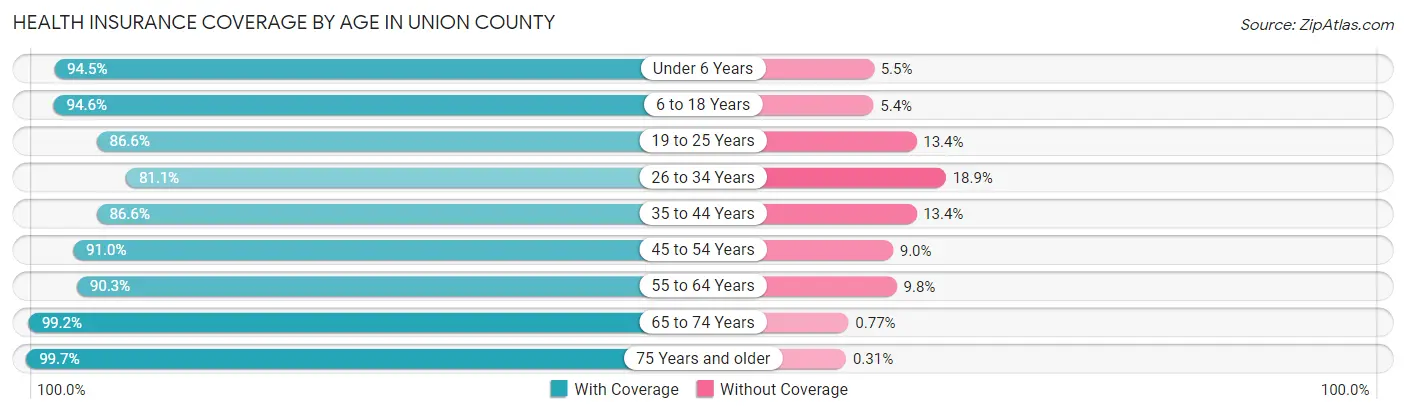
| Age Bracket | With Coverage | Without Coverage |
| Under 6 Years | 14,949 (94.5%) | 869 (5.5%) |
| 6 to 18 Years | 48,813 (94.6%) | 2,797 (5.4%) |
| 19 to 25 Years | 17,201 (86.6%) | 2,666 (13.4%) |
| 26 to 34 Years | 17,110 (81.1%) | 3,991 (18.9%) |
| 35 to 44 Years | 27,693 (86.6%) | 4,289 (13.4%) |
| 45 to 54 Years | 34,865 (91.0%) | 3,464 (9.0%) |
| 55 to 64 Years | 26,640 (90.2%) | 2,878 (9.8%) |
| 65 to 74 Years | 18,974 (99.2%) | 148 (0.8%) |
| 75 Years and older | 11,558 (99.7%) | 36 (0.3%) |
| Total | 217,803 (91.1%) | 21,138 (8.8%) |
Health Insurance Coverage by Citizenship Status in Union County
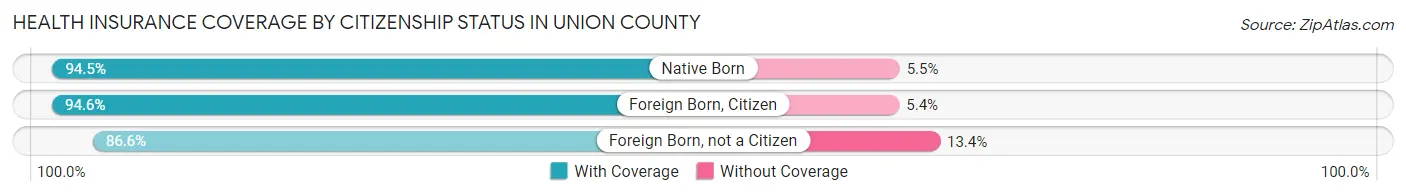
| Citizenship Status | With Coverage | Without Coverage |
| Native Born | 14,949 (94.5%) | 869 (5.5%) |
| Foreign Born, Citizen | 48,813 (94.6%) | 2,797 (5.4%) |
| Foreign Born, not a Citizen | 17,201 (86.6%) | 2,666 (13.4%) |
Health Insurance Coverage by Household Income in Union County
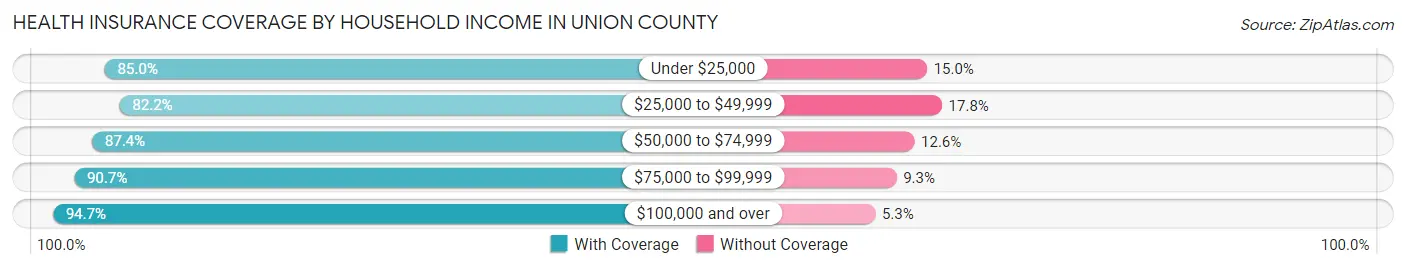
| Household Income | With Coverage | Without Coverage |
| Under $25,000 | 11,350 (85.0%) | 1,999 (15.0%) |
| $25,000 to $49,999 | 23,383 (82.2%) | 5,054 (17.8%) |
| $50,000 to $74,999 | 25,832 (87.4%) | 3,729 (12.6%) |
| $75,000 to $99,999 | 30,578 (90.7%) | 3,119 (9.3%) |
| $100,000 and over | 125,483 (94.7%) | 6,987 (5.3%) |
Public vs Private Health Insurance Coverage by Age in Union County
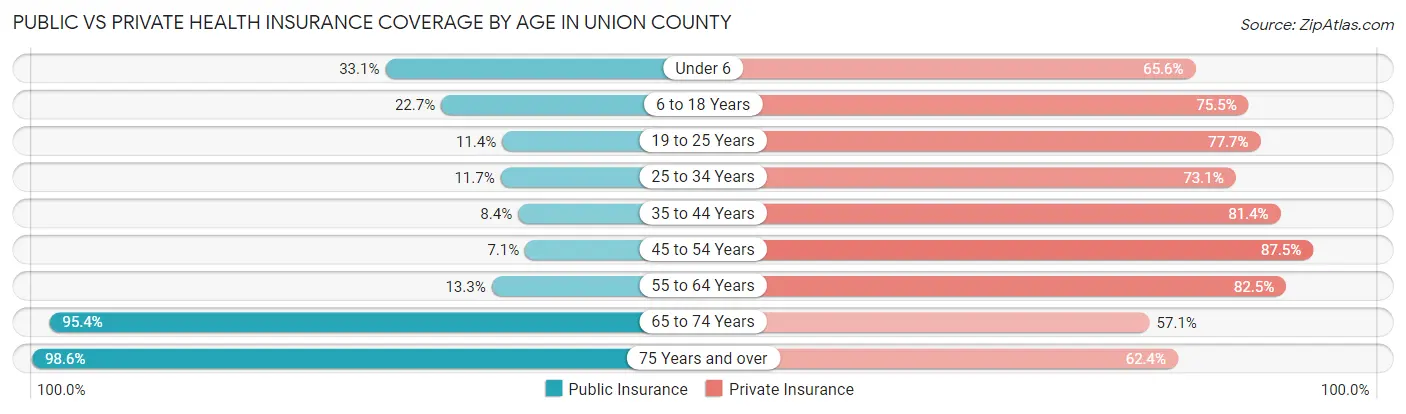
| Age Bracket | Public Insurance | Private Insurance |
| Under 6 | 5,229 (33.1%) | 10,379 (65.6%) |
| 6 to 18 Years | 11,720 (22.7%) | 38,957 (75.5%) |
| 19 to 25 Years | 2,260 (11.4%) | 15,433 (77.7%) |
| 25 to 34 Years | 2,463 (11.7%) | 15,418 (73.1%) |
| 35 to 44 Years | 2,694 (8.4%) | 26,038 (81.4%) |
| 45 to 54 Years | 2,727 (7.1%) | 33,521 (87.5%) |
| 55 to 64 Years | 3,939 (13.3%) | 24,342 (82.5%) |
| 65 to 74 Years | 18,240 (95.4%) | 10,926 (57.1%) |
| 75 Years and over | 11,434 (98.6%) | 7,230 (62.4%) |
| Total | 60,706 (25.4%) | 182,244 (76.3%) |
Disability Status by Sex by Age in Union County
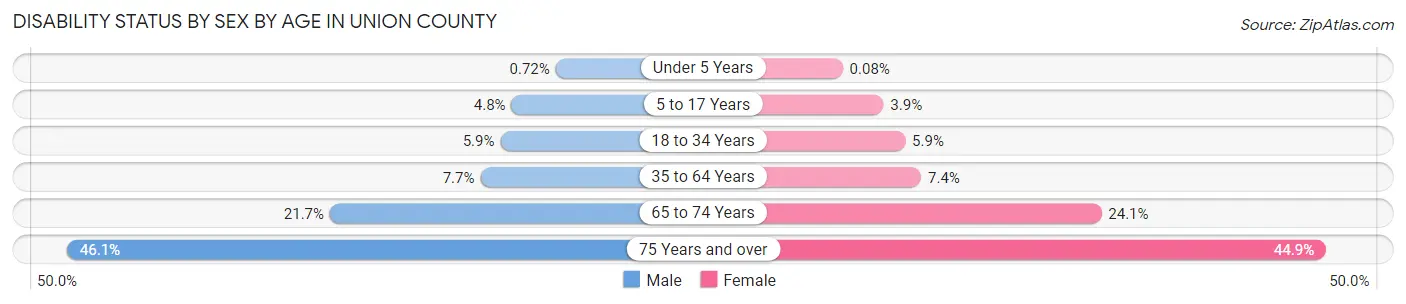
| Age Bracket | Male | Female |
| Under 5 Years | 48 (0.7%) | 5 (0.1%) |
| 5 to 17 Years | 1,220 (4.8%) | 934 (3.9%) |
| 18 to 34 Years | 1,357 (5.9%) | 1,338 (5.9%) |
| 35 to 64 Years | 3,845 (7.7%) | 3,679 (7.4%) |
| 65 to 74 Years | 1,933 (21.7%) | 2,457 (24.1%) |
| 75 Years and over | 2,223 (46.1%) | 3,042 (44.9%) |
Disability Class by Sex by Age in Union County
Disability Class: Hearing Difficulty
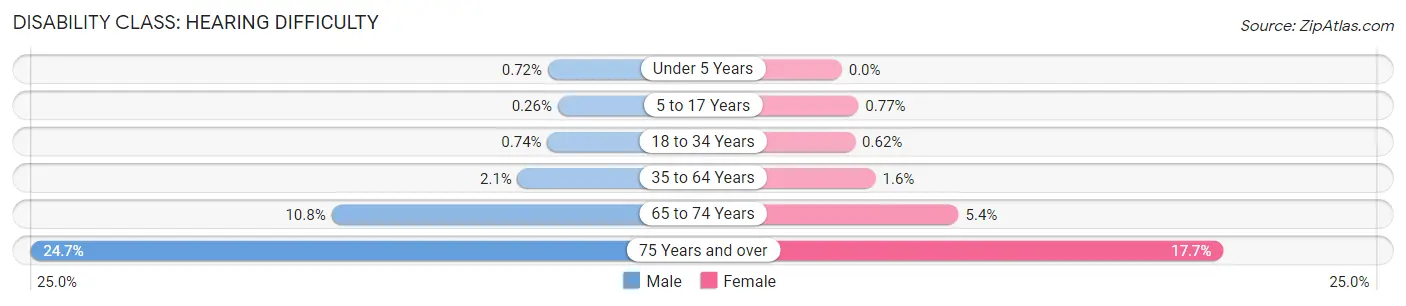
| Age Bracket | Male | Female |
| Under 5 Years | 48 (0.7%) | 0 (0.0%) |
| 5 to 17 Years | 66 (0.3%) | 185 (0.8%) |
| 18 to 34 Years | 171 (0.7%) | 142 (0.6%) |
| 35 to 64 Years | 1,058 (2.1%) | 784 (1.6%) |
| 65 to 74 Years | 960 (10.8%) | 553 (5.4%) |
| 75 Years and over | 1,193 (24.7%) | 1,198 (17.7%) |
Disability Class: Vision Difficulty
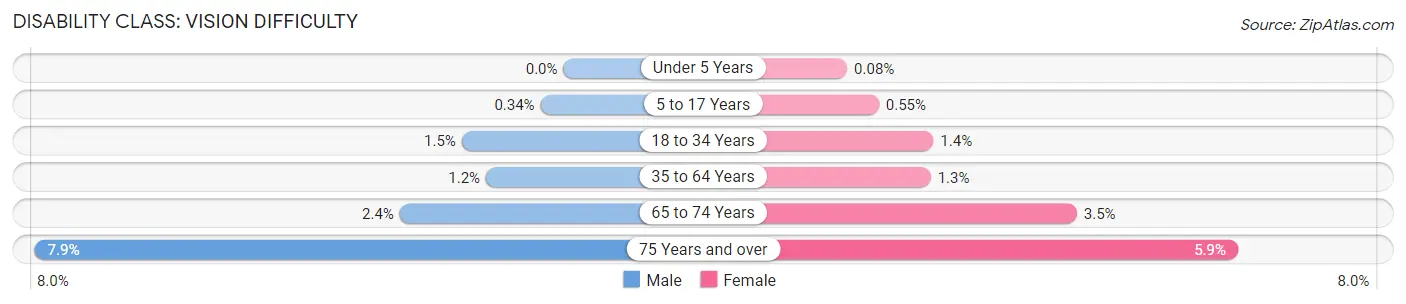
| Age Bracket | Male | Female |
| Under 5 Years | 0 (0.0%) | 5 (0.1%) |
| 5 to 17 Years | 87 (0.3%) | 132 (0.5%) |
| 18 to 34 Years | 349 (1.5%) | 309 (1.4%) |
| 35 to 64 Years | 574 (1.1%) | 661 (1.3%) |
| 65 to 74 Years | 217 (2.4%) | 356 (3.5%) |
| 75 Years and over | 379 (7.9%) | 398 (5.9%) |
Disability Class: Cognitive Difficulty
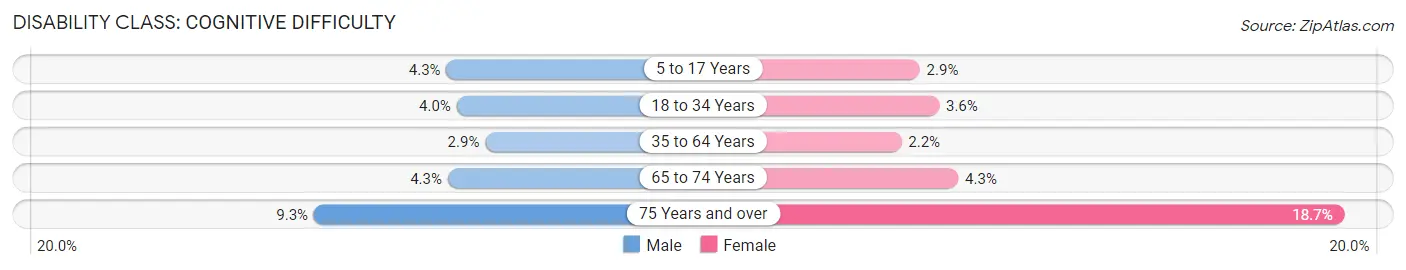
| Age Bracket | Male | Female |
| 5 to 17 Years | 1,099 (4.3%) | 698 (2.9%) |
| 18 to 34 Years | 919 (4.0%) | 821 (3.6%) |
| 35 to 64 Years | 1,445 (2.9%) | 1,104 (2.2%) |
| 65 to 74 Years | 383 (4.3%) | 441 (4.3%) |
| 75 Years and over | 447 (9.3%) | 1,263 (18.7%) |
Disability Class: Ambulatory Difficulty
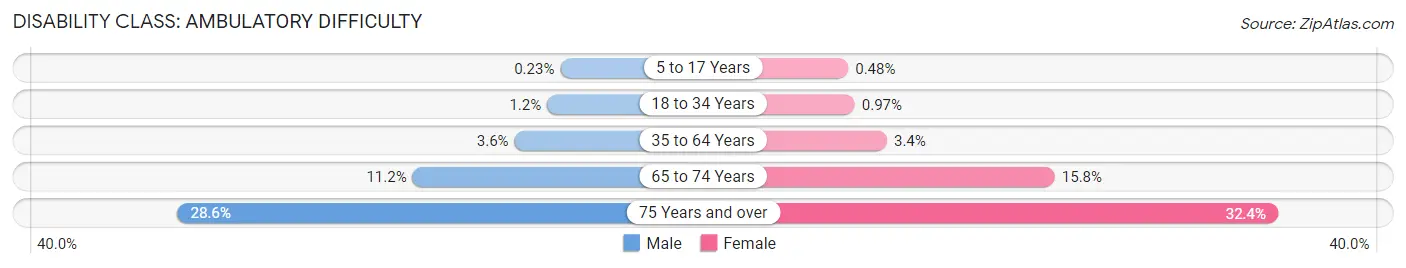
| Age Bracket | Male | Female |
| 5 to 17 Years | 59 (0.2%) | 115 (0.5%) |
| 18 to 34 Years | 281 (1.2%) | 220 (1.0%) |
| 35 to 64 Years | 1,809 (3.6%) | 1,679 (3.4%) |
| 65 to 74 Years | 999 (11.2%) | 1,614 (15.8%) |
| 75 Years and over | 1,382 (28.6%) | 2,191 (32.4%) |
Disability Class: Self-Care Difficulty
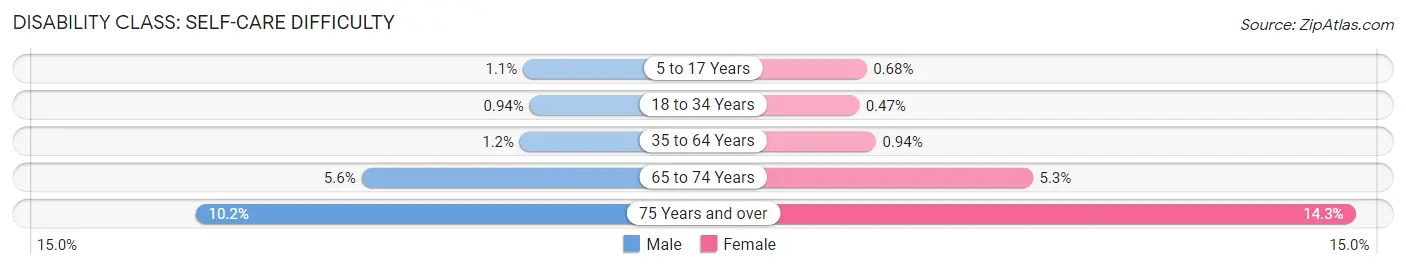
| Age Bracket | Male | Female |
| 5 to 17 Years | 284 (1.1%) | 164 (0.7%) |
| 18 to 34 Years | 217 (0.9%) | 106 (0.5%) |
| 35 to 64 Years | 603 (1.2%) | 471 (0.9%) |
| 65 to 74 Years | 501 (5.6%) | 542 (5.3%) |
| 75 Years and over | 494 (10.2%) | 968 (14.3%) |
Technology Access in Union County
Computing Device Access in Union County
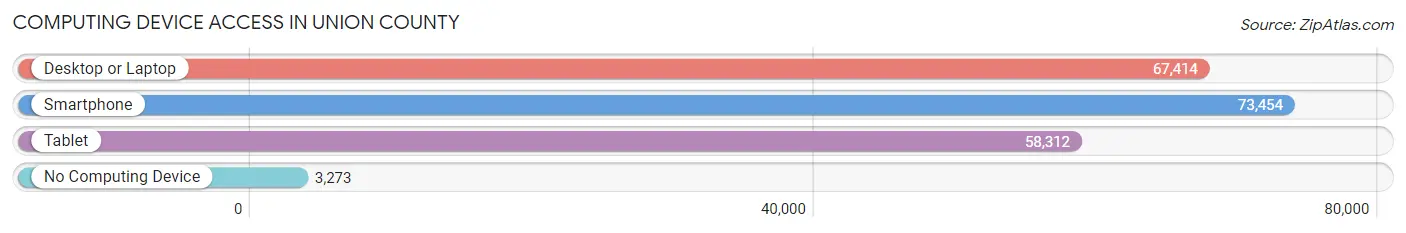
| Device Type | # Households | % Households |
| Desktop or Laptop | 67,414 | 84.0% |
| Smartphone | 73,454 | 91.5% |
| Tablet | 58,312 | 72.6% |
| No Computing Device | 3,273 | 4.1% |
| Total | 80,271 | 100.0% |
Internet Access in Union County
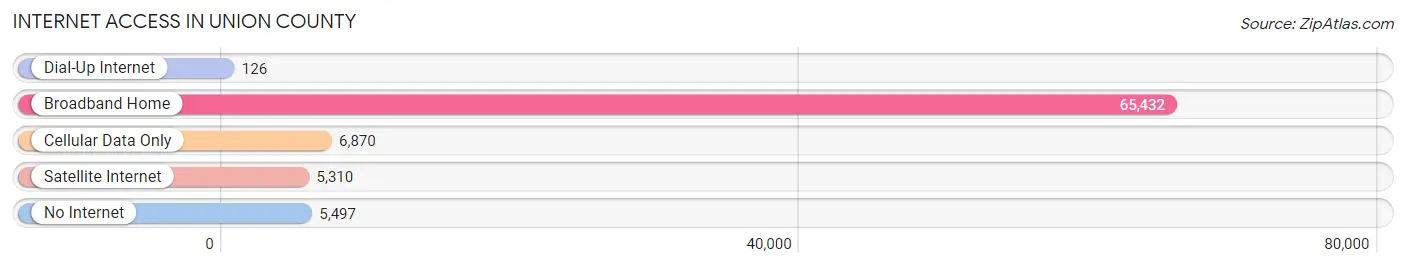
| Internet Type | # Households | % Households |
| Dial-Up Internet | 126 | 0.2% |
| Broadband Home | 65,432 | 81.5% |
| Cellular Data Only | 6,870 | 8.6% |
| Satellite Internet | 5,310 | 6.6% |
| No Internet | 5,497 | 6.9% |
| Total | 80,271 | 100.0% |
Union County Summary
Introduction
Union County is located in the western part of North Carolina, and is part of the Charlotte metropolitan area. It is bordered by Mecklenburg, Cabarrus, Anson, and Stanly counties. Union County is home to a population of over 200,000 people, making it the fifth most populous county in the state. The county seat is Monroe, and the largest city is Indian Trail.
History
Union County was formed in 1842 from parts of Anson and Mecklenburg counties. It was named for the union of the two counties. The county was originally part of the Catawba Nation, and was settled by European settlers in the late 1700s. The county was home to several Revolutionary War battles, including the Battle of Ramsour's Mill.
The county was largely agricultural until the late 19th century, when the railroad was built through the area. This brought industry and growth to the county, and it soon became a major center for textiles and furniture manufacturing. The county also became a popular destination for tourists, with many resorts and attractions being built in the area.
Geography
Union County is located in the western part of North Carolina, and is part of the Charlotte metropolitan area. It is bordered by Mecklenburg, Cabarrus, Anson, and Stanly counties. The county covers an area of 437 square miles, and is home to a population of over 200,000 people.
The county is mostly rural, with rolling hills and forests. The Catawba River runs through the county, and there are several lakes and reservoirs in the area. The county is also home to several state parks, including Morrow Mountain State Park and Lake Norman State Park.
Economy
Union County has a diverse economy, with a mix of manufacturing, agriculture, and services. The county is home to several large employers, including Atrium Health, Novant Health, and Duke Energy. The county is also home to several large manufacturing companies, including Continental Tire and Corning.
Agriculture is also an important part of the county's economy. The county is home to several large farms, and produces a variety of crops, including corn, soybeans, and tobacco. The county is also home to several wineries and breweries.
Demographics
As of the 2010 census, Union County had a population of 201,292. The population is mostly white (77.3%), with African Americans (14.2%), Hispanics (5.2%), and Asians (2.3%) making up the remainder. The median household income is $60,945, and the median home value is $179,400.
Conclusion
Union County is a diverse and vibrant county in western North Carolina. It is home to a population of over 200,000 people, and has a diverse economy that includes manufacturing, agriculture, and services. The county is also home to several state parks, wineries, and breweries. Union County is a great place to live, work, and play.
Common Questions
What is the Total Population of Union County?
Total Population of Union County is 240,109.
What is the Total Male Population of Union County?
Total Male Population of Union County is 119,375.
What is the Total Female Population of Union County?
Total Female Population of Union County is 120,734.
What is the Ratio of Males per 100 Females in Union County?
There are 98.87 Males per 100 Females in Union County.
What is the Ratio of Females per 100 Males in Union County?
There are 101.14 Females per 100 Males in Union County.
What is the Median Population Age in Union County?
Median Population Age in Union County is 38.9 Years.
What is the Average Family Size in Union County
Average Family Size in Union County is 3.3 People.
What is the Average Household Size in Union County
Average Household Size in Union County is 3.0 People.
What is Per Capita Income in Union County?
Per Capita income in Union County is $43,957.
What is the Median Family Income in Union County?
Median Family Income in Union County is $111,518.
What is the Median Household income in Union County?
Median Household Income in Union County is $95,533.
What is Income or Wage Gap in Union County?
Income or Wage Gap in Union County is 31.8%.
Women in Union County earn 68.2 cents for every dollar earned by a man.
What is Family Income Deficit in Union County?
Family Income Deficit in Union County is $11,455.
Families that are below poverty line in Union County earn $11,455 less on average than the poverty threshold level.
What is Inequality or Gini Index in Union County?
Inequality or Gini Index in Union County is 0.45.
How Large is the Labor Force in Union County?
There are 126,311 People in the Labor Forcein in Union County.
What is the Percentage of People in the Labor Force in Union County?
67.7% of People are in the Labor Force in Union County.
What is the Unemployment Rate in Union County?
Unemployment Rate in Union County is 4.3%.