Tyrrell County, NC
Tyrrell County Map
Tyrrell County Overview
3,389
TOTAL POPULATION
1,847
MALE POPULATION
1,542
FEMALE POPULATION
119.78
MALES / 100 FEMALES
83.49
FEMALES / 100 MALES
45.3
MEDIAN AGE
2.4
AVG FAMILY SIZE
2.0
AVG HOUSEHOLD SIZE
$22,403
PER CAPITA INCOME
$59,396
AVG FAMILY INCOME
$55,341
AVG HOUSEHOLD INCOME
43.5%
WAGE / INCOME GAP [ % ]
56.5¢/ $1
WAGE / INCOME GAP [ $ ]
0.40
INEQUALITY / GINI INDEX
1,227
LABOR FORCE [ PEOPLE ]
43.2%
PERCENT IN LABOR FORCE
3.9%
UNEMPLOYMENT RATE
Tyrrell County Area Codes
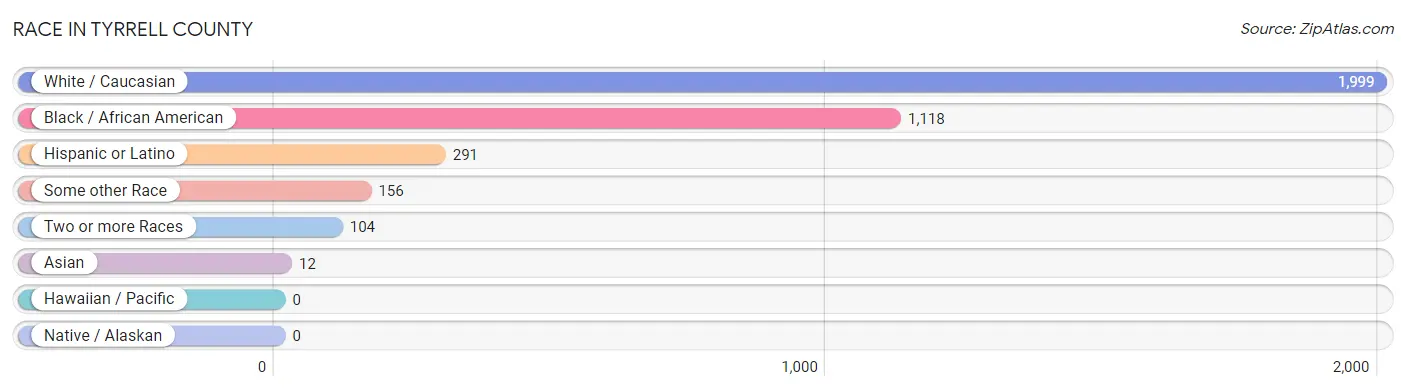
Race in Tyrrell County
The most populous races in Tyrrell County are White / Caucasian (1,999 | 59.0%), Black / African American (1,118 | 33.0%), and Hispanic or Latino (291 | 8.6%).
| Race | # Population | % Population |
| Asian | 12 | 0.4% |
| Black / African American | 1,118 | 33.0% |
| Hawaiian / Pacific | 0 | 0.0% |
| Hispanic or Latino | 291 | 8.6% |
| Native / Alaskan | 0 | 0.0% |
| White / Caucasian | 1,999 | 59.0% |
| Two or more Races | 104 | 3.1% |
| Some other Race | 156 | 4.6% |
| Total | 3,389 | 100.0% |
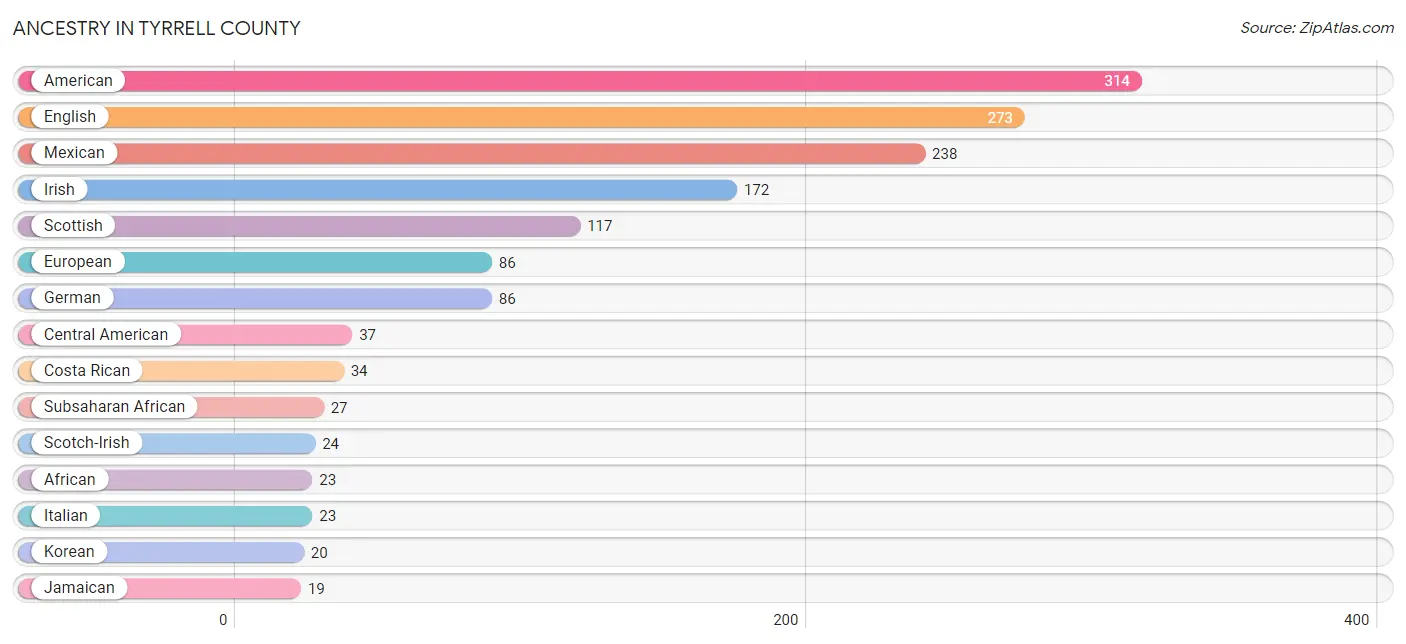
Ancestry in Tyrrell County
The most populous ancestries reported in Tyrrell County are American (314 | 9.3%), English (273 | 8.1%), Mexican (238 | 7.0%), Irish (172 | 5.1%), and Scottish (117 | 3.5%), together accounting for 32.9% of all Tyrrell County residents.
| Ancestry | # Population | % Population |
| African | 23 | 0.7% |
| American | 314 | 9.3% |
| British | 8 | 0.2% |
| British West Indian | 9 | 0.3% |
| Central American | 37 | 1.1% |
| Cherokee | 8 | 0.2% |
| Costa Rican | 34 | 1.0% |
| Danish | 2 | 0.1% |
| Dutch | 15 | 0.4% |
| English | 273 | 8.1% |
| European | 86 | 2.5% |
| French | 10 | 0.3% |
| German | 86 | 2.5% |
| Greek | 6 | 0.2% |
| Guatemalan | 3 | 0.1% |
| Irish | 172 | 5.1% |
| Italian | 23 | 0.7% |
| Jamaican | 19 | 0.6% |
| Korean | 20 | 0.6% |
| Mexican | 238 | 7.0% |
| Polish | 8 | 0.2% |
| Puerto Rican | 9 | 0.3% |
| Scandinavian | 7 | 0.2% |
| Scotch-Irish | 24 | 0.7% |
| Scottish | 117 | 3.5% |
| Subsaharan African | 27 | 0.8% |
| Welsh | 1 | 0.0% | View All 27 Rows |
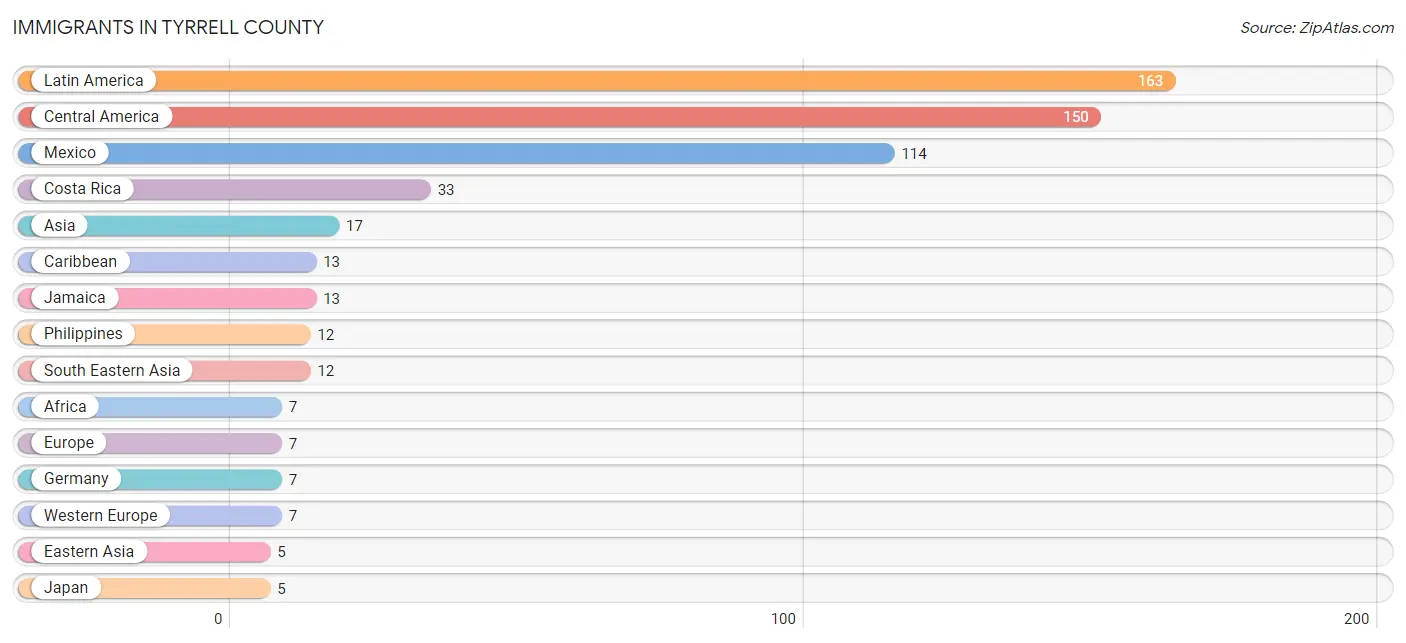
Immigrants in Tyrrell County
The most numerous immigrant groups reported in Tyrrell County came from Latin America (163 | 4.8%), Central America (150 | 4.4%), Mexico (114 | 3.4%), Costa Rica (33 | 1.0%), and Asia (17 | 0.5%), together accounting for 14.1% of all Tyrrell County residents.
| Immigration Origin | # Population | % Population |
| Africa | 7 | 0.2% |
| Asia | 17 | 0.5% |
| Caribbean | 13 | 0.4% |
| Central America | 150 | 4.4% |
| Costa Rica | 33 | 1.0% |
| Eastern Asia | 5 | 0.2% |
| Europe | 7 | 0.2% |
| Germany | 7 | 0.2% |
| Guatemala | 3 | 0.1% |
| Jamaica | 13 | 0.4% |
| Japan | 5 | 0.2% |
| Latin America | 163 | 4.8% |
| Mexico | 114 | 3.4% |
| Philippines | 12 | 0.4% |
| South Eastern Asia | 12 | 0.4% |
| Western Europe | 7 | 0.2% | View All 16 Rows |
Sex and Age in Tyrrell County
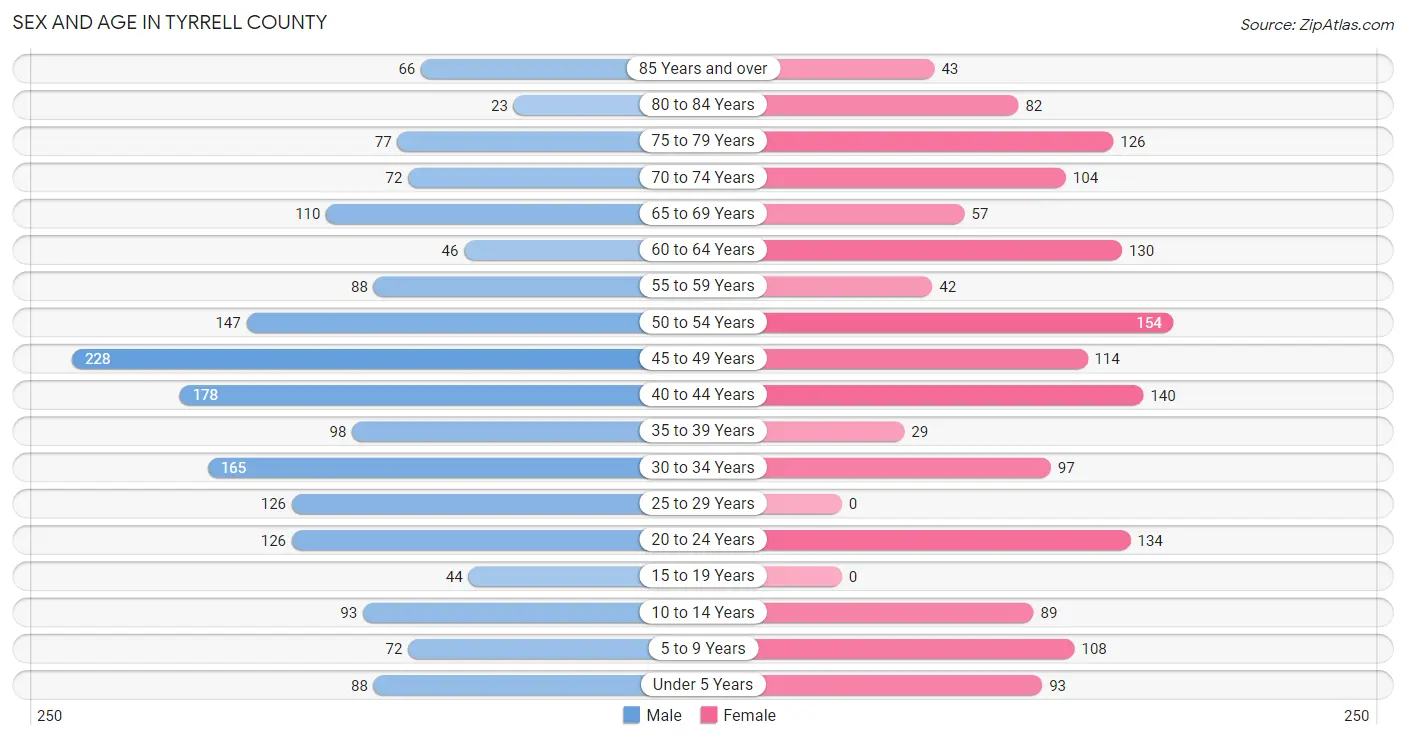
Sex and Age in Tyrrell County
The most populous age groups in Tyrrell County are 45 to 49 Years (228 | 12.3%) for men and 50 to 54 Years (154 | 10.0%) for women.
| Age Bracket | Male | Female |
| Under 5 Years | 88 (4.8%) | 93 (6.0%) |
| 5 to 9 Years | 72 (3.9%) | 108 (7.0%) |
| 10 to 14 Years | 93 (5.0%) | 89 (5.8%) |
| 15 to 19 Years | 44 (2.4%) | 0 (0.0%) |
| 20 to 24 Years | 126 (6.8%) | 134 (8.7%) |
| 25 to 29 Years | 126 (6.8%) | 0 (0.0%) |
| 30 to 34 Years | 165 (8.9%) | 97 (6.3%) |
| 35 to 39 Years | 98 (5.3%) | 29 (1.9%) |
| 40 to 44 Years | 178 (9.6%) | 140 (9.1%) |
| 45 to 49 Years | 228 (12.3%) | 114 (7.4%) |
| 50 to 54 Years | 147 (8.0%) | 154 (10.0%) |
| 55 to 59 Years | 88 (4.8%) | 42 (2.7%) |
| 60 to 64 Years | 46 (2.5%) | 130 (8.4%) |
| 65 to 69 Years | 110 (6.0%) | 57 (3.7%) |
| 70 to 74 Years | 72 (3.9%) | 104 (6.7%) |
| 75 to 79 Years | 77 (4.2%) | 126 (8.2%) |
| 80 to 84 Years | 23 (1.3%) | 82 (5.3%) |
| 85 Years and over | 66 (3.6%) | 43 (2.8%) |
| Total | 1,847 (100.0%) | 1,542 (100.0%) |
Families and Households in Tyrrell County
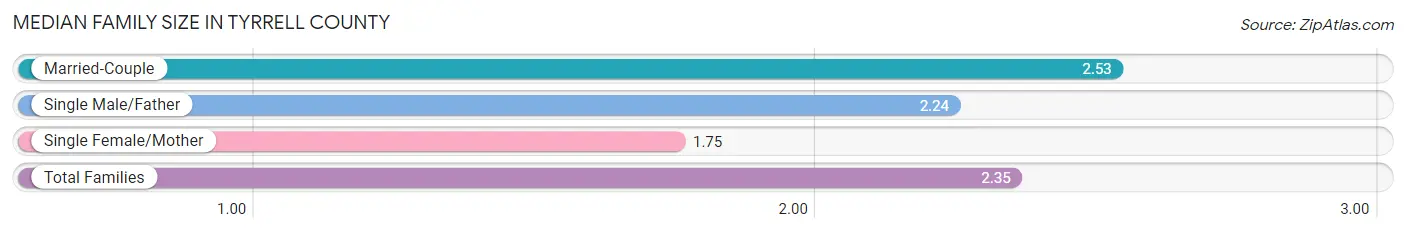
Median Family Size in Tyrrell County
The median family size in Tyrrell County is 2.35 persons per family, with married-couple families (681 | 73.6%) accounting for the largest median family size of 2.53 persons per family. On the other hand, single female/mother families (185 | 20.0%) represent the smallest median family size with 1.75 persons per family.
| Family Type | # Families | Family Size |
| Married-Couple | 681 (73.6%) | 2.53 |
| Single Male/Father | 59 (6.4%) | 2.24 |
| Single Female/Mother | 185 (20.0%) | 1.75 |
| Total Families | 925 (100.0%) | 2.35 |
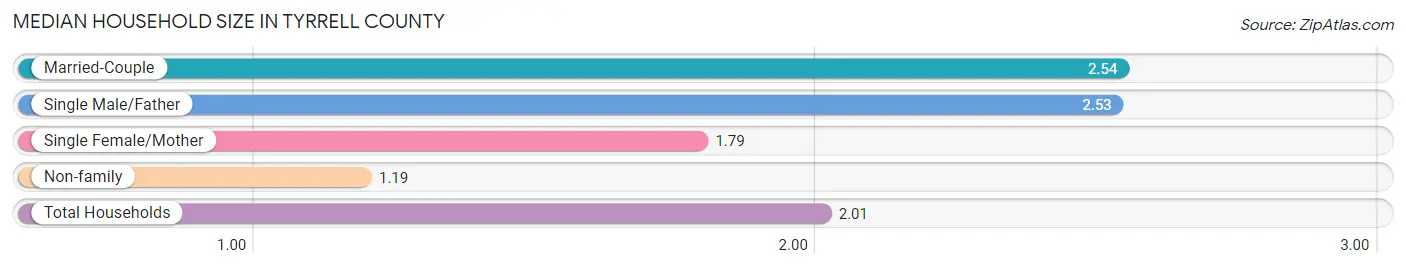
Median Household Size in Tyrrell County
The median household size in Tyrrell County is 2.01 persons per household, with married-couple households (681 | 50.4%) accounting for the largest median household size of 2.54 persons per household. non-family households (426 | 31.5%) represent the smallest median household size with 1.19 persons per household.
| Household Type | # Households | Household Size |
| Married-Couple | 681 (50.4%) | 2.54 |
| Single Male/Father | 59 (4.4%) | 2.53 |
| Single Female/Mother | 185 (13.7%) | 1.79 |
| Non-family | 426 (31.5%) | 1.19 |
| Total Households | 1,351 (100.0%) | 2.01 |
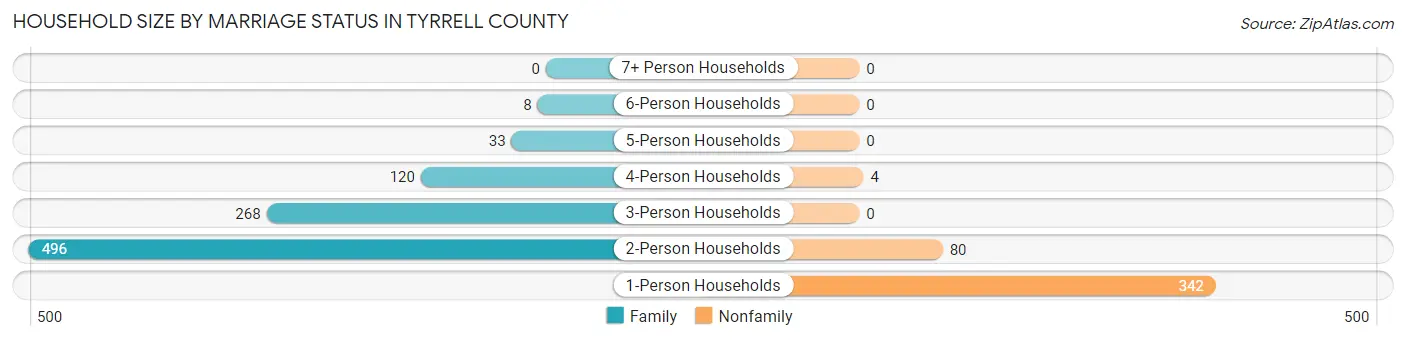
Household Size by Marriage Status in Tyrrell County
Out of a total of 1,351 households in Tyrrell County, 925 (68.5%) are family households, while 426 (31.5%) are nonfamily households. The most numerous type of family households are 2-person households, comprising 496, and the most common type of nonfamily households are 1-person households, comprising 342.
| Household Size | Family Households | Nonfamily Households |
| 1-Person Households | - | 342 (25.3%) |
| 2-Person Households | 496 (36.7%) | 80 (5.9%) |
| 3-Person Households | 268 (19.8%) | 0 (0.0%) |
| 4-Person Households | 120 (8.9%) | 4 (0.3%) |
| 5-Person Households | 33 (2.4%) | 0 (0.0%) |
| 6-Person Households | 8 (0.6%) | 0 (0.0%) |
| 7+ Person Households | 0 (0.0%) | 0 (0.0%) |
| Total | 925 (68.5%) | 426 (31.5%) |
Female Fertility in Tyrrell County
Fertility by Age in Tyrrell County
Average fertility rate in Tyrrell County is 13.0 births per 1,000 women. Women in the age bracket of 20 to 34 years have the highest fertility rate with 30.0 births per 1,000 women. Women in the age bracket of 20 to 34 years acount for 100.0% of all women with births.
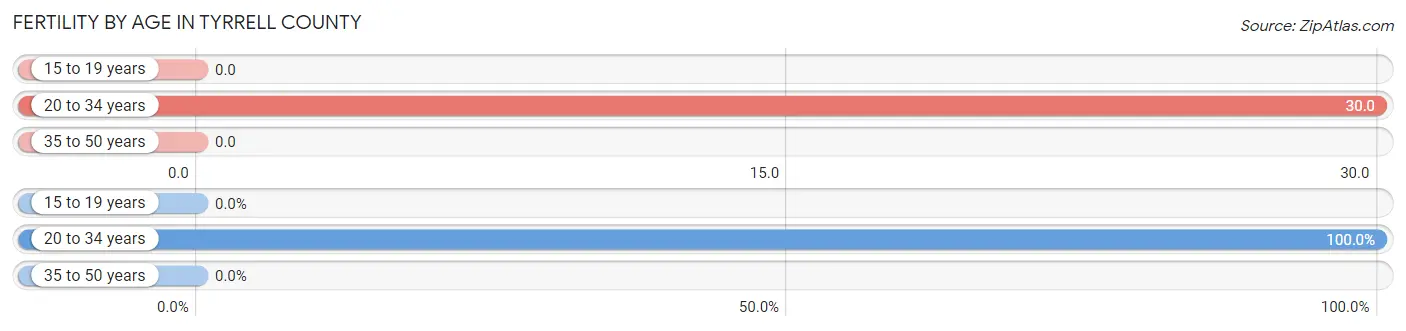
| Age Bracket | Women with Births | Births / 1,000 Women |
| 15 to 19 years | 0 (0.0%) | 0.0 |
| 20 to 34 years | 7 (100.0%) | 30.0 |
| 35 to 50 years | 0 (0.0%) | 0.0 |
| Total | 7 (100.0%) | 13.0 |
Fertility by Age by Marriage Status in Tyrrell County
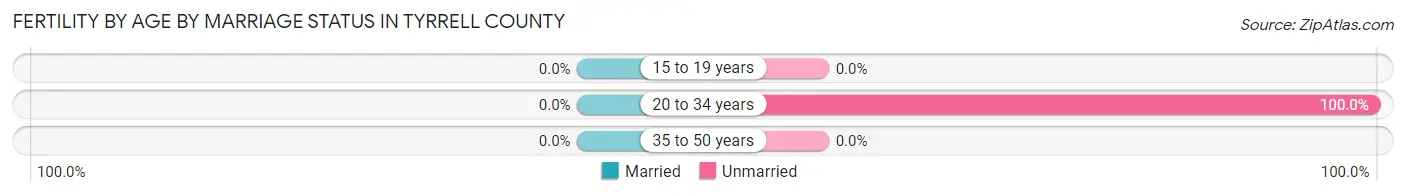
| Age Bracket | Married | Unmarried |
| 15 to 19 years | 0 (0.0%) | 0 (0.0%) |
| 20 to 34 years | 0 (0.0%) | 7 (100.0%) |
| 35 to 50 years | 0 (0.0%) | 0 (0.0%) |
| Total | 0 (0.0%) | 7 (100.0%) |
Fertility by Education in Tyrrell County
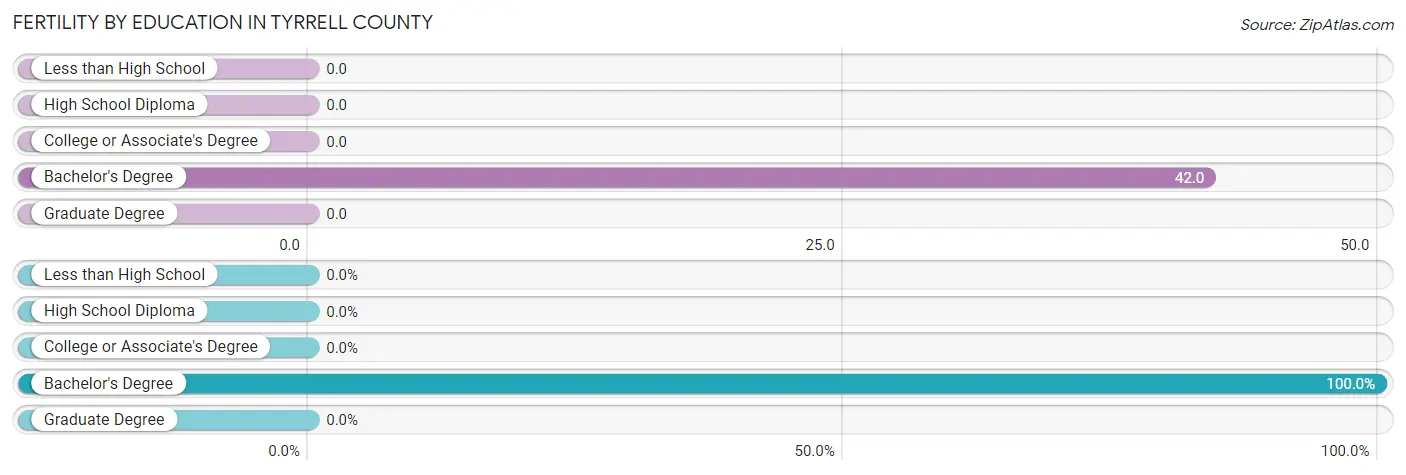
| Educational Attainment | Women with Births | Births / 1,000 Women |
| Less than High School | 0 (0.0%) | 0.0 |
| High School Diploma | 0 (0.0%) | 0.0 |
| College or Associate's Degree | 0 (0.0%) | 0.0 |
| Bachelor's Degree | 7 (100.0%) | 42.0 |
| Graduate Degree | 0 (0.0%) | 0.0 |
| Total | 7 (100.0%) | 13.0 |
Fertility by Education by Marriage Status in Tyrrell County
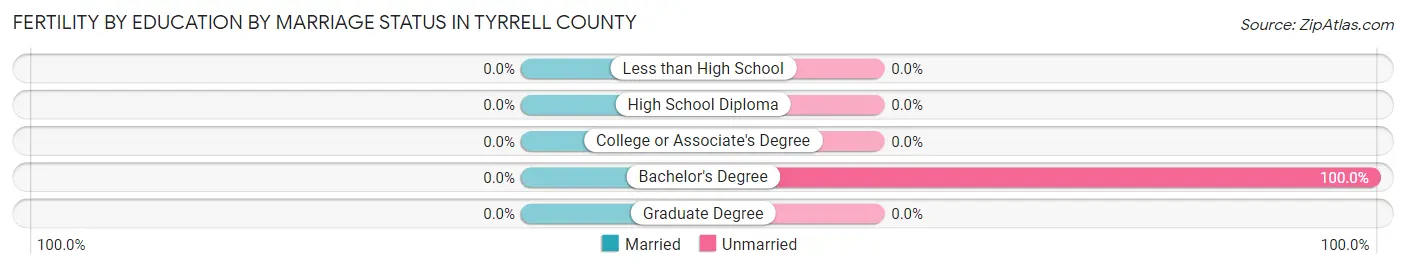
| Educational Attainment | Married | Unmarried |
| Less than High School | 0 (0.0%) | 0 (0.0%) |
| High School Diploma | 0 (0.0%) | 0 (0.0%) |
| College or Associate's Degree | 0 (0.0%) | 0 (0.0%) |
| Bachelor's Degree | 0 (0.0%) | 7 (100.0%) |
| Graduate Degree | 0 (0.0%) | 0 (0.0%) |
| Total | 0 (0.0%) | 7 (100.0%) |
Income in Tyrrell County
Income Overview in Tyrrell County
Per Capita Income in Tyrrell County is $22,403, while median incomes of families and households are $59,396 and $55,341 respectively.
| Characteristic | Number | Measure |
| Per Capita Income | 3,389 | $22,403 |
| Median Family Income | 925 | $59,396 |
| Mean Family Income | 925 | $70,747 |
| Median Household Income | 1,351 | $55,341 |
| Mean Household Income | 1,351 | $59,662 |
| Income Deficit | 925 | $0 |
| Wage / Income Gap (%) | 3,389 | 43.47% |
| Wage / Income Gap ($) | 3,389 | 56.53¢ per $1 |
| Gini / Inequality Index | 3,389 | 0.40 |
Earnings by Sex in Tyrrell County
Average Earnings in Tyrrell County are $32,557, $46,438 for men and $26,250 for women, a difference of 43.5%.
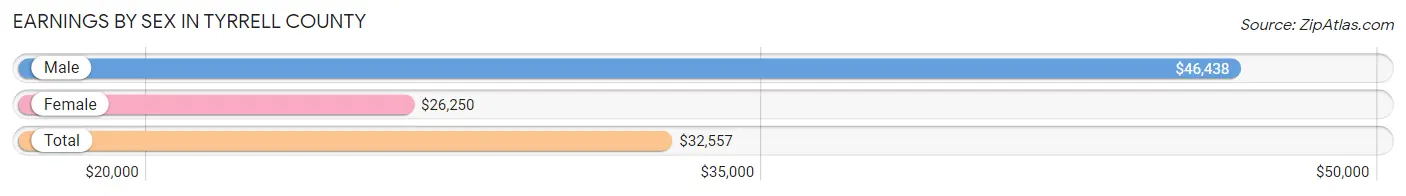
| Sex | Number | Average Earnings |
| Male | 740 (52.9%) | $46,438 |
| Female | 659 (47.1%) | $26,250 |
| Total | 1,399 (100.0%) | $32,557 |
Earnings by Sex by Income Bracket in Tyrrell County
The most common earnings brackets in Tyrrell County are $55,000 to $64,999 for men (202 | 27.3%) and $35,000 to $39,999 for women (77 | 11.7%).

| Income | Male | Female |
| $2,499 or less | 45 (6.1%) | 41 (6.2%) |
| $2,500 to $4,999 | 18 (2.4%) | 47 (7.1%) |
| $5,000 to $7,499 | 19 (2.6%) | 18 (2.7%) |
| $7,500 to $9,999 | 17 (2.3%) | 14 (2.1%) |
| $10,000 to $12,499 | 12 (1.6%) | 42 (6.4%) |
| $12,500 to $14,999 | 17 (2.3%) | 45 (6.8%) |
| $15,000 to $17,499 | 48 (6.5%) | 22 (3.3%) |
| $17,500 to $19,999 | 8 (1.1%) | 66 (10.0%) |
| $20,000 to $22,499 | 47 (6.4%) | 9 (1.4%) |
| $22,500 to $24,999 | 10 (1.3%) | 22 (3.3%) |
| $25,000 to $29,999 | 40 (5.4%) | 63 (9.6%) |
| $30,000 to $34,999 | 18 (2.4%) | 33 (5.0%) |
| $35,000 to $39,999 | 3 (0.4%) | 77 (11.7%) |
| $40,000 to $44,999 | 45 (6.1%) | 21 (3.2%) |
| $45,000 to $49,999 | 46 (6.2%) | 36 (5.5%) |
| $50,000 to $54,999 | 9 (1.2%) | 38 (5.8%) |
| $55,000 to $64,999 | 202 (27.3%) | 21 (3.2%) |
| $65,000 to $74,999 | 62 (8.4%) | 9 (1.4%) |
| $75,000 to $99,999 | 40 (5.4%) | 26 (4.0%) |
| $100,000+ | 34 (4.6%) | 9 (1.4%) |
| Total | 740 (100.0%) | 659 (100.0%) |
Earnings by Sex by Educational Attainment in Tyrrell County
Average earnings in Tyrrell County are $44,056 for men and $23,466 for women, a difference of 46.7%. Men with an educational attainment of bachelor's degree enjoy the highest average annual earnings of $68,313, while those with college or associate's degree education earn the least with $26,058. Women with an educational attainment of college or associate's degree earn the most with the average annual earnings of $37,900, while those with graduate degree education have the smallest earnings of $2,499.
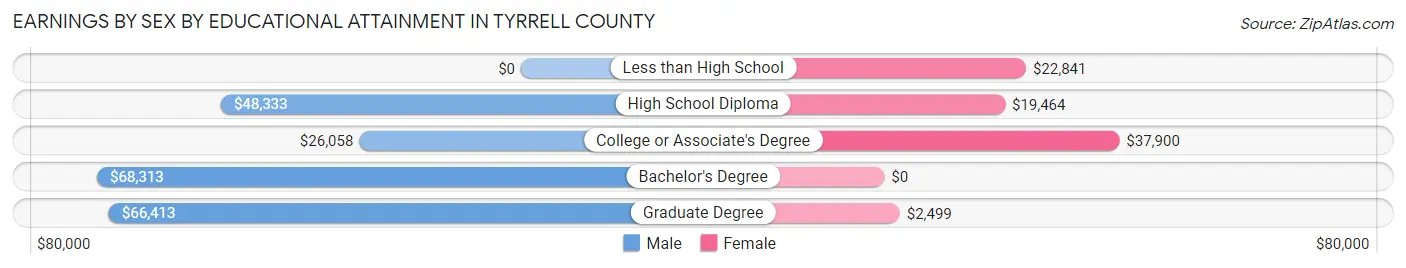
| Educational Attainment | Male Income | Female Income |
| Less than High School | - | - |
| High School Diploma | $48,333 | $19,464 |
| College or Associate's Degree | $26,058 | $37,900 |
| Bachelor's Degree | $68,313 | $0 |
| Graduate Degree | $66,413 | $2,499 |
| Total | $44,056 | $23,466 |
Family Income in Tyrrell County
Family Income Brackets in Tyrrell County
According to the Tyrrell County family income data, there are 291 families falling into the $50,000 to $74,999 income range, which is the most common income bracket and makes up 31.5% of all families. Conversely, the $10,000 to $14,999 income bracket is the least frequent group with only 13 families (1.4%) belonging to this category.
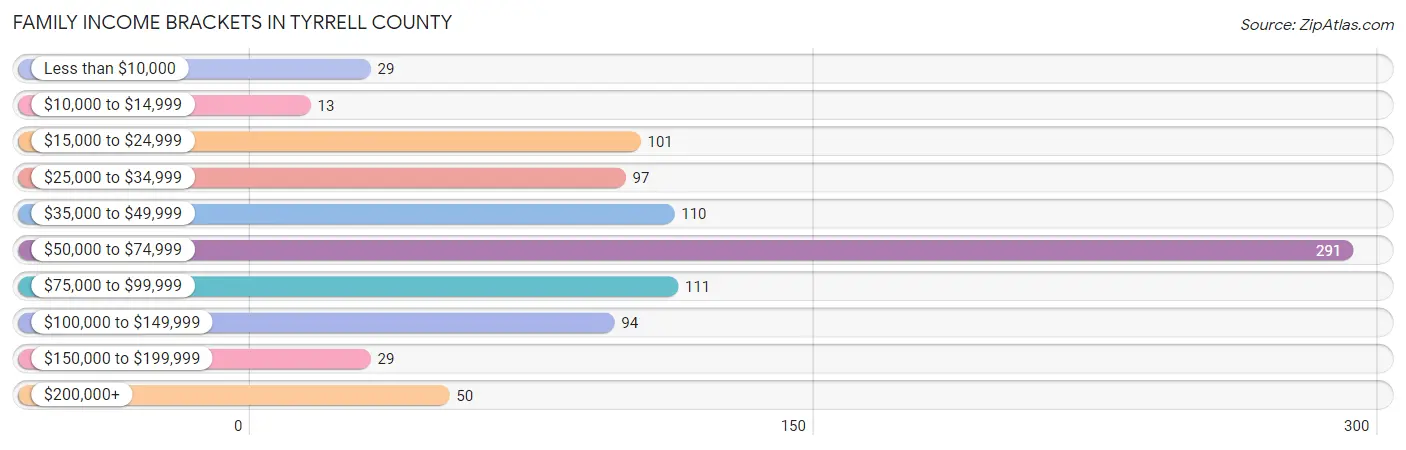
| Income Bracket | # Families | % Families |
| Less than $10,000 | 29 | 3.1% |
| $10,000 to $14,999 | 13 | 1.4% |
| $15,000 to $24,999 | 101 | 10.9% |
| $25,000 to $34,999 | 97 | 10.5% |
| $35,000 to $49,999 | 110 | 11.9% |
| $50,000 to $74,999 | 291 | 31.5% |
| $75,000 to $99,999 | 111 | 12.0% |
| $100,000 to $149,999 | 94 | 10.2% |
| $150,000 to $199,999 | 29 | 3.1% |
| $200,000+ | 50 | 5.4% |
Family Income by Famaliy Size in Tyrrell County
4-person families (129 | 14.0%) account for the highest median family income in Tyrrell County with $66,386 per family, while 2-person families (524 | 56.7%) have the highest median income of $24,546 per family member.
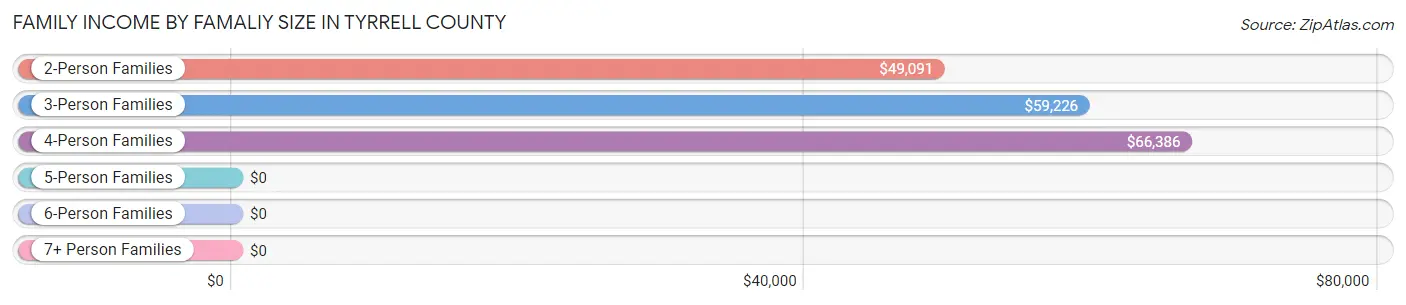
| Income Bracket | # Families | Median Income |
| 2-Person Families | 524 (56.7%) | $49,091 |
| 3-Person Families | 240 (26.0%) | $59,226 |
| 4-Person Families | 129 (14.0%) | $66,386 |
| 5-Person Families | 26 (2.8%) | $0 |
| 6-Person Families | 6 (0.6%) | $0 |
| 7+ Person Families | 0 (0.0%) | $0 |
| Total | 925 (100.0%) | $59,396 |
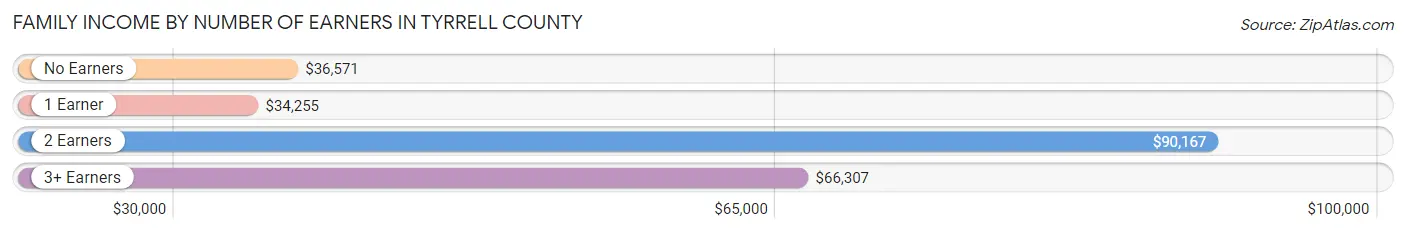
Family Income by Number of Earners in Tyrrell County
The median family income in Tyrrell County is $59,396, with families comprising 2 earners (356) having the highest median family income of $90,167, while families with 1 earner (296) have the lowest median family income of $34,255, accounting for 38.5% and 32.0% of families, respectively.
| Number of Earners | # Families | Median Income |
| No Earners | 200 (21.6%) | $36,571 |
| 1 Earner | 296 (32.0%) | $34,255 |
| 2 Earners | 356 (38.5%) | $90,167 |
| 3+ Earners | 73 (7.9%) | $66,307 |
| Total | 925 (100.0%) | $59,396 |
Household Income in Tyrrell County
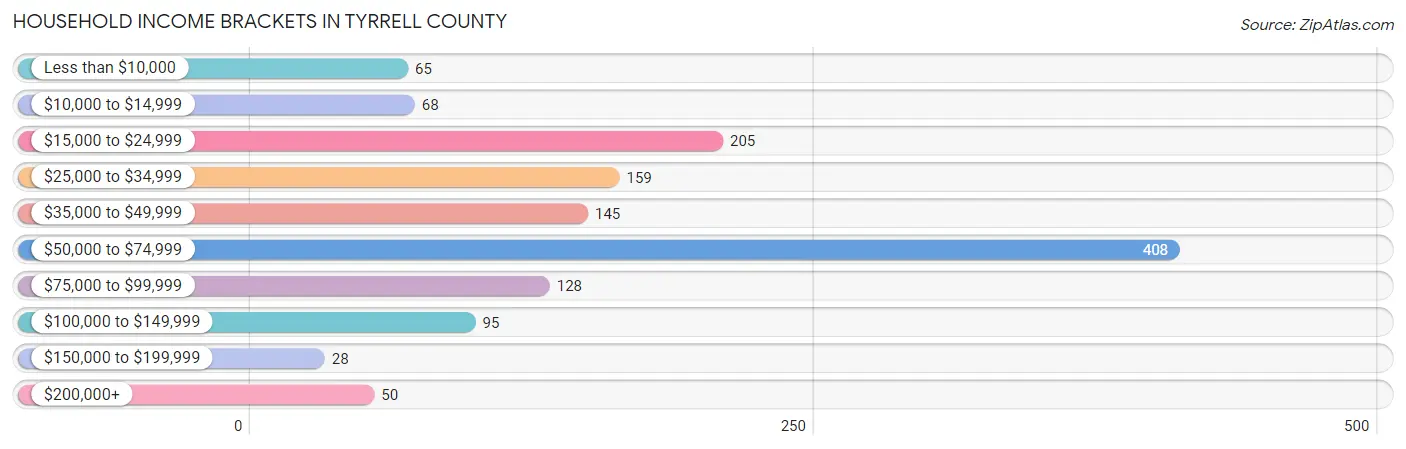
Household Income Brackets in Tyrrell County
With 408 households falling in the category, the $50,000 to $74,999 income range is the most frequent in Tyrrell County, accounting for 30.2% of all households. In contrast, only 28 households (2.1%) fall into the $150,000 to $199,999 income bracket, making it the least populous group.
| Income Bracket | # Households | % Households |
| Less than $10,000 | 65 | 4.8% |
| $10,000 to $14,999 | 68 | 5.0% |
| $15,000 to $24,999 | 205 | 15.2% |
| $25,000 to $34,999 | 159 | 11.8% |
| $35,000 to $49,999 | 145 | 10.7% |
| $50,000 to $74,999 | 408 | 30.2% |
| $75,000 to $99,999 | 128 | 9.5% |
| $100,000 to $149,999 | 95 | 7.0% |
| $150,000 to $199,999 | 28 | 2.1% |
| $200,000+ | 50 | 3.7% |
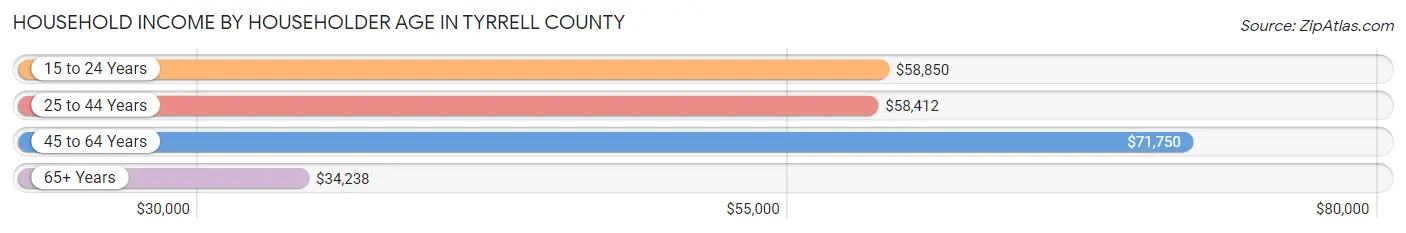
Household Income by Householder Age in Tyrrell County
The median household income in Tyrrell County is $55,341, with the highest median household income of $71,750 found in the 45 to 64 years age bracket for the primary householder. A total of 478 households (35.4%) fall into this category. Meanwhile, the 65+ years age bracket for the primary householder has the lowest median household income of $34,238, with 515 households (38.1%) in this group.
| Income Bracket | # Households | Median Income |
| 15 to 24 Years | 143 (10.6%) | $58,850 |
| 25 to 44 Years | 215 (15.9%) | $58,412 |
| 45 to 64 Years | 478 (35.4%) | $71,750 |
| 65+ Years | 515 (38.1%) | $34,238 |
| Total | 1,351 (100.0%) | $55,341 |
Poverty in Tyrrell County
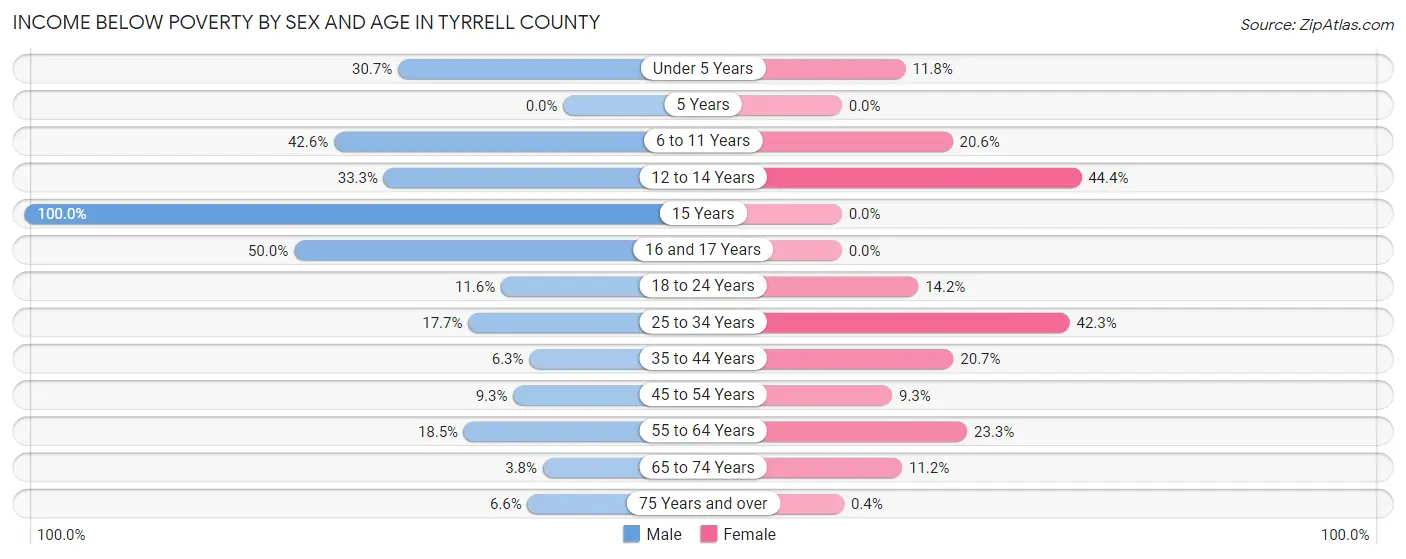
Income Below Poverty by Sex and Age in Tyrrell County
With 16.3% poverty level for males and 15.8% for females among the residents of Tyrrell County, 15 year old males and 12 to 14 year old females are the most vulnerable to poverty, with 6 males (100.0%) and 28 females (44.4%) in their respective age groups living below the poverty level.
| Age Bracket | Male | Female |
| Under 5 Years | 27 (30.7%) | 11 (11.8%) |
| 5 Years | 0 (0.0%) | 0 (0.0%) |
| 6 to 11 Years | 43 (42.6%) | 22 (20.6%) |
| 12 to 14 Years | 16 (33.3%) | 28 (44.4%) |
| 15 Years | 6 (100.0%) | 0 (0.0%) |
| 16 and 17 Years | 15 (50.0%) | 0 (0.0%) |
| 18 to 24 Years | 14 (11.6%) | 19 (14.2%) |
| 25 to 34 Years | 9 (17.6%) | 41 (42.3%) |
| 35 to 44 Years | 7 (6.3%) | 35 (20.7%) |
| 45 to 54 Years | 17 (9.3%) | 25 (9.3%) |
| 55 to 64 Years | 19 (18.4%) | 40 (23.3%) |
| 65 to 74 Years | 6 (3.8%) | 18 (11.2%) |
| 75 Years and over | 11 (6.6%) | 1 (0.4%) |
| Total | 190 (16.3%) | 240 (15.8%) |
Income Above Poverty by Sex and Age in Tyrrell County
According to the poverty statistics in Tyrrell County, males aged 65 to 74 years and females aged 5 years are the age groups that are most secure financially, with 96.2% of males and 100.0% of females in these age groups living above the poverty line.

| Age Bracket | Male | Female |
| Under 5 Years | 61 (69.3%) | 82 (88.2%) |
| 5 Years | 0 (0.0%) | 9 (100.0%) |
| 6 to 11 Years | 58 (57.4%) | 85 (79.4%) |
| 12 to 14 Years | 32 (66.7%) | 35 (55.6%) |
| 15 Years | 0 (0.0%) | 0 (0.0%) |
| 16 and 17 Years | 15 (50.0%) | 0 (0.0%) |
| 18 to 24 Years | 107 (88.4%) | 115 (85.8%) |
| 25 to 34 Years | 42 (82.4%) | 56 (57.7%) |
| 35 to 44 Years | 104 (93.7%) | 134 (79.3%) |
| 45 to 54 Years | 166 (90.7%) | 243 (90.7%) |
| 55 to 64 Years | 84 (81.6%) | 132 (76.7%) |
| 65 to 74 Years | 152 (96.2%) | 143 (88.8%) |
| 75 Years and over | 155 (93.4%) | 250 (99.6%) |
| Total | 976 (83.7%) | 1,284 (84.3%) |
Income Below Poverty Among Married-Couple Families in Tyrrell County
The poverty statistics for married-couple families in Tyrrell County show that 4.9% or 33 of the total 681 families live below the poverty line. Families with 3 or 4 children have the highest poverty rate of 57.1%, comprising of 8 families. On the other hand, families with 1 or 2 children have the lowest poverty rate of 1.2%, which includes 3 families.
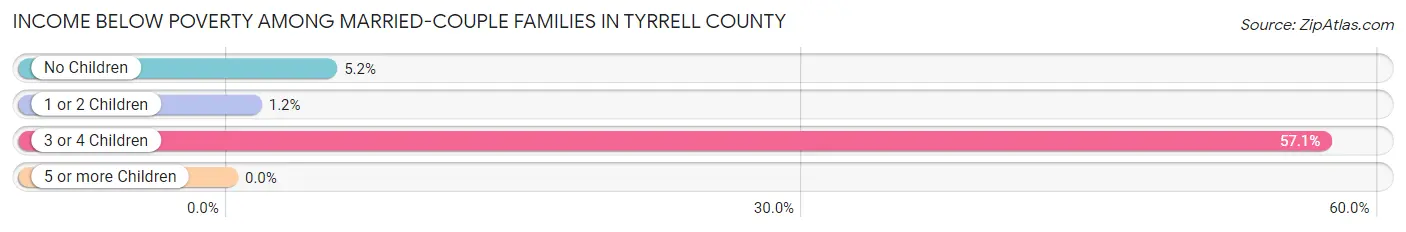
| Children | Above Poverty | Below Poverty |
| No Children | 403 (94.8%) | 22 (5.2%) |
| 1 or 2 Children | 239 (98.8%) | 3 (1.2%) |
| 3 or 4 Children | 6 (42.9%) | 8 (57.1%) |
| 5 or more Children | 0 (0.0%) | 0 (0.0%) |
| Total | 648 (95.2%) | 33 (4.9%) |
Income Below Poverty Among Single-Parent Households in Tyrrell County
According to the poverty data in Tyrrell County, 20.3% or 12 single-father households and 30.8% or 57 single-mother households are living below the poverty line. Among single-father households, those with 3 or 4 children have the highest poverty rate, with 7 households (100.0%) experiencing poverty. Likewise, among single-mother households, those with 3 or 4 children have the highest poverty rate, with 14 households (100.0%) falling below the poverty line.
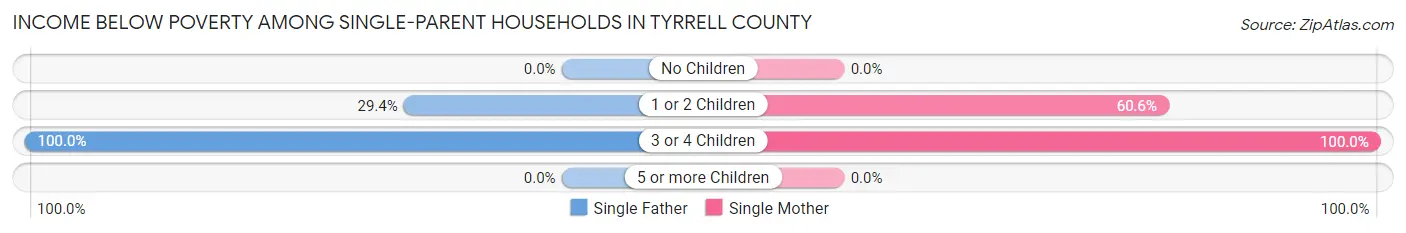
| Children | Single Father | Single Mother |
| No Children | 0 (0.0%) | 0 (0.0%) |
| 1 or 2 Children | 5 (29.4%) | 43 (60.6%) |
| 3 or 4 Children | 7 (100.0%) | 14 (100.0%) |
| 5 or more Children | 0 (0.0%) | 0 (0.0%) |
| Total | 12 (20.3%) | 57 (30.8%) |
Income Below Poverty Among Married-Couple vs Single-Parent Households in Tyrrell County
The poverty data for Tyrrell County shows that 33 of the married-couple family households (4.9%) and 69 of the single-parent households (28.3%) are living below the poverty level. Within the married-couple family households, those with 3 or 4 children have the highest poverty rate, with 8 households (57.1%) falling below the poverty line. Among the single-parent households, those with 3 or 4 children have the highest poverty rate, with 21 household (100.0%) living below poverty.
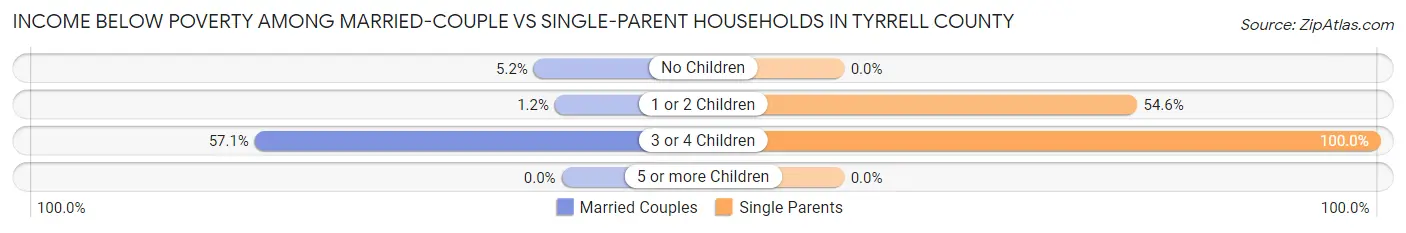
| Children | Married-Couple Families | Single-Parent Households |
| No Children | 22 (5.2%) | 0 (0.0%) |
| 1 or 2 Children | 3 (1.2%) | 48 (54.5%) |
| 3 or 4 Children | 8 (57.1%) | 21 (100.0%) |
| 5 or more Children | 0 (0.0%) | 0 (0.0%) |
| Total | 33 (4.9%) | 69 (28.3%) |
Employment Characteristics in Tyrrell County
Employment by Class of Employer in Tyrrell County
Among the 1,176 employed individuals in Tyrrell County, private company employees (723 | 61.5%), not-for-profit organizations (143 | 12.2%), and local government employees (135 | 11.5%) make up the most common classes of employment.
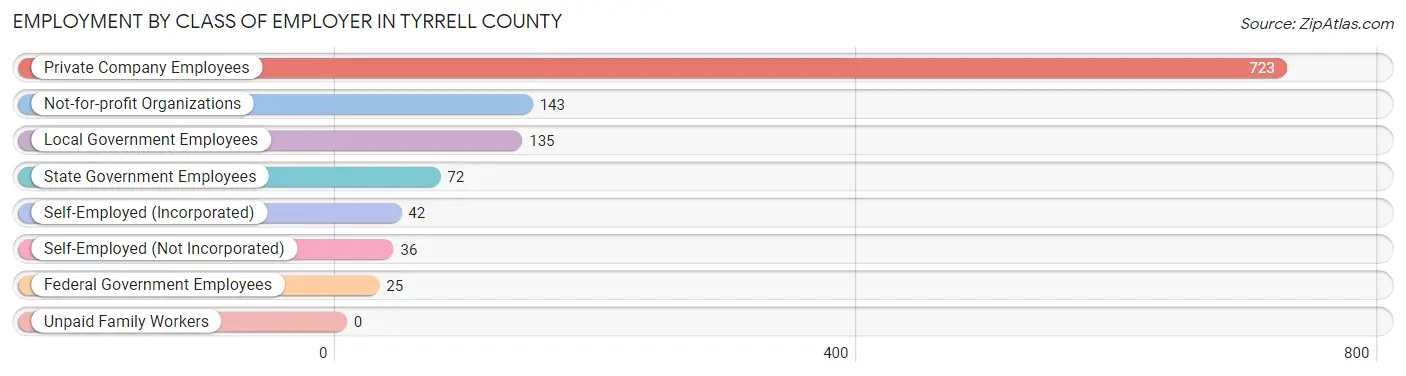
| Employer Class | # Employees | % Employees |
| Private Company Employees | 723 | 61.5% |
| Self-Employed (Incorporated) | 42 | 3.6% |
| Self-Employed (Not Incorporated) | 36 | 3.1% |
| Not-for-profit Organizations | 143 | 12.2% |
| Local Government Employees | 135 | 11.5% |
| State Government Employees | 72 | 6.1% |
| Federal Government Employees | 25 | 2.1% |
| Unpaid Family Workers | 0 | 0.0% |
| Total | 1,176 | 100.0% |
Employment Status by Age in Tyrrell County
According to the labor force statistics for Tyrrell County, out of the total population over 16 years of age (2,840), 43.2% or 1,227 individuals are in the labor force, with 3.9% or 48 of them unemployed. The age group with the highest labor force participation rate is 45 to 54 years, with 63.3% or 407 individuals in the labor force. Within the labor force, the 20 to 24 years age range has the highest percentage of unemployed individuals, with 11.1% or 18 of them being unemployed.
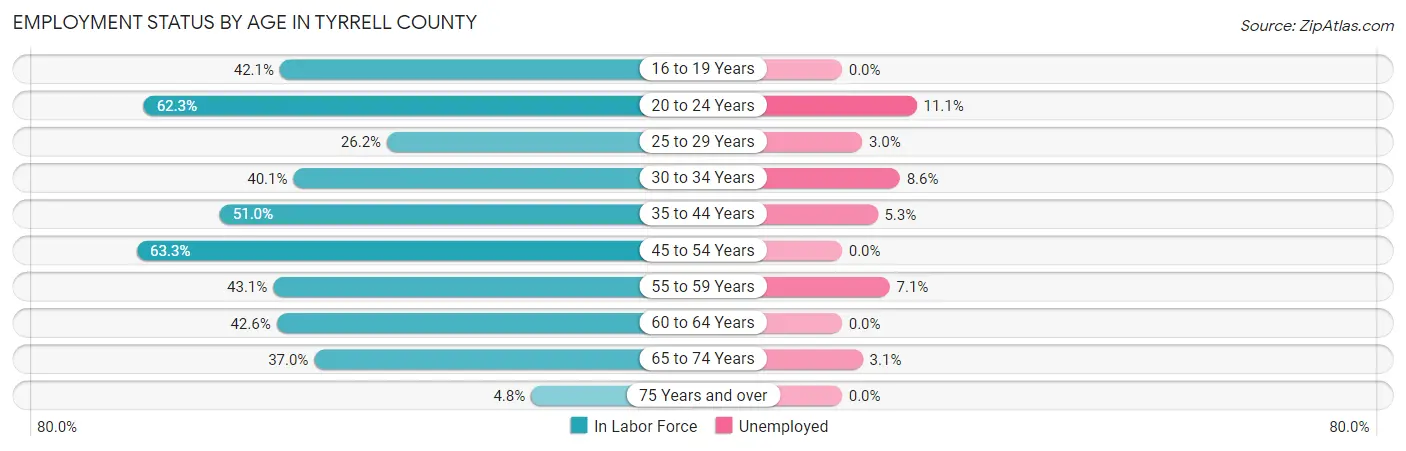
| Age Bracket | In Labor Force | Unemployed |
| 16 to 19 Years | 16 (42.1%) | 0 (0.0%) |
| 20 to 24 Years | 162 (62.3%) | 18 (11.1%) |
| 25 to 29 Years | 33 (26.2%) | 1 (3.0%) |
| 30 to 34 Years | 105 (40.1%) | 9 (8.6%) |
| 35 to 44 Years | 227 (51.0%) | 12 (5.3%) |
| 45 to 54 Years | 407 (63.3%) | 0 (0.0%) |
| 55 to 59 Years | 56 (43.1%) | 4 (7.1%) |
| 60 to 64 Years | 75 (42.6%) | 0 (0.0%) |
| 65 to 74 Years | 127 (37.0%) | 4 (3.1%) |
| 75 Years and over | 20 (4.8%) | 0 (0.0%) |
| Total | 1,227 (43.2%) | 48 (3.9%) |
Employment Status by Educational Attainment in Tyrrell County
According to labor force statistics for Tyrrell County, 50.7% of individuals (903) out of the total population between 25 and 64 years of age (1,782) are in the labor force, with 2.9% or 26 of them being unemployed. The group with the highest labor force participation rate are those with the educational attainment of bachelor's degree or higher, with 84.1% or 195 individuals in the labor force. Within the labor force, individuals with high school diploma education have the highest percentage of unemployment, with 6.2% or 22 of them being unemployed.
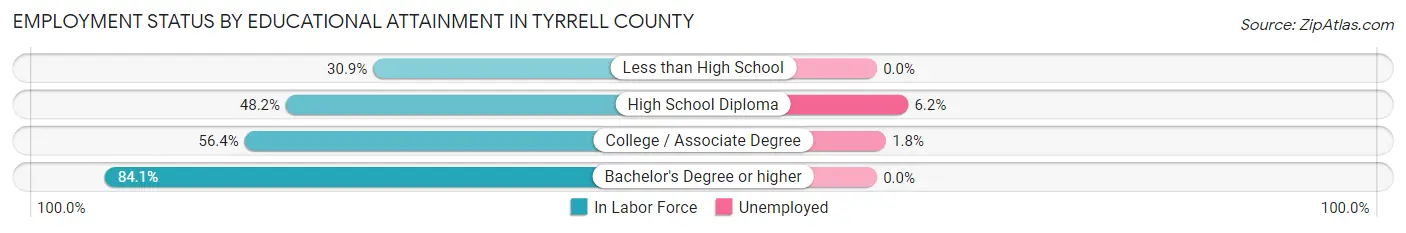
| Educational Attainment | In Labor Force | Unemployed |
| Less than High School | 129 (30.9%) | 0 (0.0%) |
| High School Diploma | 354 (48.2%) | 46 (6.2%) |
| College / Associate Degree | 225 (56.4%) | 7 (1.8%) |
| Bachelor's Degree or higher | 195 (84.1%) | 0 (0.0%) |
| Total | 903 (50.7%) | 52 (2.9%) |
Employment Occupations by Sex in Tyrrell County
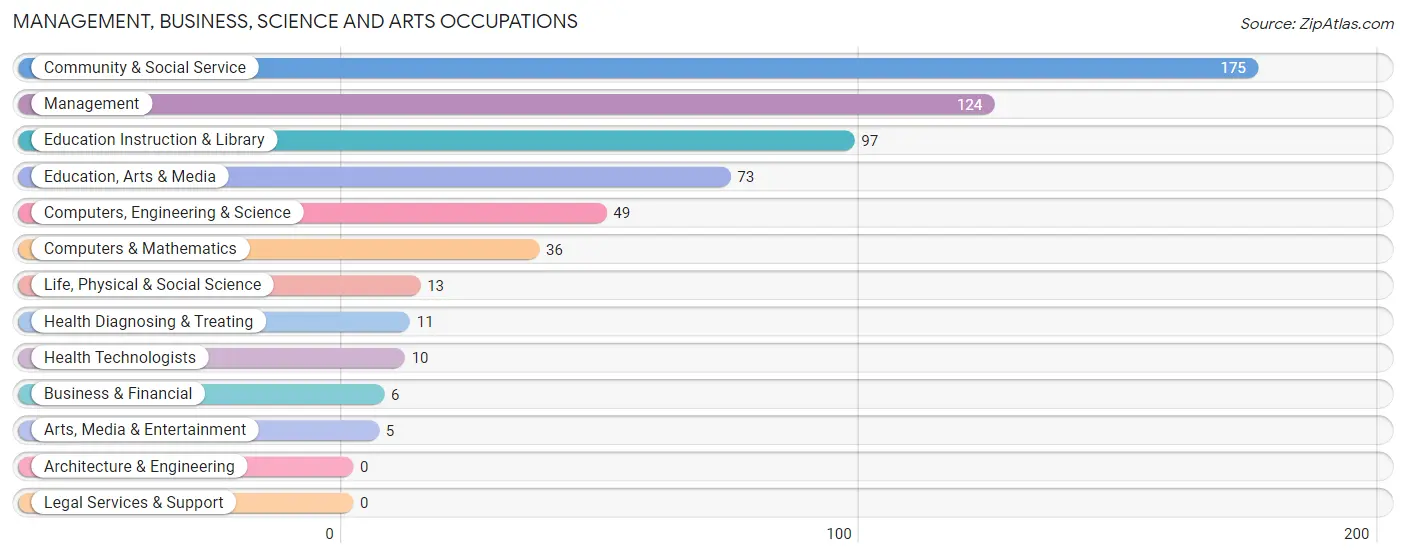
Management, Business, Science and Arts Occupations
The most common Management, Business, Science and Arts occupations in Tyrrell County are Community & Social Service (175 | 14.8%), Management (124 | 10.5%), Education Instruction & Library (97 | 8.2%), Education, Arts & Media (73 | 6.2%), and Computers, Engineering & Science (49 | 4.2%).
Management, Business, Science and Arts Occupations by Sex
Within the Management, Business, Science and Arts occupations in Tyrrell County, the most male-oriented occupations are Education, Arts & Media (84.9%), Computers & Mathematics (80.6%), and Arts, Media & Entertainment (80.0%), while the most female-oriented occupations are Business & Financial (100.0%), Education Instruction & Library (100.0%), and Health Diagnosing & Treating (100.0%).
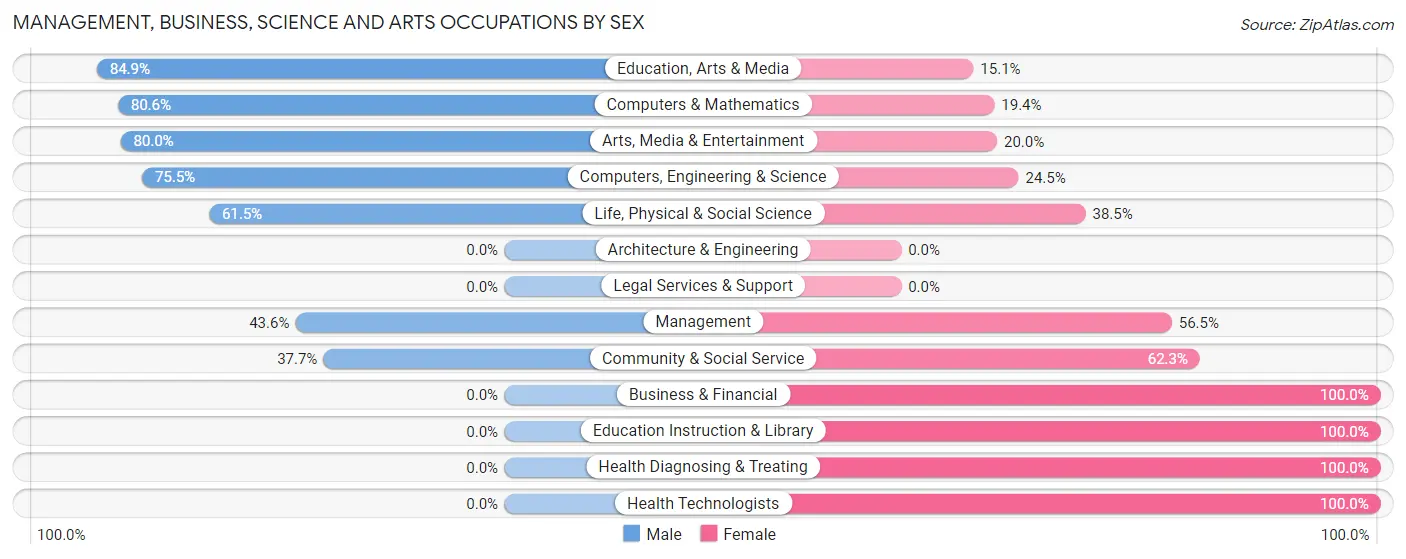
| Occupation | Male | Female |
| Management | 54 (43.5%) | 70 (56.5%) |
| Business & Financial | 0 (0.0%) | 6 (100.0%) |
| Computers, Engineering & Science | 37 (75.5%) | 12 (24.5%) |
| Computers & Mathematics | 29 (80.6%) | 7 (19.4%) |
| Architecture & Engineering | 0 (0.0%) | 0 (0.0%) |
| Life, Physical & Social Science | 8 (61.5%) | 5 (38.5%) |
| Community & Social Service | 66 (37.7%) | 109 (62.3%) |
| Education, Arts & Media | 62 (84.9%) | 11 (15.1%) |
| Legal Services & Support | 0 (0.0%) | 0 (0.0%) |
| Education Instruction & Library | 0 (0.0%) | 97 (100.0%) |
| Arts, Media & Entertainment | 4 (80.0%) | 1 (20.0%) |
| Health Diagnosing & Treating | 0 (0.0%) | 11 (100.0%) |
| Health Technologists | 0 (0.0%) | 10 (100.0%) |
| Total (Category) | 157 (43.0%) | 208 (57.0%) |
| Total (Overall) | 553 (46.9%) | 627 (53.1%) |
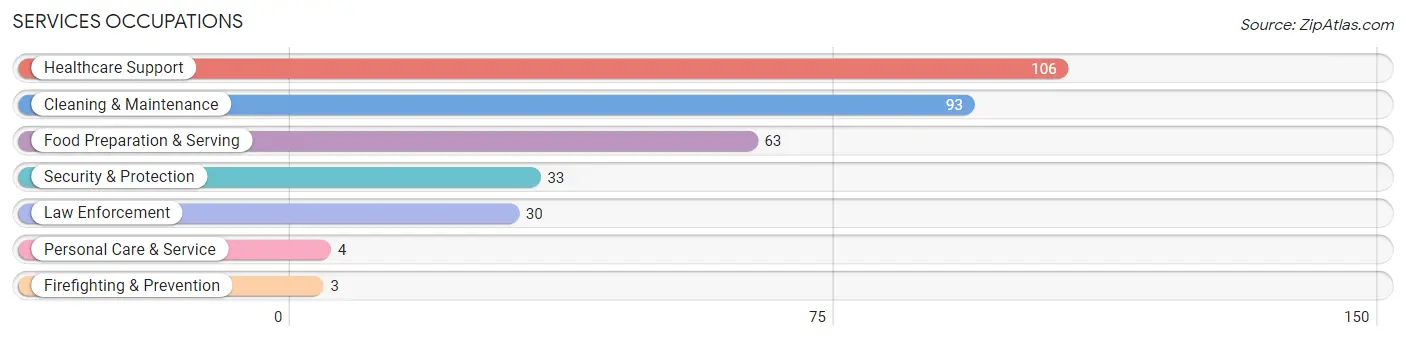
Services Occupations
The most common Services occupations in Tyrrell County are Healthcare Support (106 | 9.0%), Cleaning & Maintenance (93 | 7.9%), Food Preparation & Serving (63 | 5.3%), Security & Protection (33 | 2.8%), and Law Enforcement (30 | 2.5%).
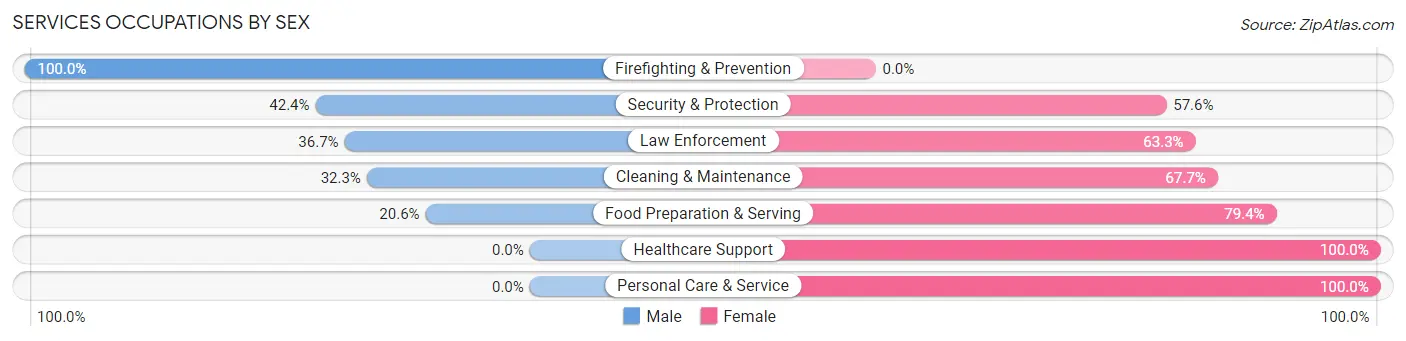
Services Occupations by Sex
Within the Services occupations in Tyrrell County, the most male-oriented occupations are Firefighting & Prevention (100.0%), Security & Protection (42.4%), and Law Enforcement (36.7%), while the most female-oriented occupations are Healthcare Support (100.0%), Personal Care & Service (100.0%), and Food Preparation & Serving (79.4%).
| Occupation | Male | Female |
| Healthcare Support | 0 (0.0%) | 106 (100.0%) |
| Security & Protection | 14 (42.4%) | 19 (57.6%) |
| Firefighting & Prevention | 3 (100.0%) | 0 (0.0%) |
| Law Enforcement | 11 (36.7%) | 19 (63.3%) |
| Food Preparation & Serving | 13 (20.6%) | 50 (79.4%) |
| Cleaning & Maintenance | 30 (32.3%) | 63 (67.7%) |
| Personal Care & Service | 0 (0.0%) | 4 (100.0%) |
| Total (Category) | 57 (19.1%) | 242 (80.9%) |
| Total (Overall) | 553 (46.9%) | 627 (53.1%) |
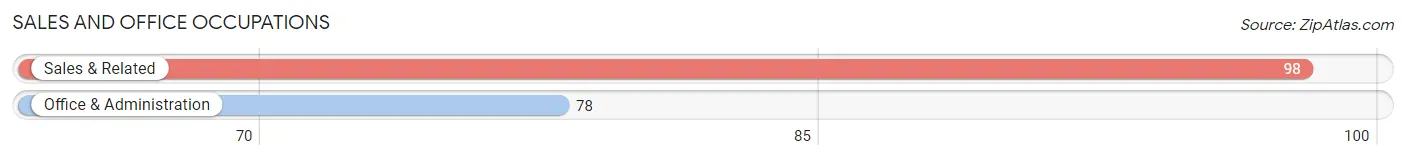
Sales and Office Occupations
The most common Sales and Office occupations in Tyrrell County are Sales & Related (98 | 8.3%), and Office & Administration (78 | 6.6%).
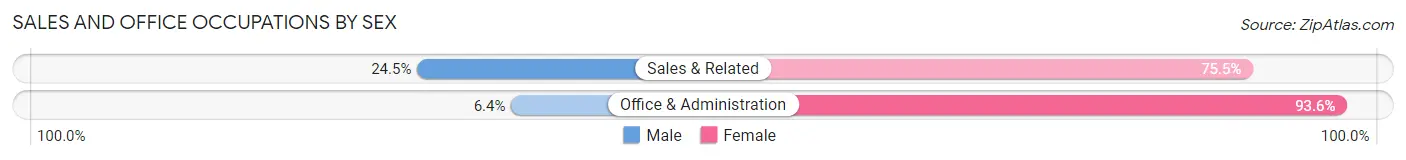
Sales and Office Occupations by Sex
| Occupation | Male | Female |
| Sales & Related | 24 (24.5%) | 74 (75.5%) |
| Office & Administration | 5 (6.4%) | 73 (93.6%) |
| Total (Category) | 29 (16.5%) | 147 (83.5%) |
| Total (Overall) | 553 (46.9%) | 627 (53.1%) |
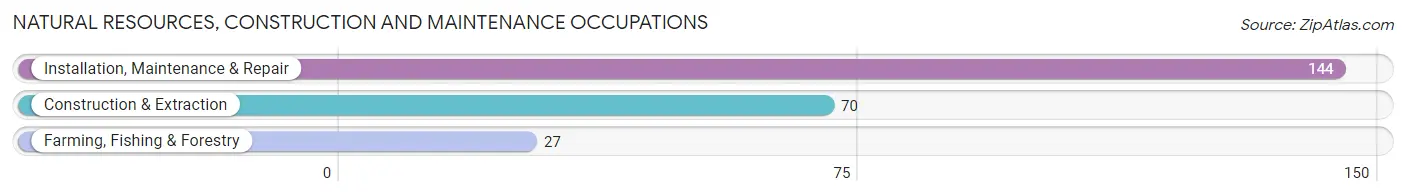
Natural Resources, Construction and Maintenance Occupations
The most common Natural Resources, Construction and Maintenance occupations in Tyrrell County are Installation, Maintenance & Repair (144 | 12.2%), Construction & Extraction (70 | 5.9%), and Farming, Fishing & Forestry (27 | 2.3%).
Natural Resources, Construction and Maintenance Occupations by Sex
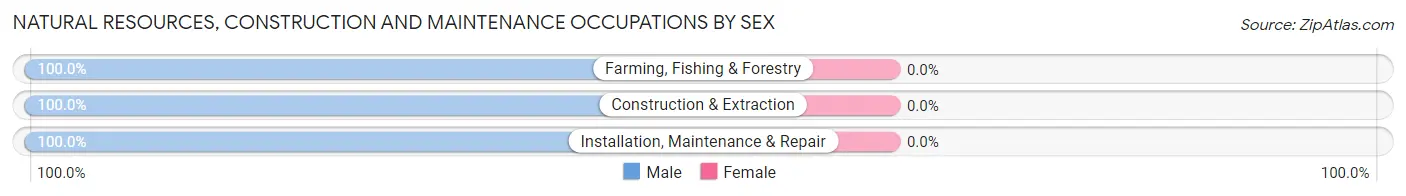
| Occupation | Male | Female |
| Farming, Fishing & Forestry | 27 (100.0%) | 0 (0.0%) |
| Construction & Extraction | 70 (100.0%) | 0 (0.0%) |
| Installation, Maintenance & Repair | 144 (100.0%) | 0 (0.0%) |
| Total (Category) | 241 (100.0%) | 0 (0.0%) |
| Total (Overall) | 553 (46.9%) | 627 (53.1%) |
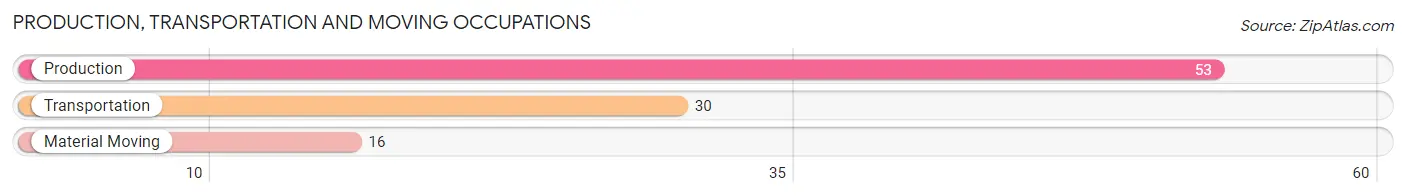
Production, Transportation and Moving Occupations
The most common Production, Transportation and Moving occupations in Tyrrell County are Production (53 | 4.5%), Transportation (30 | 2.5%), and Material Moving (16 | 1.4%).
Production, Transportation and Moving Occupations by Sex
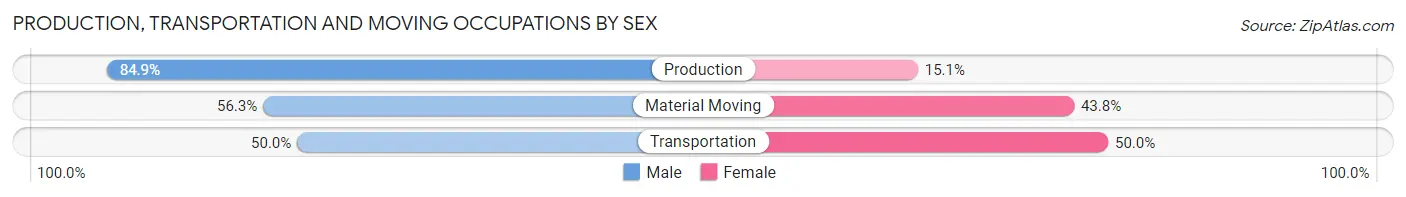
| Occupation | Male | Female |
| Production | 45 (84.9%) | 8 (15.1%) |
| Transportation | 15 (50.0%) | 15 (50.0%) |
| Material Moving | 9 (56.2%) | 7 (43.8%) |
| Total (Category) | 69 (69.7%) | 30 (30.3%) |
| Total (Overall) | 553 (46.9%) | 627 (53.1%) |
Employment Industries by Sex in Tyrrell County
Employment Industries in Tyrrell County
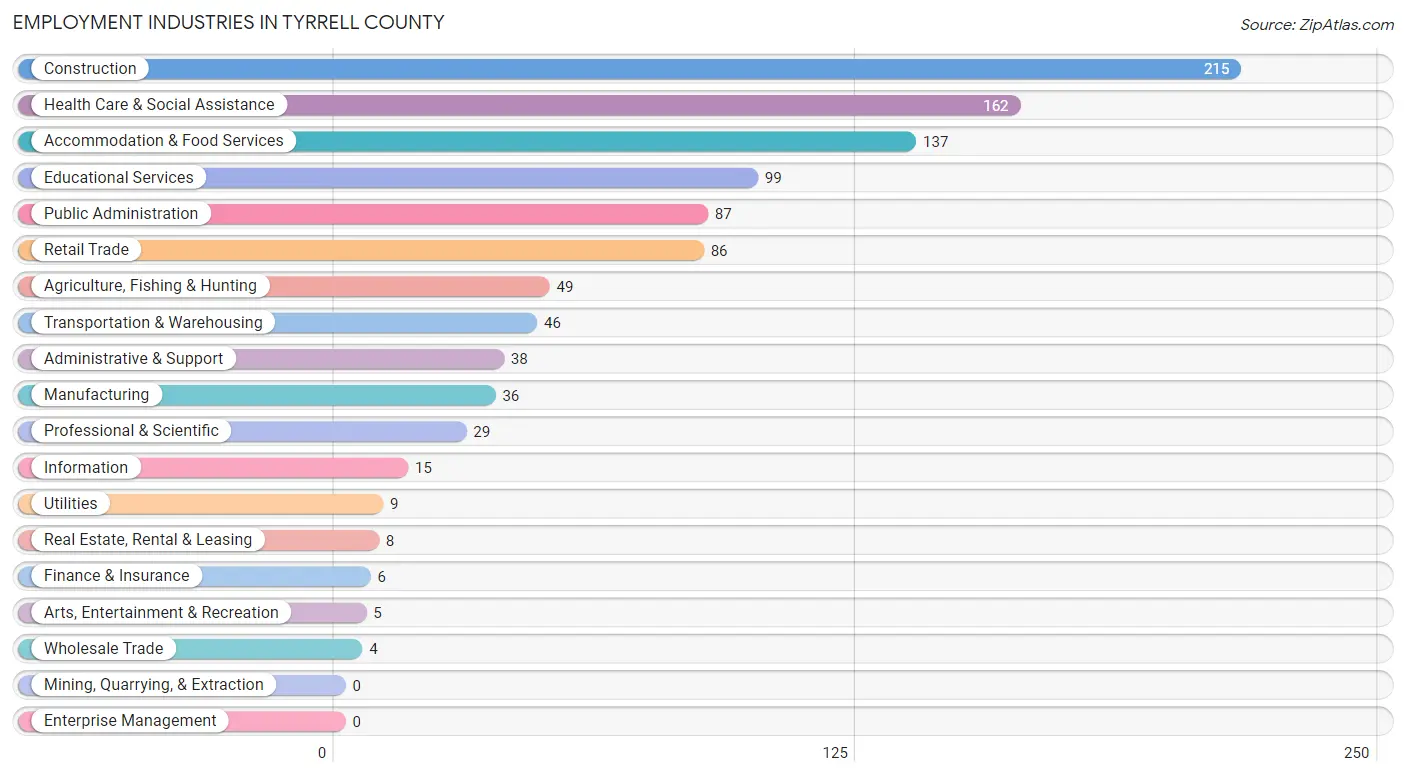
The major employment industries in Tyrrell County include Construction (215 | 18.2%), Health Care & Social Assistance (162 | 13.7%), Accommodation & Food Services (137 | 11.6%), Educational Services (99 | 8.4%), and Public Administration (87 | 7.4%).
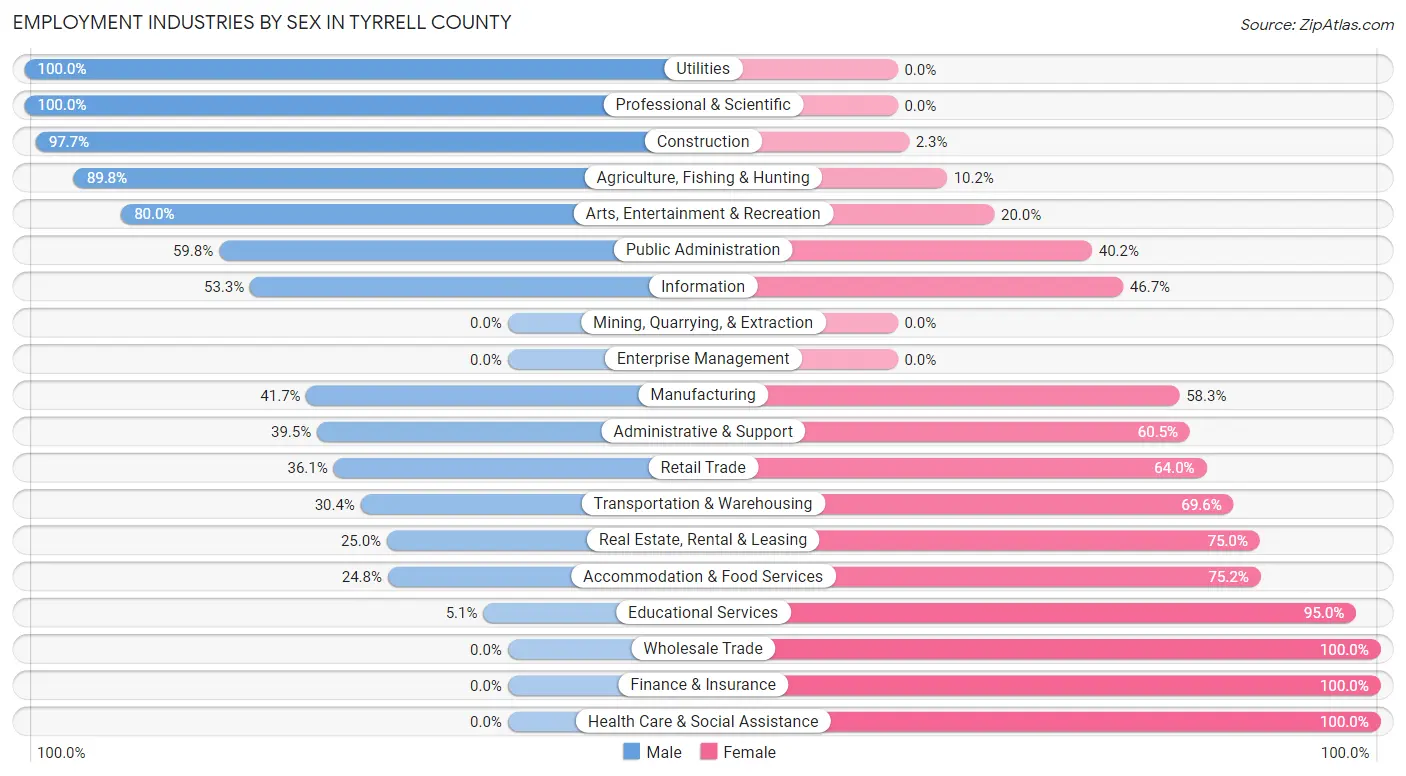
Employment Industries by Sex in Tyrrell County
The Tyrrell County industries that see more men than women are Utilities (100.0%), Professional & Scientific (100.0%), and Construction (97.7%), whereas the industries that tend to have a higher number of women are Wholesale Trade (100.0%), Finance & Insurance (100.0%), and Health Care & Social Assistance (100.0%).
| Industry | Male | Female |
| Agriculture, Fishing & Hunting | 44 (89.8%) | 5 (10.2%) |
| Mining, Quarrying, & Extraction | 0 (0.0%) | 0 (0.0%) |
| Construction | 210 (97.7%) | 5 (2.3%) |
| Manufacturing | 15 (41.7%) | 21 (58.3%) |
| Wholesale Trade | 0 (0.0%) | 4 (100.0%) |
| Retail Trade | 31 (36.0%) | 55 (63.9%) |
| Transportation & Warehousing | 14 (30.4%) | 32 (69.6%) |
| Utilities | 9 (100.0%) | 0 (0.0%) |
| Information | 8 (53.3%) | 7 (46.7%) |
| Finance & Insurance | 0 (0.0%) | 6 (100.0%) |
| Real Estate, Rental & Leasing | 2 (25.0%) | 6 (75.0%) |
| Professional & Scientific | 29 (100.0%) | 0 (0.0%) |
| Enterprise Management | 0 (0.0%) | 0 (0.0%) |
| Administrative & Support | 15 (39.5%) | 23 (60.5%) |
| Educational Services | 5 (5.1%) | 94 (95.0%) |
| Health Care & Social Assistance | 0 (0.0%) | 162 (100.0%) |
| Arts, Entertainment & Recreation | 4 (80.0%) | 1 (20.0%) |
| Accommodation & Food Services | 34 (24.8%) | 103 (75.2%) |
| Public Administration | 52 (59.8%) | 35 (40.2%) |
| Total | 553 (46.9%) | 627 (53.1%) |
Education in Tyrrell County
School Enrollment in Tyrrell County
The most common levels of schooling among the 515 students in Tyrrell County are elementary school (190 | 36.9%), middle school (146 | 28.3%), and high school (71 | 13.8%).

| School Level | # Students | % Students |
| Nursery / Preschool | 24 | 4.7% |
| Kindergarten | 0 | 0.0% |
| Elementary School | 190 | 36.9% |
| Middle School | 146 | 28.3% |
| High School | 71 | 13.8% |
| College / Undergraduate | 22 | 4.3% |
| Graduate / Professional | 62 | 12.0% |
| Total | 515 | 100.0% |
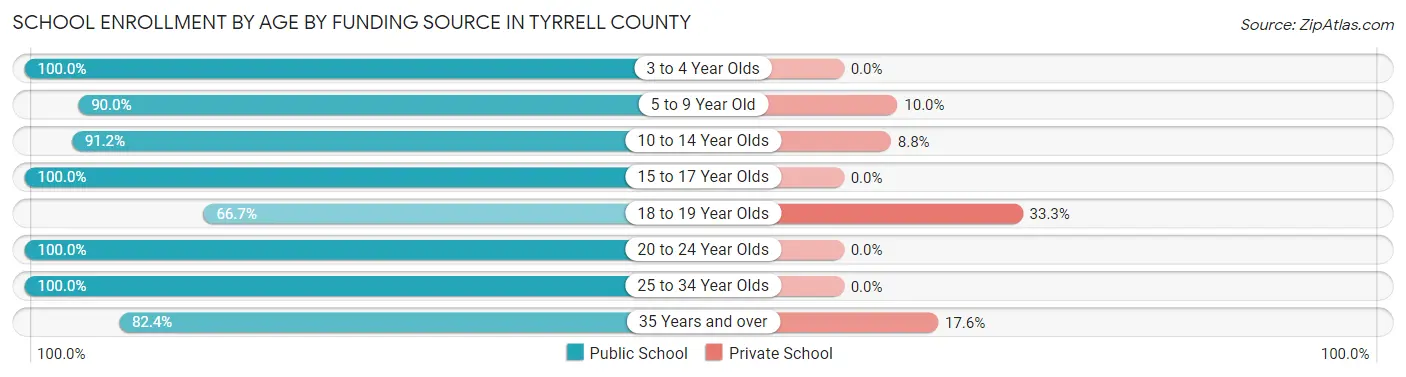
School Enrollment by Age by Funding Source in Tyrrell County
Out of a total of 515 students who are enrolled in schools in Tyrrell County, 51 (9.9%) attend a private institution, while the remaining 464 (90.1%) are enrolled in public schools. The age group of 18 to 19 year olds has the highest likelihood of being enrolled in private schools, with 1 (33.3% in the age bracket) enrolled. Conversely, the age group of 3 to 4 year olds has the lowest likelihood of being enrolled in a private school, with 15 (100.0% in the age bracket) attending a public institution.
| Age Bracket | Public School | Private School |
| 3 to 4 Year Olds | 15 (100.0%) | 0 (0.0%) |
| 5 to 9 Year Old | 162 (90.0%) | 18 (10.0%) |
| 10 to 14 Year Olds | 166 (91.2%) | 16 (8.8%) |
| 15 to 17 Year Olds | 36 (100.0%) | 0 (0.0%) |
| 18 to 19 Year Olds | 2 (66.7%) | 1 (33.3%) |
| 20 to 24 Year Olds | 1 (100.0%) | 0 (0.0%) |
| 25 to 34 Year Olds | 7 (100.0%) | 0 (0.0%) |
| 35 Years and over | 75 (82.4%) | 16 (17.6%) |
| Total | 464 (90.1%) | 51 (9.9%) |
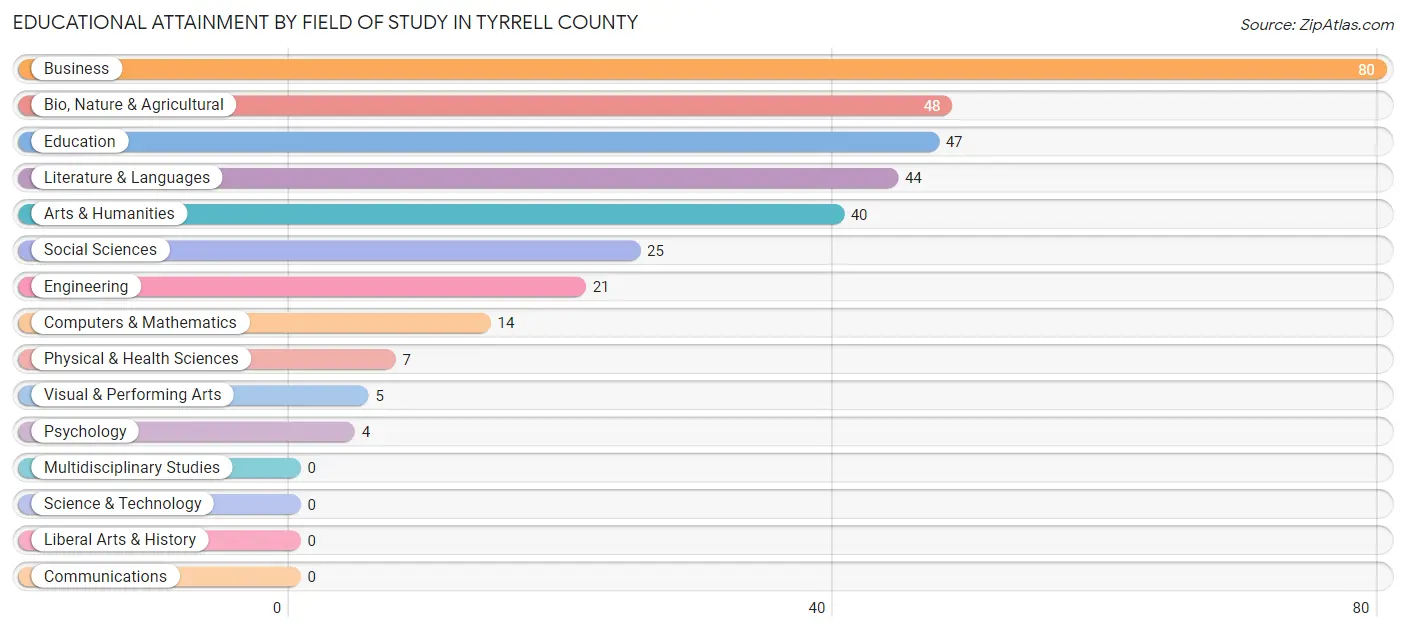
Educational Attainment by Field of Study in Tyrrell County
Business (80 | 23.9%), bio, nature & agricultural (48 | 14.3%), education (47 | 14.0%), literature & languages (44 | 13.1%), and arts & humanities (40 | 11.9%) are the most common fields of study among 335 individuals in Tyrrell County who have obtained a bachelor's degree or higher.
| Field of Study | # Graduates | % Graduates |
| Computers & Mathematics | 14 | 4.2% |
| Bio, Nature & Agricultural | 48 | 14.3% |
| Physical & Health Sciences | 7 | 2.1% |
| Psychology | 4 | 1.2% |
| Social Sciences | 25 | 7.5% |
| Engineering | 21 | 6.3% |
| Multidisciplinary Studies | 0 | 0.0% |
| Science & Technology | 0 | 0.0% |
| Business | 80 | 23.9% |
| Education | 47 | 14.0% |
| Literature & Languages | 44 | 13.1% |
| Liberal Arts & History | 0 | 0.0% |
| Visual & Performing Arts | 5 | 1.5% |
| Communications | 0 | 0.0% |
| Arts & Humanities | 40 | 11.9% |
| Total | 335 | 100.0% |
Transportation & Commute in Tyrrell County
Vehicle Availability by Sex in Tyrrell County
The most prevalent vehicle ownership categories in Tyrrell County are males with 3 vehicles (296, accounting for 53.8%) and females with 3 vehicles (235, making up 47.3%).
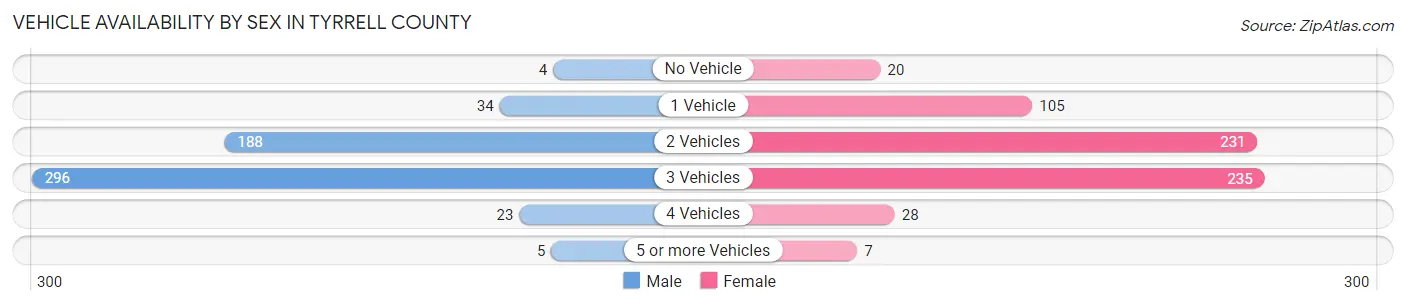
| Vehicles Available | Male | Female |
| No Vehicle | 4 (0.7%) | 20 (3.2%) |
| 1 Vehicle | 34 (6.2%) | 105 (16.8%) |
| 2 Vehicles | 188 (34.2%) | 231 (36.9%) |
| 3 Vehicles | 296 (53.8%) | 235 (37.5%) |
| 4 Vehicles | 23 (4.2%) | 28 (4.5%) |
| 5 or more Vehicles | 5 (0.9%) | 7 (1.1%) |
| Total | 550 (100.0%) | 626 (100.0%) |
Commute Time in Tyrrell County
The most frequently occuring commute durations in Tyrrell County are less than 5 minutes (187 commuters, 17.4%), 5 to 9 minutes (163 commuters, 15.1%), and 10 to 14 minutes (160 commuters, 14.9%).
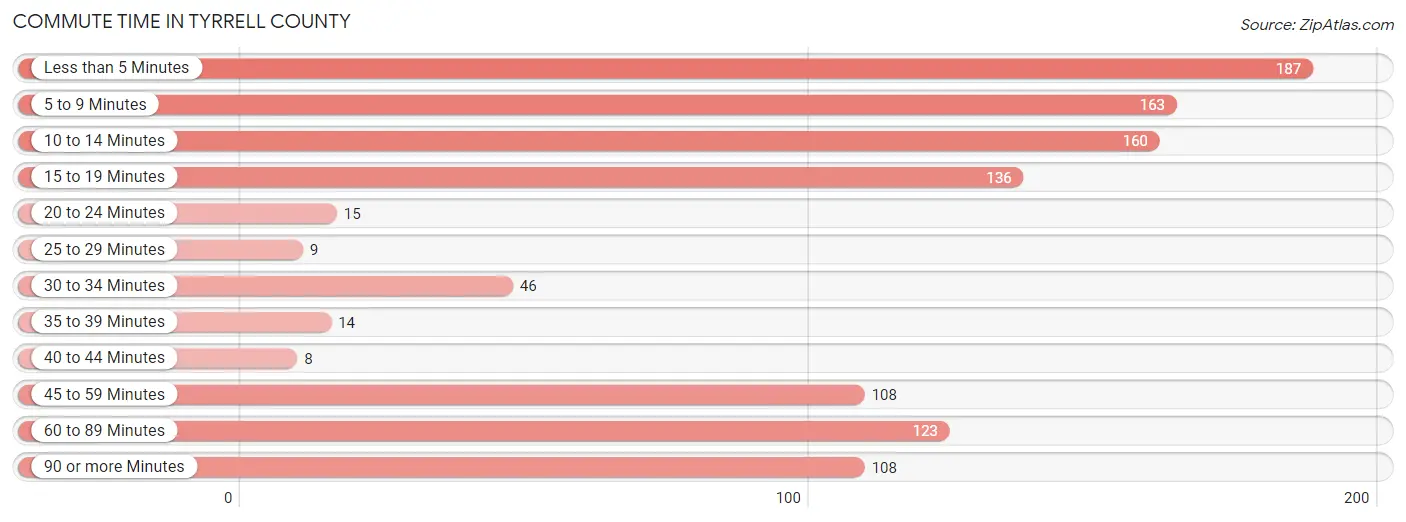
| Commute Time | # Commuters | % Commuters |
| Less than 5 Minutes | 187 | 17.4% |
| 5 to 9 Minutes | 163 | 15.1% |
| 10 to 14 Minutes | 160 | 14.9% |
| 15 to 19 Minutes | 136 | 12.6% |
| 20 to 24 Minutes | 15 | 1.4% |
| 25 to 29 Minutes | 9 | 0.8% |
| 30 to 34 Minutes | 46 | 4.3% |
| 35 to 39 Minutes | 14 | 1.3% |
| 40 to 44 Minutes | 8 | 0.7% |
| 45 to 59 Minutes | 108 | 10.0% |
| 60 to 89 Minutes | 123 | 11.4% |
| 90 or more Minutes | 108 | 10.0% |
Commute Time by Sex in Tyrrell County
The most common commute times in Tyrrell County are less than 5 minutes (138 commuters, 27.9%) for males and 10 to 14 minutes (140 commuters, 24.0%) for females.
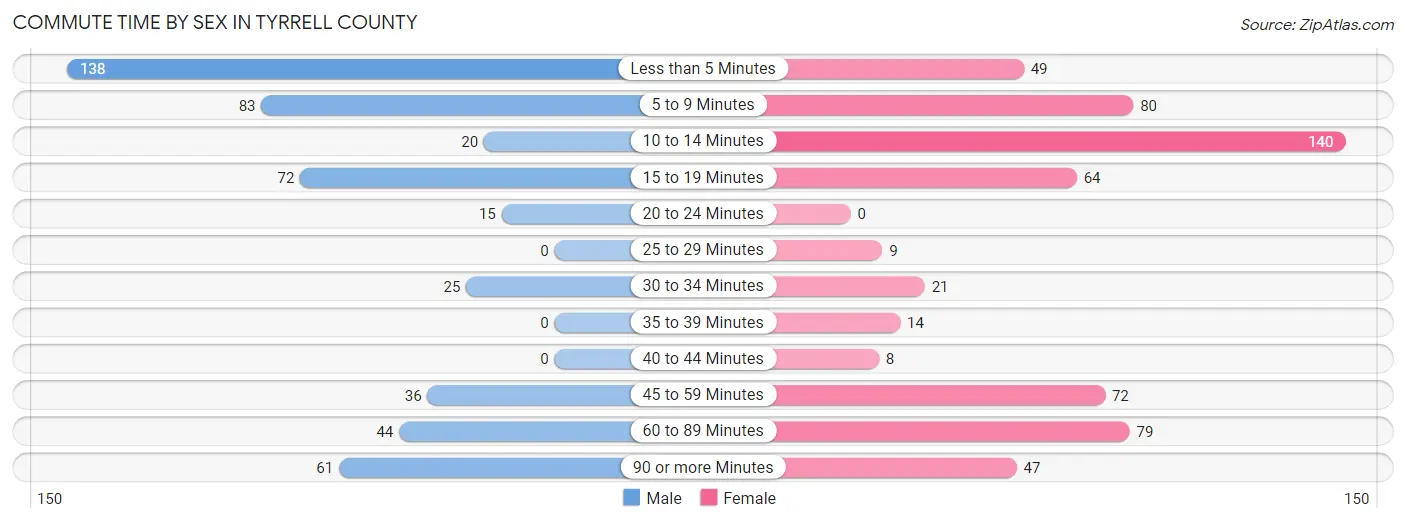
| Commute Time | Male | Female |
| Less than 5 Minutes | 138 (27.9%) | 49 (8.4%) |
| 5 to 9 Minutes | 83 (16.8%) | 80 (13.7%) |
| 10 to 14 Minutes | 20 (4.1%) | 140 (24.0%) |
| 15 to 19 Minutes | 72 (14.6%) | 64 (11.0%) |
| 20 to 24 Minutes | 15 (3.0%) | 0 (0.0%) |
| 25 to 29 Minutes | 0 (0.0%) | 9 (1.5%) |
| 30 to 34 Minutes | 25 (5.1%) | 21 (3.6%) |
| 35 to 39 Minutes | 0 (0.0%) | 14 (2.4%) |
| 40 to 44 Minutes | 0 (0.0%) | 8 (1.4%) |
| 45 to 59 Minutes | 36 (7.3%) | 72 (12.3%) |
| 60 to 89 Minutes | 44 (8.9%) | 79 (13.6%) |
| 90 or more Minutes | 61 (12.3%) | 47 (8.1%) |
Time of Departure to Work by Sex in Tyrrell County
The most frequent times of departure to work in Tyrrell County are 8:00 AM to 8:29 AM (147, 29.8%) for males and 8:00 AM to 8:29 AM (82, 14.1%) for females.
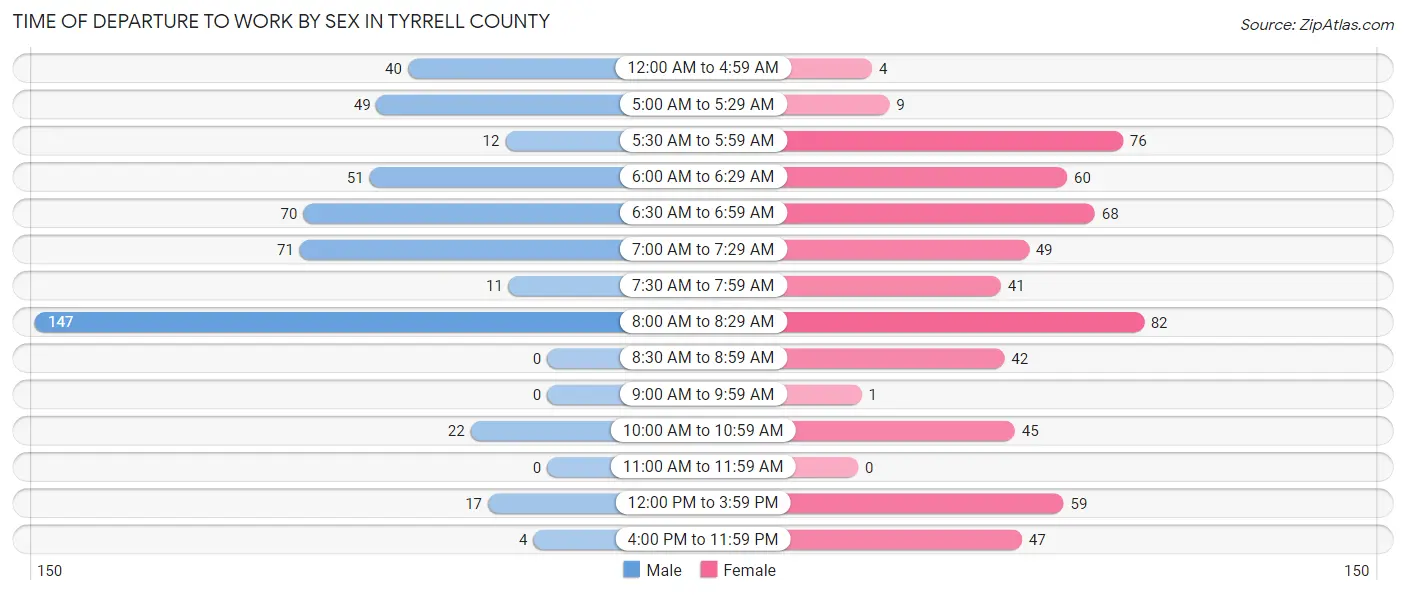
| Time of Departure | Male | Female |
| 12:00 AM to 4:59 AM | 40 (8.1%) | 4 (0.7%) |
| 5:00 AM to 5:29 AM | 49 (9.9%) | 9 (1.5%) |
| 5:30 AM to 5:59 AM | 12 (2.4%) | 76 (13.0%) |
| 6:00 AM to 6:29 AM | 51 (10.3%) | 60 (10.3%) |
| 6:30 AM to 6:59 AM | 70 (14.2%) | 68 (11.7%) |
| 7:00 AM to 7:29 AM | 71 (14.4%) | 49 (8.4%) |
| 7:30 AM to 7:59 AM | 11 (2.2%) | 41 (7.0%) |
| 8:00 AM to 8:29 AM | 147 (29.8%) | 82 (14.1%) |
| 8:30 AM to 8:59 AM | 0 (0.0%) | 42 (7.2%) |
| 9:00 AM to 9:59 AM | 0 (0.0%) | 1 (0.2%) |
| 10:00 AM to 10:59 AM | 22 (4.4%) | 45 (7.7%) |
| 11:00 AM to 11:59 AM | 0 (0.0%) | 0 (0.0%) |
| 12:00 PM to 3:59 PM | 17 (3.4%) | 59 (10.1%) |
| 4:00 PM to 11:59 PM | 4 (0.8%) | 47 (8.1%) |
| Total | 494 (100.0%) | 583 (100.0%) |
Housing Occupancy in Tyrrell County
Occupancy by Ownership in Tyrrell County
Of the total 1,351 dwellings in Tyrrell County, owner-occupied units account for 1,011 (74.8%), while renter-occupied units make up 340 (25.2%).
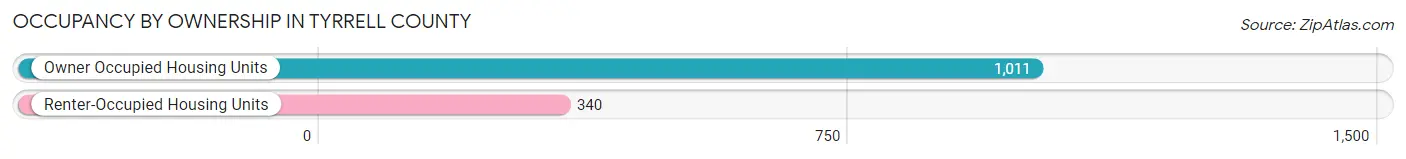
| Occupancy | # Housing Units | % Housing Units |
| Owner Occupied Housing Units | 1,011 | 74.8% |
| Renter-Occupied Housing Units | 340 | 25.2% |
| Total Occupied Housing Units | 1,351 | 100.0% |
Occupancy by Household Size in Tyrrell County
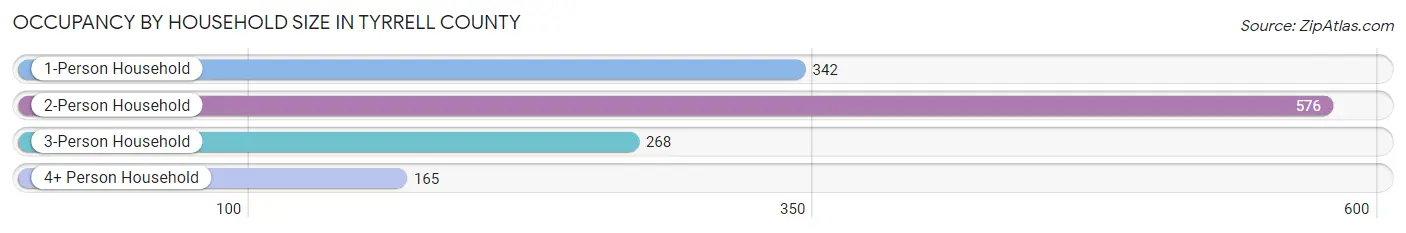
| Household Size | # Housing Units | % Housing Units |
| 1-Person Household | 342 | 25.3% |
| 2-Person Household | 576 | 42.6% |
| 3-Person Household | 268 | 19.8% |
| 4+ Person Household | 165 | 12.2% |
| Total Housing Units | 1,351 | 100.0% |
Occupancy by Ownership by Household Size in Tyrrell County
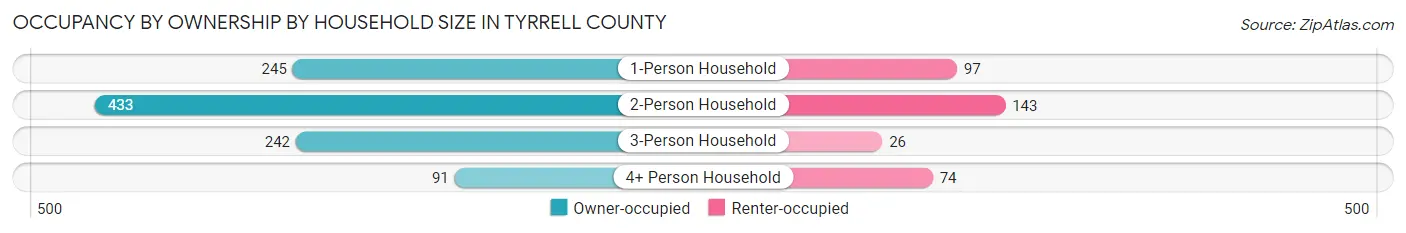
| Household Size | Owner-occupied | Renter-occupied |
| 1-Person Household | 245 (71.6%) | 97 (28.4%) |
| 2-Person Household | 433 (75.2%) | 143 (24.8%) |
| 3-Person Household | 242 (90.3%) | 26 (9.7%) |
| 4+ Person Household | 91 (55.1%) | 74 (44.9%) |
| Total Housing Units | 1,011 (74.8%) | 340 (25.2%) |
Occupancy by Educational Attainment in Tyrrell County

| Household Size | Owner-occupied | Renter-occupied |
| Less than High School | 93 (41.3%) | 132 (58.7%) |
| High School Diploma | 401 (85.5%) | 68 (14.5%) |
| College/Associate Degree | 285 (69.5%) | 125 (30.5%) |
| Bachelor's Degree or higher | 232 (93.9%) | 15 (6.1%) |
Occupancy by Age of Householder in Tyrrell County
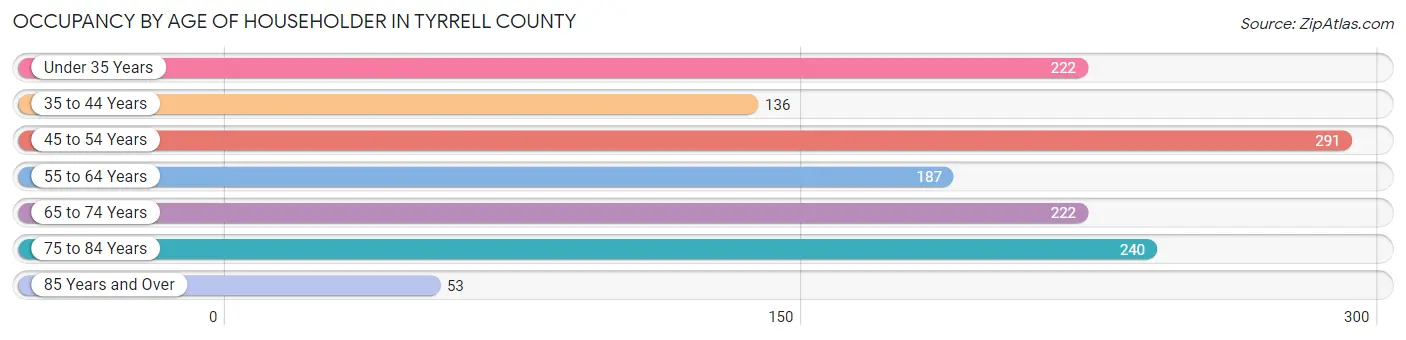
| Age Bracket | # Households | % Households |
| Under 35 Years | 222 | 16.4% |
| 35 to 44 Years | 136 | 10.1% |
| 45 to 54 Years | 291 | 21.5% |
| 55 to 64 Years | 187 | 13.8% |
| 65 to 74 Years | 222 | 16.4% |
| 75 to 84 Years | 240 | 17.8% |
| 85 Years and Over | 53 | 3.9% |
| Total | 1,351 | 100.0% |
Housing Finances in Tyrrell County
Median Income by Occupancy in Tyrrell County

| Occupancy Type | # Households | Median Income |
| Owner-Occupied | 1,011 (74.8%) | $58,573 |
| Renter-Occupied | 340 (25.2%) | $32,990 |
| Average | 1,351 (100.0%) | $55,341 |
Occupancy by Householder Income Bracket in Tyrrell County
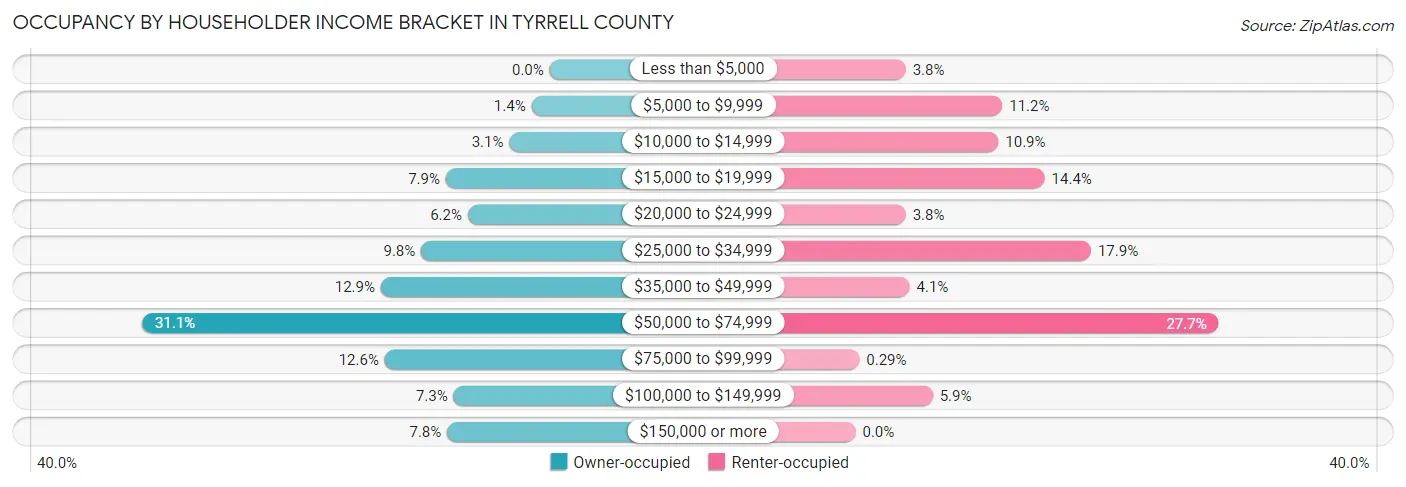
| Income Bracket | Owner-occupied | Renter-occupied |
| Less than $5,000 | 0 (0.0%) | 13 (3.8%) |
| $5,000 to $9,999 | 14 (1.4%) | 38 (11.2%) |
| $10,000 to $14,999 | 31 (3.1%) | 37 (10.9%) |
| $15,000 to $19,999 | 80 (7.9%) | 49 (14.4%) |
| $20,000 to $24,999 | 63 (6.2%) | 13 (3.8%) |
| $25,000 to $34,999 | 99 (9.8%) | 61 (17.9%) |
| $35,000 to $49,999 | 130 (12.9%) | 14 (4.1%) |
| $50,000 to $74,999 | 314 (31.1%) | 94 (27.7%) |
| $75,000 to $99,999 | 127 (12.6%) | 1 (0.3%) |
| $100,000 to $149,999 | 74 (7.3%) | 20 (5.9%) |
| $150,000 or more | 79 (7.8%) | 0 (0.0%) |
| Total | 1,011 (100.0%) | 340 (100.0%) |
Monthly Housing Cost Tiers in Tyrrell County
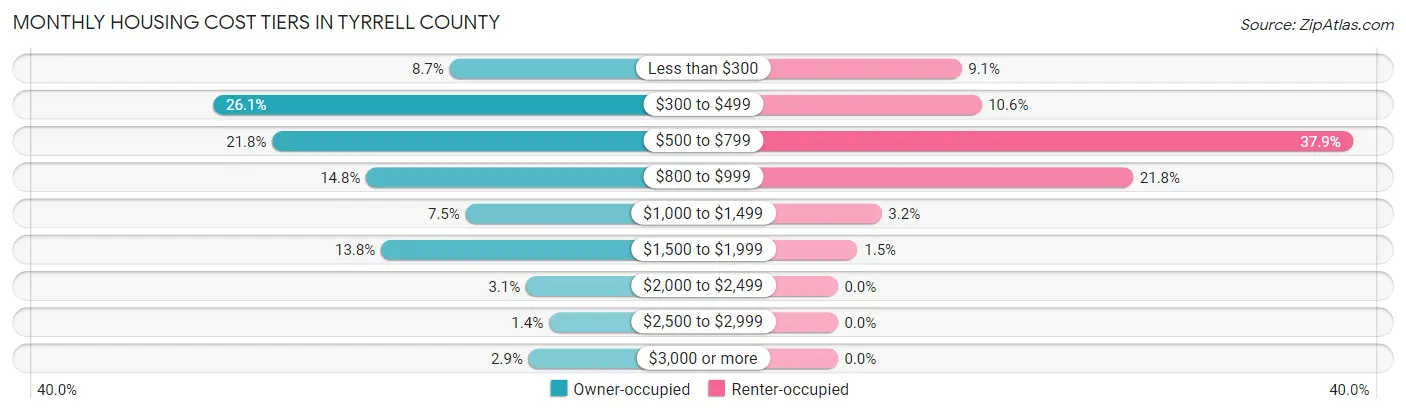
| Monthly Cost | Owner-occupied | Renter-occupied |
| Less than $300 | 88 (8.7%) | 31 (9.1%) |
| $300 to $499 | 264 (26.1%) | 36 (10.6%) |
| $500 to $799 | 220 (21.8%) | 129 (37.9%) |
| $800 to $999 | 150 (14.8%) | 74 (21.8%) |
| $1,000 to $1,499 | 76 (7.5%) | 11 (3.2%) |
| $1,500 to $1,999 | 139 (13.8%) | 5 (1.5%) |
| $2,000 to $2,499 | 31 (3.1%) | 0 (0.0%) |
| $2,500 to $2,999 | 14 (1.4%) | 0 (0.0%) |
| $3,000 or more | 29 (2.9%) | 0 (0.0%) |
| Total | 1,011 (100.0%) | 340 (100.0%) |
Physical Housing Characteristics in Tyrrell County
Housing Structures in Tyrrell County
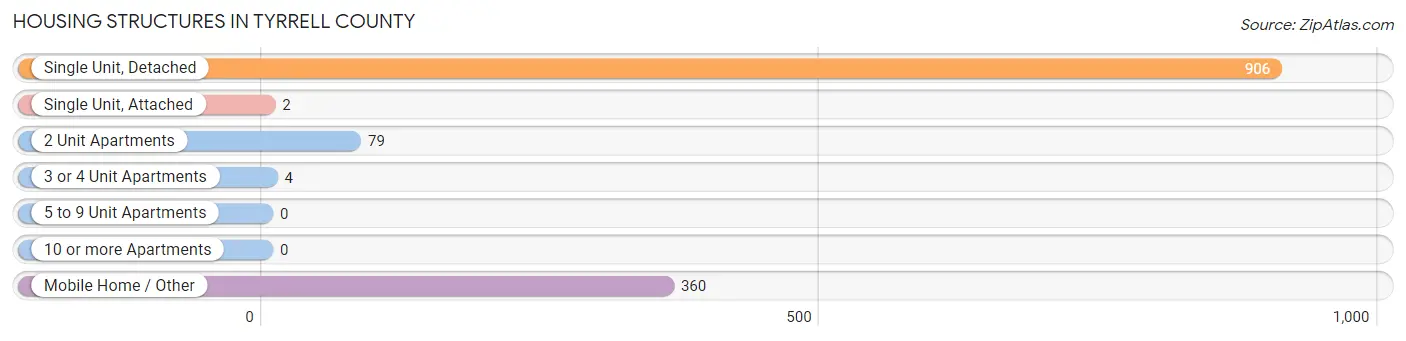
| Structure Type | # Housing Units | % Housing Units |
| Single Unit, Detached | 906 | 67.1% |
| Single Unit, Attached | 2 | 0.2% |
| 2 Unit Apartments | 79 | 5.9% |
| 3 or 4 Unit Apartments | 4 | 0.3% |
| 5 to 9 Unit Apartments | 0 | 0.0% |
| 10 or more Apartments | 0 | 0.0% |
| Mobile Home / Other | 360 | 26.7% |
| Total | 1,351 | 100.0% |
Housing Structures by Occupancy in Tyrrell County
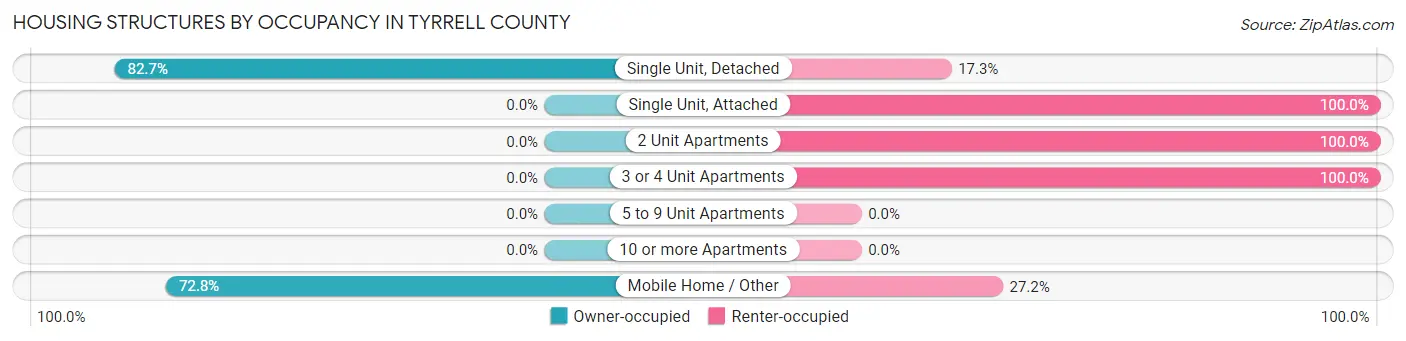
| Structure Type | Owner-occupied | Renter-occupied |
| Single Unit, Detached | 749 (82.7%) | 157 (17.3%) |
| Single Unit, Attached | 0 (0.0%) | 2 (100.0%) |
| 2 Unit Apartments | 0 (0.0%) | 79 (100.0%) |
| 3 or 4 Unit Apartments | 0 (0.0%) | 4 (100.0%) |
| 5 to 9 Unit Apartments | 0 (0.0%) | 0 (0.0%) |
| 10 or more Apartments | 0 (0.0%) | 0 (0.0%) |
| Mobile Home / Other | 262 (72.8%) | 98 (27.2%) |
| Total | 1,011 (74.8%) | 340 (25.2%) |
Housing Structures by Number of Rooms in Tyrrell County
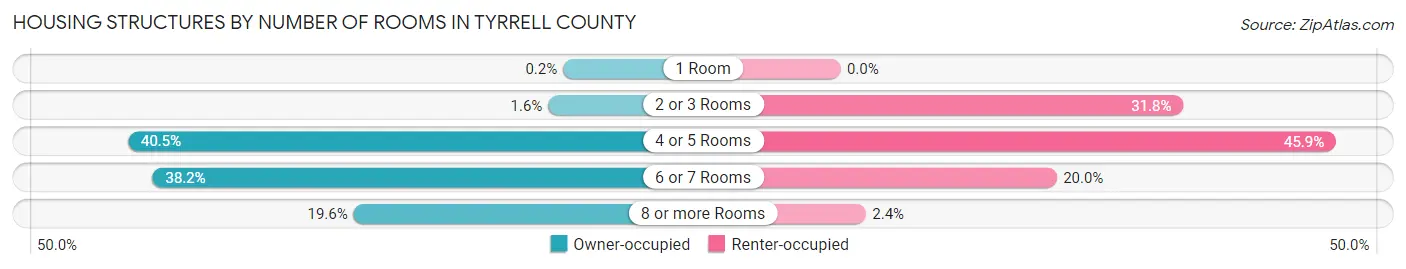
| Number of Rooms | Owner-occupied | Renter-occupied |
| 1 Room | 2 (0.2%) | 0 (0.0%) |
| 2 or 3 Rooms | 16 (1.6%) | 108 (31.8%) |
| 4 or 5 Rooms | 409 (40.5%) | 156 (45.9%) |
| 6 or 7 Rooms | 386 (38.2%) | 68 (20.0%) |
| 8 or more Rooms | 198 (19.6%) | 8 (2.4%) |
| Total | 1,011 (100.0%) | 340 (100.0%) |
Housing Structure by Heating Type in Tyrrell County
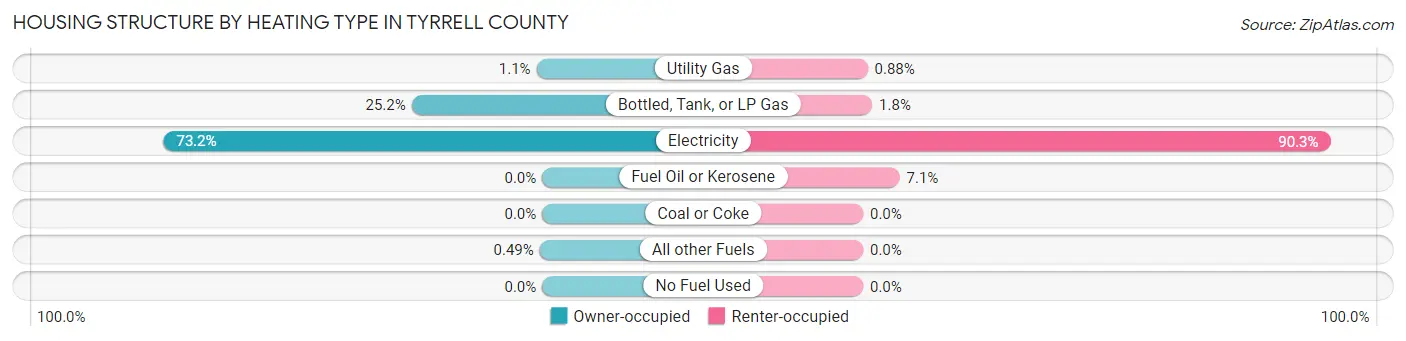
| Heating Type | Owner-occupied | Renter-occupied |
| Utility Gas | 11 (1.1%) | 3 (0.9%) |
| Bottled, Tank, or LP Gas | 255 (25.2%) | 6 (1.8%) |
| Electricity | 740 (73.2%) | 307 (90.3%) |
| Fuel Oil or Kerosene | 0 (0.0%) | 24 (7.1%) |
| Coal or Coke | 0 (0.0%) | 0 (0.0%) |
| All other Fuels | 5 (0.5%) | 0 (0.0%) |
| No Fuel Used | 0 (0.0%) | 0 (0.0%) |
| Total | 1,011 (100.0%) | 340 (100.0%) |
Household Vehicle Usage in Tyrrell County
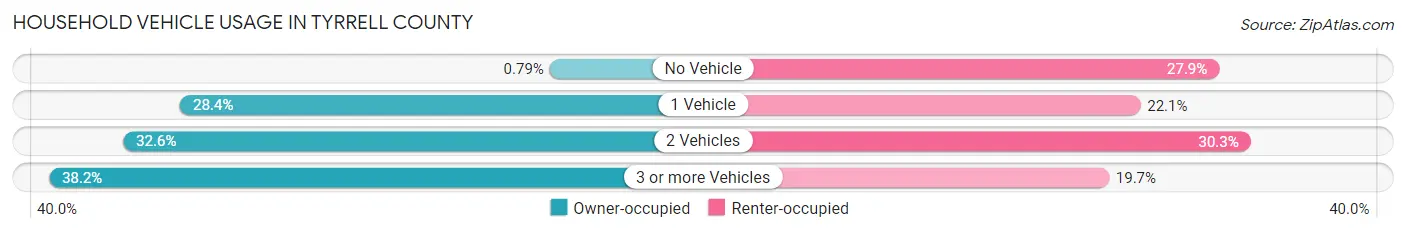
| Vehicles per Household | Owner-occupied | Renter-occupied |
| No Vehicle | 8 (0.8%) | 95 (27.9%) |
| 1 Vehicle | 287 (28.4%) | 75 (22.1%) |
| 2 Vehicles | 330 (32.6%) | 103 (30.3%) |
| 3 or more Vehicles | 386 (38.2%) | 67 (19.7%) |
| Total | 1,011 (100.0%) | 340 (100.0%) |
Real Estate & Mortgages in Tyrrell County
Real Estate and Mortgage Overview in Tyrrell County
| Characteristic | Without Mortgage | With Mortgage |
| Housing Units | 565 | 446 |
| Median Property Value | $106,300 | $171,000 |
| Median Household Income | $57,545 | $53 |
| Monthly Housing Costs | $463 | $29 |
| Real Estate Taxes | $1,047 | $8 |
Property Value by Mortgage Status in Tyrrell County
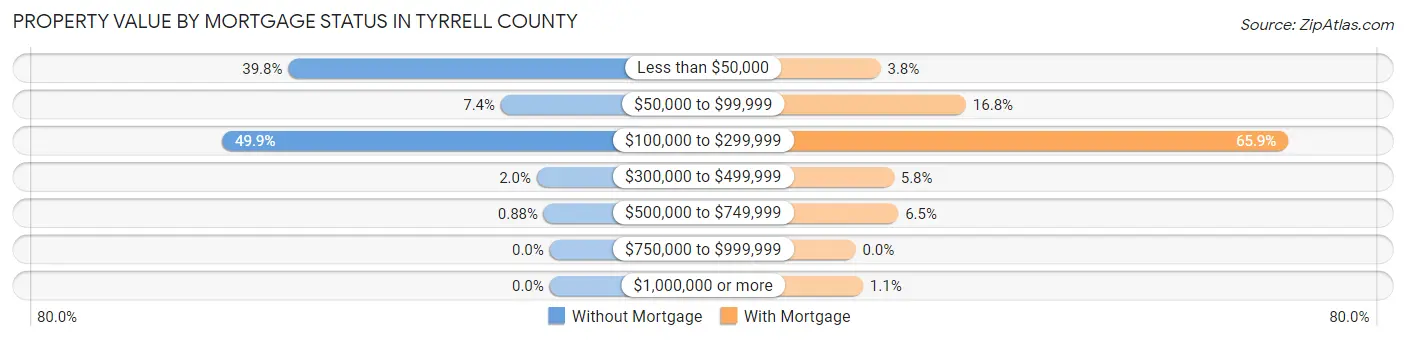
| Property Value | Without Mortgage | With Mortgage |
| Less than $50,000 | 225 (39.8%) | 17 (3.8%) |
| $50,000 to $99,999 | 42 (7.4%) | 75 (16.8%) |
| $100,000 to $299,999 | 282 (49.9%) | 294 (65.9%) |
| $300,000 to $499,999 | 11 (1.9%) | 26 (5.8%) |
| $500,000 to $749,999 | 5 (0.9%) | 29 (6.5%) |
| $750,000 to $999,999 | 0 (0.0%) | 0 (0.0%) |
| $1,000,000 or more | 0 (0.0%) | 5 (1.1%) |
| Total | 565 (100.0%) | 446 (100.0%) |
Household Income by Mortgage Status in Tyrrell County
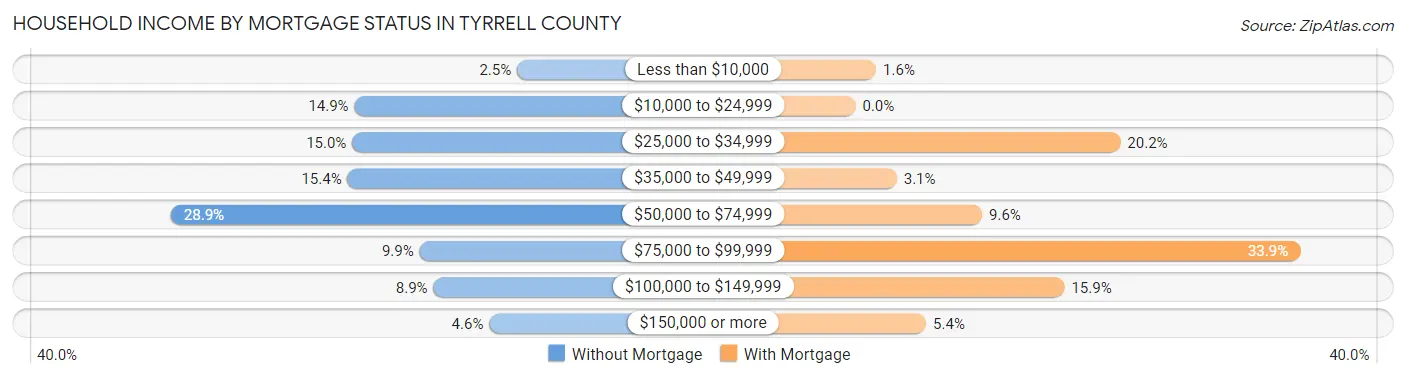
| Household Income | Without Mortgage | With Mortgage |
| Less than $10,000 | 14 (2.5%) | 7 (1.6%) |
| $10,000 to $24,999 | 84 (14.9%) | 0 (0.0%) |
| $25,000 to $34,999 | 85 (15.0%) | 90 (20.2%) |
| $35,000 to $49,999 | 87 (15.4%) | 14 (3.1%) |
| $50,000 to $74,999 | 163 (28.8%) | 43 (9.6%) |
| $75,000 to $99,999 | 56 (9.9%) | 151 (33.9%) |
| $100,000 to $149,999 | 50 (8.8%) | 71 (15.9%) |
| $150,000 or more | 26 (4.6%) | 24 (5.4%) |
| Total | 565 (100.0%) | 446 (100.0%) |
Property Value to Household Income Ratio in Tyrrell County
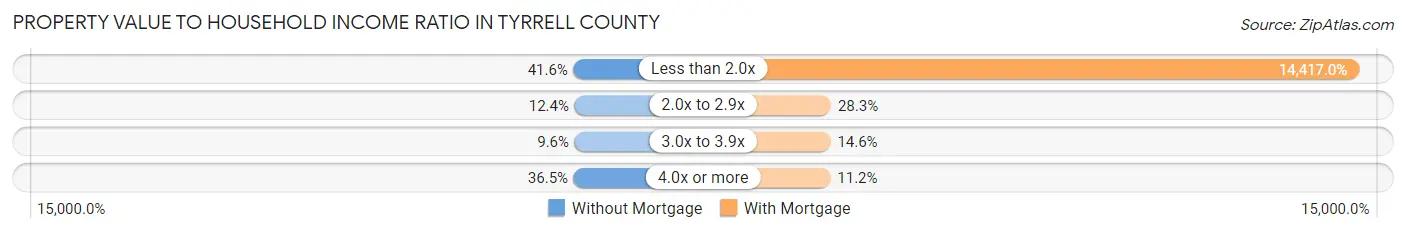
| Value-to-Income Ratio | Without Mortgage | With Mortgage |
| Less than 2.0x | 235 (41.6%) | 64,300 (14,417.0%) |
| 2.0x to 2.9x | 70 (12.4%) | 126 (28.2%) |
| 3.0x to 3.9x | 54 (9.6%) | 65 (14.6%) |
| 4.0x or more | 206 (36.5%) | 50 (11.2%) |
| Total | 565 (100.0%) | 446 (100.0%) |
Real Estate Taxes by Mortgage Status in Tyrrell County
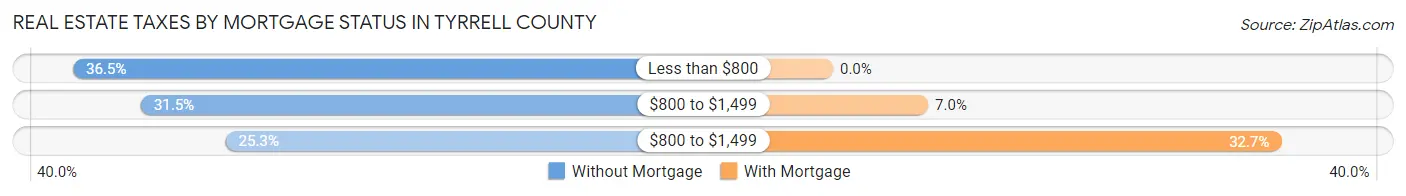
| Property Taxes | Without Mortgage | With Mortgage |
| Less than $800 | 206 (36.5%) | 0 (0.0%) |
| $800 to $1,499 | 178 (31.5%) | 31 (7.0%) |
| $800 to $1,499 | 143 (25.3%) | 146 (32.7%) |
| Total | 565 (100.0%) | 446 (100.0%) |
Health & Disability in Tyrrell County
Health Insurance Coverage by Age in Tyrrell County
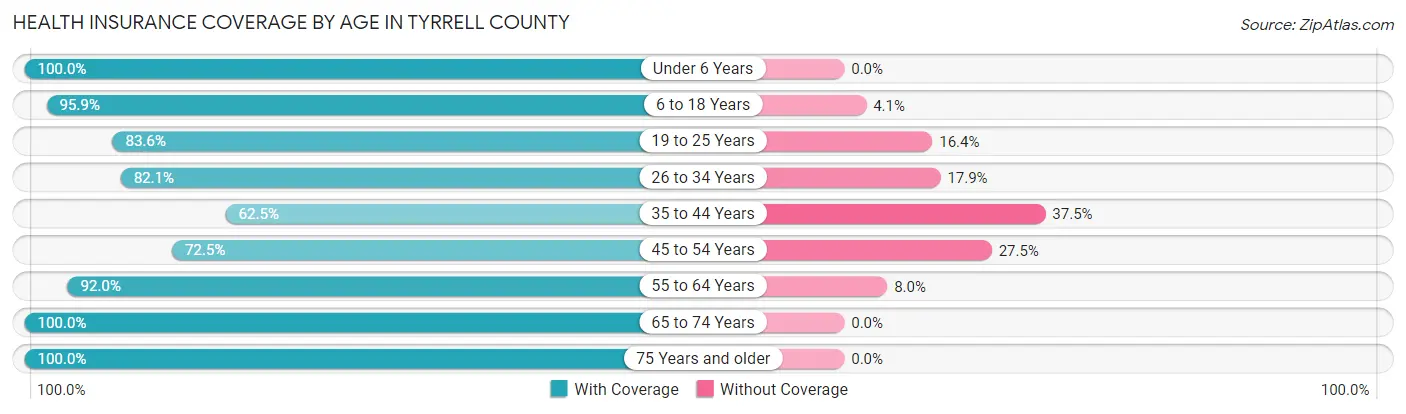
| Age Bracket | With Coverage | Without Coverage |
| Under 6 Years | 190 (100.0%) | 0 (0.0%) |
| 6 to 18 Years | 375 (95.9%) | 16 (4.1%) |
| 19 to 25 Years | 214 (83.6%) | 42 (16.4%) |
| 26 to 34 Years | 119 (82.1%) | 26 (17.9%) |
| 35 to 44 Years | 175 (62.5%) | 105 (37.5%) |
| 45 to 54 Years | 327 (72.5%) | 124 (27.5%) |
| 55 to 64 Years | 253 (92.0%) | 22 (8.0%) |
| 65 to 74 Years | 319 (100.0%) | 0 (0.0%) |
| 75 Years and older | 417 (100.0%) | 0 (0.0%) |
| Total | 2,389 (87.7%) | 335 (12.3%) |
Health Insurance Coverage by Citizenship Status in Tyrrell County
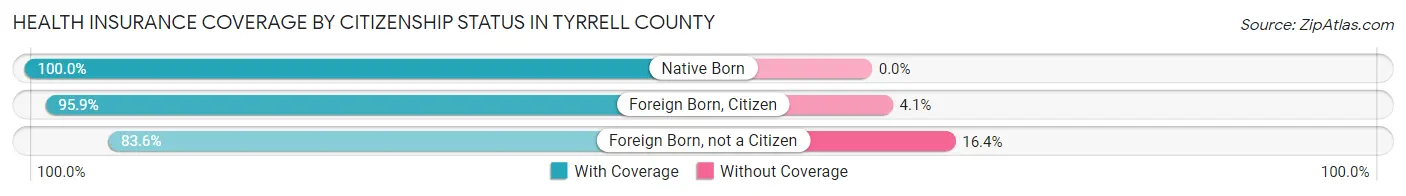
| Citizenship Status | With Coverage | Without Coverage |
| Native Born | 190 (100.0%) | 0 (0.0%) |
| Foreign Born, Citizen | 375 (95.9%) | 16 (4.1%) |
| Foreign Born, not a Citizen | 214 (83.6%) | 42 (16.4%) |
Health Insurance Coverage by Household Income in Tyrrell County
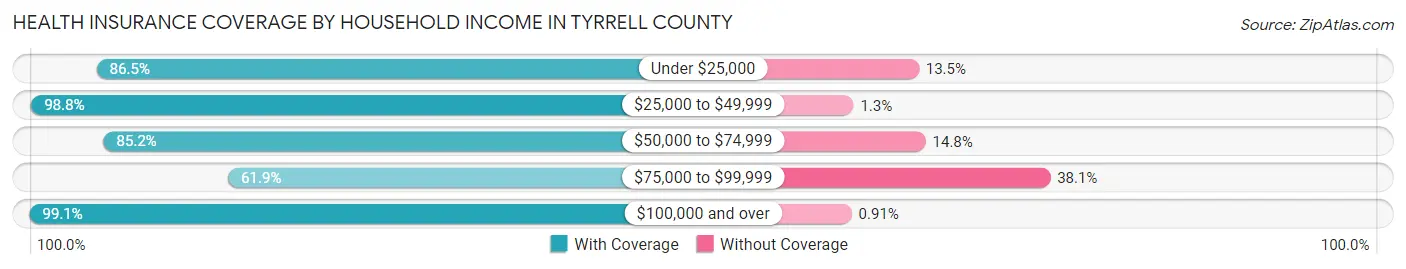
| Household Income | With Coverage | Without Coverage |
| Under $25,000 | 494 (86.5%) | 77 (13.5%) |
| $25,000 to $49,999 | 551 (98.8%) | 7 (1.3%) |
| $50,000 to $74,999 | 848 (85.2%) | 147 (14.8%) |
| $75,000 to $99,999 | 164 (61.9%) | 101 (38.1%) |
| $100,000 and over | 326 (99.1%) | 3 (0.9%) |
Public vs Private Health Insurance Coverage by Age in Tyrrell County
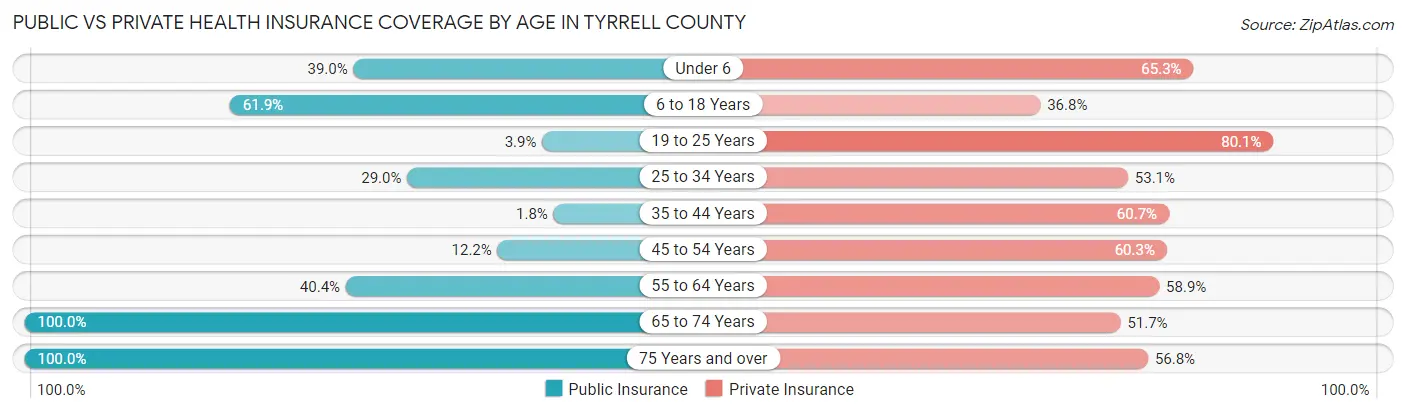
| Age Bracket | Public Insurance | Private Insurance |
| Under 6 | 74 (39.0%) | 124 (65.3%) |
| 6 to 18 Years | 242 (61.9%) | 144 (36.8%) |
| 19 to 25 Years | 10 (3.9%) | 205 (80.1%) |
| 25 to 34 Years | 42 (29.0%) | 77 (53.1%) |
| 35 to 44 Years | 5 (1.8%) | 170 (60.7%) |
| 45 to 54 Years | 55 (12.2%) | 272 (60.3%) |
| 55 to 64 Years | 111 (40.4%) | 162 (58.9%) |
| 65 to 74 Years | 319 (100.0%) | 165 (51.7%) |
| 75 Years and over | 417 (100.0%) | 237 (56.8%) |
| Total | 1,275 (46.8%) | 1,556 (57.1%) |
Disability Status by Sex by Age in Tyrrell County
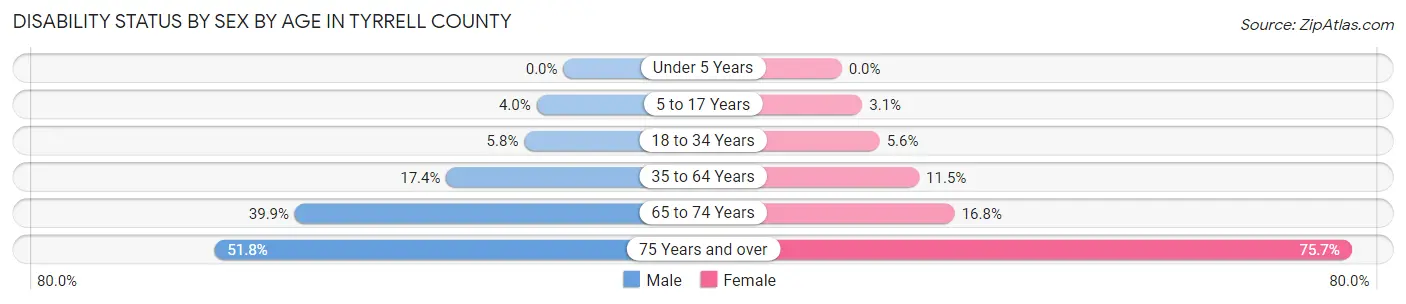
| Age Bracket | Male | Female |
| Under 5 Years | 0 (0.0%) | 0 (0.0%) |
| 5 to 17 Years | 8 (4.0%) | 6 (3.0%) |
| 18 to 34 Years | 10 (5.8%) | 13 (5.6%) |
| 35 to 64 Years | 69 (17.4%) | 70 (11.5%) |
| 65 to 74 Years | 63 (39.9%) | 27 (16.8%) |
| 75 Years and over | 86 (51.8%) | 190 (75.7%) |
Disability Class by Sex by Age in Tyrrell County
Disability Class: Hearing Difficulty
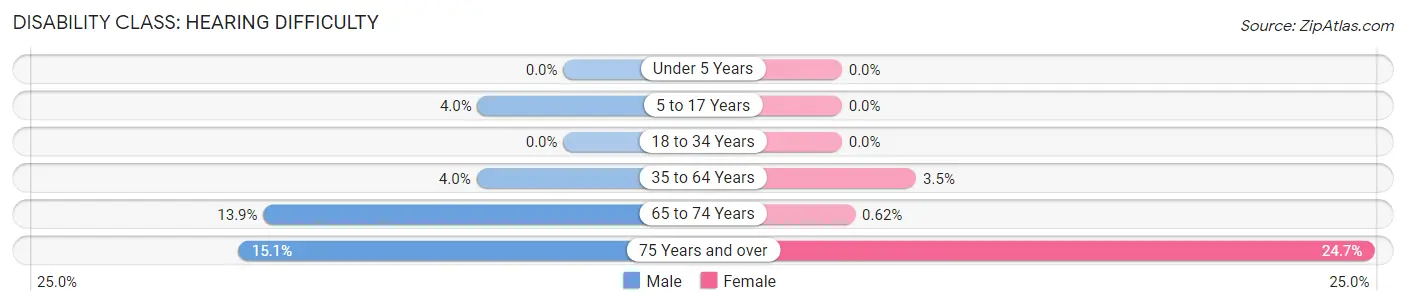
| Age Bracket | Male | Female |
| Under 5 Years | 0 (0.0%) | 0 (0.0%) |
| 5 to 17 Years | 8 (4.0%) | 0 (0.0%) |
| 18 to 34 Years | 0 (0.0%) | 0 (0.0%) |
| 35 to 64 Years | 16 (4.0%) | 21 (3.5%) |
| 65 to 74 Years | 22 (13.9%) | 1 (0.6%) |
| 75 Years and over | 25 (15.1%) | 62 (24.7%) |
Disability Class: Vision Difficulty
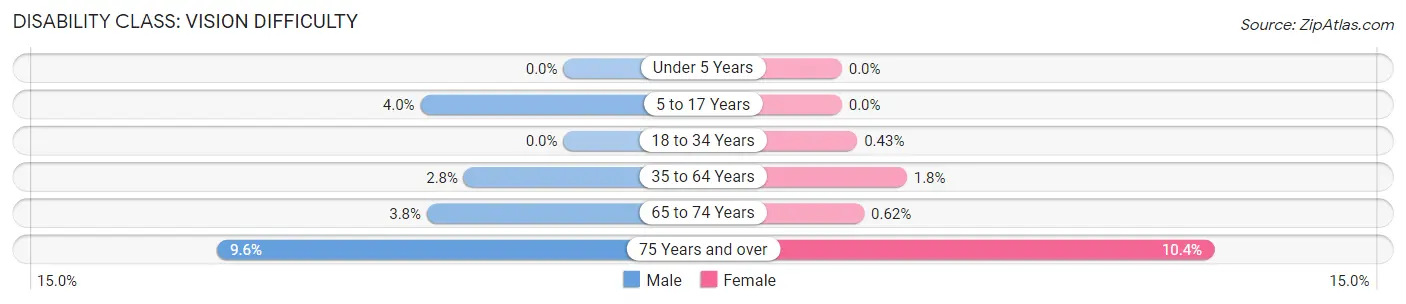
| Age Bracket | Male | Female |
| Under 5 Years | 0 (0.0%) | 0 (0.0%) |
| 5 to 17 Years | 8 (4.0%) | 0 (0.0%) |
| 18 to 34 Years | 0 (0.0%) | 1 (0.4%) |
| 35 to 64 Years | 11 (2.8%) | 11 (1.8%) |
| 65 to 74 Years | 6 (3.8%) | 1 (0.6%) |
| 75 Years and over | 16 (9.6%) | 26 (10.4%) |
Disability Class: Cognitive Difficulty
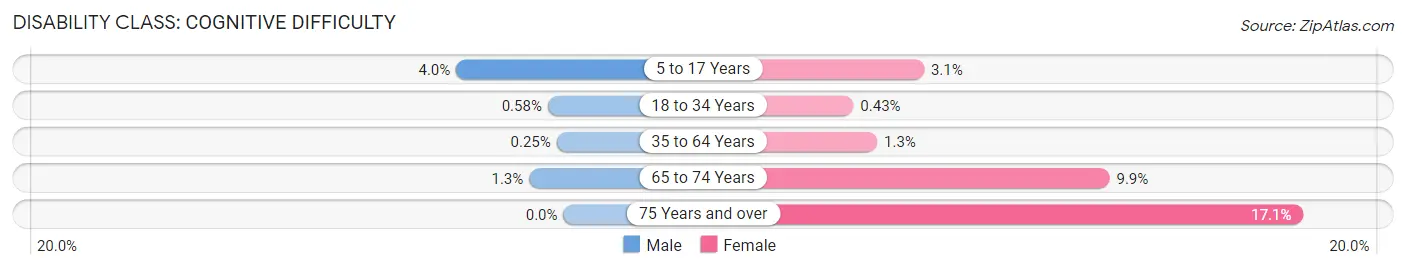
| Age Bracket | Male | Female |
| 5 to 17 Years | 8 (4.0%) | 6 (3.0%) |
| 18 to 34 Years | 1 (0.6%) | 1 (0.4%) |
| 35 to 64 Years | 1 (0.3%) | 8 (1.3%) |
| 65 to 74 Years | 2 (1.3%) | 16 (9.9%) |
| 75 Years and over | 0 (0.0%) | 43 (17.1%) |
Disability Class: Ambulatory Difficulty
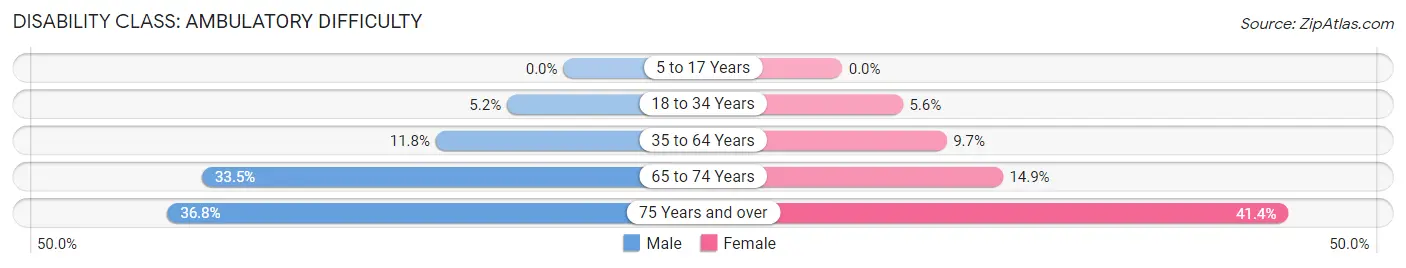
| Age Bracket | Male | Female |
| 5 to 17 Years | 0 (0.0%) | 0 (0.0%) |
| 18 to 34 Years | 9 (5.2%) | 13 (5.6%) |
| 35 to 64 Years | 47 (11.8%) | 59 (9.7%) |
| 65 to 74 Years | 53 (33.5%) | 24 (14.9%) |
| 75 Years and over | 61 (36.7%) | 104 (41.4%) |
Disability Class: Self-Care Difficulty
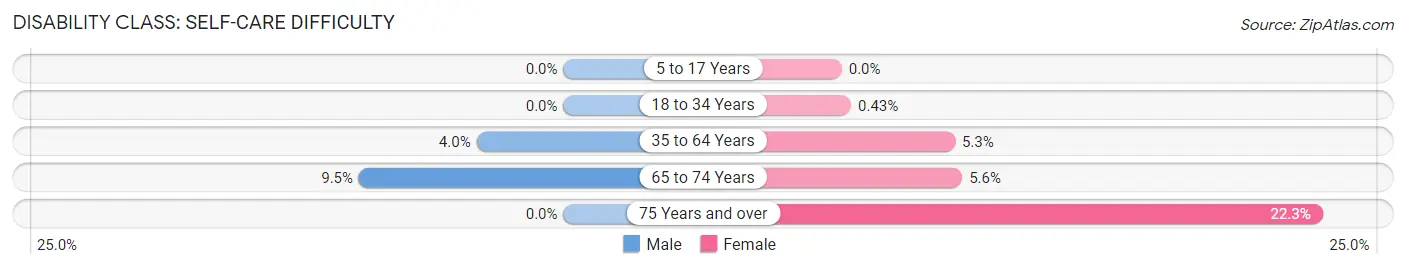
| Age Bracket | Male | Female |
| 5 to 17 Years | 0 (0.0%) | 0 (0.0%) |
| 18 to 34 Years | 0 (0.0%) | 1 (0.4%) |
| 35 to 64 Years | 16 (4.0%) | 32 (5.2%) |
| 65 to 74 Years | 15 (9.5%) | 9 (5.6%) |
| 75 Years and over | 0 (0.0%) | 56 (22.3%) |
Technology Access in Tyrrell County
Computing Device Access in Tyrrell County
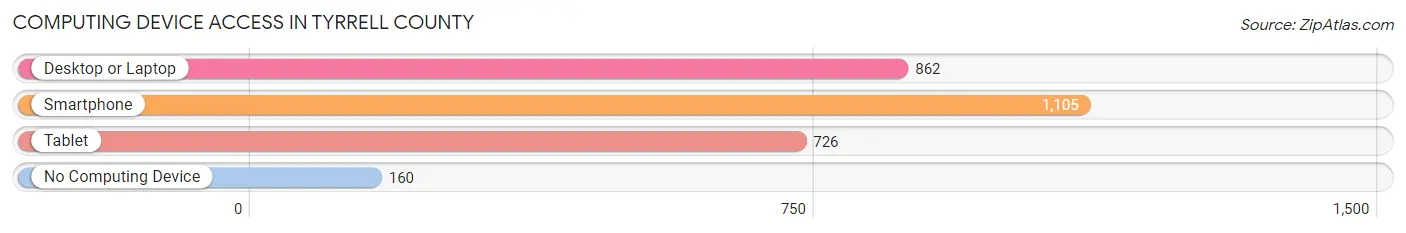
| Device Type | # Households | % Households |
| Desktop or Laptop | 862 | 63.8% |
| Smartphone | 1,105 | 81.8% |
| Tablet | 726 | 53.7% |
| No Computing Device | 160 | 11.8% |
| Total | 1,351 | 100.0% |
Internet Access in Tyrrell County
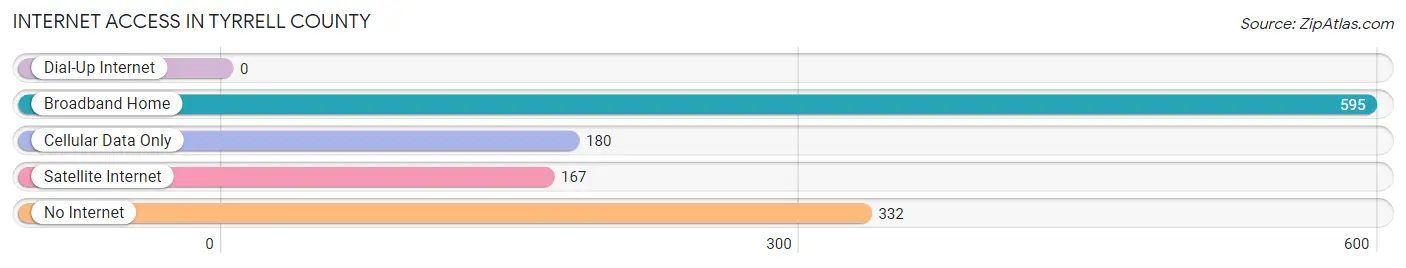
| Internet Type | # Households | % Households |
| Dial-Up Internet | 0 | 0.0% |
| Broadband Home | 595 | 44.0% |
| Cellular Data Only | 180 | 13.3% |
| Satellite Internet | 167 | 12.4% |
| No Internet | 332 | 24.6% |
| Total | 1,351 | 100.0% |
Tyrrell County Summary
Tyrrell County is a county located in the northeastern part of the U.S. state of North Carolina. As of the 2010 census, the population was 4,407, making it the least populous county in North Carolina. Its county seat is Columbia. The county was formed in 1729 as Tyrrell Precinct and gained county status in 1739. It is named for Sir John Tyrrell, a member of the Governor's Council and a supporter of colonial governor George Burrington.
Geography
Tyrrell County is located in the northeastern corner of North Carolina, on the Atlantic Coast. It is bordered by Dare County to the north, Washington County to the west, and Hyde County to the south. The county is approximately 545 square miles in size, with a total land area of 543 square miles. The county is divided into two distinct regions: the mainland and the Outer Banks. The mainland is mostly flat and marshy, with the Alligator River running through it. The Outer Banks are a series of barrier islands that stretch along the coast.
The county is home to several state parks, including Pettigrew State Park, which is located on the mainland, and Cape Hatteras National Seashore, which is located on the Outer Banks.
Demographics
As of the 2010 census, there were 4,407 people, 1,845 households, and 1,220 families residing in the county. The population density was 8.1 people per square mile. The racial makeup of the county was 73.3% White, 22.2% African American, 0.3% Native American, 0.2% Asian, 0.1% Pacific Islander, 2.7% from other races, and 1.4% from two or more races. Hispanic or Latino of any race were 4.2% of the population.
The median income for a household in the county was $30,938, and the median income for a family was $37,917. The per capita income for the county was $17,845. About 17.2% of families and 22.2% of the population were below the poverty line, including 28.2% of those under age 18 and 18.2% of those age 65 or over.
Economy
Tyrrell County's economy is largely based on agriculture and fishing. The county is home to several large farms, which produce a variety of crops, including corn, soybeans, wheat, and cotton. The county is also home to several commercial fishing operations, which harvest a variety of seafood, including shrimp, crabs, and oysters.
The county is also home to several tourist attractions, including the Alligator River National Wildlife Refuge, the Pettigrew State Park, and the Cape Hatteras National Seashore. These attractions bring in a significant amount of tourism revenue to the county.
Conclusion
Tyrrell County is a small, rural county located in the northeastern corner of North Carolina. It is home to a variety of agricultural and fishing operations, as well as several tourist attractions. The county has a population of 4,407, and a median household income of $30,938. The county is largely rural, with a large portion of its population living below the poverty line. Despite its small size and rural nature, Tyrrell County is an important part of North Carolina's economy, and its residents are proud of their county's history and culture.
Common Questions
What is the Total Population of Tyrrell County?
Total Population of Tyrrell County is 3,389.
What is the Total Male Population of Tyrrell County?
Total Male Population of Tyrrell County is 1,847.
What is the Total Female Population of Tyrrell County?
Total Female Population of Tyrrell County is 1,542.
What is the Ratio of Males per 100 Females in Tyrrell County?
There are 119.78 Males per 100 Females in Tyrrell County.
What is the Ratio of Females per 100 Males in Tyrrell County?
There are 83.49 Females per 100 Males in Tyrrell County.
What is the Median Population Age in Tyrrell County?
Median Population Age in Tyrrell County is 45.3 Years.
What is the Average Family Size in Tyrrell County
Average Family Size in Tyrrell County is 2.4 People.
What is the Average Household Size in Tyrrell County
Average Household Size in Tyrrell County is 2.0 People.
What is Per Capita Income in Tyrrell County?
Per Capita income in Tyrrell County is $22,403.
What is the Median Family Income in Tyrrell County?
Median Family Income in Tyrrell County is $59,396.
What is the Median Household income in Tyrrell County?
Median Household Income in Tyrrell County is $55,341.
What is Income or Wage Gap in Tyrrell County?
Income or Wage Gap in Tyrrell County is 43.5%.
Women in Tyrrell County earn 56.5 cents for every dollar earned by a man.
What is Inequality or Gini Index in Tyrrell County?
Inequality or Gini Index in Tyrrell County is 0.40.
How Large is the Labor Force in Tyrrell County?
There are 1,227 People in the Labor Forcein in Tyrrell County.
What is the Percentage of People in the Labor Force in Tyrrell County?
43.2% of People are in the Labor Force in Tyrrell County.
What is the Unemployment Rate in Tyrrell County?
Unemployment Rate in Tyrrell County is 3.9%.