Surry County, NC
Surry County Overview
71,429
TOTAL POPULATION
34,926
MALE POPULATION
36,503
FEMALE POPULATION
95.68
MALES / 100 FEMALES
104.52
FEMALES / 100 MALES
43.8
MEDIAN AGE
3.0
AVG FAMILY SIZE
2.4
AVG HOUSEHOLD SIZE
$30,274
PER CAPITA INCOME
$71,903
AVG FAMILY INCOME
$52,743
AVG HOUSEHOLD INCOME
30.2%
WAGE / INCOME GAP [ % ]
69.8¢/ $1
WAGE / INCOME GAP [ $ ]
$8,918
FAMILY INCOME DEFICIT
0.48
INEQUALITY / GINI INDEX
33,447
LABOR FORCE [ PEOPLE ]
57.5%
PERCENT IN LABOR FORCE
4.9%
UNEMPLOYMENT RATE
Surry County Area Codes
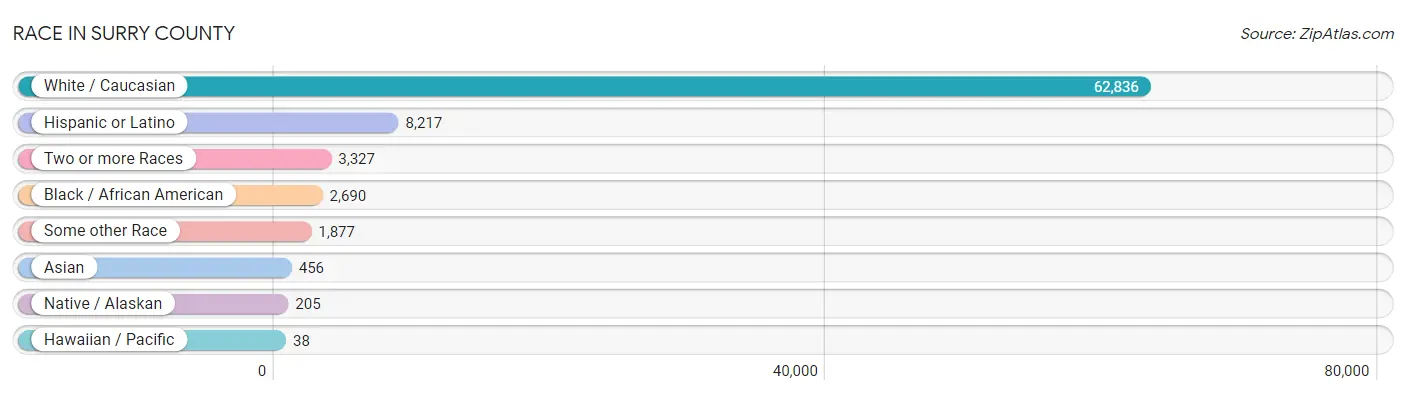
Race in Surry County
The most populous races in Surry County are White / Caucasian (62,836 | 88.0%), Hispanic or Latino (8,217 | 11.5%), and Two or more Races (3,327 | 4.7%).
| Race | # Population | % Population |
| Asian | 456 | 0.6% |
| Black / African American | 2,690 | 3.8% |
| Hawaiian / Pacific | 38 | 0.1% |
| Hispanic or Latino | 8,217 | 11.5% |
| Native / Alaskan | 205 | 0.3% |
| White / Caucasian | 62,836 | 88.0% |
| Two or more Races | 3,327 | 4.7% |
| Some other Race | 1,877 | 2.6% |
| Total | 71,429 | 100.0% |
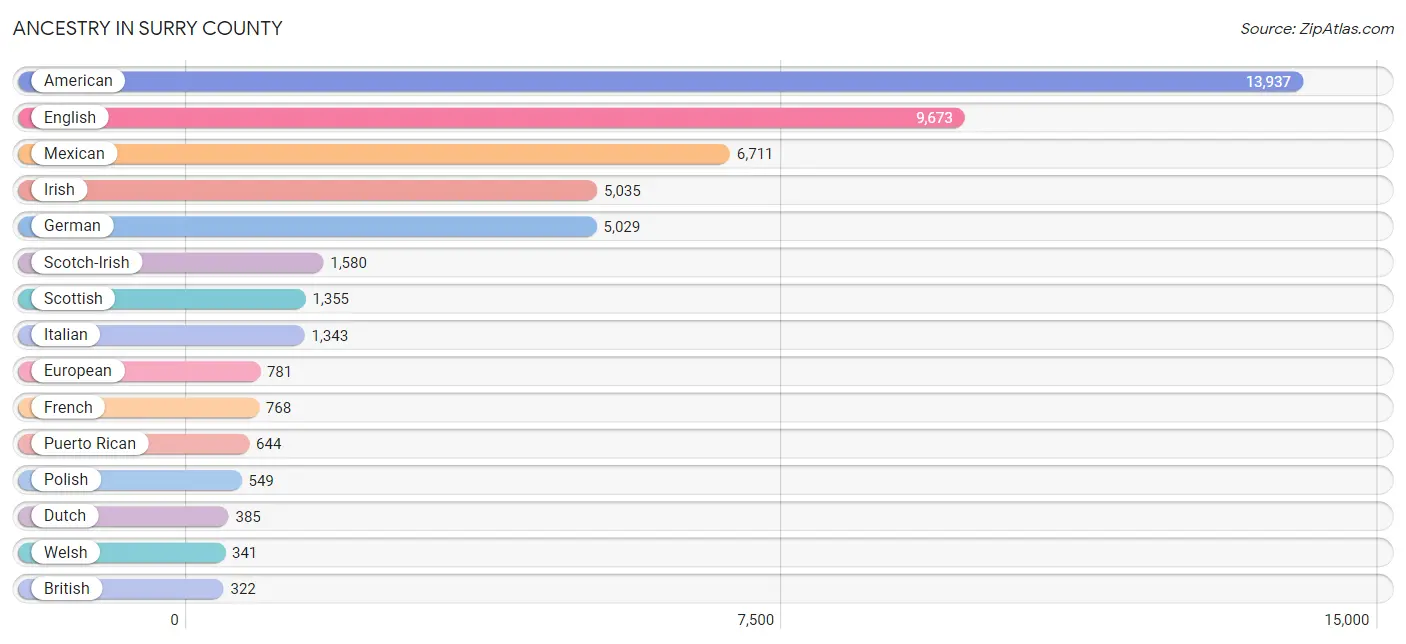
Ancestry in Surry County
The most populous ancestries reported in Surry County are American (13,937 | 19.5%), English (9,673 | 13.5%), Mexican (6,711 | 9.4%), Irish (5,035 | 7.0%), and German (5,029 | 7.0%), together accounting for 56.5% of all Surry County residents.
| Ancestry | # Population | % Population |
| African | 95 | 0.1% |
| Albanian | 5 | 0.0% |
| Aleut | 1 | 0.0% |
| Alsatian | 5 | 0.0% |
| American | 13,937 | 19.5% |
| Apache | 2 | 0.0% |
| Arab | 14 | 0.0% |
| Armenian | 37 | 0.1% |
| Austrian | 47 | 0.1% |
| Bangladeshi | 138 | 0.2% |
| Bhutanese | 51 | 0.1% |
| Blackfeet | 25 | 0.0% |
| British | 322 | 0.4% |
| Burmese | 45 | 0.1% |
| Canadian | 40 | 0.1% |
| Celtic | 1 | 0.0% |
| Central American | 261 | 0.4% |
| Cherokee | 210 | 0.3% |
| Chippewa | 3 | 0.0% |
| Colombian | 83 | 0.1% |
| Croatian | 7 | 0.0% |
| Cuban | 18 | 0.0% |
| Czech | 105 | 0.2% |
| Czechoslovakian | 52 | 0.1% |
| Danish | 19 | 0.0% |
| Delaware | 2 | 0.0% |
| Dominican | 65 | 0.1% |
| Dutch | 385 | 0.5% |
| Eastern European | 72 | 0.1% |
| English | 9,673 | 13.5% |
| Estonian | 2 | 0.0% |
| Ethiopian | 28 | 0.0% |
| European | 781 | 1.1% |
| Finnish | 6 | 0.0% |
| French | 768 | 1.1% |
| French Canadian | 141 | 0.2% |
| German | 5,029 | 7.0% |
| Greek | 34 | 0.1% |
| Guamanian / Chamorro | 2 | 0.0% |
| Guatemalan | 61 | 0.1% |
| Honduran | 64 | 0.1% |
| Hungarian | 122 | 0.2% |
| Icelander | 20 | 0.0% |
| Indian (Asian) | 87 | 0.1% |
| Inupiat | 3 | 0.0% |
| Irish | 5,035 | 7.0% |
| Iroquois | 12 | 0.0% |
| Italian | 1,343 | 1.9% |
| Korean | 61 | 0.1% |
| Lebanese | 4 | 0.0% |
| Lithuanian | 19 | 0.0% |
| Lumbee | 57 | 0.1% |
| Malaysian | 20 | 0.0% |
| Mexican | 6,711 | 9.4% |
| Mexican American Indian | 42 | 0.1% |
| Native Hawaiian | 2 | 0.0% |
| Navajo | 3 | 0.0% |
| New Zealander | 12 | 0.0% |
| Nicaraguan | 86 | 0.1% |
| Nigerian | 52 | 0.1% |
| Northern European | 20 | 0.0% |
| Norwegian | 154 | 0.2% |
| Pakistani | 154 | 0.2% |
| Polish | 549 | 0.8% |
| Portuguese | 26 | 0.0% |
| Potawatomi | 2 | 0.0% |
| Puerto Rican | 644 | 0.9% |
| Romanian | 2 | 0.0% |
| Russian | 75 | 0.1% |
| Salvadoran | 50 | 0.1% |
| Samoan | 29 | 0.0% |
| Scandinavian | 37 | 0.1% |
| Scotch-Irish | 1,580 | 2.2% |
| Scottish | 1,355 | 1.9% |
| Slavic | 9 | 0.0% |
| Slovak | 22 | 0.0% |
| Slovene | 9 | 0.0% |
| South American | 83 | 0.1% |
| Spaniard | 164 | 0.2% |
| Spanish | 27 | 0.0% |
| Sri Lankan | 131 | 0.2% |
| Subsaharan African | 175 | 0.2% |
| Swedish | 151 | 0.2% |
| Swiss | 103 | 0.1% |
| Syrian | 10 | 0.0% |
| Thai | 59 | 0.1% |
| Turkish | 148 | 0.2% |
| Ukrainian | 85 | 0.1% |
| Welsh | 341 | 0.5% | View All 89 Rows |
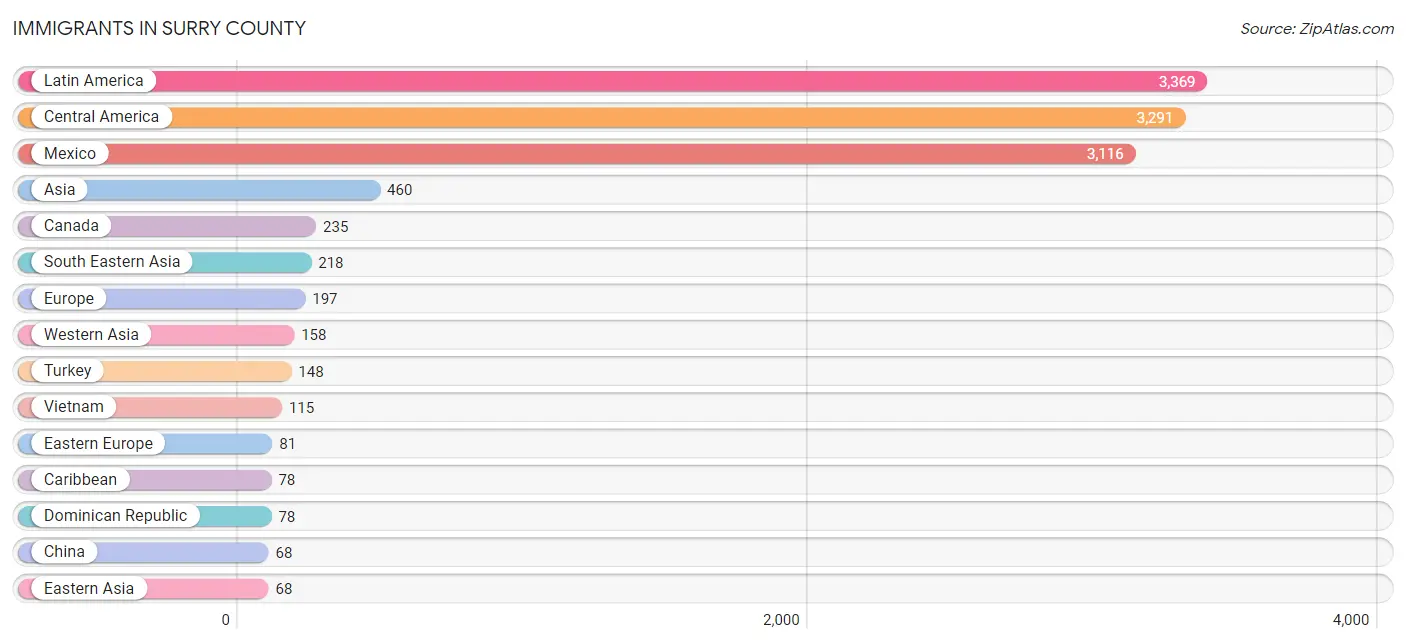
Immigrants in Surry County
The most numerous immigrant groups reported in Surry County came from Latin America (3,369 | 4.7%), Central America (3,291 | 4.6%), Mexico (3,116 | 4.4%), Asia (460 | 0.6%), and Canada (235 | 0.3%), together accounting for 14.7% of all Surry County residents.
| Immigration Origin | # Population | % Population |
| Africa | 8 | 0.0% |
| Asia | 460 | 0.6% |
| Canada | 235 | 0.3% |
| Caribbean | 78 | 0.1% |
| Central America | 3,291 | 4.6% |
| China | 68 | 0.1% |
| Czechoslovakia | 10 | 0.0% |
| Dominican Republic | 78 | 0.1% |
| Eastern Asia | 68 | 0.1% |
| Eastern Europe | 81 | 0.1% |
| El Salvador | 50 | 0.1% |
| England | 10 | 0.0% |
| Europe | 197 | 0.3% |
| Germany | 31 | 0.0% |
| Greece | 6 | 0.0% |
| Guatemala | 29 | 0.0% |
| Honduras | 40 | 0.1% |
| Hungary | 16 | 0.0% |
| India | 13 | 0.0% |
| Ireland | 19 | 0.0% |
| Italy | 21 | 0.0% |
| Laos | 11 | 0.0% |
| Latin America | 3,369 | 4.7% |
| Mexico | 3,116 | 4.4% |
| Netherlands | 9 | 0.0% |
| Nicaragua | 56 | 0.1% |
| Northern Europe | 40 | 0.1% |
| Oceania | 12 | 0.0% |
| Pakistan | 3 | 0.0% |
| Philippines | 38 | 0.1% |
| Portugal | 9 | 0.0% |
| Romania | 11 | 0.0% |
| Russia | 10 | 0.0% |
| South Africa | 8 | 0.0% |
| South Central Asia | 16 | 0.0% |
| South Eastern Asia | 218 | 0.3% |
| Southern Europe | 36 | 0.1% |
| Syria | 10 | 0.0% |
| Thailand | 54 | 0.1% |
| Turkey | 148 | 0.2% |
| Ukraine | 7 | 0.0% |
| Vietnam | 115 | 0.2% |
| Western Asia | 158 | 0.2% |
| Western Europe | 40 | 0.1% | View All 44 Rows |
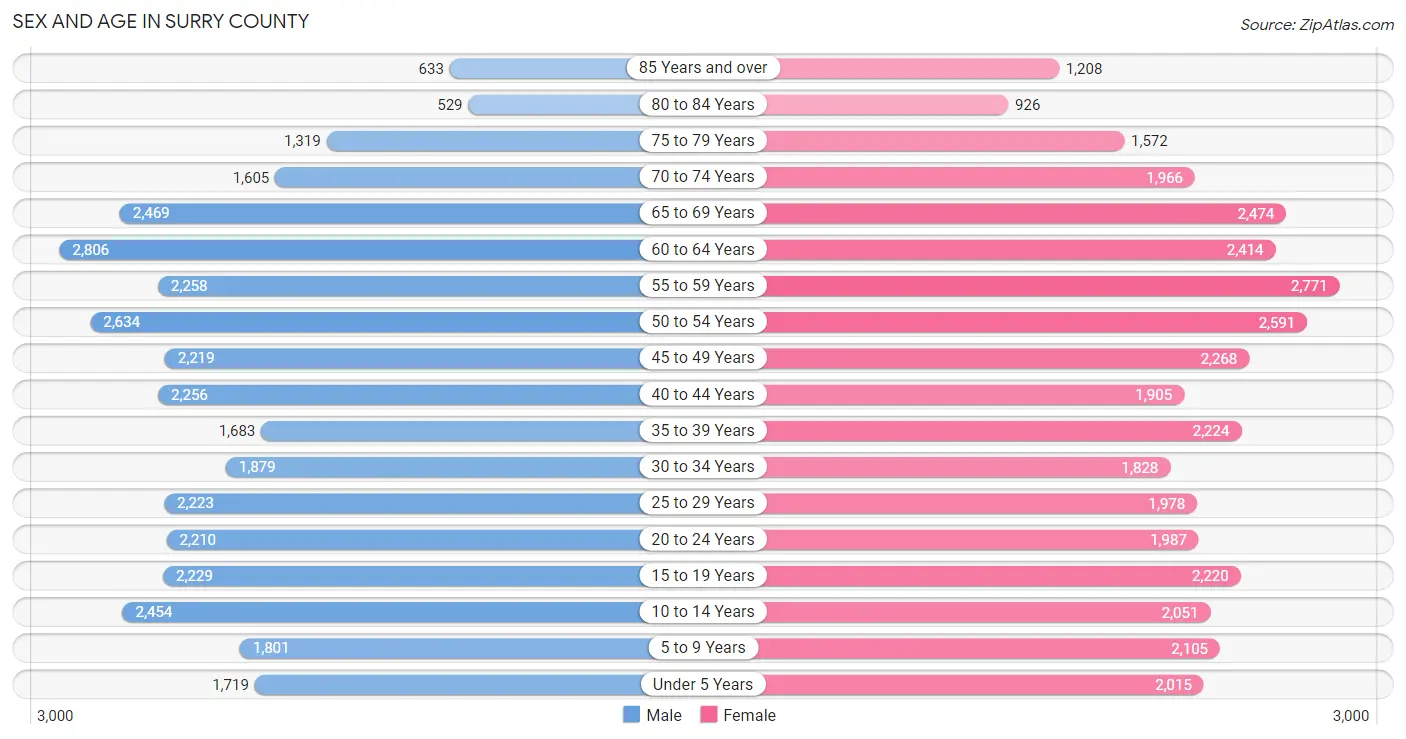
Sex and Age in Surry County
Sex and Age in Surry County
The most populous age groups in Surry County are 60 to 64 Years (2,806 | 8.0%) for men and 55 to 59 Years (2,771 | 7.6%) for women.
| Age Bracket | Male | Female |
| Under 5 Years | 1,719 (4.9%) | 2,015 (5.5%) |
| 5 to 9 Years | 1,801 (5.2%) | 2,105 (5.8%) |
| 10 to 14 Years | 2,454 (7.0%) | 2,051 (5.6%) |
| 15 to 19 Years | 2,229 (6.4%) | 2,220 (6.1%) |
| 20 to 24 Years | 2,210 (6.3%) | 1,987 (5.4%) |
| 25 to 29 Years | 2,223 (6.4%) | 1,978 (5.4%) |
| 30 to 34 Years | 1,879 (5.4%) | 1,828 (5.0%) |
| 35 to 39 Years | 1,683 (4.8%) | 2,224 (6.1%) |
| 40 to 44 Years | 2,256 (6.5%) | 1,905 (5.2%) |
| 45 to 49 Years | 2,219 (6.4%) | 2,268 (6.2%) |
| 50 to 54 Years | 2,634 (7.5%) | 2,591 (7.1%) |
| 55 to 59 Years | 2,258 (6.5%) | 2,771 (7.6%) |
| 60 to 64 Years | 2,806 (8.0%) | 2,414 (6.6%) |
| 65 to 69 Years | 2,469 (7.1%) | 2,474 (6.8%) |
| 70 to 74 Years | 1,605 (4.6%) | 1,966 (5.4%) |
| 75 to 79 Years | 1,319 (3.8%) | 1,572 (4.3%) |
| 80 to 84 Years | 529 (1.5%) | 926 (2.5%) |
| 85 Years and over | 633 (1.8%) | 1,208 (3.3%) |
| Total | 34,926 (100.0%) | 36,503 (100.0%) |
Families and Households in Surry County
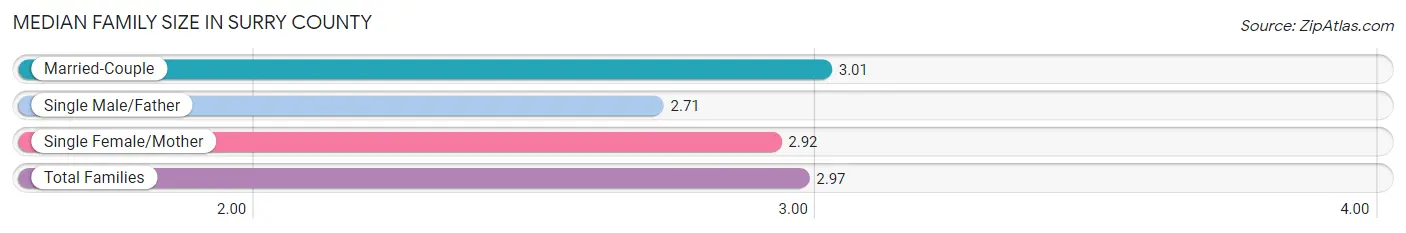
Median Family Size in Surry County
The median family size in Surry County is 2.97 persons per family, with married-couple families (14,541 | 75.4%) accounting for the largest median family size of 3.01 persons per family. On the other hand, single male/father families (1,544 | 8.0%) represent the smallest median family size with 2.71 persons per family.
| Family Type | # Families | Family Size |
| Married-Couple | 14,541 (75.4%) | 3.01 |
| Single Male/Father | 1,544 (8.0%) | 2.71 |
| Single Female/Mother | 3,196 (16.6%) | 2.92 |
| Total Families | 19,281 (100.0%) | 2.97 |
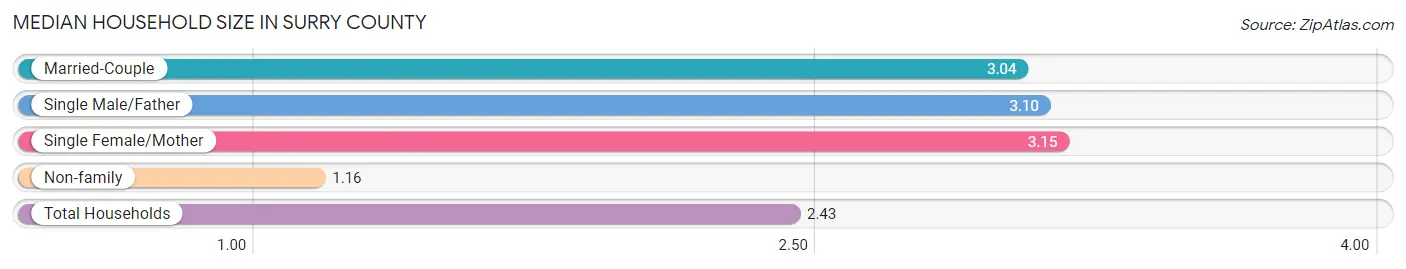
Median Household Size in Surry County
The median household size in Surry County is 2.43 persons per household, with single female/mother households (3,196 | 11.0%) accounting for the largest median household size of 3.15 persons per household. non-family households (9,709 | 33.5%) represent the smallest median household size with 1.16 persons per household.
| Household Type | # Households | Household Size |
| Married-Couple | 14,541 (50.2%) | 3.04 |
| Single Male/Father | 1,544 (5.3%) | 3.10 |
| Single Female/Mother | 3,196 (11.0%) | 3.15 |
| Non-family | 9,709 (33.5%) | 1.16 |
| Total Households | 28,990 (100.0%) | 2.43 |
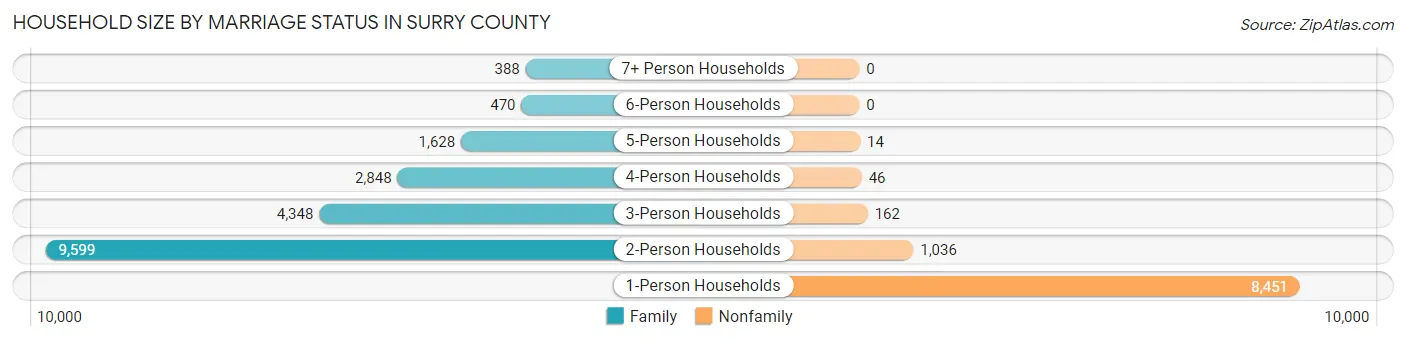
Household Size by Marriage Status in Surry County
Out of a total of 28,990 households in Surry County, 19,281 (66.5%) are family households, while 9,709 (33.5%) are nonfamily households. The most numerous type of family households are 2-person households, comprising 9,599, and the most common type of nonfamily households are 1-person households, comprising 8,451.
| Household Size | Family Households | Nonfamily Households |
| 1-Person Households | - | 8,451 (29.1%) |
| 2-Person Households | 9,599 (33.1%) | 1,036 (3.6%) |
| 3-Person Households | 4,348 (15.0%) | 162 (0.6%) |
| 4-Person Households | 2,848 (9.8%) | 46 (0.2%) |
| 5-Person Households | 1,628 (5.6%) | 14 (0.1%) |
| 6-Person Households | 470 (1.6%) | 0 (0.0%) |
| 7+ Person Households | 388 (1.3%) | 0 (0.0%) |
| Total | 19,281 (66.5%) | 9,709 (33.5%) |
Female Fertility in Surry County
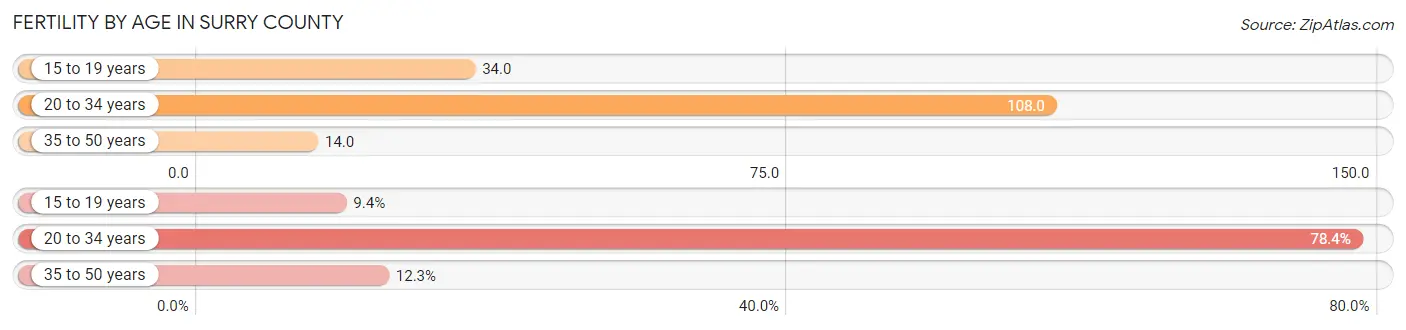
Fertility by Age in Surry County
Average fertility rate in Surry County is 54.0 births per 1,000 women. Women in the age bracket of 20 to 34 years have the highest fertility rate with 108.0 births per 1,000 women. Women in the age bracket of 20 to 34 years acount for 78.3% of all women with births.
| Age Bracket | Women with Births | Births / 1,000 Women |
| 15 to 19 years | 75 (9.4%) | 34.0 |
| 20 to 34 years | 626 (78.3%) | 108.0 |
| 35 to 50 years | 98 (12.3%) | 14.0 |
| Total | 799 (100.0%) | 54.0 |
Fertility by Age by Marriage Status in Surry County
62.2% of women with births (799) in Surry County are married. The highest percentage of unmarried women with births falls into 15 to 19 years age bracket with 69.3% of them unmarried at the time of birth, while the lowest percentage of unmarried women with births belong to 20 to 34 years age bracket with 33.6% of them unmarried.
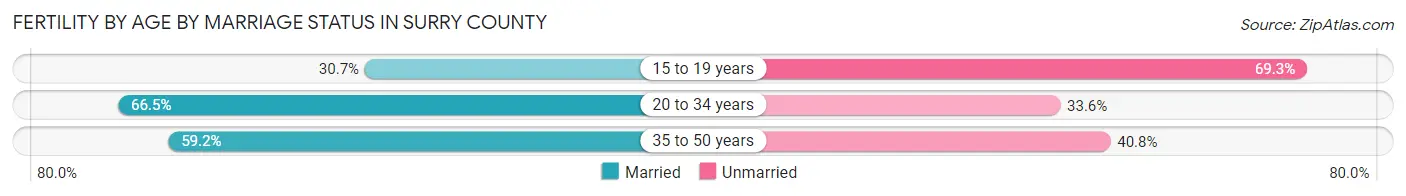
| Age Bracket | Married | Unmarried |
| 15 to 19 years | 23 (30.7%) | 52 (69.3%) |
| 20 to 34 years | 416 (66.4%) | 210 (33.6%) |
| 35 to 50 years | 58 (59.2%) | 40 (40.8%) |
| Total | 497 (62.2%) | 302 (37.8%) |
Fertility by Education in Surry County
Average fertility rate in Surry County is 54.0 births per 1,000 women. Women with the education attainment of college or associate's degree have the highest fertility rate of 74.0 births per 1,000 women, while women with the education attainment of less than high school have the lowest fertility at 11.0 births per 1,000 women. Women with the education attainment of college or associate's degree represent 52.7% of all women with births.
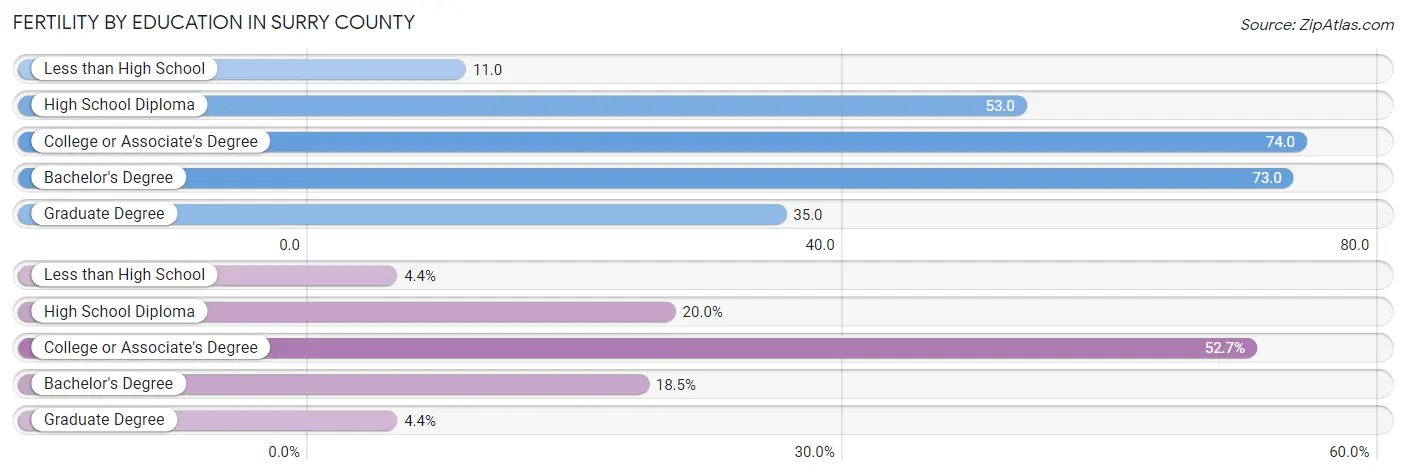
| Educational Attainment | Women with Births | Births / 1,000 Women |
| Less than High School | 35 (4.4%) | 11.0 |
| High School Diploma | 160 (20.0%) | 53.0 |
| College or Associate's Degree | 421 (52.7%) | 74.0 |
| Bachelor's Degree | 148 (18.5%) | 73.0 |
| Graduate Degree | 35 (4.4%) | 35.0 |
| Total | 799 (100.0%) | 54.0 |
Fertility by Education by Marriage Status in Surry County
37.8% of women with births in Surry County are unmarried. Women with the educational attainment of graduate degree are most likely to be married with 100.0% of them married at childbirth, while women with the educational attainment of less than high school are least likely to be married with 94.3% of them unmarried at childbirth.
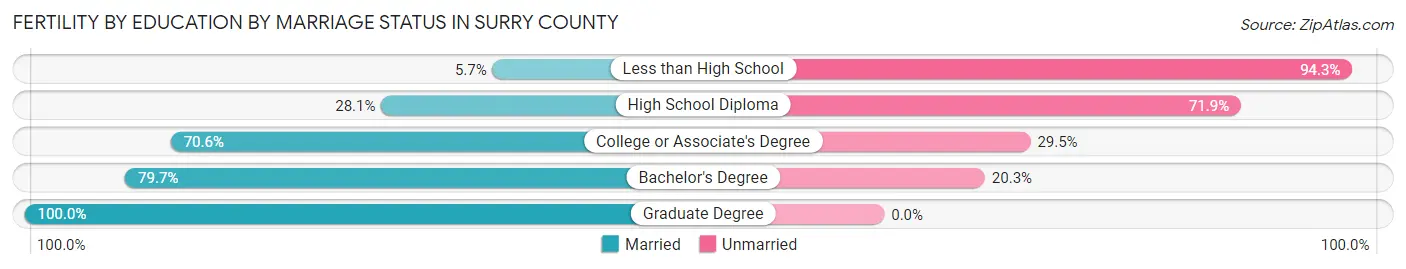
| Educational Attainment | Married | Unmarried |
| Less than High School | 2 (5.7%) | 33 (94.3%) |
| High School Diploma | 45 (28.1%) | 115 (71.9%) |
| College or Associate's Degree | 297 (70.6%) | 124 (29.4%) |
| Bachelor's Degree | 118 (79.7%) | 30 (20.3%) |
| Graduate Degree | 35 (100.0%) | 0 (0.0%) |
| Total | 497 (62.2%) | 302 (37.8%) |
Income in Surry County
Income Overview in Surry County
Per Capita Income in Surry County is $30,274, while median incomes of families and households are $71,903 and $52,743 respectively.
| Characteristic | Number | Measure |
| Per Capita Income | 71,429 | $30,274 |
| Median Family Income | 19,281 | $71,903 |
| Mean Family Income | 19,281 | $88,098 |
| Median Household Income | 28,990 | $52,743 |
| Mean Household Income | 28,990 | $72,597 |
| Income Deficit | 19,281 | $8,918 |
| Wage / Income Gap (%) | 71,429 | 30.23% |
| Wage / Income Gap ($) | 71,429 | 69.77¢ per $1 |
| Gini / Inequality Index | 71,429 | 0.48 |
Earnings by Sex in Surry County
Average Earnings in Surry County are $34,851, $40,384 for men and $28,176 for women, a difference of 30.2%.
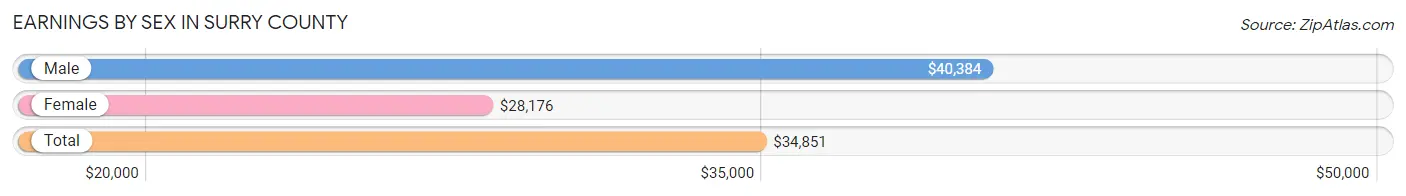
| Sex | Number | Average Earnings |
| Male | 18,386 (53.4%) | $40,384 |
| Female | 16,067 (46.6%) | $28,176 |
| Total | 34,453 (100.0%) | $34,851 |
Earnings by Sex by Income Bracket in Surry County
The most common earnings brackets in Surry County are $75,000 to $99,999 for men (1,579 | 8.6%) and $25,000 to $29,999 for women (1,739 | 10.8%).
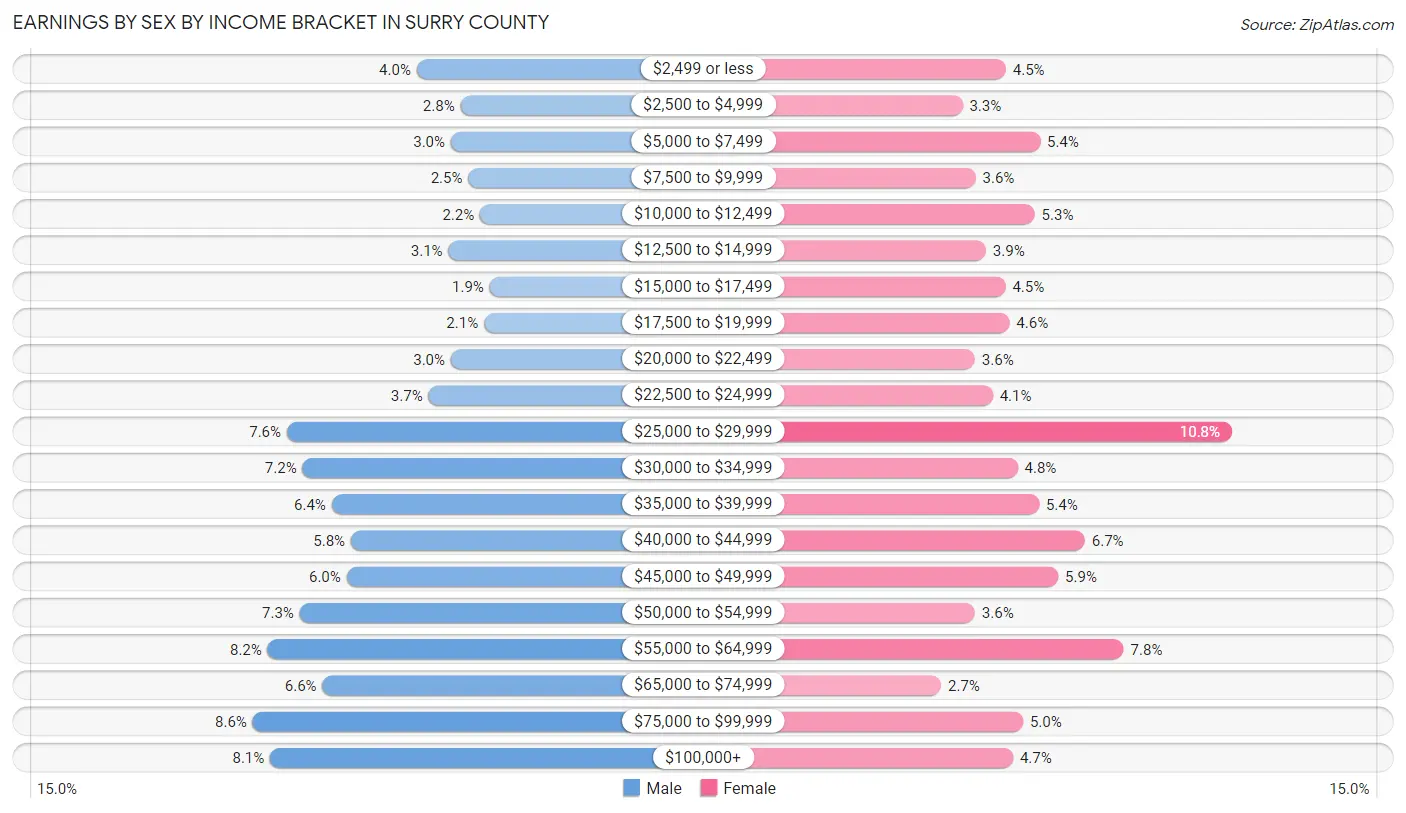
| Income | Male | Female |
| $2,499 or less | 731 (4.0%) | 718 (4.5%) |
| $2,500 to $4,999 | 506 (2.8%) | 522 (3.3%) |
| $5,000 to $7,499 | 556 (3.0%) | 873 (5.4%) |
| $7,500 to $9,999 | 465 (2.5%) | 581 (3.6%) |
| $10,000 to $12,499 | 404 (2.2%) | 849 (5.3%) |
| $12,500 to $14,999 | 569 (3.1%) | 629 (3.9%) |
| $15,000 to $17,499 | 355 (1.9%) | 716 (4.5%) |
| $17,500 to $19,999 | 385 (2.1%) | 735 (4.6%) |
| $20,000 to $22,499 | 556 (3.0%) | 578 (3.6%) |
| $22,500 to $24,999 | 671 (3.6%) | 659 (4.1%) |
| $25,000 to $29,999 | 1,403 (7.6%) | 1,739 (10.8%) |
| $30,000 to $34,999 | 1,322 (7.2%) | 771 (4.8%) |
| $35,000 to $39,999 | 1,172 (6.4%) | 868 (5.4%) |
| $40,000 to $44,999 | 1,071 (5.8%) | 1,075 (6.7%) |
| $45,000 to $49,999 | 1,094 (5.9%) | 955 (5.9%) |
| $50,000 to $54,999 | 1,336 (7.3%) | 578 (3.6%) |
| $55,000 to $64,999 | 1,503 (8.2%) | 1,250 (7.8%) |
| $65,000 to $74,999 | 1,219 (6.6%) | 425 (2.6%) |
| $75,000 to $99,999 | 1,579 (8.6%) | 796 (5.0%) |
| $100,000+ | 1,489 (8.1%) | 750 (4.7%) |
| Total | 18,386 (100.0%) | 16,067 (100.0%) |
Earnings by Sex by Educational Attainment in Surry County
Average earnings in Surry County are $44,887 for men and $31,488 for women, a difference of 29.8%. Men with an educational attainment of graduate degree enjoy the highest average annual earnings of $59,583, while those with high school diploma education earn the least with $37,540. Women with an educational attainment of graduate degree earn the most with the average annual earnings of $57,793, while those with less than high school education have the smallest earnings of $20,908.
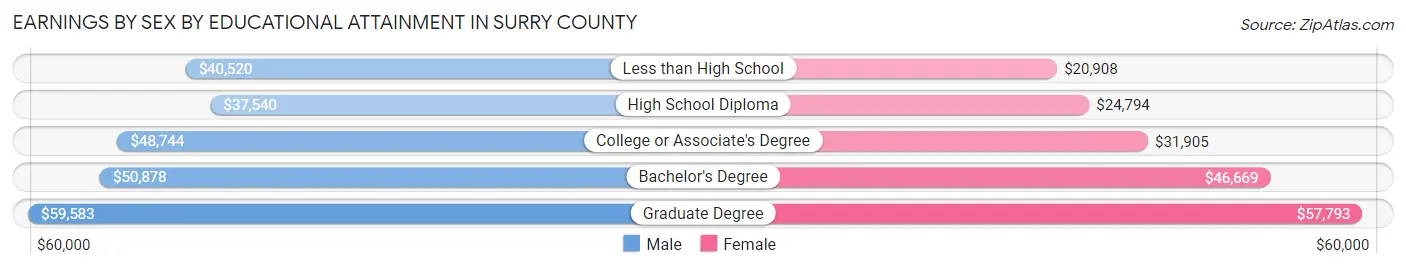
| Educational Attainment | Male Income | Female Income |
| Less than High School | $40,520 | $20,908 |
| High School Diploma | $37,540 | $24,794 |
| College or Associate's Degree | $48,744 | $31,905 |
| Bachelor's Degree | $50,878 | $46,669 |
| Graduate Degree | $59,583 | $57,793 |
| Total | $44,887 | $31,488 |
Family Income in Surry County
Family Income Brackets in Surry County
According to the Surry County family income data, there are 3,818 families falling into the $100,000 to $149,999 income range, which is the most common income bracket and makes up 19.8% of all families. Conversely, the $10,000 to $14,999 income bracket is the least frequent group with only 578 families (3.0%) belonging to this category.
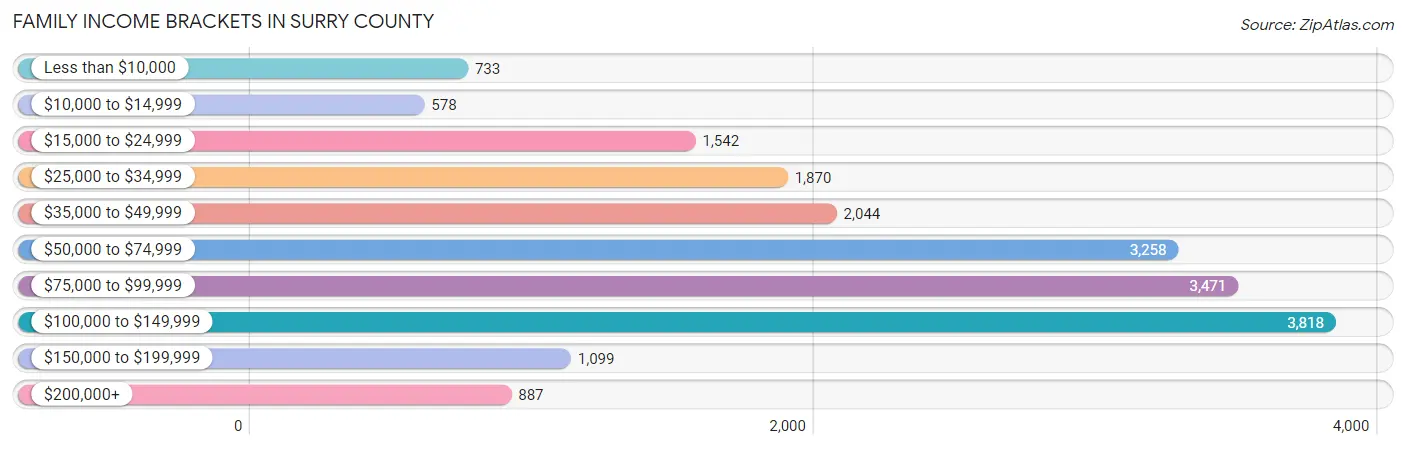
| Income Bracket | # Families | % Families |
| Less than $10,000 | 733 | 3.8% |
| $10,000 to $14,999 | 578 | 3.0% |
| $15,000 to $24,999 | 1,542 | 8.0% |
| $25,000 to $34,999 | 1,870 | 9.7% |
| $35,000 to $49,999 | 2,044 | 10.6% |
| $50,000 to $74,999 | 3,258 | 16.9% |
| $75,000 to $99,999 | 3,471 | 18.0% |
| $100,000 to $149,999 | 3,818 | 19.8% |
| $150,000 to $199,999 | 1,099 | 5.7% |
| $200,000+ | 887 | 4.6% |
Family Income by Famaliy Size in Surry County
7+ person families (264 | 1.4%) account for the highest median family income in Surry County with $97,589 per family, while 2-person families (10,211 | 53.0%) have the highest median income of $30,990 per family member.
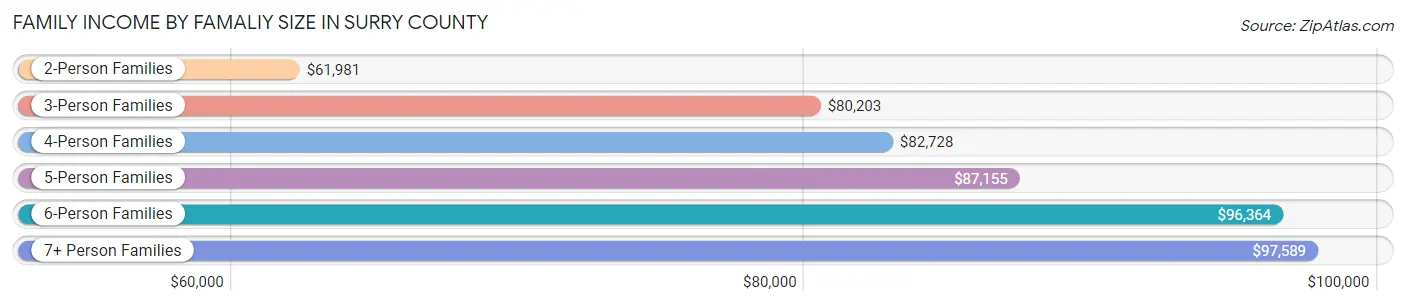
| Income Bracket | # Families | Median Income |
| 2-Person Families | 10,211 (53.0%) | $61,981 |
| 3-Person Families | 4,051 (21.0%) | $80,203 |
| 4-Person Families | 2,977 (15.4%) | $82,728 |
| 5-Person Families | 1,292 (6.7%) | $87,155 |
| 6-Person Families | 486 (2.5%) | $96,364 |
| 7+ Person Families | 264 (1.4%) | $97,589 |
| Total | 19,281 (100.0%) | $71,903 |
Family Income by Number of Earners in Surry County
The median family income in Surry County is $71,903, with families comprising 3+ earners (1,947) having the highest median family income of $120,057, while families with no earners (4,217) have the lowest median family income of $31,299, accounting for 10.1% and 21.9% of families, respectively.
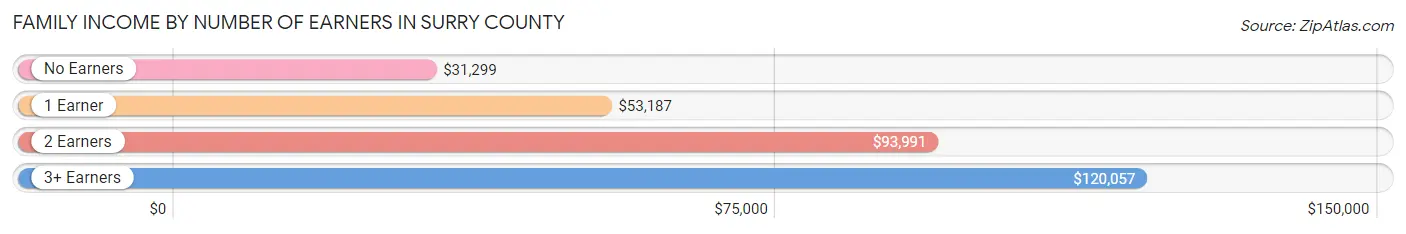
| Number of Earners | # Families | Median Income |
| No Earners | 4,217 (21.9%) | $31,299 |
| 1 Earner | 5,772 (29.9%) | $53,187 |
| 2 Earners | 7,345 (38.1%) | $93,991 |
| 3+ Earners | 1,947 (10.1%) | $120,057 |
| Total | 19,281 (100.0%) | $71,903 |
Household Income in Surry County
Household Income Brackets in Surry County
With 4,348 households falling in the category, the $100,000 to $149,999 income range is the most frequent in Surry County, accounting for 15.0% of all households. In contrast, only 986 households (3.4%) fall into the $200,000+ income bracket, making it the least populous group.
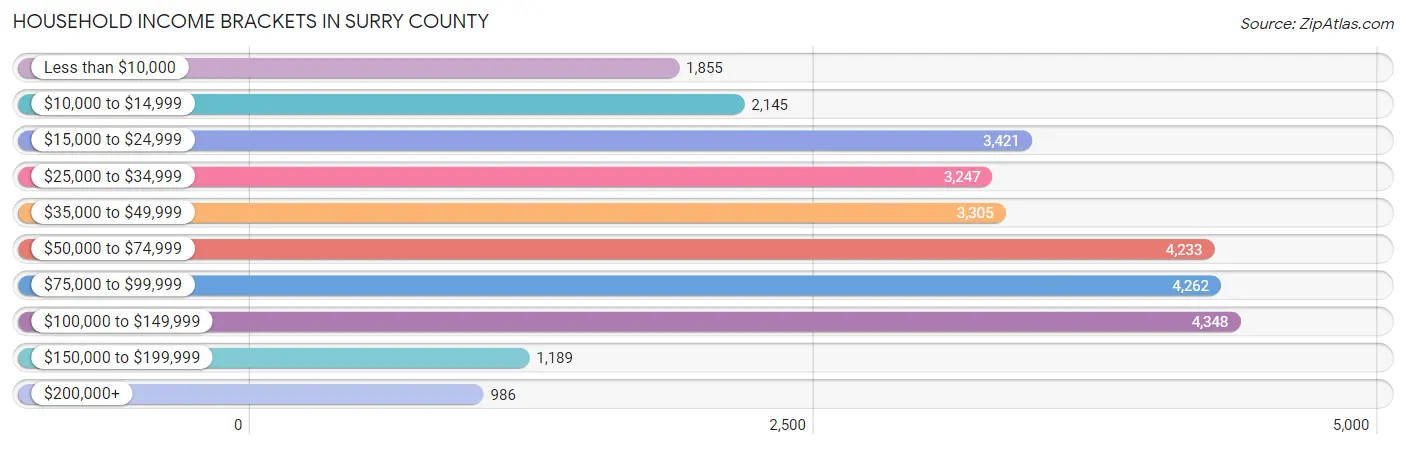
| Income Bracket | # Households | % Households |
| Less than $10,000 | 1,855 | 6.4% |
| $10,000 to $14,999 | 2,145 | 7.4% |
| $15,000 to $24,999 | 3,421 | 11.8% |
| $25,000 to $34,999 | 3,247 | 11.2% |
| $35,000 to $49,999 | 3,305 | 11.4% |
| $50,000 to $74,999 | 4,233 | 14.6% |
| $75,000 to $99,999 | 4,262 | 14.7% |
| $100,000 to $149,999 | 4,348 | 15.0% |
| $150,000 to $199,999 | 1,189 | 4.1% |
| $200,000+ | 986 | 3.4% |
Household Income by Householder Age in Surry County
The median household income in Surry County is $52,743, with the highest median household income of $63,708 found in the 45 to 64 years age bracket for the primary householder. A total of 11,394 households (39.3%) fall into this category. Meanwhile, the 65+ years age bracket for the primary householder has the lowest median household income of $35,723, with 9,411 households (32.5%) in this group.
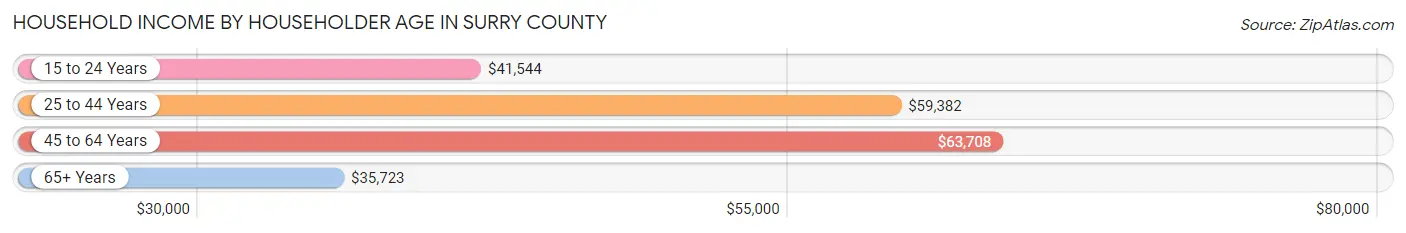
| Income Bracket | # Households | Median Income |
| 15 to 24 Years | 967 (3.3%) | $41,544 |
| 25 to 44 Years | 7,218 (24.9%) | $59,382 |
| 45 to 64 Years | 11,394 (39.3%) | $63,708 |
| 65+ Years | 9,411 (32.5%) | $35,723 |
| Total | 28,990 (100.0%) | $52,743 |
Poverty in Surry County
Income Below Poverty by Sex and Age in Surry County
With 16.6% poverty level for males and 19.2% for females among the residents of Surry County, 5 year old males and 5 year old females are the most vulnerable to poverty, with 109 males (33.2%) and 127 females (32.9%) in their respective age groups living below the poverty level.
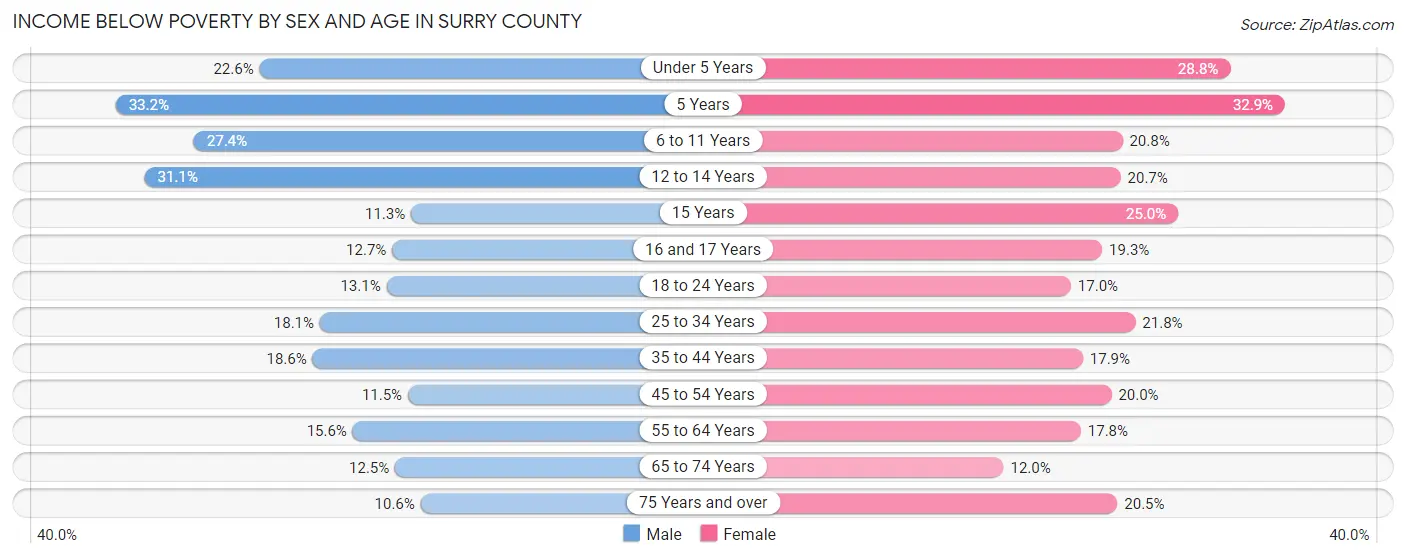
| Age Bracket | Male | Female |
| Under 5 Years | 368 (22.6%) | 565 (28.8%) |
| 5 Years | 109 (33.2%) | 127 (32.9%) |
| 6 to 11 Years | 663 (27.4%) | 556 (20.8%) |
| 12 to 14 Years | 458 (31.1%) | 214 (20.7%) |
| 15 Years | 56 (11.3%) | 155 (25.0%) |
| 16 and 17 Years | 119 (12.7%) | 150 (19.3%) |
| 18 to 24 Years | 383 (13.1%) | 478 (17.0%) |
| 25 to 34 Years | 727 (18.1%) | 825 (21.8%) |
| 35 to 44 Years | 721 (18.6%) | 739 (17.9%) |
| 45 to 54 Years | 554 (11.5%) | 973 (20.0%) |
| 55 to 64 Years | 791 (15.6%) | 910 (17.7%) |
| 65 to 74 Years | 503 (12.5%) | 526 (12.0%) |
| 75 Years and over | 258 (10.6%) | 687 (20.5%) |
| Total | 5,710 (16.6%) | 6,905 (19.2%) |
Income Above Poverty by Sex and Age in Surry County
According to the poverty statistics in Surry County, males aged 75 years and over and females aged 65 to 74 years are the age groups that are most secure financially, with 89.4% of males and 88.0% of females in these age groups living above the poverty line.
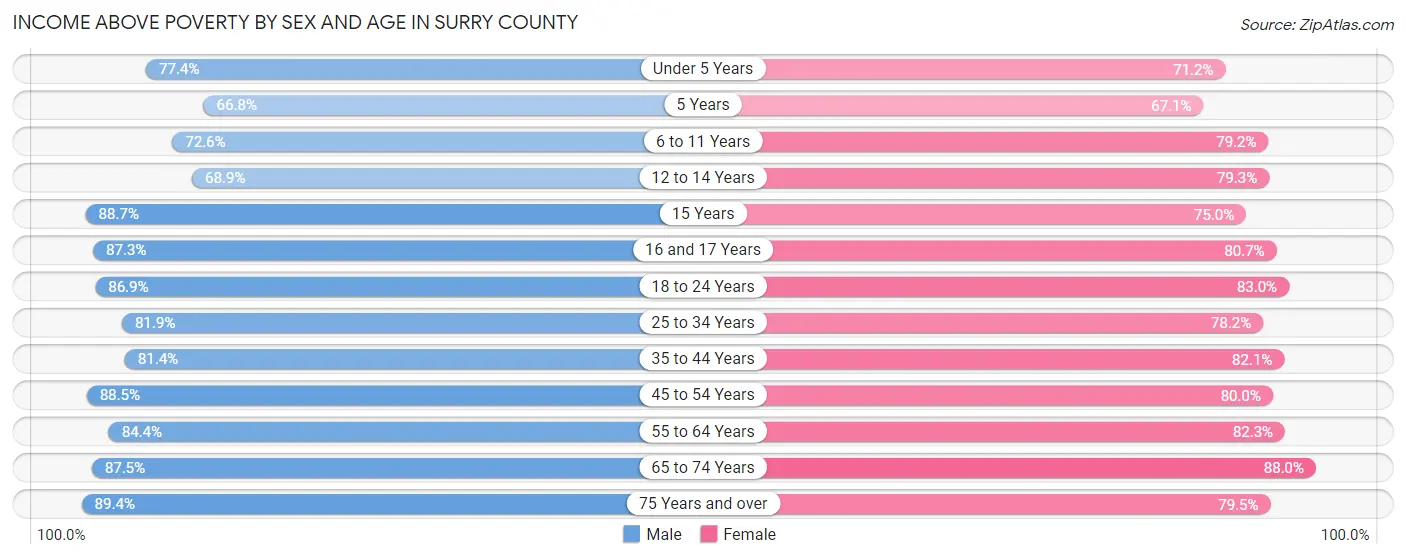
| Age Bracket | Male | Female |
| Under 5 Years | 1,263 (77.4%) | 1,395 (71.2%) |
| 5 Years | 219 (66.8%) | 259 (67.1%) |
| 6 to 11 Years | 1,754 (72.6%) | 2,112 (79.2%) |
| 12 to 14 Years | 1,015 (68.9%) | 820 (79.3%) |
| 15 Years | 439 (88.7%) | 466 (75.0%) |
| 16 and 17 Years | 817 (87.3%) | 626 (80.7%) |
| 18 to 24 Years | 2,533 (86.9%) | 2,332 (83.0%) |
| 25 to 34 Years | 3,295 (81.9%) | 2,959 (78.2%) |
| 35 to 44 Years | 3,151 (81.4%) | 3,390 (82.1%) |
| 45 to 54 Years | 4,248 (88.5%) | 3,886 (80.0%) |
| 55 to 64 Years | 4,267 (84.4%) | 4,216 (82.3%) |
| 65 to 74 Years | 3,523 (87.5%) | 3,855 (88.0%) |
| 75 Years and over | 2,177 (89.4%) | 2,670 (79.5%) |
| Total | 28,701 (83.4%) | 28,986 (80.8%) |
Income Below Poverty Among Married-Couple Families in Surry County
The poverty statistics for married-couple families in Surry County show that 7.7% or 1,116 of the total 14,541 families live below the poverty line. Families with 5 or more children have the highest poverty rate of 79.4%, comprising of 27 families. On the other hand, families with 1 or 2 children have the lowest poverty rate of 5.1%, which includes 198 families.
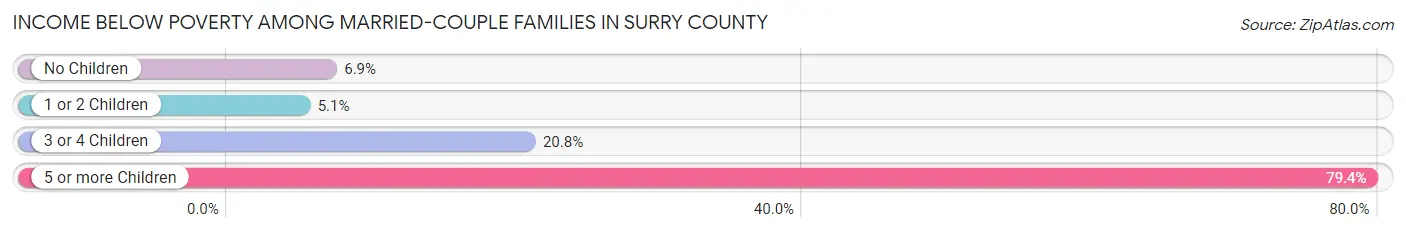
| Children | Above Poverty | Below Poverty |
| No Children | 8,795 (93.1%) | 653 (6.9%) |
| 1 or 2 Children | 3,714 (94.9%) | 198 (5.1%) |
| 3 or 4 Children | 909 (79.2%) | 238 (20.7%) |
| 5 or more Children | 7 (20.6%) | 27 (79.4%) |
| Total | 13,425 (92.3%) | 1,116 (7.7%) |
Income Below Poverty Among Single-Parent Households in Surry County
According to the poverty data in Surry County, 25.7% or 396 single-father households and 34.6% or 1,107 single-mother households are living below the poverty line. Among single-father households, those with 1 or 2 children have the highest poverty rate, with 256 households (32.9%) experiencing poverty. Likewise, among single-mother households, those with 5 or more children have the highest poverty rate, with 2 households (100.0%) falling below the poverty line.
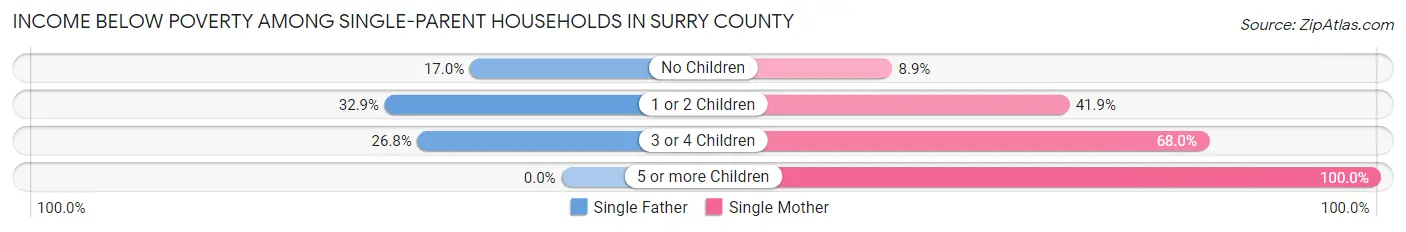
| Children | Single Father | Single Mother |
| No Children | 114 (17.0%) | 83 (8.9%) |
| 1 or 2 Children | 256 (32.9%) | 833 (41.9%) |
| 3 or 4 Children | 26 (26.8%) | 189 (68.0%) |
| 5 or more Children | 0 (0.0%) | 2 (100.0%) |
| Total | 396 (25.7%) | 1,107 (34.6%) |
Income Below Poverty Among Married-Couple vs Single-Parent Households in Surry County
The poverty data for Surry County shows that 1,116 of the married-couple family households (7.7%) and 1,503 of the single-parent households (31.7%) are living below the poverty level. Within the married-couple family households, those with 5 or more children have the highest poverty rate, with 27 households (79.4%) falling below the poverty line. Among the single-parent households, those with 5 or more children have the highest poverty rate, with 2 household (100.0%) living below poverty.
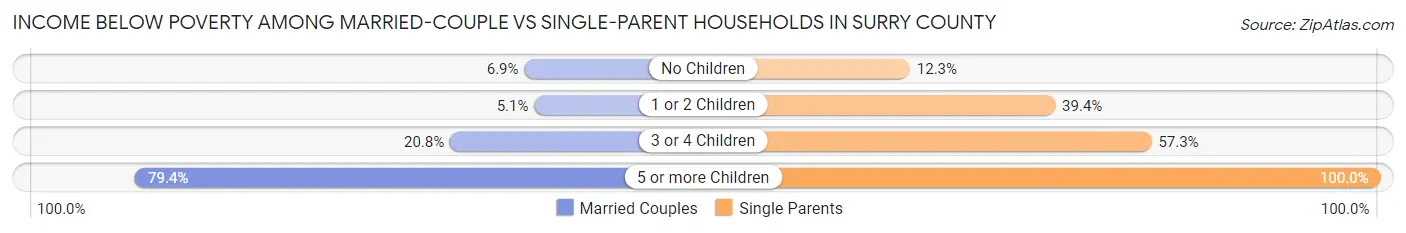
| Children | Married-Couple Families | Single-Parent Households |
| No Children | 653 (6.9%) | 197 (12.3%) |
| 1 or 2 Children | 198 (5.1%) | 1,089 (39.4%) |
| 3 or 4 Children | 238 (20.7%) | 215 (57.3%) |
| 5 or more Children | 27 (79.4%) | 2 (100.0%) |
| Total | 1,116 (7.7%) | 1,503 (31.7%) |
Employment Characteristics in Surry County
Employment by Class of Employer in Surry County
Among the 31,099 employed individuals in Surry County, private company employees (22,473 | 72.3%), local government employees (2,392 | 7.7%), and self-employed (not incorporated) (1,829 | 5.9%) make up the most common classes of employment.
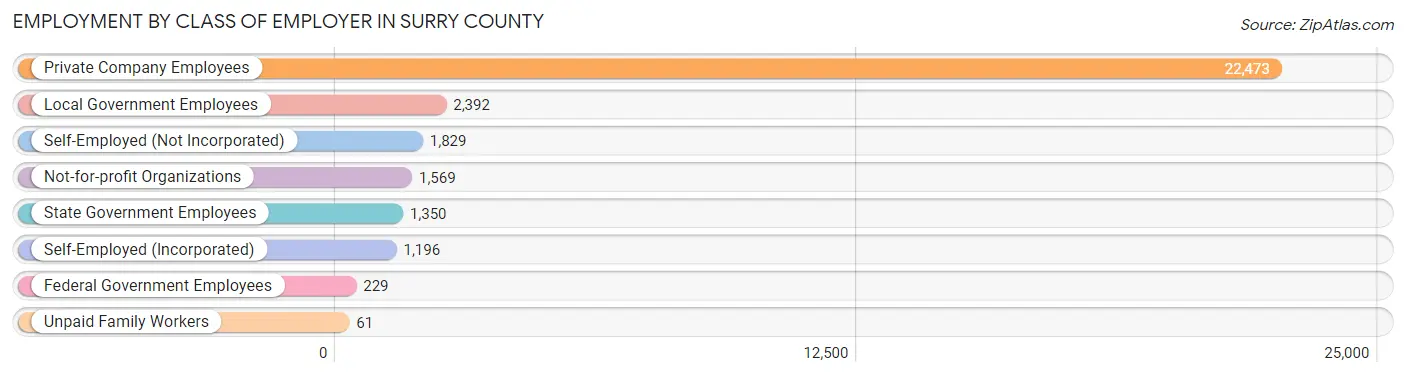
| Employer Class | # Employees | % Employees |
| Private Company Employees | 22,473 | 72.3% |
| Self-Employed (Incorporated) | 1,196 | 3.8% |
| Self-Employed (Not Incorporated) | 1,829 | 5.9% |
| Not-for-profit Organizations | 1,569 | 5.1% |
| Local Government Employees | 2,392 | 7.7% |
| State Government Employees | 1,350 | 4.3% |
| Federal Government Employees | 229 | 0.7% |
| Unpaid Family Workers | 61 | 0.2% |
| Total | 31,099 | 100.0% |
Employment Status by Age in Surry County
According to the labor force statistics for Surry County, out of the total population over 16 years of age (58,168), 57.5% or 33,447 individuals are in the labor force, with 4.9% or 1,639 of them unemployed. The age group with the highest labor force participation rate is 30 to 34 years, with 84.4% or 3,129 individuals in the labor force. Within the labor force, the 16 to 19 years age range has the highest percentage of unemployed individuals, with 17.3% or 262 of them being unemployed.
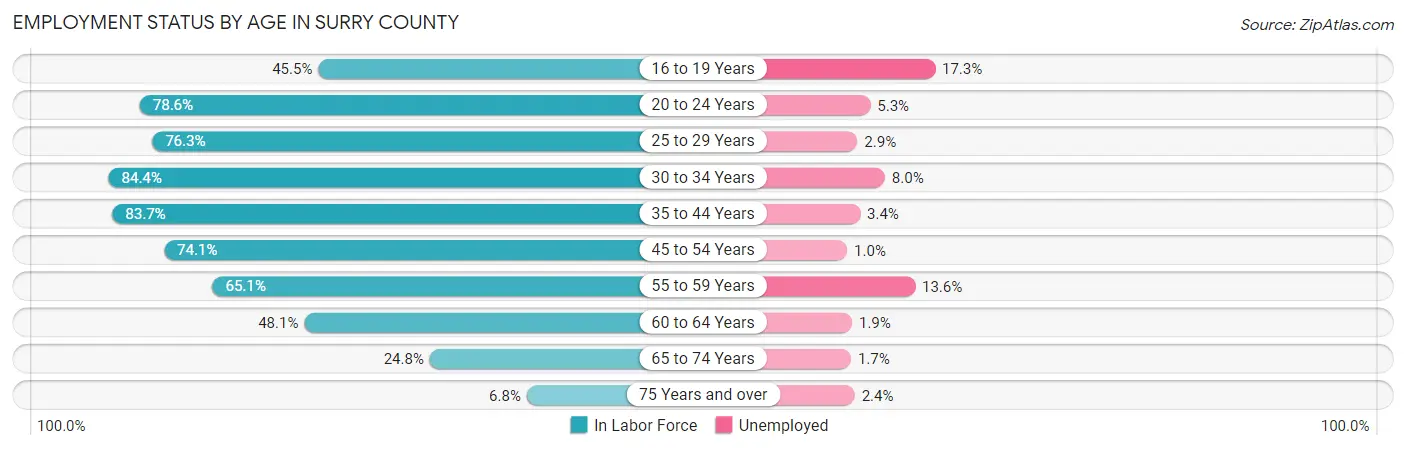
| Age Bracket | In Labor Force | Unemployed |
| 16 to 19 Years | 1,517 (45.5%) | 262 (17.3%) |
| 20 to 24 Years | 3,299 (78.6%) | 175 (5.3%) |
| 25 to 29 Years | 3,205 (76.3%) | 93 (2.9%) |
| 30 to 34 Years | 3,129 (84.4%) | 250 (8.0%) |
| 35 to 44 Years | 6,753 (83.7%) | 230 (3.4%) |
| 45 to 54 Years | 7,197 (74.1%) | 72 (1.0%) |
| 55 to 59 Years | 3,274 (65.1%) | 445 (13.6%) |
| 60 to 64 Years | 2,511 (48.1%) | 48 (1.9%) |
| 65 to 74 Years | 2,111 (24.8%) | 36 (1.7%) |
| 75 Years and over | 421 (6.8%) | 10 (2.4%) |
| Total | 33,447 (57.5%) | 1,639 (4.9%) |
Employment Status by Educational Attainment in Surry County
According to labor force statistics for Surry County, 72.5% of individuals (26,054) out of the total population between 25 and 64 years of age (35,937) are in the labor force, with 4.4% or 1,146 of them being unemployed. The group with the highest labor force participation rate are those with the educational attainment of bachelor's degree or higher, with 85.8% or 6,112 individuals in the labor force. Within the labor force, individuals with less than high school education have the highest percentage of unemployment, with 11.6% or 344 of them being unemployed.
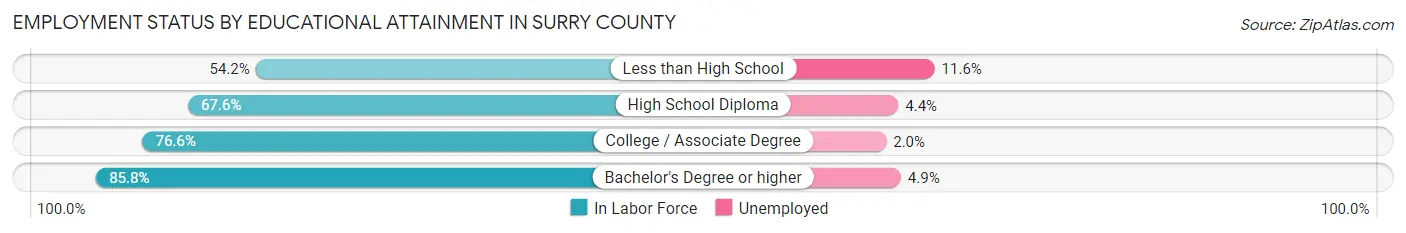
| Educational Attainment | In Labor Force | Unemployed |
| Less than High School | 2,962 (54.2%) | 634 (11.6%) |
| High School Diploma | 6,703 (67.6%) | 436 (4.4%) |
| College / Associate Degree | 10,290 (76.6%) | 269 (2.0%) |
| Bachelor's Degree or higher | 6,112 (85.8%) | 349 (4.9%) |
| Total | 26,054 (72.5%) | 1,581 (4.4%) |
Employment Occupations by Sex in Surry County
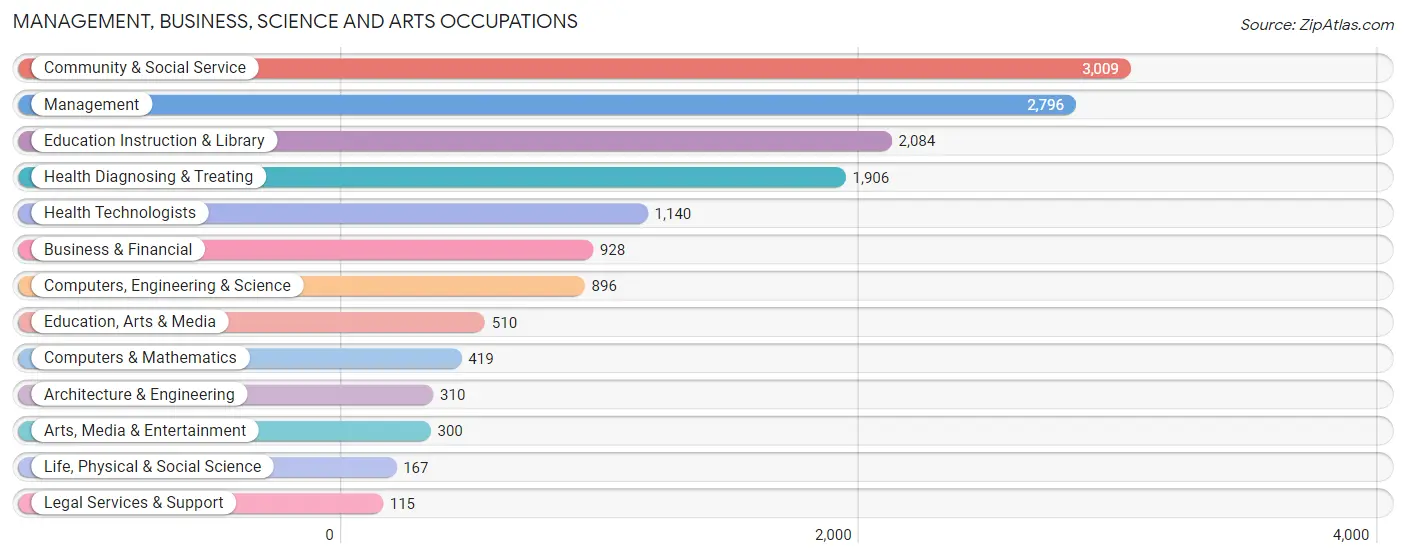
Management, Business, Science and Arts Occupations
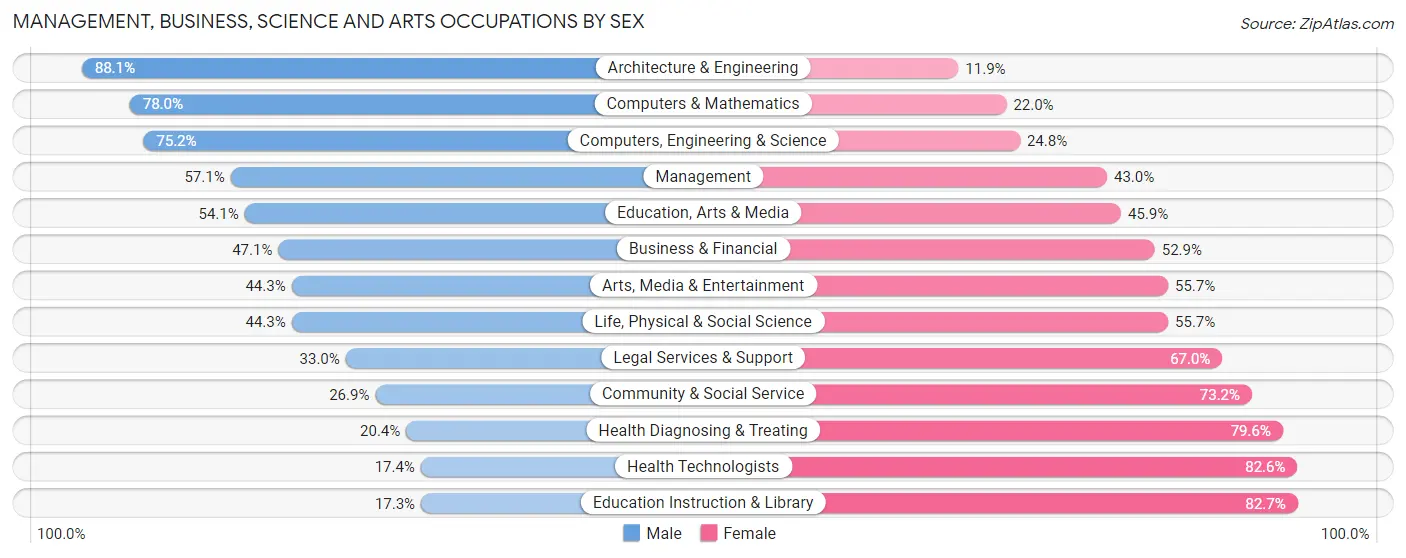
The most common Management, Business, Science and Arts occupations in Surry County are Community & Social Service (3,009 | 9.5%), Management (2,796 | 8.8%), Education Instruction & Library (2,084 | 6.6%), Health Diagnosing & Treating (1,906 | 6.0%), and Health Technologists (1,140 | 3.6%).
Management, Business, Science and Arts Occupations by Sex
Within the Management, Business, Science and Arts occupations in Surry County, the most male-oriented occupations are Architecture & Engineering (88.1%), Computers & Mathematics (78.0%), and Computers, Engineering & Science (75.2%), while the most female-oriented occupations are Education Instruction & Library (82.7%), Health Technologists (82.6%), and Health Diagnosing & Treating (79.6%).
| Occupation | Male | Female |
| Management | 1,595 (57.1%) | 1,201 (42.9%) |
| Business & Financial | 437 (47.1%) | 491 (52.9%) |
| Computers, Engineering & Science | 674 (75.2%) | 222 (24.8%) |
| Computers & Mathematics | 327 (78.0%) | 92 (22.0%) |
| Architecture & Engineering | 273 (88.1%) | 37 (11.9%) |
| Life, Physical & Social Science | 74 (44.3%) | 93 (55.7%) |
| Community & Social Service | 808 (26.9%) | 2,201 (73.2%) |
| Education, Arts & Media | 276 (54.1%) | 234 (45.9%) |
| Legal Services & Support | 38 (33.0%) | 77 (67.0%) |
| Education Instruction & Library | 361 (17.3%) | 1,723 (82.7%) |
| Arts, Media & Entertainment | 133 (44.3%) | 167 (55.7%) |
| Health Diagnosing & Treating | 389 (20.4%) | 1,517 (79.6%) |
| Health Technologists | 198 (17.4%) | 942 (82.6%) |
| Total (Category) | 3,903 (40.9%) | 5,632 (59.1%) |
| Total (Overall) | 17,097 (53.8%) | 14,671 (46.2%) |
Services Occupations
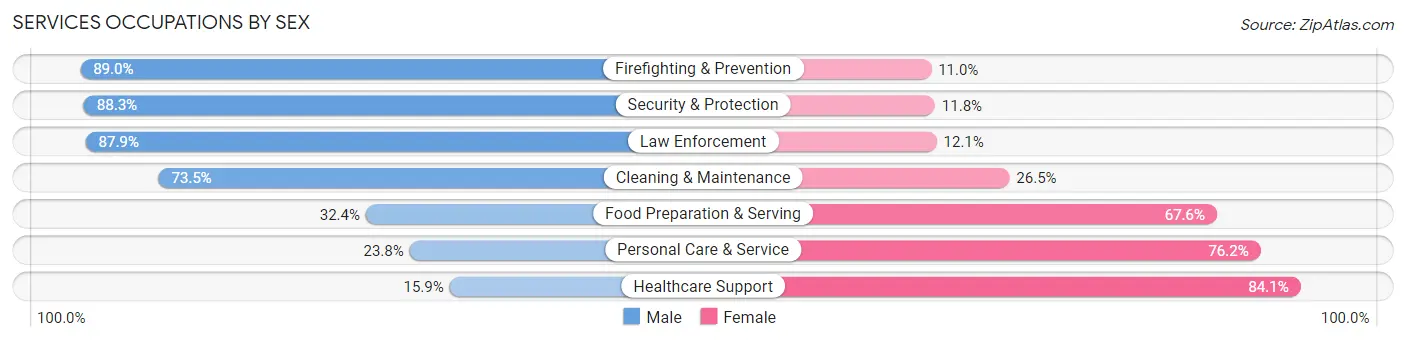
The most common Services occupations in Surry County are Food Preparation & Serving (1,597 | 5.0%), Cleaning & Maintenance (1,290 | 4.1%), Healthcare Support (1,261 | 4.0%), Personal Care & Service (593 | 1.9%), and Security & Protection (400 | 1.3%).

Services Occupations by Sex
Within the Services occupations in Surry County, the most male-oriented occupations are Firefighting & Prevention (89.0%), Security & Protection (88.2%), and Law Enforcement (87.9%), while the most female-oriented occupations are Healthcare Support (84.1%), Personal Care & Service (76.2%), and Food Preparation & Serving (67.6%).
| Occupation | Male | Female |
| Healthcare Support | 200 (15.9%) | 1,061 (84.1%) |
| Security & Protection | 353 (88.2%) | 47 (11.7%) |
| Firefighting & Prevention | 113 (89.0%) | 14 (11.0%) |
| Law Enforcement | 240 (87.9%) | 33 (12.1%) |
| Food Preparation & Serving | 518 (32.4%) | 1,079 (67.6%) |
| Cleaning & Maintenance | 948 (73.5%) | 342 (26.5%) |
| Personal Care & Service | 141 (23.8%) | 452 (76.2%) |
| Total (Category) | 2,160 (42.0%) | 2,981 (58.0%) |
| Total (Overall) | 17,097 (53.8%) | 14,671 (46.2%) |
Sales and Office Occupations
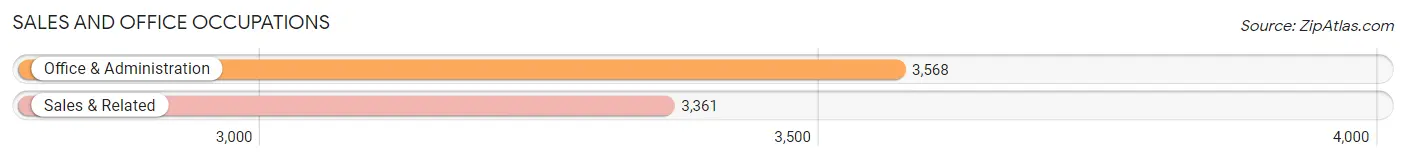
The most common Sales and Office occupations in Surry County are Office & Administration (3,568 | 11.2%), and Sales & Related (3,361 | 10.6%).
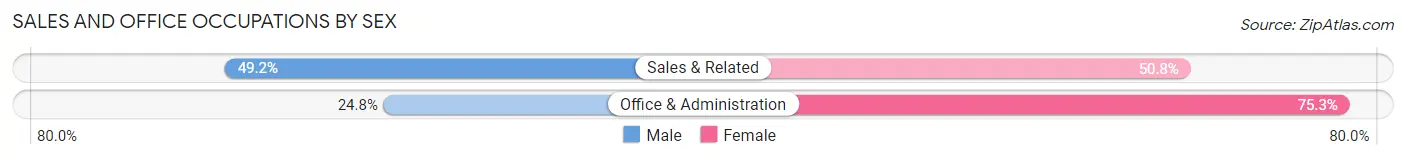
Sales and Office Occupations by Sex
| Occupation | Male | Female |
| Sales & Related | 1,654 (49.2%) | 1,707 (50.8%) |
| Office & Administration | 883 (24.7%) | 2,685 (75.2%) |
| Total (Category) | 2,537 (36.6%) | 4,392 (63.4%) |
| Total (Overall) | 17,097 (53.8%) | 14,671 (46.2%) |
Natural Resources, Construction and Maintenance Occupations
The most common Natural Resources, Construction and Maintenance occupations in Surry County are Construction & Extraction (2,014 | 6.3%), Installation, Maintenance & Repair (1,309 | 4.1%), and Farming, Fishing & Forestry (358 | 1.1%).
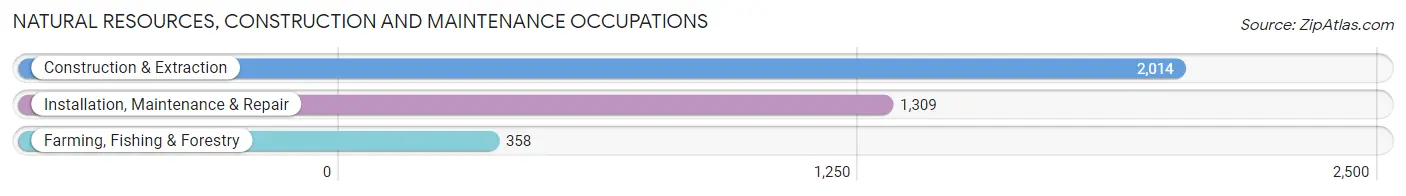
Natural Resources, Construction and Maintenance Occupations by Sex
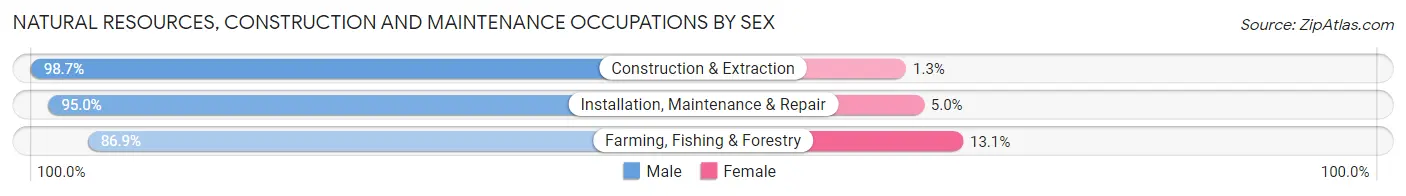
| Occupation | Male | Female |
| Farming, Fishing & Forestry | 311 (86.9%) | 47 (13.1%) |
| Construction & Extraction | 1,988 (98.7%) | 26 (1.3%) |
| Installation, Maintenance & Repair | 1,244 (95.0%) | 65 (5.0%) |
| Total (Category) | 3,543 (96.3%) | 138 (3.7%) |
| Total (Overall) | 17,097 (53.8%) | 14,671 (46.2%) |
Production, Transportation and Moving Occupations
The most common Production, Transportation and Moving occupations in Surry County are Production (3,531 | 11.1%), Material Moving (1,574 | 5.0%), and Transportation (1,377 | 4.3%).
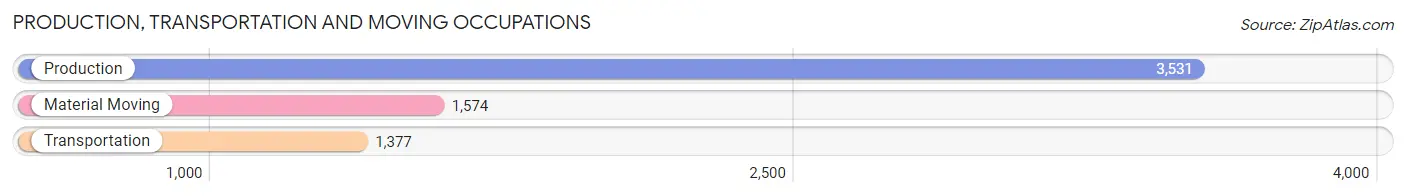
Production, Transportation and Moving Occupations by Sex
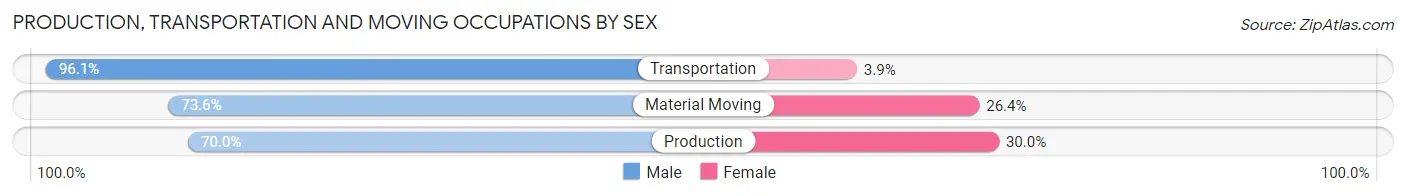
| Occupation | Male | Female |
| Production | 2,472 (70.0%) | 1,059 (30.0%) |
| Transportation | 1,323 (96.1%) | 54 (3.9%) |
| Material Moving | 1,159 (73.6%) | 415 (26.4%) |
| Total (Category) | 4,954 (76.4%) | 1,528 (23.6%) |
| Total (Overall) | 17,097 (53.8%) | 14,671 (46.2%) |
Employment Industries by Sex in Surry County
Employment Industries in Surry County
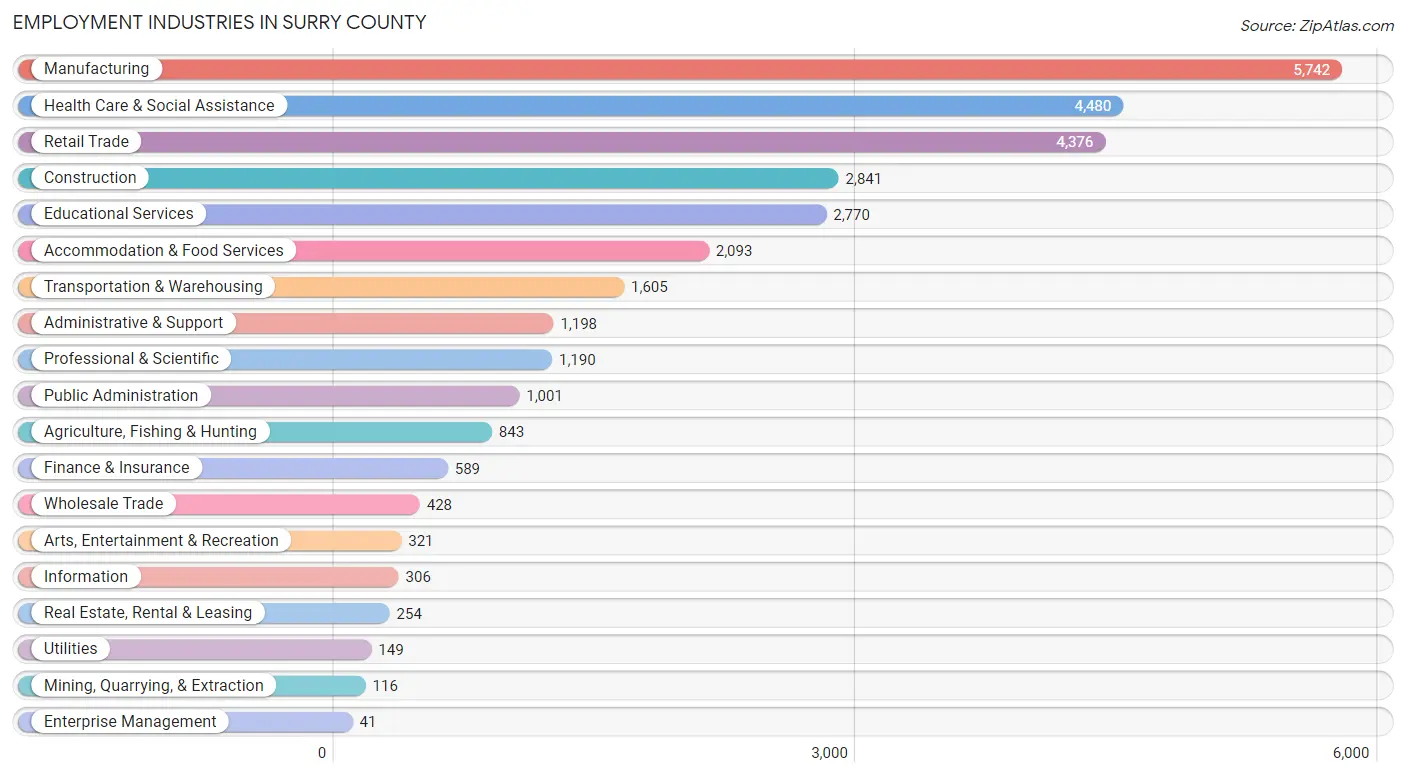
The major employment industries in Surry County include Manufacturing (5,742 | 18.1%), Health Care & Social Assistance (4,480 | 14.1%), Retail Trade (4,376 | 13.8%), Construction (2,841 | 8.9%), and Educational Services (2,770 | 8.7%).
Employment Industries by Sex in Surry County
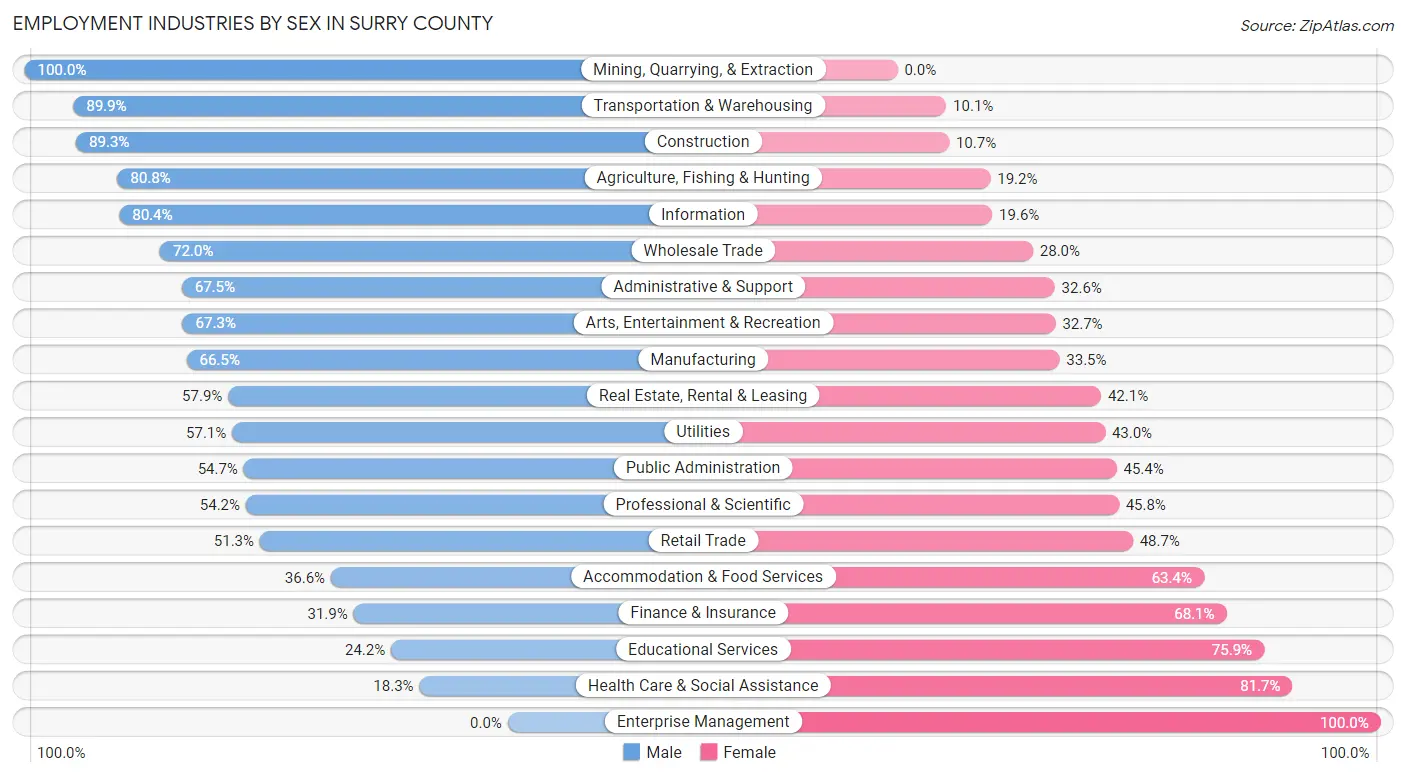
The Surry County industries that see more men than women are Mining, Quarrying, & Extraction (100.0%), Transportation & Warehousing (89.9%), and Construction (89.3%), whereas the industries that tend to have a higher number of women are Enterprise Management (100.0%), Health Care & Social Assistance (81.7%), and Educational Services (75.8%).
| Industry | Male | Female |
| Agriculture, Fishing & Hunting | 681 (80.8%) | 162 (19.2%) |
| Mining, Quarrying, & Extraction | 116 (100.0%) | 0 (0.0%) |
| Construction | 2,538 (89.3%) | 303 (10.7%) |
| Manufacturing | 3,817 (66.5%) | 1,925 (33.5%) |
| Wholesale Trade | 308 (72.0%) | 120 (28.0%) |
| Retail Trade | 2,245 (51.3%) | 2,131 (48.7%) |
| Transportation & Warehousing | 1,443 (89.9%) | 162 (10.1%) |
| Utilities | 85 (57.1%) | 64 (42.9%) |
| Information | 246 (80.4%) | 60 (19.6%) |
| Finance & Insurance | 188 (31.9%) | 401 (68.1%) |
| Real Estate, Rental & Leasing | 147 (57.9%) | 107 (42.1%) |
| Professional & Scientific | 645 (54.2%) | 545 (45.8%) |
| Enterprise Management | 0 (0.0%) | 41 (100.0%) |
| Administrative & Support | 808 (67.4%) | 390 (32.6%) |
| Educational Services | 669 (24.1%) | 2,101 (75.8%) |
| Health Care & Social Assistance | 819 (18.3%) | 3,661 (81.7%) |
| Arts, Entertainment & Recreation | 216 (67.3%) | 105 (32.7%) |
| Accommodation & Food Services | 766 (36.6%) | 1,327 (63.4%) |
| Public Administration | 547 (54.6%) | 454 (45.4%) |
| Total | 17,097 (53.8%) | 14,671 (46.2%) |
Education in Surry County
School Enrollment in Surry County
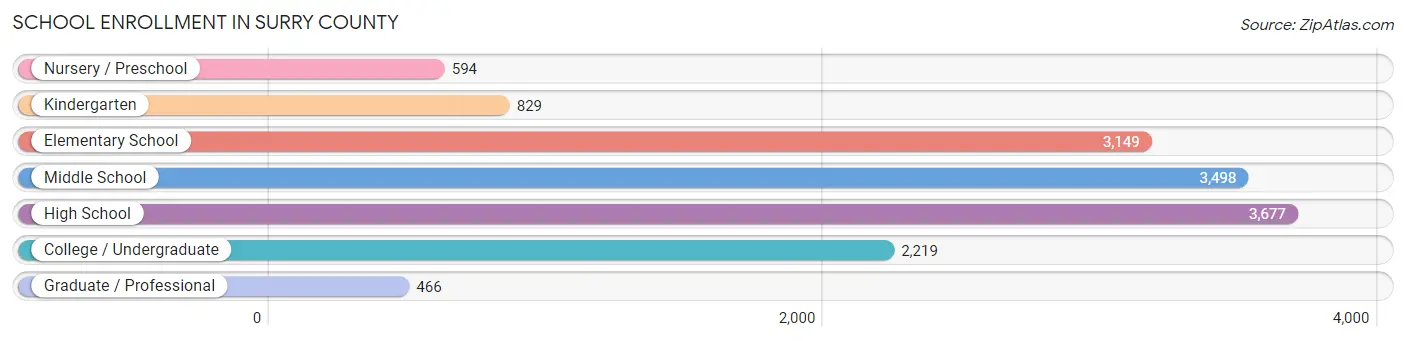
The most common levels of schooling among the 14,432 students in Surry County are high school (3,677 | 25.5%), middle school (3,498 | 24.2%), and elementary school (3,149 | 21.8%).
| School Level | # Students | % Students |
| Nursery / Preschool | 594 | 4.1% |
| Kindergarten | 829 | 5.7% |
| Elementary School | 3,149 | 21.8% |
| Middle School | 3,498 | 24.2% |
| High School | 3,677 | 25.5% |
| College / Undergraduate | 2,219 | 15.4% |
| Graduate / Professional | 466 | 3.2% |
| Total | 14,432 | 100.0% |
School Enrollment by Age by Funding Source in Surry County
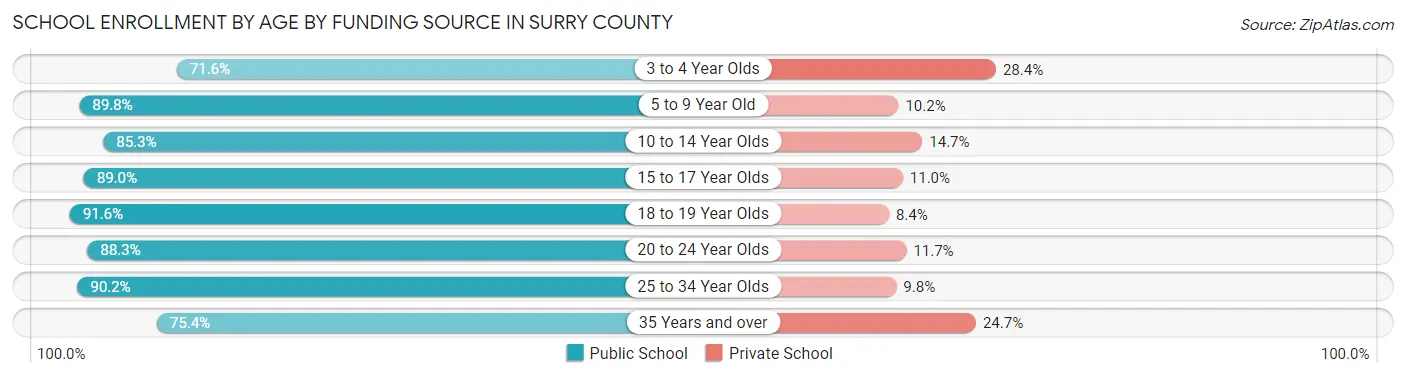
Out of a total of 14,432 students who are enrolled in schools in Surry County, 1,876 (13.0%) attend a private institution, while the remaining 12,556 (87.0%) are enrolled in public schools. The age group of 3 to 4 year olds has the highest likelihood of being enrolled in private schools, with 122 (28.4% in the age bracket) enrolled. Conversely, the age group of 18 to 19 year olds has the lowest likelihood of being enrolled in a private school, with 826 (91.6% in the age bracket) attending a public institution.
| Age Bracket | Public School | Private School |
| 3 to 4 Year Olds | 308 (71.6%) | 122 (28.4%) |
| 5 to 9 Year Old | 3,210 (89.8%) | 365 (10.2%) |
| 10 to 14 Year Olds | 3,766 (85.3%) | 647 (14.7%) |
| 15 to 17 Year Olds | 2,453 (89.0%) | 304 (11.0%) |
| 18 to 19 Year Olds | 826 (91.6%) | 76 (8.4%) |
| 20 to 24 Year Olds | 922 (88.3%) | 122 (11.7%) |
| 25 to 34 Year Olds | 542 (90.2%) | 59 (9.8%) |
| 35 Years and over | 535 (75.3%) | 175 (24.6%) |
| Total | 12,556 (87.0%) | 1,876 (13.0%) |
Educational Attainment by Field of Study in Surry County
Education (1,809 | 18.4%), business (1,694 | 17.3%), science & technology (1,369 | 14.0%), arts & humanities (622 | 6.3%), and bio, nature & agricultural (583 | 5.9%) are the most common fields of study among 9,810 individuals in Surry County who have obtained a bachelor's degree or higher.
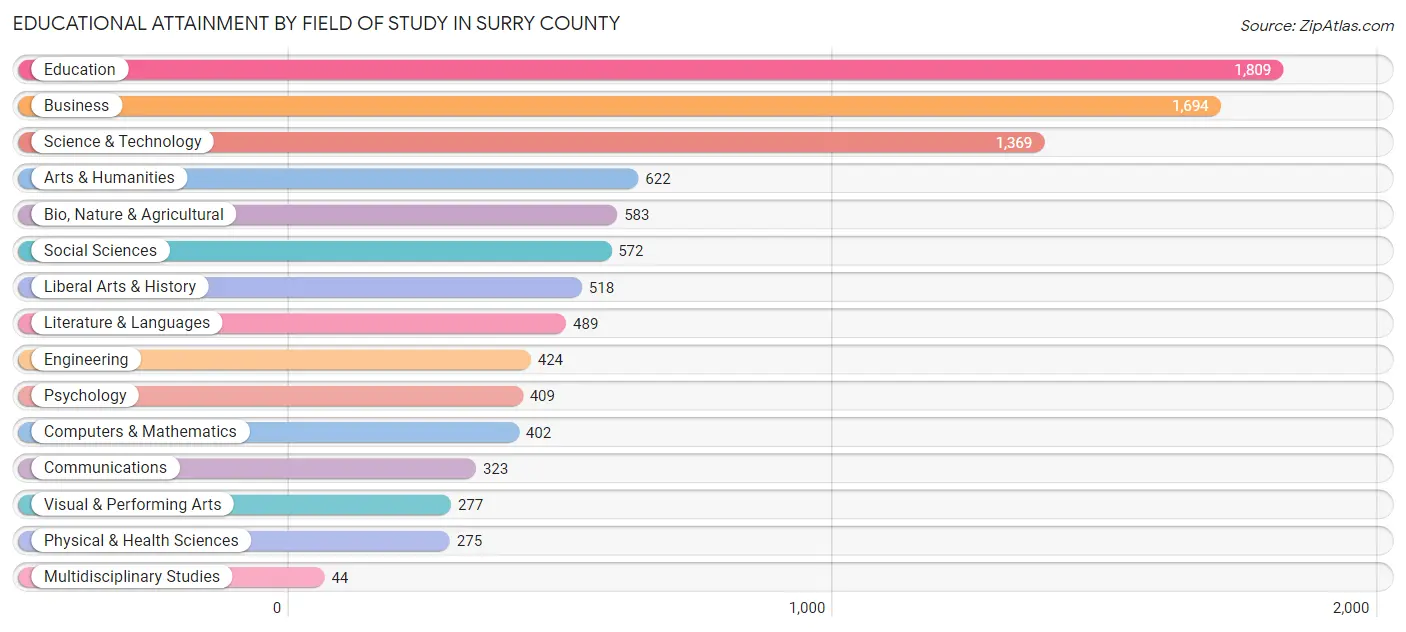
| Field of Study | # Graduates | % Graduates |
| Computers & Mathematics | 402 | 4.1% |
| Bio, Nature & Agricultural | 583 | 5.9% |
| Physical & Health Sciences | 275 | 2.8% |
| Psychology | 409 | 4.2% |
| Social Sciences | 572 | 5.8% |
| Engineering | 424 | 4.3% |
| Multidisciplinary Studies | 44 | 0.4% |
| Science & Technology | 1,369 | 14.0% |
| Business | 1,694 | 17.3% |
| Education | 1,809 | 18.4% |
| Literature & Languages | 489 | 5.0% |
| Liberal Arts & History | 518 | 5.3% |
| Visual & Performing Arts | 277 | 2.8% |
| Communications | 323 | 3.3% |
| Arts & Humanities | 622 | 6.3% |
| Total | 9,810 | 100.0% |
Transportation & Commute in Surry County
Vehicle Availability by Sex in Surry County
The most prevalent vehicle ownership categories in Surry County are males with 2 vehicles (5,735, accounting for 34.3%) and females with 2 vehicles (4,617, making up 40.0%).
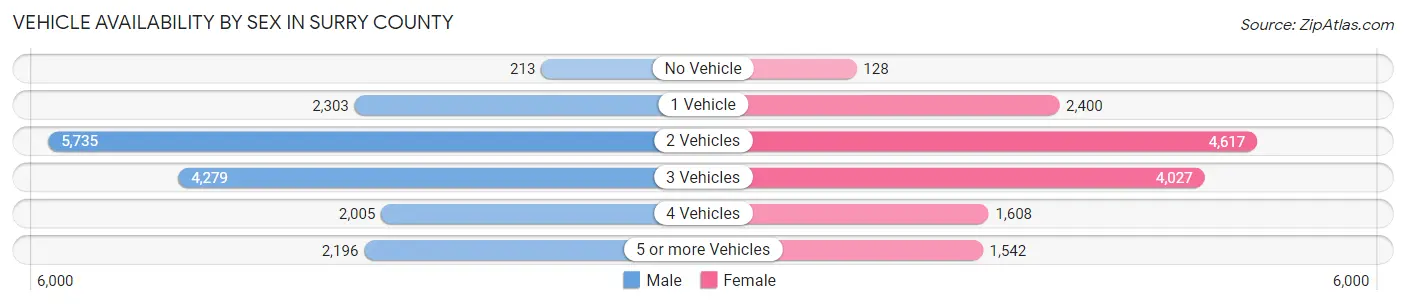
| Vehicles Available | Male | Female |
| No Vehicle | 213 (1.3%) | 128 (0.9%) |
| 1 Vehicle | 2,303 (13.8%) | 2,400 (16.8%) |
| 2 Vehicles | 5,735 (34.3%) | 4,617 (32.2%) |
| 3 Vehicles | 4,279 (25.6%) | 4,027 (28.1%) |
| 4 Vehicles | 2,005 (12.0%) | 1,608 (11.2%) |
| 5 or more Vehicles | 2,196 (13.1%) | 1,542 (10.8%) |
| Total | 16,731 (100.0%) | 14,322 (100.0%) |
Commute Time in Surry County
The most frequently occuring commute durations in Surry County are 10 to 14 minutes (5,332 commuters, 17.9%), 15 to 19 minutes (5,153 commuters, 17.3%), and 20 to 24 minutes (3,972 commuters, 13.3%).
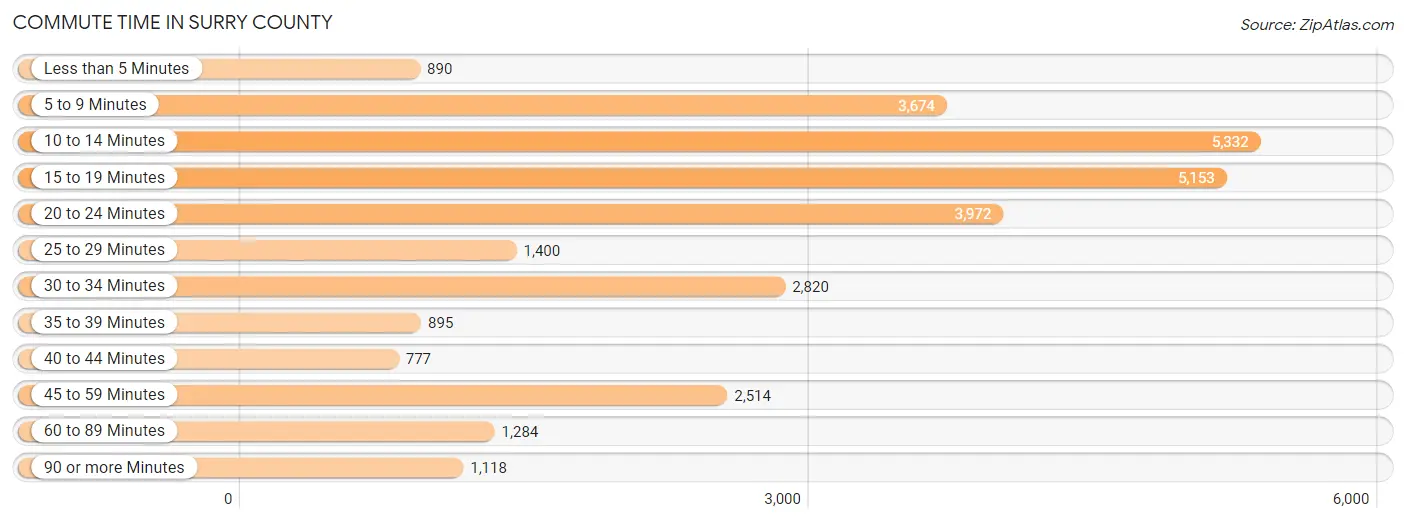
| Commute Time | # Commuters | % Commuters |
| Less than 5 Minutes | 890 | 3.0% |
| 5 to 9 Minutes | 3,674 | 12.3% |
| 10 to 14 Minutes | 5,332 | 17.9% |
| 15 to 19 Minutes | 5,153 | 17.3% |
| 20 to 24 Minutes | 3,972 | 13.3% |
| 25 to 29 Minutes | 1,400 | 4.7% |
| 30 to 34 Minutes | 2,820 | 9.5% |
| 35 to 39 Minutes | 895 | 3.0% |
| 40 to 44 Minutes | 777 | 2.6% |
| 45 to 59 Minutes | 2,514 | 8.4% |
| 60 to 89 Minutes | 1,284 | 4.3% |
| 90 or more Minutes | 1,118 | 3.7% |
Commute Time by Sex in Surry County
The most common commute times in Surry County are 15 to 19 minutes (2,846 commuters, 17.6%) for males and 10 to 14 minutes (2,694 commuters, 19.7%) for females.
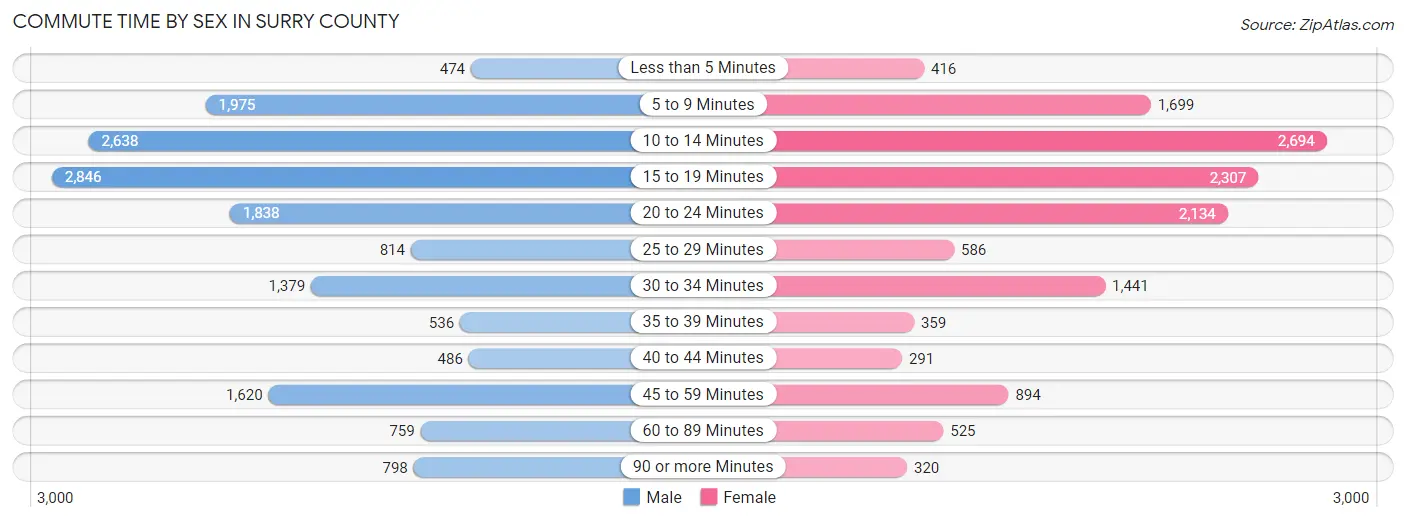
| Commute Time | Male | Female |
| Less than 5 Minutes | 474 (2.9%) | 416 (3.0%) |
| 5 to 9 Minutes | 1,975 (12.2%) | 1,699 (12.4%) |
| 10 to 14 Minutes | 2,638 (16.3%) | 2,694 (19.7%) |
| 15 to 19 Minutes | 2,846 (17.6%) | 2,307 (16.9%) |
| 20 to 24 Minutes | 1,838 (11.4%) | 2,134 (15.6%) |
| 25 to 29 Minutes | 814 (5.0%) | 586 (4.3%) |
| 30 to 34 Minutes | 1,379 (8.5%) | 1,441 (10.5%) |
| 35 to 39 Minutes | 536 (3.3%) | 359 (2.6%) |
| 40 to 44 Minutes | 486 (3.0%) | 291 (2.1%) |
| 45 to 59 Minutes | 1,620 (10.0%) | 894 (6.5%) |
| 60 to 89 Minutes | 759 (4.7%) | 525 (3.8%) |
| 90 or more Minutes | 798 (4.9%) | 320 (2.3%) |
Time of Departure to Work by Sex in Surry County
The most frequent times of departure to work in Surry County are 7:30 AM to 7:59 AM (1,862, 11.5%) for males and 7:30 AM to 7:59 AM (2,668, 19.5%) for females.
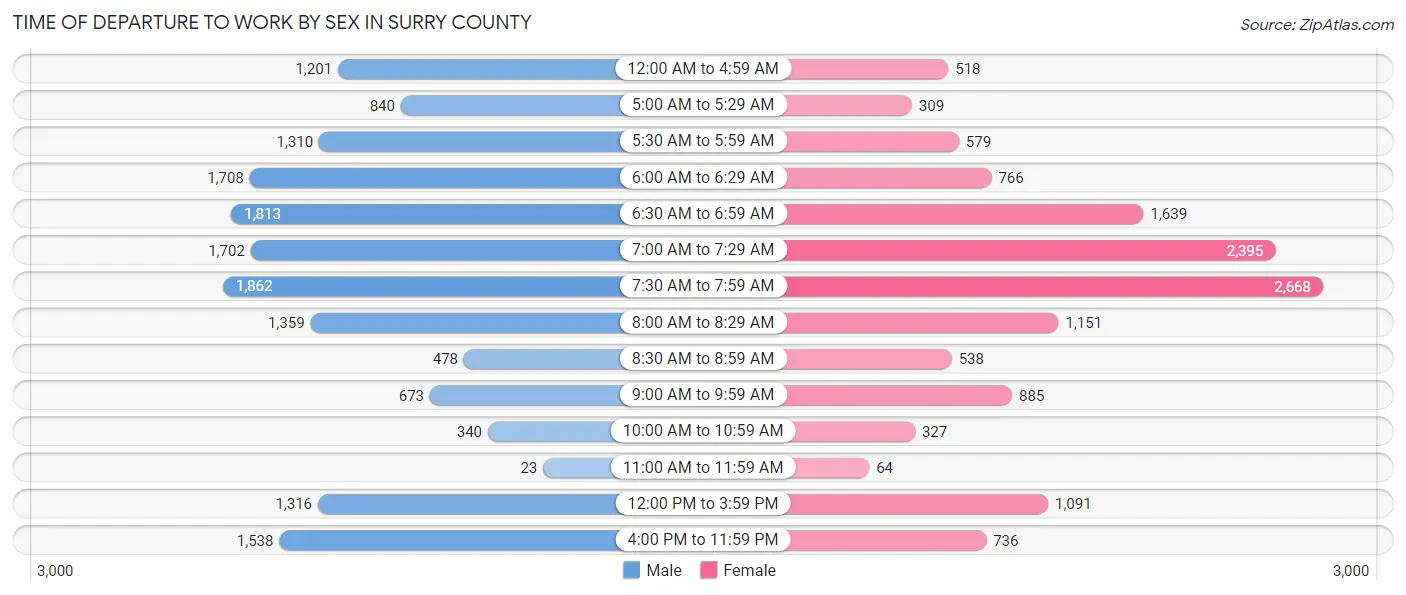
| Time of Departure | Male | Female |
| 12:00 AM to 4:59 AM | 1,201 (7.4%) | 518 (3.8%) |
| 5:00 AM to 5:29 AM | 840 (5.2%) | 309 (2.3%) |
| 5:30 AM to 5:59 AM | 1,310 (8.1%) | 579 (4.2%) |
| 6:00 AM to 6:29 AM | 1,708 (10.6%) | 766 (5.6%) |
| 6:30 AM to 6:59 AM | 1,813 (11.2%) | 1,639 (12.0%) |
| 7:00 AM to 7:29 AM | 1,702 (10.5%) | 2,395 (17.5%) |
| 7:30 AM to 7:59 AM | 1,862 (11.5%) | 2,668 (19.5%) |
| 8:00 AM to 8:29 AM | 1,359 (8.4%) | 1,151 (8.4%) |
| 8:30 AM to 8:59 AM | 478 (3.0%) | 538 (3.9%) |
| 9:00 AM to 9:59 AM | 673 (4.2%) | 885 (6.5%) |
| 10:00 AM to 10:59 AM | 340 (2.1%) | 327 (2.4%) |
| 11:00 AM to 11:59 AM | 23 (0.1%) | 64 (0.5%) |
| 12:00 PM to 3:59 PM | 1,316 (8.1%) | 1,091 (8.0%) |
| 4:00 PM to 11:59 PM | 1,538 (9.5%) | 736 (5.4%) |
| Total | 16,163 (100.0%) | 13,666 (100.0%) |
Housing Occupancy in Surry County
Occupancy by Ownership in Surry County
Of the total 28,990 dwellings in Surry County, owner-occupied units account for 21,105 (72.8%), while renter-occupied units make up 7,885 (27.2%).
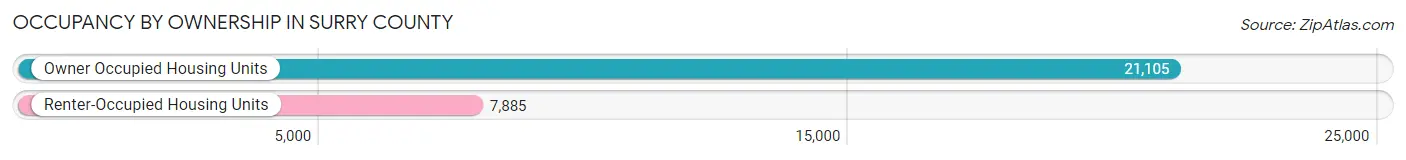
| Occupancy | # Housing Units | % Housing Units |
| Owner Occupied Housing Units | 21,105 | 72.8% |
| Renter-Occupied Housing Units | 7,885 | 27.2% |
| Total Occupied Housing Units | 28,990 | 100.0% |
Occupancy by Household Size in Surry County
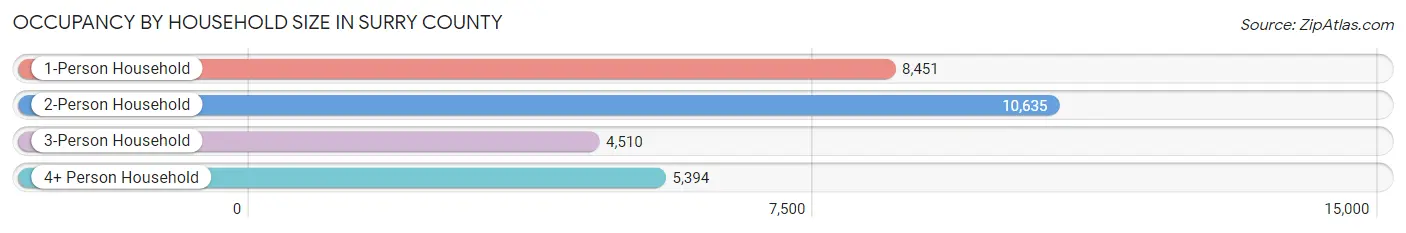
| Household Size | # Housing Units | % Housing Units |
| 1-Person Household | 8,451 | 29.1% |
| 2-Person Household | 10,635 | 36.7% |
| 3-Person Household | 4,510 | 15.6% |
| 4+ Person Household | 5,394 | 18.6% |
| Total Housing Units | 28,990 | 100.0% |
Occupancy by Ownership by Household Size in Surry County
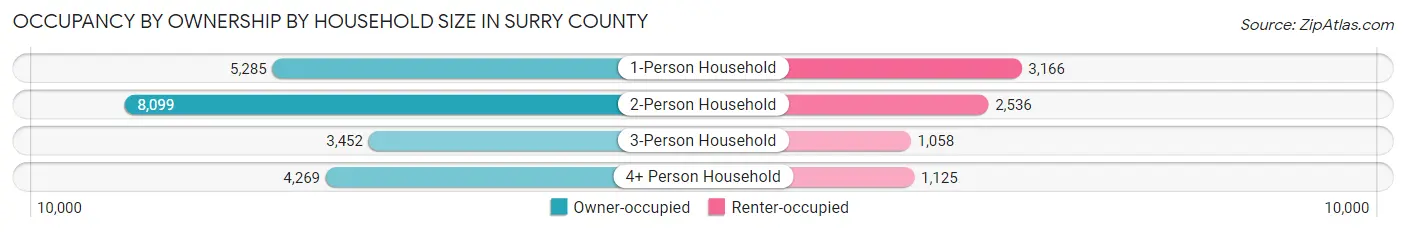
| Household Size | Owner-occupied | Renter-occupied |
| 1-Person Household | 5,285 (62.5%) | 3,166 (37.5%) |
| 2-Person Household | 8,099 (76.1%) | 2,536 (23.8%) |
| 3-Person Household | 3,452 (76.5%) | 1,058 (23.5%) |
| 4+ Person Household | 4,269 (79.1%) | 1,125 (20.9%) |
| Total Housing Units | 21,105 (72.8%) | 7,885 (27.2%) |
Occupancy by Educational Attainment in Surry County
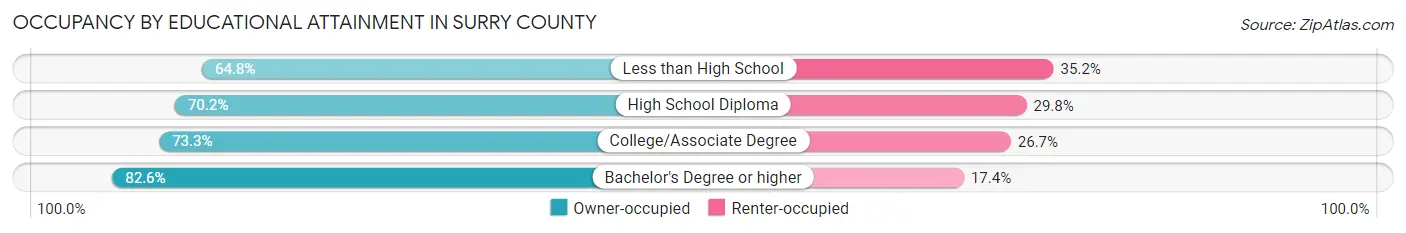
| Household Size | Owner-occupied | Renter-occupied |
| Less than High School | 3,149 (64.8%) | 1,710 (35.2%) |
| High School Diploma | 5,527 (70.2%) | 2,348 (29.8%) |
| College/Associate Degree | 7,870 (73.3%) | 2,866 (26.7%) |
| Bachelor's Degree or higher | 4,559 (82.6%) | 961 (17.4%) |
Occupancy by Age of Householder in Surry County
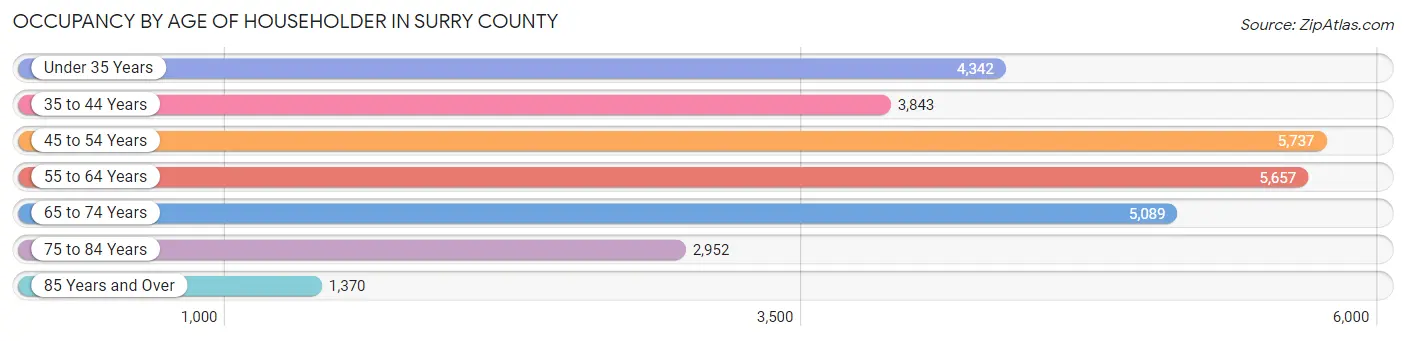
| Age Bracket | # Households | % Households |
| Under 35 Years | 4,342 | 15.0% |
| 35 to 44 Years | 3,843 | 13.3% |
| 45 to 54 Years | 5,737 | 19.8% |
| 55 to 64 Years | 5,657 | 19.5% |
| 65 to 74 Years | 5,089 | 17.5% |
| 75 to 84 Years | 2,952 | 10.2% |
| 85 Years and Over | 1,370 | 4.7% |
| Total | 28,990 | 100.0% |
Housing Finances in Surry County
Median Income by Occupancy in Surry County
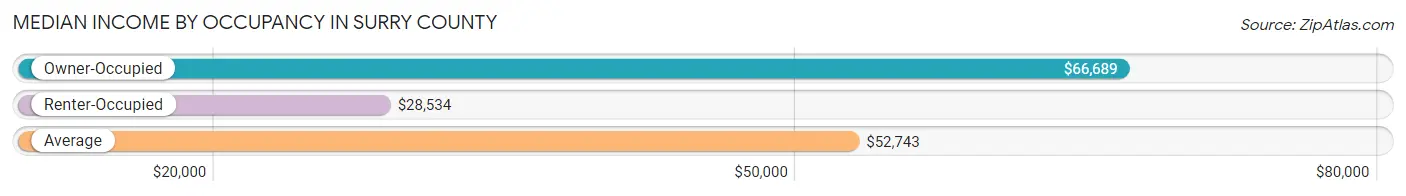
| Occupancy Type | # Households | Median Income |
| Owner-Occupied | 21,105 (72.8%) | $66,689 |
| Renter-Occupied | 7,885 (27.2%) | $28,534 |
| Average | 28,990 (100.0%) | $52,743 |
Occupancy by Householder Income Bracket in Surry County
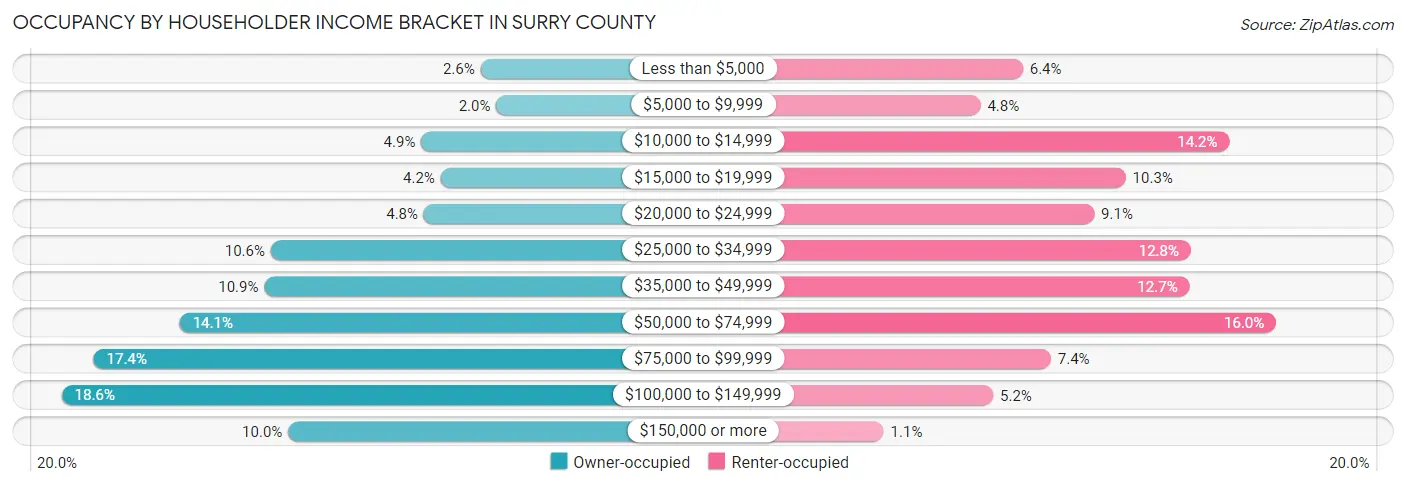
| Income Bracket | Owner-occupied | Renter-occupied |
| Less than $5,000 | 556 (2.6%) | 502 (6.4%) |
| $5,000 to $9,999 | 428 (2.0%) | 375 (4.8%) |
| $10,000 to $14,999 | 1,033 (4.9%) | 1,123 (14.2%) |
| $15,000 to $19,999 | 875 (4.2%) | 811 (10.3%) |
| $20,000 to $24,999 | 1,011 (4.8%) | 717 (9.1%) |
| $25,000 to $34,999 | 2,242 (10.6%) | 1,007 (12.8%) |
| $35,000 to $49,999 | 2,294 (10.9%) | 1,003 (12.7%) |
| $50,000 to $74,999 | 2,974 (14.1%) | 1,263 (16.0%) |
| $75,000 to $99,999 | 3,666 (17.4%) | 587 (7.4%) |
| $100,000 to $149,999 | 3,923 (18.6%) | 413 (5.2%) |
| $150,000 or more | 2,103 (10.0%) | 84 (1.1%) |
| Total | 21,105 (100.0%) | 7,885 (100.0%) |
Monthly Housing Cost Tiers in Surry County
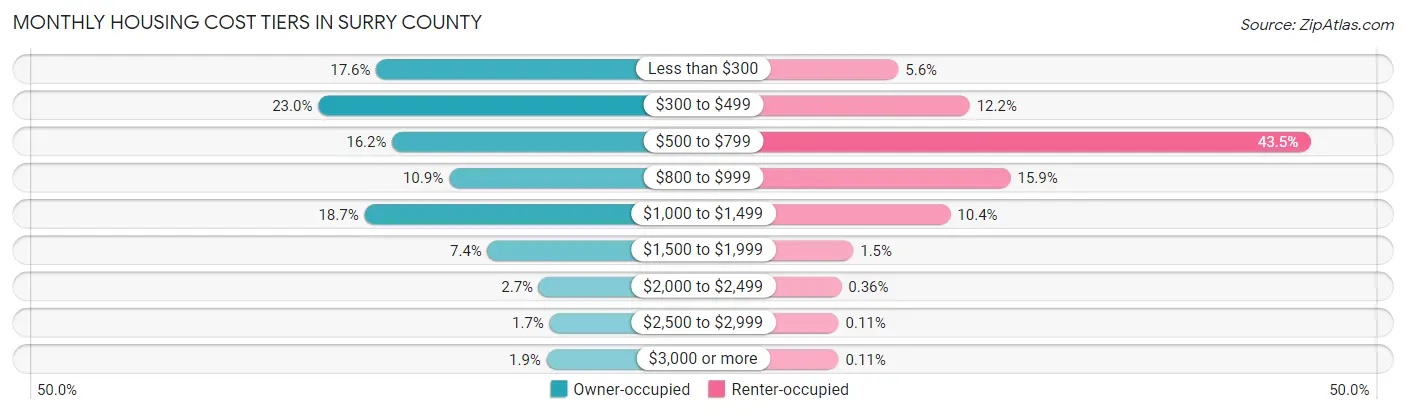
| Monthly Cost | Owner-occupied | Renter-occupied |
| Less than $300 | 3,719 (17.6%) | 442 (5.6%) |
| $300 to $499 | 4,847 (23.0%) | 960 (12.2%) |
| $500 to $799 | 3,408 (16.2%) | 3,431 (43.5%) |
| $800 to $999 | 2,307 (10.9%) | 1,257 (15.9%) |
| $1,000 to $1,499 | 3,949 (18.7%) | 820 (10.4%) |
| $1,500 to $1,999 | 1,555 (7.4%) | 115 (1.5%) |
| $2,000 to $2,499 | 560 (2.6%) | 28 (0.4%) |
| $2,500 to $2,999 | 350 (1.7%) | 9 (0.1%) |
| $3,000 or more | 410 (1.9%) | 9 (0.1%) |
| Total | 21,105 (100.0%) | 7,885 (100.0%) |
Physical Housing Characteristics in Surry County
Housing Structures in Surry County
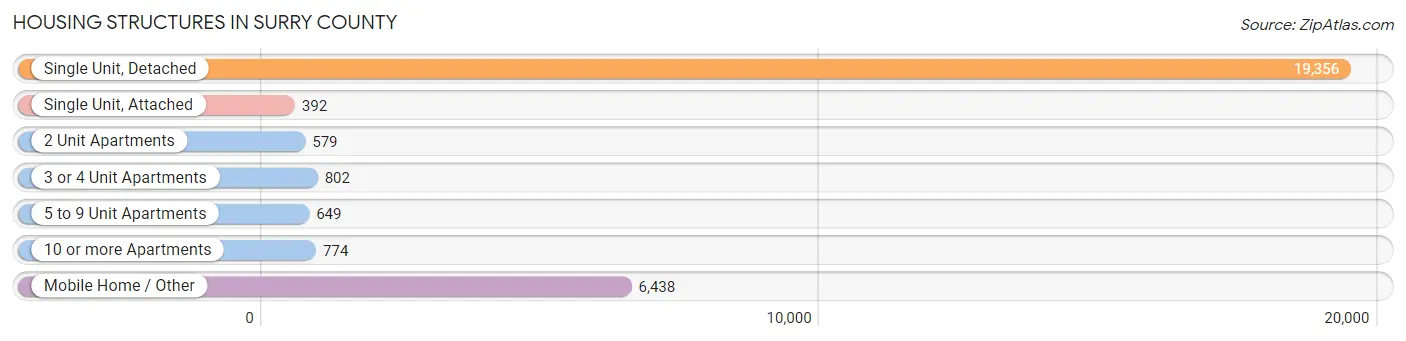
| Structure Type | # Housing Units | % Housing Units |
| Single Unit, Detached | 19,356 | 66.8% |
| Single Unit, Attached | 392 | 1.3% |
| 2 Unit Apartments | 579 | 2.0% |
| 3 or 4 Unit Apartments | 802 | 2.8% |
| 5 to 9 Unit Apartments | 649 | 2.2% |
| 10 or more Apartments | 774 | 2.7% |
| Mobile Home / Other | 6,438 | 22.2% |
| Total | 28,990 | 100.0% |
Housing Structures by Occupancy in Surry County
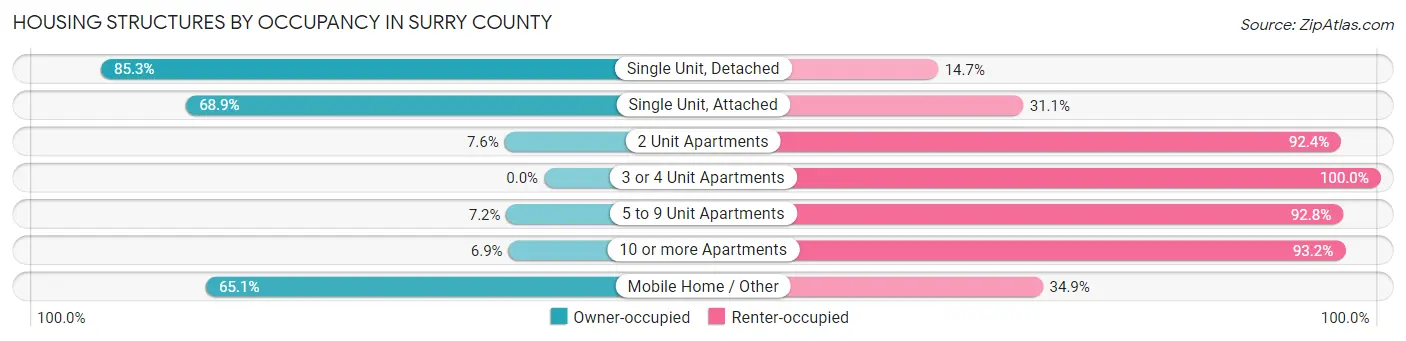
| Structure Type | Owner-occupied | Renter-occupied |
| Single Unit, Detached | 16,502 (85.3%) | 2,854 (14.7%) |
| Single Unit, Attached | 270 (68.9%) | 122 (31.1%) |
| 2 Unit Apartments | 44 (7.6%) | 535 (92.4%) |
| 3 or 4 Unit Apartments | 0 (0.0%) | 802 (100.0%) |
| 5 to 9 Unit Apartments | 47 (7.2%) | 602 (92.8%) |
| 10 or more Apartments | 53 (6.9%) | 721 (93.1%) |
| Mobile Home / Other | 4,189 (65.1%) | 2,249 (34.9%) |
| Total | 21,105 (72.8%) | 7,885 (27.2%) |
Housing Structures by Number of Rooms in Surry County
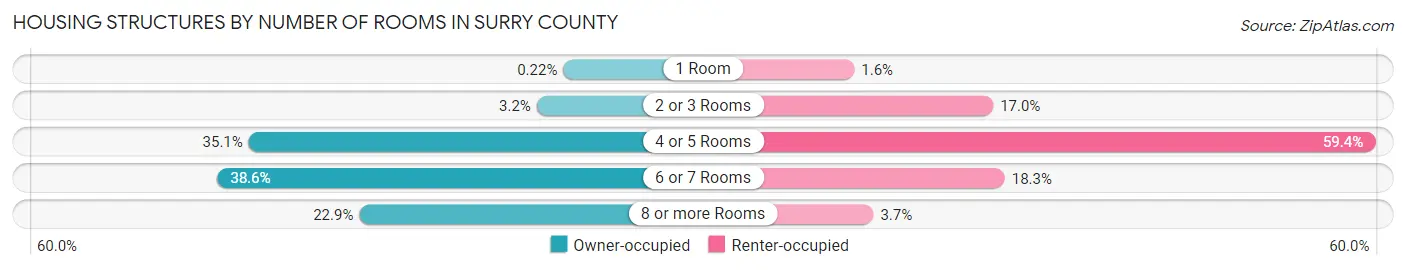
| Number of Rooms | Owner-occupied | Renter-occupied |
| 1 Room | 47 (0.2%) | 126 (1.6%) |
| 2 or 3 Rooms | 669 (3.2%) | 1,341 (17.0%) |
| 4 or 5 Rooms | 7,416 (35.1%) | 4,682 (59.4%) |
| 6 or 7 Rooms | 8,148 (38.6%) | 1,443 (18.3%) |
| 8 or more Rooms | 4,825 (22.9%) | 293 (3.7%) |
| Total | 21,105 (100.0%) | 7,885 (100.0%) |
Housing Structure by Heating Type in Surry County
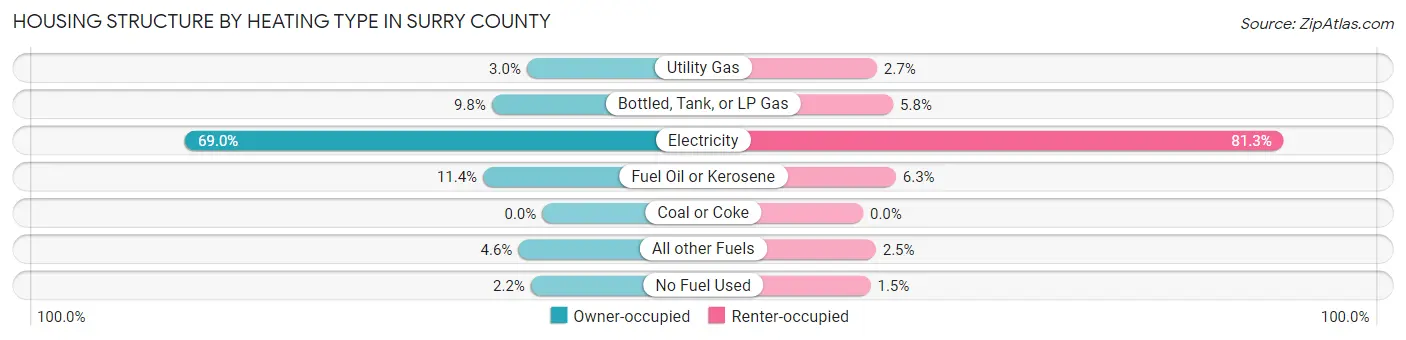
| Heating Type | Owner-occupied | Renter-occupied |
| Utility Gas | 627 (3.0%) | 211 (2.7%) |
| Bottled, Tank, or LP Gas | 2,058 (9.8%) | 459 (5.8%) |
| Electricity | 14,565 (69.0%) | 6,407 (81.3%) |
| Fuel Oil or Kerosene | 2,412 (11.4%) | 500 (6.3%) |
| Coal or Coke | 0 (0.0%) | 0 (0.0%) |
| All other Fuels | 977 (4.6%) | 194 (2.5%) |
| No Fuel Used | 466 (2.2%) | 114 (1.5%) |
| Total | 21,105 (100.0%) | 7,885 (100.0%) |
Household Vehicle Usage in Surry County
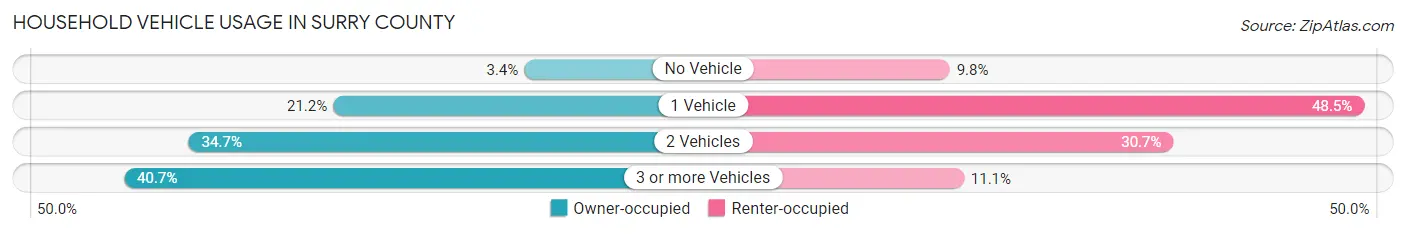
| Vehicles per Household | Owner-occupied | Renter-occupied |
| No Vehicle | 712 (3.4%) | 771 (9.8%) |
| 1 Vehicle | 4,477 (21.2%) | 3,822 (48.5%) |
| 2 Vehicles | 7,321 (34.7%) | 2,417 (30.6%) |
| 3 or more Vehicles | 8,595 (40.7%) | 875 (11.1%) |
| Total | 21,105 (100.0%) | 7,885 (100.0%) |
Real Estate & Mortgages in Surry County
Real Estate and Mortgage Overview in Surry County
| Characteristic | Without Mortgage | With Mortgage |
| Housing Units | 10,654 | 10,451 |
| Median Property Value | $131,800 | $171,300 |
| Median Household Income | $46,035 | $1,426 |
| Monthly Housing Costs | $359 | $365 |
| Real Estate Taxes | $899 | $544 |
Property Value by Mortgage Status in Surry County
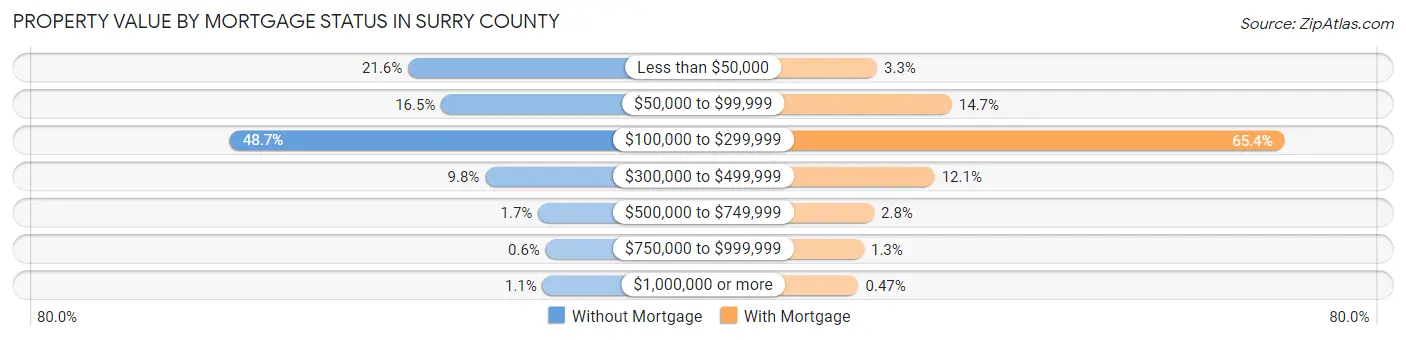
| Property Value | Without Mortgage | With Mortgage |
| Less than $50,000 | 2,298 (21.6%) | 343 (3.3%) |
| $50,000 to $99,999 | 1,759 (16.5%) | 1,534 (14.7%) |
| $100,000 to $299,999 | 5,190 (48.7%) | 6,833 (65.4%) |
| $300,000 to $499,999 | 1,045 (9.8%) | 1,261 (12.1%) |
| $500,000 to $749,999 | 185 (1.7%) | 296 (2.8%) |
| $750,000 to $999,999 | 64 (0.6%) | 135 (1.3%) |
| $1,000,000 or more | 113 (1.1%) | 49 (0.5%) |
| Total | 10,654 (100.0%) | 10,451 (100.0%) |
Household Income by Mortgage Status in Surry County
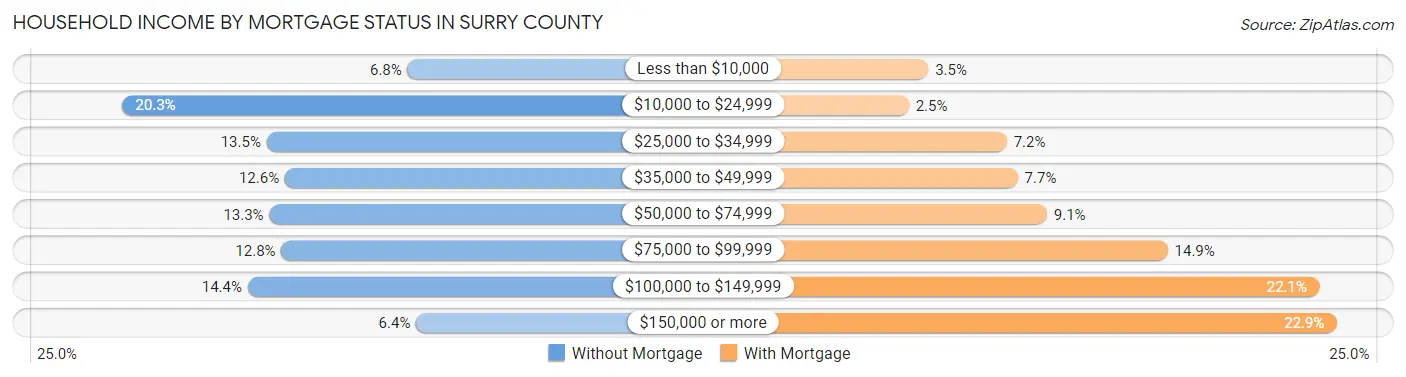
| Household Income | Without Mortgage | With Mortgage |
| Less than $10,000 | 720 (6.8%) | 362 (3.5%) |
| $10,000 to $24,999 | 2,167 (20.3%) | 264 (2.5%) |
| $25,000 to $34,999 | 1,435 (13.5%) | 752 (7.2%) |
| $35,000 to $49,999 | 1,342 (12.6%) | 807 (7.7%) |
| $50,000 to $74,999 | 1,421 (13.3%) | 952 (9.1%) |
| $75,000 to $99,999 | 1,361 (12.8%) | 1,553 (14.9%) |
| $100,000 to $149,999 | 1,531 (14.4%) | 2,305 (22.1%) |
| $150,000 or more | 677 (6.4%) | 2,392 (22.9%) |
| Total | 10,654 (100.0%) | 10,451 (100.0%) |
Property Value to Household Income Ratio in Surry County
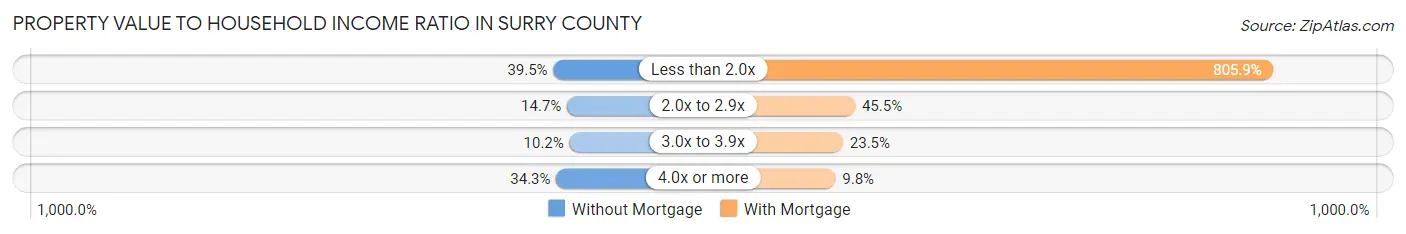
| Value-to-Income Ratio | Without Mortgage | With Mortgage |
| Less than 2.0x | 4,213 (39.5%) | 84,221 (805.9%) |
| 2.0x to 2.9x | 1,564 (14.7%) | 4,758 (45.5%) |
| 3.0x to 3.9x | 1,086 (10.2%) | 2,454 (23.5%) |
| 4.0x or more | 3,650 (34.3%) | 1,024 (9.8%) |
| Total | 10,654 (100.0%) | 10,451 (100.0%) |
Real Estate Taxes by Mortgage Status in Surry County
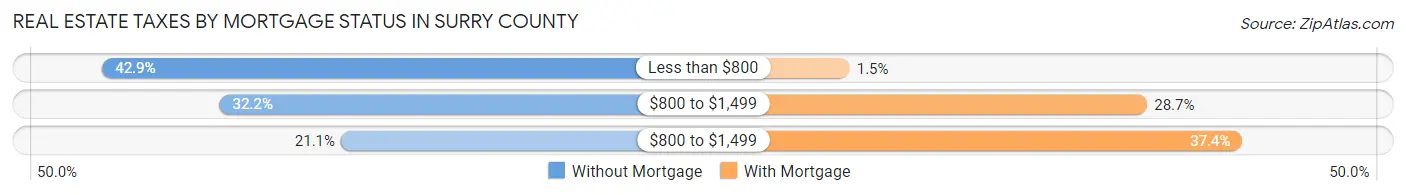
| Property Taxes | Without Mortgage | With Mortgage |
| Less than $800 | 4,571 (42.9%) | 160 (1.5%) |
| $800 to $1,499 | 3,429 (32.2%) | 2,999 (28.7%) |
| $800 to $1,499 | 2,250 (21.1%) | 3,906 (37.4%) |
| Total | 10,654 (100.0%) | 10,451 (100.0%) |
Health & Disability in Surry County
Health Insurance Coverage by Age in Surry County
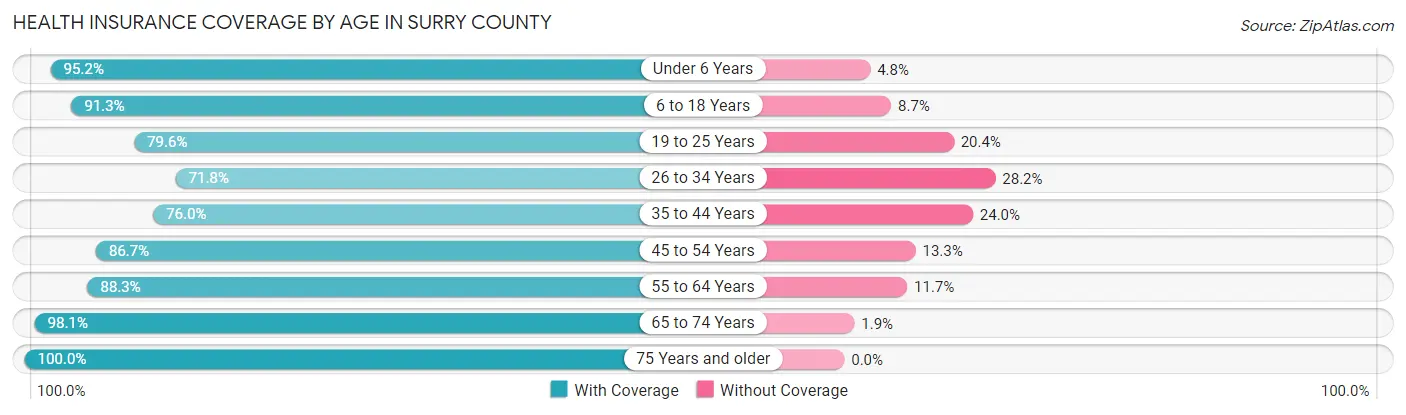
| Age Bracket | With Coverage | Without Coverage |
| Under 6 Years | 4,233 (95.2%) | 215 (4.8%) |
| 6 to 18 Years | 10,368 (91.3%) | 990 (8.7%) |
| 19 to 25 Years | 4,502 (79.6%) | 1,154 (20.4%) |
| 26 to 34 Years | 5,032 (71.8%) | 1,973 (28.2%) |
| 35 to 44 Years | 6,082 (76.0%) | 1,919 (24.0%) |
| 45 to 54 Years | 8,377 (86.7%) | 1,284 (13.3%) |
| 55 to 64 Years | 8,991 (88.3%) | 1,193 (11.7%) |
| 65 to 74 Years | 8,250 (98.1%) | 157 (1.9%) |
| 75 Years and older | 5,792 (100.0%) | 0 (0.0%) |
| Total | 61,627 (87.4%) | 8,885 (12.6%) |
Health Insurance Coverage by Citizenship Status in Surry County
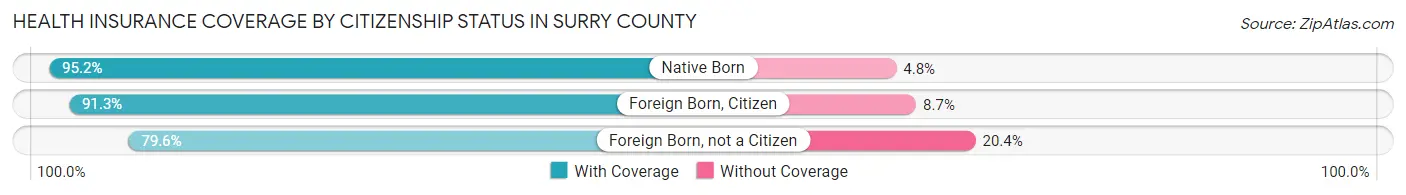
| Citizenship Status | With Coverage | Without Coverage |
| Native Born | 4,233 (95.2%) | 215 (4.8%) |
| Foreign Born, Citizen | 10,368 (91.3%) | 990 (8.7%) |
| Foreign Born, not a Citizen | 4,502 (79.6%) | 1,154 (20.4%) |
Health Insurance Coverage by Household Income in Surry County
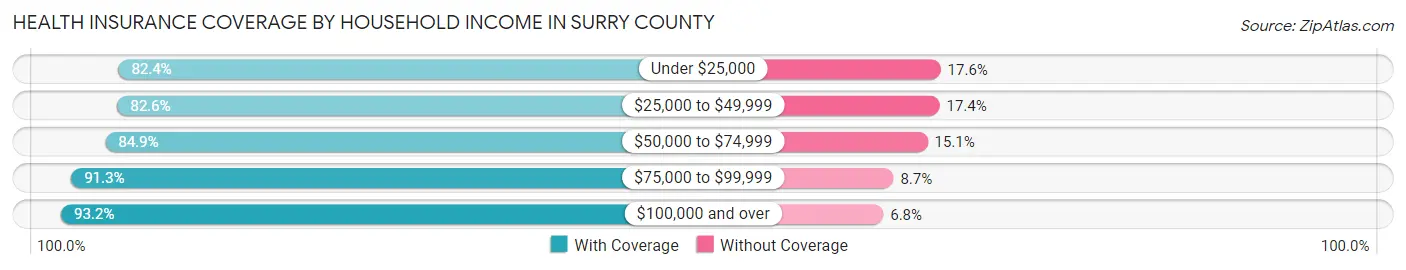
| Household Income | With Coverage | Without Coverage |
| Under $25,000 | 9,938 (82.4%) | 2,121 (17.6%) |
| $25,000 to $49,999 | 12,104 (82.6%) | 2,546 (17.4%) |
| $50,000 to $74,999 | 9,480 (84.9%) | 1,690 (15.1%) |
| $75,000 to $99,999 | 11,177 (91.3%) | 1,071 (8.7%) |
| $100,000 and over | 18,798 (93.2%) | 1,381 (6.8%) |
Public vs Private Health Insurance Coverage by Age in Surry County
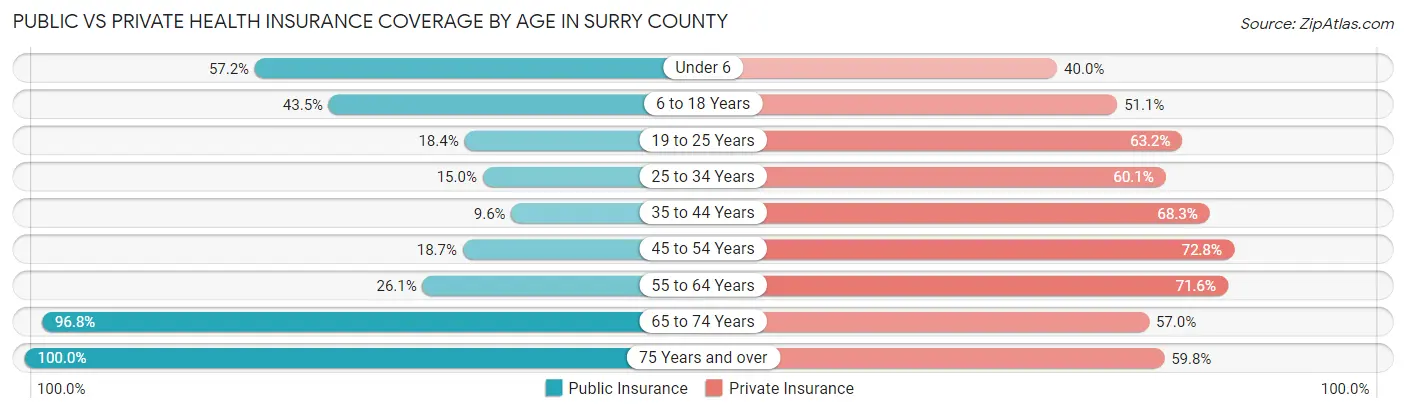
| Age Bracket | Public Insurance | Private Insurance |
| Under 6 | 2,546 (57.2%) | 1,778 (40.0%) |
| 6 to 18 Years | 4,943 (43.5%) | 5,806 (51.1%) |
| 19 to 25 Years | 1,038 (18.3%) | 3,574 (63.2%) |
| 25 to 34 Years | 1,048 (15.0%) | 4,209 (60.1%) |
| 35 to 44 Years | 771 (9.6%) | 5,462 (68.3%) |
| 45 to 54 Years | 1,804 (18.7%) | 7,029 (72.8%) |
| 55 to 64 Years | 2,661 (26.1%) | 7,296 (71.6%) |
| 65 to 74 Years | 8,136 (96.8%) | 4,794 (57.0%) |
| 75 Years and over | 5,792 (100.0%) | 3,466 (59.8%) |
| Total | 28,739 (40.8%) | 43,414 (61.6%) |
Disability Status by Sex by Age in Surry County
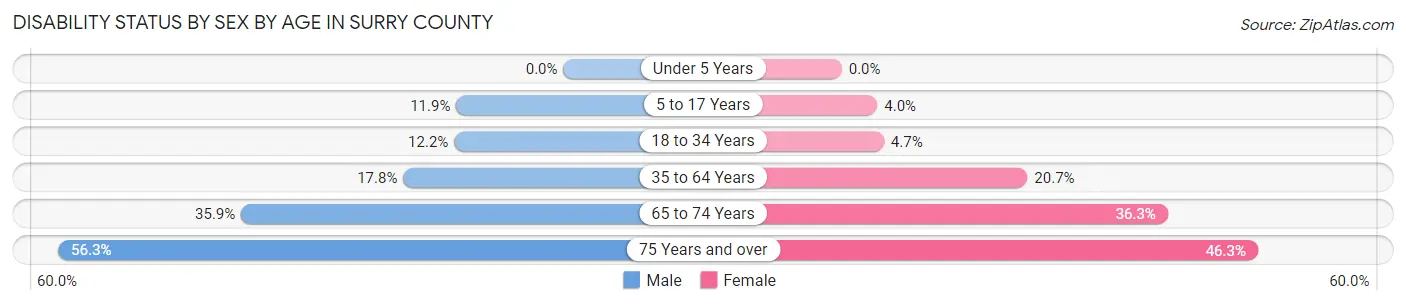
| Age Bracket | Male | Female |
| Under 5 Years | 0 (0.0%) | 0 (0.0%) |
| 5 to 17 Years | 678 (11.9%) | 220 (4.0%) |
| 18 to 34 Years | 842 (12.2%) | 308 (4.7%) |
| 35 to 64 Years | 2,448 (17.8%) | 2,917 (20.7%) |
| 65 to 74 Years | 1,445 (35.9%) | 1,590 (36.3%) |
| 75 Years and over | 1,370 (56.3%) | 1,555 (46.3%) |
Disability Class by Sex by Age in Surry County
Disability Class: Hearing Difficulty
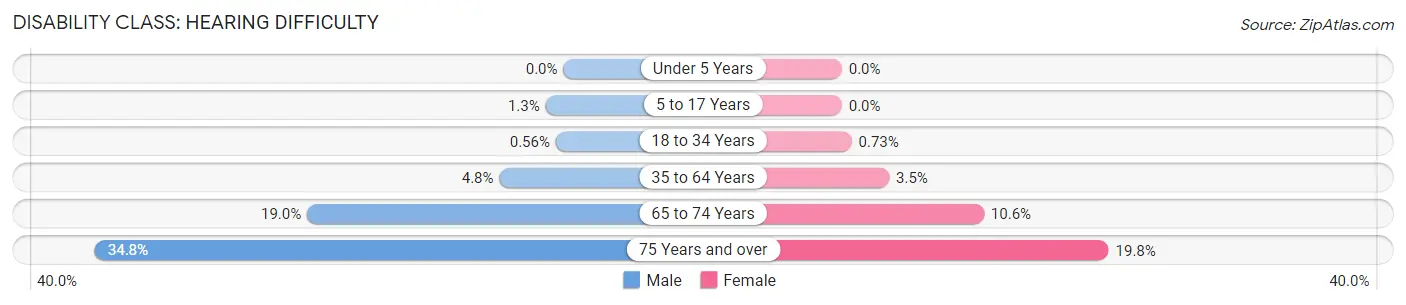
| Age Bracket | Male | Female |
| Under 5 Years | 0 (0.0%) | 0 (0.0%) |
| 5 to 17 Years | 75 (1.3%) | 0 (0.0%) |
| 18 to 34 Years | 39 (0.6%) | 48 (0.7%) |
| 35 to 64 Years | 652 (4.8%) | 495 (3.5%) |
| 65 to 74 Years | 766 (19.0%) | 462 (10.5%) |
| 75 Years and over | 847 (34.8%) | 665 (19.8%) |
Disability Class: Vision Difficulty
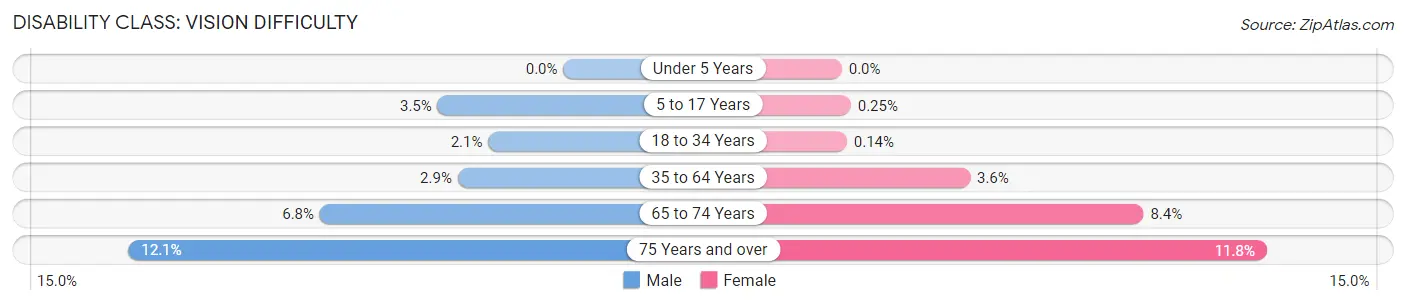
| Age Bracket | Male | Female |
| Under 5 Years | 0 (0.0%) | 0 (0.0%) |
| 5 to 17 Years | 199 (3.5%) | 14 (0.3%) |
| 18 to 34 Years | 145 (2.1%) | 9 (0.1%) |
| 35 to 64 Years | 404 (2.9%) | 504 (3.6%) |
| 65 to 74 Years | 273 (6.8%) | 368 (8.4%) |
| 75 Years and over | 295 (12.1%) | 397 (11.8%) |
Disability Class: Cognitive Difficulty
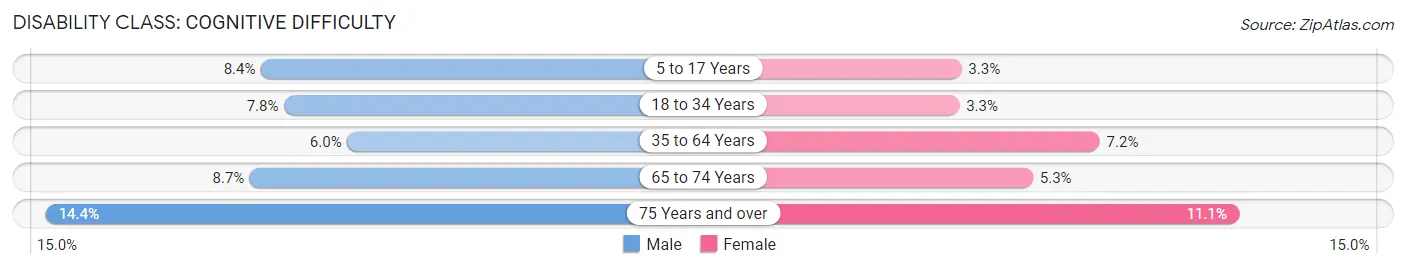
| Age Bracket | Male | Female |
| 5 to 17 Years | 478 (8.4%) | 185 (3.3%) |
| 18 to 34 Years | 538 (7.8%) | 215 (3.3%) |
| 35 to 64 Years | 825 (6.0%) | 1,014 (7.2%) |
| 65 to 74 Years | 351 (8.7%) | 233 (5.3%) |
| 75 Years and over | 351 (14.4%) | 371 (11.1%) |
Disability Class: Ambulatory Difficulty
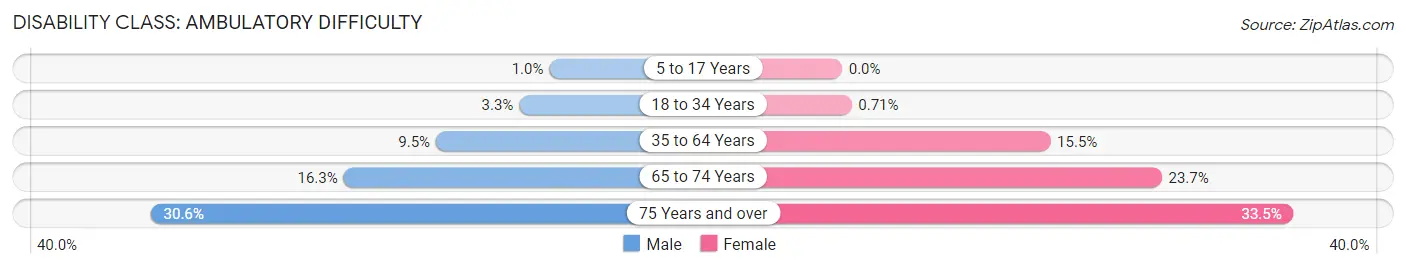
| Age Bracket | Male | Female |
| 5 to 17 Years | 59 (1.0%) | 0 (0.0%) |
| 18 to 34 Years | 227 (3.3%) | 47 (0.7%) |
| 35 to 64 Years | 1,299 (9.5%) | 2,184 (15.5%) |
| 65 to 74 Years | 657 (16.3%) | 1,040 (23.7%) |
| 75 Years and over | 746 (30.6%) | 1,126 (33.5%) |
Disability Class: Self-Care Difficulty
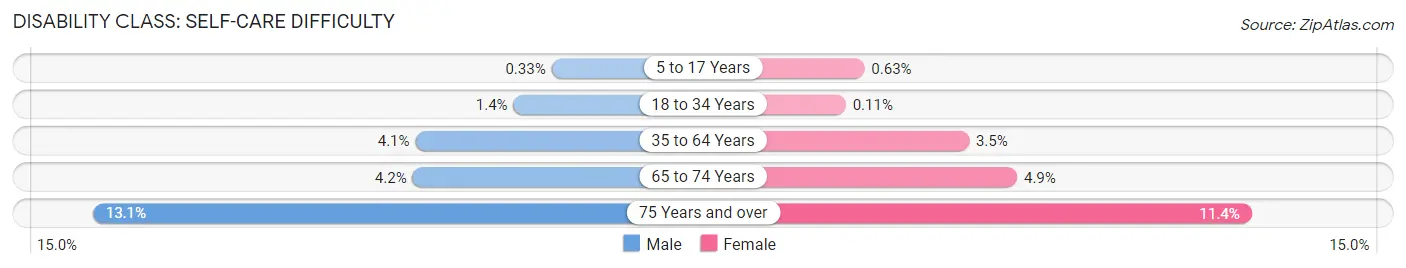
| Age Bracket | Male | Female |
| 5 to 17 Years | 19 (0.3%) | 35 (0.6%) |
| 18 to 34 Years | 96 (1.4%) | 7 (0.1%) |
| 35 to 64 Years | 566 (4.1%) | 500 (3.5%) |
| 65 to 74 Years | 169 (4.2%) | 214 (4.9%) |
| 75 Years and over | 319 (13.1%) | 383 (11.4%) |
Technology Access in Surry County
Computing Device Access in Surry County
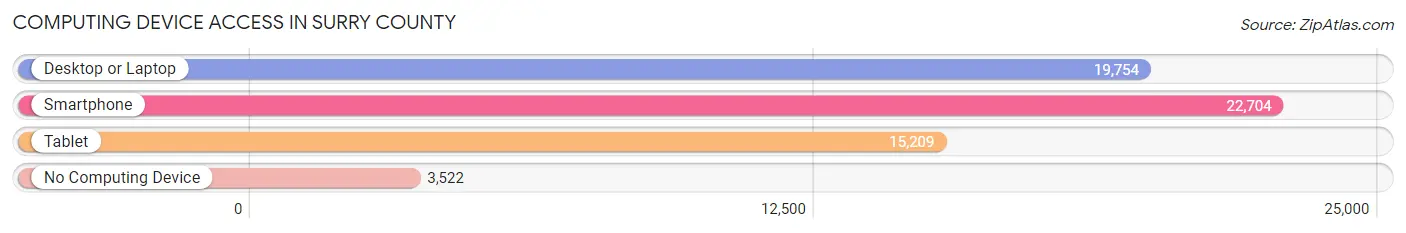
| Device Type | # Households | % Households |
| Desktop or Laptop | 19,754 | 68.1% |
| Smartphone | 22,704 | 78.3% |
| Tablet | 15,209 | 52.5% |
| No Computing Device | 3,522 | 12.1% |
| Total | 28,990 | 100.0% |
Internet Access in Surry County
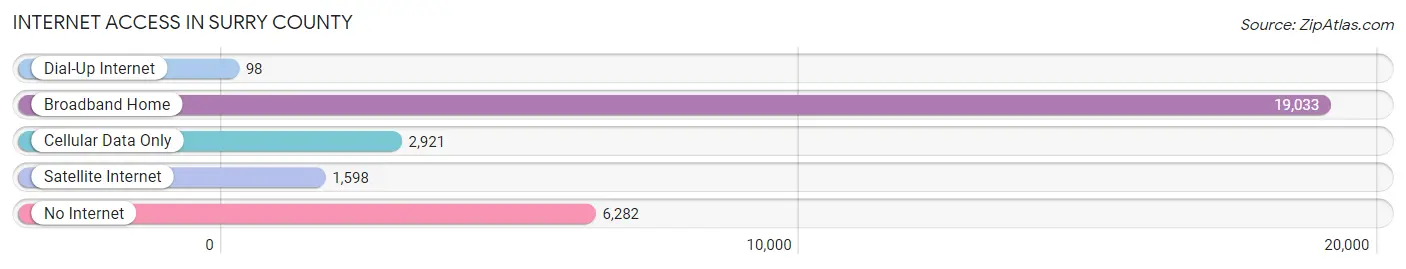
| Internet Type | # Households | % Households |
| Dial-Up Internet | 98 | 0.3% |
| Broadband Home | 19,033 | 65.6% |
| Cellular Data Only | 2,921 | 10.1% |
| Satellite Internet | 1,598 | 5.5% |
| No Internet | 6,282 | 21.7% |
| Total | 28,990 | 100.0% |
Surry County Summary
Surry County is located in the northwestern part of North Carolina, and is part of the Piedmont Triad region. It is bordered by Stokes County to the north, Wilkes County to the east, Yadkin County to the south, and Patrick County, Virginia to the west. The county seat is Dobson, and the largest city is Mount Airy. Surry County has a total area of 545 square miles, and a population of 73,673 as of the 2010 census.
History
Surry County was formed in 1771 from Rowan County. It was named for the county of Surrey in England. The county was originally part of the vast territory of the Cherokee Nation, and the first European settlers arrived in the late 1700s. The county was home to several Revolutionary War battles, including the Battle of the Yadkin and the Battle of Shallow Ford.
In the early 1800s, the county was home to several large plantations, and the economy was largely based on agriculture. The county was also home to several iron ore mines, which provided the raw material for the iron industry in the area. The county was also home to several mills, which produced textiles, furniture, and other goods.
Geography
Surry County is located in the northwestern part of North Carolina, and is part of the Piedmont Triad region. It is bordered by Stokes County to the north, Wilkes County to the east, Yadkin County to the south, and Patrick County, Virginia to the west. The county has a total area of 545 square miles, and is mostly rural. The terrain is mostly rolling hills, with the highest point being Pilot Mountain, which has an elevation of 2,421 feet. The county is home to several rivers, including the Yadkin, Ararat, and Fisher Rivers.
Economy
The economy of Surry County is largely based on agriculture and manufacturing. The county is home to several large farms, which produce a variety of crops, including corn, soybeans, wheat, and tobacco. The county is also home to several manufacturing companies, which produce a variety of products, including furniture, textiles, and automotive parts. The county is also home to several wineries, which produce a variety of wines.
Demographics
As of the 2010 census, Surry County had a population of 73,673. The racial makeup of the county was 87.3% White, 9.2% African American, 0.7% Native American, 0.5% Asian, 0.1% Pacific Islander, 1.2% from other races, and 1.1% from two or more races. Hispanic or Latino of any race were 3.2% of the population.
The median income for a household in the county was $37,845, and the median income for a family was $45,945. The per capita income for the county was $20,845. About 14.2% of the population was below the poverty line.
Common Questions
What is the Total Population of Surry County?
Total Population of Surry County is 71,429.
What is the Total Male Population of Surry County?
Total Male Population of Surry County is 34,926.
What is the Total Female Population of Surry County?
Total Female Population of Surry County is 36,503.
What is the Ratio of Males per 100 Females in Surry County?
There are 95.68 Males per 100 Females in Surry County.
What is the Ratio of Females per 100 Males in Surry County?
There are 104.52 Females per 100 Males in Surry County.
What is the Median Population Age in Surry County?
Median Population Age in Surry County is 43.8 Years.
What is the Average Family Size in Surry County
Average Family Size in Surry County is 3.0 People.
What is the Average Household Size in Surry County
Average Household Size in Surry County is 2.4 People.
What is Per Capita Income in Surry County?
Per Capita income in Surry County is $30,274.
What is the Median Family Income in Surry County?
Median Family Income in Surry County is $71,903.
What is the Median Household income in Surry County?
Median Household Income in Surry County is $52,743.
What is Income or Wage Gap in Surry County?
Income or Wage Gap in Surry County is 30.2%.
Women in Surry County earn 69.8 cents for every dollar earned by a man.
What is Family Income Deficit in Surry County?
Family Income Deficit in Surry County is $8,918.
Families that are below poverty line in Surry County earn $8,918 less on average than the poverty threshold level.
What is Inequality or Gini Index in Surry County?
Inequality or Gini Index in Surry County is 0.48.
How Large is the Labor Force in Surry County?
There are 33,447 People in the Labor Forcein in Surry County.
What is the Percentage of People in the Labor Force in Surry County?
57.5% of People are in the Labor Force in Surry County.
What is the Unemployment Rate in Surry County?
Unemployment Rate in Surry County is 4.9%.