Scotland County, NC
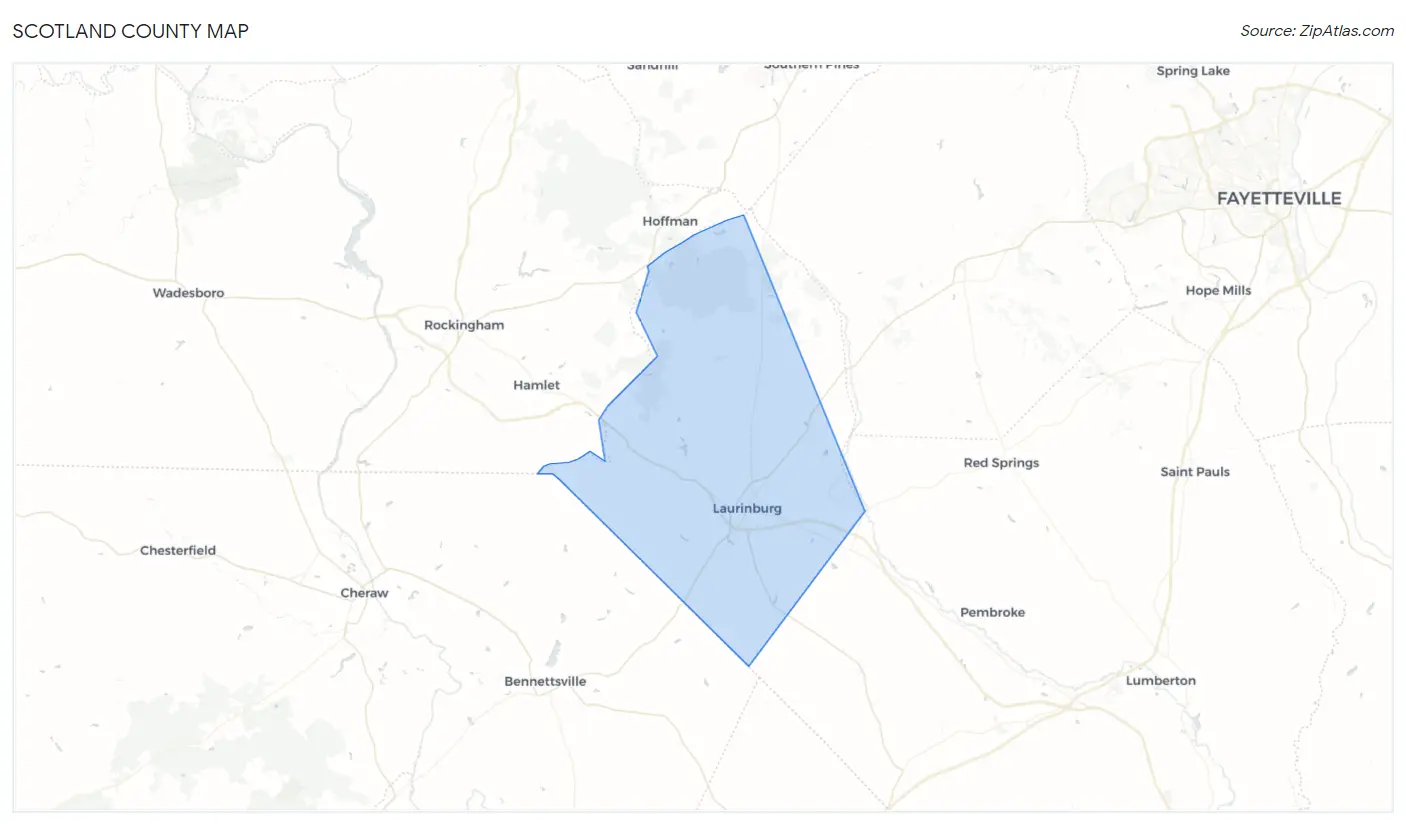
Scotland County Map
Scotland County Overview
34,222
TOTAL POPULATION
17,382
MALE POPULATION
16,840
FEMALE POPULATION
103.22
MALES / 100 FEMALES
96.88
FEMALES / 100 MALES
39.0
MEDIAN AGE
3.3
AVG FAMILY SIZE
2.6
AVG HOUSEHOLD SIZE
$24,464
PER CAPITA INCOME
$51,937
AVG FAMILY INCOME
$41,948
AVG HOUSEHOLD INCOME
30.2%
WAGE / INCOME GAP [ % ]
69.8¢/ $1
WAGE / INCOME GAP [ $ ]
$11,503
FAMILY INCOME DEFICIT
0.50
INEQUALITY / GINI INDEX
14,211
LABOR FORCE [ PEOPLE ]
52.4%
PERCENT IN LABOR FORCE
10.8%
UNEMPLOYMENT RATE
Scotland County Area Codes
Race in Scotland County
The most populous races in Scotland County are White / Caucasian (14,265 | 41.7%), Black / African American (13,330 | 39.0%), and Native / Alaskan (3,946 | 11.5%).
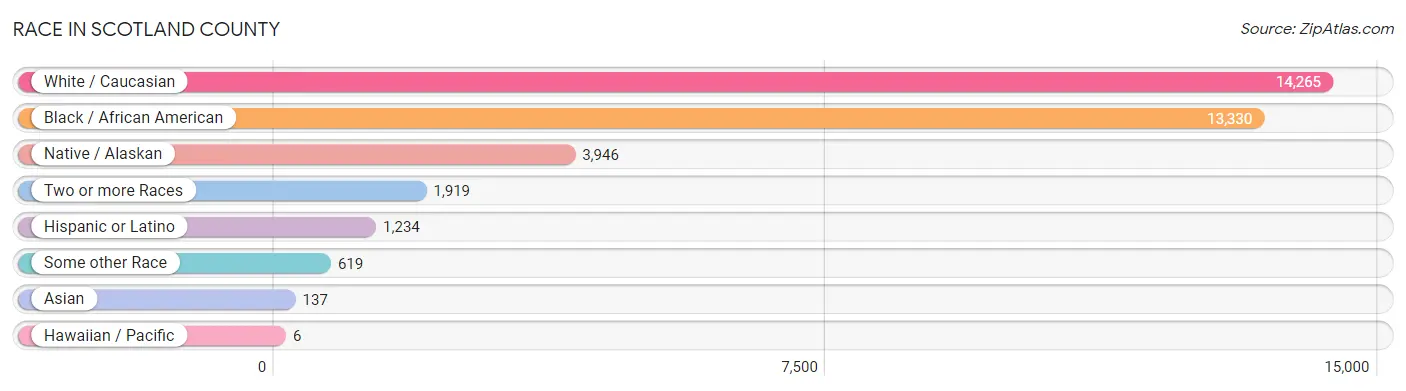
| Race | # Population | % Population |
| Asian | 137 | 0.4% |
| Black / African American | 13,330 | 39.0% |
| Hawaiian / Pacific | 6 | 0.0% |
| Hispanic or Latino | 1,234 | 3.6% |
| Native / Alaskan | 3,946 | 11.5% |
| White / Caucasian | 14,265 | 41.7% |
| Two or more Races | 1,919 | 5.6% |
| Some other Race | 619 | 1.8% |
| Total | 34,222 | 100.0% |
Ancestry in Scotland County
The most populous ancestries reported in Scotland County are Lumbee (3,988 | 11.7%), English (1,980 | 5.8%), American (1,364 | 4.0%), German (841 | 2.5%), and Irish (707 | 2.1%), together accounting for 26.0% of all Scotland County residents.
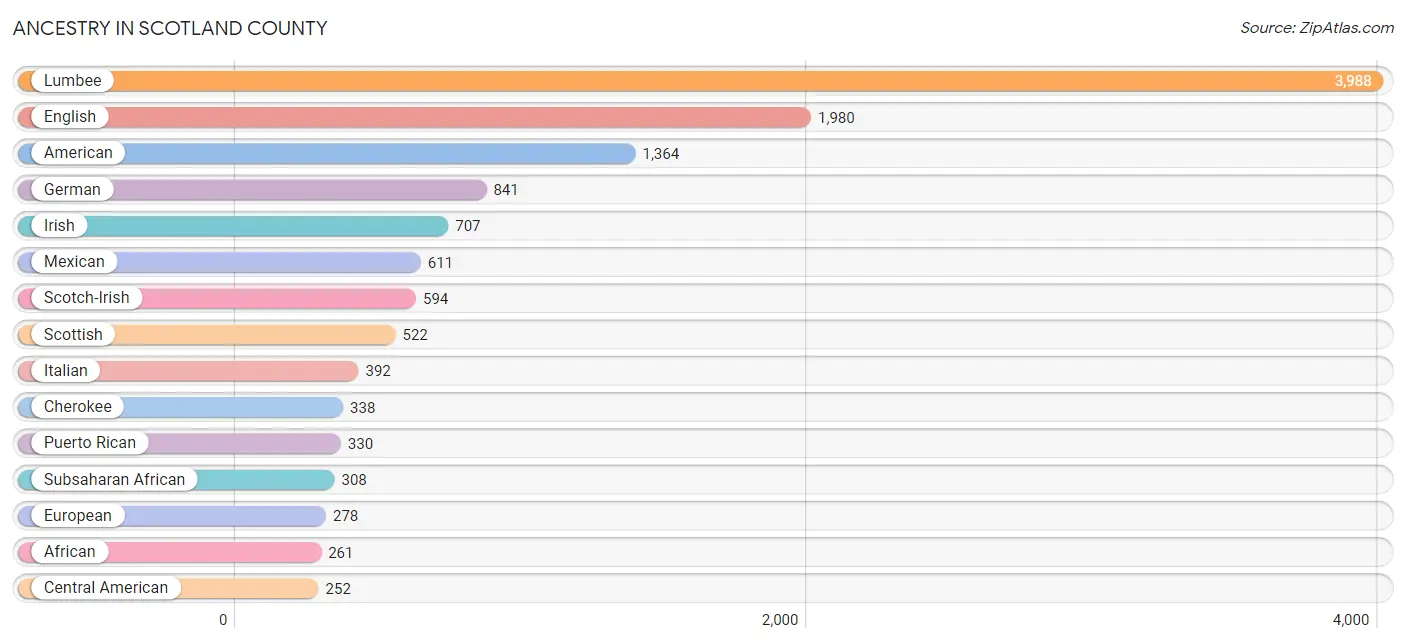
| Ancestry | # Population | % Population |
| African | 261 | 0.8% |
| American | 1,364 | 4.0% |
| Australian | 18 | 0.1% |
| Bhutanese | 25 | 0.1% |
| Brazilian | 5 | 0.0% |
| British | 136 | 0.4% |
| Celtic | 20 | 0.1% |
| Central American | 252 | 0.7% |
| Cherokee | 338 | 1.0% |
| Crow | 2 | 0.0% |
| Cuban | 2 | 0.0% |
| Czech | 37 | 0.1% |
| Danish | 41 | 0.1% |
| Dominican | 7 | 0.0% |
| Dutch | 71 | 0.2% |
| Dutch West Indian | 25 | 0.1% |
| Eastern European | 16 | 0.1% |
| English | 1,980 | 5.8% |
| European | 278 | 0.8% |
| French | 109 | 0.3% |
| French Canadian | 15 | 0.0% |
| German | 841 | 2.5% |
| Ghanaian | 13 | 0.0% |
| Greek | 10 | 0.0% |
| Guamanian / Chamorro | 6 | 0.0% |
| Guatemalan | 105 | 0.3% |
| Haitian | 2 | 0.0% |
| Honduran | 116 | 0.3% |
| Hungarian | 20 | 0.1% |
| Indian (Asian) | 51 | 0.2% |
| Iranian | 11 | 0.0% |
| Irish | 707 | 2.1% |
| Iroquois | 52 | 0.2% |
| Italian | 392 | 1.1% |
| Jamaican | 43 | 0.1% |
| Korean | 8 | 0.0% |
| Lumbee | 3,988 | 11.7% |
| Mexican | 611 | 1.8% |
| Mexican American Indian | 7 | 0.0% |
| Navajo | 56 | 0.2% |
| Nigerian | 34 | 0.1% |
| Northern European | 27 | 0.1% |
| Norwegian | 84 | 0.3% |
| Pakistani | 15 | 0.0% |
| Panamanian | 21 | 0.1% |
| Polish | 132 | 0.4% |
| Portuguese | 99 | 0.3% |
| Puerto Rican | 330 | 1.0% |
| Romanian | 28 | 0.1% |
| Russian | 70 | 0.2% |
| Salvadoran | 10 | 0.0% |
| Scotch-Irish | 594 | 1.7% |
| Scottish | 522 | 1.5% |
| South African | 13 | 0.0% |
| Sri Lankan | 6 | 0.0% |
| Subsaharan African | 308 | 0.9% |
| Swedish | 27 | 0.1% |
| Swiss | 20 | 0.1% |
| Thai | 38 | 0.1% |
| Turkish | 14 | 0.0% |
| Welsh | 101 | 0.3% |
| Zimbabwean | 7 | 0.0% | View All 62 Rows |
Immigrants in Scotland County
The most numerous immigrant groups reported in Scotland County came from Latin America (406 | 1.2%), Central America (343 | 1.0%), Mexico (166 | 0.5%), Asia (140 | 0.4%), and Europe (130 | 0.4%), together accounting for 3.5% of all Scotland County residents.
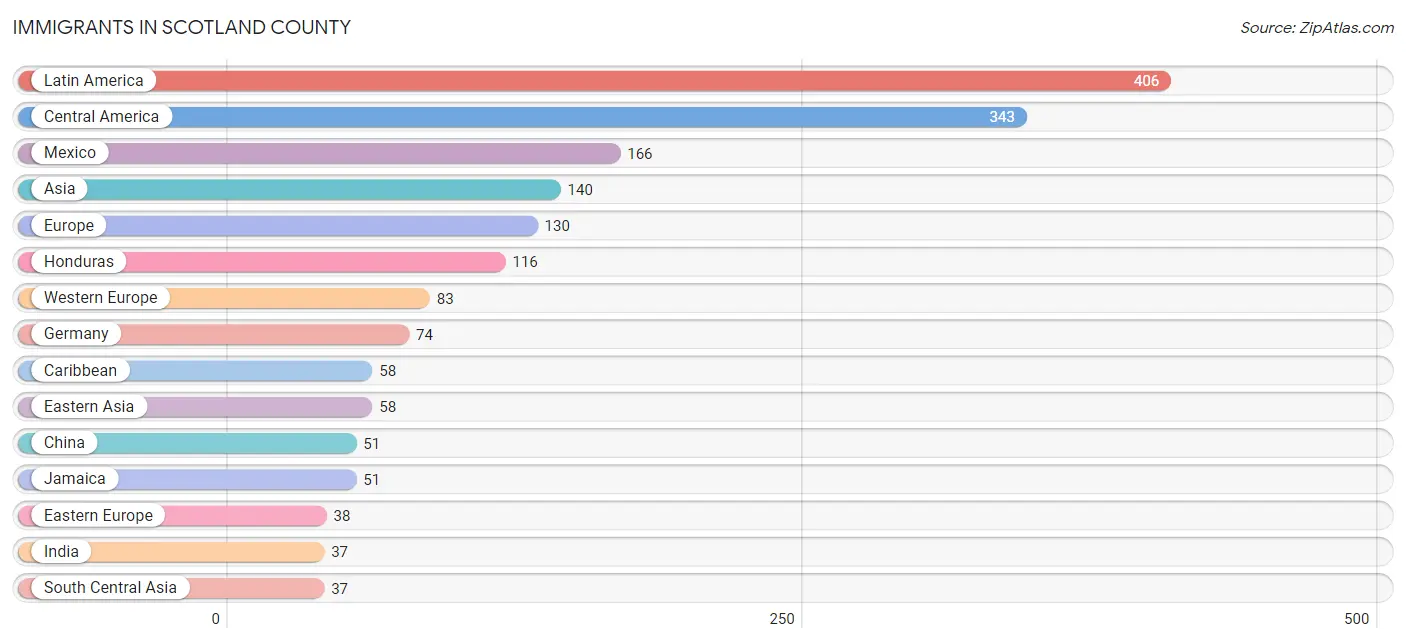
| Immigration Origin | # Population | % Population |
| Africa | 31 | 0.1% |
| Asia | 140 | 0.4% |
| Australia | 11 | 0.0% |
| Brazil | 5 | 0.0% |
| Canada | 30 | 0.1% |
| Caribbean | 58 | 0.2% |
| Central America | 343 | 1.0% |
| China | 51 | 0.2% |
| Dominican Republic | 7 | 0.0% |
| Eastern Asia | 58 | 0.2% |
| Eastern Europe | 38 | 0.1% |
| El Salvador | 23 | 0.1% |
| England | 2 | 0.0% |
| Europe | 130 | 0.4% |
| France | 9 | 0.0% |
| Germany | 74 | 0.2% |
| Guatemala | 17 | 0.1% |
| Honduras | 116 | 0.3% |
| India | 37 | 0.1% |
| Italy | 7 | 0.0% |
| Jamaica | 51 | 0.2% |
| Japan | 7 | 0.0% |
| Latin America | 406 | 1.2% |
| Mexico | 166 | 0.5% |
| Nigeria | 8 | 0.0% |
| Northern Europe | 2 | 0.0% |
| Oceania | 11 | 0.0% |
| Panama | 21 | 0.1% |
| Poland | 4 | 0.0% |
| Romania | 22 | 0.1% |
| Russia | 12 | 0.0% |
| South Africa | 23 | 0.1% |
| South America | 5 | 0.0% |
| South Central Asia | 37 | 0.1% |
| South Eastern Asia | 21 | 0.1% |
| Southern Europe | 7 | 0.0% |
| Thailand | 15 | 0.0% |
| Turkey | 14 | 0.0% |
| Vietnam | 6 | 0.0% |
| Western Africa | 8 | 0.0% |
| Western Asia | 24 | 0.1% |
| Western Europe | 83 | 0.2% |
| Yemen | 10 | 0.0% | View All 43 Rows |
Sex and Age in Scotland County
Sex and Age in Scotland County
The most populous age groups in Scotland County are 25 to 29 Years (1,338 | 7.7%) for men and Under 5 Years (1,207 | 7.2%) for women.
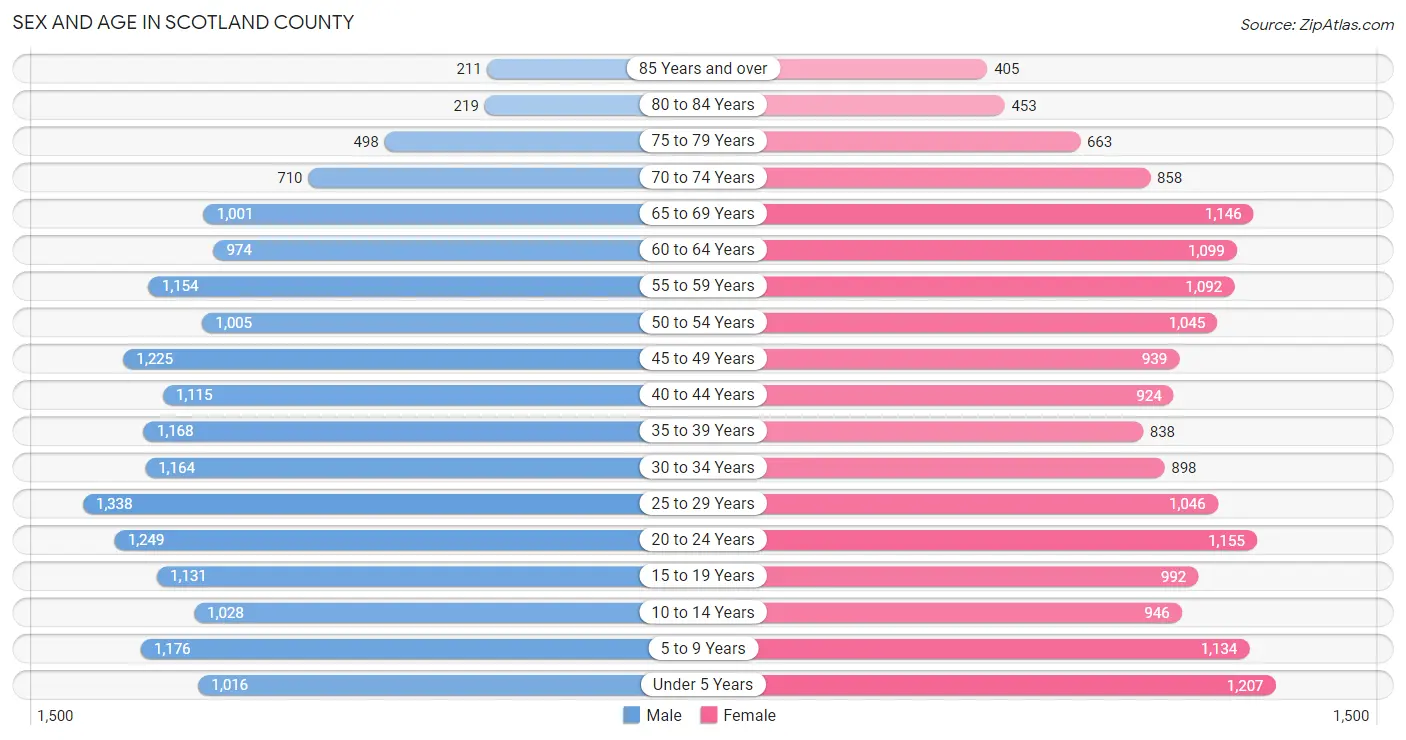
| Age Bracket | Male | Female |
| Under 5 Years | 1,016 (5.9%) | 1,207 (7.2%) |
| 5 to 9 Years | 1,176 (6.8%) | 1,134 (6.7%) |
| 10 to 14 Years | 1,028 (5.9%) | 946 (5.6%) |
| 15 to 19 Years | 1,131 (6.5%) | 992 (5.9%) |
| 20 to 24 Years | 1,249 (7.2%) | 1,155 (6.9%) |
| 25 to 29 Years | 1,338 (7.7%) | 1,046 (6.2%) |
| 30 to 34 Years | 1,164 (6.7%) | 898 (5.3%) |
| 35 to 39 Years | 1,168 (6.7%) | 838 (5.0%) |
| 40 to 44 Years | 1,115 (6.4%) | 924 (5.5%) |
| 45 to 49 Years | 1,225 (7.0%) | 939 (5.6%) |
| 50 to 54 Years | 1,005 (5.8%) | 1,045 (6.2%) |
| 55 to 59 Years | 1,154 (6.6%) | 1,092 (6.5%) |
| 60 to 64 Years | 974 (5.6%) | 1,099 (6.5%) |
| 65 to 69 Years | 1,001 (5.8%) | 1,146 (6.8%) |
| 70 to 74 Years | 710 (4.1%) | 858 (5.1%) |
| 75 to 79 Years | 498 (2.9%) | 663 (3.9%) |
| 80 to 84 Years | 219 (1.3%) | 453 (2.7%) |
| 85 Years and over | 211 (1.2%) | 405 (2.4%) |
| Total | 17,382 (100.0%) | 16,840 (100.0%) |
Families and Households in Scotland County
Median Family Size in Scotland County
The median family size in Scotland County is 3.32 persons per family, with single female/mother families (2,471 | 32.4%) accounting for the largest median family size of 3.7 persons per family. On the other hand, single male/father families (605 | 7.9%) represent the smallest median family size with 2.98 persons per family.
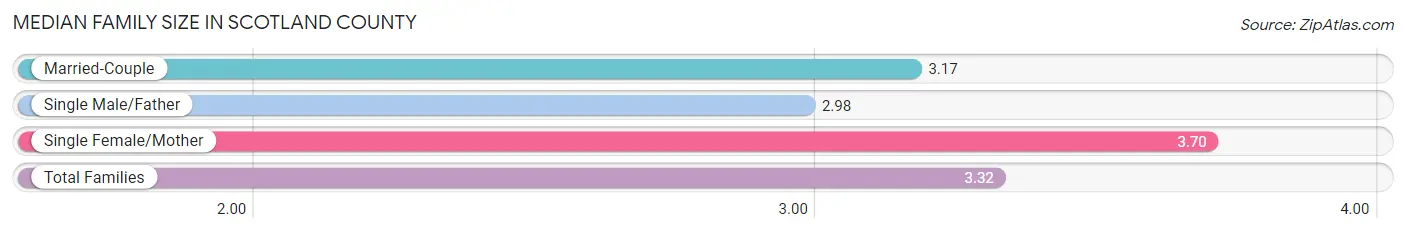
| Family Type | # Families | Family Size |
| Married-Couple | 4,552 (59.7%) | 3.17 |
| Single Male/Father | 605 (7.9%) | 2.98 |
| Single Female/Mother | 2,471 (32.4%) | 3.70 |
| Total Families | 7,628 (100.0%) | 3.32 |
Median Household Size in Scotland County
The median household size in Scotland County is 2.62 persons per household, with single female/mother households (2,471 | 20.2%) accounting for the largest median household size of 3.91 persons per household. non-family households (4,596 | 37.6%) represent the smallest median household size with 1.22 persons per household.
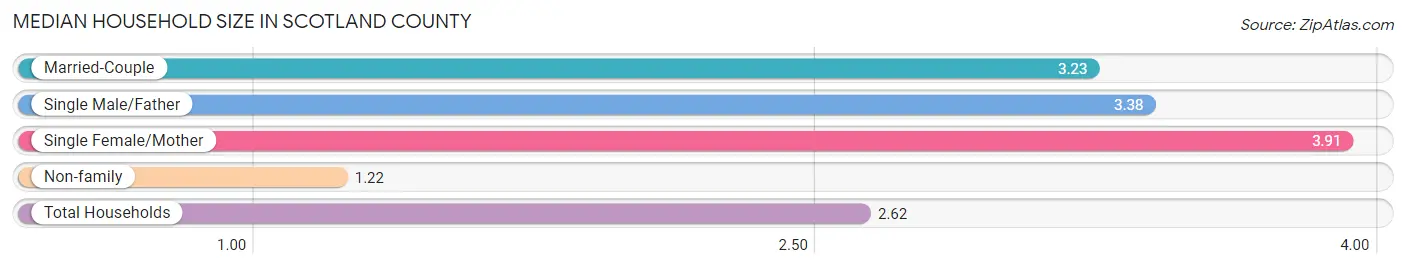
| Household Type | # Households | Household Size |
| Married-Couple | 4,552 (37.2%) | 3.23 |
| Single Male/Father | 605 (5.0%) | 3.38 |
| Single Female/Mother | 2,471 (20.2%) | 3.91 |
| Non-family | 4,596 (37.6%) | 1.22 |
| Total Households | 12,224 (100.0%) | 2.62 |
Household Size by Marriage Status in Scotland County
Out of a total of 12,224 households in Scotland County, 7,628 (62.4%) are family households, while 4,596 (37.6%) are nonfamily households. The most numerous type of family households are 2-person households, comprising 3,616, and the most common type of nonfamily households are 1-person households, comprising 4,095.
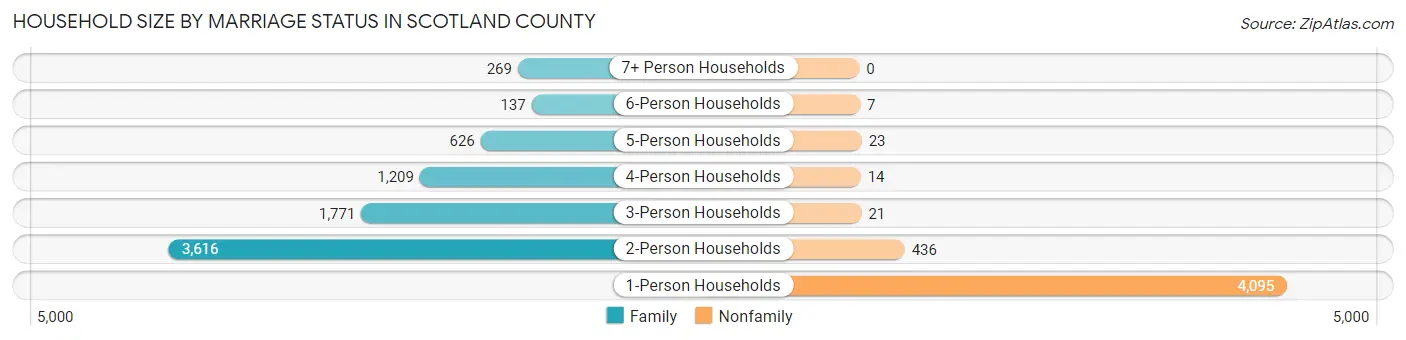
| Household Size | Family Households | Nonfamily Households |
| 1-Person Households | - | 4,095 (33.5%) |
| 2-Person Households | 3,616 (29.6%) | 436 (3.6%) |
| 3-Person Households | 1,771 (14.5%) | 21 (0.2%) |
| 4-Person Households | 1,209 (9.9%) | 14 (0.1%) |
| 5-Person Households | 626 (5.1%) | 23 (0.2%) |
| 6-Person Households | 137 (1.1%) | 7 (0.1%) |
| 7+ Person Households | 269 (2.2%) | 0 (0.0%) |
| Total | 7,628 (62.4%) | 4,596 (37.6%) |
Female Fertility in Scotland County
Fertility by Age in Scotland County
Average fertility rate in Scotland County is 59.0 births per 1,000 women. Women in the age bracket of 20 to 34 years have the highest fertility rate with 106.0 births per 1,000 women. Women in the age bracket of 20 to 34 years acount for 79.8% of all women with births.
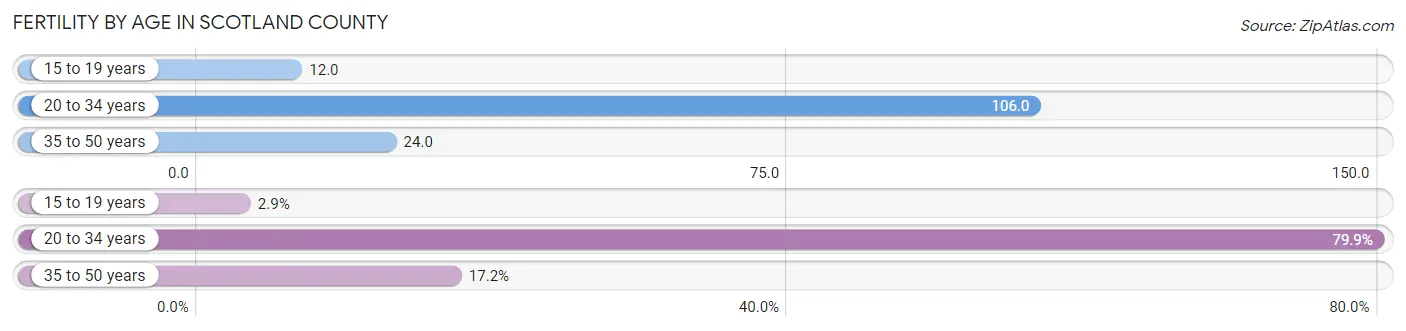
| Age Bracket | Women with Births | Births / 1,000 Women |
| 15 to 19 years | 12 (2.9%) | 12.0 |
| 20 to 34 years | 329 (79.8%) | 106.0 |
| 35 to 50 years | 71 (17.2%) | 24.0 |
| Total | 412 (100.0%) | 59.0 |
Fertility by Age by Marriage Status in Scotland County
54.6% of women with births (412) in Scotland County are married. The highest percentage of unmarried women with births falls into 15 to 19 years age bracket with 100.0% of them unmarried at the time of birth, while the lowest percentage of unmarried women with births belong to 35 to 50 years age bracket with 43.7% of them unmarried.
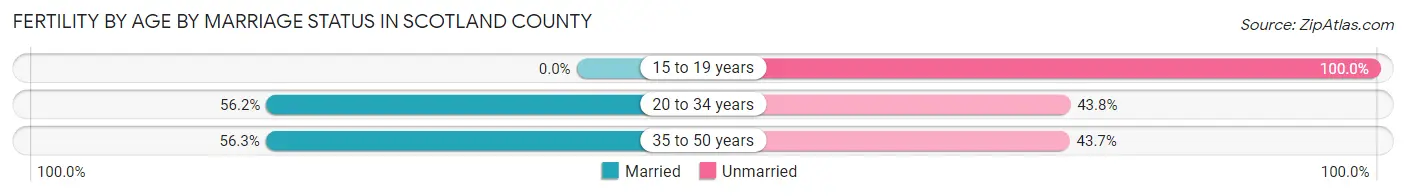
| Age Bracket | Married | Unmarried |
| 15 to 19 years | 0 (0.0%) | 12 (100.0%) |
| 20 to 34 years | 185 (56.2%) | 144 (43.8%) |
| 35 to 50 years | 40 (56.3%) | 31 (43.7%) |
| Total | 225 (54.6%) | 187 (45.4%) |
Fertility by Education in Scotland County
Average fertility rate in Scotland County is 59.0 births per 1,000 women. Women with the education attainment of college or associate's degree have the highest fertility rate of 89.0 births per 1,000 women, while women with the education attainment of graduate degree have the lowest fertility at 27.0 births per 1,000 women. Women with the education attainment of college or associate's degree represent 66.5% of all women with births.
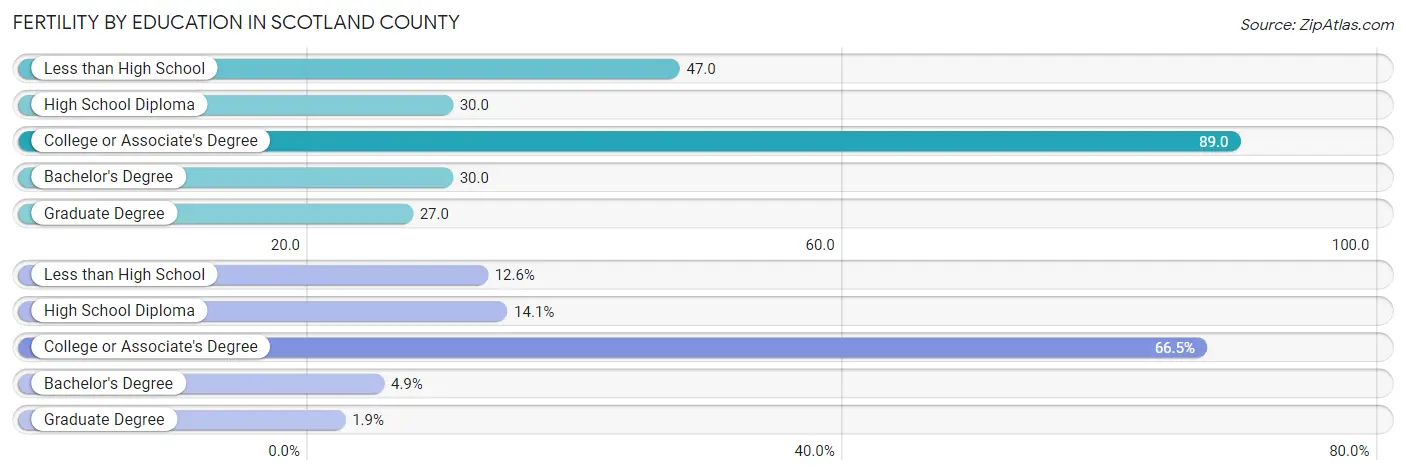
| Educational Attainment | Women with Births | Births / 1,000 Women |
| Less than High School | 52 (12.6%) | 47.0 |
| High School Diploma | 58 (14.1%) | 30.0 |
| College or Associate's Degree | 274 (66.5%) | 89.0 |
| Bachelor's Degree | 20 (4.9%) | 30.0 |
| Graduate Degree | 8 (1.9%) | 27.0 |
| Total | 412 (100.0%) | 59.0 |
Fertility by Education by Marriage Status in Scotland County
45.4% of women with births in Scotland County are unmarried. Women with the educational attainment of bachelor's degree are most likely to be married with 100.0% of them married at childbirth, while women with the educational attainment of less than high school are least likely to be married with 100.0% of them unmarried at childbirth.
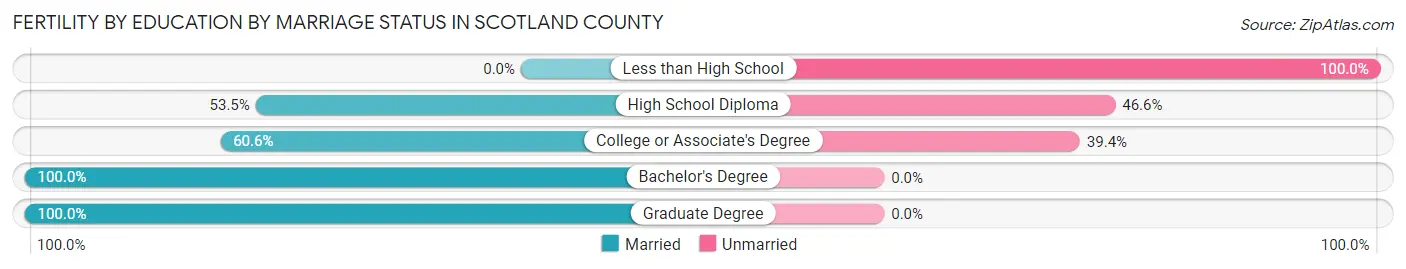
| Educational Attainment | Married | Unmarried |
| Less than High School | 0 (0.0%) | 52 (100.0%) |
| High School Diploma | 31 (53.4%) | 27 (46.6%) |
| College or Associate's Degree | 166 (60.6%) | 108 (39.4%) |
| Bachelor's Degree | 20 (100.0%) | 0 (0.0%) |
| Graduate Degree | 8 (100.0%) | 0 (0.0%) |
| Total | 225 (54.6%) | 187 (45.4%) |
Income in Scotland County
Income Overview in Scotland County
Per Capita Income in Scotland County is $24,464, while median incomes of families and households are $51,937 and $41,948 respectively.
| Characteristic | Number | Measure |
| Per Capita Income | 34,222 | $24,464 |
| Median Family Income | 7,628 | $51,937 |
| Mean Family Income | 7,628 | $72,584 |
| Median Household Income | 12,224 | $41,948 |
| Mean Household Income | 12,224 | $61,126 |
| Income Deficit | 7,628 | $11,503 |
| Wage / Income Gap (%) | 34,222 | 30.24% |
| Wage / Income Gap ($) | 34,222 | 69.76¢ per $1 |
| Gini / Inequality Index | 34,222 | 0.50 |
Earnings by Sex in Scotland County
Average Earnings in Scotland County are $30,566, $36,376 for men and $25,377 for women, a difference of 30.2%.
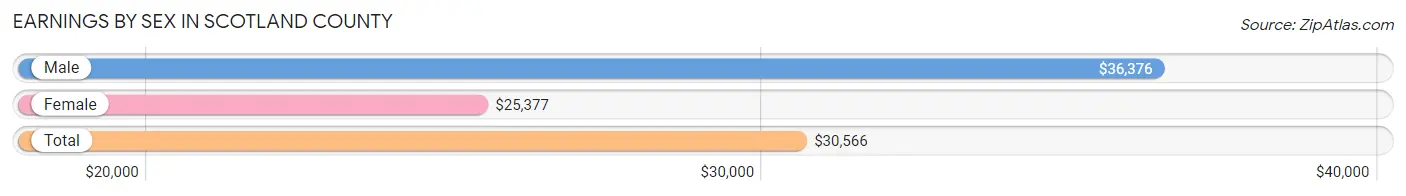
| Sex | Number | Average Earnings |
| Male | 7,394 (51.8%) | $36,376 |
| Female | 6,890 (48.2%) | $25,377 |
| Total | 14,284 (100.0%) | $30,566 |
Earnings by Sex by Income Bracket in Scotland County
The most common earnings brackets in Scotland County are $35,000 to $39,999 for men (632 | 8.6%) and $25,000 to $29,999 for women (603 | 8.7%).
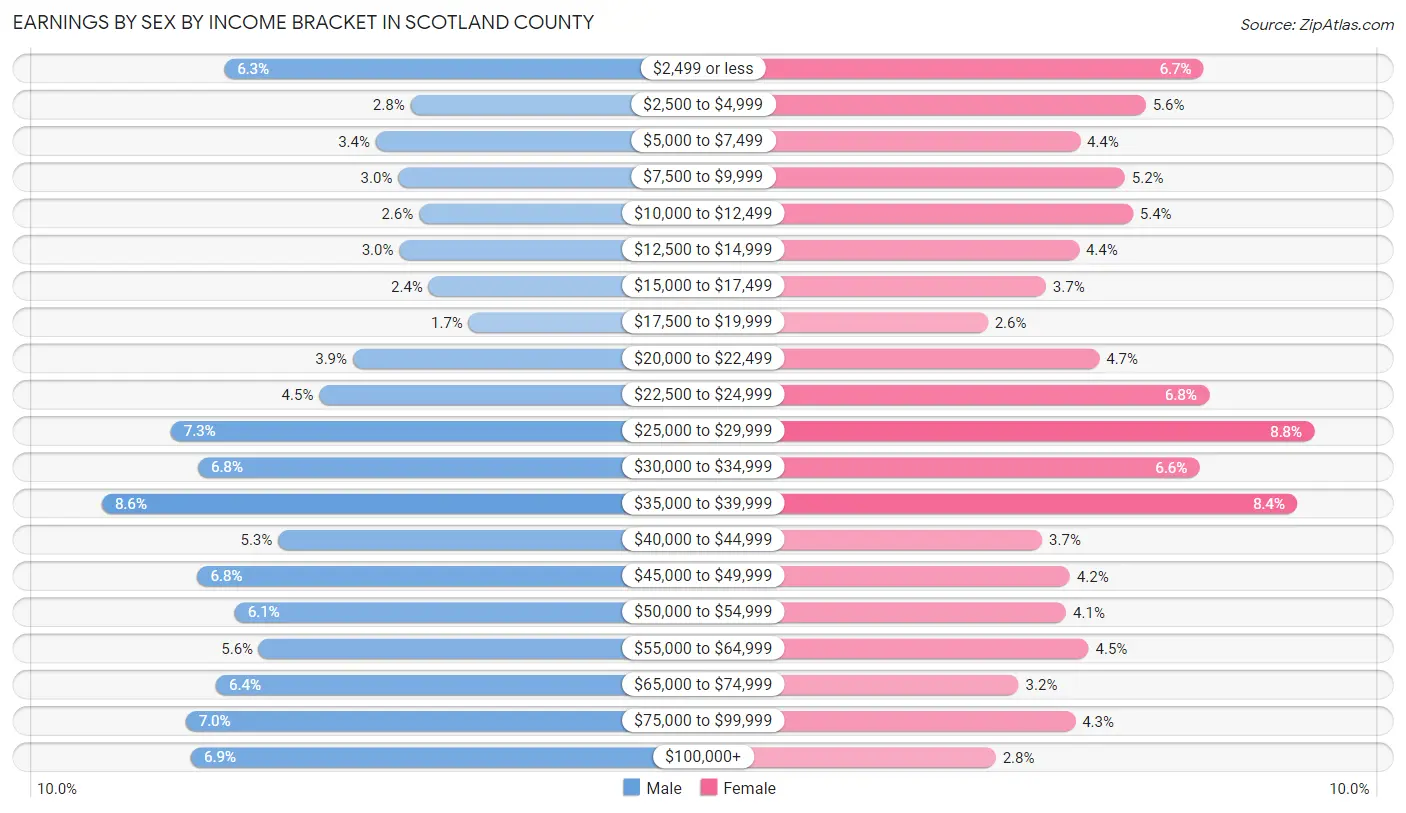
| Income | Male | Female |
| $2,499 or less | 463 (6.3%) | 460 (6.7%) |
| $2,500 to $4,999 | 205 (2.8%) | 386 (5.6%) |
| $5,000 to $7,499 | 253 (3.4%) | 301 (4.4%) |
| $7,500 to $9,999 | 222 (3.0%) | 359 (5.2%) |
| $10,000 to $12,499 | 193 (2.6%) | 369 (5.4%) |
| $12,500 to $14,999 | 220 (3.0%) | 300 (4.3%) |
| $15,000 to $17,499 | 180 (2.4%) | 257 (3.7%) |
| $17,500 to $19,999 | 124 (1.7%) | 182 (2.6%) |
| $20,000 to $22,499 | 285 (3.8%) | 326 (4.7%) |
| $22,500 to $24,999 | 331 (4.5%) | 467 (6.8%) |
| $25,000 to $29,999 | 537 (7.3%) | 603 (8.7%) |
| $30,000 to $34,999 | 499 (6.8%) | 455 (6.6%) |
| $35,000 to $39,999 | 632 (8.6%) | 581 (8.4%) |
| $40,000 to $44,999 | 388 (5.2%) | 252 (3.7%) |
| $45,000 to $49,999 | 500 (6.8%) | 288 (4.2%) |
| $50,000 to $54,999 | 448 (6.1%) | 283 (4.1%) |
| $55,000 to $64,999 | 415 (5.6%) | 312 (4.5%) |
| $65,000 to $74,999 | 474 (6.4%) | 222 (3.2%) |
| $75,000 to $99,999 | 516 (7.0%) | 295 (4.3%) |
| $100,000+ | 509 (6.9%) | 192 (2.8%) |
| Total | 7,394 (100.0%) | 6,890 (100.0%) |
Earnings by Sex by Educational Attainment in Scotland County
Average earnings in Scotland County are $40,094 for men and $29,723 for women, a difference of 25.9%. Men with an educational attainment of bachelor's degree enjoy the highest average annual earnings of $68,403, while those with less than high school education earn the least with $27,561. Women with an educational attainment of graduate degree earn the most with the average annual earnings of $58,143, while those with high school diploma education have the smallest earnings of $24,086.
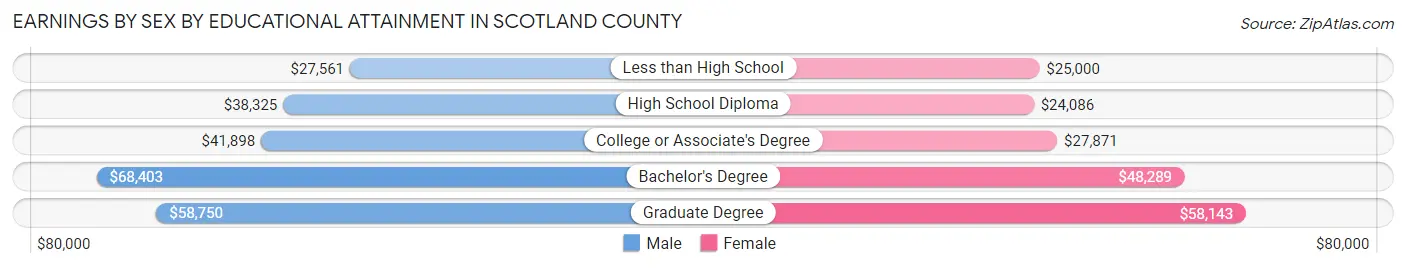
| Educational Attainment | Male Income | Female Income |
| Less than High School | $27,561 | $25,000 |
| High School Diploma | $38,325 | $24,086 |
| College or Associate's Degree | $41,898 | $27,871 |
| Bachelor's Degree | $68,403 | $48,289 |
| Graduate Degree | $58,750 | $58,143 |
| Total | $40,094 | $29,723 |
Family Income in Scotland County
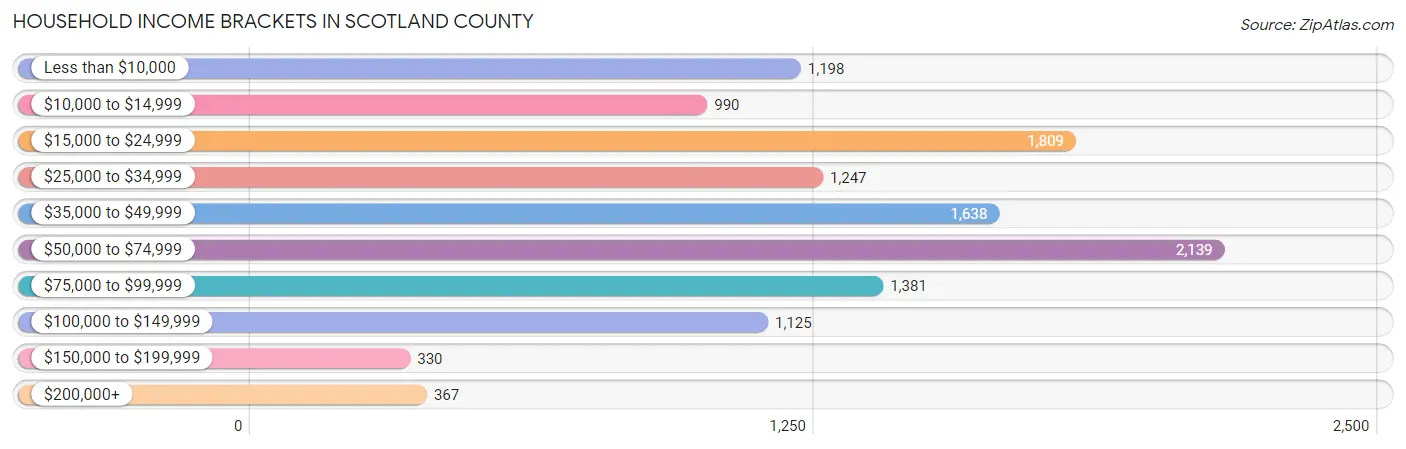
Family Income Brackets in Scotland County
According to the Scotland County family income data, there are 1,457 families falling into the $50,000 to $74,999 income range, which is the most common income bracket and makes up 19.1% of all families. Conversely, the $150,000 to $199,999 income bracket is the least frequent group with only 297 families (3.9%) belonging to this category.
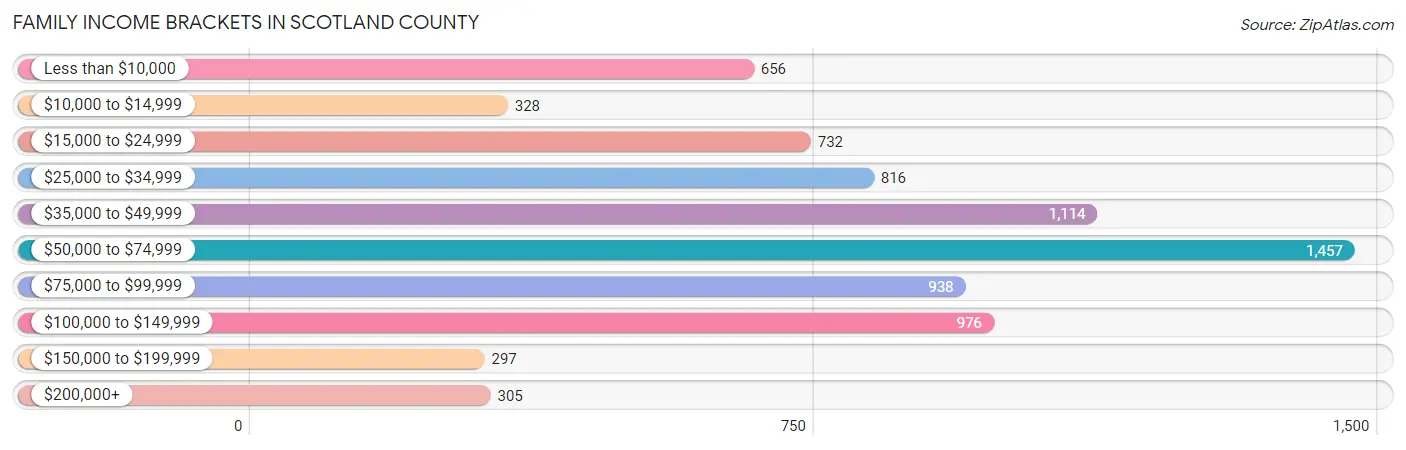
| Income Bracket | # Families | % Families |
| Less than $10,000 | 656 | 8.6% |
| $10,000 to $14,999 | 328 | 4.3% |
| $15,000 to $24,999 | 732 | 9.6% |
| $25,000 to $34,999 | 816 | 10.7% |
| $35,000 to $49,999 | 1,114 | 14.6% |
| $50,000 to $74,999 | 1,457 | 19.1% |
| $75,000 to $99,999 | 938 | 12.3% |
| $100,000 to $149,999 | 976 | 12.8% |
| $150,000 to $199,999 | 297 | 3.9% |
| $200,000+ | 305 | 4.0% |
Family Income by Famaliy Size in Scotland County
5-person families (441 | 5.8%) account for the highest median family income in Scotland County with $73,750 per family, while 2-person families (3,769 | 49.4%) have the highest median income of $26,224 per family member.
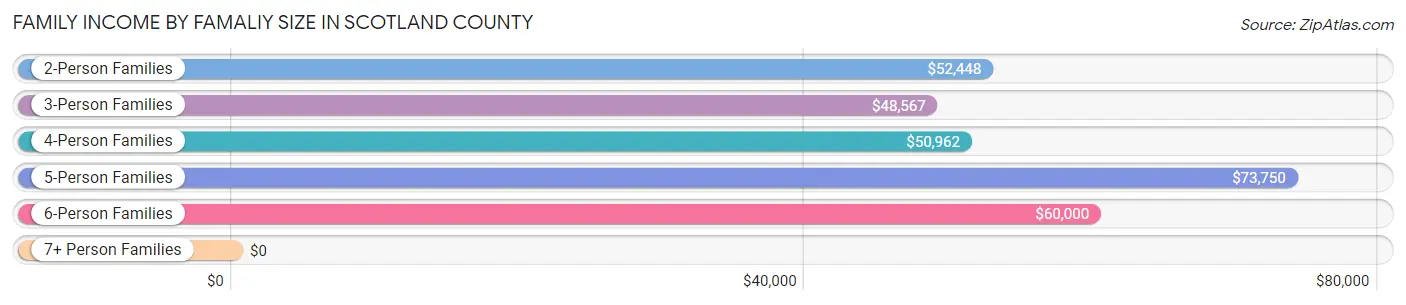
| Income Bracket | # Families | Median Income |
| 2-Person Families | 3,769 (49.4%) | $52,448 |
| 3-Person Families | 1,873 (24.5%) | $48,567 |
| 4-Person Families | 1,208 (15.8%) | $50,962 |
| 5-Person Families | 441 (5.8%) | $73,750 |
| 6-Person Families | 128 (1.7%) | $60,000 |
| 7+ Person Families | 209 (2.7%) | $0 |
| Total | 7,628 (100.0%) | $51,937 |
Family Income by Number of Earners in Scotland County
The median family income in Scotland County is $51,937, with families comprising 3+ earners (422) having the highest median family income of $106,071, while families with no earners (1,762) have the lowest median family income of $29,307, accounting for 5.5% and 23.1% of families, respectively.
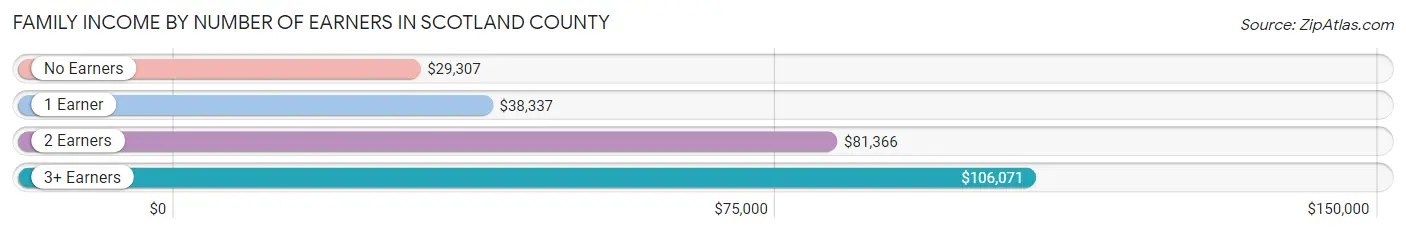
| Number of Earners | # Families | Median Income |
| No Earners | 1,762 (23.1%) | $29,307 |
| 1 Earner | 3,061 (40.1%) | $38,337 |
| 2 Earners | 2,383 (31.2%) | $81,366 |
| 3+ Earners | 422 (5.5%) | $106,071 |
| Total | 7,628 (100.0%) | $51,937 |
Household Income in Scotland County
Household Income Brackets in Scotland County
With 2,139 households falling in the category, the $50,000 to $74,999 income range is the most frequent in Scotland County, accounting for 17.5% of all households. In contrast, only 330 households (2.7%) fall into the $150,000 to $199,999 income bracket, making it the least populous group.
| Income Bracket | # Households | % Households |
| Less than $10,000 | 1,198 | 9.8% |
| $10,000 to $14,999 | 990 | 8.1% |
| $15,000 to $24,999 | 1,809 | 14.8% |
| $25,000 to $34,999 | 1,247 | 10.2% |
| $35,000 to $49,999 | 1,638 | 13.4% |
| $50,000 to $74,999 | 2,139 | 17.5% |
| $75,000 to $99,999 | 1,381 | 11.3% |
| $100,000 to $149,999 | 1,125 | 9.2% |
| $150,000 to $199,999 | 330 | 2.7% |
| $200,000+ | 367 | 3.0% |
Household Income by Householder Age in Scotland County
The median household income in Scotland County is $41,948, with the highest median household income of $52,021 found in the 45 to 64 years age bracket for the primary householder. A total of 4,415 households (36.1%) fall into this category. Meanwhile, the 15 to 24 years age bracket for the primary householder has the lowest median household income of $28,438, with 549 households (4.5%) in this group.

| Income Bracket | # Households | Median Income |
| 15 to 24 Years | 549 (4.5%) | $28,438 |
| 25 to 44 Years | 3,363 (27.5%) | $42,465 |
| 45 to 64 Years | 4,415 (36.1%) | $52,021 |
| 65+ Years | 3,897 (31.9%) | $32,954 |
| Total | 12,224 (100.0%) | $41,948 |
Poverty in Scotland County
Income Below Poverty by Sex and Age in Scotland County
With 25.0% poverty level for males and 27.2% for females among the residents of Scotland County, 6 to 11 year old males and 5 year old females are the most vulnerable to poverty, with 645 males (54.3%) and 88 females (55.0%) in their respective age groups living below the poverty level.
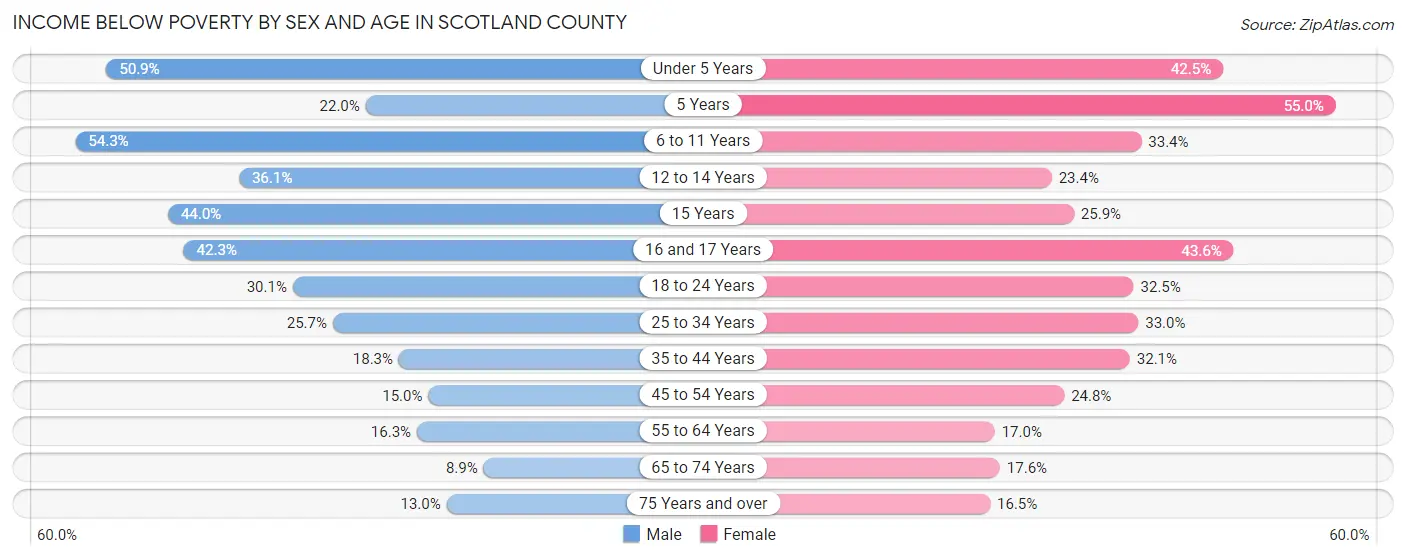
| Age Bracket | Male | Female |
| Under 5 Years | 517 (50.9%) | 512 (42.4%) |
| 5 Years | 61 (22.0%) | 88 (55.0%) |
| 6 to 11 Years | 645 (54.3%) | 436 (33.4%) |
| 12 to 14 Years | 251 (36.1%) | 126 (23.4%) |
| 15 Years | 107 (44.0%) | 91 (25.9%) |
| 16 and 17 Years | 156 (42.3%) | 127 (43.6%) |
| 18 to 24 Years | 412 (30.1%) | 428 (32.5%) |
| 25 to 34 Years | 527 (25.7%) | 642 (33.0%) |
| 35 to 44 Years | 341 (18.3%) | 565 (32.1%) |
| 45 to 54 Years | 309 (15.0%) | 485 (24.8%) |
| 55 to 64 Years | 339 (16.3%) | 373 (17.0%) |
| 65 to 74 Years | 142 (8.9%) | 350 (17.6%) |
| 75 Years and over | 109 (13.0%) | 221 (16.5%) |
| Total | 3,916 (25.0%) | 4,444 (27.2%) |
Income Above Poverty by Sex and Age in Scotland County
According to the poverty statistics in Scotland County, males aged 65 to 74 years and females aged 75 years and over are the age groups that are most secure financially, with 91.1% of males and 83.5% of females in these age groups living above the poverty line.
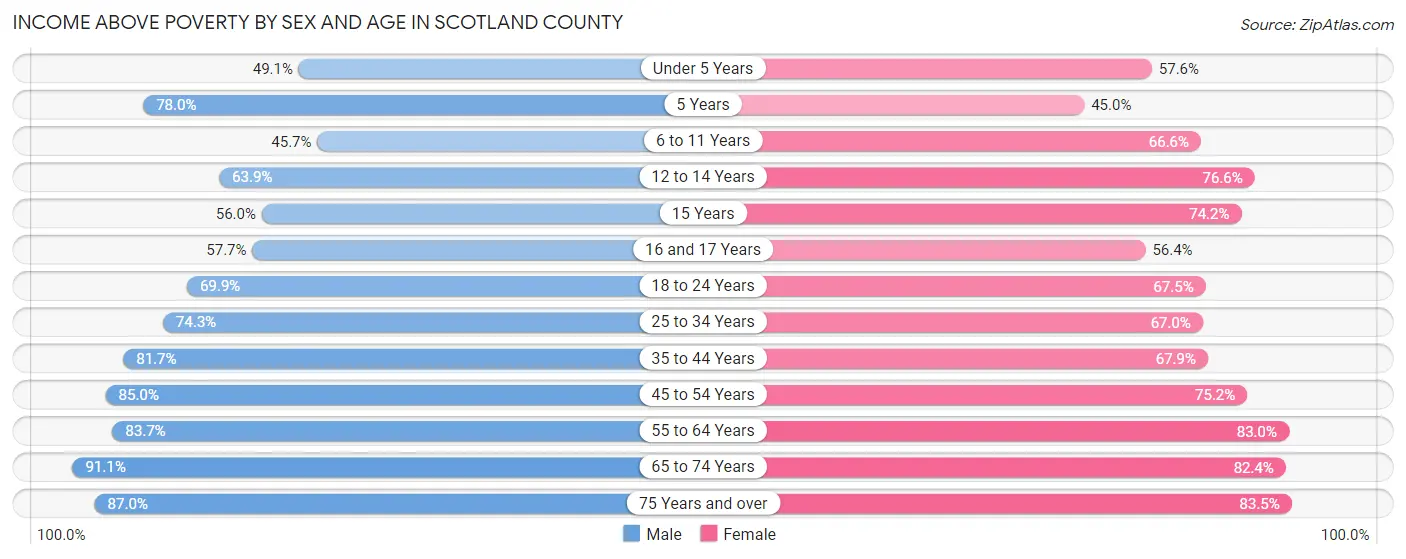
| Age Bracket | Male | Female |
| Under 5 Years | 499 (49.1%) | 694 (57.6%) |
| 5 Years | 216 (78.0%) | 72 (45.0%) |
| 6 to 11 Years | 542 (45.7%) | 871 (66.6%) |
| 12 to 14 Years | 444 (63.9%) | 413 (76.6%) |
| 15 Years | 136 (56.0%) | 261 (74.2%) |
| 16 and 17 Years | 213 (57.7%) | 164 (56.4%) |
| 18 to 24 Years | 955 (69.9%) | 889 (67.5%) |
| 25 to 34 Years | 1,525 (74.3%) | 1,302 (67.0%) |
| 35 to 44 Years | 1,520 (81.7%) | 1,196 (67.9%) |
| 45 to 54 Years | 1,746 (85.0%) | 1,473 (75.2%) |
| 55 to 64 Years | 1,739 (83.7%) | 1,817 (83.0%) |
| 65 to 74 Years | 1,456 (91.1%) | 1,637 (82.4%) |
| 75 Years and over | 729 (87.0%) | 1,117 (83.5%) |
| Total | 11,720 (75.0%) | 11,906 (72.8%) |
Income Below Poverty Among Married-Couple Families in Scotland County
The poverty statistics for married-couple families in Scotland County show that 5.6% or 256 of the total 4,552 families live below the poverty line. Families with 5 or more children have the highest poverty rate of 100.0%, comprising of 32 families. On the other hand, families with 1 or 2 children have the lowest poverty rate of 4.5%, which includes 52 families.
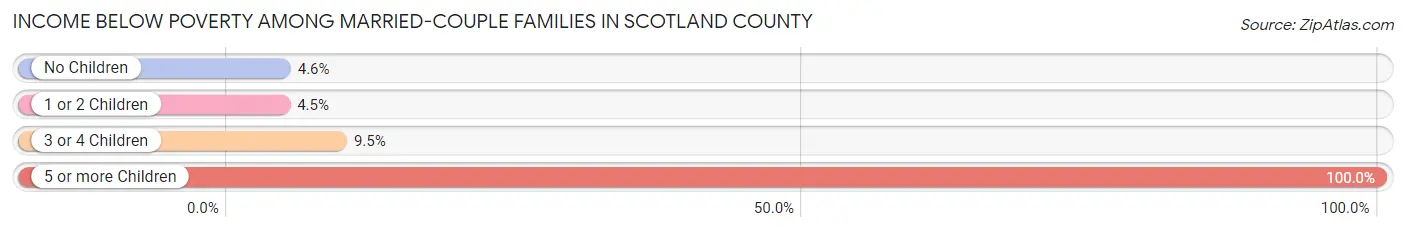
| Children | Above Poverty | Below Poverty |
| No Children | 2,888 (95.4%) | 139 (4.6%) |
| 1 or 2 Children | 1,093 (95.5%) | 52 (4.5%) |
| 3 or 4 Children | 315 (90.5%) | 33 (9.5%) |
| 5 or more Children | 0 (0.0%) | 32 (100.0%) |
| Total | 4,296 (94.4%) | 256 (5.6%) |
Income Below Poverty Among Single-Parent Households in Scotland County
According to the poverty data in Scotland County, 37.5% or 227 single-father households and 46.7% or 1,154 single-mother households are living below the poverty line. Among single-father households, those with 3 or 4 children have the highest poverty rate, with 124 households (84.9%) experiencing poverty. Likewise, among single-mother households, those with 3 or 4 children have the highest poverty rate, with 171 households (62.4%) falling below the poverty line.
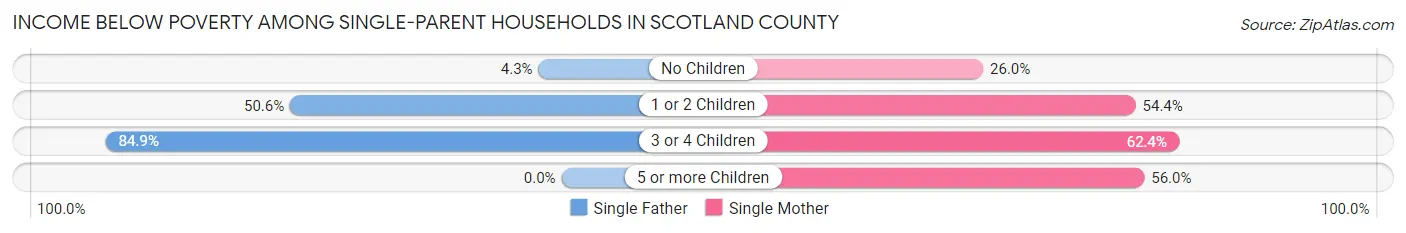
| Children | Single Father | Single Mother |
| No Children | 12 (4.3%) | 195 (26.0%) |
| 1 or 2 Children | 91 (50.6%) | 732 (54.4%) |
| 3 or 4 Children | 124 (84.9%) | 171 (62.4%) |
| 5 or more Children | 0 (0.0%) | 56 (56.0%) |
| Total | 227 (37.5%) | 1,154 (46.7%) |
Income Below Poverty Among Married-Couple vs Single-Parent Households in Scotland County
The poverty data for Scotland County shows that 256 of the married-couple family households (5.6%) and 1,381 of the single-parent households (44.9%) are living below the poverty level. Within the married-couple family households, those with 5 or more children have the highest poverty rate, with 32 households (100.0%) falling below the poverty line. Among the single-parent households, those with 3 or 4 children have the highest poverty rate, with 295 household (70.2%) living below poverty.
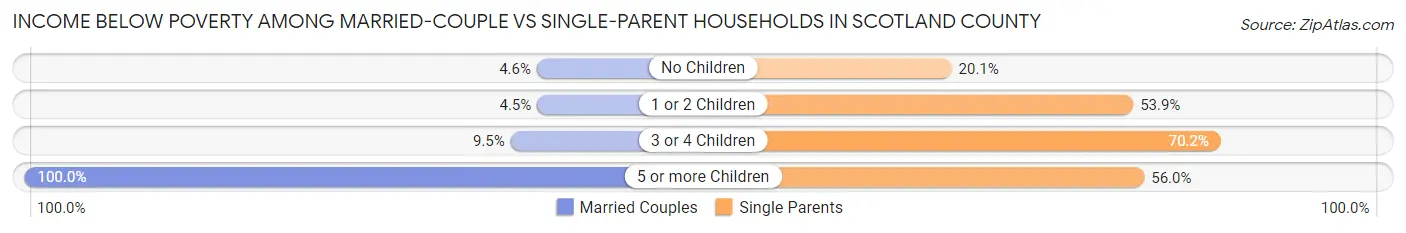
| Children | Married-Couple Families | Single-Parent Households |
| No Children | 139 (4.6%) | 207 (20.1%) |
| 1 or 2 Children | 52 (4.5%) | 823 (53.9%) |
| 3 or 4 Children | 33 (9.5%) | 295 (70.2%) |
| 5 or more Children | 32 (100.0%) | 56 (56.0%) |
| Total | 256 (5.6%) | 1,381 (44.9%) |
Employment Characteristics in Scotland County
Employment by Class of Employer in Scotland County
Among the 12,134 employed individuals in Scotland County, private company employees (8,798 | 72.5%), state government employees (907 | 7.5%), and not-for-profit organizations (698 | 5.8%) make up the most common classes of employment.
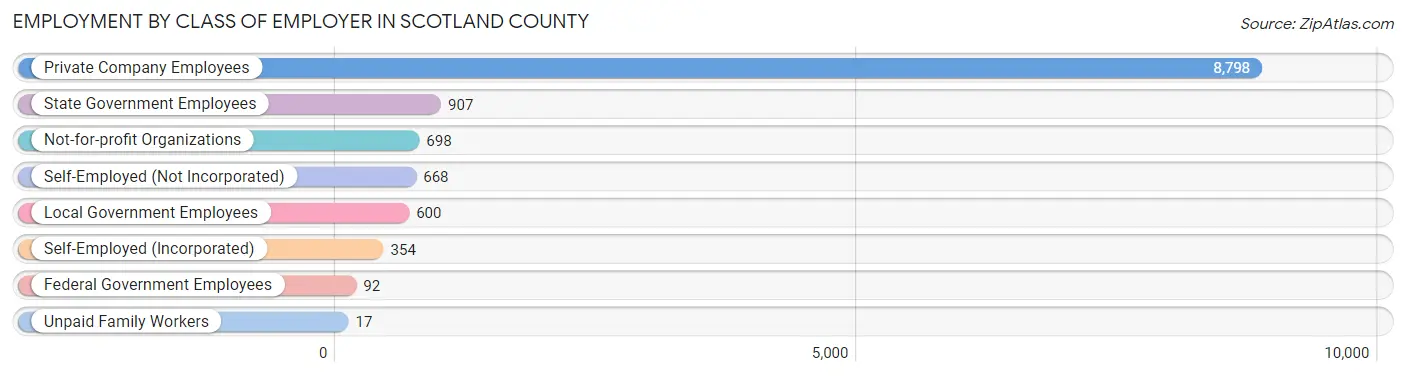
| Employer Class | # Employees | % Employees |
| Private Company Employees | 8,798 | 72.5% |
| Self-Employed (Incorporated) | 354 | 2.9% |
| Self-Employed (Not Incorporated) | 668 | 5.5% |
| Not-for-profit Organizations | 698 | 5.8% |
| Local Government Employees | 600 | 4.9% |
| State Government Employees | 907 | 7.5% |
| Federal Government Employees | 92 | 0.8% |
| Unpaid Family Workers | 17 | 0.1% |
| Total | 12,134 | 100.0% |
Employment Status by Age in Scotland County
According to the labor force statistics for Scotland County, out of the total population over 16 years of age (27,120), 52.4% or 14,211 individuals are in the labor force, with 10.8% or 1,535 of them unemployed. The age group with the highest labor force participation rate is 30 to 34 years, with 75.6% or 1,559 individuals in the labor force. Within the labor force, the 25 to 29 years age range has the highest percentage of unemployed individuals, with 20.8% or 347 of them being unemployed.
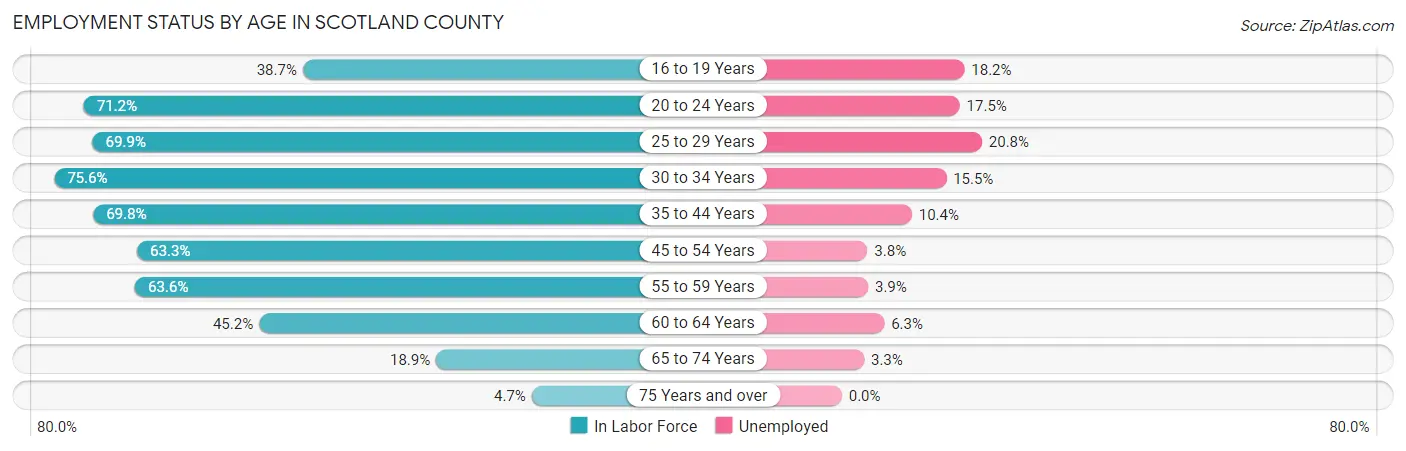
| Age Bracket | In Labor Force | Unemployed |
| 16 to 19 Years | 591 (38.7%) | 108 (18.2%) |
| 20 to 24 Years | 1,712 (71.2%) | 300 (17.5%) |
| 25 to 29 Years | 1,666 (69.9%) | 347 (20.8%) |
| 30 to 34 Years | 1,559 (75.6%) | 242 (15.5%) |
| 35 to 44 Years | 2,823 (69.8%) | 294 (10.4%) |
| 45 to 54 Years | 2,667 (63.3%) | 101 (3.8%) |
| 55 to 59 Years | 1,428 (63.6%) | 56 (3.9%) |
| 60 to 64 Years | 937 (45.2%) | 59 (6.3%) |
| 65 to 74 Years | 702 (18.9%) | 23 (3.3%) |
| 75 Years and over | 115 (4.7%) | 0 (0.0%) |
| Total | 14,211 (52.4%) | 1,535 (10.8%) |
Employment Status by Educational Attainment in Scotland County
According to labor force statistics for Scotland County, 65.1% of individuals (11,083) out of the total population between 25 and 64 years of age (17,024) are in the labor force, with 9.9% or 1,097 of them being unemployed. The group with the highest labor force participation rate are those with the educational attainment of bachelor's degree or higher, with 81.5% or 1,965 individuals in the labor force. Within the labor force, individuals with less than high school education have the highest percentage of unemployment, with 15.1% or 162 of them being unemployed.
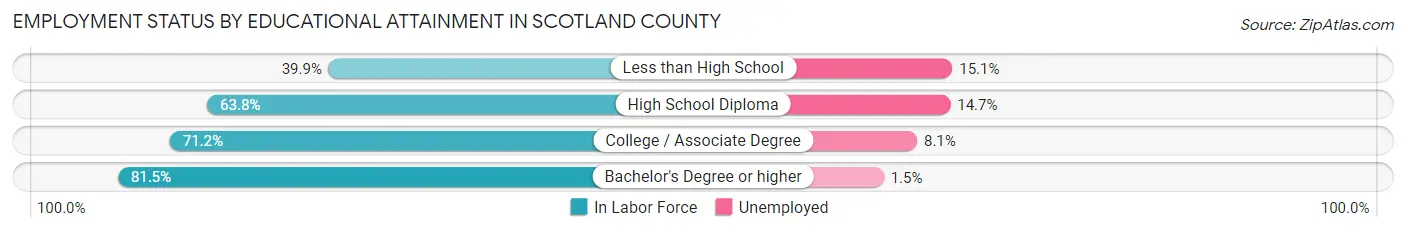
| Educational Attainment | In Labor Force | Unemployed |
| Less than High School | 1,076 (39.9%) | 407 (15.1%) |
| High School Diploma | 3,865 (63.8%) | 891 (14.7%) |
| College / Associate Degree | 4,172 (71.2%) | 475 (8.1%) |
| Bachelor's Degree or higher | 1,965 (81.5%) | 36 (1.5%) |
| Total | 11,083 (65.1%) | 1,685 (9.9%) |
Employment Occupations by Sex in Scotland County
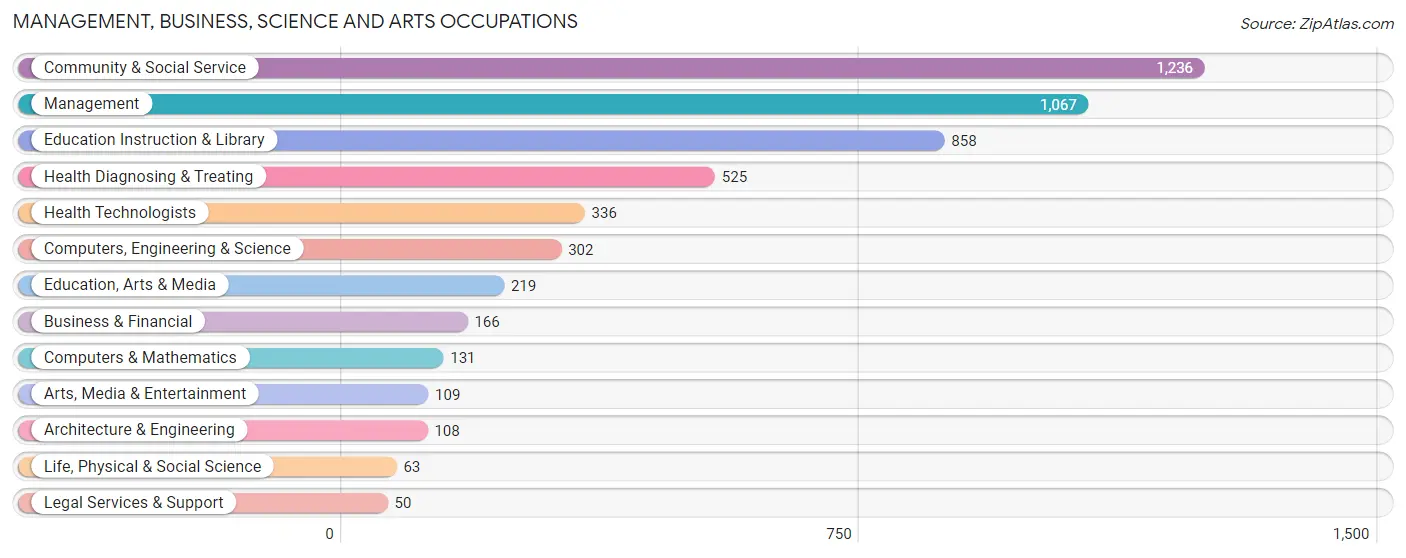
Management, Business, Science and Arts Occupations
The most common Management, Business, Science and Arts occupations in Scotland County are Community & Social Service (1,236 | 9.8%), Management (1,067 | 8.4%), Education Instruction & Library (858 | 6.8%), Health Diagnosing & Treating (525 | 4.1%), and Health Technologists (336 | 2.6%).
Management, Business, Science and Arts Occupations by Sex
Within the Management, Business, Science and Arts occupations in Scotland County, the most male-oriented occupations are Architecture & Engineering (85.2%), Computers & Mathematics (78.6%), and Computers, Engineering & Science (77.1%), while the most female-oriented occupations are Legal Services & Support (100.0%), Health Diagnosing & Treating (83.1%), and Education Instruction & Library (82.5%).
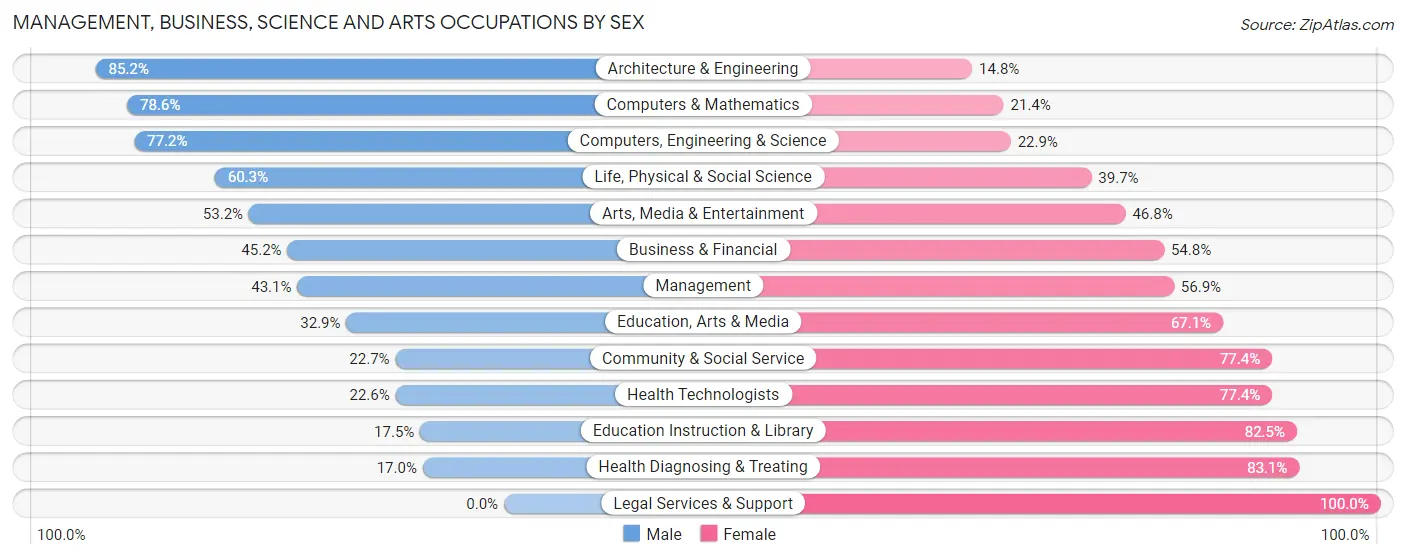
| Occupation | Male | Female |
| Management | 460 (43.1%) | 607 (56.9%) |
| Business & Financial | 75 (45.2%) | 91 (54.8%) |
| Computers, Engineering & Science | 233 (77.1%) | 69 (22.9%) |
| Computers & Mathematics | 103 (78.6%) | 28 (21.4%) |
| Architecture & Engineering | 92 (85.2%) | 16 (14.8%) |
| Life, Physical & Social Science | 38 (60.3%) | 25 (39.7%) |
| Community & Social Service | 280 (22.7%) | 956 (77.3%) |
| Education, Arts & Media | 72 (32.9%) | 147 (67.1%) |
| Legal Services & Support | 0 (0.0%) | 50 (100.0%) |
| Education Instruction & Library | 150 (17.5%) | 708 (82.5%) |
| Arts, Media & Entertainment | 58 (53.2%) | 51 (46.8%) |
| Health Diagnosing & Treating | 89 (17.0%) | 436 (83.1%) |
| Health Technologists | 76 (22.6%) | 260 (77.4%) |
| Total (Category) | 1,137 (34.5%) | 2,159 (65.5%) |
| Total (Overall) | 6,542 (51.6%) | 6,131 (48.4%) |
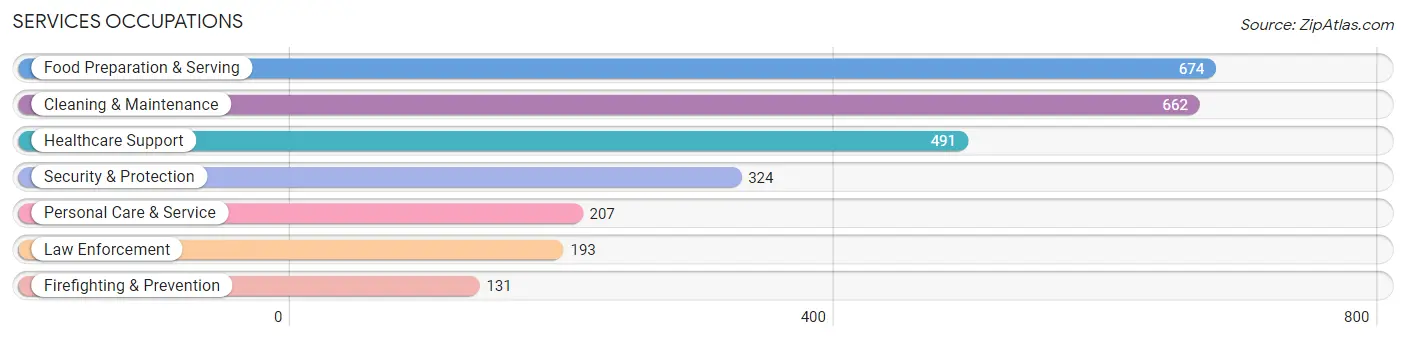
Services Occupations
The most common Services occupations in Scotland County are Food Preparation & Serving (674 | 5.3%), Cleaning & Maintenance (662 | 5.2%), Healthcare Support (491 | 3.9%), Security & Protection (324 | 2.6%), and Personal Care & Service (207 | 1.6%).
Services Occupations by Sex
Within the Services occupations in Scotland County, the most male-oriented occupations are Law Enforcement (76.7%), Cleaning & Maintenance (68.7%), and Security & Protection (68.5%), while the most female-oriented occupations are Healthcare Support (79.6%), Personal Care & Service (69.6%), and Food Preparation & Serving (64.1%).
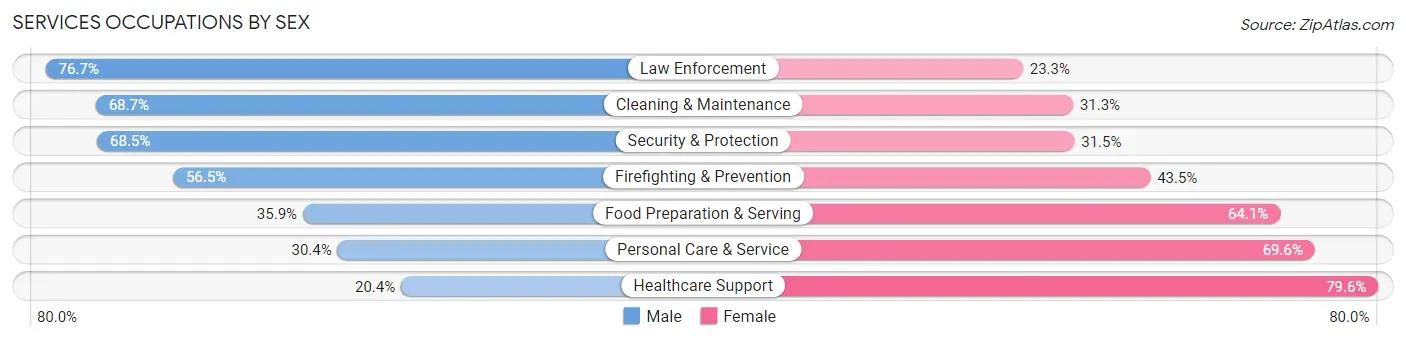
| Occupation | Male | Female |
| Healthcare Support | 100 (20.4%) | 391 (79.6%) |
| Security & Protection | 222 (68.5%) | 102 (31.5%) |
| Firefighting & Prevention | 74 (56.5%) | 57 (43.5%) |
| Law Enforcement | 148 (76.7%) | 45 (23.3%) |
| Food Preparation & Serving | 242 (35.9%) | 432 (64.1%) |
| Cleaning & Maintenance | 455 (68.7%) | 207 (31.3%) |
| Personal Care & Service | 63 (30.4%) | 144 (69.6%) |
| Total (Category) | 1,082 (45.9%) | 1,276 (54.1%) |
| Total (Overall) | 6,542 (51.6%) | 6,131 (48.4%) |
Sales and Office Occupations
The most common Sales and Office occupations in Scotland County are Office & Administration (1,191 | 9.4%), and Sales & Related (1,123 | 8.9%).

Sales and Office Occupations by Sex

| Occupation | Male | Female |
| Sales & Related | 467 (41.6%) | 656 (58.4%) |
| Office & Administration | 168 (14.1%) | 1,023 (85.9%) |
| Total (Category) | 635 (27.4%) | 1,679 (72.6%) |
| Total (Overall) | 6,542 (51.6%) | 6,131 (48.4%) |
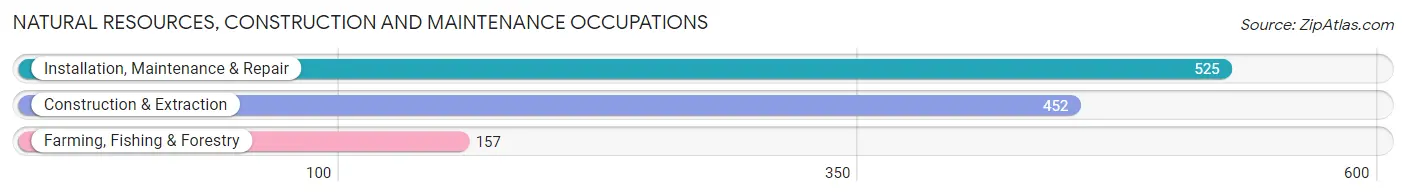
Natural Resources, Construction and Maintenance Occupations
The most common Natural Resources, Construction and Maintenance occupations in Scotland County are Installation, Maintenance & Repair (525 | 4.1%), Construction & Extraction (452 | 3.6%), and Farming, Fishing & Forestry (157 | 1.2%).
Natural Resources, Construction and Maintenance Occupations by Sex
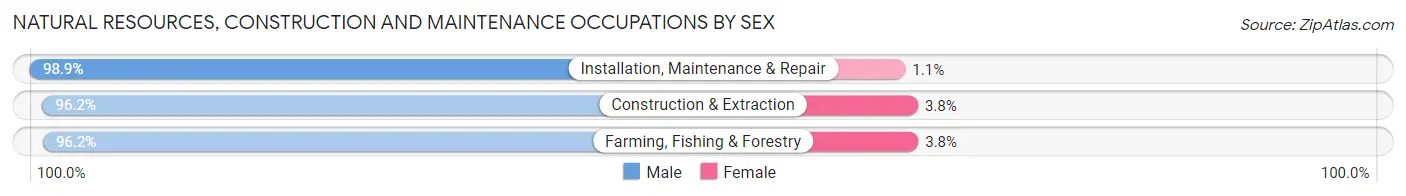
| Occupation | Male | Female |
| Farming, Fishing & Forestry | 151 (96.2%) | 6 (3.8%) |
| Construction & Extraction | 435 (96.2%) | 17 (3.8%) |
| Installation, Maintenance & Repair | 519 (98.9%) | 6 (1.1%) |
| Total (Category) | 1,105 (97.4%) | 29 (2.6%) |
| Total (Overall) | 6,542 (51.6%) | 6,131 (48.4%) |
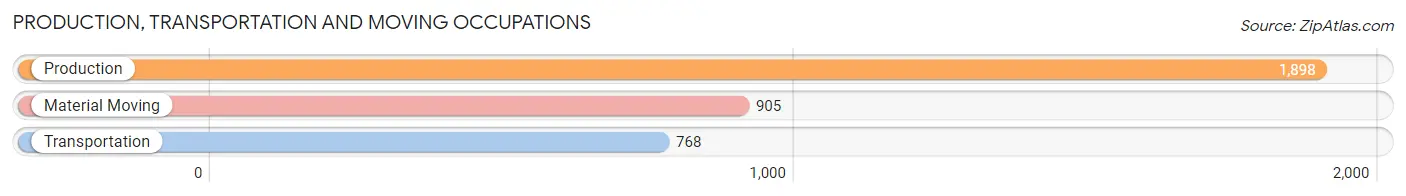
Production, Transportation and Moving Occupations
The most common Production, Transportation and Moving occupations in Scotland County are Production (1,898 | 15.0%), Material Moving (905 | 7.1%), and Transportation (768 | 6.1%).
Production, Transportation and Moving Occupations by Sex
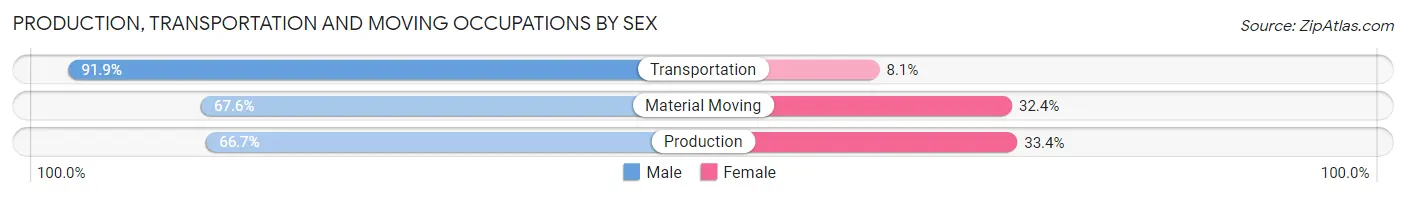
| Occupation | Male | Female |
| Production | 1,265 (66.6%) | 633 (33.4%) |
| Transportation | 706 (91.9%) | 62 (8.1%) |
| Material Moving | 612 (67.6%) | 293 (32.4%) |
| Total (Category) | 2,583 (72.3%) | 988 (27.7%) |
| Total (Overall) | 6,542 (51.6%) | 6,131 (48.4%) |
Employment Industries by Sex in Scotland County
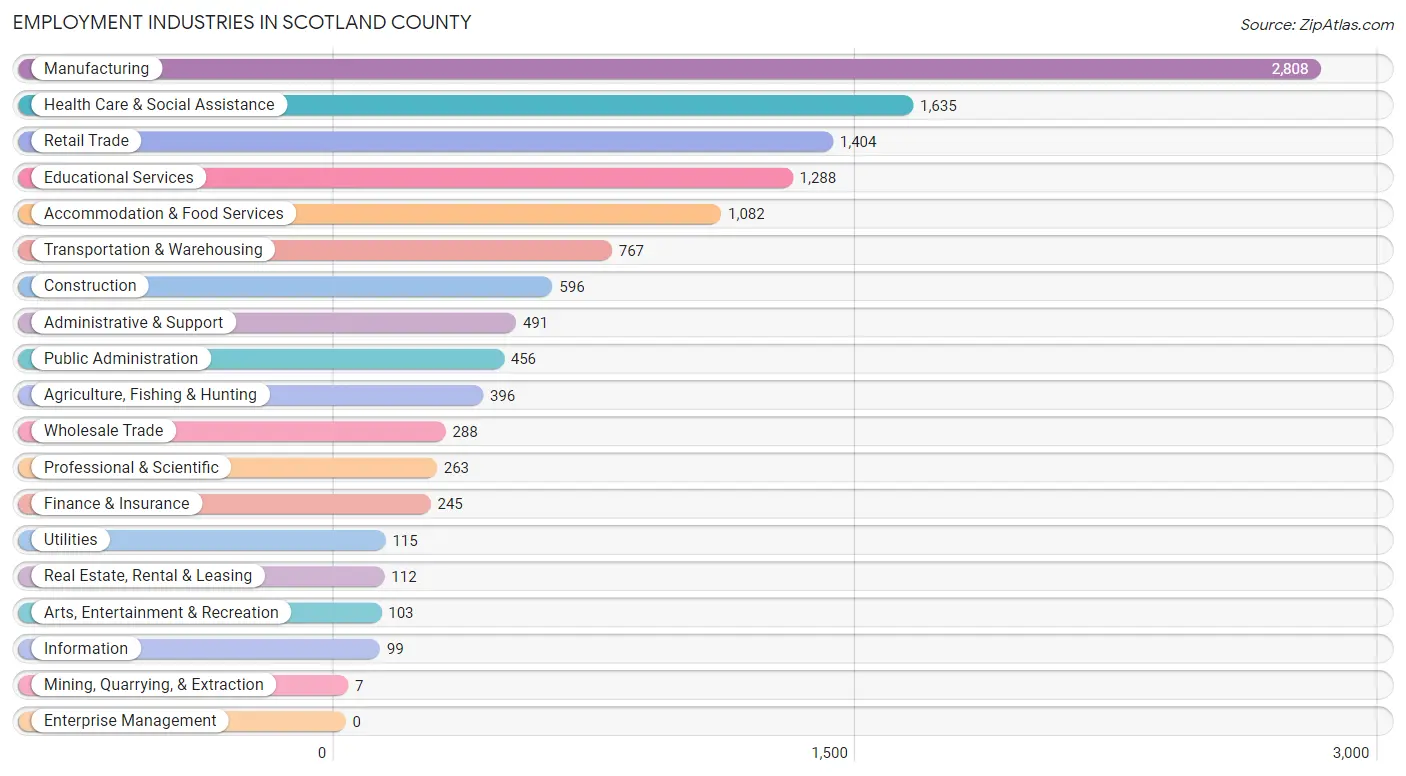
Employment Industries in Scotland County
The major employment industries in Scotland County include Manufacturing (2,808 | 22.2%), Health Care & Social Assistance (1,635 | 12.9%), Retail Trade (1,404 | 11.1%), Educational Services (1,288 | 10.2%), and Accommodation & Food Services (1,082 | 8.5%).
Employment Industries by Sex in Scotland County
The Scotland County industries that see more men than women are Mining, Quarrying, & Extraction (100.0%), Construction (93.1%), and Utilities (85.2%), whereas the industries that tend to have a higher number of women are Health Care & Social Assistance (87.8%), Real Estate, Rental & Leasing (85.7%), and Finance & Insurance (83.3%).
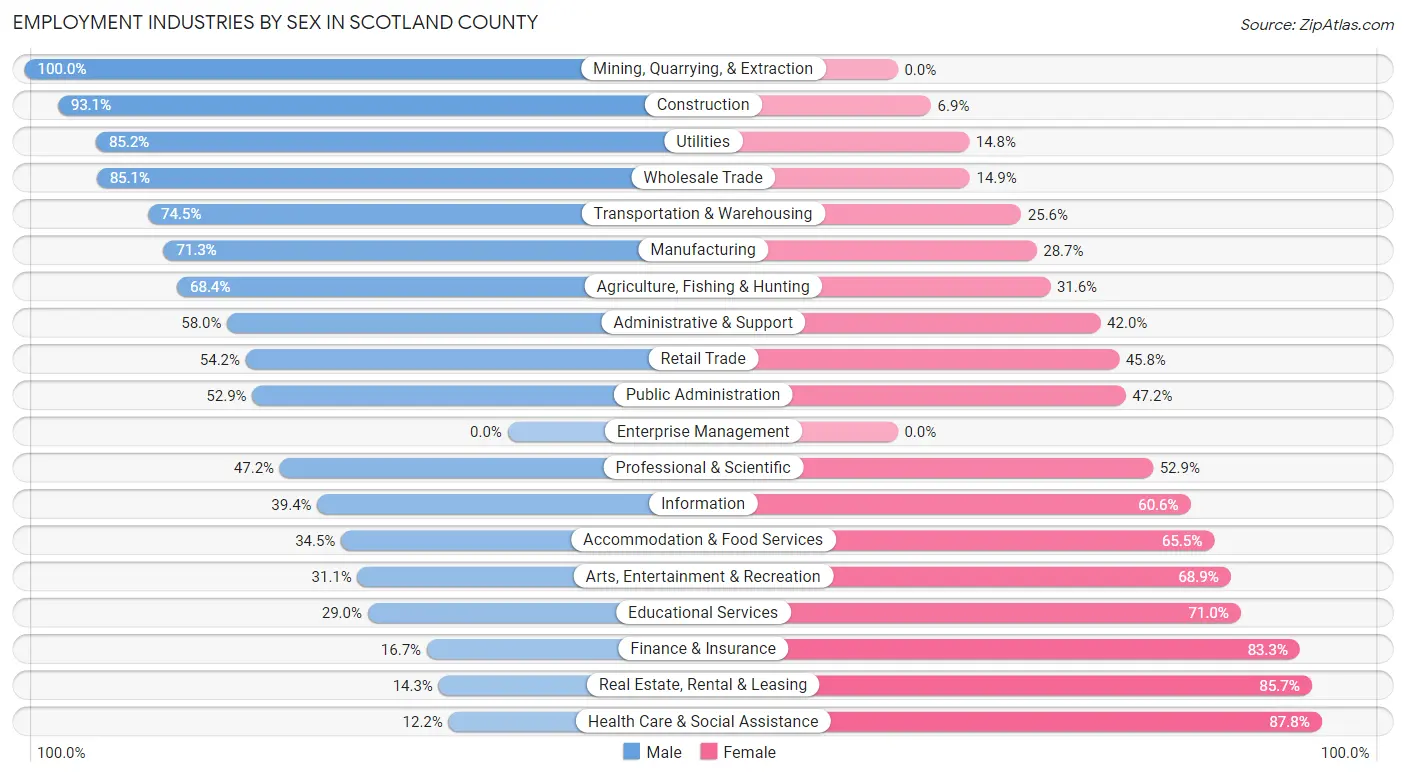
| Industry | Male | Female |
| Agriculture, Fishing & Hunting | 271 (68.4%) | 125 (31.6%) |
| Mining, Quarrying, & Extraction | 7 (100.0%) | 0 (0.0%) |
| Construction | 555 (93.1%) | 41 (6.9%) |
| Manufacturing | 2,001 (71.3%) | 807 (28.7%) |
| Wholesale Trade | 245 (85.1%) | 43 (14.9%) |
| Retail Trade | 761 (54.2%) | 643 (45.8%) |
| Transportation & Warehousing | 571 (74.5%) | 196 (25.6%) |
| Utilities | 98 (85.2%) | 17 (14.8%) |
| Information | 39 (39.4%) | 60 (60.6%) |
| Finance & Insurance | 41 (16.7%) | 204 (83.3%) |
| Real Estate, Rental & Leasing | 16 (14.3%) | 96 (85.7%) |
| Professional & Scientific | 124 (47.1%) | 139 (52.8%) |
| Enterprise Management | 0 (0.0%) | 0 (0.0%) |
| Administrative & Support | 285 (58.0%) | 206 (42.0%) |
| Educational Services | 373 (29.0%) | 915 (71.0%) |
| Health Care & Social Assistance | 200 (12.2%) | 1,435 (87.8%) |
| Arts, Entertainment & Recreation | 32 (31.1%) | 71 (68.9%) |
| Accommodation & Food Services | 373 (34.5%) | 709 (65.5%) |
| Public Administration | 241 (52.8%) | 215 (47.1%) |
| Total | 6,542 (51.6%) | 6,131 (48.4%) |
Education in Scotland County
School Enrollment in Scotland County
The most common levels of schooling among the 7,452 students in Scotland County are elementary school (1,669 | 22.4%), high school (1,651 | 22.2%), and middle school (1,599 | 21.5%).
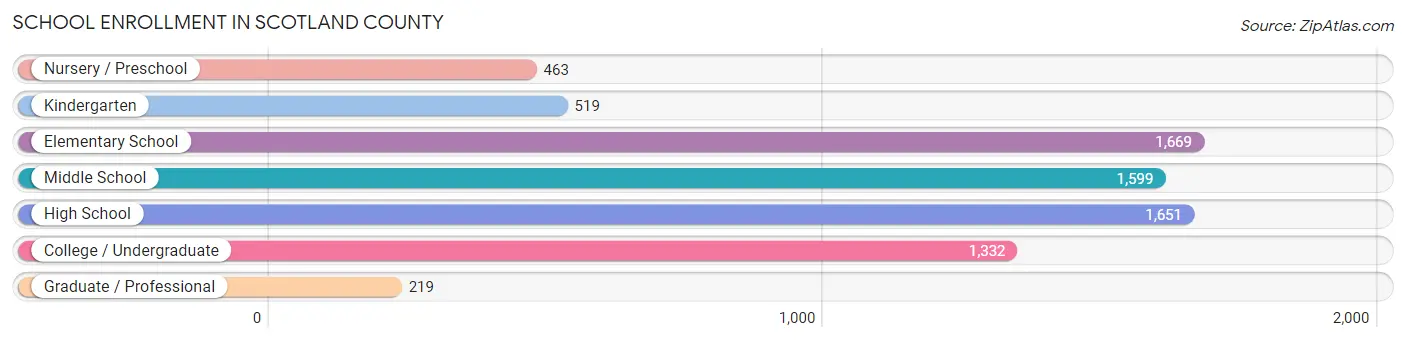
| School Level | # Students | % Students |
| Nursery / Preschool | 463 | 6.2% |
| Kindergarten | 519 | 7.0% |
| Elementary School | 1,669 | 22.4% |
| Middle School | 1,599 | 21.5% |
| High School | 1,651 | 22.2% |
| College / Undergraduate | 1,332 | 17.9% |
| Graduate / Professional | 219 | 2.9% |
| Total | 7,452 | 100.0% |
School Enrollment by Age by Funding Source in Scotland County
Out of a total of 7,452 students who are enrolled in schools in Scotland County, 946 (12.7%) attend a private institution, while the remaining 6,506 (87.3%) are enrolled in public schools. The age group of 20 to 24 year olds has the highest likelihood of being enrolled in private schools, with 302 (42.7% in the age bracket) enrolled. Conversely, the age group of 15 to 17 year olds has the lowest likelihood of being enrolled in a private school, with 1,182 (96.4% in the age bracket) attending a public institution.
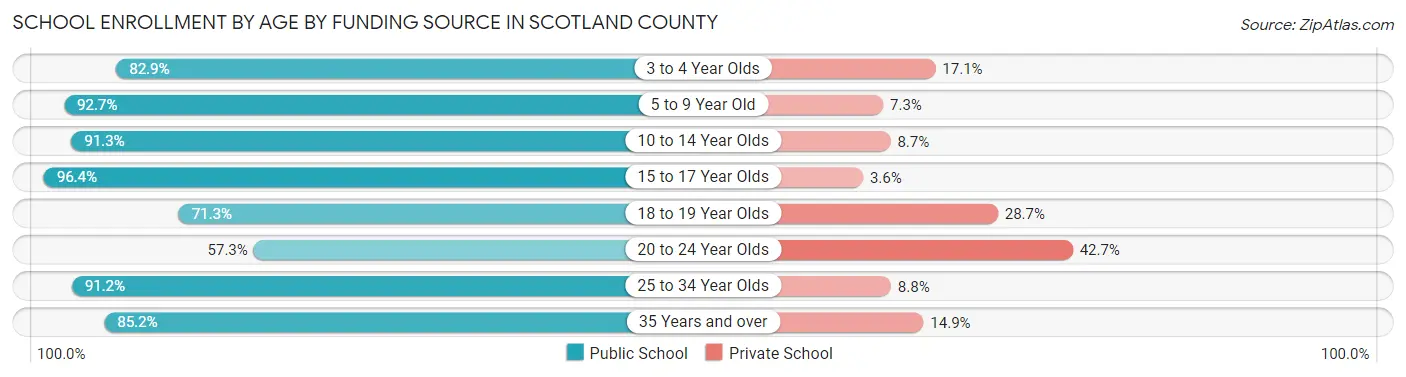
| Age Bracket | Public School | Private School |
| 3 to 4 Year Olds | 330 (82.9%) | 68 (17.1%) |
| 5 to 9 Year Old | 1,968 (92.7%) | 156 (7.3%) |
| 10 to 14 Year Olds | 1,793 (91.3%) | 171 (8.7%) |
| 15 to 17 Year Olds | 1,182 (96.4%) | 44 (3.6%) |
| 18 to 19 Year Olds | 370 (71.3%) | 149 (28.7%) |
| 20 to 24 Year Olds | 406 (57.3%) | 302 (42.7%) |
| 25 to 34 Year Olds | 259 (91.2%) | 25 (8.8%) |
| 35 Years and over | 195 (85.2%) | 34 (14.8%) |
| Total | 6,506 (87.3%) | 946 (12.7%) |
Educational Attainment by Field of Study in Scotland County
Education (951 | 26.7%), business (625 | 17.5%), science & technology (334 | 9.4%), arts & humanities (270 | 7.6%), and liberal arts & history (265 | 7.4%) are the most common fields of study among 3,567 individuals in Scotland County who have obtained a bachelor's degree or higher.
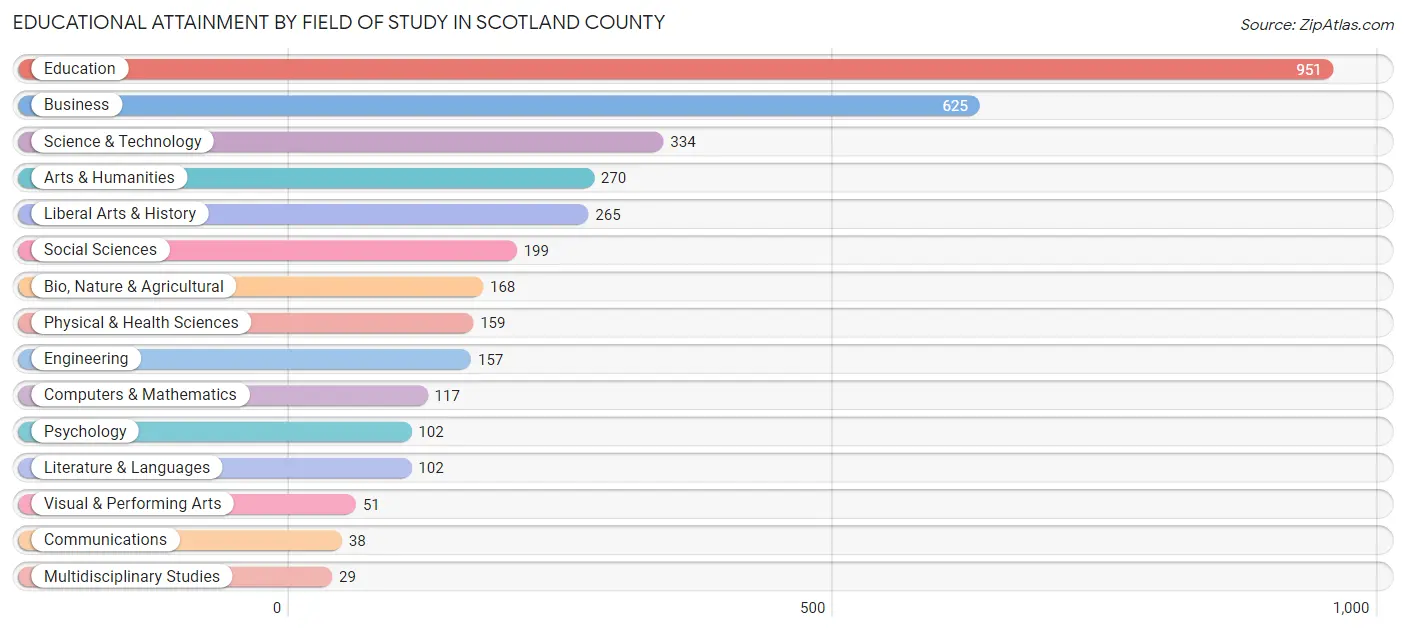
| Field of Study | # Graduates | % Graduates |
| Computers & Mathematics | 117 | 3.3% |
| Bio, Nature & Agricultural | 168 | 4.7% |
| Physical & Health Sciences | 159 | 4.5% |
| Psychology | 102 | 2.9% |
| Social Sciences | 199 | 5.6% |
| Engineering | 157 | 4.4% |
| Multidisciplinary Studies | 29 | 0.8% |
| Science & Technology | 334 | 9.4% |
| Business | 625 | 17.5% |
| Education | 951 | 26.7% |
| Literature & Languages | 102 | 2.9% |
| Liberal Arts & History | 265 | 7.4% |
| Visual & Performing Arts | 51 | 1.4% |
| Communications | 38 | 1.1% |
| Arts & Humanities | 270 | 7.6% |
| Total | 3,567 | 100.0% |
Transportation & Commute in Scotland County
Vehicle Availability by Sex in Scotland County
The most prevalent vehicle ownership categories in Scotland County are males with 2 vehicles (2,141, accounting for 33.9%) and females with 2 vehicles (1,840, making up 37.7%).
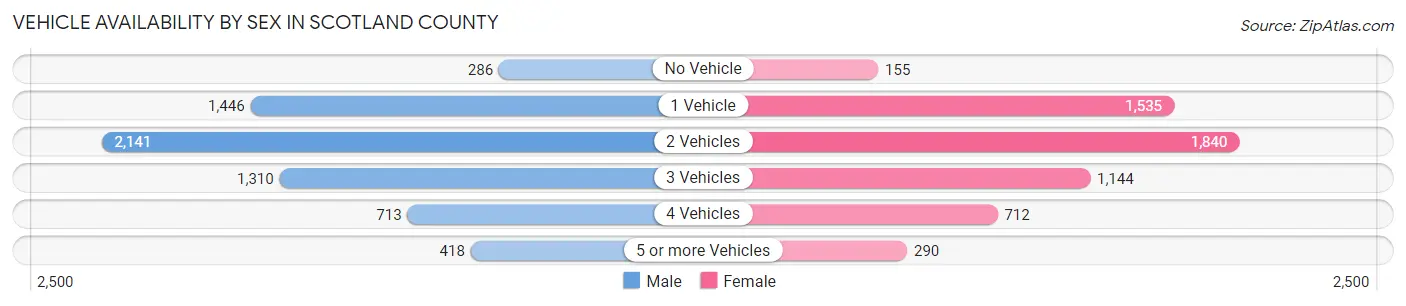
| Vehicles Available | Male | Female |
| No Vehicle | 286 (4.5%) | 155 (2.7%) |
| 1 Vehicle | 1,446 (22.9%) | 1,535 (27.0%) |
| 2 Vehicles | 2,141 (33.9%) | 1,840 (32.4%) |
| 3 Vehicles | 1,310 (20.7%) | 1,144 (20.2%) |
| 4 Vehicles | 713 (11.3%) | 712 (12.5%) |
| 5 or more Vehicles | 418 (6.6%) | 290 (5.1%) |
| Total | 6,314 (100.0%) | 5,676 (100.0%) |
Commute Time in Scotland County
The most frequently occuring commute durations in Scotland County are 15 to 19 minutes (2,051 commuters, 17.7%), 10 to 14 minutes (1,969 commuters, 17.0%), and 20 to 24 minutes (1,632 commuters, 14.1%).

| Commute Time | # Commuters | % Commuters |
| Less than 5 Minutes | 408 | 3.5% |
| 5 to 9 Minutes | 1,365 | 11.8% |
| 10 to 14 Minutes | 1,969 | 17.0% |
| 15 to 19 Minutes | 2,051 | 17.7% |
| 20 to 24 Minutes | 1,632 | 14.1% |
| 25 to 29 Minutes | 760 | 6.6% |
| 30 to 34 Minutes | 1,064 | 9.2% |
| 35 to 39 Minutes | 468 | 4.0% |
| 40 to 44 Minutes | 499 | 4.3% |
| 45 to 59 Minutes | 655 | 5.7% |
| 60 to 89 Minutes | 313 | 2.7% |
| 90 or more Minutes | 401 | 3.5% |
Commute Time by Sex in Scotland County
The most common commute times in Scotland County are 20 to 24 minutes (957 commuters, 16.0%) for males and 10 to 14 minutes (1,119 commuters, 19.9%) for females.
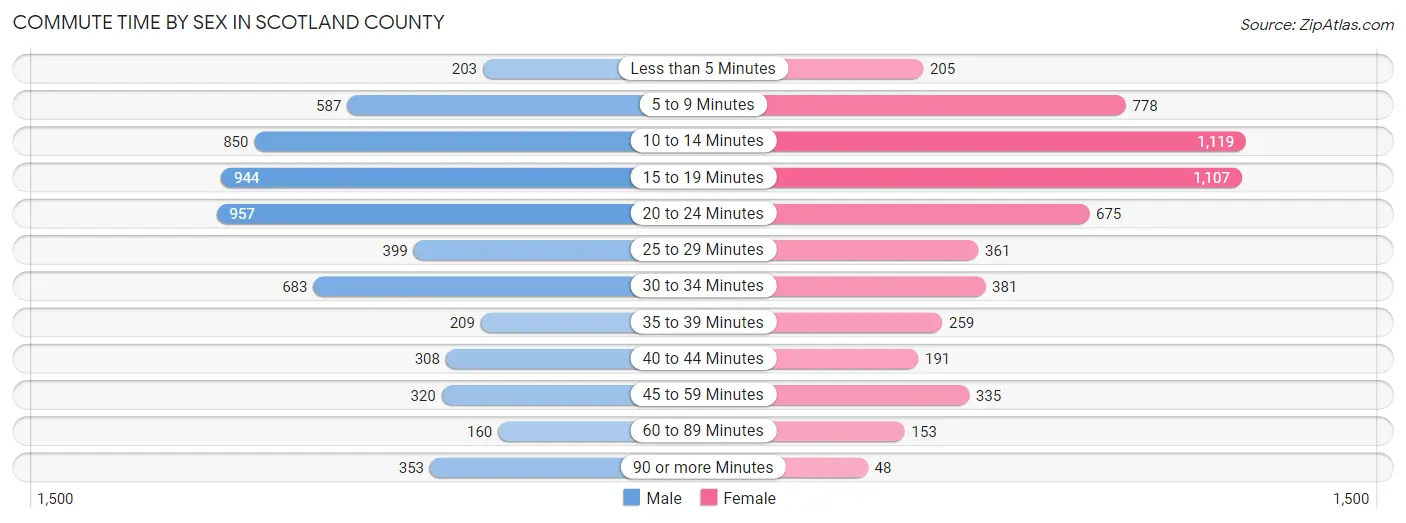
| Commute Time | Male | Female |
| Less than 5 Minutes | 203 (3.4%) | 205 (3.6%) |
| 5 to 9 Minutes | 587 (9.8%) | 778 (13.9%) |
| 10 to 14 Minutes | 850 (14.2%) | 1,119 (19.9%) |
| 15 to 19 Minutes | 944 (15.8%) | 1,107 (19.7%) |
| 20 to 24 Minutes | 957 (16.0%) | 675 (12.0%) |
| 25 to 29 Minutes | 399 (6.7%) | 361 (6.4%) |
| 30 to 34 Minutes | 683 (11.4%) | 381 (6.8%) |
| 35 to 39 Minutes | 209 (3.5%) | 259 (4.6%) |
| 40 to 44 Minutes | 308 (5.2%) | 191 (3.4%) |
| 45 to 59 Minutes | 320 (5.4%) | 335 (6.0%) |
| 60 to 89 Minutes | 160 (2.7%) | 153 (2.7%) |
| 90 or more Minutes | 353 (5.9%) | 48 (0.9%) |
Time of Departure to Work by Sex in Scotland County
The most frequent times of departure to work in Scotland County are 6:00 AM to 6:29 AM (1,025, 17.2%) for males and 7:00 AM to 7:29 AM (1,196, 21.3%) for females.
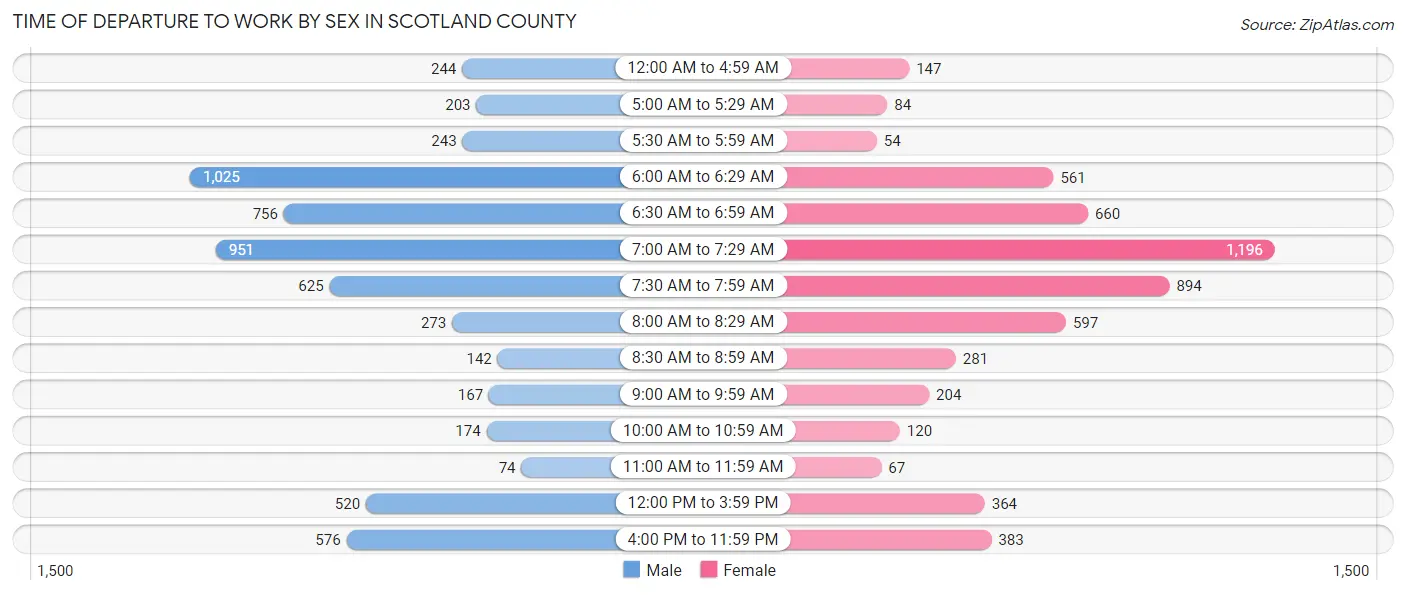
| Time of Departure | Male | Female |
| 12:00 AM to 4:59 AM | 244 (4.1%) | 147 (2.6%) |
| 5:00 AM to 5:29 AM | 203 (3.4%) | 84 (1.5%) |
| 5:30 AM to 5:59 AM | 243 (4.1%) | 54 (1.0%) |
| 6:00 AM to 6:29 AM | 1,025 (17.2%) | 561 (10.0%) |
| 6:30 AM to 6:59 AM | 756 (12.7%) | 660 (11.8%) |
| 7:00 AM to 7:29 AM | 951 (15.9%) | 1,196 (21.3%) |
| 7:30 AM to 7:59 AM | 625 (10.5%) | 894 (15.9%) |
| 8:00 AM to 8:29 AM | 273 (4.6%) | 597 (10.6%) |
| 8:30 AM to 8:59 AM | 142 (2.4%) | 281 (5.0%) |
| 9:00 AM to 9:59 AM | 167 (2.8%) | 204 (3.6%) |
| 10:00 AM to 10:59 AM | 174 (2.9%) | 120 (2.1%) |
| 11:00 AM to 11:59 AM | 74 (1.2%) | 67 (1.2%) |
| 12:00 PM to 3:59 PM | 520 (8.7%) | 364 (6.5%) |
| 4:00 PM to 11:59 PM | 576 (9.6%) | 383 (6.8%) |
| Total | 5,973 (100.0%) | 5,612 (100.0%) |
Housing Occupancy in Scotland County
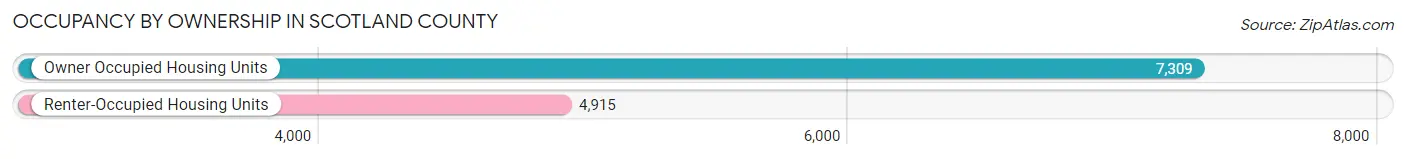
Occupancy by Ownership in Scotland County
Of the total 12,224 dwellings in Scotland County, owner-occupied units account for 7,309 (59.8%), while renter-occupied units make up 4,915 (40.2%).
| Occupancy | # Housing Units | % Housing Units |
| Owner Occupied Housing Units | 7,309 | 59.8% |
| Renter-Occupied Housing Units | 4,915 | 40.2% |
| Total Occupied Housing Units | 12,224 | 100.0% |
Occupancy by Household Size in Scotland County
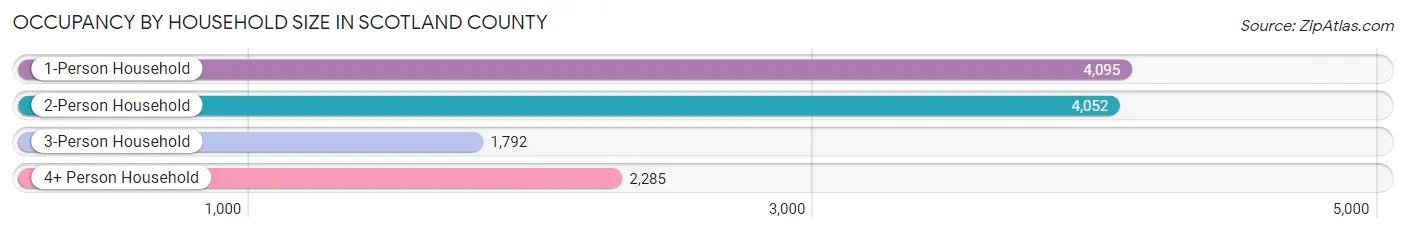
| Household Size | # Housing Units | % Housing Units |
| 1-Person Household | 4,095 | 33.5% |
| 2-Person Household | 4,052 | 33.2% |
| 3-Person Household | 1,792 | 14.7% |
| 4+ Person Household | 2,285 | 18.7% |
| Total Housing Units | 12,224 | 100.0% |
Occupancy by Ownership by Household Size in Scotland County

| Household Size | Owner-occupied | Renter-occupied |
| 1-Person Household | 2,138 (52.2%) | 1,957 (47.8%) |
| 2-Person Household | 2,928 (72.3%) | 1,124 (27.7%) |
| 3-Person Household | 1,099 (61.3%) | 693 (38.7%) |
| 4+ Person Household | 1,144 (50.1%) | 1,141 (49.9%) |
| Total Housing Units | 7,309 (59.8%) | 4,915 (40.2%) |
Occupancy by Educational Attainment in Scotland County
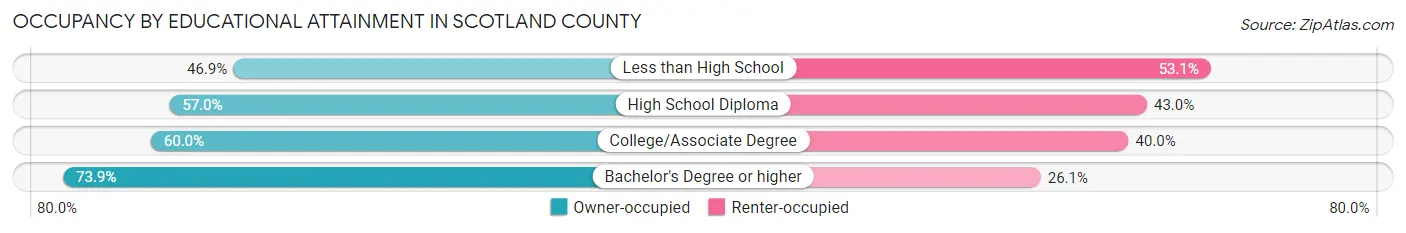
| Household Size | Owner-occupied | Renter-occupied |
| Less than High School | 798 (46.9%) | 902 (53.1%) |
| High School Diploma | 2,118 (57.0%) | 1,595 (43.0%) |
| College/Associate Degree | 2,757 (60.0%) | 1,840 (40.0%) |
| Bachelor's Degree or higher | 1,636 (73.9%) | 578 (26.1%) |
Occupancy by Age of Householder in Scotland County
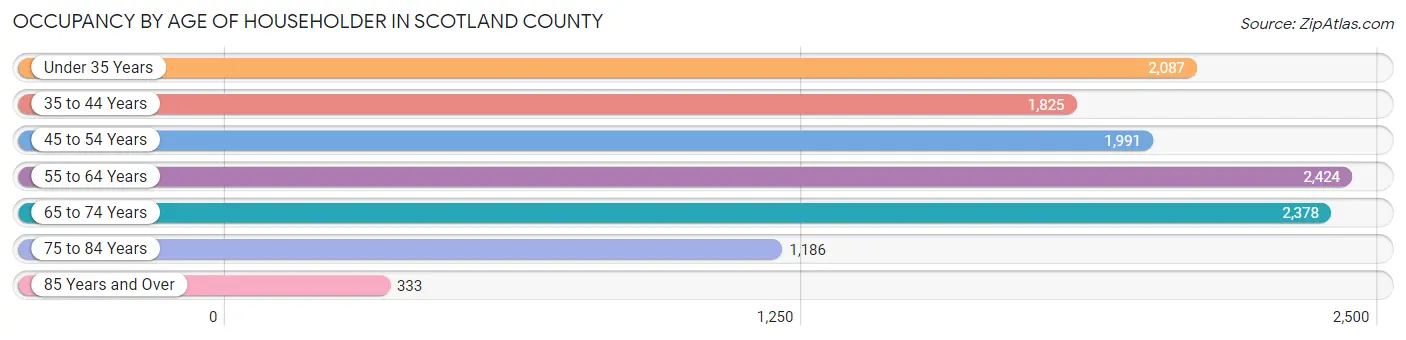
| Age Bracket | # Households | % Households |
| Under 35 Years | 2,087 | 17.1% |
| 35 to 44 Years | 1,825 | 14.9% |
| 45 to 54 Years | 1,991 | 16.3% |
| 55 to 64 Years | 2,424 | 19.8% |
| 65 to 74 Years | 2,378 | 19.5% |
| 75 to 84 Years | 1,186 | 9.7% |
| 85 Years and Over | 333 | 2.7% |
| Total | 12,224 | 100.0% |
Housing Finances in Scotland County
Median Income by Occupancy in Scotland County
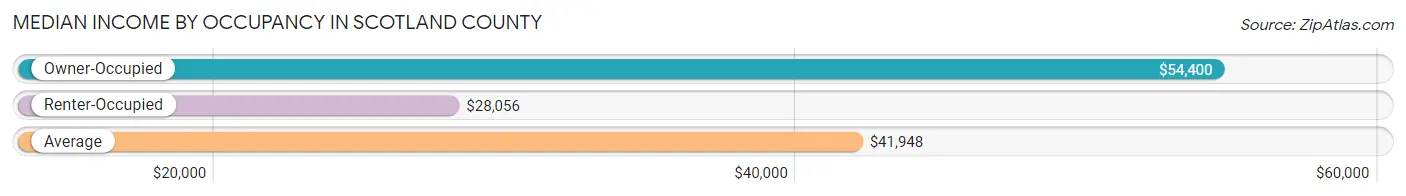
| Occupancy Type | # Households | Median Income |
| Owner-Occupied | 7,309 (59.8%) | $54,400 |
| Renter-Occupied | 4,915 (40.2%) | $28,056 |
| Average | 12,224 (100.0%) | $41,948 |
Occupancy by Householder Income Bracket in Scotland County
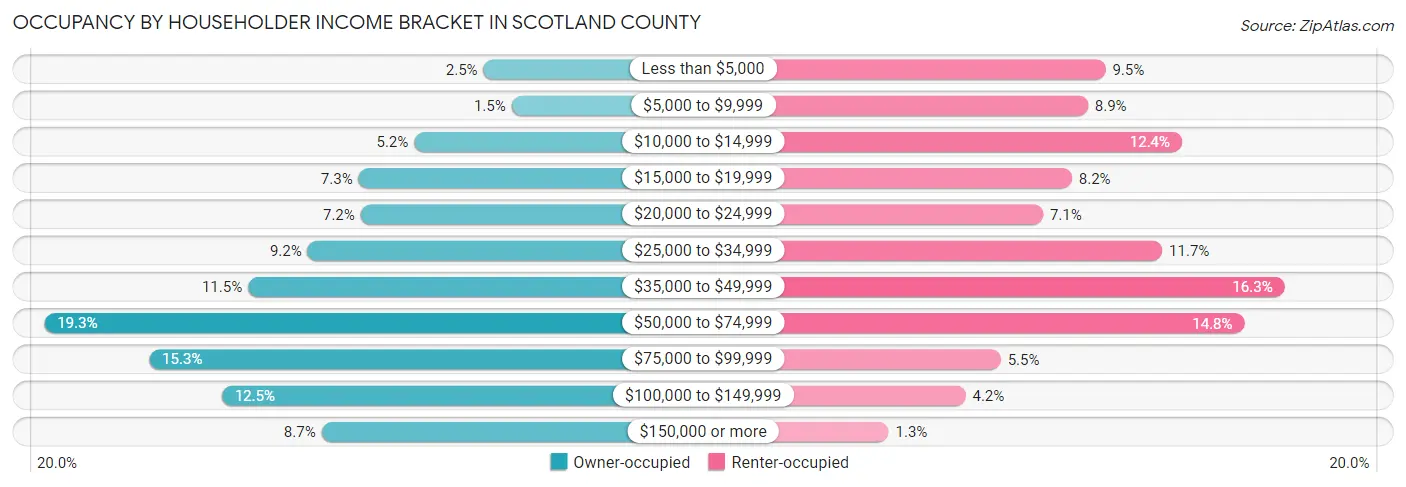
| Income Bracket | Owner-occupied | Renter-occupied |
| Less than $5,000 | 184 (2.5%) | 468 (9.5%) |
| $5,000 to $9,999 | 106 (1.5%) | 435 (8.8%) |
| $10,000 to $14,999 | 377 (5.2%) | 611 (12.4%) |
| $15,000 to $19,999 | 532 (7.3%) | 405 (8.2%) |
| $20,000 to $24,999 | 526 (7.2%) | 351 (7.1%) |
| $25,000 to $34,999 | 674 (9.2%) | 574 (11.7%) |
| $35,000 to $49,999 | 840 (11.5%) | 803 (16.3%) |
| $50,000 to $74,999 | 1,407 (19.3%) | 728 (14.8%) |
| $75,000 to $99,999 | 1,115 (15.3%) | 272 (5.5%) |
| $100,000 to $149,999 | 913 (12.5%) | 206 (4.2%) |
| $150,000 or more | 635 (8.7%) | 62 (1.3%) |
| Total | 7,309 (100.0%) | 4,915 (100.0%) |
Monthly Housing Cost Tiers in Scotland County
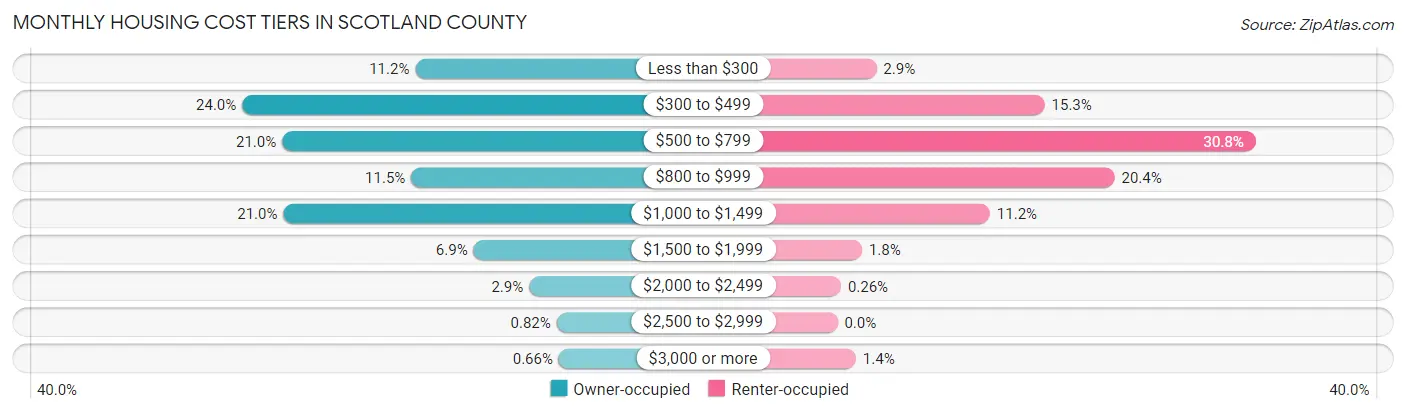
| Monthly Cost | Owner-occupied | Renter-occupied |
| Less than $300 | 821 (11.2%) | 141 (2.9%) |
| $300 to $499 | 1,753 (24.0%) | 750 (15.3%) |
| $500 to $799 | 1,538 (21.0%) | 1,514 (30.8%) |
| $800 to $999 | 843 (11.5%) | 1,003 (20.4%) |
| $1,000 to $1,499 | 1,531 (20.9%) | 552 (11.2%) |
| $1,500 to $1,999 | 507 (6.9%) | 89 (1.8%) |
| $2,000 to $2,499 | 208 (2.9%) | 13 (0.3%) |
| $2,500 to $2,999 | 60 (0.8%) | 0 (0.0%) |
| $3,000 or more | 48 (0.7%) | 67 (1.4%) |
| Total | 7,309 (100.0%) | 4,915 (100.0%) |
Physical Housing Characteristics in Scotland County
Housing Structures in Scotland County
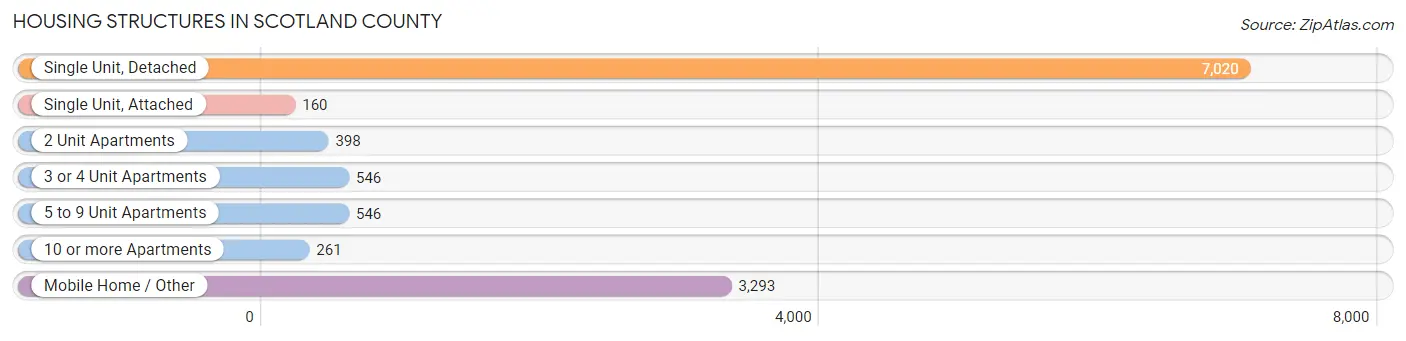
| Structure Type | # Housing Units | % Housing Units |
| Single Unit, Detached | 7,020 | 57.4% |
| Single Unit, Attached | 160 | 1.3% |
| 2 Unit Apartments | 398 | 3.3% |
| 3 or 4 Unit Apartments | 546 | 4.5% |
| 5 to 9 Unit Apartments | 546 | 4.5% |
| 10 or more Apartments | 261 | 2.1% |
| Mobile Home / Other | 3,293 | 26.9% |
| Total | 12,224 | 100.0% |
Housing Structures by Occupancy in Scotland County
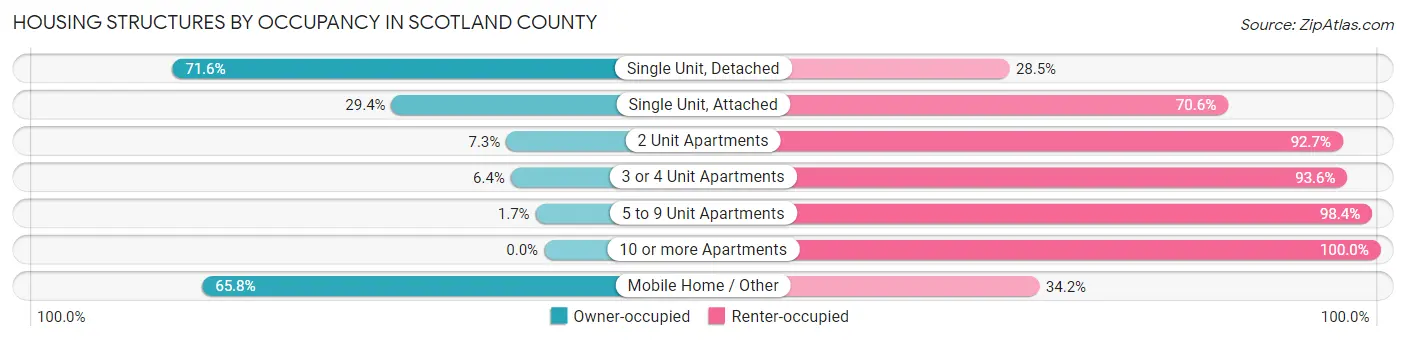
| Structure Type | Owner-occupied | Renter-occupied |
| Single Unit, Detached | 5,023 (71.6%) | 1,997 (28.4%) |
| Single Unit, Attached | 47 (29.4%) | 113 (70.6%) |
| 2 Unit Apartments | 29 (7.3%) | 369 (92.7%) |
| 3 or 4 Unit Apartments | 35 (6.4%) | 511 (93.6%) |
| 5 to 9 Unit Apartments | 9 (1.7%) | 537 (98.4%) |
| 10 or more Apartments | 0 (0.0%) | 261 (100.0%) |
| Mobile Home / Other | 2,166 (65.8%) | 1,127 (34.2%) |
| Total | 7,309 (59.8%) | 4,915 (40.2%) |
Housing Structures by Number of Rooms in Scotland County

| Number of Rooms | Owner-occupied | Renter-occupied |
| 1 Room | 44 (0.6%) | 873 (17.8%) |
| 2 or 3 Rooms | 148 (2.0%) | 427 (8.7%) |
| 4 or 5 Rooms | 2,659 (36.4%) | 2,778 (56.5%) |
| 6 or 7 Rooms | 2,905 (39.8%) | 624 (12.7%) |
| 8 or more Rooms | 1,553 (21.2%) | 213 (4.3%) |
| Total | 7,309 (100.0%) | 4,915 (100.0%) |
Housing Structure by Heating Type in Scotland County
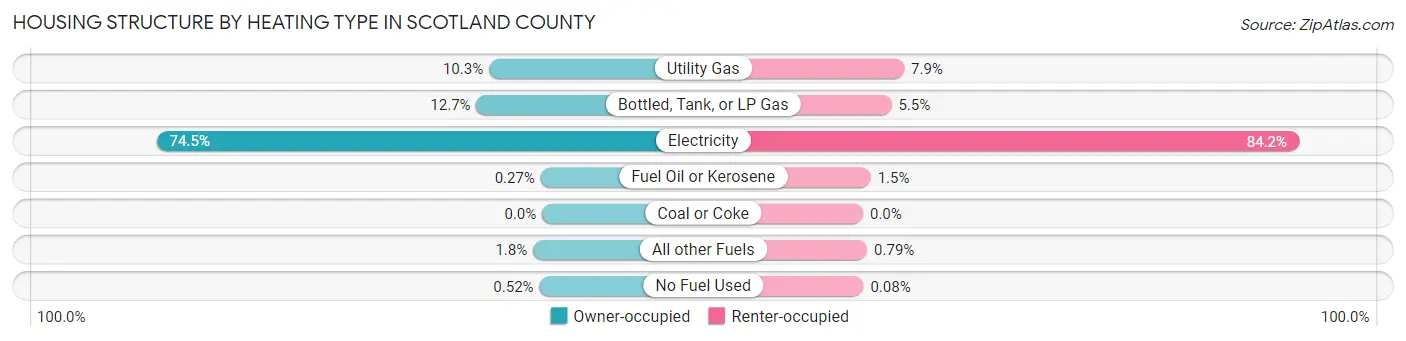
| Heating Type | Owner-occupied | Renter-occupied |
| Utility Gas | 750 (10.3%) | 390 (7.9%) |
| Bottled, Tank, or LP Gas | 928 (12.7%) | 270 (5.5%) |
| Electricity | 5,445 (74.5%) | 4,139 (84.2%) |
| Fuel Oil or Kerosene | 20 (0.3%) | 73 (1.5%) |
| Coal or Coke | 0 (0.0%) | 0 (0.0%) |
| All other Fuels | 128 (1.8%) | 39 (0.8%) |
| No Fuel Used | 38 (0.5%) | 4 (0.1%) |
| Total | 7,309 (100.0%) | 4,915 (100.0%) |
Household Vehicle Usage in Scotland County
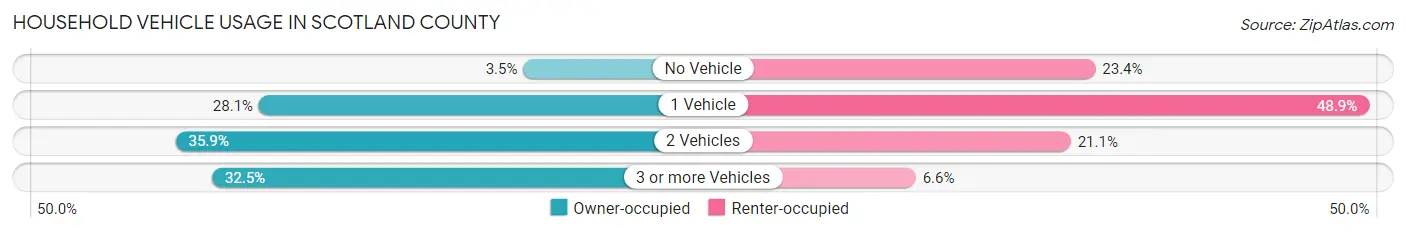
| Vehicles per Household | Owner-occupied | Renter-occupied |
| No Vehicle | 252 (3.5%) | 1,149 (23.4%) |
| 1 Vehicle | 2,056 (28.1%) | 2,405 (48.9%) |
| 2 Vehicles | 2,625 (35.9%) | 1,036 (21.1%) |
| 3 or more Vehicles | 2,376 (32.5%) | 325 (6.6%) |
| Total | 7,309 (100.0%) | 4,915 (100.0%) |
Real Estate & Mortgages in Scotland County
Real Estate and Mortgage Overview in Scotland County
| Characteristic | Without Mortgage | With Mortgage |
| Housing Units | 3,841 | 3,468 |
| Median Property Value | $78,700 | $131,800 |
| Median Household Income | $43,366 | $414 |
| Monthly Housing Costs | $428 | $48 |
| Real Estate Taxes | $813 | $29 |
Property Value by Mortgage Status in Scotland County

| Property Value | Without Mortgage | With Mortgage |
| Less than $50,000 | 1,103 (28.7%) | 266 (7.7%) |
| $50,000 to $99,999 | 1,370 (35.7%) | 919 (26.5%) |
| $100,000 to $299,999 | 1,128 (29.4%) | 1,980 (57.1%) |
| $300,000 to $499,999 | 187 (4.9%) | 246 (7.1%) |
| $500,000 to $749,999 | 0 (0.0%) | 25 (0.7%) |
| $750,000 to $999,999 | 24 (0.6%) | 0 (0.0%) |
| $1,000,000 or more | 29 (0.8%) | 32 (0.9%) |
| Total | 3,841 (100.0%) | 3,468 (100.0%) |
Household Income by Mortgage Status in Scotland County
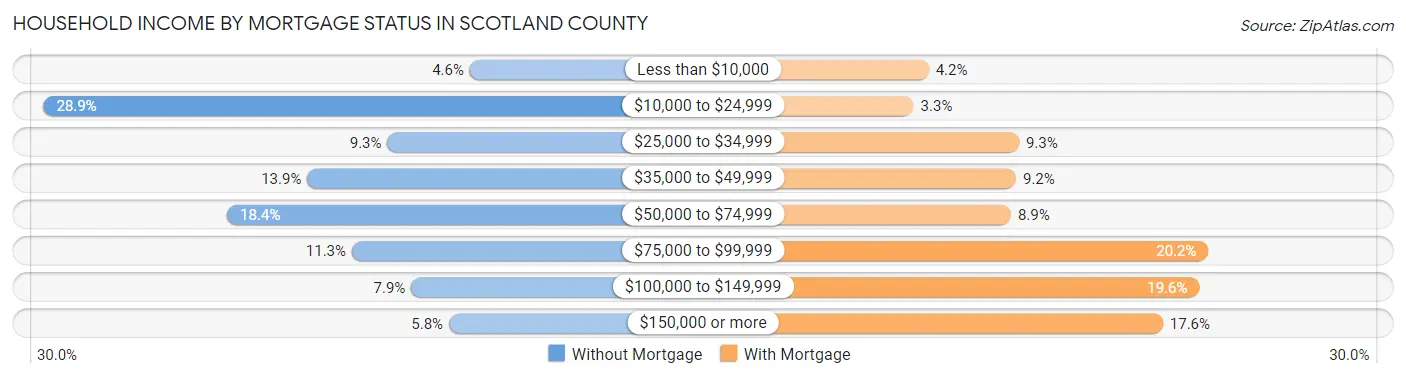
| Household Income | Without Mortgage | With Mortgage |
| Less than $10,000 | 175 (4.6%) | 145 (4.2%) |
| $10,000 to $24,999 | 1,111 (28.9%) | 115 (3.3%) |
| $25,000 to $34,999 | 356 (9.3%) | 324 (9.3%) |
| $35,000 to $49,999 | 532 (13.9%) | 318 (9.2%) |
| $50,000 to $74,999 | 708 (18.4%) | 308 (8.9%) |
| $75,000 to $99,999 | 434 (11.3%) | 699 (20.2%) |
| $100,000 to $149,999 | 304 (7.9%) | 681 (19.6%) |
| $150,000 or more | 221 (5.8%) | 609 (17.6%) |
| Total | 3,841 (100.0%) | 3,468 (100.0%) |
Property Value to Household Income Ratio in Scotland County
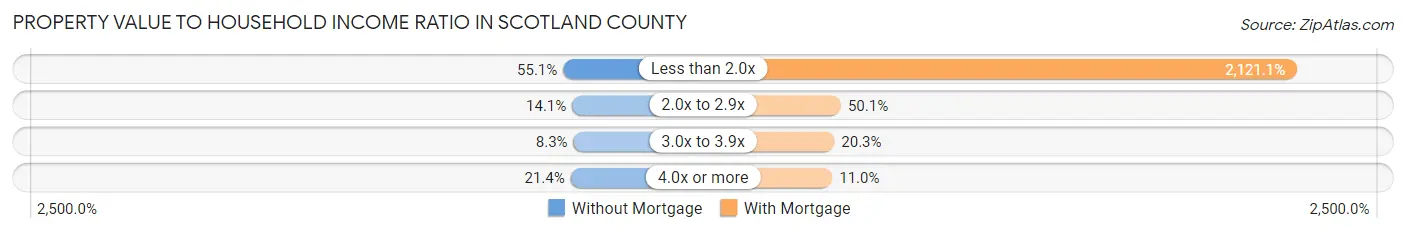
| Value-to-Income Ratio | Without Mortgage | With Mortgage |
| Less than 2.0x | 2,117 (55.1%) | 73,558 (2,121.0%) |
| 2.0x to 2.9x | 540 (14.1%) | 1,738 (50.1%) |
| 3.0x to 3.9x | 320 (8.3%) | 703 (20.3%) |
| 4.0x or more | 823 (21.4%) | 381 (11.0%) |
| Total | 3,841 (100.0%) | 3,468 (100.0%) |
Real Estate Taxes by Mortgage Status in Scotland County

| Property Taxes | Without Mortgage | With Mortgage |
| Less than $800 | 1,804 (47.0%) | 9 (0.3%) |
| $800 to $1,499 | 1,038 (27.0%) | 808 (23.3%) |
| $800 to $1,499 | 824 (21.4%) | 1,225 (35.3%) |
| Total | 3,841 (100.0%) | 3,468 (100.0%) |
Health & Disability in Scotland County
Health Insurance Coverage by Age in Scotland County
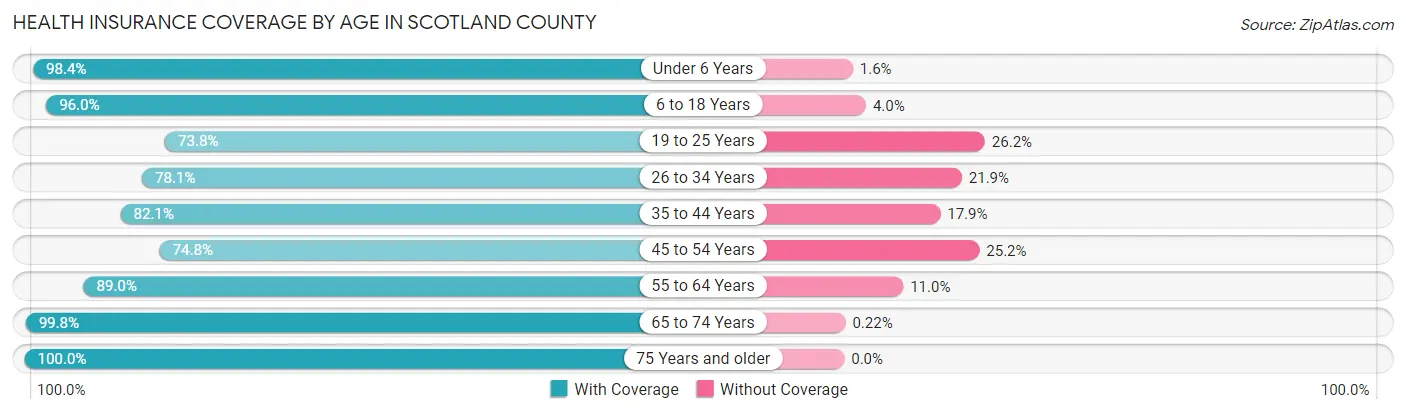
| Age Bracket | With Coverage | Without Coverage |
| Under 6 Years | 2,643 (98.4%) | 43 (1.6%) |
| 6 to 18 Years | 5,291 (96.0%) | 223 (4.0%) |
| 19 to 25 Years | 2,206 (73.8%) | 784 (26.2%) |
| 26 to 34 Years | 2,885 (78.1%) | 810 (21.9%) |
| 35 to 44 Years | 2,972 (82.1%) | 648 (17.9%) |
| 45 to 54 Years | 3,002 (74.8%) | 1,011 (25.2%) |
| 55 to 64 Years | 3,799 (89.0%) | 469 (11.0%) |
| 65 to 74 Years | 3,577 (99.8%) | 8 (0.2%) |
| 75 Years and older | 2,176 (100.0%) | 0 (0.0%) |
| Total | 28,551 (87.7%) | 3,996 (12.3%) |
Health Insurance Coverage by Citizenship Status in Scotland County
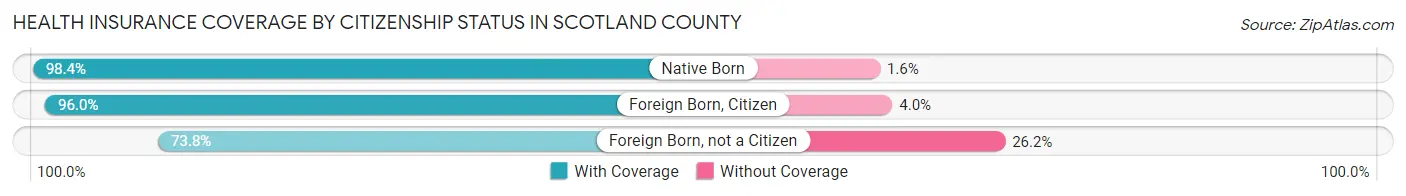
| Citizenship Status | With Coverage | Without Coverage |
| Native Born | 2,643 (98.4%) | 43 (1.6%) |
| Foreign Born, Citizen | 5,291 (96.0%) | 223 (4.0%) |
| Foreign Born, not a Citizen | 2,206 (73.8%) | 784 (26.2%) |
Health Insurance Coverage by Household Income in Scotland County
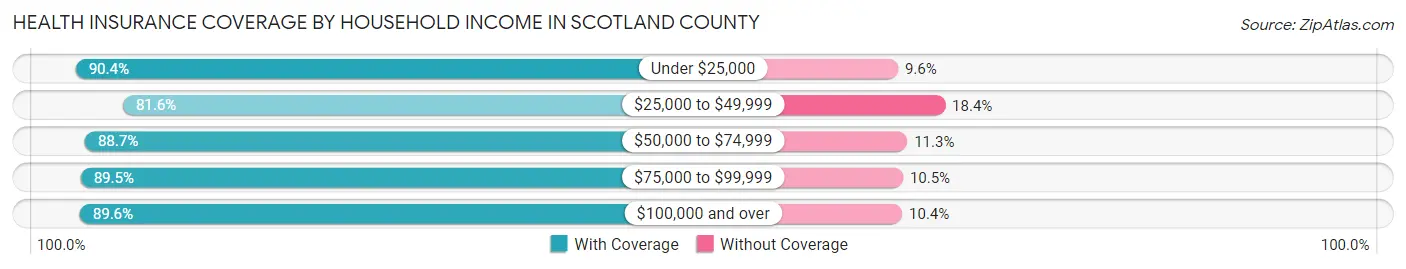
| Household Income | With Coverage | Without Coverage |
| Under $25,000 | 7,146 (90.4%) | 758 (9.6%) |
| $25,000 to $49,999 | 6,181 (81.6%) | 1,397 (18.4%) |
| $50,000 to $74,999 | 5,264 (88.7%) | 672 (11.3%) |
| $75,000 to $99,999 | 3,889 (89.5%) | 457 (10.5%) |
| $100,000 and over | 5,631 (89.6%) | 651 (10.4%) |
Public vs Private Health Insurance Coverage by Age in Scotland County
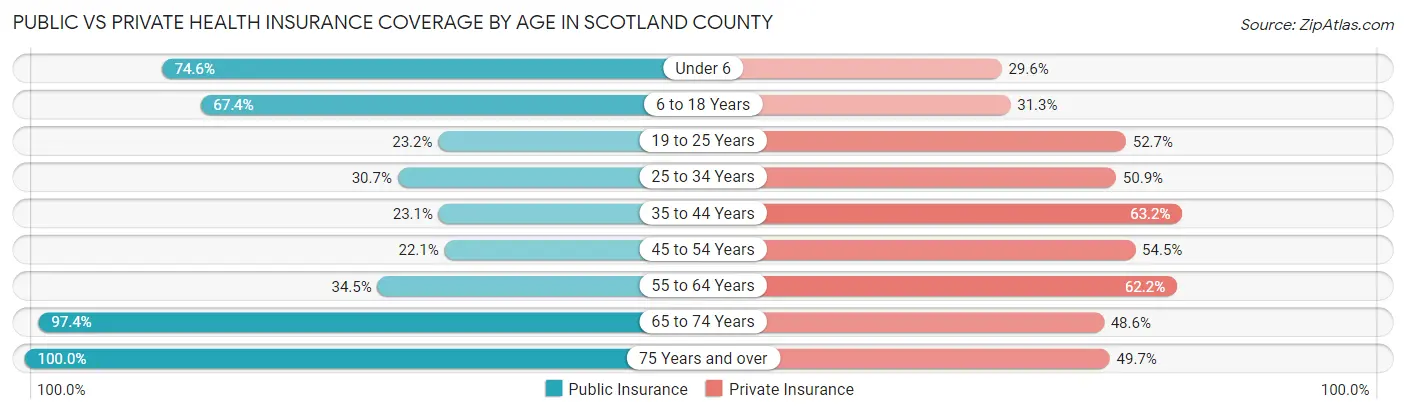
| Age Bracket | Public Insurance | Private Insurance |
| Under 6 | 2,003 (74.6%) | 796 (29.6%) |
| 6 to 18 Years | 3,715 (67.4%) | 1,724 (31.3%) |
| 19 to 25 Years | 694 (23.2%) | 1,576 (52.7%) |
| 25 to 34 Years | 1,136 (30.7%) | 1,880 (50.9%) |
| 35 to 44 Years | 837 (23.1%) | 2,288 (63.2%) |
| 45 to 54 Years | 885 (22.1%) | 2,185 (54.4%) |
| 55 to 64 Years | 1,472 (34.5%) | 2,655 (62.2%) |
| 65 to 74 Years | 3,493 (97.4%) | 1,743 (48.6%) |
| 75 Years and over | 2,176 (100.0%) | 1,082 (49.7%) |
| Total | 16,411 (50.4%) | 15,929 (48.9%) |
Disability Status by Sex by Age in Scotland County
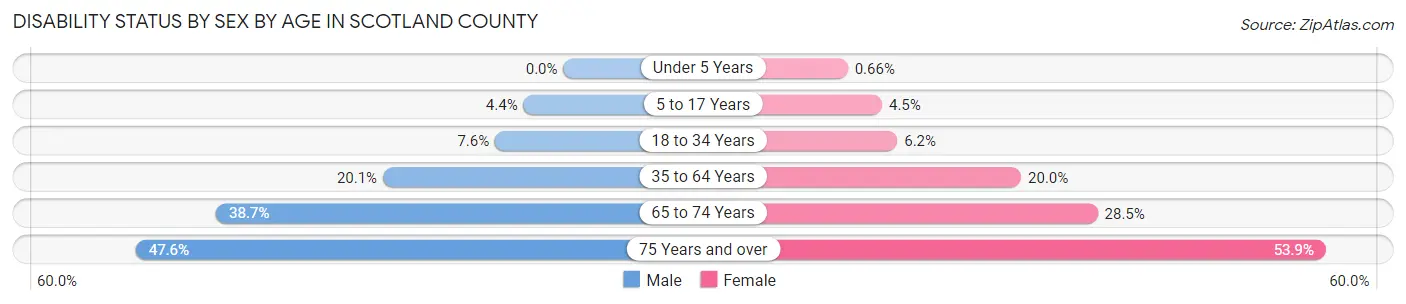
| Age Bracket | Male | Female |
| Under 5 Years | 0 (0.0%) | 8 (0.7%) |
| 5 to 17 Years | 125 (4.4%) | 122 (4.5%) |
| 18 to 34 Years | 280 (7.6%) | 213 (6.2%) |
| 35 to 64 Years | 1,204 (20.1%) | 1,180 (20.0%) |
| 65 to 74 Years | 618 (38.7%) | 566 (28.5%) |
| 75 Years and over | 399 (47.6%) | 721 (53.9%) |
Disability Class by Sex by Age in Scotland County
Disability Class: Hearing Difficulty
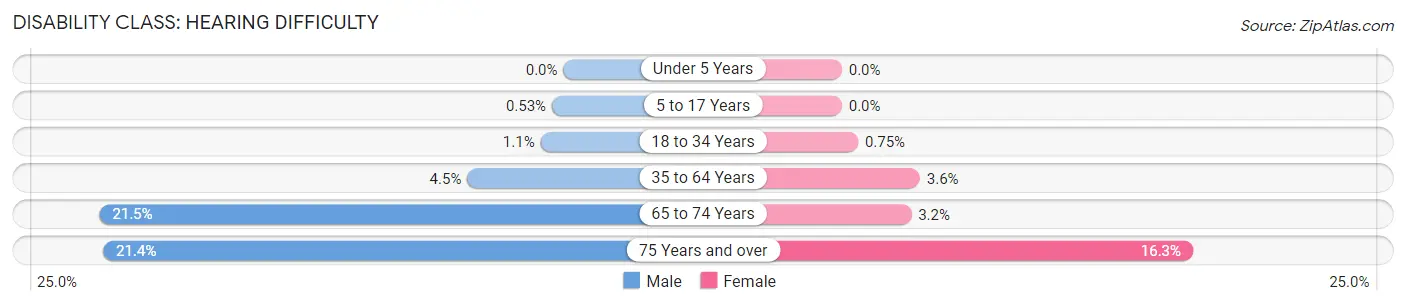
| Age Bracket | Male | Female |
| Under 5 Years | 0 (0.0%) | 0 (0.0%) |
| 5 to 17 Years | 15 (0.5%) | 0 (0.0%) |
| 18 to 34 Years | 39 (1.1%) | 26 (0.7%) |
| 35 to 64 Years | 267 (4.5%) | 214 (3.6%) |
| 65 to 74 Years | 344 (21.5%) | 64 (3.2%) |
| 75 Years and over | 179 (21.4%) | 218 (16.3%) |
Disability Class: Vision Difficulty
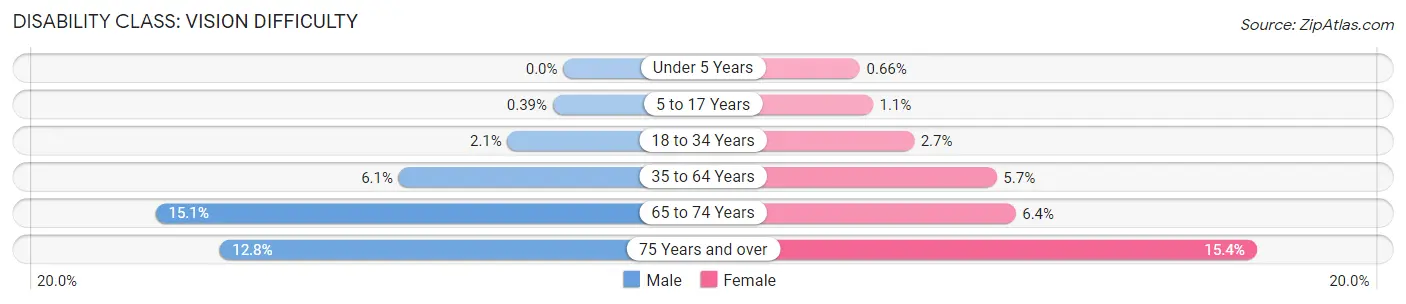
| Age Bracket | Male | Female |
| Under 5 Years | 0 (0.0%) | 8 (0.7%) |
| 5 to 17 Years | 11 (0.4%) | 31 (1.1%) |
| 18 to 34 Years | 76 (2.1%) | 92 (2.7%) |
| 35 to 64 Years | 366 (6.1%) | 339 (5.7%) |
| 65 to 74 Years | 242 (15.1%) | 128 (6.4%) |
| 75 Years and over | 107 (12.8%) | 206 (15.4%) |
Disability Class: Cognitive Difficulty
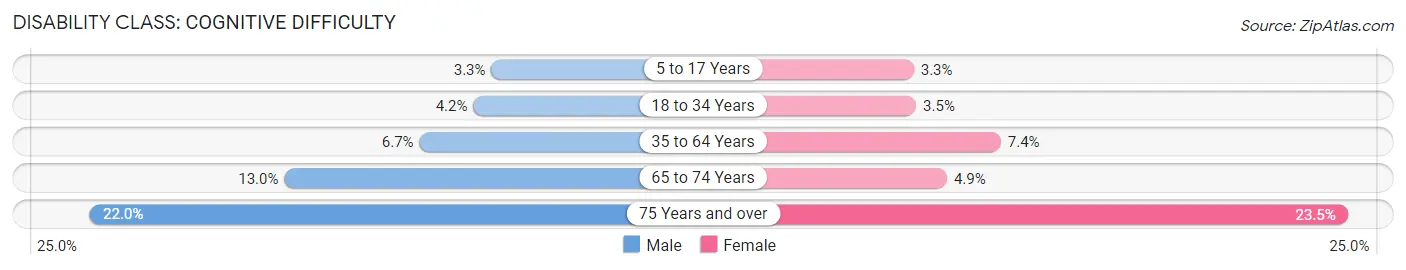
| Age Bracket | Male | Female |
| 5 to 17 Years | 94 (3.3%) | 91 (3.3%) |
| 18 to 34 Years | 154 (4.2%) | 119 (3.5%) |
| 35 to 64 Years | 400 (6.7%) | 436 (7.4%) |
| 65 to 74 Years | 207 (13.0%) | 97 (4.9%) |
| 75 Years and over | 184 (22.0%) | 314 (23.5%) |
Disability Class: Ambulatory Difficulty
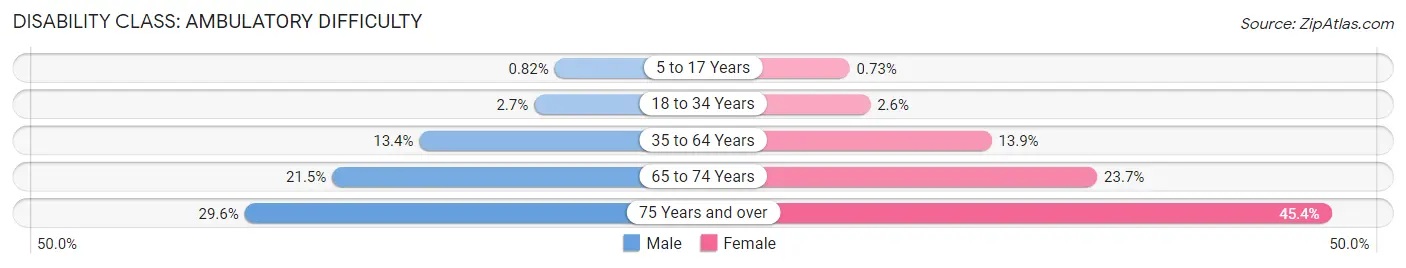
| Age Bracket | Male | Female |
| 5 to 17 Years | 23 (0.8%) | 20 (0.7%) |
| 18 to 34 Years | 100 (2.7%) | 91 (2.6%) |
| 35 to 64 Years | 801 (13.4%) | 821 (13.9%) |
| 65 to 74 Years | 343 (21.5%) | 471 (23.7%) |
| 75 Years and over | 248 (29.6%) | 608 (45.4%) |
Disability Class: Self-Care Difficulty
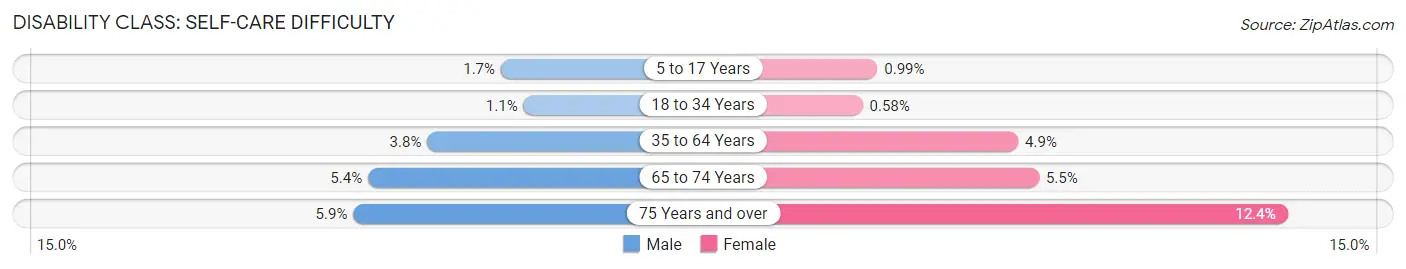
| Age Bracket | Male | Female |
| 5 to 17 Years | 49 (1.7%) | 27 (1.0%) |
| 18 to 34 Years | 41 (1.1%) | 20 (0.6%) |
| 35 to 64 Years | 227 (3.8%) | 290 (4.9%) |
| 65 to 74 Years | 87 (5.4%) | 109 (5.5%) |
| 75 Years and over | 49 (5.9%) | 166 (12.4%) |
Technology Access in Scotland County
Computing Device Access in Scotland County
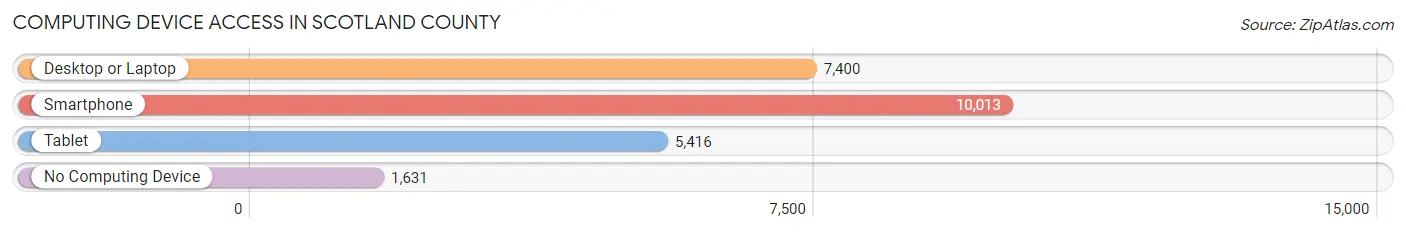
| Device Type | # Households | % Households |
| Desktop or Laptop | 7,400 | 60.5% |
| Smartphone | 10,013 | 81.9% |
| Tablet | 5,416 | 44.3% |
| No Computing Device | 1,631 | 13.3% |
| Total | 12,224 | 100.0% |
Internet Access in Scotland County
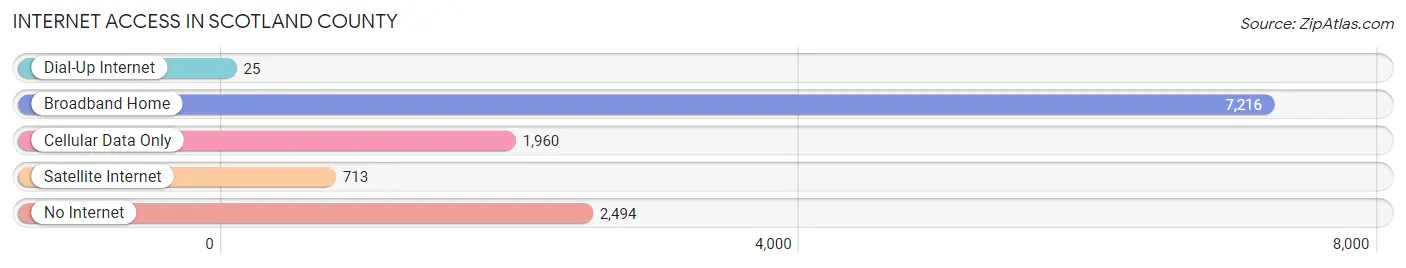
| Internet Type | # Households | % Households |
| Dial-Up Internet | 25 | 0.2% |
| Broadband Home | 7,216 | 59.0% |
| Cellular Data Only | 1,960 | 16.0% |
| Satellite Internet | 713 | 5.8% |
| No Internet | 2,494 | 20.4% |
| Total | 12,224 | 100.0% |
Scotland County Summary
History
Scotland County is located in the southeastern corner of North Carolina, and is part of the Fayetteville Metropolitan Statistical Area. The county was formed in 1899 from parts of Richmond and Robeson counties. It was named for Scotland, the homeland of many of the early settlers.
The first inhabitants of Scotland County were Native Americans, including the Tuscarora, Cheraw, and Catawba tribes. The first European settlers arrived in the area in the late 1700s, and the county was officially established in 1899.
The county was largely agricultural in its early years, with cotton, tobacco, and corn being the main crops. The county also had a thriving timber industry, with lumber being shipped to Wilmington and other coastal cities.
In the early 1900s, the county began to experience a population boom, as people moved to the area to take advantage of the growing economy. The county seat, Laurinburg, was established in 1906 and quickly became the center of commerce and industry in the county.
The county continued to grow throughout the 20th century, and today it is home to a diverse population of over 36,000 people.
Geography
Scotland County is located in the southeastern corner of North Carolina, and is bordered by Richmond, Robeson, Hoke, and Cumberland counties. The county covers an area of 441 square miles, and is home to several small towns and communities, including Laurinburg, Wagram, Gibson, and Laurel Hill.
The county is located in the Coastal Plain region of North Carolina, and is characterized by flat terrain and sandy soils. The county is drained by the Lumber River, which flows through the county from north to south.
The climate of Scotland County is humid subtropical, with hot, humid summers and mild winters. The average annual temperature is around 70 degrees Fahrenheit, and the average annual precipitation is around 45 inches.
Economy
Scotland County has a diverse economy, with a mix of manufacturing, agriculture, and services. The county’s largest employers are Scotland Health Care System, Scotland County Schools, and Scotland County Government.
Agriculture is an important part of the county’s economy, with corn, soybeans, cotton, and tobacco being the main crops. The county also has a thriving timber industry, with lumber being shipped to Wilmington and other coastal cities.
Manufacturing is also an important part of the county’s economy, with companies such as Unifirst Corporation, Carolina Container, and Laurinburg Textiles located in the county.
Demographics
As of the 2010 census, Scotland County had a population of 36,157. The population is 53.3% White, 39.7% African American, 0.5% Native American, 0.7% Asian, and 5.8% Hispanic or Latino.
The median household income in the county is $35,845, and the median family income is $43,945. The per capita income is $18,945. The poverty rate is 22.3%.
Conclusion
Scotland County is located in the southeastern corner of North Carolina, and is part of the Fayetteville Metropolitan Statistical Area. The county was formed in 1899 from parts of Richmond and Robeson counties, and was named for Scotland, the homeland of many of the early settlers. The county has a diverse economy, with a mix of manufacturing, agriculture, and services. The population of Scotland County is 53.3% White, 39.7% African American, 0.5% Native American, 0.7% Asian, and 5.8% Hispanic or Latino. The median household income in the county is $35,845, and the poverty rate is 22.3%.
Common Questions
What is the Total Population of Scotland County?
Total Population of Scotland County is 34,222.
What is the Total Male Population of Scotland County?
Total Male Population of Scotland County is 17,382.
What is the Total Female Population of Scotland County?
Total Female Population of Scotland County is 16,840.
What is the Ratio of Males per 100 Females in Scotland County?
There are 103.22 Males per 100 Females in Scotland County.
What is the Ratio of Females per 100 Males in Scotland County?
There are 96.88 Females per 100 Males in Scotland County.
What is the Median Population Age in Scotland County?
Median Population Age in Scotland County is 39.0 Years.
What is the Average Family Size in Scotland County
Average Family Size in Scotland County is 3.3 People.
What is the Average Household Size in Scotland County
Average Household Size in Scotland County is 2.6 People.
What is Per Capita Income in Scotland County?
Per Capita income in Scotland County is $24,464.
What is the Median Family Income in Scotland County?
Median Family Income in Scotland County is $51,937.
What is the Median Household income in Scotland County?
Median Household Income in Scotland County is $41,948.
What is Income or Wage Gap in Scotland County?
Income or Wage Gap in Scotland County is 30.2%.
Women in Scotland County earn 69.8 cents for every dollar earned by a man.
What is Family Income Deficit in Scotland County?
Family Income Deficit in Scotland County is $11,503.
Families that are below poverty line in Scotland County earn $11,503 less on average than the poverty threshold level.
What is Inequality or Gini Index in Scotland County?
Inequality or Gini Index in Scotland County is 0.50.
How Large is the Labor Force in Scotland County?
There are 14,211 People in the Labor Forcein in Scotland County.
What is the Percentage of People in the Labor Force in Scotland County?
52.4% of People are in the Labor Force in Scotland County.
What is the Unemployment Rate in Scotland County?
Unemployment Rate in Scotland County is 10.8%.