Rowan County, NC
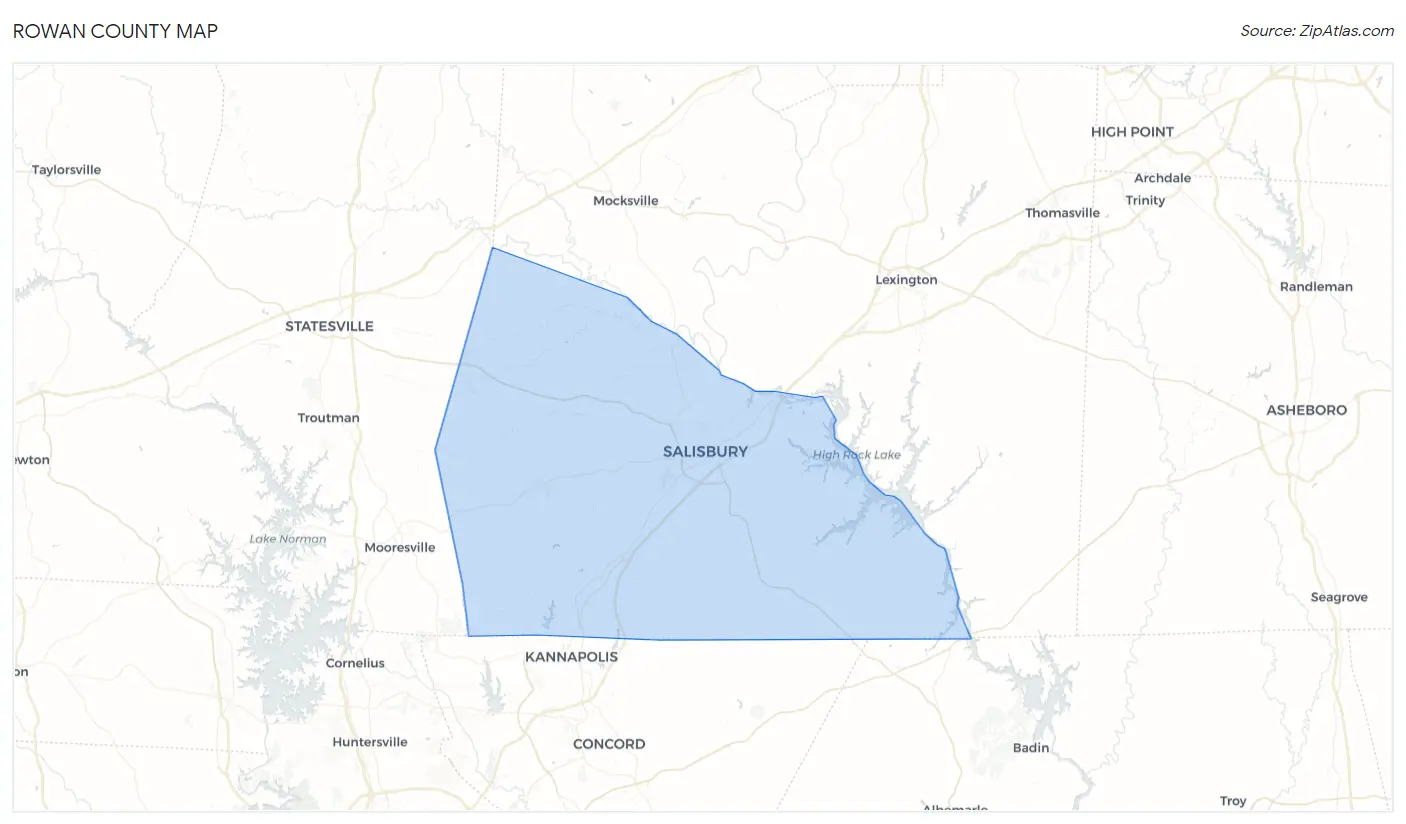
Rowan County Map
Rowan County Overview
147,067
TOTAL POPULATION
73,080
MALE POPULATION
73,987
FEMALE POPULATION
98.77
MALES / 100 FEMALES
101.24
FEMALES / 100 MALES
40.7
MEDIAN AGE
3.1
AVG FAMILY SIZE
2.5
AVG HOUSEHOLD SIZE
$31,108
PER CAPITA INCOME
$73,551
AVG FAMILY INCOME
$59,717
AVG HOUSEHOLD INCOME
33.0%
WAGE / INCOME GAP [ % ]
67.0¢/ $1
WAGE / INCOME GAP [ $ ]
$10,204
FAMILY INCOME DEFICIT
0.45
INEQUALITY / GINI INDEX
71,276
LABOR FORCE [ PEOPLE ]
60.3%
PERCENT IN LABOR FORCE
6.3%
UNEMPLOYMENT RATE
Race in Rowan County
The most populous races in Rowan County are White / Caucasian (108,005 | 73.4%), Black / African American (23,543 | 16.0%), and Hispanic or Latino (14,375 | 9.8%).
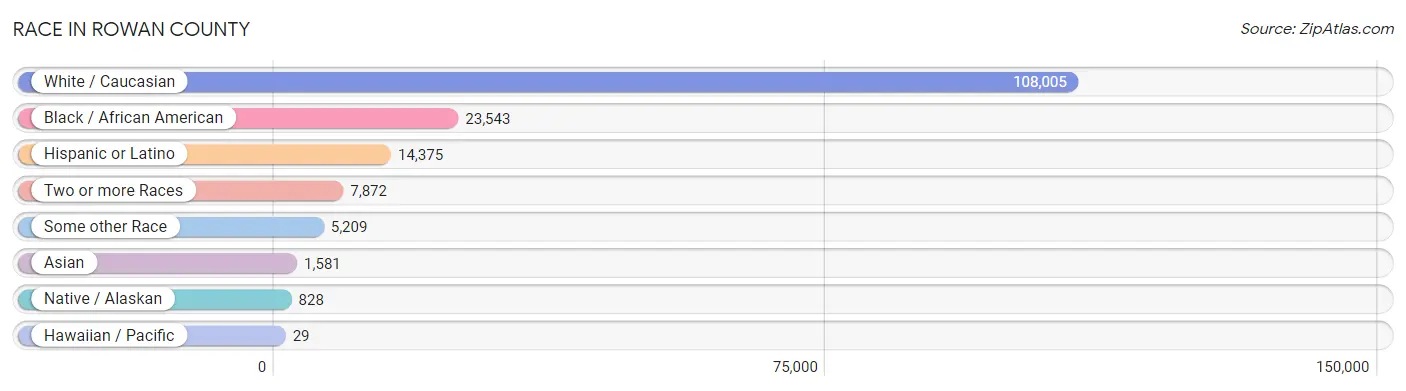
| Race | # Population | % Population |
| Asian | 1,581 | 1.1% |
| Black / African American | 23,543 | 16.0% |
| Hawaiian / Pacific | 29 | 0.0% |
| Hispanic or Latino | 14,375 | 9.8% |
| Native / Alaskan | 828 | 0.6% |
| White / Caucasian | 108,005 | 73.4% |
| Two or more Races | 7,872 | 5.3% |
| Some other Race | 5,209 | 3.5% |
| Total | 147,067 | 100.0% |
Ancestry in Rowan County
The most populous ancestries reported in Rowan County are German (20,793 | 14.1%), American (16,691 | 11.4%), English (13,103 | 8.9%), Irish (10,333 | 7.0%), and Mexican (9,288 | 6.3%), together accounting for 47.8% of all Rowan County residents.
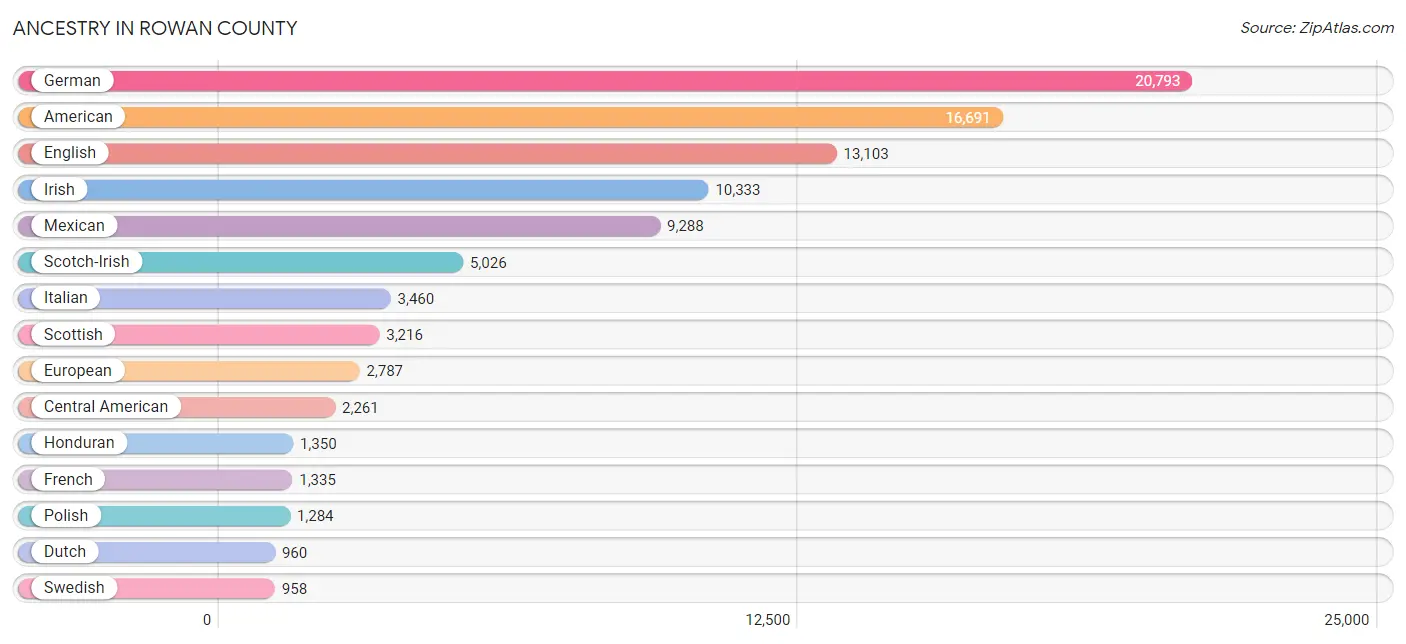
| Ancestry | # Population | % Population |
| African | 390 | 0.3% |
| Alaskan Athabascan | 4 | 0.0% |
| Albanian | 22 | 0.0% |
| Aleut | 5 | 0.0% |
| American | 16,691 | 11.4% |
| Apache | 41 | 0.0% |
| Arab | 508 | 0.4% |
| Armenian | 48 | 0.0% |
| Austrian | 46 | 0.0% |
| Bangladeshi | 101 | 0.1% |
| Barbadian | 10 | 0.0% |
| Belgian | 37 | 0.0% |
| Bhutanese | 25 | 0.0% |
| Blackfeet | 56 | 0.0% |
| Brazilian | 7 | 0.0% |
| British | 718 | 0.5% |
| British West Indian | 7 | 0.0% |
| Bulgarian | 26 | 0.0% |
| Burmese | 211 | 0.1% |
| Canadian | 50 | 0.0% |
| Central American | 2,261 | 1.5% |
| Central American Indian | 663 | 0.4% |
| Cherokee | 929 | 0.6% |
| Chilean | 19 | 0.0% |
| Chippewa | 44 | 0.0% |
| Choctaw | 31 | 0.0% |
| Colombian | 114 | 0.1% |
| Costa Rican | 95 | 0.1% |
| Cree | 14 | 0.0% |
| Croatian | 56 | 0.0% |
| Cuban | 722 | 0.5% |
| Czech | 163 | 0.1% |
| Danish | 128 | 0.1% |
| Dominican | 358 | 0.2% |
| Dutch | 960 | 0.6% |
| Eastern European | 234 | 0.2% |
| English | 13,103 | 8.9% |
| European | 2,787 | 1.9% |
| Filipino | 4 | 0.0% |
| Finnish | 134 | 0.1% |
| French | 1,335 | 0.9% |
| French Canadian | 141 | 0.1% |
| German | 20,793 | 14.1% |
| Greek | 194 | 0.1% |
| Guamanian / Chamorro | 17 | 0.0% |
| Guatemalan | 210 | 0.1% |
| Haitian | 36 | 0.0% |
| Honduran | 1,350 | 0.9% |
| Hungarian | 236 | 0.2% |
| Icelander | 14 | 0.0% |
| Indian (Asian) | 355 | 0.2% |
| Irish | 10,333 | 7.0% |
| Iroquois | 18 | 0.0% |
| Israeli | 5 | 0.0% |
| Italian | 3,460 | 2.4% |
| Jamaican | 128 | 0.1% |
| Korean | 136 | 0.1% |
| Latvian | 9 | 0.0% |
| Lebanese | 285 | 0.2% |
| Liberian | 124 | 0.1% |
| Lithuanian | 18 | 0.0% |
| Lumbee | 86 | 0.1% |
| Macedonian | 6 | 0.0% |
| Malaysian | 2 | 0.0% |
| Mexican | 9,288 | 6.3% |
| Mexican American Indian | 70 | 0.1% |
| Moroccan | 113 | 0.1% |
| Native Hawaiian | 4 | 0.0% |
| Nicaraguan | 55 | 0.0% |
| Nigerian | 45 | 0.0% |
| Northern European | 102 | 0.1% |
| Norwegian | 267 | 0.2% |
| Pakistani | 60 | 0.0% |
| Panamanian | 5 | 0.0% |
| Peruvian | 30 | 0.0% |
| Polish | 1,284 | 0.9% |
| Portuguese | 100 | 0.1% |
| Puerto Rican | 949 | 0.6% |
| Romanian | 112 | 0.1% |
| Russian | 271 | 0.2% |
| Salvadoran | 546 | 0.4% |
| Scandinavian | 282 | 0.2% |
| Scotch-Irish | 5,026 | 3.4% |
| Scottish | 3,216 | 2.2% |
| Seminole | 2 | 0.0% |
| Serbian | 9 | 0.0% |
| Sioux | 7 | 0.0% |
| Slovak | 171 | 0.1% |
| Slovene | 12 | 0.0% |
| South American | 294 | 0.2% |
| Spaniard | 204 | 0.1% |
| Spanish | 47 | 0.0% |
| Sri Lankan | 662 | 0.4% |
| Subsaharan African | 590 | 0.4% |
| Sudanese | 31 | 0.0% |
| Swedish | 958 | 0.6% |
| Swiss | 283 | 0.2% |
| Syrian | 17 | 0.0% |
| Thai | 258 | 0.2% |
| Trinidadian and Tobagonian | 9 | 0.0% |
| U.S. Virgin Islander | 29 | 0.0% |
| Uruguayan | 47 | 0.0% |
| Venezuelan | 84 | 0.1% |
| Welsh | 727 | 0.5% |
| West Indian | 40 | 0.0% | View All 105 Rows |
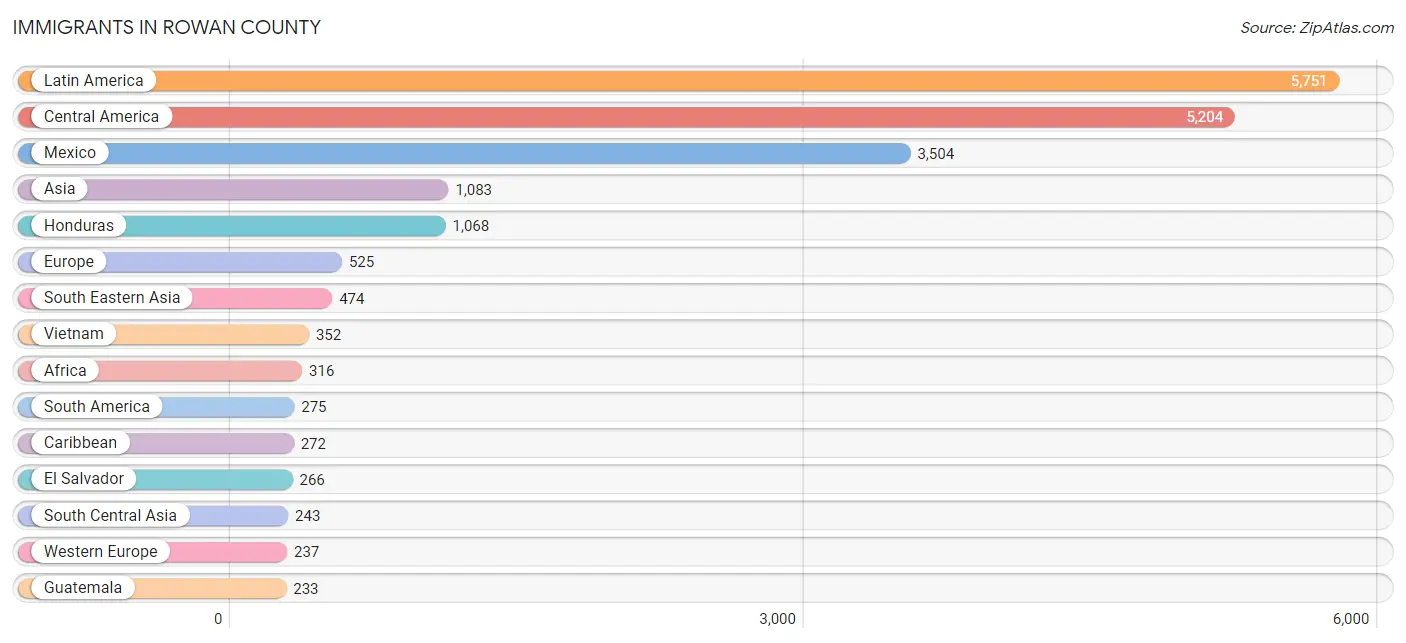
Immigrants in Rowan County
The most numerous immigrant groups reported in Rowan County came from Latin America (5,751 | 3.9%), Central America (5,204 | 3.5%), Mexico (3,504 | 2.4%), Asia (1,083 | 0.7%), and Honduras (1,068 | 0.7%), together accounting for 11.3% of all Rowan County residents.
| Immigration Origin | # Population | % Population |
| Afghanistan | 130 | 0.1% |
| Africa | 316 | 0.2% |
| Asia | 1,083 | 0.7% |
| Australia | 32 | 0.0% |
| Austria | 2 | 0.0% |
| Bahamas | 125 | 0.1% |
| Bosnia and Herzegovina | 31 | 0.0% |
| Brazil | 47 | 0.0% |
| Canada | 146 | 0.1% |
| Caribbean | 272 | 0.2% |
| Central America | 5,204 | 3.5% |
| Chile | 38 | 0.0% |
| China | 119 | 0.1% |
| Colombia | 52 | 0.0% |
| Costa Rica | 58 | 0.0% |
| Cuba | 84 | 0.1% |
| Czechoslovakia | 24 | 0.0% |
| Dominican Republic | 43 | 0.0% |
| Eastern Africa | 70 | 0.1% |
| Eastern Asia | 206 | 0.1% |
| Eastern Europe | 105 | 0.1% |
| Egypt | 31 | 0.0% |
| El Salvador | 266 | 0.2% |
| England | 116 | 0.1% |
| Europe | 525 | 0.4% |
| Germany | 217 | 0.2% |
| Guatemala | 233 | 0.2% |
| Honduras | 1,068 | 0.7% |
| Hong Kong | 37 | 0.0% |
| India | 113 | 0.1% |
| Ireland | 39 | 0.0% |
| Israel | 10 | 0.0% |
| Italy | 9 | 0.0% |
| Jamaica | 11 | 0.0% |
| Jordan | 16 | 0.0% |
| Kenya | 70 | 0.1% |
| Korea | 87 | 0.1% |
| Laos | 19 | 0.0% |
| Latin America | 5,751 | 3.9% |
| Lebanon | 91 | 0.1% |
| Liberia | 115 | 0.1% |
| Mexico | 3,504 | 2.4% |
| Morocco | 50 | 0.0% |
| Netherlands | 18 | 0.0% |
| Nicaragua | 75 | 0.1% |
| Nigeria | 17 | 0.0% |
| Northern Africa | 81 | 0.1% |
| Northern Europe | 166 | 0.1% |
| Oceania | 32 | 0.0% |
| Peru | 75 | 0.1% |
| Philippines | 52 | 0.0% |
| Russia | 50 | 0.0% |
| South Africa | 1 | 0.0% |
| South America | 275 | 0.2% |
| South Central Asia | 243 | 0.2% |
| South Eastern Asia | 474 | 0.3% |
| Southern Europe | 17 | 0.0% |
| Spain | 8 | 0.0% |
| Taiwan | 46 | 0.0% |
| Thailand | 50 | 0.0% |
| Trinidad and Tobago | 9 | 0.0% |
| Uruguay | 20 | 0.0% |
| Venezuela | 43 | 0.0% |
| Vietnam | 352 | 0.2% |
| Western Africa | 141 | 0.1% |
| Western Asia | 160 | 0.1% |
| Western Europe | 237 | 0.2% |
| Yemen | 21 | 0.0% | View All 68 Rows |
Sex and Age in Rowan County
Sex and Age in Rowan County
The most populous age groups in Rowan County are 55 to 59 Years (5,217 | 7.1%) for men and 55 to 59 Years (5,370 | 7.3%) for women.
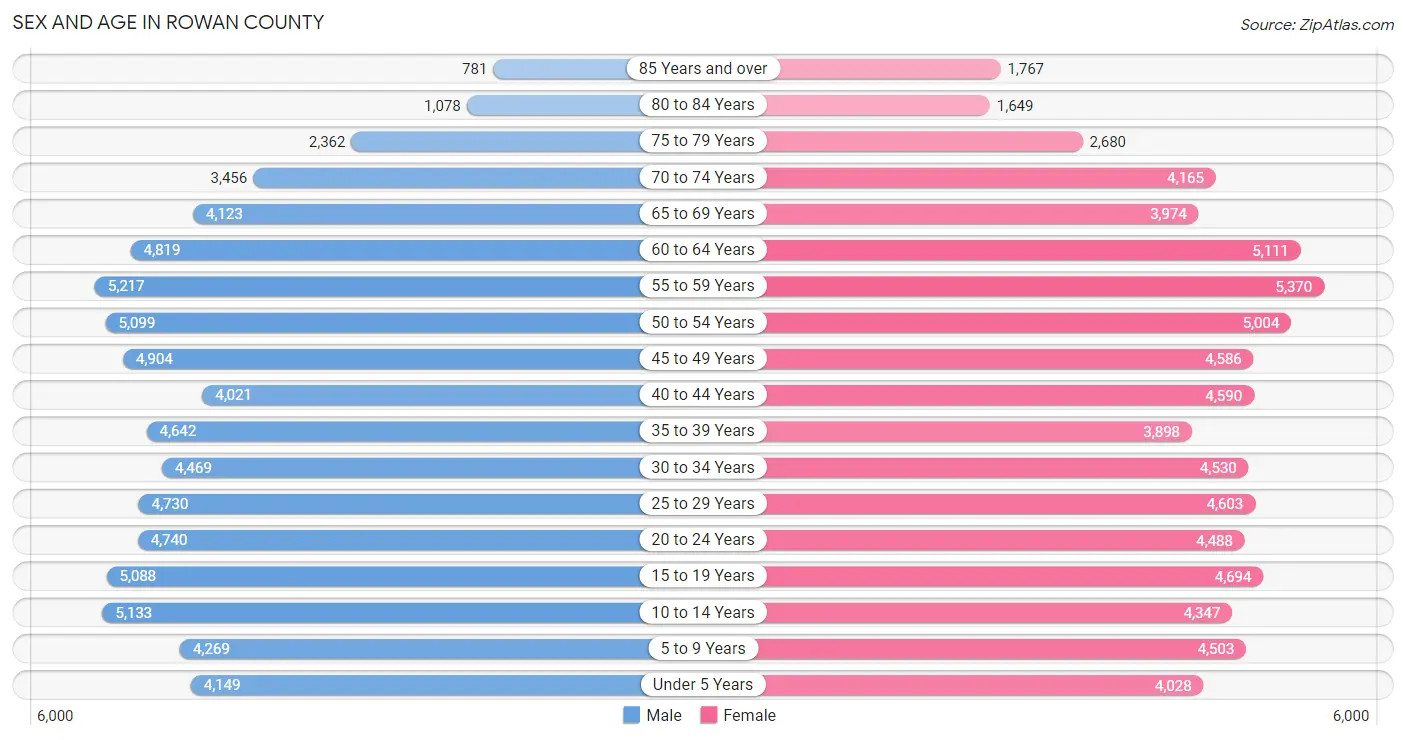
| Age Bracket | Male | Female |
| Under 5 Years | 4,149 (5.7%) | 4,028 (5.4%) |
| 5 to 9 Years | 4,269 (5.8%) | 4,503 (6.1%) |
| 10 to 14 Years | 5,133 (7.0%) | 4,347 (5.9%) |
| 15 to 19 Years | 5,088 (7.0%) | 4,694 (6.3%) |
| 20 to 24 Years | 4,740 (6.5%) | 4,488 (6.1%) |
| 25 to 29 Years | 4,730 (6.5%) | 4,603 (6.2%) |
| 30 to 34 Years | 4,469 (6.1%) | 4,530 (6.1%) |
| 35 to 39 Years | 4,642 (6.4%) | 3,898 (5.3%) |
| 40 to 44 Years | 4,021 (5.5%) | 4,590 (6.2%) |
| 45 to 49 Years | 4,904 (6.7%) | 4,586 (6.2%) |
| 50 to 54 Years | 5,099 (7.0%) | 5,004 (6.8%) |
| 55 to 59 Years | 5,217 (7.1%) | 5,370 (7.3%) |
| 60 to 64 Years | 4,819 (6.6%) | 5,111 (6.9%) |
| 65 to 69 Years | 4,123 (5.6%) | 3,974 (5.4%) |
| 70 to 74 Years | 3,456 (4.7%) | 4,165 (5.6%) |
| 75 to 79 Years | 2,362 (3.2%) | 2,680 (3.6%) |
| 80 to 84 Years | 1,078 (1.5%) | 1,649 (2.2%) |
| 85 Years and over | 781 (1.1%) | 1,767 (2.4%) |
| Total | 73,080 (100.0%) | 73,987 (100.0%) |
Families and Households in Rowan County
Median Family Size in Rowan County
The median family size in Rowan County is 3.07 persons per family, with single female/mother families (7,631 | 20.2%) accounting for the largest median family size of 3.12 persons per family. On the other hand, single male/father families (2,737 | 7.2%) represent the smallest median family size with 2.86 persons per family.
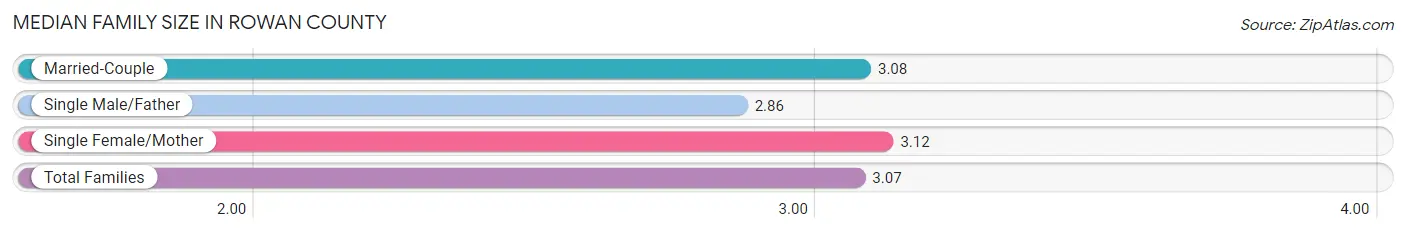
| Family Type | # Families | Family Size |
| Married-Couple | 27,462 (72.6%) | 3.08 |
| Single Male/Father | 2,737 (7.2%) | 2.86 |
| Single Female/Mother | 7,631 (20.2%) | 3.12 |
| Total Families | 37,830 (100.0%) | 3.07 |
Median Household Size in Rowan County
The median household size in Rowan County is 2.52 persons per household, with single female/mother households (7,631 | 13.5%) accounting for the largest median household size of 3.38 persons per household. non-family households (18,788 | 33.2%) represent the smallest median household size with 1.21 persons per household.
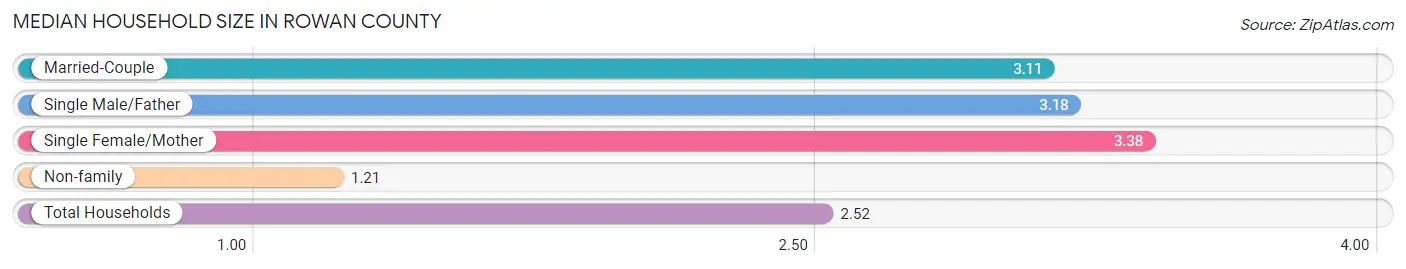
| Household Type | # Households | Household Size |
| Married-Couple | 27,462 (48.5%) | 3.11 |
| Single Male/Father | 2,737 (4.8%) | 3.18 |
| Single Female/Mother | 7,631 (13.5%) | 3.38 |
| Non-family | 18,788 (33.2%) | 1.21 |
| Total Households | 56,618 (100.0%) | 2.52 |
Household Size by Marriage Status in Rowan County
Out of a total of 56,618 households in Rowan County, 37,830 (66.8%) are family households, while 18,788 (33.2%) are nonfamily households. The most numerous type of family households are 2-person households, comprising 17,131, and the most common type of nonfamily households are 1-person households, comprising 15,468.

| Household Size | Family Households | Nonfamily Households |
| 1-Person Households | - | 15,468 (27.3%) |
| 2-Person Households | 17,131 (30.3%) | 2,747 (4.9%) |
| 3-Person Households | 8,987 (15.9%) | 475 (0.8%) |
| 4-Person Households | 5,784 (10.2%) | 69 (0.1%) |
| 5-Person Households | 3,609 (6.4%) | 29 (0.1%) |
| 6-Person Households | 1,451 (2.6%) | 0 (0.0%) |
| 7+ Person Households | 868 (1.5%) | 0 (0.0%) |
| Total | 37,830 (66.8%) | 18,788 (33.2%) |
Female Fertility in Rowan County
Fertility by Age in Rowan County
Average fertility rate in Rowan County is 56.0 births per 1,000 women. Women in the age bracket of 20 to 34 years have the highest fertility rate with 116.0 births per 1,000 women. Women in the age bracket of 20 to 34 years acount for 86.3% of all women with births.
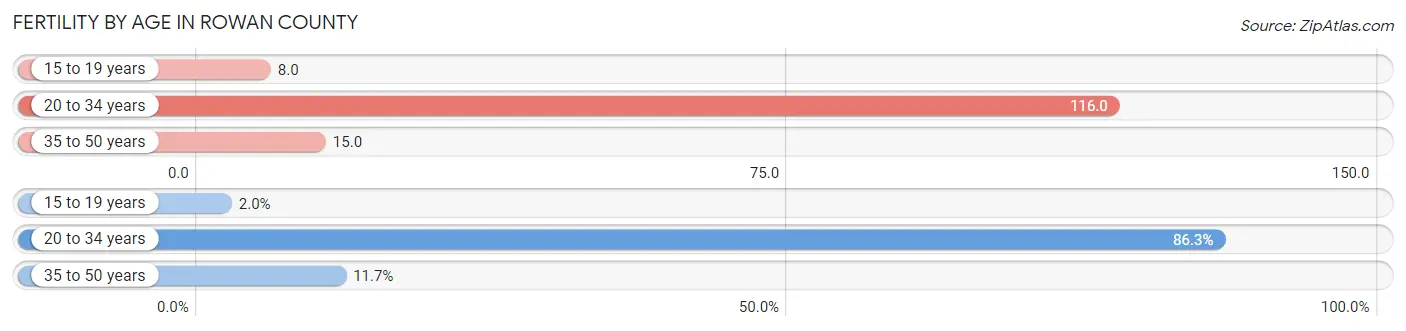
| Age Bracket | Women with Births | Births / 1,000 Women |
| 15 to 19 years | 37 (2.0%) | 8.0 |
| 20 to 34 years | 1,583 (86.3%) | 116.0 |
| 35 to 50 years | 215 (11.7%) | 15.0 |
| Total | 1,835 (100.0%) | 56.0 |
Fertility by Age by Marriage Status in Rowan County
49.6% of women with births (1,835) in Rowan County are married. The highest percentage of unmarried women with births falls into 15 to 19 years age bracket with 100.0% of them unmarried at the time of birth, while the lowest percentage of unmarried women with births belong to 35 to 50 years age bracket with 27.0% of them unmarried.
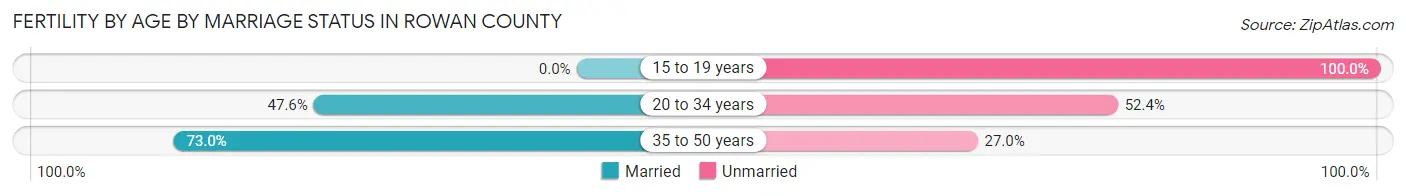
| Age Bracket | Married | Unmarried |
| 15 to 19 years | 0 (0.0%) | 37 (100.0%) |
| 20 to 34 years | 754 (47.6%) | 829 (52.4%) |
| 35 to 50 years | 157 (73.0%) | 58 (27.0%) |
| Total | 910 (49.6%) | 925 (50.4%) |
Fertility by Education in Rowan County
Average fertility rate in Rowan County is 56.0 births per 1,000 women. Women with the education attainment of high school diploma have the highest fertility rate of 71.0 births per 1,000 women, while women with the education attainment of graduate degree have the lowest fertility at 24.0 births per 1,000 women. Women with the education attainment of college or associate's degree represent 33.7% of all women with births.
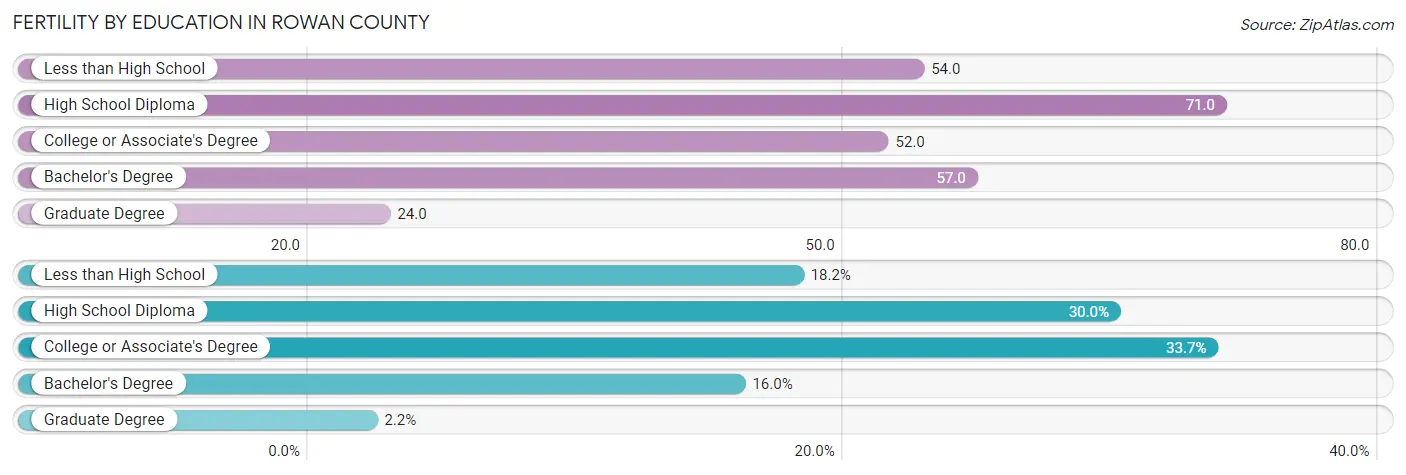
| Educational Attainment | Women with Births | Births / 1,000 Women |
| Less than High School | 333 (18.1%) | 54.0 |
| High School Diploma | 551 (30.0%) | 71.0 |
| College or Associate's Degree | 618 (33.7%) | 52.0 |
| Bachelor's Degree | 293 (16.0%) | 57.0 |
| Graduate Degree | 40 (2.2%) | 24.0 |
| Total | 1,835 (100.0%) | 56.0 |
Fertility by Education by Marriage Status in Rowan County
50.4% of women with births in Rowan County are unmarried. Women with the educational attainment of bachelor's degree are most likely to be married with 96.9% of them married at childbirth, while women with the educational attainment of less than high school are least likely to be married with 79.3% of them unmarried at childbirth.
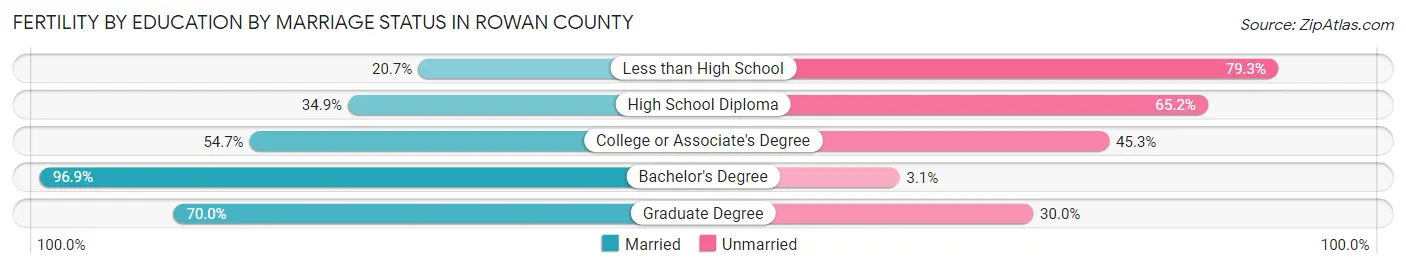
| Educational Attainment | Married | Unmarried |
| Less than High School | 69 (20.7%) | 264 (79.3%) |
| High School Diploma | 192 (34.8%) | 359 (65.1%) |
| College or Associate's Degree | 338 (54.7%) | 280 (45.3%) |
| Bachelor's Degree | 284 (96.9%) | 9 (3.1%) |
| Graduate Degree | 28 (70.0%) | 12 (30.0%) |
| Total | 910 (49.6%) | 925 (50.4%) |
Income in Rowan County
Income Overview in Rowan County
Per Capita Income in Rowan County is $31,108, while median incomes of families and households are $73,551 and $59,717 respectively.
| Characteristic | Number | Measure |
| Per Capita Income | 147,067 | $31,108 |
| Median Family Income | 37,830 | $73,551 |
| Mean Family Income | 37,830 | $92,253 |
| Median Household Income | 56,618 | $59,717 |
| Mean Household Income | 56,618 | $78,418 |
| Income Deficit | 37,830 | $10,204 |
| Wage / Income Gap (%) | 147,067 | 33.05% |
| Wage / Income Gap ($) | 147,067 | 66.95¢ per $1 |
| Gini / Inequality Index | 147,067 | 0.45 |
Earnings by Sex in Rowan County
Average Earnings in Rowan County are $36,677, $43,782 for men and $29,314 for women, a difference of 33.1%.
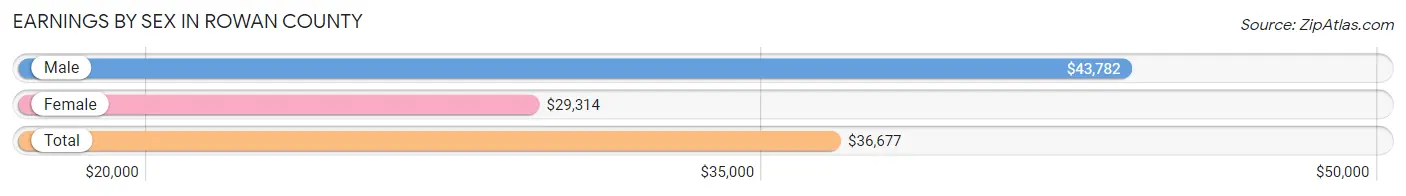
| Sex | Number | Average Earnings |
| Male | 39,836 (53.4%) | $43,782 |
| Female | 34,729 (46.6%) | $29,314 |
| Total | 74,565 (100.0%) | $36,677 |
Earnings by Sex by Income Bracket in Rowan County
The most common earnings brackets in Rowan County are $75,000 to $99,999 for men (4,480 | 11.3%) and $25,000 to $29,999 for women (2,911 | 8.4%).
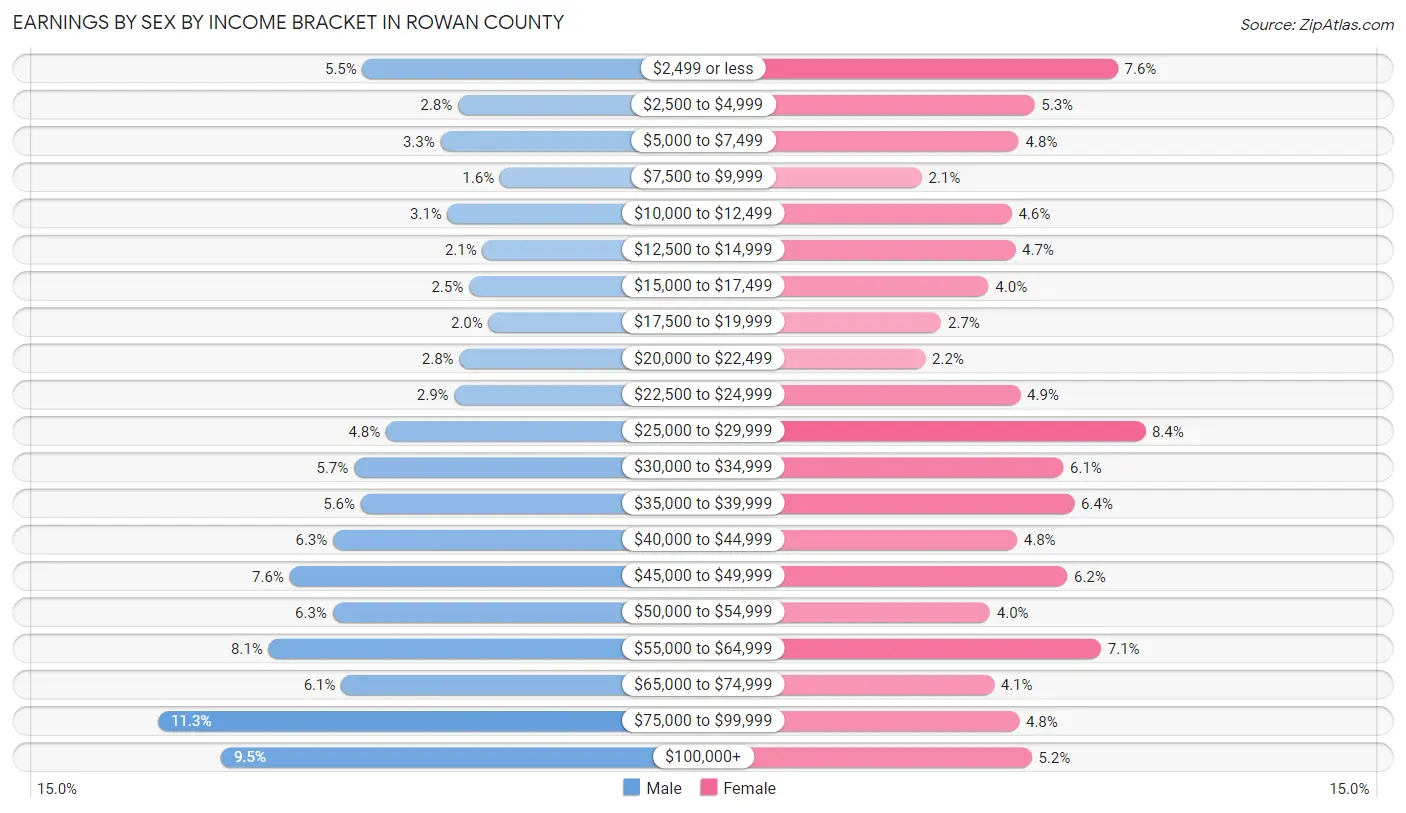
| Income | Male | Female |
| $2,499 or less | 2,191 (5.5%) | 2,642 (7.6%) |
| $2,500 to $4,999 | 1,124 (2.8%) | 1,831 (5.3%) |
| $5,000 to $7,499 | 1,318 (3.3%) | 1,677 (4.8%) |
| $7,500 to $9,999 | 652 (1.6%) | 728 (2.1%) |
| $10,000 to $12,499 | 1,240 (3.1%) | 1,608 (4.6%) |
| $12,500 to $14,999 | 850 (2.1%) | 1,643 (4.7%) |
| $15,000 to $17,499 | 1,000 (2.5%) | 1,382 (4.0%) |
| $17,500 to $19,999 | 782 (2.0%) | 921 (2.6%) |
| $20,000 to $22,499 | 1,109 (2.8%) | 764 (2.2%) |
| $22,500 to $24,999 | 1,162 (2.9%) | 1,691 (4.9%) |
| $25,000 to $29,999 | 1,928 (4.8%) | 2,911 (8.4%) |
| $30,000 to $34,999 | 2,285 (5.7%) | 2,111 (6.1%) |
| $35,000 to $39,999 | 2,211 (5.6%) | 2,220 (6.4%) |
| $40,000 to $44,999 | 2,520 (6.3%) | 1,660 (4.8%) |
| $45,000 to $49,999 | 3,007 (7.5%) | 2,148 (6.2%) |
| $50,000 to $54,999 | 2,526 (6.3%) | 1,395 (4.0%) |
| $55,000 to $64,999 | 3,243 (8.1%) | 2,480 (7.1%) |
| $65,000 to $74,999 | 2,431 (6.1%) | 1,434 (4.1%) |
| $75,000 to $99,999 | 4,480 (11.3%) | 1,682 (4.8%) |
| $100,000+ | 3,777 (9.5%) | 1,801 (5.2%) |
| Total | 39,836 (100.0%) | 34,729 (100.0%) |
Earnings by Sex by Educational Attainment in Rowan County
Average earnings in Rowan County are $48,307 for men and $34,745 for women, a difference of 28.1%. Men with an educational attainment of graduate degree enjoy the highest average annual earnings of $84,324, while those with less than high school education earn the least with $33,249. Women with an educational attainment of graduate degree earn the most with the average annual earnings of $62,277, while those with less than high school education have the smallest earnings of $16,932.
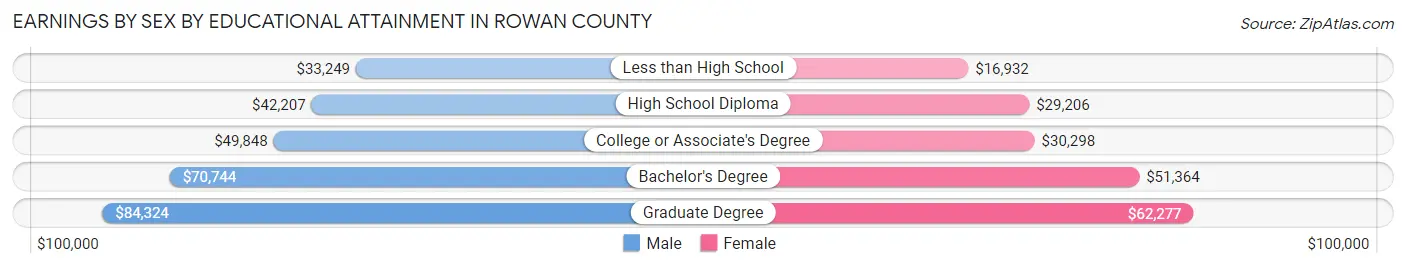
| Educational Attainment | Male Income | Female Income |
| Less than High School | $33,249 | $16,932 |
| High School Diploma | $42,207 | $29,206 |
| College or Associate's Degree | $49,848 | $30,298 |
| Bachelor's Degree | $70,744 | $51,364 |
| Graduate Degree | $84,324 | $62,277 |
| Total | $48,307 | $34,745 |
Family Income in Rowan County
Family Income Brackets in Rowan County
According to the Rowan County family income data, there are 7,263 families falling into the $50,000 to $74,999 income range, which is the most common income bracket and makes up 19.2% of all families. Conversely, the less than $10,000 income bracket is the least frequent group with only 1,248 families (3.3%) belonging to this category.
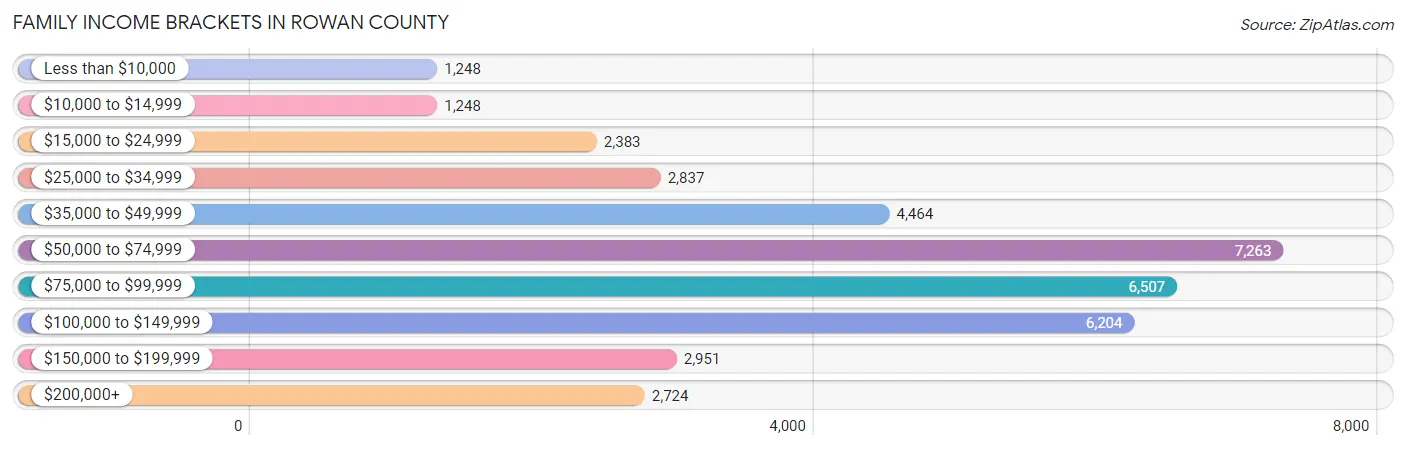
| Income Bracket | # Families | % Families |
| Less than $10,000 | 1,248 | 3.3% |
| $10,000 to $14,999 | 1,248 | 3.3% |
| $15,000 to $24,999 | 2,383 | 6.3% |
| $25,000 to $34,999 | 2,837 | 7.5% |
| $35,000 to $49,999 | 4,464 | 11.8% |
| $50,000 to $74,999 | 7,263 | 19.2% |
| $75,000 to $99,999 | 6,507 | 17.2% |
| $100,000 to $149,999 | 6,204 | 16.4% |
| $150,000 to $199,999 | 2,951 | 7.8% |
| $200,000+ | 2,724 | 7.2% |
Family Income by Famaliy Size in Rowan County
4-person families (5,267 | 13.9%) account for the highest median family income in Rowan County with $82,827 per family, while 2-person families (18,095 | 47.8%) have the highest median income of $34,392 per family member.
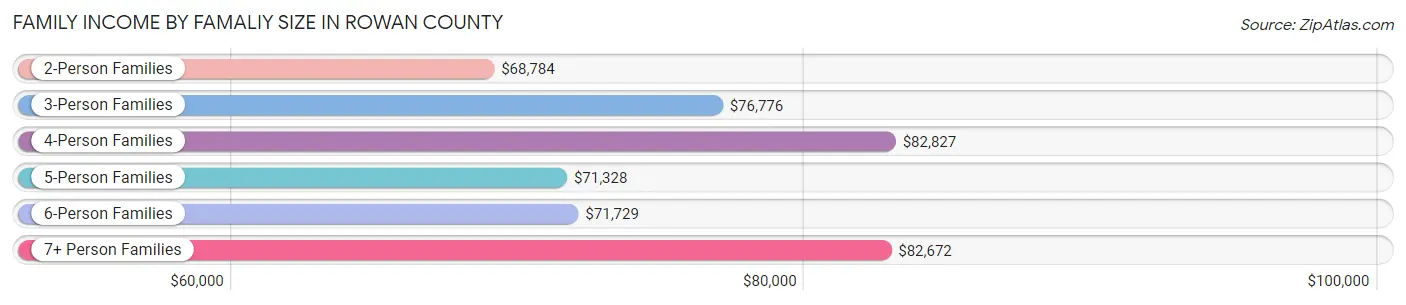
| Income Bracket | # Families | Median Income |
| 2-Person Families | 18,095 (47.8%) | $68,784 |
| 3-Person Families | 9,131 (24.1%) | $76,776 |
| 4-Person Families | 5,267 (13.9%) | $82,827 |
| 5-Person Families | 3,462 (9.1%) | $71,328 |
| 6-Person Families | 1,273 (3.4%) | $71,729 |
| 7+ Person Families | 602 (1.6%) | $82,672 |
| Total | 37,830 (100.0%) | $73,551 |
Family Income by Number of Earners in Rowan County
The median family income in Rowan County is $73,551, with families comprising 3+ earners (3,401) having the highest median family income of $120,313, while families with no earners (6,327) have the lowest median family income of $41,519, accounting for 9.0% and 16.7% of families, respectively.
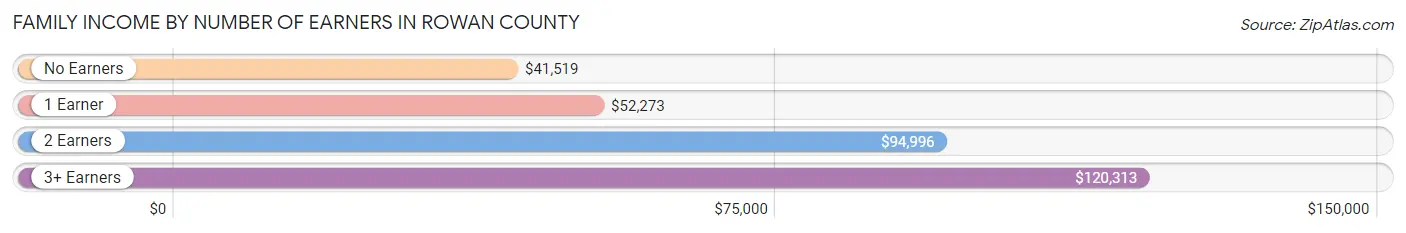
| Number of Earners | # Families | Median Income |
| No Earners | 6,327 (16.7%) | $41,519 |
| 1 Earner | 12,329 (32.6%) | $52,273 |
| 2 Earners | 15,773 (41.7%) | $94,996 |
| 3+ Earners | 3,401 (9.0%) | $120,313 |
| Total | 37,830 (100.0%) | $73,551 |
Household Income in Rowan County
Household Income Brackets in Rowan County
With 10,531 households falling in the category, the $50,000 to $74,999 income range is the most frequent in Rowan County, accounting for 18.6% of all households. In contrast, only 2,661 households (4.7%) fall into the less than $10,000 income bracket, making it the least populous group.
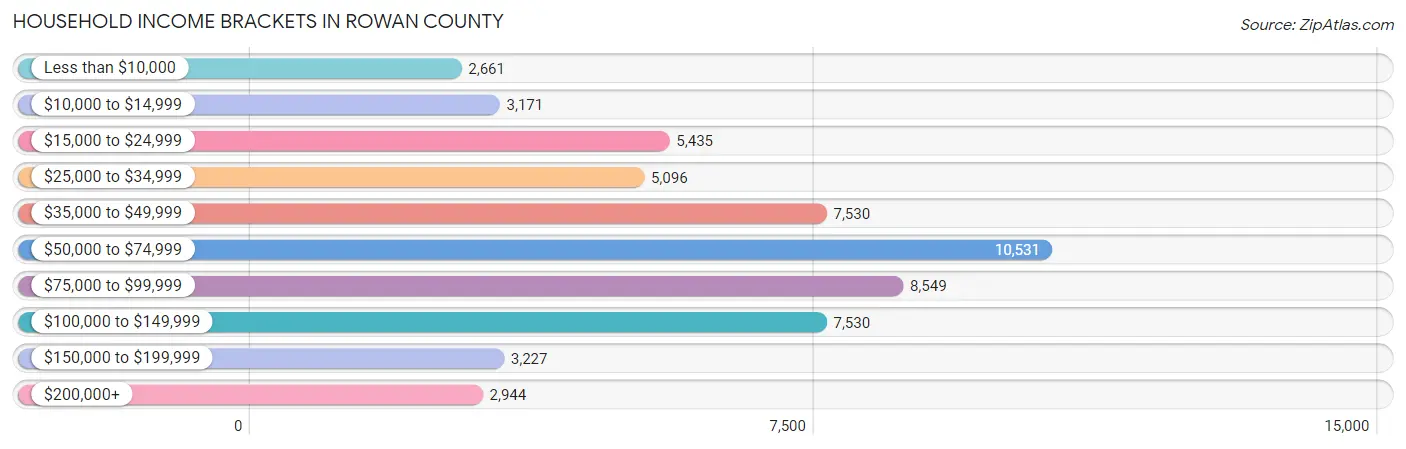
| Income Bracket | # Households | % Households |
| Less than $10,000 | 2,661 | 4.7% |
| $10,000 to $14,999 | 3,171 | 5.6% |
| $15,000 to $24,999 | 5,435 | 9.6% |
| $25,000 to $34,999 | 5,096 | 9.0% |
| $35,000 to $49,999 | 7,530 | 13.3% |
| $50,000 to $74,999 | 10,531 | 18.6% |
| $75,000 to $99,999 | 8,549 | 15.1% |
| $100,000 to $149,999 | 7,530 | 13.3% |
| $150,000 to $199,999 | 3,227 | 5.7% |
| $200,000+ | 2,944 | 5.2% |
Household Income by Householder Age in Rowan County
The median household income in Rowan County is $59,717, with the highest median household income of $74,561 found in the 45 to 64 years age bracket for the primary householder. A total of 22,426 households (39.6%) fall into this category. Meanwhile, the 65+ years age bracket for the primary householder has the lowest median household income of $41,784, with 16,403 households (29.0%) in this group.
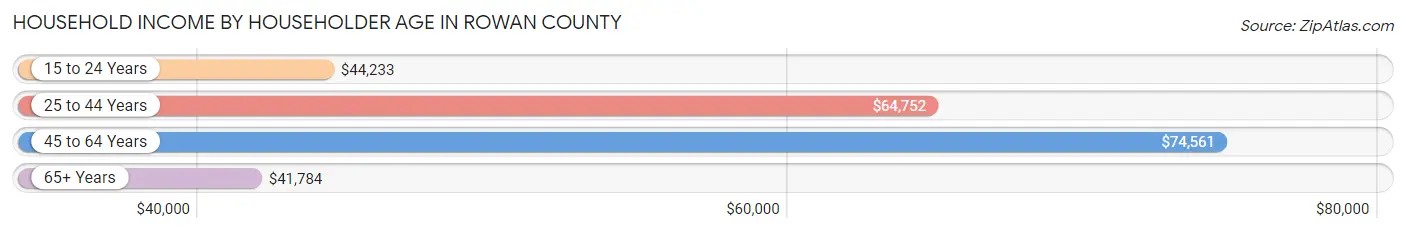
| Income Bracket | # Households | Median Income |
| 15 to 24 Years | 2,020 (3.6%) | $44,233 |
| 25 to 44 Years | 15,769 (27.9%) | $64,752 |
| 45 to 64 Years | 22,426 (39.6%) | $74,561 |
| 65+ Years | 16,403 (29.0%) | $41,784 |
| Total | 56,618 (100.0%) | $59,717 |
Poverty in Rowan County
Income Below Poverty by Sex and Age in Rowan County
With 15.1% poverty level for males and 17.7% for females among the residents of Rowan County, 5 year old males and 5 year old females are the most vulnerable to poverty, with 241 males (41.0%) and 292 females (33.8%) in their respective age groups living below the poverty level.
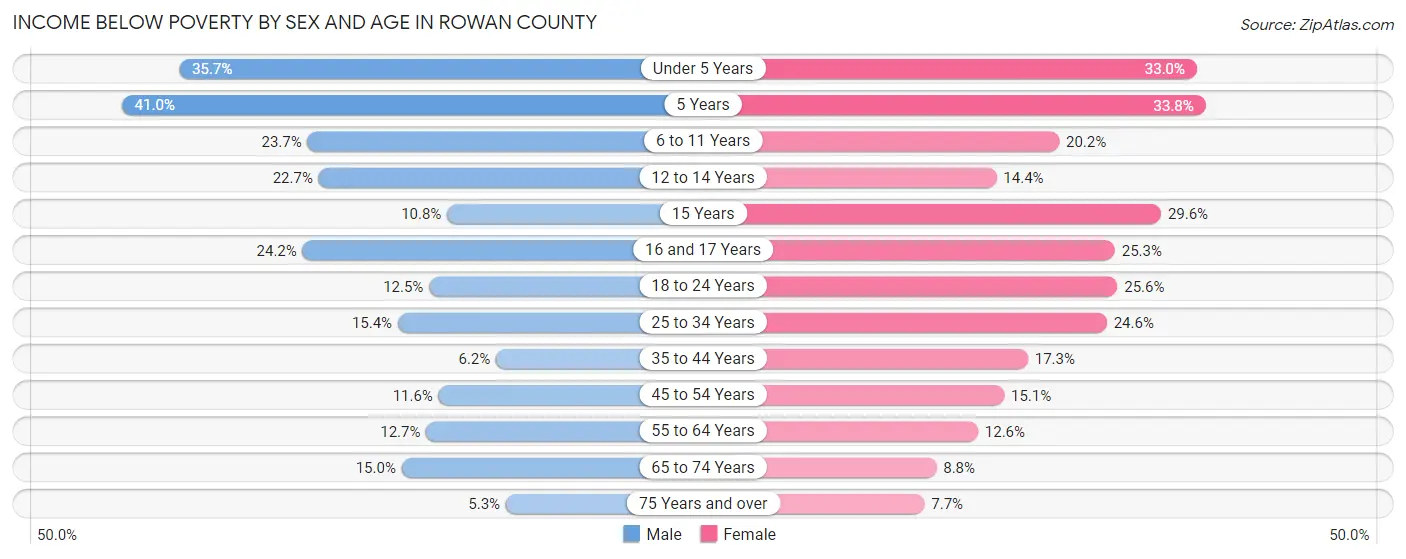
| Age Bracket | Male | Female |
| Under 5 Years | 1,443 (35.7%) | 1,303 (33.0%) |
| 5 Years | 241 (41.0%) | 292 (33.8%) |
| 6 to 11 Years | 1,346 (23.7%) | 1,073 (20.2%) |
| 12 to 14 Years | 671 (22.7%) | 367 (14.3%) |
| 15 Years | 139 (10.8%) | 335 (29.6%) |
| 16 and 17 Years | 418 (24.2%) | 441 (25.3%) |
| 18 to 24 Years | 727 (12.4%) | 1,459 (25.6%) |
| 25 to 34 Years | 1,367 (15.3%) | 2,243 (24.6%) |
| 35 to 44 Years | 515 (6.2%) | 1,454 (17.3%) |
| 45 to 54 Years | 1,136 (11.6%) | 1,439 (15.1%) |
| 55 to 64 Years | 1,262 (12.7%) | 1,314 (12.6%) |
| 65 to 74 Years | 1,111 (15.0%) | 705 (8.8%) |
| 75 Years and over | 203 (5.3%) | 439 (7.7%) |
| Total | 10,579 (15.1%) | 12,864 (17.7%) |
Income Above Poverty by Sex and Age in Rowan County
According to the poverty statistics in Rowan County, males aged 75 years and over and females aged 75 years and over are the age groups that are most secure financially, with 94.7% of males and 92.3% of females in these age groups living above the poverty line.
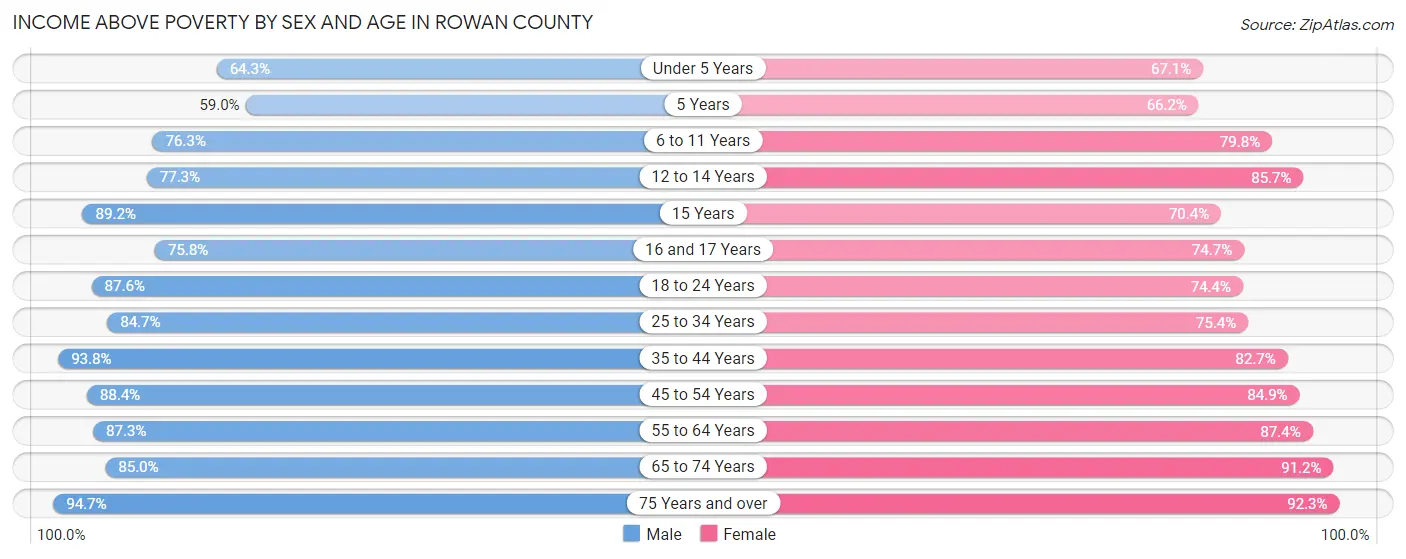
| Age Bracket | Male | Female |
| Under 5 Years | 2,602 (64.3%) | 2,652 (67.0%) |
| 5 Years | 347 (59.0%) | 573 (66.2%) |
| 6 to 11 Years | 4,324 (76.3%) | 4,249 (79.8%) |
| 12 to 14 Years | 2,285 (77.3%) | 2,190 (85.7%) |
| 15 Years | 1,150 (89.2%) | 796 (70.4%) |
| 16 and 17 Years | 1,309 (75.8%) | 1,299 (74.7%) |
| 18 to 24 Years | 5,113 (87.5%) | 4,248 (74.4%) |
| 25 to 34 Years | 7,540 (84.7%) | 6,880 (75.4%) |
| 35 to 44 Years | 7,742 (93.8%) | 6,971 (82.7%) |
| 45 to 54 Years | 8,681 (88.4%) | 8,118 (84.9%) |
| 55 to 64 Years | 8,660 (87.3%) | 9,087 (87.4%) |
| 65 to 74 Years | 6,295 (85.0%) | 7,338 (91.2%) |
| 75 Years and over | 3,604 (94.7%) | 5,294 (92.3%) |
| Total | 59,652 (84.9%) | 59,695 (82.3%) |
Income Below Poverty Among Married-Couple Families in Rowan County
The poverty statistics for married-couple families in Rowan County show that 5.9% or 1,634 of the total 27,462 families live below the poverty line. Families with 3 or 4 children have the highest poverty rate of 16.5%, comprising of 407 families. On the other hand, families with 5 or more children have the lowest poverty rate of 0.0%, which includes 0 families.
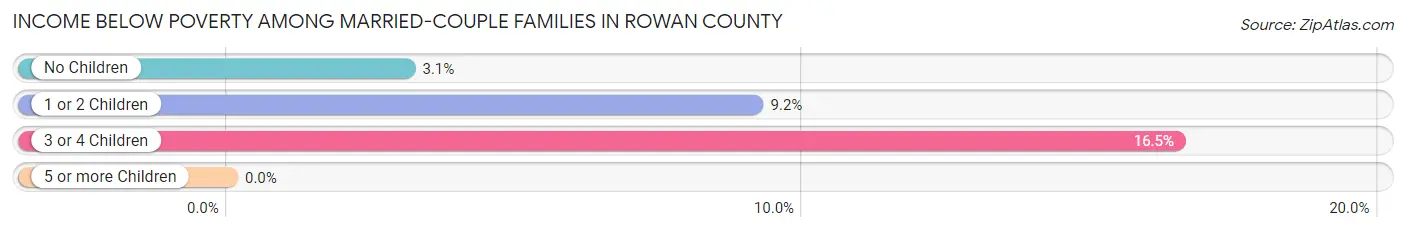
| Children | Above Poverty | Below Poverty |
| No Children | 16,690 (96.9%) | 532 (3.1%) |
| 1 or 2 Children | 6,904 (90.8%) | 695 (9.1%) |
| 3 or 4 Children | 2,059 (83.5%) | 407 (16.5%) |
| 5 or more Children | 175 (100.0%) | 0 (0.0%) |
| Total | 25,828 (94.1%) | 1,634 (5.9%) |
Income Below Poverty Among Single-Parent Households in Rowan County
According to the poverty data in Rowan County, 18.4% or 505 single-father households and 33.4% or 2,552 single-mother households are living below the poverty line. Among single-father households, those with 1 or 2 children have the highest poverty rate, with 325 households (26.0%) experiencing poverty. Likewise, among single-mother households, those with 5 or more children have the highest poverty rate, with 10 households (100.0%) falling below the poverty line.
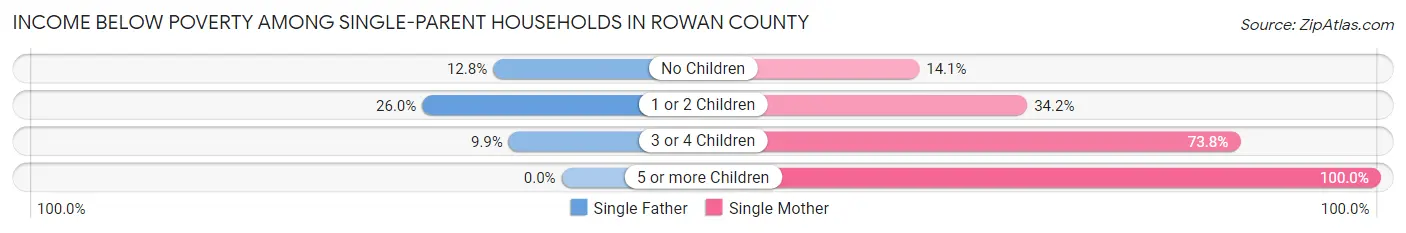
| Children | Single Father | Single Mother |
| No Children | 148 (12.8%) | 384 (14.1%) |
| 1 or 2 Children | 325 (26.0%) | 1,255 (34.2%) |
| 3 or 4 Children | 32 (9.9%) | 903 (73.8%) |
| 5 or more Children | 0 (0.0%) | 10 (100.0%) |
| Total | 505 (18.4%) | 2,552 (33.4%) |
Income Below Poverty Among Married-Couple vs Single-Parent Households in Rowan County
The poverty data for Rowan County shows that 1,634 of the married-couple family households (5.9%) and 3,057 of the single-parent households (29.5%) are living below the poverty level. Within the married-couple family households, those with 3 or 4 children have the highest poverty rate, with 407 households (16.5%) falling below the poverty line. Among the single-parent households, those with 5 or more children have the highest poverty rate, with 10 household (100.0%) living below poverty.
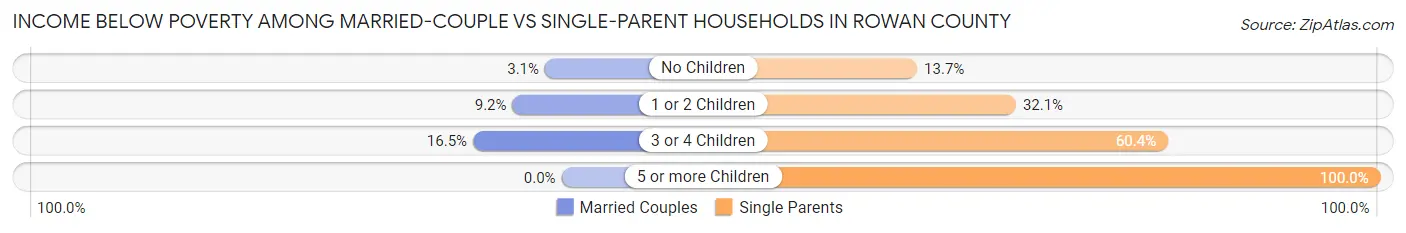
| Children | Married-Couple Families | Single-Parent Households |
| No Children | 532 (3.1%) | 532 (13.7%) |
| 1 or 2 Children | 695 (9.1%) | 1,580 (32.1%) |
| 3 or 4 Children | 407 (16.5%) | 935 (60.4%) |
| 5 or more Children | 0 (0.0%) | 10 (100.0%) |
| Total | 1,634 (5.9%) | 3,057 (29.5%) |
Employment Characteristics in Rowan County
Employment by Class of Employer in Rowan County
Among the 65,043 employed individuals in Rowan County, private company employees (45,984 | 70.7%), not-for-profit organizations (4,835 | 7.4%), and local government employees (4,149 | 6.4%) make up the most common classes of employment.
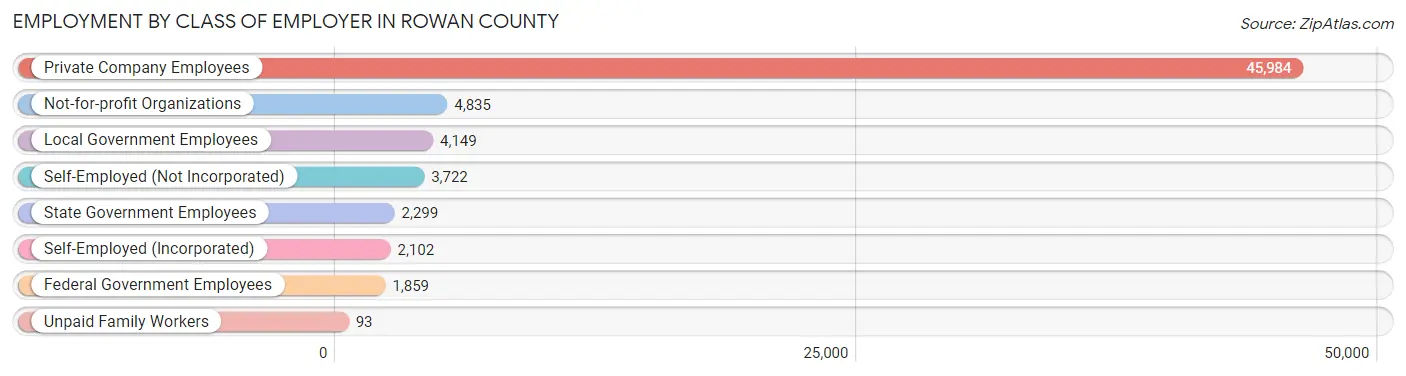
| Employer Class | # Employees | % Employees |
| Private Company Employees | 45,984 | 70.7% |
| Self-Employed (Incorporated) | 2,102 | 3.2% |
| Self-Employed (Not Incorporated) | 3,722 | 5.7% |
| Not-for-profit Organizations | 4,835 | 7.4% |
| Local Government Employees | 4,149 | 6.4% |
| State Government Employees | 2,299 | 3.5% |
| Federal Government Employees | 1,859 | 2.9% |
| Unpaid Family Workers | 93 | 0.1% |
| Total | 65,043 | 100.0% |
Employment Status by Age in Rowan County
According to the labor force statistics for Rowan County, out of the total population over 16 years of age (118,203), 60.3% or 71,276 individuals are in the labor force, with 6.3% or 4,490 of them unemployed. The age group with the highest labor force participation rate is 25 to 29 years, with 85.6% or 7,989 individuals in the labor force. Within the labor force, the 16 to 19 years age range has the highest percentage of unemployed individuals, with 27.4% or 858 of them being unemployed.
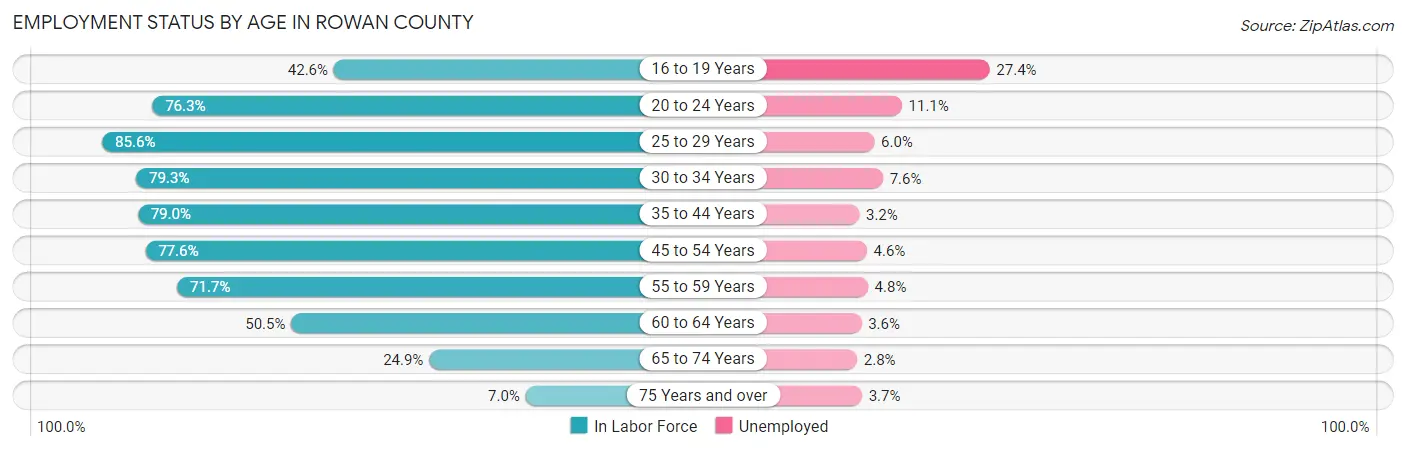
| Age Bracket | In Labor Force | Unemployed |
| 16 to 19 Years | 3,130 (42.6%) | 858 (27.4%) |
| 20 to 24 Years | 7,041 (76.3%) | 782 (11.1%) |
| 25 to 29 Years | 7,989 (85.6%) | 479 (6.0%) |
| 30 to 34 Years | 7,136 (79.3%) | 542 (7.6%) |
| 35 to 44 Years | 13,549 (79.0%) | 434 (3.2%) |
| 45 to 54 Years | 15,204 (77.6%) | 699 (4.6%) |
| 55 to 59 Years | 7,591 (71.7%) | 364 (4.8%) |
| 60 to 64 Years | 5,015 (50.5%) | 181 (3.6%) |
| 65 to 74 Years | 3,914 (24.9%) | 110 (2.8%) |
| 75 Years and over | 722 (7.0%) | 27 (3.7%) |
| Total | 71,276 (60.3%) | 4,490 (6.3%) |
Employment Status by Educational Attainment in Rowan County
According to labor force statistics for Rowan County, 74.7% of individuals (56,468) out of the total population between 25 and 64 years of age (75,593) are in the labor force, with 4.8% or 2,710 of them being unemployed. The group with the highest labor force participation rate are those with the educational attainment of bachelor's degree or higher, with 83.1% or 13,562 individuals in the labor force. Within the labor force, individuals with less than high school education have the highest percentage of unemployment, with 6.7% or 354 of them being unemployed.
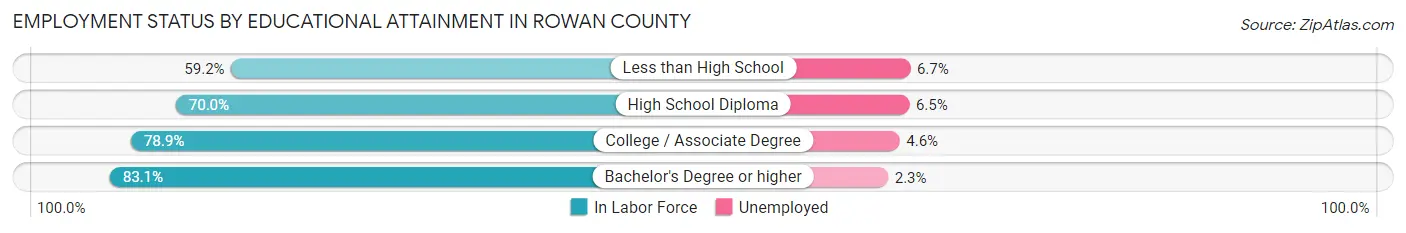
| Educational Attainment | In Labor Force | Unemployed |
| Less than High School | 5,282 (59.2%) | 598 (6.7%) |
| High School Diploma | 16,580 (70.0%) | 1,540 (6.5%) |
| College / Associate Degree | 21,039 (78.9%) | 1,227 (4.6%) |
| Bachelor's Degree or higher | 13,562 (83.1%) | 375 (2.3%) |
| Total | 56,468 (74.7%) | 3,628 (4.8%) |
Employment Occupations by Sex in Rowan County
Management, Business, Science and Arts Occupations
The most common Management, Business, Science and Arts occupations in Rowan County are Community & Social Service (6,274 | 9.4%), Management (5,963 | 8.9%), Health Diagnosing & Treating (3,667 | 5.5%), Education Instruction & Library (3,363 | 5.0%), and Business & Financial (2,754 | 4.1%).

Management, Business, Science and Arts Occupations by Sex
Within the Management, Business, Science and Arts occupations in Rowan County, the most male-oriented occupations are Architecture & Engineering (85.4%), Computers, Engineering & Science (72.8%), and Life, Physical & Social Science (64.7%), while the most female-oriented occupations are Health Technologists (82.9%), Legal Services & Support (82.9%), and Health Diagnosing & Treating (82.4%).
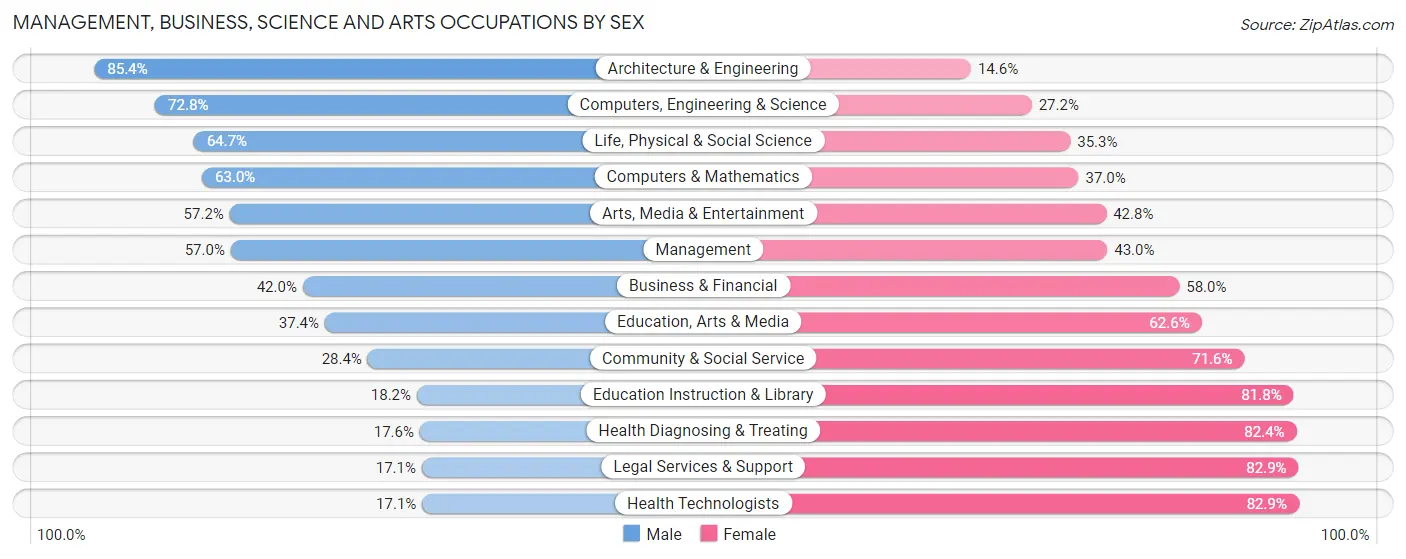
| Occupation | Male | Female |
| Management | 3,399 (57.0%) | 2,564 (43.0%) |
| Business & Financial | 1,156 (42.0%) | 1,598 (58.0%) |
| Computers, Engineering & Science | 1,862 (72.8%) | 697 (27.2%) |
| Computers & Mathematics | 642 (63.0%) | 377 (37.0%) |
| Architecture & Engineering | 921 (85.4%) | 157 (14.6%) |
| Life, Physical & Social Science | 299 (64.7%) | 163 (35.3%) |
| Community & Social Service | 1,784 (28.4%) | 4,490 (71.6%) |
| Education, Arts & Media | 584 (37.4%) | 979 (62.6%) |
| Legal Services & Support | 78 (17.1%) | 377 (82.9%) |
| Education Instruction & Library | 611 (18.2%) | 2,752 (81.8%) |
| Arts, Media & Entertainment | 511 (57.2%) | 382 (42.8%) |
| Health Diagnosing & Treating | 644 (17.6%) | 3,023 (82.4%) |
| Health Technologists | 402 (17.1%) | 1,953 (82.9%) |
| Total (Category) | 8,845 (41.7%) | 12,372 (58.3%) |
| Total (Overall) | 36,092 (54.1%) | 30,650 (45.9%) |
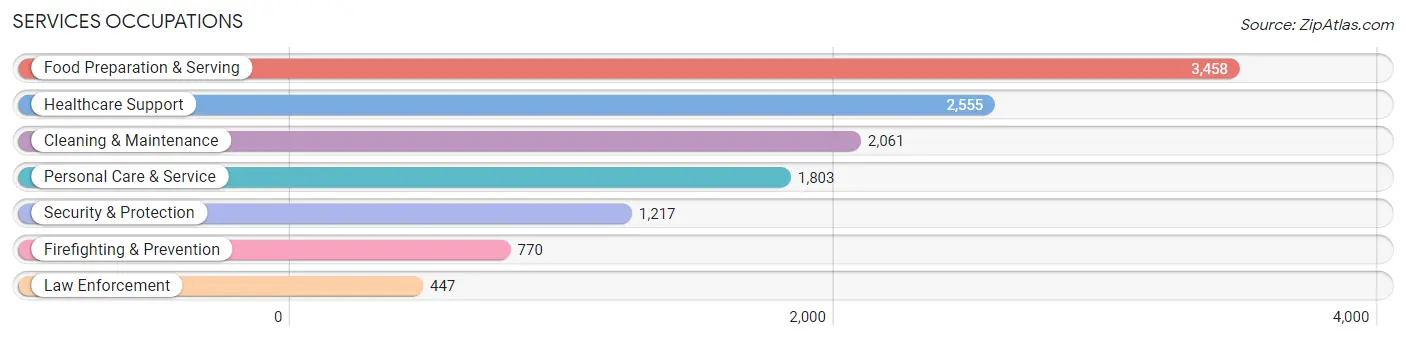
Services Occupations
The most common Services occupations in Rowan County are Food Preparation & Serving (3,458 | 5.2%), Healthcare Support (2,555 | 3.8%), Cleaning & Maintenance (2,061 | 3.1%), Personal Care & Service (1,803 | 2.7%), and Security & Protection (1,217 | 1.8%).
Services Occupations by Sex
Within the Services occupations in Rowan County, the most male-oriented occupations are Firefighting & Prevention (82.7%), Security & Protection (81.9%), and Law Enforcement (80.5%), while the most female-oriented occupations are Healthcare Support (84.0%), Personal Care & Service (65.5%), and Food Preparation & Serving (64.4%).
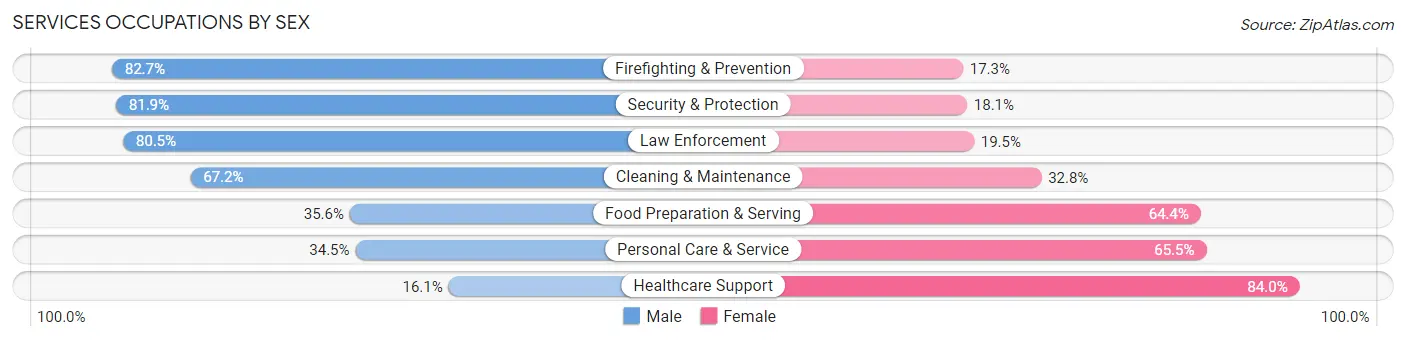
| Occupation | Male | Female |
| Healthcare Support | 410 (16.1%) | 2,145 (84.0%) |
| Security & Protection | 997 (81.9%) | 220 (18.1%) |
| Firefighting & Prevention | 637 (82.7%) | 133 (17.3%) |
| Law Enforcement | 360 (80.5%) | 87 (19.5%) |
| Food Preparation & Serving | 1,231 (35.6%) | 2,227 (64.4%) |
| Cleaning & Maintenance | 1,385 (67.2%) | 676 (32.8%) |
| Personal Care & Service | 622 (34.5%) | 1,181 (65.5%) |
| Total (Category) | 4,645 (41.9%) | 6,449 (58.1%) |
| Total (Overall) | 36,092 (54.1%) | 30,650 (45.9%) |
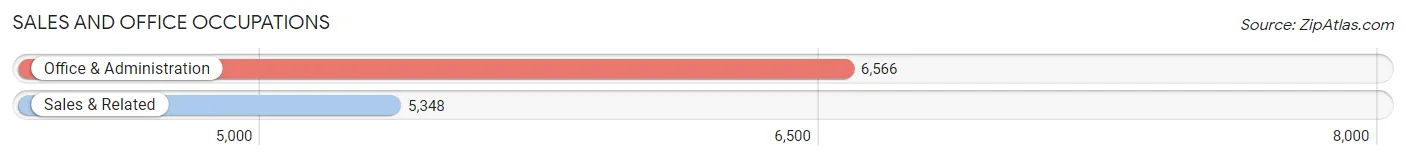
Sales and Office Occupations
The most common Sales and Office occupations in Rowan County are Office & Administration (6,566 | 9.8%), and Sales & Related (5,348 | 8.0%).
Sales and Office Occupations by Sex
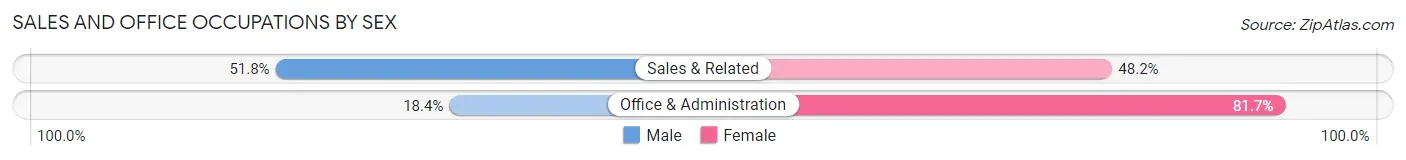
| Occupation | Male | Female |
| Sales & Related | 2,768 (51.8%) | 2,580 (48.2%) |
| Office & Administration | 1,205 (18.3%) | 5,361 (81.7%) |
| Total (Category) | 3,973 (33.4%) | 7,941 (66.6%) |
| Total (Overall) | 36,092 (54.1%) | 30,650 (45.9%) |
Natural Resources, Construction and Maintenance Occupations
The most common Natural Resources, Construction and Maintenance occupations in Rowan County are Construction & Extraction (5,019 | 7.5%), Installation, Maintenance & Repair (3,248 | 4.9%), and Farming, Fishing & Forestry (443 | 0.7%).
Natural Resources, Construction and Maintenance Occupations by Sex
| Occupation | Male | Female |
| Farming, Fishing & Forestry | 358 (80.8%) | 85 (19.2%) |
| Construction & Extraction | 4,883 (97.3%) | 136 (2.7%) |
| Installation, Maintenance & Repair | 3,160 (97.3%) | 88 (2.7%) |
| Total (Category) | 8,401 (96.5%) | 309 (3.5%) |
| Total (Overall) | 36,092 (54.1%) | 30,650 (45.9%) |
Production, Transportation and Moving Occupations
The most common Production, Transportation and Moving occupations in Rowan County are Production (6,898 | 10.3%), Material Moving (3,753 | 5.6%), and Transportation (3,156 | 4.7%).
Production, Transportation and Moving Occupations by Sex
| Occupation | Male | Female |
| Production | 4,794 (69.5%) | 2,104 (30.5%) |
| Transportation | 2,709 (85.8%) | 447 (14.2%) |
| Material Moving | 2,725 (72.6%) | 1,028 (27.4%) |
| Total (Category) | 10,228 (74.1%) | 3,579 (25.9%) |
| Total (Overall) | 36,092 (54.1%) | 30,650 (45.9%) |
Employment Industries by Sex in Rowan County
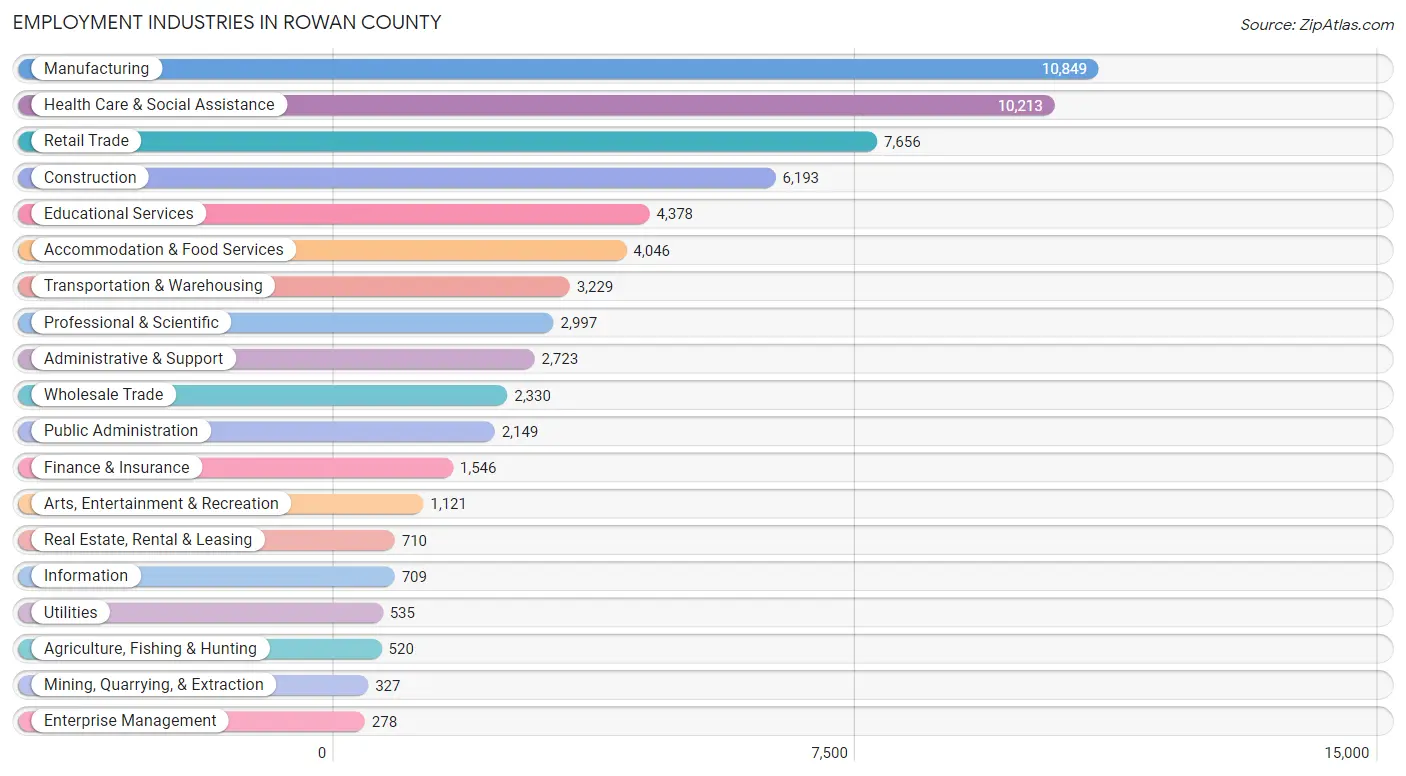
Employment Industries in Rowan County
The major employment industries in Rowan County include Manufacturing (10,849 | 16.3%), Health Care & Social Assistance (10,213 | 15.3%), Retail Trade (7,656 | 11.5%), Construction (6,193 | 9.3%), and Educational Services (4,378 | 6.6%).
Employment Industries by Sex in Rowan County
The Rowan County industries that see more men than women are Construction (92.0%), Utilities (78.9%), and Wholesale Trade (73.5%), whereas the industries that tend to have a higher number of women are Health Care & Social Assistance (77.4%), Educational Services (73.9%), and Enterprise Management (67.6%).
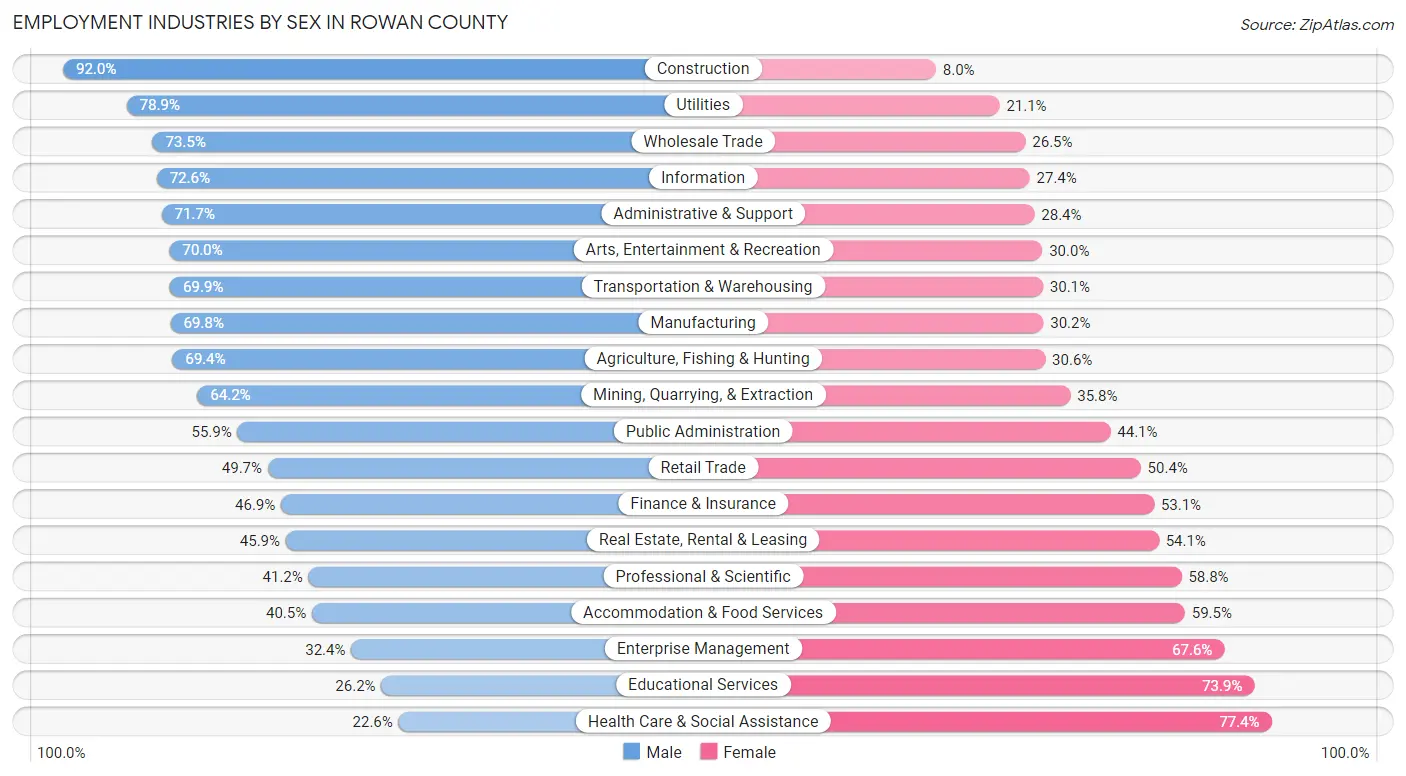
| Industry | Male | Female |
| Agriculture, Fishing & Hunting | 361 (69.4%) | 159 (30.6%) |
| Mining, Quarrying, & Extraction | 210 (64.2%) | 117 (35.8%) |
| Construction | 5,700 (92.0%) | 493 (8.0%) |
| Manufacturing | 7,573 (69.8%) | 3,276 (30.2%) |
| Wholesale Trade | 1,713 (73.5%) | 617 (26.5%) |
| Retail Trade | 3,801 (49.6%) | 3,855 (50.3%) |
| Transportation & Warehousing | 2,257 (69.9%) | 972 (30.1%) |
| Utilities | 422 (78.9%) | 113 (21.1%) |
| Information | 515 (72.6%) | 194 (27.4%) |
| Finance & Insurance | 725 (46.9%) | 821 (53.1%) |
| Real Estate, Rental & Leasing | 326 (45.9%) | 384 (54.1%) |
| Professional & Scientific | 1,235 (41.2%) | 1,762 (58.8%) |
| Enterprise Management | 90 (32.4%) | 188 (67.6%) |
| Administrative & Support | 1,951 (71.7%) | 772 (28.3%) |
| Educational Services | 1,145 (26.2%) | 3,233 (73.9%) |
| Health Care & Social Assistance | 2,307 (22.6%) | 7,906 (77.4%) |
| Arts, Entertainment & Recreation | 785 (70.0%) | 336 (30.0%) |
| Accommodation & Food Services | 1,639 (40.5%) | 2,407 (59.5%) |
| Public Administration | 1,202 (55.9%) | 947 (44.1%) |
| Total | 36,092 (54.1%) | 30,650 (45.9%) |
Education in Rowan County
School Enrollment in Rowan County
The most common levels of schooling among the 35,104 students in Rowan County are high school (8,015 | 22.8%), middle school (7,582 | 21.6%), and college / undergraduate (7,214 | 20.5%).
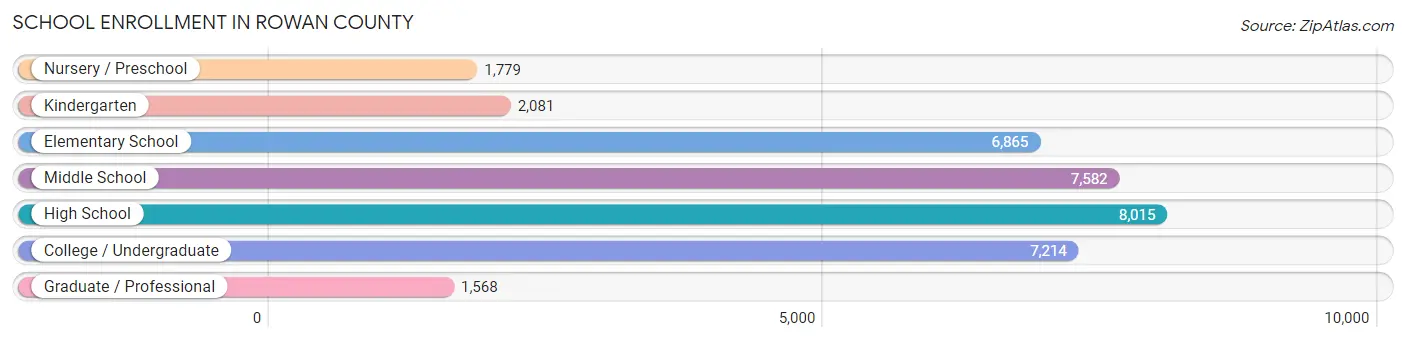
| School Level | # Students | % Students |
| Nursery / Preschool | 1,779 | 5.1% |
| Kindergarten | 2,081 | 5.9% |
| Elementary School | 6,865 | 19.6% |
| Middle School | 7,582 | 21.6% |
| High School | 8,015 | 22.8% |
| College / Undergraduate | 7,214 | 20.5% |
| Graduate / Professional | 1,568 | 4.5% |
| Total | 35,104 | 100.0% |
School Enrollment by Age by Funding Source in Rowan County
Out of a total of 35,104 students who are enrolled in schools in Rowan County, 7,056 (20.1%) attend a private institution, while the remaining 28,048 (79.9%) are enrolled in public schools. The age group of 3 to 4 year olds has the highest likelihood of being enrolled in private schools, with 693 (55.5% in the age bracket) enrolled. Conversely, the age group of 15 to 17 year olds has the lowest likelihood of being enrolled in a private school, with 5,182 (90.0% in the age bracket) attending a public institution.
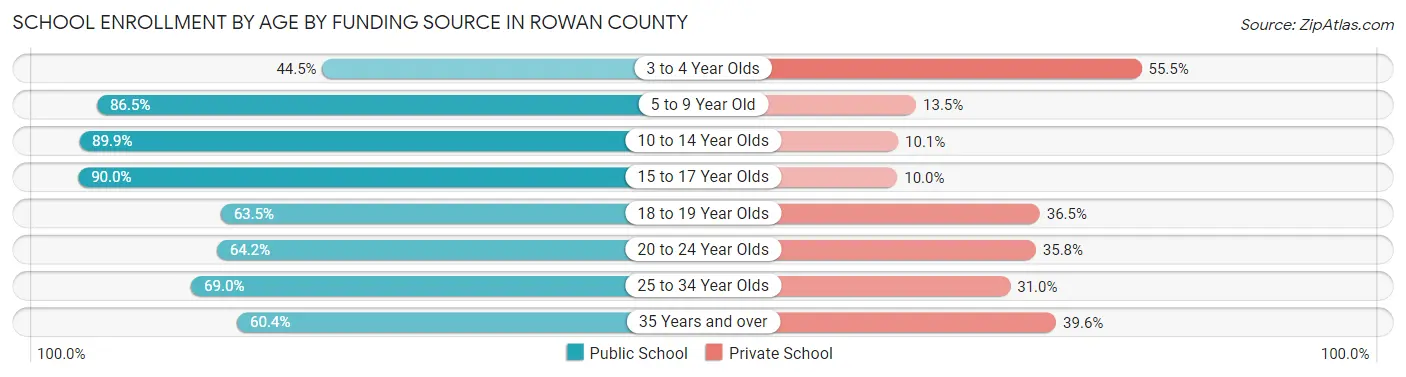
| Age Bracket | Public School | Private School |
| 3 to 4 Year Olds | 556 (44.5%) | 693 (55.5%) |
| 5 to 9 Year Old | 7,409 (86.5%) | 1,155 (13.5%) |
| 10 to 14 Year Olds | 8,416 (89.9%) | 950 (10.1%) |
| 15 to 17 Year Olds | 5,182 (90.0%) | 575 (10.0%) |
| 18 to 19 Year Olds | 1,748 (63.5%) | 1,006 (36.5%) |
| 20 to 24 Year Olds | 1,924 (64.2%) | 1,073 (35.8%) |
| 25 to 34 Year Olds | 1,147 (69.0%) | 516 (31.0%) |
| 35 Years and over | 1,664 (60.4%) | 1,090 (39.6%) |
| Total | 28,048 (79.9%) | 7,056 (20.1%) |
Educational Attainment by Field of Study in Rowan County
Business (5,172 | 22.8%), education (3,001 | 13.2%), science & technology (2,410 | 10.6%), arts & humanities (1,986 | 8.7%), and social sciences (1,667 | 7.3%) are the most common fields of study among 22,713 individuals in Rowan County who have obtained a bachelor's degree or higher.
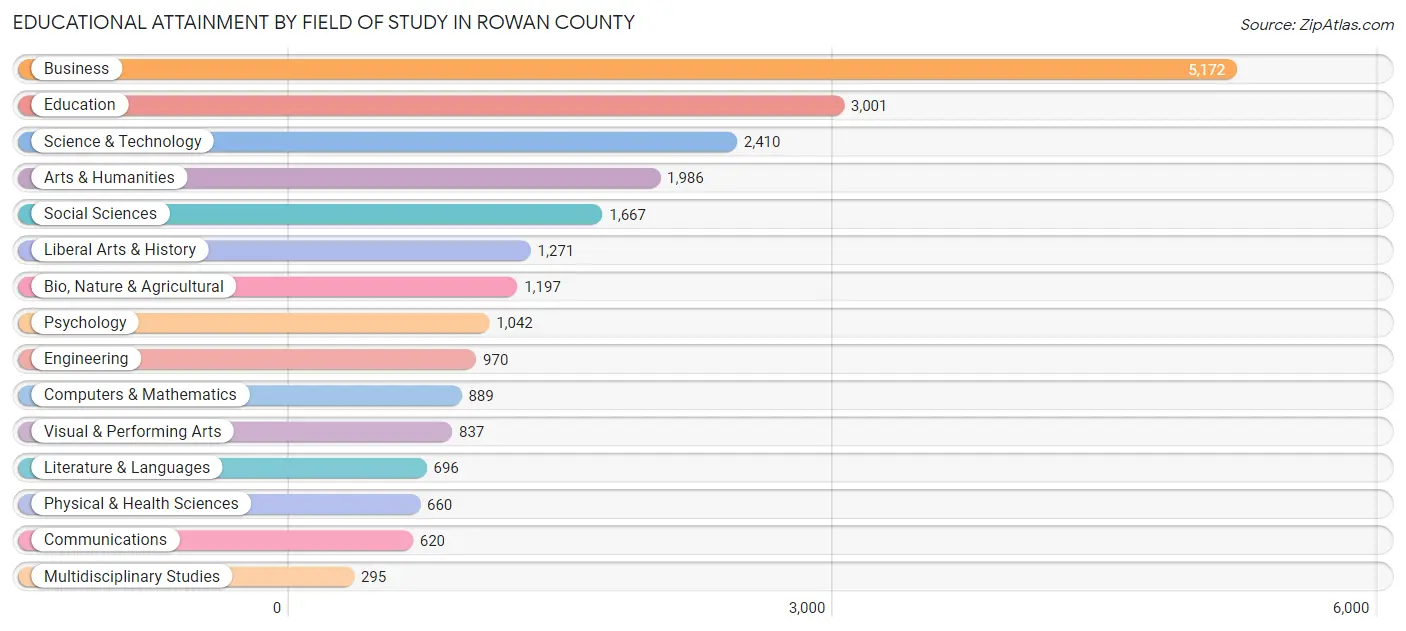
| Field of Study | # Graduates | % Graduates |
| Computers & Mathematics | 889 | 3.9% |
| Bio, Nature & Agricultural | 1,197 | 5.3% |
| Physical & Health Sciences | 660 | 2.9% |
| Psychology | 1,042 | 4.6% |
| Social Sciences | 1,667 | 7.3% |
| Engineering | 970 | 4.3% |
| Multidisciplinary Studies | 295 | 1.3% |
| Science & Technology | 2,410 | 10.6% |
| Business | 5,172 | 22.8% |
| Education | 3,001 | 13.2% |
| Literature & Languages | 696 | 3.1% |
| Liberal Arts & History | 1,271 | 5.6% |
| Visual & Performing Arts | 837 | 3.7% |
| Communications | 620 | 2.7% |
| Arts & Humanities | 1,986 | 8.7% |
| Total | 22,713 | 100.0% |
Transportation & Commute in Rowan County
Vehicle Availability by Sex in Rowan County
The most prevalent vehicle ownership categories in Rowan County are males with 2 vehicles (13,019, accounting for 37.2%) and females with 2 vehicles (10,868, making up 44.1%).
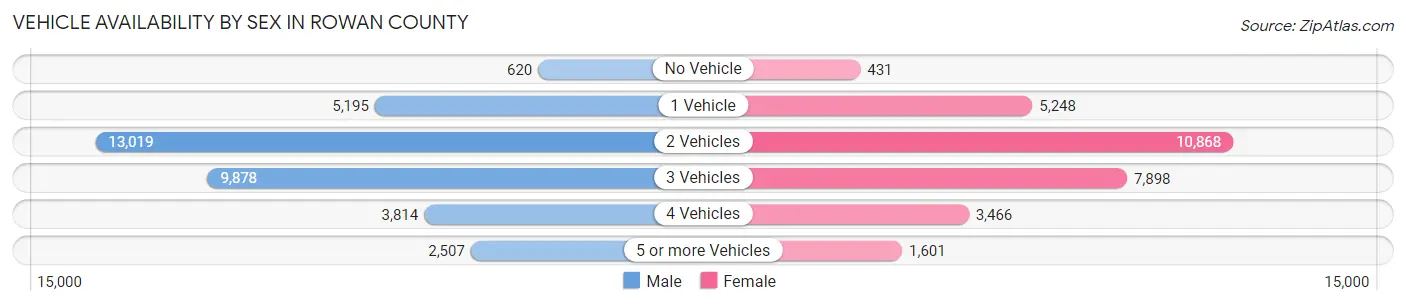
| Vehicles Available | Male | Female |
| No Vehicle | 620 (1.8%) | 431 (1.5%) |
| 1 Vehicle | 5,195 (14.8%) | 5,248 (17.8%) |
| 2 Vehicles | 13,019 (37.2%) | 10,868 (36.8%) |
| 3 Vehicles | 9,878 (28.2%) | 7,898 (26.8%) |
| 4 Vehicles | 3,814 (10.9%) | 3,466 (11.7%) |
| 5 or more Vehicles | 2,507 (7.2%) | 1,601 (5.4%) |
| Total | 35,033 (100.0%) | 29,512 (100.0%) |
Commute Time in Rowan County
The most frequently occuring commute durations in Rowan County are 15 to 19 minutes (10,257 commuters, 16.9%), 20 to 24 minutes (8,631 commuters, 14.2%), and 10 to 14 minutes (8,112 commuters, 13.3%).
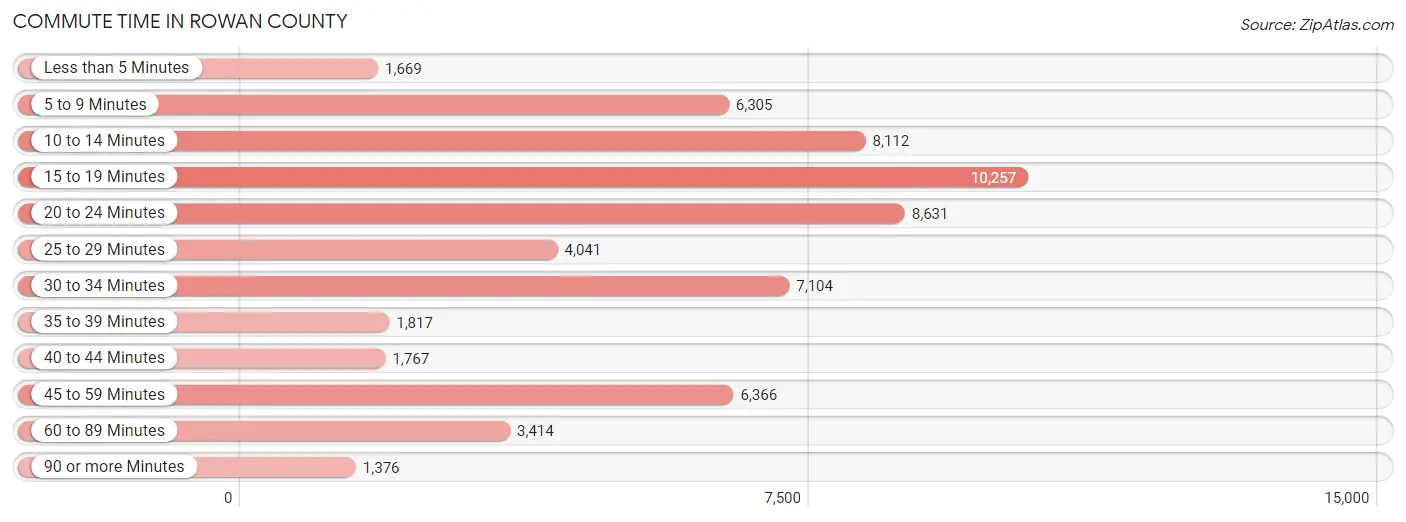
| Commute Time | # Commuters | % Commuters |
| Less than 5 Minutes | 1,669 | 2.7% |
| 5 to 9 Minutes | 6,305 | 10.4% |
| 10 to 14 Minutes | 8,112 | 13.3% |
| 15 to 19 Minutes | 10,257 | 16.9% |
| 20 to 24 Minutes | 8,631 | 14.2% |
| 25 to 29 Minutes | 4,041 | 6.6% |
| 30 to 34 Minutes | 7,104 | 11.7% |
| 35 to 39 Minutes | 1,817 | 3.0% |
| 40 to 44 Minutes | 1,767 | 2.9% |
| 45 to 59 Minutes | 6,366 | 10.5% |
| 60 to 89 Minutes | 3,414 | 5.6% |
| 90 or more Minutes | 1,376 | 2.3% |
Commute Time by Sex in Rowan County
The most common commute times in Rowan County are 15 to 19 minutes (5,582 commuters, 16.7%) for males and 15 to 19 minutes (4,675 commuters, 17.1%) for females.
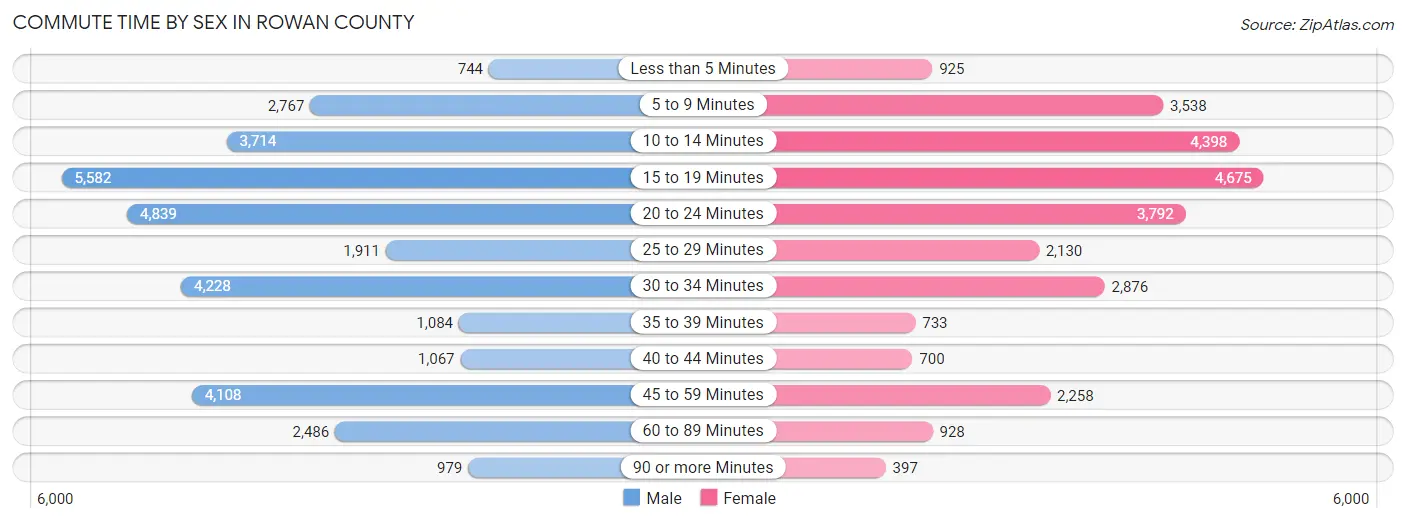
| Commute Time | Male | Female |
| Less than 5 Minutes | 744 (2.2%) | 925 (3.4%) |
| 5 to 9 Minutes | 2,767 (8.3%) | 3,538 (12.9%) |
| 10 to 14 Minutes | 3,714 (11.1%) | 4,398 (16.1%) |
| 15 to 19 Minutes | 5,582 (16.7%) | 4,675 (17.1%) |
| 20 to 24 Minutes | 4,839 (14.4%) | 3,792 (13.9%) |
| 25 to 29 Minutes | 1,911 (5.7%) | 2,130 (7.8%) |
| 30 to 34 Minutes | 4,228 (12.6%) | 2,876 (10.5%) |
| 35 to 39 Minutes | 1,084 (3.2%) | 733 (2.7%) |
| 40 to 44 Minutes | 1,067 (3.2%) | 700 (2.6%) |
| 45 to 59 Minutes | 4,108 (12.3%) | 2,258 (8.3%) |
| 60 to 89 Minutes | 2,486 (7.4%) | 928 (3.4%) |
| 90 or more Minutes | 979 (2.9%) | 397 (1.5%) |
Time of Departure to Work by Sex in Rowan County
The most frequent times of departure to work in Rowan County are 6:00 AM to 6:29 AM (4,565, 13.6%) for males and 7:30 AM to 7:59 AM (4,254, 15.5%) for females.
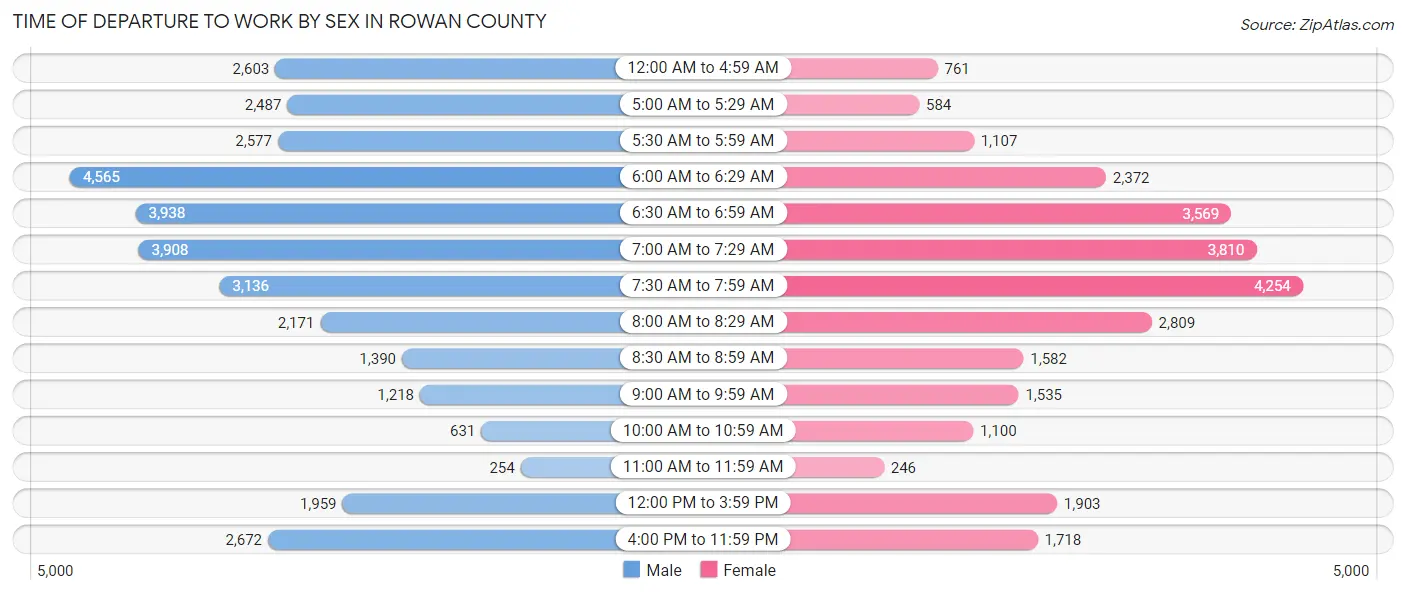
| Time of Departure | Male | Female |
| 12:00 AM to 4:59 AM | 2,603 (7.8%) | 761 (2.8%) |
| 5:00 AM to 5:29 AM | 2,487 (7.4%) | 584 (2.1%) |
| 5:30 AM to 5:59 AM | 2,577 (7.7%) | 1,107 (4.1%) |
| 6:00 AM to 6:29 AM | 4,565 (13.6%) | 2,372 (8.7%) |
| 6:30 AM to 6:59 AM | 3,938 (11.7%) | 3,569 (13.1%) |
| 7:00 AM to 7:29 AM | 3,908 (11.7%) | 3,810 (13.9%) |
| 7:30 AM to 7:59 AM | 3,136 (9.4%) | 4,254 (15.5%) |
| 8:00 AM to 8:29 AM | 2,171 (6.5%) | 2,809 (10.3%) |
| 8:30 AM to 8:59 AM | 1,390 (4.2%) | 1,582 (5.8%) |
| 9:00 AM to 9:59 AM | 1,218 (3.6%) | 1,535 (5.6%) |
| 10:00 AM to 10:59 AM | 631 (1.9%) | 1,100 (4.0%) |
| 11:00 AM to 11:59 AM | 254 (0.8%) | 246 (0.9%) |
| 12:00 PM to 3:59 PM | 1,959 (5.9%) | 1,903 (7.0%) |
| 4:00 PM to 11:59 PM | 2,672 (8.0%) | 1,718 (6.3%) |
| Total | 33,509 (100.0%) | 27,350 (100.0%) |
Housing Occupancy in Rowan County
Occupancy by Ownership in Rowan County
Of the total 56,618 dwellings in Rowan County, owner-occupied units account for 40,056 (70.8%), while renter-occupied units make up 16,562 (29.2%).
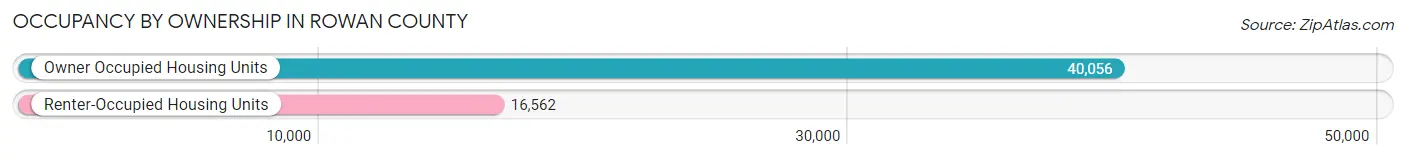
| Occupancy | # Housing Units | % Housing Units |
| Owner Occupied Housing Units | 40,056 | 70.8% |
| Renter-Occupied Housing Units | 16,562 | 29.2% |
| Total Occupied Housing Units | 56,618 | 100.0% |
Occupancy by Household Size in Rowan County
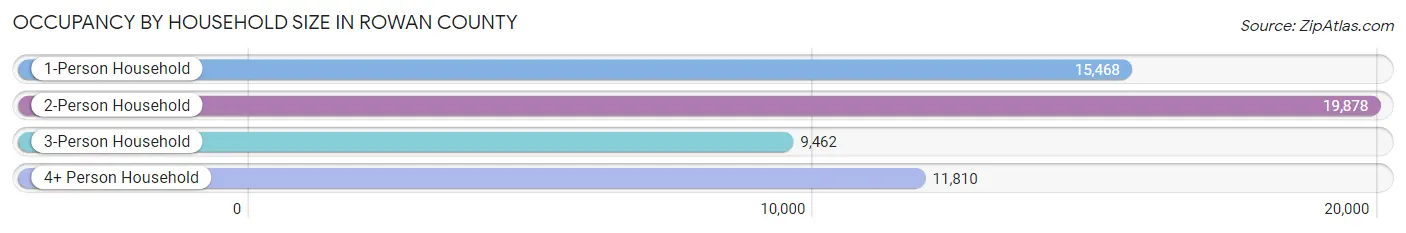
| Household Size | # Housing Units | % Housing Units |
| 1-Person Household | 15,468 | 27.3% |
| 2-Person Household | 19,878 | 35.1% |
| 3-Person Household | 9,462 | 16.7% |
| 4+ Person Household | 11,810 | 20.9% |
| Total Housing Units | 56,618 | 100.0% |
Occupancy by Ownership by Household Size in Rowan County
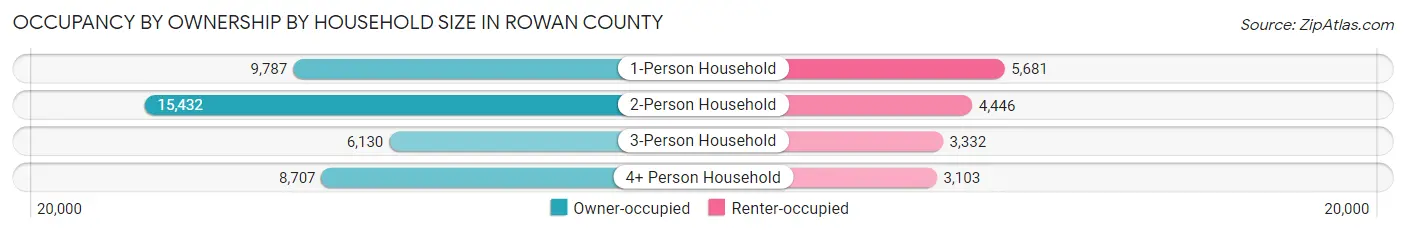
| Household Size | Owner-occupied | Renter-occupied |
| 1-Person Household | 9,787 (63.3%) | 5,681 (36.7%) |
| 2-Person Household | 15,432 (77.6%) | 4,446 (22.4%) |
| 3-Person Household | 6,130 (64.8%) | 3,332 (35.2%) |
| 4+ Person Household | 8,707 (73.7%) | 3,103 (26.3%) |
| Total Housing Units | 40,056 (70.8%) | 16,562 (29.2%) |
Occupancy by Educational Attainment in Rowan County
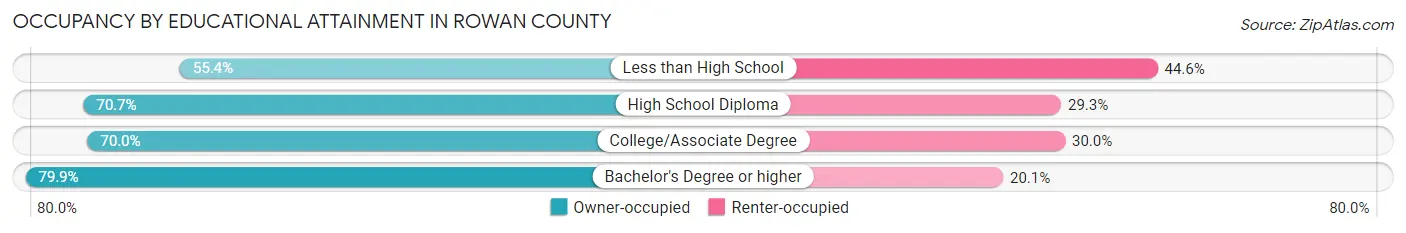
| Household Size | Owner-occupied | Renter-occupied |
| Less than High School | 3,498 (55.4%) | 2,820 (44.6%) |
| High School Diploma | 12,407 (70.7%) | 5,147 (29.3%) |
| College/Associate Degree | 14,281 (70.0%) | 6,108 (30.0%) |
| Bachelor's Degree or higher | 9,870 (79.9%) | 2,487 (20.1%) |
Occupancy by Age of Householder in Rowan County
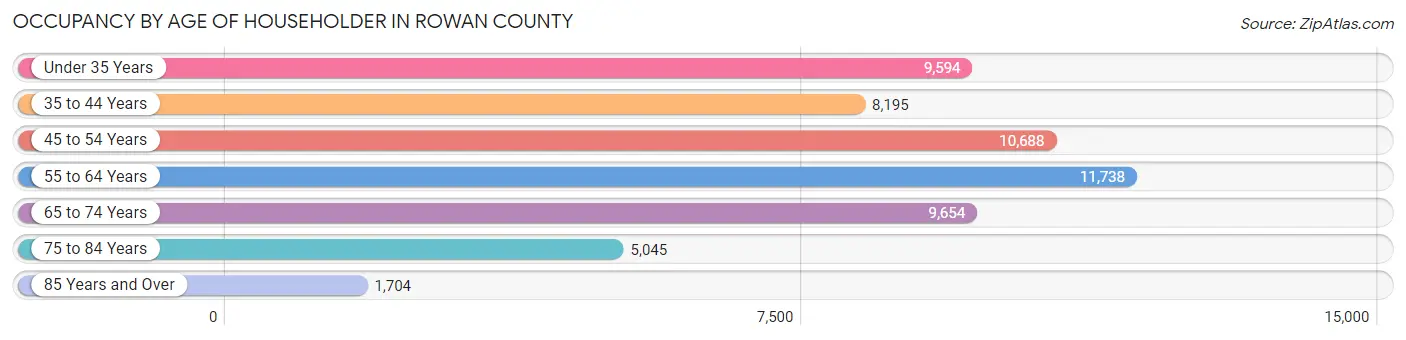
| Age Bracket | # Households | % Households |
| Under 35 Years | 9,594 | 17.0% |
| 35 to 44 Years | 8,195 | 14.5% |
| 45 to 54 Years | 10,688 | 18.9% |
| 55 to 64 Years | 11,738 | 20.7% |
| 65 to 74 Years | 9,654 | 17.1% |
| 75 to 84 Years | 5,045 | 8.9% |
| 85 Years and Over | 1,704 | 3.0% |
| Total | 56,618 | 100.0% |
Housing Finances in Rowan County
Median Income by Occupancy in Rowan County
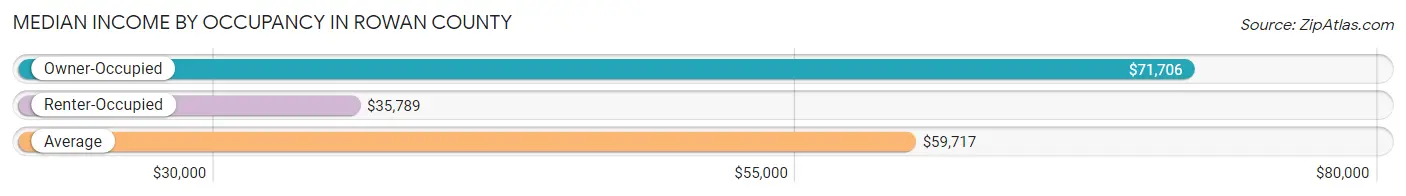
| Occupancy Type | # Households | Median Income |
| Owner-Occupied | 40,056 (70.8%) | $71,706 |
| Renter-Occupied | 16,562 (29.2%) | $35,789 |
| Average | 56,618 (100.0%) | $59,717 |
Occupancy by Householder Income Bracket in Rowan County
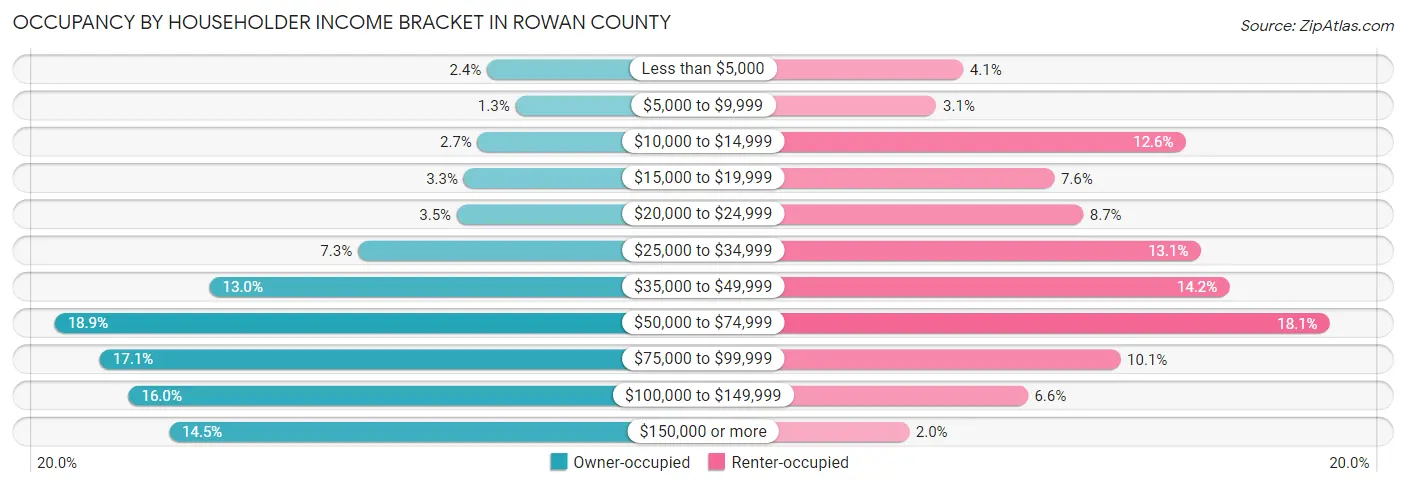
| Income Bracket | Owner-occupied | Renter-occupied |
| Less than $5,000 | 954 (2.4%) | 677 (4.1%) |
| $5,000 to $9,999 | 519 (1.3%) | 508 (3.1%) |
| $10,000 to $14,999 | 1,098 (2.7%) | 2,080 (12.6%) |
| $15,000 to $19,999 | 1,311 (3.3%) | 1,252 (7.6%) |
| $20,000 to $24,999 | 1,415 (3.5%) | 1,434 (8.7%) |
| $25,000 to $34,999 | 2,924 (7.3%) | 2,175 (13.1%) |
| $35,000 to $49,999 | 5,189 (13.0%) | 2,356 (14.2%) |
| $50,000 to $74,999 | 7,552 (18.9%) | 2,989 (18.0%) |
| $75,000 to $99,999 | 6,862 (17.1%) | 1,670 (10.1%) |
| $100,000 to $149,999 | 6,425 (16.0%) | 1,084 (6.6%) |
| $150,000 or more | 5,807 (14.5%) | 337 (2.0%) |
| Total | 40,056 (100.0%) | 16,562 (100.0%) |
Monthly Housing Cost Tiers in Rowan County

| Monthly Cost | Owner-occupied | Renter-occupied |
| Less than $300 | 5,116 (12.8%) | 417 (2.5%) |
| $300 to $499 | 7,995 (20.0%) | 1,015 (6.1%) |
| $500 to $799 | 5,951 (14.9%) | 3,371 (20.3%) |
| $800 to $999 | 3,528 (8.8%) | 3,911 (23.6%) |
| $1,000 to $1,499 | 9,055 (22.6%) | 4,901 (29.6%) |
| $1,500 to $1,999 | 4,883 (12.2%) | 1,195 (7.2%) |
| $2,000 to $2,499 | 1,907 (4.8%) | 69 (0.4%) |
| $2,500 to $2,999 | 698 (1.7%) | 135 (0.8%) |
| $3,000 or more | 923 (2.3%) | 36 (0.2%) |
| Total | 40,056 (100.0%) | 16,562 (100.0%) |
Physical Housing Characteristics in Rowan County
Housing Structures in Rowan County
| Structure Type | # Housing Units | % Housing Units |
| Single Unit, Detached | 39,761 | 70.2% |
| Single Unit, Attached | 775 | 1.4% |
| 2 Unit Apartments | 1,669 | 2.9% |
| 3 or 4 Unit Apartments | 1,335 | 2.4% |
| 5 to 9 Unit Apartments | 1,533 | 2.7% |
| 10 or more Apartments | 1,938 | 3.4% |
| Mobile Home / Other | 9,607 | 17.0% |
| Total | 56,618 | 100.0% |
Housing Structures by Occupancy in Rowan County
| Structure Type | Owner-occupied | Renter-occupied |
| Single Unit, Detached | 32,997 (83.0%) | 6,764 (17.0%) |
| Single Unit, Attached | 403 (52.0%) | 372 (48.0%) |
| 2 Unit Apartments | 53 (3.2%) | 1,616 (96.8%) |
| 3 or 4 Unit Apartments | 16 (1.2%) | 1,319 (98.8%) |
| 5 to 9 Unit Apartments | 101 (6.6%) | 1,432 (93.4%) |
| 10 or more Apartments | 47 (2.4%) | 1,891 (97.6%) |
| Mobile Home / Other | 6,439 (67.0%) | 3,168 (33.0%) |
| Total | 40,056 (70.8%) | 16,562 (29.2%) |
Housing Structures by Number of Rooms in Rowan County
| Number of Rooms | Owner-occupied | Renter-occupied |
| 1 Room | 85 (0.2%) | 313 (1.9%) |
| 2 or 3 Rooms | 762 (1.9%) | 2,582 (15.6%) |
| 4 or 5 Rooms | 14,462 (36.1%) | 9,205 (55.6%) |
| 6 or 7 Rooms | 14,513 (36.2%) | 3,483 (21.0%) |
| 8 or more Rooms | 10,234 (25.6%) | 979 (5.9%) |
| Total | 40,056 (100.0%) | 16,562 (100.0%) |
Housing Structure by Heating Type in Rowan County
| Heating Type | Owner-occupied | Renter-occupied |
| Utility Gas | 10,413 (26.0%) | 3,223 (19.5%) |
| Bottled, Tank, or LP Gas | 1,627 (4.1%) | 437 (2.6%) |
| Electricity | 25,956 (64.8%) | 12,251 (74.0%) |
| Fuel Oil or Kerosene | 838 (2.1%) | 389 (2.4%) |
| Coal or Coke | 0 (0.0%) | 0 (0.0%) |
| All other Fuels | 966 (2.4%) | 141 (0.9%) |
| No Fuel Used | 256 (0.6%) | 121 (0.7%) |
| Total | 40,056 (100.0%) | 16,562 (100.0%) |
Household Vehicle Usage in Rowan County
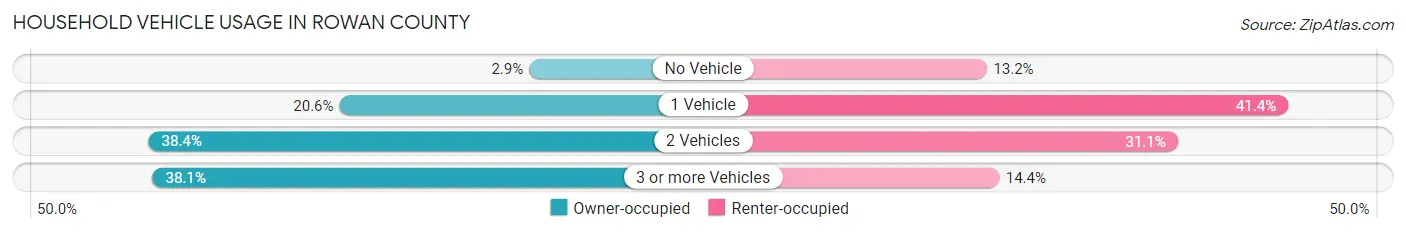
| Vehicles per Household | Owner-occupied | Renter-occupied |
| No Vehicle | 1,167 (2.9%) | 2,188 (13.2%) |
| 1 Vehicle | 8,259 (20.6%) | 6,852 (41.4%) |
| 2 Vehicles | 15,389 (38.4%) | 5,143 (31.0%) |
| 3 or more Vehicles | 15,241 (38.1%) | 2,379 (14.4%) |
| Total | 40,056 (100.0%) | 16,562 (100.0%) |
Real Estate & Mortgages in Rowan County
Real Estate and Mortgage Overview in Rowan County
| Characteristic | Without Mortgage | With Mortgage |
| Housing Units | 16,508 | 23,548 |
| Median Property Value | $146,100 | $214,100 |
| Median Household Income | $52,439 | $4,307 |
| Monthly Housing Costs | $372 | $866 |
| Real Estate Taxes | $1,097 | $412 |
Property Value by Mortgage Status in Rowan County
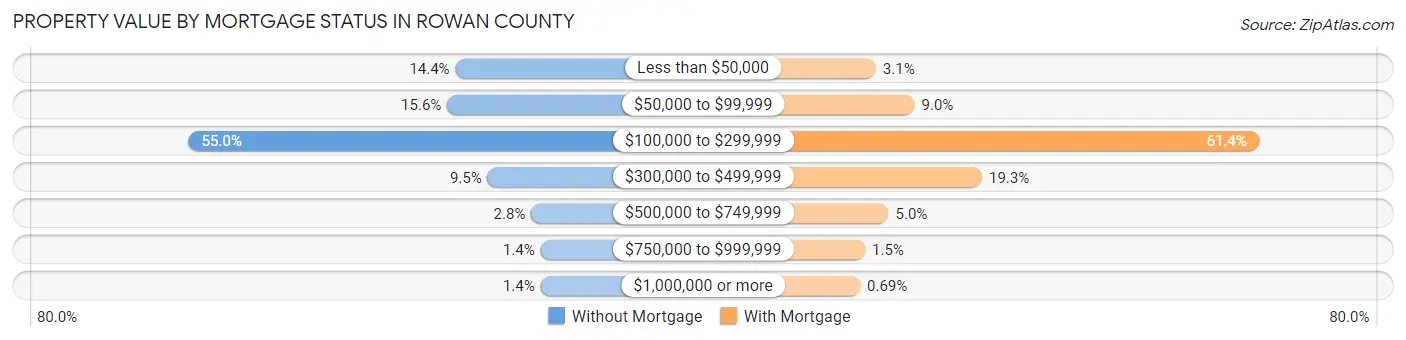
| Property Value | Without Mortgage | With Mortgage |
| Less than $50,000 | 2,369 (14.3%) | 729 (3.1%) |
| $50,000 to $99,999 | 2,577 (15.6%) | 2,120 (9.0%) |
| $100,000 to $299,999 | 9,083 (55.0%) | 14,468 (61.4%) |
| $300,000 to $499,999 | 1,562 (9.5%) | 4,540 (19.3%) |
| $500,000 to $749,999 | 463 (2.8%) | 1,187 (5.0%) |
| $750,000 to $999,999 | 227 (1.4%) | 341 (1.5%) |
| $1,000,000 or more | 227 (1.4%) | 163 (0.7%) |
| Total | 16,508 (100.0%) | 23,548 (100.0%) |
Household Income by Mortgage Status in Rowan County
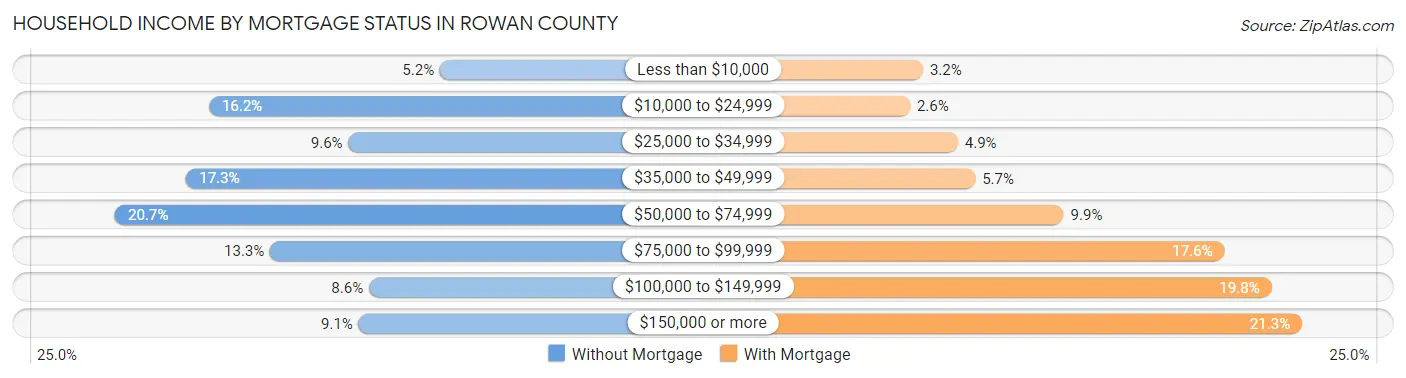
| Household Income | Without Mortgage | With Mortgage |
| Less than $10,000 | 862 (5.2%) | 756 (3.2%) |
| $10,000 to $24,999 | 2,677 (16.2%) | 611 (2.6%) |
| $25,000 to $34,999 | 1,581 (9.6%) | 1,147 (4.9%) |
| $35,000 to $49,999 | 2,856 (17.3%) | 1,343 (5.7%) |
| $50,000 to $74,999 | 3,415 (20.7%) | 2,333 (9.9%) |
| $75,000 to $99,999 | 2,198 (13.3%) | 4,137 (17.6%) |
| $100,000 to $149,999 | 1,419 (8.6%) | 4,664 (19.8%) |
| $150,000 or more | 1,500 (9.1%) | 5,006 (21.3%) |
| Total | 16,508 (100.0%) | 23,548 (100.0%) |
Property Value to Household Income Ratio in Rowan County
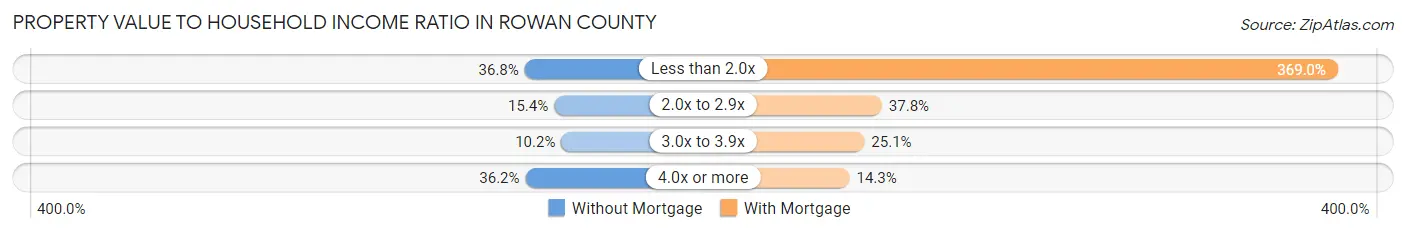
| Value-to-Income Ratio | Without Mortgage | With Mortgage |
| Less than 2.0x | 6,066 (36.7%) | 86,880 (368.9%) |
| 2.0x to 2.9x | 2,543 (15.4%) | 8,892 (37.8%) |
| 3.0x to 3.9x | 1,676 (10.2%) | 5,904 (25.1%) |
| 4.0x or more | 5,978 (36.2%) | 3,356 (14.2%) |
| Total | 16,508 (100.0%) | 23,548 (100.0%) |
Real Estate Taxes by Mortgage Status in Rowan County
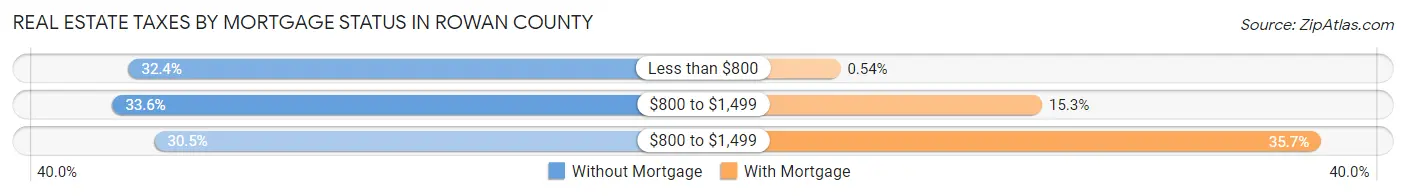
| Property Taxes | Without Mortgage | With Mortgage |
| Less than $800 | 5,348 (32.4%) | 128 (0.5%) |
| $800 to $1,499 | 5,544 (33.6%) | 3,595 (15.3%) |
| $800 to $1,499 | 5,037 (30.5%) | 8,396 (35.6%) |
| Total | 16,508 (100.0%) | 23,548 (100.0%) |
Health & Disability in Rowan County
Health Insurance Coverage by Age in Rowan County
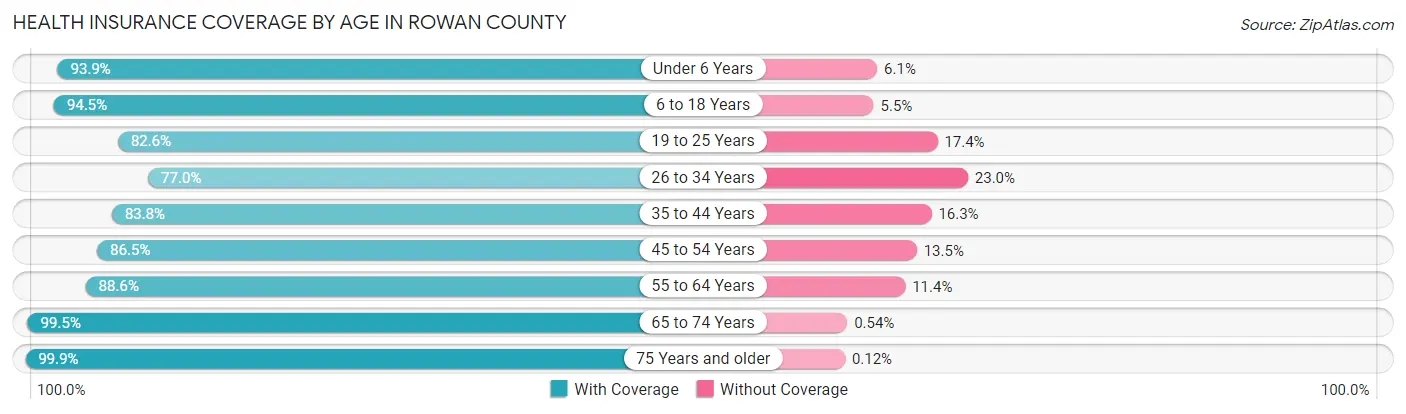
| Age Bracket | With Coverage | Without Coverage |
| Under 6 Years | 9,090 (93.9%) | 594 (6.1%) |
| 6 to 18 Years | 22,961 (94.5%) | 1,326 (5.5%) |
| 19 to 25 Years | 10,669 (82.6%) | 2,243 (17.4%) |
| 26 to 34 Years | 12,583 (77.0%) | 3,767 (23.0%) |
| 35 to 44 Years | 13,946 (83.8%) | 2,705 (16.3%) |
| 45 to 54 Years | 16,757 (86.5%) | 2,617 (13.5%) |
| 55 to 64 Years | 18,015 (88.6%) | 2,308 (11.4%) |
| 65 to 74 Years | 15,366 (99.5%) | 83 (0.5%) |
| 75 Years and older | 9,529 (99.9%) | 11 (0.1%) |
| Total | 128,916 (89.2%) | 15,654 (10.8%) |
Health Insurance Coverage by Citizenship Status in Rowan County
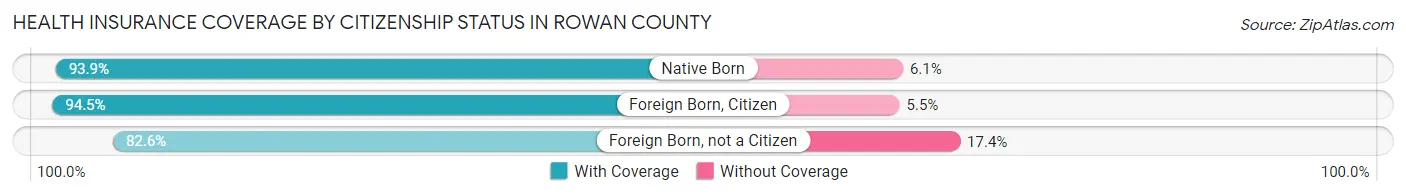
| Citizenship Status | With Coverage | Without Coverage |
| Native Born | 9,090 (93.9%) | 594 (6.1%) |
| Foreign Born, Citizen | 22,961 (94.5%) | 1,326 (5.5%) |
| Foreign Born, not a Citizen | 10,669 (82.6%) | 2,243 (17.4%) |
Health Insurance Coverage by Household Income in Rowan County
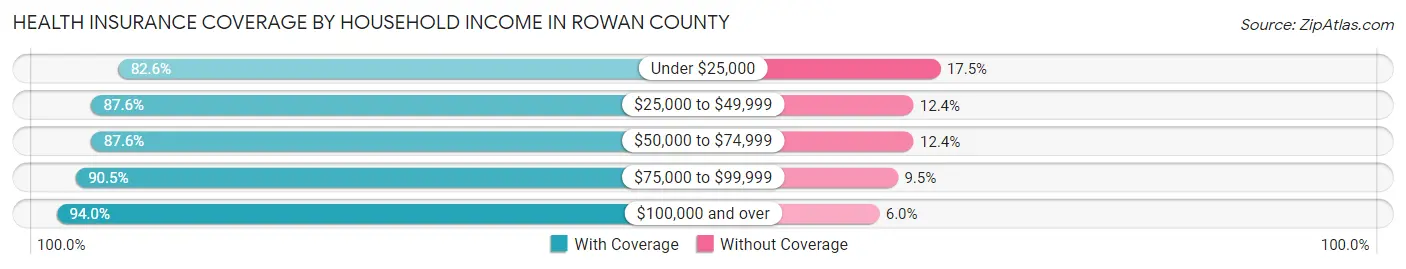
| Household Income | With Coverage | Without Coverage |
| Under $25,000 | 17,500 (82.6%) | 3,698 (17.4%) |
| $25,000 to $49,999 | 24,127 (87.6%) | 3,410 (12.4%) |
| $50,000 to $74,999 | 22,771 (87.6%) | 3,232 (12.4%) |
| $75,000 to $99,999 | 22,535 (90.5%) | 2,363 (9.5%) |
| $100,000 and over | 40,445 (94.0%) | 2,578 (6.0%) |
Public vs Private Health Insurance Coverage by Age in Rowan County
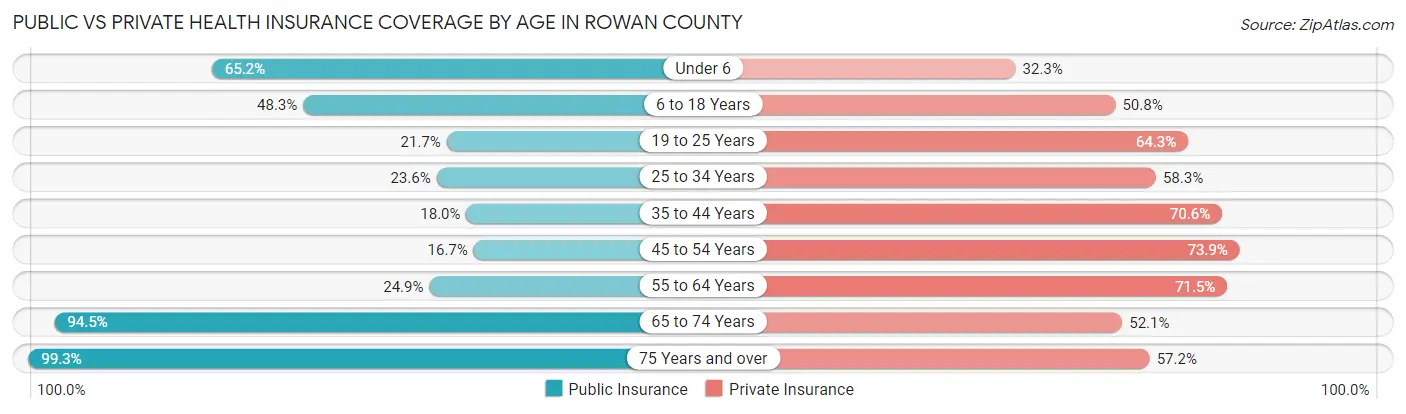
| Age Bracket | Public Insurance | Private Insurance |
| Under 6 | 6,317 (65.2%) | 3,124 (32.3%) |
| 6 to 18 Years | 11,730 (48.3%) | 12,338 (50.8%) |
| 19 to 25 Years | 2,797 (21.7%) | 8,298 (64.3%) |
| 25 to 34 Years | 3,851 (23.5%) | 9,535 (58.3%) |
| 35 to 44 Years | 2,997 (18.0%) | 11,754 (70.6%) |
| 45 to 54 Years | 3,228 (16.7%) | 14,307 (73.9%) |
| 55 to 64 Years | 5,059 (24.9%) | 14,537 (71.5%) |
| 65 to 74 Years | 14,593 (94.5%) | 8,045 (52.1%) |
| 75 Years and over | 9,473 (99.3%) | 5,453 (57.2%) |
| Total | 60,045 (41.5%) | 87,391 (60.5%) |
Disability Status by Sex by Age in Rowan County
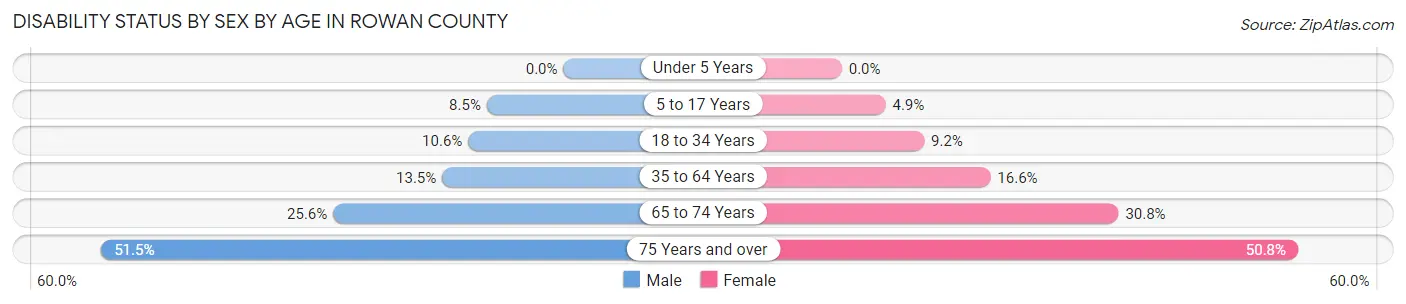
| Age Bracket | Male | Female |
| Under 5 Years | 0 (0.0%) | 0 (0.0%) |
| 5 to 17 Years | 1,058 (8.5%) | 570 (4.9%) |
| 18 to 34 Years | 1,646 (10.6%) | 1,414 (9.2%) |
| 35 to 64 Years | 3,776 (13.5%) | 4,698 (16.6%) |
| 65 to 74 Years | 1,899 (25.6%) | 2,478 (30.8%) |
| 75 Years and over | 1,959 (51.5%) | 2,912 (50.8%) |
Disability Class by Sex by Age in Rowan County
Disability Class: Hearing Difficulty
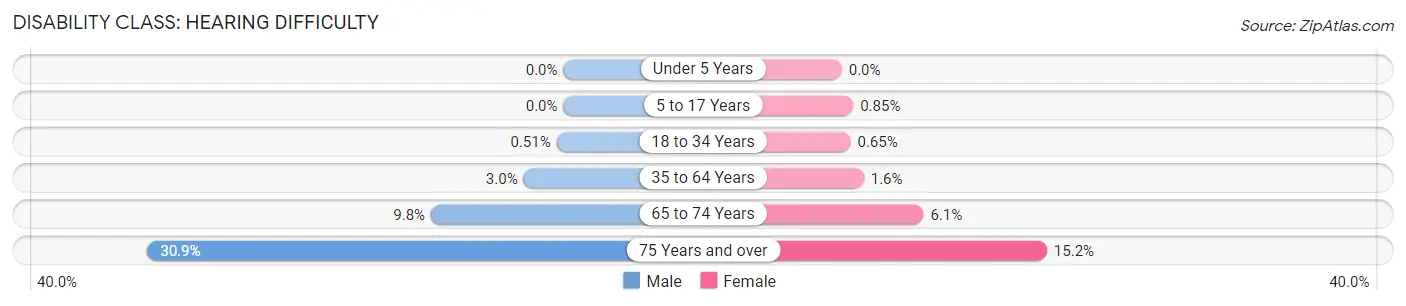
| Age Bracket | Male | Female |
| Under 5 Years | 0 (0.0%) | 0 (0.0%) |
| 5 to 17 Years | 0 (0.0%) | 99 (0.9%) |
| 18 to 34 Years | 79 (0.5%) | 100 (0.6%) |
| 35 to 64 Years | 828 (3.0%) | 464 (1.6%) |
| 65 to 74 Years | 728 (9.8%) | 488 (6.1%) |
| 75 Years and over | 1,176 (30.9%) | 873 (15.2%) |
Disability Class: Vision Difficulty
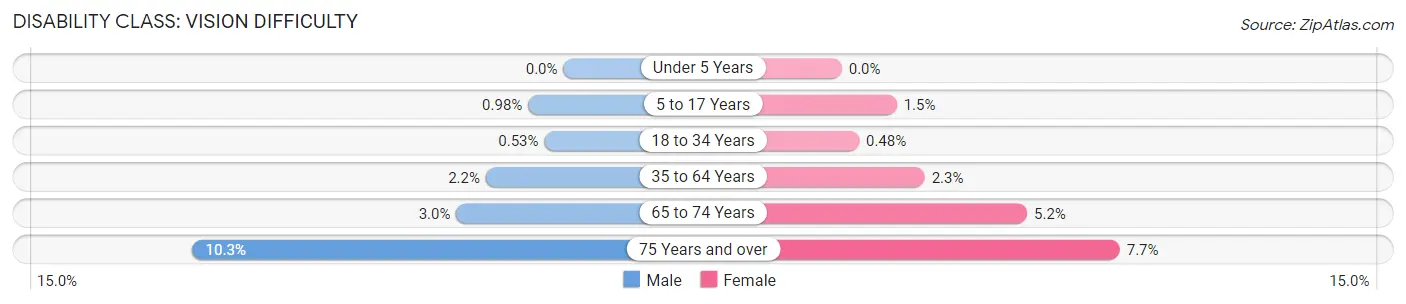
| Age Bracket | Male | Female |
| Under 5 Years | 0 (0.0%) | 0 (0.0%) |
| 5 to 17 Years | 121 (1.0%) | 179 (1.5%) |
| 18 to 34 Years | 82 (0.5%) | 74 (0.5%) |
| 35 to 64 Years | 605 (2.2%) | 655 (2.3%) |
| 65 to 74 Years | 221 (3.0%) | 415 (5.2%) |
| 75 Years and over | 393 (10.3%) | 444 (7.7%) |
Disability Class: Cognitive Difficulty
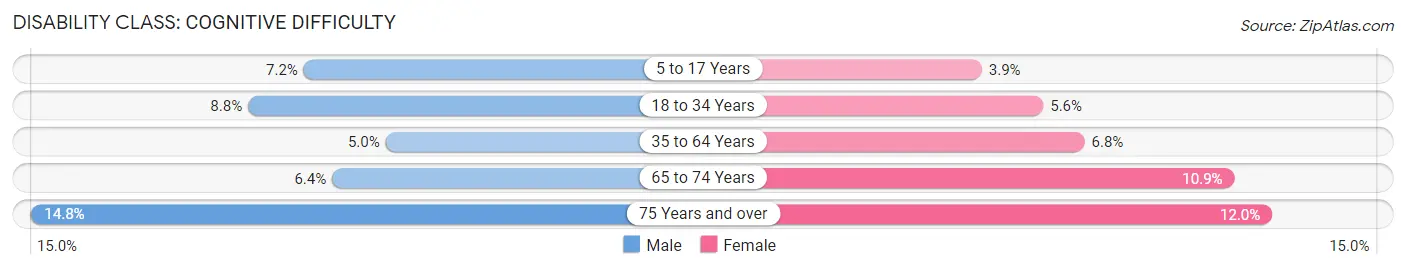
| Age Bracket | Male | Female |
| 5 to 17 Years | 897 (7.2%) | 457 (3.9%) |
| 18 to 34 Years | 1,363 (8.8%) | 865 (5.6%) |
| 35 to 64 Years | 1,383 (5.0%) | 1,920 (6.8%) |
| 65 to 74 Years | 477 (6.4%) | 879 (10.9%) |
| 75 Years and over | 564 (14.8%) | 687 (12.0%) |
Disability Class: Ambulatory Difficulty
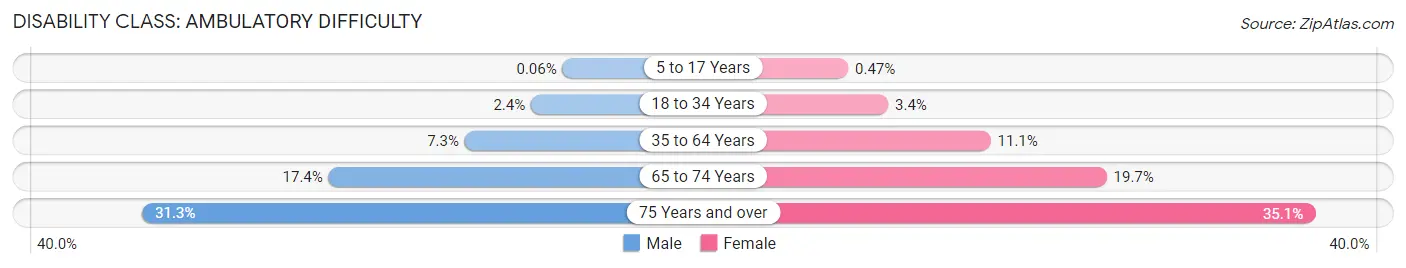
| Age Bracket | Male | Female |
| 5 to 17 Years | 8 (0.1%) | 55 (0.5%) |
| 18 to 34 Years | 373 (2.4%) | 530 (3.4%) |
| 35 to 64 Years | 2,046 (7.3%) | 3,136 (11.1%) |
| 65 to 74 Years | 1,291 (17.4%) | 1,581 (19.7%) |
| 75 Years and over | 1,191 (31.3%) | 2,014 (35.1%) |
Disability Class: Self-Care Difficulty

| Age Bracket | Male | Female |
| 5 to 17 Years | 167 (1.3%) | 83 (0.7%) |
| 18 to 34 Years | 295 (1.9%) | 61 (0.4%) |
| 35 to 64 Years | 733 (2.6%) | 917 (3.2%) |
| 65 to 74 Years | 281 (3.8%) | 442 (5.5%) |
| 75 Years and over | 394 (10.3%) | 691 (12.0%) |
Technology Access in Rowan County
Computing Device Access in Rowan County

| Device Type | # Households | % Households |
| Desktop or Laptop | 40,263 | 71.1% |
| Smartphone | 48,058 | 84.9% |
| Tablet | 34,146 | 60.3% |
| No Computing Device | 4,913 | 8.7% |
| Total | 56,618 | 100.0% |
Internet Access in Rowan County
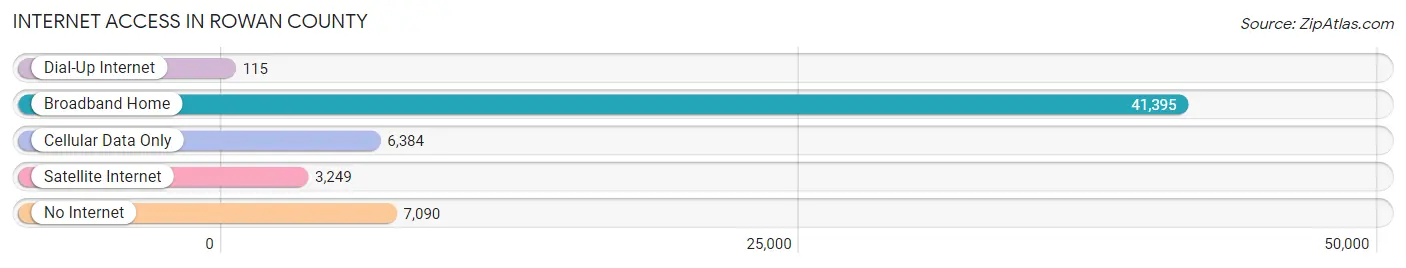
| Internet Type | # Households | % Households |
| Dial-Up Internet | 115 | 0.2% |
| Broadband Home | 41,395 | 73.1% |
| Cellular Data Only | 6,384 | 11.3% |
| Satellite Internet | 3,249 | 5.7% |
| No Internet | 7,090 | 12.5% |
| Total | 56,618 | 100.0% |
Rowan County Summary
Rowan County is located in the central part of North Carolina, in the Piedmont region. It is bordered by Cabarrus, Davidson, Davie, Iredell, and Stanly counties. The county seat is Salisbury, and the county is named after Matthew Rowan, who was the president of the North Carolina Provincial Congress in 1776.
Geography
Rowan County covers an area of 545 square miles, with a population of 138,428 as of the 2020 census. The terrain is mostly rolling hills, with the Uwharrie Mountains in the western part of the county. The Yadkin River runs through the county, and the Catawba River forms the eastern border. The county is home to several state parks, including Dan Nicholas Park, High Rock Lake, and Morrow Mountain State Park.
Climate
Rowan County has a humid subtropical climate, with hot, humid summers and mild winters. The average annual temperature is around 61°F, with an average high of around 79°F in the summer and an average low of around 43°F in the winter. The average annual precipitation is around 44 inches, with most of it falling in the summer months.
Economy
Rowan County’s economy is largely based on manufacturing, with major employers including Corning, Inc., Ingersoll Rand, and Freightliner. Agriculture is also an important part of the economy, with the county’s main crops being corn, soybeans, and tobacco. The county is also home to several wineries, and tourism is an important part of the economy, with attractions such as the North Carolina Transportation Museum and the North Carolina Zoo.
Demographics
As of the 2020 census, the population of Rowan County was 138,428, with a population density of 253 people per square mile. The median household income was $50,845, and the median age was 38.7 years. The racial makeup of the county was 79.2% White, 15.2% Black or African American, 0.5% Native American, 1.7% Asian, 0.1% Pacific Islander, 1.7% from other races, and 2.1% from two or more races. Hispanic or Latino of any race were 5.2% of the population.
Rowan County is home to several colleges and universities, including Catawba College, Livingstone College, and Rowan-Cabarrus Community College. The county is also home to several hospitals, including Novant Health Rowan Medical Center and Wake Forest Baptist Health-Rowan Medical Center.
Rowan County is a diverse and vibrant community, with a rich history and a strong economy. It is home to a variety of attractions, from state parks to wineries, and its population is growing. With its strong economy and diverse population, Rowan County is a great place to live and work.
Common Questions
What is the Total Population of Rowan County?
Total Population of Rowan County is 147,067.
What is the Total Male Population of Rowan County?
Total Male Population of Rowan County is 73,080.
What is the Total Female Population of Rowan County?
Total Female Population of Rowan County is 73,987.
What is the Ratio of Males per 100 Females in Rowan County?
There are 98.77 Males per 100 Females in Rowan County.
What is the Ratio of Females per 100 Males in Rowan County?
There are 101.24 Females per 100 Males in Rowan County.
What is the Median Population Age in Rowan County?
Median Population Age in Rowan County is 40.7 Years.
What is the Average Family Size in Rowan County
Average Family Size in Rowan County is 3.1 People.
What is the Average Household Size in Rowan County
Average Household Size in Rowan County is 2.5 People.
What is Per Capita Income in Rowan County?
Per Capita income in Rowan County is $31,108.
What is the Median Family Income in Rowan County?
Median Family Income in Rowan County is $73,551.
What is the Median Household income in Rowan County?
Median Household Income in Rowan County is $59,717.
What is Income or Wage Gap in Rowan County?
Income or Wage Gap in Rowan County is 33.0%.
Women in Rowan County earn 67.0 cents for every dollar earned by a man.
What is Family Income Deficit in Rowan County?
Family Income Deficit in Rowan County is $10,204.
Families that are below poverty line in Rowan County earn $10,204 less on average than the poverty threshold level.
What is Inequality or Gini Index in Rowan County?
Inequality or Gini Index in Rowan County is 0.45.
How Large is the Labor Force in Rowan County?
There are 71,276 People in the Labor Forcein in Rowan County.
What is the Percentage of People in the Labor Force in Rowan County?
60.3% of People are in the Labor Force in Rowan County.
What is the Unemployment Rate in Rowan County?
Unemployment Rate in Rowan County is 6.3%.