Pitt County, NC
Pitt County Map
Pitt County Overview
171,196
TOTAL POPULATION
80,857
MALE POPULATION
90,339
FEMALE POPULATION
89.50
MALES / 100 FEMALES
111.73
FEMALES / 100 MALES
33.2
MEDIAN AGE
2.9
AVG FAMILY SIZE
2.3
AVG HOUSEHOLD SIZE
$32,224
PER CAPITA INCOME
$73,970
AVG FAMILY INCOME
$54,915
AVG HOUSEHOLD INCOME
24.7%
WAGE / INCOME GAP [ % ]
75.3¢/ $1
WAGE / INCOME GAP [ $ ]
$13,167
FAMILY INCOME DEFICIT
0.48
INEQUALITY / GINI INDEX
87,955
LABOR FORCE [ PEOPLE ]
63.2%
PERCENT IN LABOR FORCE
7.5%
UNEMPLOYMENT RATE
Pitt County Area Codes
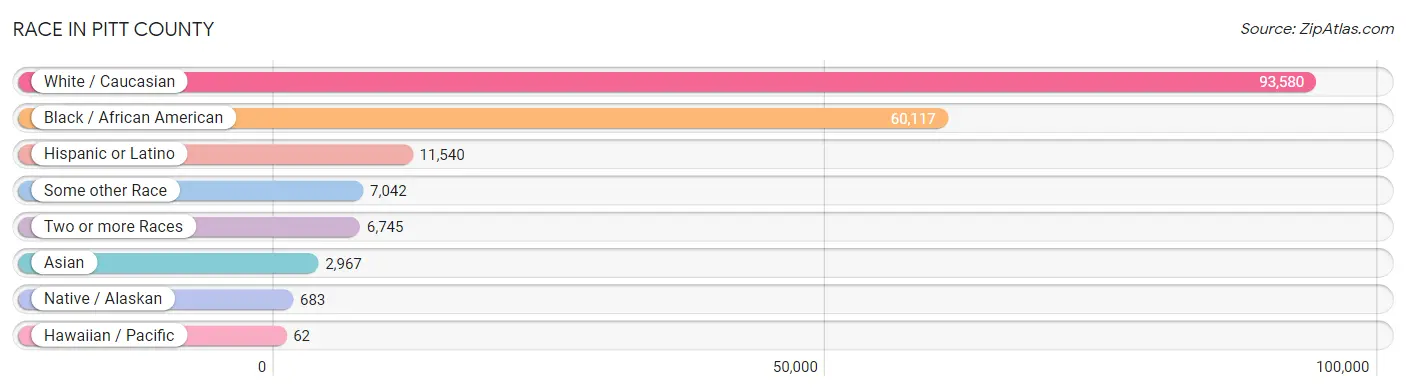
Race in Pitt County
The most populous races in Pitt County are White / Caucasian (93,580 | 54.7%), Black / African American (60,117 | 35.1%), and Hispanic or Latino (11,540 | 6.7%).
| Race | # Population | % Population |
| Asian | 2,967 | 1.7% |
| Black / African American | 60,117 | 35.1% |
| Hawaiian / Pacific | 62 | 0.0% |
| Hispanic or Latino | 11,540 | 6.7% |
| Native / Alaskan | 683 | 0.4% |
| White / Caucasian | 93,580 | 54.7% |
| Two or more Races | 6,745 | 3.9% |
| Some other Race | 7,042 | 4.1% |
| Total | 171,196 | 100.0% |
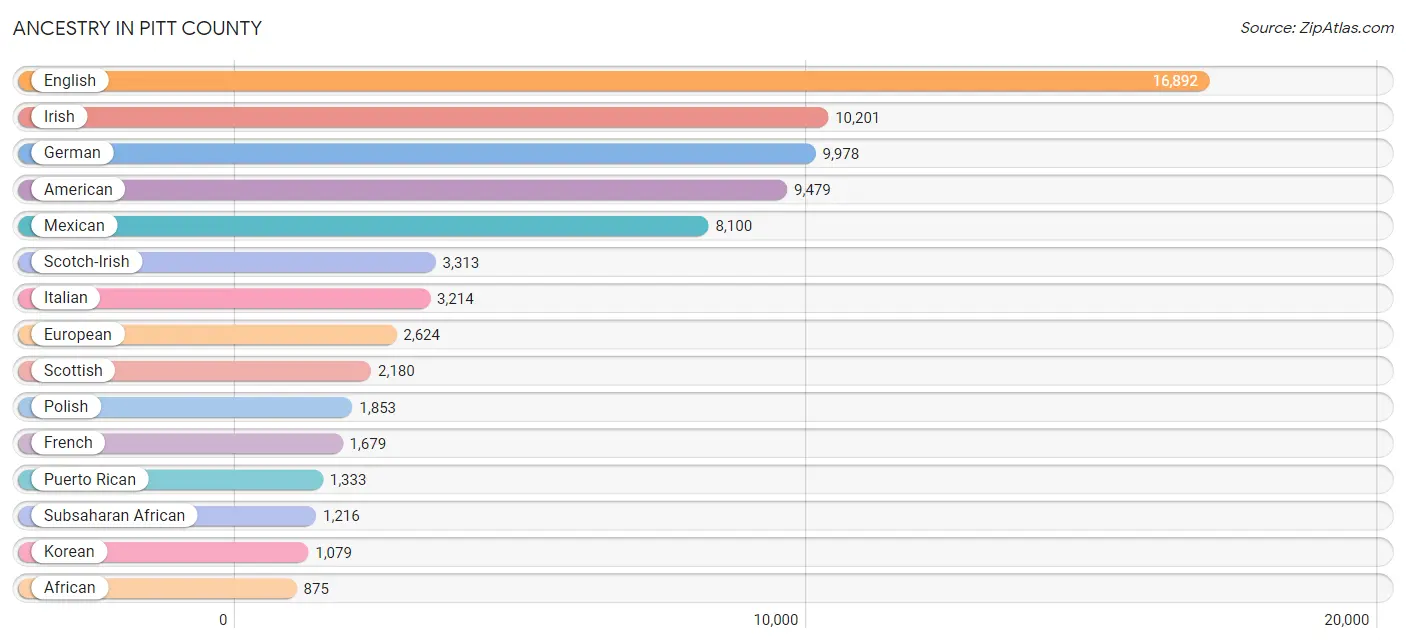
Ancestry in Pitt County
The most populous ancestries reported in Pitt County are English (16,892 | 9.9%), Irish (10,201 | 6.0%), German (9,978 | 5.8%), American (9,479 | 5.5%), and Mexican (8,100 | 4.7%), together accounting for 31.9% of all Pitt County residents.
| Ancestry | # Population | % Population |
| African | 875 | 0.5% |
| Albanian | 63 | 0.0% |
| American | 9,479 | 5.5% |
| Arab | 755 | 0.4% |
| Argentinean | 27 | 0.0% |
| Armenian | 87 | 0.1% |
| Austrian | 121 | 0.1% |
| Bangladeshi | 67 | 0.0% |
| Barbadian | 13 | 0.0% |
| Basque | 6 | 0.0% |
| Belgian | 19 | 0.0% |
| Bhutanese | 727 | 0.4% |
| Brazilian | 70 | 0.0% |
| British | 780 | 0.5% |
| Bulgarian | 56 | 0.0% |
| Burmese | 583 | 0.3% |
| Canadian | 183 | 0.1% |
| Central American | 539 | 0.3% |
| Central American Indian | 135 | 0.1% |
| Cherokee | 384 | 0.2% |
| Chickasaw | 7 | 0.0% |
| Chilean | 45 | 0.0% |
| Chinese | 64 | 0.0% |
| Colombian | 179 | 0.1% |
| Croatian | 3 | 0.0% |
| Cuban | 437 | 0.3% |
| Czech | 107 | 0.1% |
| Czechoslovakian | 33 | 0.0% |
| Danish | 141 | 0.1% |
| Dominican | 12 | 0.0% |
| Dutch | 554 | 0.3% |
| Eastern European | 441 | 0.3% |
| Ecuadorian | 3 | 0.0% |
| Egyptian | 61 | 0.0% |
| English | 16,892 | 9.9% |
| European | 2,624 | 1.5% |
| Filipino | 11 | 0.0% |
| Finnish | 48 | 0.0% |
| French | 1,679 | 1.0% |
| French Canadian | 225 | 0.1% |
| German | 9,978 | 5.8% |
| Ghanaian | 28 | 0.0% |
| Greek | 212 | 0.1% |
| Guatemalan | 191 | 0.1% |
| Guyanese | 34 | 0.0% |
| Haitian | 143 | 0.1% |
| Honduran | 41 | 0.0% |
| Hungarian | 483 | 0.3% |
| Indian (Asian) | 598 | 0.4% |
| Indonesian | 43 | 0.0% |
| Iranian | 16 | 0.0% |
| Iraqi | 40 | 0.0% |
| Irish | 10,201 | 6.0% |
| Iroquois | 50 | 0.0% |
| Italian | 3,214 | 1.9% |
| Jamaican | 686 | 0.4% |
| Japanese | 35 | 0.0% |
| Jordanian | 17 | 0.0% |
| Kenyan | 3 | 0.0% |
| Korean | 1,079 | 0.6% |
| Lebanese | 89 | 0.1% |
| Liberian | 84 | 0.1% |
| Lithuanian | 115 | 0.1% |
| Lumbee | 174 | 0.1% |
| Maltese | 14 | 0.0% |
| Mexican | 8,100 | 4.7% |
| Mexican American Indian | 41 | 0.0% |
| Native Hawaiian | 224 | 0.1% |
| Navajo | 33 | 0.0% |
| New Zealander | 24 | 0.0% |
| Nicaraguan | 11 | 0.0% |
| Nigerian | 191 | 0.1% |
| Northern European | 171 | 0.1% |
| Norwegian | 498 | 0.3% |
| Pakistani | 64 | 0.0% |
| Palestinian | 192 | 0.1% |
| Pennsylvania German | 5 | 0.0% |
| Peruvian | 73 | 0.0% |
| Polish | 1,853 | 1.1% |
| Portuguese | 128 | 0.1% |
| Potawatomi | 7 | 0.0% |
| Puerto Rican | 1,333 | 0.8% |
| Romanian | 127 | 0.1% |
| Russian | 282 | 0.2% |
| Salvadoran | 279 | 0.2% |
| Samoan | 153 | 0.1% |
| Scandinavian | 296 | 0.2% |
| Scotch-Irish | 3,313 | 1.9% |
| Scottish | 2,180 | 1.3% |
| Serbian | 8 | 0.0% |
| Slavic | 33 | 0.0% |
| Slovak | 146 | 0.1% |
| Slovene | 21 | 0.0% |
| South African | 14 | 0.0% |
| South American | 739 | 0.4% |
| Spaniard | 90 | 0.1% |
| Spanish | 50 | 0.0% |
| Sri Lankan | 113 | 0.1% |
| Subsaharan African | 1,216 | 0.7% |
| Sudanese | 29 | 0.0% |
| Swedish | 429 | 0.3% |
| Swiss | 145 | 0.1% |
| Syrian | 48 | 0.0% |
| Thai | 859 | 0.5% |
| Trinidadian and Tobagonian | 93 | 0.1% |
| Turkish | 20 | 0.0% |
| U.S. Virgin Islander | 56 | 0.0% |
| Ukrainian | 306 | 0.2% |
| Venezuelan | 405 | 0.2% |
| Welsh | 640 | 0.4% |
| West Indian | 212 | 0.1% |
| Yugoslavian | 52 | 0.0% | View All 112 Rows |
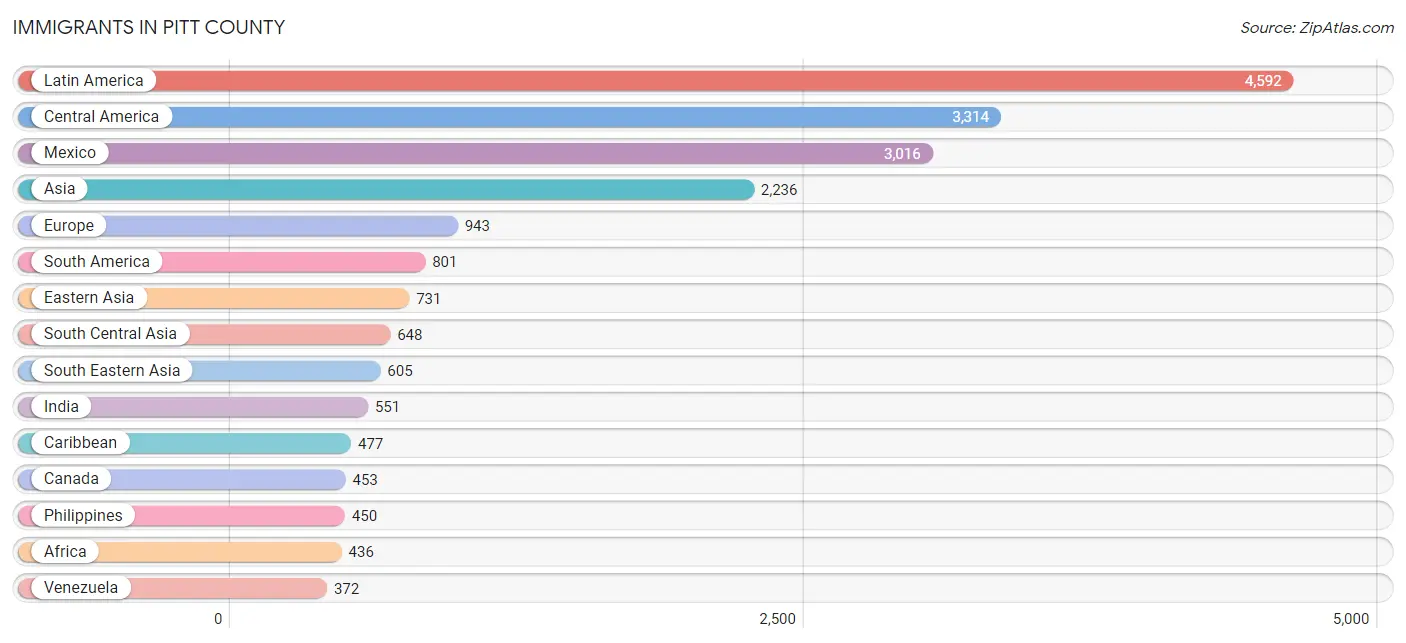
Immigrants in Pitt County
The most numerous immigrant groups reported in Pitt County came from Latin America (4,592 | 2.7%), Central America (3,314 | 1.9%), Mexico (3,016 | 1.8%), Asia (2,236 | 1.3%), and Europe (943 | 0.5%), together accounting for 8.2% of all Pitt County residents.
| Immigration Origin | # Population | % Population |
| Africa | 436 | 0.3% |
| Albania | 18 | 0.0% |
| Asia | 2,236 | 1.3% |
| Australia | 20 | 0.0% |
| Belgium | 14 | 0.0% |
| Brazil | 53 | 0.0% |
| Bulgaria | 39 | 0.0% |
| Cambodia | 35 | 0.0% |
| Cameroon | 9 | 0.0% |
| Canada | 453 | 0.3% |
| Caribbean | 477 | 0.3% |
| Central America | 3,314 | 1.9% |
| Chile | 55 | 0.0% |
| China | 267 | 0.2% |
| Colombia | 219 | 0.1% |
| Cuba | 84 | 0.1% |
| Dominican Republic | 4 | 0.0% |
| Eastern Africa | 3 | 0.0% |
| Eastern Asia | 731 | 0.4% |
| Eastern Europe | 272 | 0.2% |
| Ecuador | 4 | 0.0% |
| Egypt | 37 | 0.0% |
| England | 75 | 0.0% |
| Europe | 943 | 0.5% |
| France | 104 | 0.1% |
| Germany | 241 | 0.1% |
| Ghana | 120 | 0.1% |
| Guatemala | 224 | 0.1% |
| Haiti | 35 | 0.0% |
| Honduras | 63 | 0.0% |
| Hong Kong | 30 | 0.0% |
| India | 551 | 0.3% |
| Iran | 12 | 0.0% |
| Iraq | 87 | 0.1% |
| Ireland | 10 | 0.0% |
| Israel | 42 | 0.0% |
| Italy | 10 | 0.0% |
| Jamaica | 290 | 0.2% |
| Japan | 266 | 0.2% |
| Jordan | 17 | 0.0% |
| Kazakhstan | 8 | 0.0% |
| Kenya | 3 | 0.0% |
| Korea | 198 | 0.1% |
| Latin America | 4,592 | 2.7% |
| Liberia | 84 | 0.1% |
| Mexico | 3,016 | 1.8% |
| Middle Africa | 9 | 0.0% |
| Netherlands | 2 | 0.0% |
| Nicaragua | 11 | 0.0% |
| Nigeria | 118 | 0.1% |
| Northern Africa | 37 | 0.0% |
| Northern Europe | 300 | 0.2% |
| Oceania | 52 | 0.0% |
| Pakistan | 77 | 0.0% |
| Peru | 62 | 0.0% |
| Philippines | 450 | 0.3% |
| Poland | 9 | 0.0% |
| Romania | 13 | 0.0% |
| Russia | 53 | 0.0% |
| Saudi Arabia | 9 | 0.0% |
| Scotland | 11 | 0.0% |
| South Africa | 14 | 0.0% |
| South America | 801 | 0.5% |
| South Central Asia | 648 | 0.4% |
| South Eastern Asia | 605 | 0.4% |
| Southern Europe | 10 | 0.0% |
| Taiwan | 15 | 0.0% |
| Thailand | 25 | 0.0% |
| Trinidad and Tobago | 47 | 0.0% |
| Turkey | 20 | 0.0% |
| Ukraine | 87 | 0.1% |
| Venezuela | 372 | 0.2% |
| Vietnam | 52 | 0.0% |
| Western Africa | 336 | 0.2% |
| Western Asia | 252 | 0.2% |
| Western Europe | 361 | 0.2% |
| Yemen | 60 | 0.0% | View All 77 Rows |
Sex and Age in Pitt County
Sex and Age in Pitt County
The most populous age groups in Pitt County are 20 to 24 Years (10,217 | 12.6%) for men and 20 to 24 Years (11,676 | 12.9%) for women.
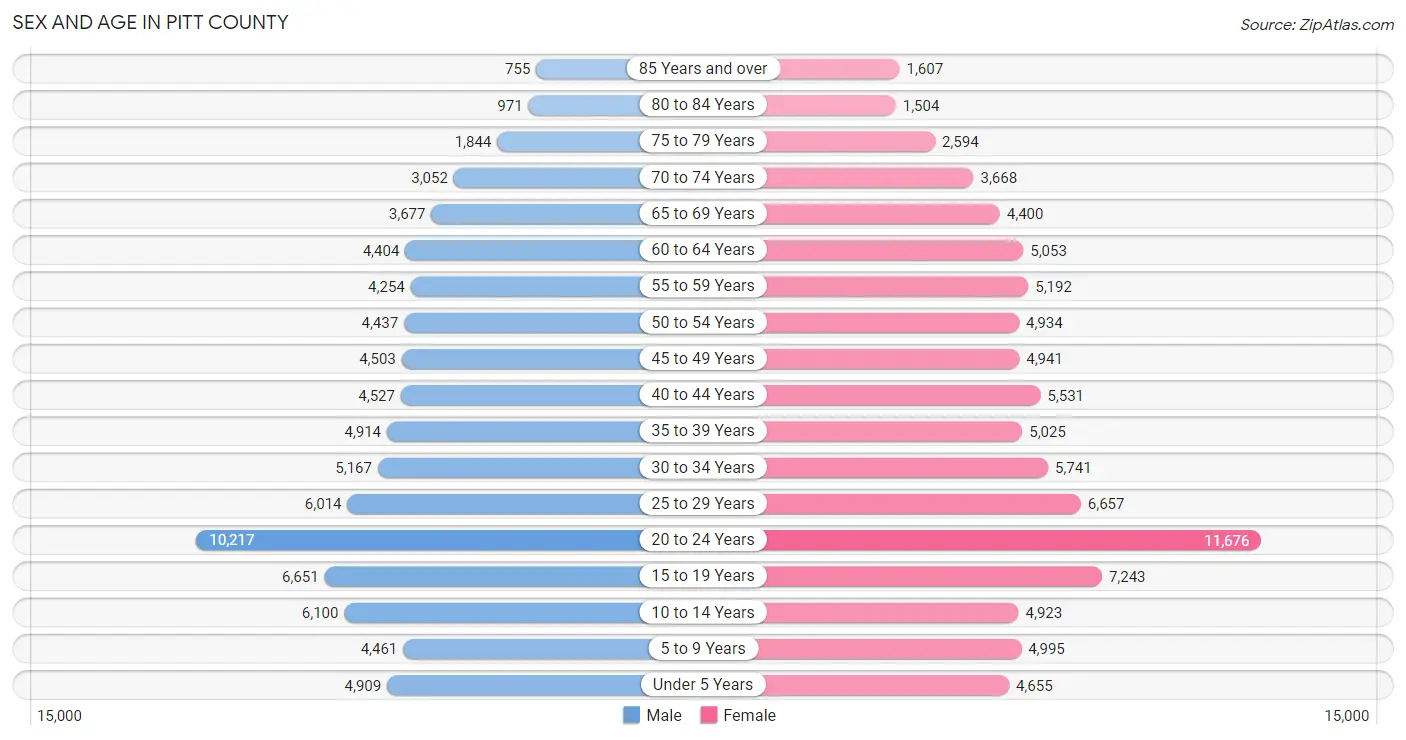
| Age Bracket | Male | Female |
| Under 5 Years | 4,909 (6.1%) | 4,655 (5.1%) |
| 5 to 9 Years | 4,461 (5.5%) | 4,995 (5.5%) |
| 10 to 14 Years | 6,100 (7.5%) | 4,923 (5.4%) |
| 15 to 19 Years | 6,651 (8.2%) | 7,243 (8.0%) |
| 20 to 24 Years | 10,217 (12.6%) | 11,676 (12.9%) |
| 25 to 29 Years | 6,014 (7.4%) | 6,657 (7.4%) |
| 30 to 34 Years | 5,167 (6.4%) | 5,741 (6.4%) |
| 35 to 39 Years | 4,914 (6.1%) | 5,025 (5.6%) |
| 40 to 44 Years | 4,527 (5.6%) | 5,531 (6.1%) |
| 45 to 49 Years | 4,503 (5.6%) | 4,941 (5.5%) |
| 50 to 54 Years | 4,437 (5.5%) | 4,934 (5.5%) |
| 55 to 59 Years | 4,254 (5.3%) | 5,192 (5.8%) |
| 60 to 64 Years | 4,404 (5.4%) | 5,053 (5.6%) |
| 65 to 69 Years | 3,677 (4.5%) | 4,400 (4.9%) |
| 70 to 74 Years | 3,052 (3.8%) | 3,668 (4.1%) |
| 75 to 79 Years | 1,844 (2.3%) | 2,594 (2.9%) |
| 80 to 84 Years | 971 (1.2%) | 1,504 (1.7%) |
| 85 Years and over | 755 (0.9%) | 1,607 (1.8%) |
| Total | 80,857 (100.0%) | 90,339 (100.0%) |
Families and Households in Pitt County
Median Family Size in Pitt County
The median family size in Pitt County is 2.89 persons per family, with married-couple families (25,613 | 63.4%) accounting for the largest median family size of 2.94 persons per family. On the other hand, single male/father families (3,851 | 9.5%) represent the smallest median family size with 2.53 persons per family.
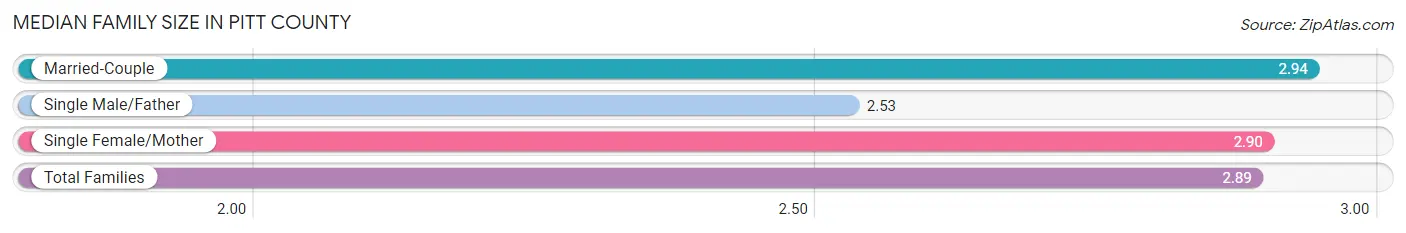
| Family Type | # Families | Family Size |
| Married-Couple | 25,613 (63.4%) | 2.94 |
| Single Male/Father | 3,851 (9.5%) | 2.53 |
| Single Female/Mother | 10,934 (27.1%) | 2.90 |
| Total Families | 40,398 (100.0%) | 2.89 |
Median Household Size in Pitt County
The median household size in Pitt County is 2.28 persons per household, with single female/mother households (10,934 | 15.1%) accounting for the largest median household size of 3.09 persons per household. non-family households (31,755 | 44.0%) represent the smallest median household size with 1.40 persons per household.
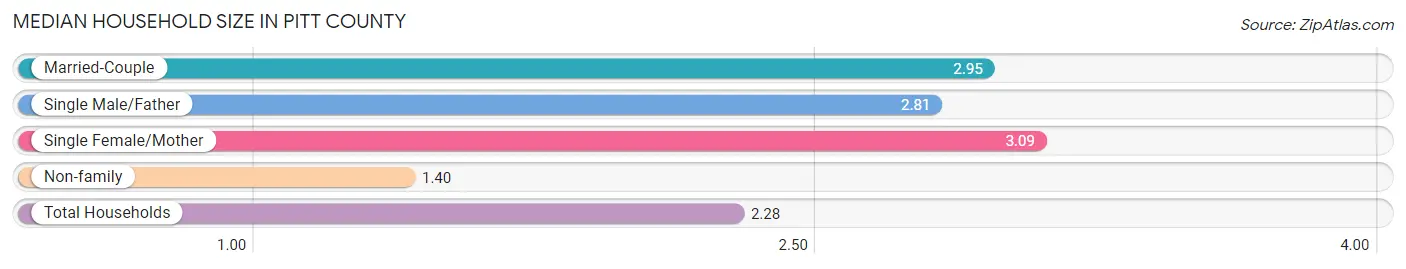
| Household Type | # Households | Household Size |
| Married-Couple | 25,613 (35.5%) | 2.95 |
| Single Male/Father | 3,851 (5.3%) | 2.81 |
| Single Female/Mother | 10,934 (15.1%) | 3.09 |
| Non-family | 31,755 (44.0%) | 1.40 |
| Total Households | 72,153 (100.0%) | 2.28 |
Household Size by Marriage Status in Pitt County
Out of a total of 72,153 households in Pitt County, 40,398 (56.0%) are family households, while 31,755 (44.0%) are nonfamily households. The most numerous type of family households are 2-person households, comprising 18,728, and the most common type of nonfamily households are 1-person households, comprising 22,972.
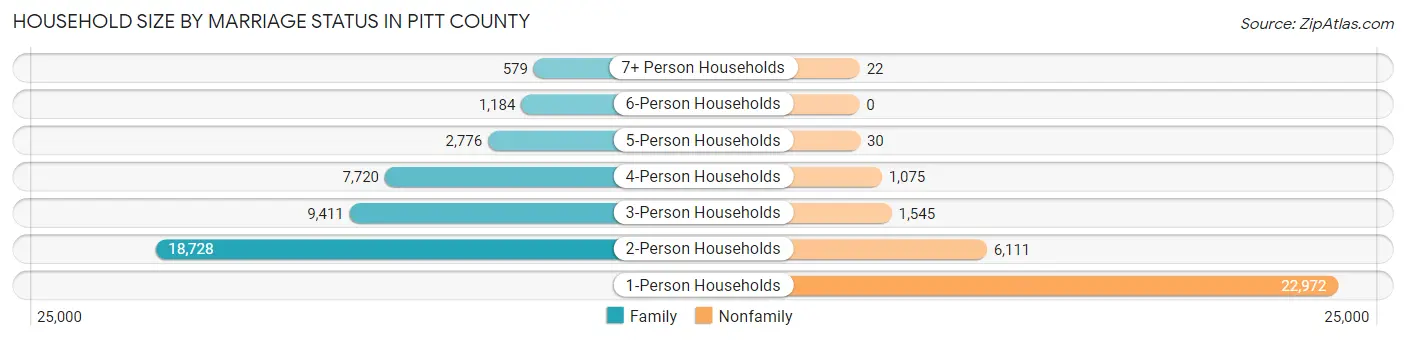
| Household Size | Family Households | Nonfamily Households |
| 1-Person Households | - | 22,972 (31.8%) |
| 2-Person Households | 18,728 (26.0%) | 6,111 (8.5%) |
| 3-Person Households | 9,411 (13.0%) | 1,545 (2.1%) |
| 4-Person Households | 7,720 (10.7%) | 1,075 (1.5%) |
| 5-Person Households | 2,776 (3.8%) | 30 (0.0%) |
| 6-Person Households | 1,184 (1.6%) | 0 (0.0%) |
| 7+ Person Households | 579 (0.8%) | 22 (0.0%) |
| Total | 40,398 (56.0%) | 31,755 (44.0%) |
Female Fertility in Pitt County
Fertility by Age in Pitt County
Average fertility rate in Pitt County is 34.0 births per 1,000 women. Women in the age bracket of 20 to 34 years have the highest fertility rate with 54.0 births per 1,000 women. Women in the age bracket of 20 to 34 years acount for 79.7% of all women with births.
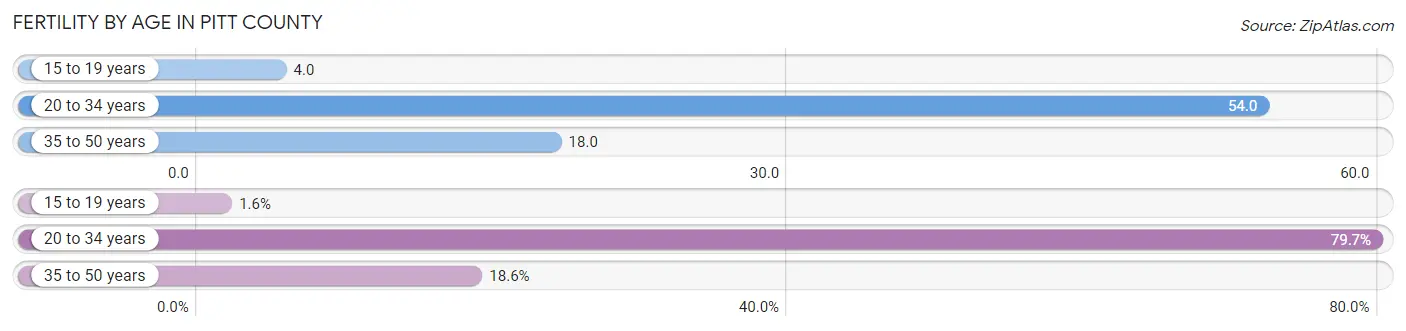
| Age Bracket | Women with Births | Births / 1,000 Women |
| 15 to 19 years | 27 (1.6%) | 4.0 |
| 20 to 34 years | 1,310 (79.7%) | 54.0 |
| 35 to 50 years | 306 (18.6%) | 18.0 |
| Total | 1,643 (100.0%) | 34.0 |
Fertility by Age by Marriage Status in Pitt County
54.7% of women with births (1,643) in Pitt County are married. The highest percentage of unmarried women with births falls into 20 to 34 years age bracket with 55.0% of them unmarried at the time of birth, while the lowest percentage of unmarried women with births belong to 15 to 19 years age bracket with 0.0% of them unmarried.
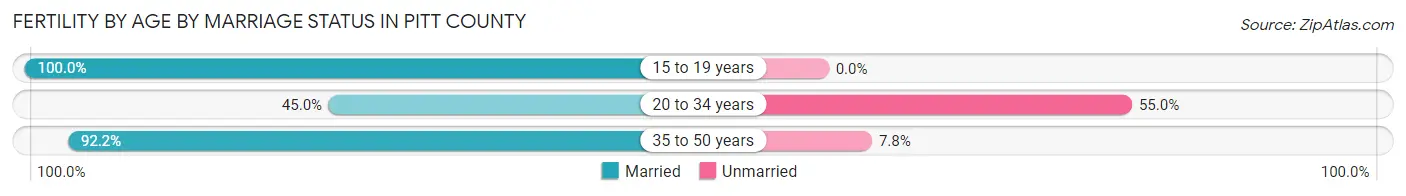
| Age Bracket | Married | Unmarried |
| 15 to 19 years | 27 (100.0%) | 0 (0.0%) |
| 20 to 34 years | 590 (45.0%) | 720 (55.0%) |
| 35 to 50 years | 282 (92.2%) | 24 (7.8%) |
| Total | 899 (54.7%) | 744 (45.3%) |
Fertility by Education in Pitt County
Average fertility rate in Pitt County is 34.0 births per 1,000 women. Women with the education attainment of graduate degree have the highest fertility rate of 55.0 births per 1,000 women, while women with the education attainment of less than high school have the lowest fertility at 21.0 births per 1,000 women. Women with the education attainment of college or associate's degree represent 38.3% of all women with births.
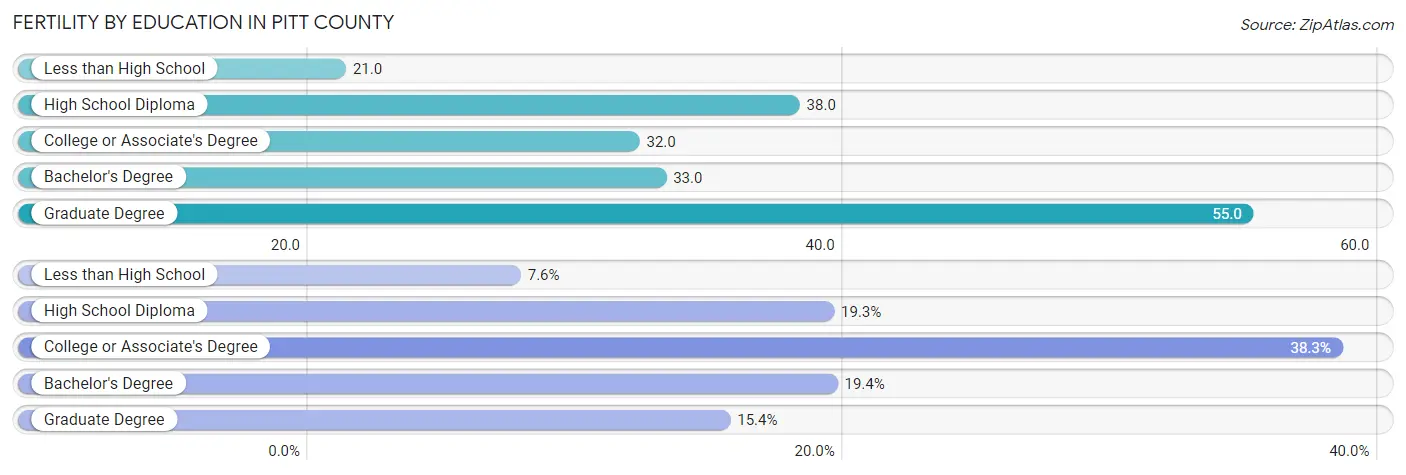
| Educational Attainment | Women with Births | Births / 1,000 Women |
| Less than High School | 124 (7.5%) | 21.0 |
| High School Diploma | 317 (19.3%) | 38.0 |
| College or Associate's Degree | 630 (38.3%) | 32.0 |
| Bachelor's Degree | 319 (19.4%) | 33.0 |
| Graduate Degree | 253 (15.4%) | 55.0 |
| Total | 1,643 (100.0%) | 34.0 |
Fertility by Education by Marriage Status in Pitt County
45.3% of women with births in Pitt County are unmarried. Women with the educational attainment of graduate degree are most likely to be married with 100.0% of them married at childbirth, while women with the educational attainment of high school diploma are least likely to be married with 83.0% of them unmarried at childbirth.
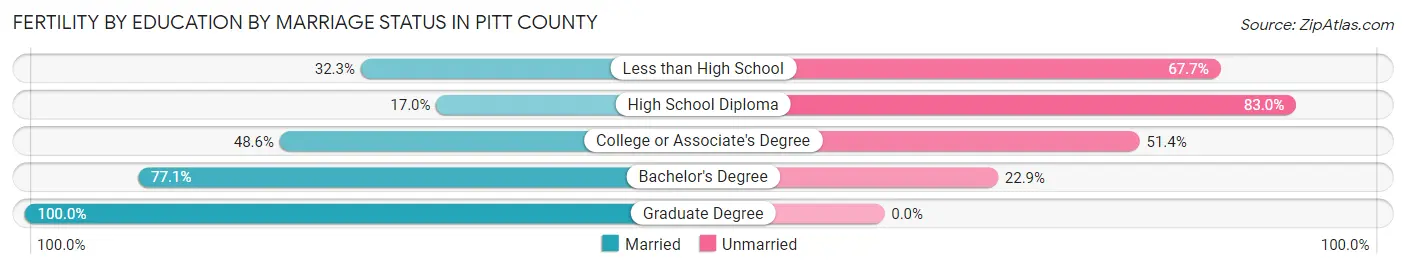
| Educational Attainment | Married | Unmarried |
| Less than High School | 40 (32.3%) | 84 (67.7%) |
| High School Diploma | 54 (17.0%) | 263 (83.0%) |
| College or Associate's Degree | 306 (48.6%) | 324 (51.4%) |
| Bachelor's Degree | 246 (77.1%) | 73 (22.9%) |
| Graduate Degree | 253 (100.0%) | 0 (0.0%) |
| Total | 899 (54.7%) | 744 (45.3%) |
Income in Pitt County
Income Overview in Pitt County
Per Capita Income in Pitt County is $32,224, while median incomes of families and households are $73,970 and $54,915 respectively.
| Characteristic | Number | Measure |
| Per Capita Income | 171,196 | $32,224 |
| Median Family Income | 40,398 | $73,970 |
| Mean Family Income | 40,398 | $93,644 |
| Median Household Income | 72,153 | $54,915 |
| Mean Household Income | 72,153 | $76,312 |
| Income Deficit | 40,398 | $13,167 |
| Wage / Income Gap (%) | 171,196 | 24.67% |
| Wage / Income Gap ($) | 171,196 | 75.33¢ per $1 |
| Gini / Inequality Index | 171,196 | 0.48 |
Earnings by Sex in Pitt County
Average Earnings in Pitt County are $35,434, $40,955 for men and $30,850 for women, a difference of 24.7%.
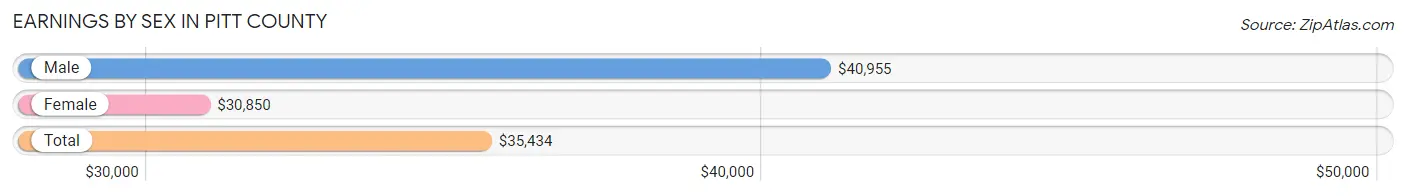
| Sex | Number | Average Earnings |
| Male | 45,572 (50.2%) | $40,955 |
| Female | 45,276 (49.8%) | $30,850 |
| Total | 90,848 (100.0%) | $35,434 |
Earnings by Sex by Income Bracket in Pitt County
The most common earnings brackets in Pitt County are $100,000+ for men (5,097 | 11.2%) and $2,499 or less for women (3,314 | 7.3%).
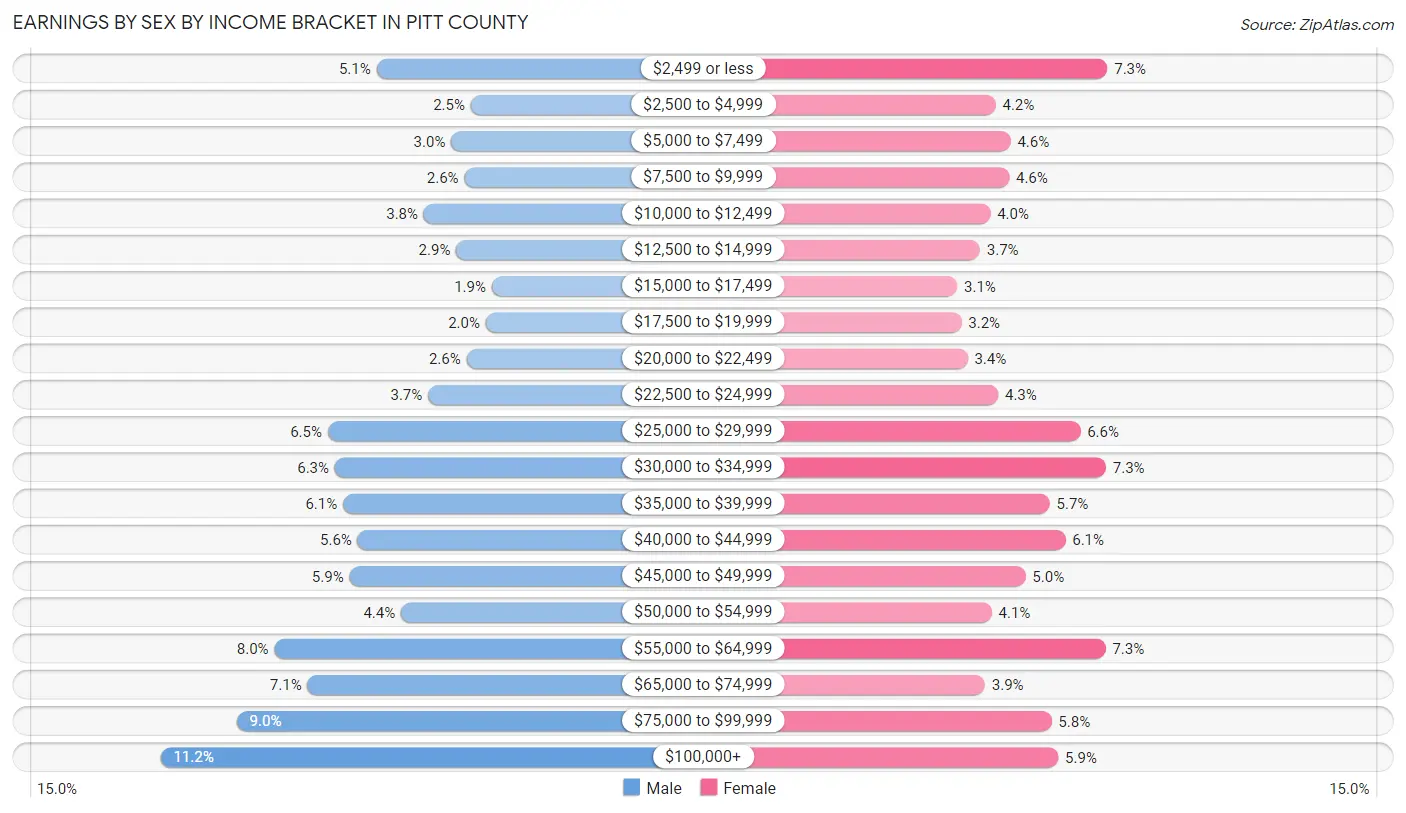
| Income | Male | Female |
| $2,499 or less | 2,328 (5.1%) | 3,314 (7.3%) |
| $2,500 to $4,999 | 1,121 (2.5%) | 1,894 (4.2%) |
| $5,000 to $7,499 | 1,372 (3.0%) | 2,084 (4.6%) |
| $7,500 to $9,999 | 1,202 (2.6%) | 2,066 (4.6%) |
| $10,000 to $12,499 | 1,723 (3.8%) | 1,823 (4.0%) |
| $12,500 to $14,999 | 1,308 (2.9%) | 1,693 (3.7%) |
| $15,000 to $17,499 | 853 (1.9%) | 1,405 (3.1%) |
| $17,500 to $19,999 | 930 (2.0%) | 1,456 (3.2%) |
| $20,000 to $22,499 | 1,175 (2.6%) | 1,536 (3.4%) |
| $22,500 to $24,999 | 1,666 (3.7%) | 1,922 (4.3%) |
| $25,000 to $29,999 | 2,951 (6.5%) | 2,971 (6.6%) |
| $30,000 to $34,999 | 2,864 (6.3%) | 3,297 (7.3%) |
| $35,000 to $39,999 | 2,756 (6.0%) | 2,580 (5.7%) |
| $40,000 to $44,999 | 2,568 (5.6%) | 2,779 (6.1%) |
| $45,000 to $49,999 | 2,676 (5.9%) | 2,273 (5.0%) |
| $50,000 to $54,999 | 2,014 (4.4%) | 1,844 (4.1%) |
| $55,000 to $64,999 | 3,638 (8.0%) | 3,291 (7.3%) |
| $65,000 to $74,999 | 3,212 (7.0%) | 1,757 (3.9%) |
| $75,000 to $99,999 | 4,118 (9.0%) | 2,602 (5.8%) |
| $100,000+ | 5,097 (11.2%) | 2,689 (5.9%) |
| Total | 45,572 (100.0%) | 45,276 (100.0%) |
Earnings by Sex by Educational Attainment in Pitt County
Average earnings in Pitt County are $48,766 for men and $38,472 for women, a difference of 21.1%. Men with an educational attainment of graduate degree enjoy the highest average annual earnings of $74,773, while those with less than high school education earn the least with $33,030. Women with an educational attainment of graduate degree earn the most with the average annual earnings of $60,790, while those with high school diploma education have the smallest earnings of $24,630.
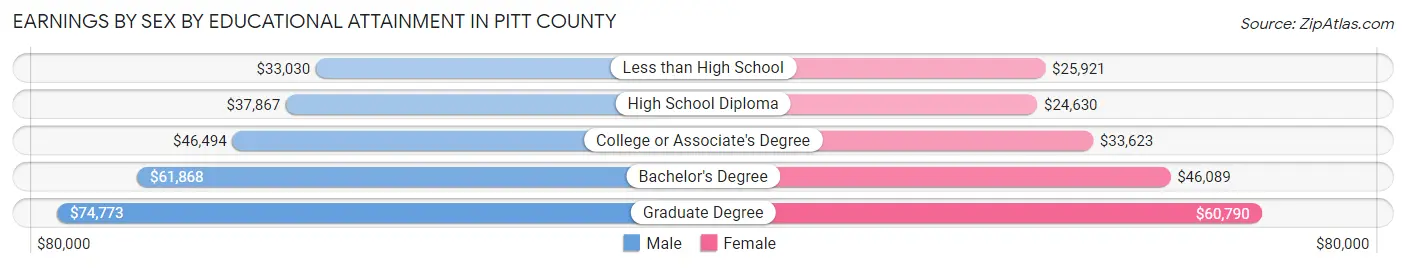
| Educational Attainment | Male Income | Female Income |
| Less than High School | $33,030 | $25,921 |
| High School Diploma | $37,867 | $24,630 |
| College or Associate's Degree | $46,494 | $33,623 |
| Bachelor's Degree | $61,868 | $46,089 |
| Graduate Degree | $74,773 | $60,790 |
| Total | $48,766 | $38,472 |
Family Income in Pitt County
Family Income Brackets in Pitt County
According to the Pitt County family income data, there are 7,676 families falling into the $100,000 to $149,999 income range, which is the most common income bracket and makes up 19.0% of all families. Conversely, the $10,000 to $14,999 income bracket is the least frequent group with only 970 families (2.4%) belonging to this category.
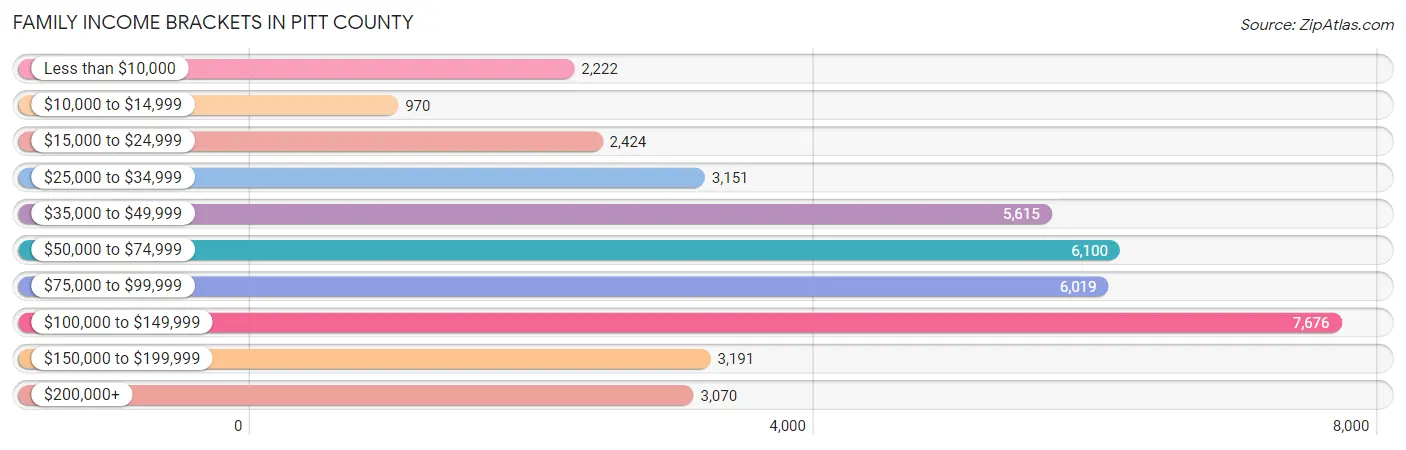
| Income Bracket | # Families | % Families |
| Less than $10,000 | 2,222 | 5.5% |
| $10,000 to $14,999 | 970 | 2.4% |
| $15,000 to $24,999 | 2,424 | 6.0% |
| $25,000 to $34,999 | 3,151 | 7.8% |
| $35,000 to $49,999 | 5,615 | 13.9% |
| $50,000 to $74,999 | 6,100 | 15.1% |
| $75,000 to $99,999 | 6,019 | 14.9% |
| $100,000 to $149,999 | 7,676 | 19.0% |
| $150,000 to $199,999 | 3,191 | 7.9% |
| $200,000+ | 3,070 | 7.6% |
Family Income by Famaliy Size in Pitt County
6-person families (862 | 2.1%) account for the highest median family income in Pitt County with $118,062 per family, while 2-person families (20,076 | 49.7%) have the highest median income of $33,816 per family member.
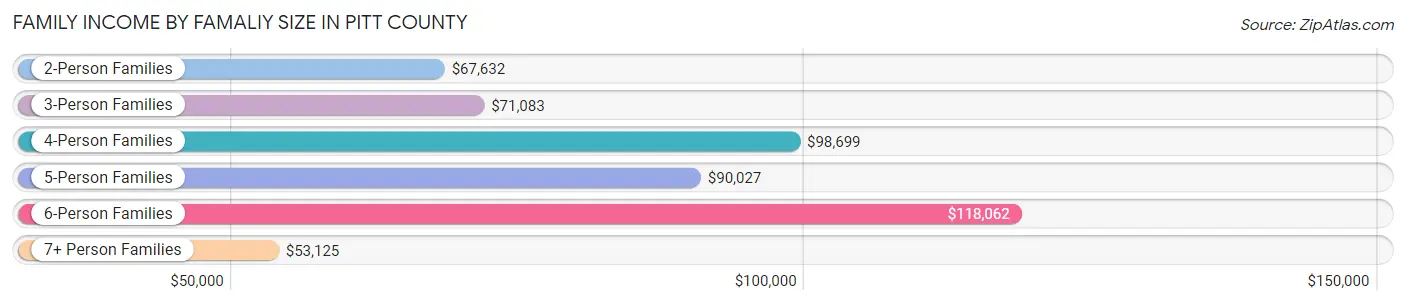
| Income Bracket | # Families | Median Income |
| 2-Person Families | 20,076 (49.7%) | $67,632 |
| 3-Person Families | 9,186 (22.7%) | $71,083 |
| 4-Person Families | 6,943 (17.2%) | $98,699 |
| 5-Person Families | 2,841 (7.0%) | $90,027 |
| 6-Person Families | 862 (2.1%) | $118,062 |
| 7+ Person Families | 490 (1.2%) | $53,125 |
| Total | 40,398 (100.0%) | $73,970 |
Family Income by Number of Earners in Pitt County
The median family income in Pitt County is $73,970, with families comprising 3+ earners (2,943) having the highest median family income of $130,391, while families with no earners (6,194) have the lowest median family income of $39,380, accounting for 7.3% and 15.3% of families, respectively.
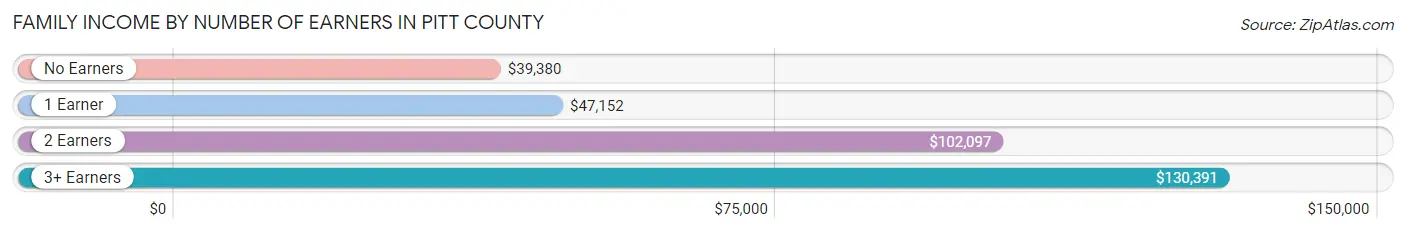
| Number of Earners | # Families | Median Income |
| No Earners | 6,194 (15.3%) | $39,380 |
| 1 Earner | 14,326 (35.5%) | $47,152 |
| 2 Earners | 16,935 (41.9%) | $102,097 |
| 3+ Earners | 2,943 (7.3%) | $130,391 |
| Total | 40,398 (100.0%) | $73,970 |
Household Income in Pitt County
Household Income Brackets in Pitt County
With 12,410 households falling in the category, the $50,000 to $74,999 income range is the most frequent in Pitt County, accounting for 17.2% of all households. In contrast, only 3,608 households (5.0%) fall into the $200,000+ income bracket, making it the least populous group.
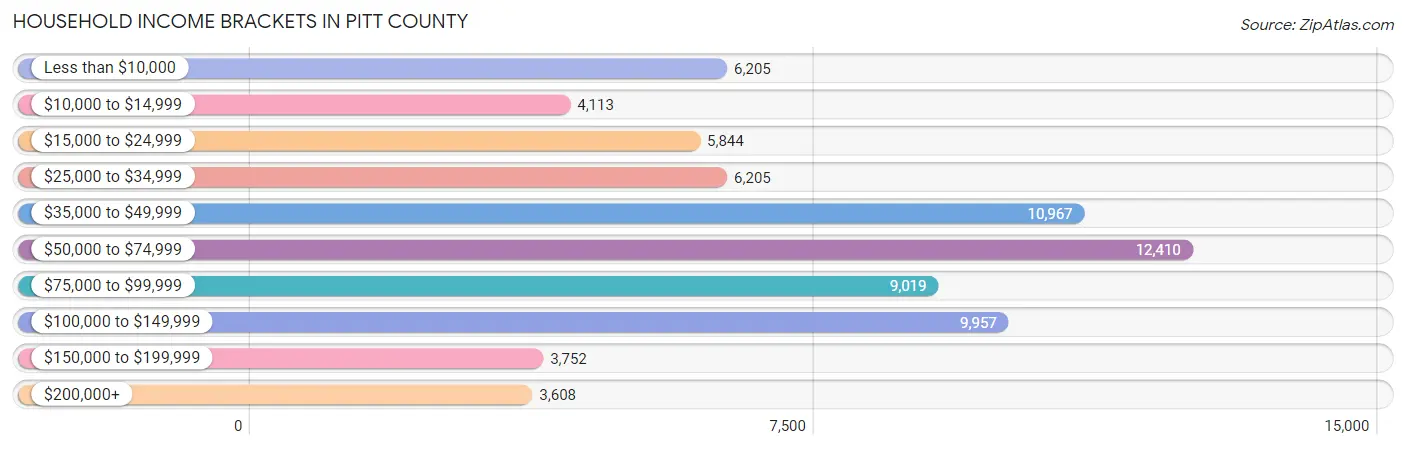
| Income Bracket | # Households | % Households |
| Less than $10,000 | 6,205 | 8.6% |
| $10,000 to $14,999 | 4,113 | 5.7% |
| $15,000 to $24,999 | 5,844 | 8.1% |
| $25,000 to $34,999 | 6,205 | 8.6% |
| $35,000 to $49,999 | 10,967 | 15.2% |
| $50,000 to $74,999 | 12,410 | 17.2% |
| $75,000 to $99,999 | 9,019 | 12.5% |
| $100,000 to $149,999 | 9,957 | 13.8% |
| $150,000 to $199,999 | 3,752 | 5.2% |
| $200,000+ | 3,608 | 5.0% |
Household Income by Householder Age in Pitt County
The median household income in Pitt County is $54,915, with the highest median household income of $69,604 found in the 45 to 64 years age bracket for the primary householder. A total of 22,576 households (31.3%) fall into this category. Meanwhile, the 15 to 24 years age bracket for the primary householder has the lowest median household income of $32,696, with 9,336 households (12.9%) in this group.
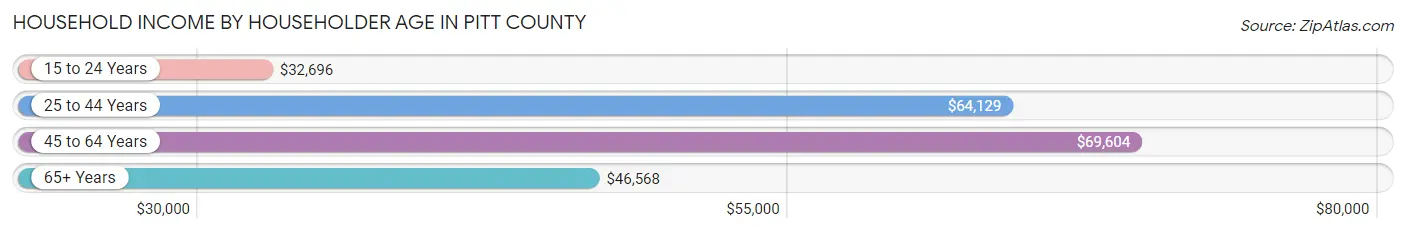
| Income Bracket | # Households | Median Income |
| 15 to 24 Years | 9,336 (12.9%) | $32,696 |
| 25 to 44 Years | 24,381 (33.8%) | $64,129 |
| 45 to 64 Years | 22,576 (31.3%) | $69,604 |
| 65+ Years | 15,860 (22.0%) | $46,568 |
| Total | 72,153 (100.0%) | $54,915 |
Poverty in Pitt County
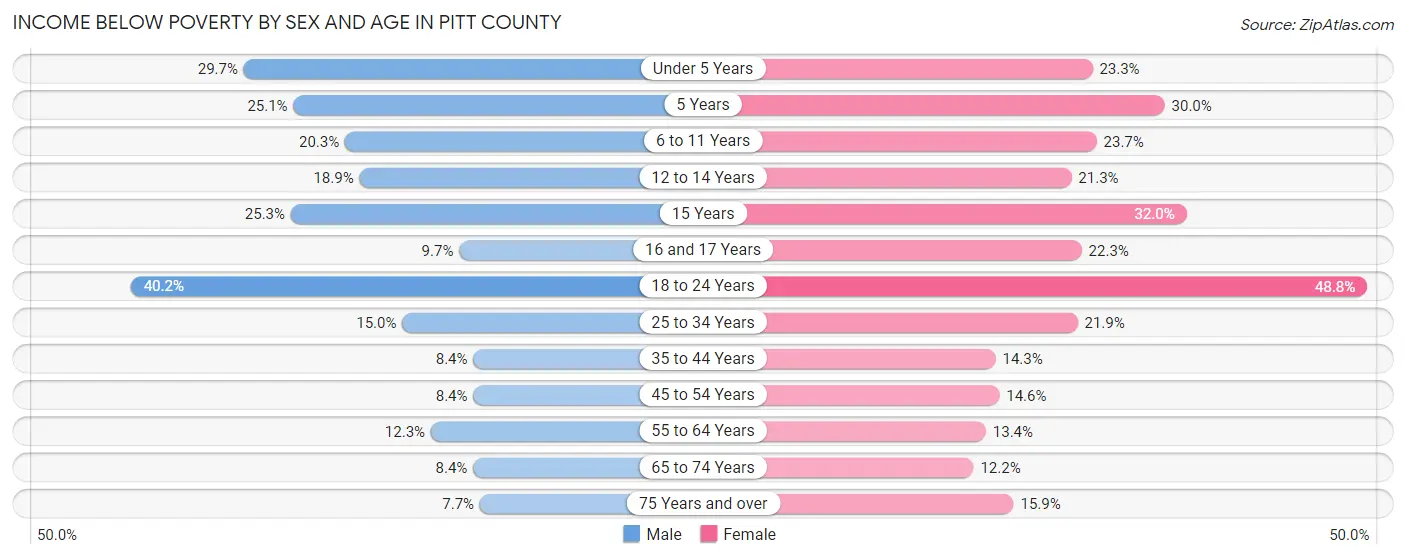
Income Below Poverty by Sex and Age in Pitt County
With 17.5% poverty level for males and 22.3% for females among the residents of Pitt County, 18 to 24 year old males and 18 to 24 year old females are the most vulnerable to poverty, with 4,605 males (40.2%) and 6,314 females (48.7%) in their respective age groups living below the poverty level.
| Age Bracket | Male | Female |
| Under 5 Years | 1,433 (29.7%) | 1,058 (23.3%) |
| 5 Years | 249 (25.1%) | 329 (30.0%) |
| 6 to 11 Years | 1,215 (20.3%) | 1,346 (23.6%) |
| 12 to 14 Years | 653 (18.9%) | 620 (21.3%) |
| 15 Years | 236 (25.3%) | 336 (32.0%) |
| 16 and 17 Years | 219 (9.7%) | 443 (22.3%) |
| 18 to 24 Years | 4,605 (40.2%) | 6,314 (48.7%) |
| 25 to 34 Years | 1,661 (14.9%) | 2,711 (21.9%) |
| 35 to 44 Years | 780 (8.4%) | 1,505 (14.3%) |
| 45 to 54 Years | 742 (8.4%) | 1,442 (14.6%) |
| 55 to 64 Years | 1,053 (12.3%) | 1,364 (13.4%) |
| 65 to 74 Years | 557 (8.4%) | 975 (12.2%) |
| 75 Years and over | 270 (7.7%) | 862 (15.9%) |
| Total | 13,673 (17.5%) | 19,305 (22.3%) |
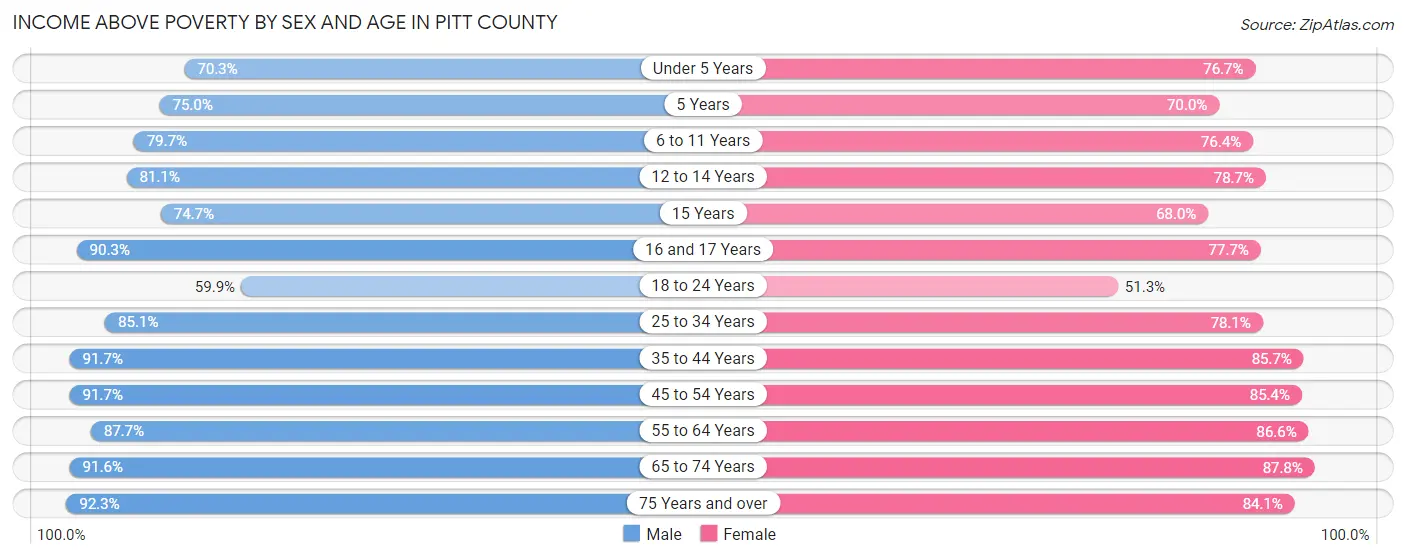
Income Above Poverty by Sex and Age in Pitt County
According to the poverty statistics in Pitt County, males aged 75 years and over and females aged 65 to 74 years are the age groups that are most secure financially, with 92.3% of males and 87.8% of females in these age groups living above the poverty line.
| Age Bracket | Male | Female |
| Under 5 Years | 3,398 (70.3%) | 3,490 (76.7%) |
| 5 Years | 745 (75.0%) | 769 (70.0%) |
| 6 to 11 Years | 4,783 (79.7%) | 4,346 (76.3%) |
| 12 to 14 Years | 2,799 (81.1%) | 2,290 (78.7%) |
| 15 Years | 697 (74.7%) | 714 (68.0%) |
| 16 and 17 Years | 2,047 (90.3%) | 1,547 (77.7%) |
| 18 to 24 Years | 6,864 (59.9%) | 6,637 (51.2%) |
| 25 to 34 Years | 9,449 (85.1%) | 9,679 (78.1%) |
| 35 to 44 Years | 8,563 (91.6%) | 9,042 (85.7%) |
| 45 to 54 Years | 8,149 (91.6%) | 8,418 (85.4%) |
| 55 to 64 Years | 7,515 (87.7%) | 8,839 (86.6%) |
| 65 to 74 Years | 6,094 (91.6%) | 7,003 (87.8%) |
| 75 Years and over | 3,218 (92.3%) | 4,545 (84.1%) |
| Total | 64,321 (82.5%) | 67,319 (77.7%) |
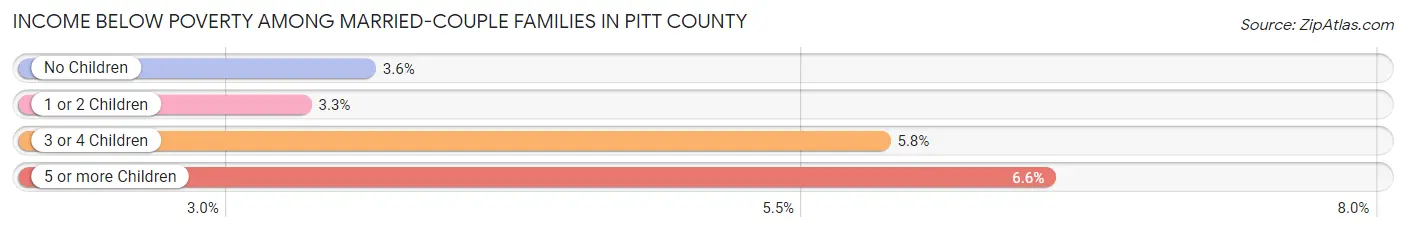
Income Below Poverty Among Married-Couple Families in Pitt County
The poverty statistics for married-couple families in Pitt County show that 3.7% or 948 of the total 25,613 families live below the poverty line. Families with 5 or more children have the highest poverty rate of 6.6%, comprising of 12 families. On the other hand, families with 1 or 2 children have the lowest poverty rate of 3.3%, which includes 273 families.
| Children | Above Poverty | Below Poverty |
| No Children | 14,703 (96.4%) | 549 (3.6%) |
| 1 or 2 Children | 7,952 (96.7%) | 273 (3.3%) |
| 3 or 4 Children | 1,839 (94.2%) | 114 (5.8%) |
| 5 or more Children | 171 (93.4%) | 12 (6.6%) |
| Total | 24,665 (96.3%) | 948 (3.7%) |
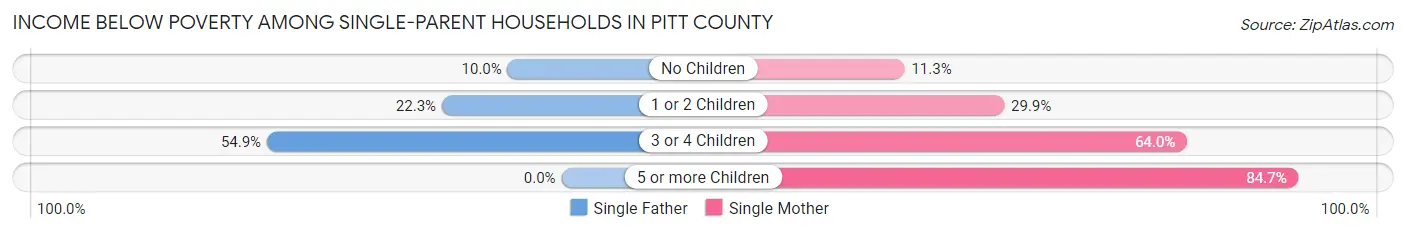
Income Below Poverty Among Single-Parent Households in Pitt County
According to the poverty data in Pitt County, 17.6% or 679 single-father households and 29.1% or 3,186 single-mother households are living below the poverty line. Among single-father households, those with 3 or 4 children have the highest poverty rate, with 96 households (54.9%) experiencing poverty. Likewise, among single-mother households, those with 5 or more children have the highest poverty rate, with 133 households (84.7%) falling below the poverty line.
| Children | Single Father | Single Mother |
| No Children | 187 (10.0%) | 391 (11.3%) |
| 1 or 2 Children | 396 (22.3%) | 1,774 (29.9%) |
| 3 or 4 Children | 96 (54.9%) | 888 (64.0%) |
| 5 or more Children | 0 (0.0%) | 133 (84.7%) |
| Total | 679 (17.6%) | 3,186 (29.1%) |
Income Below Poverty Among Married-Couple vs Single-Parent Households in Pitt County
The poverty data for Pitt County shows that 948 of the married-couple family households (3.7%) and 3,865 of the single-parent households (26.1%) are living below the poverty level. Within the married-couple family households, those with 5 or more children have the highest poverty rate, with 12 households (6.6%) falling below the poverty line. Among the single-parent households, those with 5 or more children have the highest poverty rate, with 133 household (70.0%) living below poverty.
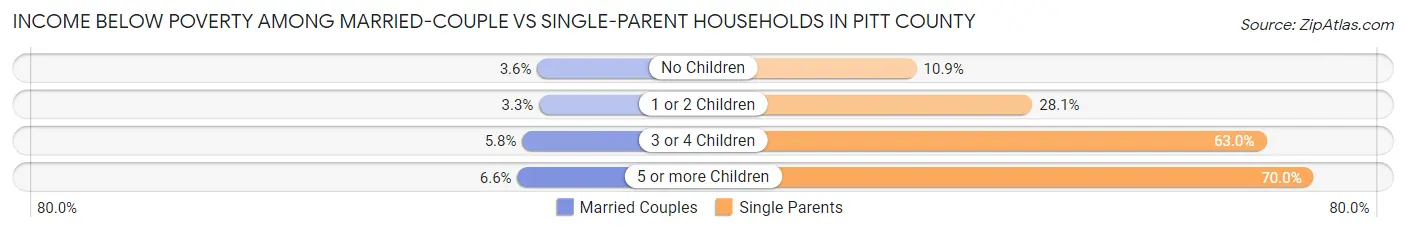
| Children | Married-Couple Families | Single-Parent Households |
| No Children | 549 (3.6%) | 578 (10.9%) |
| 1 or 2 Children | 273 (3.3%) | 2,170 (28.1%) |
| 3 or 4 Children | 114 (5.8%) | 984 (63.0%) |
| 5 or more Children | 12 (6.6%) | 133 (70.0%) |
| Total | 948 (3.7%) | 3,865 (26.1%) |
Employment Characteristics in Pitt County
Employment by Class of Employer in Pitt County
Among the 80,221 employed individuals in Pitt County, private company employees (51,102 | 63.7%), state government employees (7,957 | 9.9%), and not-for-profit organizations (7,633 | 9.5%) make up the most common classes of employment.
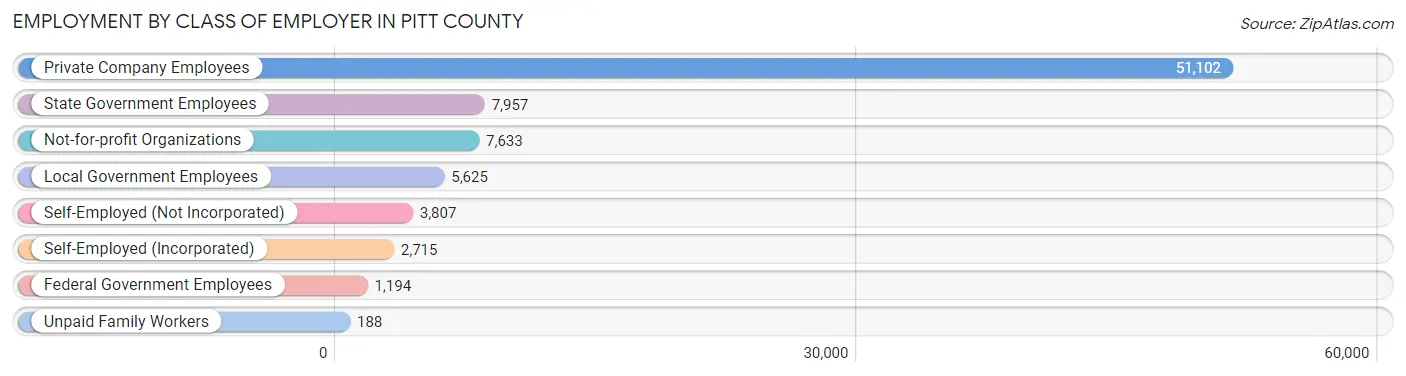
| Employer Class | # Employees | % Employees |
| Private Company Employees | 51,102 | 63.7% |
| Self-Employed (Incorporated) | 2,715 | 3.4% |
| Self-Employed (Not Incorporated) | 3,807 | 4.8% |
| Not-for-profit Organizations | 7,633 | 9.5% |
| Local Government Employees | 5,625 | 7.0% |
| State Government Employees | 7,957 | 9.9% |
| Federal Government Employees | 1,194 | 1.5% |
| Unpaid Family Workers | 188 | 0.2% |
| Total | 80,221 | 100.0% |
Employment Status by Age in Pitt County
According to the labor force statistics for Pitt County, out of the total population over 16 years of age (139,169), 63.2% or 87,955 individuals are in the labor force, with 7.5% or 6,597 of them unemployed. The age group with the highest labor force participation rate is 35 to 44 years, with 86.3% or 17,257 individuals in the labor force. Within the labor force, the 75 years and over age range has the highest percentage of unemployed individuals, with 17.1% or 94 of them being unemployed.
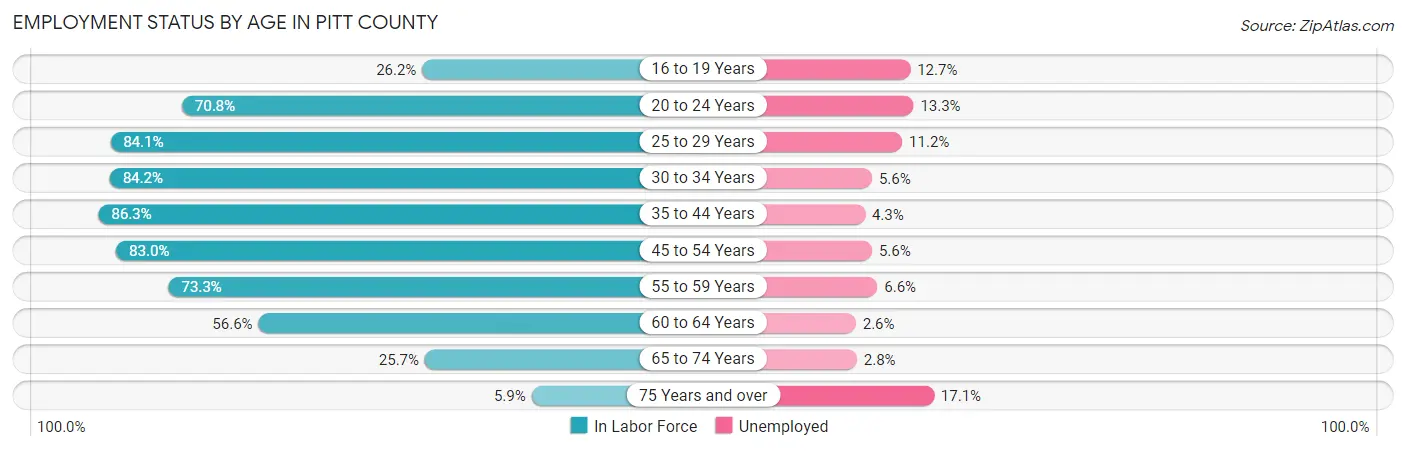
| Age Bracket | In Labor Force | Unemployed |
| 16 to 19 Years | 3,120 (26.2%) | 396 (12.7%) |
| 20 to 24 Years | 15,500 (70.8%) | 2,062 (13.3%) |
| 25 to 29 Years | 10,656 (84.1%) | 1,193 (11.2%) |
| 30 to 34 Years | 9,185 (84.2%) | 514 (5.6%) |
| 35 to 44 Years | 17,257 (86.3%) | 742 (4.3%) |
| 45 to 54 Years | 15,616 (83.0%) | 874 (5.6%) |
| 55 to 59 Years | 6,924 (73.3%) | 457 (6.6%) |
| 60 to 64 Years | 5,353 (56.6%) | 139 (2.6%) |
| 65 to 74 Years | 3,803 (25.7%) | 106 (2.8%) |
| 75 Years and over | 547 (5.9%) | 94 (17.1%) |
| Total | 87,955 (63.2%) | 6,597 (7.5%) |
Employment Status by Educational Attainment in Pitt County
According to labor force statistics for Pitt County, 80.0% of individuals (65,035) out of the total population between 25 and 64 years of age (81,294) are in the labor force, with 6.0% or 3,902 of them being unemployed. The group with the highest labor force participation rate are those with the educational attainment of bachelor's degree or higher, with 86.3% or 24,699 individuals in the labor force. Within the labor force, individuals with high school diploma education have the highest percentage of unemployment, with 10.8% or 1,513 of them being unemployed.
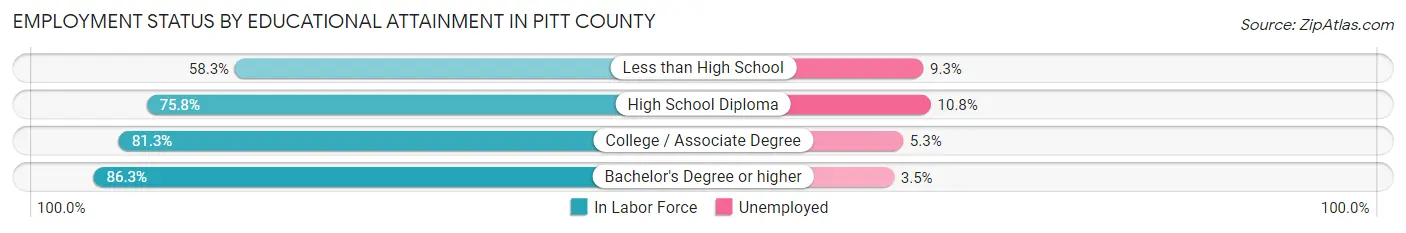
| Educational Attainment | In Labor Force | Unemployed |
| Less than High School | 3,819 (58.3%) | 609 (9.3%) |
| High School Diploma | 14,007 (75.8%) | 1,996 (10.8%) |
| College / Associate Degree | 22,475 (81.3%) | 1,465 (5.3%) |
| Bachelor's Degree or higher | 24,699 (86.3%) | 1,002 (3.5%) |
| Total | 65,035 (80.0%) | 4,878 (6.0%) |
Employment Occupations by Sex in Pitt County
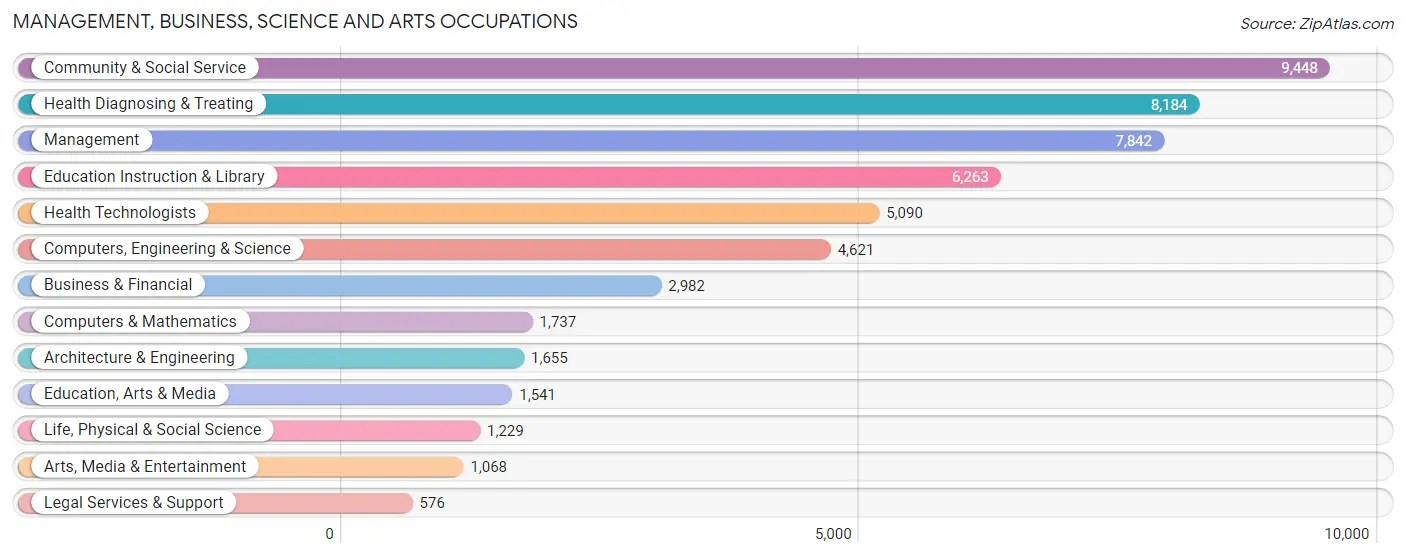
Management, Business, Science and Arts Occupations
The most common Management, Business, Science and Arts occupations in Pitt County are Community & Social Service (9,448 | 11.7%), Health Diagnosing & Treating (8,184 | 10.1%), Management (7,842 | 9.7%), Education Instruction & Library (6,263 | 7.7%), and Health Technologists (5,090 | 6.3%).
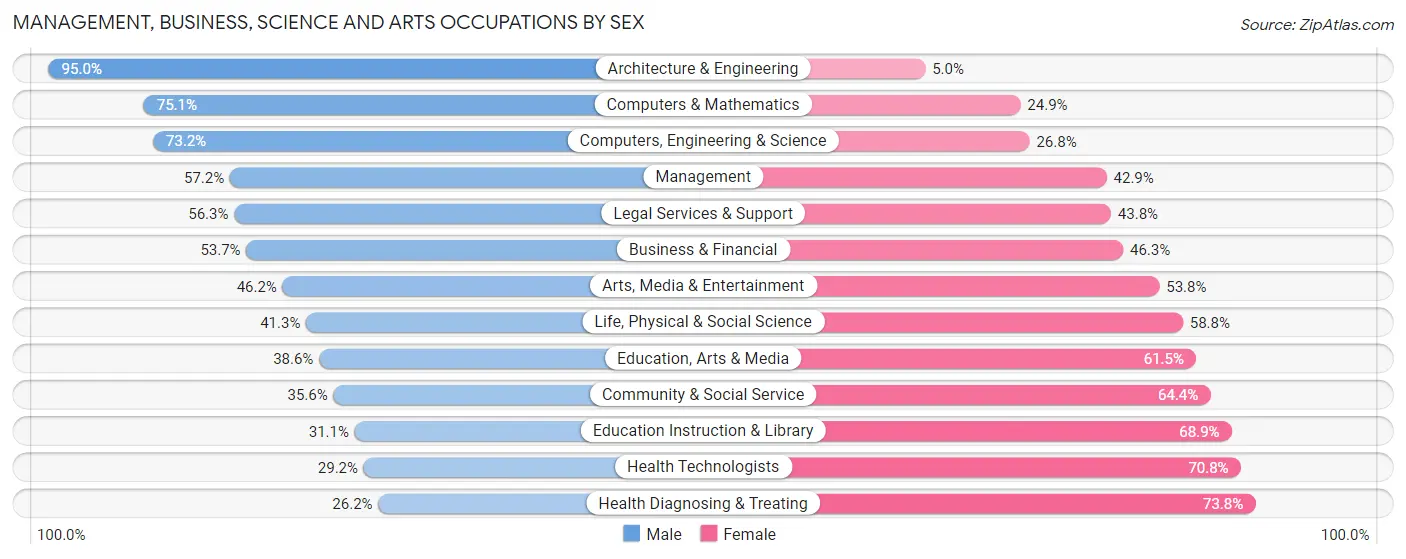
Management, Business, Science and Arts Occupations by Sex
Within the Management, Business, Science and Arts occupations in Pitt County, the most male-oriented occupations are Architecture & Engineering (95.0%), Computers & Mathematics (75.1%), and Computers, Engineering & Science (73.2%), while the most female-oriented occupations are Health Diagnosing & Treating (73.8%), Health Technologists (70.8%), and Education Instruction & Library (68.9%).
| Occupation | Male | Female |
| Management | 4,482 (57.2%) | 3,360 (42.8%) |
| Business & Financial | 1,602 (53.7%) | 1,380 (46.3%) |
| Computers, Engineering & Science | 3,384 (73.2%) | 1,237 (26.8%) |
| Computers & Mathematics | 1,305 (75.1%) | 432 (24.9%) |
| Architecture & Engineering | 1,572 (95.0%) | 83 (5.0%) |
| Life, Physical & Social Science | 507 (41.2%) | 722 (58.8%) |
| Community & Social Service | 3,360 (35.6%) | 6,088 (64.4%) |
| Education, Arts & Media | 594 (38.6%) | 947 (61.5%) |
| Legal Services & Support | 324 (56.2%) | 252 (43.8%) |
| Education Instruction & Library | 1,949 (31.1%) | 4,314 (68.9%) |
| Arts, Media & Entertainment | 493 (46.2%) | 575 (53.8%) |
| Health Diagnosing & Treating | 2,143 (26.2%) | 6,041 (73.8%) |
| Health Technologists | 1,488 (29.2%) | 3,602 (70.8%) |
| Total (Category) | 14,971 (45.3%) | 18,106 (54.7%) |
| Total (Overall) | 41,122 (50.9%) | 39,731 (49.1%) |
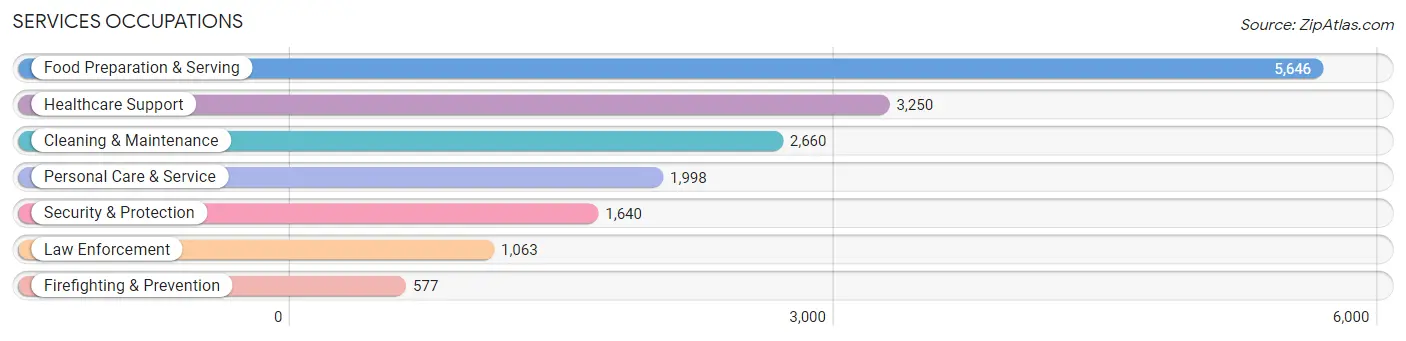
Services Occupations
The most common Services occupations in Pitt County are Food Preparation & Serving (5,646 | 7.0%), Healthcare Support (3,250 | 4.0%), Cleaning & Maintenance (2,660 | 3.3%), Personal Care & Service (1,998 | 2.5%), and Security & Protection (1,640 | 2.0%).
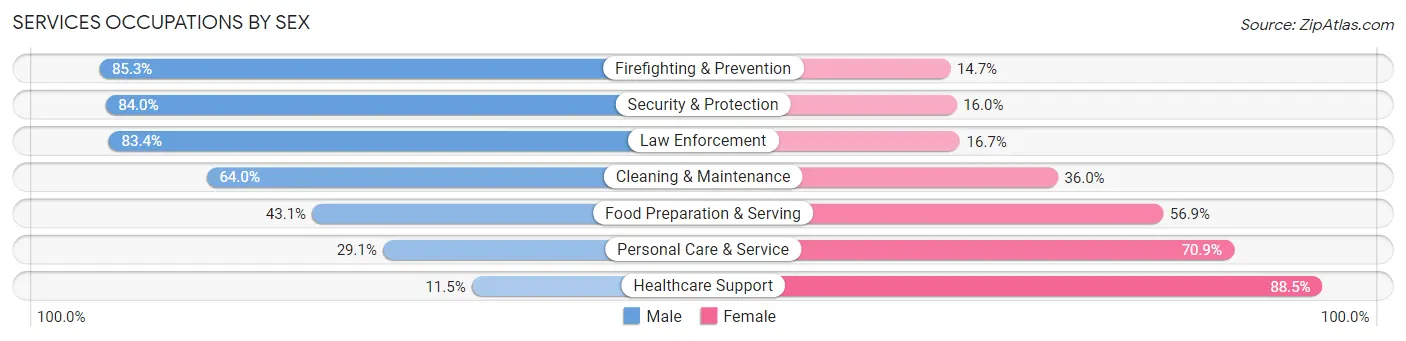
Services Occupations by Sex
Within the Services occupations in Pitt County, the most male-oriented occupations are Firefighting & Prevention (85.3%), Security & Protection (84.0%), and Law Enforcement (83.4%), while the most female-oriented occupations are Healthcare Support (88.5%), Personal Care & Service (70.9%), and Food Preparation & Serving (56.9%).
| Occupation | Male | Female |
| Healthcare Support | 374 (11.5%) | 2,876 (88.5%) |
| Security & Protection | 1,378 (84.0%) | 262 (16.0%) |
| Firefighting & Prevention | 492 (85.3%) | 85 (14.7%) |
| Law Enforcement | 886 (83.4%) | 177 (16.7%) |
| Food Preparation & Serving | 2,434 (43.1%) | 3,212 (56.9%) |
| Cleaning & Maintenance | 1,702 (64.0%) | 958 (36.0%) |
| Personal Care & Service | 581 (29.1%) | 1,417 (70.9%) |
| Total (Category) | 6,469 (42.6%) | 8,725 (57.4%) |
| Total (Overall) | 41,122 (50.9%) | 39,731 (49.1%) |
Sales and Office Occupations
The most common Sales and Office occupations in Pitt County are Office & Administration (8,349 | 10.3%), and Sales & Related (7,740 | 9.6%).

Sales and Office Occupations by Sex
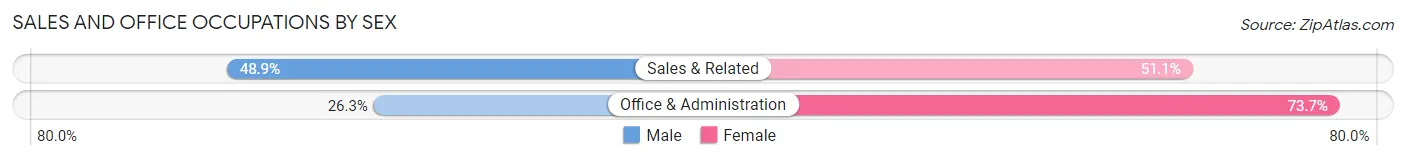
| Occupation | Male | Female |
| Sales & Related | 3,784 (48.9%) | 3,956 (51.1%) |
| Office & Administration | 2,195 (26.3%) | 6,154 (73.7%) |
| Total (Category) | 5,979 (37.2%) | 10,110 (62.8%) |
| Total (Overall) | 41,122 (50.9%) | 39,731 (49.1%) |
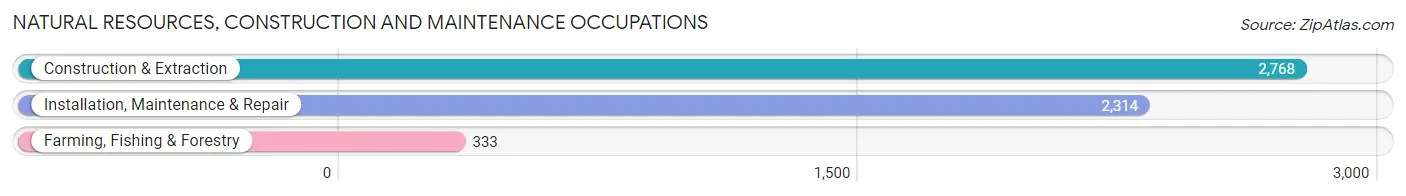
Natural Resources, Construction and Maintenance Occupations
The most common Natural Resources, Construction and Maintenance occupations in Pitt County are Construction & Extraction (2,768 | 3.4%), Installation, Maintenance & Repair (2,314 | 2.9%), and Farming, Fishing & Forestry (333 | 0.4%).
Natural Resources, Construction and Maintenance Occupations by Sex

| Occupation | Male | Female |
| Farming, Fishing & Forestry | 182 (54.6%) | 151 (45.4%) |
| Construction & Extraction | 2,636 (95.2%) | 132 (4.8%) |
| Installation, Maintenance & Repair | 2,215 (95.7%) | 99 (4.3%) |
| Total (Category) | 5,033 (92.9%) | 382 (7.0%) |
| Total (Overall) | 41,122 (50.9%) | 39,731 (49.1%) |
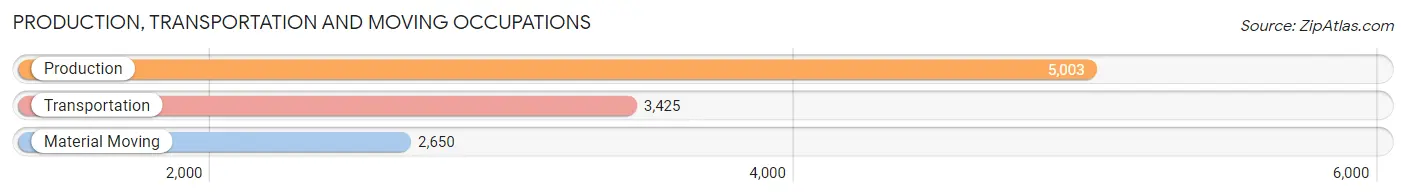
Production, Transportation and Moving Occupations
The most common Production, Transportation and Moving occupations in Pitt County are Production (5,003 | 6.2%), Transportation (3,425 | 4.2%), and Material Moving (2,650 | 3.3%).
Production, Transportation and Moving Occupations by Sex
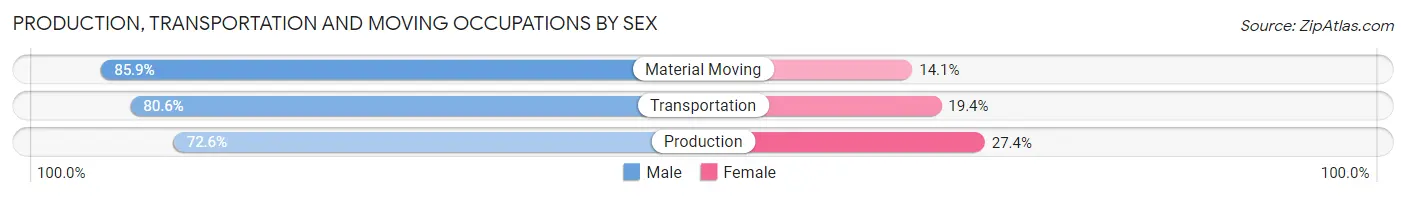
| Occupation | Male | Female |
| Production | 3,633 (72.6%) | 1,370 (27.4%) |
| Transportation | 2,760 (80.6%) | 665 (19.4%) |
| Material Moving | 2,277 (85.9%) | 373 (14.1%) |
| Total (Category) | 8,670 (78.3%) | 2,408 (21.7%) |
| Total (Overall) | 41,122 (50.9%) | 39,731 (49.1%) |
Employment Industries by Sex in Pitt County
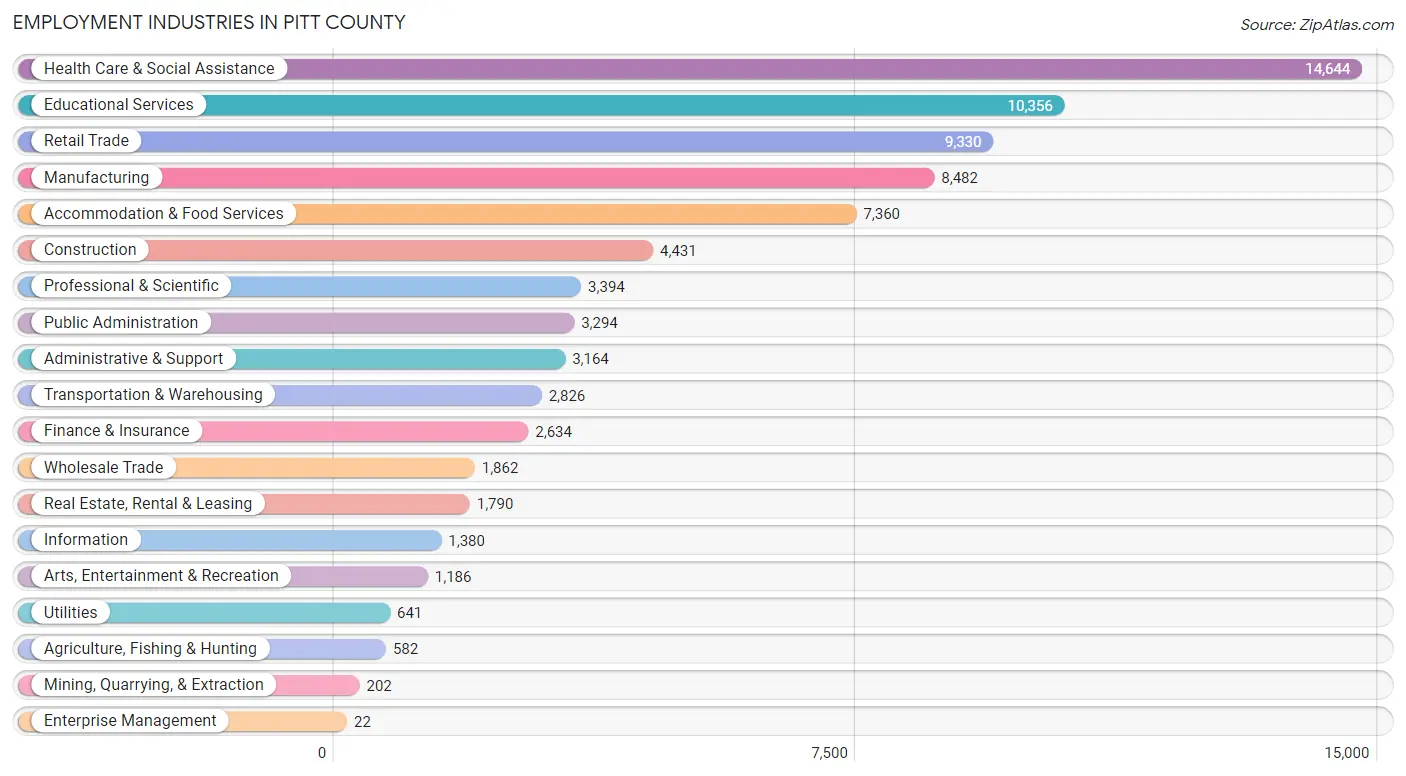
Employment Industries in Pitt County
The major employment industries in Pitt County include Health Care & Social Assistance (14,644 | 18.1%), Educational Services (10,356 | 12.8%), Retail Trade (9,330 | 11.5%), Manufacturing (8,482 | 10.5%), and Accommodation & Food Services (7,360 | 9.1%).
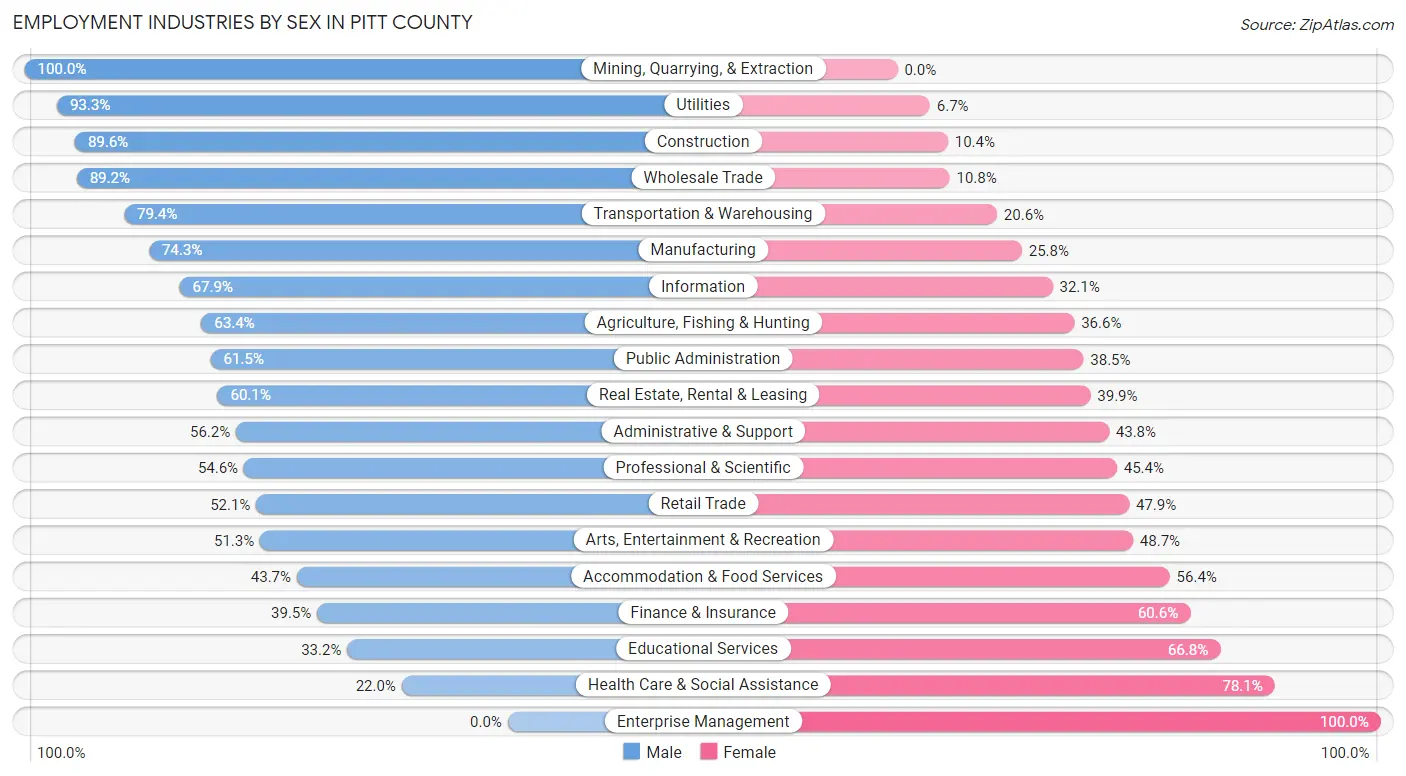
Employment Industries by Sex in Pitt County
The Pitt County industries that see more men than women are Mining, Quarrying, & Extraction (100.0%), Utilities (93.3%), and Construction (89.6%), whereas the industries that tend to have a higher number of women are Enterprise Management (100.0%), Health Care & Social Assistance (78.0%), and Educational Services (66.8%).
| Industry | Male | Female |
| Agriculture, Fishing & Hunting | 369 (63.4%) | 213 (36.6%) |
| Mining, Quarrying, & Extraction | 202 (100.0%) | 0 (0.0%) |
| Construction | 3,969 (89.6%) | 462 (10.4%) |
| Manufacturing | 6,298 (74.3%) | 2,184 (25.8%) |
| Wholesale Trade | 1,661 (89.2%) | 201 (10.8%) |
| Retail Trade | 4,857 (52.1%) | 4,473 (47.9%) |
| Transportation & Warehousing | 2,244 (79.4%) | 582 (20.6%) |
| Utilities | 598 (93.3%) | 43 (6.7%) |
| Information | 937 (67.9%) | 443 (32.1%) |
| Finance & Insurance | 1,039 (39.5%) | 1,595 (60.6%) |
| Real Estate, Rental & Leasing | 1,075 (60.1%) | 715 (39.9%) |
| Professional & Scientific | 1,853 (54.6%) | 1,541 (45.4%) |
| Enterprise Management | 0 (0.0%) | 22 (100.0%) |
| Administrative & Support | 1,779 (56.2%) | 1,385 (43.8%) |
| Educational Services | 3,440 (33.2%) | 6,916 (66.8%) |
| Health Care & Social Assistance | 3,214 (22.0%) | 11,430 (78.0%) |
| Arts, Entertainment & Recreation | 608 (51.3%) | 578 (48.7%) |
| Accommodation & Food Services | 3,213 (43.6%) | 4,147 (56.4%) |
| Public Administration | 2,026 (61.5%) | 1,268 (38.5%) |
| Total | 41,122 (50.9%) | 39,731 (49.1%) |
Education in Pitt County
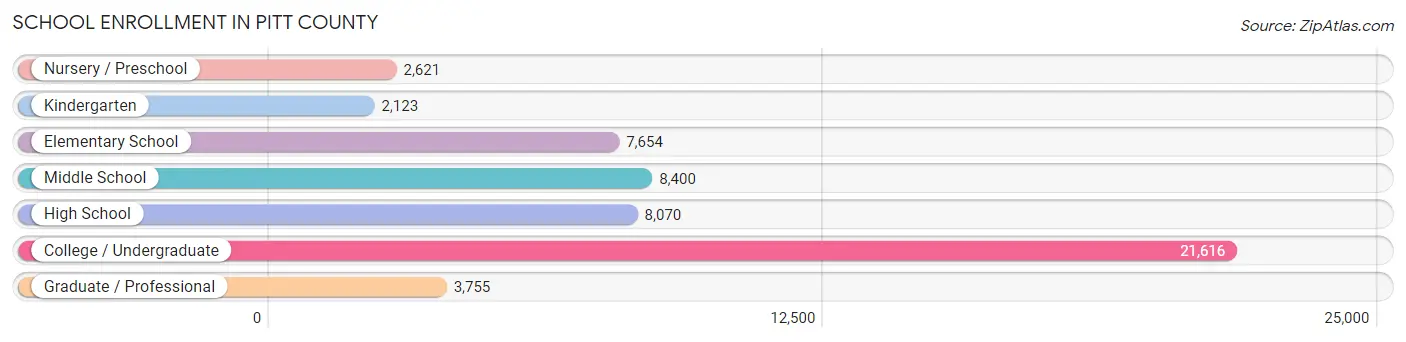
School Enrollment in Pitt County
The most common levels of schooling among the 54,239 students in Pitt County are college / undergraduate (21,616 | 39.9%), middle school (8,400 | 15.5%), and high school (8,070 | 14.9%).
| School Level | # Students | % Students |
| Nursery / Preschool | 2,621 | 4.8% |
| Kindergarten | 2,123 | 3.9% |
| Elementary School | 7,654 | 14.1% |
| Middle School | 8,400 | 15.5% |
| High School | 8,070 | 14.9% |
| College / Undergraduate | 21,616 | 39.9% |
| Graduate / Professional | 3,755 | 6.9% |
| Total | 54,239 | 100.0% |
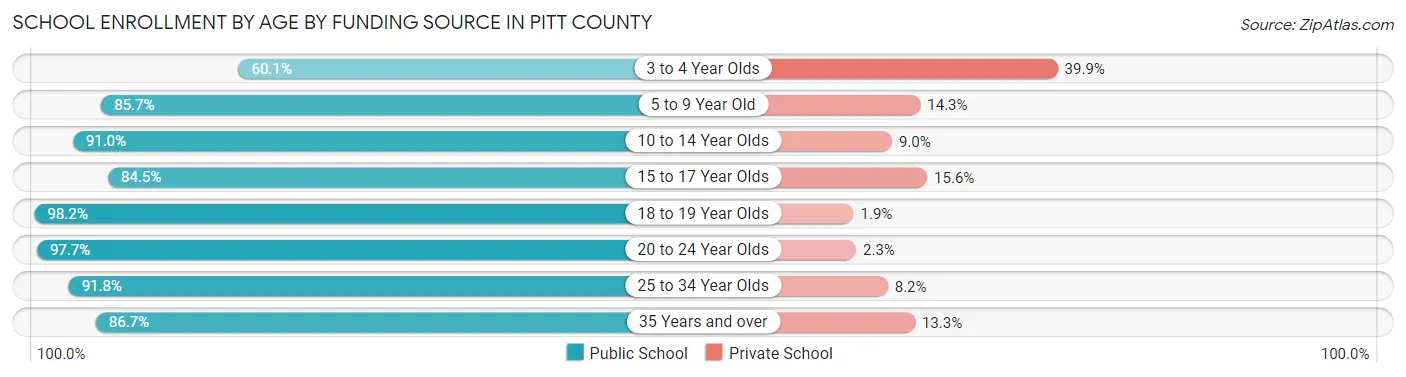
School Enrollment by Age by Funding Source in Pitt County
Out of a total of 54,239 students who are enrolled in schools in Pitt County, 5,153 (9.5%) attend a private institution, while the remaining 49,086 (90.5%) are enrolled in public schools. The age group of 3 to 4 year olds has the highest likelihood of being enrolled in private schools, with 859 (39.9% in the age bracket) enrolled. Conversely, the age group of 18 to 19 year olds has the lowest likelihood of being enrolled in a private school, with 6,800 (98.2% in the age bracket) attending a public institution.
| Age Bracket | Public School | Private School |
| 3 to 4 Year Olds | 1,296 (60.1%) | 859 (39.9%) |
| 5 to 9 Year Old | 7,473 (85.7%) | 1,245 (14.3%) |
| 10 to 14 Year Olds | 9,801 (91.0%) | 969 (9.0%) |
| 15 to 17 Year Olds | 5,159 (84.5%) | 950 (15.5%) |
| 18 to 19 Year Olds | 6,800 (98.2%) | 128 (1.8%) |
| 20 to 24 Year Olds | 12,654 (97.7%) | 299 (2.3%) |
| 25 to 34 Year Olds | 3,575 (91.8%) | 320 (8.2%) |
| 35 Years and over | 2,351 (86.7%) | 360 (13.3%) |
| Total | 49,086 (90.5%) | 5,153 (9.5%) |
Educational Attainment by Field of Study in Pitt County
Science & technology (5,802 | 15.6%), business (5,592 | 15.0%), education (4,889 | 13.1%), arts & humanities (3,631 | 9.8%), and bio, nature & agricultural (3,474 | 9.3%) are the most common fields of study among 37,223 individuals in Pitt County who have obtained a bachelor's degree or higher.
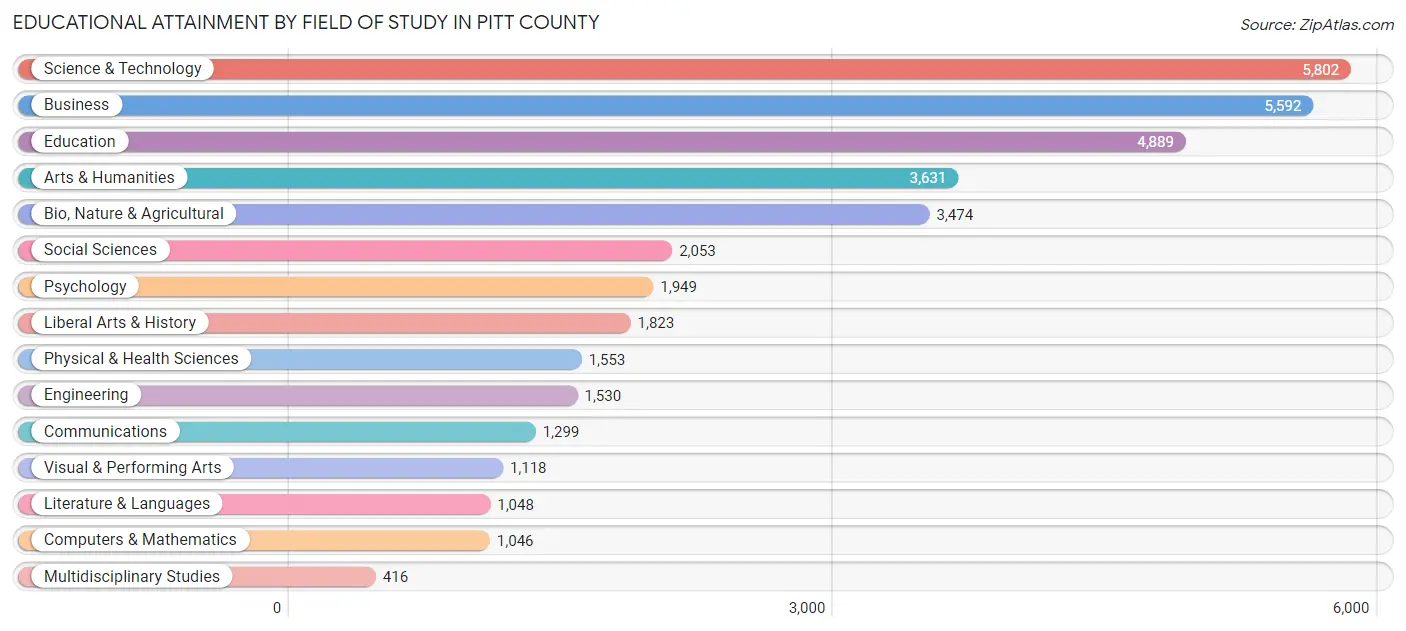
| Field of Study | # Graduates | % Graduates |
| Computers & Mathematics | 1,046 | 2.8% |
| Bio, Nature & Agricultural | 3,474 | 9.3% |
| Physical & Health Sciences | 1,553 | 4.2% |
| Psychology | 1,949 | 5.2% |
| Social Sciences | 2,053 | 5.5% |
| Engineering | 1,530 | 4.1% |
| Multidisciplinary Studies | 416 | 1.1% |
| Science & Technology | 5,802 | 15.6% |
| Business | 5,592 | 15.0% |
| Education | 4,889 | 13.1% |
| Literature & Languages | 1,048 | 2.8% |
| Liberal Arts & History | 1,823 | 4.9% |
| Visual & Performing Arts | 1,118 | 3.0% |
| Communications | 1,299 | 3.5% |
| Arts & Humanities | 3,631 | 9.8% |
| Total | 37,223 | 100.0% |
Transportation & Commute in Pitt County
Vehicle Availability by Sex in Pitt County
The most prevalent vehicle ownership categories in Pitt County are males with 2 vehicles (17,604, accounting for 43.1%) and females with 2 vehicles (15,958, making up 44.8%).
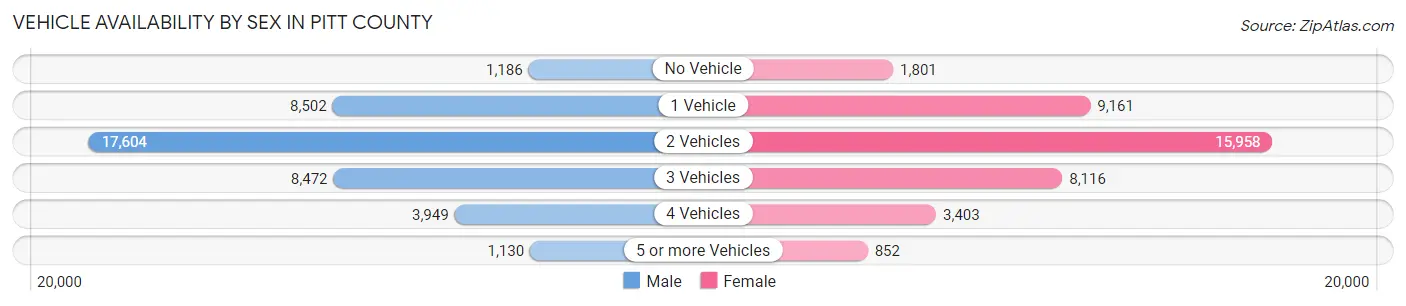
| Vehicles Available | Male | Female |
| No Vehicle | 1,186 (2.9%) | 1,801 (4.6%) |
| 1 Vehicle | 8,502 (20.8%) | 9,161 (23.3%) |
| 2 Vehicles | 17,604 (43.1%) | 15,958 (40.6%) |
| 3 Vehicles | 8,472 (20.7%) | 8,116 (20.7%) |
| 4 Vehicles | 3,949 (9.7%) | 3,403 (8.7%) |
| 5 or more Vehicles | 1,130 (2.8%) | 852 (2.2%) |
| Total | 40,843 (100.0%) | 39,291 (100.0%) |
Commute Time in Pitt County
The most frequently occuring commute durations in Pitt County are 15 to 19 minutes (15,438 commuters, 21.2%), 10 to 14 minutes (14,925 commuters, 20.5%), and 20 to 24 minutes (10,598 commuters, 14.5%).
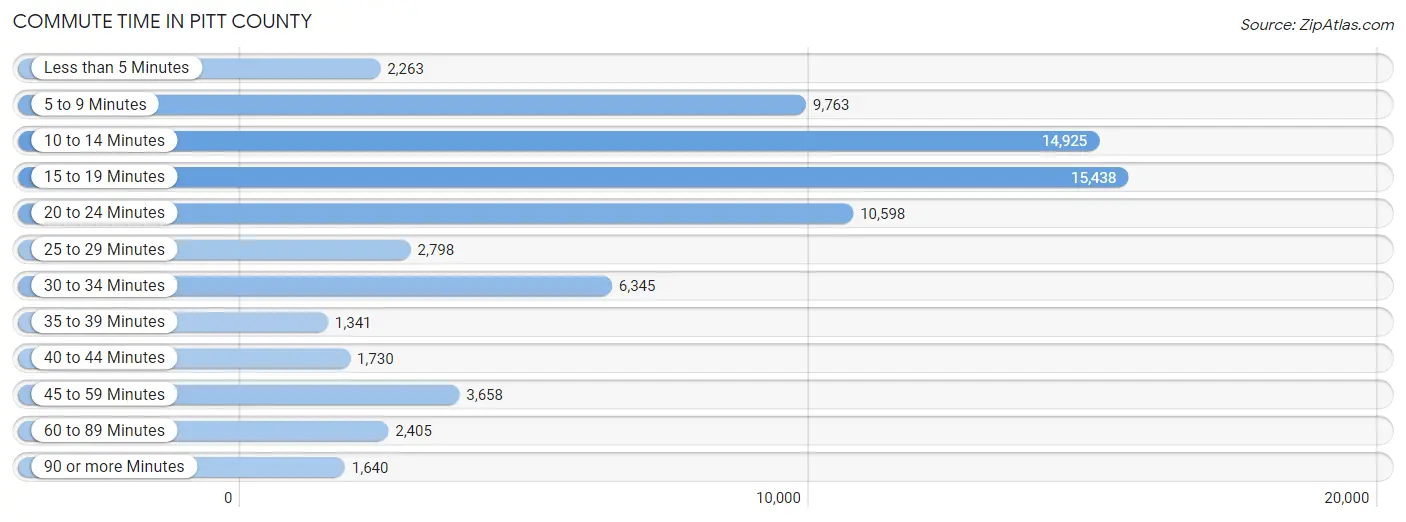
| Commute Time | # Commuters | % Commuters |
| Less than 5 Minutes | 2,263 | 3.1% |
| 5 to 9 Minutes | 9,763 | 13.4% |
| 10 to 14 Minutes | 14,925 | 20.5% |
| 15 to 19 Minutes | 15,438 | 21.2% |
| 20 to 24 Minutes | 10,598 | 14.5% |
| 25 to 29 Minutes | 2,798 | 3.8% |
| 30 to 34 Minutes | 6,345 | 8.7% |
| 35 to 39 Minutes | 1,341 | 1.8% |
| 40 to 44 Minutes | 1,730 | 2.4% |
| 45 to 59 Minutes | 3,658 | 5.0% |
| 60 to 89 Minutes | 2,405 | 3.3% |
| 90 or more Minutes | 1,640 | 2.2% |
Commute Time by Sex in Pitt County
The most common commute times in Pitt County are 15 to 19 minutes (7,919 commuters, 21.4%) for males and 10 to 14 minutes (8,783 commuters, 24.4%) for females.
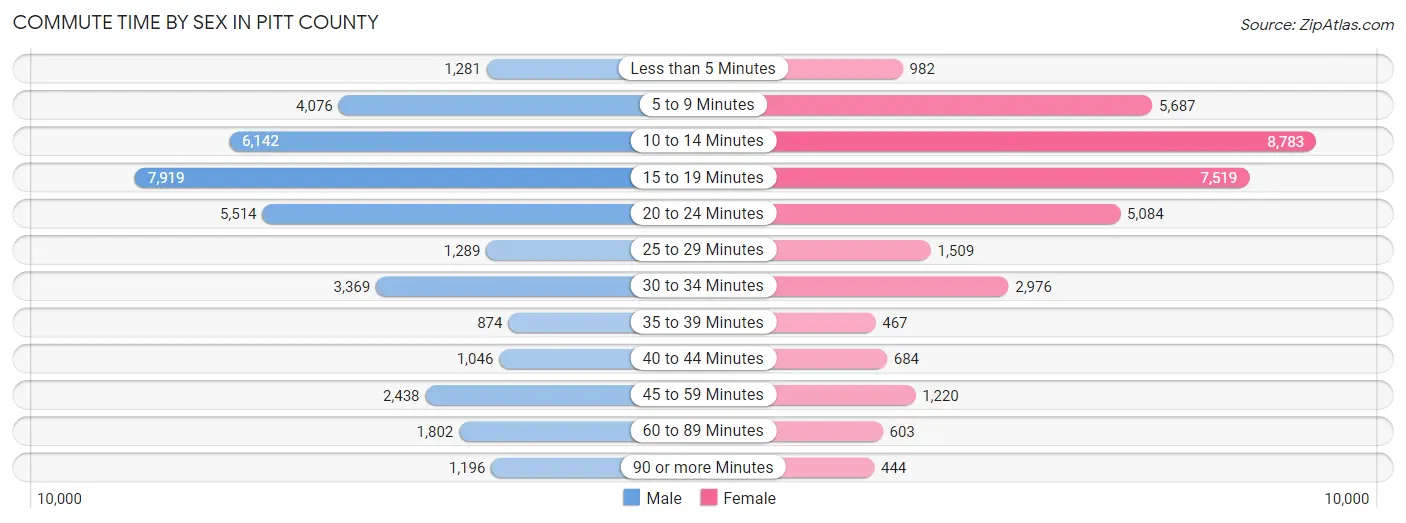
| Commute Time | Male | Female |
| Less than 5 Minutes | 1,281 (3.5%) | 982 (2.7%) |
| 5 to 9 Minutes | 4,076 (11.0%) | 5,687 (15.8%) |
| 10 to 14 Minutes | 6,142 (16.6%) | 8,783 (24.4%) |
| 15 to 19 Minutes | 7,919 (21.4%) | 7,519 (20.9%) |
| 20 to 24 Minutes | 5,514 (14.9%) | 5,084 (14.1%) |
| 25 to 29 Minutes | 1,289 (3.5%) | 1,509 (4.2%) |
| 30 to 34 Minutes | 3,369 (9.1%) | 2,976 (8.3%) |
| 35 to 39 Minutes | 874 (2.4%) | 467 (1.3%) |
| 40 to 44 Minutes | 1,046 (2.8%) | 684 (1.9%) |
| 45 to 59 Minutes | 2,438 (6.6%) | 1,220 (3.4%) |
| 60 to 89 Minutes | 1,802 (4.9%) | 603 (1.7%) |
| 90 or more Minutes | 1,196 (3.2%) | 444 (1.2%) |
Time of Departure to Work by Sex in Pitt County
The most frequent times of departure to work in Pitt County are 7:30 AM to 7:59 AM (4,869, 13.2%) for males and 7:30 AM to 7:59 AM (5,985, 16.6%) for females.
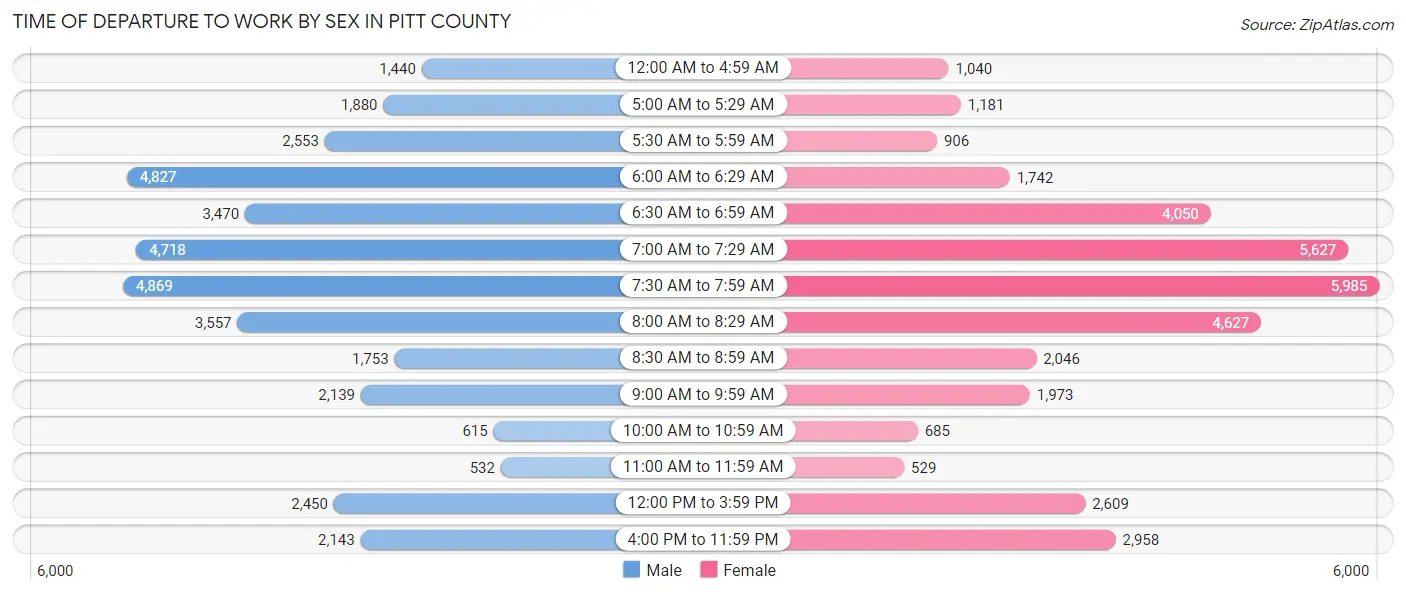
| Time of Departure | Male | Female |
| 12:00 AM to 4:59 AM | 1,440 (3.9%) | 1,040 (2.9%) |
| 5:00 AM to 5:29 AM | 1,880 (5.1%) | 1,181 (3.3%) |
| 5:30 AM to 5:59 AM | 2,553 (6.9%) | 906 (2.5%) |
| 6:00 AM to 6:29 AM | 4,827 (13.1%) | 1,742 (4.8%) |
| 6:30 AM to 6:59 AM | 3,470 (9.4%) | 4,050 (11.3%) |
| 7:00 AM to 7:29 AM | 4,718 (12.8%) | 5,627 (15.7%) |
| 7:30 AM to 7:59 AM | 4,869 (13.2%) | 5,985 (16.6%) |
| 8:00 AM to 8:29 AM | 3,557 (9.6%) | 4,627 (12.9%) |
| 8:30 AM to 8:59 AM | 1,753 (4.7%) | 2,046 (5.7%) |
| 9:00 AM to 9:59 AM | 2,139 (5.8%) | 1,973 (5.5%) |
| 10:00 AM to 10:59 AM | 615 (1.7%) | 685 (1.9%) |
| 11:00 AM to 11:59 AM | 532 (1.4%) | 529 (1.5%) |
| 12:00 PM to 3:59 PM | 2,450 (6.6%) | 2,609 (7.3%) |
| 4:00 PM to 11:59 PM | 2,143 (5.8%) | 2,958 (8.2%) |
| Total | 36,946 (100.0%) | 35,958 (100.0%) |
Housing Occupancy in Pitt County
Occupancy by Ownership in Pitt County
Of the total 72,153 dwellings in Pitt County, owner-occupied units account for 36,960 (51.2%), while renter-occupied units make up 35,193 (48.8%).
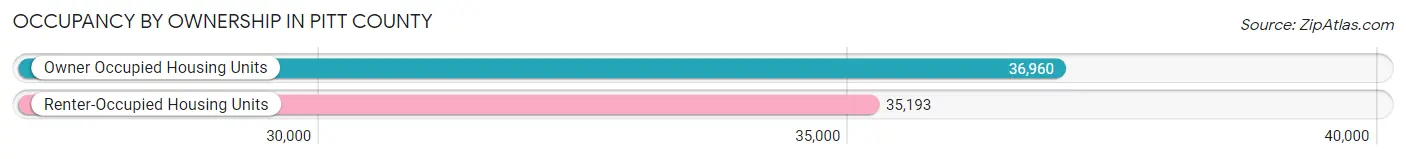
| Occupancy | # Housing Units | % Housing Units |
| Owner Occupied Housing Units | 36,960 | 51.2% |
| Renter-Occupied Housing Units | 35,193 | 48.8% |
| Total Occupied Housing Units | 72,153 | 100.0% |
Occupancy by Household Size in Pitt County
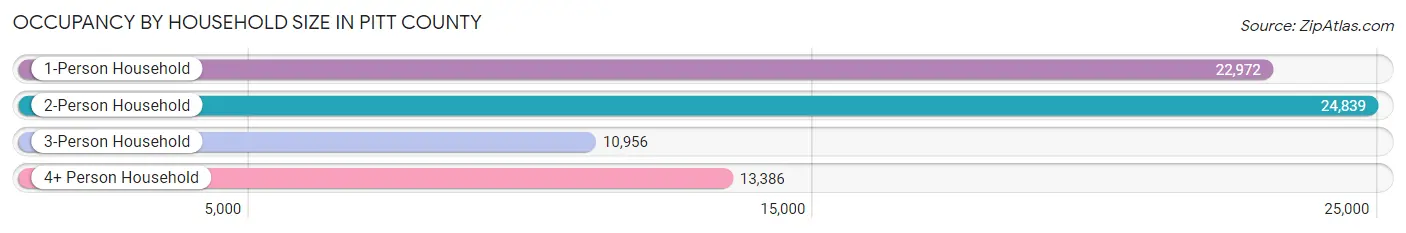
| Household Size | # Housing Units | % Housing Units |
| 1-Person Household | 22,972 | 31.8% |
| 2-Person Household | 24,839 | 34.4% |
| 3-Person Household | 10,956 | 15.2% |
| 4+ Person Household | 13,386 | 18.5% |
| Total Housing Units | 72,153 | 100.0% |
Occupancy by Ownership by Household Size in Pitt County
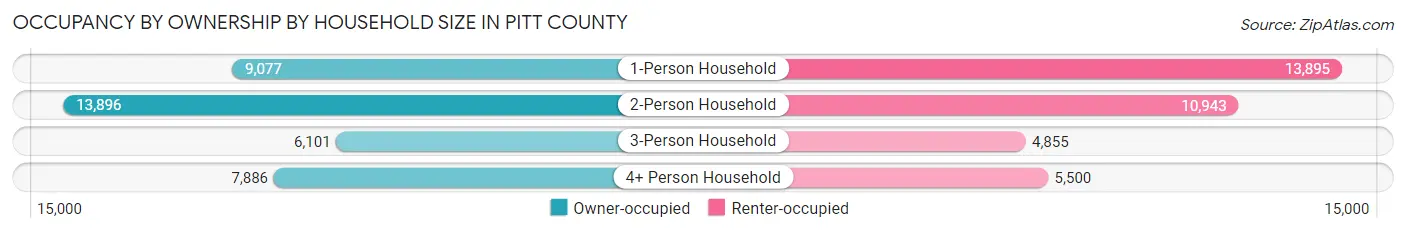
| Household Size | Owner-occupied | Renter-occupied |
| 1-Person Household | 9,077 (39.5%) | 13,895 (60.5%) |
| 2-Person Household | 13,896 (55.9%) | 10,943 (44.1%) |
| 3-Person Household | 6,101 (55.7%) | 4,855 (44.3%) |
| 4+ Person Household | 7,886 (58.9%) | 5,500 (41.1%) |
| Total Housing Units | 36,960 (51.2%) | 35,193 (48.8%) |
Occupancy by Educational Attainment in Pitt County
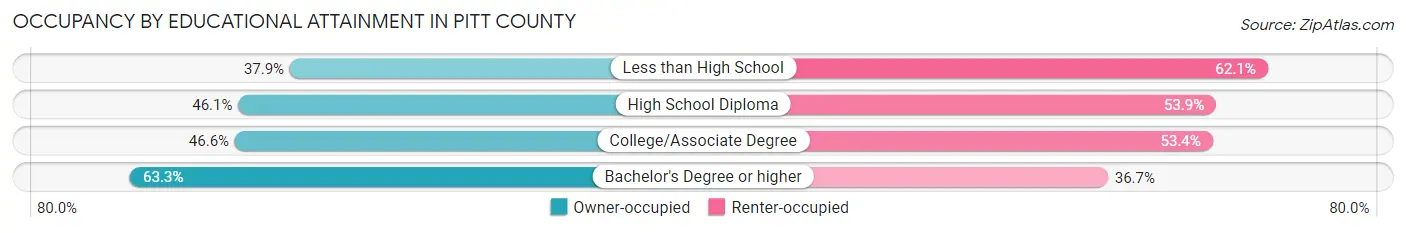
| Household Size | Owner-occupied | Renter-occupied |
| Less than High School | 2,449 (37.9%) | 4,011 (62.1%) |
| High School Diploma | 7,388 (46.1%) | 8,639 (53.9%) |
| College/Associate Degree | 12,053 (46.6%) | 13,789 (53.4%) |
| Bachelor's Degree or higher | 15,070 (63.3%) | 8,754 (36.7%) |
Occupancy by Age of Householder in Pitt County
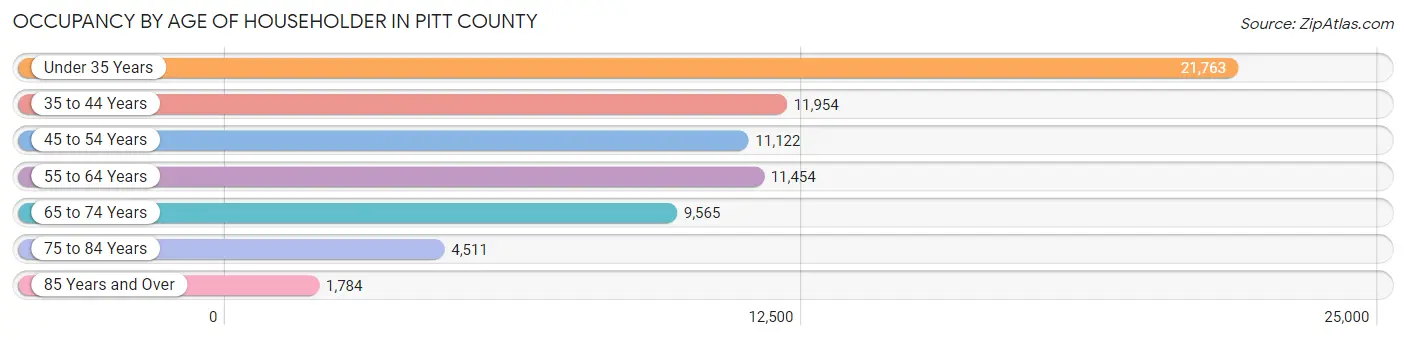
| Age Bracket | # Households | % Households |
| Under 35 Years | 21,763 | 30.2% |
| 35 to 44 Years | 11,954 | 16.6% |
| 45 to 54 Years | 11,122 | 15.4% |
| 55 to 64 Years | 11,454 | 15.9% |
| 65 to 74 Years | 9,565 | 13.3% |
| 75 to 84 Years | 4,511 | 6.2% |
| 85 Years and Over | 1,784 | 2.5% |
| Total | 72,153 | 100.0% |
Housing Finances in Pitt County
Median Income by Occupancy in Pitt County
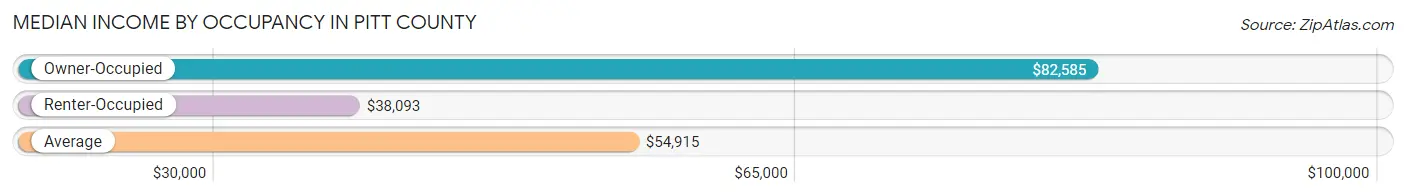
| Occupancy Type | # Households | Median Income |
| Owner-Occupied | 36,960 (51.2%) | $82,585 |
| Renter-Occupied | 35,193 (48.8%) | $38,093 |
| Average | 72,153 (100.0%) | $54,915 |
Occupancy by Householder Income Bracket in Pitt County
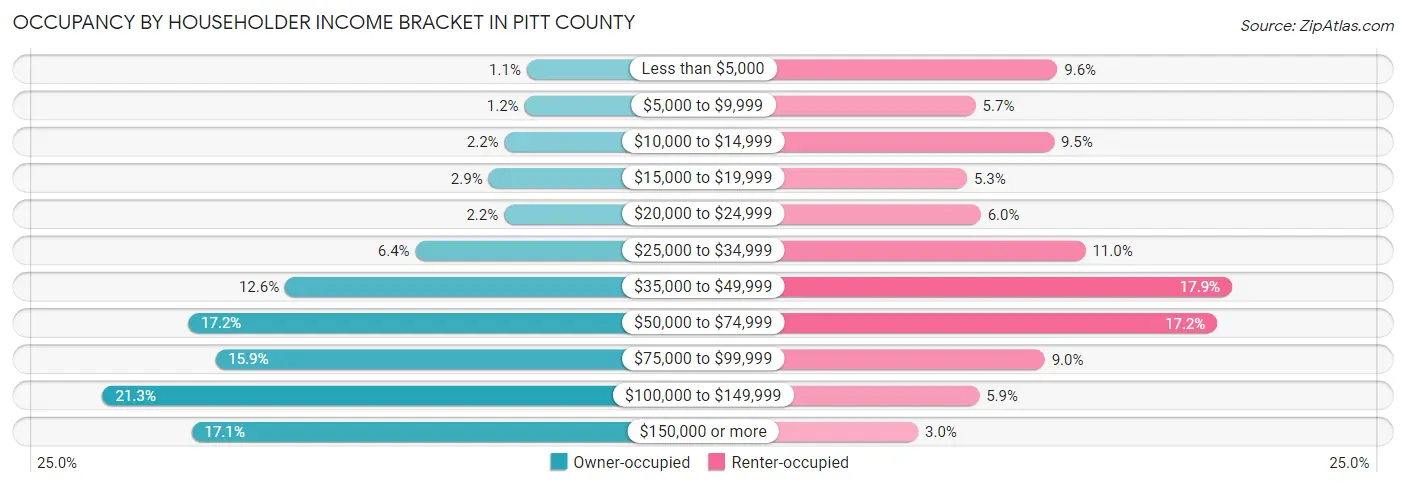
| Income Bracket | Owner-occupied | Renter-occupied |
| Less than $5,000 | 403 (1.1%) | 3,381 (9.6%) |
| $5,000 to $9,999 | 444 (1.2%) | 2,013 (5.7%) |
| $10,000 to $14,999 | 793 (2.1%) | 3,327 (9.5%) |
| $15,000 to $19,999 | 1,076 (2.9%) | 1,867 (5.3%) |
| $20,000 to $24,999 | 803 (2.2%) | 2,097 (6.0%) |
| $25,000 to $34,999 | 2,362 (6.4%) | 3,852 (11.0%) |
| $35,000 to $49,999 | 4,656 (12.6%) | 6,308 (17.9%) |
| $50,000 to $74,999 | 6,365 (17.2%) | 6,059 (17.2%) |
| $75,000 to $99,999 | 5,885 (15.9%) | 3,170 (9.0%) |
| $100,000 to $149,999 | 7,870 (21.3%) | 2,072 (5.9%) |
| $150,000 or more | 6,303 (17.1%) | 1,047 (3.0%) |
| Total | 36,960 (100.0%) | 35,193 (100.0%) |
Monthly Housing Cost Tiers in Pitt County
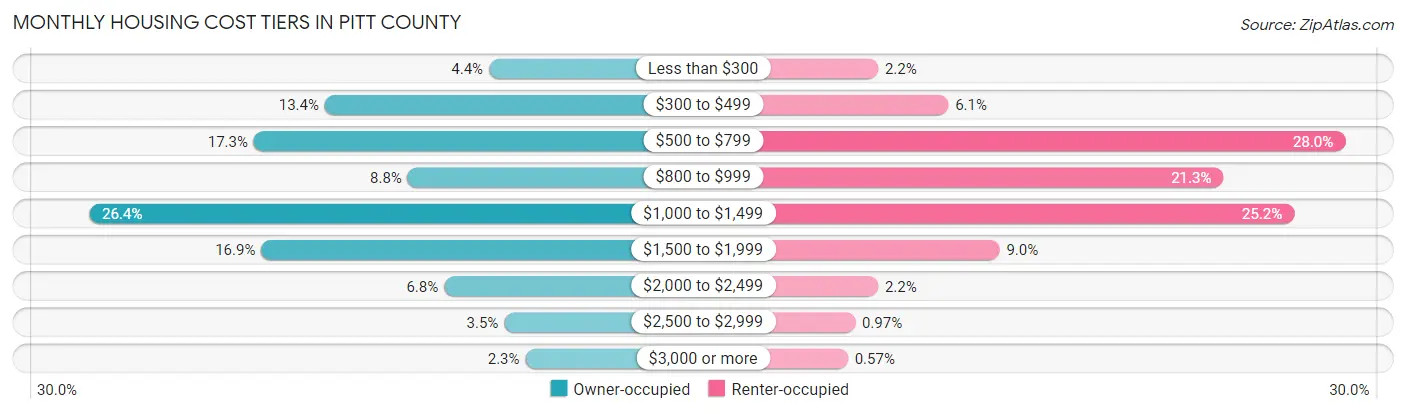
| Monthly Cost | Owner-occupied | Renter-occupied |
| Less than $300 | 1,607 (4.3%) | 787 (2.2%) |
| $300 to $499 | 4,961 (13.4%) | 2,153 (6.1%) |
| $500 to $799 | 6,409 (17.3%) | 9,869 (28.0%) |
| $800 to $999 | 3,266 (8.8%) | 7,498 (21.3%) |
| $1,000 to $1,499 | 9,774 (26.4%) | 8,876 (25.2%) |
| $1,500 to $1,999 | 6,256 (16.9%) | 3,149 (8.9%) |
| $2,000 to $2,499 | 2,524 (6.8%) | 787 (2.2%) |
| $2,500 to $2,999 | 1,299 (3.5%) | 342 (1.0%) |
| $3,000 or more | 864 (2.3%) | 202 (0.6%) |
| Total | 36,960 (100.0%) | 35,193 (100.0%) |
Physical Housing Characteristics in Pitt County
Housing Structures in Pitt County
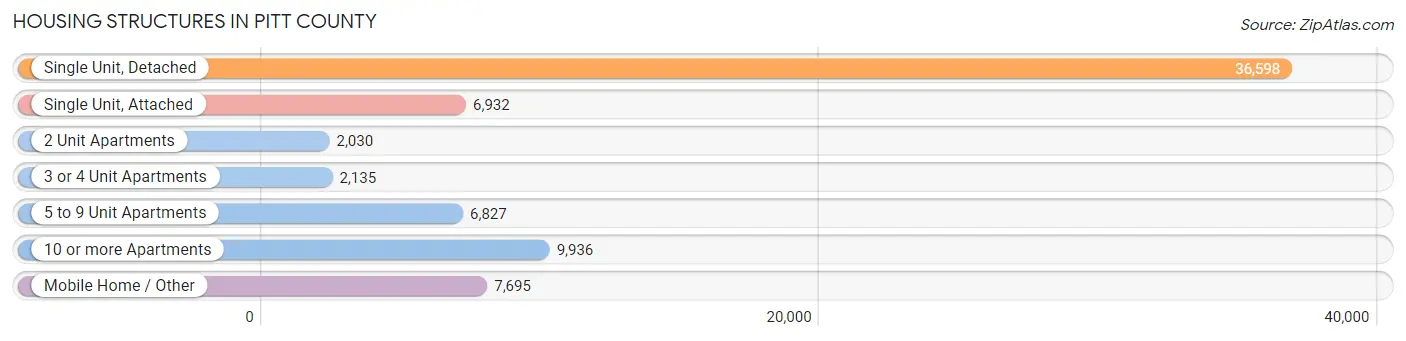
| Structure Type | # Housing Units | % Housing Units |
| Single Unit, Detached | 36,598 | 50.7% |
| Single Unit, Attached | 6,932 | 9.6% |
| 2 Unit Apartments | 2,030 | 2.8% |
| 3 or 4 Unit Apartments | 2,135 | 3.0% |
| 5 to 9 Unit Apartments | 6,827 | 9.5% |
| 10 or more Apartments | 9,936 | 13.8% |
| Mobile Home / Other | 7,695 | 10.7% |
| Total | 72,153 | 100.0% |
Housing Structures by Occupancy in Pitt County
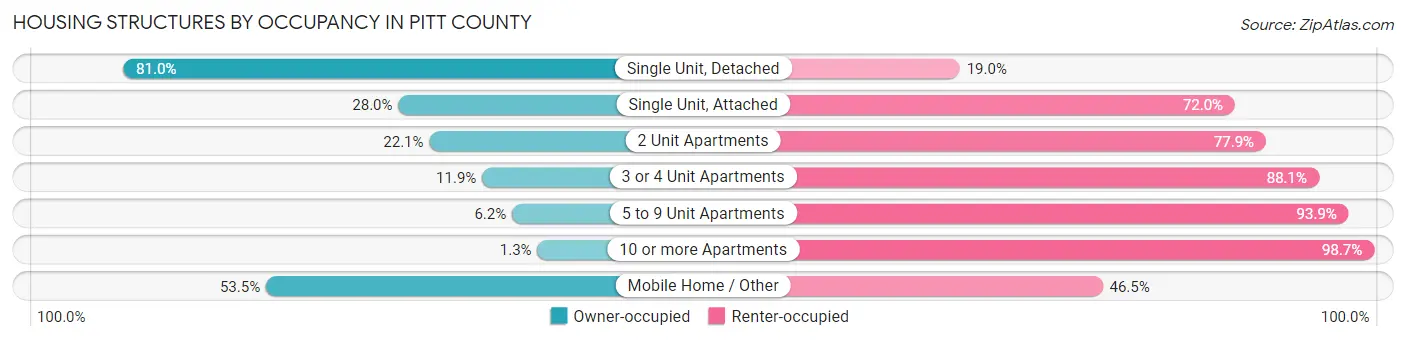
| Structure Type | Owner-occupied | Renter-occupied |
| Single Unit, Detached | 29,651 (81.0%) | 6,947 (19.0%) |
| Single Unit, Attached | 1,944 (28.0%) | 4,988 (72.0%) |
| 2 Unit Apartments | 448 (22.1%) | 1,582 (77.9%) |
| 3 or 4 Unit Apartments | 254 (11.9%) | 1,881 (88.1%) |
| 5 to 9 Unit Apartments | 420 (6.1%) | 6,407 (93.9%) |
| 10 or more Apartments | 125 (1.3%) | 9,811 (98.7%) |
| Mobile Home / Other | 4,118 (53.5%) | 3,577 (46.5%) |
| Total | 36,960 (51.2%) | 35,193 (48.8%) |
Housing Structures by Number of Rooms in Pitt County
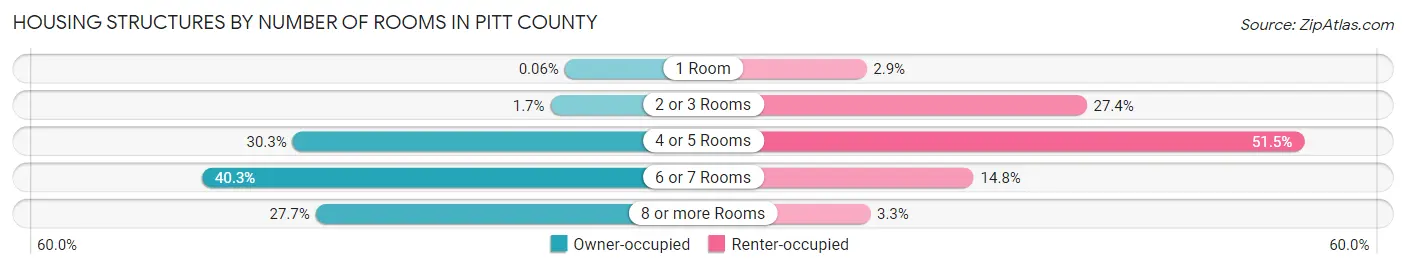
| Number of Rooms | Owner-occupied | Renter-occupied |
| 1 Room | 21 (0.1%) | 1,032 (2.9%) |
| 2 or 3 Rooms | 609 (1.7%) | 9,633 (27.4%) |
| 4 or 5 Rooms | 11,185 (30.3%) | 18,127 (51.5%) |
| 6 or 7 Rooms | 14,902 (40.3%) | 5,224 (14.8%) |
| 8 or more Rooms | 10,243 (27.7%) | 1,177 (3.3%) |
| Total | 36,960 (100.0%) | 35,193 (100.0%) |
Housing Structure by Heating Type in Pitt County
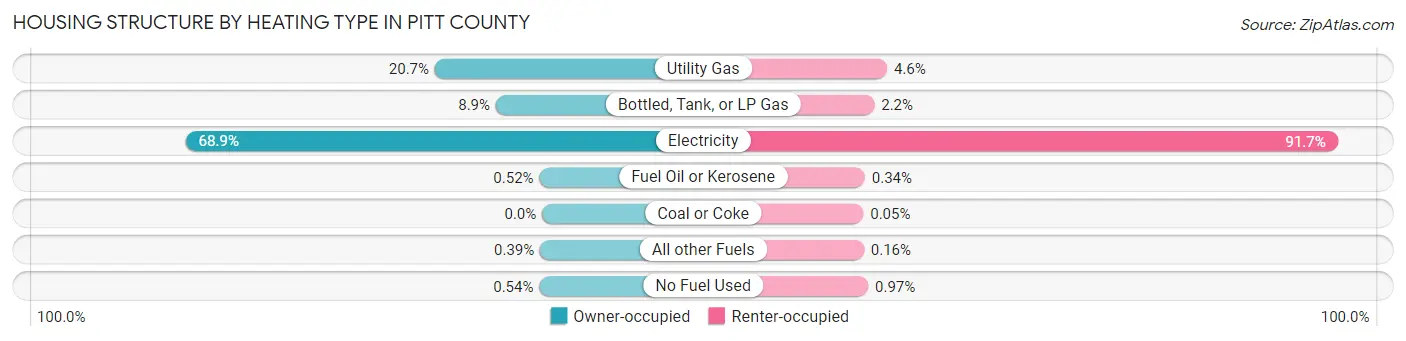
| Heating Type | Owner-occupied | Renter-occupied |
| Utility Gas | 7,657 (20.7%) | 1,628 (4.6%) |
| Bottled, Tank, or LP Gas | 3,302 (8.9%) | 762 (2.2%) |
| Electricity | 25,466 (68.9%) | 32,266 (91.7%) |
| Fuel Oil or Kerosene | 191 (0.5%) | 121 (0.3%) |
| Coal or Coke | 0 (0.0%) | 18 (0.1%) |
| All other Fuels | 144 (0.4%) | 55 (0.2%) |
| No Fuel Used | 200 (0.5%) | 343 (1.0%) |
| Total | 36,960 (100.0%) | 35,193 (100.0%) |
Household Vehicle Usage in Pitt County
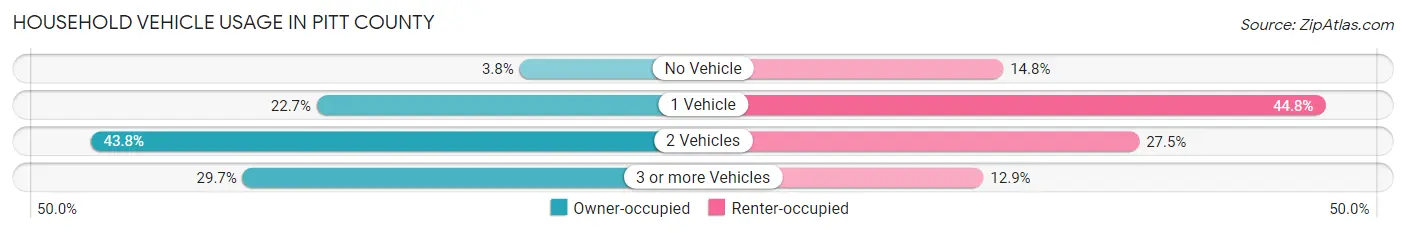
| Vehicles per Household | Owner-occupied | Renter-occupied |
| No Vehicle | 1,404 (3.8%) | 5,201 (14.8%) |
| 1 Vehicle | 8,398 (22.7%) | 15,776 (44.8%) |
| 2 Vehicles | 16,201 (43.8%) | 9,667 (27.5%) |
| 3 or more Vehicles | 10,957 (29.6%) | 4,549 (12.9%) |
| Total | 36,960 (100.0%) | 35,193 (100.0%) |
Real Estate & Mortgages in Pitt County
Real Estate and Mortgage Overview in Pitt County
| Characteristic | Without Mortgage | With Mortgage |
| Housing Units | 12,733 | 24,227 |
| Median Property Value | $149,100 | $189,000 |
| Median Household Income | $59,187 | $4,830 |
| Monthly Housing Costs | $508 | $814 |
| Real Estate Taxes | $1,393 | $305 |
Property Value by Mortgage Status in Pitt County
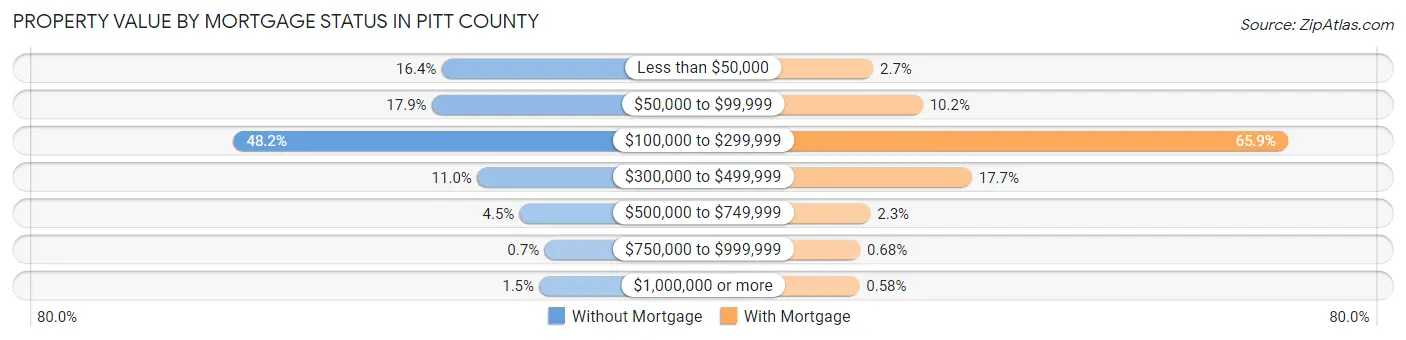
| Property Value | Without Mortgage | With Mortgage |
| Less than $50,000 | 2,085 (16.4%) | 646 (2.7%) |
| $50,000 to $99,999 | 2,274 (17.9%) | 2,482 (10.2%) |
| $100,000 to $299,999 | 6,131 (48.1%) | 15,957 (65.9%) |
| $300,000 to $499,999 | 1,395 (11.0%) | 4,293 (17.7%) |
| $500,000 to $749,999 | 571 (4.5%) | 544 (2.2%) |
| $750,000 to $999,999 | 89 (0.7%) | 164 (0.7%) |
| $1,000,000 or more | 188 (1.5%) | 141 (0.6%) |
| Total | 12,733 (100.0%) | 24,227 (100.0%) |
Household Income by Mortgage Status in Pitt County
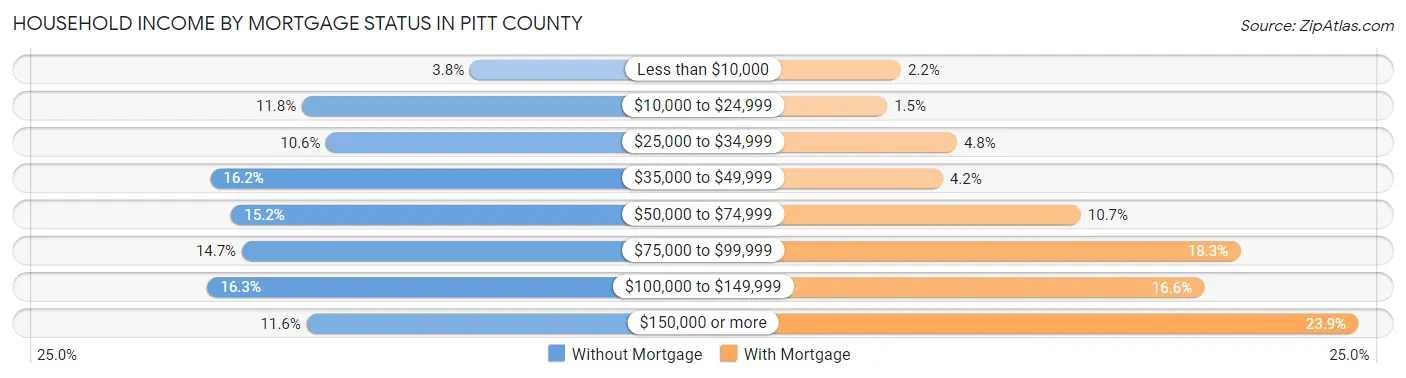
| Household Income | Without Mortgage | With Mortgage |
| Less than $10,000 | 482 (3.8%) | 526 (2.2%) |
| $10,000 to $24,999 | 1,501 (11.8%) | 365 (1.5%) |
| $25,000 to $34,999 | 1,353 (10.6%) | 1,171 (4.8%) |
| $35,000 to $49,999 | 2,056 (16.2%) | 1,009 (4.2%) |
| $50,000 to $74,999 | 1,929 (15.1%) | 2,600 (10.7%) |
| $75,000 to $99,999 | 1,865 (14.6%) | 4,436 (18.3%) |
| $100,000 to $149,999 | 2,074 (16.3%) | 4,020 (16.6%) |
| $150,000 or more | 1,473 (11.6%) | 5,796 (23.9%) |
| Total | 12,733 (100.0%) | 24,227 (100.0%) |
Property Value to Household Income Ratio in Pitt County
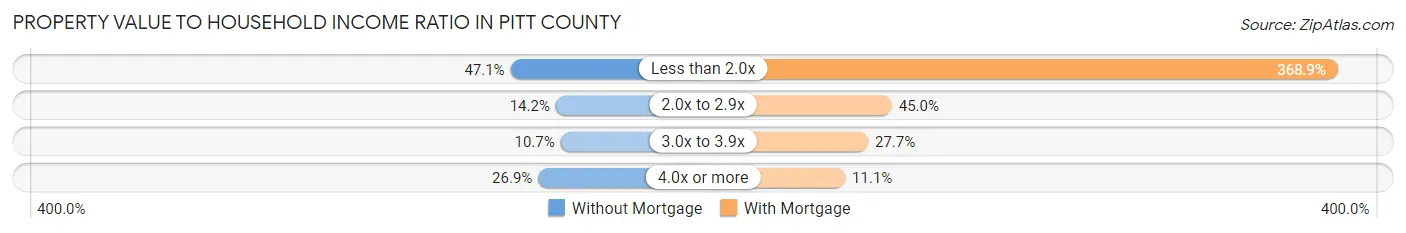
| Value-to-Income Ratio | Without Mortgage | With Mortgage |
| Less than 2.0x | 5,994 (47.1%) | 89,370 (368.9%) |
| 2.0x to 2.9x | 1,802 (14.1%) | 10,896 (45.0%) |
| 3.0x to 3.9x | 1,356 (10.6%) | 6,715 (27.7%) |
| 4.0x or more | 3,430 (26.9%) | 2,682 (11.1%) |
| Total | 12,733 (100.0%) | 24,227 (100.0%) |
Real Estate Taxes by Mortgage Status in Pitt County
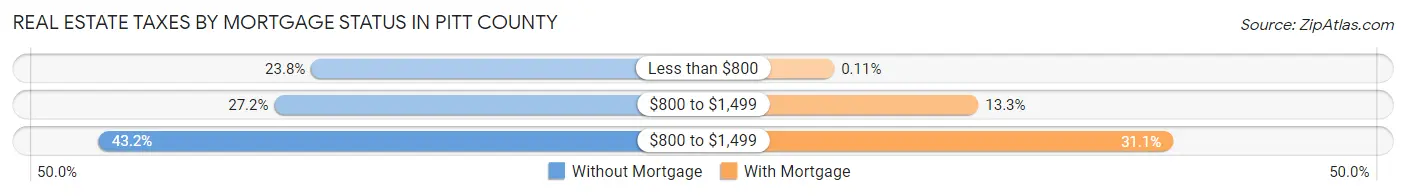
| Property Taxes | Without Mortgage | With Mortgage |
| Less than $800 | 3,034 (23.8%) | 26 (0.1%) |
| $800 to $1,499 | 3,464 (27.2%) | 3,216 (13.3%) |
| $800 to $1,499 | 5,502 (43.2%) | 7,524 (31.1%) |
| Total | 12,733 (100.0%) | 24,227 (100.0%) |
Health & Disability in Pitt County
Health Insurance Coverage by Age in Pitt County
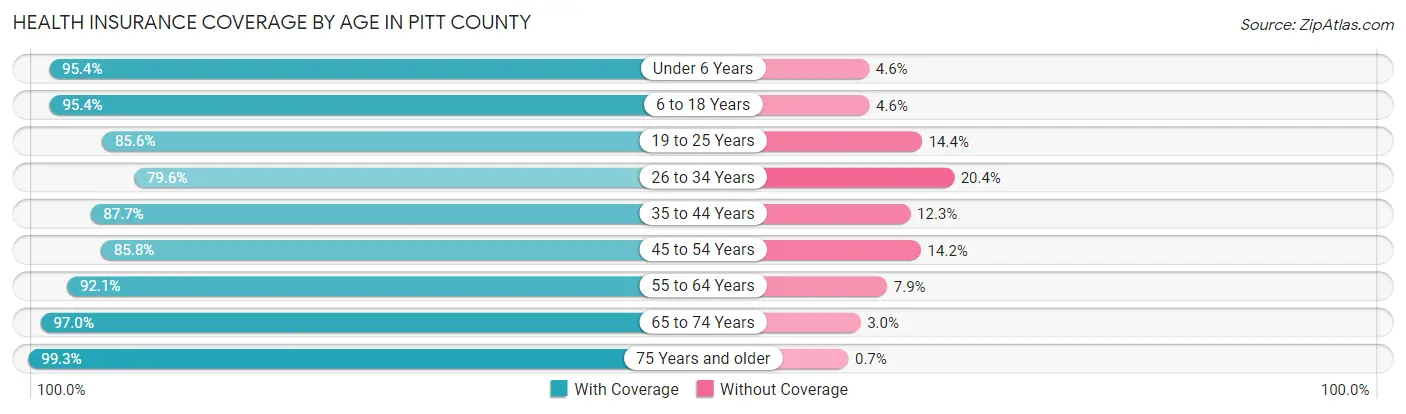
| Age Bracket | With Coverage | Without Coverage |
| Under 6 Years | 11,131 (95.4%) | 534 (4.6%) |
| 6 to 18 Years | 27,101 (95.4%) | 1,320 (4.6%) |
| 19 to 25 Years | 24,123 (85.6%) | 4,072 (14.4%) |
| 26 to 34 Years | 16,492 (79.6%) | 4,226 (20.4%) |
| 35 to 44 Years | 17,174 (87.7%) | 2,404 (12.3%) |
| 45 to 54 Years | 16,032 (85.8%) | 2,663 (14.2%) |
| 55 to 64 Years | 17,280 (92.1%) | 1,491 (7.9%) |
| 65 to 74 Years | 14,195 (97.0%) | 434 (3.0%) |
| 75 Years and older | 8,833 (99.3%) | 62 (0.7%) |
| Total | 152,361 (89.8%) | 17,206 (10.2%) |
Health Insurance Coverage by Citizenship Status in Pitt County
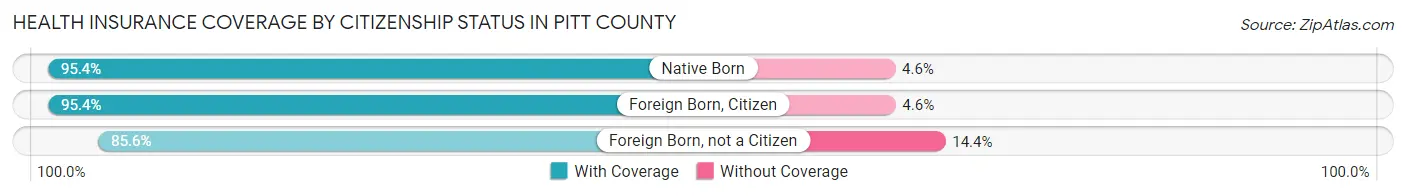
| Citizenship Status | With Coverage | Without Coverage |
| Native Born | 11,131 (95.4%) | 534 (4.6%) |
| Foreign Born, Citizen | 27,101 (95.4%) | 1,320 (4.6%) |
| Foreign Born, not a Citizen | 24,123 (85.6%) | 4,072 (14.4%) |
Health Insurance Coverage by Household Income in Pitt County
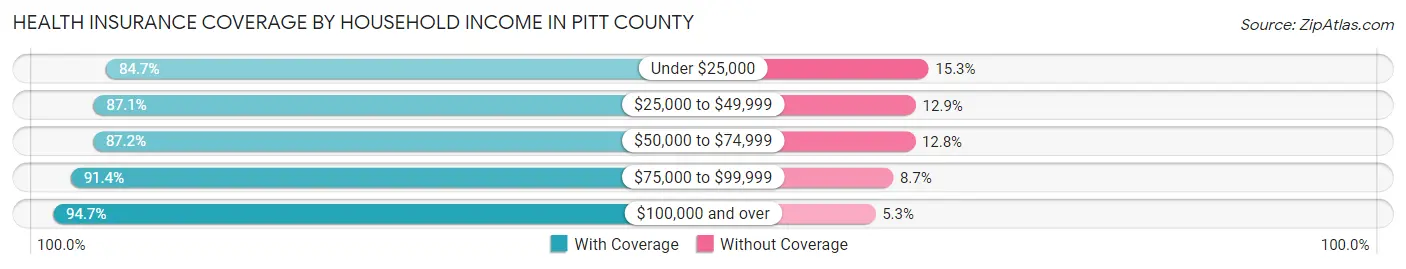
| Household Income | With Coverage | Without Coverage |
| Under $25,000 | 24,356 (84.7%) | 4,392 (15.3%) |
| $25,000 to $49,999 | 30,203 (87.1%) | 4,475 (12.9%) |
| $50,000 to $74,999 | 24,449 (87.2%) | 3,579 (12.8%) |
| $75,000 to $99,999 | 20,413 (91.3%) | 1,933 (8.6%) |
| $100,000 and over | 47,684 (94.7%) | 2,687 (5.3%) |
Public vs Private Health Insurance Coverage by Age in Pitt County
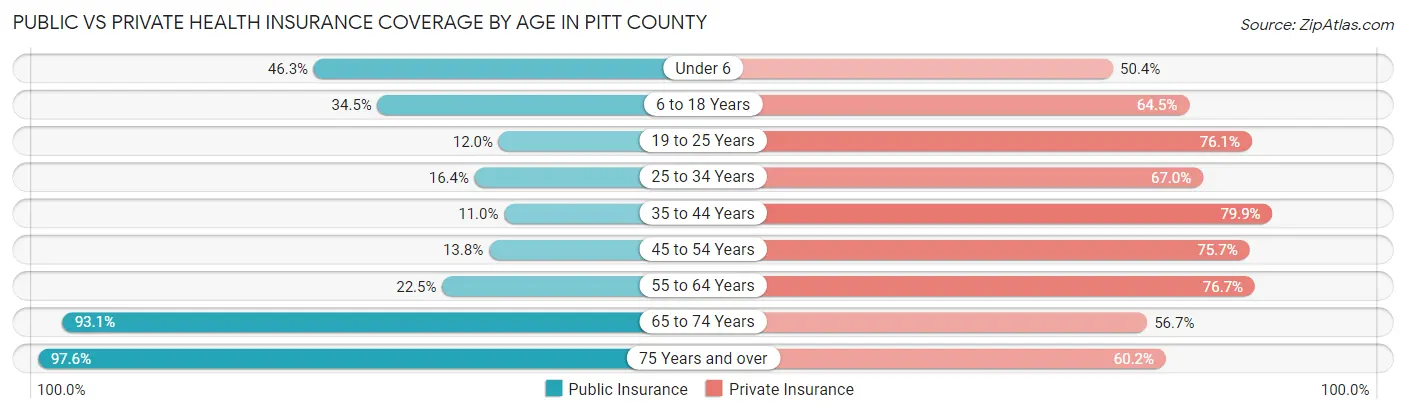
| Age Bracket | Public Insurance | Private Insurance |
| Under 6 | 5,401 (46.3%) | 5,874 (50.4%) |
| 6 to 18 Years | 9,796 (34.5%) | 18,323 (64.5%) |
| 19 to 25 Years | 3,374 (12.0%) | 21,460 (76.1%) |
| 25 to 34 Years | 3,405 (16.4%) | 13,890 (67.0%) |
| 35 to 44 Years | 2,146 (11.0%) | 15,648 (79.9%) |
| 45 to 54 Years | 2,579 (13.8%) | 14,147 (75.7%) |
| 55 to 64 Years | 4,217 (22.5%) | 14,391 (76.7%) |
| 65 to 74 Years | 13,619 (93.1%) | 8,293 (56.7%) |
| 75 Years and over | 8,678 (97.6%) | 5,350 (60.2%) |
| Total | 53,215 (31.4%) | 117,376 (69.2%) |
Disability Status by Sex by Age in Pitt County
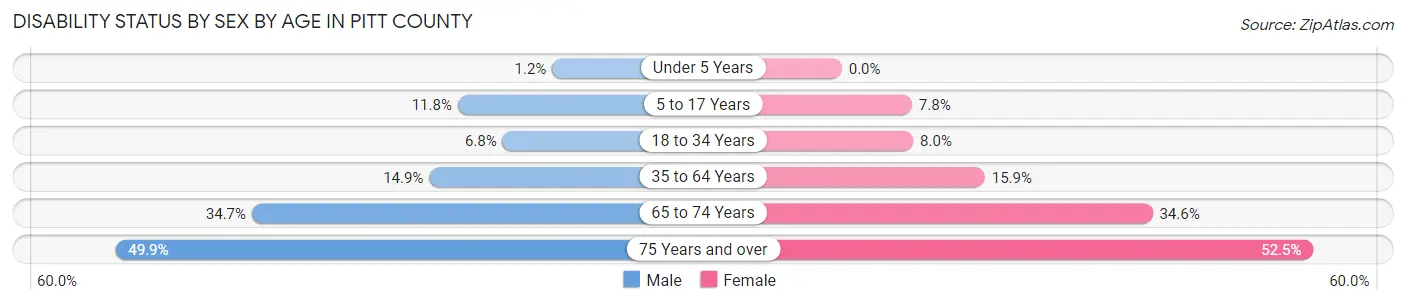
| Age Bracket | Male | Female |
| Under 5 Years | 61 (1.2%) | 0 (0.0%) |
| 5 to 17 Years | 1,617 (11.8%) | 1,014 (7.8%) |
| 18 to 34 Years | 1,660 (6.8%) | 2,241 (8.0%) |
| 35 to 64 Years | 3,949 (14.9%) | 4,877 (15.9%) |
| 65 to 74 Years | 2,307 (34.7%) | 2,760 (34.6%) |
| 75 Years and over | 1,740 (49.9%) | 2,839 (52.5%) |
Disability Class by Sex by Age in Pitt County
Disability Class: Hearing Difficulty
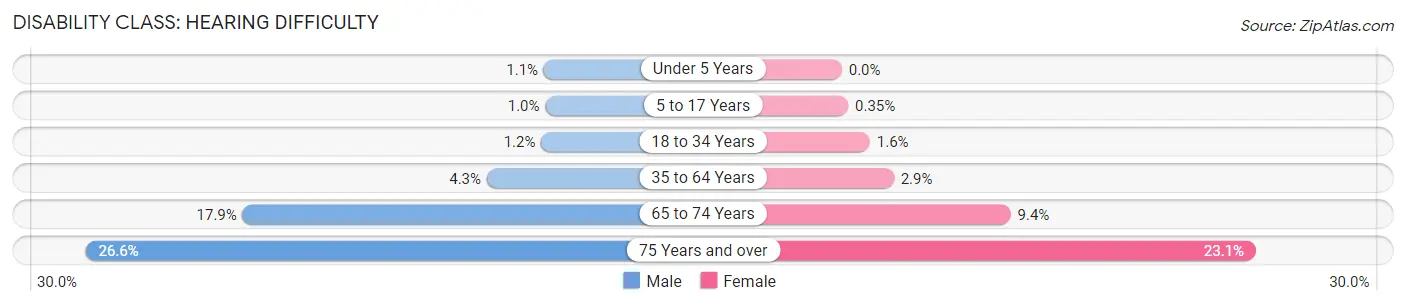
| Age Bracket | Male | Female |
| Under 5 Years | 53 (1.1%) | 0 (0.0%) |
| 5 to 17 Years | 137 (1.0%) | 45 (0.4%) |
| 18 to 34 Years | 302 (1.2%) | 439 (1.6%) |
| 35 to 64 Years | 1,125 (4.3%) | 886 (2.9%) |
| 65 to 74 Years | 1,188 (17.9%) | 750 (9.4%) |
| 75 Years and over | 928 (26.6%) | 1,247 (23.1%) |
Disability Class: Vision Difficulty
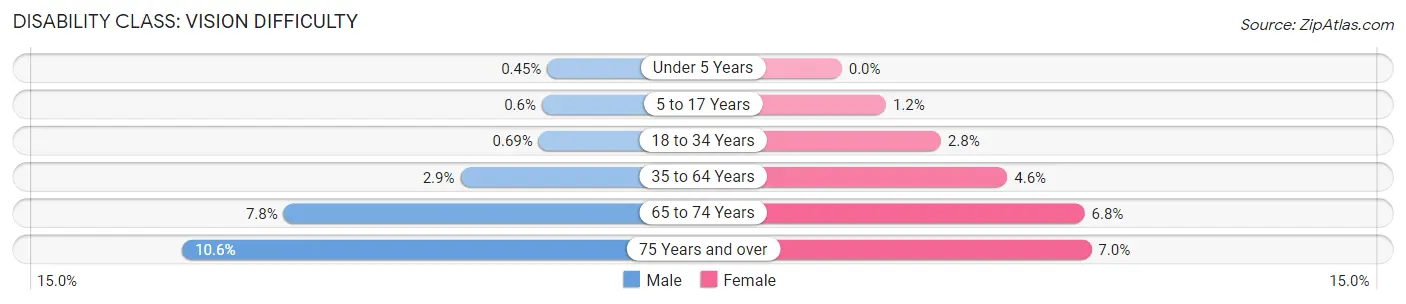
| Age Bracket | Male | Female |
| Under 5 Years | 22 (0.4%) | 0 (0.0%) |
| 5 to 17 Years | 83 (0.6%) | 159 (1.2%) |
| 18 to 34 Years | 170 (0.7%) | 777 (2.8%) |
| 35 to 64 Years | 759 (2.9%) | 1,411 (4.6%) |
| 65 to 74 Years | 518 (7.8%) | 539 (6.8%) |
| 75 Years and over | 370 (10.6%) | 376 (7.0%) |
Disability Class: Cognitive Difficulty
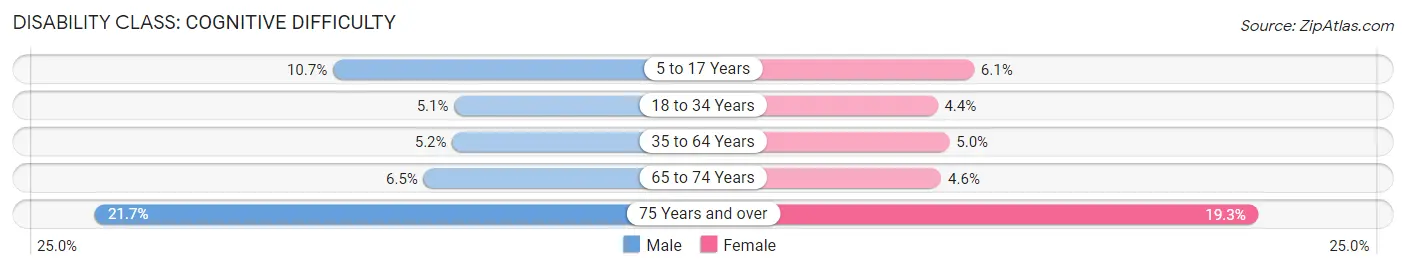
| Age Bracket | Male | Female |
| 5 to 17 Years | 1,469 (10.7%) | 795 (6.1%) |
| 18 to 34 Years | 1,240 (5.1%) | 1,251 (4.4%) |
| 35 to 64 Years | 1,362 (5.1%) | 1,527 (5.0%) |
| 65 to 74 Years | 431 (6.5%) | 368 (4.6%) |
| 75 Years and over | 758 (21.7%) | 1,043 (19.3%) |
Disability Class: Ambulatory Difficulty
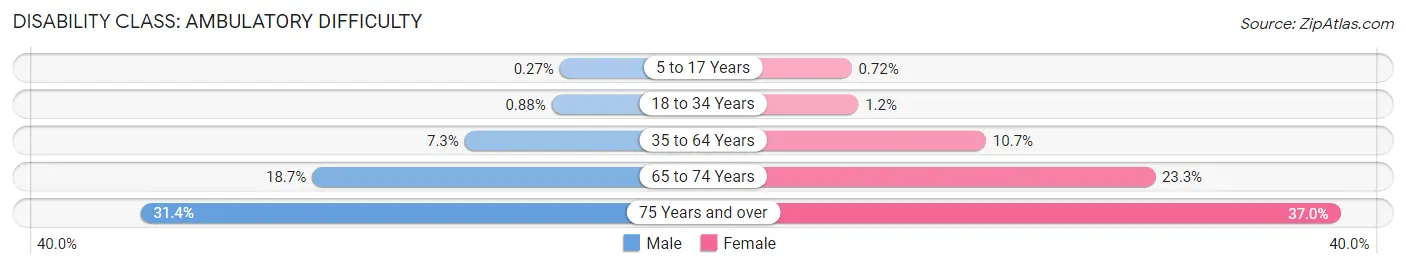
| Age Bracket | Male | Female |
| 5 to 17 Years | 37 (0.3%) | 93 (0.7%) |
| 18 to 34 Years | 215 (0.9%) | 345 (1.2%) |
| 35 to 64 Years | 1,938 (7.3%) | 3,274 (10.7%) |
| 65 to 74 Years | 1,241 (18.7%) | 1,855 (23.3%) |
| 75 Years and over | 1,095 (31.4%) | 2,001 (37.0%) |
Disability Class: Self-Care Difficulty
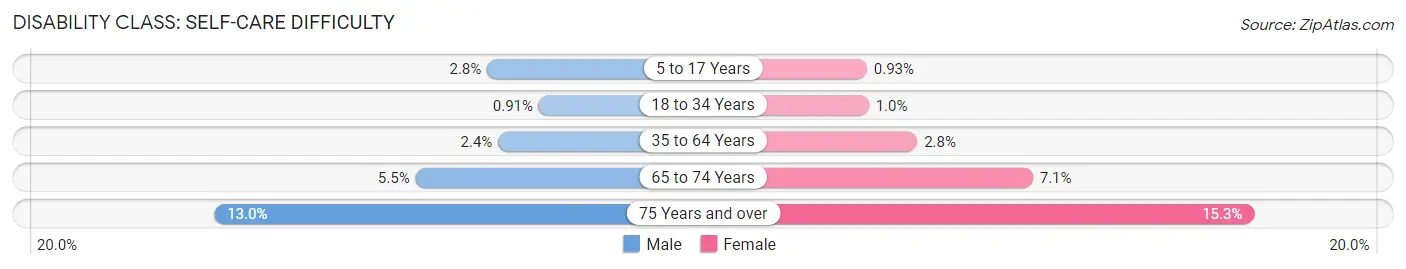
| Age Bracket | Male | Female |
| 5 to 17 Years | 389 (2.8%) | 121 (0.9%) |
| 18 to 34 Years | 223 (0.9%) | 283 (1.0%) |
| 35 to 64 Years | 639 (2.4%) | 856 (2.8%) |
| 65 to 74 Years | 365 (5.5%) | 566 (7.1%) |
| 75 Years and over | 452 (13.0%) | 828 (15.3%) |
Technology Access in Pitt County
Computing Device Access in Pitt County
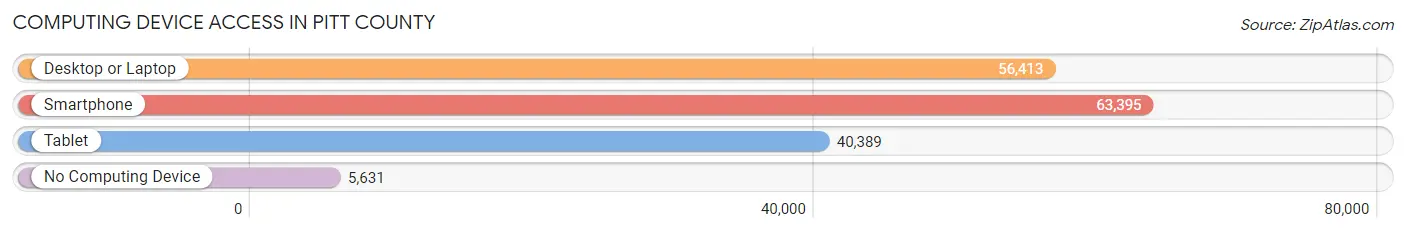
| Device Type | # Households | % Households |
| Desktop or Laptop | 56,413 | 78.2% |
| Smartphone | 63,395 | 87.9% |
| Tablet | 40,389 | 56.0% |
| No Computing Device | 5,631 | 7.8% |
| Total | 72,153 | 100.0% |
Internet Access in Pitt County
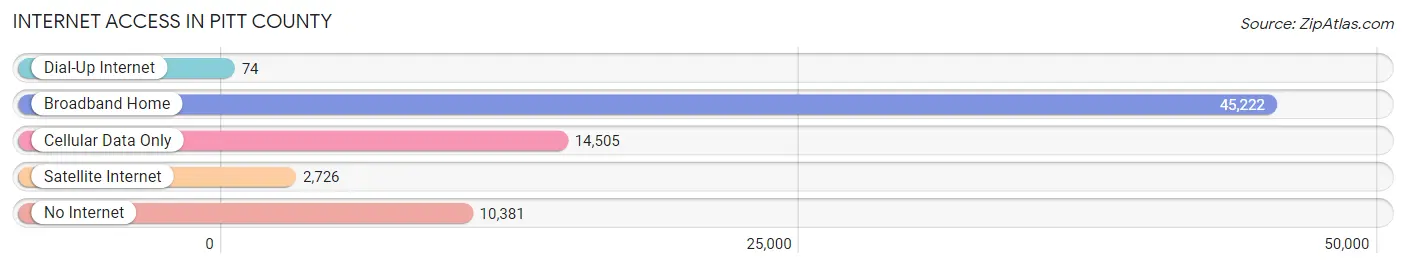
| Internet Type | # Households | % Households |
| Dial-Up Internet | 74 | 0.1% |
| Broadband Home | 45,222 | 62.7% |
| Cellular Data Only | 14,505 | 20.1% |
| Satellite Internet | 2,726 | 3.8% |
| No Internet | 10,381 | 14.4% |
| Total | 72,153 | 100.0% |
Pitt County Summary
History
Pitt County, North Carolina is located in the eastern part of the state and is part of the Greenville Metropolitan Statistical Area. The county was formed in 1760 from Beaufort County and was named for William Pitt, the Earl of Chatham. The county seat is Greenville, which is the largest city in the county.
Pitt County was home to the Tuscarora Indians prior to the arrival of European settlers. The Tuscarora were part of the Iroquois Confederacy and were known as the “People of the Hills”. The Tuscarora were forced to move to New York in 1713 after a series of wars with the colonists.
The first European settlers arrived in Pitt County in the 1730s. The county was officially established in 1760 and the first county court was held in 1761. The county was divided into four townships: Greenville, Falkland, Contentnea, and Contentnea Neck.
During the American Revolution, Pitt County was a hotbed of Patriot activity. The county was home to several prominent Patriot leaders, including William Hooper, a signer of the Declaration of Independence.
In the 19th century, Pitt County was a major center of the tobacco industry. The county was home to several large tobacco warehouses and factories. The county also had a thriving lumber industry, with several sawmills located in the area.
In the 20th century, Pitt County experienced rapid growth. The county’s population increased from just over 20,000 in 1900 to over 130,000 in 2000. The county’s economy shifted from agriculture to manufacturing and services.
Geography
Pitt County is located in the eastern part of North Carolina and is part of the Greenville Metropolitan Statistical Area. The county is bordered by Beaufort County to the north, Martin County to the east, Wilson County to the south, and Greene County to the west.
The county has a total area of 545 square miles, of which 543 square miles is land and 2 square miles is water. The county is divided into four townships: Greenville, Falkland, Contentnea, and Contentnea Neck.
The county is located in the Coastal Plain region of North Carolina and is mostly flat. The county is drained by the Tar, Neuse, and Contentnea rivers. The county is home to several lakes, including Lake Phelps, Lake Mattamuskeet, and Lake Phelps.
Economy
Pitt County’s economy is largely based on manufacturing and services. The county is home to several large manufacturing companies, including East Carolina University, Vidant Medical Center, and Pitt County Memorial Hospital.
The county is also home to several large retail stores, including Walmart, Target, and Lowe’s. The county is also home to several large agricultural operations, including hog farms, poultry farms, and tobacco farms.
Demographics
As of the 2010 census, Pitt County had a population of 168,148. The population was 54.2% White, 37.3% African American, 0.5% Native American, 2.2% Asian, 0.1% Pacific Islander, 3.2% from other races, and 2.5% from two or more races. Hispanic or Latino of any race were 6.3% of the population.
The median income for a household in the county was $41,945 and the median income for a family was $50,945. The per capita income for the county was $21,845. About 17.2% of families and 22.2% of the population were below the poverty line, including 33.2% of those under age 18 and 11.2% of those age 65 or over.
Common Questions
What is the Total Population of Pitt County?
Total Population of Pitt County is 171,196.
What is the Total Male Population of Pitt County?
Total Male Population of Pitt County is 80,857.
What is the Total Female Population of Pitt County?
Total Female Population of Pitt County is 90,339.
What is the Ratio of Males per 100 Females in Pitt County?
There are 89.50 Males per 100 Females in Pitt County.
What is the Ratio of Females per 100 Males in Pitt County?
There are 111.73 Females per 100 Males in Pitt County.
What is the Median Population Age in Pitt County?
Median Population Age in Pitt County is 33.2 Years.
What is the Average Family Size in Pitt County
Average Family Size in Pitt County is 2.9 People.
What is the Average Household Size in Pitt County
Average Household Size in Pitt County is 2.3 People.
What is Per Capita Income in Pitt County?
Per Capita income in Pitt County is $32,224.
What is the Median Family Income in Pitt County?
Median Family Income in Pitt County is $73,970.
What is the Median Household income in Pitt County?
Median Household Income in Pitt County is $54,915.
What is Income or Wage Gap in Pitt County?
Income or Wage Gap in Pitt County is 24.7%.
Women in Pitt County earn 75.3 cents for every dollar earned by a man.
What is Family Income Deficit in Pitt County?
Family Income Deficit in Pitt County is $13,167.
Families that are below poverty line in Pitt County earn $13,167 less on average than the poverty threshold level.
What is Inequality or Gini Index in Pitt County?
Inequality or Gini Index in Pitt County is 0.48.
How Large is the Labor Force in Pitt County?
There are 87,955 People in the Labor Forcein in Pitt County.
What is the Percentage of People in the Labor Force in Pitt County?
63.2% of People are in the Labor Force in Pitt County.
What is the Unemployment Rate in Pitt County?
Unemployment Rate in Pitt County is 7.5%.