Orange County, NC
Orange County Map

Orange County Overview
145,919
TOTAL POPULATION
69,888
MALE POPULATION
76,031
FEMALE POPULATION
91.92
MALES / 100 FEMALES
108.79
FEMALES / 100 MALES
36.2
MEDIAN AGE
3.0
AVG FAMILY SIZE
2.4
AVG HOUSEHOLD SIZE
$50,449
PER CAPITA INCOME
$122,332
AVG FAMILY INCOME
$85,785
AVG HOUSEHOLD INCOME
26.2%
WAGE / INCOME GAP [ % ]
73.8¢/ $1
WAGE / INCOME GAP [ $ ]
$11,350
FAMILY INCOME DEFICIT
0.51
INEQUALITY / GINI INDEX
75,316
LABOR FORCE [ PEOPLE ]
61.9%
PERCENT IN LABOR FORCE
3.9%
UNEMPLOYMENT RATE
Orange County Area Codes
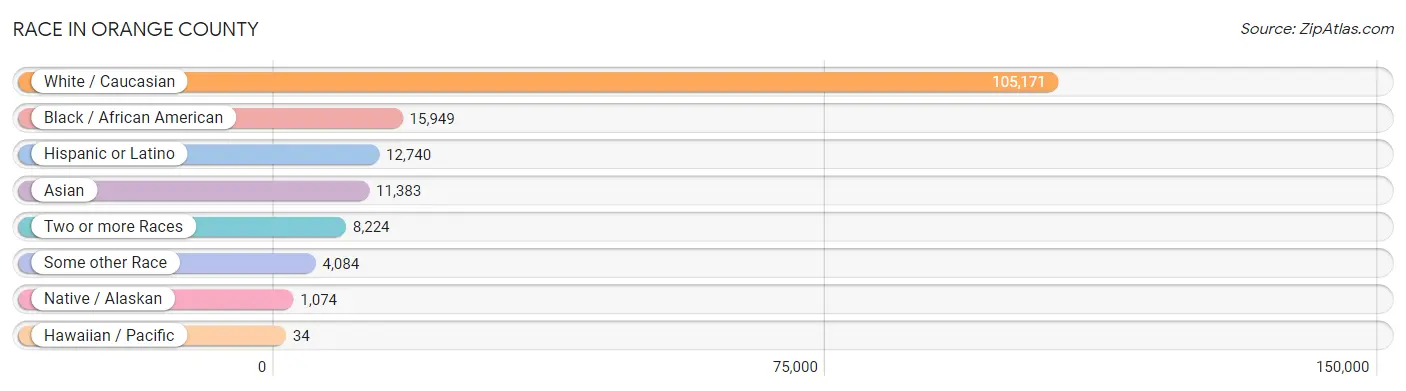
Race in Orange County
The most populous races in Orange County are White / Caucasian (105,171 | 72.1%), Black / African American (15,949 | 10.9%), and Hispanic or Latino (12,740 | 8.7%).
| Race | # Population | % Population |
| Asian | 11,383 | 7.8% |
| Black / African American | 15,949 | 10.9% |
| Hawaiian / Pacific | 34 | 0.0% |
| Hispanic or Latino | 12,740 | 8.7% |
| Native / Alaskan | 1,074 | 0.7% |
| White / Caucasian | 105,171 | 72.1% |
| Two or more Races | 8,224 | 5.6% |
| Some other Race | 4,084 | 2.8% |
| Total | 145,919 | 100.0% |
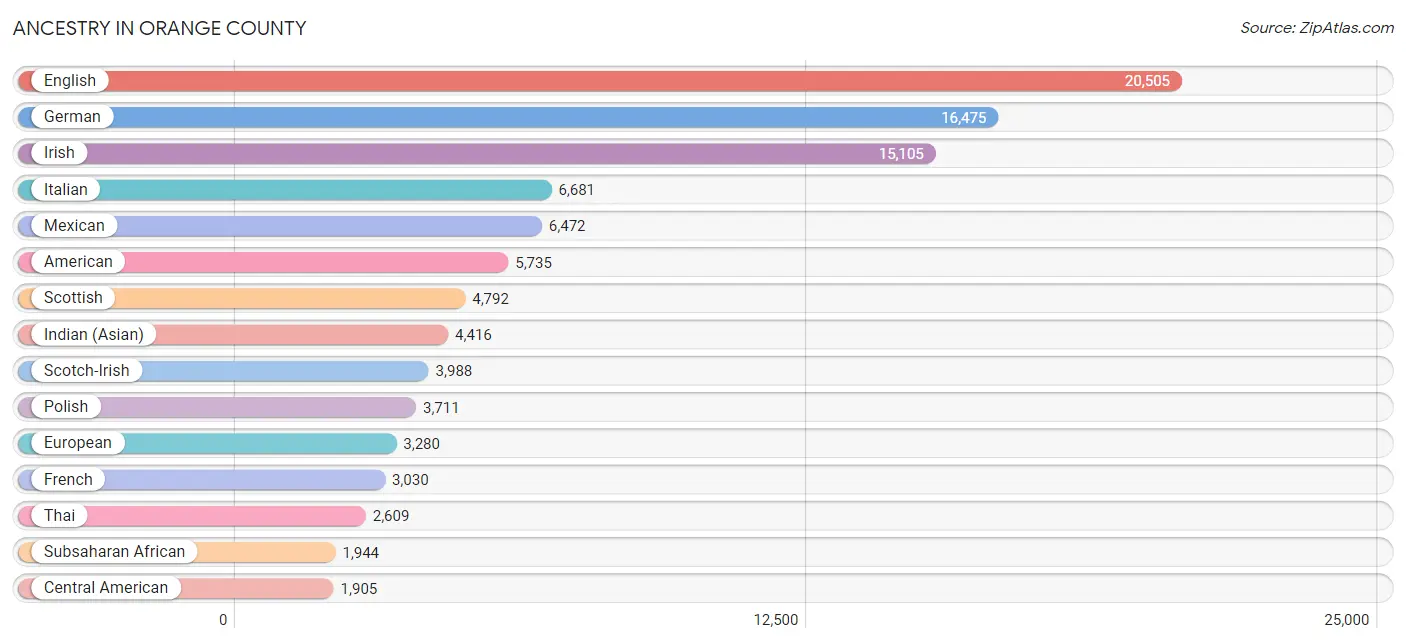
Ancestry in Orange County
The most populous ancestries reported in Orange County are English (20,505 | 14.1%), German (16,475 | 11.3%), Irish (15,105 | 10.3%), Italian (6,681 | 4.6%), and Mexican (6,472 | 4.4%), together accounting for 44.7% of all Orange County residents.
| Ancestry | # Population | % Population |
| African | 898 | 0.6% |
| Albanian | 26 | 0.0% |
| American | 5,735 | 3.9% |
| Arab | 1,045 | 0.7% |
| Argentinean | 261 | 0.2% |
| Armenian | 45 | 0.0% |
| Assyrian / Chaldean / Syriac | 12 | 0.0% |
| Australian | 10 | 0.0% |
| Austrian | 470 | 0.3% |
| Bahamian | 14 | 0.0% |
| Bangladeshi | 140 | 0.1% |
| Barbadian | 7 | 0.0% |
| Basque | 28 | 0.0% |
| Belgian | 225 | 0.2% |
| Bhutanese | 606 | 0.4% |
| Bolivian | 28 | 0.0% |
| Brazilian | 117 | 0.1% |
| British | 1,702 | 1.2% |
| British West Indian | 53 | 0.0% |
| Bulgarian | 25 | 0.0% |
| Burmese | 1,771 | 1.2% |
| Cajun | 106 | 0.1% |
| Canadian | 267 | 0.2% |
| Carpatho Rusyn | 7 | 0.0% |
| Celtic | 22 | 0.0% |
| Central American | 1,905 | 1.3% |
| Central American Indian | 329 | 0.2% |
| Cherokee | 785 | 0.5% |
| Cheyenne | 1 | 0.0% |
| Chilean | 204 | 0.1% |
| Chippewa | 8 | 0.0% |
| Choctaw | 80 | 0.1% |
| Colombian | 401 | 0.3% |
| Costa Rican | 92 | 0.1% |
| Cree | 13 | 0.0% |
| Creek | 20 | 0.0% |
| Croatian | 221 | 0.2% |
| Cuban | 307 | 0.2% |
| Czech | 397 | 0.3% |
| Czechoslovakian | 183 | 0.1% |
| Danish | 572 | 0.4% |
| Dominican | 100 | 0.1% |
| Dutch | 1,390 | 0.9% |
| Eastern European | 722 | 0.5% |
| Ecuadorian | 84 | 0.1% |
| Egyptian | 167 | 0.1% |
| English | 20,505 | 14.1% |
| Estonian | 139 | 0.1% |
| Ethiopian | 185 | 0.1% |
| European | 3,280 | 2.2% |
| Filipino | 269 | 0.2% |
| Finnish | 257 | 0.2% |
| French | 3,030 | 2.1% |
| French Canadian | 693 | 0.5% |
| German | 16,475 | 11.3% |
| Ghanaian | 214 | 0.2% |
| Greek | 557 | 0.4% |
| Guamanian / Chamorro | 34 | 0.0% |
| Guatemalan | 837 | 0.6% |
| Guyanese | 4 | 0.0% |
| Haitian | 45 | 0.0% |
| Honduran | 552 | 0.4% |
| Hungarian | 776 | 0.5% |
| Icelander | 93 | 0.1% |
| Indian (Asian) | 4,416 | 3.0% |
| Indonesian | 628 | 0.4% |
| Iranian | 555 | 0.4% |
| Irish | 15,105 | 10.3% |
| Iroquois | 1 | 0.0% |
| Israeli | 18 | 0.0% |
| Italian | 6,681 | 4.6% |
| Jamaican | 228 | 0.2% |
| Japanese | 197 | 0.1% |
| Kenyan | 74 | 0.1% |
| Korean | 772 | 0.5% |
| Latvian | 115 | 0.1% |
| Lebanese | 334 | 0.2% |
| Lithuanian | 288 | 0.2% |
| Lumbee | 330 | 0.2% |
| Luxembourger | 9 | 0.0% |
| Macedonian | 38 | 0.0% |
| Malaysian | 15 | 0.0% |
| Maltese | 34 | 0.0% |
| Mexican | 6,472 | 4.4% |
| Mexican American Indian | 275 | 0.2% |
| Mongolian | 30 | 0.0% |
| Moroccan | 57 | 0.0% |
| Native Hawaiian | 27 | 0.0% |
| Navajo | 38 | 0.0% |
| Nicaraguan | 44 | 0.0% |
| Nigerian | 206 | 0.1% |
| Northern European | 732 | 0.5% |
| Norwegian | 1,261 | 0.9% |
| Pakistani | 19 | 0.0% |
| Palestinian | 37 | 0.0% |
| Panamanian | 26 | 0.0% |
| Paraguayan | 37 | 0.0% |
| Pennsylvania German | 41 | 0.0% |
| Peruvian | 113 | 0.1% |
| Polish | 3,711 | 2.5% |
| Portuguese | 446 | 0.3% |
| Potawatomi | 19 | 0.0% |
| Puerto Rican | 1,115 | 0.8% |
| Romanian | 190 | 0.1% |
| Russian | 1,694 | 1.2% |
| Salvadoran | 354 | 0.2% |
| Samoan | 53 | 0.0% |
| Scandinavian | 261 | 0.2% |
| Scotch-Irish | 3,988 | 2.7% |
| Scottish | 4,792 | 3.3% |
| Serbian | 206 | 0.1% |
| Slavic | 69 | 0.1% |
| Slovak | 458 | 0.3% |
| Slovene | 181 | 0.1% |
| South African | 263 | 0.2% |
| South American | 1,446 | 1.0% |
| South American Indian | 61 | 0.0% |
| Spaniard | 287 | 0.2% |
| Spanish | 516 | 0.4% |
| Sri Lankan | 345 | 0.2% |
| Subsaharan African | 1,944 | 1.3% |
| Swedish | 1,283 | 0.9% |
| Swiss | 552 | 0.4% |
| Syrian | 48 | 0.0% |
| Thai | 2,609 | 1.8% |
| Trinidadian and Tobagonian | 23 | 0.0% |
| Turkish | 302 | 0.2% |
| U.S. Virgin Islander | 65 | 0.0% |
| Ugandan | 6 | 0.0% |
| Ukrainian | 401 | 0.3% |
| Uruguayan | 48 | 0.0% |
| Venezuelan | 270 | 0.2% |
| Welsh | 1,605 | 1.1% |
| West Indian | 101 | 0.1% |
| Yugoslavian | 50 | 0.0% | View All 135 Rows |
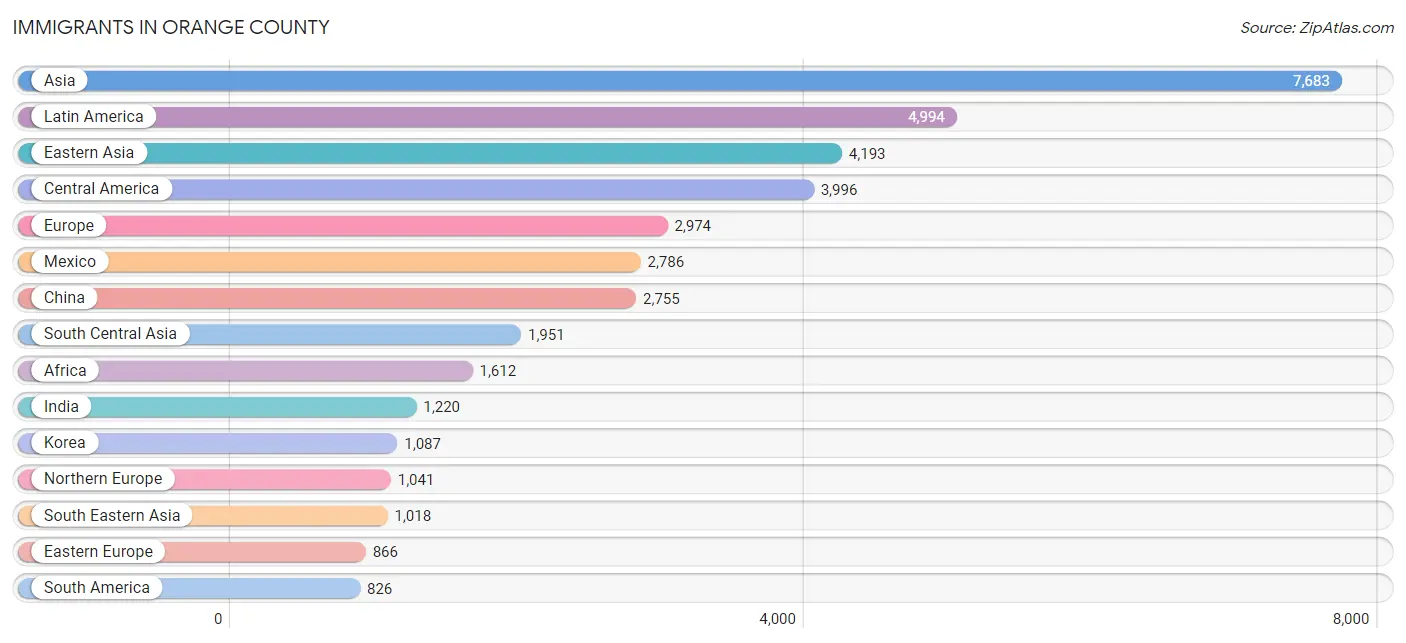
Immigrants in Orange County
The most numerous immigrant groups reported in Orange County came from Asia (7,683 | 5.3%), Latin America (4,994 | 3.4%), Eastern Asia (4,193 | 2.9%), Central America (3,996 | 2.7%), and Europe (2,974 | 2.0%), together accounting for 16.3% of all Orange County residents.
| Immigration Origin | # Population | % Population |
| Africa | 1,612 | 1.1% |
| Albania | 15 | 0.0% |
| Argentina | 107 | 0.1% |
| Armenia | 16 | 0.0% |
| Asia | 7,683 | 5.3% |
| Australia | 78 | 0.1% |
| Austria | 36 | 0.0% |
| Bahamas | 34 | 0.0% |
| Bangladesh | 7 | 0.0% |
| Belarus | 93 | 0.1% |
| Belgium | 45 | 0.0% |
| Brazil | 173 | 0.1% |
| Bulgaria | 26 | 0.0% |
| Cambodia | 58 | 0.0% |
| Cameroon | 18 | 0.0% |
| Canada | 454 | 0.3% |
| Caribbean | 172 | 0.1% |
| Central America | 3,996 | 2.7% |
| Chile | 122 | 0.1% |
| China | 2,755 | 1.9% |
| Colombia | 156 | 0.1% |
| Costa Rica | 44 | 0.0% |
| Croatia | 7 | 0.0% |
| Cuba | 3 | 0.0% |
| Czechoslovakia | 17 | 0.0% |
| Denmark | 126 | 0.1% |
| Dominican Republic | 25 | 0.0% |
| Eastern Africa | 442 | 0.3% |
| Eastern Asia | 4,193 | 2.9% |
| Eastern Europe | 866 | 0.6% |
| Ecuador | 71 | 0.1% |
| Egypt | 235 | 0.2% |
| El Salvador | 275 | 0.2% |
| England | 215 | 0.2% |
| Eritrea | 33 | 0.0% |
| Ethiopia | 89 | 0.1% |
| Europe | 2,974 | 2.0% |
| France | 308 | 0.2% |
| Germany | 229 | 0.2% |
| Ghana | 69 | 0.1% |
| Greece | 22 | 0.0% |
| Guatemala | 667 | 0.5% |
| Honduras | 200 | 0.1% |
| Hong Kong | 43 | 0.0% |
| Hungary | 69 | 0.1% |
| India | 1,220 | 0.8% |
| Iran | 157 | 0.1% |
| Iraq | 8 | 0.0% |
| Ireland | 59 | 0.0% |
| Israel | 32 | 0.0% |
| Italy | 207 | 0.1% |
| Jamaica | 67 | 0.1% |
| Japan | 351 | 0.2% |
| Kazakhstan | 1 | 0.0% |
| Kenya | 271 | 0.2% |
| Korea | 1,087 | 0.7% |
| Kuwait | 2 | 0.0% |
| Latin America | 4,994 | 3.4% |
| Latvia | 28 | 0.0% |
| Lebanon | 188 | 0.1% |
| Malaysia | 118 | 0.1% |
| Mexico | 2,786 | 1.9% |
| Middle Africa | 30 | 0.0% |
| Morocco | 212 | 0.2% |
| Nepal | 190 | 0.1% |
| Netherlands | 122 | 0.1% |
| Nicaragua | 24 | 0.0% |
| Nigeria | 2 | 0.0% |
| Northern Africa | 463 | 0.3% |
| Northern Europe | 1,041 | 0.7% |
| Oceania | 171 | 0.1% |
| Pakistan | 223 | 0.2% |
| Peru | 45 | 0.0% |
| Philippines | 349 | 0.2% |
| Poland | 172 | 0.1% |
| Portugal | 22 | 0.0% |
| Romania | 101 | 0.1% |
| Russia | 129 | 0.1% |
| Saudi Arabia | 6 | 0.0% |
| Scotland | 25 | 0.0% |
| Serbia | 18 | 0.0% |
| Sierra Leone | 316 | 0.2% |
| Singapore | 22 | 0.0% |
| South Africa | 202 | 0.1% |
| South America | 826 | 0.6% |
| South Central Asia | 1,951 | 1.3% |
| South Eastern Asia | 1,018 | 0.7% |
| Southern Europe | 276 | 0.2% |
| Spain | 25 | 0.0% |
| Sri Lanka | 151 | 0.1% |
| St. Vincent and the Grenadines | 20 | 0.0% |
| Sudan | 12 | 0.0% |
| Sweden | 23 | 0.0% |
| Switzerland | 51 | 0.0% |
| Taiwan | 237 | 0.2% |
| Thailand | 48 | 0.0% |
| Trinidad and Tobago | 23 | 0.0% |
| Turkey | 215 | 0.2% |
| Uganda | 6 | 0.0% |
| Ukraine | 105 | 0.1% |
| Uruguay | 22 | 0.0% |
| Uzbekistan | 2 | 0.0% |
| Venezuela | 67 | 0.1% |
| Vietnam | 148 | 0.1% |
| Western Africa | 454 | 0.3% |
| Western Asia | 477 | 0.3% |
| Western Europe | 791 | 0.5% | View All 107 Rows |
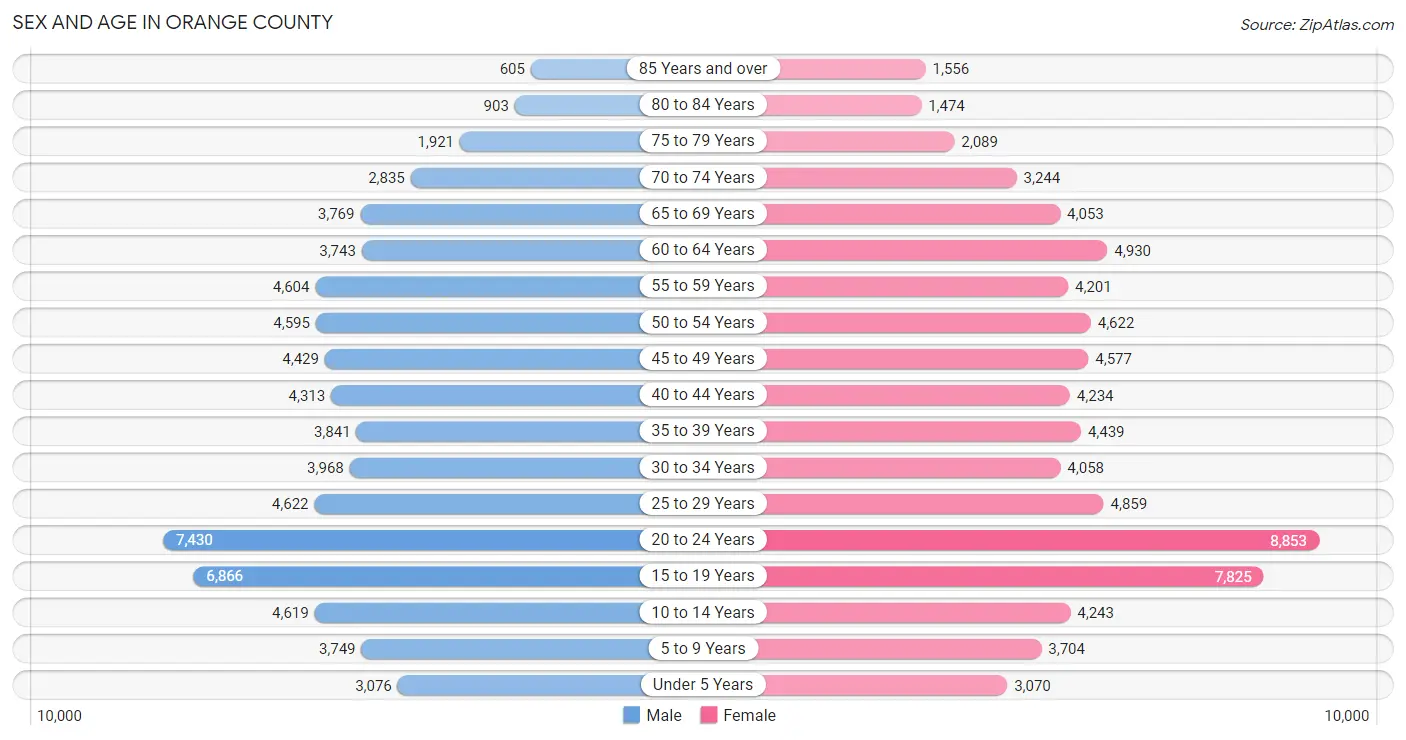
Sex and Age in Orange County
Sex and Age in Orange County
The most populous age groups in Orange County are 20 to 24 Years (7,430 | 10.6%) for men and 20 to 24 Years (8,853 | 11.6%) for women.
| Age Bracket | Male | Female |
| Under 5 Years | 3,076 (4.4%) | 3,070 (4.0%) |
| 5 to 9 Years | 3,749 (5.4%) | 3,704 (4.9%) |
| 10 to 14 Years | 4,619 (6.6%) | 4,243 (5.6%) |
| 15 to 19 Years | 6,866 (9.8%) | 7,825 (10.3%) |
| 20 to 24 Years | 7,430 (10.6%) | 8,853 (11.6%) |
| 25 to 29 Years | 4,622 (6.6%) | 4,859 (6.4%) |
| 30 to 34 Years | 3,968 (5.7%) | 4,058 (5.3%) |
| 35 to 39 Years | 3,841 (5.5%) | 4,439 (5.8%) |
| 40 to 44 Years | 4,313 (6.2%) | 4,234 (5.6%) |
| 45 to 49 Years | 4,429 (6.3%) | 4,577 (6.0%) |
| 50 to 54 Years | 4,595 (6.6%) | 4,622 (6.1%) |
| 55 to 59 Years | 4,604 (6.6%) | 4,201 (5.5%) |
| 60 to 64 Years | 3,743 (5.4%) | 4,930 (6.5%) |
| 65 to 69 Years | 3,769 (5.4%) | 4,053 (5.3%) |
| 70 to 74 Years | 2,835 (4.1%) | 3,244 (4.3%) |
| 75 to 79 Years | 1,921 (2.8%) | 2,089 (2.8%) |
| 80 to 84 Years | 903 (1.3%) | 1,474 (1.9%) |
| 85 Years and over | 605 (0.9%) | 1,556 (2.1%) |
| Total | 69,888 (100.0%) | 76,031 (100.0%) |
Families and Households in Orange County
Median Family Size in Orange County
The median family size in Orange County is 3.00 persons per family, with married-couple families (27,474 | 82.2%) accounting for the largest median family size of 3.03 persons per family. On the other hand, single male/father families (1,619 | 4.8%) represent the smallest median family size with 2.71 persons per family.

| Family Type | # Families | Family Size |
| Married-Couple | 27,474 (82.2%) | 3.03 |
| Single Male/Father | 1,619 (4.8%) | 2.71 |
| Single Female/Mother | 4,323 (12.9%) | 2.96 |
| Total Families | 33,416 (100.0%) | 3.00 |
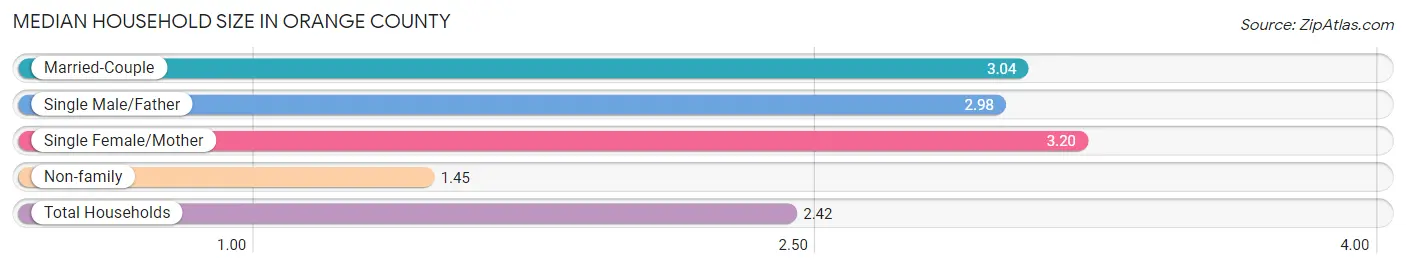
Median Household Size in Orange County
The median household size in Orange County is 2.42 persons per household, with single female/mother households (4,323 | 7.8%) accounting for the largest median household size of 3.2 persons per household. non-family households (22,118 | 39.8%) represent the smallest median household size with 1.45 persons per household.
| Household Type | # Households | Household Size |
| Married-Couple | 27,474 (49.5%) | 3.04 |
| Single Male/Father | 1,619 (2.9%) | 2.98 |
| Single Female/Mother | 4,323 (7.8%) | 3.20 |
| Non-family | 22,118 (39.8%) | 1.45 |
| Total Households | 55,534 (100.0%) | 2.42 |
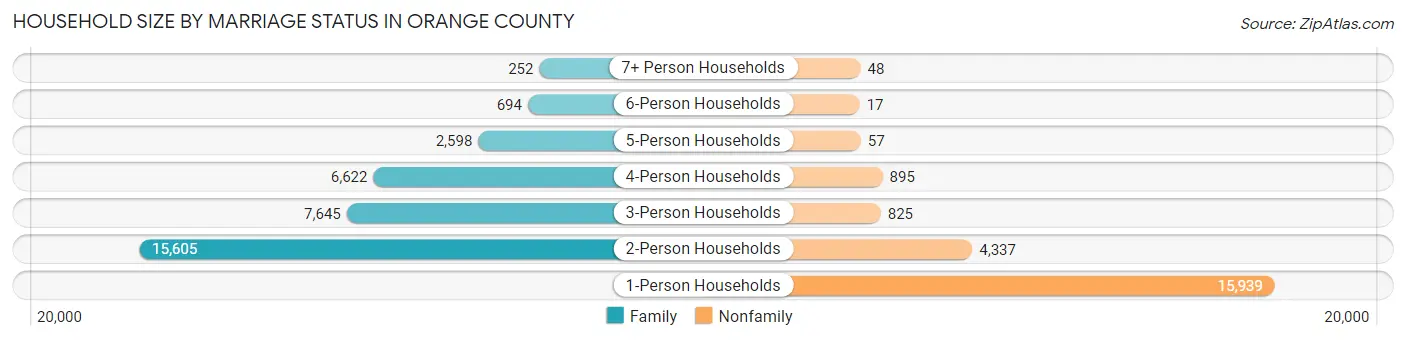
Household Size by Marriage Status in Orange County
Out of a total of 55,534 households in Orange County, 33,416 (60.2%) are family households, while 22,118 (39.8%) are nonfamily households. The most numerous type of family households are 2-person households, comprising 15,605, and the most common type of nonfamily households are 1-person households, comprising 15,939.
| Household Size | Family Households | Nonfamily Households |
| 1-Person Households | - | 15,939 (28.7%) |
| 2-Person Households | 15,605 (28.1%) | 4,337 (7.8%) |
| 3-Person Households | 7,645 (13.8%) | 825 (1.5%) |
| 4-Person Households | 6,622 (11.9%) | 895 (1.6%) |
| 5-Person Households | 2,598 (4.7%) | 57 (0.1%) |
| 6-Person Households | 694 (1.3%) | 17 (0.0%) |
| 7+ Person Households | 252 (0.4%) | 48 (0.1%) |
| Total | 33,416 (60.2%) | 22,118 (39.8%) |
Female Fertility in Orange County
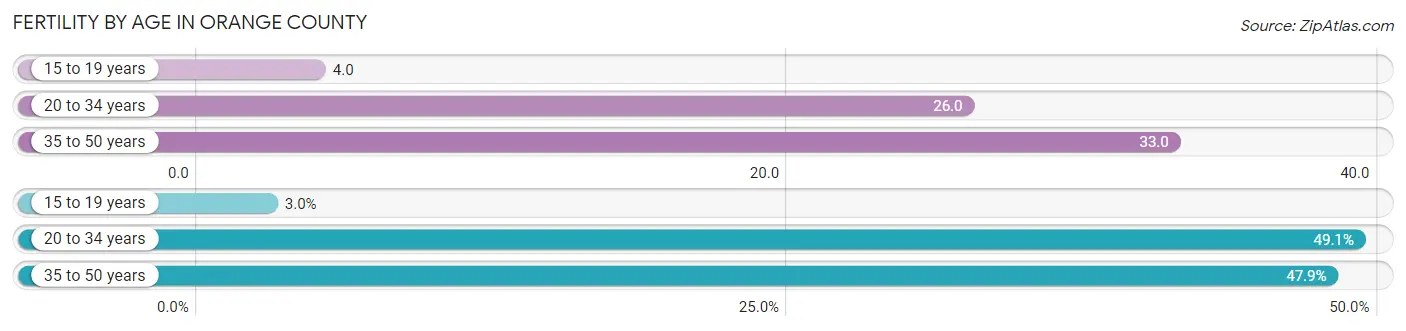
Fertility by Age in Orange County
Average fertility rate in Orange County is 24.0 births per 1,000 women. Women in the age bracket of 35 to 50 years have the highest fertility rate with 33.0 births per 1,000 women. Women in the age bracket of 20 to 34 years acount for 49.1% of all women with births.
| Age Bracket | Women with Births | Births / 1,000 Women |
| 15 to 19 years | 28 (3.0%) | 4.0 |
| 20 to 34 years | 465 (49.1%) | 26.0 |
| 35 to 50 years | 454 (47.9%) | 33.0 |
| Total | 947 (100.0%) | 24.0 |
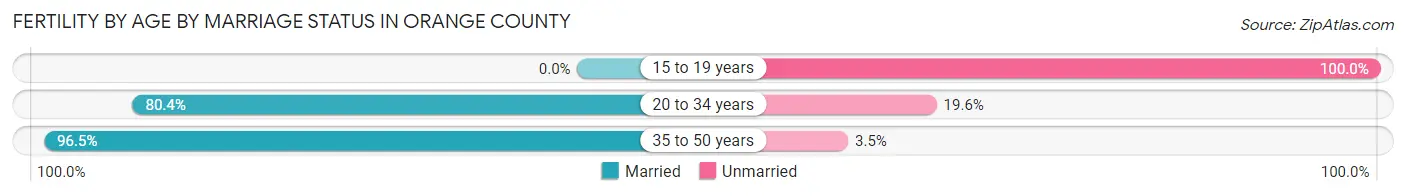
Fertility by Age by Marriage Status in Orange County
85.7% of women with births (947) in Orange County are married. The highest percentage of unmarried women with births falls into 15 to 19 years age bracket with 100.0% of them unmarried at the time of birth, while the lowest percentage of unmarried women with births belong to 35 to 50 years age bracket with 3.5% of them unmarried.
| Age Bracket | Married | Unmarried |
| 15 to 19 years | 0 (0.0%) | 28 (100.0%) |
| 20 to 34 years | 374 (80.4%) | 91 (19.6%) |
| 35 to 50 years | 438 (96.5%) | 16 (3.5%) |
| Total | 812 (85.7%) | 135 (14.3%) |
Fertility by Education in Orange County
Average fertility rate in Orange County is 24.0 births per 1,000 women. Women with the education attainment of graduate degree have the highest fertility rate of 46.0 births per 1,000 women, while women with the education attainment of less than high school have the lowest fertility at 2.0 births per 1,000 women. Women with the education attainment of graduate degree represent 42.4% of all women with births.
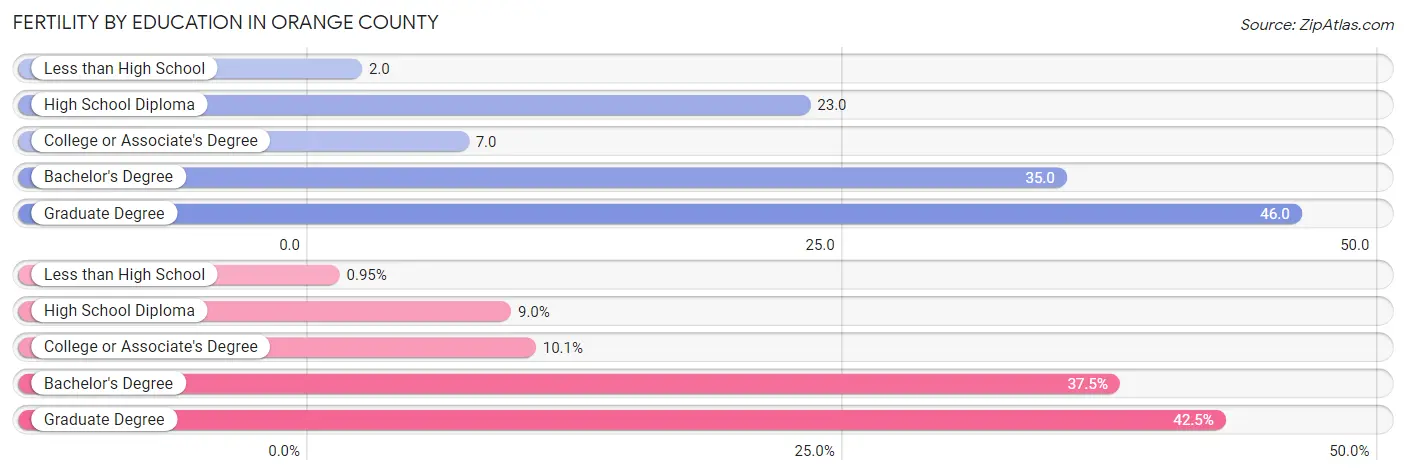
| Educational Attainment | Women with Births | Births / 1,000 Women |
| Less than High School | 9 (0.9%) | 2.0 |
| High School Diploma | 85 (9.0%) | 23.0 |
| College or Associate's Degree | 96 (10.1%) | 7.0 |
| Bachelor's Degree | 355 (37.5%) | 35.0 |
| Graduate Degree | 402 (42.4%) | 46.0 |
| Total | 947 (100.0%) | 24.0 |
Fertility by Education by Marriage Status in Orange County
14.3% of women with births in Orange County are unmarried. Women with the educational attainment of graduate degree are most likely to be married with 100.0% of them married at childbirth, while women with the educational attainment of high school diploma are least likely to be married with 84.7% of them unmarried at childbirth.
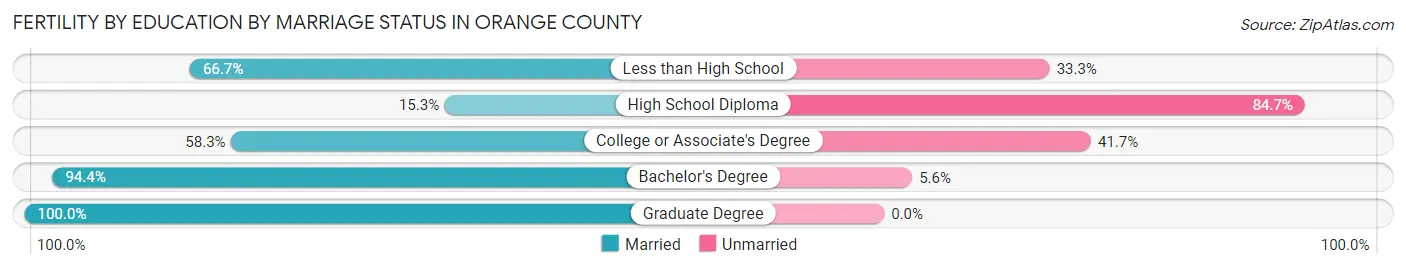
| Educational Attainment | Married | Unmarried |
| Less than High School | 6 (66.7%) | 3 (33.3%) |
| High School Diploma | 13 (15.3%) | 72 (84.7%) |
| College or Associate's Degree | 56 (58.3%) | 40 (41.7%) |
| Bachelor's Degree | 335 (94.4%) | 20 (5.6%) |
| Graduate Degree | 402 (100.0%) | 0 (0.0%) |
| Total | 812 (85.7%) | 135 (14.3%) |
Income in Orange County
Income Overview in Orange County
Per Capita Income in Orange County is $50,449, while median incomes of families and households are $122,332 and $85,785 respectively.
| Characteristic | Number | Measure |
| Per Capita Income | 145,919 | $50,449 |
| Median Family Income | 33,416 | $122,332 |
| Mean Family Income | 33,416 | $169,380 |
| Median Household Income | 55,534 | $85,785 |
| Mean Household Income | 55,534 | $130,452 |
| Income Deficit | 33,416 | $11,350 |
| Wage / Income Gap (%) | 145,919 | 26.25% |
| Wage / Income Gap ($) | 145,919 | 73.75¢ per $1 |
| Gini / Inequality Index | 145,919 | 0.51 |
Earnings by Sex in Orange County
Average Earnings in Orange County are $40,259, $45,536 for men and $33,584 for women, a difference of 26.3%.
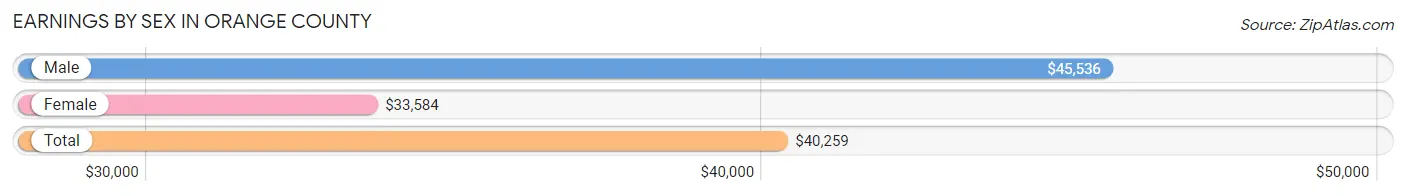
| Sex | Number | Average Earnings |
| Male | 41,894 (50.2%) | $45,536 |
| Female | 41,618 (49.8%) | $33,584 |
| Total | 83,512 (100.0%) | $40,259 |
Earnings by Sex by Income Bracket in Orange County
The most common earnings brackets in Orange County are $100,000+ for men (10,698 | 25.5%) and $100,000+ for women (5,998 | 14.4%).
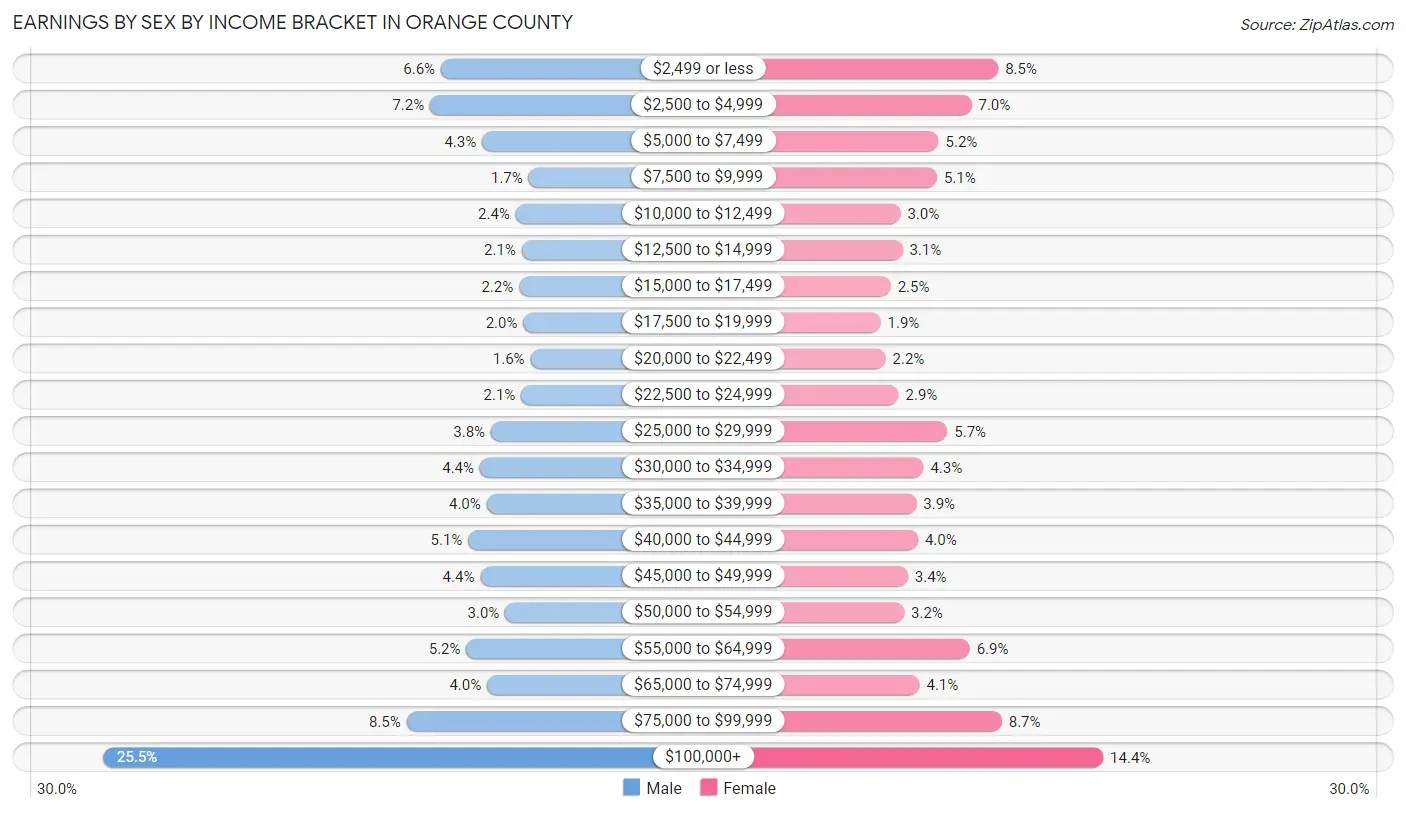
| Income | Male | Female |
| $2,499 or less | 2,766 (6.6%) | 3,541 (8.5%) |
| $2,500 to $4,999 | 3,021 (7.2%) | 2,919 (7.0%) |
| $5,000 to $7,499 | 1,798 (4.3%) | 2,147 (5.2%) |
| $7,500 to $9,999 | 698 (1.7%) | 2,108 (5.1%) |
| $10,000 to $12,499 | 1,004 (2.4%) | 1,256 (3.0%) |
| $12,500 to $14,999 | 863 (2.1%) | 1,303 (3.1%) |
| $15,000 to $17,499 | 925 (2.2%) | 1,029 (2.5%) |
| $17,500 to $19,999 | 826 (2.0%) | 789 (1.9%) |
| $20,000 to $22,499 | 658 (1.6%) | 907 (2.2%) |
| $22,500 to $24,999 | 875 (2.1%) | 1,210 (2.9%) |
| $25,000 to $29,999 | 1,589 (3.8%) | 2,352 (5.7%) |
| $30,000 to $34,999 | 1,846 (4.4%) | 1,794 (4.3%) |
| $35,000 to $39,999 | 1,689 (4.0%) | 1,627 (3.9%) |
| $40,000 to $44,999 | 2,124 (5.1%) | 1,666 (4.0%) |
| $45,000 to $49,999 | 1,841 (4.4%) | 1,426 (3.4%) |
| $50,000 to $54,999 | 1,254 (3.0%) | 1,341 (3.2%) |
| $55,000 to $64,999 | 2,167 (5.2%) | 2,874 (6.9%) |
| $65,000 to $74,999 | 1,678 (4.0%) | 1,704 (4.1%) |
| $75,000 to $99,999 | 3,574 (8.5%) | 3,627 (8.7%) |
| $100,000+ | 10,698 (25.5%) | 5,998 (14.4%) |
| Total | 41,894 (100.0%) | 41,618 (100.0%) |
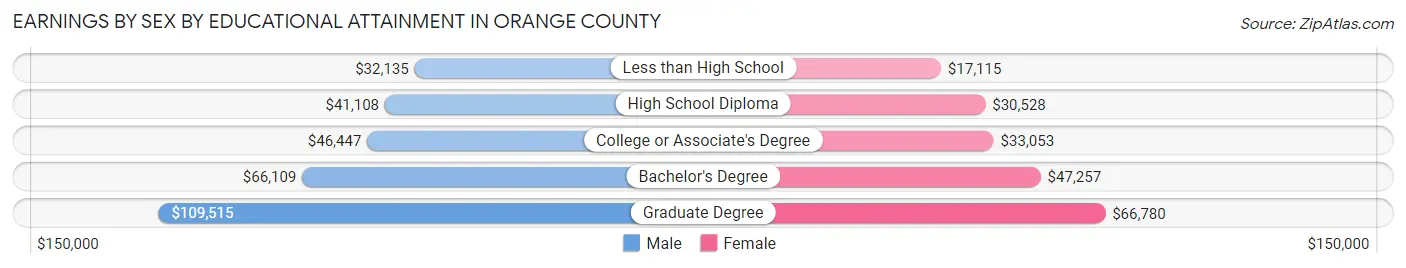
Earnings by Sex by Educational Attainment in Orange County
Average earnings in Orange County are $60,783 for men and $47,346 for women, a difference of 22.1%. Men with an educational attainment of graduate degree enjoy the highest average annual earnings of $109,515, while those with less than high school education earn the least with $32,135. Women with an educational attainment of graduate degree earn the most with the average annual earnings of $66,780, while those with less than high school education have the smallest earnings of $17,115.
| Educational Attainment | Male Income | Female Income |
| Less than High School | $32,135 | $17,115 |
| High School Diploma | $41,108 | $30,528 |
| College or Associate's Degree | $46,447 | $33,053 |
| Bachelor's Degree | $66,109 | $47,257 |
| Graduate Degree | $109,515 | $66,780 |
| Total | $60,783 | $47,346 |
Family Income in Orange County
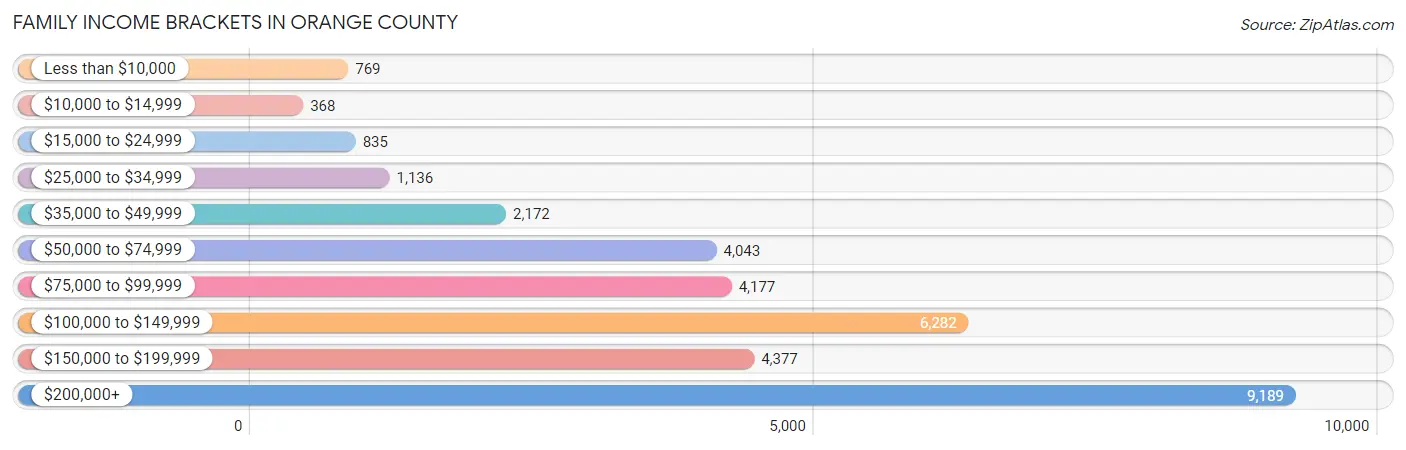
Family Income Brackets in Orange County
According to the Orange County family income data, there are 9,189 families falling into the $200,000+ income range, which is the most common income bracket and makes up 27.5% of all families. Conversely, the $10,000 to $14,999 income bracket is the least frequent group with only 368 families (1.1%) belonging to this category.
| Income Bracket | # Families | % Families |
| Less than $10,000 | 769 | 2.3% |
| $10,000 to $14,999 | 368 | 1.1% |
| $15,000 to $24,999 | 835 | 2.5% |
| $25,000 to $34,999 | 1,136 | 3.4% |
| $35,000 to $49,999 | 2,172 | 6.5% |
| $50,000 to $74,999 | 4,043 | 12.1% |
| $75,000 to $99,999 | 4,177 | 12.5% |
| $100,000 to $149,999 | 6,282 | 18.8% |
| $150,000 to $199,999 | 4,377 | 13.1% |
| $200,000+ | 9,189 | 27.5% |
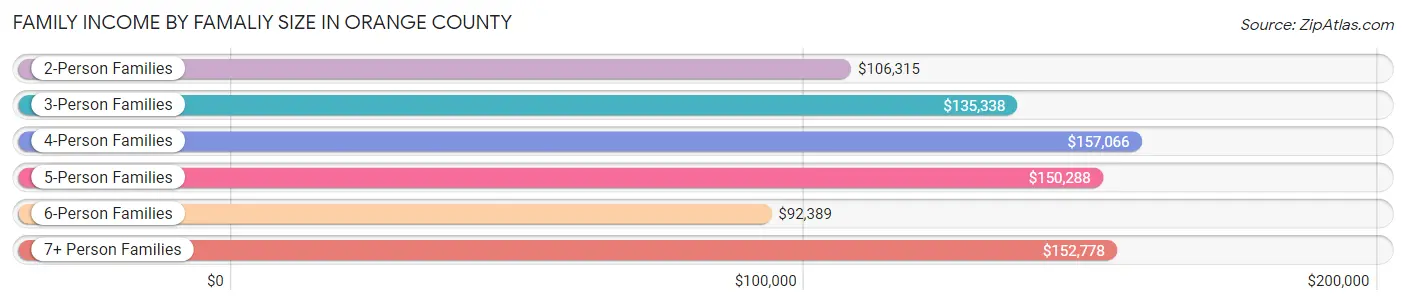
Family Income by Famaliy Size in Orange County
4-person families (6,641 | 19.9%) account for the highest median family income in Orange County with $157,066 per family, while 2-person families (16,171 | 48.4%) have the highest median income of $53,158 per family member.
| Income Bracket | # Families | Median Income |
| 2-Person Families | 16,171 (48.4%) | $106,315 |
| 3-Person Families | 7,520 (22.5%) | $135,338 |
| 4-Person Families | 6,641 (19.9%) | $157,066 |
| 5-Person Families | 2,255 (6.8%) | $150,288 |
| 6-Person Families | 639 (1.9%) | $92,389 |
| 7+ Person Families | 190 (0.6%) | $152,778 |
| Total | 33,416 (100.0%) | $122,332 |
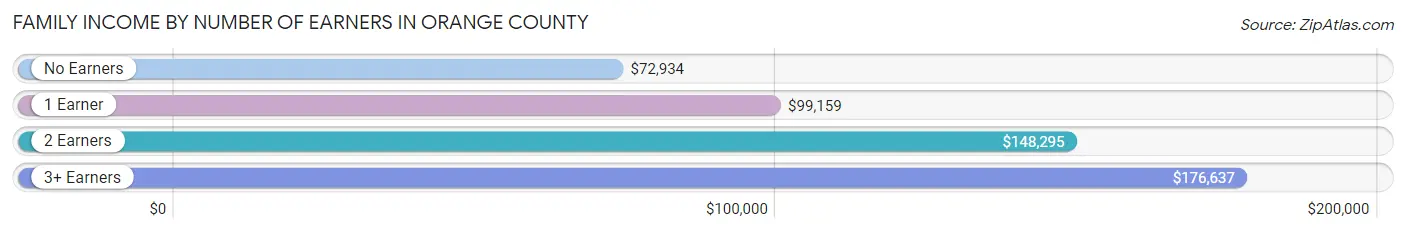
Family Income by Number of Earners in Orange County
The median family income in Orange County is $122,332, with families comprising 3+ earners (3,475) having the highest median family income of $176,637, while families with no earners (4,489) have the lowest median family income of $72,934, accounting for 10.4% and 13.4% of families, respectively.
| Number of Earners | # Families | Median Income |
| No Earners | 4,489 (13.4%) | $72,934 |
| 1 Earner | 9,589 (28.7%) | $99,159 |
| 2 Earners | 15,863 (47.5%) | $148,295 |
| 3+ Earners | 3,475 (10.4%) | $176,637 |
| Total | 33,416 (100.0%) | $122,332 |
Household Income in Orange County
Household Income Brackets in Orange County
With 10,218 households falling in the category, the $200,000+ income range is the most frequent in Orange County, accounting for 18.4% of all households. In contrast, only 1,722 households (3.1%) fall into the $10,000 to $14,999 income bracket, making it the least populous group.
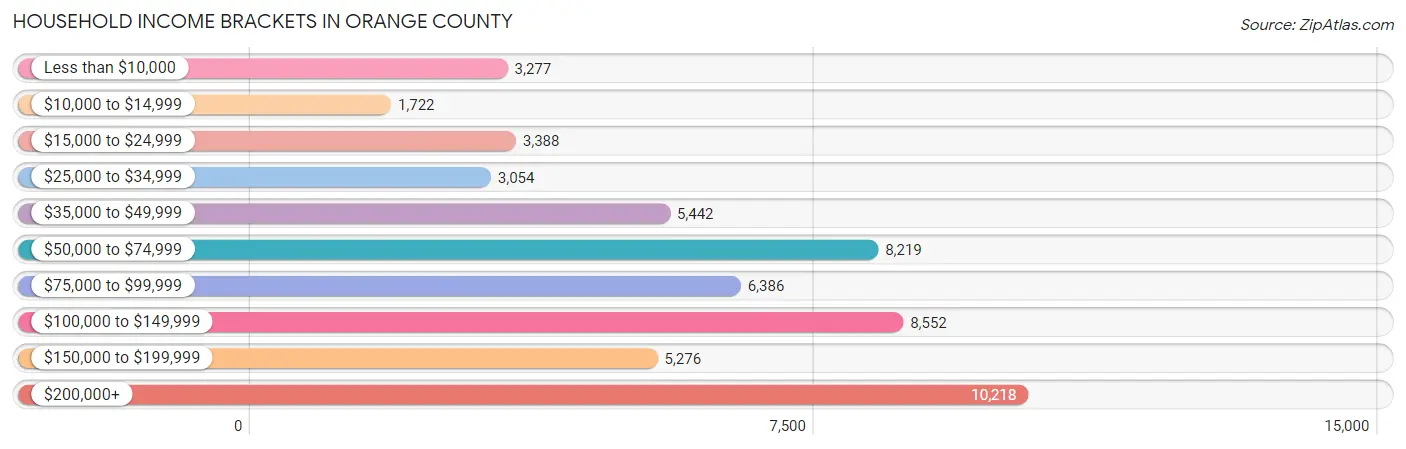
| Income Bracket | # Households | % Households |
| Less than $10,000 | 3,277 | 5.9% |
| $10,000 to $14,999 | 1,722 | 3.1% |
| $15,000 to $24,999 | 3,388 | 6.1% |
| $25,000 to $34,999 | 3,054 | 5.5% |
| $35,000 to $49,999 | 5,442 | 9.8% |
| $50,000 to $74,999 | 8,219 | 14.8% |
| $75,000 to $99,999 | 6,386 | 11.5% |
| $100,000 to $149,999 | 8,552 | 15.4% |
| $150,000 to $199,999 | 5,276 | 9.5% |
| $200,000+ | 10,218 | 18.4% |
Household Income by Householder Age in Orange County
The median household income in Orange County is $85,785, with the highest median household income of $114,993 found in the 45 to 64 years age bracket for the primary householder. A total of 20,012 households (36.0%) fall into this category. Meanwhile, the 15 to 24 years age bracket for the primary householder has the lowest median household income of $26,240, with 4,325 households (7.8%) in this group.
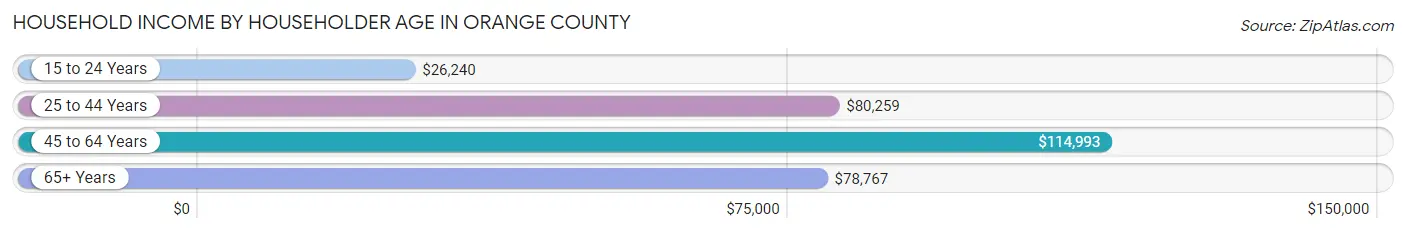
| Income Bracket | # Households | Median Income |
| 15 to 24 Years | 4,325 (7.8%) | $26,240 |
| 25 to 44 Years | 17,260 (31.1%) | $80,259 |
| 45 to 64 Years | 20,012 (36.0%) | $114,993 |
| 65+ Years | 13,937 (25.1%) | $78,767 |
| Total | 55,534 (100.0%) | $85,785 |
Poverty in Orange County
Income Below Poverty by Sex and Age in Orange County
With 9.9% poverty level for males and 14.5% for females among the residents of Orange County, 18 to 24 year old males and 18 to 24 year old females are the most vulnerable to poverty, with 2,227 males (31.6%) and 4,183 females (51.0%) in their respective age groups living below the poverty level.
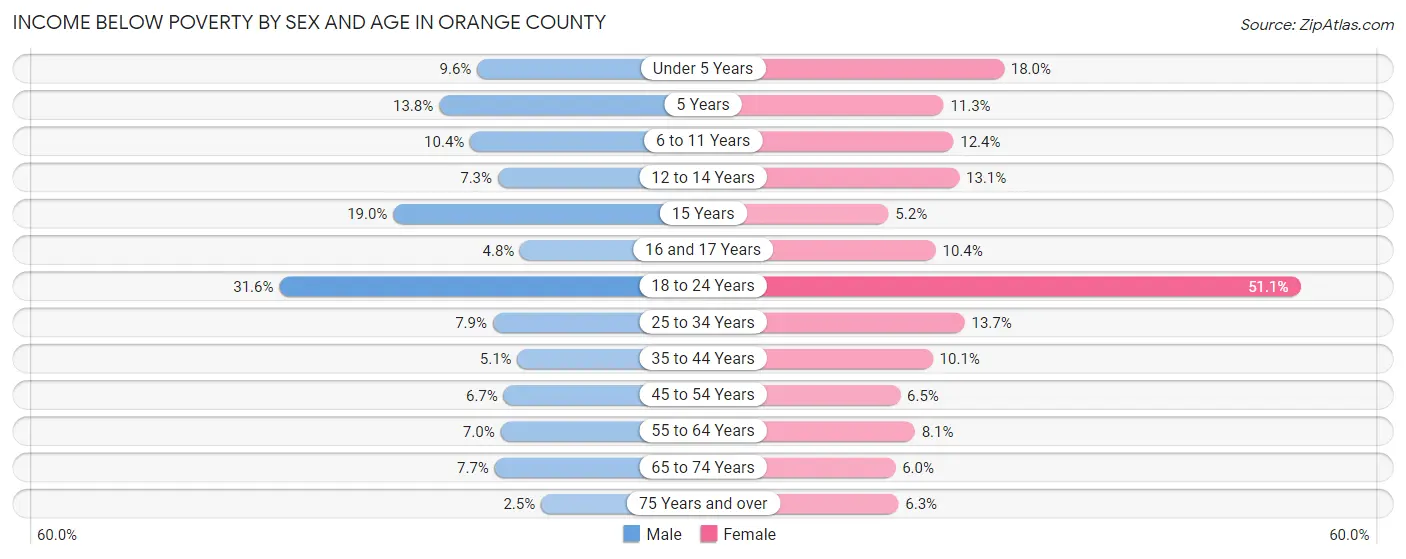
| Age Bracket | Male | Female |
| Under 5 Years | 294 (9.6%) | 553 (18.0%) |
| 5 Years | 80 (13.8%) | 54 (11.3%) |
| 6 to 11 Years | 516 (10.4%) | 597 (12.4%) |
| 12 to 14 Years | 196 (7.3%) | 327 (13.1%) |
| 15 Years | 163 (19.0%) | 48 (5.2%) |
| 16 and 17 Years | 97 (4.8%) | 181 (10.4%) |
| 18 to 24 Years | 2,227 (31.6%) | 4,183 (51.0%) |
| 25 to 34 Years | 664 (7.9%) | 1,202 (13.7%) |
| 35 to 44 Years | 410 (5.1%) | 871 (10.1%) |
| 45 to 54 Years | 592 (6.7%) | 595 (6.5%) |
| 55 to 64 Years | 582 (7.0%) | 740 (8.1%) |
| 65 to 74 Years | 504 (7.6%) | 433 (5.9%) |
| 75 Years and over | 82 (2.5%) | 312 (6.3%) |
| Total | 6,407 (9.9%) | 10,096 (14.5%) |
Income Above Poverty by Sex and Age in Orange County
According to the poverty statistics in Orange County, males aged 75 years and over and females aged 15 years are the age groups that are most secure financially, with 97.5% of males and 94.8% of females in these age groups living above the poverty line.
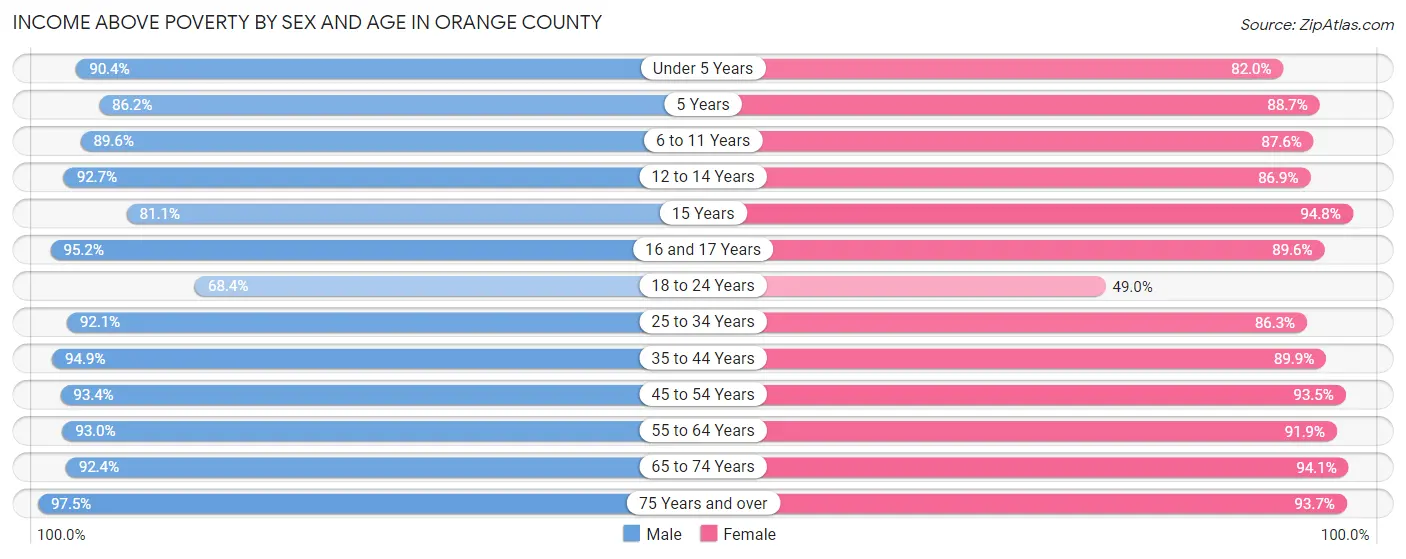
| Age Bracket | Male | Female |
| Under 5 Years | 2,770 (90.4%) | 2,513 (82.0%) |
| 5 Years | 498 (86.2%) | 423 (88.7%) |
| 6 to 11 Years | 4,453 (89.6%) | 4,211 (87.6%) |
| 12 to 14 Years | 2,493 (92.7%) | 2,176 (86.9%) |
| 15 Years | 697 (81.0%) | 877 (94.8%) |
| 16 and 17 Years | 1,920 (95.2%) | 1,552 (89.6%) |
| 18 to 24 Years | 4,812 (68.4%) | 4,011 (48.9%) |
| 25 to 34 Years | 7,786 (92.1%) | 7,588 (86.3%) |
| 35 to 44 Years | 7,619 (94.9%) | 7,738 (89.9%) |
| 45 to 54 Years | 8,312 (93.3%) | 8,571 (93.5%) |
| 55 to 64 Years | 7,731 (93.0%) | 8,377 (91.9%) |
| 65 to 74 Years | 6,088 (92.3%) | 6,849 (94.1%) |
| 75 Years and over | 3,218 (97.5%) | 4,642 (93.7%) |
| Total | 58,397 (90.1%) | 59,528 (85.5%) |
Income Below Poverty Among Married-Couple Families in Orange County
The poverty statistics for married-couple families in Orange County show that 2.7% or 731 of the total 27,474 families live below the poverty line. Families with 3 or 4 children have the highest poverty rate of 8.8%, comprising of 157 families. On the other hand, families with 5 or more children have the lowest poverty rate of 0.0%, which includes 0 families.
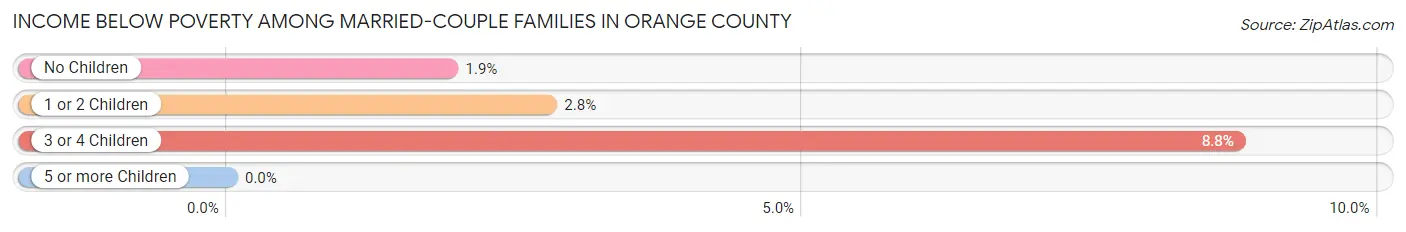
| Children | Above Poverty | Below Poverty |
| No Children | 15,580 (98.1%) | 305 (1.9%) |
| 1 or 2 Children | 9,413 (97.2%) | 269 (2.8%) |
| 3 or 4 Children | 1,633 (91.2%) | 157 (8.8%) |
| 5 or more Children | 117 (100.0%) | 0 (0.0%) |
| Total | 26,743 (97.3%) | 731 (2.7%) |
Income Below Poverty Among Single-Parent Households in Orange County
According to the poverty data in Orange County, 11.4% or 185 single-father households and 19.0% or 823 single-mother households are living below the poverty line. Among single-father households, those with 3 or 4 children have the highest poverty rate, with 36 households (20.6%) experiencing poverty. Likewise, among single-mother households, those with 3 or 4 children have the highest poverty rate, with 136 households (43.9%) falling below the poverty line.
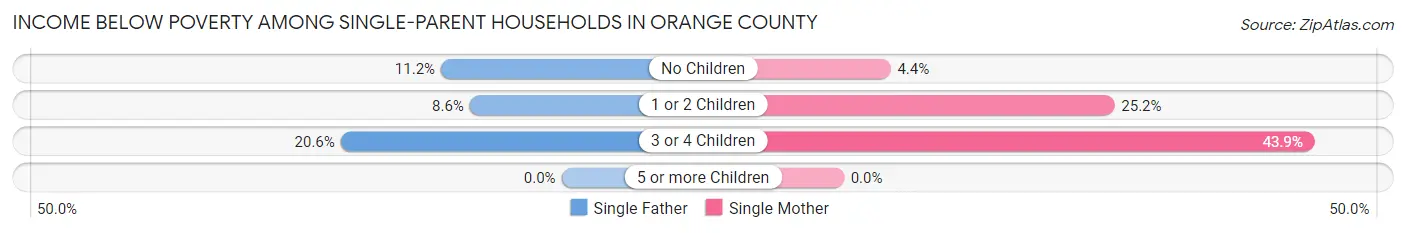
| Children | Single Father | Single Mother |
| No Children | 107 (11.2%) | 68 (4.4%) |
| 1 or 2 Children | 42 (8.6%) | 619 (25.2%) |
| 3 or 4 Children | 36 (20.6%) | 136 (43.9%) |
| 5 or more Children | 0 (0.0%) | 0 (0.0%) |
| Total | 185 (11.4%) | 823 (19.0%) |
Income Below Poverty Among Married-Couple vs Single-Parent Households in Orange County
The poverty data for Orange County shows that 731 of the married-couple family households (2.7%) and 1,008 of the single-parent households (17.0%) are living below the poverty level. Within the married-couple family households, those with 3 or 4 children have the highest poverty rate, with 157 households (8.8%) falling below the poverty line. Among the single-parent households, those with 3 or 4 children have the highest poverty rate, with 172 household (35.5%) living below poverty.
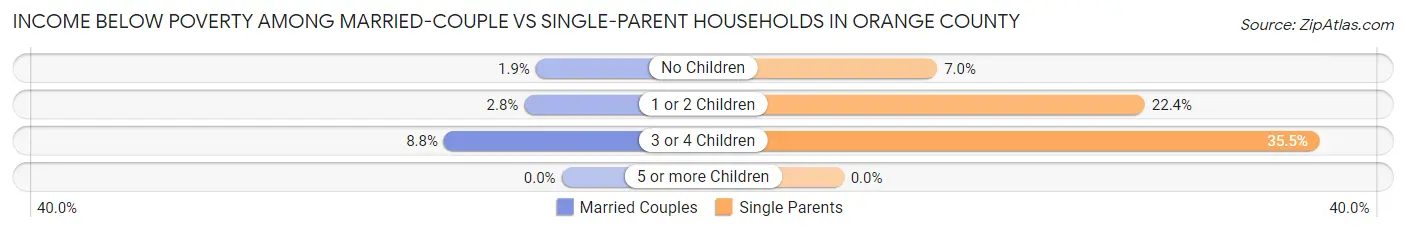
| Children | Married-Couple Families | Single-Parent Households |
| No Children | 305 (1.9%) | 175 (7.0%) |
| 1 or 2 Children | 269 (2.8%) | 661 (22.4%) |
| 3 or 4 Children | 157 (8.8%) | 172 (35.5%) |
| 5 or more Children | 0 (0.0%) | 0 (0.0%) |
| Total | 731 (2.7%) | 1,008 (17.0%) |
Employment Characteristics in Orange County
Employment by Class of Employer in Orange County
Among the 69,679 employed individuals in Orange County, private company employees (35,865 | 51.5%), state government employees (11,794 | 16.9%), and not-for-profit organizations (9,266 | 13.3%) make up the most common classes of employment.
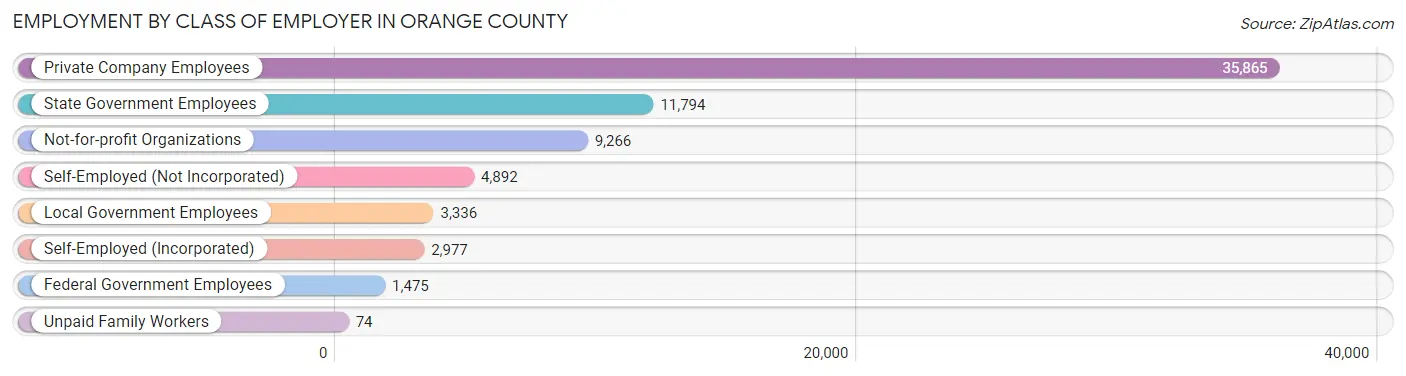
| Employer Class | # Employees | % Employees |
| Private Company Employees | 35,865 | 51.5% |
| Self-Employed (Incorporated) | 2,977 | 4.3% |
| Self-Employed (Not Incorporated) | 4,892 | 7.0% |
| Not-for-profit Organizations | 9,266 | 13.3% |
| Local Government Employees | 3,336 | 4.8% |
| State Government Employees | 11,794 | 16.9% |
| Federal Government Employees | 1,475 | 2.1% |
| Unpaid Family Workers | 74 | 0.1% |
| Total | 69,679 | 100.0% |
Employment Status by Age in Orange County
According to the labor force statistics for Orange County, out of the total population over 16 years of age (121,673), 61.9% or 75,316 individuals are in the labor force, with 3.9% or 2,937 of them unemployed. The age group with the highest labor force participation rate is 35 to 44 years, with 86.5% or 14,555 individuals in the labor force. Within the labor force, the 20 to 24 years age range has the highest percentage of unemployed individuals, with 8.1% or 783 of them being unemployed.
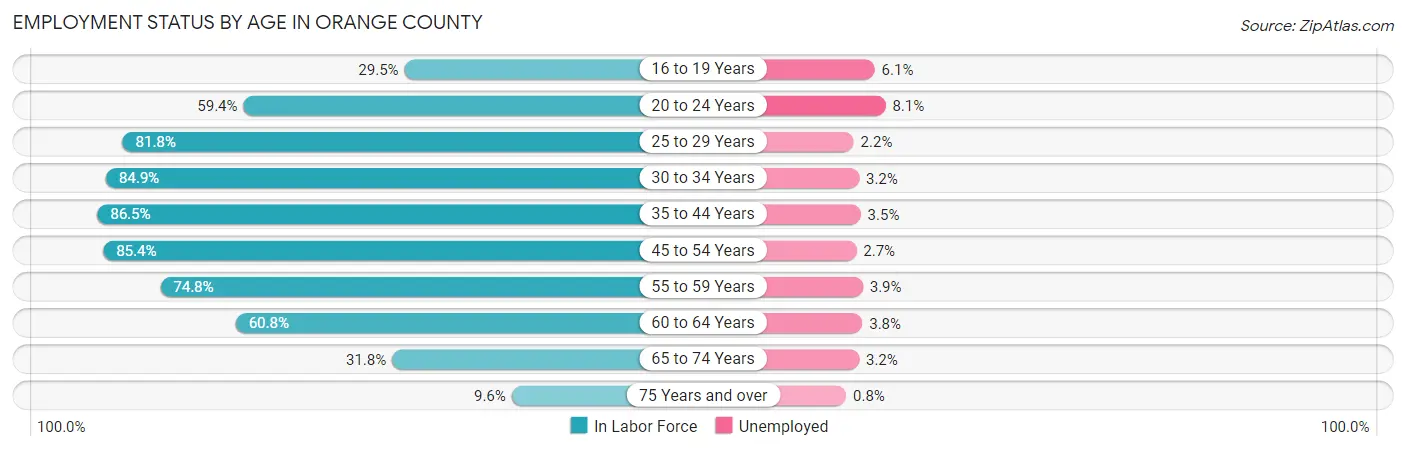
| Age Bracket | In Labor Force | Unemployed |
| 16 to 19 Years | 3,807 (29.5%) | 232 (6.1%) |
| 20 to 24 Years | 9,672 (59.4%) | 783 (8.1%) |
| 25 to 29 Years | 7,755 (81.8%) | 171 (2.2%) |
| 30 to 34 Years | 6,814 (84.9%) | 218 (3.2%) |
| 35 to 44 Years | 14,555 (86.5%) | 509 (3.5%) |
| 45 to 54 Years | 15,562 (85.4%) | 420 (2.7%) |
| 55 to 59 Years | 6,586 (74.8%) | 257 (3.9%) |
| 60 to 64 Years | 5,273 (60.8%) | 200 (3.8%) |
| 65 to 74 Years | 4,421 (31.8%) | 141 (3.2%) |
| 75 Years and over | 821 (9.6%) | 7 (0.8%) |
| Total | 75,316 (61.9%) | 2,937 (3.9%) |
Employment Status by Educational Attainment in Orange County
According to labor force statistics for Orange County, 80.7% of individuals (56,518) out of the total population between 25 and 64 years of age (70,035) are in the labor force, with 3.1% or 1,752 of them being unemployed. The group with the highest labor force participation rate are those with the educational attainment of bachelor's degree or higher, with 85.3% or 38,015 individuals in the labor force. Within the labor force, individuals with high school diploma education have the highest percentage of unemployment, with 5.4% or 286 of them being unemployed.
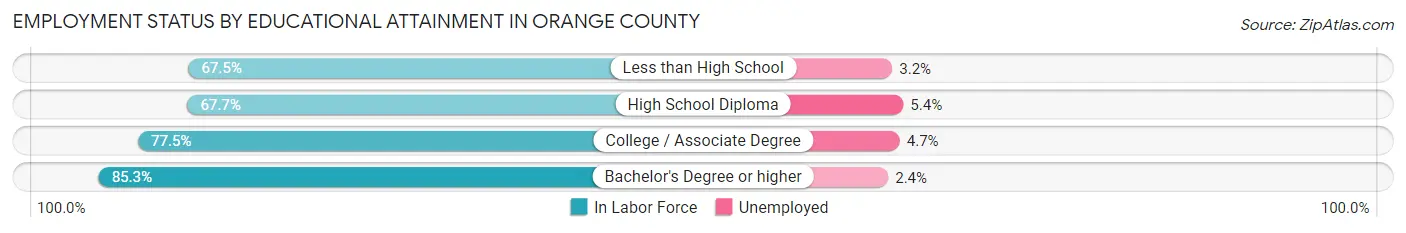
| Educational Attainment | In Labor Force | Unemployed |
| Less than High School | 2,930 (67.5%) | 139 (3.2%) |
| High School Diploma | 5,293 (67.7%) | 422 (5.4%) |
| College / Associate Degree | 10,316 (77.5%) | 626 (4.7%) |
| Bachelor's Degree or higher | 38,015 (85.3%) | 1,070 (2.4%) |
| Total | 56,518 (80.7%) | 2,171 (3.1%) |
Employment Occupations by Sex in Orange County
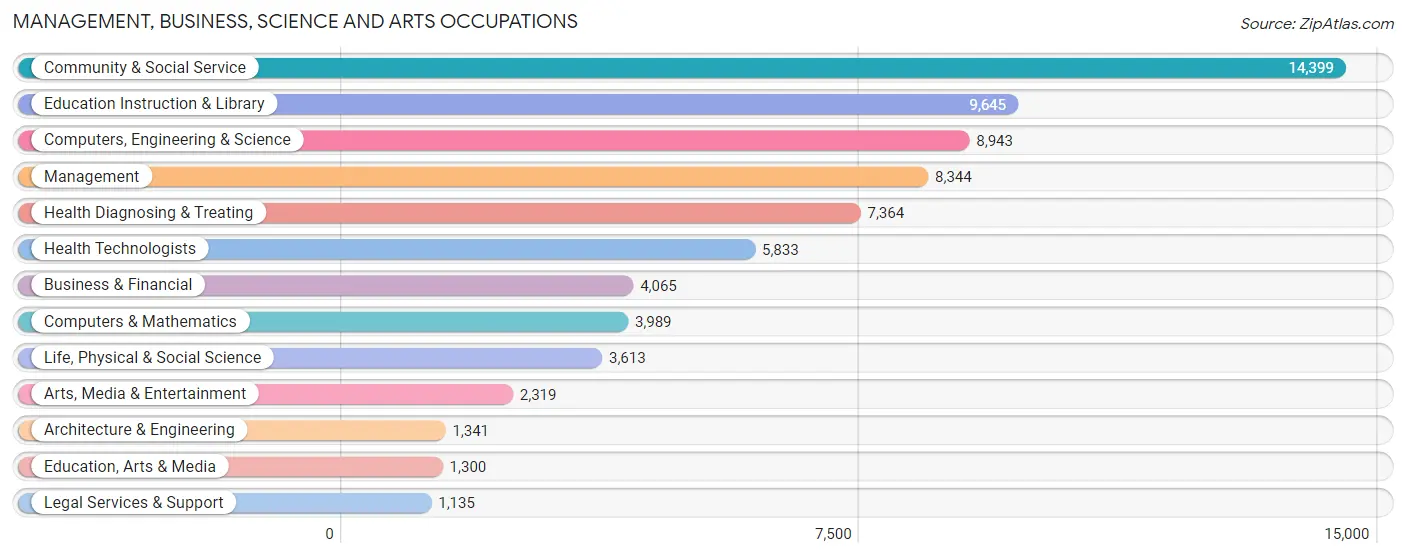
Management, Business, Science and Arts Occupations
The most common Management, Business, Science and Arts occupations in Orange County are Community & Social Service (14,399 | 19.9%), Education Instruction & Library (9,645 | 13.3%), Computers, Engineering & Science (8,943 | 12.4%), Management (8,344 | 11.5%), and Health Diagnosing & Treating (7,364 | 10.2%).
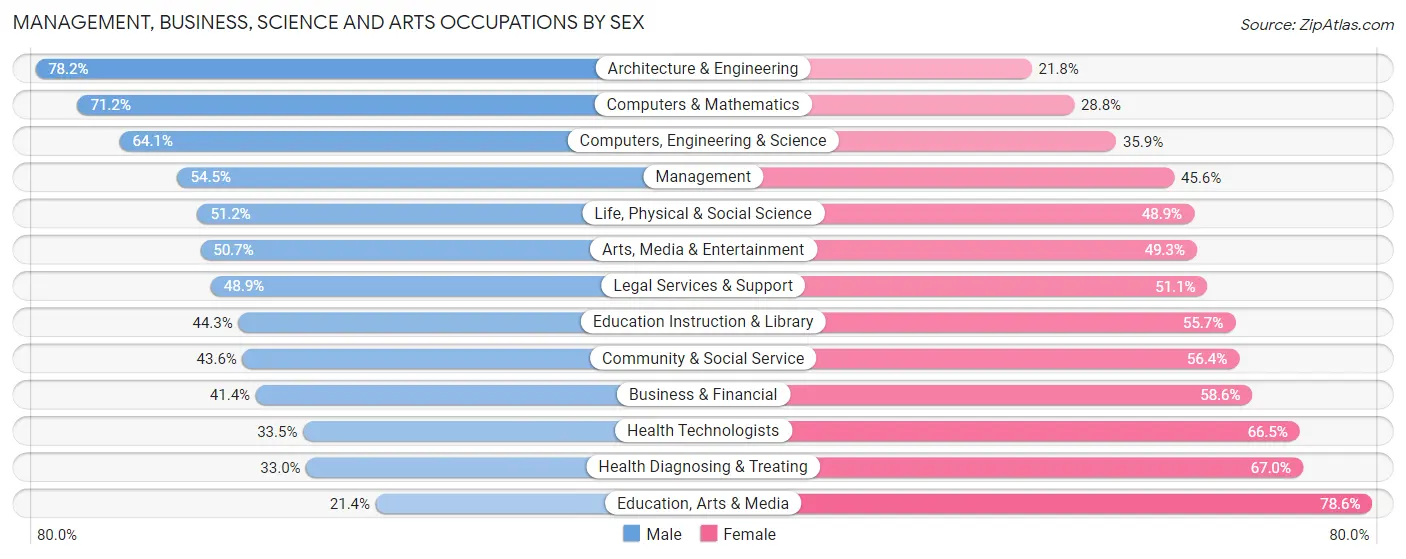
Management, Business, Science and Arts Occupations by Sex
Within the Management, Business, Science and Arts occupations in Orange County, the most male-oriented occupations are Architecture & Engineering (78.2%), Computers & Mathematics (71.2%), and Computers, Engineering & Science (64.1%), while the most female-oriented occupations are Education, Arts & Media (78.6%), Health Diagnosing & Treating (67.0%), and Health Technologists (66.5%).
| Occupation | Male | Female |
| Management | 4,543 (54.4%) | 3,801 (45.6%) |
| Business & Financial | 1,683 (41.4%) | 2,382 (58.6%) |
| Computers, Engineering & Science | 5,736 (64.1%) | 3,207 (35.9%) |
| Computers & Mathematics | 2,839 (71.2%) | 1,150 (28.8%) |
| Architecture & Engineering | 1,049 (78.2%) | 292 (21.8%) |
| Life, Physical & Social Science | 1,848 (51.1%) | 1,765 (48.8%) |
| Community & Social Service | 6,280 (43.6%) | 8,119 (56.4%) |
| Education, Arts & Media | 278 (21.4%) | 1,022 (78.6%) |
| Legal Services & Support | 555 (48.9%) | 580 (51.1%) |
| Education Instruction & Library | 4,272 (44.3%) | 5,373 (55.7%) |
| Arts, Media & Entertainment | 1,175 (50.7%) | 1,144 (49.3%) |
| Health Diagnosing & Treating | 2,428 (33.0%) | 4,936 (67.0%) |
| Health Technologists | 1,954 (33.5%) | 3,879 (66.5%) |
| Total (Category) | 20,670 (47.9%) | 22,445 (52.1%) |
| Total (Overall) | 35,985 (49.8%) | 36,318 (50.2%) |
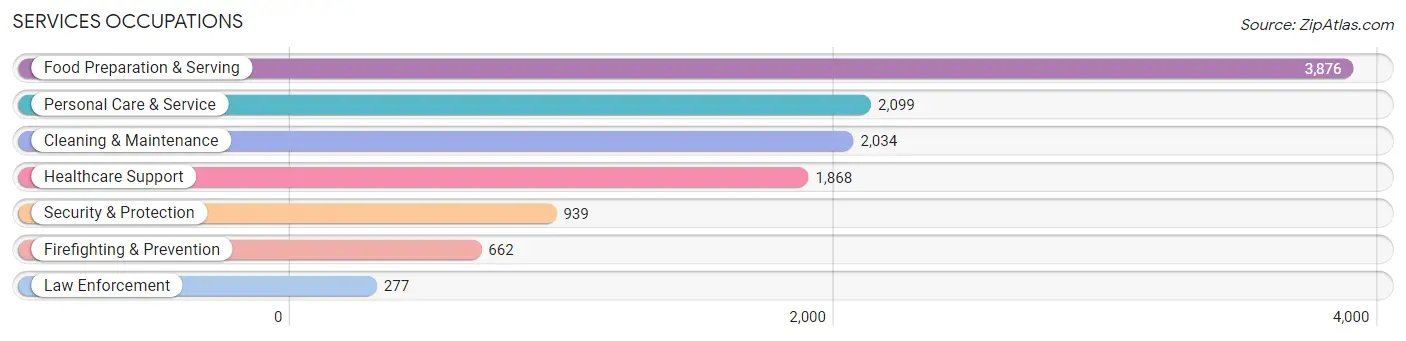
Services Occupations
The most common Services occupations in Orange County are Food Preparation & Serving (3,876 | 5.4%), Personal Care & Service (2,099 | 2.9%), Cleaning & Maintenance (2,034 | 2.8%), Healthcare Support (1,868 | 2.6%), and Security & Protection (939 | 1.3%).
Services Occupations by Sex
Within the Services occupations in Orange County, the most male-oriented occupations are Cleaning & Maintenance (76.2%), Law Enforcement (74.0%), and Security & Protection (49.8%), while the most female-oriented occupations are Healthcare Support (85.0%), Personal Care & Service (66.9%), and Food Preparation & Serving (60.8%).

| Occupation | Male | Female |
| Healthcare Support | 280 (15.0%) | 1,588 (85.0%) |
| Security & Protection | 468 (49.8%) | 471 (50.2%) |
| Firefighting & Prevention | 263 (39.7%) | 399 (60.3%) |
| Law Enforcement | 205 (74.0%) | 72 (26.0%) |
| Food Preparation & Serving | 1,518 (39.2%) | 2,358 (60.8%) |
| Cleaning & Maintenance | 1,549 (76.2%) | 485 (23.8%) |
| Personal Care & Service | 695 (33.1%) | 1,404 (66.9%) |
| Total (Category) | 4,510 (41.7%) | 6,306 (58.3%) |
| Total (Overall) | 35,985 (49.8%) | 36,318 (50.2%) |
Sales and Office Occupations
The most common Sales and Office occupations in Orange County are Office & Administration (5,255 | 7.3%), and Sales & Related (5,251 | 7.3%).

Sales and Office Occupations by Sex

| Occupation | Male | Female |
| Sales & Related | 2,715 (51.7%) | 2,536 (48.3%) |
| Office & Administration | 1,601 (30.5%) | 3,654 (69.5%) |
| Total (Category) | 4,316 (41.1%) | 6,190 (58.9%) |
| Total (Overall) | 35,985 (49.8%) | 36,318 (50.2%) |
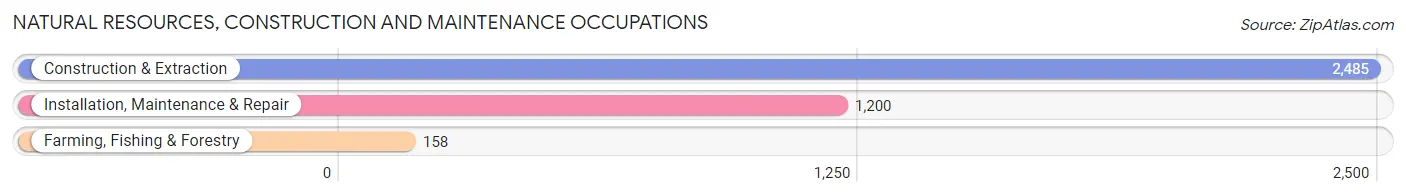
Natural Resources, Construction and Maintenance Occupations
The most common Natural Resources, Construction and Maintenance occupations in Orange County are Construction & Extraction (2,485 | 3.4%), Installation, Maintenance & Repair (1,200 | 1.7%), and Farming, Fishing & Forestry (158 | 0.2%).
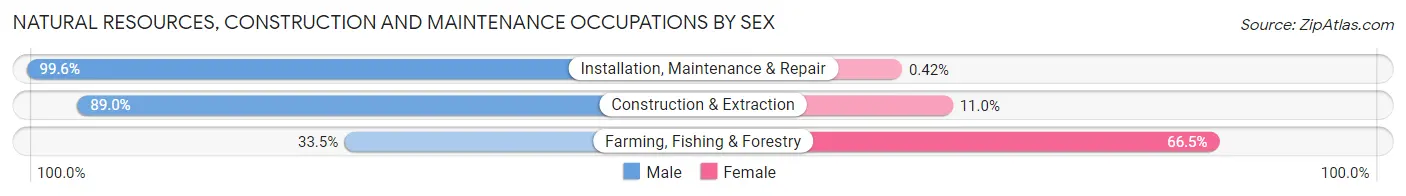
Natural Resources, Construction and Maintenance Occupations by Sex
| Occupation | Male | Female |
| Farming, Fishing & Forestry | 53 (33.5%) | 105 (66.5%) |
| Construction & Extraction | 2,212 (89.0%) | 273 (11.0%) |
| Installation, Maintenance & Repair | 1,195 (99.6%) | 5 (0.4%) |
| Total (Category) | 3,460 (90.0%) | 383 (10.0%) |
| Total (Overall) | 35,985 (49.8%) | 36,318 (50.2%) |
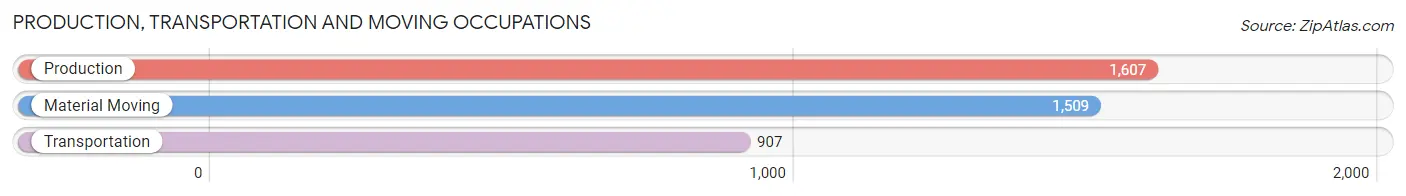
Production, Transportation and Moving Occupations
The most common Production, Transportation and Moving occupations in Orange County are Production (1,607 | 2.2%), Material Moving (1,509 | 2.1%), and Transportation (907 | 1.3%).
Production, Transportation and Moving Occupations by Sex
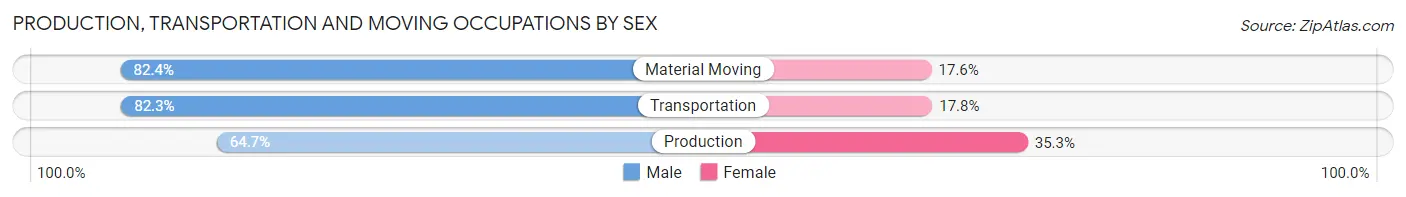
| Occupation | Male | Female |
| Production | 1,040 (64.7%) | 567 (35.3%) |
| Transportation | 746 (82.3%) | 161 (17.7%) |
| Material Moving | 1,243 (82.4%) | 266 (17.6%) |
| Total (Category) | 3,029 (75.3%) | 994 (24.7%) |
| Total (Overall) | 35,985 (49.8%) | 36,318 (50.2%) |
Employment Industries by Sex in Orange County
Employment Industries in Orange County
The major employment industries in Orange County include Educational Services (16,267 | 22.5%), Health Care & Social Assistance (11,387 | 15.8%), Professional & Scientific (9,116 | 12.6%), Retail Trade (5,709 | 7.9%), and Accommodation & Food Services (4,979 | 6.9%).

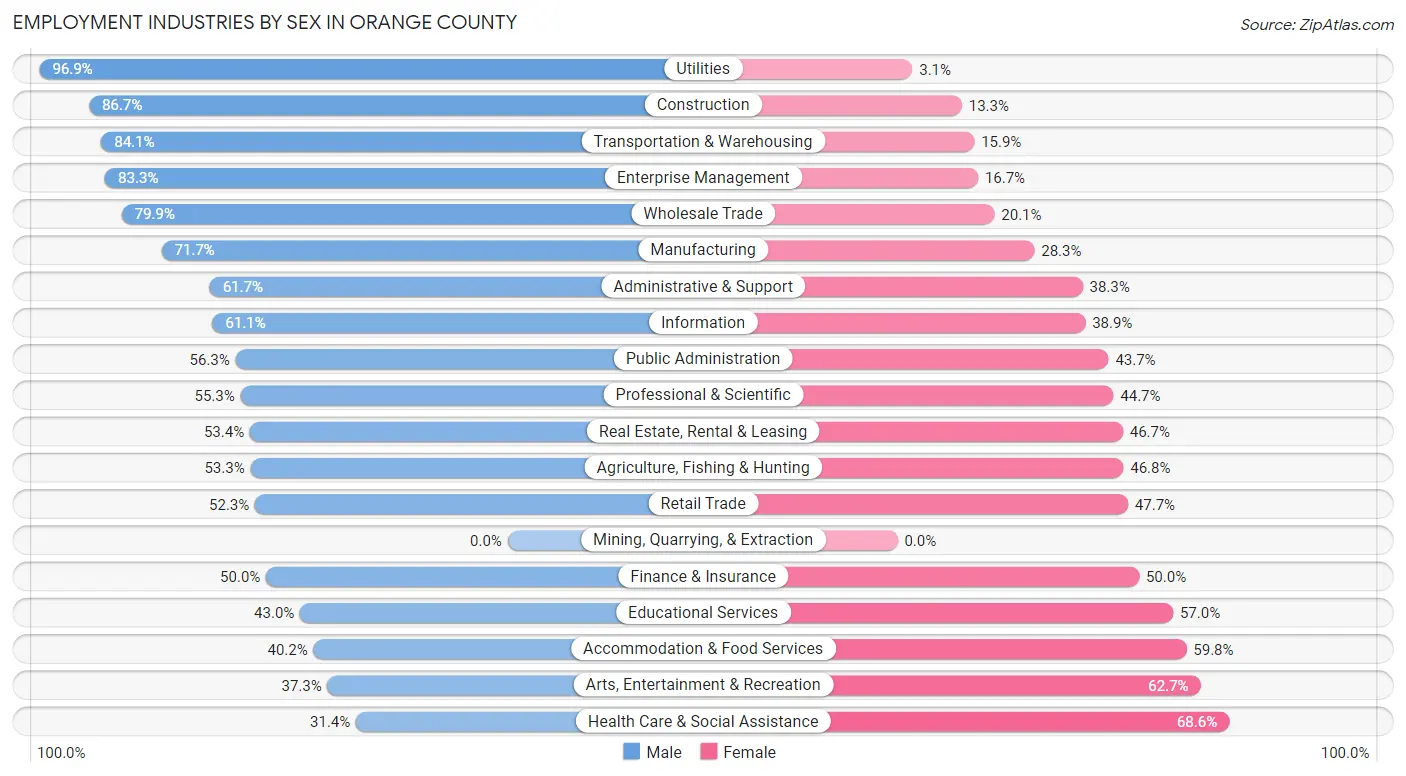
Employment Industries by Sex in Orange County
The Orange County industries that see more men than women are Utilities (96.9%), Construction (86.7%), and Transportation & Warehousing (84.1%), whereas the industries that tend to have a higher number of women are Health Care & Social Assistance (68.6%), Arts, Entertainment & Recreation (62.7%), and Accommodation & Food Services (59.8%).
| Industry | Male | Female |
| Agriculture, Fishing & Hunting | 254 (53.2%) | 223 (46.8%) |
| Mining, Quarrying, & Extraction | 0 (0.0%) | 0 (0.0%) |
| Construction | 2,673 (86.7%) | 411 (13.3%) |
| Manufacturing | 3,058 (71.7%) | 1,209 (28.3%) |
| Wholesale Trade | 657 (79.9%) | 165 (20.1%) |
| Retail Trade | 2,985 (52.3%) | 2,724 (47.7%) |
| Transportation & Warehousing | 868 (84.1%) | 164 (15.9%) |
| Utilities | 503 (96.9%) | 16 (3.1%) |
| Information | 945 (61.1%) | 601 (38.9%) |
| Finance & Insurance | 1,056 (50.0%) | 1,056 (50.0%) |
| Real Estate, Rental & Leasing | 684 (53.3%) | 598 (46.7%) |
| Professional & Scientific | 5,041 (55.3%) | 4,075 (44.7%) |
| Enterprise Management | 10 (83.3%) | 2 (16.7%) |
| Administrative & Support | 1,505 (61.7%) | 935 (38.3%) |
| Educational Services | 6,988 (43.0%) | 9,279 (57.0%) |
| Health Care & Social Assistance | 3,573 (31.4%) | 7,814 (68.6%) |
| Arts, Entertainment & Recreation | 764 (37.3%) | 1,285 (62.7%) |
| Accommodation & Food Services | 2,001 (40.2%) | 2,978 (59.8%) |
| Public Administration | 1,301 (56.3%) | 1,009 (43.7%) |
| Total | 35,985 (49.8%) | 36,318 (50.2%) |
Education in Orange County
School Enrollment in Orange County
The most common levels of schooling among the 51,091 students in Orange County are college / undergraduate (20,721 | 40.6%), high school (7,233 | 14.2%), and graduate / professional (6,648 | 13.0%).

| School Level | # Students | % Students |
| Nursery / Preschool | 2,043 | 4.0% |
| Kindergarten | 1,345 | 2.6% |
| Elementary School | 6,457 | 12.6% |
| Middle School | 6,644 | 13.0% |
| High School | 7,233 | 14.2% |
| College / Undergraduate | 20,721 | 40.6% |
| Graduate / Professional | 6,648 | 13.0% |
| Total | 51,091 | 100.0% |
School Enrollment by Age by Funding Source in Orange County
Out of a total of 51,091 students who are enrolled in schools in Orange County, 6,591 (12.9%) attend a private institution, while the remaining 44,500 (87.1%) are enrolled in public schools. The age group of 3 to 4 year olds has the highest likelihood of being enrolled in private schools, with 1,138 (72.0% in the age bracket) enrolled. Conversely, the age group of 18 to 19 year olds has the lowest likelihood of being enrolled in a private school, with 8,324 (96.5% in the age bracket) attending a public institution.
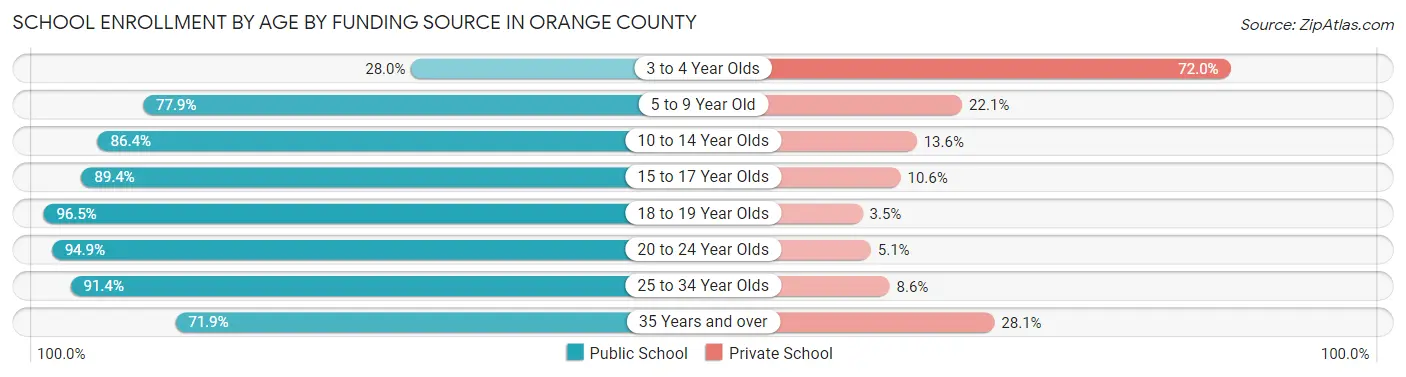
| Age Bracket | Public School | Private School |
| 3 to 4 Year Olds | 442 (28.0%) | 1,138 (72.0%) |
| 5 to 9 Year Old | 5,630 (77.9%) | 1,594 (22.1%) |
| 10 to 14 Year Olds | 7,530 (86.4%) | 1,186 (13.6%) |
| 15 to 17 Year Olds | 4,844 (89.4%) | 574 (10.6%) |
| 18 to 19 Year Olds | 8,324 (96.5%) | 304 (3.5%) |
| 20 to 24 Year Olds | 11,568 (94.9%) | 616 (5.1%) |
| 25 to 34 Year Olds | 4,068 (91.4%) | 381 (8.6%) |
| 35 Years and over | 2,080 (71.9%) | 812 (28.1%) |
| Total | 44,500 (87.1%) | 6,591 (12.9%) |
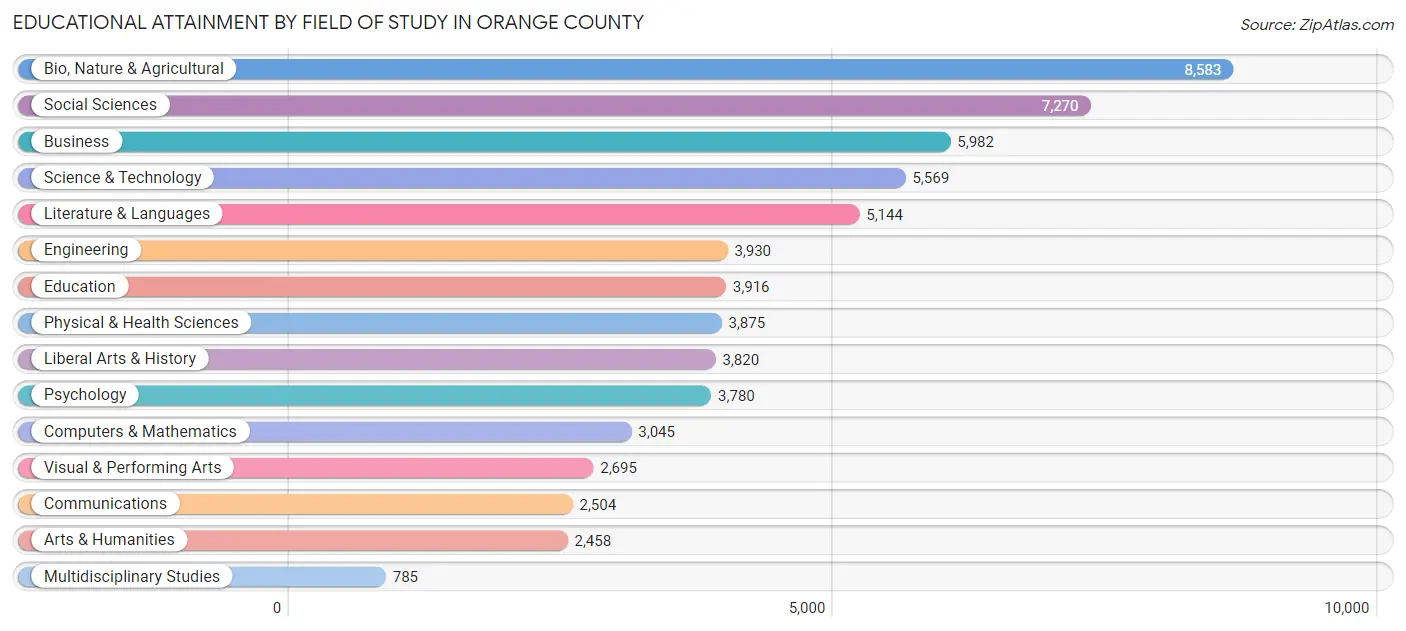
Educational Attainment by Field of Study in Orange County
Bio, nature & agricultural (8,583 | 13.6%), social sciences (7,270 | 11.5%), business (5,982 | 9.4%), science & technology (5,569 | 8.8%), and literature & languages (5,144 | 8.1%) are the most common fields of study among 63,356 individuals in Orange County who have obtained a bachelor's degree or higher.
| Field of Study | # Graduates | % Graduates |
| Computers & Mathematics | 3,045 | 4.8% |
| Bio, Nature & Agricultural | 8,583 | 13.6% |
| Physical & Health Sciences | 3,875 | 6.1% |
| Psychology | 3,780 | 6.0% |
| Social Sciences | 7,270 | 11.5% |
| Engineering | 3,930 | 6.2% |
| Multidisciplinary Studies | 785 | 1.2% |
| Science & Technology | 5,569 | 8.8% |
| Business | 5,982 | 9.4% |
| Education | 3,916 | 6.2% |
| Literature & Languages | 5,144 | 8.1% |
| Liberal Arts & History | 3,820 | 6.0% |
| Visual & Performing Arts | 2,695 | 4.3% |
| Communications | 2,504 | 4.0% |
| Arts & Humanities | 2,458 | 3.9% |
| Total | 63,356 | 100.0% |
Transportation & Commute in Orange County
Vehicle Availability by Sex in Orange County
The most prevalent vehicle ownership categories in Orange County are males with 2 vehicles (14,477, accounting for 42.3%) and females with 2 vehicles (13,487, making up 44.0%).
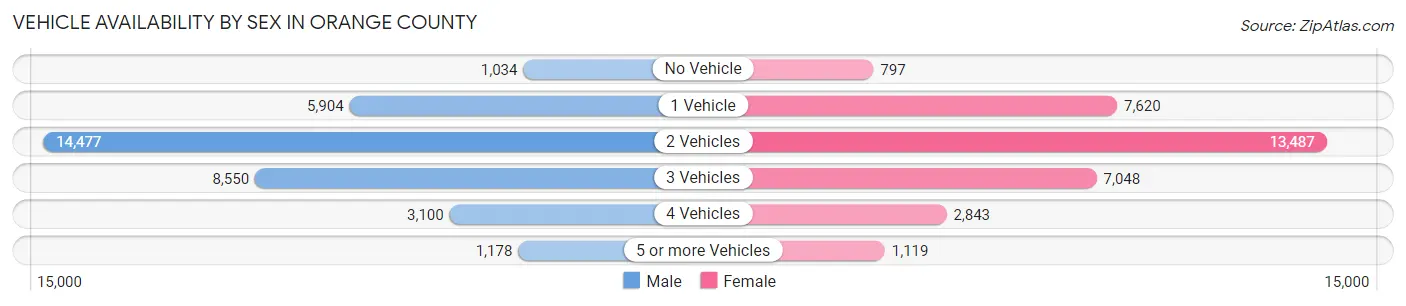
| Vehicles Available | Male | Female |
| No Vehicle | 1,034 (3.0%) | 797 (2.4%) |
| 1 Vehicle | 5,904 (17.2%) | 7,620 (23.2%) |
| 2 Vehicles | 14,477 (42.3%) | 13,487 (41.0%) |
| 3 Vehicles | 8,550 (25.0%) | 7,048 (21.4%) |
| 4 Vehicles | 3,100 (9.0%) | 2,843 (8.6%) |
| 5 or more Vehicles | 1,178 (3.4%) | 1,119 (3.4%) |
| Total | 34,243 (100.0%) | 32,914 (100.0%) |
Commute Time in Orange County
The most frequently occuring commute durations in Orange County are 15 to 19 minutes (9,546 commuters, 17.5%), 20 to 24 minutes (9,054 commuters, 16.6%), and 10 to 14 minutes (7,543 commuters, 13.8%).
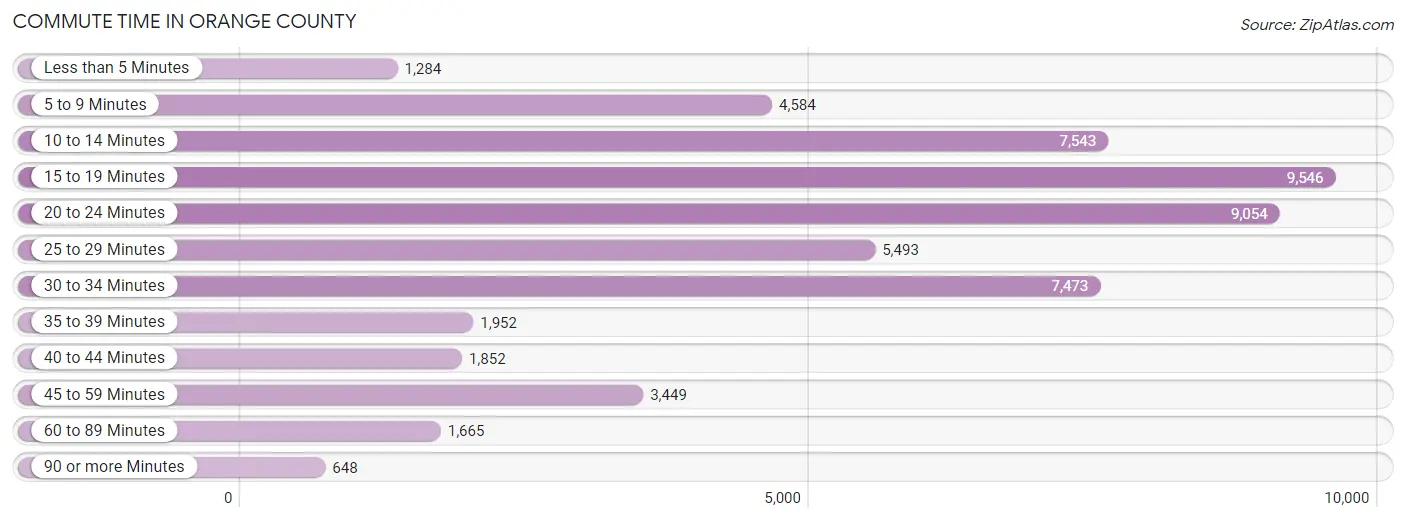
| Commute Time | # Commuters | % Commuters |
| Less than 5 Minutes | 1,284 | 2.4% |
| 5 to 9 Minutes | 4,584 | 8.4% |
| 10 to 14 Minutes | 7,543 | 13.8% |
| 15 to 19 Minutes | 9,546 | 17.5% |
| 20 to 24 Minutes | 9,054 | 16.6% |
| 25 to 29 Minutes | 5,493 | 10.1% |
| 30 to 34 Minutes | 7,473 | 13.7% |
| 35 to 39 Minutes | 1,952 | 3.6% |
| 40 to 44 Minutes | 1,852 | 3.4% |
| 45 to 59 Minutes | 3,449 | 6.3% |
| 60 to 89 Minutes | 1,665 | 3.0% |
| 90 or more Minutes | 648 | 1.2% |
Commute Time by Sex in Orange County
The most common commute times in Orange County are 15 to 19 minutes (5,107 commuters, 18.0%) for males and 15 to 19 minutes (4,439 commuters, 16.9%) for females.
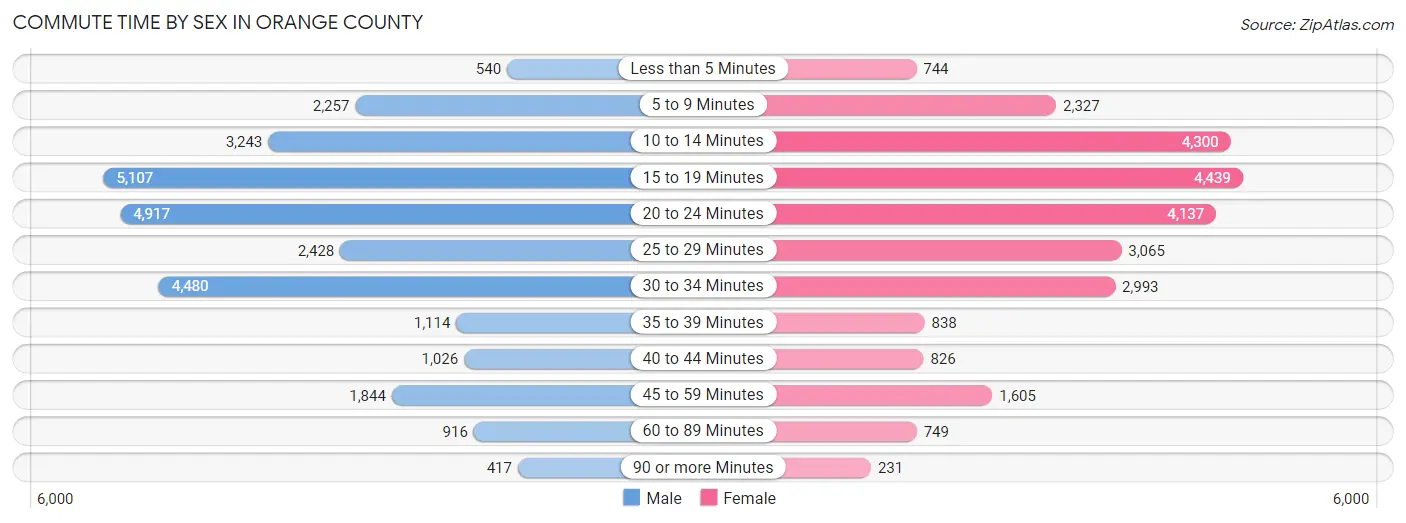
| Commute Time | Male | Female |
| Less than 5 Minutes | 540 (1.9%) | 744 (2.8%) |
| 5 to 9 Minutes | 2,257 (8.0%) | 2,327 (8.9%) |
| 10 to 14 Minutes | 3,243 (11.5%) | 4,300 (16.4%) |
| 15 to 19 Minutes | 5,107 (18.0%) | 4,439 (16.9%) |
| 20 to 24 Minutes | 4,917 (17.4%) | 4,137 (15.8%) |
| 25 to 29 Minutes | 2,428 (8.6%) | 3,065 (11.7%) |
| 30 to 34 Minutes | 4,480 (15.8%) | 2,993 (11.4%) |
| 35 to 39 Minutes | 1,114 (3.9%) | 838 (3.2%) |
| 40 to 44 Minutes | 1,026 (3.6%) | 826 (3.2%) |
| 45 to 59 Minutes | 1,844 (6.5%) | 1,605 (6.1%) |
| 60 to 89 Minutes | 916 (3.2%) | 749 (2.9%) |
| 90 or more Minutes | 417 (1.5%) | 231 (0.9%) |
Time of Departure to Work by Sex in Orange County
The most frequent times of departure to work in Orange County are 7:30 AM to 7:59 AM (5,003, 17.7%) for males and 8:00 AM to 8:29 AM (4,179, 15.9%) for females.
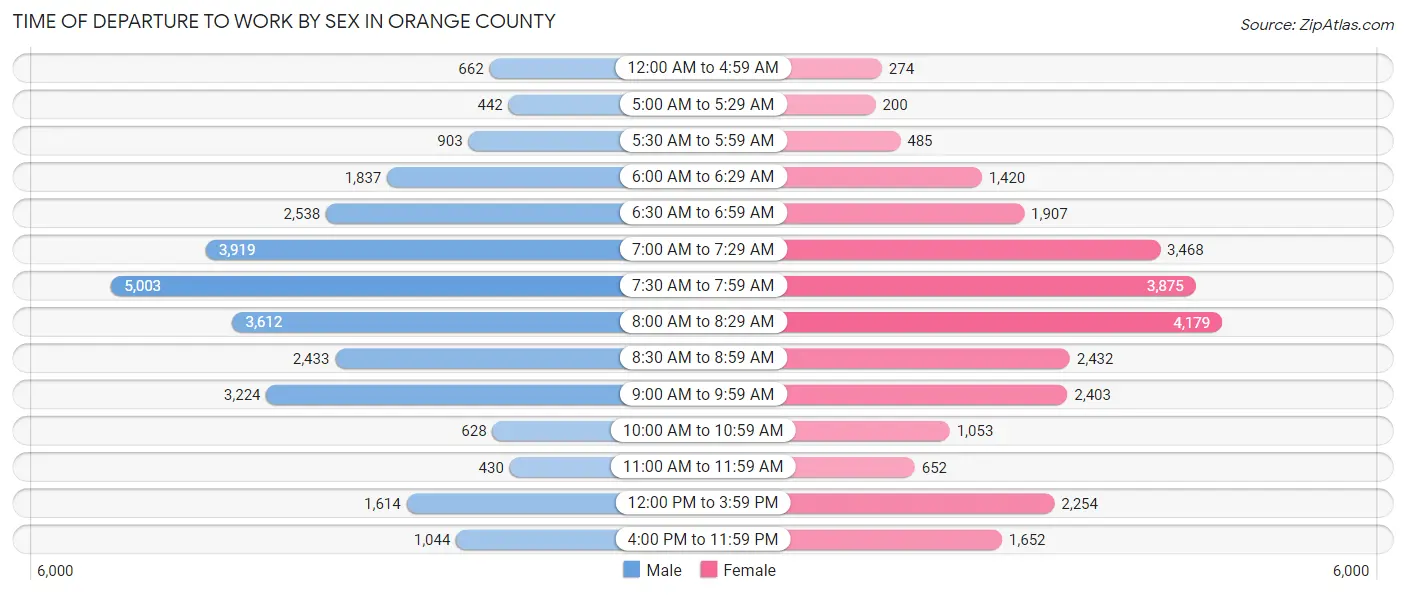
| Time of Departure | Male | Female |
| 12:00 AM to 4:59 AM | 662 (2.3%) | 274 (1.0%) |
| 5:00 AM to 5:29 AM | 442 (1.6%) | 200 (0.8%) |
| 5:30 AM to 5:59 AM | 903 (3.2%) | 485 (1.8%) |
| 6:00 AM to 6:29 AM | 1,837 (6.5%) | 1,420 (5.4%) |
| 6:30 AM to 6:59 AM | 2,538 (9.0%) | 1,907 (7.3%) |
| 7:00 AM to 7:29 AM | 3,919 (13.9%) | 3,468 (13.2%) |
| 7:30 AM to 7:59 AM | 5,003 (17.7%) | 3,875 (14.8%) |
| 8:00 AM to 8:29 AM | 3,612 (12.8%) | 4,179 (15.9%) |
| 8:30 AM to 8:59 AM | 2,433 (8.6%) | 2,432 (9.3%) |
| 9:00 AM to 9:59 AM | 3,224 (11.4%) | 2,403 (9.1%) |
| 10:00 AM to 10:59 AM | 628 (2.2%) | 1,053 (4.0%) |
| 11:00 AM to 11:59 AM | 430 (1.5%) | 652 (2.5%) |
| 12:00 PM to 3:59 PM | 1,614 (5.7%) | 2,254 (8.6%) |
| 4:00 PM to 11:59 PM | 1,044 (3.7%) | 1,652 (6.3%) |
| Total | 28,289 (100.0%) | 26,254 (100.0%) |
Housing Occupancy in Orange County
Occupancy by Ownership in Orange County
Of the total 55,534 dwellings in Orange County, owner-occupied units account for 35,939 (64.7%), while renter-occupied units make up 19,595 (35.3%).

| Occupancy | # Housing Units | % Housing Units |
| Owner Occupied Housing Units | 35,939 | 64.7% |
| Renter-Occupied Housing Units | 19,595 | 35.3% |
| Total Occupied Housing Units | 55,534 | 100.0% |
Occupancy by Household Size in Orange County
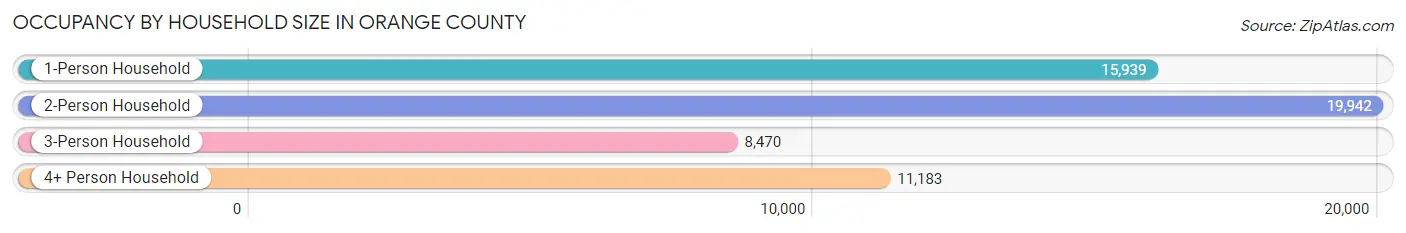
| Household Size | # Housing Units | % Housing Units |
| 1-Person Household | 15,939 | 28.7% |
| 2-Person Household | 19,942 | 35.9% |
| 3-Person Household | 8,470 | 15.2% |
| 4+ Person Household | 11,183 | 20.1% |
| Total Housing Units | 55,534 | 100.0% |
Occupancy by Ownership by Household Size in Orange County
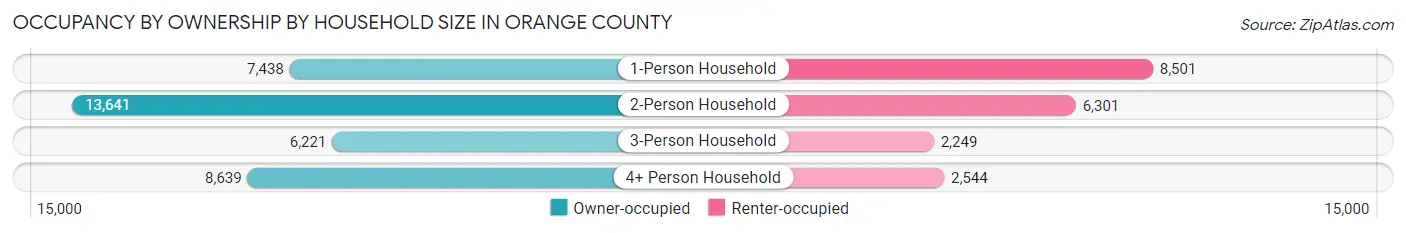
| Household Size | Owner-occupied | Renter-occupied |
| 1-Person Household | 7,438 (46.7%) | 8,501 (53.3%) |
| 2-Person Household | 13,641 (68.4%) | 6,301 (31.6%) |
| 3-Person Household | 6,221 (73.5%) | 2,249 (26.6%) |
| 4+ Person Household | 8,639 (77.2%) | 2,544 (22.8%) |
| Total Housing Units | 35,939 (64.7%) | 19,595 (35.3%) |
Occupancy by Educational Attainment in Orange County
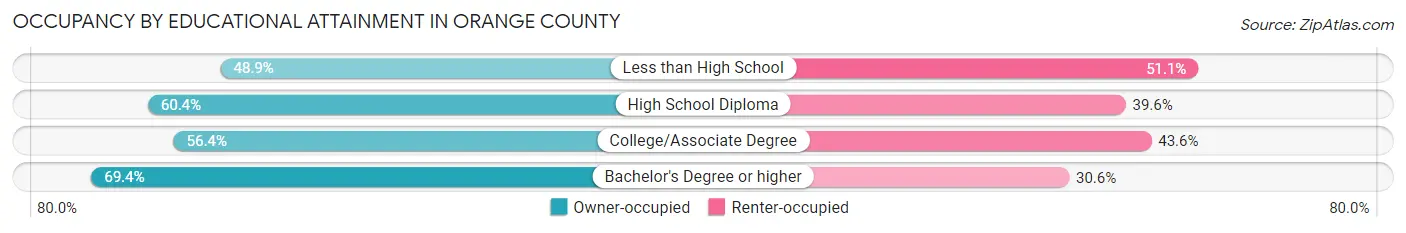
| Household Size | Owner-occupied | Renter-occupied |
| Less than High School | 1,424 (48.9%) | 1,486 (51.1%) |
| High School Diploma | 3,433 (60.4%) | 2,247 (39.6%) |
| College/Associate Degree | 6,480 (56.4%) | 5,018 (43.6%) |
| Bachelor's Degree or higher | 24,602 (69.4%) | 10,844 (30.6%) |
Occupancy by Age of Householder in Orange County
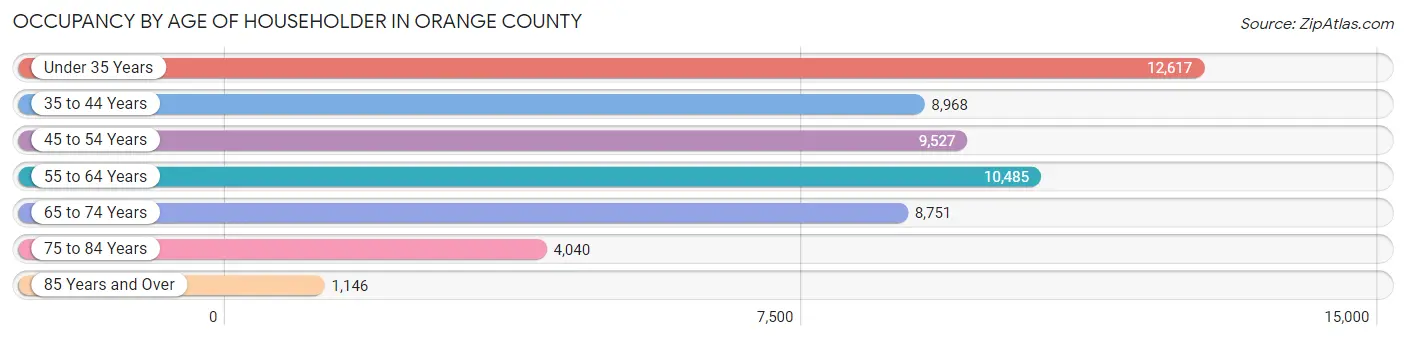
| Age Bracket | # Households | % Households |
| Under 35 Years | 12,617 | 22.7% |
| 35 to 44 Years | 8,968 | 16.2% |
| 45 to 54 Years | 9,527 | 17.2% |
| 55 to 64 Years | 10,485 | 18.9% |
| 65 to 74 Years | 8,751 | 15.8% |
| 75 to 84 Years | 4,040 | 7.3% |
| 85 Years and Over | 1,146 | 2.1% |
| Total | 55,534 | 100.0% |
Housing Finances in Orange County
Median Income by Occupancy in Orange County
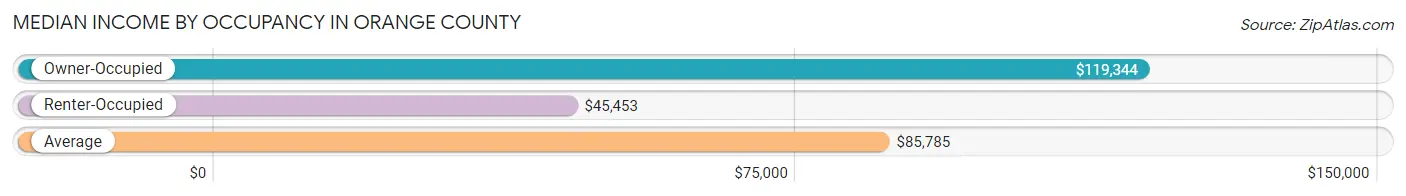
| Occupancy Type | # Households | Median Income |
| Owner-Occupied | 35,939 (64.7%) | $119,344 |
| Renter-Occupied | 19,595 (35.3%) | $45,453 |
| Average | 55,534 (100.0%) | $85,785 |
Occupancy by Householder Income Bracket in Orange County
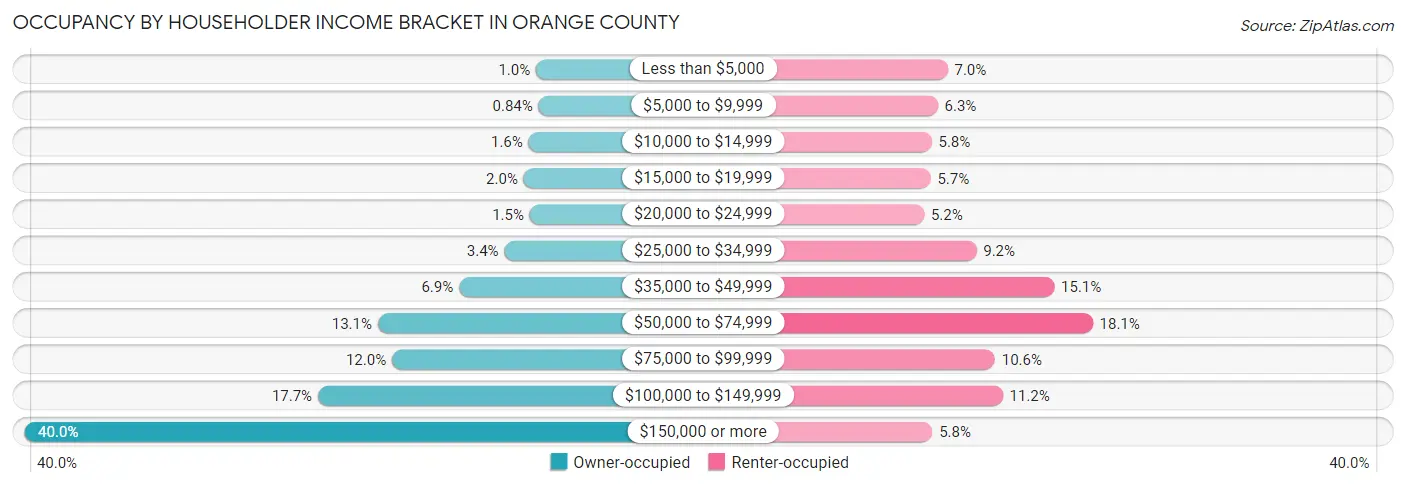
| Income Bracket | Owner-occupied | Renter-occupied |
| Less than $5,000 | 369 (1.0%) | 1,373 (7.0%) |
| $5,000 to $9,999 | 302 (0.8%) | 1,225 (6.2%) |
| $10,000 to $14,999 | 574 (1.6%) | 1,135 (5.8%) |
| $15,000 to $19,999 | 709 (2.0%) | 1,118 (5.7%) |
| $20,000 to $24,999 | 541 (1.5%) | 1,020 (5.2%) |
| $25,000 to $34,999 | 1,238 (3.4%) | 1,803 (9.2%) |
| $35,000 to $49,999 | 2,480 (6.9%) | 2,964 (15.1%) |
| $50,000 to $74,999 | 4,706 (13.1%) | 3,538 (18.1%) |
| $75,000 to $99,999 | 4,316 (12.0%) | 2,080 (10.6%) |
| $100,000 to $149,999 | 6,342 (17.6%) | 2,194 (11.2%) |
| $150,000 or more | 14,362 (40.0%) | 1,145 (5.8%) |
| Total | 35,939 (100.0%) | 19,595 (100.0%) |
Monthly Housing Cost Tiers in Orange County
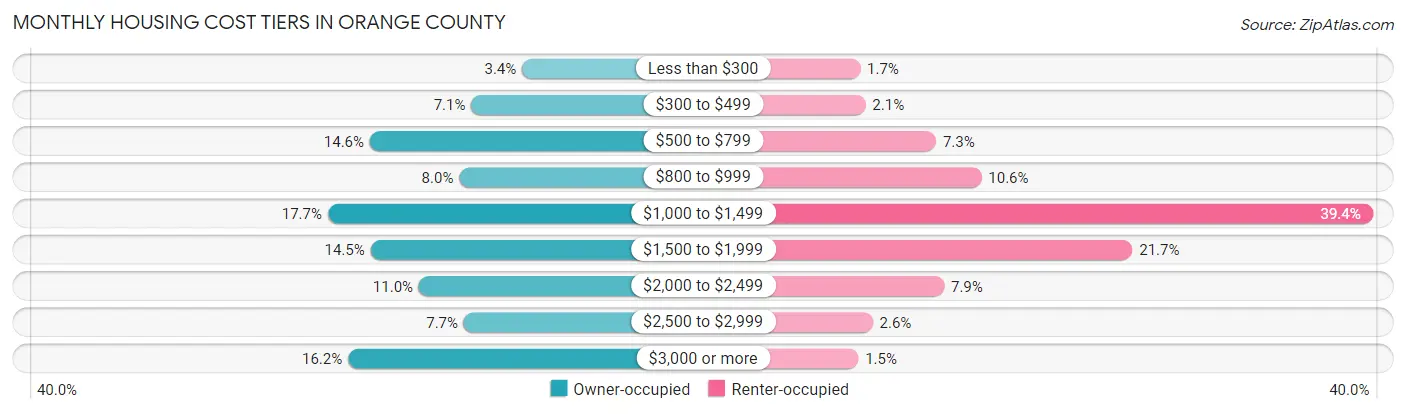
| Monthly Cost | Owner-occupied | Renter-occupied |
| Less than $300 | 1,207 (3.4%) | 327 (1.7%) |
| $300 to $499 | 2,553 (7.1%) | 403 (2.1%) |
| $500 to $799 | 5,235 (14.6%) | 1,422 (7.3%) |
| $800 to $999 | 2,873 (8.0%) | 2,078 (10.6%) |
| $1,000 to $1,499 | 6,350 (17.7%) | 7,722 (39.4%) |
| $1,500 to $1,999 | 5,219 (14.5%) | 4,256 (21.7%) |
| $2,000 to $2,499 | 3,938 (11.0%) | 1,538 (7.9%) |
| $2,500 to $2,999 | 2,749 (7.6%) | 508 (2.6%) |
| $3,000 or more | 5,815 (16.2%) | 299 (1.5%) |
| Total | 35,939 (100.0%) | 19,595 (100.0%) |
Physical Housing Characteristics in Orange County
Housing Structures in Orange County
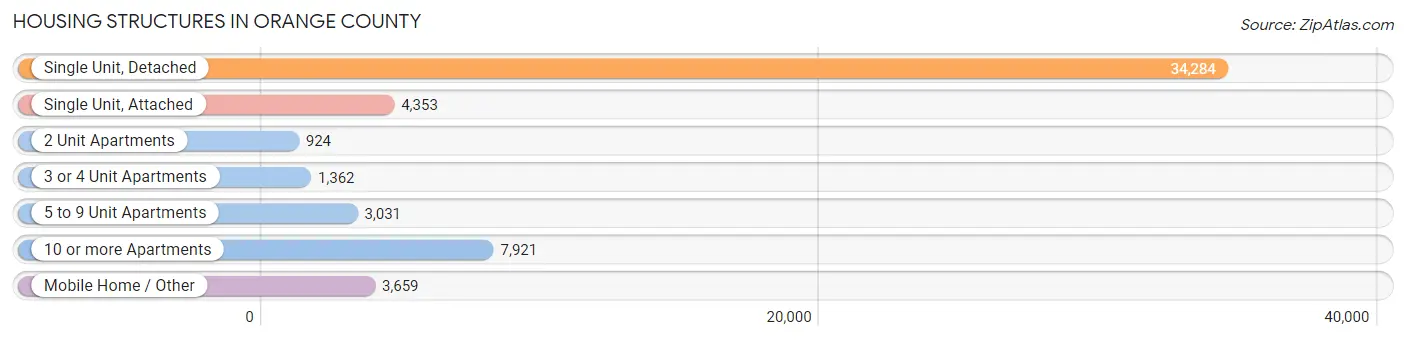
| Structure Type | # Housing Units | % Housing Units |
| Single Unit, Detached | 34,284 | 61.7% |
| Single Unit, Attached | 4,353 | 7.8% |
| 2 Unit Apartments | 924 | 1.7% |
| 3 or 4 Unit Apartments | 1,362 | 2.5% |
| 5 to 9 Unit Apartments | 3,031 | 5.5% |
| 10 or more Apartments | 7,921 | 14.3% |
| Mobile Home / Other | 3,659 | 6.6% |
| Total | 55,534 | 100.0% |
Housing Structures by Occupancy in Orange County
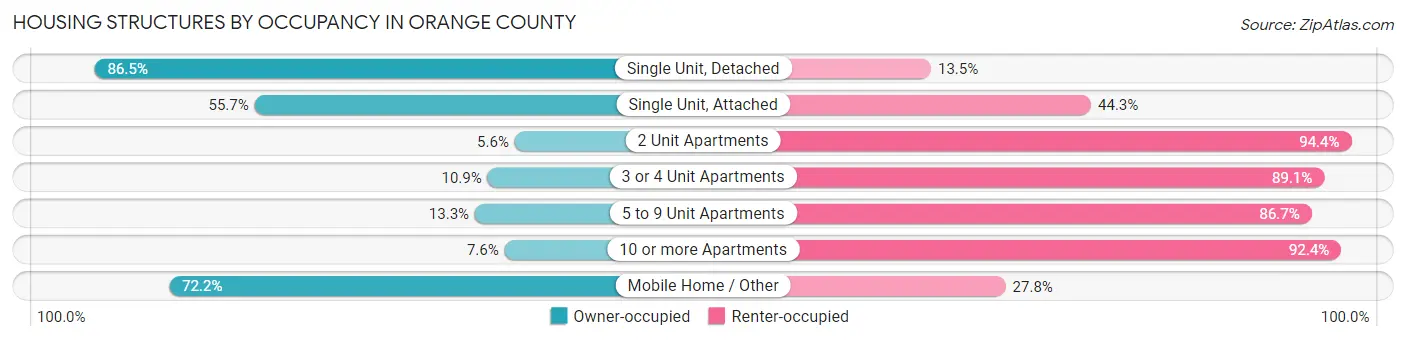
| Structure Type | Owner-occupied | Renter-occupied |
| Single Unit, Detached | 29,668 (86.5%) | 4,616 (13.5%) |
| Single Unit, Attached | 2,426 (55.7%) | 1,927 (44.3%) |
| 2 Unit Apartments | 52 (5.6%) | 872 (94.4%) |
| 3 or 4 Unit Apartments | 148 (10.9%) | 1,214 (89.1%) |
| 5 to 9 Unit Apartments | 403 (13.3%) | 2,628 (86.7%) |
| 10 or more Apartments | 601 (7.6%) | 7,320 (92.4%) |
| Mobile Home / Other | 2,641 (72.2%) | 1,018 (27.8%) |
| Total | 35,939 (64.7%) | 19,595 (35.3%) |
Housing Structures by Number of Rooms in Orange County
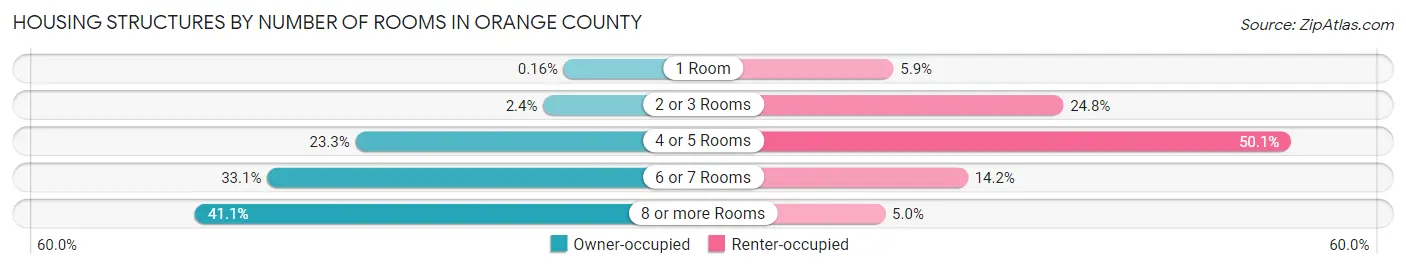
| Number of Rooms | Owner-occupied | Renter-occupied |
| 1 Room | 56 (0.2%) | 1,162 (5.9%) |
| 2 or 3 Rooms | 875 (2.4%) | 4,856 (24.8%) |
| 4 or 5 Rooms | 8,362 (23.3%) | 9,814 (50.1%) |
| 6 or 7 Rooms | 11,885 (33.1%) | 2,779 (14.2%) |
| 8 or more Rooms | 14,761 (41.1%) | 984 (5.0%) |
| Total | 35,939 (100.0%) | 19,595 (100.0%) |
Housing Structure by Heating Type in Orange County
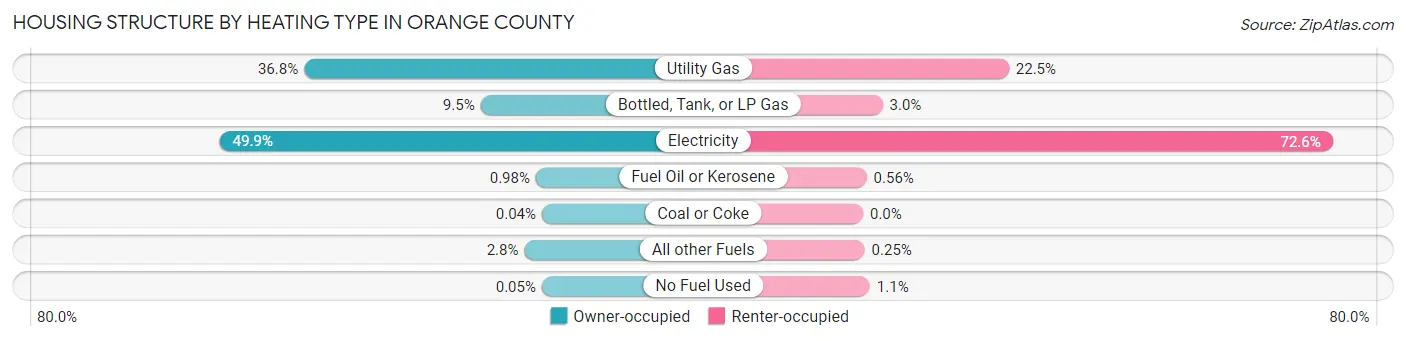
| Heating Type | Owner-occupied | Renter-occupied |
| Utility Gas | 13,230 (36.8%) | 4,416 (22.5%) |
| Bottled, Tank, or LP Gas | 3,421 (9.5%) | 591 (3.0%) |
| Electricity | 17,915 (49.8%) | 14,221 (72.6%) |
| Fuel Oil or Kerosene | 353 (1.0%) | 110 (0.6%) |
| Coal or Coke | 14 (0.0%) | 0 (0.0%) |
| All other Fuels | 987 (2.8%) | 49 (0.3%) |
| No Fuel Used | 19 (0.1%) | 208 (1.1%) |
| Total | 35,939 (100.0%) | 19,595 (100.0%) |
Household Vehicle Usage in Orange County
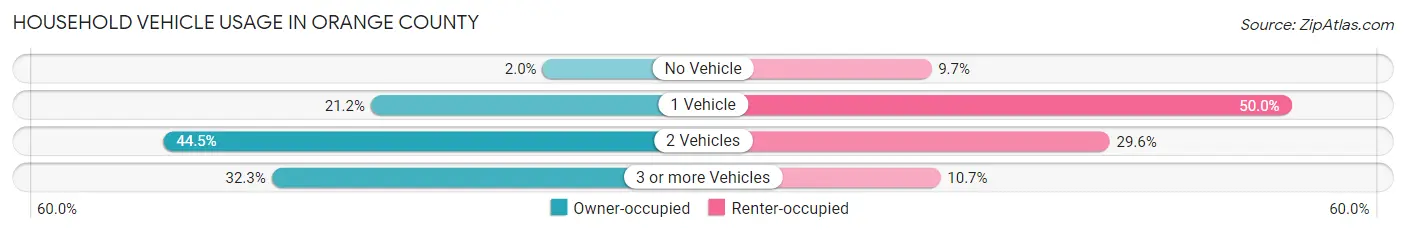
| Vehicles per Household | Owner-occupied | Renter-occupied |
| No Vehicle | 715 (2.0%) | 1,894 (9.7%) |
| 1 Vehicle | 7,627 (21.2%) | 9,799 (50.0%) |
| 2 Vehicles | 15,974 (44.5%) | 5,808 (29.6%) |
| 3 or more Vehicles | 11,623 (32.3%) | 2,094 (10.7%) |
| Total | 35,939 (100.0%) | 19,595 (100.0%) |
Real Estate & Mortgages in Orange County
Real Estate and Mortgage Overview in Orange County
| Characteristic | Without Mortgage | With Mortgage |
| Housing Units | 12,930 | 23,009 |
| Median Property Value | $373,000 | $407,900 |
| Median Household Income | $90,885 | $10,686 |
| Monthly Housing Costs | $674 | $5,681 |
| Real Estate Taxes | $4,050 | $204 |
Property Value by Mortgage Status in Orange County
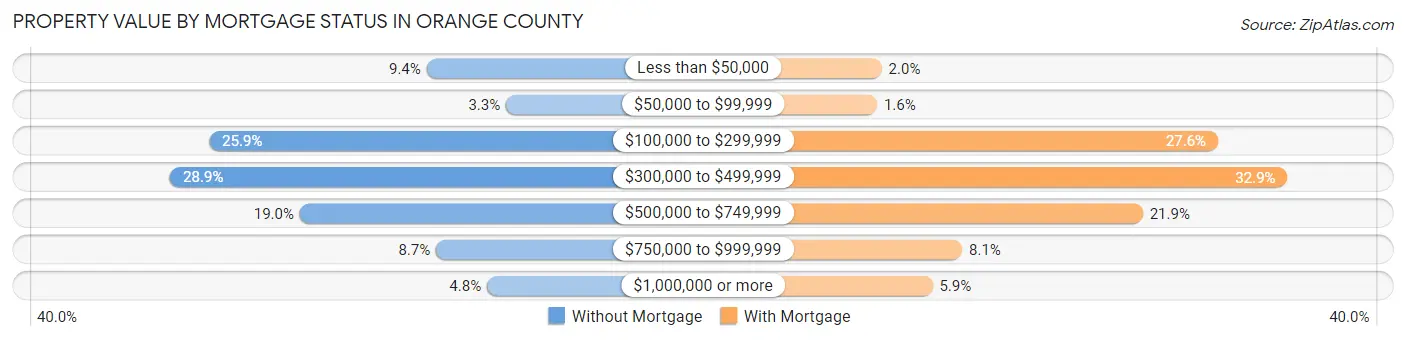
| Property Value | Without Mortgage | With Mortgage |
| Less than $50,000 | 1,212 (9.4%) | 459 (2.0%) |
| $50,000 to $99,999 | 429 (3.3%) | 375 (1.6%) |
| $100,000 to $299,999 | 3,354 (25.9%) | 6,353 (27.6%) |
| $300,000 to $499,999 | 3,739 (28.9%) | 7,571 (32.9%) |
| $500,000 to $749,999 | 2,460 (19.0%) | 5,034 (21.9%) |
| $750,000 to $999,999 | 1,119 (8.6%) | 1,869 (8.1%) |
| $1,000,000 or more | 617 (4.8%) | 1,348 (5.9%) |
| Total | 12,930 (100.0%) | 23,009 (100.0%) |
Household Income by Mortgage Status in Orange County
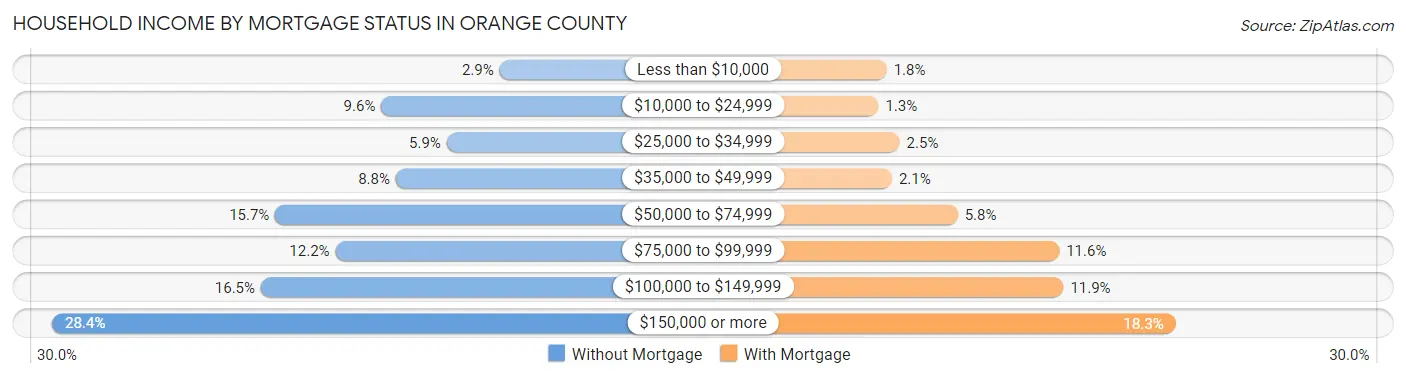
| Household Income | Without Mortgage | With Mortgage |
| Less than $10,000 | 370 (2.9%) | 410 (1.8%) |
| $10,000 to $24,999 | 1,244 (9.6%) | 301 (1.3%) |
| $25,000 to $34,999 | 760 (5.9%) | 580 (2.5%) |
| $35,000 to $49,999 | 1,136 (8.8%) | 478 (2.1%) |
| $50,000 to $74,999 | 2,027 (15.7%) | 1,344 (5.8%) |
| $75,000 to $99,999 | 1,583 (12.2%) | 2,679 (11.6%) |
| $100,000 to $149,999 | 2,134 (16.5%) | 2,733 (11.9%) |
| $150,000 or more | 3,676 (28.4%) | 4,208 (18.3%) |
| Total | 12,930 (100.0%) | 23,009 (100.0%) |
Property Value to Household Income Ratio in Orange County
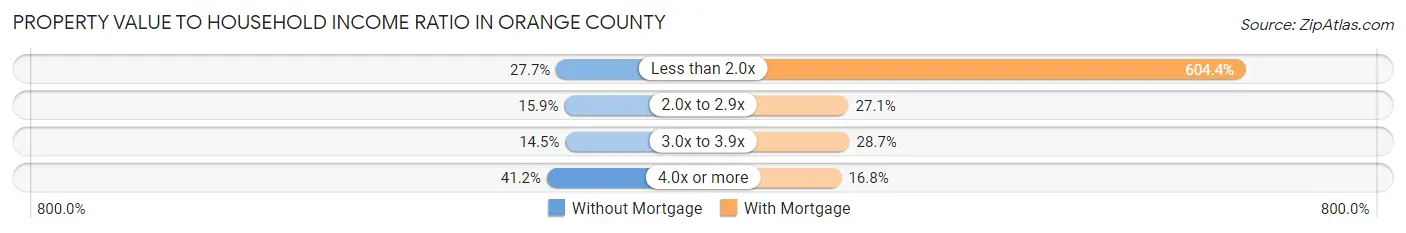
| Value-to-Income Ratio | Without Mortgage | With Mortgage |
| Less than 2.0x | 3,579 (27.7%) | 139,061 (604.4%) |
| 2.0x to 2.9x | 2,056 (15.9%) | 6,243 (27.1%) |
| 3.0x to 3.9x | 1,875 (14.5%) | 6,599 (28.7%) |
| 4.0x or more | 5,325 (41.2%) | 3,869 (16.8%) |
| Total | 12,930 (100.0%) | 23,009 (100.0%) |
Real Estate Taxes by Mortgage Status in Orange County

| Property Taxes | Without Mortgage | With Mortgage |
| Less than $800 | 1,346 (10.4%) | 37 (0.2%) |
| $800 to $1,499 | 1,076 (8.3%) | 705 (3.1%) |
| $800 to $1,499 | 10,234 (79.1%) | 1,868 (8.1%) |
| Total | 12,930 (100.0%) | 23,009 (100.0%) |
Health & Disability in Orange County
Health Insurance Coverage by Age in Orange County
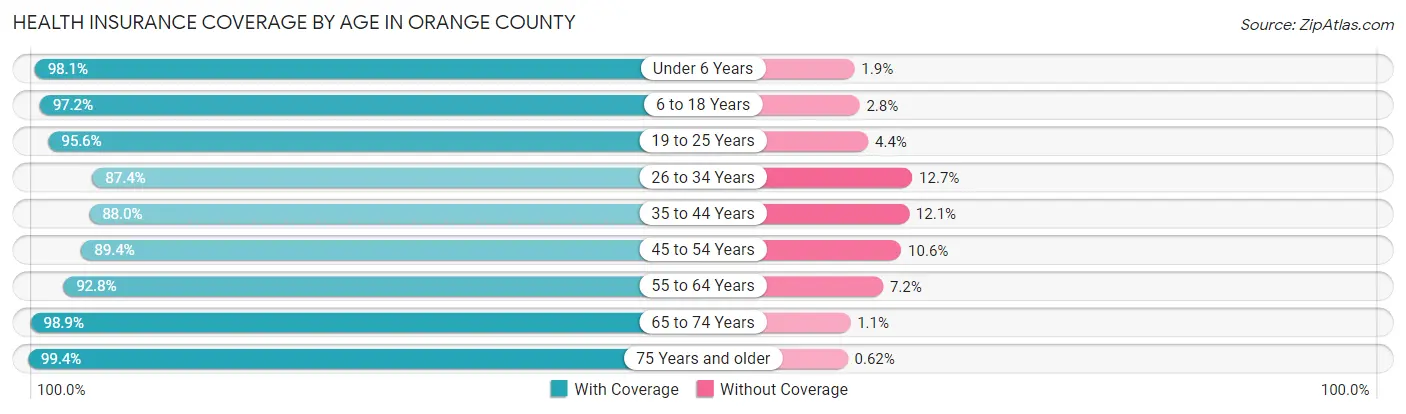
| Age Bracket | With Coverage | Without Coverage |
| Under 6 Years | 7,065 (98.1%) | 136 (1.9%) |
| 6 to 18 Years | 23,500 (97.2%) | 684 (2.8%) |
| 19 to 25 Years | 23,283 (95.6%) | 1,082 (4.4%) |
| 26 to 34 Years | 13,130 (87.4%) | 1,901 (12.7%) |
| 35 to 44 Years | 14,755 (87.9%) | 2,022 (12.0%) |
| 45 to 54 Years | 16,174 (89.4%) | 1,918 (10.6%) |
| 55 to 64 Years | 16,176 (92.8%) | 1,256 (7.2%) |
| 65 to 74 Years | 13,720 (98.9%) | 154 (1.1%) |
| 75 Years and older | 8,203 (99.4%) | 51 (0.6%) |
| Total | 136,006 (93.7%) | 9,204 (6.3%) |
Health Insurance Coverage by Citizenship Status in Orange County
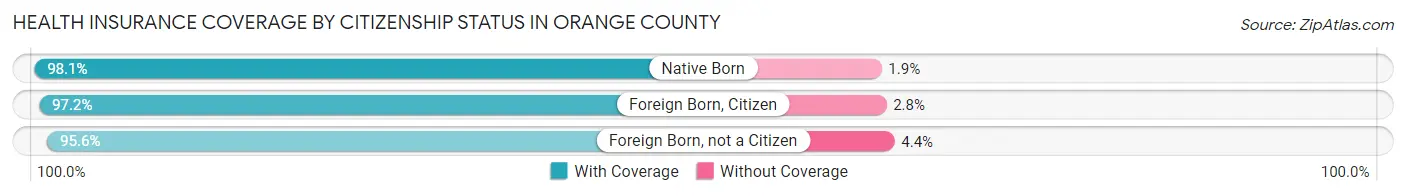
| Citizenship Status | With Coverage | Without Coverage |
| Native Born | 7,065 (98.1%) | 136 (1.9%) |
| Foreign Born, Citizen | 23,500 (97.2%) | 684 (2.8%) |
| Foreign Born, not a Citizen | 23,283 (95.6%) | 1,082 (4.4%) |
Health Insurance Coverage by Household Income in Orange County
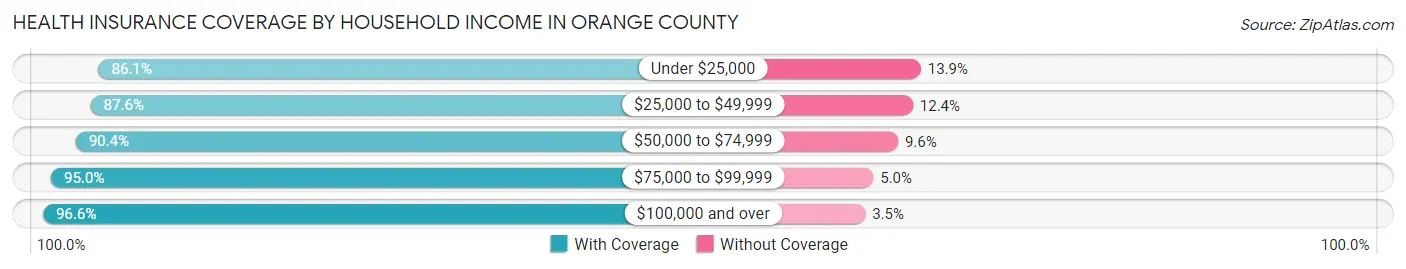
| Household Income | With Coverage | Without Coverage |
| Under $25,000 | 12,256 (86.1%) | 1,973 (13.9%) |
| $25,000 to $49,999 | 14,838 (87.6%) | 2,096 (12.4%) |
| $50,000 to $74,999 | 16,386 (90.4%) | 1,739 (9.6%) |
| $75,000 to $99,999 | 15,104 (95.0%) | 788 (5.0%) |
| $100,000 and over | 66,685 (96.6%) | 2,382 (3.5%) |
Public vs Private Health Insurance Coverage by Age in Orange County
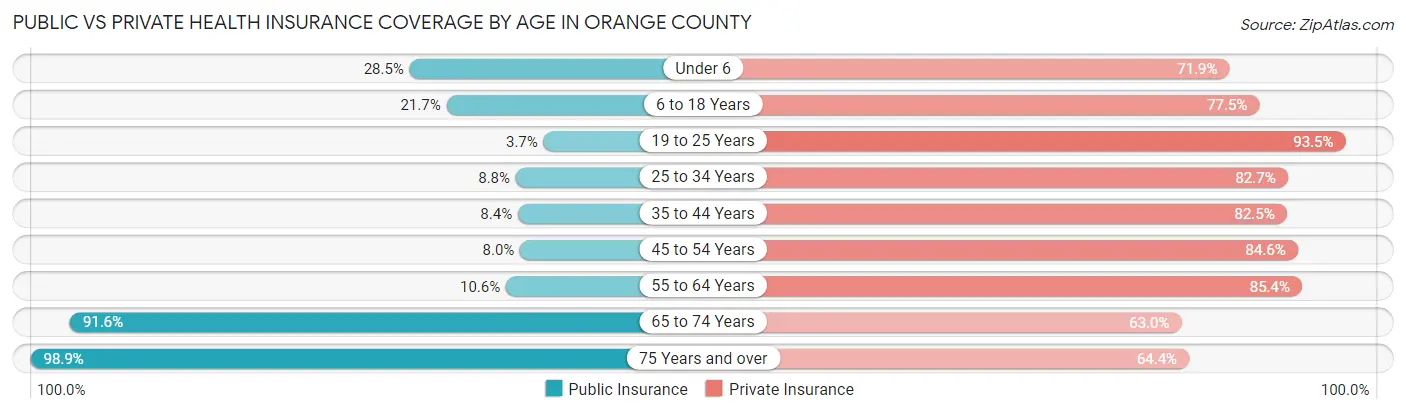
| Age Bracket | Public Insurance | Private Insurance |
| Under 6 | 2,054 (28.5%) | 5,180 (71.9%) |
| 6 to 18 Years | 5,245 (21.7%) | 18,735 (77.5%) |
| 19 to 25 Years | 891 (3.7%) | 22,771 (93.5%) |
| 25 to 34 Years | 1,325 (8.8%) | 12,434 (82.7%) |
| 35 to 44 Years | 1,412 (8.4%) | 13,848 (82.5%) |
| 45 to 54 Years | 1,449 (8.0%) | 15,307 (84.6%) |
| 55 to 64 Years | 1,853 (10.6%) | 14,884 (85.4%) |
| 65 to 74 Years | 12,707 (91.6%) | 8,742 (63.0%) |
| 75 Years and over | 8,164 (98.9%) | 5,318 (64.4%) |
| Total | 35,100 (24.2%) | 117,219 (80.7%) |
Disability Status by Sex by Age in Orange County
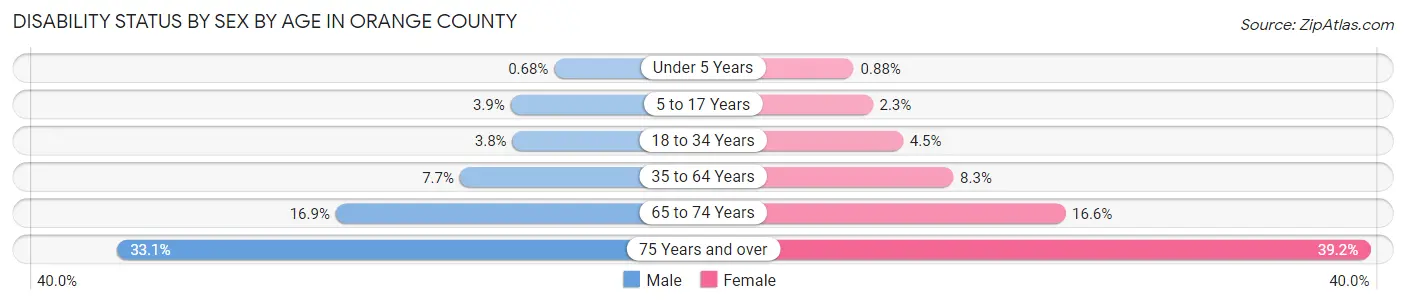
| Age Bracket | Male | Female |
| Under 5 Years | 21 (0.7%) | 27 (0.9%) |
| 5 to 17 Years | 441 (3.9%) | 242 (2.3%) |
| 18 to 34 Years | 750 (3.8%) | 1,037 (4.5%) |
| 35 to 64 Years | 1,948 (7.7%) | 2,232 (8.3%) |
| 65 to 74 Years | 1,114 (16.9%) | 1,207 (16.6%) |
| 75 Years and over | 1,093 (33.1%) | 1,943 (39.2%) |
Disability Class by Sex by Age in Orange County
Disability Class: Hearing Difficulty
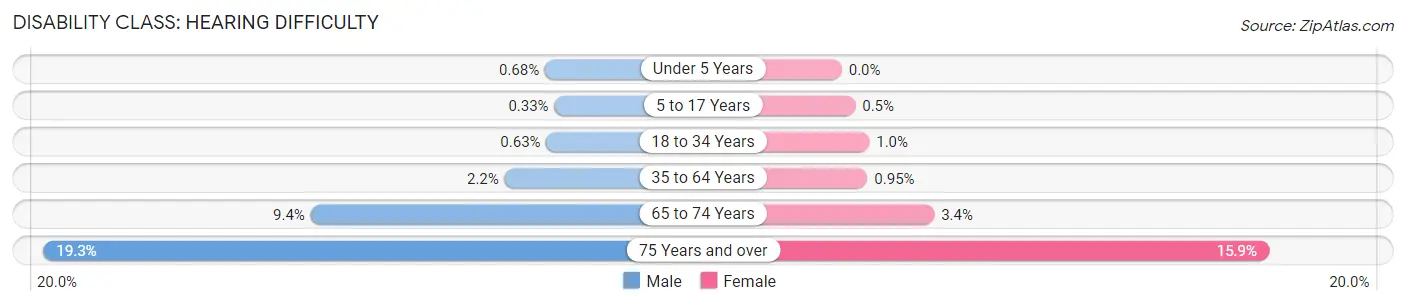
| Age Bracket | Male | Female |
| Under 5 Years | 21 (0.7%) | 0 (0.0%) |
| 5 to 17 Years | 37 (0.3%) | 53 (0.5%) |
| 18 to 34 Years | 125 (0.6%) | 233 (1.0%) |
| 35 to 64 Years | 553 (2.2%) | 257 (0.9%) |
| 65 to 74 Years | 618 (9.4%) | 250 (3.4%) |
| 75 Years and over | 637 (19.3%) | 785 (15.9%) |
Disability Class: Vision Difficulty
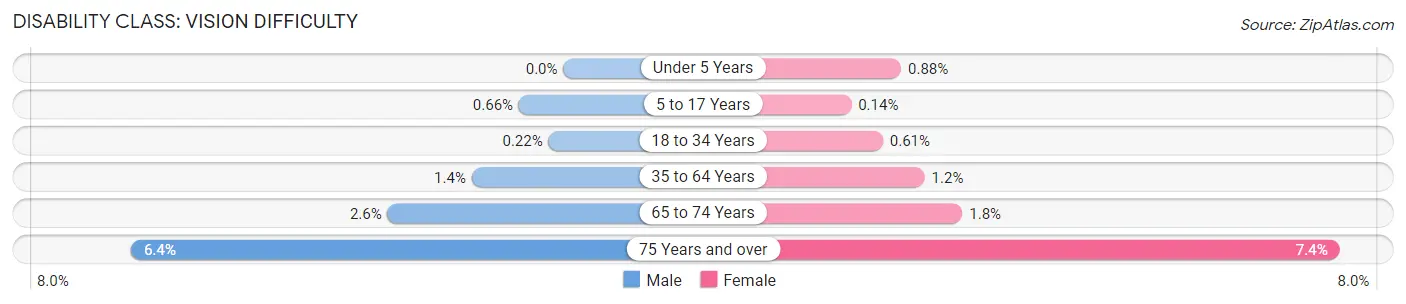
| Age Bracket | Male | Female |
| Under 5 Years | 0 (0.0%) | 27 (0.9%) |
| 5 to 17 Years | 74 (0.7%) | 15 (0.1%) |
| 18 to 34 Years | 44 (0.2%) | 139 (0.6%) |
| 35 to 64 Years | 345 (1.4%) | 331 (1.2%) |
| 65 to 74 Years | 172 (2.6%) | 130 (1.8%) |
| 75 Years and over | 212 (6.4%) | 366 (7.4%) |
Disability Class: Cognitive Difficulty
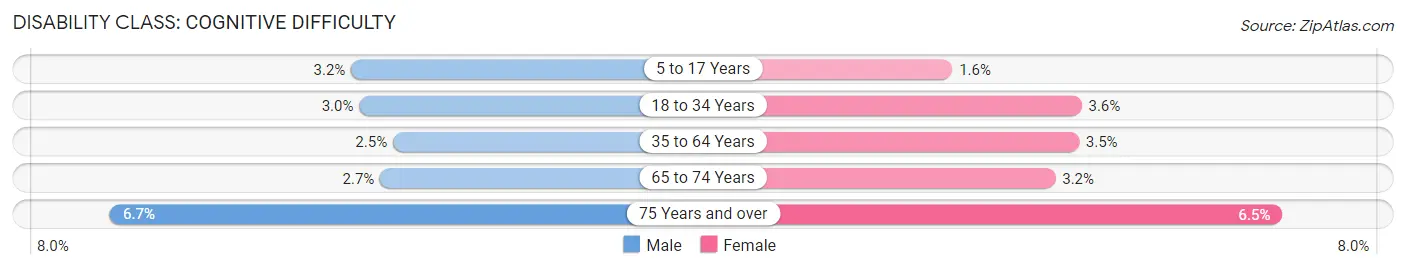
| Age Bracket | Male | Female |
| 5 to 17 Years | 355 (3.2%) | 174 (1.6%) |
| 18 to 34 Years | 602 (3.0%) | 815 (3.6%) |
| 35 to 64 Years | 640 (2.5%) | 951 (3.5%) |
| 65 to 74 Years | 179 (2.7%) | 231 (3.2%) |
| 75 Years and over | 222 (6.7%) | 324 (6.5%) |
Disability Class: Ambulatory Difficulty
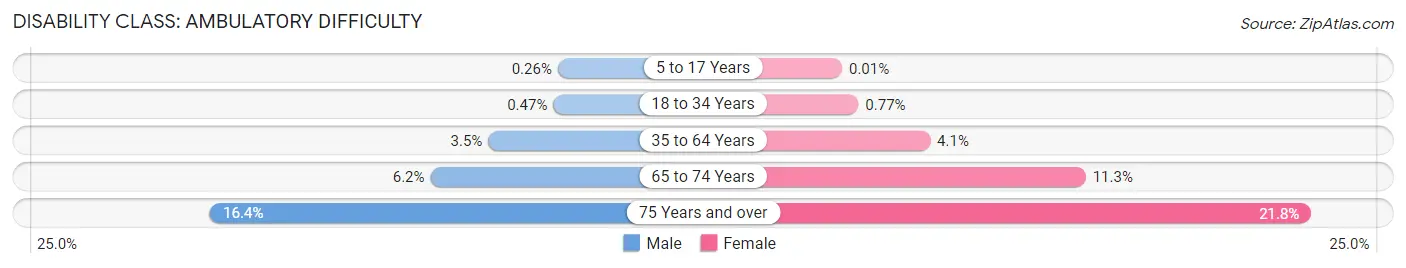
| Age Bracket | Male | Female |
| 5 to 17 Years | 29 (0.3%) | 1 (0.0%) |
| 18 to 34 Years | 94 (0.5%) | 176 (0.8%) |
| 35 to 64 Years | 884 (3.5%) | 1,107 (4.1%) |
| 65 to 74 Years | 407 (6.2%) | 824 (11.3%) |
| 75 Years and over | 541 (16.4%) | 1,079 (21.8%) |
Disability Class: Self-Care Difficulty
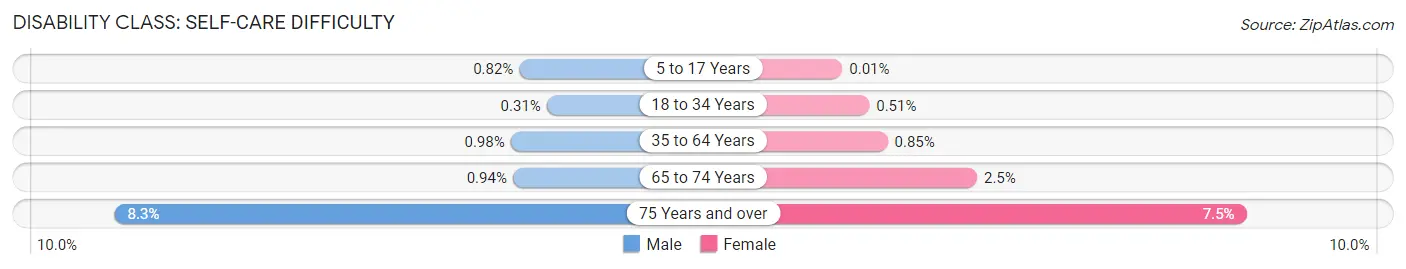
| Age Bracket | Male | Female |
| 5 to 17 Years | 92 (0.8%) | 1 (0.0%) |
| 18 to 34 Years | 61 (0.3%) | 118 (0.5%) |
| 35 to 64 Years | 248 (1.0%) | 230 (0.9%) |
| 65 to 74 Years | 62 (0.9%) | 183 (2.5%) |
| 75 Years and over | 275 (8.3%) | 372 (7.5%) |
Technology Access in Orange County
Computing Device Access in Orange County
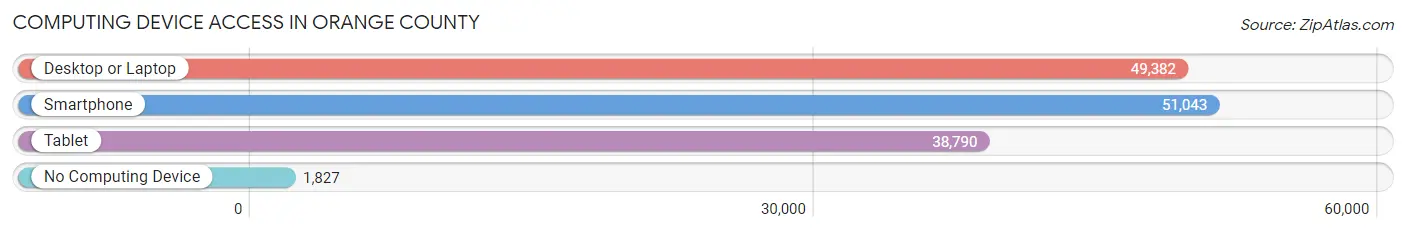
| Device Type | # Households | % Households |
| Desktop or Laptop | 49,382 | 88.9% |
| Smartphone | 51,043 | 91.9% |
| Tablet | 38,790 | 69.9% |
| No Computing Device | 1,827 | 3.3% |
| Total | 55,534 | 100.0% |
Internet Access in Orange County
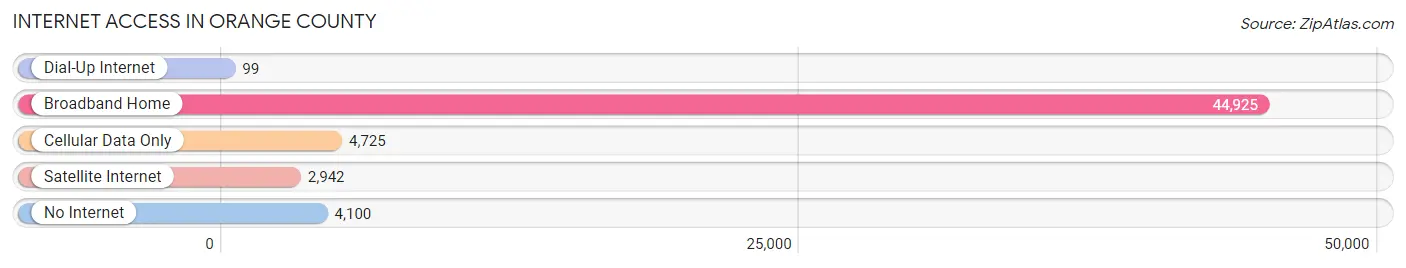
| Internet Type | # Households | % Households |
| Dial-Up Internet | 99 | 0.2% |
| Broadband Home | 44,925 | 80.9% |
| Cellular Data Only | 4,725 | 8.5% |
| Satellite Internet | 2,942 | 5.3% |
| No Internet | 4,100 | 7.4% |
| Total | 55,534 | 100.0% |
Orange County Summary
Orange County, North Carolina is located in the central part of the state and is part of the Triangle region. It is bordered by Chatham County to the north, Alamance County to the east, Durham County to the south, and Person County to the west. The county seat is Hillsborough, and the largest city is Chapel Hill. The county was formed in 1752 from parts of Bladen County and Johnston County.
History
The area that is now Orange County was originally inhabited by the Occaneechi tribe of Native Americans. The first European settlers arrived in the area in the late 17th century, and the county was officially established in 1752. The county was named for William of Orange, who was the Prince of Orange and the King of England at the time.
During the American Revolution, the county was the site of several battles, including the Battle of Alamance in 1771 and the Battle of Hillsborough in 1781. After the war, the county grew rapidly, and by the early 19th century, it was one of the most populous counties in the state.
In the mid-19th century, the county was the site of several important events in the history of the United States. In 1851, the first public university in the United States, the University of North Carolina at Chapel Hill, was founded in the county. In 1868, the county was the site of the first Ku Klux Klan rally in the United States.
In the late 19th and early 20th centuries, the county was the site of several important events in the civil rights movement. In 1957, the first sit-in at a segregated lunch counter in the United States took place in the county. In 1960, the first civil rights demonstration in the South took place in the county.
Geography
Orange County covers an area of 441 square miles and is located in the central part of the state. It is bordered by Chatham County to the north, Alamance County to the east, Durham County to the south, and Person County to the west. The county is located in the Piedmont region of North Carolina and is part of the Triangle region.
The terrain of the county is mostly rolling hills, with some flat areas in the northern and eastern parts of the county. The Haw River runs through the county, and there are several small lakes and ponds in the area. The county is located in the humid subtropical climate zone, and the average annual temperature is around 60 degrees Fahrenheit.
Economy
Orange County has a diverse economy, with a mix of manufacturing, technology, and service industries. The county is home to several large employers, including the University of North Carolina at Chapel Hill, Duke University, and IBM. The county is also home to several large medical centers, including UNC Hospitals and Duke University Medical Center.
The county is also home to several large retail centers, including University Mall and Southpoint Mall. The county is also home to several large industrial parks, including the Research Triangle Park.
Demographics
As of the 2010 census, the population of Orange County was 133,801. The population is fairly evenly split between men and women, with 50.3% of the population being male and 49.7% being female. The median age of the population is 37.7 years.
The racial makeup of the county is 79.2% White, 11.3% African American, 5.2% Hispanic or Latino, 2.3% Asian, and 2.0% other. The largest ancestry groups in the county are German (17.3%), English (14.2%), Irish (13.2%), and African American (11.3%).
The median household income in the county is $60,945, and the median family income is $76,945. The per capita income in the county is $35,945. The unemployment rate in the county is 4.2%.
Common Questions
What is the Total Population of Orange County?
Total Population of Orange County is 145,919.
What is the Total Male Population of Orange County?
Total Male Population of Orange County is 69,888.
What is the Total Female Population of Orange County?
Total Female Population of Orange County is 76,031.
What is the Ratio of Males per 100 Females in Orange County?
There are 91.92 Males per 100 Females in Orange County.
What is the Ratio of Females per 100 Males in Orange County?
There are 108.79 Females per 100 Males in Orange County.
What is the Median Population Age in Orange County?
Median Population Age in Orange County is 36.2 Years.
What is the Average Family Size in Orange County
Average Family Size in Orange County is 3.0 People.
What is the Average Household Size in Orange County
Average Household Size in Orange County is 2.4 People.
What is Per Capita Income in Orange County?
Per Capita income in Orange County is $50,449.
What is the Median Family Income in Orange County?
Median Family Income in Orange County is $122,332.
What is the Median Household income in Orange County?
Median Household Income in Orange County is $85,785.
What is Income or Wage Gap in Orange County?
Income or Wage Gap in Orange County is 26.2%.
Women in Orange County earn 73.8 cents for every dollar earned by a man.
What is Family Income Deficit in Orange County?
Family Income Deficit in Orange County is $11,350.
Families that are below poverty line in Orange County earn $11,350 less on average than the poverty threshold level.
What is Inequality or Gini Index in Orange County?
Inequality or Gini Index in Orange County is 0.51.
How Large is the Labor Force in Orange County?
There are 75,316 People in the Labor Forcein in Orange County.
What is the Percentage of People in the Labor Force in Orange County?
61.9% of People are in the Labor Force in Orange County.
What is the Unemployment Rate in Orange County?
Unemployment Rate in Orange County is 3.9%.