Onslow County, NC
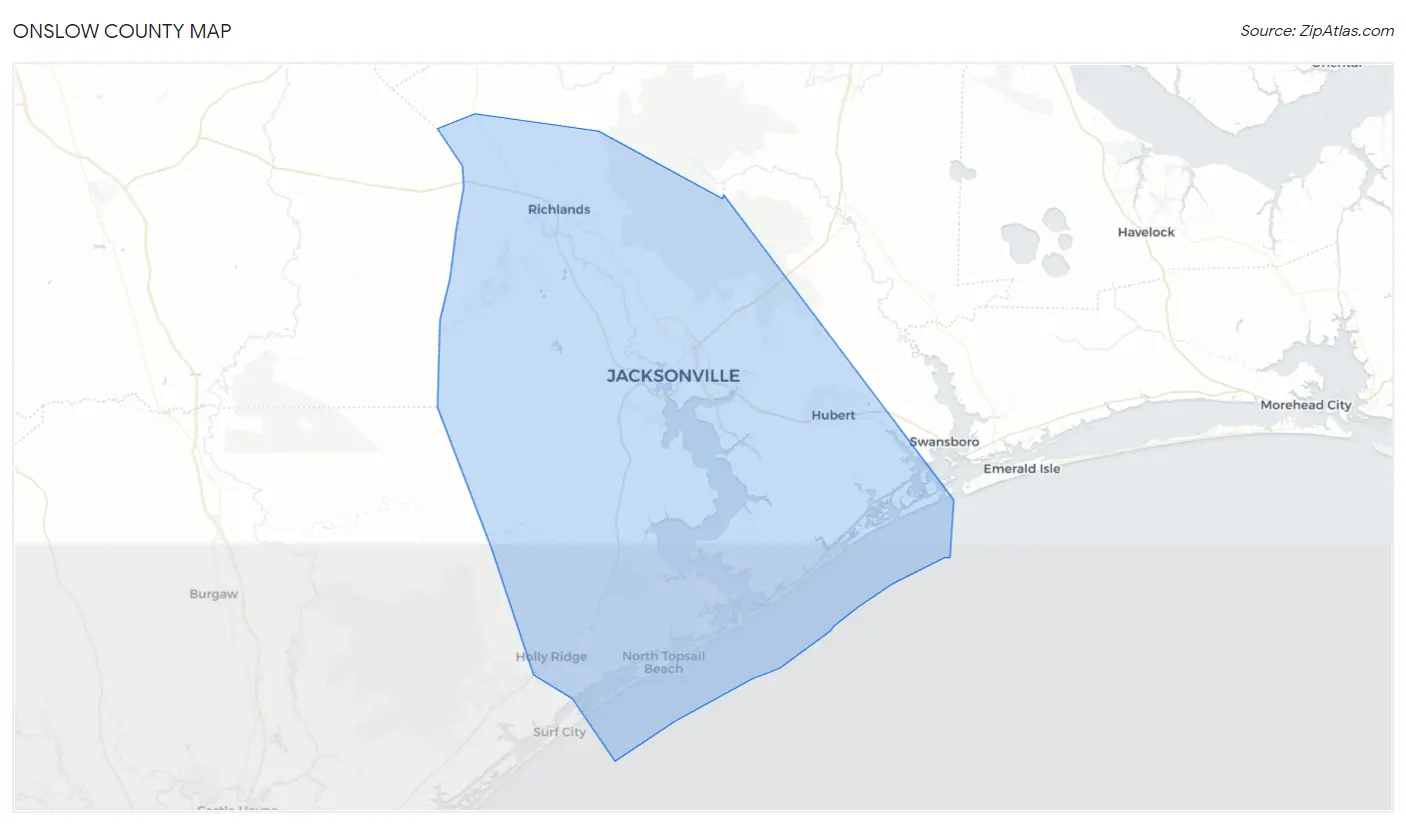
Onslow County Map
Onslow County Overview
203,686
TOTAL POPULATION
113,368
MALE POPULATION
90,318
FEMALE POPULATION
125.52
MALES / 100 FEMALES
79.67
FEMALES / 100 MALES
26.9
MEDIAN AGE
3.0
AVG FAMILY SIZE
2.6
AVG HOUSEHOLD SIZE
$29,214
PER CAPITA INCOME
$67,237
AVG FAMILY INCOME
$59,976
AVG HOUSEHOLD INCOME
20.7%
WAGE / INCOME GAP [ % ]
79.3¢/ $1
WAGE / INCOME GAP [ $ ]
$11,714
FAMILY INCOME DEFICIT
0.42
INEQUALITY / GINI INDEX
111,156
LABOR FORCE [ PEOPLE ]
70.0%
PERCENT IN LABOR FORCE
6.4%
UNEMPLOYMENT RATE
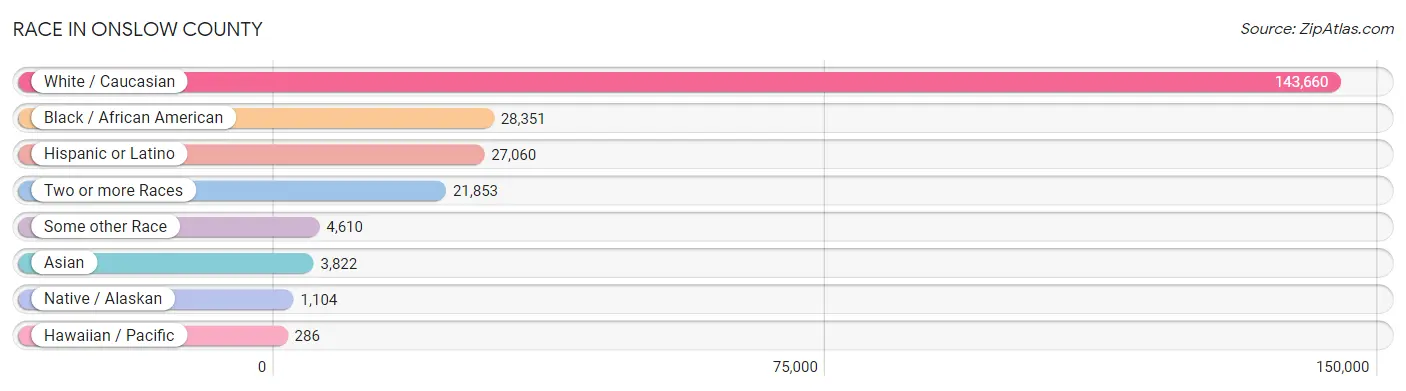
Race in Onslow County
The most populous races in Onslow County are White / Caucasian (143,660 | 70.5%), Black / African American (28,351 | 13.9%), and Hispanic or Latino (27,060 | 13.3%).
| Race | # Population | % Population |
| Asian | 3,822 | 1.9% |
| Black / African American | 28,351 | 13.9% |
| Hawaiian / Pacific | 286 | 0.1% |
| Hispanic or Latino | 27,060 | 13.3% |
| Native / Alaskan | 1,104 | 0.5% |
| White / Caucasian | 143,660 | 70.5% |
| Two or more Races | 21,853 | 10.7% |
| Some other Race | 4,610 | 2.3% |
| Total | 203,686 | 100.0% |
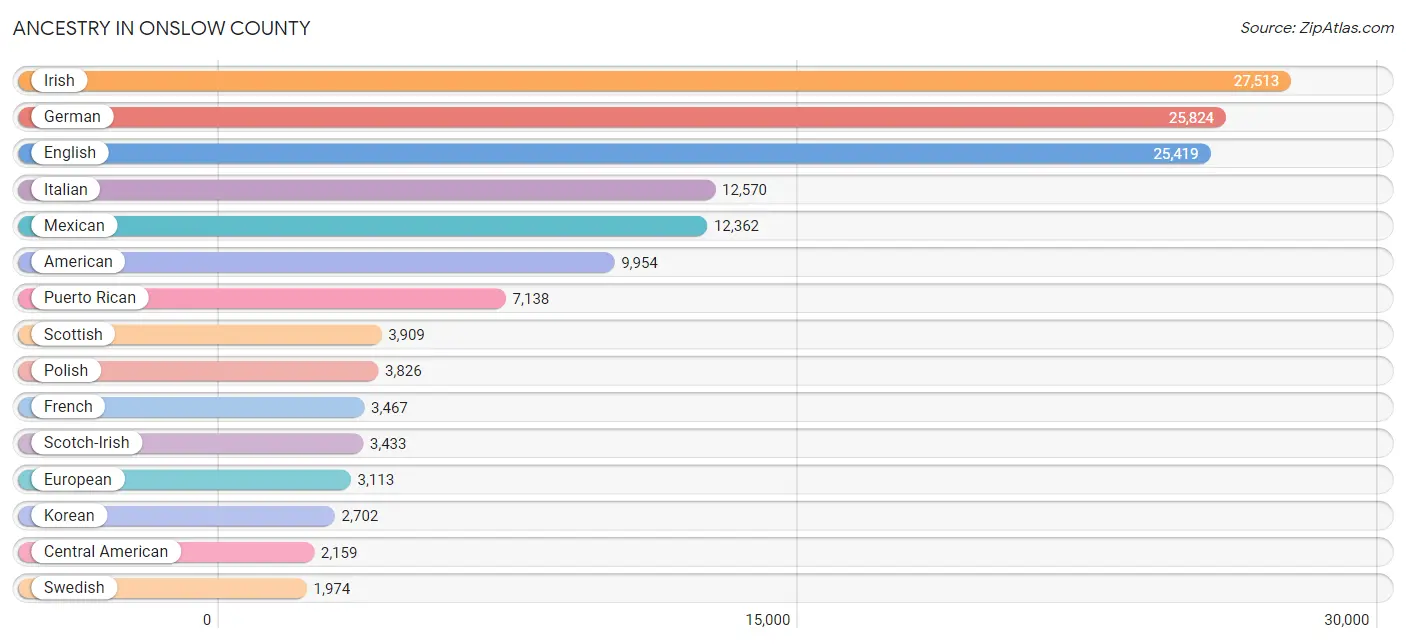
Ancestry in Onslow County
The most populous ancestries reported in Onslow County are Irish (27,513 | 13.5%), German (25,824 | 12.7%), English (25,419 | 12.5%), Italian (12,570 | 6.2%), and Mexican (12,362 | 6.1%), together accounting for 50.9% of all Onslow County residents.
| Ancestry | # Population | % Population |
| African | 1,015 | 0.5% |
| Alaska Native | 125 | 0.1% |
| Albanian | 18 | 0.0% |
| American | 9,954 | 4.9% |
| Apache | 31 | 0.0% |
| Arab | 863 | 0.4% |
| Argentinean | 57 | 0.0% |
| Armenian | 269 | 0.1% |
| Australian | 15 | 0.0% |
| Austrian | 296 | 0.2% |
| Bangladeshi | 86 | 0.0% |
| Barbadian | 41 | 0.0% |
| Basque | 17 | 0.0% |
| Belgian | 61 | 0.0% |
| Bermudan | 3 | 0.0% |
| Bhutanese | 1,323 | 0.6% |
| Blackfeet | 535 | 0.3% |
| Bolivian | 20 | 0.0% |
| Brazilian | 12 | 0.0% |
| British | 1,421 | 0.7% |
| British West Indian | 117 | 0.1% |
| Bulgarian | 19 | 0.0% |
| Burmese | 1,211 | 0.6% |
| Cajun | 57 | 0.0% |
| Canadian | 291 | 0.1% |
| Cape Verdean | 47 | 0.0% |
| Central American | 2,159 | 1.1% |
| Central American Indian | 432 | 0.2% |
| Cherokee | 1,660 | 0.8% |
| Chilean | 196 | 0.1% |
| Chinese | 176 | 0.1% |
| Chippewa | 132 | 0.1% |
| Choctaw | 70 | 0.0% |
| Colombian | 549 | 0.3% |
| Comanche | 17 | 0.0% |
| Costa Rican | 73 | 0.0% |
| Creek | 23 | 0.0% |
| Croatian | 249 | 0.1% |
| Cuban | 774 | 0.4% |
| Cypriot | 65 | 0.0% |
| Czech | 627 | 0.3% |
| Czechoslovakian | 98 | 0.1% |
| Danish | 355 | 0.2% |
| Dominican | 1,400 | 0.7% |
| Dutch | 1,622 | 0.8% |
| Dutch West Indian | 42 | 0.0% |
| Eastern European | 117 | 0.1% |
| Ecuadorian | 452 | 0.2% |
| English | 25,419 | 12.5% |
| Ethiopian | 18 | 0.0% |
| European | 3,113 | 1.5% |
| Filipino | 58 | 0.0% |
| Finnish | 193 | 0.1% |
| French | 3,467 | 1.7% |
| French American Indian | 18 | 0.0% |
| French Canadian | 1,664 | 0.8% |
| German | 25,824 | 12.7% |
| Ghanaian | 10 | 0.0% |
| Greek | 655 | 0.3% |
| Guamanian / Chamorro | 108 | 0.1% |
| Guatemalan | 408 | 0.2% |
| Guyanese | 67 | 0.0% |
| Haitian | 647 | 0.3% |
| Honduran | 310 | 0.2% |
| Hopi | 53 | 0.0% |
| Houma | 35 | 0.0% |
| Hungarian | 1,293 | 0.6% |
| Indian (Asian) | 1,355 | 0.7% |
| Indonesian | 19 | 0.0% |
| Iranian | 37 | 0.0% |
| Irish | 27,513 | 13.5% |
| Iroquois | 5 | 0.0% |
| Israeli | 18 | 0.0% |
| Italian | 12,570 | 6.2% |
| Jamaican | 597 | 0.3% |
| Japanese | 237 | 0.1% |
| Kenyan | 69 | 0.0% |
| Korean | 2,702 | 1.3% |
| Latvian | 52 | 0.0% |
| Lebanese | 480 | 0.2% |
| Liberian | 25 | 0.0% |
| Lithuanian | 117 | 0.1% |
| Lumbee | 96 | 0.1% |
| Malaysian | 117 | 0.1% |
| Menominee | 16 | 0.0% |
| Mexican | 12,362 | 6.1% |
| Mexican American Indian | 131 | 0.1% |
| Mongolian | 6 | 0.0% |
| Native Hawaiian | 554 | 0.3% |
| Navajo | 31 | 0.0% |
| New Zealander | 104 | 0.1% |
| Nicaraguan | 155 | 0.1% |
| Nigerian | 199 | 0.1% |
| Northern European | 135 | 0.1% |
| Norwegian | 1,275 | 0.6% |
| Osage | 5 | 0.0% |
| Pakistani | 182 | 0.1% |
| Panamanian | 184 | 0.1% |
| Paraguayan | 112 | 0.1% |
| Pennsylvania German | 18 | 0.0% |
| Peruvian | 211 | 0.1% |
| Polish | 3,826 | 1.9% |
| Portuguese | 1,078 | 0.5% |
| Potawatomi | 13 | 0.0% |
| Pueblo | 26 | 0.0% |
| Puerto Rican | 7,138 | 3.5% |
| Puget Sound Salish | 16 | 0.0% |
| Romanian | 111 | 0.1% |
| Russian | 663 | 0.3% |
| Salvadoran | 1,029 | 0.5% |
| Samoan | 289 | 0.1% |
| Scandinavian | 1,858 | 0.9% |
| Scotch-Irish | 3,433 | 1.7% |
| Scottish | 3,909 | 1.9% |
| Seminole | 33 | 0.0% |
| Serbian | 47 | 0.0% |
| Sioux | 194 | 0.1% |
| Slavic | 26 | 0.0% |
| Slovak | 202 | 0.1% |
| Slovene | 11 | 0.0% |
| Somali | 22 | 0.0% |
| South African | 45 | 0.0% |
| South American | 1,917 | 0.9% |
| South American Indian | 5 | 0.0% |
| Spaniard | 707 | 0.4% |
| Spanish | 318 | 0.2% |
| Sri Lankan | 474 | 0.2% |
| Subsaharan African | 1,494 | 0.7% |
| Swedish | 1,974 | 1.0% |
| Swiss | 345 | 0.2% |
| Syrian | 206 | 0.1% |
| Thai | 505 | 0.3% |
| Tlingit-Haida | 1 | 0.0% |
| Tohono O'Odham | 16 | 0.0% |
| Tongan | 1 | 0.0% |
| Trinidadian and Tobagonian | 52 | 0.0% |
| Turkish | 13 | 0.0% |
| Ukrainian | 391 | 0.2% |
| Uruguayan | 19 | 0.0% |
| Ute | 14 | 0.0% |
| Venezuelan | 301 | 0.2% |
| Vietnamese | 54 | 0.0% |
| Welsh | 1,577 | 0.8% |
| West Indian | 420 | 0.2% |
| Yugoslavian | 15 | 0.0% | View All 145 Rows |
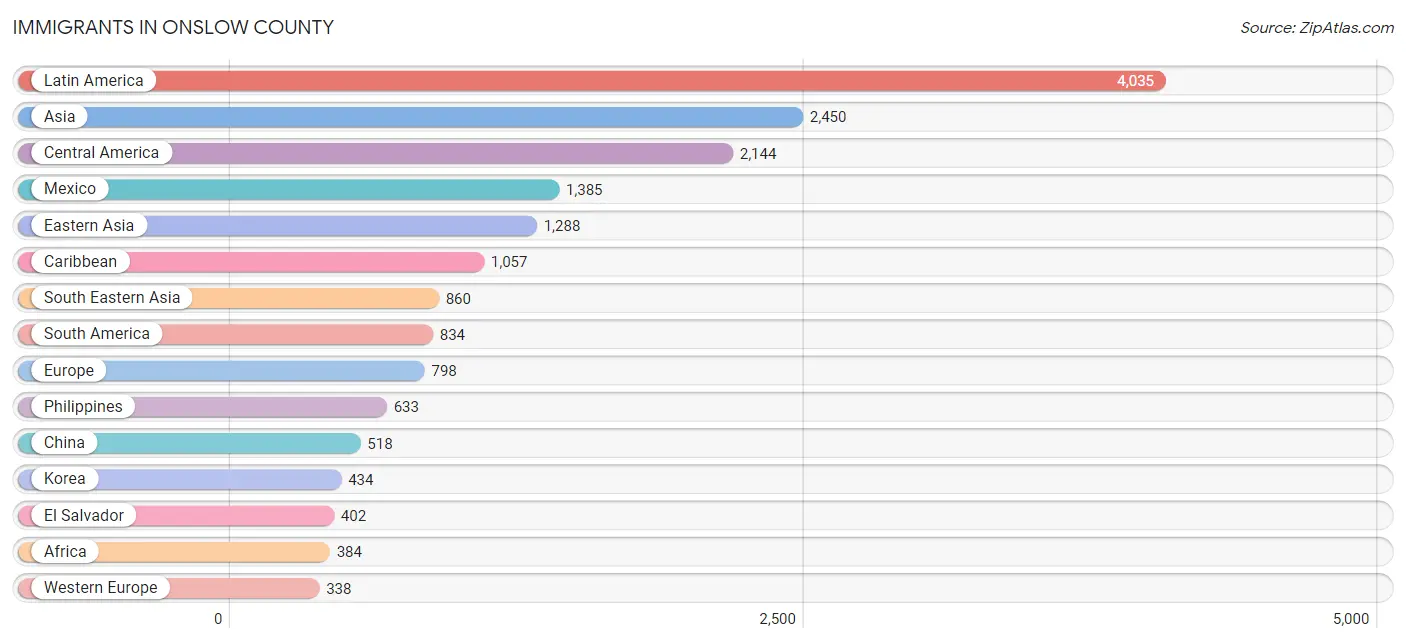
Immigrants in Onslow County
The most numerous immigrant groups reported in Onslow County came from Latin America (4,035 | 2.0%), Asia (2,450 | 1.2%), Central America (2,144 | 1.1%), Mexico (1,385 | 0.7%), and Eastern Asia (1,288 | 0.6%), together accounting for 5.5% of all Onslow County residents.
| Immigration Origin | # Population | % Population |
| Africa | 384 | 0.2% |
| Albania | 18 | 0.0% |
| Armenia | 37 | 0.0% |
| Asia | 2,450 | 1.2% |
| Australia | 12 | 0.0% |
| Austria | 12 | 0.0% |
| Bangladesh | 64 | 0.0% |
| Barbados | 65 | 0.0% |
| Bolivia | 12 | 0.0% |
| Brazil | 86 | 0.0% |
| Cambodia | 7 | 0.0% |
| Cameroon | 43 | 0.0% |
| Canada | 31 | 0.0% |
| Caribbean | 1,057 | 0.5% |
| Central America | 2,144 | 1.1% |
| Chile | 80 | 0.0% |
| China | 518 | 0.3% |
| Colombia | 142 | 0.1% |
| Costa Rica | 16 | 0.0% |
| Cuba | 196 | 0.1% |
| Dominican Republic | 256 | 0.1% |
| Eastern Africa | 136 | 0.1% |
| Eastern Asia | 1,288 | 0.6% |
| Eastern Europe | 124 | 0.1% |
| Ecuador | 168 | 0.1% |
| Egypt | 29 | 0.0% |
| El Salvador | 402 | 0.2% |
| England | 58 | 0.0% |
| Ethiopia | 26 | 0.0% |
| Europe | 798 | 0.4% |
| Germany | 326 | 0.2% |
| Ghana | 10 | 0.0% |
| Greece | 71 | 0.0% |
| Grenada | 19 | 0.0% |
| Guatemala | 62 | 0.0% |
| Guyana | 46 | 0.0% |
| Haiti | 219 | 0.1% |
| Honduras | 170 | 0.1% |
| Hong Kong | 23 | 0.0% |
| India | 148 | 0.1% |
| Iran | 16 | 0.0% |
| Italy | 16 | 0.0% |
| Jamaica | 235 | 0.1% |
| Japan | 336 | 0.2% |
| Kazakhstan | 9 | 0.0% |
| Kenya | 69 | 0.0% |
| Korea | 434 | 0.2% |
| Laos | 35 | 0.0% |
| Latin America | 4,035 | 2.0% |
| Latvia | 43 | 0.0% |
| Liberia | 34 | 0.0% |
| Lithuania | 5 | 0.0% |
| Mexico | 1,385 | 0.7% |
| Middle Africa | 43 | 0.0% |
| Nepal | 6 | 0.0% |
| Nicaragua | 24 | 0.0% |
| Nigeria | 18 | 0.0% |
| Northern Africa | 29 | 0.0% |
| Northern Europe | 237 | 0.1% |
| Oceania | 258 | 0.1% |
| Pakistan | 1 | 0.0% |
| Panama | 85 | 0.0% |
| Peru | 59 | 0.0% |
| Philippines | 633 | 0.3% |
| Romania | 15 | 0.0% |
| Russia | 31 | 0.0% |
| Singapore | 3 | 0.0% |
| South Africa | 48 | 0.0% |
| South America | 834 | 0.4% |
| South Central Asia | 244 | 0.1% |
| South Eastern Asia | 860 | 0.4% |
| Southern Europe | 99 | 0.1% |
| Spain | 12 | 0.0% |
| St. Vincent and the Grenadines | 7 | 0.0% |
| Syria | 16 | 0.0% |
| Taiwan | 75 | 0.0% |
| Thailand | 65 | 0.0% |
| Trinidad and Tobago | 36 | 0.0% |
| Turkey | 5 | 0.0% |
| Ukraine | 12 | 0.0% |
| Venezuela | 153 | 0.1% |
| Vietnam | 117 | 0.1% |
| Western Africa | 62 | 0.0% |
| Western Asia | 58 | 0.0% |
| Western Europe | 338 | 0.2% | View All 85 Rows |
Sex and Age in Onslow County
Sex and Age in Onslow County
The most populous age groups in Onslow County are 20 to 24 Years (25,002 | 22.1%) for men and 20 to 24 Years (9,220 | 10.2%) for women.

| Age Bracket | Male | Female |
| Under 5 Years | 8,425 (7.4%) | 8,236 (9.1%) |
| 5 to 9 Years | 7,101 (6.3%) | 6,848 (7.6%) |
| 10 to 14 Years | 6,405 (5.7%) | 6,109 (6.8%) |
| 15 to 19 Years | 10,847 (9.6%) | 5,279 (5.8%) |
| 20 to 24 Years | 25,002 (22.1%) | 9,220 (10.2%) |
| 25 to 29 Years | 11,402 (10.1%) | 8,288 (9.2%) |
| 30 to 34 Years | 8,459 (7.5%) | 7,781 (8.6%) |
| 35 to 39 Years | 6,791 (6.0%) | 6,287 (7.0%) |
| 40 to 44 Years | 4,759 (4.2%) | 4,655 (5.1%) |
| 45 to 49 Years | 3,938 (3.5%) | 4,095 (4.5%) |
| 50 to 54 Years | 3,704 (3.3%) | 3,987 (4.4%) |
| 55 to 59 Years | 3,989 (3.5%) | 4,319 (4.8%) |
| 60 to 64 Years | 3,777 (3.3%) | 4,420 (4.9%) |
| 65 to 69 Years | 3,535 (3.1%) | 3,825 (4.2%) |
| 70 to 74 Years | 2,099 (1.8%) | 2,482 (2.8%) |
| 75 to 79 Years | 1,503 (1.3%) | 2,110 (2.3%) |
| 80 to 84 Years | 902 (0.8%) | 1,209 (1.3%) |
| 85 Years and over | 730 (0.6%) | 1,168 (1.3%) |
| Total | 113,368 (100.0%) | 90,318 (100.0%) |
Families and Households in Onslow County
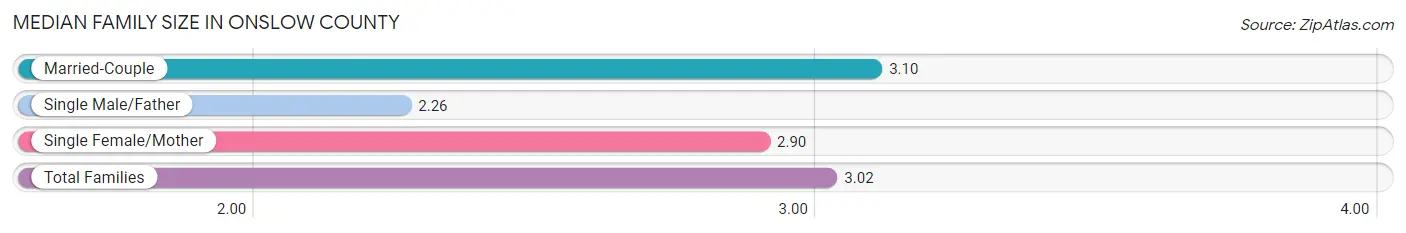
Median Family Size in Onslow County
The median family size in Onslow County is 3.02 persons per family, with married-couple families (39,866 | 78.1%) accounting for the largest median family size of 3.1 persons per family. On the other hand, single male/father families (2,828 | 5.5%) represent the smallest median family size with 2.26 persons per family.
| Family Type | # Families | Family Size |
| Married-Couple | 39,866 (78.1%) | 3.10 |
| Single Male/Father | 2,828 (5.5%) | 2.26 |
| Single Female/Mother | 8,357 (16.4%) | 2.90 |
| Total Families | 51,051 (100.0%) | 3.02 |
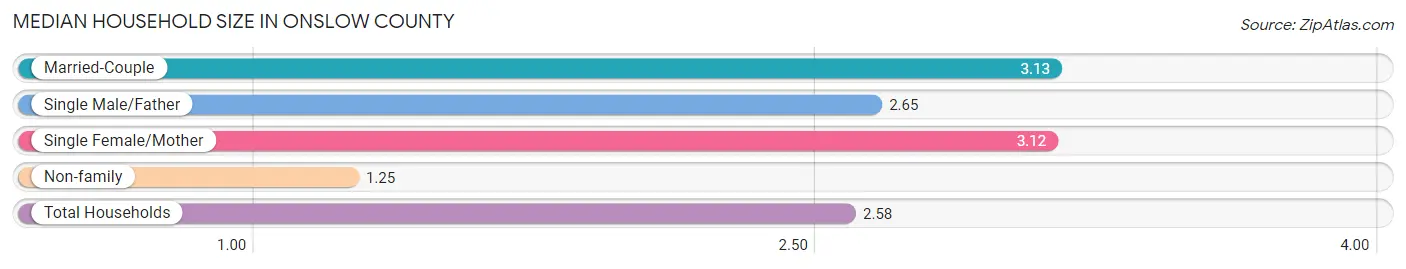
Median Household Size in Onslow County
The median household size in Onslow County is 2.58 persons per household, with married-couple households (39,866 | 56.1%) accounting for the largest median household size of 3.13 persons per household. non-family households (19,958 | 28.1%) represent the smallest median household size with 1.25 persons per household.
| Household Type | # Households | Household Size |
| Married-Couple | 39,866 (56.1%) | 3.13 |
| Single Male/Father | 2,828 (4.0%) | 2.65 |
| Single Female/Mother | 8,357 (11.8%) | 3.12 |
| Non-family | 19,958 (28.1%) | 1.25 |
| Total Households | 71,009 (100.0%) | 2.58 |
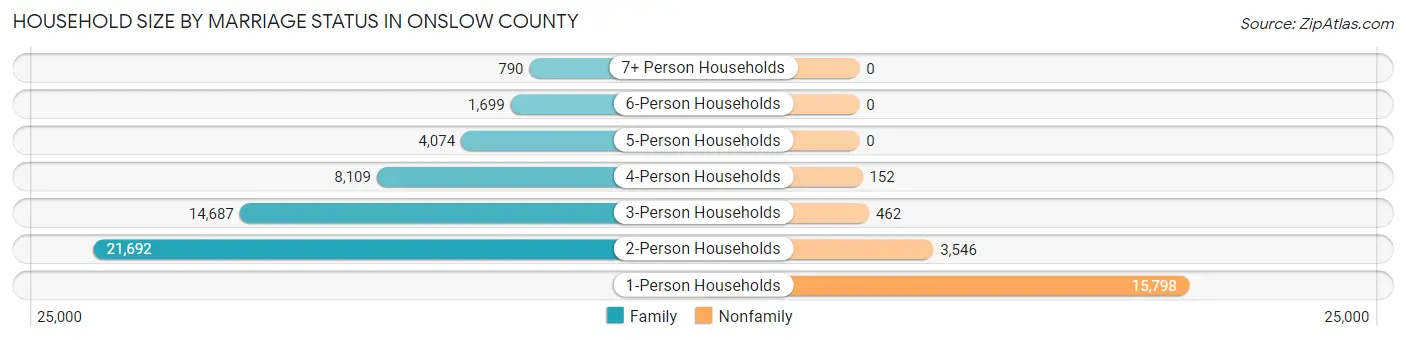
Household Size by Marriage Status in Onslow County
Out of a total of 71,009 households in Onslow County, 51,051 (71.9%) are family households, while 19,958 (28.1%) are nonfamily households. The most numerous type of family households are 2-person households, comprising 21,692, and the most common type of nonfamily households are 1-person households, comprising 15,798.
| Household Size | Family Households | Nonfamily Households |
| 1-Person Households | - | 15,798 (22.3%) |
| 2-Person Households | 21,692 (30.5%) | 3,546 (5.0%) |
| 3-Person Households | 14,687 (20.7%) | 462 (0.6%) |
| 4-Person Households | 8,109 (11.4%) | 152 (0.2%) |
| 5-Person Households | 4,074 (5.7%) | 0 (0.0%) |
| 6-Person Households | 1,699 (2.4%) | 0 (0.0%) |
| 7+ Person Households | 790 (1.1%) | 0 (0.0%) |
| Total | 51,051 (71.9%) | 19,958 (28.1%) |
Female Fertility in Onslow County
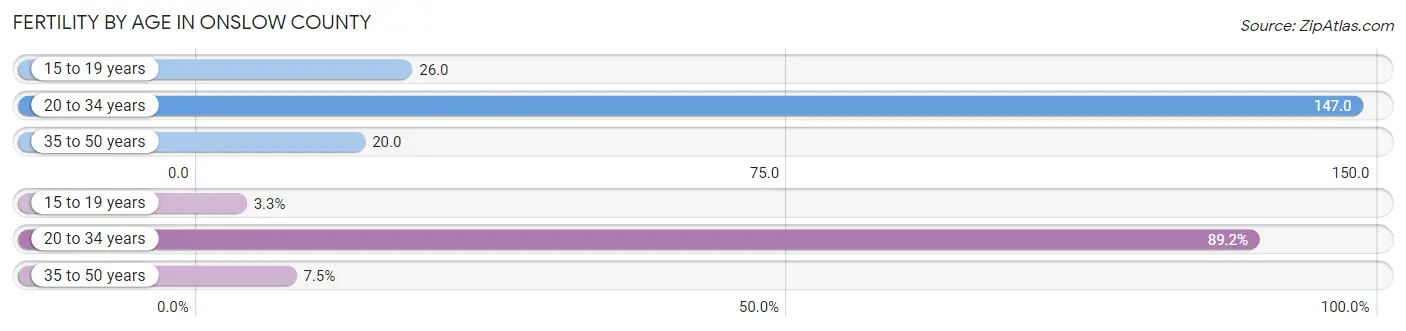
Fertility by Age in Onslow County
Average fertility rate in Onslow County is 90.0 births per 1,000 women. Women in the age bracket of 20 to 34 years have the highest fertility rate with 147.0 births per 1,000 women. Women in the age bracket of 20 to 34 years acount for 89.2% of all women with births.
| Age Bracket | Women with Births | Births / 1,000 Women |
| 15 to 19 years | 137 (3.3%) | 26.0 |
| 20 to 34 years | 3,724 (89.2%) | 147.0 |
| 35 to 50 years | 313 (7.5%) | 20.0 |
| Total | 4,174 (100.0%) | 90.0 |
Fertility by Age by Marriage Status in Onslow County
84.8% of women with births (4,174) in Onslow County are married. The highest percentage of unmarried women with births falls into 35 to 50 years age bracket with 18.2% of them unmarried at the time of birth, while the lowest percentage of unmarried women with births belong to 15 to 19 years age bracket with 0.0% of them unmarried.
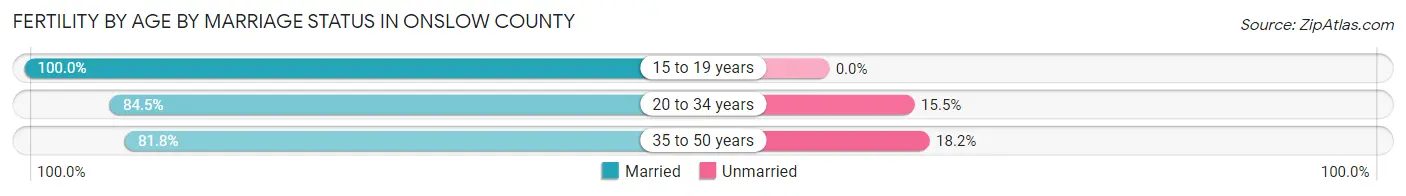
| Age Bracket | Married | Unmarried |
| 15 to 19 years | 137 (100.0%) | 0 (0.0%) |
| 20 to 34 years | 3,147 (84.5%) | 577 (15.5%) |
| 35 to 50 years | 256 (81.8%) | 57 (18.2%) |
| Total | 3,540 (84.8%) | 634 (15.2%) |
Fertility by Education in Onslow County
Average fertility rate in Onslow County is 90.0 births per 1,000 women. Women with the education attainment of high school diploma have the highest fertility rate of 141.0 births per 1,000 women, while women with the education attainment of less than high school have the lowest fertility at 41.0 births per 1,000 women. Women with the education attainment of high school diploma represent 37.9% of all women with births.
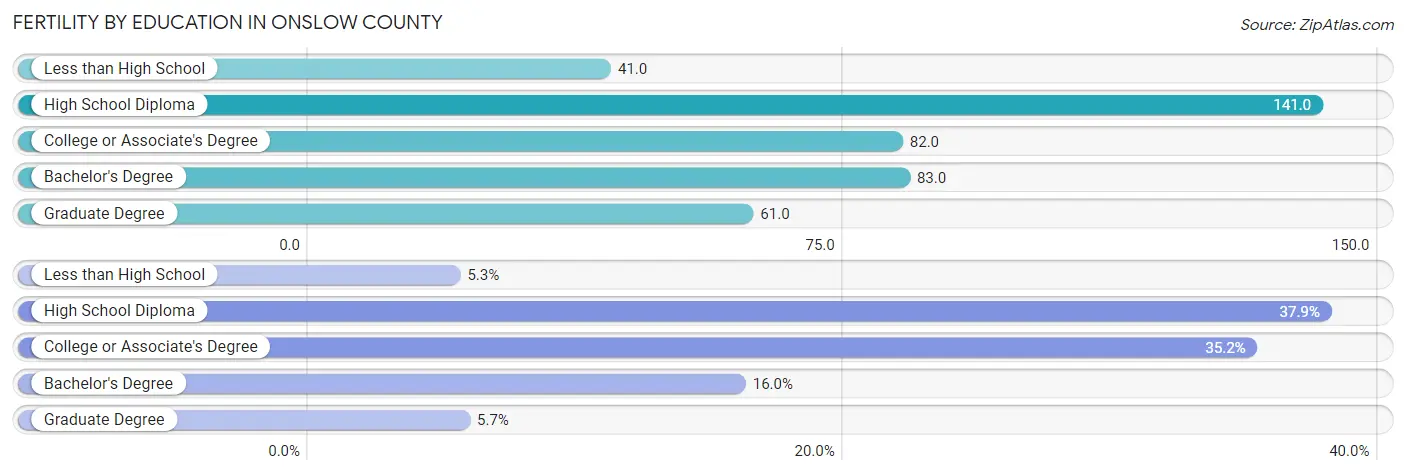
| Educational Attainment | Women with Births | Births / 1,000 Women |
| Less than High School | 221 (5.3%) | 41.0 |
| High School Diploma | 1,583 (37.9%) | 141.0 |
| College or Associate's Degree | 1,467 (35.1%) | 82.0 |
| Bachelor's Degree | 667 (16.0%) | 83.0 |
| Graduate Degree | 236 (5.7%) | 61.0 |
| Total | 4,174 (100.0%) | 90.0 |
Fertility by Education by Marriage Status in Onslow County
15.2% of women with births in Onslow County are unmarried. Women with the educational attainment of bachelor's degree are most likely to be married with 97.2% of them married at childbirth, while women with the educational attainment of less than high school are least likely to be married with 29.0% of them unmarried at childbirth.
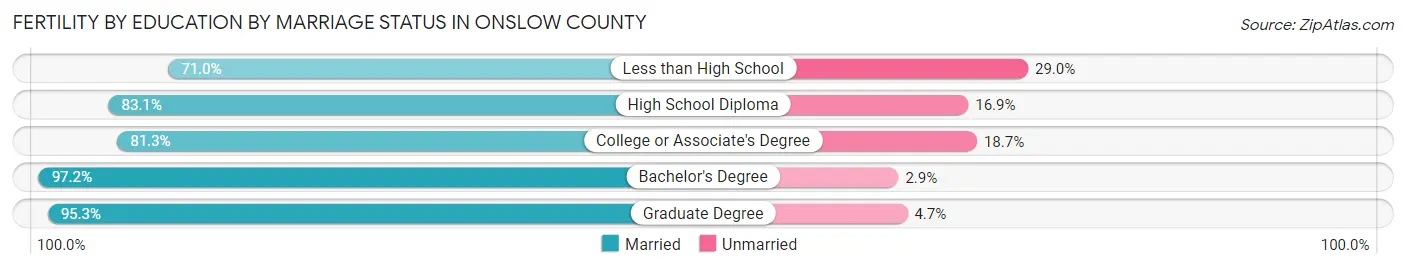
| Educational Attainment | Married | Unmarried |
| Less than High School | 157 (71.0%) | 64 (29.0%) |
| High School Diploma | 1,315 (83.1%) | 268 (16.9%) |
| College or Associate's Degree | 1,193 (81.3%) | 274 (18.7%) |
| Bachelor's Degree | 648 (97.2%) | 19 (2.9%) |
| Graduate Degree | 225 (95.3%) | 11 (4.7%) |
| Total | 3,540 (84.8%) | 634 (15.2%) |
Income in Onslow County
Income Overview in Onslow County
Per Capita Income in Onslow County is $29,214, while median incomes of families and households are $67,237 and $59,976 respectively.
| Characteristic | Number | Measure |
| Per Capita Income | 203,686 | $29,214 |
| Median Family Income | 51,051 | $67,237 |
| Mean Family Income | 51,051 | $83,238 |
| Median Household Income | 71,009 | $59,976 |
| Mean Household Income | 71,009 | $76,084 |
| Income Deficit | 51,051 | $11,714 |
| Wage / Income Gap (%) | 203,686 | 20.65% |
| Wage / Income Gap ($) | 203,686 | 79.35¢ per $1 |
| Gini / Inequality Index | 203,686 | 0.42 |
Earnings by Sex in Onslow County
Average Earnings in Onslow County are $31,016, $33,439 for men and $26,533 for women, a difference of 20.6%.
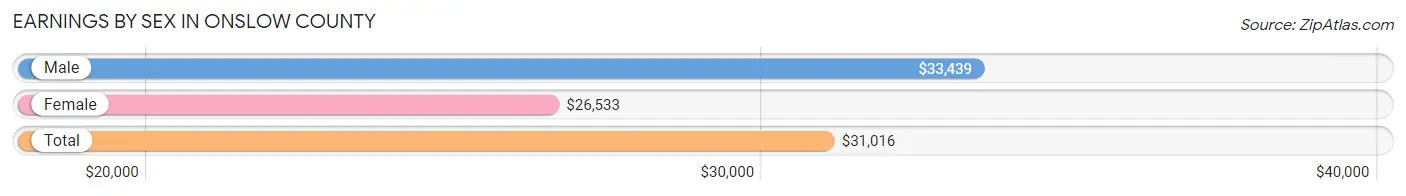
| Sex | Number | Average Earnings |
| Male | 73,617 (64.5%) | $33,439 |
| Female | 40,577 (35.5%) | $26,533 |
| Total | 114,194 (100.0%) | $31,016 |
Earnings by Sex by Income Bracket in Onslow County
The most common earnings brackets in Onslow County are $25,000 to $29,999 for men (10,425 | 14.2%) and $25,000 to $29,999 for women (3,373 | 8.3%).
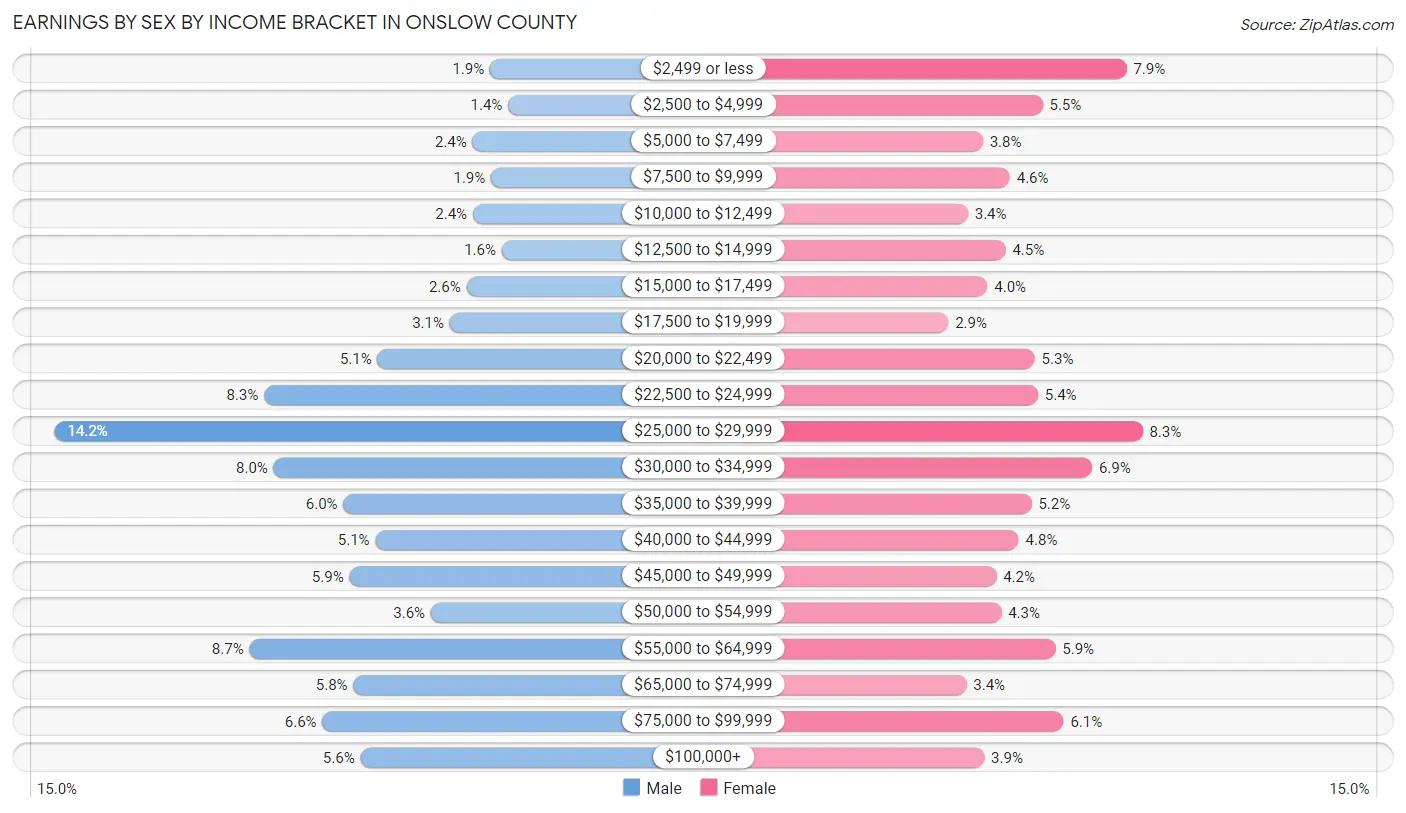
| Income | Male | Female |
| $2,499 or less | 1,416 (1.9%) | 3,188 (7.9%) |
| $2,500 to $4,999 | 1,037 (1.4%) | 2,232 (5.5%) |
| $5,000 to $7,499 | 1,772 (2.4%) | 1,550 (3.8%) |
| $7,500 to $9,999 | 1,391 (1.9%) | 1,859 (4.6%) |
| $10,000 to $12,499 | 1,765 (2.4%) | 1,378 (3.4%) |
| $12,500 to $14,999 | 1,168 (1.6%) | 1,811 (4.5%) |
| $15,000 to $17,499 | 1,896 (2.6%) | 1,601 (4.0%) |
| $17,500 to $19,999 | 2,245 (3.0%) | 1,157 (2.9%) |
| $20,000 to $22,499 | 3,742 (5.1%) | 2,142 (5.3%) |
| $22,500 to $24,999 | 6,088 (8.3%) | 2,180 (5.4%) |
| $25,000 to $29,999 | 10,425 (14.2%) | 3,373 (8.3%) |
| $30,000 to $34,999 | 5,889 (8.0%) | 2,794 (6.9%) |
| $35,000 to $39,999 | 4,443 (6.0%) | 2,107 (5.2%) |
| $40,000 to $44,999 | 3,783 (5.1%) | 1,959 (4.8%) |
| $45,000 to $49,999 | 4,318 (5.9%) | 1,703 (4.2%) |
| $50,000 to $54,999 | 2,632 (3.6%) | 1,762 (4.3%) |
| $55,000 to $64,999 | 6,388 (8.7%) | 2,378 (5.9%) |
| $65,000 to $74,999 | 4,244 (5.8%) | 1,365 (3.4%) |
| $75,000 to $99,999 | 4,881 (6.6%) | 2,473 (6.1%) |
| $100,000+ | 4,094 (5.6%) | 1,565 (3.9%) |
| Total | 73,617 (100.0%) | 40,577 (100.0%) |
Earnings by Sex by Educational Attainment in Onslow County
Average earnings in Onslow County are $48,684 for men and $33,391 for women, a difference of 31.4%. Men with an educational attainment of graduate degree enjoy the highest average annual earnings of $85,154, while those with less than high school education earn the least with $25,984. Women with an educational attainment of graduate degree earn the most with the average annual earnings of $61,788, while those with less than high school education have the smallest earnings of $22,734.

| Educational Attainment | Male Income | Female Income |
| Less than High School | $25,984 | $22,734 |
| High School Diploma | $42,989 | $24,117 |
| College or Associate's Degree | $46,710 | $28,259 |
| Bachelor's Degree | $65,986 | $45,571 |
| Graduate Degree | $85,154 | $61,788 |
| Total | $48,684 | $33,391 |
Family Income in Onslow County
Family Income Brackets in Onslow County
According to the Onslow County family income data, there are 10,619 families falling into the $50,000 to $74,999 income range, which is the most common income bracket and makes up 20.8% of all families. Conversely, the $10,000 to $14,999 income bracket is the least frequent group with only 1,276 families (2.5%) belonging to this category.
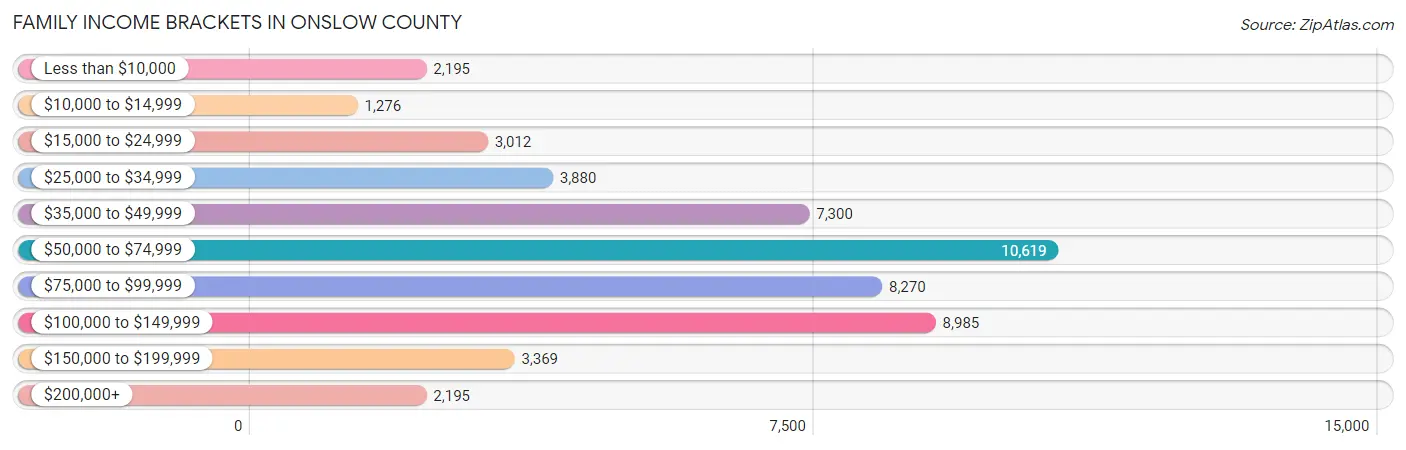
| Income Bracket | # Families | % Families |
| Less than $10,000 | 2,195 | 4.3% |
| $10,000 to $14,999 | 1,276 | 2.5% |
| $15,000 to $24,999 | 3,012 | 5.9% |
| $25,000 to $34,999 | 3,880 | 7.6% |
| $35,000 to $49,999 | 7,300 | 14.3% |
| $50,000 to $74,999 | 10,619 | 20.8% |
| $75,000 to $99,999 | 8,270 | 16.2% |
| $100,000 to $149,999 | 8,985 | 17.6% |
| $150,000 to $199,999 | 3,369 | 6.6% |
| $200,000+ | 2,195 | 4.3% |
Family Income by Famaliy Size in Onslow County
4-person families (7,457 | 14.6%) account for the highest median family income in Onslow County with $83,238 per family, while 2-person families (23,418 | 45.9%) have the highest median income of $30,522 per family member.
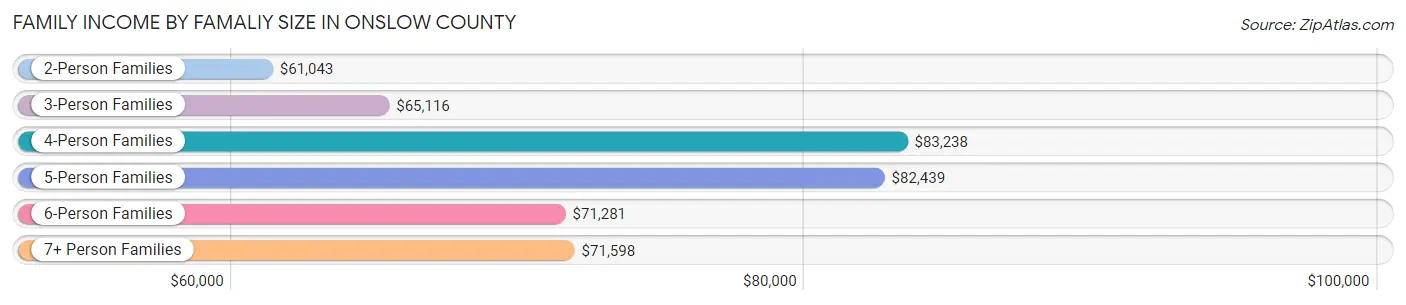
| Income Bracket | # Families | Median Income |
| 2-Person Families | 23,418 (45.9%) | $61,043 |
| 3-Person Families | 14,030 (27.5%) | $65,116 |
| 4-Person Families | 7,457 (14.6%) | $83,238 |
| 5-Person Families | 3,738 (7.3%) | $82,439 |
| 6-Person Families | 1,895 (3.7%) | $71,281 |
| 7+ Person Families | 513 (1.0%) | $71,598 |
| Total | 51,051 (100.0%) | $67,237 |
Family Income by Number of Earners in Onslow County
The median family income in Onslow County is $67,237, with families comprising 3+ earners (2,939) having the highest median family income of $114,981, while families with no earners (6,794) have the lowest median family income of $33,825, accounting for 5.8% and 13.3% of families, respectively.
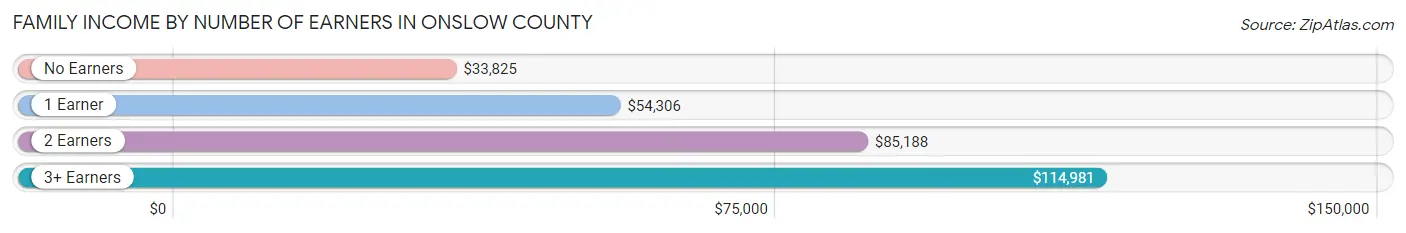
| Number of Earners | # Families | Median Income |
| No Earners | 6,794 (13.3%) | $33,825 |
| 1 Earner | 18,971 (37.2%) | $54,306 |
| 2 Earners | 22,347 (43.8%) | $85,188 |
| 3+ Earners | 2,939 (5.8%) | $114,981 |
| Total | 51,051 (100.0%) | $67,237 |
Household Income in Onslow County
Household Income Brackets in Onslow County
With 14,202 households falling in the category, the $50,000 to $74,999 income range is the most frequent in Onslow County, accounting for 20.0% of all households. In contrast, only 2,414 households (3.4%) fall into the $10,000 to $14,999 income bracket, making it the least populous group.
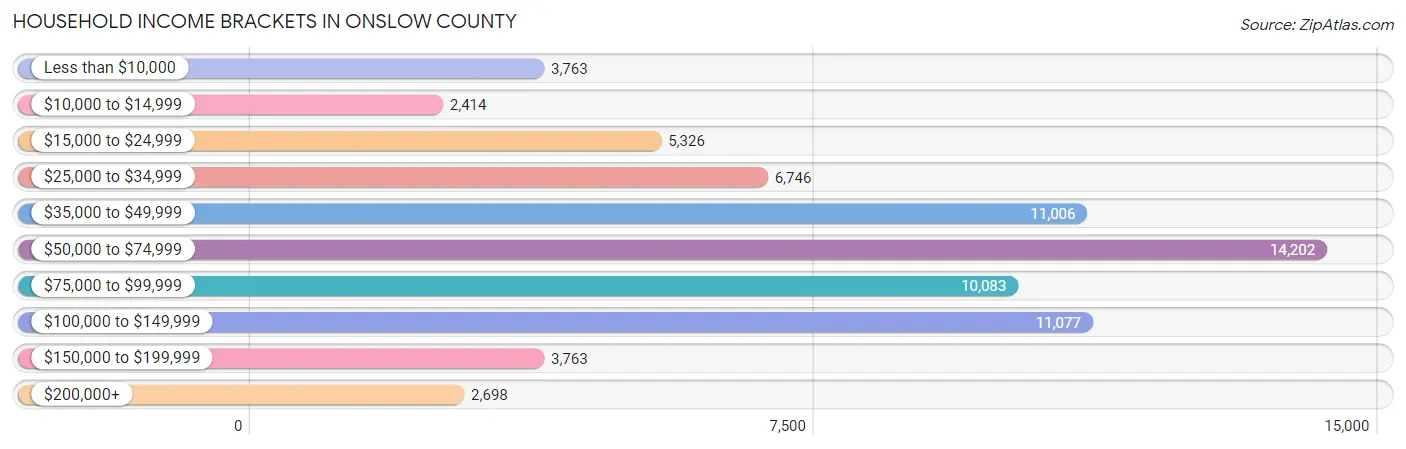
| Income Bracket | # Households | % Households |
| Less than $10,000 | 3,763 | 5.3% |
| $10,000 to $14,999 | 2,414 | 3.4% |
| $15,000 to $24,999 | 5,326 | 7.5% |
| $25,000 to $34,999 | 6,746 | 9.5% |
| $35,000 to $49,999 | 11,006 | 15.5% |
| $50,000 to $74,999 | 14,202 | 20.0% |
| $75,000 to $99,999 | 10,083 | 14.2% |
| $100,000 to $149,999 | 11,077 | 15.6% |
| $150,000 to $199,999 | 3,763 | 5.3% |
| $200,000+ | 2,698 | 3.8% |
Household Income by Householder Age in Onslow County
The median household income in Onslow County is $59,976, with the highest median household income of $74,663 found in the 45 to 64 years age bracket for the primary householder. A total of 18,097 households (25.5%) fall into this category. Meanwhile, the 15 to 24 years age bracket for the primary householder has the lowest median household income of $41,944, with 11,034 households (15.5%) in this group.
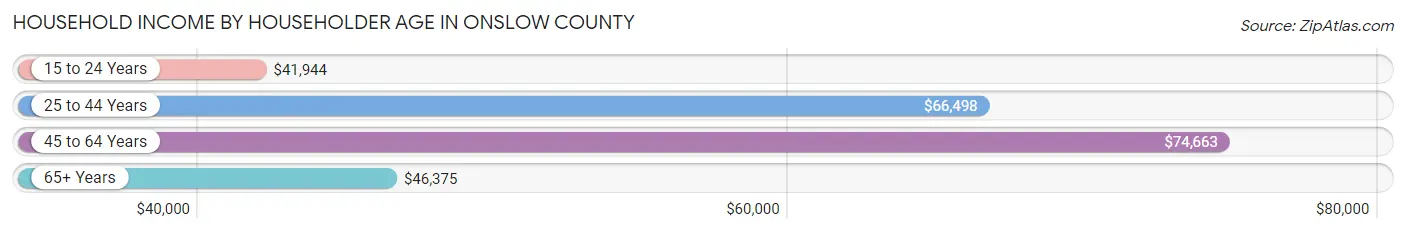
| Income Bracket | # Households | Median Income |
| 15 to 24 Years | 11,034 (15.5%) | $41,944 |
| 25 to 44 Years | 29,597 (41.7%) | $66,498 |
| 45 to 64 Years | 18,097 (25.5%) | $74,663 |
| 65+ Years | 12,281 (17.3%) | $46,375 |
| Total | 71,009 (100.0%) | $59,976 |
Poverty in Onslow County
Income Below Poverty by Sex and Age in Onslow County
With 10.7% poverty level for males and 14.9% for females among the residents of Onslow County, 5 year old males and 5 year old females are the most vulnerable to poverty, with 319 males (18.7%) and 325 females (26.1%) in their respective age groups living below the poverty level.
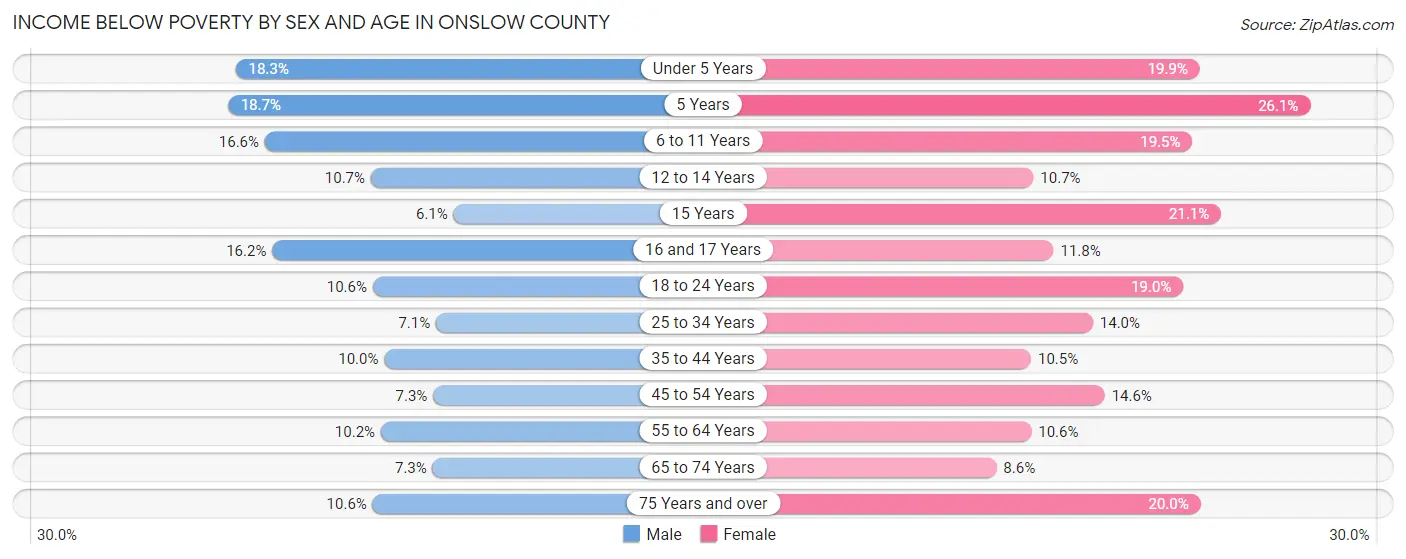
| Age Bracket | Male | Female |
| Under 5 Years | 1,507 (18.2%) | 1,628 (19.9%) |
| 5 Years | 319 (18.7%) | 325 (26.1%) |
| 6 to 11 Years | 1,315 (16.6%) | 1,531 (19.5%) |
| 12 to 14 Years | 396 (10.7%) | 402 (10.7%) |
| 15 Years | 64 (6.1%) | 151 (21.1%) |
| 16 and 17 Years | 346 (16.2%) | 286 (11.8%) |
| 18 to 24 Years | 1,639 (10.6%) | 2,004 (19.0%) |
| 25 to 34 Years | 1,289 (7.1%) | 2,237 (14.0%) |
| 35 to 44 Years | 1,134 (10.0%) | 1,148 (10.5%) |
| 45 to 54 Years | 550 (7.2%) | 1,182 (14.6%) |
| 55 to 64 Years | 787 (10.2%) | 919 (10.5%) |
| 65 to 74 Years | 408 (7.3%) | 540 (8.6%) |
| 75 Years and over | 330 (10.6%) | 877 (20.0%) |
| Total | 10,084 (10.7%) | 13,230 (14.9%) |
Income Above Poverty by Sex and Age in Onslow County
According to the poverty statistics in Onslow County, males aged 15 years and females aged 65 to 74 years are the age groups that are most secure financially, with 93.9% of males and 91.4% of females in these age groups living above the poverty line.
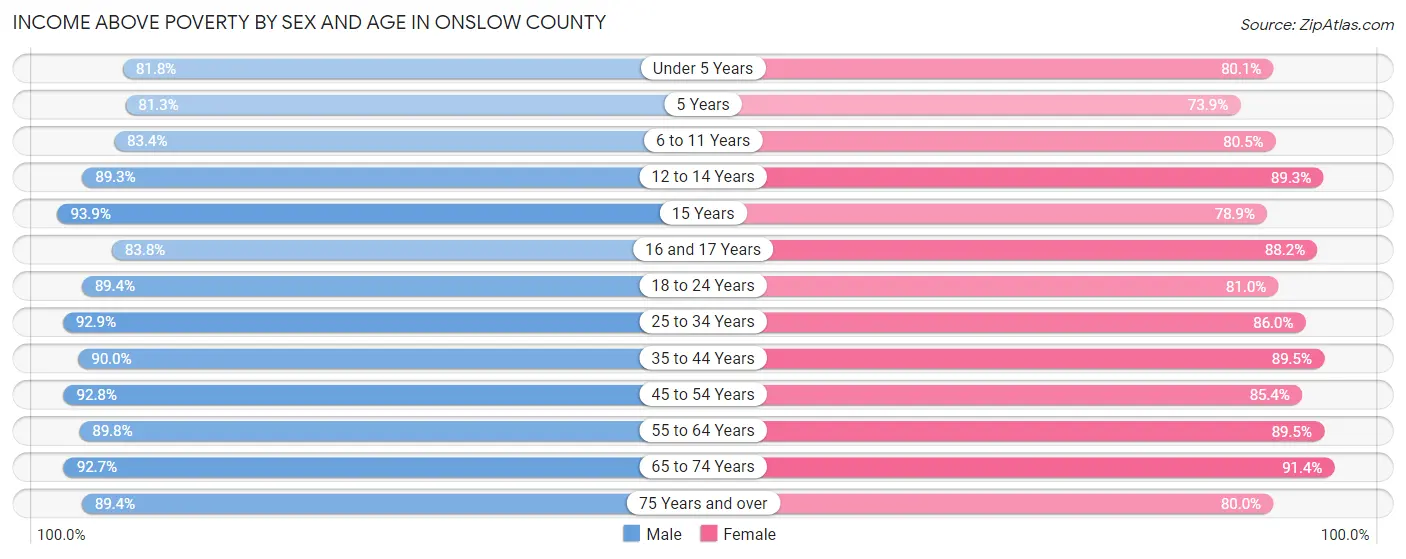
| Age Bracket | Male | Female |
| Under 5 Years | 6,750 (81.8%) | 6,539 (80.1%) |
| 5 Years | 1,388 (81.3%) | 921 (73.9%) |
| 6 to 11 Years | 6,595 (83.4%) | 6,313 (80.5%) |
| 12 to 14 Years | 3,299 (89.3%) | 3,366 (89.3%) |
| 15 Years | 983 (93.9%) | 564 (78.9%) |
| 16 and 17 Years | 1,788 (83.8%) | 2,140 (88.2%) |
| 18 to 24 Years | 13,811 (89.4%) | 8,540 (81.0%) |
| 25 to 34 Years | 16,895 (92.9%) | 13,762 (86.0%) |
| 35 to 44 Years | 10,240 (90.0%) | 9,747 (89.5%) |
| 45 to 54 Years | 7,040 (92.7%) | 6,892 (85.4%) |
| 55 to 64 Years | 6,957 (89.8%) | 7,790 (89.4%) |
| 65 to 74 Years | 5,200 (92.7%) | 5,729 (91.4%) |
| 75 Years and over | 2,777 (89.4%) | 3,513 (80.0%) |
| Total | 83,723 (89.2%) | 75,816 (85.1%) |
Income Below Poverty Among Married-Couple Families in Onslow County
The poverty statistics for married-couple families in Onslow County show that 6.2% or 2,485 of the total 39,866 families live below the poverty line. Families with 3 or 4 children have the highest poverty rate of 12.5%, comprising of 452 families. On the other hand, families with 5 or more children have the lowest poverty rate of 0.0%, which includes 0 families.
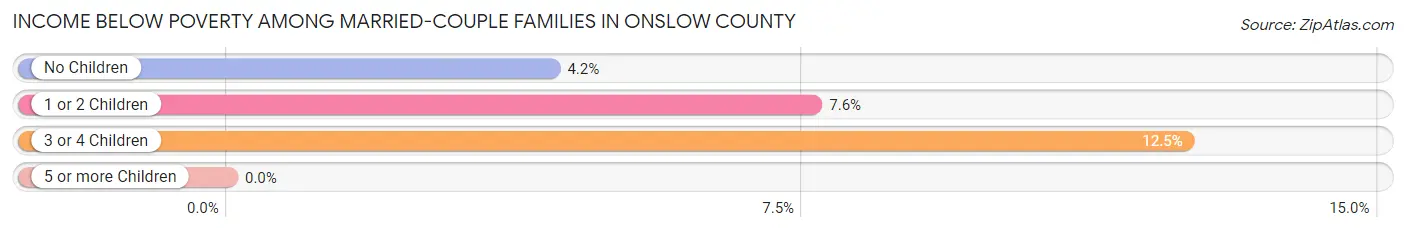
| Children | Above Poverty | Below Poverty |
| No Children | 19,722 (95.8%) | 867 (4.2%) |
| 1 or 2 Children | 14,118 (92.4%) | 1,166 (7.6%) |
| 3 or 4 Children | 3,168 (87.5%) | 452 (12.5%) |
| 5 or more Children | 373 (100.0%) | 0 (0.0%) |
| Total | 37,381 (93.8%) | 2,485 (6.2%) |
Income Below Poverty Among Single-Parent Households in Onslow County
According to the poverty data in Onslow County, 24.6% or 697 single-father households and 28.9% or 2,416 single-mother households are living below the poverty line. Among single-father households, those with 3 or 4 children have the highest poverty rate, with 13 households (50.0%) experiencing poverty. Likewise, among single-mother households, those with 5 or more children have the highest poverty rate, with 319 households (100.0%) falling below the poverty line.
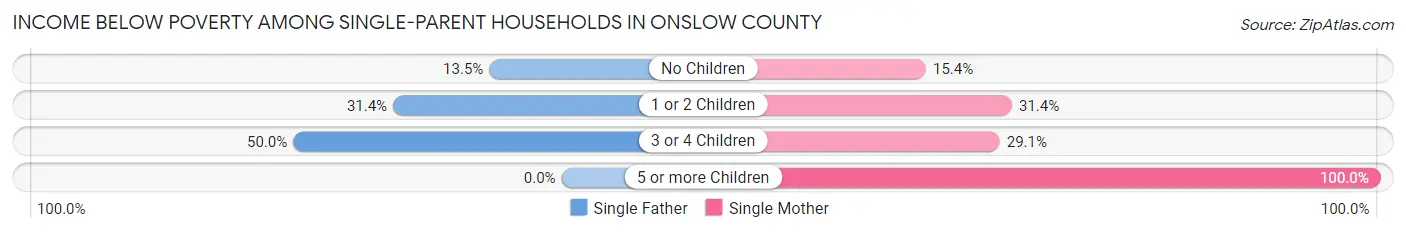
| Children | Single Father | Single Mother |
| No Children | 147 (13.5%) | 393 (15.3%) |
| 1 or 2 Children | 537 (31.4%) | 1,524 (31.4%) |
| 3 or 4 Children | 13 (50.0%) | 180 (29.1%) |
| 5 or more Children | 0 (0.0%) | 319 (100.0%) |
| Total | 697 (24.6%) | 2,416 (28.9%) |
Income Below Poverty Among Married-Couple vs Single-Parent Households in Onslow County
The poverty data for Onslow County shows that 2,485 of the married-couple family households (6.2%) and 3,113 of the single-parent households (27.8%) are living below the poverty level. Within the married-couple family households, those with 3 or 4 children have the highest poverty rate, with 452 households (12.5%) falling below the poverty line. Among the single-parent households, those with 5 or more children have the highest poverty rate, with 319 household (100.0%) living below poverty.

| Children | Married-Couple Families | Single-Parent Households |
| No Children | 867 (4.2%) | 540 (14.8%) |
| 1 or 2 Children | 1,166 (7.6%) | 2,061 (31.4%) |
| 3 or 4 Children | 452 (12.5%) | 193 (29.9%) |
| 5 or more Children | 0 (0.0%) | 319 (100.0%) |
| Total | 2,485 (6.2%) | 3,113 (27.8%) |
Employment Characteristics in Onslow County
Employment by Class of Employer in Onslow County
Among the 104,468 employed individuals in Onslow County, federal government employees (46,645 | 44.7%), private company employees (41,267 | 39.5%), and local government employees (5,440 | 5.2%) make up the most common classes of employment.
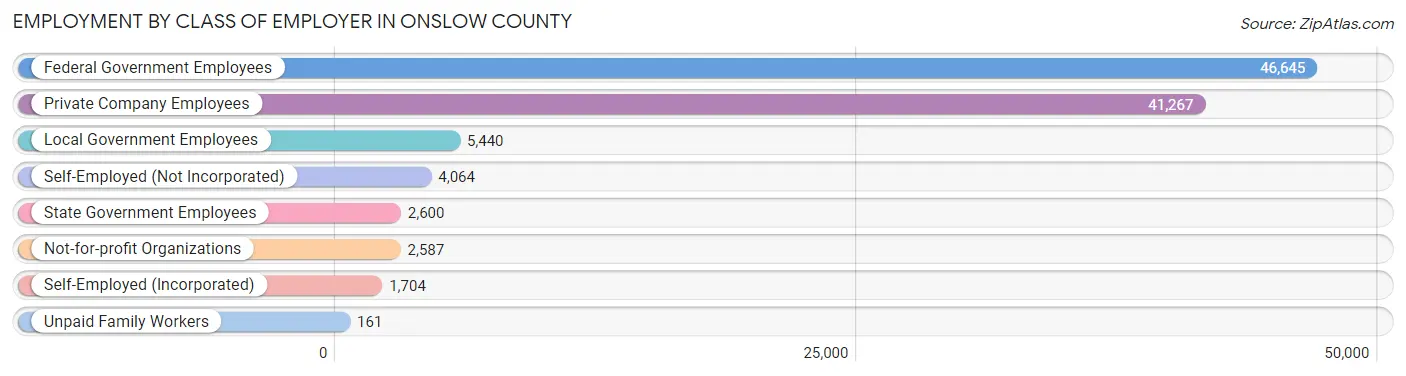
| Employer Class | # Employees | % Employees |
| Private Company Employees | 41,267 | 39.5% |
| Self-Employed (Incorporated) | 1,704 | 1.6% |
| Self-Employed (Not Incorporated) | 4,064 | 3.9% |
| Not-for-profit Organizations | 2,587 | 2.5% |
| Local Government Employees | 5,440 | 5.2% |
| State Government Employees | 2,600 | 2.5% |
| Federal Government Employees | 46,645 | 44.7% |
| Unpaid Family Workers | 161 | 0.2% |
| Total | 104,468 | 100.0% |
Employment Status by Age in Onslow County
According to the labor force statistics for Onslow County, out of the total population over 16 years of age (158,795), 70.0% or 111,156 individuals are in the labor force, with 6.4% or 7,114 of them unemployed. The age group with the highest labor force participation rate is 20 to 24 years, with 87.8% or 30,047 individuals in the labor force. Within the labor force, the 16 to 19 years age range has the highest percentage of unemployed individuals, with 15.4% or 1,535 of them being unemployed.
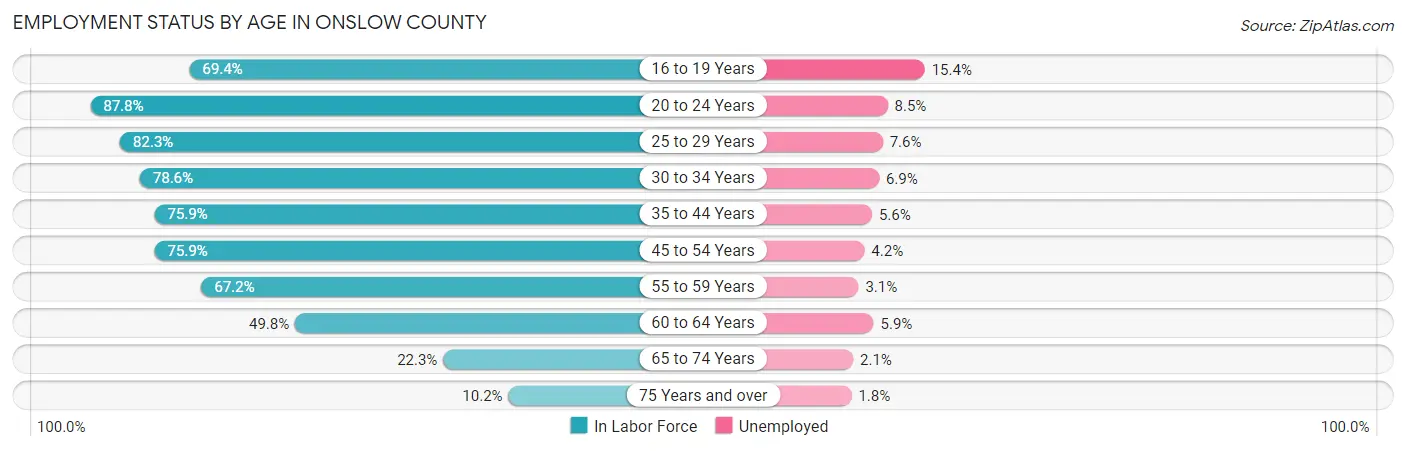
| Age Bracket | In Labor Force | Unemployed |
| 16 to 19 Years | 9,965 (69.4%) | 1,535 (15.4%) |
| 20 to 24 Years | 30,047 (87.8%) | 2,554 (8.5%) |
| 25 to 29 Years | 16,205 (82.3%) | 1,232 (7.6%) |
| 30 to 34 Years | 12,765 (78.6%) | 881 (6.9%) |
| 35 to 44 Years | 17,071 (75.9%) | 956 (5.6%) |
| 45 to 54 Years | 11,935 (75.9%) | 501 (4.2%) |
| 55 to 59 Years | 5,583 (67.2%) | 173 (3.1%) |
| 60 to 64 Years | 4,082 (49.8%) | 241 (5.9%) |
| 65 to 74 Years | 2,663 (22.3%) | 56 (2.1%) |
| 75 Years and over | 777 (10.2%) | 14 (1.8%) |
| Total | 111,156 (70.0%) | 7,114 (6.4%) |
Employment Status by Educational Attainment in Onslow County
According to labor force statistics for Onslow County, 74.6% of individuals (67,626) out of the total population between 25 and 64 years of age (90,651) are in the labor force, with 5.7% or 3,855 of them being unemployed. The group with the highest labor force participation rate are those with the educational attainment of bachelor's degree or higher, with 82.6% or 20,281 individuals in the labor force. Within the labor force, individuals with high school diploma education have the highest percentage of unemployment, with 7.4% or 1,367 of them being unemployed.
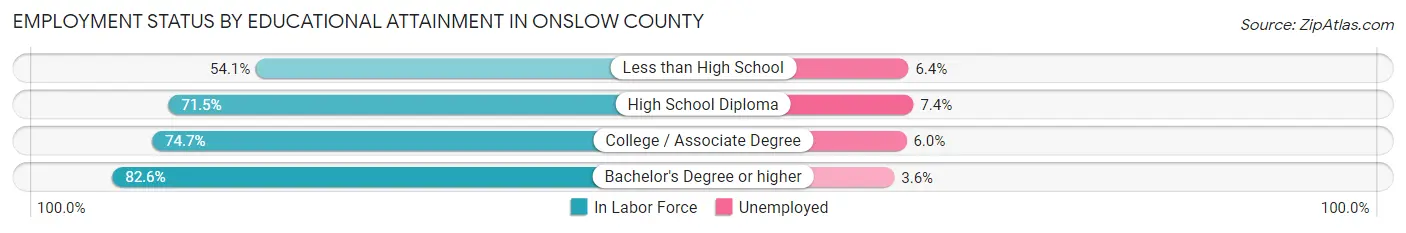
| Educational Attainment | In Labor Force | Unemployed |
| Less than High School | 3,132 (54.1%) | 371 (6.4%) |
| High School Diploma | 18,478 (71.5%) | 1,912 (7.4%) |
| College / Associate Degree | 25,745 (74.7%) | 2,068 (6.0%) |
| Bachelor's Degree or higher | 20,281 (82.6%) | 884 (3.6%) |
| Total | 67,626 (74.6%) | 5,167 (5.7%) |
Employment Occupations by Sex in Onslow County
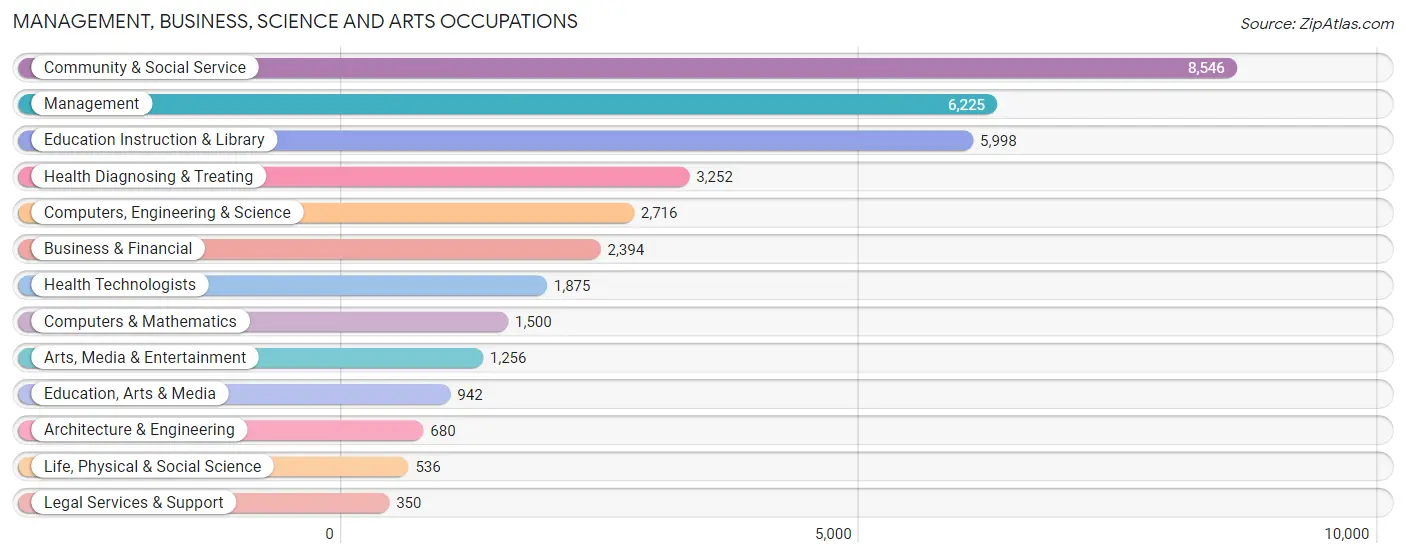
Management, Business, Science and Arts Occupations
The most common Management, Business, Science and Arts occupations in Onslow County are Community & Social Service (8,546 | 12.6%), Management (6,225 | 9.2%), Education Instruction & Library (5,998 | 8.8%), Health Diagnosing & Treating (3,252 | 4.8%), and Computers, Engineering & Science (2,716 | 4.0%).
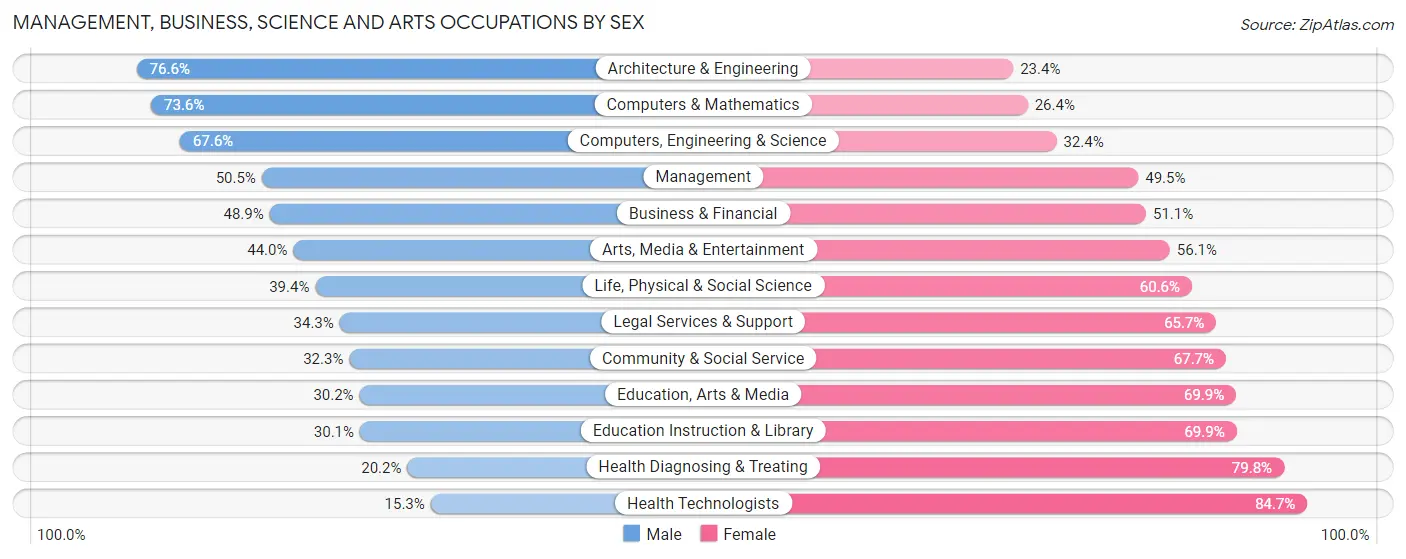
Management, Business, Science and Arts Occupations by Sex
Within the Management, Business, Science and Arts occupations in Onslow County, the most male-oriented occupations are Architecture & Engineering (76.6%), Computers & Mathematics (73.6%), and Computers, Engineering & Science (67.6%), while the most female-oriented occupations are Health Technologists (84.7%), Health Diagnosing & Treating (79.8%), and Education Instruction & Library (69.9%).
| Occupation | Male | Female |
| Management | 3,146 (50.5%) | 3,079 (49.5%) |
| Business & Financial | 1,171 (48.9%) | 1,223 (51.1%) |
| Computers, Engineering & Science | 1,836 (67.6%) | 880 (32.4%) |
| Computers & Mathematics | 1,104 (73.6%) | 396 (26.4%) |
| Architecture & Engineering | 521 (76.6%) | 159 (23.4%) |
| Life, Physical & Social Science | 211 (39.4%) | 325 (60.6%) |
| Community & Social Service | 2,759 (32.3%) | 5,787 (67.7%) |
| Education, Arts & Media | 284 (30.1%) | 658 (69.9%) |
| Legal Services & Support | 120 (34.3%) | 230 (65.7%) |
| Education Instruction & Library | 1,803 (30.1%) | 4,195 (69.9%) |
| Arts, Media & Entertainment | 552 (44.0%) | 704 (56.0%) |
| Health Diagnosing & Treating | 656 (20.2%) | 2,596 (79.8%) |
| Health Technologists | 287 (15.3%) | 1,588 (84.7%) |
| Total (Category) | 9,568 (41.4%) | 13,565 (58.6%) |
| Total (Overall) | 34,570 (50.9%) | 33,381 (49.1%) |
Services Occupations
The most common Services occupations in Onslow County are Food Preparation & Serving (4,219 | 6.2%), Cleaning & Maintenance (2,939 | 4.3%), Healthcare Support (1,991 | 2.9%), Personal Care & Service (1,922 | 2.8%), and Security & Protection (1,849 | 2.7%).

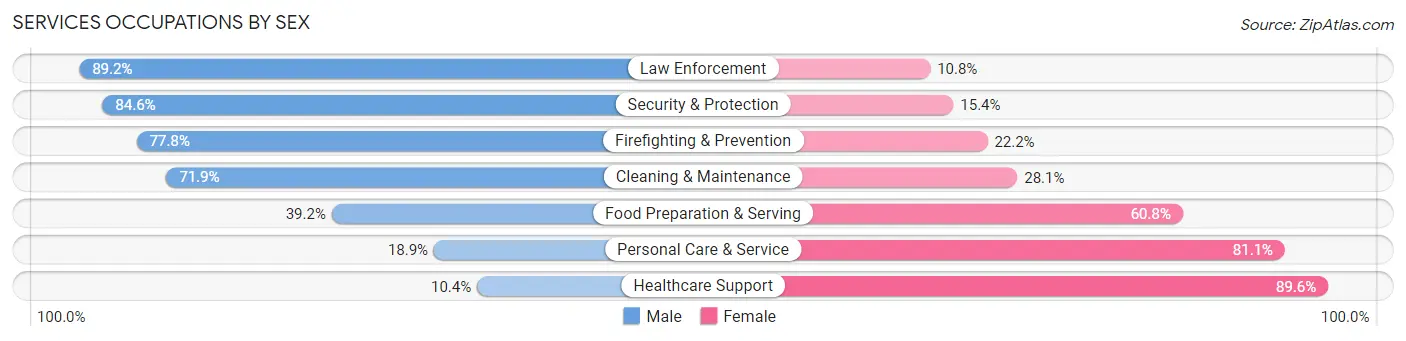
Services Occupations by Sex
Within the Services occupations in Onslow County, the most male-oriented occupations are Law Enforcement (89.2%), Security & Protection (84.6%), and Firefighting & Prevention (77.8%), while the most female-oriented occupations are Healthcare Support (89.6%), Personal Care & Service (81.1%), and Food Preparation & Serving (60.8%).
| Occupation | Male | Female |
| Healthcare Support | 207 (10.4%) | 1,784 (89.6%) |
| Security & Protection | 1,564 (84.6%) | 285 (15.4%) |
| Firefighting & Prevention | 583 (77.8%) | 166 (22.2%) |
| Law Enforcement | 981 (89.2%) | 119 (10.8%) |
| Food Preparation & Serving | 1,653 (39.2%) | 2,566 (60.8%) |
| Cleaning & Maintenance | 2,114 (71.9%) | 825 (28.1%) |
| Personal Care & Service | 364 (18.9%) | 1,558 (81.1%) |
| Total (Category) | 5,902 (45.7%) | 7,018 (54.3%) |
| Total (Overall) | 34,570 (50.9%) | 33,381 (49.1%) |
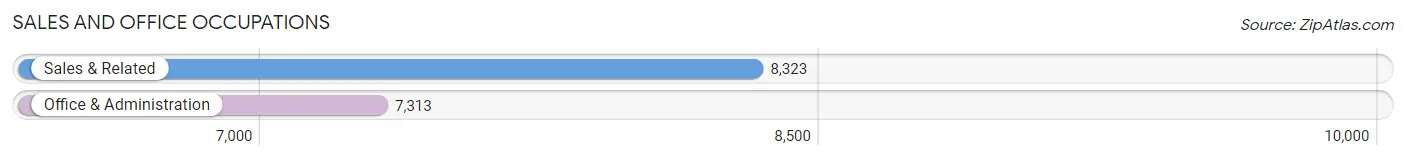
Sales and Office Occupations
The most common Sales and Office occupations in Onslow County are Sales & Related (8,323 | 12.2%), and Office & Administration (7,313 | 10.8%).
Sales and Office Occupations by Sex
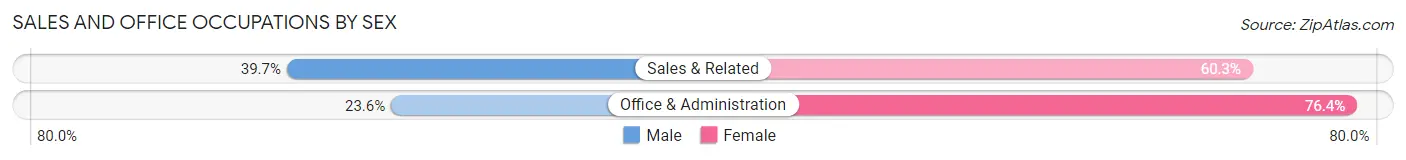
| Occupation | Male | Female |
| Sales & Related | 3,301 (39.7%) | 5,022 (60.3%) |
| Office & Administration | 1,727 (23.6%) | 5,586 (76.4%) |
| Total (Category) | 5,028 (32.2%) | 10,608 (67.8%) |
| Total (Overall) | 34,570 (50.9%) | 33,381 (49.1%) |
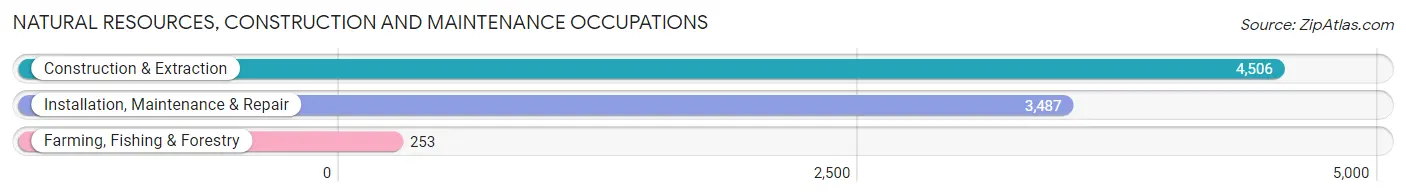
Natural Resources, Construction and Maintenance Occupations
The most common Natural Resources, Construction and Maintenance occupations in Onslow County are Construction & Extraction (4,506 | 6.6%), Installation, Maintenance & Repair (3,487 | 5.1%), and Farming, Fishing & Forestry (253 | 0.4%).
Natural Resources, Construction and Maintenance Occupations by Sex
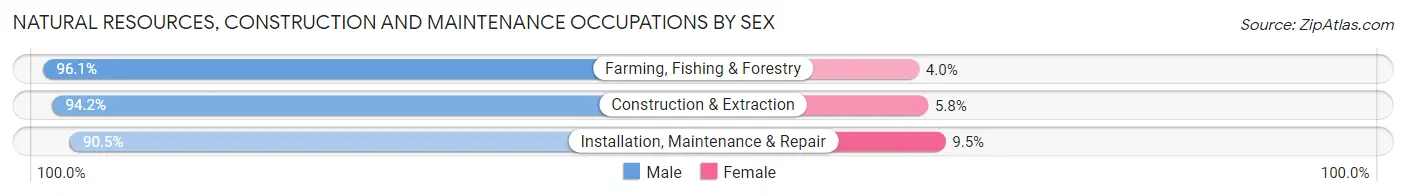
| Occupation | Male | Female |
| Farming, Fishing & Forestry | 243 (96.1%) | 10 (4.0%) |
| Construction & Extraction | 4,243 (94.2%) | 263 (5.8%) |
| Installation, Maintenance & Repair | 3,157 (90.5%) | 330 (9.5%) |
| Total (Category) | 7,643 (92.7%) | 603 (7.3%) |
| Total (Overall) | 34,570 (50.9%) | 33,381 (49.1%) |
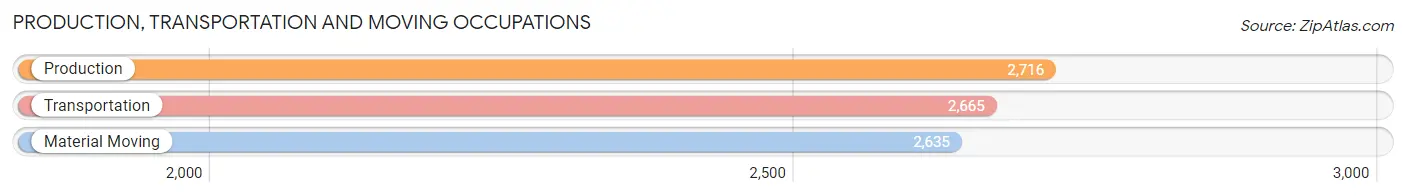
Production, Transportation and Moving Occupations
The most common Production, Transportation and Moving occupations in Onslow County are Production (2,716 | 4.0%), Transportation (2,665 | 3.9%), and Material Moving (2,635 | 3.9%).
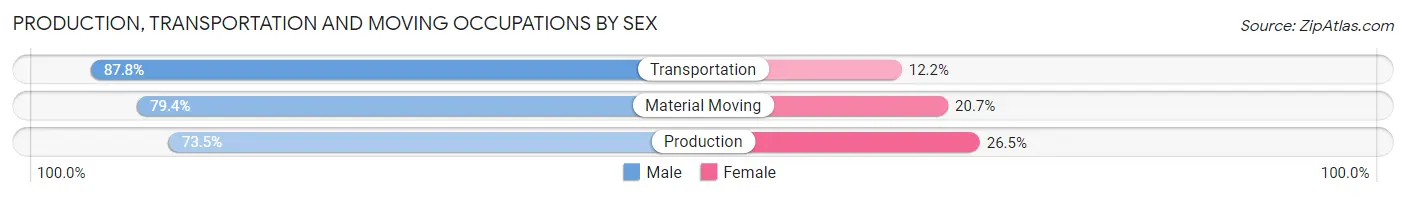
Production, Transportation and Moving Occupations by Sex
| Occupation | Male | Female |
| Production | 1,997 (73.5%) | 719 (26.5%) |
| Transportation | 2,341 (87.8%) | 324 (12.2%) |
| Material Moving | 2,091 (79.3%) | 544 (20.6%) |
| Total (Category) | 6,429 (80.2%) | 1,587 (19.8%) |
| Total (Overall) | 34,570 (50.9%) | 33,381 (49.1%) |
Employment Industries by Sex in Onslow County
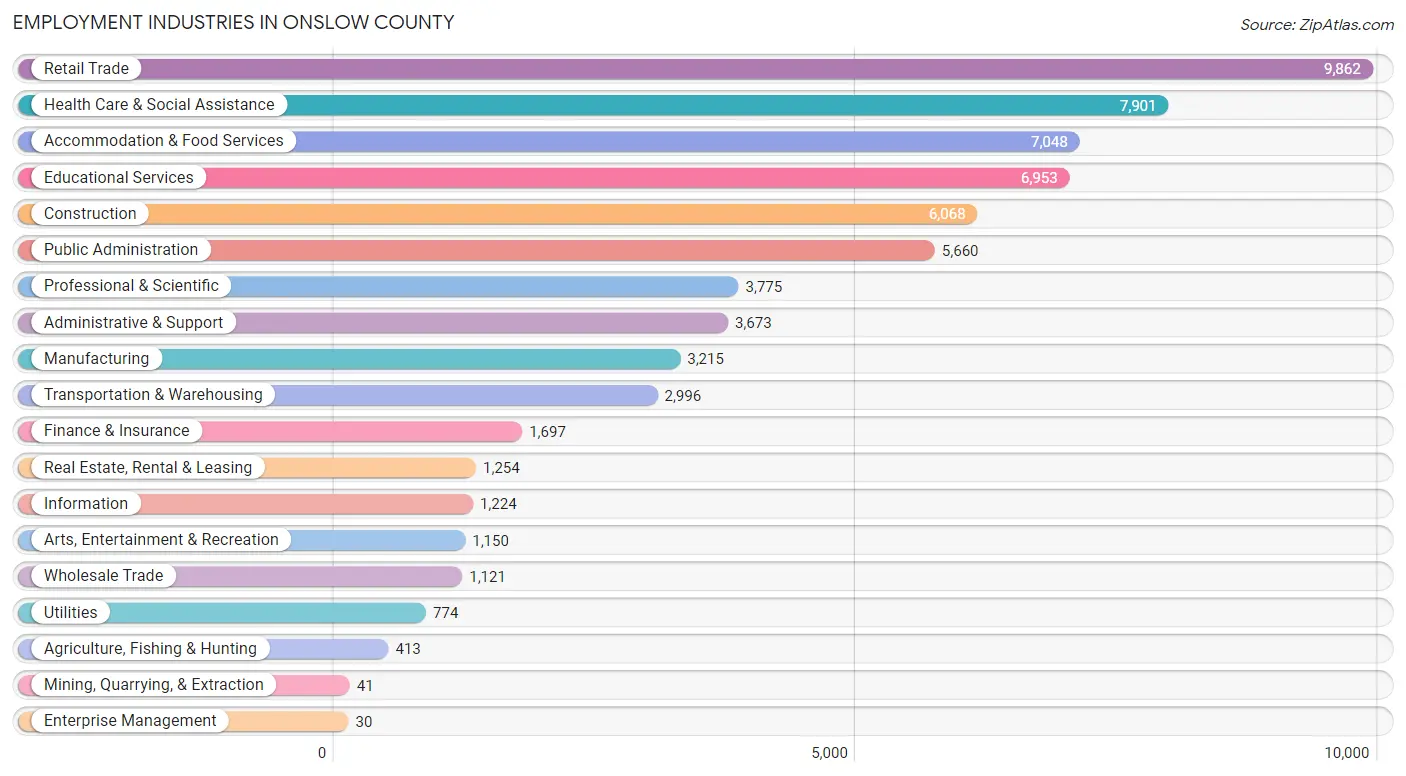
Employment Industries in Onslow County
The major employment industries in Onslow County include Retail Trade (9,862 | 14.5%), Health Care & Social Assistance (7,901 | 11.6%), Accommodation & Food Services (7,048 | 10.4%), Educational Services (6,953 | 10.2%), and Construction (6,068 | 8.9%).
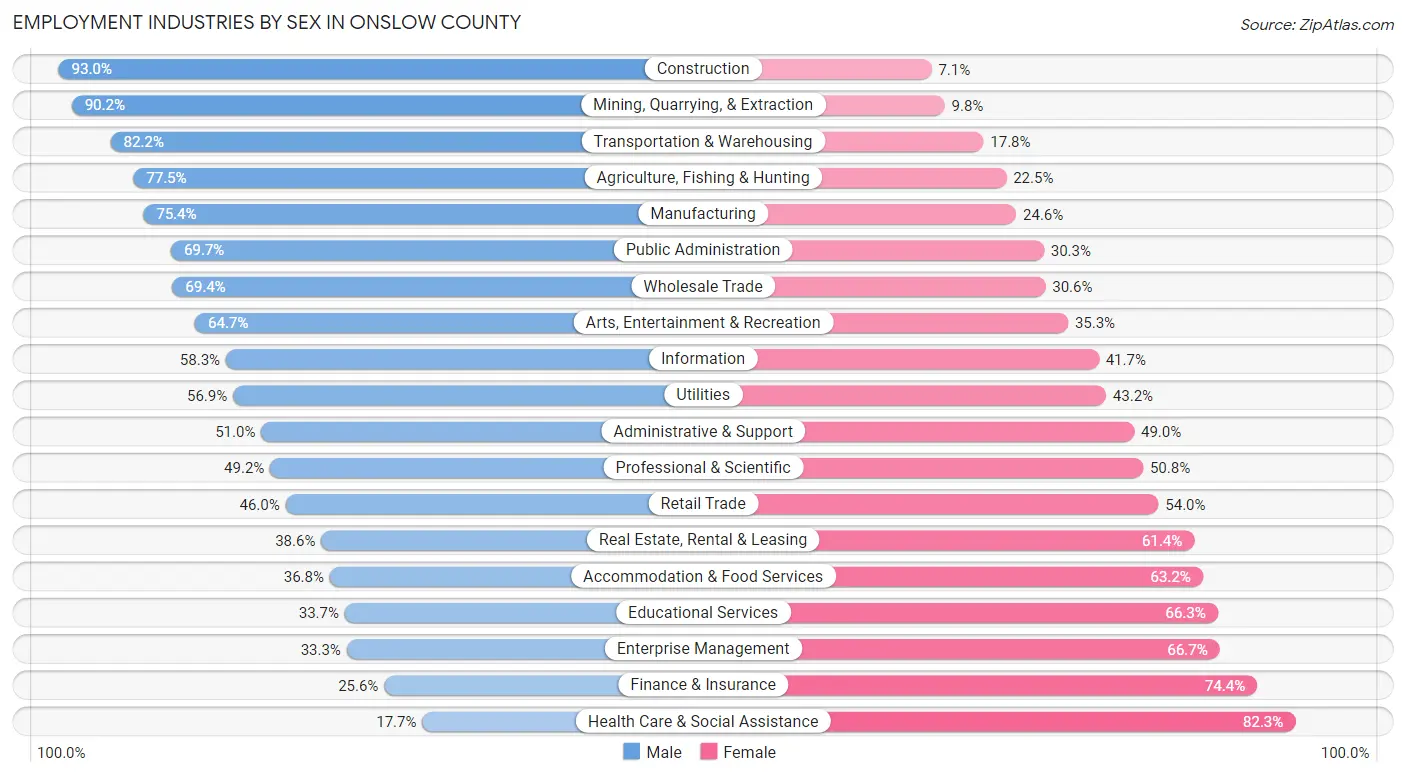
Employment Industries by Sex in Onslow County
The Onslow County industries that see more men than women are Construction (92.9%), Mining, Quarrying, & Extraction (90.2%), and Transportation & Warehousing (82.2%), whereas the industries that tend to have a higher number of women are Health Care & Social Assistance (82.3%), Finance & Insurance (74.4%), and Enterprise Management (66.7%).
| Industry | Male | Female |
| Agriculture, Fishing & Hunting | 320 (77.5%) | 93 (22.5%) |
| Mining, Quarrying, & Extraction | 37 (90.2%) | 4 (9.8%) |
| Construction | 5,640 (92.9%) | 428 (7.0%) |
| Manufacturing | 2,425 (75.4%) | 790 (24.6%) |
| Wholesale Trade | 778 (69.4%) | 343 (30.6%) |
| Retail Trade | 4,536 (46.0%) | 5,326 (54.0%) |
| Transportation & Warehousing | 2,463 (82.2%) | 533 (17.8%) |
| Utilities | 440 (56.9%) | 334 (43.1%) |
| Information | 714 (58.3%) | 510 (41.7%) |
| Finance & Insurance | 434 (25.6%) | 1,263 (74.4%) |
| Real Estate, Rental & Leasing | 484 (38.6%) | 770 (61.4%) |
| Professional & Scientific | 1,856 (49.2%) | 1,919 (50.8%) |
| Enterprise Management | 10 (33.3%) | 20 (66.7%) |
| Administrative & Support | 1,874 (51.0%) | 1,799 (49.0%) |
| Educational Services | 2,345 (33.7%) | 4,608 (66.3%) |
| Health Care & Social Assistance | 1,398 (17.7%) | 6,503 (82.3%) |
| Arts, Entertainment & Recreation | 744 (64.7%) | 406 (35.3%) |
| Accommodation & Food Services | 2,596 (36.8%) | 4,452 (63.2%) |
| Public Administration | 3,945 (69.7%) | 1,715 (30.3%) |
| Total | 34,570 (50.9%) | 33,381 (49.1%) |
Education in Onslow County
School Enrollment in Onslow County
The most common levels of schooling among the 49,243 students in Onslow County are college / undergraduate (12,750 | 25.9%), middle school (10,279 | 20.9%), and elementary school (9,611 | 19.5%).
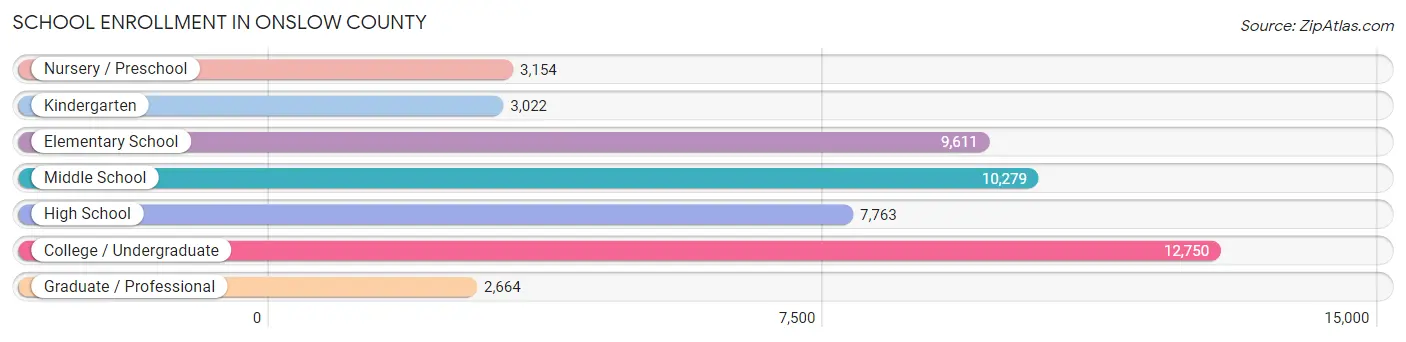
| School Level | # Students | % Students |
| Nursery / Preschool | 3,154 | 6.4% |
| Kindergarten | 3,022 | 6.1% |
| Elementary School | 9,611 | 19.5% |
| Middle School | 10,279 | 20.9% |
| High School | 7,763 | 15.8% |
| College / Undergraduate | 12,750 | 25.9% |
| Graduate / Professional | 2,664 | 5.4% |
| Total | 49,243 | 100.0% |
School Enrollment by Age by Funding Source in Onslow County
Out of a total of 49,243 students who are enrolled in schools in Onslow County, 6,648 (13.5%) attend a private institution, while the remaining 42,595 (86.5%) are enrolled in public schools. The age group of 3 to 4 year olds has the highest likelihood of being enrolled in private schools, with 1,076 (48.2% in the age bracket) enrolled. Conversely, the age group of 20 to 24 year olds has the lowest likelihood of being enrolled in a private school, with 5,328 (91.8% in the age bracket) attending a public institution.
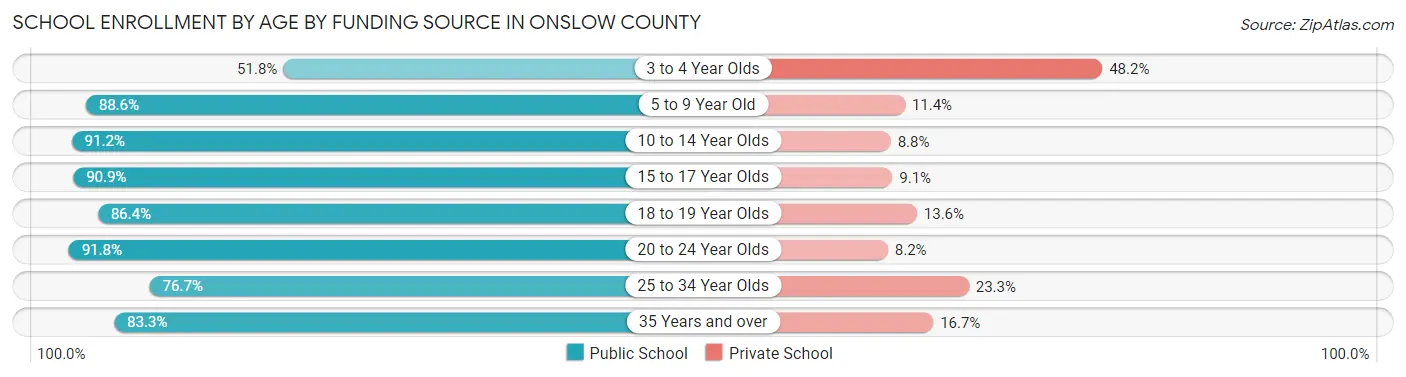
| Age Bracket | Public School | Private School |
| 3 to 4 Year Olds | 1,158 (51.8%) | 1,076 (48.2%) |
| 5 to 9 Year Old | 11,316 (88.6%) | 1,458 (11.4%) |
| 10 to 14 Year Olds | 10,990 (91.2%) | 1,056 (8.8%) |
| 15 to 17 Year Olds | 5,489 (90.9%) | 547 (9.1%) |
| 18 to 19 Year Olds | 1,407 (86.4%) | 222 (13.6%) |
| 20 to 24 Year Olds | 5,328 (91.8%) | 478 (8.2%) |
| 25 to 34 Year Olds | 4,042 (76.7%) | 1,228 (23.3%) |
| 35 Years and over | 2,873 (83.3%) | 575 (16.7%) |
| Total | 42,595 (86.5%) | 6,648 (13.5%) |
Educational Attainment by Field of Study in Onslow County
Education (5,170 | 16.9%), business (5,037 | 16.5%), arts & humanities (3,922 | 12.8%), science & technology (3,537 | 11.6%), and psychology (2,300 | 7.5%) are the most common fields of study among 30,589 individuals in Onslow County who have obtained a bachelor's degree or higher.
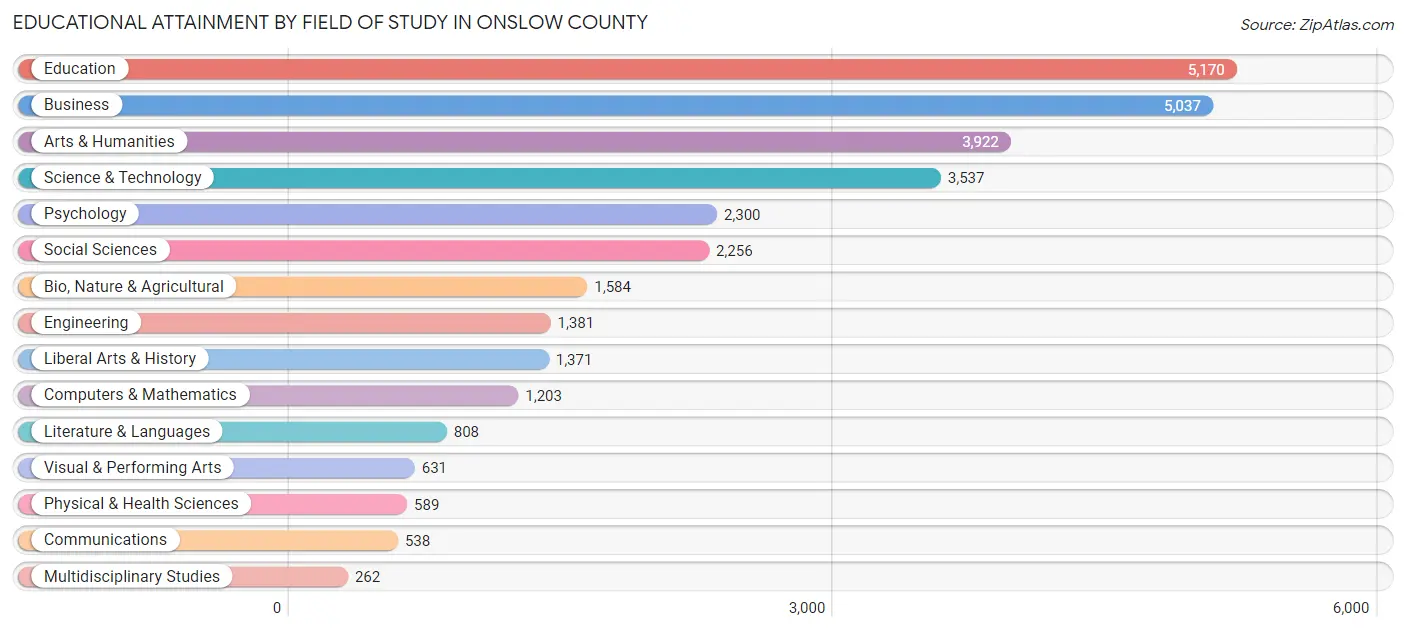
| Field of Study | # Graduates | % Graduates |
| Computers & Mathematics | 1,203 | 3.9% |
| Bio, Nature & Agricultural | 1,584 | 5.2% |
| Physical & Health Sciences | 589 | 1.9% |
| Psychology | 2,300 | 7.5% |
| Social Sciences | 2,256 | 7.4% |
| Engineering | 1,381 | 4.5% |
| Multidisciplinary Studies | 262 | 0.9% |
| Science & Technology | 3,537 | 11.6% |
| Business | 5,037 | 16.5% |
| Education | 5,170 | 16.9% |
| Literature & Languages | 808 | 2.6% |
| Liberal Arts & History | 1,371 | 4.5% |
| Visual & Performing Arts | 631 | 2.1% |
| Communications | 538 | 1.8% |
| Arts & Humanities | 3,922 | 12.8% |
| Total | 30,589 | 100.0% |
Transportation & Commute in Onslow County
Vehicle Availability by Sex in Onslow County
The most prevalent vehicle ownership categories in Onslow County are males with 2 vehicles (25,560, accounting for 49.8%) and females with 2 vehicles (15,714, making up 76.1%).
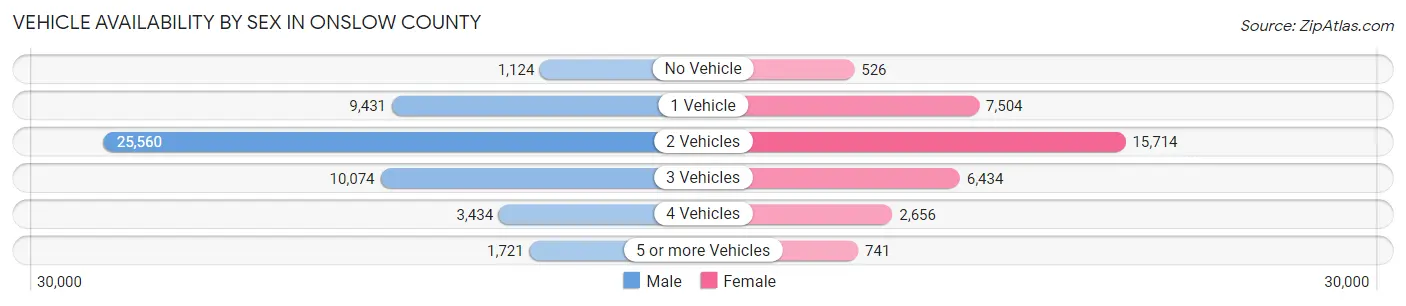
| Vehicles Available | Male | Female |
| No Vehicle | 1,124 (2.2%) | 526 (1.6%) |
| 1 Vehicle | 9,431 (18.4%) | 7,504 (22.4%) |
| 2 Vehicles | 25,560 (49.8%) | 15,714 (46.8%) |
| 3 Vehicles | 10,074 (19.6%) | 6,434 (19.2%) |
| 4 Vehicles | 3,434 (6.7%) | 2,656 (7.9%) |
| 5 or more Vehicles | 1,721 (3.4%) | 741 (2.2%) |
| Total | 51,344 (100.0%) | 33,575 (100.0%) |
Commute Time in Onslow County
The most frequently occuring commute durations in Onslow County are 15 to 19 minutes (14,316 commuters, 14.9%), 20 to 24 minutes (14,053 commuters, 14.7%), and 5 to 9 minutes (13,977 commuters, 14.6%).
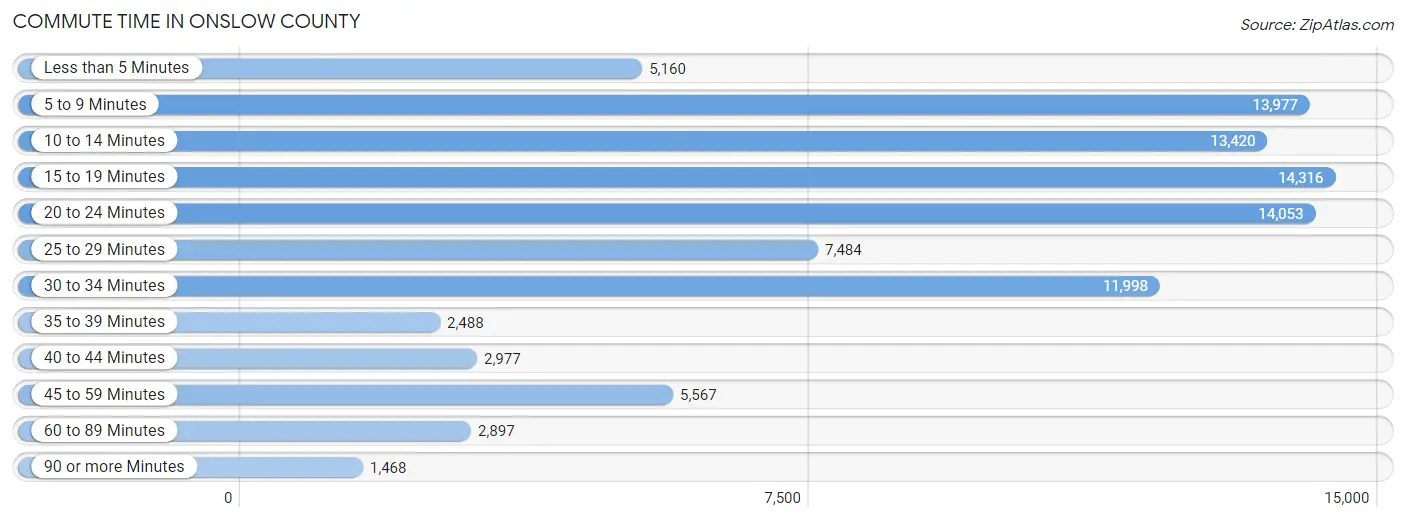
| Commute Time | # Commuters | % Commuters |
| Less than 5 Minutes | 5,160 | 5.4% |
| 5 to 9 Minutes | 13,977 | 14.6% |
| 10 to 14 Minutes | 13,420 | 14.0% |
| 15 to 19 Minutes | 14,316 | 14.9% |
| 20 to 24 Minutes | 14,053 | 14.7% |
| 25 to 29 Minutes | 7,484 | 7.8% |
| 30 to 34 Minutes | 11,998 | 12.5% |
| 35 to 39 Minutes | 2,488 | 2.6% |
| 40 to 44 Minutes | 2,977 | 3.1% |
| 45 to 59 Minutes | 5,567 | 5.8% |
| 60 to 89 Minutes | 2,897 | 3.0% |
| 90 or more Minutes | 1,468 | 1.5% |
Commute Time by Sex in Onslow County
The most common commute times in Onslow County are 5 to 9 minutes (10,542 commuters, 16.2%) for males and 15 to 19 minutes (5,682 commuters, 18.4%) for females.
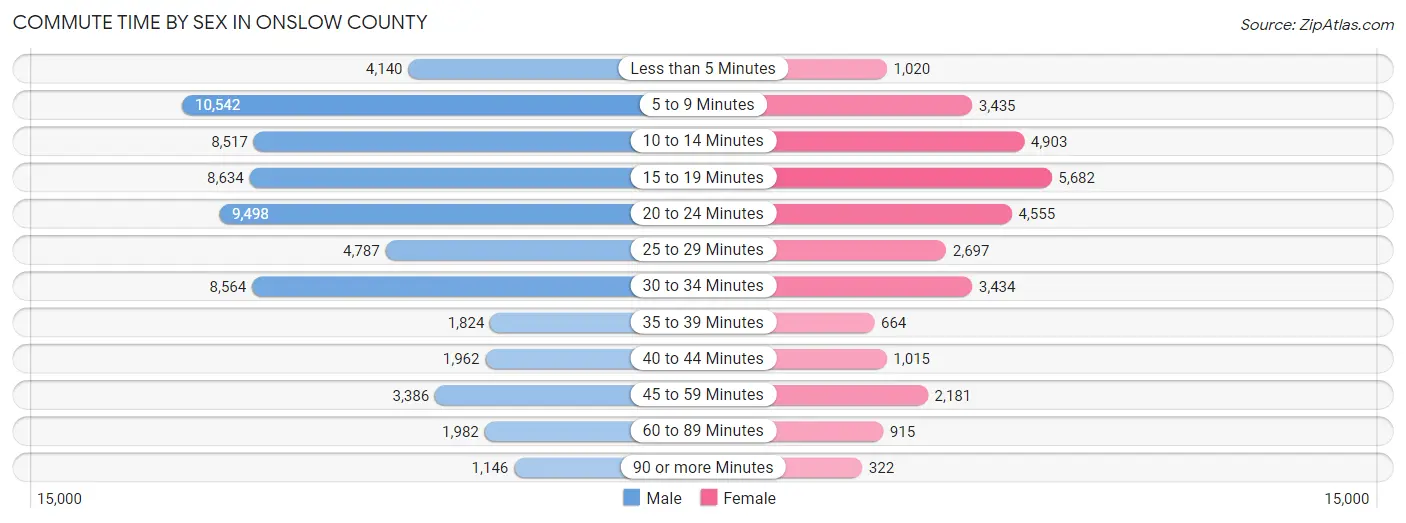
| Commute Time | Male | Female |
| Less than 5 Minutes | 4,140 (6.4%) | 1,020 (3.3%) |
| 5 to 9 Minutes | 10,542 (16.2%) | 3,435 (11.1%) |
| 10 to 14 Minutes | 8,517 (13.1%) | 4,903 (15.9%) |
| 15 to 19 Minutes | 8,634 (13.3%) | 5,682 (18.4%) |
| 20 to 24 Minutes | 9,498 (14.6%) | 4,555 (14.8%) |
| 25 to 29 Minutes | 4,787 (7.4%) | 2,697 (8.7%) |
| 30 to 34 Minutes | 8,564 (13.2%) | 3,434 (11.1%) |
| 35 to 39 Minutes | 1,824 (2.8%) | 664 (2.1%) |
| 40 to 44 Minutes | 1,962 (3.0%) | 1,015 (3.3%) |
| 45 to 59 Minutes | 3,386 (5.2%) | 2,181 (7.1%) |
| 60 to 89 Minutes | 1,982 (3.0%) | 915 (3.0%) |
| 90 or more Minutes | 1,146 (1.8%) | 322 (1.0%) |
Time of Departure to Work by Sex in Onslow County
The most frequent times of departure to work in Onslow County are 7:00 AM to 7:29 AM (13,397, 20.6%) for males and 7:00 AM to 7:29 AM (4,751, 15.4%) for females.
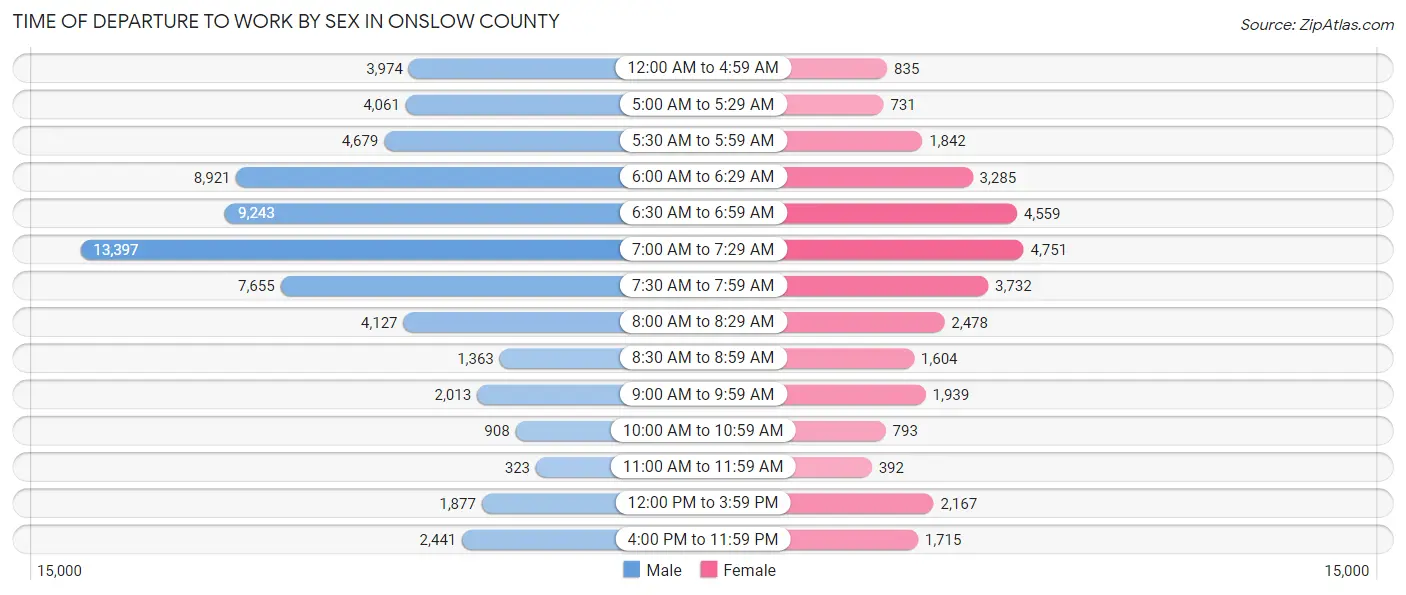
| Time of Departure | Male | Female |
| 12:00 AM to 4:59 AM | 3,974 (6.1%) | 835 (2.7%) |
| 5:00 AM to 5:29 AM | 4,061 (6.2%) | 731 (2.4%) |
| 5:30 AM to 5:59 AM | 4,679 (7.2%) | 1,842 (6.0%) |
| 6:00 AM to 6:29 AM | 8,921 (13.7%) | 3,285 (10.7%) |
| 6:30 AM to 6:59 AM | 9,243 (14.2%) | 4,559 (14.8%) |
| 7:00 AM to 7:29 AM | 13,397 (20.6%) | 4,751 (15.4%) |
| 7:30 AM to 7:59 AM | 7,655 (11.8%) | 3,732 (12.1%) |
| 8:00 AM to 8:29 AM | 4,127 (6.4%) | 2,478 (8.0%) |
| 8:30 AM to 8:59 AM | 1,363 (2.1%) | 1,604 (5.2%) |
| 9:00 AM to 9:59 AM | 2,013 (3.1%) | 1,939 (6.3%) |
| 10:00 AM to 10:59 AM | 908 (1.4%) | 793 (2.6%) |
| 11:00 AM to 11:59 AM | 323 (0.5%) | 392 (1.3%) |
| 12:00 PM to 3:59 PM | 1,877 (2.9%) | 2,167 (7.0%) |
| 4:00 PM to 11:59 PM | 2,441 (3.8%) | 1,715 (5.6%) |
| Total | 64,982 (100.0%) | 30,823 (100.0%) |
Housing Occupancy in Onslow County
Occupancy by Ownership in Onslow County
Of the total 71,009 dwellings in Onslow County, owner-occupied units account for 41,845 (58.9%), while renter-occupied units make up 29,164 (41.1%).
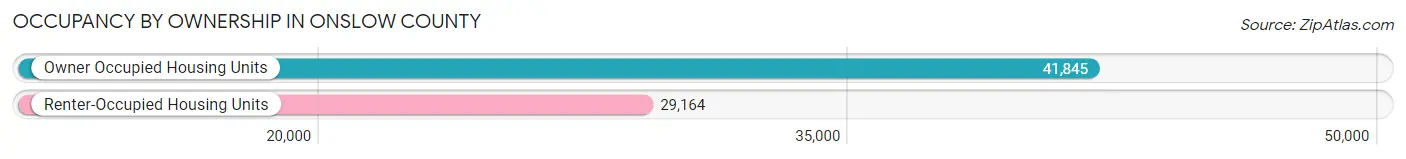
| Occupancy | # Housing Units | % Housing Units |
| Owner Occupied Housing Units | 41,845 | 58.9% |
| Renter-Occupied Housing Units | 29,164 | 41.1% |
| Total Occupied Housing Units | 71,009 | 100.0% |
Occupancy by Household Size in Onslow County
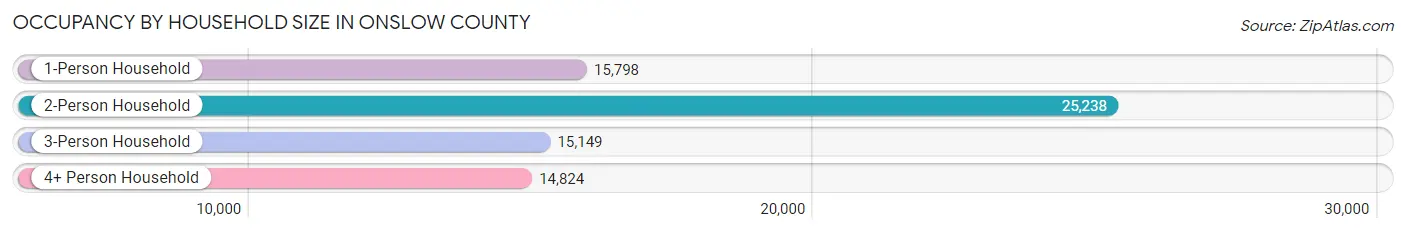
| Household Size | # Housing Units | % Housing Units |
| 1-Person Household | 15,798 | 22.3% |
| 2-Person Household | 25,238 | 35.5% |
| 3-Person Household | 15,149 | 21.3% |
| 4+ Person Household | 14,824 | 20.9% |
| Total Housing Units | 71,009 | 100.0% |
Occupancy by Ownership by Household Size in Onslow County
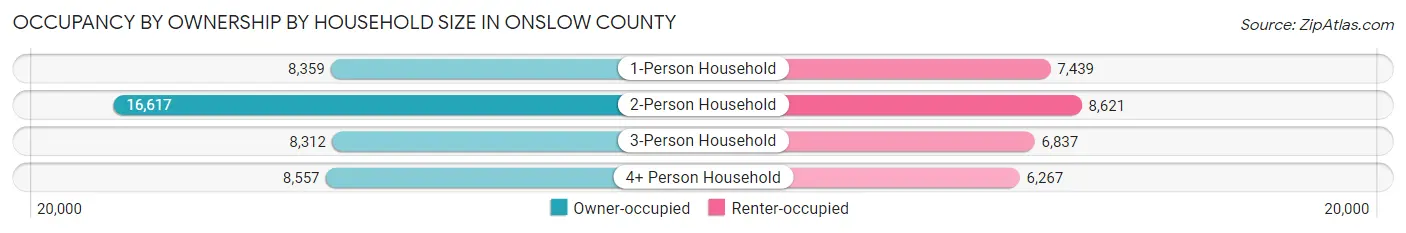
| Household Size | Owner-occupied | Renter-occupied |
| 1-Person Household | 8,359 (52.9%) | 7,439 (47.1%) |
| 2-Person Household | 16,617 (65.8%) | 8,621 (34.2%) |
| 3-Person Household | 8,312 (54.9%) | 6,837 (45.1%) |
| 4+ Person Household | 8,557 (57.7%) | 6,267 (42.3%) |
| Total Housing Units | 41,845 (58.9%) | 29,164 (41.1%) |
Occupancy by Educational Attainment in Onslow County
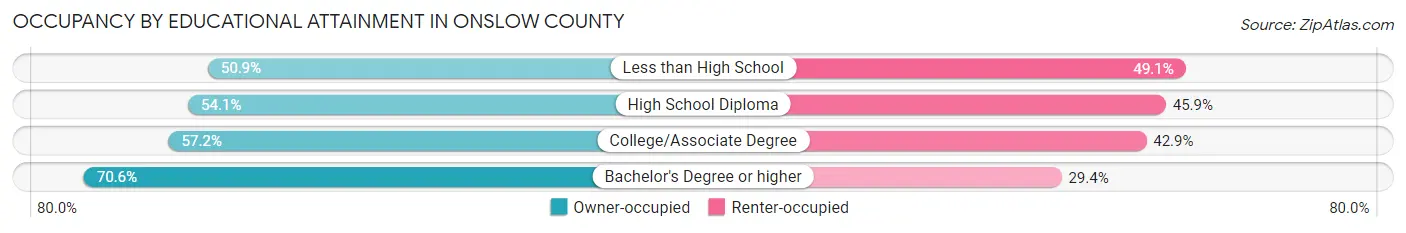
| Household Size | Owner-occupied | Renter-occupied |
| Less than High School | 2,495 (50.9%) | 2,404 (49.1%) |
| High School Diploma | 12,080 (54.1%) | 10,264 (45.9%) |
| College/Associate Degree | 15,424 (57.2%) | 11,565 (42.8%) |
| Bachelor's Degree or higher | 11,846 (70.6%) | 4,931 (29.4%) |
Occupancy by Age of Householder in Onslow County
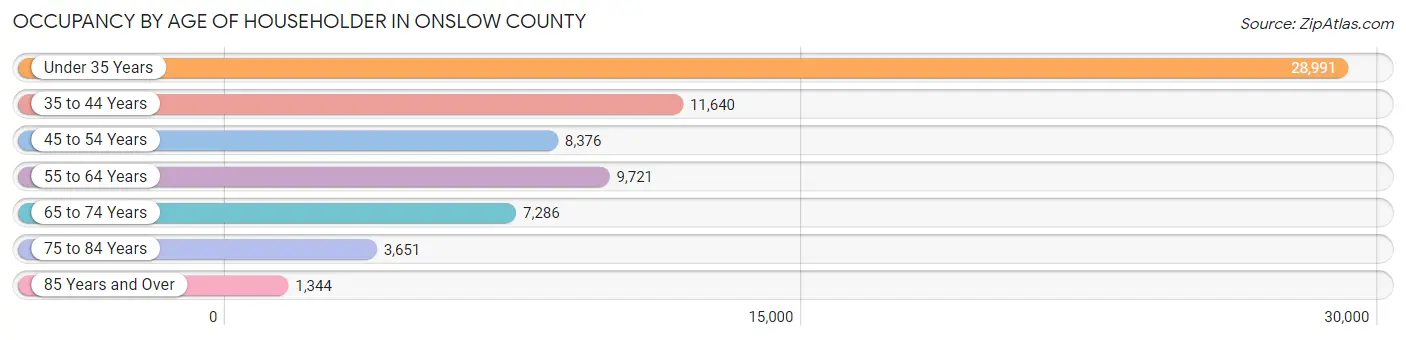
| Age Bracket | # Households | % Households |
| Under 35 Years | 28,991 | 40.8% |
| 35 to 44 Years | 11,640 | 16.4% |
| 45 to 54 Years | 8,376 | 11.8% |
| 55 to 64 Years | 9,721 | 13.7% |
| 65 to 74 Years | 7,286 | 10.3% |
| 75 to 84 Years | 3,651 | 5.1% |
| 85 Years and Over | 1,344 | 1.9% |
| Total | 71,009 | 100.0% |
Housing Finances in Onslow County
Median Income by Occupancy in Onslow County
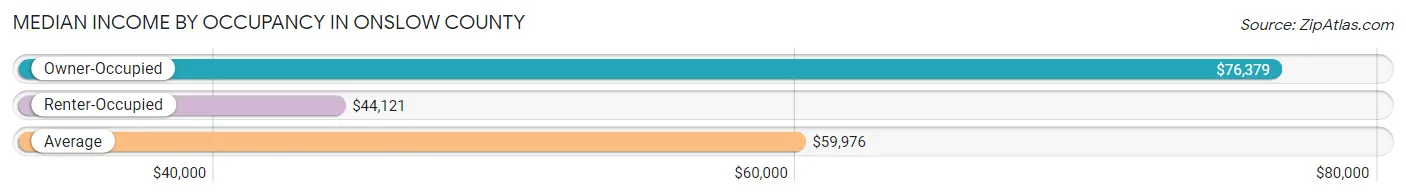
| Occupancy Type | # Households | Median Income |
| Owner-Occupied | 41,845 (58.9%) | $76,379 |
| Renter-Occupied | 29,164 (41.1%) | $44,121 |
| Average | 71,009 (100.0%) | $59,976 |
Occupancy by Householder Income Bracket in Onslow County
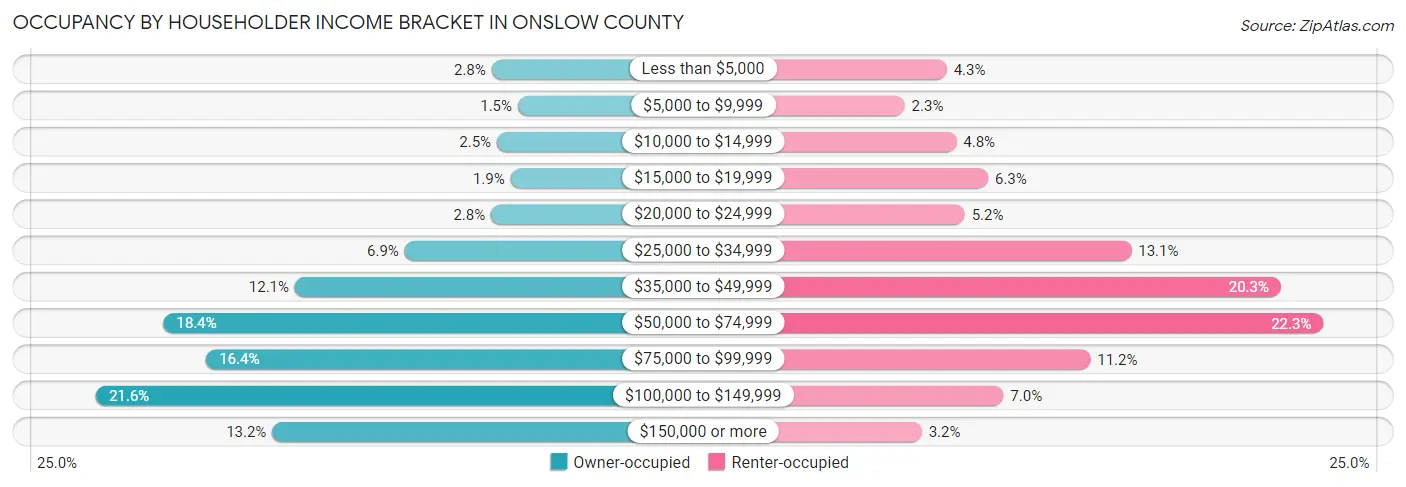
| Income Bracket | Owner-occupied | Renter-occupied |
| Less than $5,000 | 1,155 (2.8%) | 1,267 (4.3%) |
| $5,000 to $9,999 | 632 (1.5%) | 682 (2.3%) |
| $10,000 to $14,999 | 1,050 (2.5%) | 1,399 (4.8%) |
| $15,000 to $19,999 | 778 (1.9%) | 1,841 (6.3%) |
| $20,000 to $24,999 | 1,166 (2.8%) | 1,517 (5.2%) |
| $25,000 to $34,999 | 2,889 (6.9%) | 3,828 (13.1%) |
| $35,000 to $49,999 | 5,075 (12.1%) | 5,906 (20.3%) |
| $50,000 to $74,999 | 7,696 (18.4%) | 6,494 (22.3%) |
| $75,000 to $99,999 | 6,841 (16.4%) | 3,260 (11.2%) |
| $100,000 to $149,999 | 9,037 (21.6%) | 2,052 (7.0%) |
| $150,000 or more | 5,526 (13.2%) | 918 (3.2%) |
| Total | 41,845 (100.0%) | 29,164 (100.0%) |
Monthly Housing Cost Tiers in Onslow County
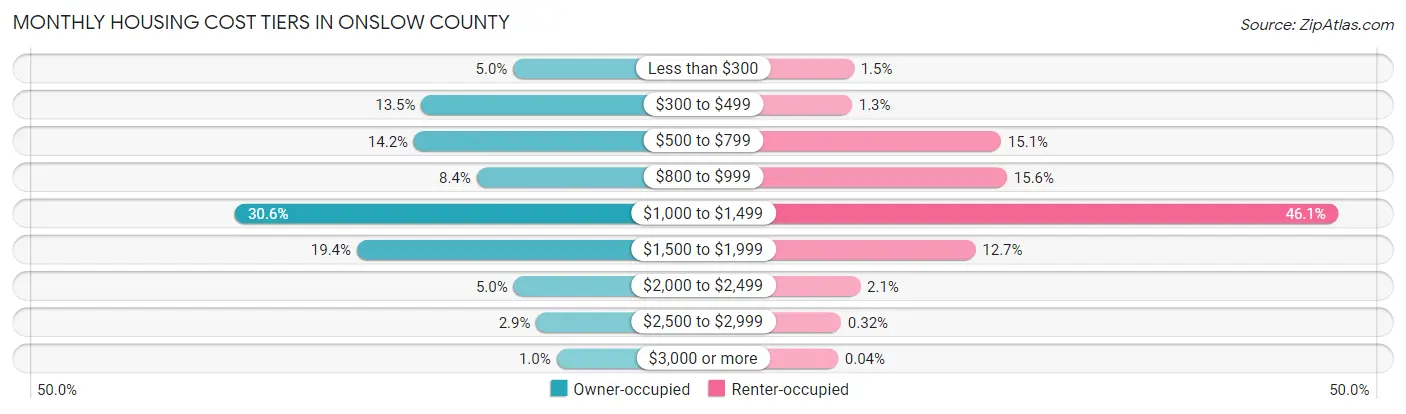
| Monthly Cost | Owner-occupied | Renter-occupied |
| Less than $300 | 2,102 (5.0%) | 437 (1.5%) |
| $300 to $499 | 5,640 (13.5%) | 386 (1.3%) |
| $500 to $799 | 5,925 (14.2%) | 4,389 (15.0%) |
| $800 to $999 | 3,508 (8.4%) | 4,550 (15.6%) |
| $1,000 to $1,499 | 12,818 (30.6%) | 13,430 (46.1%) |
| $1,500 to $1,999 | 8,121 (19.4%) | 3,704 (12.7%) |
| $2,000 to $2,499 | 2,087 (5.0%) | 609 (2.1%) |
| $2,500 to $2,999 | 1,211 (2.9%) | 93 (0.3%) |
| $3,000 or more | 433 (1.0%) | 13 (0.0%) |
| Total | 41,845 (100.0%) | 29,164 (100.0%) |
Physical Housing Characteristics in Onslow County
Housing Structures in Onslow County
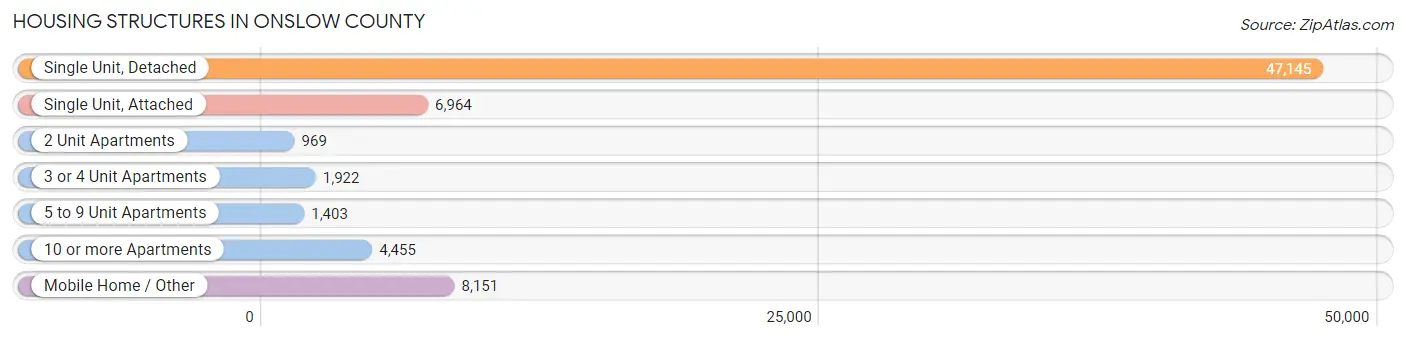
| Structure Type | # Housing Units | % Housing Units |
| Single Unit, Detached | 47,145 | 66.4% |
| Single Unit, Attached | 6,964 | 9.8% |
| 2 Unit Apartments | 969 | 1.4% |
| 3 or 4 Unit Apartments | 1,922 | 2.7% |
| 5 to 9 Unit Apartments | 1,403 | 2.0% |
| 10 or more Apartments | 4,455 | 6.3% |
| Mobile Home / Other | 8,151 | 11.5% |
| Total | 71,009 | 100.0% |
Housing Structures by Occupancy in Onslow County
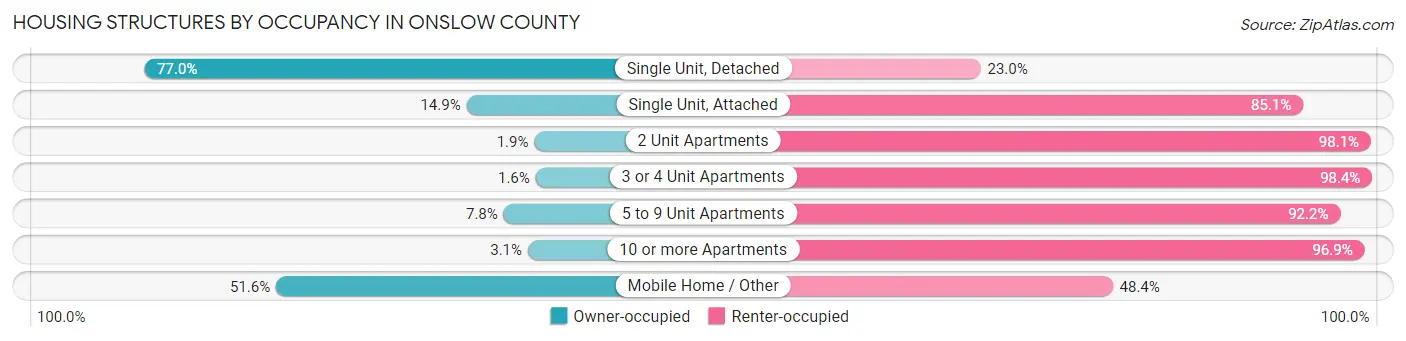
| Structure Type | Owner-occupied | Renter-occupied |
| Single Unit, Detached | 36,305 (77.0%) | 10,840 (23.0%) |
| Single Unit, Attached | 1,039 (14.9%) | 5,925 (85.1%) |
| 2 Unit Apartments | 18 (1.9%) | 951 (98.1%) |
| 3 or 4 Unit Apartments | 31 (1.6%) | 1,891 (98.4%) |
| 5 to 9 Unit Apartments | 109 (7.8%) | 1,294 (92.2%) |
| 10 or more Apartments | 138 (3.1%) | 4,317 (96.9%) |
| Mobile Home / Other | 4,205 (51.6%) | 3,946 (48.4%) |
| Total | 41,845 (58.9%) | 29,164 (41.1%) |
Housing Structures by Number of Rooms in Onslow County
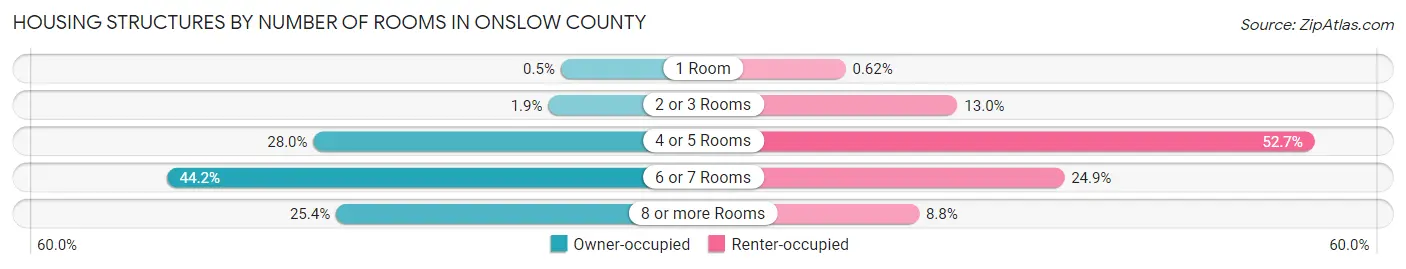
| Number of Rooms | Owner-occupied | Renter-occupied |
| 1 Room | 208 (0.5%) | 181 (0.6%) |
| 2 or 3 Rooms | 788 (1.9%) | 3,802 (13.0%) |
| 4 or 5 Rooms | 11,696 (28.0%) | 15,363 (52.7%) |
| 6 or 7 Rooms | 18,509 (44.2%) | 7,260 (24.9%) |
| 8 or more Rooms | 10,644 (25.4%) | 2,558 (8.8%) |
| Total | 41,845 (100.0%) | 29,164 (100.0%) |
Housing Structure by Heating Type in Onslow County
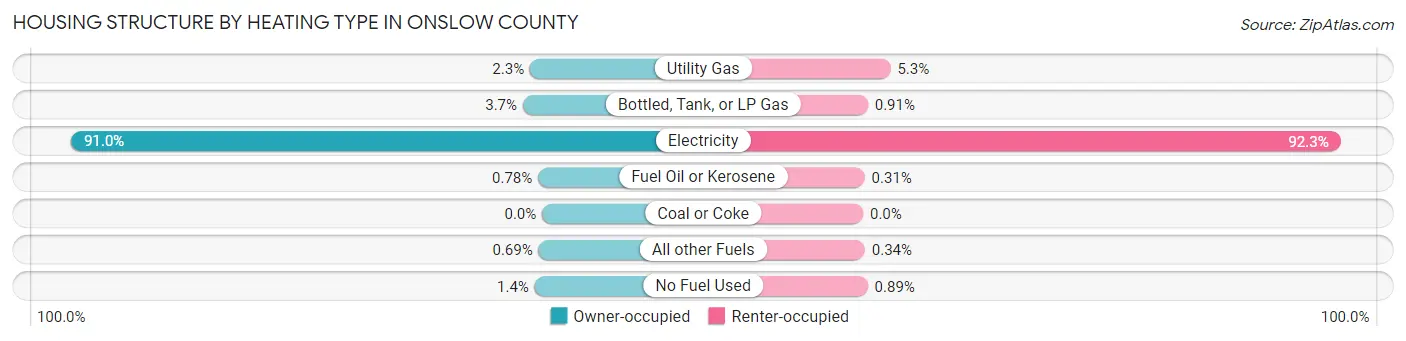
| Heating Type | Owner-occupied | Renter-occupied |
| Utility Gas | 979 (2.3%) | 1,547 (5.3%) |
| Bottled, Tank, or LP Gas | 1,552 (3.7%) | 264 (0.9%) |
| Electricity | 38,097 (91.0%) | 26,903 (92.2%) |
| Fuel Oil or Kerosene | 327 (0.8%) | 91 (0.3%) |
| Coal or Coke | 0 (0.0%) | 0 (0.0%) |
| All other Fuels | 287 (0.7%) | 99 (0.3%) |
| No Fuel Used | 603 (1.4%) | 260 (0.9%) |
| Total | 41,845 (100.0%) | 29,164 (100.0%) |
Household Vehicle Usage in Onslow County
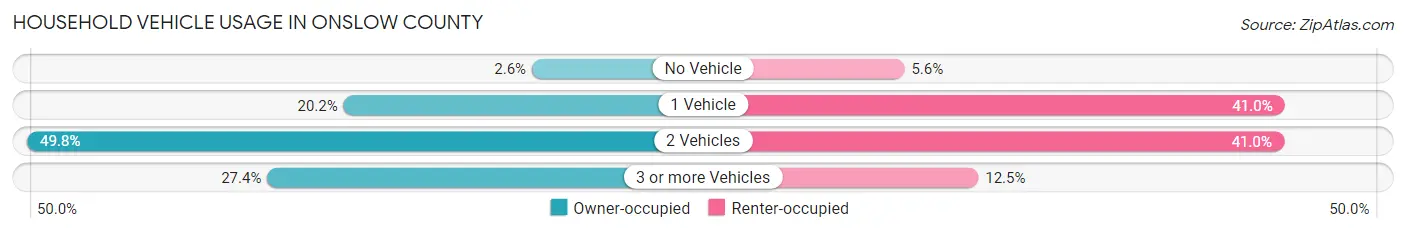
| Vehicles per Household | Owner-occupied | Renter-occupied |
| No Vehicle | 1,106 (2.6%) | 1,622 (5.6%) |
| 1 Vehicle | 8,467 (20.2%) | 11,966 (41.0%) |
| 2 Vehicles | 20,828 (49.8%) | 11,945 (41.0%) |
| 3 or more Vehicles | 11,444 (27.4%) | 3,631 (12.4%) |
| Total | 41,845 (100.0%) | 29,164 (100.0%) |
Real Estate & Mortgages in Onslow County
Real Estate and Mortgage Overview in Onslow County
| Characteristic | Without Mortgage | With Mortgage |
| Housing Units | 12,736 | 29,109 |
| Median Property Value | $170,700 | $204,900 |
| Median Household Income | $60,301 | $4,295 |
| Monthly Housing Costs | $465 | $433 |
| Real Estate Taxes | $1,259 | $976 |
Property Value by Mortgage Status in Onslow County
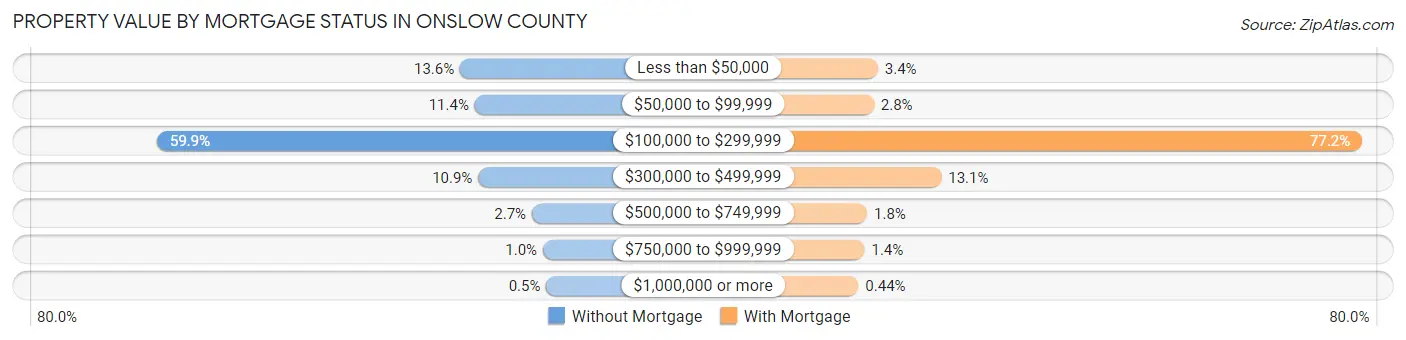
| Property Value | Without Mortgage | With Mortgage |
| Less than $50,000 | 1,737 (13.6%) | 989 (3.4%) |
| $50,000 to $99,999 | 1,453 (11.4%) | 812 (2.8%) |
| $100,000 to $299,999 | 7,623 (59.9%) | 22,468 (77.2%) |
| $300,000 to $499,999 | 1,386 (10.9%) | 3,802 (13.1%) |
| $500,000 to $749,999 | 343 (2.7%) | 511 (1.8%) |
| $750,000 to $999,999 | 130 (1.0%) | 400 (1.4%) |
| $1,000,000 or more | 64 (0.5%) | 127 (0.4%) |
| Total | 12,736 (100.0%) | 29,109 (100.0%) |
Household Income by Mortgage Status in Onslow County
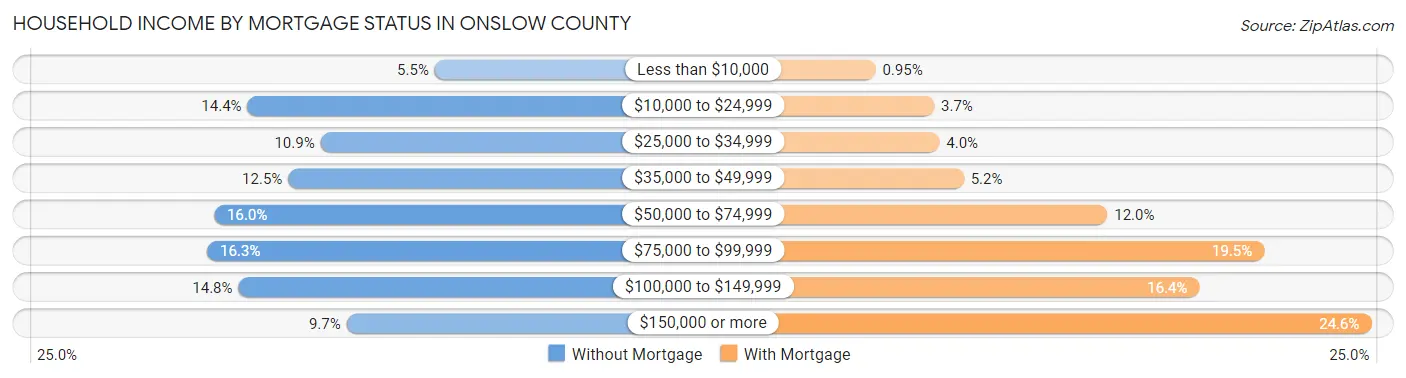
| Household Income | Without Mortgage | With Mortgage |
| Less than $10,000 | 697 (5.5%) | 277 (0.9%) |
| $10,000 to $24,999 | 1,833 (14.4%) | 1,090 (3.7%) |
| $25,000 to $34,999 | 1,389 (10.9%) | 1,161 (4.0%) |
| $35,000 to $49,999 | 1,586 (12.4%) | 1,500 (5.1%) |
| $50,000 to $74,999 | 2,035 (16.0%) | 3,489 (12.0%) |
| $75,000 to $99,999 | 2,077 (16.3%) | 5,661 (19.5%) |
| $100,000 to $149,999 | 1,888 (14.8%) | 4,764 (16.4%) |
| $150,000 or more | 1,231 (9.7%) | 7,149 (24.6%) |
| Total | 12,736 (100.0%) | 29,109 (100.0%) |
Property Value to Household Income Ratio in Onslow County
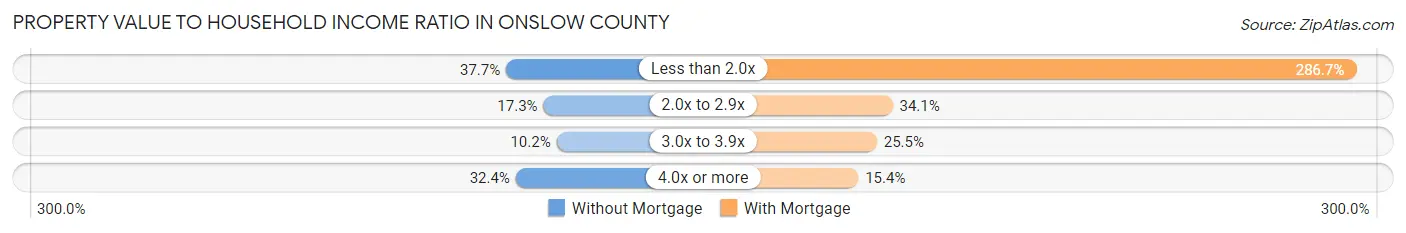
| Value-to-Income Ratio | Without Mortgage | With Mortgage |
| Less than 2.0x | 4,802 (37.7%) | 83,467 (286.7%) |
| 2.0x to 2.9x | 2,209 (17.3%) | 9,936 (34.1%) |
| 3.0x to 3.9x | 1,299 (10.2%) | 7,429 (25.5%) |
| 4.0x or more | 4,131 (32.4%) | 4,495 (15.4%) |
| Total | 12,736 (100.0%) | 29,109 (100.0%) |
Real Estate Taxes by Mortgage Status in Onslow County
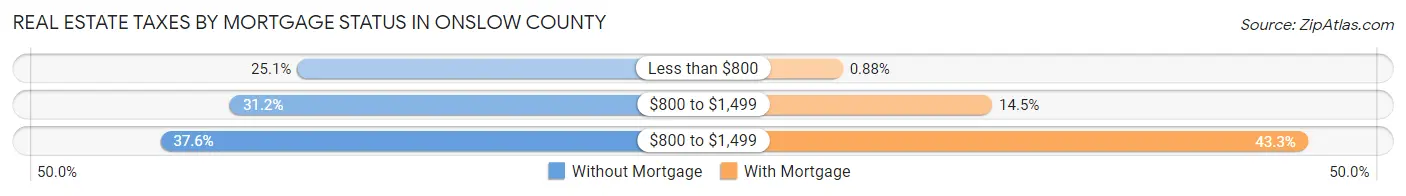
| Property Taxes | Without Mortgage | With Mortgage |
| Less than $800 | 3,198 (25.1%) | 255 (0.9%) |
| $800 to $1,499 | 3,979 (31.2%) | 4,230 (14.5%) |
| $800 to $1,499 | 4,787 (37.6%) | 12,617 (43.3%) |
| Total | 12,736 (100.0%) | 29,109 (100.0%) |
Health & Disability in Onslow County
Health Insurance Coverage by Age in Onslow County
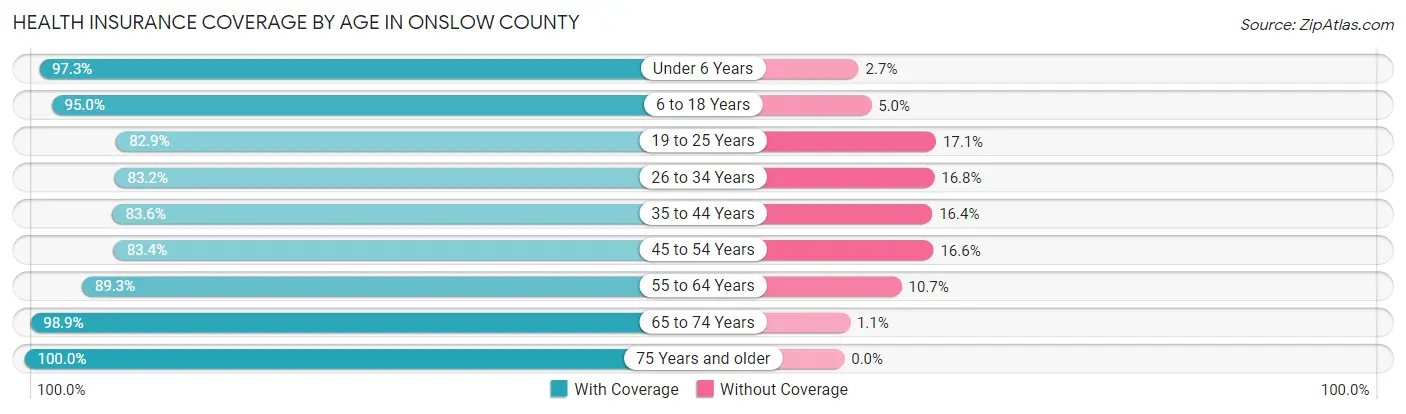
| Age Bracket | With Coverage | Without Coverage |
| Under 6 Years | 19,147 (97.3%) | 527 (2.7%) |
| 6 to 18 Years | 29,502 (95.0%) | 1,564 (5.0%) |
| 19 to 25 Years | 16,201 (82.9%) | 3,339 (17.1%) |
| 26 to 34 Years | 19,583 (83.2%) | 3,951 (16.8%) |
| 35 to 44 Years | 16,179 (83.6%) | 3,175 (16.4%) |
| 45 to 54 Years | 12,732 (83.4%) | 2,539 (16.6%) |
| 55 to 64 Years | 14,605 (89.3%) | 1,747 (10.7%) |
| 65 to 74 Years | 11,751 (98.9%) | 126 (1.1%) |
| 75 Years and older | 7,497 (100.0%) | 0 (0.0%) |
| Total | 147,197 (89.7%) | 16,968 (10.3%) |
Health Insurance Coverage by Citizenship Status in Onslow County
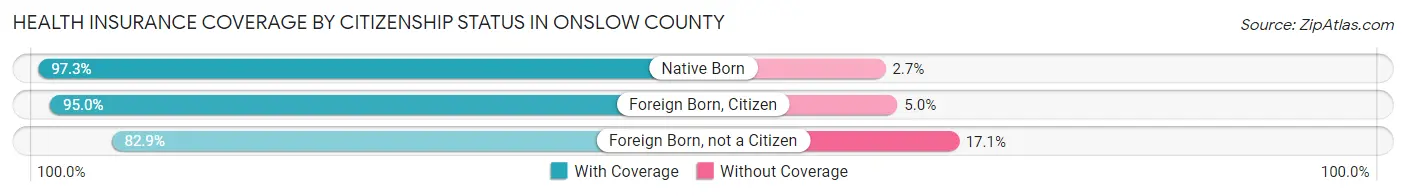
| Citizenship Status | With Coverage | Without Coverage |
| Native Born | 19,147 (97.3%) | 527 (2.7%) |
| Foreign Born, Citizen | 29,502 (95.0%) | 1,564 (5.0%) |
| Foreign Born, not a Citizen | 16,201 (82.9%) | 3,339 (17.1%) |
Health Insurance Coverage by Household Income in Onslow County
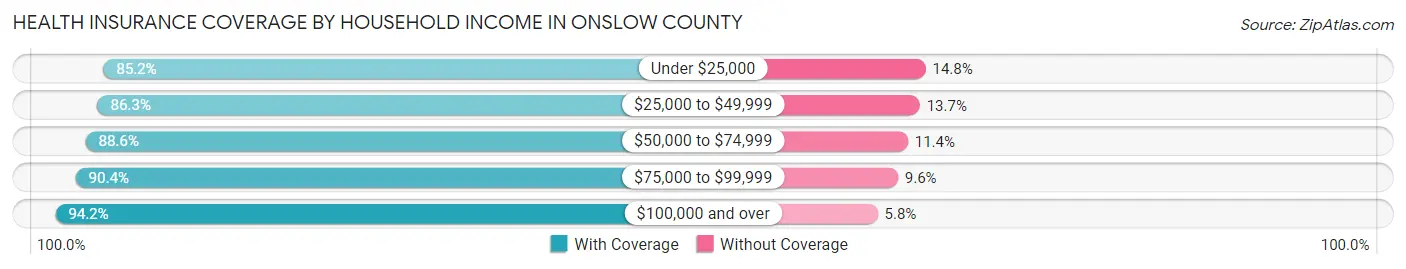
| Household Income | With Coverage | Without Coverage |
| Under $25,000 | 19,187 (85.2%) | 3,322 (14.8%) |
| $25,000 to $49,999 | 29,637 (86.3%) | 4,691 (13.7%) |
| $50,000 to $74,999 | 27,629 (88.6%) | 3,564 (11.4%) |
| $75,000 to $99,999 | 23,455 (90.4%) | 2,482 (9.6%) |
| $100,000 and over | 47,090 (94.2%) | 2,884 (5.8%) |
Public vs Private Health Insurance Coverage by Age in Onslow County
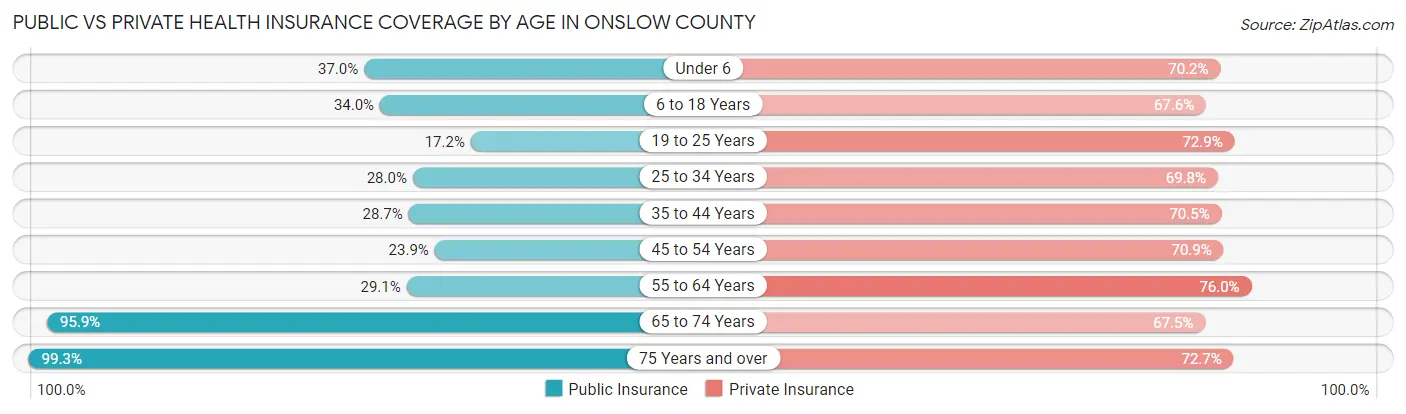
| Age Bracket | Public Insurance | Private Insurance |
| Under 6 | 7,277 (37.0%) | 13,820 (70.2%) |
| 6 to 18 Years | 10,574 (34.0%) | 20,996 (67.6%) |
| 19 to 25 Years | 3,359 (17.2%) | 14,240 (72.9%) |
| 25 to 34 Years | 6,579 (28.0%) | 16,427 (69.8%) |
| 35 to 44 Years | 5,563 (28.7%) | 13,639 (70.5%) |
| 45 to 54 Years | 3,648 (23.9%) | 10,819 (70.9%) |
| 55 to 64 Years | 4,758 (29.1%) | 12,432 (76.0%) |
| 65 to 74 Years | 11,384 (95.9%) | 8,015 (67.5%) |
| 75 Years and over | 7,441 (99.3%) | 5,451 (72.7%) |
| Total | 60,583 (36.9%) | 115,839 (70.6%) |
Disability Status by Sex by Age in Onslow County
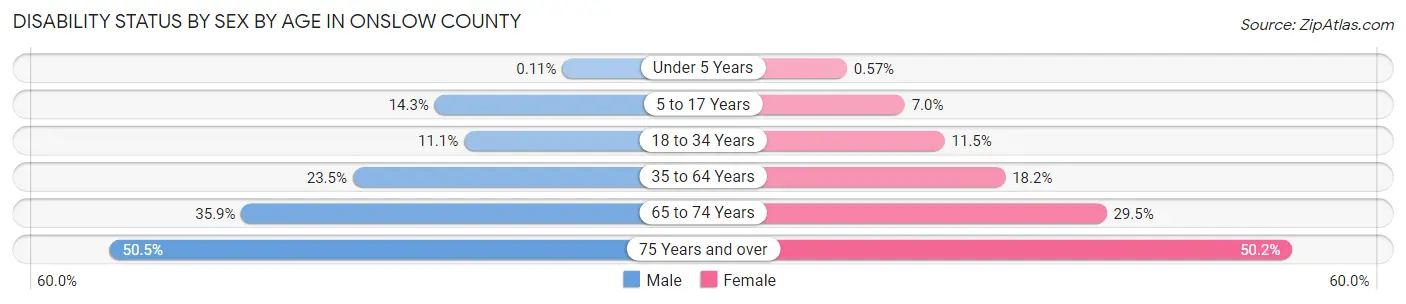
| Age Bracket | Male | Female |
| Under 5 Years | 9 (0.1%) | 47 (0.6%) |
| 5 to 17 Years | 2,390 (14.3%) | 1,129 (7.0%) |
| 18 to 34 Years | 2,108 (11.1%) | 2,900 (11.5%) |
| 35 to 64 Years | 5,521 (23.4%) | 4,994 (18.2%) |
| 65 to 74 Years | 2,011 (35.9%) | 1,848 (29.5%) |
| 75 Years and over | 1,570 (50.5%) | 2,202 (50.2%) |
Disability Class by Sex by Age in Onslow County
Disability Class: Hearing Difficulty
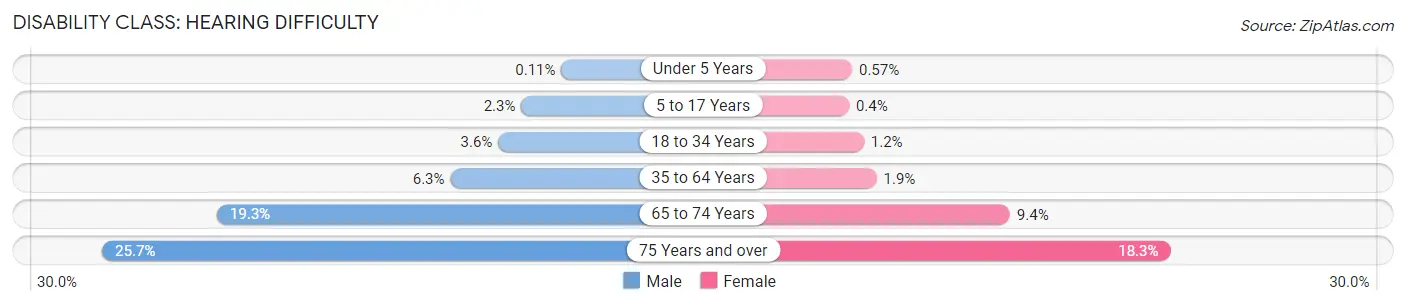
| Age Bracket | Male | Female |
| Under 5 Years | 9 (0.1%) | 47 (0.6%) |
| 5 to 17 Years | 391 (2.3%) | 65 (0.4%) |
| 18 to 34 Years | 691 (3.6%) | 311 (1.2%) |
| 35 to 64 Years | 1,480 (6.3%) | 532 (1.9%) |
| 65 to 74 Years | 1,082 (19.3%) | 587 (9.4%) |
| 75 Years and over | 798 (25.7%) | 803 (18.3%) |
Disability Class: Vision Difficulty
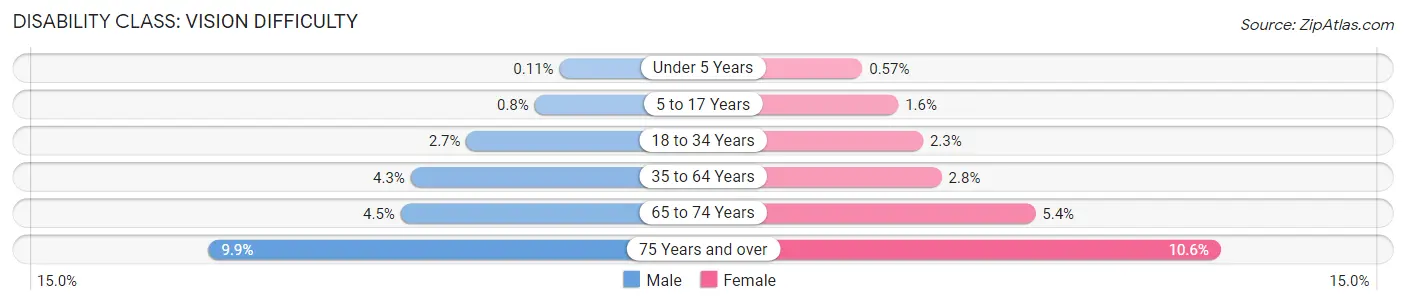
| Age Bracket | Male | Female |
| Under 5 Years | 9 (0.1%) | 47 (0.6%) |
| 5 to 17 Years | 134 (0.8%) | 252 (1.6%) |
| 18 to 34 Years | 514 (2.7%) | 573 (2.3%) |
| 35 to 64 Years | 1,001 (4.3%) | 762 (2.8%) |
| 65 to 74 Years | 254 (4.5%) | 338 (5.4%) |
| 75 Years and over | 307 (9.9%) | 463 (10.5%) |
Disability Class: Cognitive Difficulty
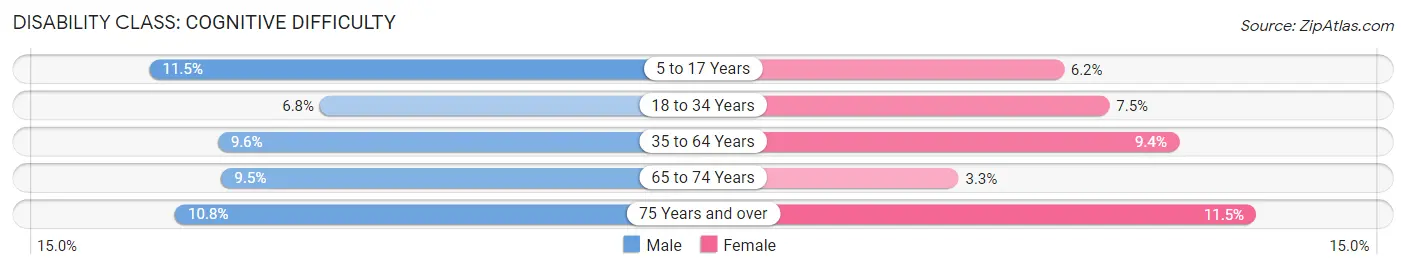
| Age Bracket | Male | Female |
| 5 to 17 Years | 1,921 (11.5%) | 994 (6.2%) |
| 18 to 34 Years | 1,293 (6.8%) | 1,887 (7.4%) |
| 35 to 64 Years | 2,264 (9.6%) | 2,574 (9.4%) |
| 65 to 74 Years | 534 (9.5%) | 204 (3.3%) |
| 75 Years and over | 336 (10.8%) | 506 (11.5%) |
Disability Class: Ambulatory Difficulty
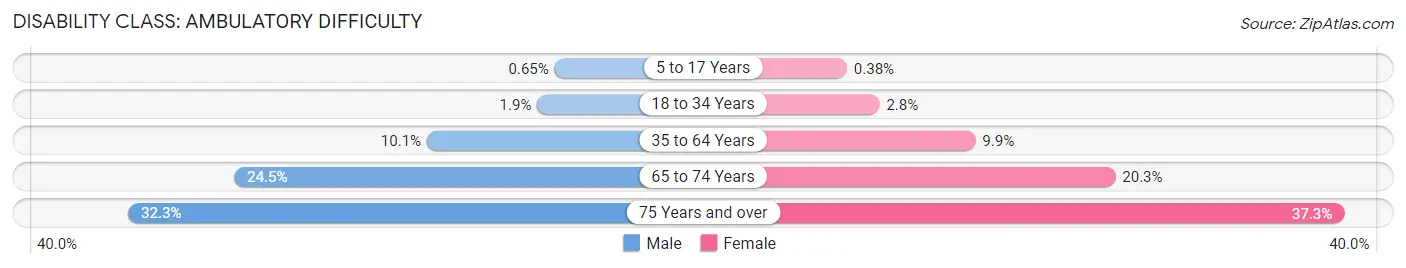
| Age Bracket | Male | Female |
| 5 to 17 Years | 108 (0.6%) | 61 (0.4%) |
| 18 to 34 Years | 369 (1.9%) | 710 (2.8%) |
| 35 to 64 Years | 2,384 (10.1%) | 2,720 (9.9%) |
| 65 to 74 Years | 1,371 (24.4%) | 1,273 (20.3%) |
| 75 Years and over | 1,004 (32.3%) | 1,637 (37.3%) |
Disability Class: Self-Care Difficulty
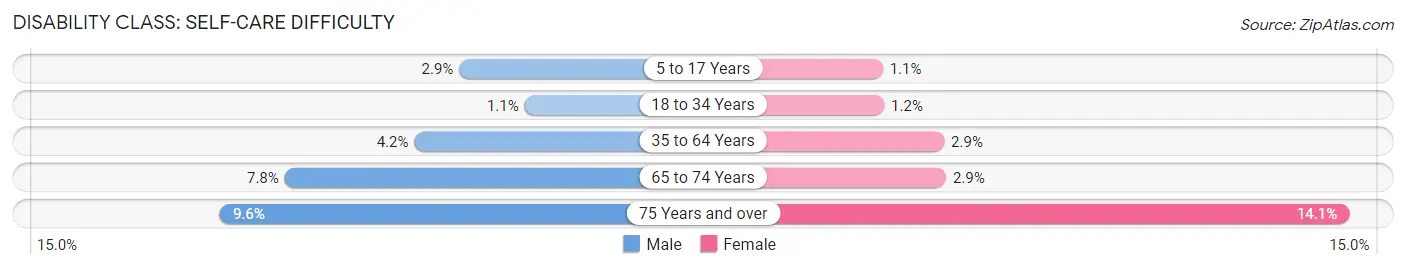
| Age Bracket | Male | Female |
| 5 to 17 Years | 484 (2.9%) | 183 (1.1%) |
| 18 to 34 Years | 205 (1.1%) | 299 (1.2%) |
| 35 to 64 Years | 978 (4.2%) | 781 (2.9%) |
| 65 to 74 Years | 435 (7.8%) | 182 (2.9%) |
| 75 Years and over | 297 (9.6%) | 620 (14.1%) |
Technology Access in Onslow County
Computing Device Access in Onslow County

| Device Type | # Households | % Households |
| Desktop or Laptop | 60,110 | 84.7% |
| Smartphone | 65,710 | 92.5% |
| Tablet | 45,983 | 64.8% |
| No Computing Device | 2,300 | 3.2% |
| Total | 71,009 | 100.0% |
Internet Access in Onslow County
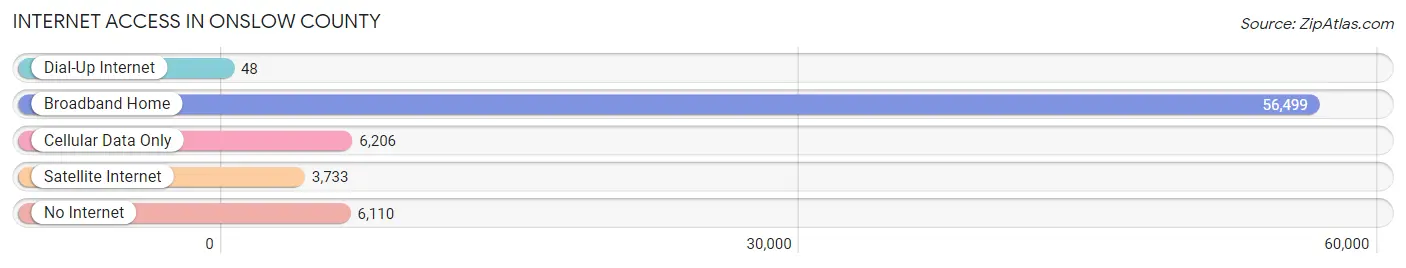
| Internet Type | # Households | % Households |
| Dial-Up Internet | 48 | 0.1% |
| Broadband Home | 56,499 | 79.6% |
| Cellular Data Only | 6,206 | 8.7% |
| Satellite Internet | 3,733 | 5.3% |
| No Internet | 6,110 | 8.6% |
| Total | 71,009 | 100.0% |
Onslow County Summary
Onslow County is located in the southeastern corner of North Carolina, and is part of the Coastal Plain region. It is bordered by Carteret County to the north, Jones County to the west, and Pender County to the south. The county seat is Jacksonville, and the county is home to a population of approximately 180,000 people.
Geography
Onslow County is located in the Coastal Plain region of North Carolina, and is characterized by flat terrain and sandy soils. The county is divided into two distinct regions: the mainland and the barrier islands. The mainland is located on the mainland of North Carolina and is home to the majority of the county’s population. The barrier islands are located off the coast of Onslow County and are home to a variety of wildlife, including sea turtles, dolphins, and shorebirds.
The county is home to a variety of natural resources, including forests, wetlands, and estuaries. The New River, White Oak River, and the Intracoastal Waterway all flow through Onslow County. The county is also home to a variety of wildlife, including deer, black bears, and wild turkeys.
History
Onslow County was formed in 1734 from parts of New Hanover and Carteret Counties. The county was named after Arthur Onslow, the Speaker of the House of Commons in England. The county was initially home to a variety of Native American tribes, including the Tuscarora, Coree, and Croatan.
In the late 1700s, the county began to experience an influx of settlers from the British Isles. These settlers established small farms and plantations, and the county’s economy began to grow. By the mid-1800s, the county was home to a variety of industries, including lumber, fishing, and naval stores.
During the Civil War, Onslow County was the site of several battles, including the Battle of Richlands and the Battle of Swansboro. After the war, the county’s economy began to shift from agriculture to industry. In the early 1900s, the county experienced a boom in the lumber industry, and by the mid-1900s, the county was home to a variety of manufacturing and service industries.
Economy
Onslow County’s economy is largely driven by the military, with Camp Lejeune and the Marine Corps Air Station New River located in the county. The county is also home to a variety of manufacturing and service industries, including food processing, electronics, and tourism.
The county’s unemployment rate is lower than the state average, and the median household income is higher than the state average. The county is home to a variety of educational institutions, including the University of North Carolina at Wilmington, Coastal Carolina Community College, and Jacksonville State University.
Demographics
As of the 2010 census, Onslow County had a population of 177,772. The population is largely white (77.3%), with African Americans making up 16.2% of the population. The median age is 33.7 years, and the median household income is $48,927.
Conclusion
Onslow County is located in the southeastern corner of North Carolina and is part of the Coastal Plain region. The county is home to a variety of natural resources, and its economy is largely driven by the military. The county is home to a population of approximately 180,000 people, and the median household income is higher than the state average. Onslow County is a diverse and vibrant community, and is an important part of the state of North Carolina.
Common Questions
What is the Total Population of Onslow County?
Total Population of Onslow County is 203,686.
What is the Total Male Population of Onslow County?
Total Male Population of Onslow County is 113,368.
What is the Total Female Population of Onslow County?
Total Female Population of Onslow County is 90,318.
What is the Ratio of Males per 100 Females in Onslow County?
There are 125.52 Males per 100 Females in Onslow County.
What is the Ratio of Females per 100 Males in Onslow County?
There are 79.67 Females per 100 Males in Onslow County.
What is the Median Population Age in Onslow County?
Median Population Age in Onslow County is 26.9 Years.
What is the Average Family Size in Onslow County
Average Family Size in Onslow County is 3.0 People.
What is the Average Household Size in Onslow County
Average Household Size in Onslow County is 2.6 People.
What is Per Capita Income in Onslow County?
Per Capita income in Onslow County is $29,214.
What is the Median Family Income in Onslow County?
Median Family Income in Onslow County is $67,237.
What is the Median Household income in Onslow County?
Median Household Income in Onslow County is $59,976.
What is Income or Wage Gap in Onslow County?
Income or Wage Gap in Onslow County is 20.7%.
Women in Onslow County earn 79.3 cents for every dollar earned by a man.
What is Family Income Deficit in Onslow County?
Family Income Deficit in Onslow County is $11,714.
Families that are below poverty line in Onslow County earn $11,714 less on average than the poverty threshold level.
What is Inequality or Gini Index in Onslow County?
Inequality or Gini Index in Onslow County is 0.42.
How Large is the Labor Force in Onslow County?
There are 111,156 People in the Labor Forcein in Onslow County.
What is the Percentage of People in the Labor Force in Onslow County?
70.0% of People are in the Labor Force in Onslow County.
What is the Unemployment Rate in Onslow County?
Unemployment Rate in Onslow County is 6.4%.