New Hanover County, NC
New Hanover County Map
New Hanover County Overview
228,134
TOTAL POPULATION
109,251
MALE POPULATION
118,883
FEMALE POPULATION
91.90
MALES / 100 FEMALES
108.82
FEMALES / 100 MALES
40.2
MEDIAN AGE
2.9
AVG FAMILY SIZE
2.2
AVG HOUSEHOLD SIZE
$43,378
PER CAPITA INCOME
$92,806
AVG FAMILY INCOME
$67,515
AVG HOUSEHOLD INCOME
23.8%
WAGE / INCOME GAP [ % ]
76.2¢/ $1
WAGE / INCOME GAP [ $ ]
$11,306
FAMILY INCOME DEFICIT
0.49
INEQUALITY / GINI INDEX
123,606
LABOR FORCE [ PEOPLE ]
64.6%
PERCENT IN LABOR FORCE
4.8%
UNEMPLOYMENT RATE
New Hanover County Area Codes
Race in New Hanover County
The most populous races in New Hanover County are White / Caucasian (180,420 | 79.1%), Black / African American (27,648 | 12.1%), and Hispanic or Latino (13,857 | 6.1%).

| Race | # Population | % Population |
| Asian | 3,007 | 1.3% |
| Black / African American | 27,648 | 12.1% |
| Hawaiian / Pacific | 34 | 0.0% |
| Hispanic or Latino | 13,857 | 6.1% |
| Native / Alaskan | 507 | 0.2% |
| White / Caucasian | 180,420 | 79.1% |
| Two or more Races | 10,590 | 4.6% |
| Some other Race | 5,928 | 2.6% |
| Total | 228,134 | 100.0% |
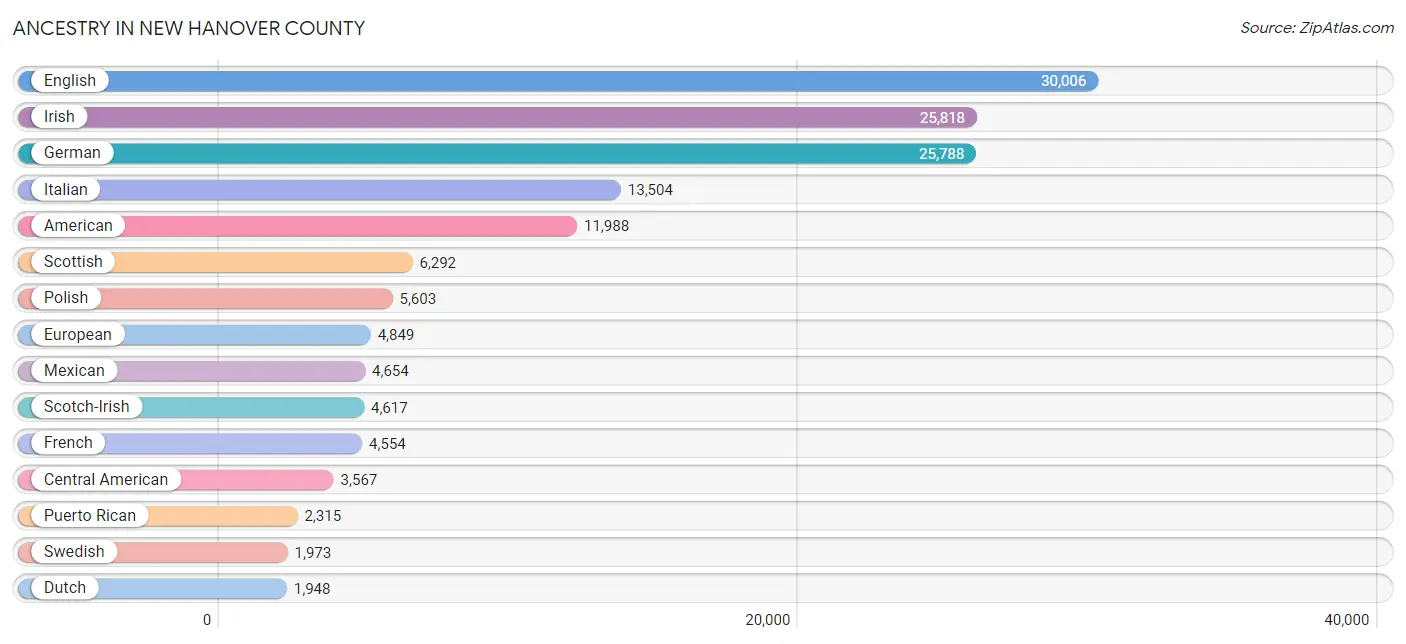
Ancestry in New Hanover County
The most populous ancestries reported in New Hanover County are English (30,006 | 13.2%), Irish (25,818 | 11.3%), German (25,788 | 11.3%), Italian (13,504 | 5.9%), and American (11,988 | 5.2%), together accounting for 46.9% of all New Hanover County residents.
| Ancestry | # Population | % Population |
| Afghan | 4 | 0.0% |
| African | 1,281 | 0.6% |
| Albanian | 133 | 0.1% |
| American | 11,988 | 5.2% |
| Arab | 1,068 | 0.5% |
| Argentinean | 97 | 0.0% |
| Armenian | 124 | 0.1% |
| Australian | 73 | 0.0% |
| Austrian | 510 | 0.2% |
| Bahamian | 11 | 0.0% |
| Bangladeshi | 41 | 0.0% |
| Basque | 27 | 0.0% |
| Belgian | 227 | 0.1% |
| Bhutanese | 351 | 0.2% |
| Blackfeet | 52 | 0.0% |
| Brazilian | 751 | 0.3% |
| British | 1,759 | 0.8% |
| British West Indian | 24 | 0.0% |
| Burmese | 1,389 | 0.6% |
| Cambodian | 14 | 0.0% |
| Canadian | 459 | 0.2% |
| Cape Verdean | 12 | 0.0% |
| Celtic | 15 | 0.0% |
| Central American | 3,567 | 1.6% |
| Central American Indian | 67 | 0.0% |
| Cherokee | 954 | 0.4% |
| Cheyenne | 32 | 0.0% |
| Chilean | 155 | 0.1% |
| Chippewa | 4 | 0.0% |
| Choctaw | 21 | 0.0% |
| Colombian | 421 | 0.2% |
| Comanche | 78 | 0.0% |
| Costa Rican | 71 | 0.0% |
| Croatian | 199 | 0.1% |
| Cuban | 863 | 0.4% |
| Cypriot | 23 | 0.0% |
| Czech | 533 | 0.2% |
| Czechoslovakian | 9 | 0.0% |
| Danish | 770 | 0.3% |
| Dominican | 323 | 0.1% |
| Dutch | 1,948 | 0.9% |
| Eastern European | 1,098 | 0.5% |
| Ecuadorian | 4 | 0.0% |
| Egyptian | 128 | 0.1% |
| English | 30,006 | 13.2% |
| Estonian | 17 | 0.0% |
| Ethiopian | 20 | 0.0% |
| European | 4,849 | 2.1% |
| Filipino | 121 | 0.1% |
| Finnish | 189 | 0.1% |
| French | 4,554 | 2.0% |
| French American Indian | 121 | 0.1% |
| French Canadian | 861 | 0.4% |
| German | 25,788 | 11.3% |
| Ghanaian | 69 | 0.0% |
| Greek | 1,244 | 0.5% |
| Guamanian / Chamorro | 29 | 0.0% |
| Guatemalan | 365 | 0.2% |
| Haitian | 310 | 0.1% |
| Honduran | 1,825 | 0.8% |
| Hungarian | 921 | 0.4% |
| Icelander | 79 | 0.0% |
| Indian (Asian) | 970 | 0.4% |
| Indonesian | 63 | 0.0% |
| Iranian | 32 | 0.0% |
| Irish | 25,818 | 11.3% |
| Iroquois | 143 | 0.1% |
| Israeli | 58 | 0.0% |
| Italian | 13,504 | 5.9% |
| Jamaican | 165 | 0.1% |
| Jordanian | 29 | 0.0% |
| Korean | 853 | 0.4% |
| Laotian | 33 | 0.0% |
| Latvian | 48 | 0.0% |
| Lebanese | 529 | 0.2% |
| Lithuanian | 442 | 0.2% |
| Lumbee | 262 | 0.1% |
| Luxembourger | 32 | 0.0% |
| Maltese | 22 | 0.0% |
| Mexican | 4,654 | 2.0% |
| Mexican American Indian | 21 | 0.0% |
| Moroccan | 162 | 0.1% |
| Native Hawaiian | 25 | 0.0% |
| Navajo | 39 | 0.0% |
| Nicaraguan | 30 | 0.0% |
| Nigerian | 240 | 0.1% |
| Northern European | 326 | 0.1% |
| Norwegian | 1,793 | 0.8% |
| Osage | 7 | 0.0% |
| Pakistani | 133 | 0.1% |
| Palestinian | 44 | 0.0% |
| Panamanian | 130 | 0.1% |
| Pennsylvania German | 70 | 0.0% |
| Peruvian | 76 | 0.0% |
| Polish | 5,603 | 2.5% |
| Portuguese | 452 | 0.2% |
| Puerto Rican | 2,315 | 1.0% |
| Romanian | 279 | 0.1% |
| Russian | 1,110 | 0.5% |
| Salvadoran | 1,113 | 0.5% |
| Samoan | 43 | 0.0% |
| Scandinavian | 384 | 0.2% |
| Scotch-Irish | 4,617 | 2.0% |
| Scottish | 6,292 | 2.8% |
| Seminole | 8 | 0.0% |
| Serbian | 30 | 0.0% |
| Slavic | 118 | 0.1% |
| Slovak | 615 | 0.3% |
| Slovene | 96 | 0.0% |
| South African | 143 | 0.1% |
| South American | 1,066 | 0.5% |
| South American Indian | 91 | 0.0% |
| Spaniard | 263 | 0.1% |
| Spanish | 310 | 0.1% |
| Sri Lankan | 311 | 0.1% |
| Subsaharan African | 1,810 | 0.8% |
| Swedish | 1,973 | 0.9% |
| Swiss | 525 | 0.2% |
| Syrian | 183 | 0.1% |
| Thai | 463 | 0.2% |
| Trinidadian and Tobagonian | 78 | 0.0% |
| Turkish | 248 | 0.1% |
| Ugandan | 17 | 0.0% |
| Ukrainian | 631 | 0.3% |
| Venezuelan | 313 | 0.1% |
| Welsh | 1,564 | 0.7% |
| West Indian | 156 | 0.1% |
| Yugoslavian | 72 | 0.0% | View All 128 Rows |
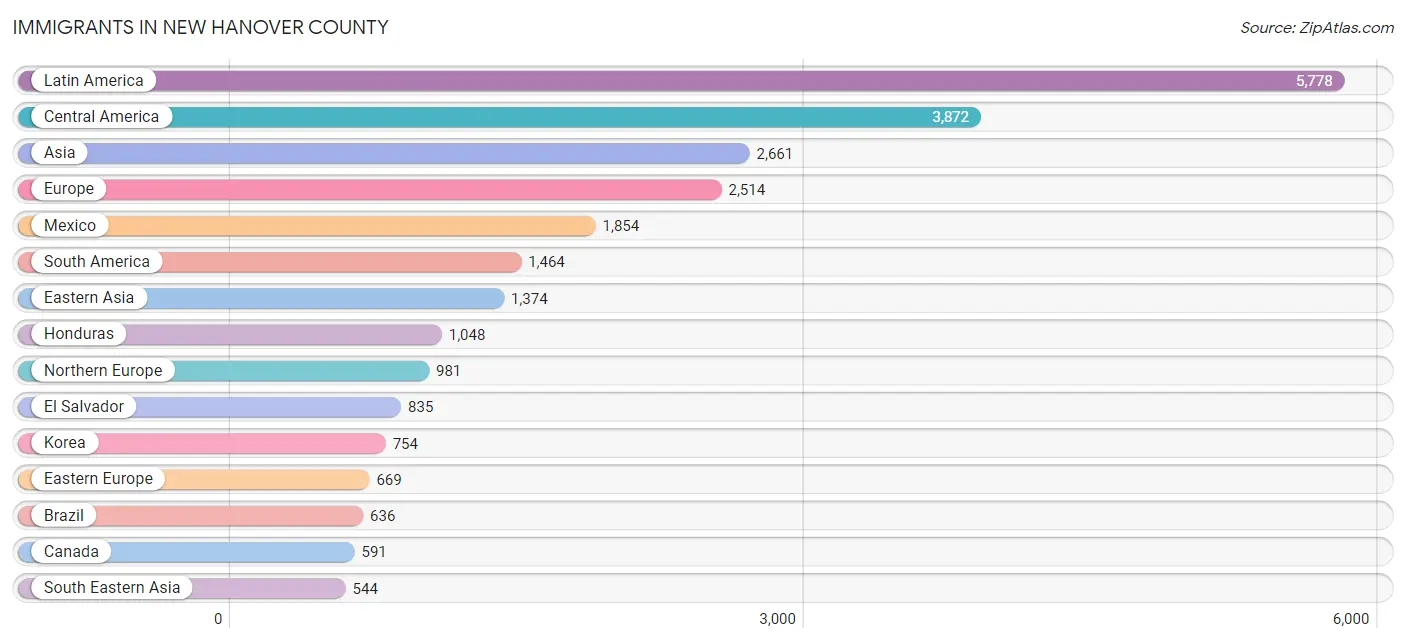
Immigrants in New Hanover County
The most numerous immigrant groups reported in New Hanover County came from Latin America (5,778 | 2.5%), Central America (3,872 | 1.7%), Asia (2,661 | 1.2%), Europe (2,514 | 1.1%), and Mexico (1,854 | 0.8%), together accounting for 7.3% of all New Hanover County residents.
| Immigration Origin | # Population | % Population |
| Afghanistan | 110 | 0.1% |
| Africa | 466 | 0.2% |
| Argentina | 53 | 0.0% |
| Armenia | 11 | 0.0% |
| Asia | 2,661 | 1.2% |
| Australia | 69 | 0.0% |
| Austria | 56 | 0.0% |
| Bangladesh | 59 | 0.0% |
| Barbados | 44 | 0.0% |
| Belarus | 28 | 0.0% |
| Belgium | 37 | 0.0% |
| Bosnia and Herzegovina | 38 | 0.0% |
| Brazil | 636 | 0.3% |
| Canada | 591 | 0.3% |
| Caribbean | 442 | 0.2% |
| Central America | 3,872 | 1.7% |
| Chile | 155 | 0.1% |
| China | 481 | 0.2% |
| Colombia | 212 | 0.1% |
| Costa Rica | 60 | 0.0% |
| Cuba | 222 | 0.1% |
| Czechoslovakia | 122 | 0.1% |
| Denmark | 26 | 0.0% |
| Eastern Africa | 71 | 0.0% |
| Eastern Asia | 1,374 | 0.6% |
| Eastern Europe | 669 | 0.3% |
| Ecuador | 17 | 0.0% |
| Egypt | 136 | 0.1% |
| El Salvador | 835 | 0.4% |
| England | 330 | 0.1% |
| Europe | 2,514 | 1.1% |
| France | 47 | 0.0% |
| Germany | 340 | 0.2% |
| Greece | 86 | 0.0% |
| Guatemala | 75 | 0.0% |
| Haiti | 97 | 0.0% |
| Honduras | 1,048 | 0.5% |
| Hong Kong | 23 | 0.0% |
| Hungary | 10 | 0.0% |
| India | 83 | 0.0% |
| Indonesia | 33 | 0.0% |
| Iran | 5 | 0.0% |
| Ireland | 62 | 0.0% |
| Israel | 64 | 0.0% |
| Italy | 169 | 0.1% |
| Jamaica | 75 | 0.0% |
| Japan | 139 | 0.1% |
| Korea | 754 | 0.3% |
| Laos | 13 | 0.0% |
| Latin America | 5,778 | 2.5% |
| Latvia | 58 | 0.0% |
| Lebanon | 18 | 0.0% |
| Malaysia | 14 | 0.0% |
| Mexico | 1,854 | 0.8% |
| Middle Africa | 33 | 0.0% |
| Morocco | 27 | 0.0% |
| Netherlands | 50 | 0.0% |
| Northern Africa | 191 | 0.1% |
| Northern Europe | 981 | 0.4% |
| Oceania | 86 | 0.0% |
| Pakistan | 43 | 0.0% |
| Peru | 115 | 0.1% |
| Philippines | 368 | 0.2% |
| Poland | 60 | 0.0% |
| Portugal | 15 | 0.0% |
| Romania | 56 | 0.0% |
| Russia | 159 | 0.1% |
| Scotland | 56 | 0.0% |
| South Africa | 148 | 0.1% |
| South America | 1,464 | 0.6% |
| South Central Asia | 317 | 0.1% |
| South Eastern Asia | 544 | 0.2% |
| Southern Europe | 312 | 0.1% |
| Spain | 28 | 0.0% |
| Sweden | 112 | 0.1% |
| Taiwan | 92 | 0.0% |
| Thailand | 8 | 0.0% |
| Trinidad and Tobago | 4 | 0.0% |
| Turkey | 112 | 0.1% |
| Ukraine | 78 | 0.0% |
| Uzbekistan | 6 | 0.0% |
| Venezuela | 276 | 0.1% |
| Vietnam | 78 | 0.0% |
| Western Africa | 23 | 0.0% |
| Western Asia | 320 | 0.1% |
| Western Europe | 530 | 0.2% |
| Yemen | 72 | 0.0% |
| Zaire | 33 | 0.0% | View All 88 Rows |
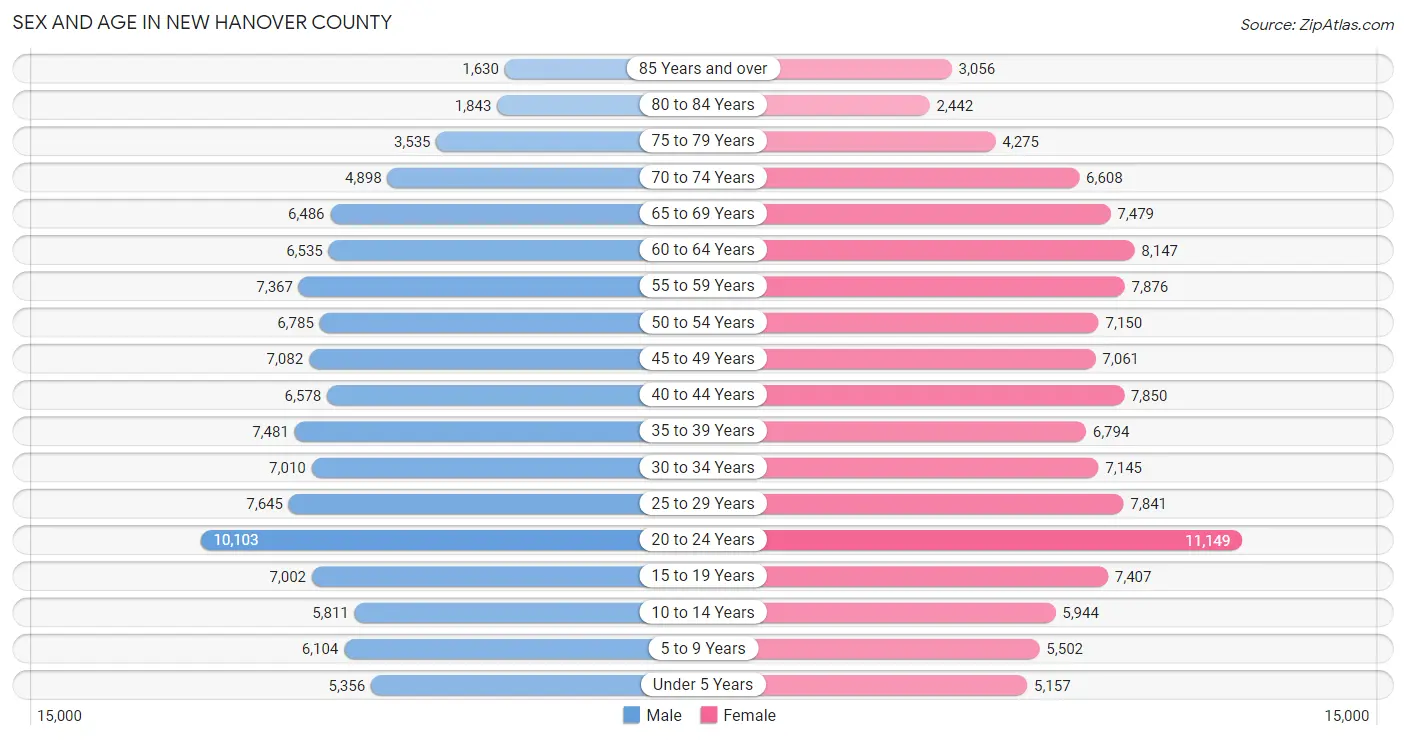
Sex and Age in New Hanover County
Sex and Age in New Hanover County
The most populous age groups in New Hanover County are 20 to 24 Years (10,103 | 9.2%) for men and 20 to 24 Years (11,149 | 9.4%) for women.
| Age Bracket | Male | Female |
| Under 5 Years | 5,356 (4.9%) | 5,157 (4.3%) |
| 5 to 9 Years | 6,104 (5.6%) | 5,502 (4.6%) |
| 10 to 14 Years | 5,811 (5.3%) | 5,944 (5.0%) |
| 15 to 19 Years | 7,002 (6.4%) | 7,407 (6.2%) |
| 20 to 24 Years | 10,103 (9.2%) | 11,149 (9.4%) |
| 25 to 29 Years | 7,645 (7.0%) | 7,841 (6.6%) |
| 30 to 34 Years | 7,010 (6.4%) | 7,145 (6.0%) |
| 35 to 39 Years | 7,481 (6.9%) | 6,794 (5.7%) |
| 40 to 44 Years | 6,578 (6.0%) | 7,850 (6.6%) |
| 45 to 49 Years | 7,082 (6.5%) | 7,061 (5.9%) |
| 50 to 54 Years | 6,785 (6.2%) | 7,150 (6.0%) |
| 55 to 59 Years | 7,367 (6.7%) | 7,876 (6.6%) |
| 60 to 64 Years | 6,535 (6.0%) | 8,147 (6.9%) |
| 65 to 69 Years | 6,486 (5.9%) | 7,479 (6.3%) |
| 70 to 74 Years | 4,898 (4.5%) | 6,608 (5.6%) |
| 75 to 79 Years | 3,535 (3.2%) | 4,275 (3.6%) |
| 80 to 84 Years | 1,843 (1.7%) | 2,442 (2.1%) |
| 85 Years and over | 1,630 (1.5%) | 3,056 (2.6%) |
| Total | 109,251 (100.0%) | 118,883 (100.0%) |
Families and Households in New Hanover County
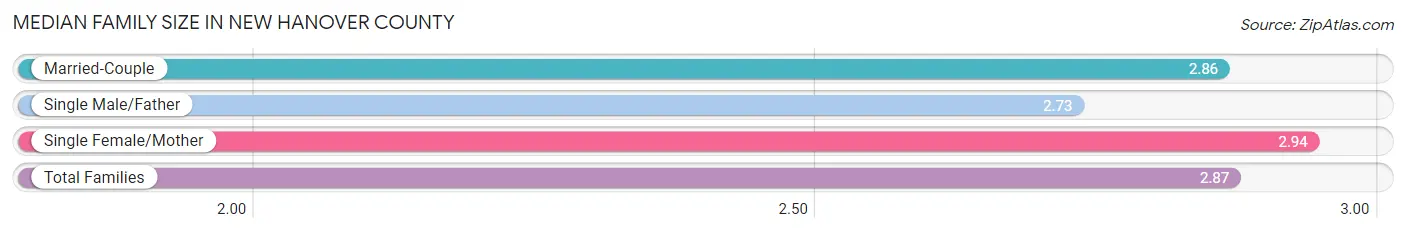
Median Family Size in New Hanover County
The median family size in New Hanover County is 2.87 persons per family, with single female/mother families (8,986 | 16.2%) accounting for the largest median family size of 2.94 persons per family. On the other hand, single male/father families (3,283 | 5.9%) represent the smallest median family size with 2.73 persons per family.
| Family Type | # Families | Family Size |
| Married-Couple | 43,265 (77.9%) | 2.86 |
| Single Male/Father | 3,283 (5.9%) | 2.73 |
| Single Female/Mother | 8,986 (16.2%) | 2.94 |
| Total Families | 55,534 (100.0%) | 2.87 |
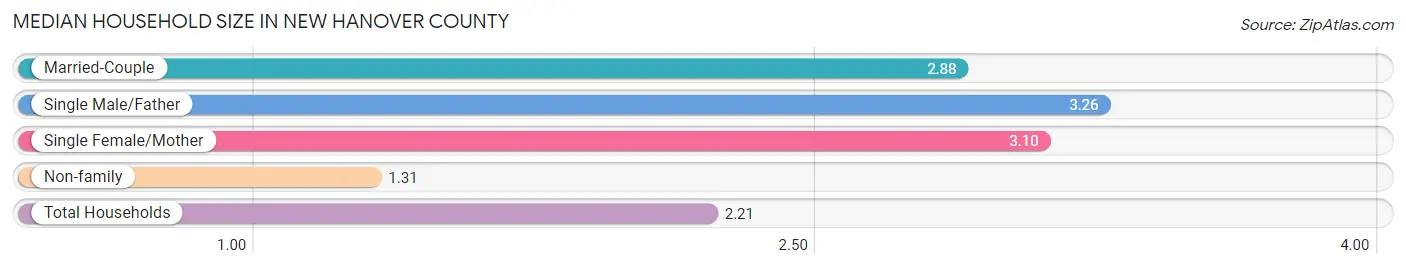
Median Household Size in New Hanover County
The median household size in New Hanover County is 2.21 persons per household, with single male/father households (3,283 | 3.3%) accounting for the largest median household size of 3.26 persons per household. non-family households (44,441 | 44.5%) represent the smallest median household size with 1.31 persons per household.
| Household Type | # Households | Household Size |
| Married-Couple | 43,265 (43.3%) | 2.88 |
| Single Male/Father | 3,283 (3.3%) | 3.26 |
| Single Female/Mother | 8,986 (9.0%) | 3.10 |
| Non-family | 44,441 (44.5%) | 1.31 |
| Total Households | 99,975 (100.0%) | 2.21 |
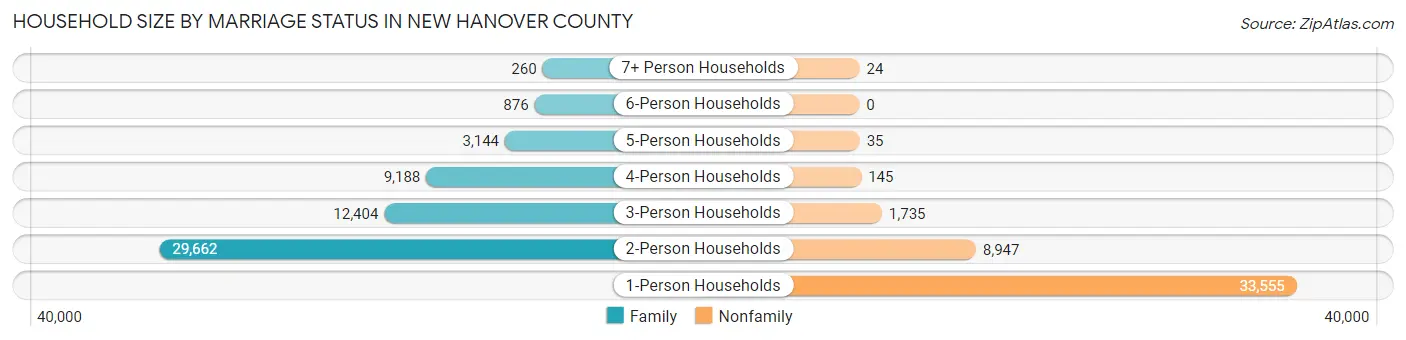
Household Size by Marriage Status in New Hanover County
Out of a total of 99,975 households in New Hanover County, 55,534 (55.5%) are family households, while 44,441 (44.5%) are nonfamily households. The most numerous type of family households are 2-person households, comprising 29,662, and the most common type of nonfamily households are 1-person households, comprising 33,555.
| Household Size | Family Households | Nonfamily Households |
| 1-Person Households | - | 33,555 (33.6%) |
| 2-Person Households | 29,662 (29.7%) | 8,947 (8.9%) |
| 3-Person Households | 12,404 (12.4%) | 1,735 (1.7%) |
| 4-Person Households | 9,188 (9.2%) | 145 (0.2%) |
| 5-Person Households | 3,144 (3.1%) | 35 (0.0%) |
| 6-Person Households | 876 (0.9%) | 0 (0.0%) |
| 7+ Person Households | 260 (0.3%) | 24 (0.0%) |
| Total | 55,534 (55.5%) | 44,441 (44.5%) |
Female Fertility in New Hanover County
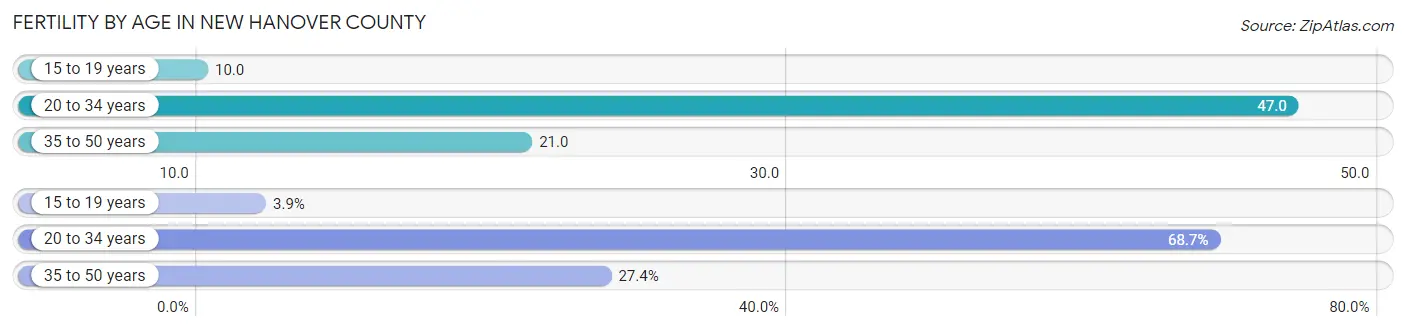
Fertility by Age in New Hanover County
Average fertility rate in New Hanover County is 32.0 births per 1,000 women. Women in the age bracket of 20 to 34 years have the highest fertility rate with 47.0 births per 1,000 women. Women in the age bracket of 20 to 34 years acount for 68.7% of all women with births.
| Age Bracket | Women with Births | Births / 1,000 Women |
| 15 to 19 years | 71 (3.9%) | 10.0 |
| 20 to 34 years | 1,239 (68.7%) | 47.0 |
| 35 to 50 years | 494 (27.4%) | 21.0 |
| Total | 1,804 (100.0%) | 32.0 |
Fertility by Age by Marriage Status in New Hanover County
72.3% of women with births (1,804) in New Hanover County are married. The highest percentage of unmarried women with births falls into 15 to 19 years age bracket with 100.0% of them unmarried at the time of birth, while the lowest percentage of unmarried women with births belong to 35 to 50 years age bracket with 9.5% of them unmarried.
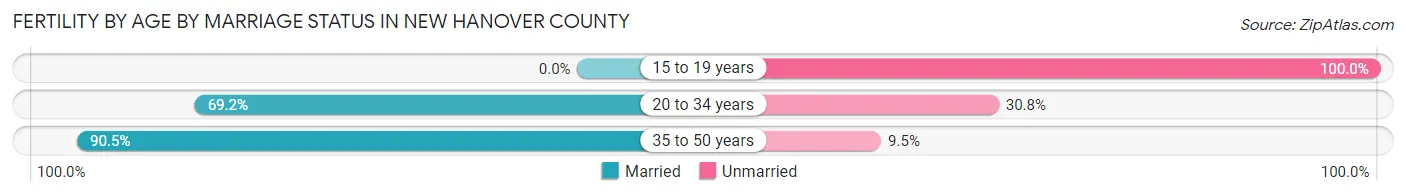
| Age Bracket | Married | Unmarried |
| 15 to 19 years | 0 (0.0%) | 71 (100.0%) |
| 20 to 34 years | 857 (69.2%) | 382 (30.8%) |
| 35 to 50 years | 447 (90.5%) | 47 (9.5%) |
| Total | 1,304 (72.3%) | 500 (27.7%) |
Fertility by Education in New Hanover County
Average fertility rate in New Hanover County is 32.0 births per 1,000 women. Women with the education attainment of graduate degree have the highest fertility rate of 51.0 births per 1,000 women, while women with the education attainment of bachelor's degree have the lowest fertility at 24.0 births per 1,000 women. Women with the education attainment of college or associate's degree represent 34.7% of all women with births.
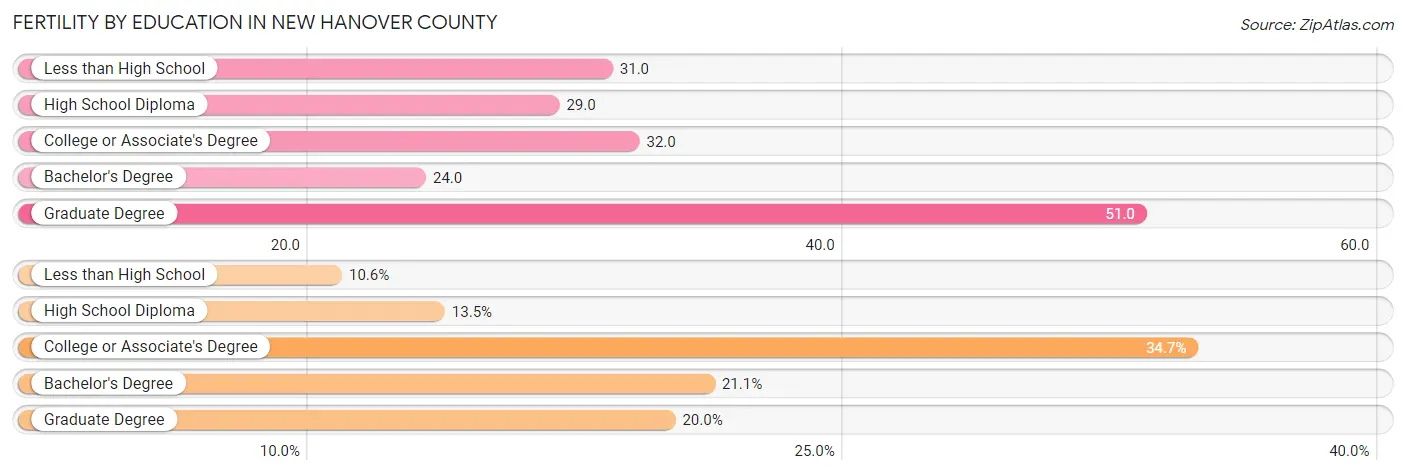
| Educational Attainment | Women with Births | Births / 1,000 Women |
| Less than High School | 192 (10.6%) | 31.0 |
| High School Diploma | 244 (13.5%) | 29.0 |
| College or Associate's Degree | 626 (34.7%) | 32.0 |
| Bachelor's Degree | 381 (21.1%) | 24.0 |
| Graduate Degree | 361 (20.0%) | 51.0 |
| Total | 1,804 (100.0%) | 32.0 |
Fertility by Education by Marriage Status in New Hanover County
27.7% of women with births in New Hanover County are unmarried. Women with the educational attainment of bachelor's degree are most likely to be married with 100.0% of them married at childbirth, while women with the educational attainment of less than high school are least likely to be married with 71.4% of them unmarried at childbirth.
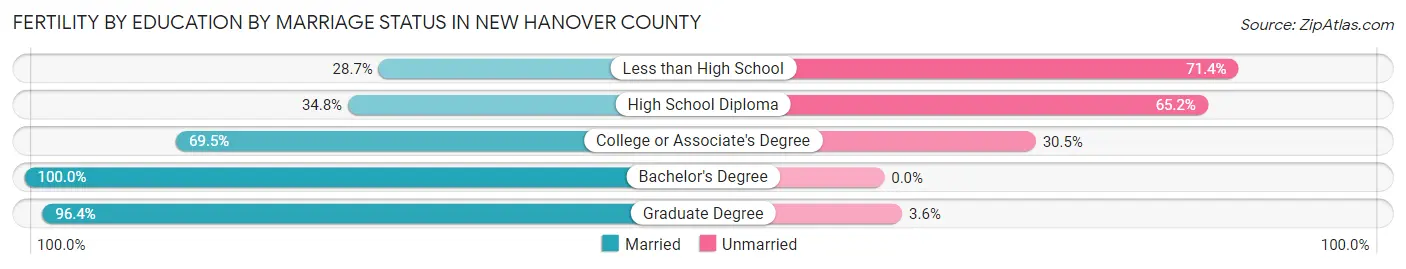
| Educational Attainment | Married | Unmarried |
| Less than High School | 55 (28.6%) | 137 (71.4%) |
| High School Diploma | 85 (34.8%) | 159 (65.2%) |
| College or Associate's Degree | 435 (69.5%) | 191 (30.5%) |
| Bachelor's Degree | 381 (100.0%) | 0 (0.0%) |
| Graduate Degree | 348 (96.4%) | 13 (3.6%) |
| Total | 1,304 (72.3%) | 500 (27.7%) |
Income in New Hanover County
Income Overview in New Hanover County
Per Capita Income in New Hanover County is $43,378, while median incomes of families and households are $92,806 and $67,515 respectively.
| Characteristic | Number | Measure |
| Per Capita Income | 228,134 | $43,378 |
| Median Family Income | 55,534 | $92,806 |
| Mean Family Income | 55,534 | $125,597 |
| Median Household Income | 99,975 | $67,515 |
| Mean Household Income | 99,975 | $97,277 |
| Income Deficit | 55,534 | $11,306 |
| Wage / Income Gap (%) | 228,134 | 23.79% |
| Wage / Income Gap ($) | 228,134 | 76.21¢ per $1 |
| Gini / Inequality Index | 228,134 | 0.49 |
Earnings by Sex in New Hanover County
Average Earnings in New Hanover County are $39,387, $44,284 for men and $33,749 for women, a difference of 23.8%.
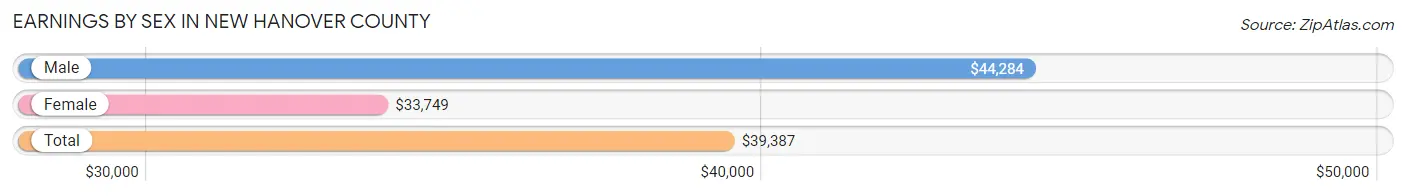
| Sex | Number | Average Earnings |
| Male | 65,522 (50.4%) | $44,284 |
| Female | 64,439 (49.6%) | $33,749 |
| Total | 129,961 (100.0%) | $39,387 |
Earnings by Sex by Income Bracket in New Hanover County
The most common earnings brackets in New Hanover County are $100,000+ for men (11,892 | 18.1%) and $100,000+ for women (5,759 | 8.9%).
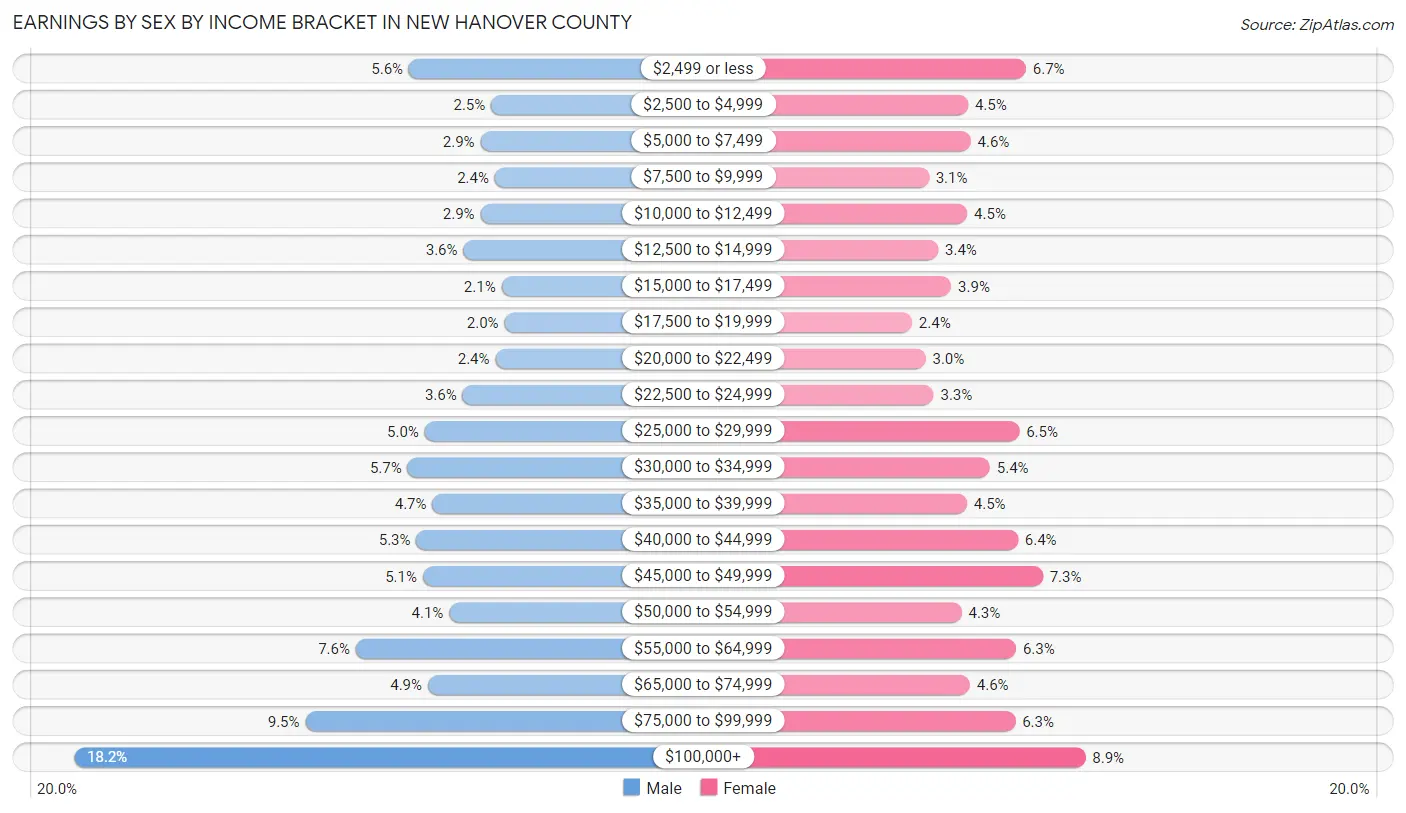
| Income | Male | Female |
| $2,499 or less | 3,666 (5.6%) | 4,322 (6.7%) |
| $2,500 to $4,999 | 1,653 (2.5%) | 2,924 (4.5%) |
| $5,000 to $7,499 | 1,912 (2.9%) | 2,990 (4.6%) |
| $7,500 to $9,999 | 1,561 (2.4%) | 1,980 (3.1%) |
| $10,000 to $12,499 | 1,914 (2.9%) | 2,906 (4.5%) |
| $12,500 to $14,999 | 2,332 (3.6%) | 2,201 (3.4%) |
| $15,000 to $17,499 | 1,397 (2.1%) | 2,519 (3.9%) |
| $17,500 to $19,999 | 1,324 (2.0%) | 1,572 (2.4%) |
| $20,000 to $22,499 | 1,545 (2.4%) | 1,902 (2.9%) |
| $22,500 to $24,999 | 2,353 (3.6%) | 2,094 (3.3%) |
| $25,000 to $29,999 | 3,285 (5.0%) | 4,163 (6.5%) |
| $30,000 to $34,999 | 3,705 (5.7%) | 3,454 (5.4%) |
| $35,000 to $39,999 | 3,092 (4.7%) | 2,898 (4.5%) |
| $40,000 to $44,999 | 3,486 (5.3%) | 4,128 (6.4%) |
| $45,000 to $49,999 | 3,329 (5.1%) | 4,732 (7.3%) |
| $50,000 to $54,999 | 2,681 (4.1%) | 2,770 (4.3%) |
| $55,000 to $64,999 | 4,976 (7.6%) | 4,087 (6.3%) |
| $65,000 to $74,999 | 3,207 (4.9%) | 2,973 (4.6%) |
| $75,000 to $99,999 | 6,212 (9.5%) | 4,065 (6.3%) |
| $100,000+ | 11,892 (18.1%) | 5,759 (8.9%) |
| Total | 65,522 (100.0%) | 64,439 (100.0%) |
Earnings by Sex by Educational Attainment in New Hanover County
Average earnings in New Hanover County are $51,940 for men and $41,508 for women, a difference of 20.1%. Men with an educational attainment of graduate degree enjoy the highest average annual earnings of $90,587, while those with less than high school education earn the least with $24,537. Women with an educational attainment of graduate degree earn the most with the average annual earnings of $62,988, while those with less than high school education have the smallest earnings of $16,498.
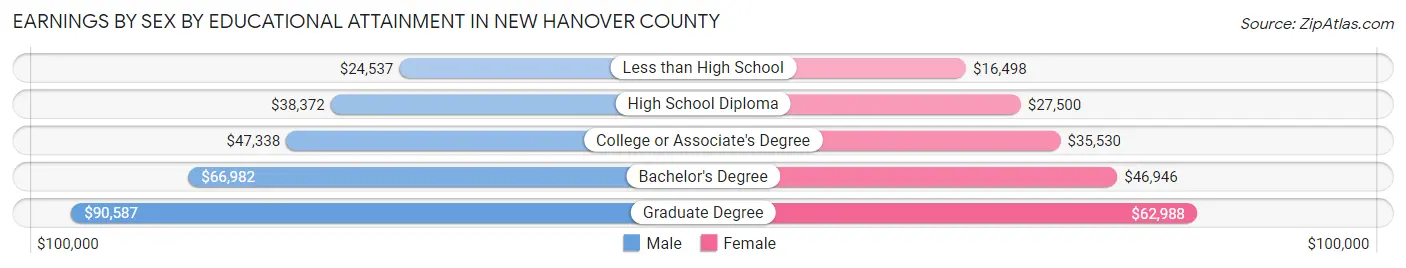
| Educational Attainment | Male Income | Female Income |
| Less than High School | $24,537 | $16,498 |
| High School Diploma | $38,372 | $27,500 |
| College or Associate's Degree | $47,338 | $35,530 |
| Bachelor's Degree | $66,982 | $46,946 |
| Graduate Degree | $90,587 | $62,988 |
| Total | $51,940 | $41,508 |
Family Income in New Hanover County
Family Income Brackets in New Hanover County
According to the New Hanover County family income data, there are 11,829 families falling into the $100,000 to $149,999 income range, which is the most common income bracket and makes up 21.3% of all families. Conversely, the $10,000 to $14,999 income bracket is the least frequent group with only 1,055 families (1.9%) belonging to this category.
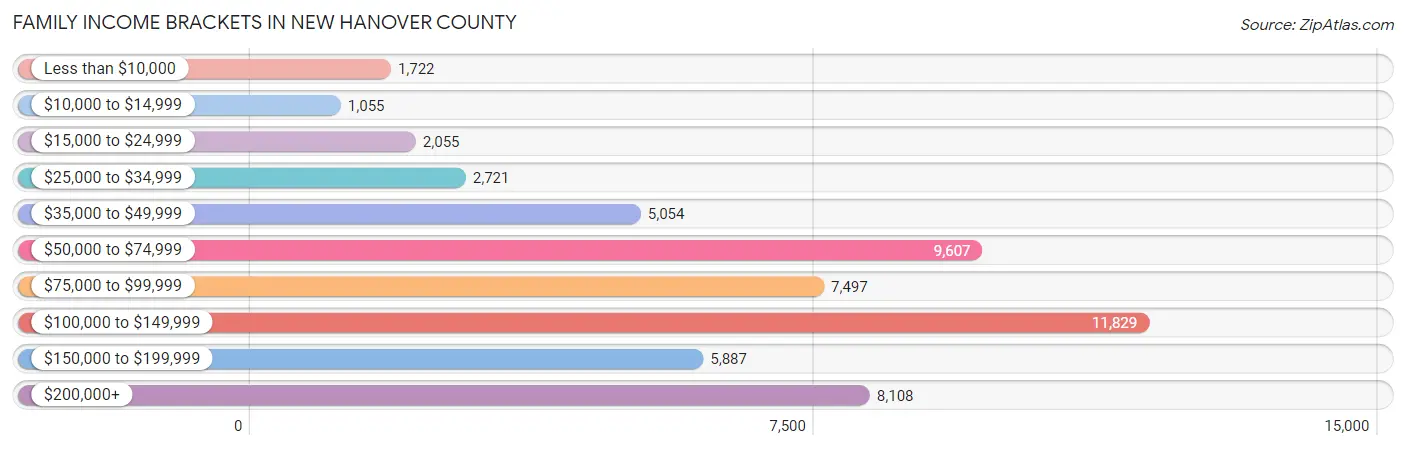
| Income Bracket | # Families | % Families |
| Less than $10,000 | 1,722 | 3.1% |
| $10,000 to $14,999 | 1,055 | 1.9% |
| $15,000 to $24,999 | 2,055 | 3.7% |
| $25,000 to $34,999 | 2,721 | 4.9% |
| $35,000 to $49,999 | 5,054 | 9.1% |
| $50,000 to $74,999 | 9,607 | 17.3% |
| $75,000 to $99,999 | 7,497 | 13.5% |
| $100,000 to $149,999 | 11,829 | 21.3% |
| $150,000 to $199,999 | 5,887 | 10.6% |
| $200,000+ | 8,108 | 14.6% |
Family Income by Famaliy Size in New Hanover County
7+ person families (238 | 0.4%) account for the highest median family income in New Hanover County with $133,056 per family, while 2-person families (31,547 | 56.8%) have the highest median income of $41,758 per family member.
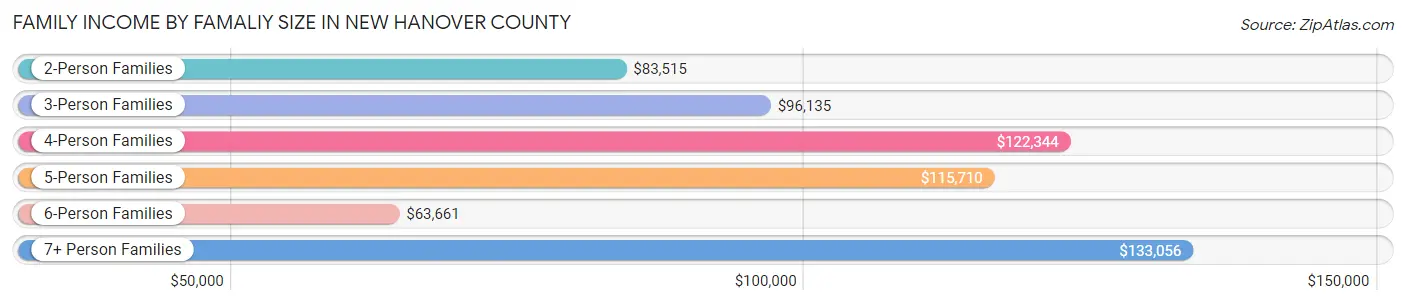
| Income Bracket | # Families | Median Income |
| 2-Person Families | 31,547 (56.8%) | $83,515 |
| 3-Person Families | 11,516 (20.7%) | $96,135 |
| 4-Person Families | 8,545 (15.4%) | $122,344 |
| 5-Person Families | 2,816 (5.1%) | $115,710 |
| 6-Person Families | 872 (1.6%) | $63,661 |
| 7+ Person Families | 238 (0.4%) | $133,056 |
| Total | 55,534 (100.0%) | $92,806 |
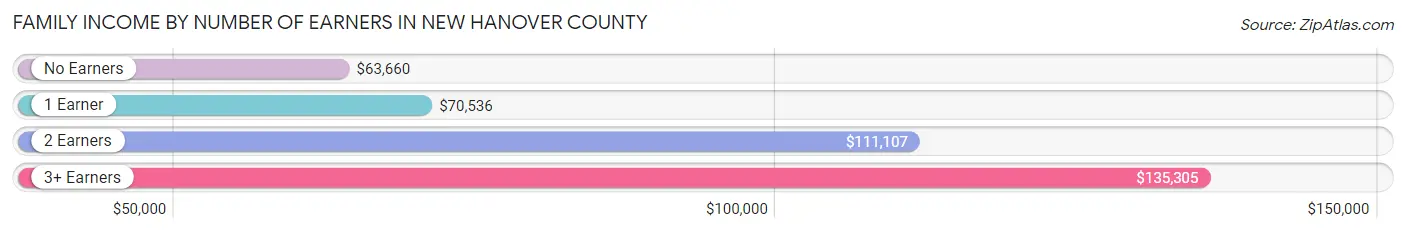
Family Income by Number of Earners in New Hanover County
The median family income in New Hanover County is $92,806, with families comprising 3+ earners (4,333) having the highest median family income of $135,305, while families with no earners (9,968) have the lowest median family income of $63,660, accounting for 7.8% and 17.9% of families, respectively.
| Number of Earners | # Families | Median Income |
| No Earners | 9,968 (17.9%) | $63,660 |
| 1 Earner | 16,511 (29.7%) | $70,536 |
| 2 Earners | 24,722 (44.5%) | $111,107 |
| 3+ Earners | 4,333 (7.8%) | $135,305 |
| Total | 55,534 (100.0%) | $92,806 |
Household Income in New Hanover County
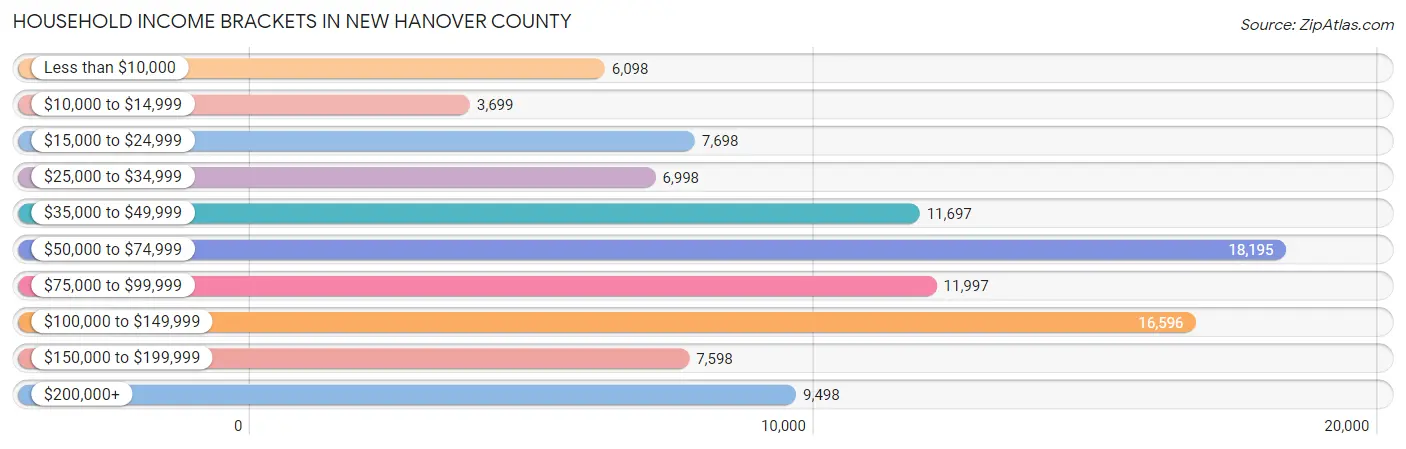
Household Income Brackets in New Hanover County
With 18,195 households falling in the category, the $50,000 to $74,999 income range is the most frequent in New Hanover County, accounting for 18.2% of all households. In contrast, only 3,699 households (3.7%) fall into the $10,000 to $14,999 income bracket, making it the least populous group.
| Income Bracket | # Households | % Households |
| Less than $10,000 | 6,098 | 6.1% |
| $10,000 to $14,999 | 3,699 | 3.7% |
| $15,000 to $24,999 | 7,698 | 7.7% |
| $25,000 to $34,999 | 6,998 | 7.0% |
| $35,000 to $49,999 | 11,697 | 11.7% |
| $50,000 to $74,999 | 18,195 | 18.2% |
| $75,000 to $99,999 | 11,997 | 12.0% |
| $100,000 to $149,999 | 16,596 | 16.6% |
| $150,000 to $199,999 | 7,598 | 7.6% |
| $200,000+ | 9,498 | 9.5% |
Household Income by Householder Age in New Hanover County
The median household income in New Hanover County is $67,515, with the highest median household income of $82,350 found in the 45 to 64 years age bracket for the primary householder. A total of 33,914 households (33.9%) fall into this category. Meanwhile, the 15 to 24 years age bracket for the primary householder has the lowest median household income of $33,147, with 7,496 households (7.5%) in this group.

| Income Bracket | # Households | Median Income |
| 15 to 24 Years | 7,496 (7.5%) | $33,147 |
| 25 to 44 Years | 30,759 (30.8%) | $76,267 |
| 45 to 64 Years | 33,914 (33.9%) | $82,350 |
| 65+ Years | 27,806 (27.8%) | $58,985 |
| Total | 99,975 (100.0%) | $67,515 |
Poverty in New Hanover County
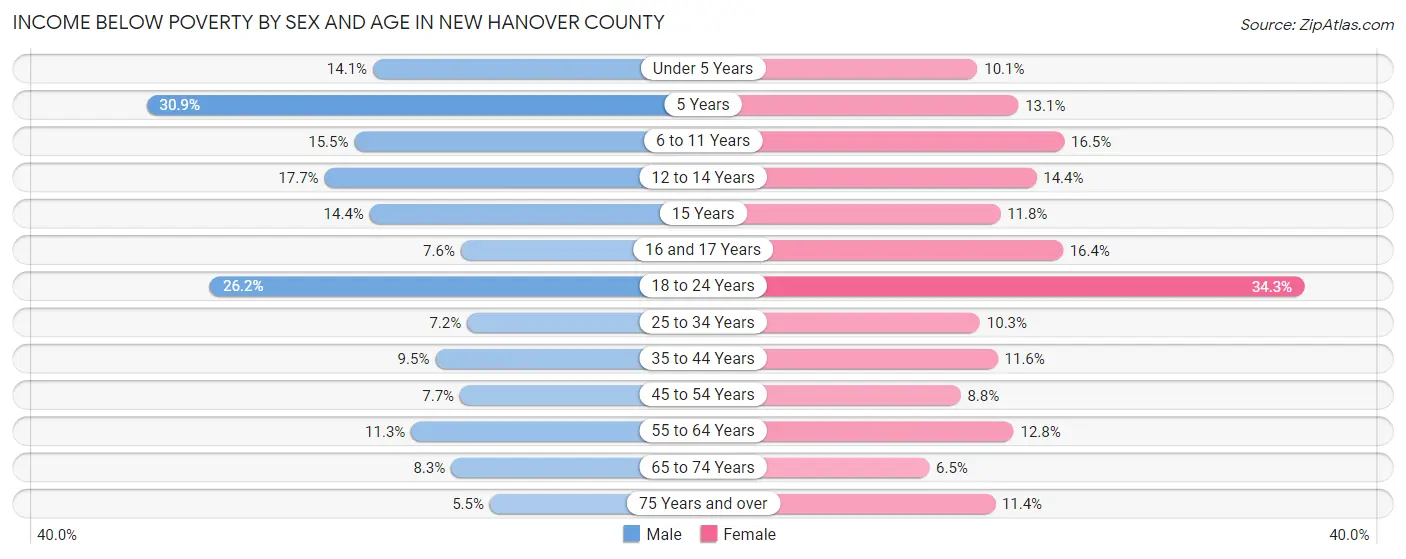
Income Below Poverty by Sex and Age in New Hanover County
With 11.8% poverty level for males and 13.5% for females among the residents of New Hanover County, 5 year old males and 18 to 24 year old females are the most vulnerable to poverty, with 332 males (30.9%) and 4,331 females (34.3%) in their respective age groups living below the poverty level.
| Age Bracket | Male | Female |
| Under 5 Years | 756 (14.1%) | 519 (10.1%) |
| 5 Years | 332 (30.9%) | 150 (13.1%) |
| 6 to 11 Years | 1,161 (15.5%) | 1,127 (16.5%) |
| 12 to 14 Years | 557 (17.7%) | 472 (14.4%) |
| 15 Years | 234 (14.4%) | 152 (11.8%) |
| 16 and 17 Years | 163 (7.6%) | 360 (16.4%) |
| 18 to 24 Years | 3,159 (26.2%) | 4,331 (34.3%) |
| 25 to 34 Years | 1,021 (7.1%) | 1,528 (10.2%) |
| 35 to 44 Years | 1,309 (9.5%) | 1,691 (11.6%) |
| 45 to 54 Years | 1,053 (7.7%) | 1,251 (8.8%) |
| 55 to 64 Years | 1,559 (11.3%) | 2,041 (12.8%) |
| 65 to 74 Years | 936 (8.3%) | 909 (6.5%) |
| 75 Years and over | 373 (5.5%) | 1,053 (11.4%) |
| Total | 12,613 (11.8%) | 15,584 (13.5%) |
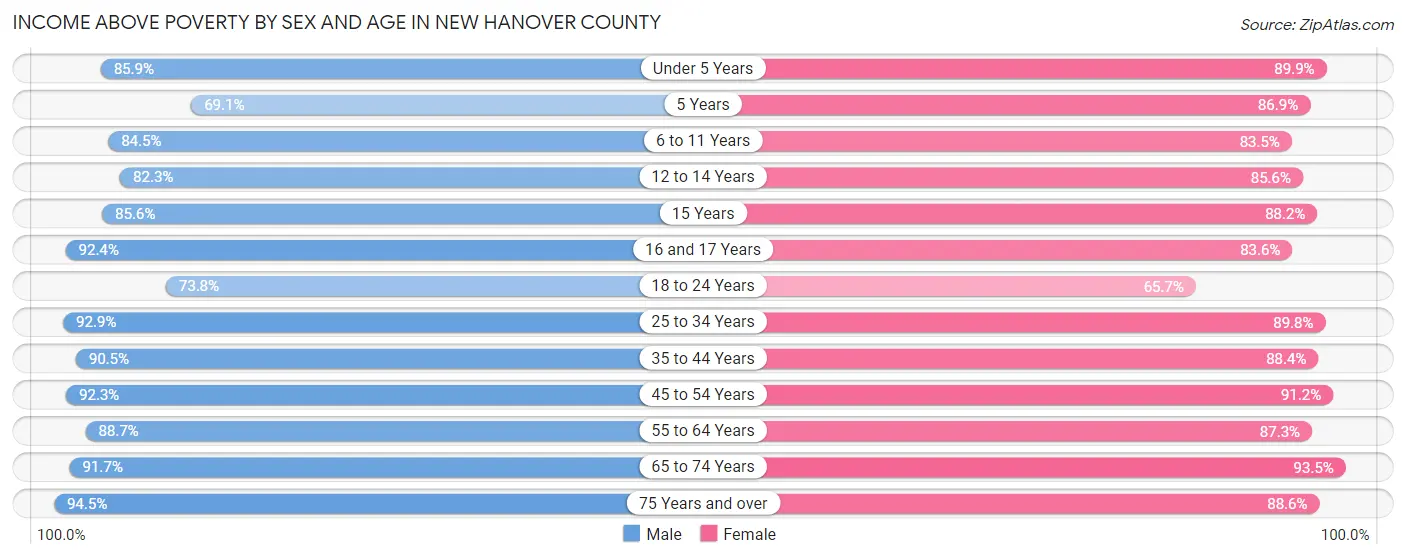
Income Above Poverty by Sex and Age in New Hanover County
According to the poverty statistics in New Hanover County, males aged 75 years and over and females aged 65 to 74 years are the age groups that are most secure financially, with 94.5% of males and 93.5% of females in these age groups living above the poverty line.
| Age Bracket | Male | Female |
| Under 5 Years | 4,589 (85.9%) | 4,638 (89.9%) |
| 5 Years | 741 (69.1%) | 995 (86.9%) |
| 6 to 11 Years | 6,322 (84.5%) | 5,704 (83.5%) |
| 12 to 14 Years | 2,582 (82.3%) | 2,797 (85.6%) |
| 15 Years | 1,393 (85.6%) | 1,140 (88.2%) |
| 16 and 17 Years | 1,977 (92.4%) | 1,835 (83.6%) |
| 18 to 24 Years | 8,886 (73.8%) | 8,293 (65.7%) |
| 25 to 34 Years | 13,268 (92.8%) | 13,381 (89.7%) |
| 35 to 44 Years | 12,459 (90.5%) | 12,925 (88.4%) |
| 45 to 54 Years | 12,657 (92.3%) | 12,942 (91.2%) |
| 55 to 64 Years | 12,240 (88.7%) | 13,964 (87.3%) |
| 65 to 74 Years | 10,287 (91.7%) | 13,117 (93.5%) |
| 75 Years and over | 6,460 (94.5%) | 8,210 (88.6%) |
| Total | 93,861 (88.1%) | 99,941 (86.5%) |
Income Below Poverty Among Married-Couple Families in New Hanover County
The poverty statistics for married-couple families in New Hanover County show that 3.0% or 1,296 of the total 43,265 families live below the poverty line. Families with 3 or 4 children have the highest poverty rate of 6.0%, comprising of 154 families. On the other hand, families with 5 or more children have the lowest poverty rate of 0.0%, which includes 0 families.
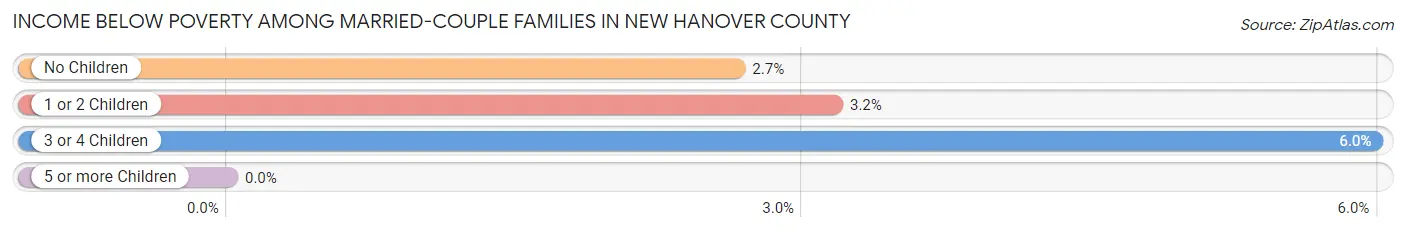
| Children | Above Poverty | Below Poverty |
| No Children | 27,315 (97.4%) | 744 (2.6%) |
| 1 or 2 Children | 12,212 (96.8%) | 398 (3.2%) |
| 3 or 4 Children | 2,423 (94.0%) | 154 (6.0%) |
| 5 or more Children | 19 (100.0%) | 0 (0.0%) |
| Total | 41,969 (97.0%) | 1,296 (3.0%) |
Income Below Poverty Among Single-Parent Households in New Hanover County
According to the poverty data in New Hanover County, 12.0% or 394 single-father households and 25.7% or 2,307 single-mother households are living below the poverty line. Among single-father households, those with 3 or 4 children have the highest poverty rate, with 18 households (19.4%) experiencing poverty. Likewise, among single-mother households, those with 5 or more children have the highest poverty rate, with 69 households (100.0%) falling below the poverty line.

| Children | Single Father | Single Mother |
| No Children | 180 (10.5%) | 362 (10.3%) |
| 1 or 2 Children | 196 (13.3%) | 1,360 (29.7%) |
| 3 or 4 Children | 18 (19.4%) | 516 (61.6%) |
| 5 or more Children | 0 (0.0%) | 69 (100.0%) |
| Total | 394 (12.0%) | 2,307 (25.7%) |
Income Below Poverty Among Married-Couple vs Single-Parent Households in New Hanover County
The poverty data for New Hanover County shows that 1,296 of the married-couple family households (3.0%) and 2,701 of the single-parent households (22.0%) are living below the poverty level. Within the married-couple family households, those with 3 or 4 children have the highest poverty rate, with 154 households (6.0%) falling below the poverty line. Among the single-parent households, those with 5 or more children have the highest poverty rate, with 69 household (100.0%) living below poverty.
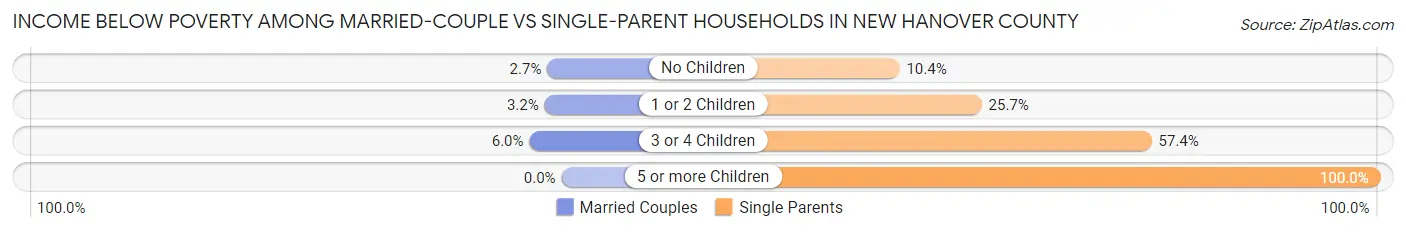
| Children | Married-Couple Families | Single-Parent Households |
| No Children | 744 (2.6%) | 542 (10.4%) |
| 1 or 2 Children | 398 (3.2%) | 1,556 (25.7%) |
| 3 or 4 Children | 154 (6.0%) | 534 (57.4%) |
| 5 or more Children | 0 (0.0%) | 69 (100.0%) |
| Total | 1,296 (3.0%) | 2,701 (22.0%) |
Employment Characteristics in New Hanover County
Employment by Class of Employer in New Hanover County
Among the 115,016 employed individuals in New Hanover County, private company employees (75,685 | 65.8%), self-employed (not incorporated) (9,547 | 8.3%), and not-for-profit organizations (8,662 | 7.5%) make up the most common classes of employment.

| Employer Class | # Employees | % Employees |
| Private Company Employees | 75,685 | 65.8% |
| Self-Employed (Incorporated) | 6,627 | 5.8% |
| Self-Employed (Not Incorporated) | 9,547 | 8.3% |
| Not-for-profit Organizations | 8,662 | 7.5% |
| Local Government Employees | 5,924 | 5.1% |
| State Government Employees | 5,775 | 5.0% |
| Federal Government Employees | 2,477 | 2.1% |
| Unpaid Family Workers | 319 | 0.3% |
| Total | 115,016 | 100.0% |
Employment Status by Age in New Hanover County
According to the labor force statistics for New Hanover County, out of the total population over 16 years of age (191,340), 64.6% or 123,606 individuals are in the labor force, with 4.8% or 5,933 of them unemployed. The age group with the highest labor force participation rate is 25 to 29 years, with 91.4% or 14,154 individuals in the labor force. Within the labor force, the 16 to 19 years age range has the highest percentage of unemployed individuals, with 15.1% or 755 of them being unemployed.
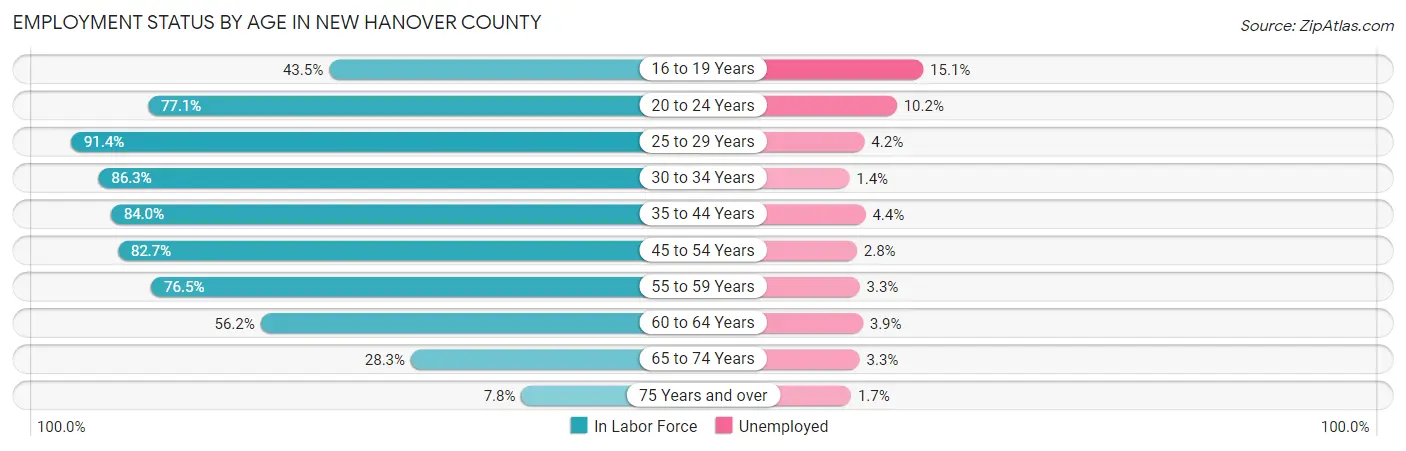
| Age Bracket | In Labor Force | Unemployed |
| 16 to 19 Years | 4,998 (43.5%) | 755 (15.1%) |
| 20 to 24 Years | 16,385 (77.1%) | 1,671 (10.2%) |
| 25 to 29 Years | 14,154 (91.4%) | 594 (4.2%) |
| 30 to 34 Years | 12,216 (86.3%) | 171 (1.4%) |
| 35 to 44 Years | 24,111 (84.0%) | 1,061 (4.4%) |
| 45 to 54 Years | 23,221 (82.7%) | 650 (2.8%) |
| 55 to 59 Years | 11,661 (76.5%) | 385 (3.3%) |
| 60 to 64 Years | 8,251 (56.2%) | 322 (3.9%) |
| 65 to 74 Years | 7,208 (28.3%) | 238 (3.3%) |
| 75 Years and over | 1,309 (7.8%) | 22 (1.7%) |
| Total | 123,606 (64.6%) | 5,933 (4.8%) |
Employment Status by Educational Attainment in New Hanover County
According to labor force statistics for New Hanover County, 80.5% of individuals (93,659) out of the total population between 25 and 64 years of age (116,347) are in the labor force, with 3.4% or 3,184 of them being unemployed. The group with the highest labor force participation rate are those with the educational attainment of bachelor's degree or higher, with 86.7% or 45,266 individuals in the labor force. Within the labor force, individuals with less than high school education have the highest percentage of unemployment, with 4.6% or 220 of them being unemployed.
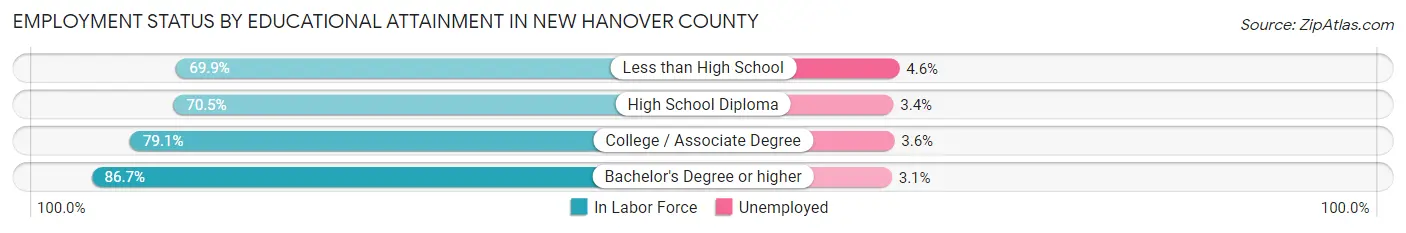
| Educational Attainment | In Labor Force | Unemployed |
| Less than High School | 4,792 (69.9%) | 315 (4.6%) |
| High School Diploma | 14,450 (70.5%) | 697 (3.4%) |
| College / Associate Degree | 29,096 (79.1%) | 1,324 (3.6%) |
| Bachelor's Degree or higher | 45,266 (86.7%) | 1,619 (3.1%) |
| Total | 93,659 (80.5%) | 3,956 (3.4%) |
Employment Occupations by Sex in New Hanover County
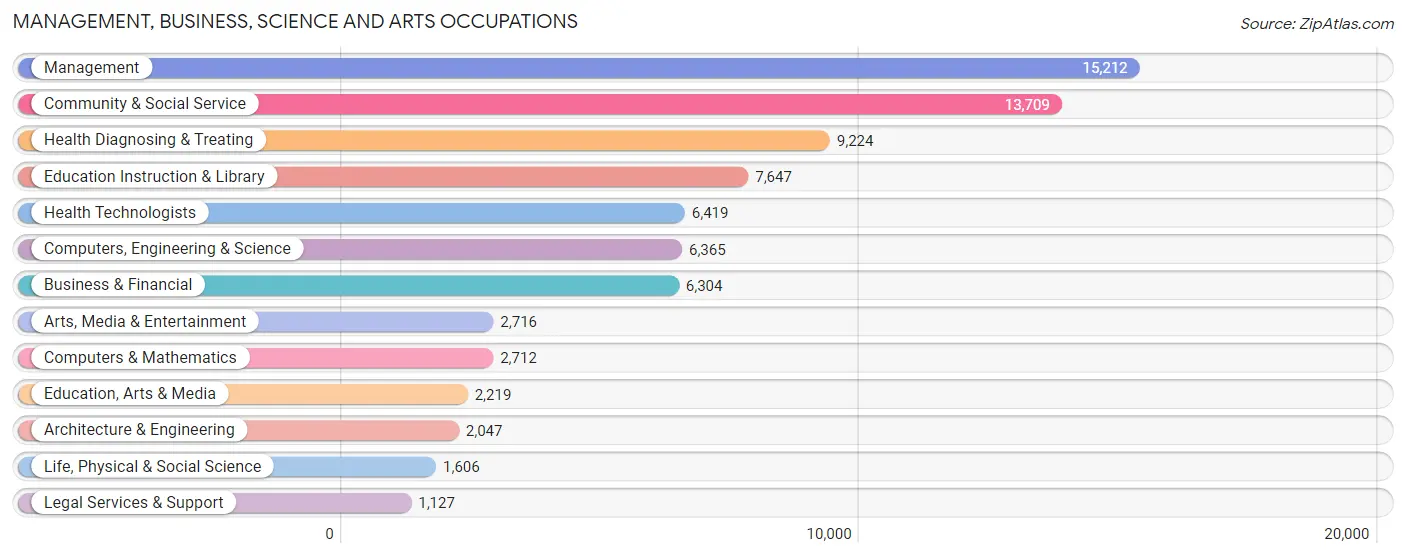
Management, Business, Science and Arts Occupations
The most common Management, Business, Science and Arts occupations in New Hanover County are Management (15,212 | 13.0%), Community & Social Service (13,709 | 11.7%), Health Diagnosing & Treating (9,224 | 7.9%), Education Instruction & Library (7,647 | 6.5%), and Health Technologists (6,419 | 5.5%).
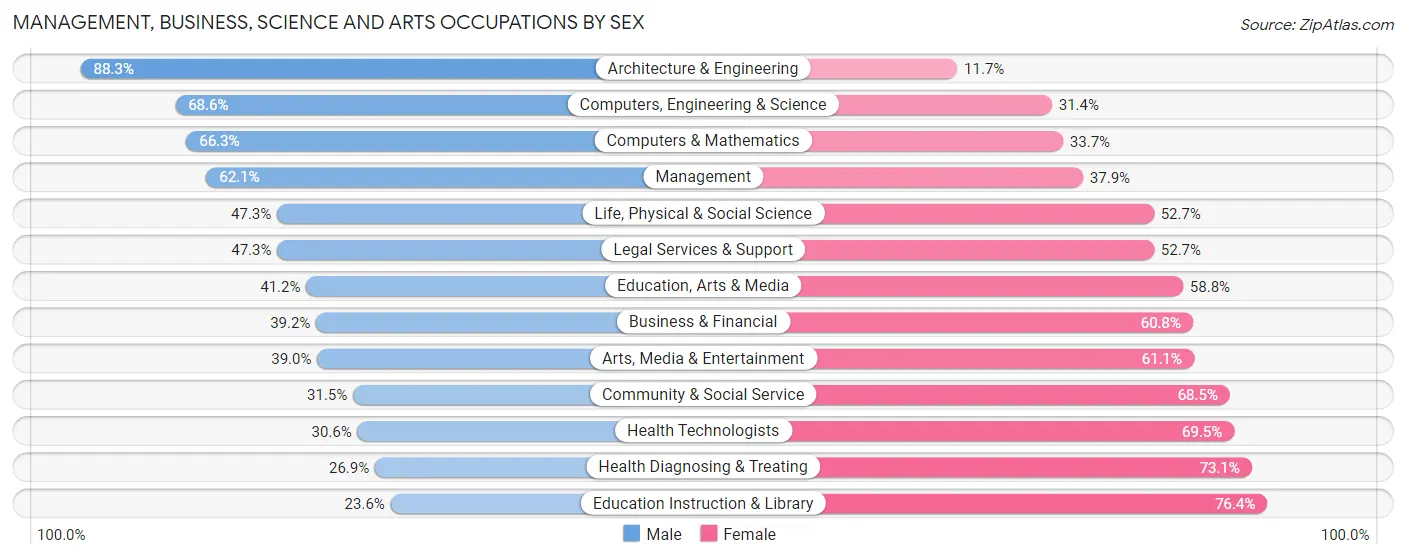
Management, Business, Science and Arts Occupations by Sex
Within the Management, Business, Science and Arts occupations in New Hanover County, the most male-oriented occupations are Architecture & Engineering (88.3%), Computers, Engineering & Science (68.6%), and Computers & Mathematics (66.3%), while the most female-oriented occupations are Education Instruction & Library (76.4%), Health Diagnosing & Treating (73.1%), and Health Technologists (69.5%).
| Occupation | Male | Female |
| Management | 9,445 (62.1%) | 5,767 (37.9%) |
| Business & Financial | 2,469 (39.2%) | 3,835 (60.8%) |
| Computers, Engineering & Science | 4,365 (68.6%) | 2,000 (31.4%) |
| Computers & Mathematics | 1,797 (66.3%) | 915 (33.7%) |
| Architecture & Engineering | 1,808 (88.3%) | 239 (11.7%) |
| Life, Physical & Social Science | 760 (47.3%) | 846 (52.7%) |
| Community & Social Service | 4,314 (31.5%) | 9,395 (68.5%) |
| Education, Arts & Media | 915 (41.2%) | 1,304 (58.8%) |
| Legal Services & Support | 533 (47.3%) | 594 (52.7%) |
| Education Instruction & Library | 1,808 (23.6%) | 5,839 (76.4%) |
| Arts, Media & Entertainment | 1,058 (39.0%) | 1,658 (61.1%) |
| Health Diagnosing & Treating | 2,480 (26.9%) | 6,744 (73.1%) |
| Health Technologists | 1,961 (30.5%) | 4,458 (69.5%) |
| Total (Category) | 23,073 (45.4%) | 27,741 (54.6%) |
| Total (Overall) | 58,790 (50.2%) | 58,221 (49.8%) |
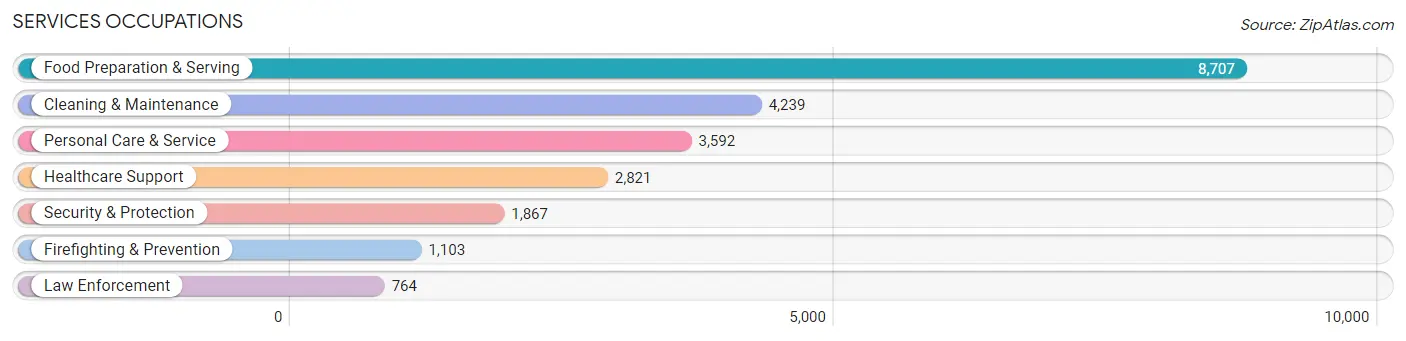
Services Occupations
The most common Services occupations in New Hanover County are Food Preparation & Serving (8,707 | 7.4%), Cleaning & Maintenance (4,239 | 3.6%), Personal Care & Service (3,592 | 3.1%), Healthcare Support (2,821 | 2.4%), and Security & Protection (1,867 | 1.6%).
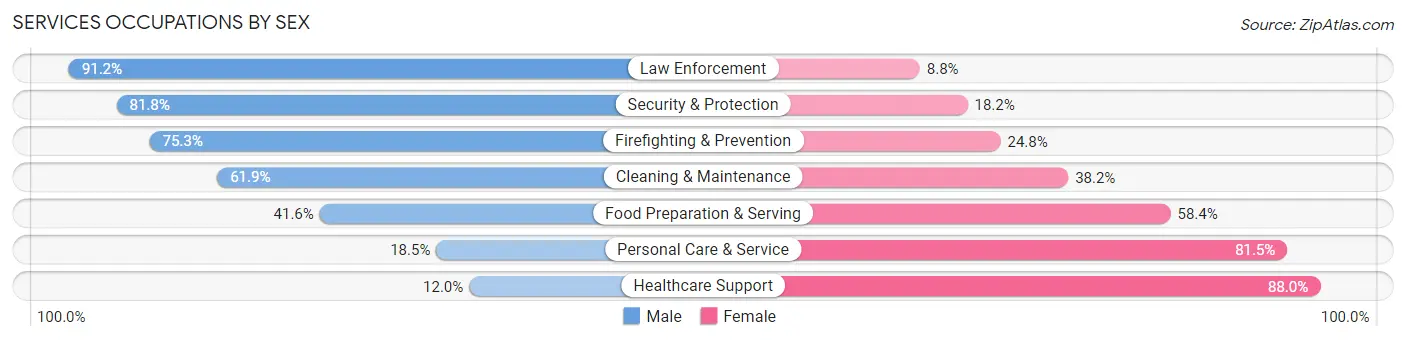
Services Occupations by Sex
Within the Services occupations in New Hanover County, the most male-oriented occupations are Law Enforcement (91.2%), Security & Protection (81.8%), and Firefighting & Prevention (75.2%), while the most female-oriented occupations are Healthcare Support (88.0%), Personal Care & Service (81.5%), and Food Preparation & Serving (58.4%).
| Occupation | Male | Female |
| Healthcare Support | 338 (12.0%) | 2,483 (88.0%) |
| Security & Protection | 1,527 (81.8%) | 340 (18.2%) |
| Firefighting & Prevention | 830 (75.2%) | 273 (24.7%) |
| Law Enforcement | 697 (91.2%) | 67 (8.8%) |
| Food Preparation & Serving | 3,620 (41.6%) | 5,087 (58.4%) |
| Cleaning & Maintenance | 2,622 (61.9%) | 1,617 (38.2%) |
| Personal Care & Service | 664 (18.5%) | 2,928 (81.5%) |
| Total (Category) | 8,771 (41.3%) | 12,455 (58.7%) |
| Total (Overall) | 58,790 (50.2%) | 58,221 (49.8%) |
Sales and Office Occupations
The most common Sales and Office occupations in New Hanover County are Sales & Related (14,062 | 12.0%), and Office & Administration (11,173 | 9.6%).

Sales and Office Occupations by Sex
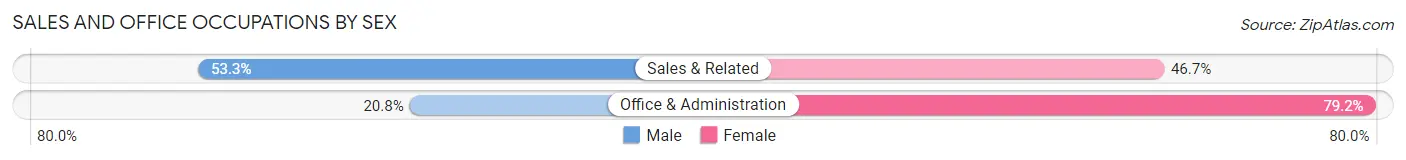
| Occupation | Male | Female |
| Sales & Related | 7,498 (53.3%) | 6,564 (46.7%) |
| Office & Administration | 2,323 (20.8%) | 8,850 (79.2%) |
| Total (Category) | 9,821 (38.9%) | 15,414 (61.1%) |
| Total (Overall) | 58,790 (50.2%) | 58,221 (49.8%) |
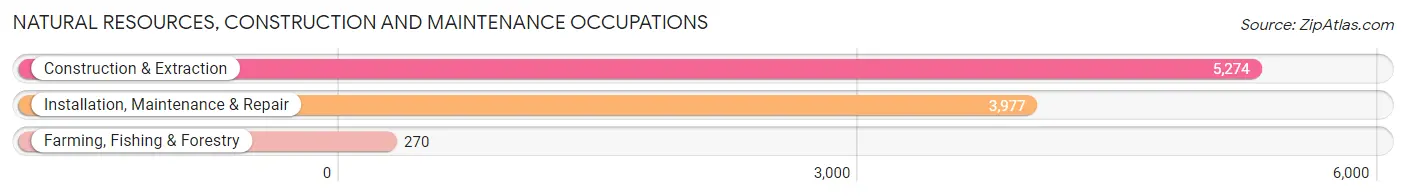
Natural Resources, Construction and Maintenance Occupations
The most common Natural Resources, Construction and Maintenance occupations in New Hanover County are Construction & Extraction (5,274 | 4.5%), Installation, Maintenance & Repair (3,977 | 3.4%), and Farming, Fishing & Forestry (270 | 0.2%).
Natural Resources, Construction and Maintenance Occupations by Sex
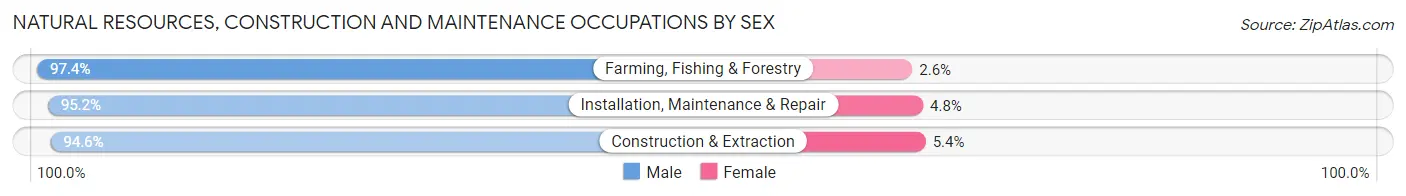
| Occupation | Male | Female |
| Farming, Fishing & Forestry | 263 (97.4%) | 7 (2.6%) |
| Construction & Extraction | 4,991 (94.6%) | 283 (5.4%) |
| Installation, Maintenance & Repair | 3,785 (95.2%) | 192 (4.8%) |
| Total (Category) | 9,039 (94.9%) | 482 (5.1%) |
| Total (Overall) | 58,790 (50.2%) | 58,221 (49.8%) |
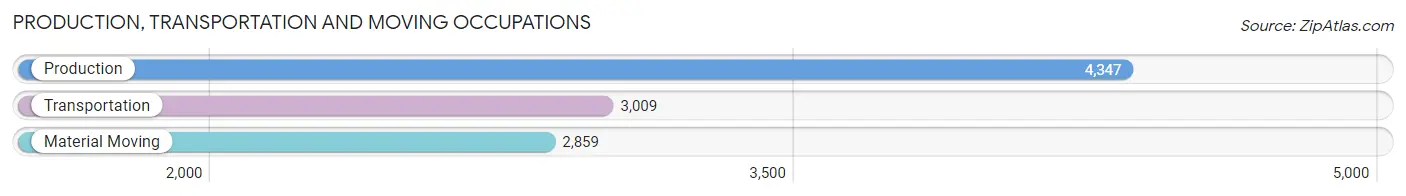
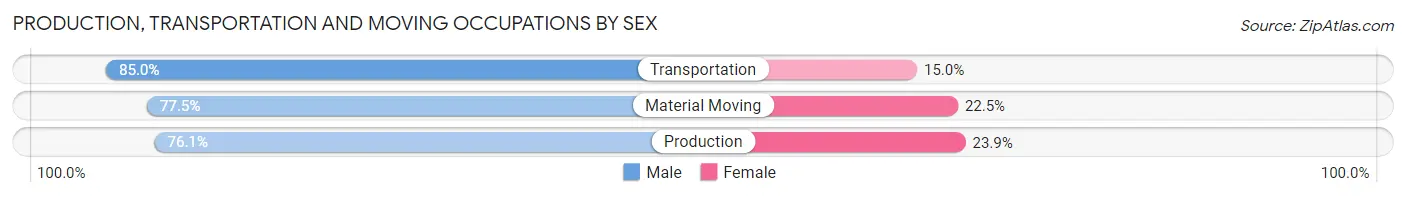
Production, Transportation and Moving Occupations
The most common Production, Transportation and Moving occupations in New Hanover County are Production (4,347 | 3.7%), Transportation (3,009 | 2.6%), and Material Moving (2,859 | 2.4%).
Production, Transportation and Moving Occupations by Sex
| Occupation | Male | Female |
| Production | 3,310 (76.1%) | 1,037 (23.9%) |
| Transportation | 2,559 (85.0%) | 450 (15.0%) |
| Material Moving | 2,217 (77.5%) | 642 (22.5%) |
| Total (Category) | 8,086 (79.2%) | 2,129 (20.8%) |
| Total (Overall) | 58,790 (50.2%) | 58,221 (49.8%) |
Employment Industries by Sex in New Hanover County
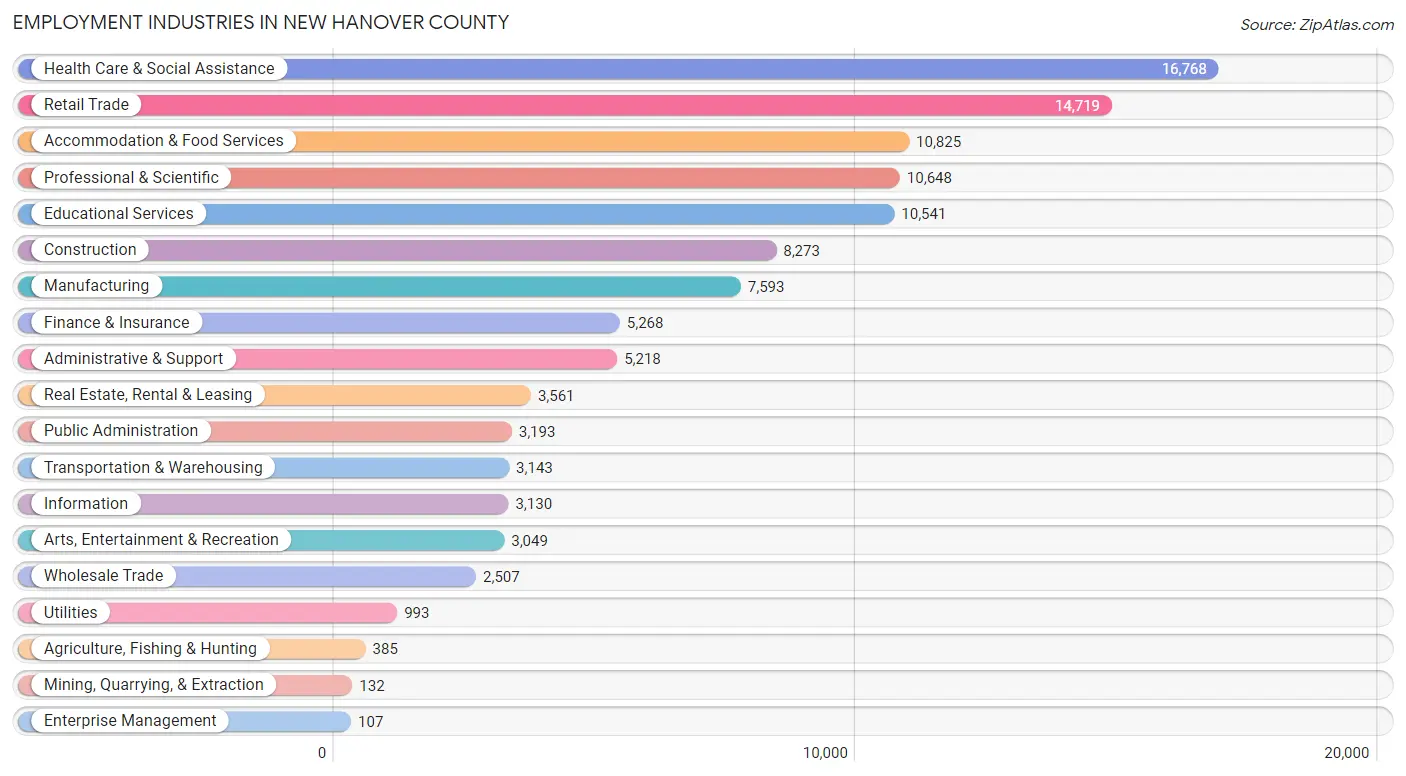
Employment Industries in New Hanover County
The major employment industries in New Hanover County include Health Care & Social Assistance (16,768 | 14.3%), Retail Trade (14,719 | 12.6%), Accommodation & Food Services (10,825 | 9.2%), Professional & Scientific (10,648 | 9.1%), and Educational Services (10,541 | 9.0%).
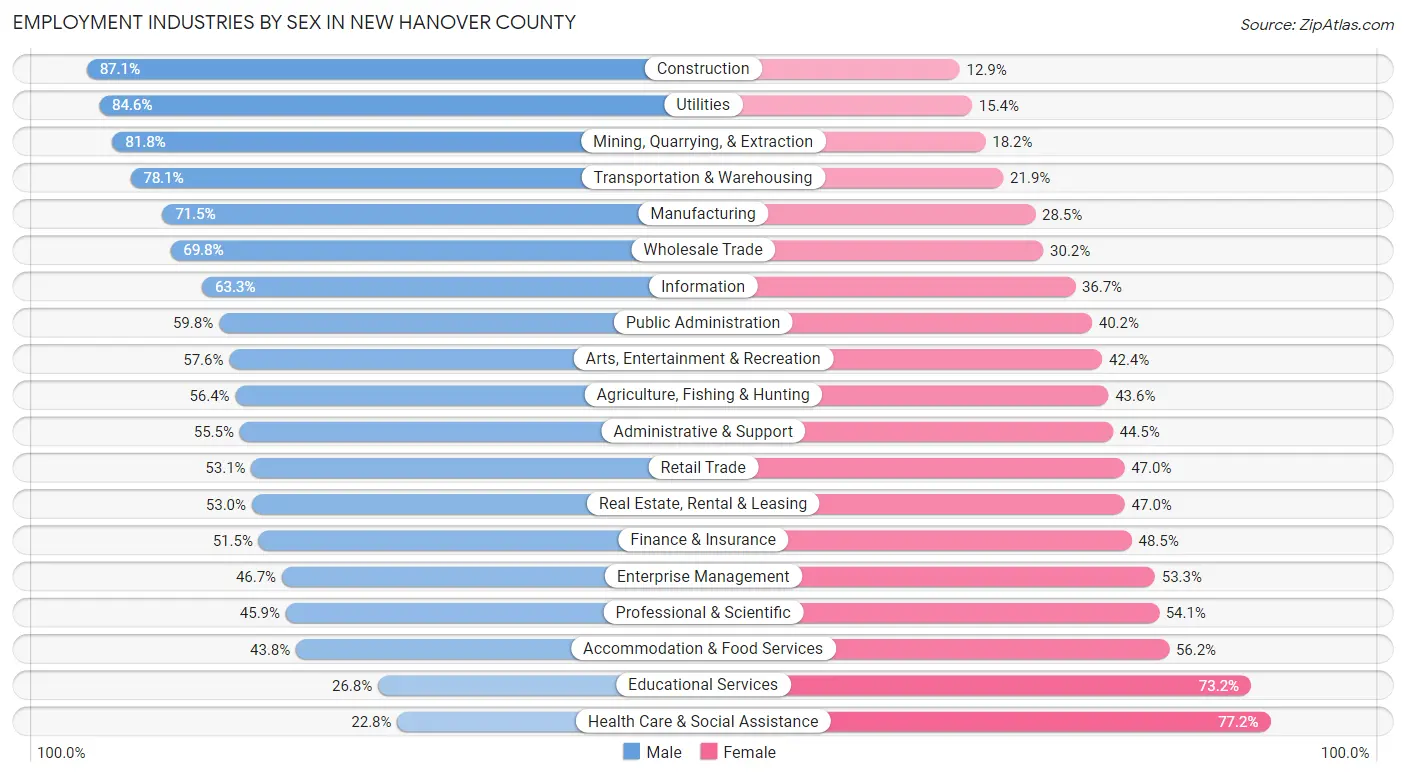
Employment Industries by Sex in New Hanover County
The New Hanover County industries that see more men than women are Construction (87.1%), Utilities (84.6%), and Mining, Quarrying, & Extraction (81.8%), whereas the industries that tend to have a higher number of women are Health Care & Social Assistance (77.2%), Educational Services (73.2%), and Accommodation & Food Services (56.2%).
| Industry | Male | Female |
| Agriculture, Fishing & Hunting | 217 (56.4%) | 168 (43.6%) |
| Mining, Quarrying, & Extraction | 108 (81.8%) | 24 (18.2%) |
| Construction | 7,208 (87.1%) | 1,065 (12.9%) |
| Manufacturing | 5,429 (71.5%) | 2,164 (28.5%) |
| Wholesale Trade | 1,751 (69.8%) | 756 (30.2%) |
| Retail Trade | 7,808 (53.0%) | 6,911 (46.9%) |
| Transportation & Warehousing | 2,455 (78.1%) | 688 (21.9%) |
| Utilities | 840 (84.6%) | 153 (15.4%) |
| Information | 1,980 (63.3%) | 1,150 (36.7%) |
| Finance & Insurance | 2,715 (51.5%) | 2,553 (48.5%) |
| Real Estate, Rental & Leasing | 1,886 (53.0%) | 1,675 (47.0%) |
| Professional & Scientific | 4,890 (45.9%) | 5,758 (54.1%) |
| Enterprise Management | 50 (46.7%) | 57 (53.3%) |
| Administrative & Support | 2,894 (55.5%) | 2,324 (44.5%) |
| Educational Services | 2,829 (26.8%) | 7,712 (73.2%) |
| Health Care & Social Assistance | 3,829 (22.8%) | 12,939 (77.2%) |
| Arts, Entertainment & Recreation | 1,757 (57.6%) | 1,292 (42.4%) |
| Accommodation & Food Services | 4,741 (43.8%) | 6,084 (56.2%) |
| Public Administration | 1,908 (59.8%) | 1,285 (40.2%) |
| Total | 58,790 (50.2%) | 58,221 (49.8%) |
Education in New Hanover County
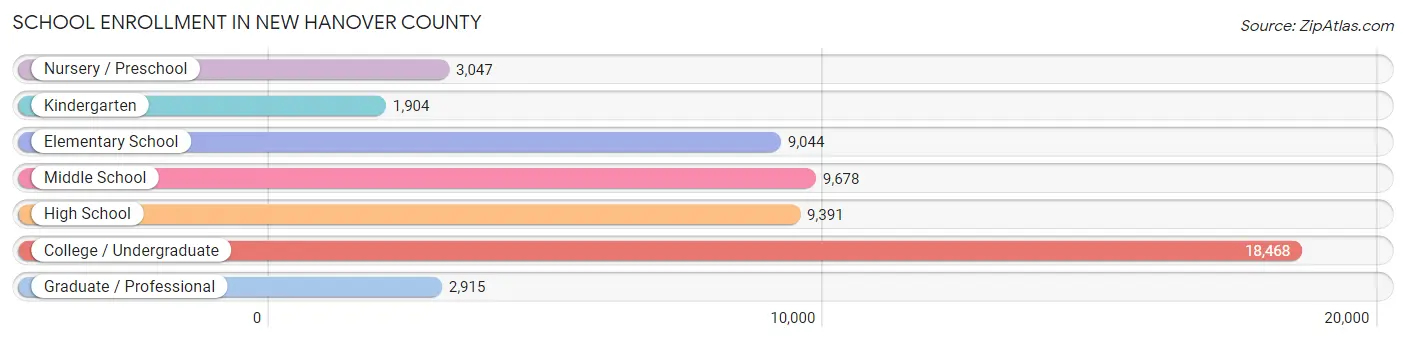
School Enrollment in New Hanover County
The most common levels of schooling among the 54,447 students in New Hanover County are college / undergraduate (18,468 | 33.9%), middle school (9,678 | 17.8%), and high school (9,391 | 17.2%).
| School Level | # Students | % Students |
| Nursery / Preschool | 3,047 | 5.6% |
| Kindergarten | 1,904 | 3.5% |
| Elementary School | 9,044 | 16.6% |
| Middle School | 9,678 | 17.8% |
| High School | 9,391 | 17.2% |
| College / Undergraduate | 18,468 | 33.9% |
| Graduate / Professional | 2,915 | 5.3% |
| Total | 54,447 | 100.0% |
School Enrollment by Age by Funding Source in New Hanover County
Out of a total of 54,447 students who are enrolled in schools in New Hanover County, 8,113 (14.9%) attend a private institution, while the remaining 46,334 (85.1%) are enrolled in public schools. The age group of 3 to 4 year olds has the highest likelihood of being enrolled in private schools, with 1,045 (52.3% in the age bracket) enrolled. Conversely, the age group of 18 to 19 year olds has the lowest likelihood of being enrolled in a private school, with 5,909 (97.3% in the age bracket) attending a public institution.
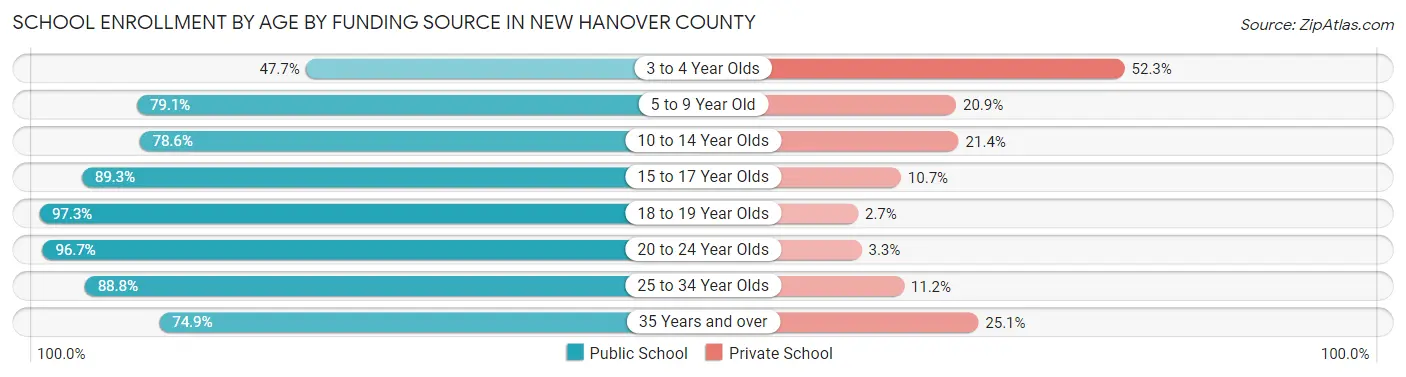
| Age Bracket | Public School | Private School |
| 3 to 4 Year Olds | 952 (47.7%) | 1,045 (52.3%) |
| 5 to 9 Year Old | 8,597 (79.1%) | 2,276 (20.9%) |
| 10 to 14 Year Olds | 9,136 (78.6%) | 2,490 (21.4%) |
| 15 to 17 Year Olds | 6,316 (89.3%) | 754 (10.7%) |
| 18 to 19 Year Olds | 5,909 (97.3%) | 163 (2.7%) |
| 20 to 24 Year Olds | 10,644 (96.7%) | 367 (3.3%) |
| 25 to 34 Year Olds | 2,795 (88.8%) | 353 (11.2%) |
| 35 Years and over | 1,985 (74.9%) | 665 (25.1%) |
| Total | 46,334 (85.1%) | 8,113 (14.9%) |
Educational Attainment by Field of Study in New Hanover County
Business (14,742 | 20.0%), education (8,770 | 11.9%), science & technology (6,130 | 8.3%), bio, nature & agricultural (5,479 | 7.4%), and social sciences (5,140 | 7.0%) are the most common fields of study among 73,861 individuals in New Hanover County who have obtained a bachelor's degree or higher.
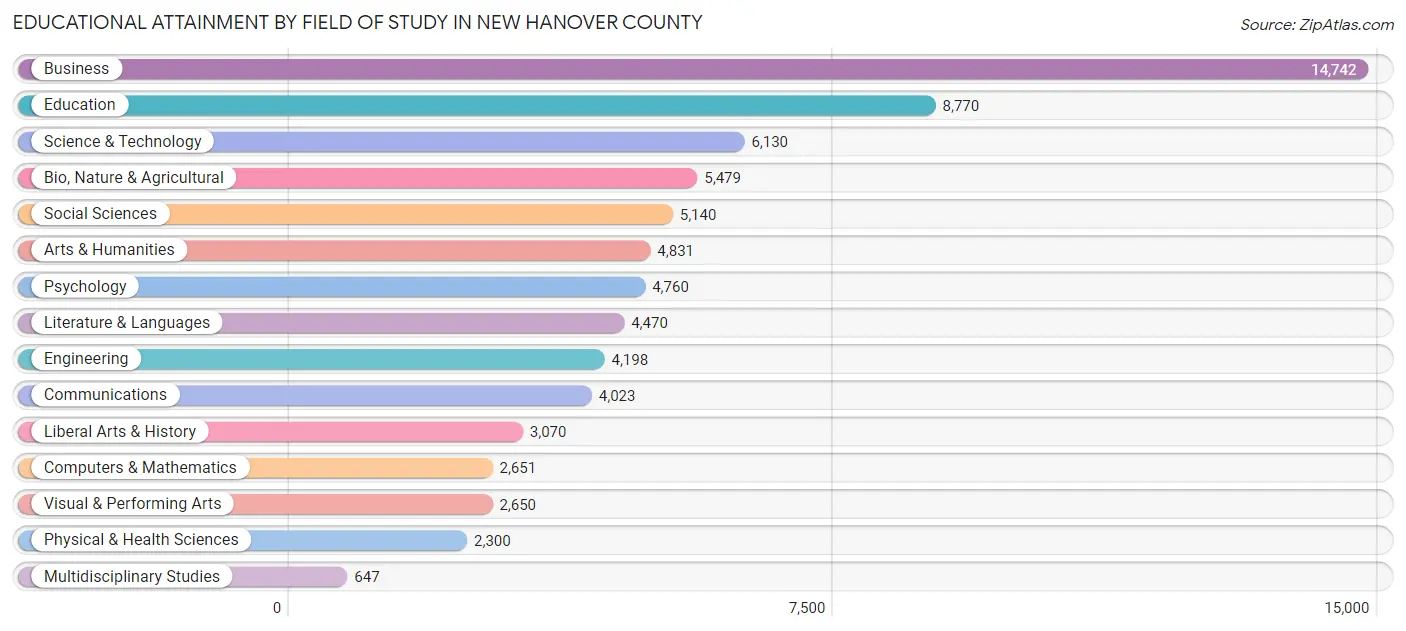
| Field of Study | # Graduates | % Graduates |
| Computers & Mathematics | 2,651 | 3.6% |
| Bio, Nature & Agricultural | 5,479 | 7.4% |
| Physical & Health Sciences | 2,300 | 3.1% |
| Psychology | 4,760 | 6.4% |
| Social Sciences | 5,140 | 7.0% |
| Engineering | 4,198 | 5.7% |
| Multidisciplinary Studies | 647 | 0.9% |
| Science & Technology | 6,130 | 8.3% |
| Business | 14,742 | 20.0% |
| Education | 8,770 | 11.9% |
| Literature & Languages | 4,470 | 6.0% |
| Liberal Arts & History | 3,070 | 4.2% |
| Visual & Performing Arts | 2,650 | 3.6% |
| Communications | 4,023 | 5.4% |
| Arts & Humanities | 4,831 | 6.5% |
| Total | 73,861 | 100.0% |
Transportation & Commute in New Hanover County
Vehicle Availability by Sex in New Hanover County
The most prevalent vehicle ownership categories in New Hanover County are males with 2 vehicles (30,117, accounting for 52.1%) and females with 2 vehicles (25,052, making up 54.1%).
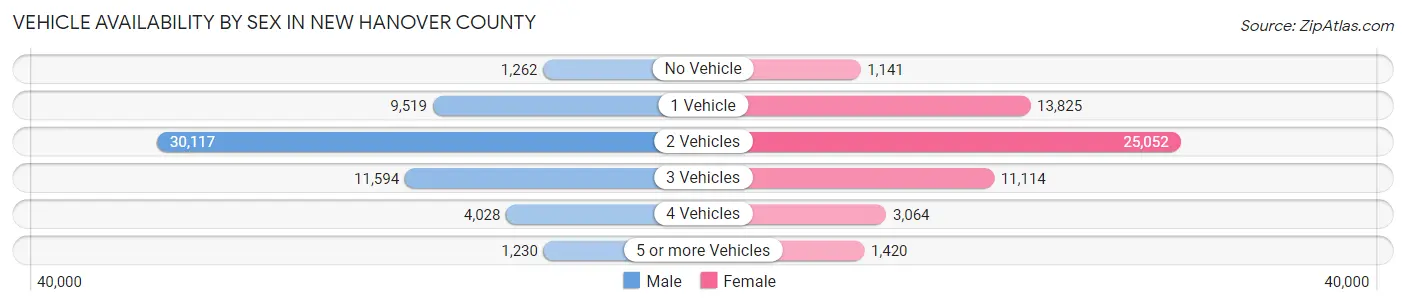
| Vehicles Available | Male | Female |
| No Vehicle | 1,262 (2.2%) | 1,141 (2.1%) |
| 1 Vehicle | 9,519 (16.5%) | 13,825 (24.9%) |
| 2 Vehicles | 30,117 (52.1%) | 25,052 (45.0%) |
| 3 Vehicles | 11,594 (20.1%) | 11,114 (20.0%) |
| 4 Vehicles | 4,028 (7.0%) | 3,064 (5.5%) |
| 5 or more Vehicles | 1,230 (2.1%) | 1,420 (2.5%) |
| Total | 57,750 (100.0%) | 55,616 (100.0%) |
Commute Time in New Hanover County
The most frequently occuring commute durations in New Hanover County are 15 to 19 minutes (22,649 commuters, 23.1%), 10 to 14 minutes (19,524 commuters, 19.9%), and 20 to 24 minutes (17,684 commuters, 18.0%).
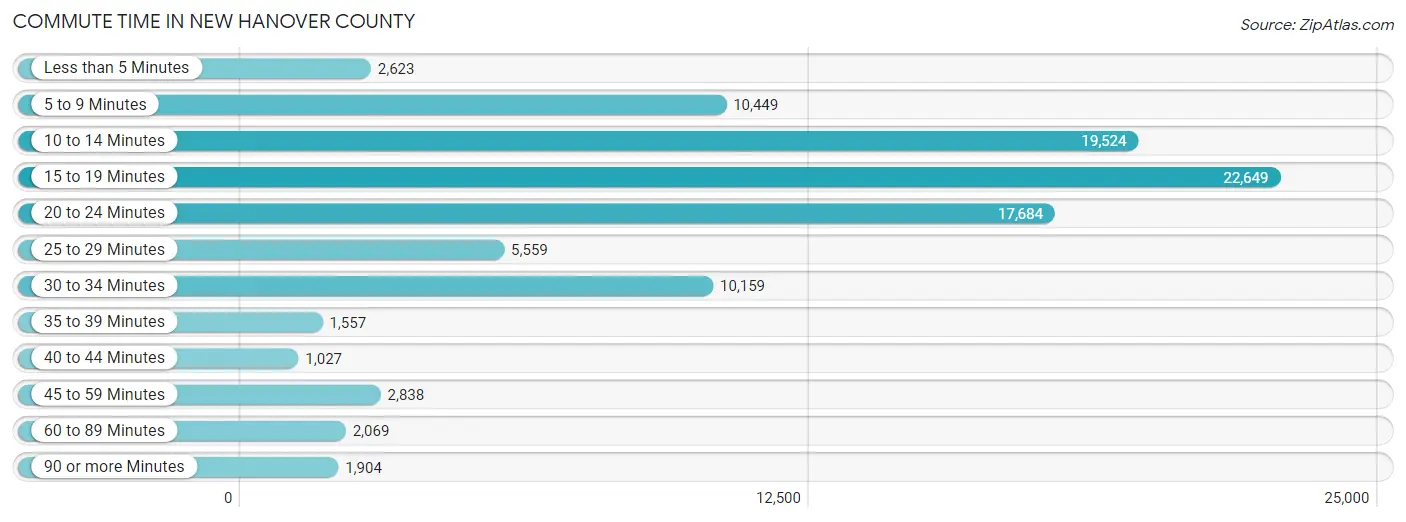
| Commute Time | # Commuters | % Commuters |
| Less than 5 Minutes | 2,623 | 2.7% |
| 5 to 9 Minutes | 10,449 | 10.7% |
| 10 to 14 Minutes | 19,524 | 19.9% |
| 15 to 19 Minutes | 22,649 | 23.1% |
| 20 to 24 Minutes | 17,684 | 18.0% |
| 25 to 29 Minutes | 5,559 | 5.7% |
| 30 to 34 Minutes | 10,159 | 10.4% |
| 35 to 39 Minutes | 1,557 | 1.6% |
| 40 to 44 Minutes | 1,027 | 1.1% |
| 45 to 59 Minutes | 2,838 | 2.9% |
| 60 to 89 Minutes | 2,069 | 2.1% |
| 90 or more Minutes | 1,904 | 1.9% |
Commute Time by Sex in New Hanover County
The most common commute times in New Hanover County are 15 to 19 minutes (11,285 commuters, 22.1%) for males and 15 to 19 minutes (11,364 commuters, 24.2%) for females.
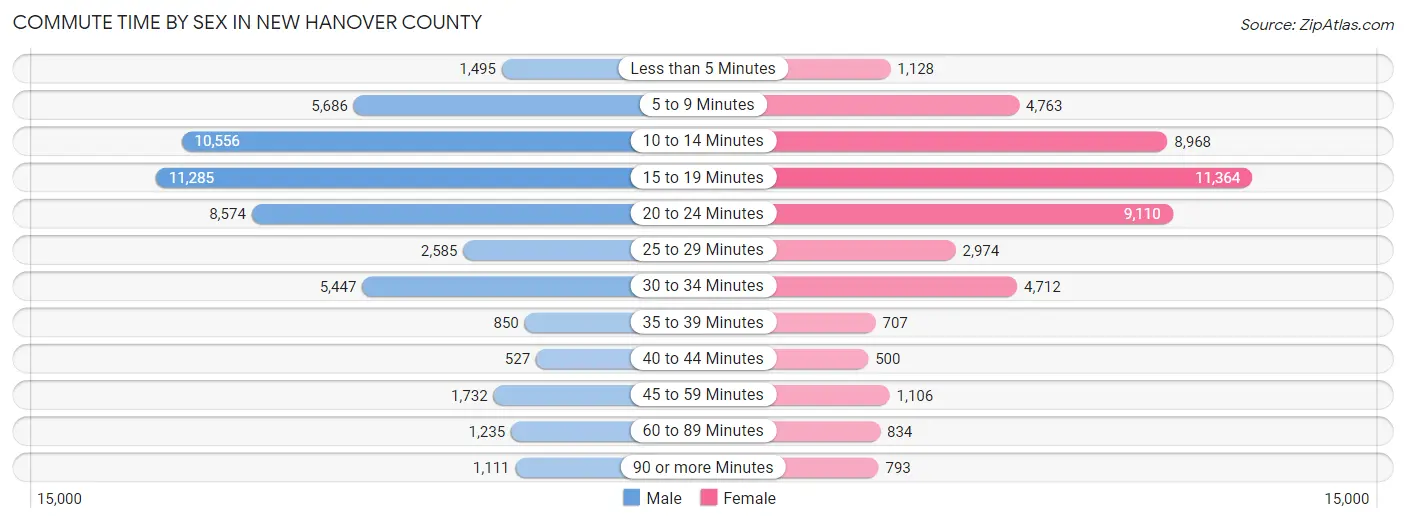
| Commute Time | Male | Female |
| Less than 5 Minutes | 1,495 (2.9%) | 1,128 (2.4%) |
| 5 to 9 Minutes | 5,686 (11.1%) | 4,763 (10.1%) |
| 10 to 14 Minutes | 10,556 (20.7%) | 8,968 (19.1%) |
| 15 to 19 Minutes | 11,285 (22.1%) | 11,364 (24.2%) |
| 20 to 24 Minutes | 8,574 (16.8%) | 9,110 (19.4%) |
| 25 to 29 Minutes | 2,585 (5.1%) | 2,974 (6.3%) |
| 30 to 34 Minutes | 5,447 (10.7%) | 4,712 (10.0%) |
| 35 to 39 Minutes | 850 (1.7%) | 707 (1.5%) |
| 40 to 44 Minutes | 527 (1.0%) | 500 (1.1%) |
| 45 to 59 Minutes | 1,732 (3.4%) | 1,106 (2.4%) |
| 60 to 89 Minutes | 1,235 (2.4%) | 834 (1.8%) |
| 90 or more Minutes | 1,111 (2.2%) | 793 (1.7%) |
Time of Departure to Work by Sex in New Hanover County
The most frequent times of departure to work in New Hanover County are 7:30 AM to 7:59 AM (7,812, 15.3%) for males and 7:30 AM to 7:59 AM (6,955, 14.8%) for females.
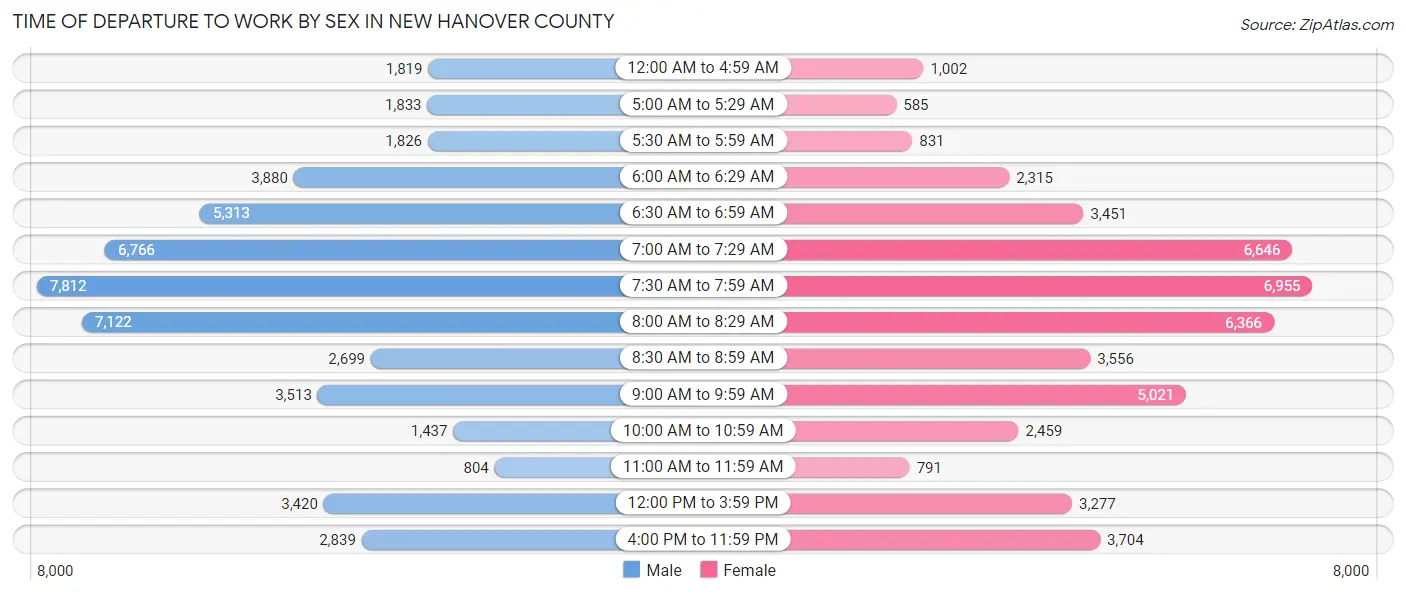
| Time of Departure | Male | Female |
| 12:00 AM to 4:59 AM | 1,819 (3.6%) | 1,002 (2.1%) |
| 5:00 AM to 5:29 AM | 1,833 (3.6%) | 585 (1.3%) |
| 5:30 AM to 5:59 AM | 1,826 (3.6%) | 831 (1.8%) |
| 6:00 AM to 6:29 AM | 3,880 (7.6%) | 2,315 (4.9%) |
| 6:30 AM to 6:59 AM | 5,313 (10.4%) | 3,451 (7.3%) |
| 7:00 AM to 7:29 AM | 6,766 (13.3%) | 6,646 (14.1%) |
| 7:30 AM to 7:59 AM | 7,812 (15.3%) | 6,955 (14.8%) |
| 8:00 AM to 8:29 AM | 7,122 (13.9%) | 6,366 (13.6%) |
| 8:30 AM to 8:59 AM | 2,699 (5.3%) | 3,556 (7.6%) |
| 9:00 AM to 9:59 AM | 3,513 (6.9%) | 5,021 (10.7%) |
| 10:00 AM to 10:59 AM | 1,437 (2.8%) | 2,459 (5.2%) |
| 11:00 AM to 11:59 AM | 804 (1.6%) | 791 (1.7%) |
| 12:00 PM to 3:59 PM | 3,420 (6.7%) | 3,277 (7.0%) |
| 4:00 PM to 11:59 PM | 2,839 (5.6%) | 3,704 (7.9%) |
| Total | 51,083 (100.0%) | 46,959 (100.0%) |
Housing Occupancy in New Hanover County
Occupancy by Ownership in New Hanover County
Of the total 99,975 dwellings in New Hanover County, owner-occupied units account for 59,524 (59.5%), while renter-occupied units make up 40,451 (40.5%).
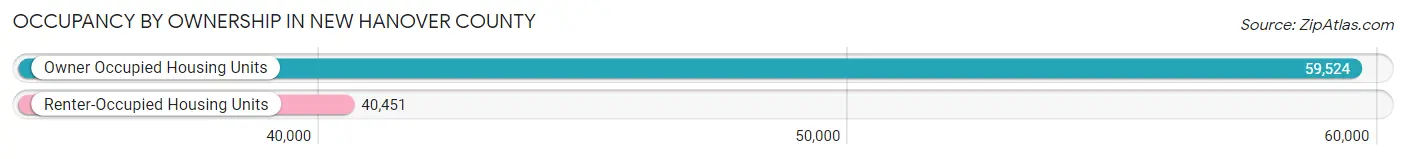
| Occupancy | # Housing Units | % Housing Units |
| Owner Occupied Housing Units | 59,524 | 59.5% |
| Renter-Occupied Housing Units | 40,451 | 40.5% |
| Total Occupied Housing Units | 99,975 | 100.0% |
Occupancy by Household Size in New Hanover County
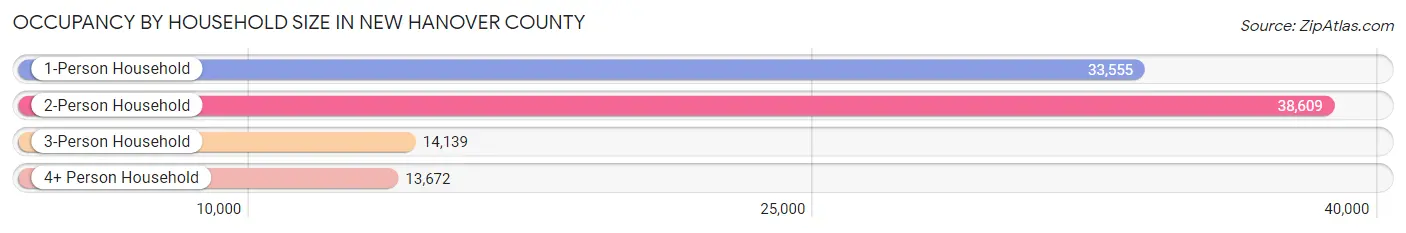
| Household Size | # Housing Units | % Housing Units |
| 1-Person Household | 33,555 | 33.6% |
| 2-Person Household | 38,609 | 38.6% |
| 3-Person Household | 14,139 | 14.1% |
| 4+ Person Household | 13,672 | 13.7% |
| Total Housing Units | 99,975 | 100.0% |
Occupancy by Ownership by Household Size in New Hanover County
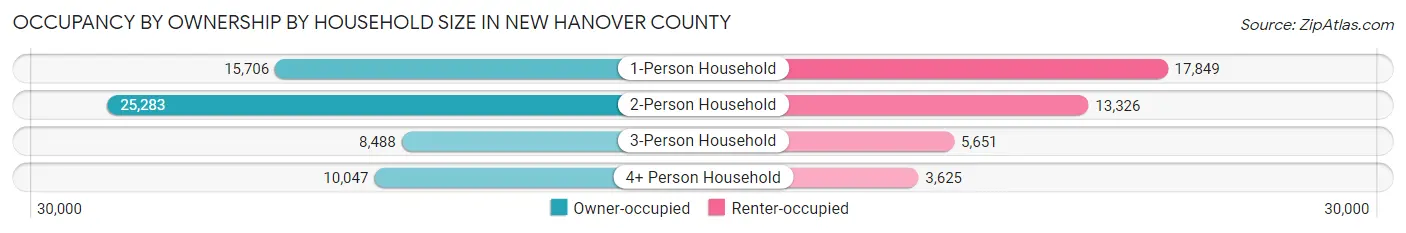
| Household Size | Owner-occupied | Renter-occupied |
| 1-Person Household | 15,706 (46.8%) | 17,849 (53.2%) |
| 2-Person Household | 25,283 (65.5%) | 13,326 (34.5%) |
| 3-Person Household | 8,488 (60.0%) | 5,651 (40.0%) |
| 4+ Person Household | 10,047 (73.5%) | 3,625 (26.5%) |
| Total Housing Units | 59,524 (59.5%) | 40,451 (40.5%) |
Occupancy by Educational Attainment in New Hanover County
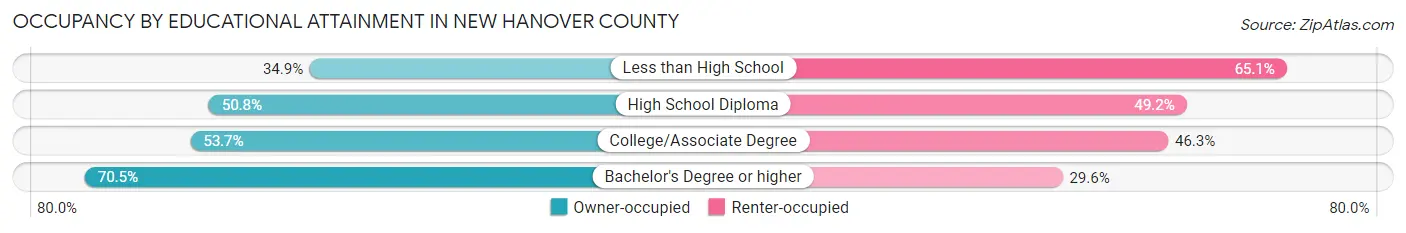
| Household Size | Owner-occupied | Renter-occupied |
| Less than High School | 2,118 (34.9%) | 3,952 (65.1%) |
| High School Diploma | 8,239 (50.8%) | 7,986 (49.2%) |
| College/Associate Degree | 17,836 (53.7%) | 15,373 (46.3%) |
| Bachelor's Degree or higher | 31,331 (70.5%) | 13,140 (29.5%) |
Occupancy by Age of Householder in New Hanover County
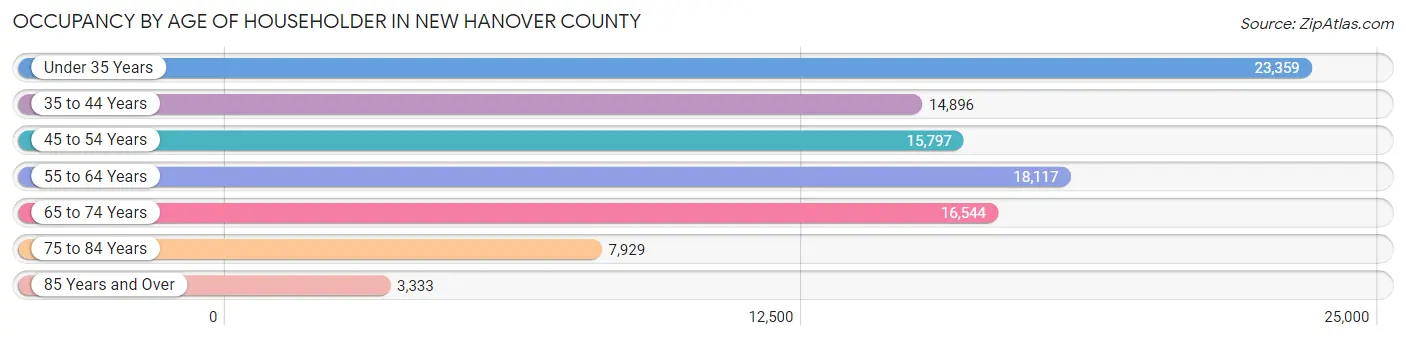
| Age Bracket | # Households | % Households |
| Under 35 Years | 23,359 | 23.4% |
| 35 to 44 Years | 14,896 | 14.9% |
| 45 to 54 Years | 15,797 | 15.8% |
| 55 to 64 Years | 18,117 | 18.1% |
| 65 to 74 Years | 16,544 | 16.6% |
| 75 to 84 Years | 7,929 | 7.9% |
| 85 Years and Over | 3,333 | 3.3% |
| Total | 99,975 | 100.0% |
Housing Finances in New Hanover County
Median Income by Occupancy in New Hanover County

| Occupancy Type | # Households | Median Income |
| Owner-Occupied | 59,524 (59.5%) | $92,525 |
| Renter-Occupied | 40,451 (40.5%) | $45,328 |
| Average | 99,975 (100.0%) | $67,515 |
Occupancy by Householder Income Bracket in New Hanover County
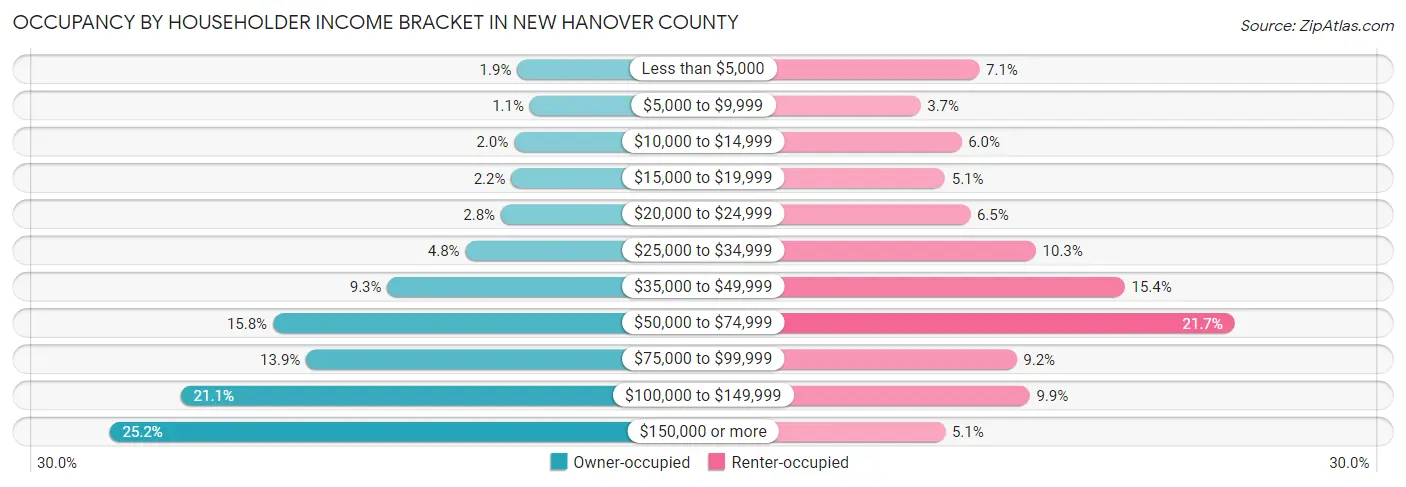
| Income Bracket | Owner-occupied | Renter-occupied |
| Less than $5,000 | 1,103 (1.8%) | 2,855 (7.1%) |
| $5,000 to $9,999 | 670 (1.1%) | 1,497 (3.7%) |
| $10,000 to $14,999 | 1,209 (2.0%) | 2,442 (6.0%) |
| $15,000 to $19,999 | 1,301 (2.2%) | 2,065 (5.1%) |
| $20,000 to $24,999 | 1,654 (2.8%) | 2,645 (6.5%) |
| $25,000 to $34,999 | 2,861 (4.8%) | 4,164 (10.3%) |
| $35,000 to $49,999 | 5,516 (9.3%) | 6,218 (15.4%) |
| $50,000 to $74,999 | 9,411 (15.8%) | 8,760 (21.7%) |
| $75,000 to $99,999 | 8,277 (13.9%) | 3,719 (9.2%) |
| $100,000 to $149,999 | 12,549 (21.1%) | 4,019 (9.9%) |
| $150,000 or more | 14,973 (25.2%) | 2,067 (5.1%) |
| Total | 59,524 (100.0%) | 40,451 (100.0%) |
Monthly Housing Cost Tiers in New Hanover County
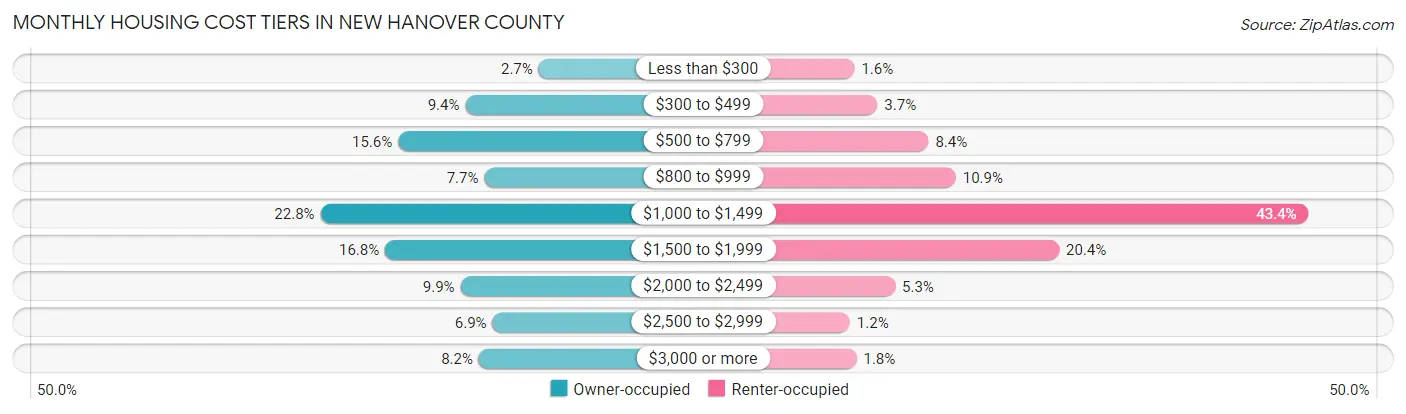
| Monthly Cost | Owner-occupied | Renter-occupied |
| Less than $300 | 1,595 (2.7%) | 635 (1.6%) |
| $300 to $499 | 5,616 (9.4%) | 1,487 (3.7%) |
| $500 to $799 | 9,299 (15.6%) | 3,391 (8.4%) |
| $800 to $999 | 4,570 (7.7%) | 4,410 (10.9%) |
| $1,000 to $1,499 | 13,554 (22.8%) | 17,539 (43.4%) |
| $1,500 to $1,999 | 10,010 (16.8%) | 8,255 (20.4%) |
| $2,000 to $2,499 | 5,878 (9.9%) | 2,149 (5.3%) |
| $2,500 to $2,999 | 4,126 (6.9%) | 467 (1.1%) |
| $3,000 or more | 4,876 (8.2%) | 712 (1.8%) |
| Total | 59,524 (100.0%) | 40,451 (100.0%) |
Physical Housing Characteristics in New Hanover County
Housing Structures in New Hanover County
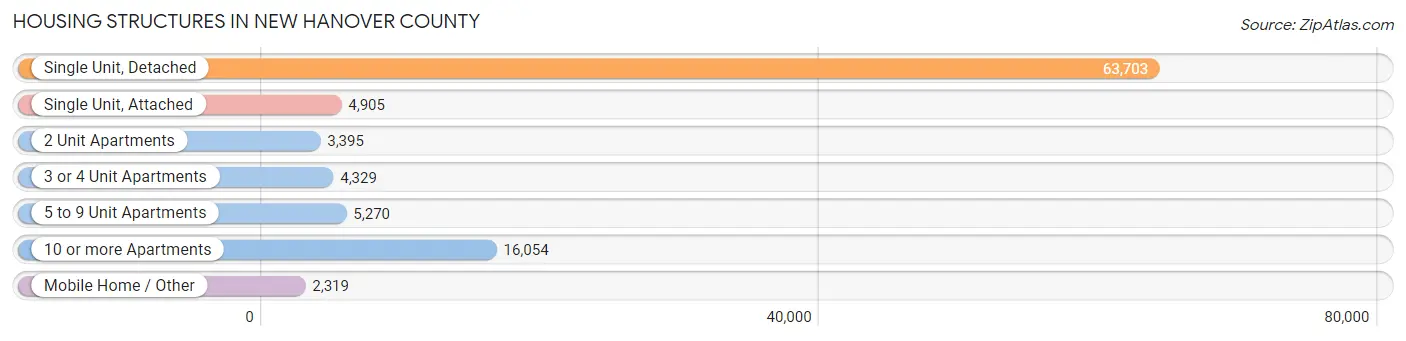
| Structure Type | # Housing Units | % Housing Units |
| Single Unit, Detached | 63,703 | 63.7% |
| Single Unit, Attached | 4,905 | 4.9% |
| 2 Unit Apartments | 3,395 | 3.4% |
| 3 or 4 Unit Apartments | 4,329 | 4.3% |
| 5 to 9 Unit Apartments | 5,270 | 5.3% |
| 10 or more Apartments | 16,054 | 16.1% |
| Mobile Home / Other | 2,319 | 2.3% |
| Total | 99,975 | 100.0% |
Housing Structures by Occupancy in New Hanover County

| Structure Type | Owner-occupied | Renter-occupied |
| Single Unit, Detached | 52,556 (82.5%) | 11,147 (17.5%) |
| Single Unit, Attached | 2,847 (58.0%) | 2,058 (42.0%) |
| 2 Unit Apartments | 375 (11.1%) | 3,020 (88.9%) |
| 3 or 4 Unit Apartments | 940 (21.7%) | 3,389 (78.3%) |
| 5 to 9 Unit Apartments | 798 (15.1%) | 4,472 (84.9%) |
| 10 or more Apartments | 907 (5.7%) | 15,147 (94.4%) |
| Mobile Home / Other | 1,101 (47.5%) | 1,218 (52.5%) |
| Total | 59,524 (59.5%) | 40,451 (40.5%) |
Housing Structures by Number of Rooms in New Hanover County
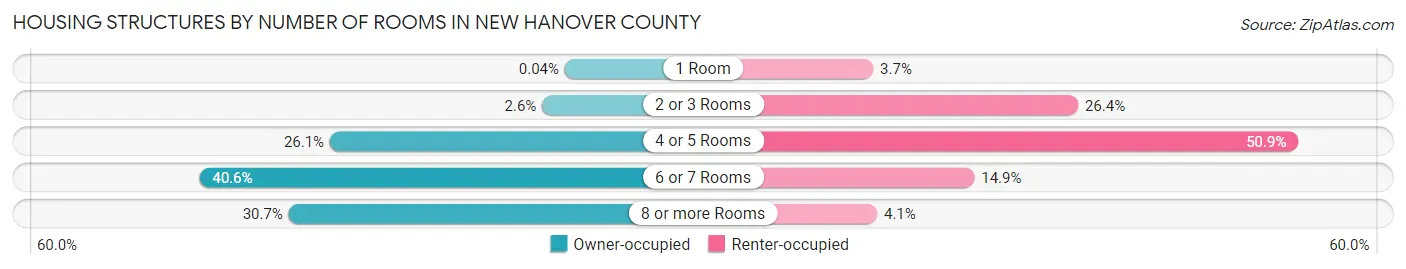
| Number of Rooms | Owner-occupied | Renter-occupied |
| 1 Room | 21 (0.0%) | 1,492 (3.7%) |
| 2 or 3 Rooms | 1,521 (2.6%) | 10,687 (26.4%) |
| 4 or 5 Rooms | 15,540 (26.1%) | 20,574 (50.9%) |
| 6 or 7 Rooms | 24,173 (40.6%) | 6,033 (14.9%) |
| 8 or more Rooms | 18,269 (30.7%) | 1,665 (4.1%) |
| Total | 59,524 (100.0%) | 40,451 (100.0%) |
Housing Structure by Heating Type in New Hanover County
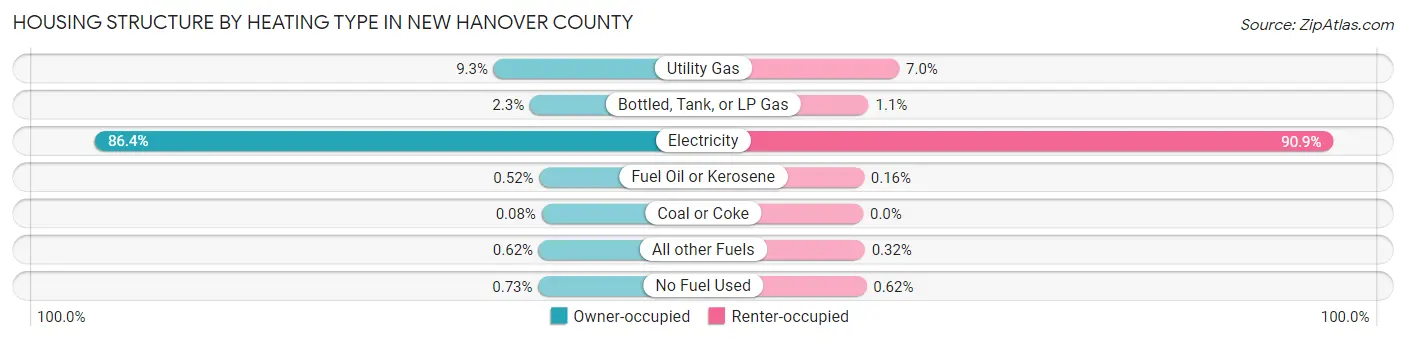
| Heating Type | Owner-occupied | Renter-occupied |
| Utility Gas | 5,553 (9.3%) | 2,816 (7.0%) |
| Bottled, Tank, or LP Gas | 1,391 (2.3%) | 432 (1.1%) |
| Electricity | 51,422 (86.4%) | 36,761 (90.9%) |
| Fuel Oil or Kerosene | 307 (0.5%) | 64 (0.2%) |
| Coal or Coke | 50 (0.1%) | 0 (0.0%) |
| All other Fuels | 369 (0.6%) | 129 (0.3%) |
| No Fuel Used | 432 (0.7%) | 249 (0.6%) |
| Total | 59,524 (100.0%) | 40,451 (100.0%) |
Household Vehicle Usage in New Hanover County
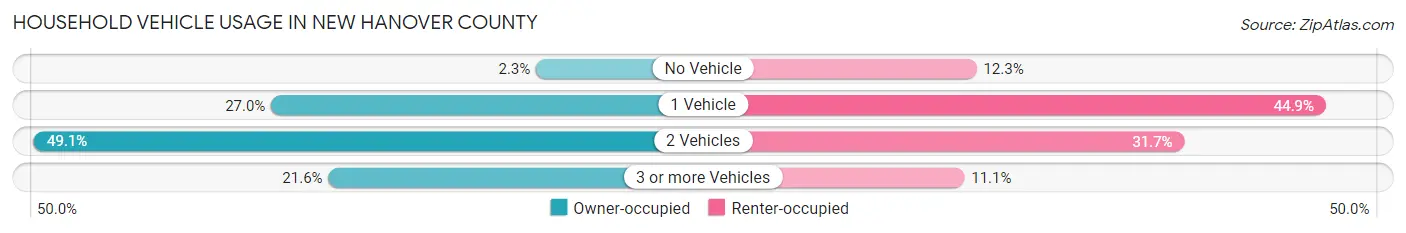
| Vehicles per Household | Owner-occupied | Renter-occupied |
| No Vehicle | 1,337 (2.2%) | 4,967 (12.3%) |
| 1 Vehicle | 16,061 (27.0%) | 18,160 (44.9%) |
| 2 Vehicles | 29,247 (49.1%) | 12,819 (31.7%) |
| 3 or more Vehicles | 12,879 (21.6%) | 4,505 (11.1%) |
| Total | 59,524 (100.0%) | 40,451 (100.0%) |
Real Estate & Mortgages in New Hanover County
Real Estate and Mortgage Overview in New Hanover County
| Characteristic | Without Mortgage | With Mortgage |
| Housing Units | 19,589 | 39,935 |
| Median Property Value | $322,100 | $319,200 |
| Median Household Income | $69,842 | $11,127 |
| Monthly Housing Costs | $601 | $4,778 |
| Real Estate Taxes | $1,998 | $669 |
Property Value by Mortgage Status in New Hanover County
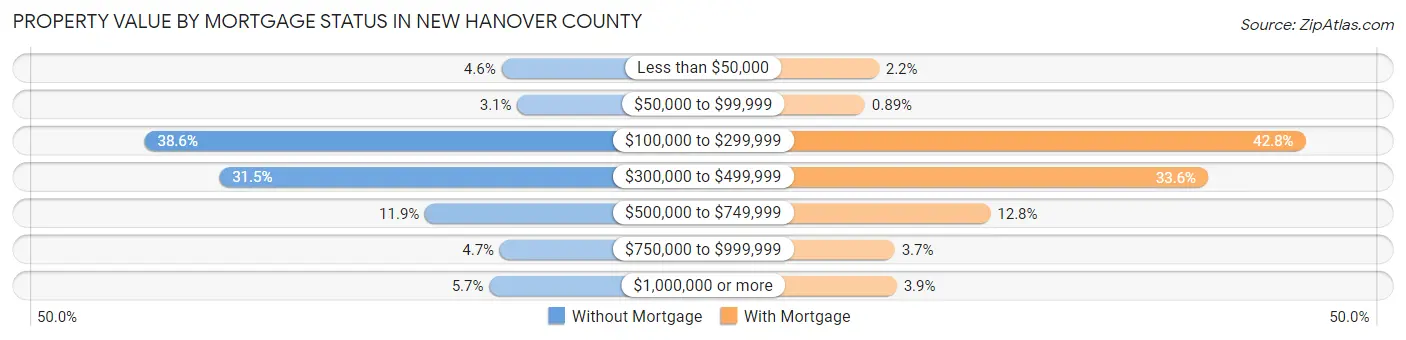
| Property Value | Without Mortgage | With Mortgage |
| Less than $50,000 | 897 (4.6%) | 883 (2.2%) |
| $50,000 to $99,999 | 602 (3.1%) | 357 (0.9%) |
| $100,000 to $299,999 | 7,556 (38.6%) | 17,109 (42.8%) |
| $300,000 to $499,999 | 6,163 (31.5%) | 13,404 (33.6%) |
| $500,000 to $749,999 | 2,321 (11.8%) | 5,127 (12.8%) |
| $750,000 to $999,999 | 926 (4.7%) | 1,489 (3.7%) |
| $1,000,000 or more | 1,124 (5.7%) | 1,566 (3.9%) |
| Total | 19,589 (100.0%) | 39,935 (100.0%) |
Household Income by Mortgage Status in New Hanover County
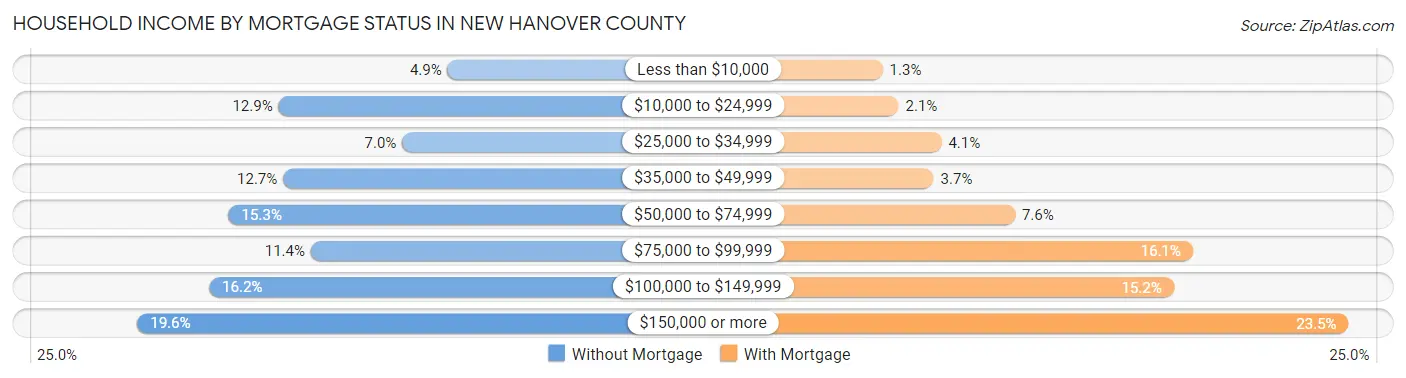
| Household Income | Without Mortgage | With Mortgage |
| Less than $10,000 | 953 (4.9%) | 514 (1.3%) |
| $10,000 to $24,999 | 2,529 (12.9%) | 820 (2.1%) |
| $25,000 to $34,999 | 1,375 (7.0%) | 1,635 (4.1%) |
| $35,000 to $49,999 | 2,486 (12.7%) | 1,486 (3.7%) |
| $50,000 to $74,999 | 2,996 (15.3%) | 3,030 (7.6%) |
| $75,000 to $99,999 | 2,228 (11.4%) | 6,415 (16.1%) |
| $100,000 to $149,999 | 3,176 (16.2%) | 6,049 (15.1%) |
| $150,000 or more | 3,846 (19.6%) | 9,373 (23.5%) |
| Total | 19,589 (100.0%) | 39,935 (100.0%) |
Property Value to Household Income Ratio in New Hanover County
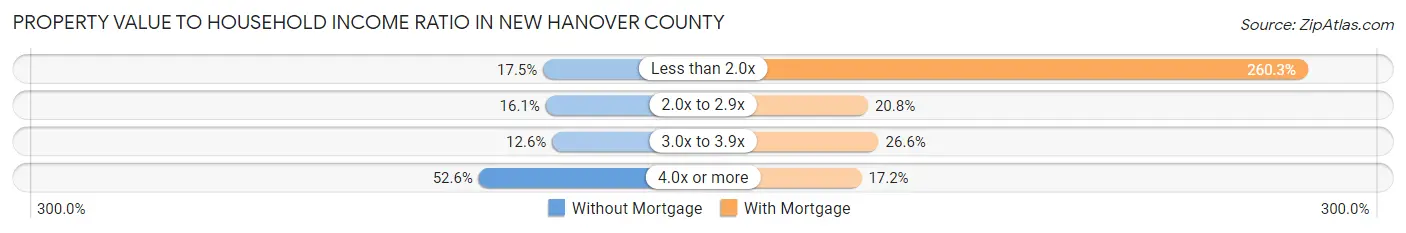
| Value-to-Income Ratio | Without Mortgage | With Mortgage |
| Less than 2.0x | 3,428 (17.5%) | 103,959 (260.3%) |
| 2.0x to 2.9x | 3,155 (16.1%) | 8,286 (20.7%) |
| 3.0x to 3.9x | 2,460 (12.6%) | 10,604 (26.6%) |
| 4.0x or more | 10,300 (52.6%) | 6,856 (17.2%) |
| Total | 19,589 (100.0%) | 39,935 (100.0%) |
Real Estate Taxes by Mortgage Status in New Hanover County
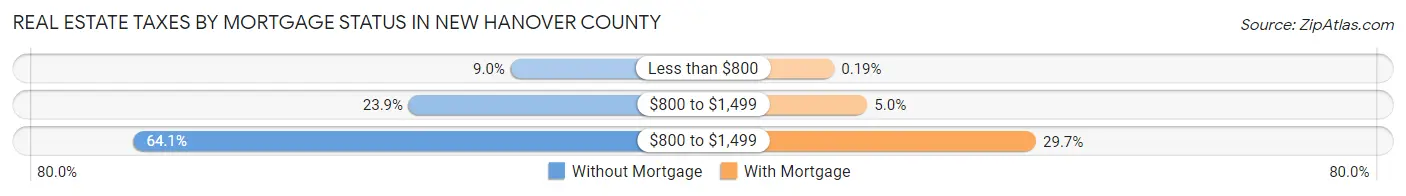
| Property Taxes | Without Mortgage | With Mortgage |
| Less than $800 | 1,760 (9.0%) | 75 (0.2%) |
| $800 to $1,499 | 4,671 (23.8%) | 2,003 (5.0%) |
| $800 to $1,499 | 12,553 (64.1%) | 11,847 (29.7%) |
| Total | 19,589 (100.0%) | 39,935 (100.0%) |
Health & Disability in New Hanover County
Health Insurance Coverage by Age in New Hanover County
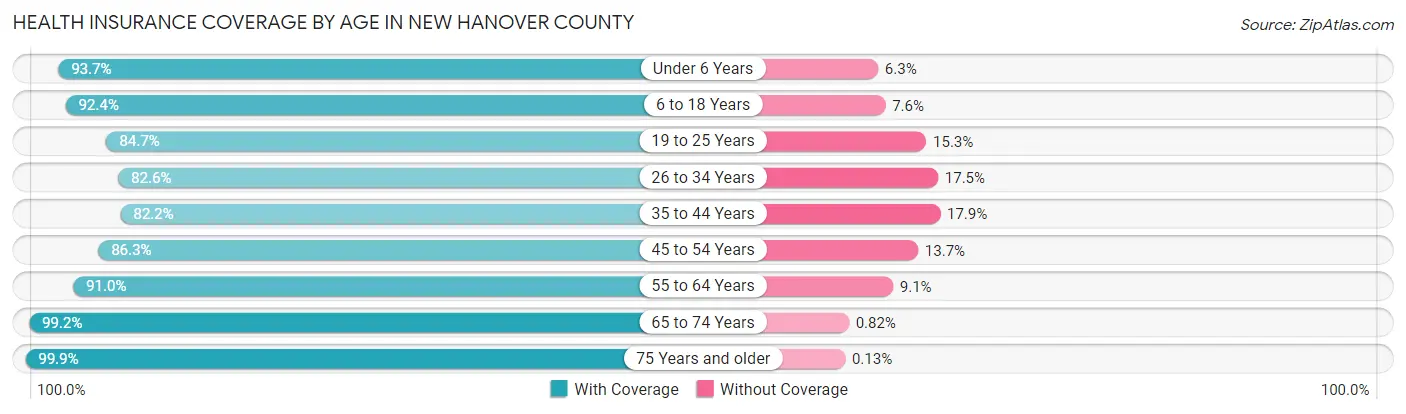
| Age Bracket | With Coverage | Without Coverage |
| Under 6 Years | 12,013 (93.7%) | 803 (6.3%) |
| 6 to 18 Years | 29,494 (92.4%) | 2,438 (7.6%) |
| 19 to 25 Years | 23,224 (84.7%) | 4,183 (15.3%) |
| 26 to 34 Years | 21,561 (82.6%) | 4,559 (17.4%) |
| 35 to 44 Years | 23,170 (82.2%) | 5,033 (17.8%) |
| 45 to 54 Years | 24,053 (86.3%) | 3,829 (13.7%) |
| 55 to 64 Years | 27,107 (90.9%) | 2,697 (9.0%) |
| 65 to 74 Years | 25,042 (99.2%) | 207 (0.8%) |
| 75 Years and older | 16,075 (99.9%) | 21 (0.1%) |
| Total | 201,739 (89.5%) | 23,770 (10.5%) |
Health Insurance Coverage by Citizenship Status in New Hanover County
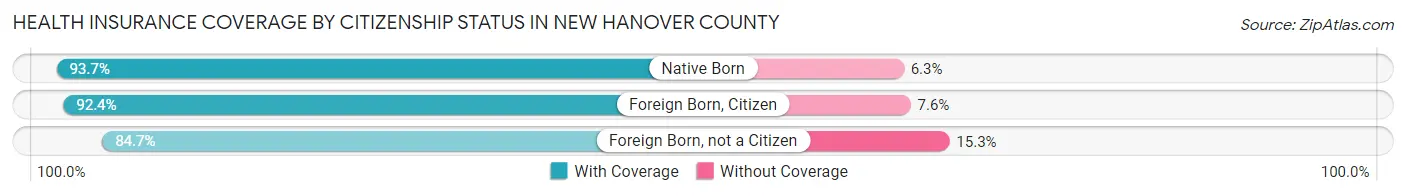
| Citizenship Status | With Coverage | Without Coverage |
| Native Born | 12,013 (93.7%) | 803 (6.3%) |
| Foreign Born, Citizen | 29,494 (92.4%) | 2,438 (7.6%) |
| Foreign Born, not a Citizen | 23,224 (84.7%) | 4,183 (15.3%) |
Health Insurance Coverage by Household Income in New Hanover County
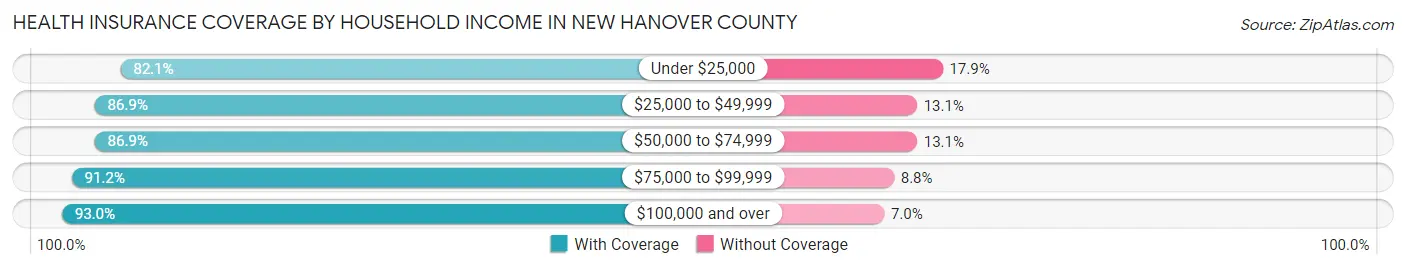
| Household Income | With Coverage | Without Coverage |
| Under $25,000 | 22,582 (82.1%) | 4,934 (17.9%) |
| $25,000 to $49,999 | 30,900 (86.9%) | 4,660 (13.1%) |
| $50,000 to $74,999 | 33,967 (86.9%) | 5,128 (13.1%) |
| $75,000 to $99,999 | 24,719 (91.2%) | 2,385 (8.8%) |
| $100,000 and over | 85,166 (93.0%) | 6,379 (7.0%) |
Public vs Private Health Insurance Coverage by Age in New Hanover County
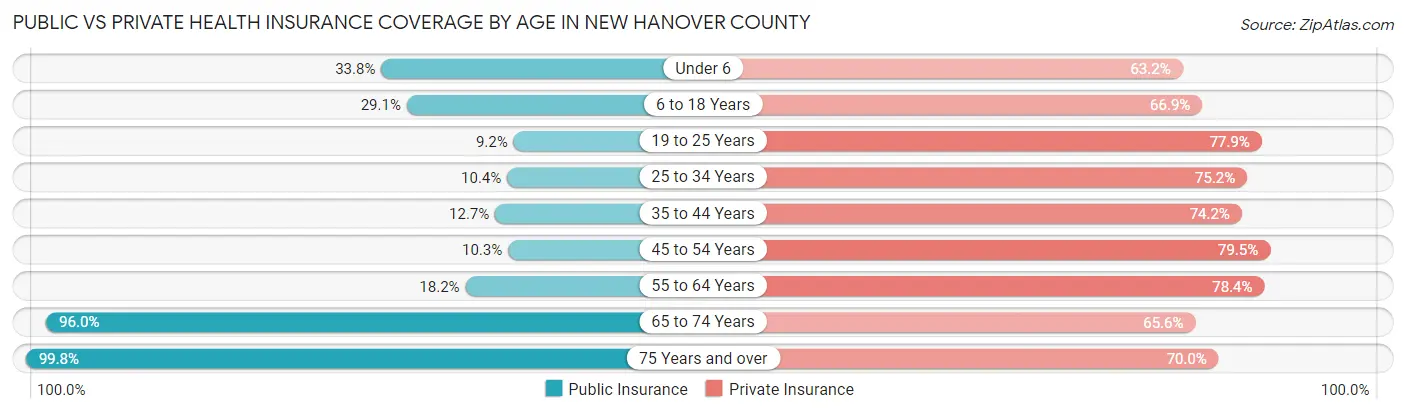
| Age Bracket | Public Insurance | Private Insurance |
| Under 6 | 4,332 (33.8%) | 8,103 (63.2%) |
| 6 to 18 Years | 9,284 (29.1%) | 21,356 (66.9%) |
| 19 to 25 Years | 2,533 (9.2%) | 21,359 (77.9%) |
| 25 to 34 Years | 2,727 (10.4%) | 19,649 (75.2%) |
| 35 to 44 Years | 3,574 (12.7%) | 20,931 (74.2%) |
| 45 to 54 Years | 2,862 (10.3%) | 22,161 (79.5%) |
| 55 to 64 Years | 5,417 (18.2%) | 23,375 (78.4%) |
| 65 to 74 Years | 24,237 (96.0%) | 16,567 (65.6%) |
| 75 Years and over | 16,062 (99.8%) | 11,259 (70.0%) |
| Total | 71,028 (31.5%) | 164,760 (73.1%) |
Disability Status by Sex by Age in New Hanover County
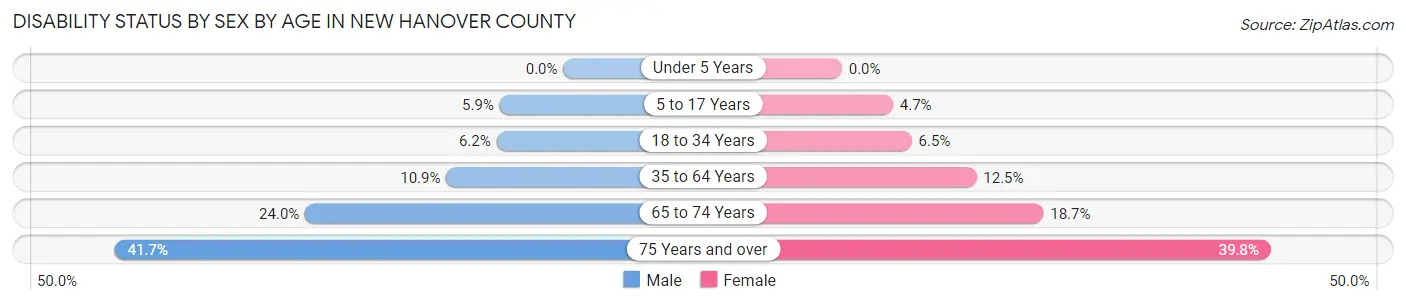
| Age Bracket | Male | Female |
| Under 5 Years | 0 (0.0%) | 0 (0.0%) |
| 5 to 17 Years | 926 (5.9%) | 709 (4.7%) |
| 18 to 34 Years | 1,685 (6.2%) | 1,941 (6.5%) |
| 35 to 64 Years | 4,460 (10.9%) | 5,599 (12.5%) |
| 65 to 74 Years | 2,689 (24.0%) | 2,623 (18.7%) |
| 75 Years and over | 2,846 (41.6%) | 3,688 (39.8%) |
Disability Class by Sex by Age in New Hanover County
Disability Class: Hearing Difficulty
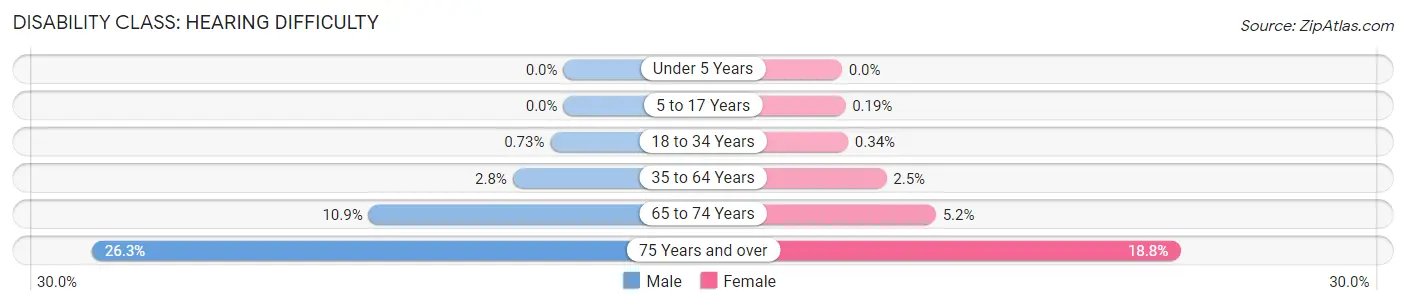
| Age Bracket | Male | Female |
| Under 5 Years | 0 (0.0%) | 0 (0.0%) |
| 5 to 17 Years | 0 (0.0%) | 28 (0.2%) |
| 18 to 34 Years | 199 (0.7%) | 103 (0.3%) |
| 35 to 64 Years | 1,159 (2.8%) | 1,110 (2.5%) |
| 65 to 74 Years | 1,218 (10.8%) | 733 (5.2%) |
| 75 Years and over | 1,794 (26.3%) | 1,744 (18.8%) |
Disability Class: Vision Difficulty
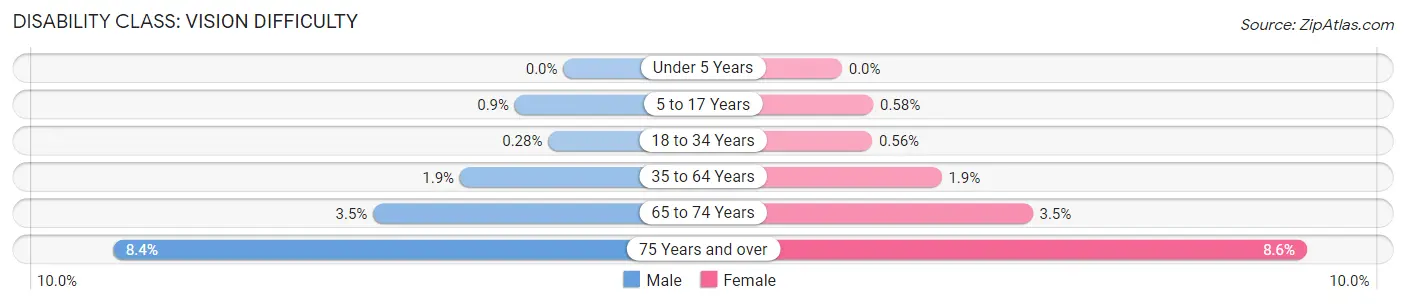
| Age Bracket | Male | Female |
| Under 5 Years | 0 (0.0%) | 0 (0.0%) |
| 5 to 17 Years | 141 (0.9%) | 86 (0.6%) |
| 18 to 34 Years | 76 (0.3%) | 168 (0.6%) |
| 35 to 64 Years | 787 (1.9%) | 827 (1.8%) |
| 65 to 74 Years | 396 (3.5%) | 496 (3.5%) |
| 75 Years and over | 571 (8.4%) | 799 (8.6%) |
Disability Class: Cognitive Difficulty
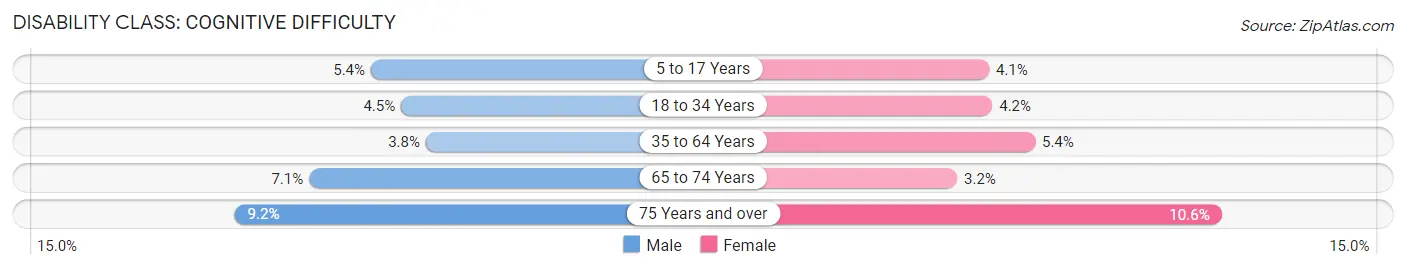
| Age Bracket | Male | Female |
| 5 to 17 Years | 840 (5.4%) | 613 (4.1%) |
| 18 to 34 Years | 1,227 (4.5%) | 1,254 (4.2%) |
| 35 to 64 Years | 1,573 (3.8%) | 2,412 (5.4%) |
| 65 to 74 Years | 795 (7.1%) | 450 (3.2%) |
| 75 Years and over | 625 (9.1%) | 979 (10.6%) |
Disability Class: Ambulatory Difficulty
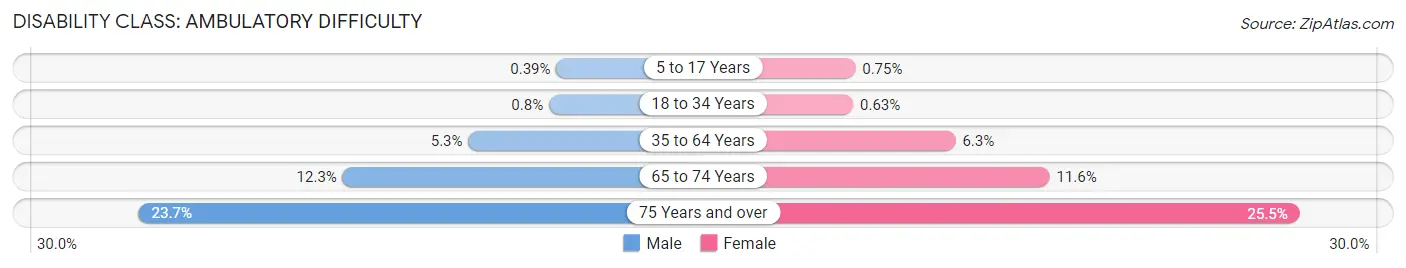
| Age Bracket | Male | Female |
| 5 to 17 Years | 61 (0.4%) | 112 (0.7%) |
| 18 to 34 Years | 218 (0.8%) | 189 (0.6%) |
| 35 to 64 Years | 2,174 (5.3%) | 2,835 (6.3%) |
| 65 to 74 Years | 1,379 (12.3%) | 1,623 (11.6%) |
| 75 Years and over | 1,616 (23.6%) | 2,361 (25.5%) |
Disability Class: Self-Care Difficulty
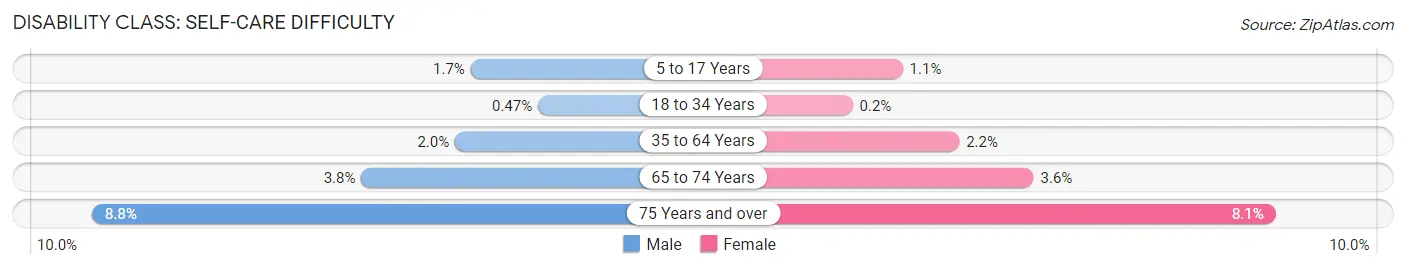
| Age Bracket | Male | Female |
| 5 to 17 Years | 270 (1.7%) | 169 (1.1%) |
| 18 to 34 Years | 128 (0.5%) | 60 (0.2%) |
| 35 to 64 Years | 826 (2.0%) | 978 (2.2%) |
| 65 to 74 Years | 421 (3.7%) | 499 (3.6%) |
| 75 Years and over | 598 (8.7%) | 746 (8.1%) |
Technology Access in New Hanover County
Computing Device Access in New Hanover County

| Device Type | # Households | % Households |
| Desktop or Laptop | 84,968 | 85.0% |
| Smartphone | 91,224 | 91.2% |
| Tablet | 66,971 | 67.0% |
| No Computing Device | 4,037 | 4.0% |
| Total | 99,975 | 100.0% |
Internet Access in New Hanover County
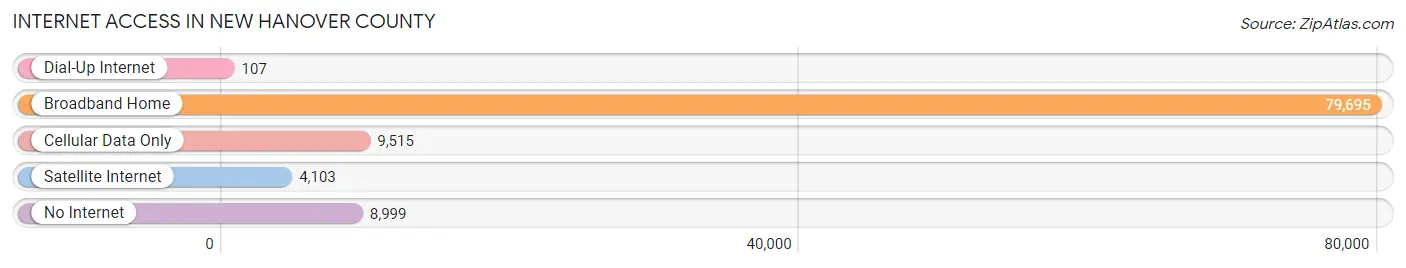
| Internet Type | # Households | % Households |
| Dial-Up Internet | 107 | 0.1% |
| Broadband Home | 79,695 | 79.7% |
| Cellular Data Only | 9,515 | 9.5% |
| Satellite Internet | 4,103 | 4.1% |
| No Internet | 8,999 | 9.0% |
| Total | 99,975 | 100.0% |
New Hanover County Summary
New Hanover County, North Carolina is located in the southeastern corner of the state, along the Atlantic coast. It is bordered by Brunswick County to the north, Pender County to the east, and Columbus County to the south. The county seat is Wilmington, which is also the largest city in the county. New Hanover County is part of the Wilmington Metropolitan Statistical Area, and is home to a population of over 200,000 people.
History
New Hanover County was established in 1729, and was named after the House of Hanover, which was the ruling house of Great Britain at the time. The county was originally part of the New Hanover Precinct, which was created in 1711. The county was divided into two parts in 1729, with the northern part becoming Bladen County and the southern part becoming New Hanover County.
The county was home to a number of Native American tribes, including the Tuscarora, Coree, and Cape Fear Indians. The first European settlers arrived in the area in the early 1700s, and the county was officially established in 1729.
During the American Revolution, New Hanover County was the site of several battles, including the Battle of Moore's Creek Bridge in 1776. The county was also the site of the Wilmington Insurrection of 1898, which was a violent race riot that resulted in the deaths of several African Americans.
Geography
New Hanover County covers an area of 839 square miles, and is located in the southeastern corner of North Carolina. The county is bordered by Brunswick County to the north, Pender County to the east, and Columbus County to the south. The county is located along the Atlantic coast, and is home to a number of rivers, including the Cape Fear River, Northeast Cape Fear River, and the Brunswick River.
The county is home to a number of parks and recreational areas, including Carolina Beach State Park, Fort Fisher State Recreation Area, and the Hugh MacRae Park. The county is also home to a number of beaches, including Wrightsville Beach, Carolina Beach, and Kure Beach.
Economy
New Hanover County has a diverse economy, with a number of industries contributing to the local economy. The county is home to a number of large employers, including GE Aviation, Corning, and PPD. The county is also home to a number of military installations, including the Marine Corps Air Station New River and the Wilmington International Airport.
The county is home to a number of tourist attractions, including the USS North Carolina Battleship Memorial, the Cape Fear Museum, and the Airlie Gardens. The county is also home to a number of festivals and events, including the Azalea Festival, the North Carolina Jazz Festival, and the Wilmington Riverfest.
Demographics
As of the 2010 census, New Hanover County had a population of 202,667 people. The population was spread out, with 24.3% under the age of 18, 10.2% from 18 to 24, 28.2% from 25 to 44, 24.2% from 45 to 64, and 13.1% who were 65 years of age or older. The median age was 36.3 years.
The racial makeup of the county was 73.2% White, 19.2% African American, 0.5% Native American, 3.2% Asian, 0.1% Pacific Islander, 1.7% from other races, and 1.9% from two or more races. Hispanic or Latino of any race were 5.2% of the population.
The median income for a household in the county was $48,867, and the median income for a family was $58,945. The per capita income for the county was $26,945. About 11.2% of families and 15.2% of the population were below the poverty line, including 22.2% of those under age 18 and 8.7% of those age 65 or over.
Common Questions
What is the Total Population of New Hanover County?
Total Population of New Hanover County is 228,134.
What is the Total Male Population of New Hanover County?
Total Male Population of New Hanover County is 109,251.
What is the Total Female Population of New Hanover County?
Total Female Population of New Hanover County is 118,883.
What is the Ratio of Males per 100 Females in New Hanover County?
There are 91.90 Males per 100 Females in New Hanover County.
What is the Ratio of Females per 100 Males in New Hanover County?
There are 108.82 Females per 100 Males in New Hanover County.
What is the Median Population Age in New Hanover County?
Median Population Age in New Hanover County is 40.2 Years.
What is the Average Family Size in New Hanover County
Average Family Size in New Hanover County is 2.9 People.
What is the Average Household Size in New Hanover County
Average Household Size in New Hanover County is 2.2 People.
What is Per Capita Income in New Hanover County?
Per Capita income in New Hanover County is $43,378.
What is the Median Family Income in New Hanover County?
Median Family Income in New Hanover County is $92,806.
What is the Median Household income in New Hanover County?
Median Household Income in New Hanover County is $67,515.
What is Income or Wage Gap in New Hanover County?
Income or Wage Gap in New Hanover County is 23.8%.
Women in New Hanover County earn 76.2 cents for every dollar earned by a man.
What is Family Income Deficit in New Hanover County?
Family Income Deficit in New Hanover County is $11,306.
Families that are below poverty line in New Hanover County earn $11,306 less on average than the poverty threshold level.
What is Inequality or Gini Index in New Hanover County?
Inequality or Gini Index in New Hanover County is 0.49.
How Large is the Labor Force in New Hanover County?
There are 123,606 People in the Labor Forcein in New Hanover County.
What is the Percentage of People in the Labor Force in New Hanover County?
64.6% of People are in the Labor Force in New Hanover County.
What is the Unemployment Rate in New Hanover County?
Unemployment Rate in New Hanover County is 4.8%.