Nash County, NC
Nash County Map
Nash County Overview
95,015
TOTAL POPULATION
45,908
MALE POPULATION
49,107
FEMALE POPULATION
93.49
MALES / 100 FEMALES
106.97
FEMALES / 100 MALES
41.7
MEDIAN AGE
3.1
AVG FAMILY SIZE
2.5
AVG HOUSEHOLD SIZE
$31,987
PER CAPITA INCOME
$69,593
AVG FAMILY INCOME
$56,770
AVG HOUSEHOLD INCOME
20.3%
WAGE / INCOME GAP [ % ]
79.7¢/ $1
WAGE / INCOME GAP [ $ ]
$9,882
FAMILY INCOME DEFICIT
0.45
INEQUALITY / GINI INDEX
46,165
LABOR FORCE [ PEOPLE ]
60.1%
PERCENT IN LABOR FORCE
6.4%
UNEMPLOYMENT RATE
Nash County Area Codes
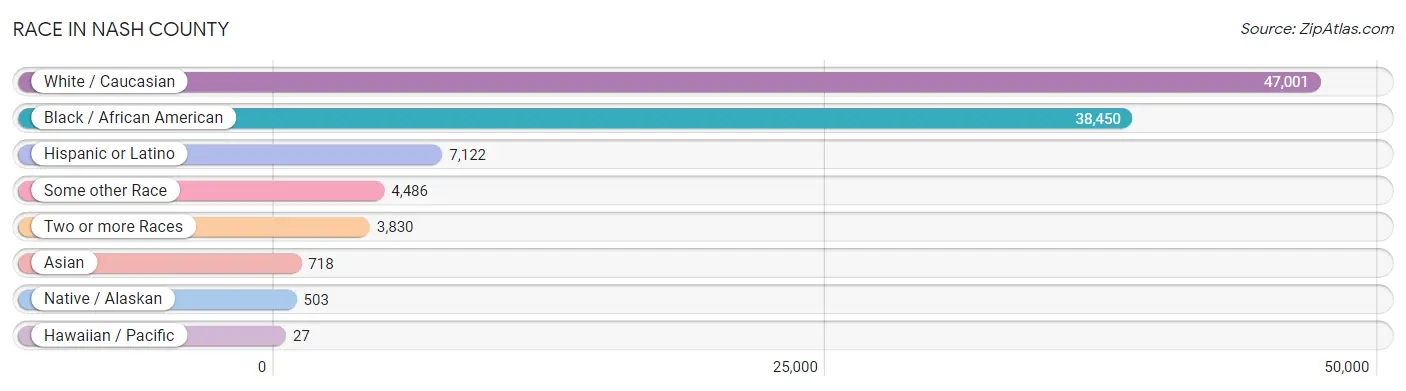
Race in Nash County
The most populous races in Nash County are White / Caucasian (47,001 | 49.5%), Black / African American (38,450 | 40.5%), and Hispanic or Latino (7,122 | 7.5%).
| Race | # Population | % Population |
| Asian | 718 | 0.8% |
| Black / African American | 38,450 | 40.5% |
| Hawaiian / Pacific | 27 | 0.0% |
| Hispanic or Latino | 7,122 | 7.5% |
| Native / Alaskan | 503 | 0.5% |
| White / Caucasian | 47,001 | 49.5% |
| Two or more Races | 3,830 | 4.0% |
| Some other Race | 4,486 | 4.7% |
| Total | 95,015 | 100.0% |
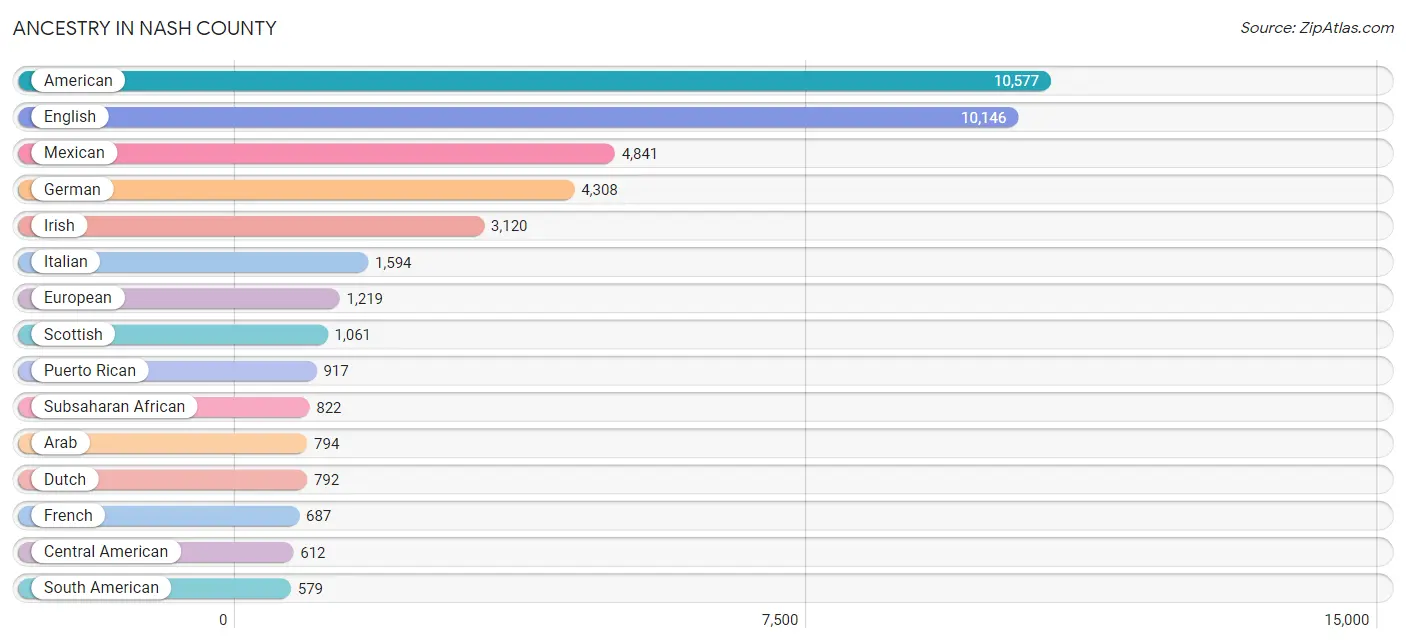
Ancestry in Nash County
The most populous ancestries reported in Nash County are American (10,577 | 11.1%), English (10,146 | 10.7%), Mexican (4,841 | 5.1%), German (4,308 | 4.5%), and Irish (3,120 | 3.3%), together accounting for 34.7% of all Nash County residents.
| Ancestry | # Population | % Population |
| African | 450 | 0.5% |
| American | 10,577 | 11.1% |
| Arab | 794 | 0.8% |
| Armenian | 10 | 0.0% |
| Australian | 11 | 0.0% |
| Austrian | 34 | 0.0% |
| Belgian | 8 | 0.0% |
| Bhutanese | 86 | 0.1% |
| Blackfeet | 143 | 0.2% |
| British | 297 | 0.3% |
| British West Indian | 28 | 0.0% |
| Burmese | 8 | 0.0% |
| Canadian | 1 | 0.0% |
| Celtic | 15 | 0.0% |
| Central American | 612 | 0.6% |
| Central American Indian | 6 | 0.0% |
| Cherokee | 307 | 0.3% |
| Chilean | 216 | 0.2% |
| Chippewa | 5 | 0.0% |
| Colombian | 124 | 0.1% |
| Costa Rican | 10 | 0.0% |
| Creek | 19 | 0.0% |
| Croatian | 40 | 0.0% |
| Cuban | 26 | 0.0% |
| Czech | 11 | 0.0% |
| Czechoslovakian | 47 | 0.1% |
| Danish | 90 | 0.1% |
| Dominican | 19 | 0.0% |
| Dutch | 792 | 0.8% |
| Eastern European | 196 | 0.2% |
| English | 10,146 | 10.7% |
| Ethiopian | 42 | 0.0% |
| European | 1,219 | 1.3% |
| French | 687 | 0.7% |
| French American Indian | 5 | 0.0% |
| French Canadian | 32 | 0.0% |
| German | 4,308 | 4.5% |
| Greek | 64 | 0.1% |
| Guatemalan | 92 | 0.1% |
| Haitian | 54 | 0.1% |
| Honduran | 348 | 0.4% |
| Hungarian | 178 | 0.2% |
| Icelander | 15 | 0.0% |
| Indian (Asian) | 121 | 0.1% |
| Irish | 3,120 | 3.3% |
| Iroquois | 2 | 0.0% |
| Italian | 1,594 | 1.7% |
| Jamaican | 125 | 0.1% |
| Jordanian | 28 | 0.0% |
| Korean | 88 | 0.1% |
| Lebanese | 33 | 0.0% |
| Lumbee | 209 | 0.2% |
| Macedonian | 7 | 0.0% |
| Maltese | 7 | 0.0% |
| Mexican | 4,841 | 5.1% |
| Mexican American Indian | 106 | 0.1% |
| Moroccan | 67 | 0.1% |
| Native Hawaiian | 15 | 0.0% |
| Navajo | 55 | 0.1% |
| Nicaraguan | 32 | 0.0% |
| Nigerian | 304 | 0.3% |
| Northern European | 120 | 0.1% |
| Norwegian | 326 | 0.3% |
| Pakistani | 43 | 0.1% |
| Palestinian | 538 | 0.6% |
| Panamanian | 34 | 0.0% |
| Pennsylvania German | 24 | 0.0% |
| Peruvian | 212 | 0.2% |
| Polish | 335 | 0.4% |
| Puerto Rican | 917 | 1.0% |
| Romanian | 3 | 0.0% |
| Russian | 27 | 0.0% |
| Samoan | 205 | 0.2% |
| Scandinavian | 65 | 0.1% |
| Scotch-Irish | 576 | 0.6% |
| Scottish | 1,061 | 1.1% |
| Seminole | 4 | 0.0% |
| Sioux | 2 | 0.0% |
| Slovak | 25 | 0.0% |
| South African | 19 | 0.0% |
| South American | 579 | 0.6% |
| South American Indian | 17 | 0.0% |
| Spaniard | 14 | 0.0% |
| Spanish | 42 | 0.0% |
| Spanish American | 32 | 0.0% |
| Sri Lankan | 80 | 0.1% |
| Subsaharan African | 822 | 0.9% |
| Swedish | 444 | 0.5% |
| Swiss | 4 | 0.0% |
| Syrian | 7 | 0.0% |
| Thai | 225 | 0.2% |
| Trinidadian and Tobagonian | 26 | 0.0% |
| Ukrainian | 52 | 0.1% |
| Venezuelan | 27 | 0.0% |
| Welsh | 112 | 0.1% |
| West Indian | 242 | 0.3% |
| Yuman | 4 | 0.0% | View All 97 Rows |
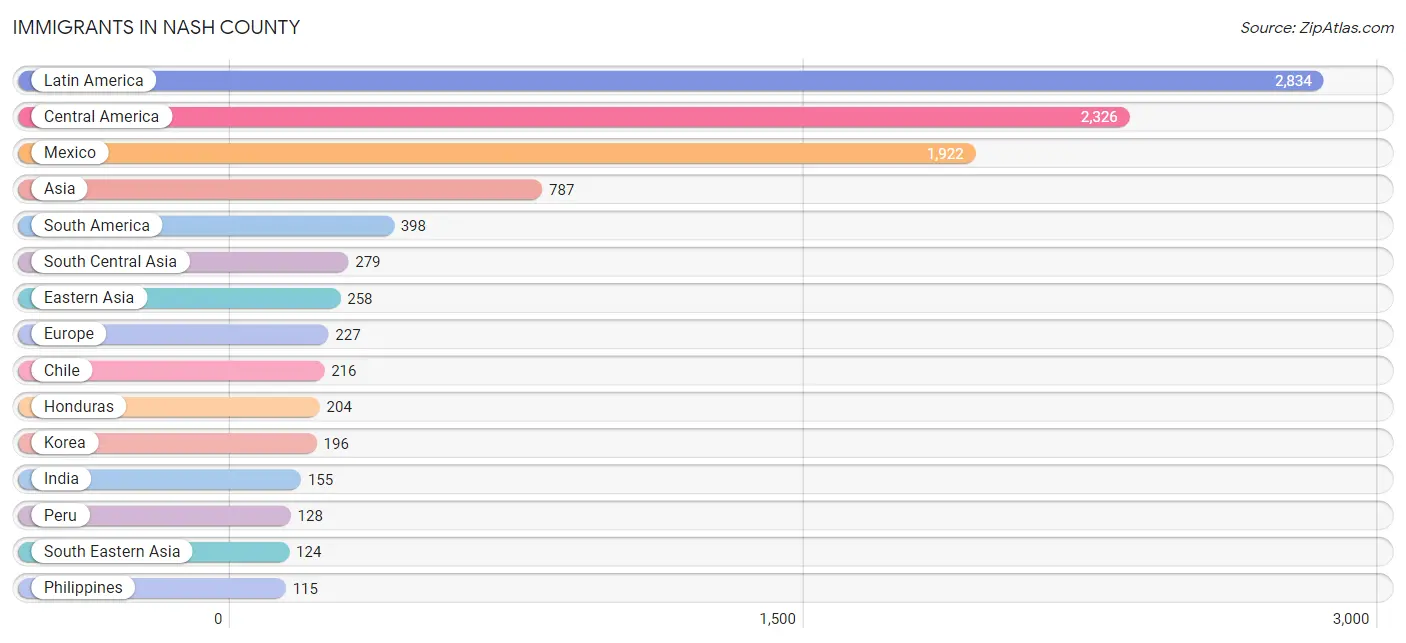
Immigrants in Nash County
The most numerous immigrant groups reported in Nash County came from Latin America (2,834 | 3.0%), Central America (2,326 | 2.5%), Mexico (1,922 | 2.0%), Asia (787 | 0.8%), and South America (398 | 0.4%), together accounting for 8.7% of all Nash County residents.
| Immigration Origin | # Population | % Population |
| Afghanistan | 42 | 0.0% |
| Africa | 114 | 0.1% |
| Asia | 787 | 0.8% |
| Australia | 9 | 0.0% |
| Barbados | 7 | 0.0% |
| Canada | 79 | 0.1% |
| Caribbean | 110 | 0.1% |
| Central America | 2,326 | 2.5% |
| Chile | 216 | 0.2% |
| China | 36 | 0.0% |
| Colombia | 43 | 0.1% |
| Costa Rica | 10 | 0.0% |
| Cuba | 31 | 0.0% |
| Dominican Republic | 29 | 0.0% |
| Eastern Africa | 33 | 0.0% |
| Eastern Asia | 258 | 0.3% |
| Eastern Europe | 66 | 0.1% |
| El Salvador | 102 | 0.1% |
| England | 108 | 0.1% |
| Ethiopia | 33 | 0.0% |
| Europe | 227 | 0.2% |
| Germany | 45 | 0.1% |
| Guatemala | 74 | 0.1% |
| Honduras | 204 | 0.2% |
| Hungary | 10 | 0.0% |
| India | 155 | 0.2% |
| Ireland | 5 | 0.0% |
| Italy | 3 | 0.0% |
| Japan | 26 | 0.0% |
| Jordan | 71 | 0.1% |
| Korea | 196 | 0.2% |
| Latin America | 2,834 | 3.0% |
| Latvia | 17 | 0.0% |
| Malaysia | 9 | 0.0% |
| Mexico | 1,922 | 2.0% |
| Nicaragua | 11 | 0.0% |
| Nigeria | 4 | 0.0% |
| Northern Africa | 37 | 0.0% |
| Northern Europe | 113 | 0.1% |
| Oceania | 21 | 0.0% |
| Pakistan | 49 | 0.1% |
| Panama | 3 | 0.0% |
| Peru | 128 | 0.1% |
| Philippines | 115 | 0.1% |
| Russia | 4 | 0.0% |
| South Africa | 19 | 0.0% |
| South America | 398 | 0.4% |
| South Central Asia | 279 | 0.3% |
| South Eastern Asia | 124 | 0.1% |
| Southern Europe | 3 | 0.0% |
| Sri Lanka | 33 | 0.0% |
| Sudan | 37 | 0.0% |
| Trinidad and Tobago | 26 | 0.0% |
| Ukraine | 35 | 0.0% |
| Venezuela | 11 | 0.0% |
| Western Africa | 4 | 0.0% |
| Western Asia | 71 | 0.1% |
| Western Europe | 45 | 0.1% | View All 58 Rows |
Sex and Age in Nash County
Sex and Age in Nash County
The most populous age groups in Nash County are 60 to 64 Years (3,284 | 7.1%) for men and 60 to 64 Years (3,515 | 7.2%) for women.
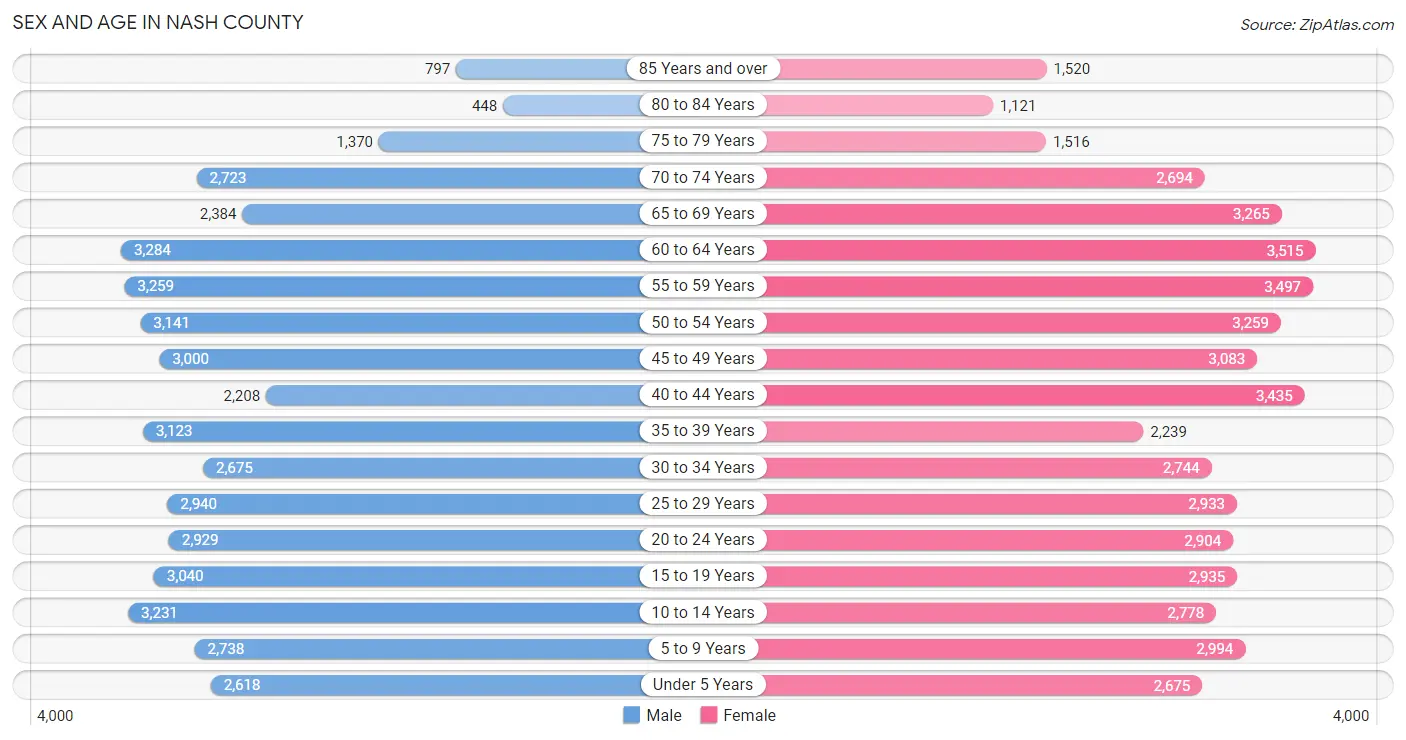
| Age Bracket | Male | Female |
| Under 5 Years | 2,618 (5.7%) | 2,675 (5.4%) |
| 5 to 9 Years | 2,738 (6.0%) | 2,994 (6.1%) |
| 10 to 14 Years | 3,231 (7.0%) | 2,778 (5.7%) |
| 15 to 19 Years | 3,040 (6.6%) | 2,935 (6.0%) |
| 20 to 24 Years | 2,929 (6.4%) | 2,904 (5.9%) |
| 25 to 29 Years | 2,940 (6.4%) | 2,933 (6.0%) |
| 30 to 34 Years | 2,675 (5.8%) | 2,744 (5.6%) |
| 35 to 39 Years | 3,123 (6.8%) | 2,239 (4.6%) |
| 40 to 44 Years | 2,208 (4.8%) | 3,435 (7.0%) |
| 45 to 49 Years | 3,000 (6.5%) | 3,083 (6.3%) |
| 50 to 54 Years | 3,141 (6.8%) | 3,259 (6.6%) |
| 55 to 59 Years | 3,259 (7.1%) | 3,497 (7.1%) |
| 60 to 64 Years | 3,284 (7.1%) | 3,515 (7.2%) |
| 65 to 69 Years | 2,384 (5.2%) | 3,265 (6.7%) |
| 70 to 74 Years | 2,723 (5.9%) | 2,694 (5.5%) |
| 75 to 79 Years | 1,370 (3.0%) | 1,516 (3.1%) |
| 80 to 84 Years | 448 (1.0%) | 1,121 (2.3%) |
| 85 Years and over | 797 (1.7%) | 1,520 (3.1%) |
| Total | 45,908 (100.0%) | 49,107 (100.0%) |
Families and Households in Nash County
Median Family Size in Nash County
The median family size in Nash County is 3.08 persons per family, with single female/mother families (6,789 | 27.6%) accounting for the largest median family size of 3.18 persons per family. On the other hand, single male/father families (1,666 | 6.8%) represent the smallest median family size with 2.95 persons per family.
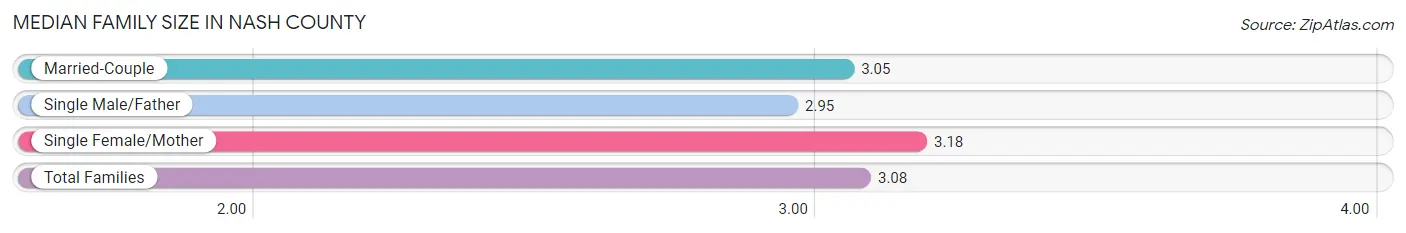
| Family Type | # Families | Family Size |
| Married-Couple | 16,116 (65.6%) | 3.05 |
| Single Male/Father | 1,666 (6.8%) | 2.95 |
| Single Female/Mother | 6,789 (27.6%) | 3.18 |
| Total Families | 24,571 (100.0%) | 3.08 |
Median Household Size in Nash County
The median household size in Nash County is 2.46 persons per household, with single female/mother households (6,789 | 18.0%) accounting for the largest median household size of 3.39 persons per household. non-family households (13,222 | 35.0%) represent the smallest median household size with 1.13 persons per household.
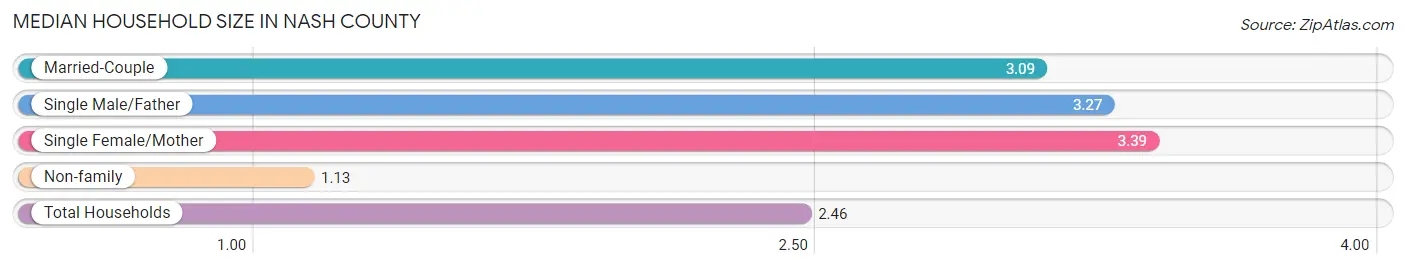
| Household Type | # Households | Household Size |
| Married-Couple | 16,116 (42.6%) | 3.09 |
| Single Male/Father | 1,666 (4.4%) | 3.27 |
| Single Female/Mother | 6,789 (18.0%) | 3.39 |
| Non-family | 13,222 (35.0%) | 1.13 |
| Total Households | 37,793 (100.0%) | 2.46 |
Household Size by Marriage Status in Nash County
Out of a total of 37,793 households in Nash County, 24,571 (65.0%) are family households, while 13,222 (35.0%) are nonfamily households. The most numerous type of family households are 2-person households, comprising 11,512, and the most common type of nonfamily households are 1-person households, comprising 11,806.
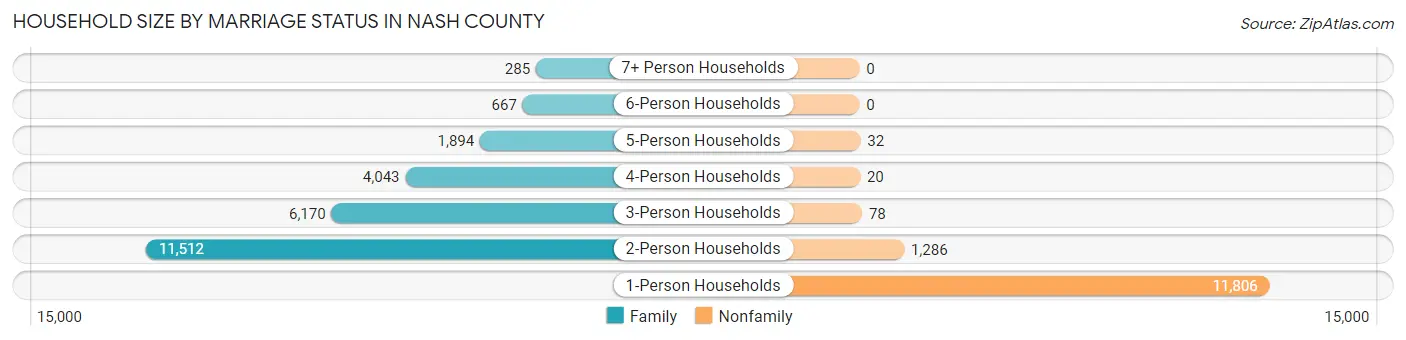
| Household Size | Family Households | Nonfamily Households |
| 1-Person Households | - | 11,806 (31.2%) |
| 2-Person Households | 11,512 (30.5%) | 1,286 (3.4%) |
| 3-Person Households | 6,170 (16.3%) | 78 (0.2%) |
| 4-Person Households | 4,043 (10.7%) | 20 (0.1%) |
| 5-Person Households | 1,894 (5.0%) | 32 (0.1%) |
| 6-Person Households | 667 (1.8%) | 0 (0.0%) |
| 7+ Person Households | 285 (0.7%) | 0 (0.0%) |
| Total | 24,571 (65.0%) | 13,222 (35.0%) |
Female Fertility in Nash County
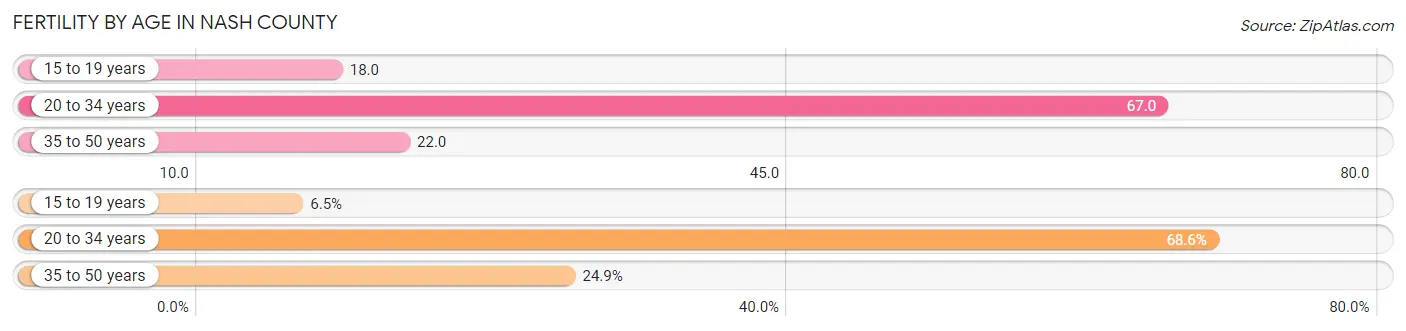
Fertility by Age in Nash County
Average fertility rate in Nash County is 40.0 births per 1,000 women. Women in the age bracket of 20 to 34 years have the highest fertility rate with 67.0 births per 1,000 women. Women in the age bracket of 20 to 34 years acount for 68.6% of all women with births.
| Age Bracket | Women with Births | Births / 1,000 Women |
| 15 to 19 years | 54 (6.5%) | 18.0 |
| 20 to 34 years | 572 (68.6%) | 67.0 |
| 35 to 50 years | 208 (24.9%) | 22.0 |
| Total | 834 (100.0%) | 40.0 |
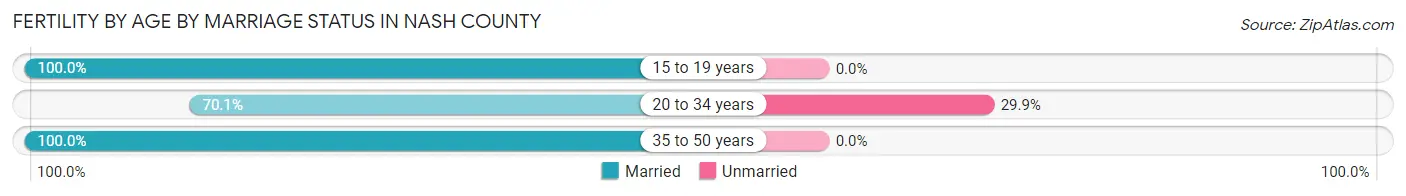
Fertility by Age by Marriage Status in Nash County
79.5% of women with births (834) in Nash County are married. The highest percentage of unmarried women with births falls into 20 to 34 years age bracket with 29.9% of them unmarried at the time of birth, while the lowest percentage of unmarried women with births belong to 15 to 19 years age bracket with 0.0% of them unmarried.
| Age Bracket | Married | Unmarried |
| 15 to 19 years | 54 (100.0%) | 0 (0.0%) |
| 20 to 34 years | 401 (70.1%) | 171 (29.9%) |
| 35 to 50 years | 208 (100.0%) | 0 (0.0%) |
| Total | 663 (79.5%) | 171 (20.5%) |
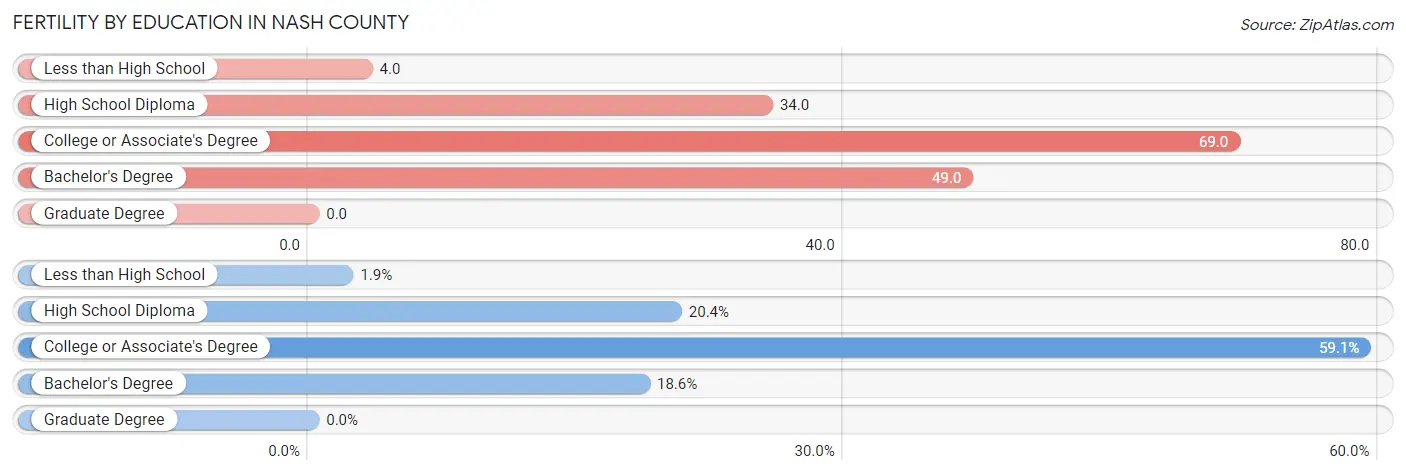
Fertility by Education in Nash County
| Educational Attainment | Women with Births | Births / 1,000 Women |
| Less than High School | 16 (1.9%) | 4.0 |
| High School Diploma | 170 (20.4%) | 34.0 |
| College or Associate's Degree | 493 (59.1%) | 69.0 |
| Bachelor's Degree | 155 (18.6%) | 49.0 |
| Graduate Degree | 0 (0.0%) | 0.0 |
| Total | 834 (100.0%) | 40.0 |
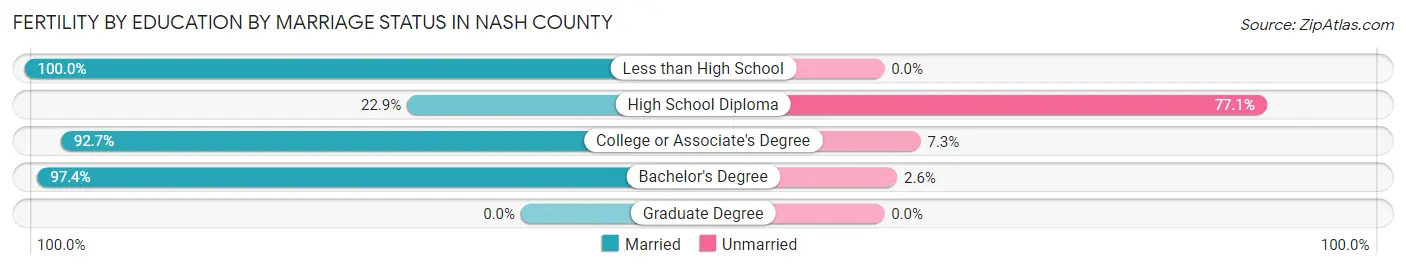
Fertility by Education by Marriage Status in Nash County
20.5% of women with births in Nash County are unmarried. Women with the educational attainment of less than high school are most likely to be married with 100.0% of them married at childbirth, while women with the educational attainment of high school diploma are least likely to be married with 77.1% of them unmarried at childbirth.
| Educational Attainment | Married | Unmarried |
| Less than High School | 16 (100.0%) | 0 (0.0%) |
| High School Diploma | 39 (22.9%) | 131 (77.1%) |
| College or Associate's Degree | 457 (92.7%) | 36 (7.3%) |
| Bachelor's Degree | 151 (97.4%) | 4 (2.6%) |
| Graduate Degree | 0 (0.0%) | 0 (0.0%) |
| Total | 663 (79.5%) | 171 (20.5%) |
Income in Nash County
Income Overview in Nash County
Per Capita Income in Nash County is $31,987, while median incomes of families and households are $69,593 and $56,770 respectively.
| Characteristic | Number | Measure |
| Per Capita Income | 95,015 | $31,987 |
| Median Family Income | 24,571 | $69,593 |
| Mean Family Income | 24,571 | $91,851 |
| Median Household Income | 37,793 | $56,770 |
| Mean Household Income | 37,793 | $77,266 |
| Income Deficit | 24,571 | $9,882 |
| Wage / Income Gap (%) | 95,015 | 20.34% |
| Wage / Income Gap ($) | 95,015 | 79.66¢ per $1 |
| Gini / Inequality Index | 95,015 | 0.45 |
Earnings by Sex in Nash County
Average Earnings in Nash County are $35,071, $41,070 for men and $32,717 for women, a difference of 20.3%.
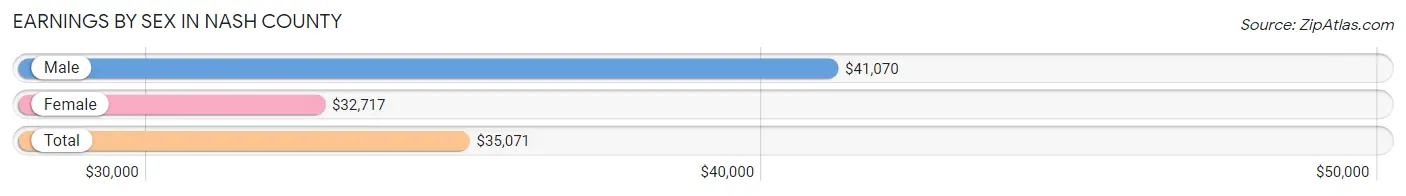
| Sex | Number | Average Earnings |
| Male | 24,572 (50.8%) | $41,070 |
| Female | 23,836 (49.2%) | $32,717 |
| Total | 48,408 (100.0%) | $35,071 |
Earnings by Sex by Income Bracket in Nash County
The most common earnings brackets in Nash County are $100,000+ for men (3,031 | 12.3%) and $25,000 to $29,999 for women (2,202 | 9.2%).
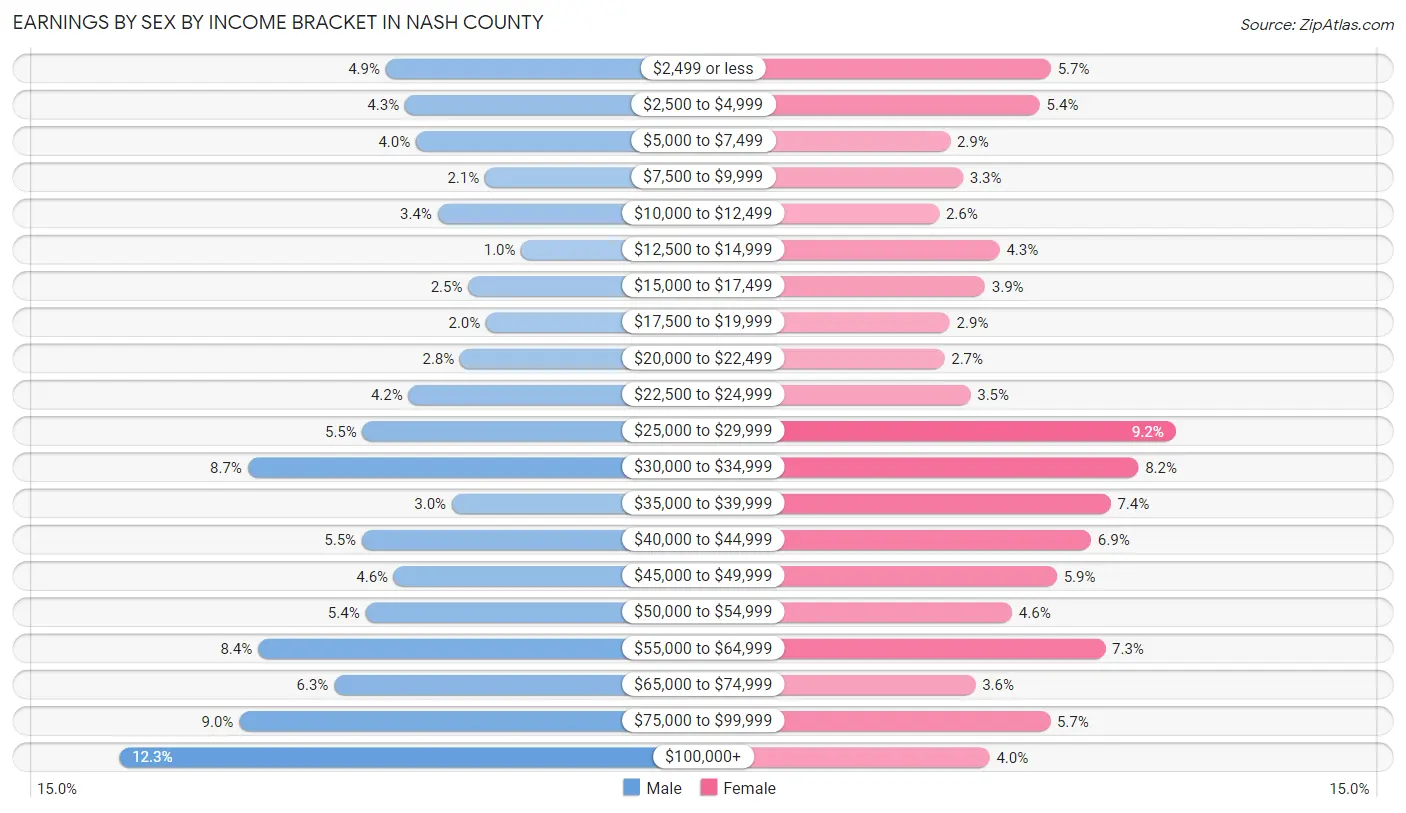
| Income | Male | Female |
| $2,499 or less | 1,192 (4.9%) | 1,366 (5.7%) |
| $2,500 to $4,999 | 1,060 (4.3%) | 1,293 (5.4%) |
| $5,000 to $7,499 | 982 (4.0%) | 692 (2.9%) |
| $7,500 to $9,999 | 505 (2.1%) | 778 (3.3%) |
| $10,000 to $12,499 | 834 (3.4%) | 617 (2.6%) |
| $12,500 to $14,999 | 256 (1.0%) | 1,022 (4.3%) |
| $15,000 to $17,499 | 621 (2.5%) | 924 (3.9%) |
| $17,500 to $19,999 | 499 (2.0%) | 690 (2.9%) |
| $20,000 to $22,499 | 677 (2.8%) | 652 (2.7%) |
| $22,500 to $24,999 | 1,035 (4.2%) | 827 (3.5%) |
| $25,000 to $29,999 | 1,352 (5.5%) | 2,202 (9.2%) |
| $30,000 to $34,999 | 2,145 (8.7%) | 1,951 (8.2%) |
| $35,000 to $39,999 | 735 (3.0%) | 1,767 (7.4%) |
| $40,000 to $44,999 | 1,356 (5.5%) | 1,634 (6.9%) |
| $45,000 to $49,999 | 1,135 (4.6%) | 1,406 (5.9%) |
| $50,000 to $54,999 | 1,331 (5.4%) | 1,105 (4.6%) |
| $55,000 to $64,999 | 2,075 (8.4%) | 1,730 (7.3%) |
| $65,000 to $74,999 | 1,547 (6.3%) | 861 (3.6%) |
| $75,000 to $99,999 | 2,204 (9.0%) | 1,362 (5.7%) |
| $100,000+ | 3,031 (12.3%) | 957 (4.0%) |
| Total | 24,572 (100.0%) | 23,836 (100.0%) |
Earnings by Sex by Educational Attainment in Nash County
Average earnings in Nash County are $46,319 for men and $36,310 for women, a difference of 21.6%. Men with an educational attainment of graduate degree enjoy the highest average annual earnings of $78,856, while those with less than high school education earn the least with $29,208. Women with an educational attainment of graduate degree earn the most with the average annual earnings of $59,496, while those with less than high school education have the smallest earnings of $17,902.
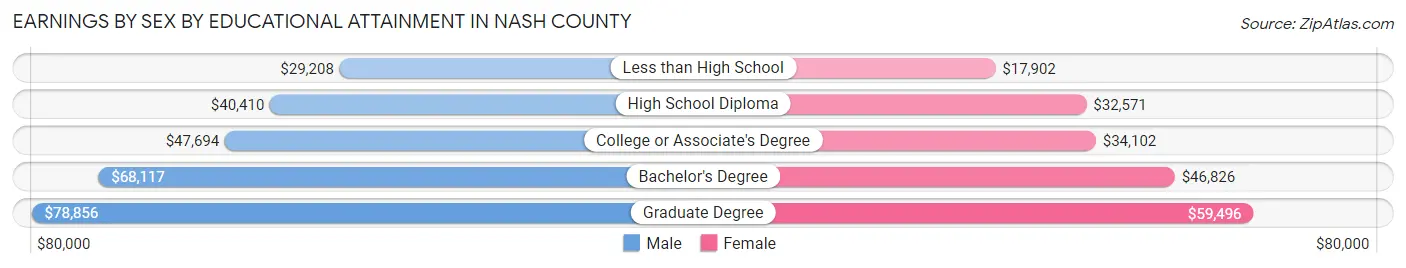
| Educational Attainment | Male Income | Female Income |
| Less than High School | $29,208 | $17,902 |
| High School Diploma | $40,410 | $32,571 |
| College or Associate's Degree | $47,694 | $34,102 |
| Bachelor's Degree | $68,117 | $46,826 |
| Graduate Degree | $78,856 | $59,496 |
| Total | $46,319 | $36,310 |
Family Income in Nash County
Family Income Brackets in Nash County
According to the Nash County family income data, there are 5,332 families falling into the $50,000 to $74,999 income range, which is the most common income bracket and makes up 21.7% of all families. Conversely, the $10,000 to $14,999 income bracket is the least frequent group with only 590 families (2.4%) belonging to this category.
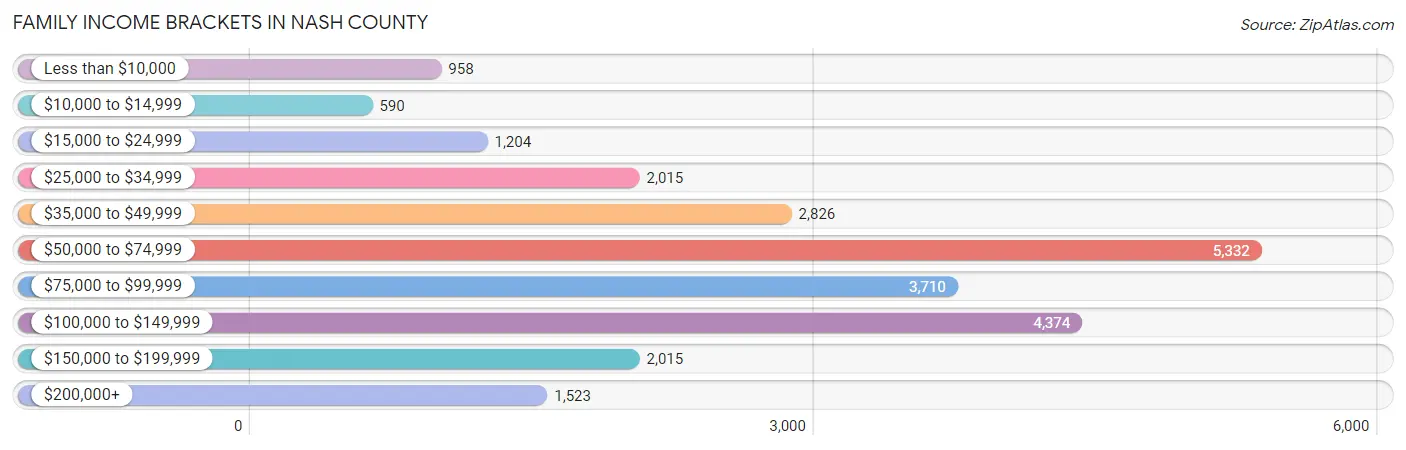
| Income Bracket | # Families | % Families |
| Less than $10,000 | 958 | 3.9% |
| $10,000 to $14,999 | 590 | 2.4% |
| $15,000 to $24,999 | 1,204 | 4.9% |
| $25,000 to $34,999 | 2,015 | 8.2% |
| $35,000 to $49,999 | 2,826 | 11.5% |
| $50,000 to $74,999 | 5,332 | 21.7% |
| $75,000 to $99,999 | 3,710 | 15.1% |
| $100,000 to $149,999 | 4,374 | 17.8% |
| $150,000 to $199,999 | 2,015 | 8.2% |
| $200,000+ | 1,523 | 6.2% |
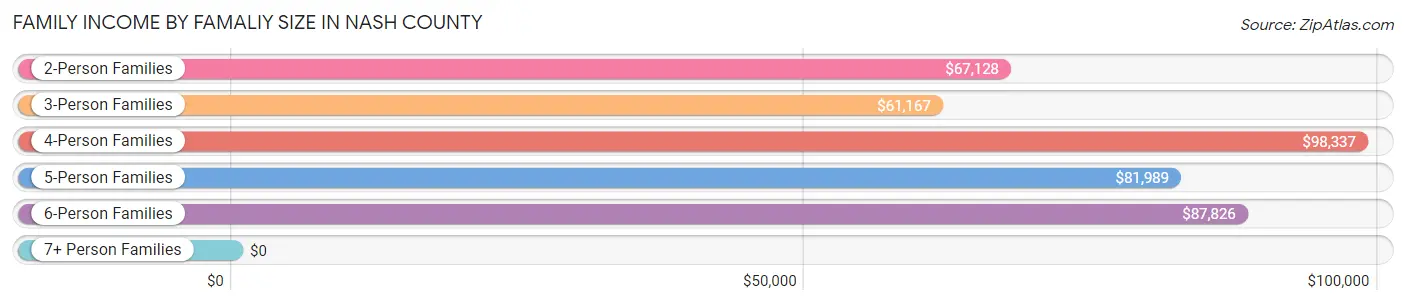
Family Income by Famaliy Size in Nash County
4-person families (3,475 | 14.1%) account for the highest median family income in Nash County with $98,337 per family, while 2-person families (12,414 | 50.5%) have the highest median income of $33,564 per family member.
| Income Bracket | # Families | Median Income |
| 2-Person Families | 12,414 (50.5%) | $67,128 |
| 3-Person Families | 6,130 (24.9%) | $61,167 |
| 4-Person Families | 3,475 (14.1%) | $98,337 |
| 5-Person Families | 1,624 (6.6%) | $81,989 |
| 6-Person Families | 666 (2.7%) | $87,826 |
| 7+ Person Families | 262 (1.1%) | $0 |
| Total | 24,571 (100.0%) | $69,593 |
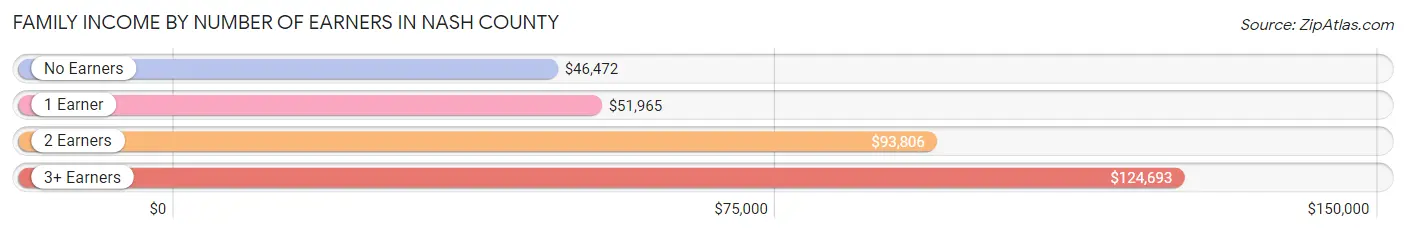
Family Income by Number of Earners in Nash County
The median family income in Nash County is $69,593, with families comprising 3+ earners (2,444) having the highest median family income of $124,693, while families with no earners (4,041) have the lowest median family income of $46,472, accounting for 10.0% and 16.5% of families, respectively.
| Number of Earners | # Families | Median Income |
| No Earners | 4,041 (16.5%) | $46,472 |
| 1 Earner | 8,306 (33.8%) | $51,965 |
| 2 Earners | 9,780 (39.8%) | $93,806 |
| 3+ Earners | 2,444 (10.0%) | $124,693 |
| Total | 24,571 (100.0%) | $69,593 |
Household Income in Nash County
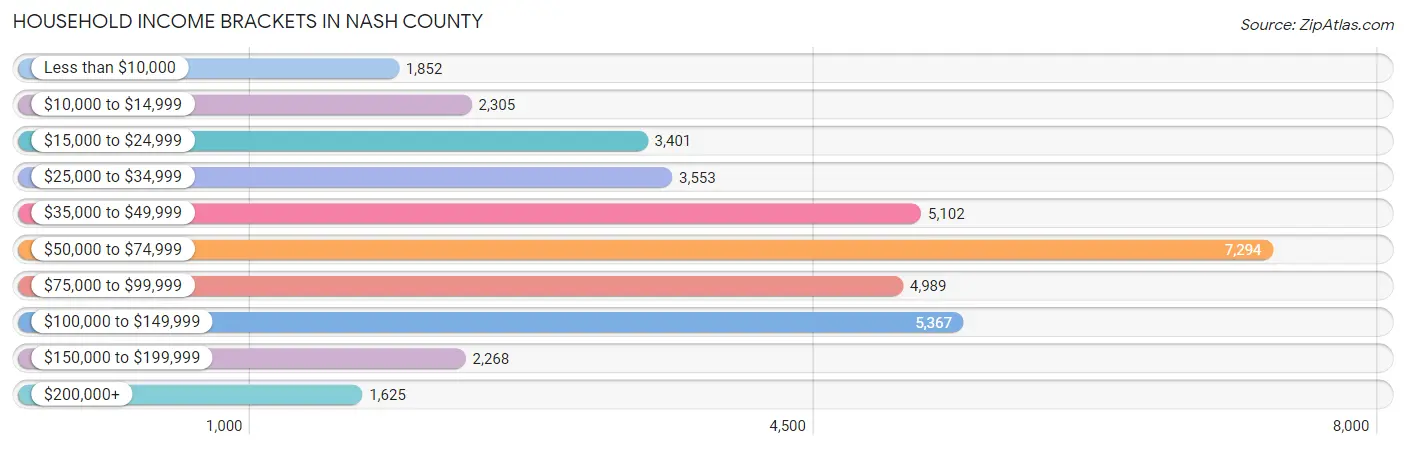
Household Income Brackets in Nash County
With 7,294 households falling in the category, the $50,000 to $74,999 income range is the most frequent in Nash County, accounting for 19.3% of all households. In contrast, only 1,625 households (4.3%) fall into the $200,000+ income bracket, making it the least populous group.
| Income Bracket | # Households | % Households |
| Less than $10,000 | 1,852 | 4.9% |
| $10,000 to $14,999 | 2,305 | 6.1% |
| $15,000 to $24,999 | 3,401 | 9.0% |
| $25,000 to $34,999 | 3,553 | 9.4% |
| $35,000 to $49,999 | 5,102 | 13.5% |
| $50,000 to $74,999 | 7,294 | 19.3% |
| $75,000 to $99,999 | 4,989 | 13.2% |
| $100,000 to $149,999 | 5,367 | 14.2% |
| $150,000 to $199,999 | 2,268 | 6.0% |
| $200,000+ | 1,625 | 4.3% |
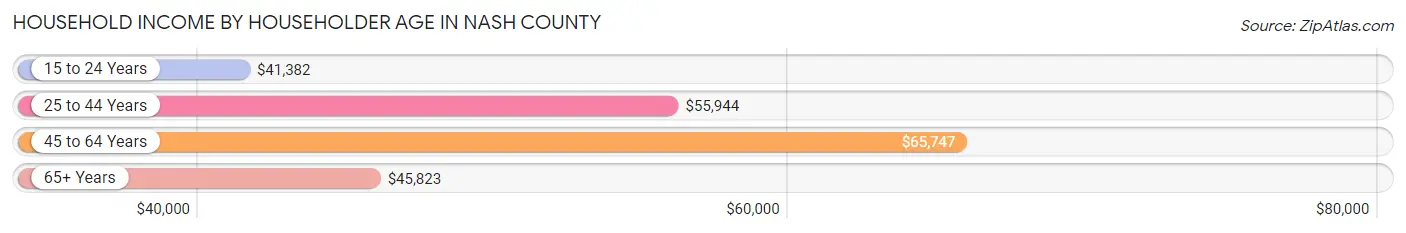
Household Income by Householder Age in Nash County
The median household income in Nash County is $56,770, with the highest median household income of $65,747 found in the 45 to 64 years age bracket for the primary householder. A total of 14,727 households (39.0%) fall into this category. Meanwhile, the 15 to 24 years age bracket for the primary householder has the lowest median household income of $41,382, with 1,032 households (2.7%) in this group.
| Income Bracket | # Households | Median Income |
| 15 to 24 Years | 1,032 (2.7%) | $41,382 |
| 25 to 44 Years | 10,330 (27.3%) | $55,944 |
| 45 to 64 Years | 14,727 (39.0%) | $65,747 |
| 65+ Years | 11,704 (31.0%) | $45,823 |
| Total | 37,793 (100.0%) | $56,770 |
Poverty in Nash County
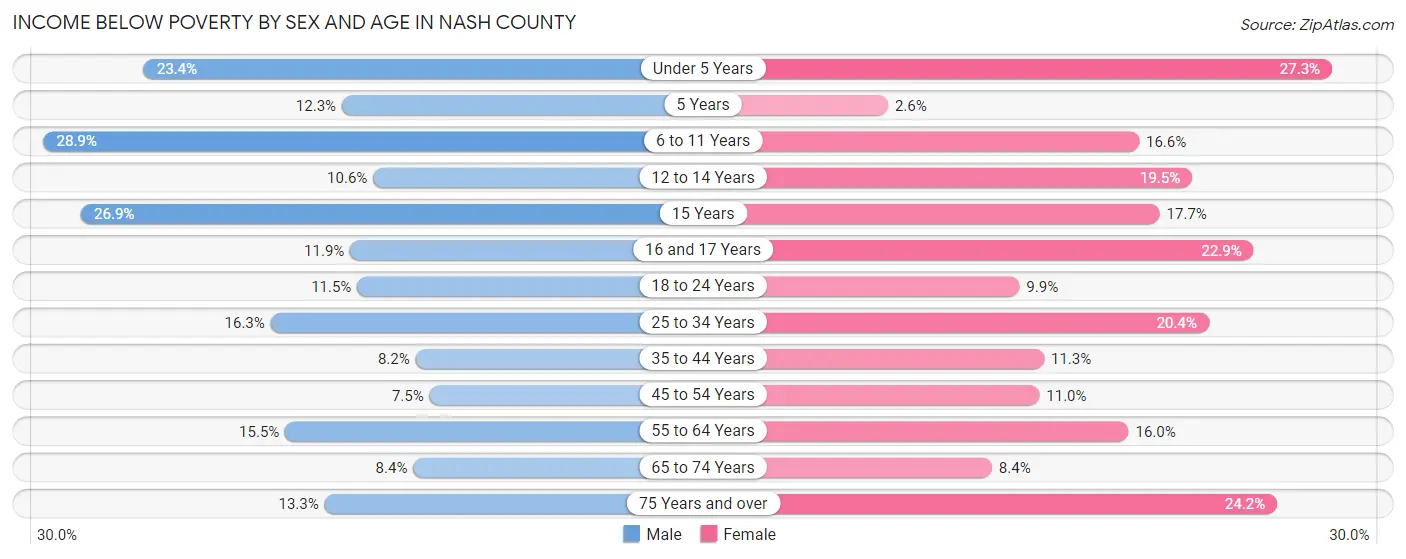
Income Below Poverty by Sex and Age in Nash County
With 13.6% poverty level for males and 15.4% for females among the residents of Nash County, 6 to 11 year old males and under 5 year old females are the most vulnerable to poverty, with 988 males (28.9%) and 730 females (27.3%) in their respective age groups living below the poverty level.
| Age Bracket | Male | Female |
| Under 5 Years | 533 (23.4%) | 730 (27.3%) |
| 5 Years | 55 (12.3%) | 10 (2.6%) |
| 6 to 11 Years | 988 (28.9%) | 669 (16.6%) |
| 12 to 14 Years | 209 (10.6%) | 251 (19.5%) |
| 15 Years | 120 (26.9%) | 126 (17.7%) |
| 16 and 17 Years | 173 (11.9%) | 266 (22.9%) |
| 18 to 24 Years | 439 (11.5%) | 369 (9.9%) |
| 25 to 34 Years | 907 (16.3%) | 1,160 (20.4%) |
| 35 to 44 Years | 424 (8.2%) | 639 (11.3%) |
| 45 to 54 Years | 445 (7.4%) | 697 (11.0%) |
| 55 to 64 Years | 997 (15.5%) | 1,112 (16.0%) |
| 65 to 74 Years | 414 (8.4%) | 494 (8.4%) |
| 75 Years and over | 342 (13.3%) | 954 (24.2%) |
| Total | 6,046 (13.6%) | 7,477 (15.4%) |
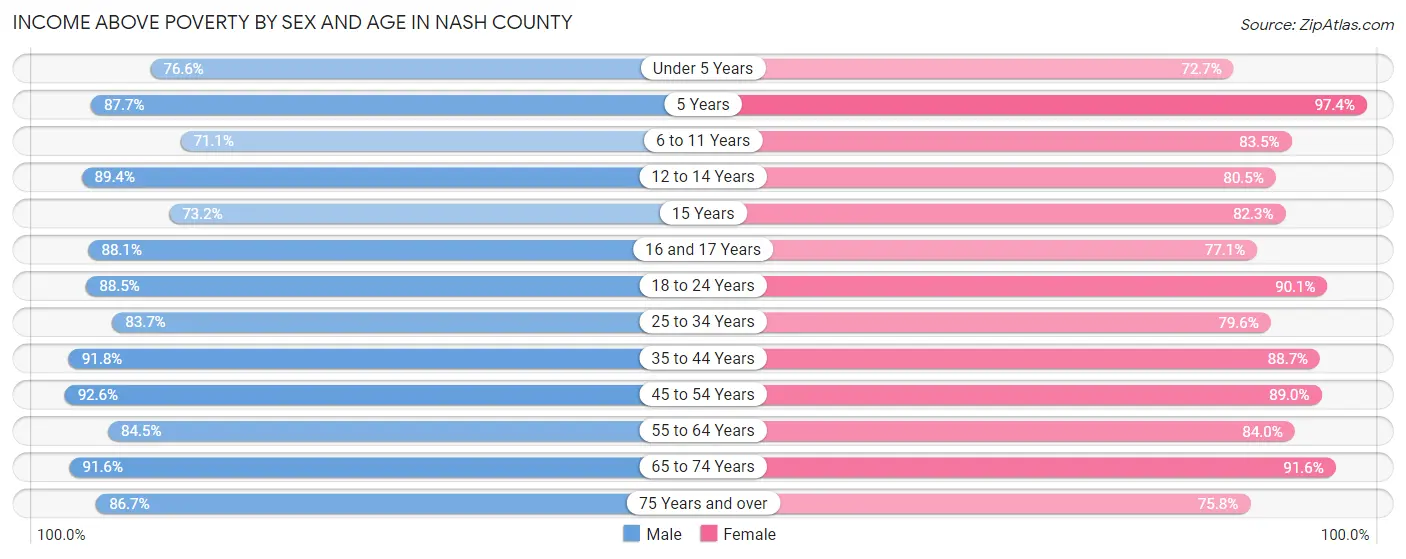
Income Above Poverty by Sex and Age in Nash County
According to the poverty statistics in Nash County, males aged 45 to 54 years and females aged 5 years are the age groups that are most secure financially, with 92.5% of males and 97.4% of females in these age groups living above the poverty line.
| Age Bracket | Male | Female |
| Under 5 Years | 1,749 (76.6%) | 1,945 (72.7%) |
| 5 Years | 391 (87.7%) | 379 (97.4%) |
| 6 to 11 Years | 2,426 (71.1%) | 3,373 (83.5%) |
| 12 to 14 Years | 1,765 (89.4%) | 1,036 (80.5%) |
| 15 Years | 327 (73.2%) | 586 (82.3%) |
| 16 and 17 Years | 1,284 (88.1%) | 894 (77.1%) |
| 18 to 24 Years | 3,384 (88.5%) | 3,363 (90.1%) |
| 25 to 34 Years | 4,656 (83.7%) | 4,517 (79.6%) |
| 35 to 44 Years | 4,731 (91.8%) | 5,035 (88.7%) |
| 45 to 54 Years | 5,527 (92.5%) | 5,639 (89.0%) |
| 55 to 64 Years | 5,438 (84.5%) | 5,852 (84.0%) |
| 65 to 74 Years | 4,540 (91.6%) | 5,414 (91.6%) |
| 75 Years and over | 2,229 (86.7%) | 2,981 (75.8%) |
| Total | 38,447 (86.4%) | 41,014 (84.6%) |
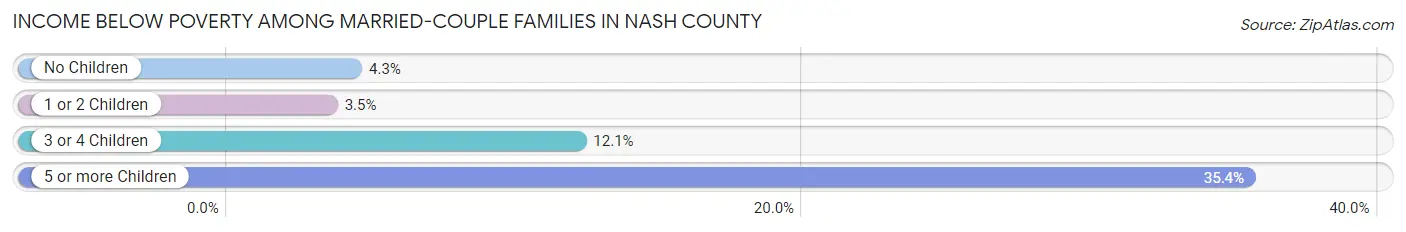
Income Below Poverty Among Married-Couple Families in Nash County
The poverty statistics for married-couple families in Nash County show that 4.8% or 765 of the total 16,116 families live below the poverty line. Families with 5 or more children have the highest poverty rate of 35.4%, comprising of 28 families. On the other hand, families with 1 or 2 children have the lowest poverty rate of 3.5%, which includes 164 families.
| Children | Above Poverty | Below Poverty |
| No Children | 9,775 (95.7%) | 441 (4.3%) |
| 1 or 2 Children | 4,569 (96.5%) | 164 (3.5%) |
| 3 or 4 Children | 956 (87.9%) | 132 (12.1%) |
| 5 or more Children | 51 (64.6%) | 28 (35.4%) |
| Total | 15,351 (95.3%) | 765 (4.8%) |
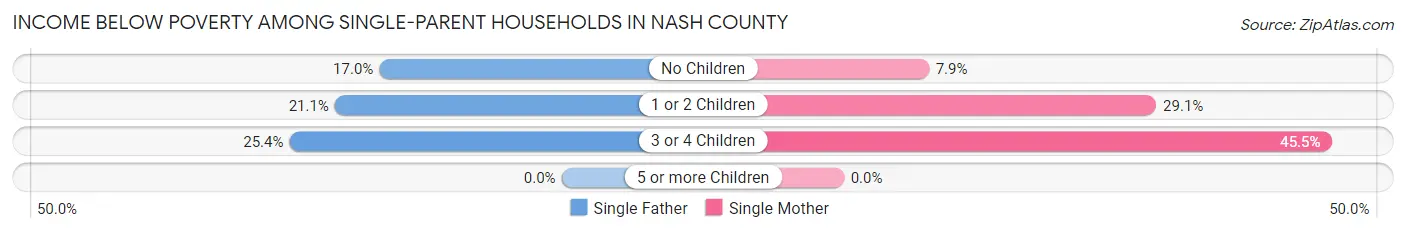
Income Below Poverty Among Single-Parent Households in Nash County
According to the poverty data in Nash County, 19.3% or 322 single-father households and 22.1% or 1,500 single-mother households are living below the poverty line. Among single-father households, those with 3 or 4 children have the highest poverty rate, with 18 households (25.4%) experiencing poverty. Likewise, among single-mother households, those with 3 or 4 children have the highest poverty rate, with 298 households (45.5%) falling below the poverty line.
| Children | Single Father | Single Mother |
| No Children | 135 (17.0%) | 218 (7.9%) |
| 1 or 2 Children | 169 (21.1%) | 984 (29.1%) |
| 3 or 4 Children | 18 (25.4%) | 298 (45.5%) |
| 5 or more Children | 0 (0.0%) | 0 (0.0%) |
| Total | 322 (19.3%) | 1,500 (22.1%) |
Income Below Poverty Among Married-Couple vs Single-Parent Households in Nash County
The poverty data for Nash County shows that 765 of the married-couple family households (4.8%) and 1,822 of the single-parent households (21.5%) are living below the poverty level. Within the married-couple family households, those with 5 or more children have the highest poverty rate, with 28 households (35.4%) falling below the poverty line. Among the single-parent households, those with 3 or 4 children have the highest poverty rate, with 316 household (43.5%) living below poverty.
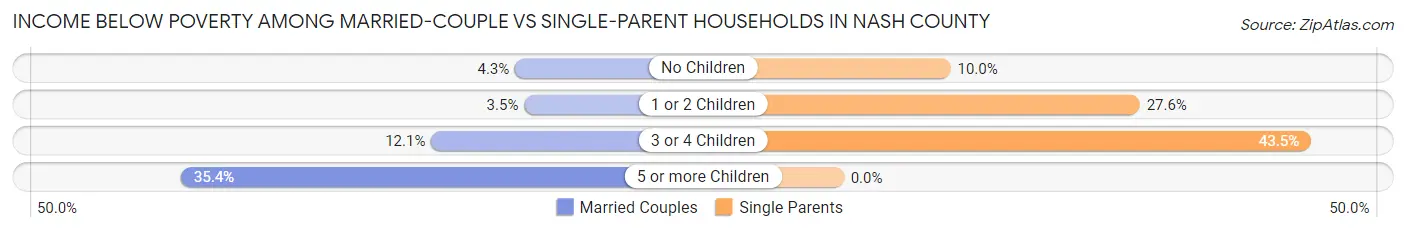
| Children | Married-Couple Families | Single-Parent Households |
| No Children | 441 (4.3%) | 353 (10.0%) |
| 1 or 2 Children | 164 (3.5%) | 1,153 (27.6%) |
| 3 or 4 Children | 132 (12.1%) | 316 (43.5%) |
| 5 or more Children | 28 (35.4%) | 0 (0.0%) |
| Total | 765 (4.8%) | 1,822 (21.5%) |
Employment Characteristics in Nash County
Employment by Class of Employer in Nash County
Among the 42,444 employed individuals in Nash County, private company employees (31,126 | 73.3%), local government employees (2,697 | 6.4%), and not-for-profit organizations (2,293 | 5.4%) make up the most common classes of employment.
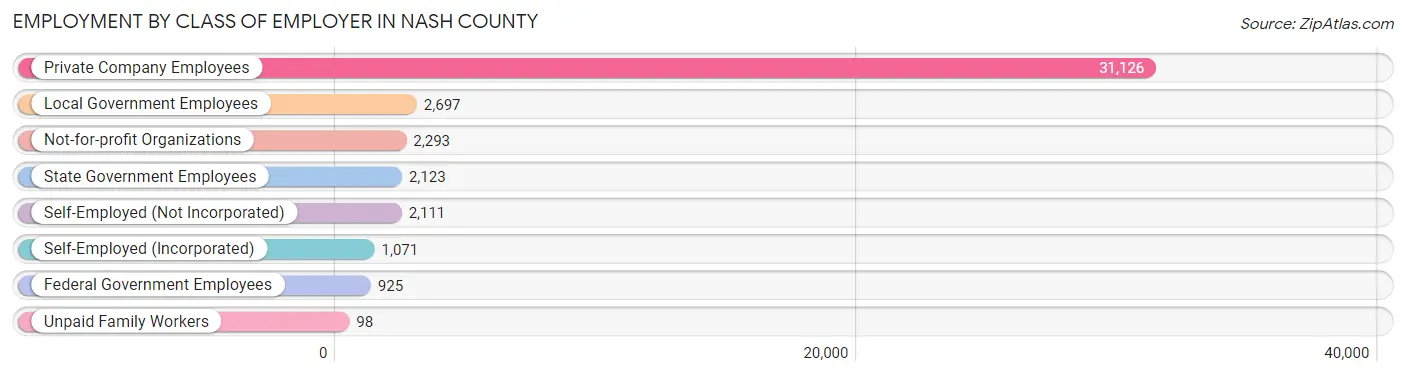
| Employer Class | # Employees | % Employees |
| Private Company Employees | 31,126 | 73.3% |
| Self-Employed (Incorporated) | 1,071 | 2.5% |
| Self-Employed (Not Incorporated) | 2,111 | 5.0% |
| Not-for-profit Organizations | 2,293 | 5.4% |
| Local Government Employees | 2,697 | 6.4% |
| State Government Employees | 2,123 | 5.0% |
| Federal Government Employees | 925 | 2.2% |
| Unpaid Family Workers | 98 | 0.2% |
| Total | 42,444 | 100.0% |
Employment Status by Age in Nash County
According to the labor force statistics for Nash County, out of the total population over 16 years of age (76,813), 60.1% or 46,165 individuals are in the labor force, with 6.4% or 2,955 of them unemployed. The age group with the highest labor force participation rate is 25 to 29 years, with 85.4% or 5,016 individuals in the labor force. Within the labor force, the 20 to 24 years age range has the highest percentage of unemployed individuals, with 15.2% or 666 of them being unemployed.
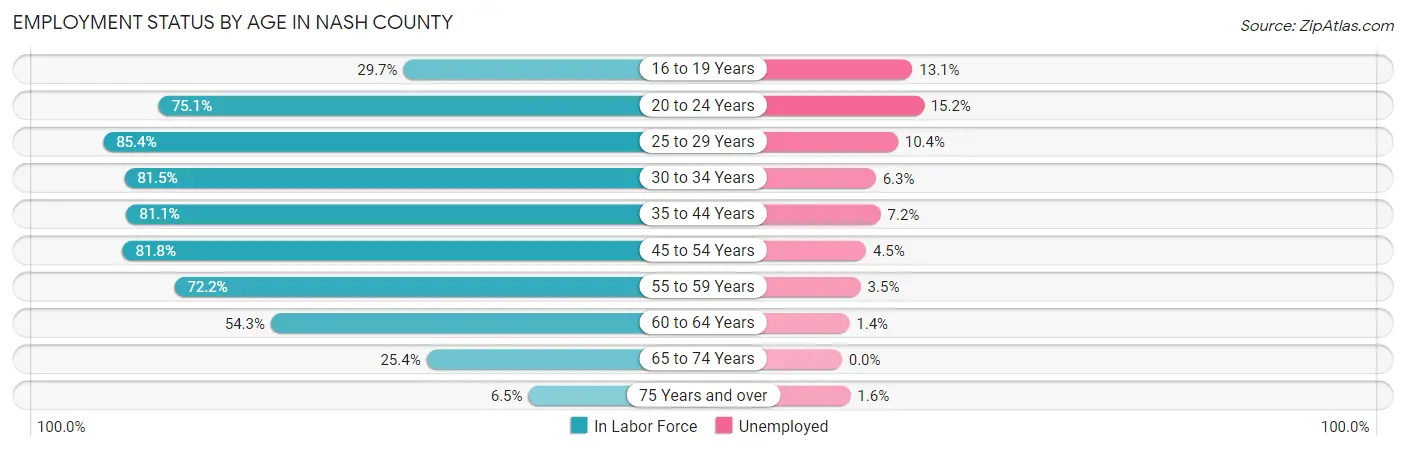
| Age Bracket | In Labor Force | Unemployed |
| 16 to 19 Years | 1,428 (29.7%) | 187 (13.1%) |
| 20 to 24 Years | 4,381 (75.1%) | 666 (15.2%) |
| 25 to 29 Years | 5,016 (85.4%) | 522 (10.4%) |
| 30 to 34 Years | 4,416 (81.5%) | 278 (6.3%) |
| 35 to 44 Years | 8,925 (81.1%) | 643 (7.2%) |
| 45 to 54 Years | 10,211 (81.8%) | 459 (4.5%) |
| 55 to 59 Years | 4,878 (72.2%) | 171 (3.5%) |
| 60 to 64 Years | 3,692 (54.3%) | 52 (1.4%) |
| 65 to 74 Years | 2,811 (25.4%) | 0 (0.0%) |
| 75 Years and over | 440 (6.5%) | 7 (1.6%) |
| Total | 46,165 (60.1%) | 2,955 (6.4%) |
Employment Status by Educational Attainment in Nash County
According to labor force statistics for Nash County, 76.8% of individuals (37,121) out of the total population between 25 and 64 years of age (48,335) are in the labor force, with 5.7% or 2,116 of them being unemployed. The group with the highest labor force participation rate are those with the educational attainment of bachelor's degree or higher, with 84.3% or 9,115 individuals in the labor force. Within the labor force, individuals with less than high school education have the highest percentage of unemployment, with 10.3% or 340 of them being unemployed.
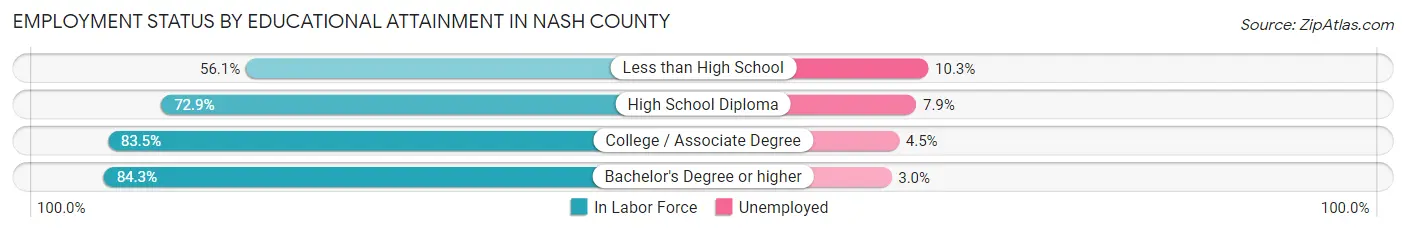
| Educational Attainment | In Labor Force | Unemployed |
| Less than High School | 3,304 (56.1%) | 607 (10.3%) |
| High School Diploma | 11,520 (72.9%) | 1,248 (7.9%) |
| College / Associate Degree | 13,218 (83.5%) | 712 (4.5%) |
| Bachelor's Degree or higher | 9,115 (84.3%) | 324 (3.0%) |
| Total | 37,121 (76.8%) | 2,755 (5.7%) |
Employment Occupations by Sex in Nash County
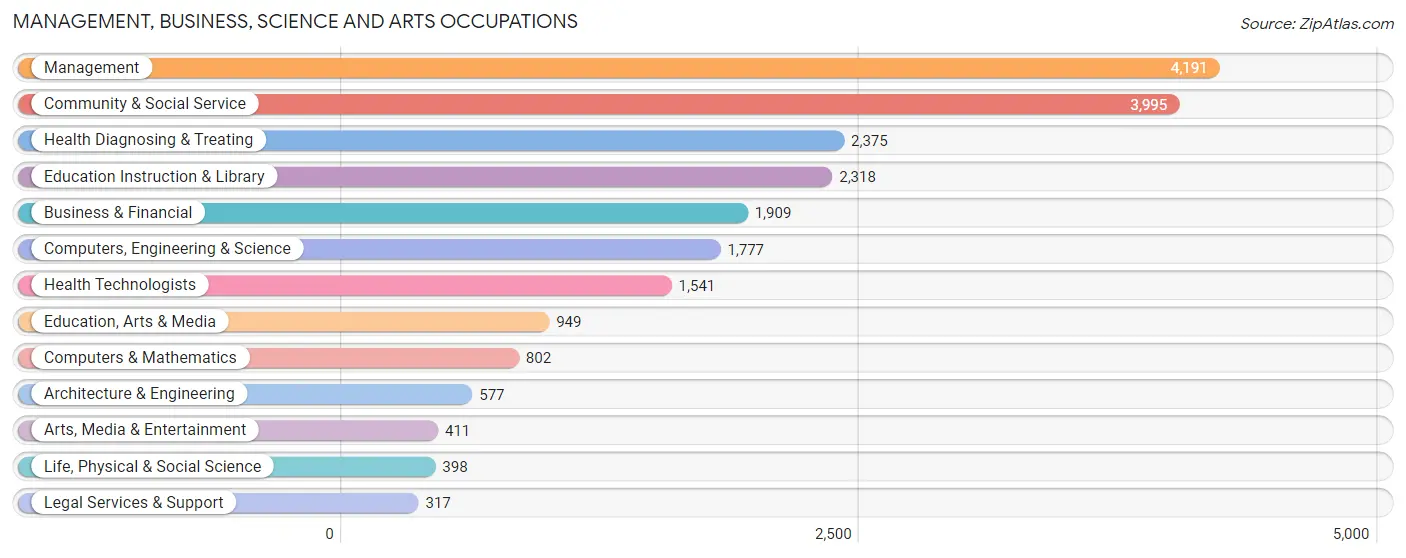
Management, Business, Science and Arts Occupations
The most common Management, Business, Science and Arts occupations in Nash County are Management (4,191 | 9.7%), Community & Social Service (3,995 | 9.2%), Health Diagnosing & Treating (2,375 | 5.5%), Education Instruction & Library (2,318 | 5.4%), and Business & Financial (1,909 | 4.4%).
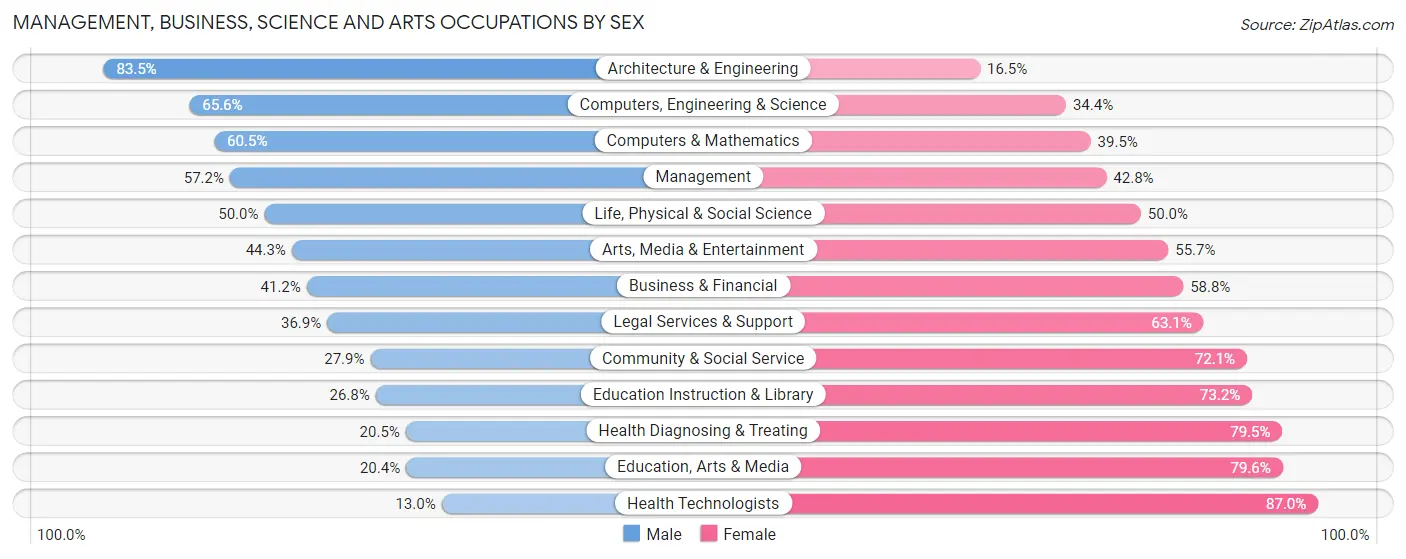
Management, Business, Science and Arts Occupations by Sex
Within the Management, Business, Science and Arts occupations in Nash County, the most male-oriented occupations are Architecture & Engineering (83.5%), Computers, Engineering & Science (65.6%), and Computers & Mathematics (60.5%), while the most female-oriented occupations are Health Technologists (87.0%), Education, Arts & Media (79.6%), and Health Diagnosing & Treating (79.5%).
| Occupation | Male | Female |
| Management | 2,397 (57.2%) | 1,794 (42.8%) |
| Business & Financial | 786 (41.2%) | 1,123 (58.8%) |
| Computers, Engineering & Science | 1,166 (65.6%) | 611 (34.4%) |
| Computers & Mathematics | 485 (60.5%) | 317 (39.5%) |
| Architecture & Engineering | 482 (83.5%) | 95 (16.5%) |
| Life, Physical & Social Science | 199 (50.0%) | 199 (50.0%) |
| Community & Social Service | 1,114 (27.9%) | 2,881 (72.1%) |
| Education, Arts & Media | 194 (20.4%) | 755 (79.6%) |
| Legal Services & Support | 117 (36.9%) | 200 (63.1%) |
| Education Instruction & Library | 621 (26.8%) | 1,697 (73.2%) |
| Arts, Media & Entertainment | 182 (44.3%) | 229 (55.7%) |
| Health Diagnosing & Treating | 487 (20.5%) | 1,888 (79.5%) |
| Health Technologists | 201 (13.0%) | 1,340 (87.0%) |
| Total (Category) | 5,950 (41.8%) | 8,297 (58.2%) |
| Total (Overall) | 22,094 (51.2%) | 21,079 (48.8%) |
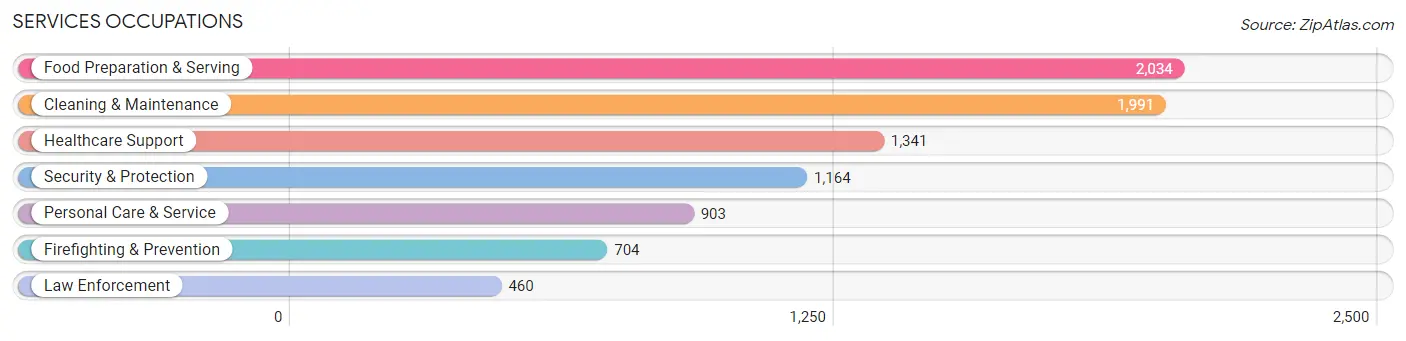
Services Occupations
The most common Services occupations in Nash County are Food Preparation & Serving (2,034 | 4.7%), Cleaning & Maintenance (1,991 | 4.6%), Healthcare Support (1,341 | 3.1%), Security & Protection (1,164 | 2.7%), and Personal Care & Service (903 | 2.1%).
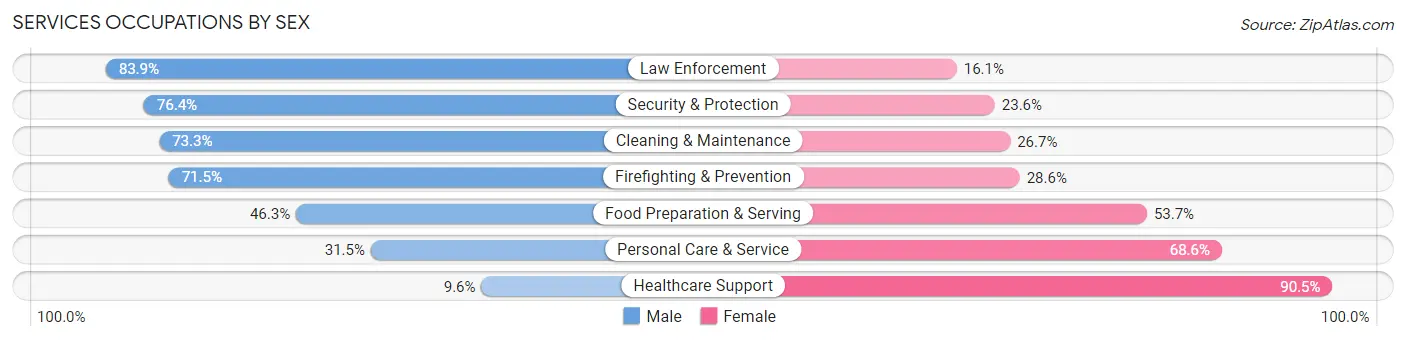
Services Occupations by Sex
Within the Services occupations in Nash County, the most male-oriented occupations are Law Enforcement (83.9%), Security & Protection (76.4%), and Cleaning & Maintenance (73.3%), while the most female-oriented occupations are Healthcare Support (90.4%), Personal Care & Service (68.5%), and Food Preparation & Serving (53.7%).
| Occupation | Male | Female |
| Healthcare Support | 128 (9.6%) | 1,213 (90.4%) |
| Security & Protection | 889 (76.4%) | 275 (23.6%) |
| Firefighting & Prevention | 503 (71.5%) | 201 (28.5%) |
| Law Enforcement | 386 (83.9%) | 74 (16.1%) |
| Food Preparation & Serving | 941 (46.3%) | 1,093 (53.7%) |
| Cleaning & Maintenance | 1,460 (73.3%) | 531 (26.7%) |
| Personal Care & Service | 284 (31.5%) | 619 (68.5%) |
| Total (Category) | 3,702 (49.8%) | 3,731 (50.2%) |
| Total (Overall) | 22,094 (51.2%) | 21,079 (48.8%) |
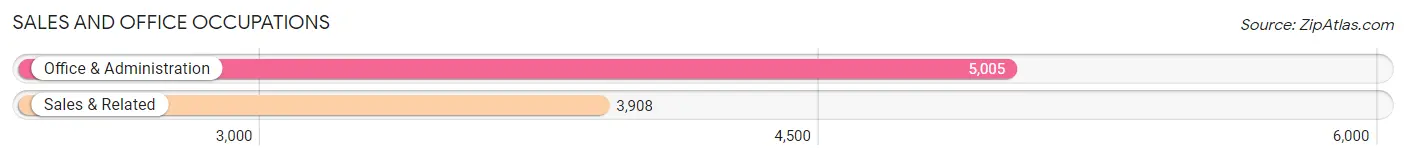
Sales and Office Occupations
The most common Sales and Office occupations in Nash County are Office & Administration (5,005 | 11.6%), and Sales & Related (3,908 | 9.0%).
Sales and Office Occupations by Sex
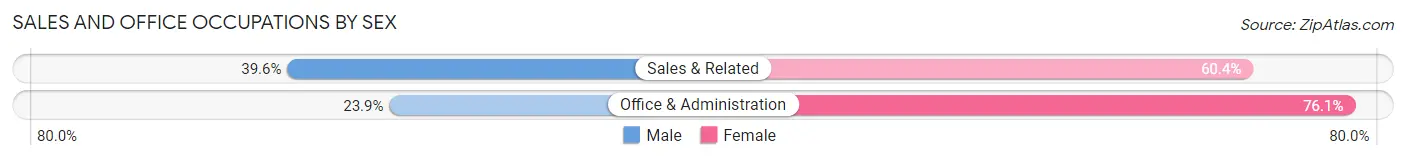
| Occupation | Male | Female |
| Sales & Related | 1,547 (39.6%) | 2,361 (60.4%) |
| Office & Administration | 1,196 (23.9%) | 3,809 (76.1%) |
| Total (Category) | 2,743 (30.8%) | 6,170 (69.2%) |
| Total (Overall) | 22,094 (51.2%) | 21,079 (48.8%) |
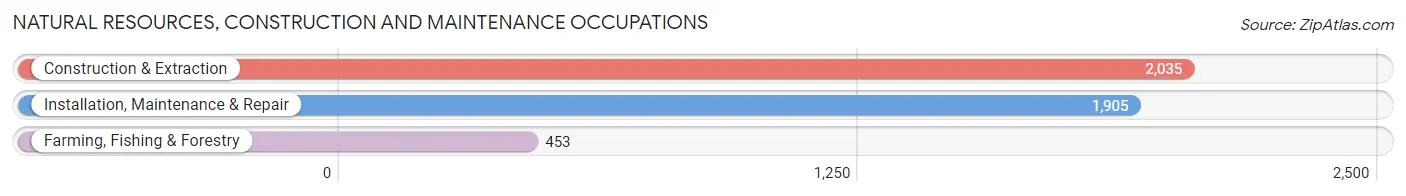
Natural Resources, Construction and Maintenance Occupations
The most common Natural Resources, Construction and Maintenance occupations in Nash County are Construction & Extraction (2,035 | 4.7%), Installation, Maintenance & Repair (1,905 | 4.4%), and Farming, Fishing & Forestry (453 | 1.1%).
Natural Resources, Construction and Maintenance Occupations by Sex
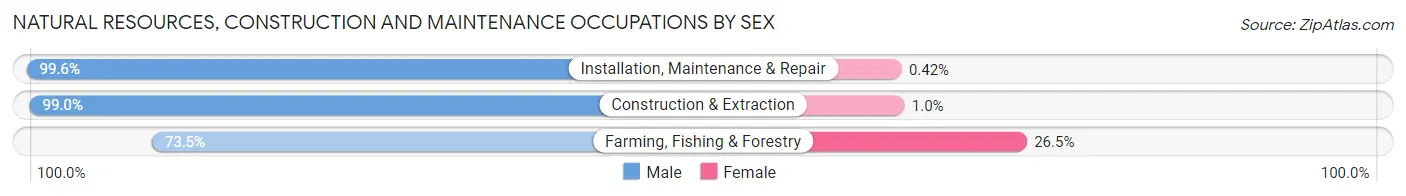
| Occupation | Male | Female |
| Farming, Fishing & Forestry | 333 (73.5%) | 120 (26.5%) |
| Construction & Extraction | 2,014 (99.0%) | 21 (1.0%) |
| Installation, Maintenance & Repair | 1,897 (99.6%) | 8 (0.4%) |
| Total (Category) | 4,244 (96.6%) | 149 (3.4%) |
| Total (Overall) | 22,094 (51.2%) | 21,079 (48.8%) |
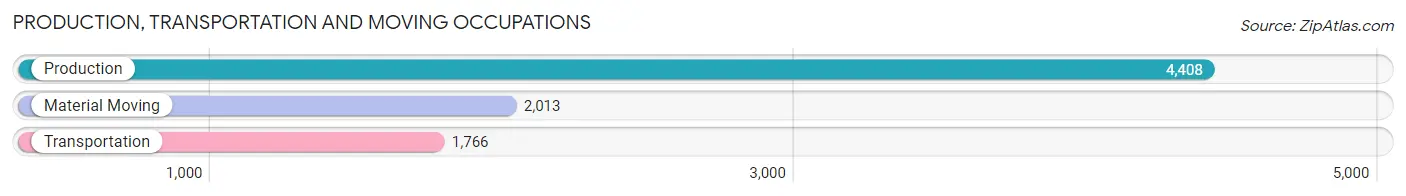
Production, Transportation and Moving Occupations
The most common Production, Transportation and Moving occupations in Nash County are Production (4,408 | 10.2%), Material Moving (2,013 | 4.7%), and Transportation (1,766 | 4.1%).
Production, Transportation and Moving Occupations by Sex
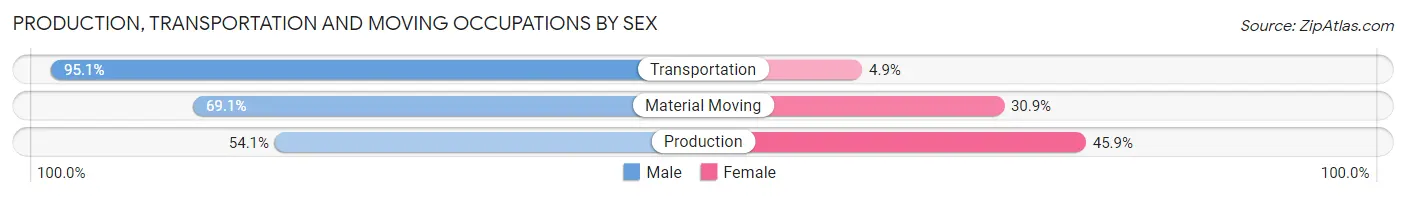
| Occupation | Male | Female |
| Production | 2,384 (54.1%) | 2,024 (45.9%) |
| Transportation | 1,680 (95.1%) | 86 (4.9%) |
| Material Moving | 1,391 (69.1%) | 622 (30.9%) |
| Total (Category) | 5,455 (66.6%) | 2,732 (33.4%) |
| Total (Overall) | 22,094 (51.2%) | 21,079 (48.8%) |
Employment Industries by Sex in Nash County
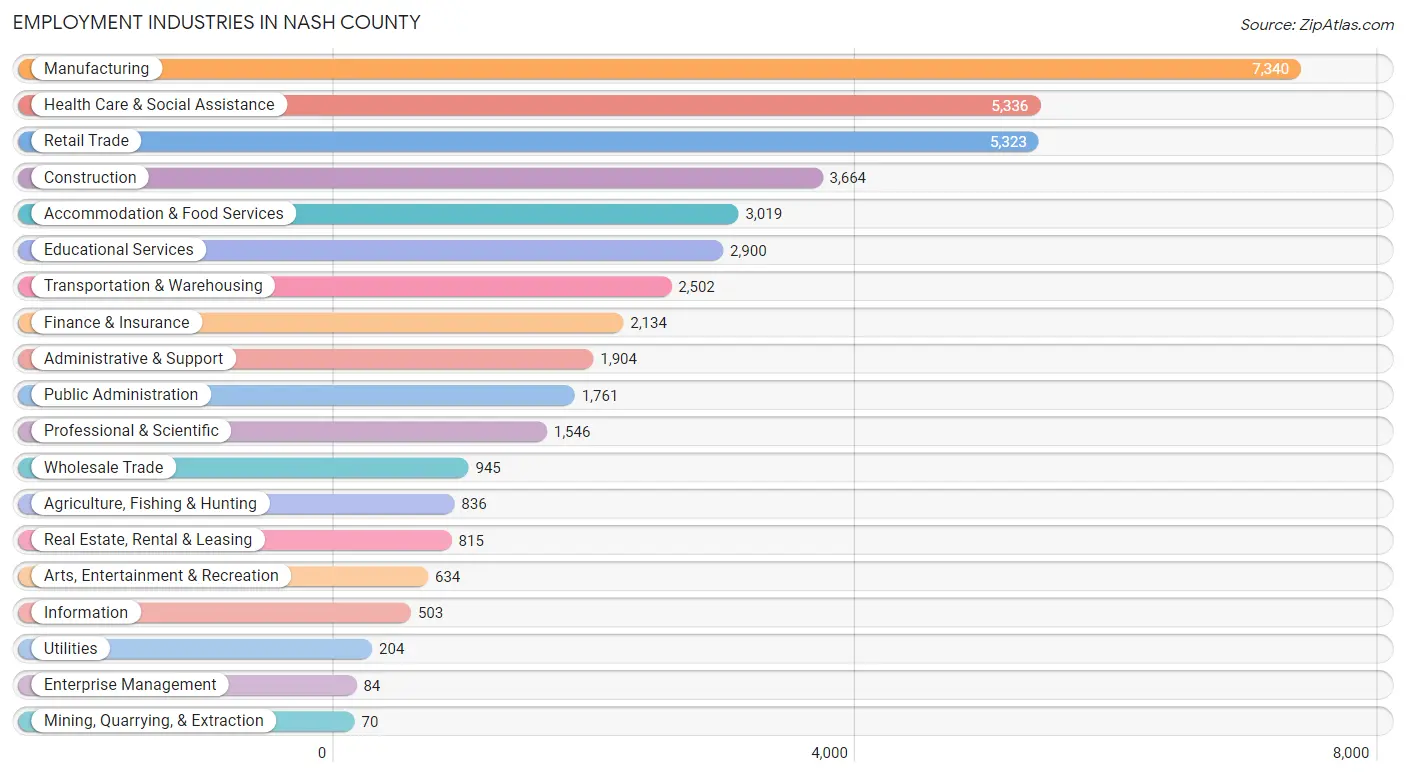
Employment Industries in Nash County
The major employment industries in Nash County include Manufacturing (7,340 | 17.0%), Health Care & Social Assistance (5,336 | 12.4%), Retail Trade (5,323 | 12.3%), Construction (3,664 | 8.5%), and Accommodation & Food Services (3,019 | 7.0%).
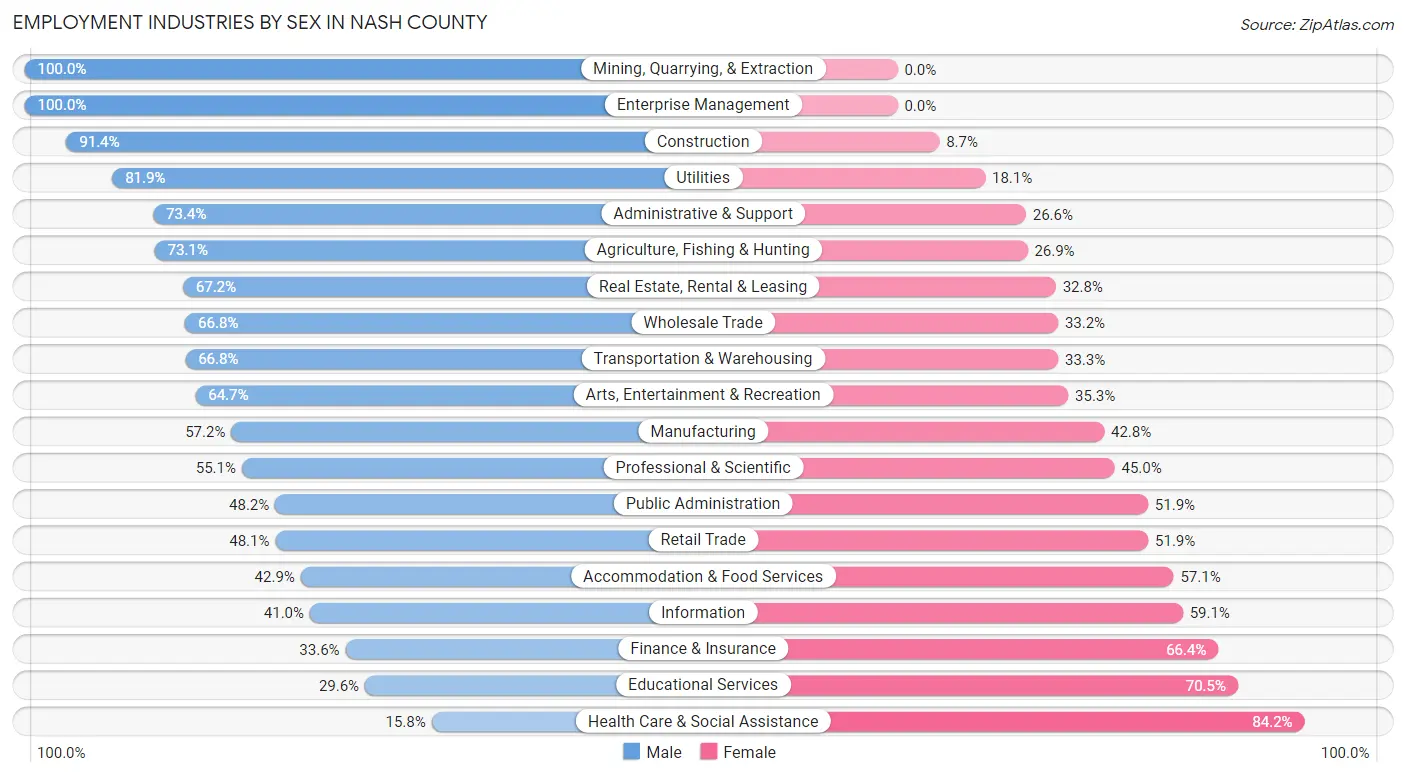
Employment Industries by Sex in Nash County
The Nash County industries that see more men than women are Mining, Quarrying, & Extraction (100.0%), Enterprise Management (100.0%), and Construction (91.3%), whereas the industries that tend to have a higher number of women are Health Care & Social Assistance (84.2%), Educational Services (70.5%), and Finance & Insurance (66.4%).
| Industry | Male | Female |
| Agriculture, Fishing & Hunting | 611 (73.1%) | 225 (26.9%) |
| Mining, Quarrying, & Extraction | 70 (100.0%) | 0 (0.0%) |
| Construction | 3,347 (91.3%) | 317 (8.6%) |
| Manufacturing | 4,201 (57.2%) | 3,139 (42.8%) |
| Wholesale Trade | 631 (66.8%) | 314 (33.2%) |
| Retail Trade | 2,561 (48.1%) | 2,762 (51.9%) |
| Transportation & Warehousing | 1,670 (66.7%) | 832 (33.3%) |
| Utilities | 167 (81.9%) | 37 (18.1%) |
| Information | 206 (40.9%) | 297 (59.1%) |
| Finance & Insurance | 717 (33.6%) | 1,417 (66.4%) |
| Real Estate, Rental & Leasing | 548 (67.2%) | 267 (32.8%) |
| Professional & Scientific | 851 (55.0%) | 695 (45.0%) |
| Enterprise Management | 84 (100.0%) | 0 (0.0%) |
| Administrative & Support | 1,398 (73.4%) | 506 (26.6%) |
| Educational Services | 857 (29.5%) | 2,043 (70.5%) |
| Health Care & Social Assistance | 841 (15.8%) | 4,495 (84.2%) |
| Arts, Entertainment & Recreation | 410 (64.7%) | 224 (35.3%) |
| Accommodation & Food Services | 1,294 (42.9%) | 1,725 (57.1%) |
| Public Administration | 848 (48.1%) | 913 (51.8%) |
| Total | 22,094 (51.2%) | 21,079 (48.8%) |
Education in Nash County
School Enrollment in Nash County
The most common levels of schooling among the 21,636 students in Nash County are high school (5,002 | 23.1%), elementary school (4,959 | 22.9%), and college / undergraduate (4,455 | 20.6%).
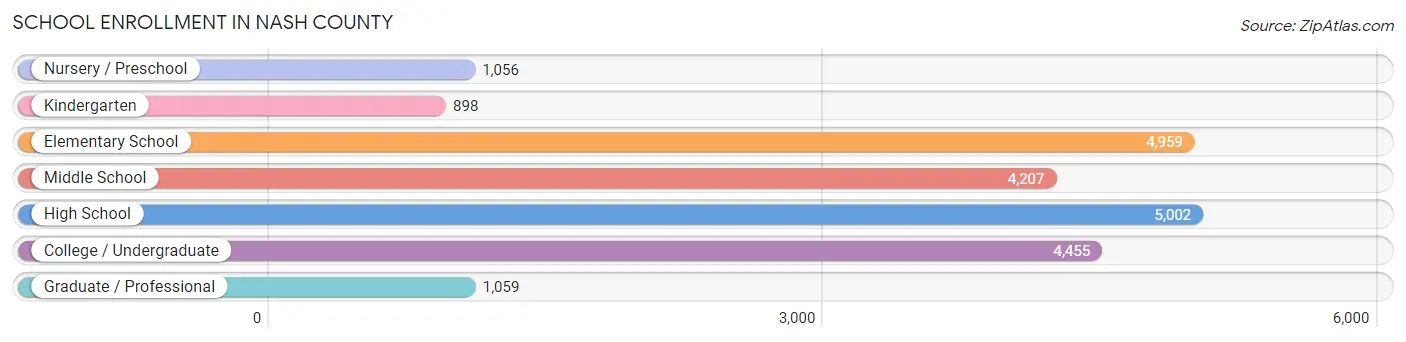
| School Level | # Students | % Students |
| Nursery / Preschool | 1,056 | 4.9% |
| Kindergarten | 898 | 4.2% |
| Elementary School | 4,959 | 22.9% |
| Middle School | 4,207 | 19.4% |
| High School | 5,002 | 23.1% |
| College / Undergraduate | 4,455 | 20.6% |
| Graduate / Professional | 1,059 | 4.9% |
| Total | 21,636 | 100.0% |
School Enrollment by Age by Funding Source in Nash County
Out of a total of 21,636 students who are enrolled in schools in Nash County, 3,765 (17.4%) attend a private institution, while the remaining 17,871 (82.6%) are enrolled in public schools. The age group of 20 to 24 year olds has the highest likelihood of being enrolled in private schools, with 513 (30.9% in the age bracket) enrolled. Conversely, the age group of 15 to 17 year olds has the lowest likelihood of being enrolled in a private school, with 2,956 (86.9% in the age bracket) attending a public institution.
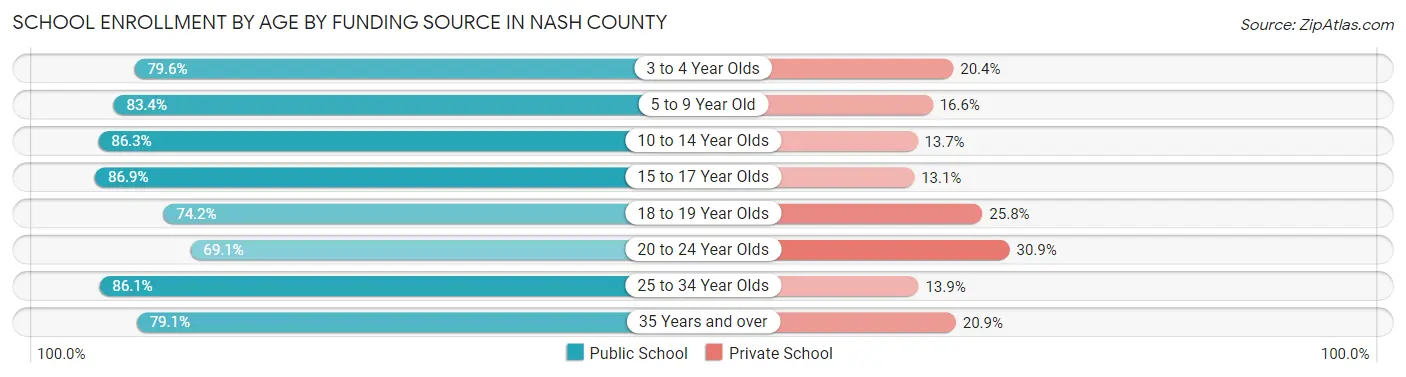
| Age Bracket | Public School | Private School |
| 3 to 4 Year Olds | 643 (79.6%) | 165 (20.4%) |
| 5 to 9 Year Old | 4,363 (83.4%) | 867 (16.6%) |
| 10 to 14 Year Olds | 5,097 (86.3%) | 812 (13.7%) |
| 15 to 17 Year Olds | 2,956 (86.9%) | 447 (13.1%) |
| 18 to 19 Year Olds | 1,145 (74.2%) | 399 (25.8%) |
| 20 to 24 Year Olds | 1,148 (69.1%) | 513 (30.9%) |
| 25 to 34 Year Olds | 1,148 (86.1%) | 186 (13.9%) |
| 35 Years and over | 1,382 (79.1%) | 365 (20.9%) |
| Total | 17,871 (82.6%) | 3,765 (17.4%) |
Educational Attainment by Field of Study in Nash County
Business (3,622 | 22.9%), education (3,058 | 19.3%), science & technology (1,739 | 11.0%), arts & humanities (1,240 | 7.8%), and social sciences (1,129 | 7.1%) are the most common fields of study among 15,815 individuals in Nash County who have obtained a bachelor's degree or higher.
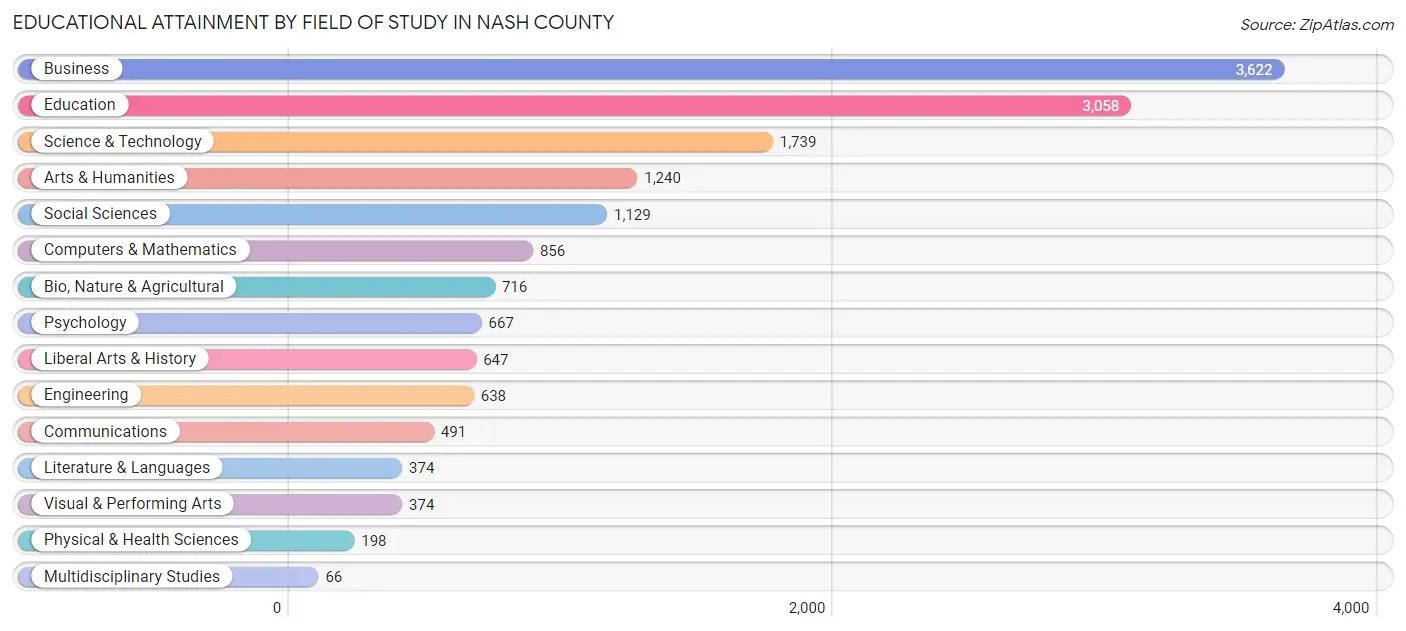
| Field of Study | # Graduates | % Graduates |
| Computers & Mathematics | 856 | 5.4% |
| Bio, Nature & Agricultural | 716 | 4.5% |
| Physical & Health Sciences | 198 | 1.3% |
| Psychology | 667 | 4.2% |
| Social Sciences | 1,129 | 7.1% |
| Engineering | 638 | 4.0% |
| Multidisciplinary Studies | 66 | 0.4% |
| Science & Technology | 1,739 | 11.0% |
| Business | 3,622 | 22.9% |
| Education | 3,058 | 19.3% |
| Literature & Languages | 374 | 2.4% |
| Liberal Arts & History | 647 | 4.1% |
| Visual & Performing Arts | 374 | 2.4% |
| Communications | 491 | 3.1% |
| Arts & Humanities | 1,240 | 7.8% |
| Total | 15,815 | 100.0% |
Transportation & Commute in Nash County
Vehicle Availability by Sex in Nash County
The most prevalent vehicle ownership categories in Nash County are males with 2 vehicles (7,349, accounting for 34.2%) and females with 2 vehicles (6,637, making up 35.6%).
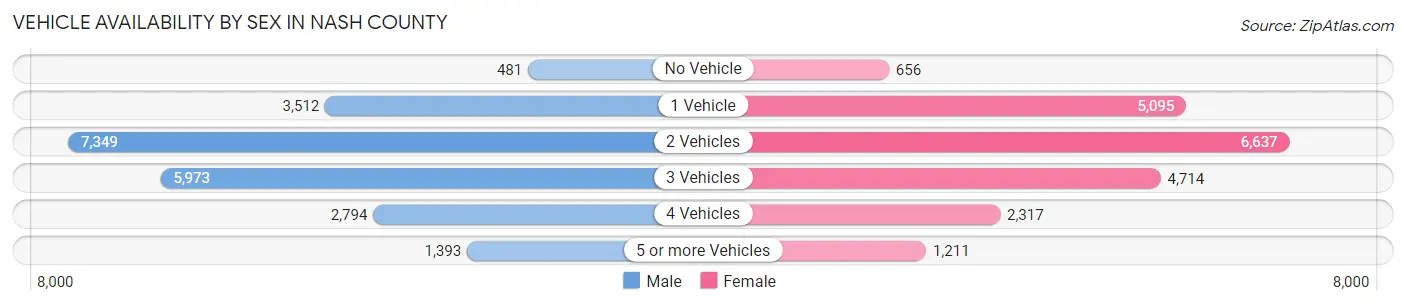
| Vehicles Available | Male | Female |
| No Vehicle | 481 (2.2%) | 656 (3.2%) |
| 1 Vehicle | 3,512 (16.3%) | 5,095 (24.7%) |
| 2 Vehicles | 7,349 (34.2%) | 6,637 (32.2%) |
| 3 Vehicles | 5,973 (27.8%) | 4,714 (22.9%) |
| 4 Vehicles | 2,794 (13.0%) | 2,317 (11.2%) |
| 5 or more Vehicles | 1,393 (6.5%) | 1,211 (5.9%) |
| Total | 21,502 (100.0%) | 20,630 (100.0%) |
Commute Time in Nash County
The most frequently occuring commute durations in Nash County are 15 to 19 minutes (7,601 commuters, 19.5%), 10 to 14 minutes (6,299 commuters, 16.2%), and 20 to 24 minutes (5,831 commuters, 14.9%).

| Commute Time | # Commuters | % Commuters |
| Less than 5 Minutes | 721 | 1.8% |
| 5 to 9 Minutes | 4,617 | 11.8% |
| 10 to 14 Minutes | 6,299 | 16.2% |
| 15 to 19 Minutes | 7,601 | 19.5% |
| 20 to 24 Minutes | 5,831 | 14.9% |
| 25 to 29 Minutes | 2,435 | 6.2% |
| 30 to 34 Minutes | 4,122 | 10.6% |
| 35 to 39 Minutes | 1,115 | 2.9% |
| 40 to 44 Minutes | 901 | 2.3% |
| 45 to 59 Minutes | 2,714 | 7.0% |
| 60 to 89 Minutes | 1,719 | 4.4% |
| 90 or more Minutes | 916 | 2.4% |
Commute Time by Sex in Nash County
The most common commute times in Nash County are 10 to 14 minutes (3,375 commuters, 17.0%) for males and 15 to 19 minutes (4,318 commuters, 22.6%) for females.
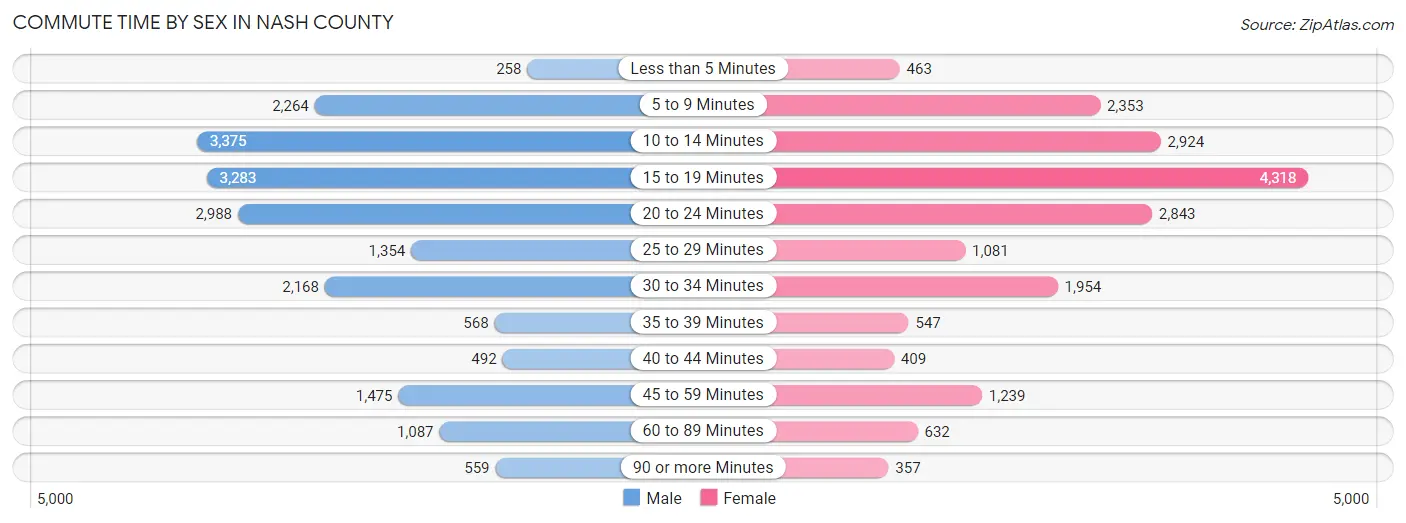
| Commute Time | Male | Female |
| Less than 5 Minutes | 258 (1.3%) | 463 (2.4%) |
| 5 to 9 Minutes | 2,264 (11.4%) | 2,353 (12.3%) |
| 10 to 14 Minutes | 3,375 (17.0%) | 2,924 (15.3%) |
| 15 to 19 Minutes | 3,283 (16.5%) | 4,318 (22.6%) |
| 20 to 24 Minutes | 2,988 (15.0%) | 2,843 (14.9%) |
| 25 to 29 Minutes | 1,354 (6.8%) | 1,081 (5.7%) |
| 30 to 34 Minutes | 2,168 (10.9%) | 1,954 (10.2%) |
| 35 to 39 Minutes | 568 (2.9%) | 547 (2.9%) |
| 40 to 44 Minutes | 492 (2.5%) | 409 (2.1%) |
| 45 to 59 Minutes | 1,475 (7.4%) | 1,239 (6.5%) |
| 60 to 89 Minutes | 1,087 (5.5%) | 632 (3.3%) |
| 90 or more Minutes | 559 (2.8%) | 357 (1.9%) |
Time of Departure to Work by Sex in Nash County
The most frequent times of departure to work in Nash County are 7:00 AM to 7:29 AM (2,481, 12.5%) for males and 7:30 AM to 7:59 AM (3,161, 16.5%) for females.
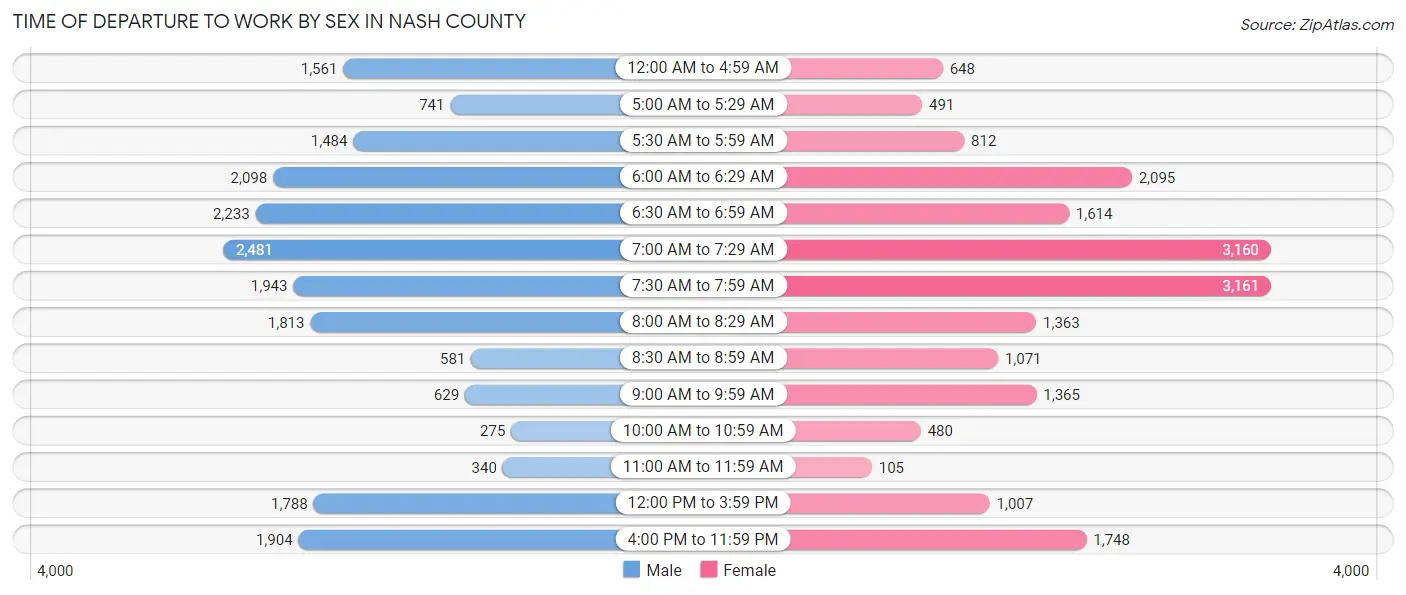
| Time of Departure | Male | Female |
| 12:00 AM to 4:59 AM | 1,561 (7.9%) | 648 (3.4%) |
| 5:00 AM to 5:29 AM | 741 (3.7%) | 491 (2.6%) |
| 5:30 AM to 5:59 AM | 1,484 (7.5%) | 812 (4.3%) |
| 6:00 AM to 6:29 AM | 2,098 (10.6%) | 2,095 (11.0%) |
| 6:30 AM to 6:59 AM | 2,233 (11.2%) | 1,614 (8.4%) |
| 7:00 AM to 7:29 AM | 2,481 (12.5%) | 3,160 (16.5%) |
| 7:30 AM to 7:59 AM | 1,943 (9.8%) | 3,161 (16.5%) |
| 8:00 AM to 8:29 AM | 1,813 (9.1%) | 1,363 (7.1%) |
| 8:30 AM to 8:59 AM | 581 (2.9%) | 1,071 (5.6%) |
| 9:00 AM to 9:59 AM | 629 (3.2%) | 1,365 (7.1%) |
| 10:00 AM to 10:59 AM | 275 (1.4%) | 480 (2.5%) |
| 11:00 AM to 11:59 AM | 340 (1.7%) | 105 (0.5%) |
| 12:00 PM to 3:59 PM | 1,788 (9.0%) | 1,007 (5.3%) |
| 4:00 PM to 11:59 PM | 1,904 (9.6%) | 1,748 (9.1%) |
| Total | 19,871 (100.0%) | 19,120 (100.0%) |
Housing Occupancy in Nash County
Occupancy by Ownership in Nash County
Of the total 37,793 dwellings in Nash County, owner-occupied units account for 24,538 (64.9%), while renter-occupied units make up 13,255 (35.1%).
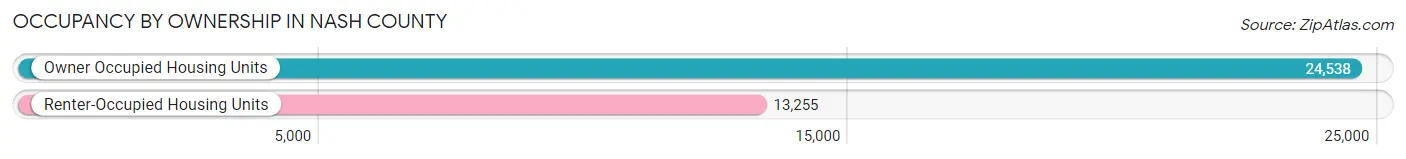
| Occupancy | # Housing Units | % Housing Units |
| Owner Occupied Housing Units | 24,538 | 64.9% |
| Renter-Occupied Housing Units | 13,255 | 35.1% |
| Total Occupied Housing Units | 37,793 | 100.0% |
Occupancy by Household Size in Nash County
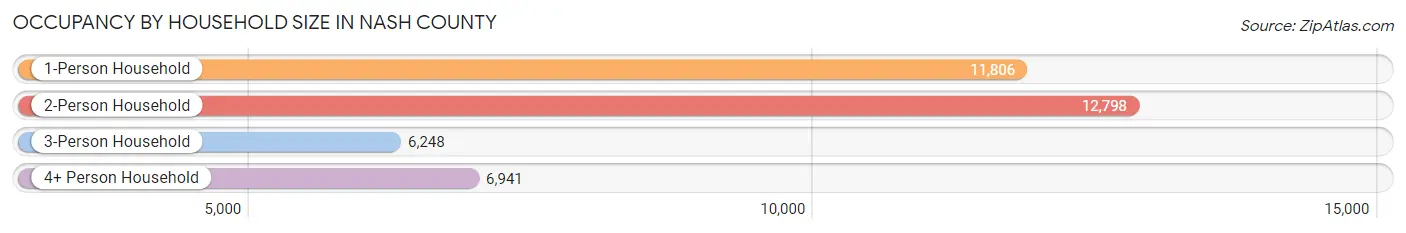
| Household Size | # Housing Units | % Housing Units |
| 1-Person Household | 11,806 | 31.2% |
| 2-Person Household | 12,798 | 33.9% |
| 3-Person Household | 6,248 | 16.5% |
| 4+ Person Household | 6,941 | 18.4% |
| Total Housing Units | 37,793 | 100.0% |
Occupancy by Ownership by Household Size in Nash County
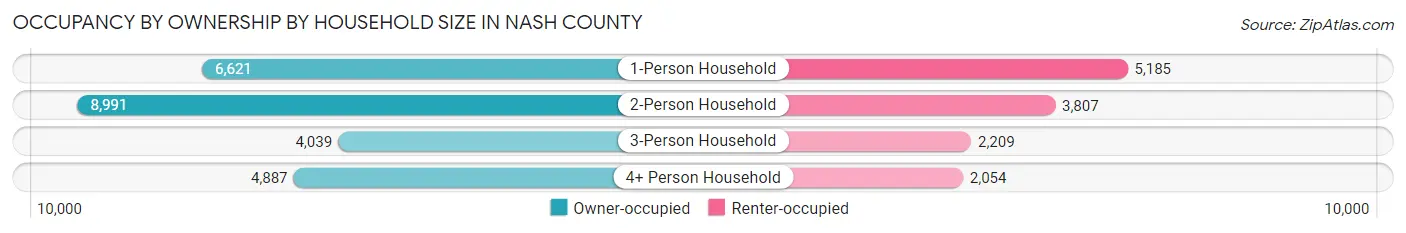
| Household Size | Owner-occupied | Renter-occupied |
| 1-Person Household | 6,621 (56.1%) | 5,185 (43.9%) |
| 2-Person Household | 8,991 (70.3%) | 3,807 (29.7%) |
| 3-Person Household | 4,039 (64.6%) | 2,209 (35.4%) |
| 4+ Person Household | 4,887 (70.4%) | 2,054 (29.6%) |
| Total Housing Units | 24,538 (64.9%) | 13,255 (35.1%) |
Occupancy by Educational Attainment in Nash County
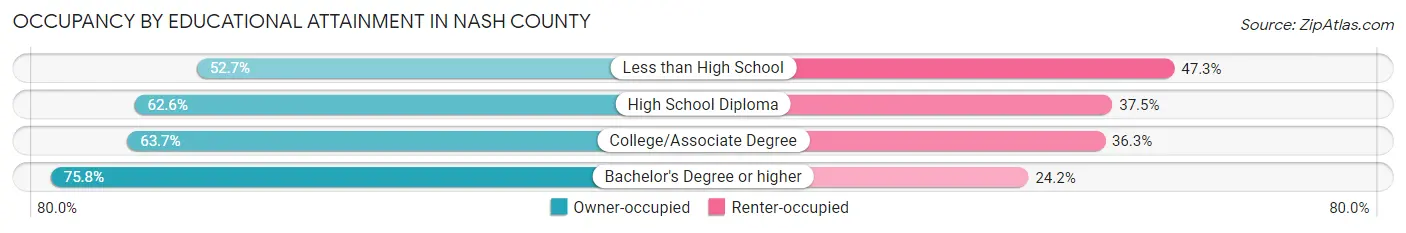
| Household Size | Owner-occupied | Renter-occupied |
| Less than High School | 2,331 (52.7%) | 2,092 (47.3%) |
| High School Diploma | 7,136 (62.5%) | 4,273 (37.4%) |
| College/Associate Degree | 8,322 (63.7%) | 4,740 (36.3%) |
| Bachelor's Degree or higher | 6,749 (75.8%) | 2,150 (24.2%) |
Occupancy by Age of Householder in Nash County
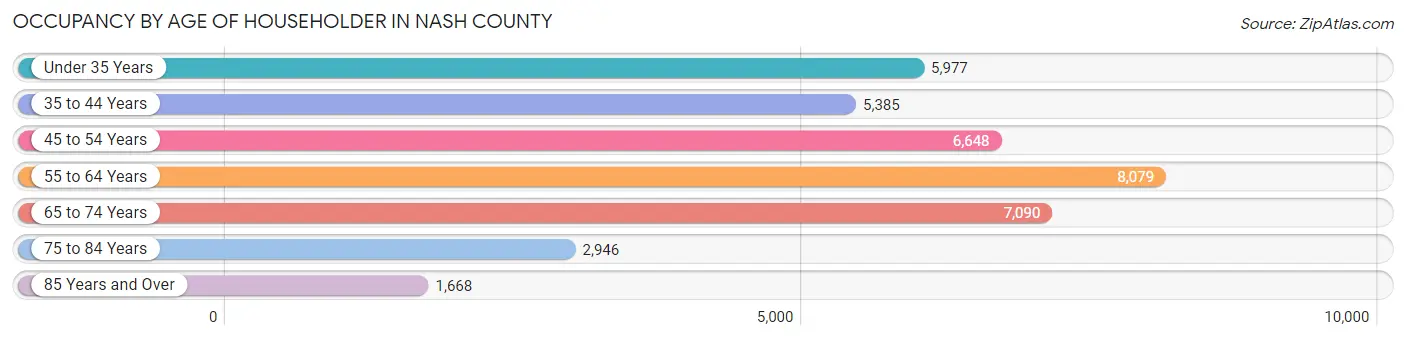
| Age Bracket | # Households | % Households |
| Under 35 Years | 5,977 | 15.8% |
| 35 to 44 Years | 5,385 | 14.2% |
| 45 to 54 Years | 6,648 | 17.6% |
| 55 to 64 Years | 8,079 | 21.4% |
| 65 to 74 Years | 7,090 | 18.8% |
| 75 to 84 Years | 2,946 | 7.8% |
| 85 Years and Over | 1,668 | 4.4% |
| Total | 37,793 | 100.0% |
Housing Finances in Nash County
Median Income by Occupancy in Nash County
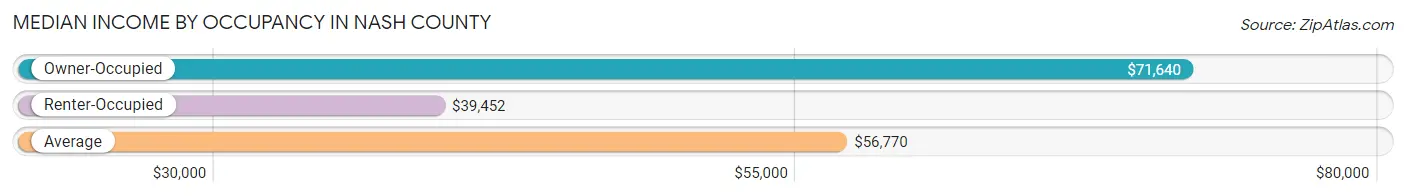
| Occupancy Type | # Households | Median Income |
| Owner-Occupied | 24,538 (64.9%) | $71,640 |
| Renter-Occupied | 13,255 (35.1%) | $39,452 |
| Average | 37,793 (100.0%) | $56,770 |
Occupancy by Householder Income Bracket in Nash County
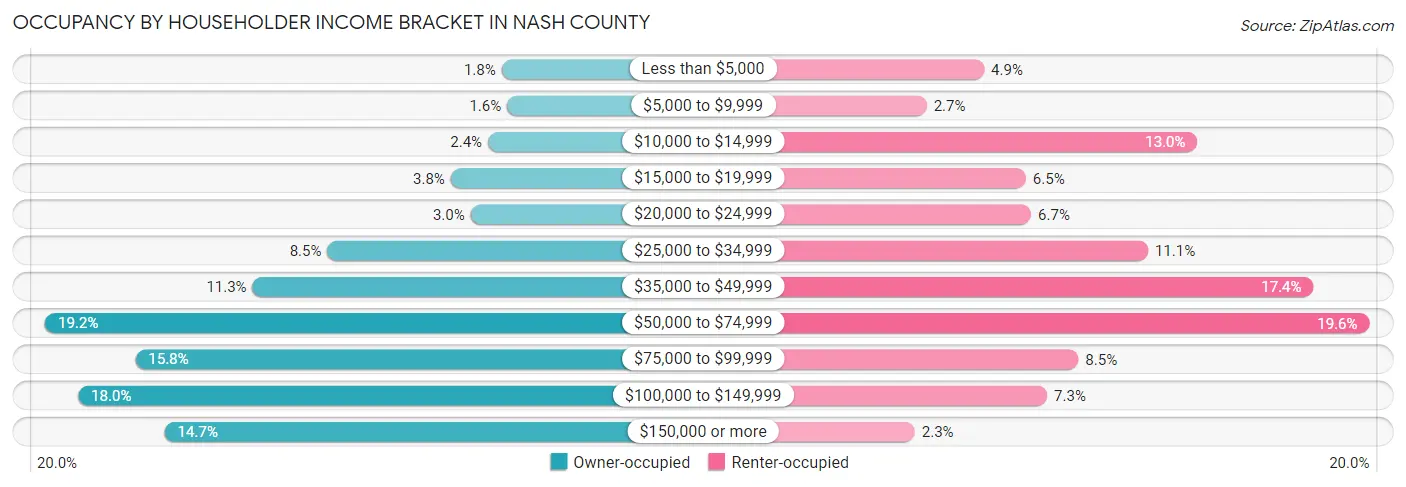
| Income Bracket | Owner-occupied | Renter-occupied |
| Less than $5,000 | 449 (1.8%) | 649 (4.9%) |
| $5,000 to $9,999 | 398 (1.6%) | 359 (2.7%) |
| $10,000 to $14,999 | 576 (2.4%) | 1,726 (13.0%) |
| $15,000 to $19,999 | 925 (3.8%) | 860 (6.5%) |
| $20,000 to $24,999 | 738 (3.0%) | 887 (6.7%) |
| $25,000 to $34,999 | 2,078 (8.5%) | 1,476 (11.1%) |
| $35,000 to $49,999 | 2,778 (11.3%) | 2,312 (17.4%) |
| $50,000 to $74,999 | 4,716 (19.2%) | 2,594 (19.6%) |
| $75,000 to $99,999 | 3,873 (15.8%) | 1,125 (8.5%) |
| $100,000 to $149,999 | 4,408 (18.0%) | 968 (7.3%) |
| $150,000 or more | 3,599 (14.7%) | 299 (2.3%) |
| Total | 24,538 (100.0%) | 13,255 (100.0%) |
Monthly Housing Cost Tiers in Nash County
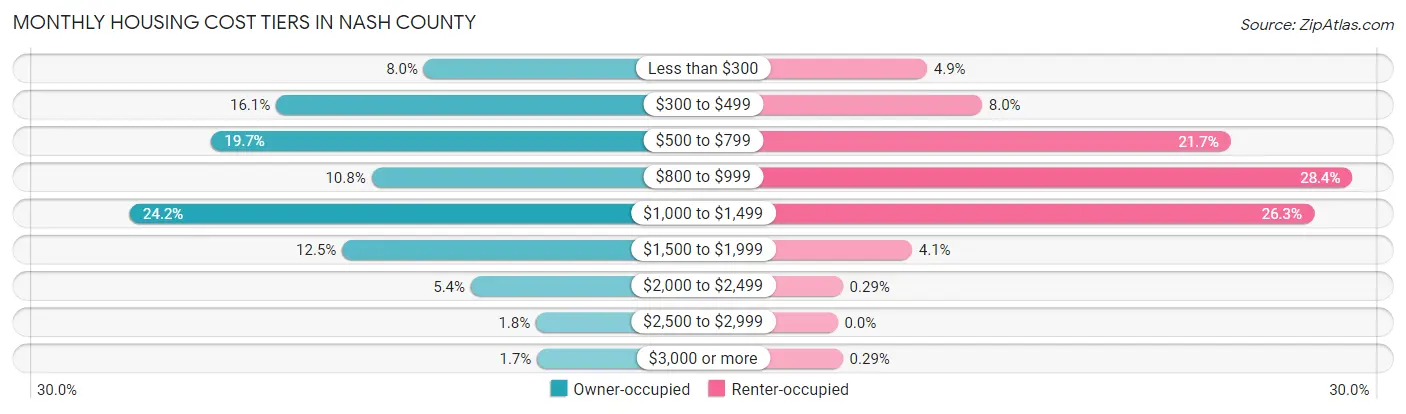
| Monthly Cost | Owner-occupied | Renter-occupied |
| Less than $300 | 1,950 (8.0%) | 655 (4.9%) |
| $300 to $499 | 3,953 (16.1%) | 1,058 (8.0%) |
| $500 to $799 | 4,829 (19.7%) | 2,878 (21.7%) |
| $800 to $999 | 2,660 (10.8%) | 3,770 (28.4%) |
| $1,000 to $1,499 | 5,933 (24.2%) | 3,487 (26.3%) |
| $1,500 to $1,999 | 3,057 (12.5%) | 545 (4.1%) |
| $2,000 to $2,499 | 1,312 (5.3%) | 39 (0.3%) |
| $2,500 to $2,999 | 430 (1.8%) | 0 (0.0%) |
| $3,000 or more | 414 (1.7%) | 39 (0.3%) |
| Total | 24,538 (100.0%) | 13,255 (100.0%) |
Physical Housing Characteristics in Nash County
Housing Structures in Nash County
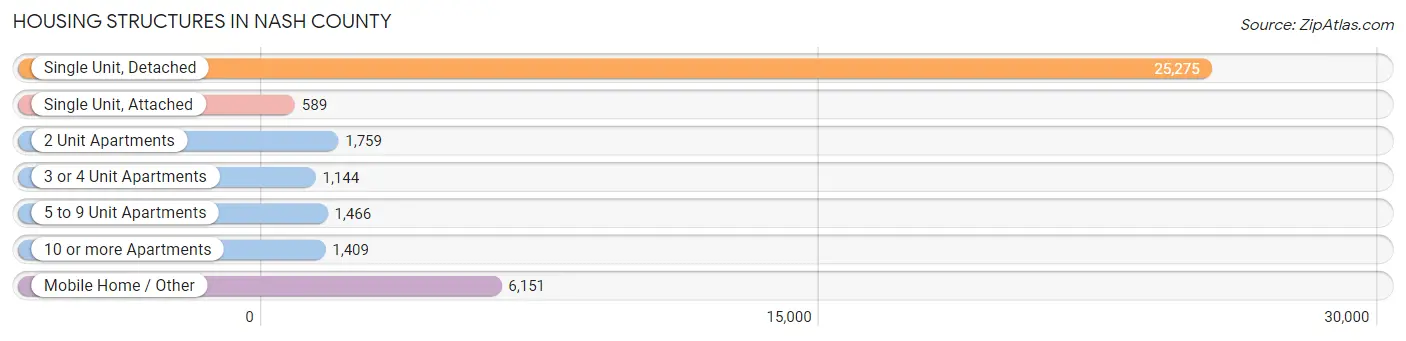
| Structure Type | # Housing Units | % Housing Units |
| Single Unit, Detached | 25,275 | 66.9% |
| Single Unit, Attached | 589 | 1.6% |
| 2 Unit Apartments | 1,759 | 4.6% |
| 3 or 4 Unit Apartments | 1,144 | 3.0% |
| 5 to 9 Unit Apartments | 1,466 | 3.9% |
| 10 or more Apartments | 1,409 | 3.7% |
| Mobile Home / Other | 6,151 | 16.3% |
| Total | 37,793 | 100.0% |
Housing Structures by Occupancy in Nash County
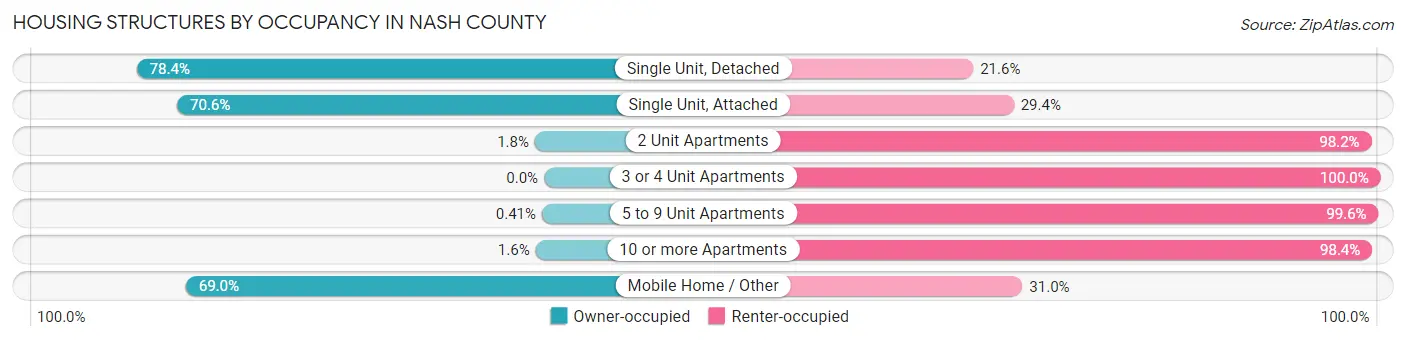
| Structure Type | Owner-occupied | Renter-occupied |
| Single Unit, Detached | 19,820 (78.4%) | 5,455 (21.6%) |
| Single Unit, Attached | 416 (70.6%) | 173 (29.4%) |
| 2 Unit Apartments | 31 (1.8%) | 1,728 (98.2%) |
| 3 or 4 Unit Apartments | 0 (0.0%) | 1,144 (100.0%) |
| 5 to 9 Unit Apartments | 6 (0.4%) | 1,460 (99.6%) |
| 10 or more Apartments | 23 (1.6%) | 1,386 (98.4%) |
| Mobile Home / Other | 4,242 (69.0%) | 1,909 (31.0%) |
| Total | 24,538 (64.9%) | 13,255 (35.1%) |
Housing Structures by Number of Rooms in Nash County
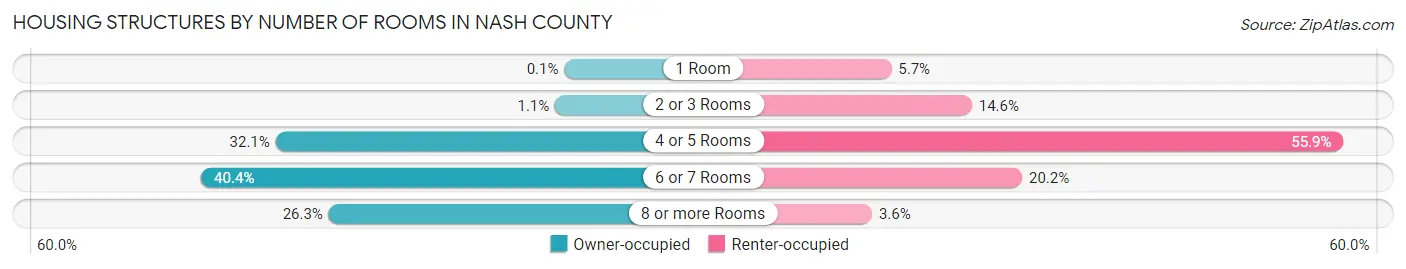
| Number of Rooms | Owner-occupied | Renter-occupied |
| 1 Room | 25 (0.1%) | 757 (5.7%) |
| 2 or 3 Rooms | 274 (1.1%) | 1,941 (14.6%) |
| 4 or 5 Rooms | 7,886 (32.1%) | 7,406 (55.9%) |
| 6 or 7 Rooms | 9,913 (40.4%) | 2,679 (20.2%) |
| 8 or more Rooms | 6,440 (26.3%) | 472 (3.6%) |
| Total | 24,538 (100.0%) | 13,255 (100.0%) |
Housing Structure by Heating Type in Nash County
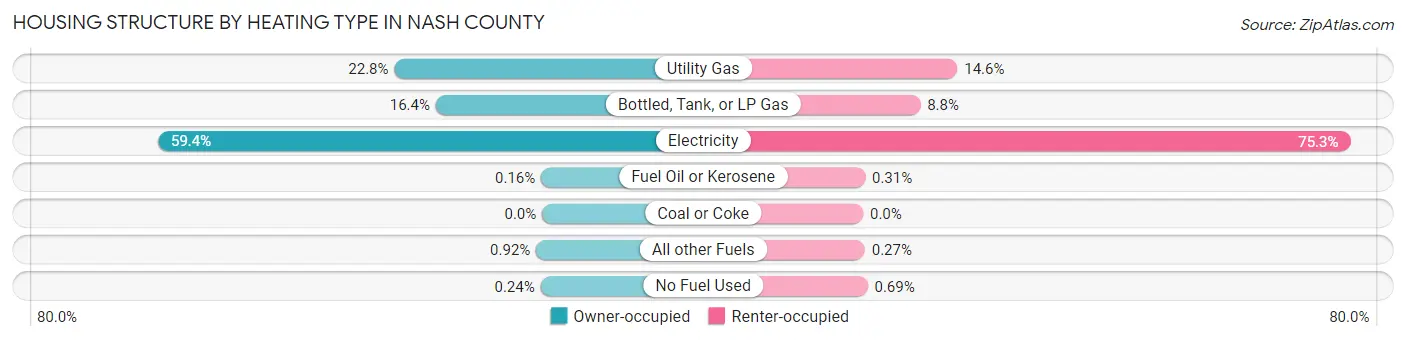
| Heating Type | Owner-occupied | Renter-occupied |
| Utility Gas | 5,605 (22.8%) | 1,931 (14.6%) |
| Bottled, Tank, or LP Gas | 4,033 (16.4%) | 1,172 (8.8%) |
| Electricity | 14,575 (59.4%) | 9,984 (75.3%) |
| Fuel Oil or Kerosene | 39 (0.2%) | 41 (0.3%) |
| Coal or Coke | 0 (0.0%) | 0 (0.0%) |
| All other Fuels | 226 (0.9%) | 36 (0.3%) |
| No Fuel Used | 60 (0.2%) | 91 (0.7%) |
| Total | 24,538 (100.0%) | 13,255 (100.0%) |
Household Vehicle Usage in Nash County
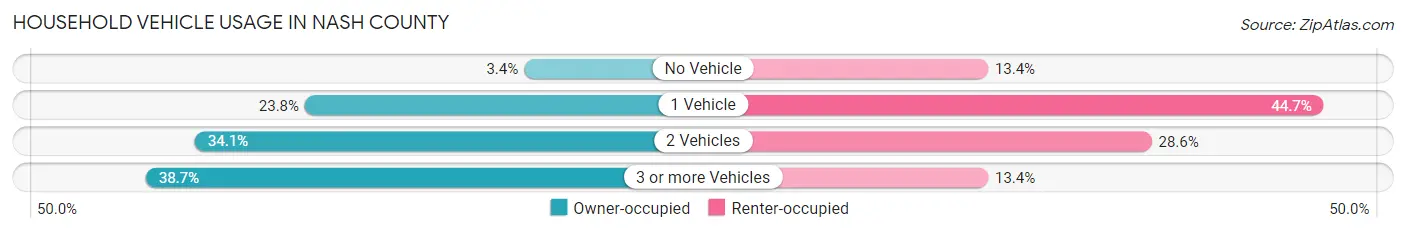
| Vehicles per Household | Owner-occupied | Renter-occupied |
| No Vehicle | 829 (3.4%) | 1,769 (13.4%) |
| 1 Vehicle | 5,849 (23.8%) | 5,922 (44.7%) |
| 2 Vehicles | 8,368 (34.1%) | 3,793 (28.6%) |
| 3 or more Vehicles | 9,492 (38.7%) | 1,771 (13.4%) |
| Total | 24,538 (100.0%) | 13,255 (100.0%) |
Real Estate & Mortgages in Nash County
Real Estate and Mortgage Overview in Nash County
| Characteristic | Without Mortgage | With Mortgage |
| Housing Units | 10,613 | 13,925 |
| Median Property Value | $135,400 | $179,700 |
| Median Household Income | $60,114 | $2,639 |
| Monthly Housing Costs | $475 | $414 |
| Real Estate Taxes | $1,029 | $251 |
Property Value by Mortgage Status in Nash County
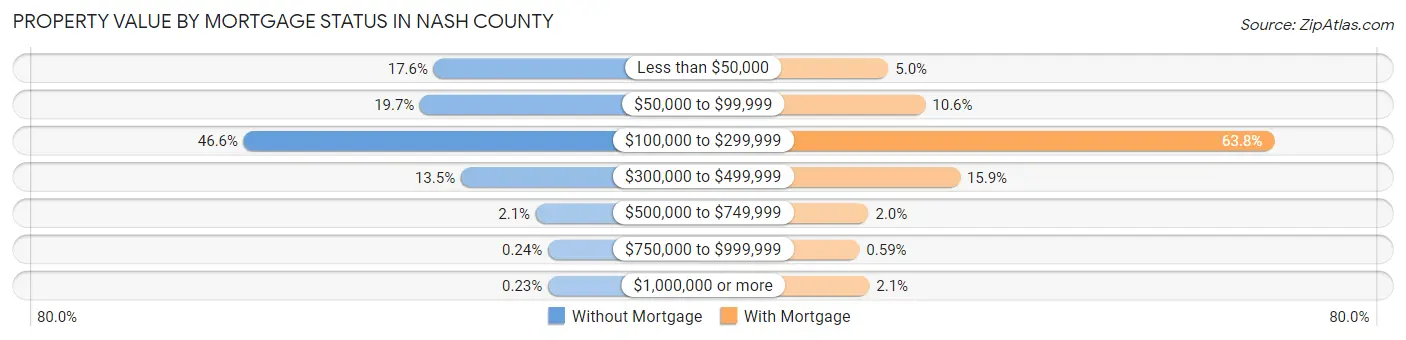
| Property Value | Without Mortgage | With Mortgage |
| Less than $50,000 | 1,872 (17.6%) | 696 (5.0%) |
| $50,000 to $99,999 | 2,093 (19.7%) | 1,482 (10.6%) |
| $100,000 to $299,999 | 4,945 (46.6%) | 8,882 (63.8%) |
| $300,000 to $499,999 | 1,433 (13.5%) | 2,215 (15.9%) |
| $500,000 to $749,999 | 221 (2.1%) | 276 (2.0%) |
| $750,000 to $999,999 | 25 (0.2%) | 82 (0.6%) |
| $1,000,000 or more | 24 (0.2%) | 292 (2.1%) |
| Total | 10,613 (100.0%) | 13,925 (100.0%) |
Household Income by Mortgage Status in Nash County
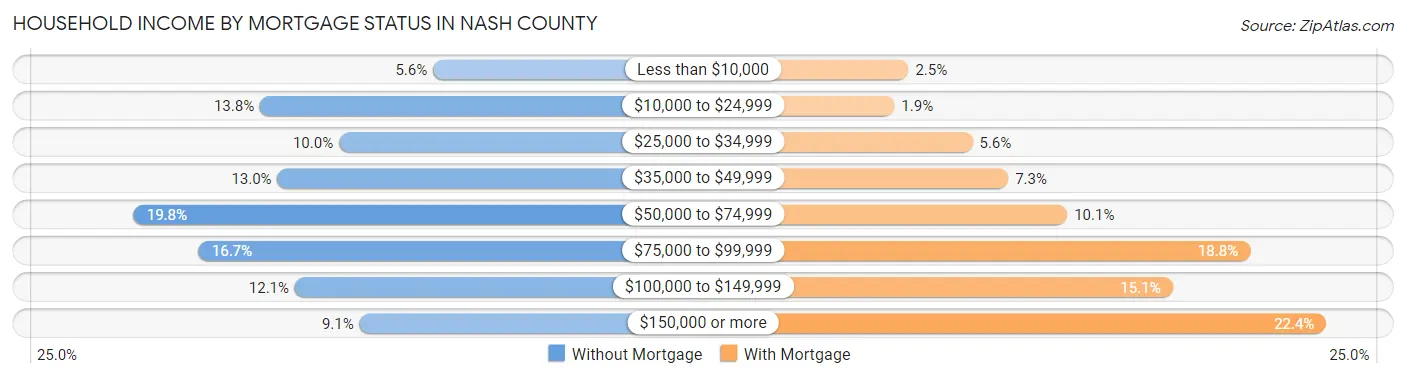
| Household Income | Without Mortgage | With Mortgage |
| Less than $10,000 | 589 (5.6%) | 351 (2.5%) |
| $10,000 to $24,999 | 1,464 (13.8%) | 258 (1.8%) |
| $25,000 to $34,999 | 1,065 (10.0%) | 775 (5.6%) |
| $35,000 to $49,999 | 1,375 (13.0%) | 1,013 (7.3%) |
| $50,000 to $74,999 | 2,101 (19.8%) | 1,403 (10.1%) |
| $75,000 to $99,999 | 1,772 (16.7%) | 2,615 (18.8%) |
| $100,000 to $149,999 | 1,287 (12.1%) | 2,101 (15.1%) |
| $150,000 or more | 960 (9.0%) | 3,121 (22.4%) |
| Total | 10,613 (100.0%) | 13,925 (100.0%) |
Property Value to Household Income Ratio in Nash County
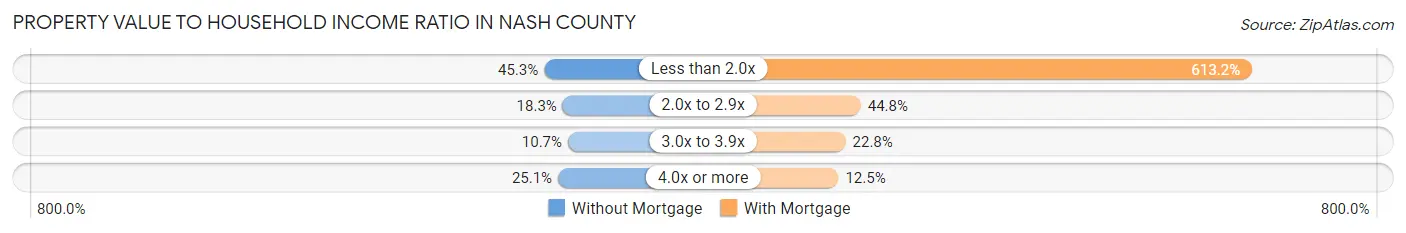
| Value-to-Income Ratio | Without Mortgage | With Mortgage |
| Less than 2.0x | 4,807 (45.3%) | 85,391 (613.2%) |
| 2.0x to 2.9x | 1,941 (18.3%) | 6,243 (44.8%) |
| 3.0x to 3.9x | 1,132 (10.7%) | 3,174 (22.8%) |
| 4.0x or more | 2,665 (25.1%) | 1,734 (12.4%) |
| Total | 10,613 (100.0%) | 13,925 (100.0%) |
Real Estate Taxes by Mortgage Status in Nash County

| Property Taxes | Without Mortgage | With Mortgage |
| Less than $800 | 4,166 (39.3%) | 18 (0.1%) |
| $800 to $1,499 | 2,807 (26.5%) | 2,232 (16.0%) |
| $800 to $1,499 | 3,274 (30.8%) | 4,646 (33.4%) |
| Total | 10,613 (100.0%) | 13,925 (100.0%) |
Health & Disability in Nash County
Health Insurance Coverage by Age in Nash County
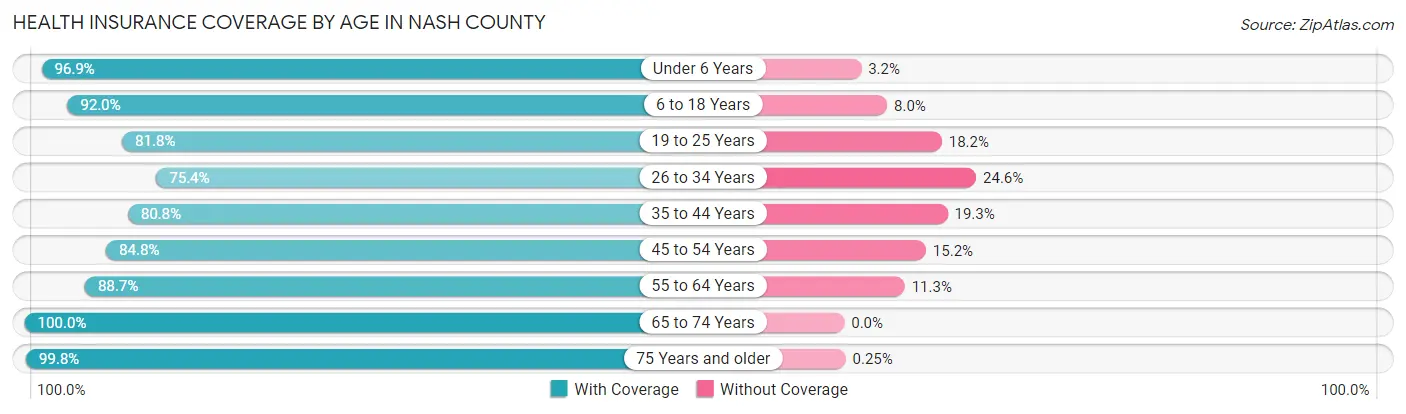
| Age Bracket | With Coverage | Without Coverage |
| Under 6 Years | 5,940 (96.9%) | 193 (3.2%) |
| 6 to 18 Years | 14,726 (92.0%) | 1,277 (8.0%) |
| 19 to 25 Years | 6,187 (81.8%) | 1,375 (18.2%) |
| 26 to 34 Years | 7,761 (75.4%) | 2,529 (24.6%) |
| 35 to 44 Years | 8,744 (80.7%) | 2,085 (19.3%) |
| 45 to 54 Years | 10,435 (84.8%) | 1,873 (15.2%) |
| 55 to 64 Years | 11,889 (88.7%) | 1,510 (11.3%) |
| 65 to 74 Years | 10,862 (100.0%) | 0 (0.0%) |
| 75 Years and older | 6,490 (99.8%) | 16 (0.3%) |
| Total | 83,034 (88.4%) | 10,858 (11.6%) |
Health Insurance Coverage by Citizenship Status in Nash County
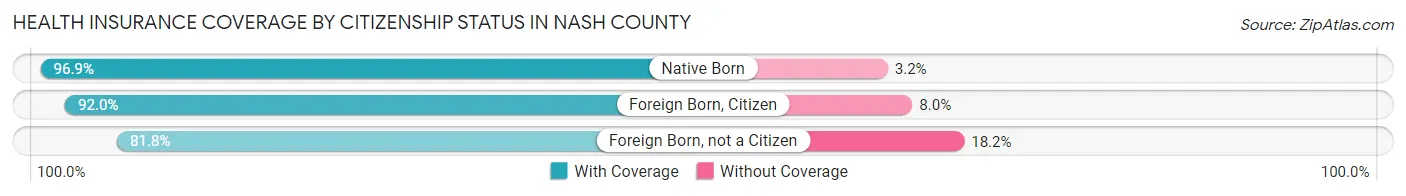
| Citizenship Status | With Coverage | Without Coverage |
| Native Born | 5,940 (96.9%) | 193 (3.2%) |
| Foreign Born, Citizen | 14,726 (92.0%) | 1,277 (8.0%) |
| Foreign Born, not a Citizen | 6,187 (81.8%) | 1,375 (18.2%) |
Health Insurance Coverage by Household Income in Nash County

| Household Income | With Coverage | Without Coverage |
| Under $25,000 | 10,898 (86.0%) | 1,772 (14.0%) |
| $25,000 to $49,999 | 16,037 (82.5%) | 3,412 (17.5%) |
| $50,000 to $74,999 | 15,947 (86.4%) | 2,504 (13.6%) |
| $75,000 to $99,999 | 12,736 (90.4%) | 1,350 (9.6%) |
| $100,000 and over | 26,804 (94.4%) | 1,601 (5.6%) |
Public vs Private Health Insurance Coverage by Age in Nash County
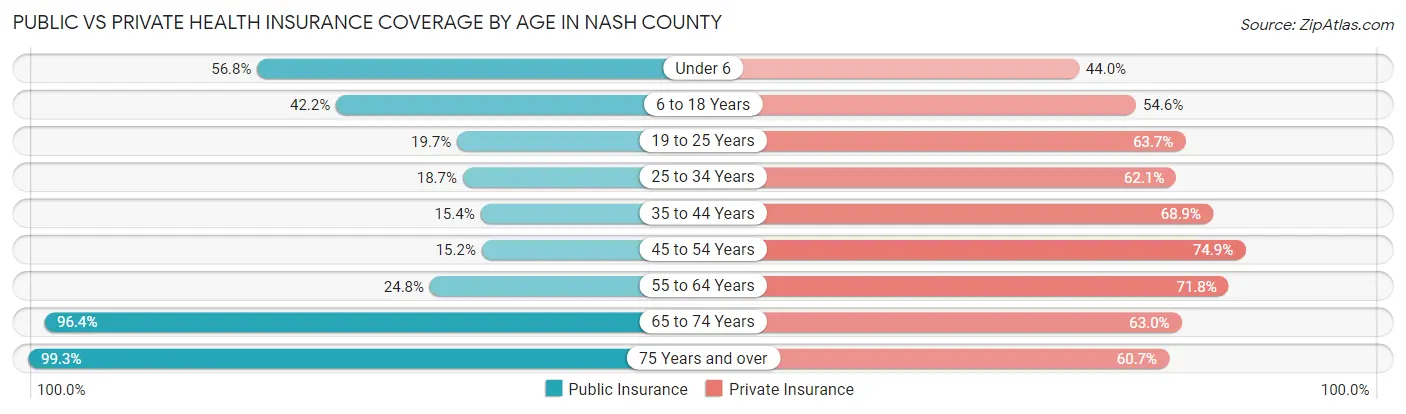
| Age Bracket | Public Insurance | Private Insurance |
| Under 6 | 3,484 (56.8%) | 2,699 (44.0%) |
| 6 to 18 Years | 6,752 (42.2%) | 8,741 (54.6%) |
| 19 to 25 Years | 1,491 (19.7%) | 4,819 (63.7%) |
| 25 to 34 Years | 1,921 (18.7%) | 6,385 (62.1%) |
| 35 to 44 Years | 1,666 (15.4%) | 7,458 (68.9%) |
| 45 to 54 Years | 1,865 (15.1%) | 9,213 (74.9%) |
| 55 to 64 Years | 3,320 (24.8%) | 9,619 (71.8%) |
| 65 to 74 Years | 10,470 (96.4%) | 6,846 (63.0%) |
| 75 Years and over | 6,463 (99.3%) | 3,949 (60.7%) |
| Total | 37,432 (39.9%) | 59,729 (63.6%) |
Disability Status by Sex by Age in Nash County
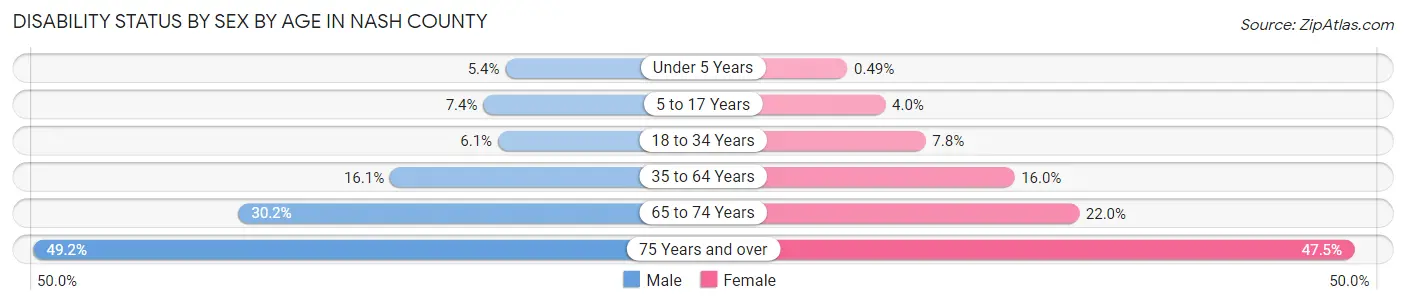
| Age Bracket | Male | Female |
| Under 5 Years | 141 (5.4%) | 13 (0.5%) |
| 5 to 17 Years | 585 (7.4%) | 307 (4.0%) |
| 18 to 34 Years | 582 (6.1%) | 745 (7.8%) |
| 35 to 64 Years | 2,826 (16.1%) | 3,035 (16.0%) |
| 65 to 74 Years | 1,494 (30.2%) | 1,300 (22.0%) |
| 75 Years and over | 1,264 (49.2%) | 1,870 (47.5%) |
Disability Class by Sex by Age in Nash County
Disability Class: Hearing Difficulty
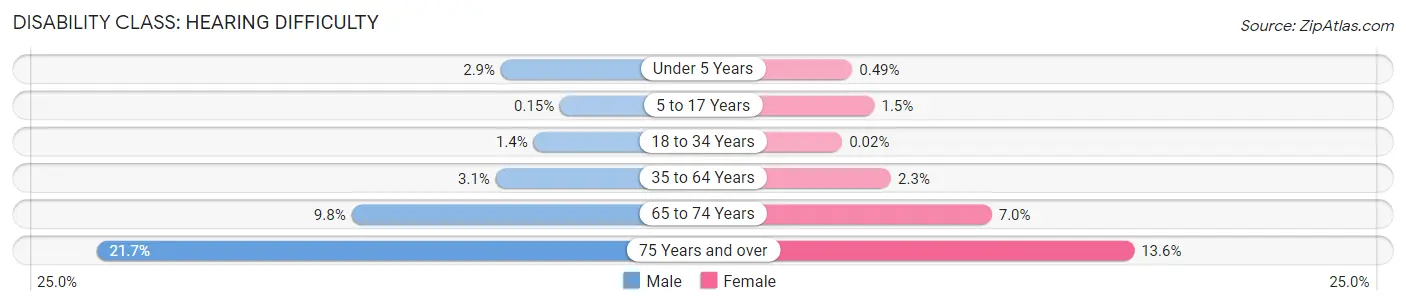
| Age Bracket | Male | Female |
| Under 5 Years | 76 (2.9%) | 13 (0.5%) |
| 5 to 17 Years | 12 (0.2%) | 116 (1.5%) |
| 18 to 34 Years | 132 (1.4%) | 2 (0.0%) |
| 35 to 64 Years | 552 (3.1%) | 434 (2.3%) |
| 65 to 74 Years | 487 (9.8%) | 411 (7.0%) |
| 75 Years and over | 557 (21.7%) | 534 (13.6%) |
Disability Class: Vision Difficulty
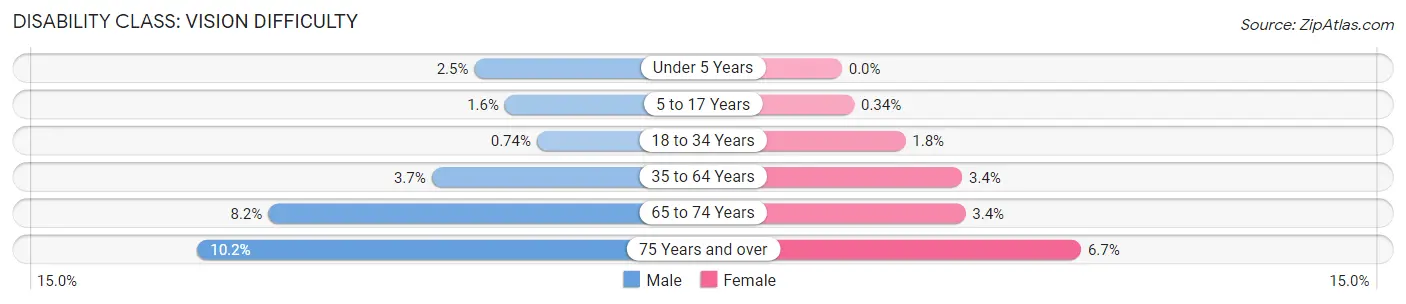
| Age Bracket | Male | Female |
| Under 5 Years | 65 (2.5%) | 0 (0.0%) |
| 5 to 17 Years | 128 (1.6%) | 26 (0.3%) |
| 18 to 34 Years | 71 (0.7%) | 170 (1.8%) |
| 35 to 64 Years | 645 (3.7%) | 635 (3.4%) |
| 65 to 74 Years | 407 (8.2%) | 203 (3.4%) |
| 75 Years and over | 262 (10.2%) | 262 (6.7%) |
Disability Class: Cognitive Difficulty
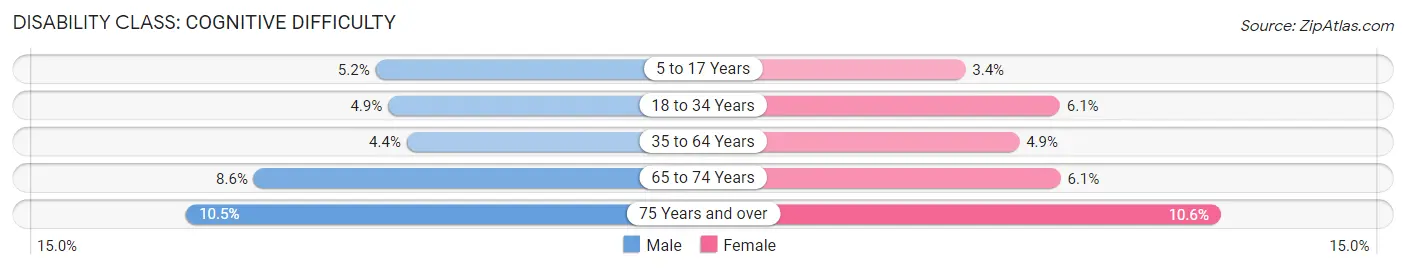
| Age Bracket | Male | Female |
| 5 to 17 Years | 412 (5.2%) | 263 (3.4%) |
| 18 to 34 Years | 468 (4.9%) | 583 (6.1%) |
| 35 to 64 Years | 766 (4.4%) | 938 (4.9%) |
| 65 to 74 Years | 427 (8.6%) | 360 (6.1%) |
| 75 Years and over | 270 (10.5%) | 415 (10.5%) |
Disability Class: Ambulatory Difficulty
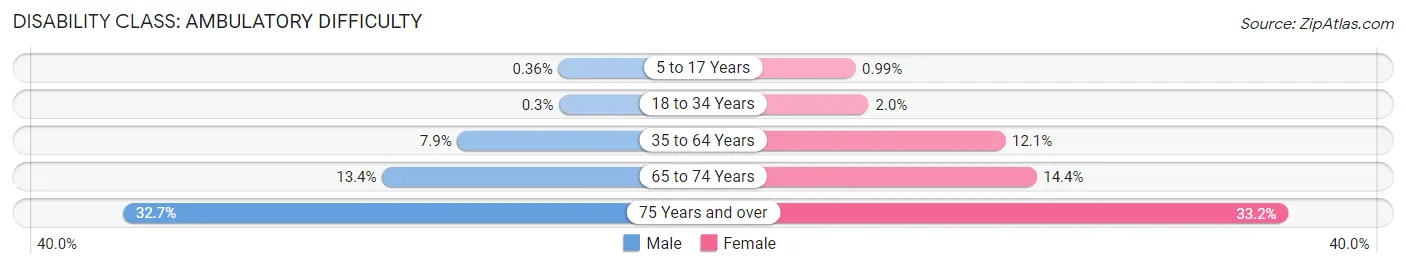
| Age Bracket | Male | Female |
| 5 to 17 Years | 28 (0.4%) | 76 (1.0%) |
| 18 to 34 Years | 29 (0.3%) | 191 (2.0%) |
| 35 to 64 Years | 1,381 (7.9%) | 2,300 (12.1%) |
| 65 to 74 Years | 666 (13.4%) | 853 (14.4%) |
| 75 Years and over | 841 (32.7%) | 1,305 (33.2%) |
Disability Class: Self-Care Difficulty
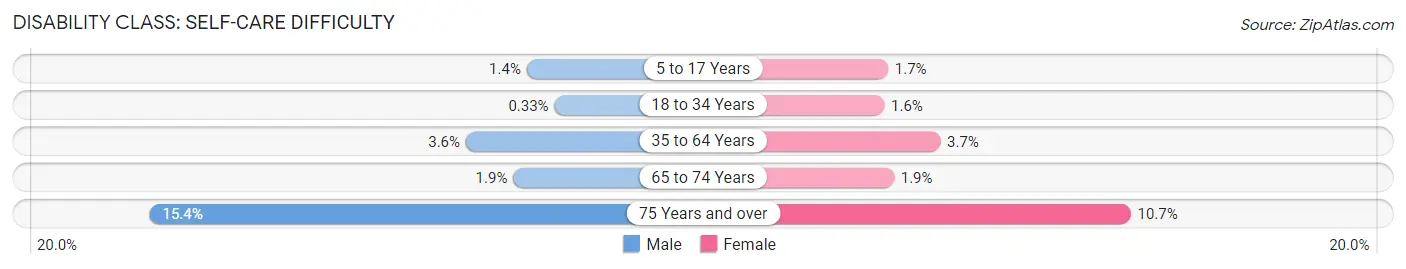
| Age Bracket | Male | Female |
| 5 to 17 Years | 107 (1.4%) | 131 (1.7%) |
| 18 to 34 Years | 32 (0.3%) | 151 (1.6%) |
| 35 to 64 Years | 636 (3.6%) | 693 (3.6%) |
| 65 to 74 Years | 92 (1.9%) | 114 (1.9%) |
| 75 Years and over | 395 (15.4%) | 422 (10.7%) |
Technology Access in Nash County
Computing Device Access in Nash County
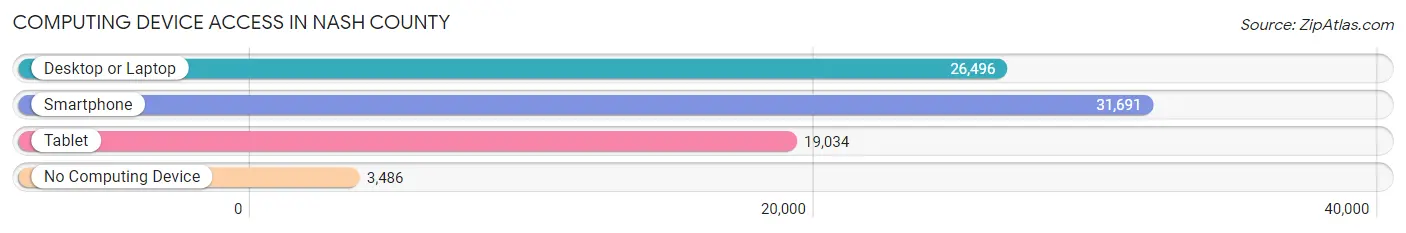
| Device Type | # Households | % Households |
| Desktop or Laptop | 26,496 | 70.1% |
| Smartphone | 31,691 | 83.9% |
| Tablet | 19,034 | 50.4% |
| No Computing Device | 3,486 | 9.2% |
| Total | 37,793 | 100.0% |
Internet Access in Nash County
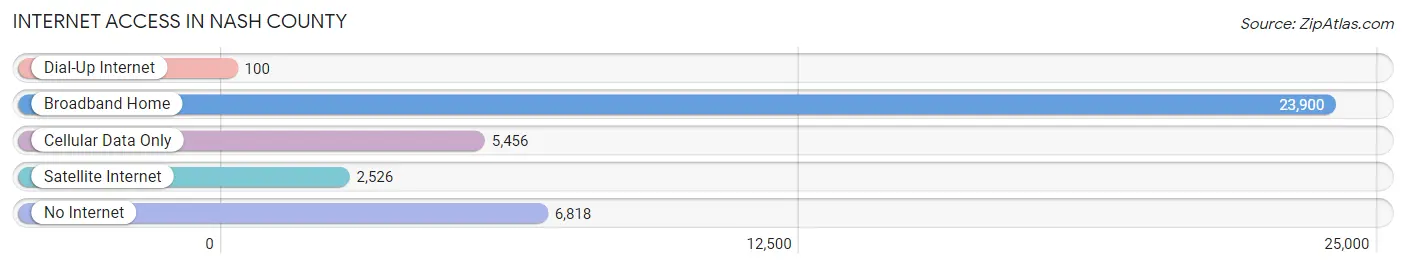
| Internet Type | # Households | % Households |
| Dial-Up Internet | 100 | 0.3% |
| Broadband Home | 23,900 | 63.2% |
| Cellular Data Only | 5,456 | 14.4% |
| Satellite Internet | 2,526 | 6.7% |
| No Internet | 6,818 | 18.0% |
| Total | 37,793 | 100.0% |
Nash County Summary
Nash County is located in the northeastern part of North Carolina, and is part of the Rocky Mount Metropolitan Statistical Area. The county was formed in 1777 from Edgecombe County and was named for American Revolutionary War hero General Francis Nash. The county seat is Nashville, which is also the largest city in the county.
Geography
Nash County is located in the northeastern part of North Carolina, and is bordered by Edgecombe County to the north, Wilson County to the east, Johnston County to the south, and Halifax County to the west. The county covers an area of 545 square miles, and is mostly rural, with a few small towns and villages scattered throughout. The terrain is mostly flat, with some rolling hills in the western part of the county. The county is drained by the Tar River, which flows through the center of the county.
Climate
Nash County has a humid subtropical climate, with hot, humid summers and mild winters. The average annual temperature is around 70°F, with average highs in the summer reaching the mid-90s and average lows in the winter reaching the mid-30s. The average annual precipitation is around 45 inches, with most of it falling in the summer months.
Demographics
As of the 2010 census, Nash County had a population of 95,840, making it the 15th most populous county in North Carolina. The population was spread out, with 24.3% under the age of 18, 8.2% from 18 to 24, 28.2% from 25 to 44, 24.7% from 45 to 64, and 14.6% who were 65 years of age or older. The median age was 37.4 years. The population was 51.2% female and 48.8% male.
The racial makeup of the county was 68.2% White, 25.2% African American, 0.4% Native American, 1.7% Asian, 0.1% Pacific Islander, 2.7% from other races, and 1.7% from two or more races. Hispanic or Latino of any race were 6.2% of the population.
Economy
Nash County has a diverse economy, with a mix of manufacturing, agriculture, and services. The county is home to several large manufacturing companies, including Nash Health Care Systems, Nash-Rocky Mount Public Schools, and Nash County Schools. Agriculture is also an important part of the economy, with the county producing a variety of crops, including corn, soybeans, cotton, and tobacco. The county also has a thriving service sector, with a variety of restaurants, retail stores, and other businesses.
The median household income in Nash County was $45,845 in 2019, and the median home value was $164,400. The unemployment rate was 4.2%, which was lower than the national average of 3.7%.
Conclusion
Nash County is a rural county located in the northeastern part of North Carolina. The county has a diverse economy, with a mix of manufacturing, agriculture, and services. The population is mostly White, with a significant African American population. The median household income is slightly lower than the national average, but the unemployment rate is lower than the national average.
Common Questions
What is the Total Population of Nash County?
Total Population of Nash County is 95,015.
What is the Total Male Population of Nash County?
Total Male Population of Nash County is 45,908.
What is the Total Female Population of Nash County?
Total Female Population of Nash County is 49,107.
What is the Ratio of Males per 100 Females in Nash County?
There are 93.49 Males per 100 Females in Nash County.
What is the Ratio of Females per 100 Males in Nash County?
There are 106.97 Females per 100 Males in Nash County.
What is the Median Population Age in Nash County?
Median Population Age in Nash County is 41.7 Years.
What is the Average Family Size in Nash County
Average Family Size in Nash County is 3.1 People.
What is the Average Household Size in Nash County
Average Household Size in Nash County is 2.5 People.
What is Per Capita Income in Nash County?
Per Capita income in Nash County is $31,987.
What is the Median Family Income in Nash County?
Median Family Income in Nash County is $69,593.
What is the Median Household income in Nash County?
Median Household Income in Nash County is $56,770.
What is Income or Wage Gap in Nash County?
Income or Wage Gap in Nash County is 20.3%.
Women in Nash County earn 79.7 cents for every dollar earned by a man.
What is Family Income Deficit in Nash County?
Family Income Deficit in Nash County is $9,882.
Families that are below poverty line in Nash County earn $9,882 less on average than the poverty threshold level.
What is Inequality or Gini Index in Nash County?
Inequality or Gini Index in Nash County is 0.45.
How Large is the Labor Force in Nash County?
There are 46,165 People in the Labor Forcein in Nash County.
What is the Percentage of People in the Labor Force in Nash County?
60.1% of People are in the Labor Force in Nash County.
What is the Unemployment Rate in Nash County?
Unemployment Rate in Nash County is 6.4%.