Moore County, NC
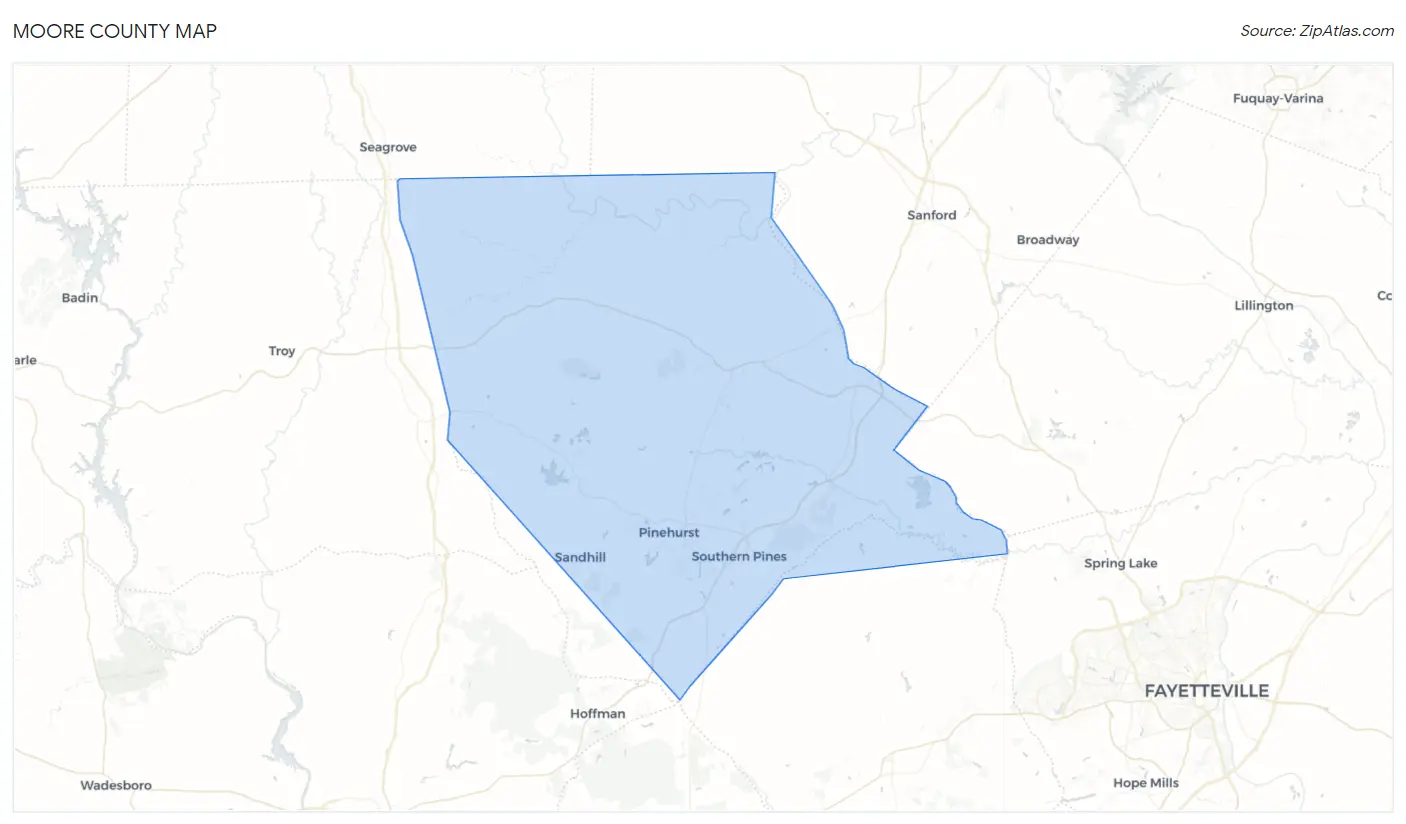
Moore County Map
Moore County Overview
100,759
TOTAL POPULATION
49,243
MALE POPULATION
51,516
FEMALE POPULATION
95.59
MALES / 100 FEMALES
104.62
FEMALES / 100 MALES
43.0
MEDIAN AGE
2.9
AVG FAMILY SIZE
2.4
AVG HOUSEHOLD SIZE
$42,094
PER CAPITA INCOME
$95,534
AVG FAMILY INCOME
$77,981
AVG HOUSEHOLD INCOME
34.3%
WAGE / INCOME GAP [ % ]
65.7¢/ $1
WAGE / INCOME GAP [ $ ]
$11,368
FAMILY INCOME DEFICIT
0.45
INEQUALITY / GINI INDEX
47,179
LABOR FORCE [ PEOPLE ]
57.9%
PERCENT IN LABOR FORCE
4.6%
UNEMPLOYMENT RATE
Moore County Area Codes
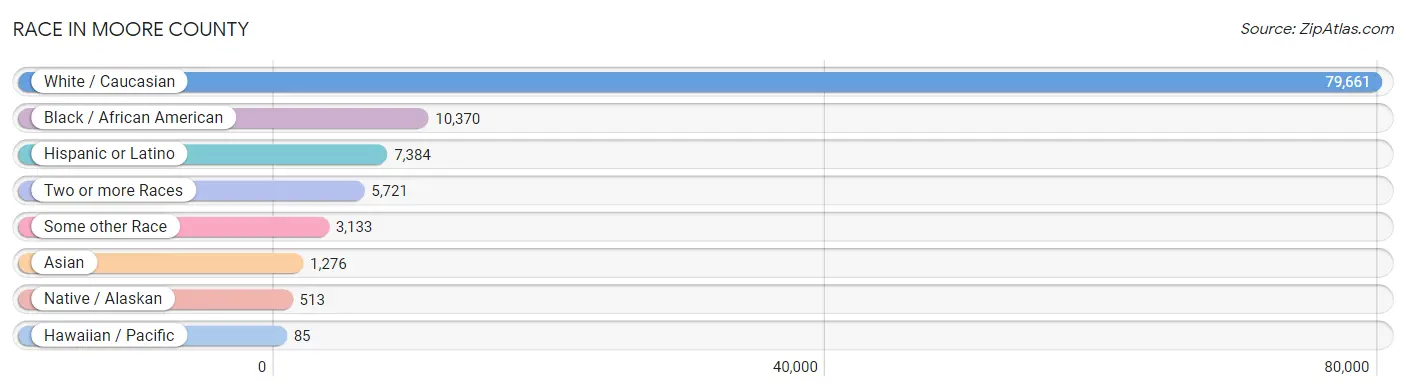
Race in Moore County
The most populous races in Moore County are White / Caucasian (79,661 | 79.1%), Black / African American (10,370 | 10.3%), and Hispanic or Latino (7,384 | 7.3%).
| Race | # Population | % Population |
| Asian | 1,276 | 1.3% |
| Black / African American | 10,370 | 10.3% |
| Hawaiian / Pacific | 85 | 0.1% |
| Hispanic or Latino | 7,384 | 7.3% |
| Native / Alaskan | 513 | 0.5% |
| White / Caucasian | 79,661 | 79.1% |
| Two or more Races | 5,721 | 5.7% |
| Some other Race | 3,133 | 3.1% |
| Total | 100,759 | 100.0% |
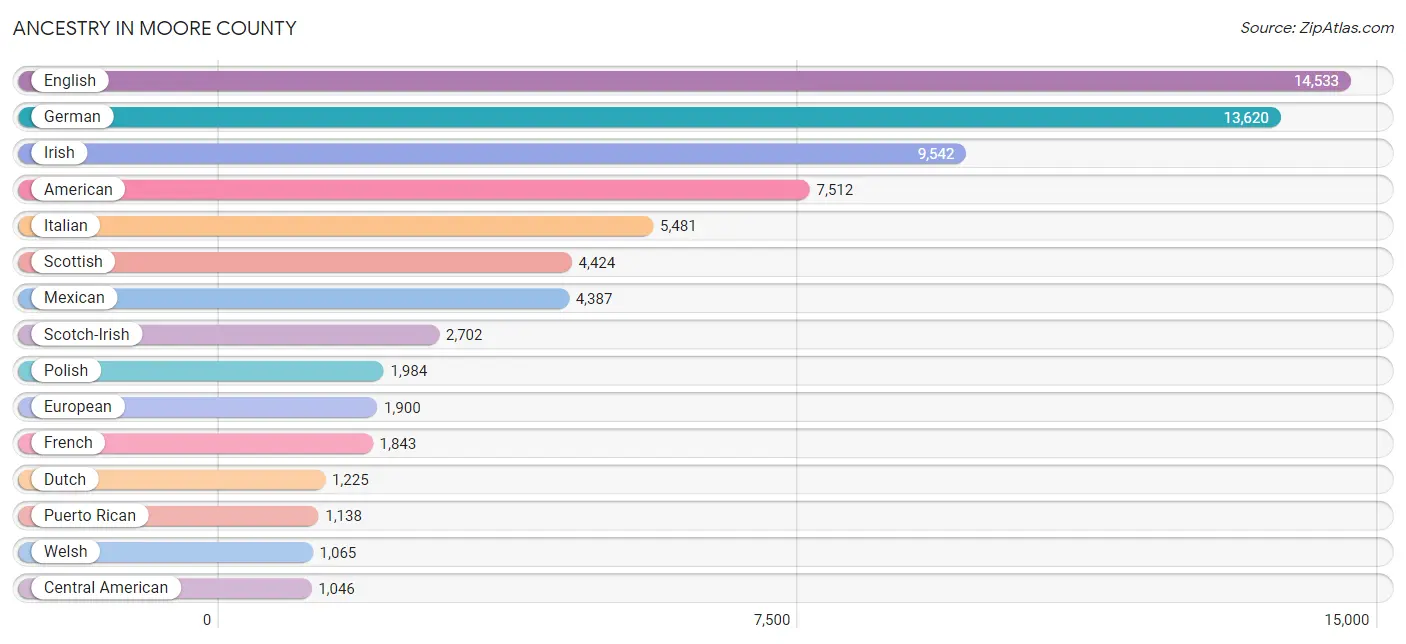
Ancestry in Moore County
The most populous ancestries reported in Moore County are English (14,533 | 14.4%), German (13,620 | 13.5%), Irish (9,542 | 9.5%), American (7,512 | 7.5%), and Italian (5,481 | 5.4%), together accounting for 50.3% of all Moore County residents.
| Ancestry | # Population | % Population |
| African | 291 | 0.3% |
| Albanian | 27 | 0.0% |
| American | 7,512 | 7.5% |
| Arab | 330 | 0.3% |
| Argentinean | 39 | 0.0% |
| Armenian | 18 | 0.0% |
| Australian | 4 | 0.0% |
| Austrian | 191 | 0.2% |
| Belgian | 28 | 0.0% |
| Belizean | 27 | 0.0% |
| Bhutanese | 392 | 0.4% |
| Blackfeet | 46 | 0.1% |
| Brazilian | 14 | 0.0% |
| British | 680 | 0.7% |
| Burmese | 306 | 0.3% |
| Cajun | 26 | 0.0% |
| Canadian | 407 | 0.4% |
| Central American | 1,046 | 1.0% |
| Central American Indian | 45 | 0.0% |
| Cherokee | 503 | 0.5% |
| Chickasaw | 44 | 0.0% |
| Chinese | 2 | 0.0% |
| Chippewa | 21 | 0.0% |
| Choctaw | 8 | 0.0% |
| Colombian | 23 | 0.0% |
| Costa Rican | 109 | 0.1% |
| Croatian | 85 | 0.1% |
| Cuban | 285 | 0.3% |
| Czech | 421 | 0.4% |
| Czechoslovakian | 41 | 0.0% |
| Danish | 225 | 0.2% |
| Dominican | 11 | 0.0% |
| Dutch | 1,225 | 1.2% |
| Eastern European | 126 | 0.1% |
| Egyptian | 34 | 0.0% |
| English | 14,533 | 14.4% |
| Estonian | 27 | 0.0% |
| European | 1,900 | 1.9% |
| Filipino | 15 | 0.0% |
| Finnish | 157 | 0.2% |
| French | 1,843 | 1.8% |
| French Canadian | 386 | 0.4% |
| German | 13,620 | 13.5% |
| Greek | 228 | 0.2% |
| Guamanian / Chamorro | 39 | 0.0% |
| Guatemalan | 523 | 0.5% |
| Honduran | 346 | 0.3% |
| Hungarian | 780 | 0.8% |
| Icelander | 13 | 0.0% |
| Indian (Asian) | 927 | 0.9% |
| Irish | 9,542 | 9.5% |
| Iroquois | 3 | 0.0% |
| Israeli | 35 | 0.0% |
| Italian | 5,481 | 5.4% |
| Jamaican | 65 | 0.1% |
| Korean | 416 | 0.4% |
| Latvian | 22 | 0.0% |
| Lebanese | 243 | 0.2% |
| Lithuanian | 76 | 0.1% |
| Lumbee | 186 | 0.2% |
| Luxembourger | 24 | 0.0% |
| Maltese | 9 | 0.0% |
| Mexican | 4,387 | 4.3% |
| Mexican American Indian | 80 | 0.1% |
| Moroccan | 17 | 0.0% |
| Native Hawaiian | 46 | 0.1% |
| Navajo | 5 | 0.0% |
| Nicaraguan | 7 | 0.0% |
| Nigerian | 20 | 0.0% |
| Northern European | 69 | 0.1% |
| Norwegian | 705 | 0.7% |
| Okinawan | 11 | 0.0% |
| Pakistani | 38 | 0.0% |
| Panamanian | 5 | 0.0% |
| Pennsylvania German | 278 | 0.3% |
| Peruvian | 73 | 0.1% |
| Polish | 1,984 | 2.0% |
| Portuguese | 71 | 0.1% |
| Puerto Rican | 1,138 | 1.1% |
| Romanian | 164 | 0.2% |
| Russian | 307 | 0.3% |
| Salvadoran | 56 | 0.1% |
| Scandinavian | 273 | 0.3% |
| Scotch-Irish | 2,702 | 2.7% |
| Scottish | 4,424 | 4.4% |
| Seminole | 6 | 0.0% |
| Serbian | 23 | 0.0% |
| Sioux | 35 | 0.0% |
| Slavic | 85 | 0.1% |
| Slovak | 519 | 0.5% |
| Slovene | 12 | 0.0% |
| South African | 103 | 0.1% |
| South American | 228 | 0.2% |
| South American Indian | 2 | 0.0% |
| Spaniard | 31 | 0.0% |
| Spanish | 80 | 0.1% |
| Sri Lankan | 415 | 0.4% |
| Subsaharan African | 426 | 0.4% |
| Swedish | 732 | 0.7% |
| Swiss | 314 | 0.3% |
| Thai | 183 | 0.2% |
| Ukrainian | 285 | 0.3% |
| Welsh | 1,065 | 1.1% |
| Yugoslavian | 81 | 0.1% | View All 104 Rows |
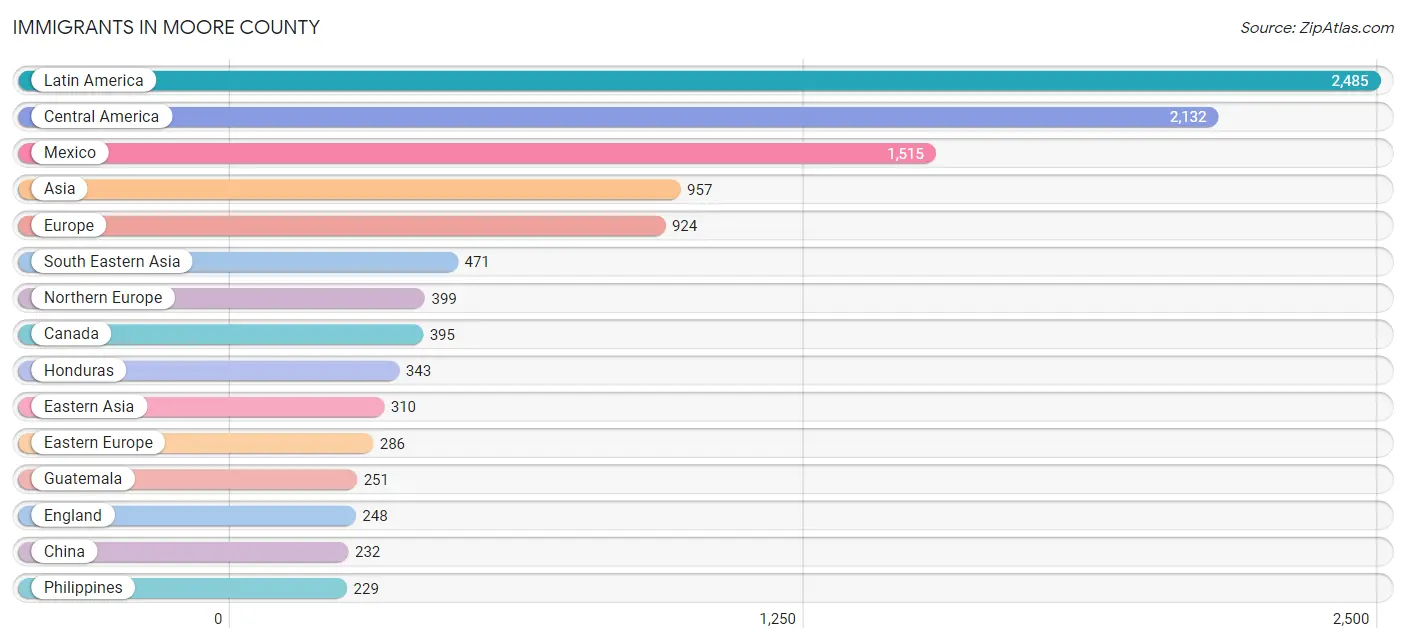
Immigrants in Moore County
The most numerous immigrant groups reported in Moore County came from Latin America (2,485 | 2.5%), Central America (2,132 | 2.1%), Mexico (1,515 | 1.5%), Asia (957 | 0.9%), and Europe (924 | 0.9%), together accounting for 8.0% of all Moore County residents.
| Immigration Origin | # Population | % Population |
| Africa | 175 | 0.2% |
| Albania | 15 | 0.0% |
| Argentina | 1 | 0.0% |
| Asia | 957 | 0.9% |
| Australia | 33 | 0.0% |
| Austria | 17 | 0.0% |
| Barbados | 13 | 0.0% |
| Brazil | 32 | 0.0% |
| Canada | 395 | 0.4% |
| Caribbean | 167 | 0.2% |
| Central America | 2,132 | 2.1% |
| Chile | 47 | 0.1% |
| China | 232 | 0.2% |
| Colombia | 5 | 0.0% |
| Croatia | 30 | 0.0% |
| Cuba | 68 | 0.1% |
| Czechoslovakia | 4 | 0.0% |
| Dominican Republic | 7 | 0.0% |
| Eastern Africa | 36 | 0.0% |
| Eastern Asia | 310 | 0.3% |
| Eastern Europe | 286 | 0.3% |
| Egypt | 34 | 0.0% |
| El Salvador | 23 | 0.0% |
| England | 248 | 0.3% |
| Europe | 924 | 0.9% |
| France | 58 | 0.1% |
| Germany | 142 | 0.1% |
| Guatemala | 251 | 0.3% |
| Honduras | 343 | 0.3% |
| India | 152 | 0.2% |
| Italy | 12 | 0.0% |
| Jamaica | 79 | 0.1% |
| Japan | 18 | 0.0% |
| Korea | 60 | 0.1% |
| Latin America | 2,485 | 2.5% |
| Lithuania | 55 | 0.1% |
| Malaysia | 11 | 0.0% |
| Mexico | 1,515 | 1.5% |
| Northern Africa | 34 | 0.0% |
| Northern Europe | 399 | 0.4% |
| Oceania | 33 | 0.0% |
| Peru | 73 | 0.1% |
| Philippines | 229 | 0.2% |
| Portugal | 10 | 0.0% |
| Romania | 54 | 0.1% |
| Russia | 118 | 0.1% |
| South Africa | 74 | 0.1% |
| South America | 186 | 0.2% |
| South Central Asia | 152 | 0.2% |
| South Eastern Asia | 471 | 0.5% |
| Southern Europe | 22 | 0.0% |
| Taiwan | 38 | 0.0% |
| Thailand | 12 | 0.0% |
| Ukraine | 10 | 0.0% |
| Vietnam | 219 | 0.2% |
| Western Asia | 24 | 0.0% |
| Western Europe | 217 | 0.2% |
| Yemen | 24 | 0.0% | View All 58 Rows |
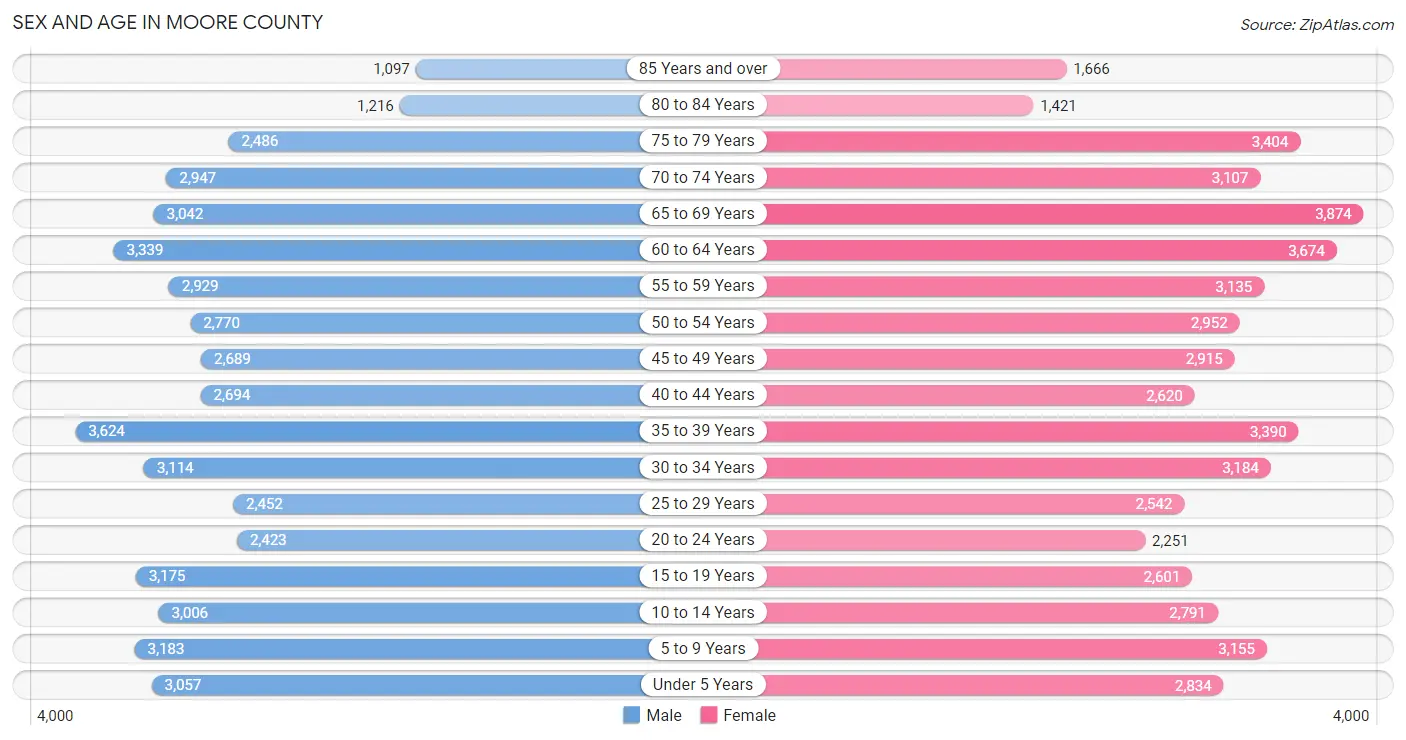
Sex and Age in Moore County
Sex and Age in Moore County
The most populous age groups in Moore County are 35 to 39 Years (3,624 | 7.4%) for men and 65 to 69 Years (3,874 | 7.5%) for women.
| Age Bracket | Male | Female |
| Under 5 Years | 3,057 (6.2%) | 2,834 (5.5%) |
| 5 to 9 Years | 3,183 (6.5%) | 3,155 (6.1%) |
| 10 to 14 Years | 3,006 (6.1%) | 2,791 (5.4%) |
| 15 to 19 Years | 3,175 (6.5%) | 2,601 (5.1%) |
| 20 to 24 Years | 2,423 (4.9%) | 2,251 (4.4%) |
| 25 to 29 Years | 2,452 (5.0%) | 2,542 (4.9%) |
| 30 to 34 Years | 3,114 (6.3%) | 3,184 (6.2%) |
| 35 to 39 Years | 3,624 (7.4%) | 3,390 (6.6%) |
| 40 to 44 Years | 2,694 (5.5%) | 2,620 (5.1%) |
| 45 to 49 Years | 2,689 (5.5%) | 2,915 (5.7%) |
| 50 to 54 Years | 2,770 (5.6%) | 2,952 (5.7%) |
| 55 to 59 Years | 2,929 (5.9%) | 3,135 (6.1%) |
| 60 to 64 Years | 3,339 (6.8%) | 3,674 (7.1%) |
| 65 to 69 Years | 3,042 (6.2%) | 3,874 (7.5%) |
| 70 to 74 Years | 2,947 (6.0%) | 3,107 (6.0%) |
| 75 to 79 Years | 2,486 (5.1%) | 3,404 (6.6%) |
| 80 to 84 Years | 1,216 (2.5%) | 1,421 (2.8%) |
| 85 Years and over | 1,097 (2.2%) | 1,666 (3.2%) |
| Total | 49,243 (100.0%) | 51,516 (100.0%) |
Families and Households in Moore County
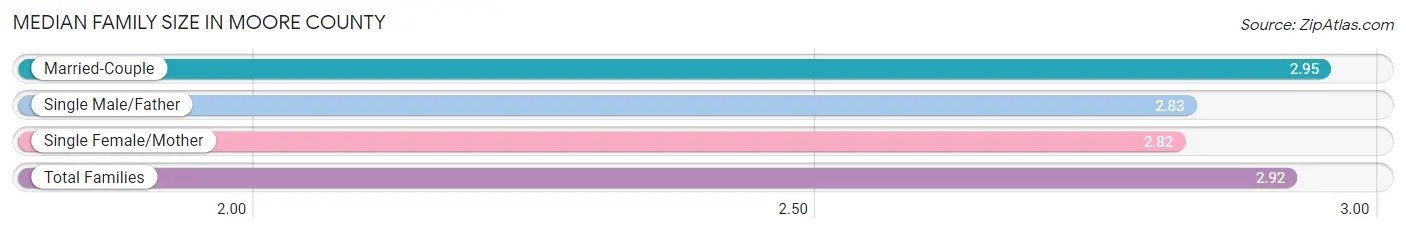
Median Family Size in Moore County
The median family size in Moore County is 2.92 persons per family, with married-couple families (22,641 | 81.3%) accounting for the largest median family size of 2.95 persons per family. On the other hand, single female/mother families (3,908 | 14.0%) represent the smallest median family size with 2.82 persons per family.
| Family Type | # Families | Family Size |
| Married-Couple | 22,641 (81.3%) | 2.95 |
| Single Male/Father | 1,312 (4.7%) | 2.83 |
| Single Female/Mother | 3,908 (14.0%) | 2.82 |
| Total Families | 27,861 (100.0%) | 2.92 |
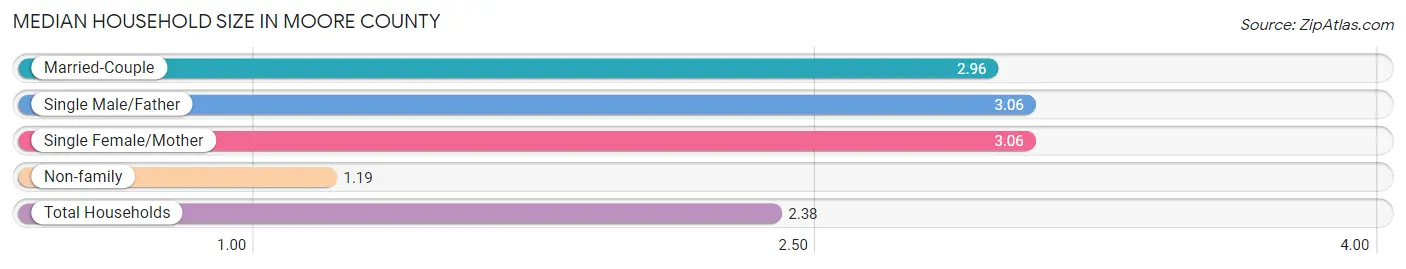
Median Household Size in Moore County
The median household size in Moore County is 2.38 persons per household, with single male/father households (1,312 | 3.1%) accounting for the largest median household size of 3.06 persons per household. non-family households (13,921 | 33.3%) represent the smallest median household size with 1.19 persons per household.
| Household Type | # Households | Household Size |
| Married-Couple | 22,641 (54.2%) | 2.96 |
| Single Male/Father | 1,312 (3.1%) | 3.06 |
| Single Female/Mother | 3,908 (9.3%) | 3.06 |
| Non-family | 13,921 (33.3%) | 1.19 |
| Total Households | 41,782 (100.0%) | 2.38 |
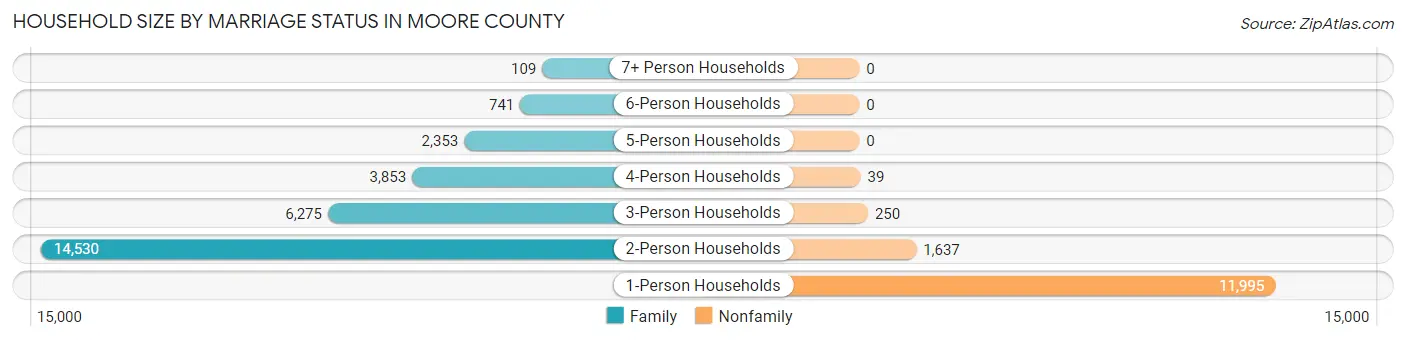
Household Size by Marriage Status in Moore County
Out of a total of 41,782 households in Moore County, 27,861 (66.7%) are family households, while 13,921 (33.3%) are nonfamily households. The most numerous type of family households are 2-person households, comprising 14,530, and the most common type of nonfamily households are 1-person households, comprising 11,995.
| Household Size | Family Households | Nonfamily Households |
| 1-Person Households | - | 11,995 (28.7%) |
| 2-Person Households | 14,530 (34.8%) | 1,637 (3.9%) |
| 3-Person Households | 6,275 (15.0%) | 250 (0.6%) |
| 4-Person Households | 3,853 (9.2%) | 39 (0.1%) |
| 5-Person Households | 2,353 (5.6%) | 0 (0.0%) |
| 6-Person Households | 741 (1.8%) | 0 (0.0%) |
| 7+ Person Households | 109 (0.3%) | 0 (0.0%) |
| Total | 27,861 (66.7%) | 13,921 (33.3%) |
Female Fertility in Moore County
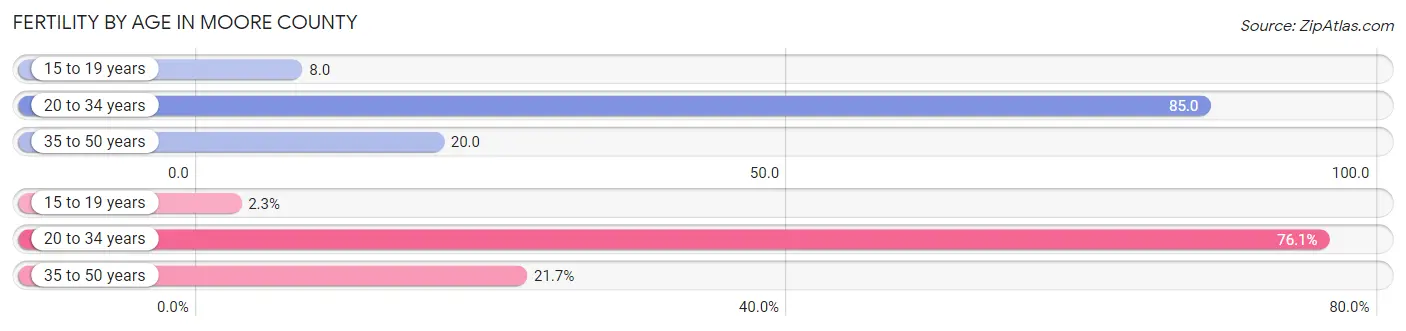
Fertility by Age in Moore County
Average fertility rate in Moore County is 44.0 births per 1,000 women. Women in the age bracket of 20 to 34 years have the highest fertility rate with 85.0 births per 1,000 women. Women in the age bracket of 20 to 34 years acount for 76.1% of all women with births.
| Age Bracket | Women with Births | Births / 1,000 Women |
| 15 to 19 years | 20 (2.2%) | 8.0 |
| 20 to 34 years | 675 (76.1%) | 85.0 |
| 35 to 50 years | 192 (21.6%) | 20.0 |
| Total | 887 (100.0%) | 44.0 |
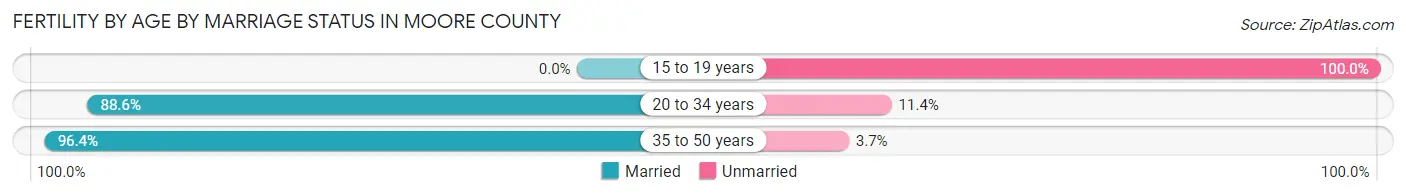
Fertility by Age by Marriage Status in Moore County
88.3% of women with births (887) in Moore County are married. The highest percentage of unmarried women with births falls into 15 to 19 years age bracket with 100.0% of them unmarried at the time of birth, while the lowest percentage of unmarried women with births belong to 35 to 50 years age bracket with 3.6% of them unmarried.
| Age Bracket | Married | Unmarried |
| 15 to 19 years | 0 (0.0%) | 20 (100.0%) |
| 20 to 34 years | 598 (88.6%) | 77 (11.4%) |
| 35 to 50 years | 185 (96.4%) | 7 (3.6%) |
| Total | 783 (88.3%) | 104 (11.7%) |
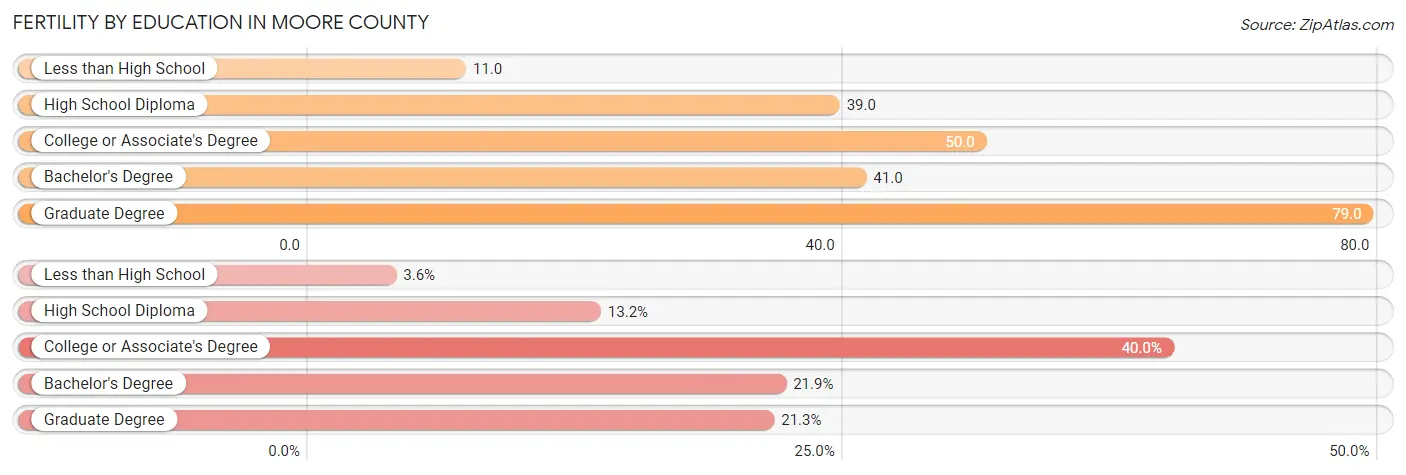
Fertility by Education in Moore County
Average fertility rate in Moore County is 44.0 births per 1,000 women. Women with the education attainment of graduate degree have the highest fertility rate of 79.0 births per 1,000 women, while women with the education attainment of less than high school have the lowest fertility at 11.0 births per 1,000 women. Women with the education attainment of college or associate's degree represent 40.0% of all women with births.
| Educational Attainment | Women with Births | Births / 1,000 Women |
| Less than High School | 32 (3.6%) | 11.0 |
| High School Diploma | 117 (13.2%) | 39.0 |
| College or Associate's Degree | 355 (40.0%) | 50.0 |
| Bachelor's Degree | 194 (21.9%) | 41.0 |
| Graduate Degree | 189 (21.3%) | 79.0 |
| Total | 887 (100.0%) | 44.0 |
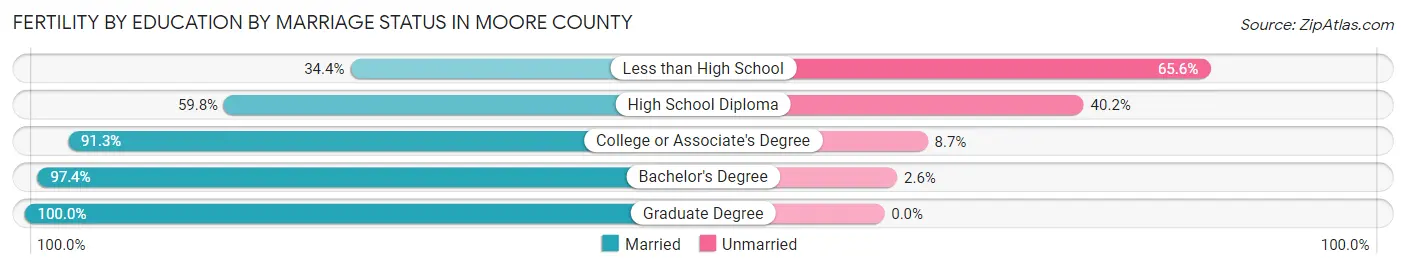
Fertility by Education by Marriage Status in Moore County
11.7% of women with births in Moore County are unmarried. Women with the educational attainment of graduate degree are most likely to be married with 100.0% of them married at childbirth, while women with the educational attainment of less than high school are least likely to be married with 65.6% of them unmarried at childbirth.
| Educational Attainment | Married | Unmarried |
| Less than High School | 11 (34.4%) | 21 (65.6%) |
| High School Diploma | 70 (59.8%) | 47 (40.2%) |
| College or Associate's Degree | 324 (91.3%) | 31 (8.7%) |
| Bachelor's Degree | 189 (97.4%) | 5 (2.6%) |
| Graduate Degree | 189 (100.0%) | 0 (0.0%) |
| Total | 783 (88.3%) | 104 (11.7%) |
Income in Moore County
Income Overview in Moore County
Per Capita Income in Moore County is $42,094, while median incomes of families and households are $95,534 and $77,981 respectively.
| Characteristic | Number | Measure |
| Per Capita Income | 100,759 | $42,094 |
| Median Family Income | 27,861 | $95,534 |
| Mean Family Income | 27,861 | $118,449 |
| Median Household Income | 41,782 | $77,981 |
| Mean Household Income | 41,782 | $100,144 |
| Income Deficit | 27,861 | $11,368 |
| Wage / Income Gap (%) | 100,759 | 34.27% |
| Wage / Income Gap ($) | 100,759 | 65.73¢ per $1 |
| Gini / Inequality Index | 100,759 | 0.45 |
Earnings by Sex in Moore County
Average Earnings in Moore County are $41,506, $50,469 for men and $33,173 for women, a difference of 34.3%.
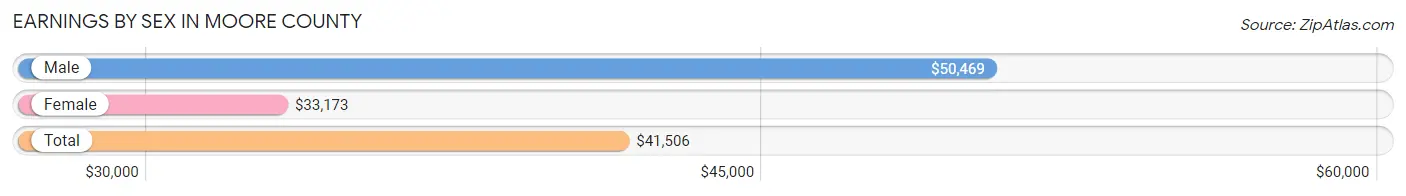
| Sex | Number | Average Earnings |
| Male | 26,354 (53.3%) | $50,469 |
| Female | 23,082 (46.7%) | $33,173 |
| Total | 49,436 (100.0%) | $41,506 |
Earnings by Sex by Income Bracket in Moore County
The most common earnings brackets in Moore County are $100,000+ for men (4,696 | 17.8%) and $2,499 or less for women (1,710 | 7.4%).
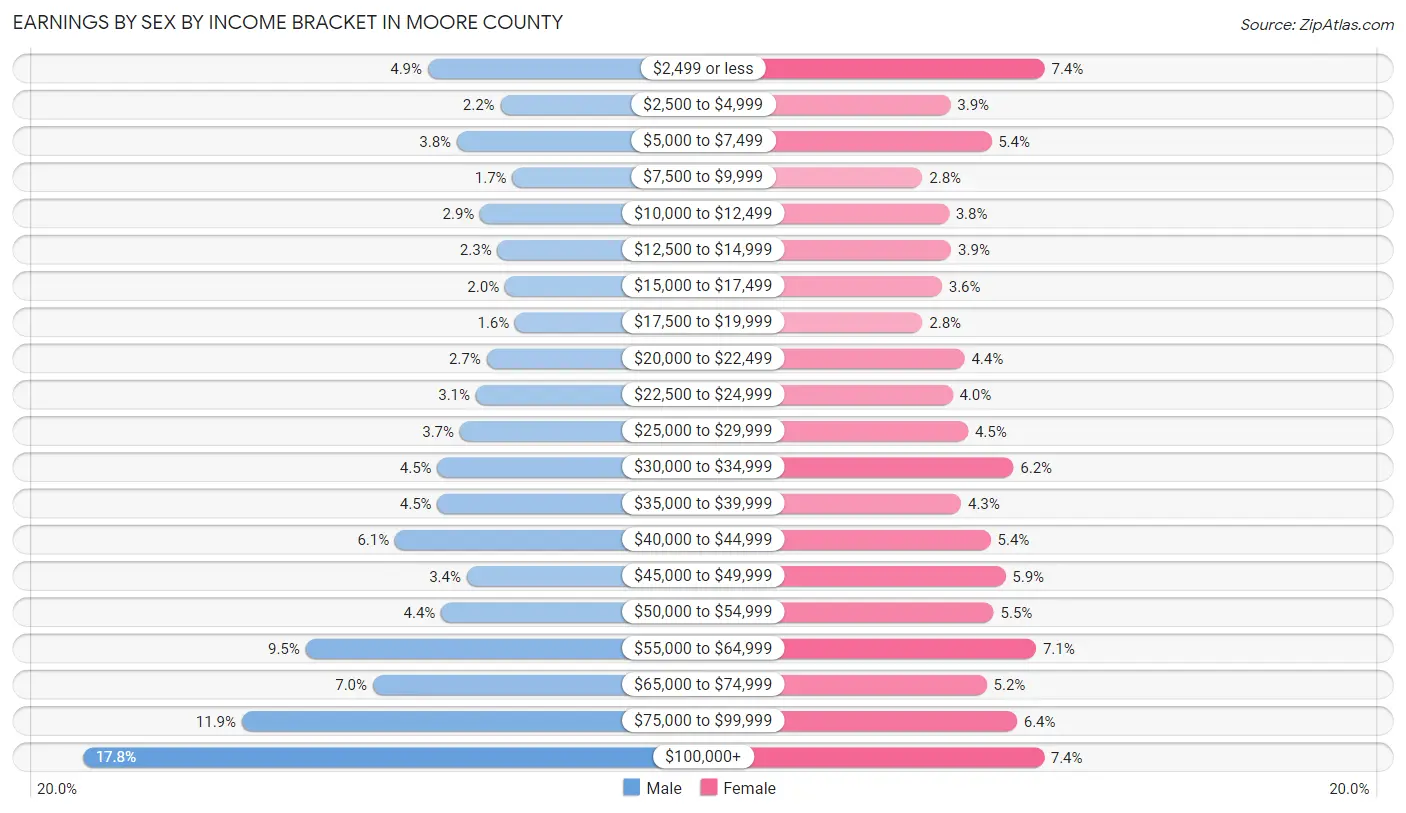
| Income | Male | Female |
| $2,499 or less | 1,288 (4.9%) | 1,710 (7.4%) |
| $2,500 to $4,999 | 573 (2.2%) | 896 (3.9%) |
| $5,000 to $7,499 | 1,002 (3.8%) | 1,248 (5.4%) |
| $7,500 to $9,999 | 454 (1.7%) | 653 (2.8%) |
| $10,000 to $12,499 | 773 (2.9%) | 882 (3.8%) |
| $12,500 to $14,999 | 602 (2.3%) | 902 (3.9%) |
| $15,000 to $17,499 | 528 (2.0%) | 822 (3.6%) |
| $17,500 to $19,999 | 428 (1.6%) | 654 (2.8%) |
| $20,000 to $22,499 | 710 (2.7%) | 1,017 (4.4%) |
| $22,500 to $24,999 | 814 (3.1%) | 915 (4.0%) |
| $25,000 to $29,999 | 972 (3.7%) | 1,048 (4.5%) |
| $30,000 to $34,999 | 1,193 (4.5%) | 1,440 (6.2%) |
| $35,000 to $39,999 | 1,195 (4.5%) | 988 (4.3%) |
| $40,000 to $44,999 | 1,614 (6.1%) | 1,245 (5.4%) |
| $45,000 to $49,999 | 903 (3.4%) | 1,372 (5.9%) |
| $50,000 to $54,999 | 1,156 (4.4%) | 1,270 (5.5%) |
| $55,000 to $64,999 | 2,496 (9.5%) | 1,636 (7.1%) |
| $65,000 to $74,999 | 1,832 (7.0%) | 1,210 (5.2%) |
| $75,000 to $99,999 | 3,125 (11.9%) | 1,470 (6.4%) |
| $100,000+ | 4,696 (17.8%) | 1,704 (7.4%) |
| Total | 26,354 (100.0%) | 23,082 (100.0%) |
Earnings by Sex by Educational Attainment in Moore County
Average earnings in Moore County are $56,235 for men and $38,070 for women, a difference of 32.3%. Men with an educational attainment of graduate degree enjoy the highest average annual earnings of $99,971, while those with less than high school education earn the least with $32,364. Women with an educational attainment of graduate degree earn the most with the average annual earnings of $59,819, while those with less than high school education have the smallest earnings of $18,208.
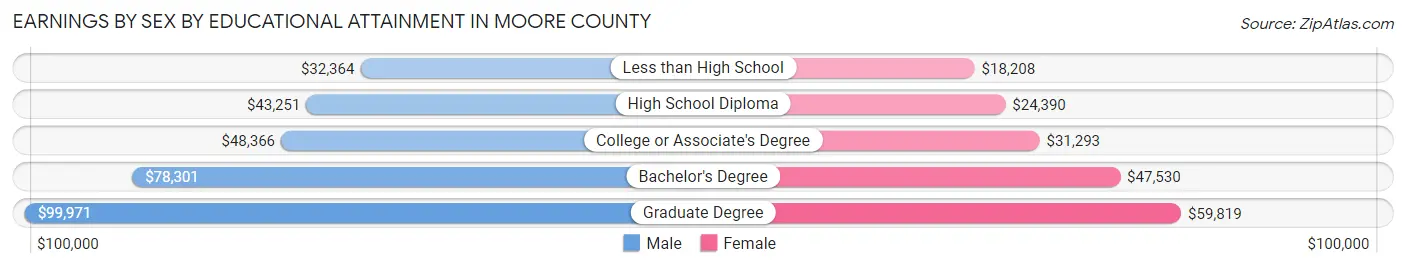
| Educational Attainment | Male Income | Female Income |
| Less than High School | $32,364 | $18,208 |
| High School Diploma | $43,251 | $24,390 |
| College or Associate's Degree | $48,366 | $31,293 |
| Bachelor's Degree | $78,301 | $47,530 |
| Graduate Degree | $99,971 | $59,819 |
| Total | $56,235 | $38,070 |
Family Income in Moore County
Family Income Brackets in Moore County
According to the Moore County family income data, there are 6,770 families falling into the $100,000 to $149,999 income range, which is the most common income bracket and makes up 24.3% of all families. Conversely, the $10,000 to $14,999 income bracket is the least frequent group with only 418 families (1.5%) belonging to this category.
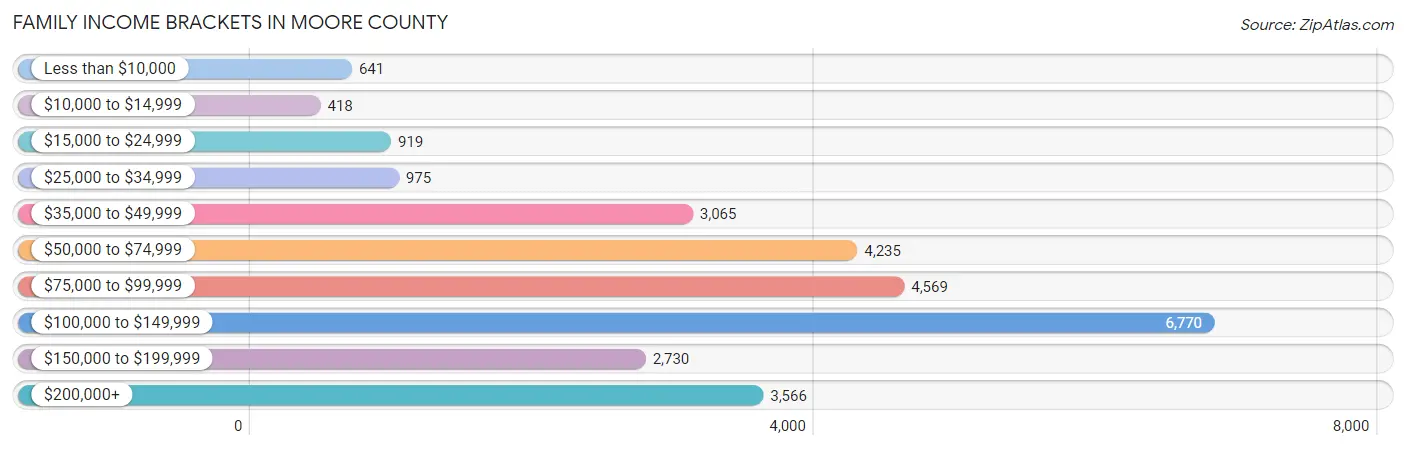
| Income Bracket | # Families | % Families |
| Less than $10,000 | 641 | 2.3% |
| $10,000 to $14,999 | 418 | 1.5% |
| $15,000 to $24,999 | 919 | 3.3% |
| $25,000 to $34,999 | 975 | 3.5% |
| $35,000 to $49,999 | 3,065 | 11.0% |
| $50,000 to $74,999 | 4,235 | 15.2% |
| $75,000 to $99,999 | 4,569 | 16.4% |
| $100,000 to $149,999 | 6,770 | 24.3% |
| $150,000 to $199,999 | 2,730 | 9.8% |
| $200,000+ | 3,566 | 12.8% |
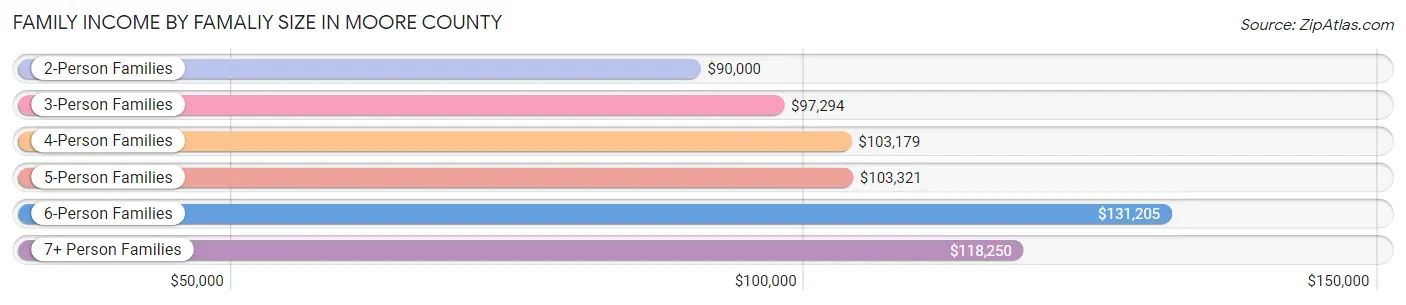
Family Income by Famaliy Size in Moore County
6-person families (643 | 2.3%) account for the highest median family income in Moore County with $131,205 per family, while 2-person families (15,100 | 54.2%) have the highest median income of $45,000 per family member.
| Income Bracket | # Families | Median Income |
| 2-Person Families | 15,100 (54.2%) | $90,000 |
| 3-Person Families | 6,077 (21.8%) | $97,294 |
| 4-Person Families | 3,811 (13.7%) | $103,179 |
| 5-Person Families | 2,133 (7.7%) | $103,321 |
| 6-Person Families | 643 (2.3%) | $131,205 |
| 7+ Person Families | 97 (0.4%) | $118,250 |
| Total | 27,861 (100.0%) | $95,534 |
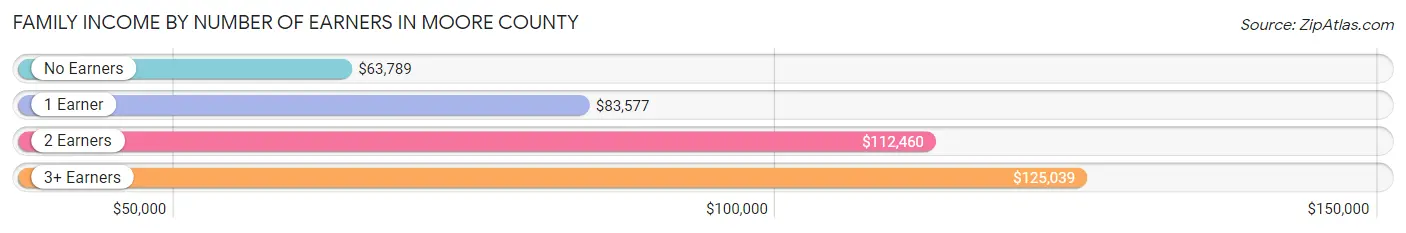
Family Income by Number of Earners in Moore County
The median family income in Moore County is $95,534, with families comprising 3+ earners (2,127) having the highest median family income of $125,039, while families with no earners (5,841) have the lowest median family income of $63,789, accounting for 7.6% and 21.0% of families, respectively.
| Number of Earners | # Families | Median Income |
| No Earners | 5,841 (21.0%) | $63,789 |
| 1 Earner | 8,547 (30.7%) | $83,577 |
| 2 Earners | 11,346 (40.7%) | $112,460 |
| 3+ Earners | 2,127 (7.6%) | $125,039 |
| Total | 27,861 (100.0%) | $95,534 |
Household Income in Moore County
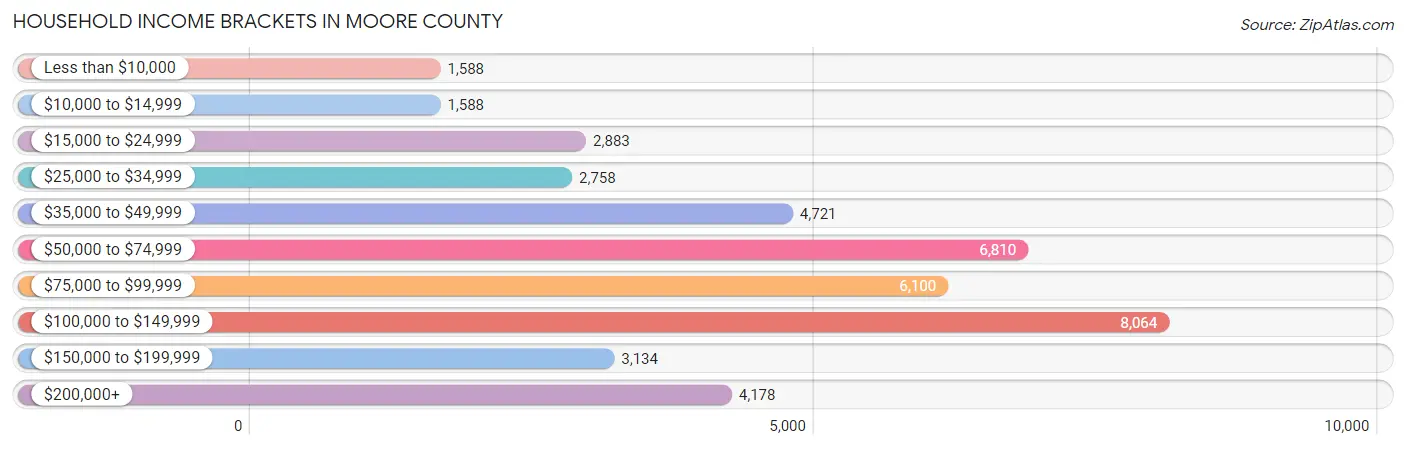
Household Income Brackets in Moore County
With 8,064 households falling in the category, the $100,000 to $149,999 income range is the most frequent in Moore County, accounting for 19.3% of all households. In contrast, only 1,588 households (3.8%) fall into the less than $10,000 income bracket, making it the least populous group.
| Income Bracket | # Households | % Households |
| Less than $10,000 | 1,588 | 3.8% |
| $10,000 to $14,999 | 1,588 | 3.8% |
| $15,000 to $24,999 | 2,883 | 6.9% |
| $25,000 to $34,999 | 2,758 | 6.6% |
| $35,000 to $49,999 | 4,721 | 11.3% |
| $50,000 to $74,999 | 6,810 | 16.3% |
| $75,000 to $99,999 | 6,100 | 14.6% |
| $100,000 to $149,999 | 8,064 | 19.3% |
| $150,000 to $199,999 | 3,134 | 7.5% |
| $200,000+ | 4,178 | 10.0% |
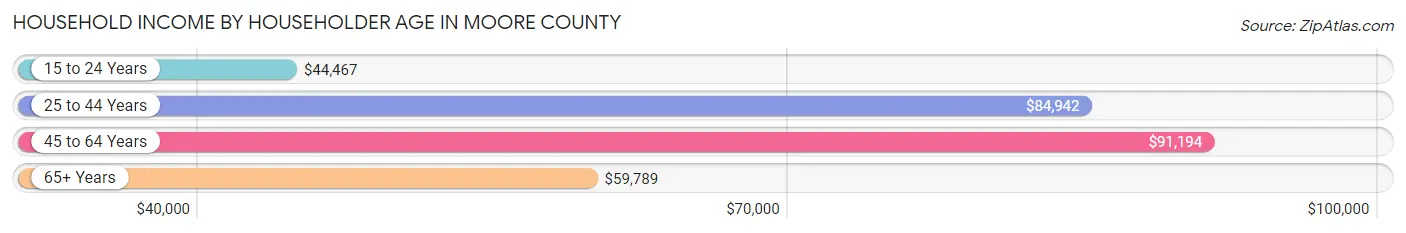
Household Income by Householder Age in Moore County
The median household income in Moore County is $77,981, with the highest median household income of $91,194 found in the 45 to 64 years age bracket for the primary householder. A total of 13,980 households (33.5%) fall into this category. Meanwhile, the 15 to 24 years age bracket for the primary householder has the lowest median household income of $44,467, with 1,118 households (2.7%) in this group.
| Income Bracket | # Households | Median Income |
| 15 to 24 Years | 1,118 (2.7%) | $44,467 |
| 25 to 44 Years | 12,120 (29.0%) | $84,942 |
| 45 to 64 Years | 13,980 (33.5%) | $91,194 |
| 65+ Years | 14,564 (34.9%) | $59,789 |
| Total | 41,782 (100.0%) | $77,981 |
Poverty in Moore County
Income Below Poverty by Sex and Age in Moore County
With 7.8% poverty level for males and 11.1% for females among the residents of Moore County, 15 year old males and 18 to 24 year old females are the most vulnerable to poverty, with 277 males (39.2%) and 634 females (19.5%) in their respective age groups living below the poverty level.
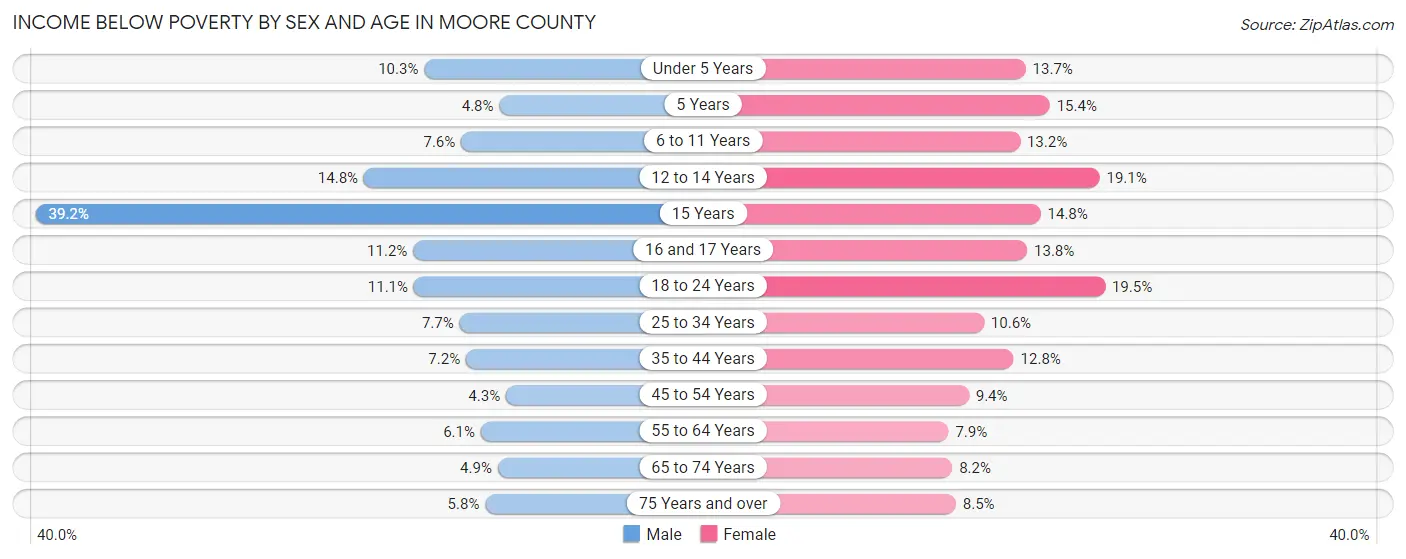
| Age Bracket | Male | Female |
| Under 5 Years | 305 (10.3%) | 364 (13.7%) |
| 5 Years | 18 (4.8%) | 115 (15.4%) |
| 6 to 11 Years | 267 (7.6%) | 485 (13.2%) |
| 12 to 14 Years | 305 (14.8%) | 257 (19.1%) |
| 15 Years | 277 (39.2%) | 80 (14.8%) |
| 16 and 17 Years | 149 (11.2%) | 146 (13.8%) |
| 18 to 24 Years | 393 (11.1%) | 634 (19.5%) |
| 25 to 34 Years | 429 (7.7%) | 603 (10.5%) |
| 35 to 44 Years | 457 (7.2%) | 767 (12.8%) |
| 45 to 54 Years | 232 (4.3%) | 551 (9.4%) |
| 55 to 64 Years | 383 (6.1%) | 538 (7.9%) |
| 65 to 74 Years | 287 (4.9%) | 560 (8.2%) |
| 75 Years and over | 261 (5.8%) | 517 (8.5%) |
| Total | 3,763 (7.8%) | 5,617 (11.1%) |
Income Above Poverty by Sex and Age in Moore County
According to the poverty statistics in Moore County, males aged 45 to 54 years and females aged 55 to 64 years are the age groups that are most secure financially, with 95.7% of males and 92.1% of females in these age groups living above the poverty line.
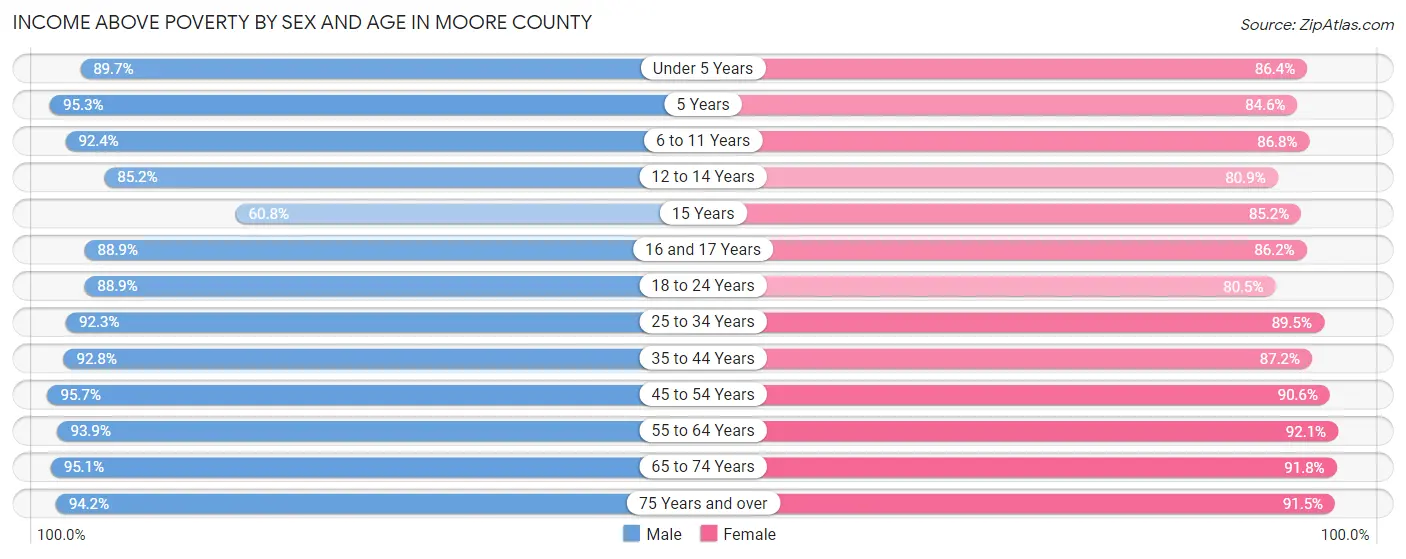
| Age Bracket | Male | Female |
| Under 5 Years | 2,647 (89.7%) | 2,302 (86.4%) |
| 5 Years | 361 (95.3%) | 630 (84.6%) |
| 6 to 11 Years | 3,249 (92.4%) | 3,180 (86.8%) |
| 12 to 14 Years | 1,754 (85.2%) | 1,086 (80.9%) |
| 15 Years | 430 (60.8%) | 462 (85.2%) |
| 16 and 17 Years | 1,187 (88.8%) | 915 (86.2%) |
| 18 to 24 Years | 3,146 (88.9%) | 2,611 (80.5%) |
| 25 to 34 Years | 5,136 (92.3%) | 5,114 (89.4%) |
| 35 to 44 Years | 5,861 (92.8%) | 5,243 (87.2%) |
| 45 to 54 Years | 5,219 (95.7%) | 5,293 (90.6%) |
| 55 to 64 Years | 5,867 (93.9%) | 6,258 (92.1%) |
| 65 to 74 Years | 5,601 (95.1%) | 6,266 (91.8%) |
| 75 Years and over | 4,239 (94.2%) | 5,584 (91.5%) |
| Total | 44,697 (92.2%) | 44,944 (88.9%) |
Income Below Poverty Among Married-Couple Families in Moore County
The poverty statistics for married-couple families in Moore County show that 2.1% or 480 of the total 22,641 families live below the poverty line. Families with 5 or more children have the highest poverty rate of 17.0%, comprising of 9 families. On the other hand, families with 1 or 2 children have the lowest poverty rate of 1.0%, which includes 63 families.
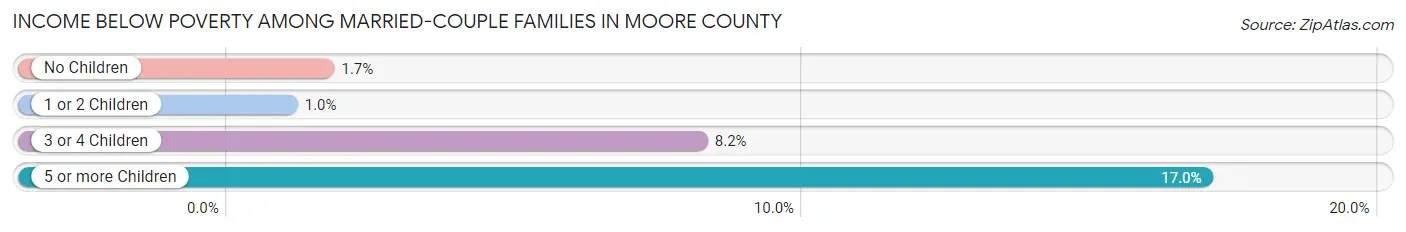
| Children | Above Poverty | Below Poverty |
| No Children | 14,279 (98.3%) | 244 (1.7%) |
| 1 or 2 Children | 5,998 (99.0%) | 63 (1.0%) |
| 3 or 4 Children | 1,840 (91.8%) | 164 (8.2%) |
| 5 or more Children | 44 (83.0%) | 9 (17.0%) |
| Total | 22,161 (97.9%) | 480 (2.1%) |
Income Below Poverty Among Single-Parent Households in Moore County
According to the poverty data in Moore County, 6.6% or 86 single-father households and 26.8% or 1,047 single-mother households are living below the poverty line. Among single-father households, those with 3 or 4 children have the highest poverty rate, with 40 households (31.2%) experiencing poverty. Likewise, among single-mother households, those with 3 or 4 children have the highest poverty rate, with 116 households (56.6%) falling below the poverty line.
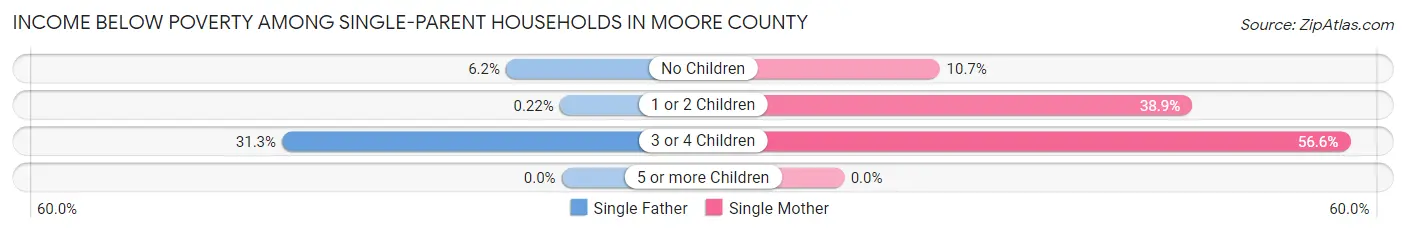
| Children | Single Father | Single Mother |
| No Children | 45 (6.2%) | 194 (10.7%) |
| 1 or 2 Children | 1 (0.2%) | 737 (38.9%) |
| 3 or 4 Children | 40 (31.2%) | 116 (56.6%) |
| 5 or more Children | 0 (0.0%) | 0 (0.0%) |
| Total | 86 (6.6%) | 1,047 (26.8%) |
Income Below Poverty Among Married-Couple vs Single-Parent Households in Moore County
The poverty data for Moore County shows that 480 of the married-couple family households (2.1%) and 1,133 of the single-parent households (21.7%) are living below the poverty level. Within the married-couple family households, those with 5 or more children have the highest poverty rate, with 9 households (17.0%) falling below the poverty line. Among the single-parent households, those with 3 or 4 children have the highest poverty rate, with 156 household (46.9%) living below poverty.
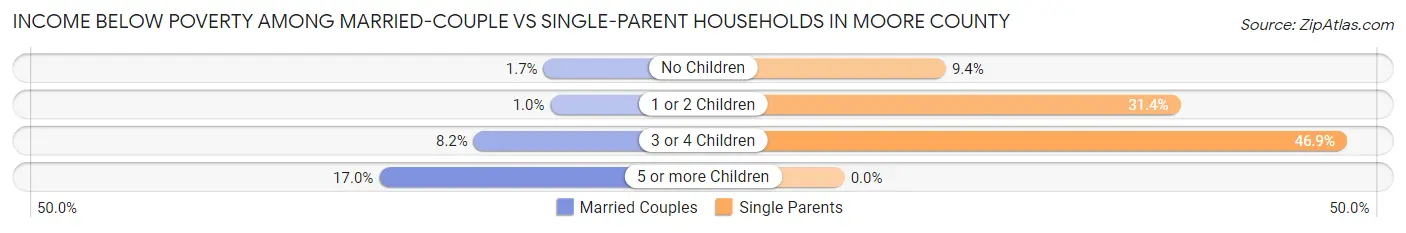
| Children | Married-Couple Families | Single-Parent Households |
| No Children | 244 (1.7%) | 239 (9.4%) |
| 1 or 2 Children | 63 (1.0%) | 738 (31.4%) |
| 3 or 4 Children | 164 (8.2%) | 156 (46.9%) |
| 5 or more Children | 9 (17.0%) | 0 (0.0%) |
| Total | 480 (2.1%) | 1,133 (21.7%) |
Employment Characteristics in Moore County
Employment by Class of Employer in Moore County
Among the 44,256 employed individuals in Moore County, private company employees (24,739 | 55.9%), federal government employees (5,326 | 12.0%), and not-for-profit organizations (3,426 | 7.7%) make up the most common classes of employment.
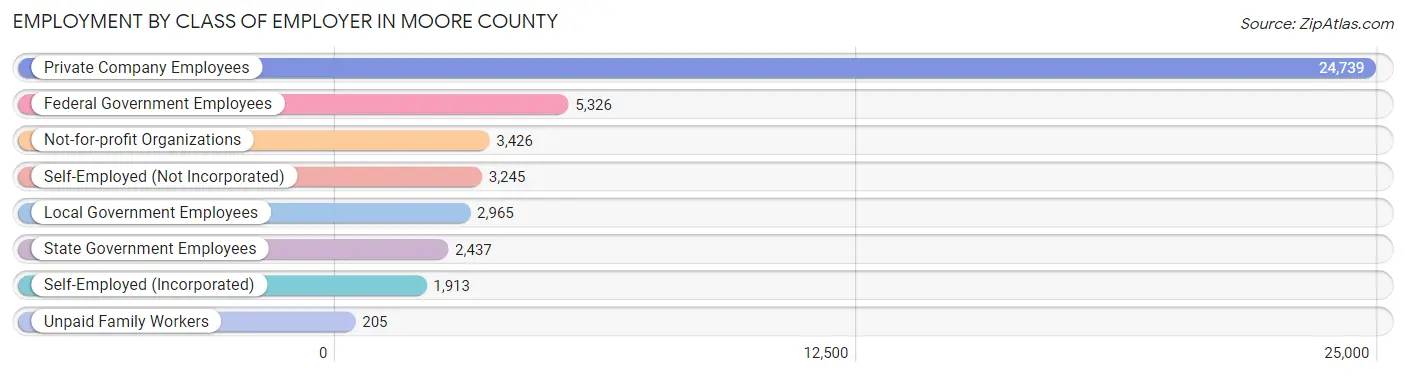
| Employer Class | # Employees | % Employees |
| Private Company Employees | 24,739 | 55.9% |
| Self-Employed (Incorporated) | 1,913 | 4.3% |
| Self-Employed (Not Incorporated) | 3,245 | 7.3% |
| Not-for-profit Organizations | 3,426 | 7.7% |
| Local Government Employees | 2,965 | 6.7% |
| State Government Employees | 2,437 | 5.5% |
| Federal Government Employees | 5,326 | 12.0% |
| Unpaid Family Workers | 205 | 0.5% |
| Total | 44,256 | 100.0% |
Employment Status by Age in Moore County
According to the labor force statistics for Moore County, out of the total population over 16 years of age (81,483), 57.9% or 47,179 individuals are in the labor force, with 4.6% or 2,170 of them unemployed. The age group with the highest labor force participation rate is 25 to 29 years, with 90.8% or 4,535 individuals in the labor force. Within the labor force, the 25 to 29 years age range has the highest percentage of unemployed individuals, with 8.4% or 381 of them being unemployed.
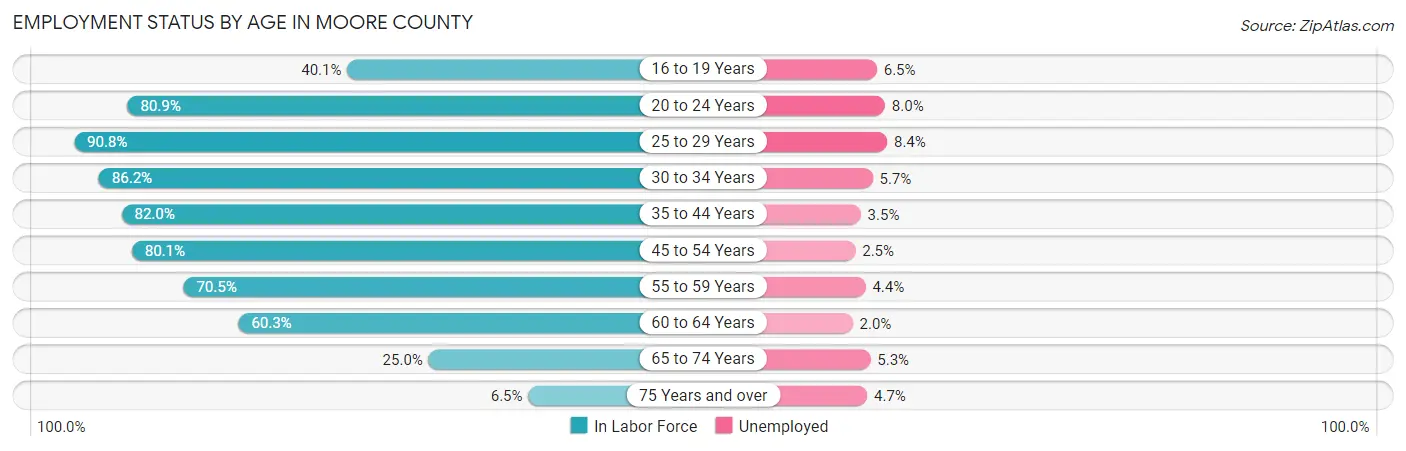
| Age Bracket | In Labor Force | Unemployed |
| 16 to 19 Years | 1,815 (40.1%) | 118 (6.5%) |
| 20 to 24 Years | 3,781 (80.9%) | 302 (8.0%) |
| 25 to 29 Years | 4,535 (90.8%) | 381 (8.4%) |
| 30 to 34 Years | 5,429 (86.2%) | 309 (5.7%) |
| 35 to 44 Years | 10,109 (82.0%) | 354 (3.5%) |
| 45 to 54 Years | 9,072 (80.1%) | 227 (2.5%) |
| 55 to 59 Years | 4,275 (70.5%) | 188 (4.4%) |
| 60 to 64 Years | 4,229 (60.3%) | 85 (2.0%) |
| 65 to 74 Years | 3,242 (25.0%) | 172 (5.3%) |
| 75 Years and over | 734 (6.5%) | 34 (4.7%) |
| Total | 47,179 (57.9%) | 2,170 (4.6%) |
Employment Status by Educational Attainment in Moore County
According to labor force statistics for Moore County, 78.4% of individuals (37,650) out of the total population between 25 and 64 years of age (48,023) are in the labor force, with 4.0% or 1,506 of them being unemployed. The group with the highest labor force participation rate are those with the educational attainment of bachelor's degree or higher, with 82.5% or 15,997 individuals in the labor force. Within the labor force, individuals with high school diploma education have the highest percentage of unemployment, with 6.2% or 419 of them being unemployed.
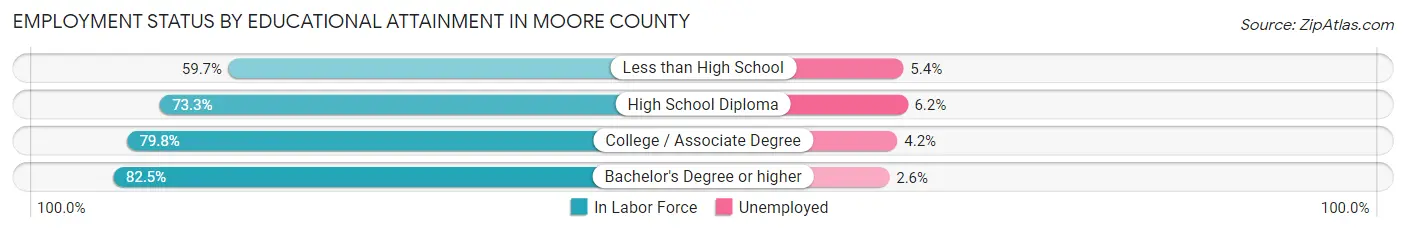
| Educational Attainment | In Labor Force | Unemployed |
| Less than High School | 1,841 (59.7%) | 167 (5.4%) |
| High School Diploma | 6,757 (73.3%) | 572 (6.2%) |
| College / Associate Degree | 13,032 (79.8%) | 686 (4.2%) |
| Bachelor's Degree or higher | 15,997 (82.5%) | 504 (2.6%) |
| Total | 37,650 (78.4%) | 1,921 (4.0%) |
Employment Occupations by Sex in Moore County
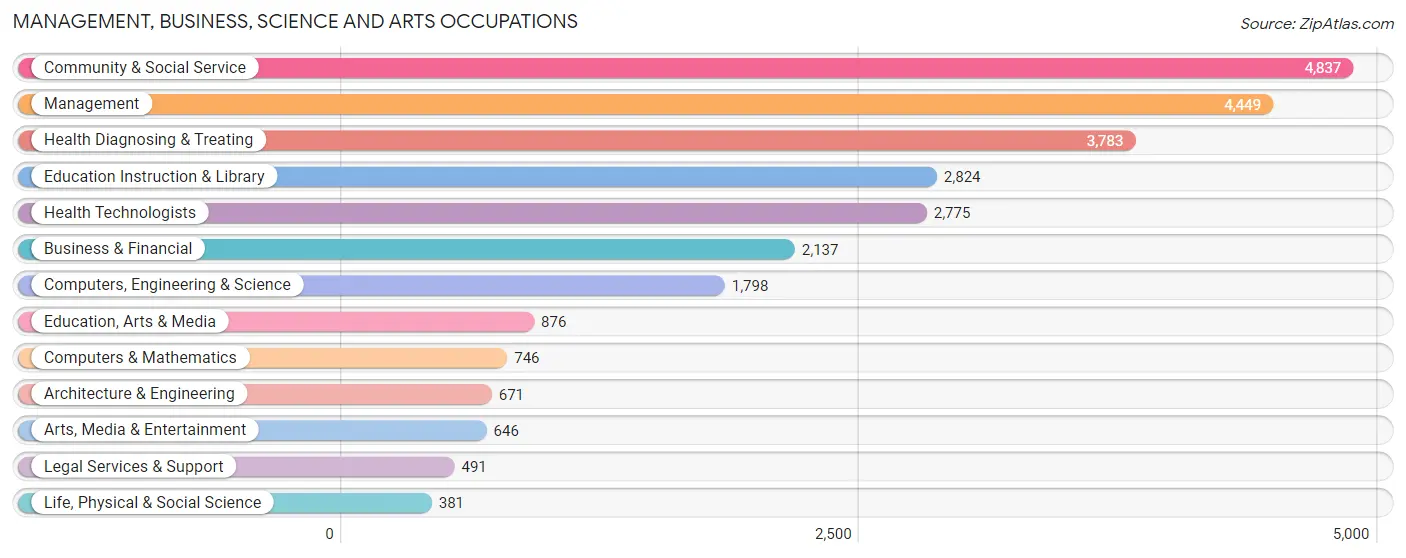
Management, Business, Science and Arts Occupations
The most common Management, Business, Science and Arts occupations in Moore County are Community & Social Service (4,837 | 11.7%), Management (4,449 | 10.7%), Health Diagnosing & Treating (3,783 | 9.1%), Education Instruction & Library (2,824 | 6.8%), and Health Technologists (2,775 | 6.7%).
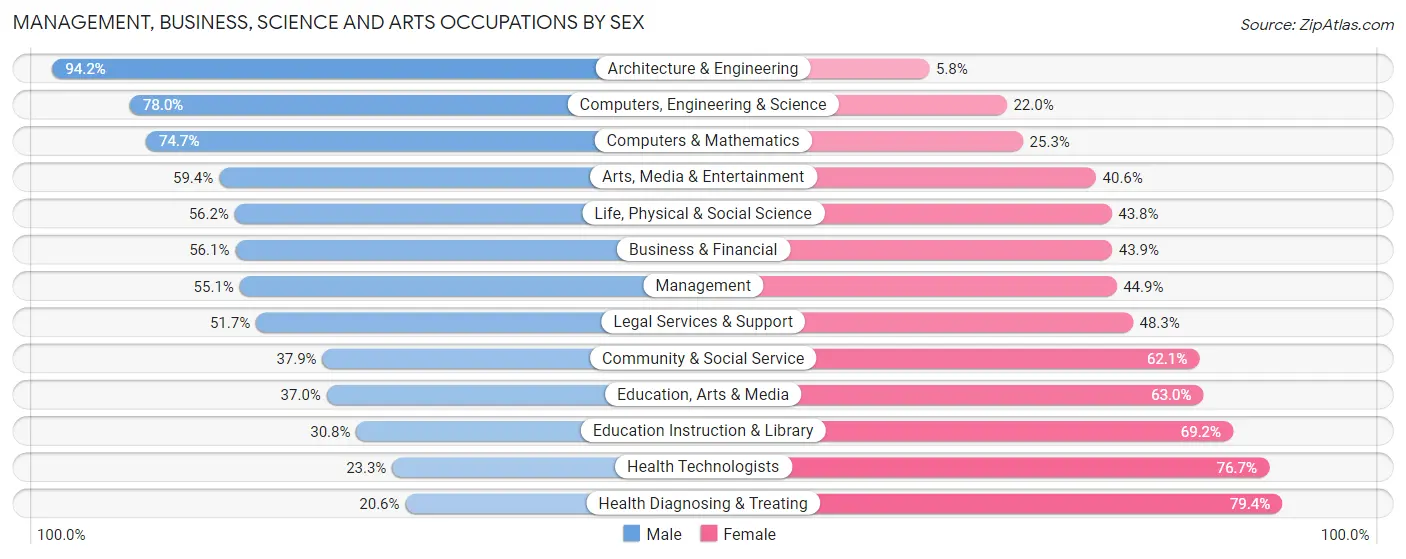
Management, Business, Science and Arts Occupations by Sex
Within the Management, Business, Science and Arts occupations in Moore County, the most male-oriented occupations are Architecture & Engineering (94.2%), Computers, Engineering & Science (78.0%), and Computers & Mathematics (74.7%), while the most female-oriented occupations are Health Diagnosing & Treating (79.4%), Health Technologists (76.7%), and Education Instruction & Library (69.2%).
| Occupation | Male | Female |
| Management | 2,453 (55.1%) | 1,996 (44.9%) |
| Business & Financial | 1,198 (56.1%) | 939 (43.9%) |
| Computers, Engineering & Science | 1,403 (78.0%) | 395 (22.0%) |
| Computers & Mathematics | 557 (74.7%) | 189 (25.3%) |
| Architecture & Engineering | 632 (94.2%) | 39 (5.8%) |
| Life, Physical & Social Science | 214 (56.2%) | 167 (43.8%) |
| Community & Social Service | 1,832 (37.9%) | 3,005 (62.1%) |
| Education, Arts & Media | 324 (37.0%) | 552 (63.0%) |
| Legal Services & Support | 254 (51.7%) | 237 (48.3%) |
| Education Instruction & Library | 870 (30.8%) | 1,954 (69.2%) |
| Arts, Media & Entertainment | 384 (59.4%) | 262 (40.6%) |
| Health Diagnosing & Treating | 778 (20.6%) | 3,005 (79.4%) |
| Health Technologists | 647 (23.3%) | 2,128 (76.7%) |
| Total (Category) | 7,664 (45.1%) | 9,340 (54.9%) |
| Total (Overall) | 21,078 (50.7%) | 20,451 (49.2%) |
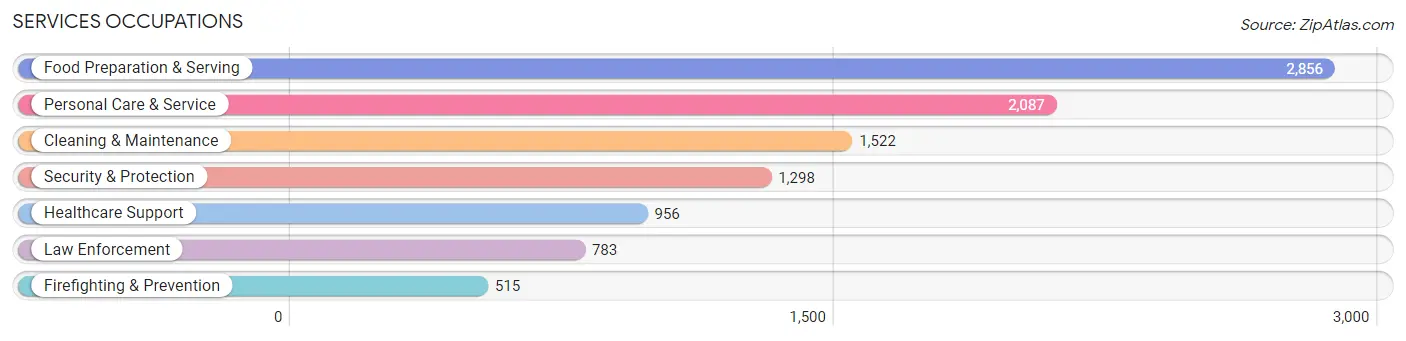
Services Occupations
The most common Services occupations in Moore County are Food Preparation & Serving (2,856 | 6.9%), Personal Care & Service (2,087 | 5.0%), Cleaning & Maintenance (1,522 | 3.7%), Security & Protection (1,298 | 3.1%), and Healthcare Support (956 | 2.3%).
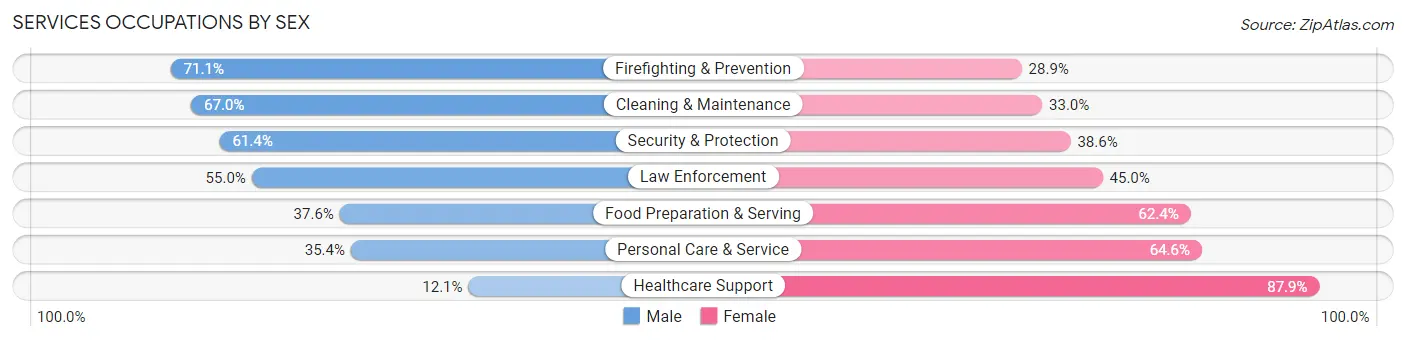
Services Occupations by Sex
Within the Services occupations in Moore County, the most male-oriented occupations are Firefighting & Prevention (71.1%), Cleaning & Maintenance (67.0%), and Security & Protection (61.4%), while the most female-oriented occupations are Healthcare Support (87.9%), Personal Care & Service (64.6%), and Food Preparation & Serving (62.4%).
| Occupation | Male | Female |
| Healthcare Support | 116 (12.1%) | 840 (87.9%) |
| Security & Protection | 797 (61.4%) | 501 (38.6%) |
| Firefighting & Prevention | 366 (71.1%) | 149 (28.9%) |
| Law Enforcement | 431 (55.0%) | 352 (45.0%) |
| Food Preparation & Serving | 1,074 (37.6%) | 1,782 (62.4%) |
| Cleaning & Maintenance | 1,020 (67.0%) | 502 (33.0%) |
| Personal Care & Service | 739 (35.4%) | 1,348 (64.6%) |
| Total (Category) | 3,746 (43.0%) | 4,973 (57.0%) |
| Total (Overall) | 21,078 (50.7%) | 20,451 (49.2%) |
Sales and Office Occupations
The most common Sales and Office occupations in Moore County are Office & Administration (4,365 | 10.5%), and Sales & Related (3,626 | 8.7%).

Sales and Office Occupations by Sex
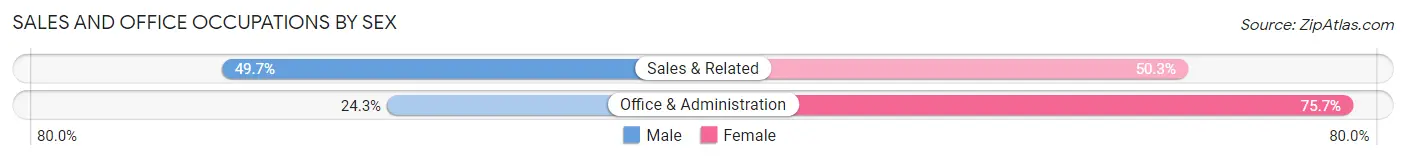
| Occupation | Male | Female |
| Sales & Related | 1,801 (49.7%) | 1,825 (50.3%) |
| Office & Administration | 1,059 (24.3%) | 3,306 (75.7%) |
| Total (Category) | 2,860 (35.8%) | 5,131 (64.2%) |
| Total (Overall) | 21,078 (50.7%) | 20,451 (49.2%) |
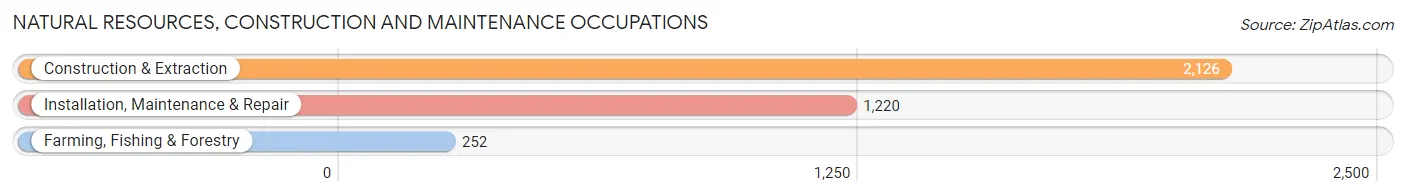
Natural Resources, Construction and Maintenance Occupations
The most common Natural Resources, Construction and Maintenance occupations in Moore County are Construction & Extraction (2,126 | 5.1%), Installation, Maintenance & Repair (1,220 | 2.9%), and Farming, Fishing & Forestry (252 | 0.6%).
Natural Resources, Construction and Maintenance Occupations by Sex
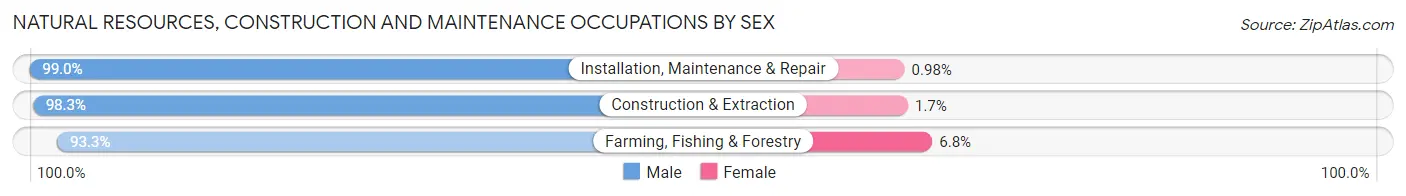
| Occupation | Male | Female |
| Farming, Fishing & Forestry | 235 (93.2%) | 17 (6.8%) |
| Construction & Extraction | 2,090 (98.3%) | 36 (1.7%) |
| Installation, Maintenance & Repair | 1,208 (99.0%) | 12 (1.0%) |
| Total (Category) | 3,533 (98.2%) | 65 (1.8%) |
| Total (Overall) | 21,078 (50.7%) | 20,451 (49.2%) |
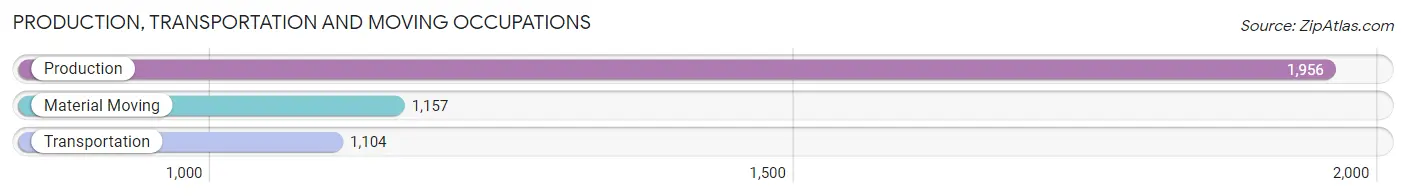
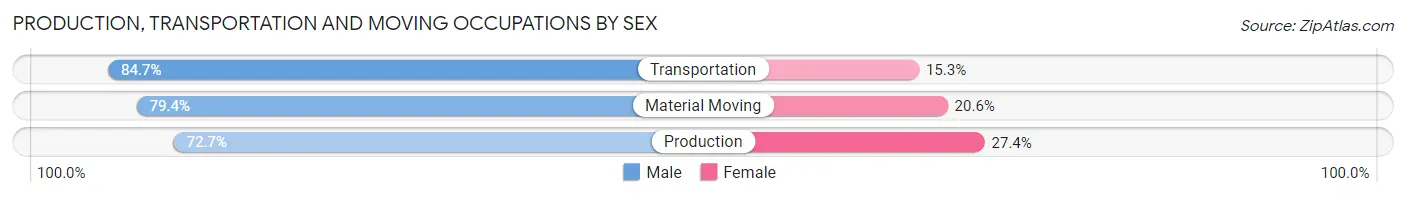
Production, Transportation and Moving Occupations
The most common Production, Transportation and Moving occupations in Moore County are Production (1,956 | 4.7%), Material Moving (1,157 | 2.8%), and Transportation (1,104 | 2.7%).
Production, Transportation and Moving Occupations by Sex
| Occupation | Male | Female |
| Production | 1,421 (72.7%) | 535 (27.4%) |
| Transportation | 935 (84.7%) | 169 (15.3%) |
| Material Moving | 919 (79.4%) | 238 (20.6%) |
| Total (Category) | 3,275 (77.7%) | 942 (22.3%) |
| Total (Overall) | 21,078 (50.7%) | 20,451 (49.2%) |
Employment Industries by Sex in Moore County
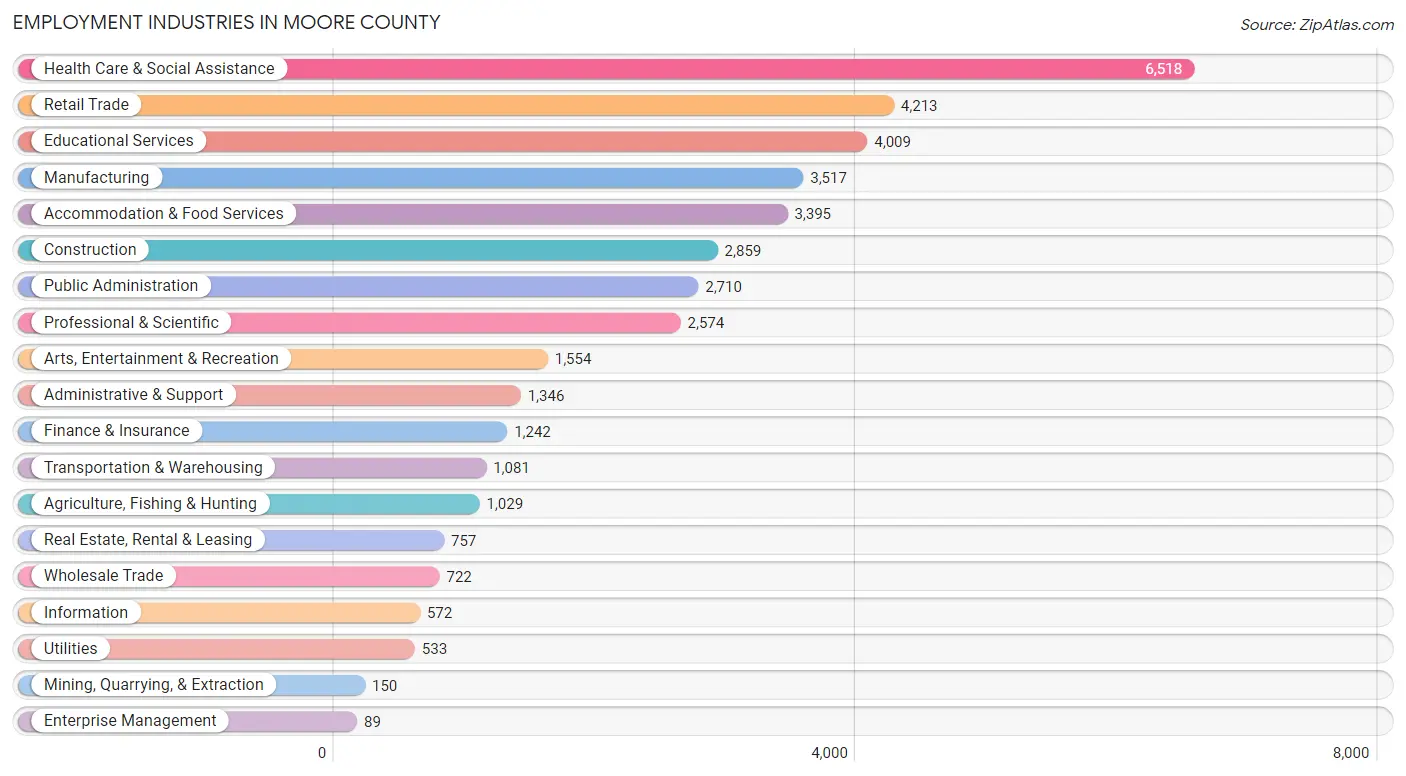
Employment Industries in Moore County
The major employment industries in Moore County include Health Care & Social Assistance (6,518 | 15.7%), Retail Trade (4,213 | 10.1%), Educational Services (4,009 | 9.7%), Manufacturing (3,517 | 8.5%), and Accommodation & Food Services (3,395 | 8.2%).
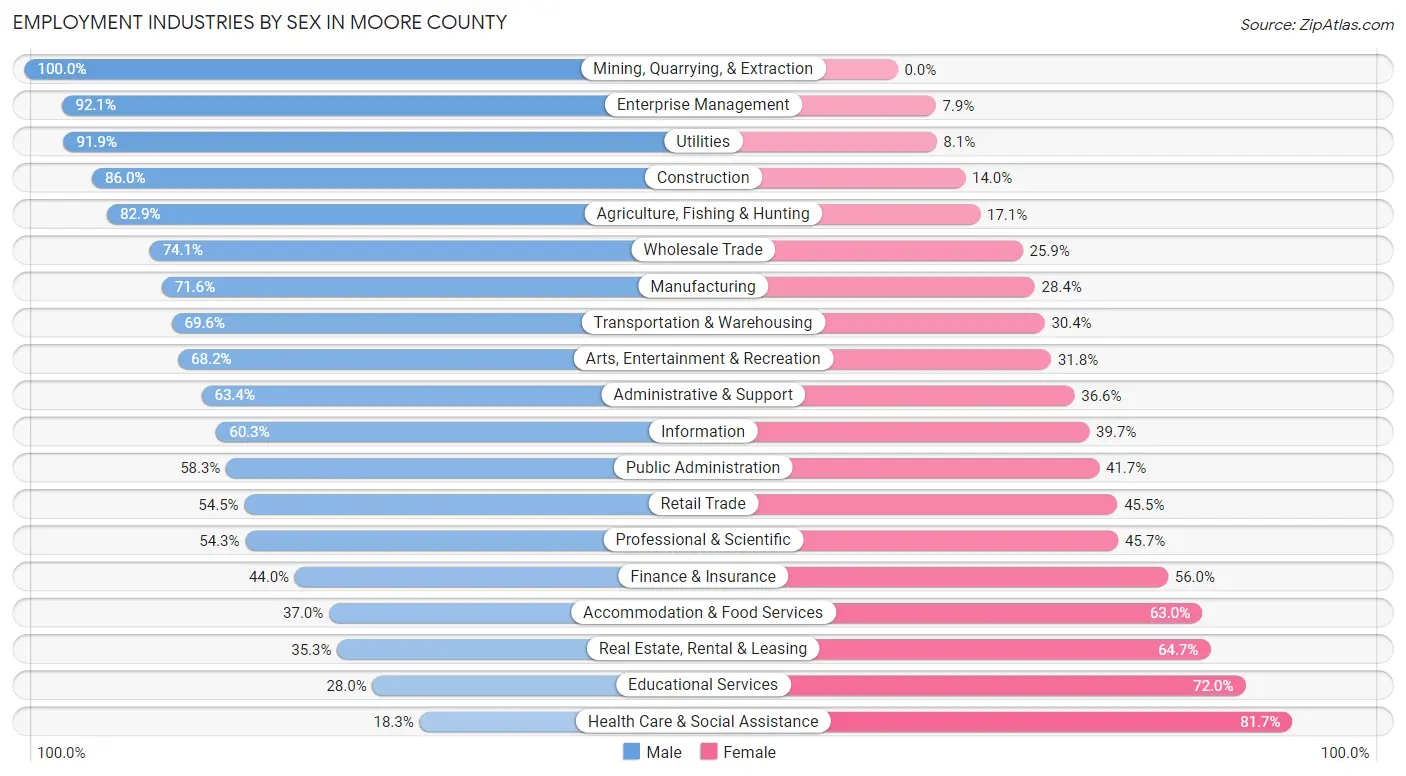
Employment Industries by Sex in Moore County
The Moore County industries that see more men than women are Mining, Quarrying, & Extraction (100.0%), Enterprise Management (92.1%), and Utilities (91.9%), whereas the industries that tend to have a higher number of women are Health Care & Social Assistance (81.7%), Educational Services (72.0%), and Real Estate, Rental & Leasing (64.7%).
| Industry | Male | Female |
| Agriculture, Fishing & Hunting | 853 (82.9%) | 176 (17.1%) |
| Mining, Quarrying, & Extraction | 150 (100.0%) | 0 (0.0%) |
| Construction | 2,459 (86.0%) | 400 (14.0%) |
| Manufacturing | 2,518 (71.6%) | 999 (28.4%) |
| Wholesale Trade | 535 (74.1%) | 187 (25.9%) |
| Retail Trade | 2,296 (54.5%) | 1,917 (45.5%) |
| Transportation & Warehousing | 752 (69.6%) | 329 (30.4%) |
| Utilities | 490 (91.9%) | 43 (8.1%) |
| Information | 345 (60.3%) | 227 (39.7%) |
| Finance & Insurance | 547 (44.0%) | 695 (56.0%) |
| Real Estate, Rental & Leasing | 267 (35.3%) | 490 (64.7%) |
| Professional & Scientific | 1,398 (54.3%) | 1,176 (45.7%) |
| Enterprise Management | 82 (92.1%) | 7 (7.9%) |
| Administrative & Support | 853 (63.4%) | 493 (36.6%) |
| Educational Services | 1,122 (28.0%) | 2,887 (72.0%) |
| Health Care & Social Assistance | 1,190 (18.3%) | 5,328 (81.7%) |
| Arts, Entertainment & Recreation | 1,060 (68.2%) | 494 (31.8%) |
| Accommodation & Food Services | 1,255 (37.0%) | 2,140 (63.0%) |
| Public Administration | 1,579 (58.3%) | 1,131 (41.7%) |
| Total | 21,078 (50.7%) | 20,451 (49.2%) |
Education in Moore County
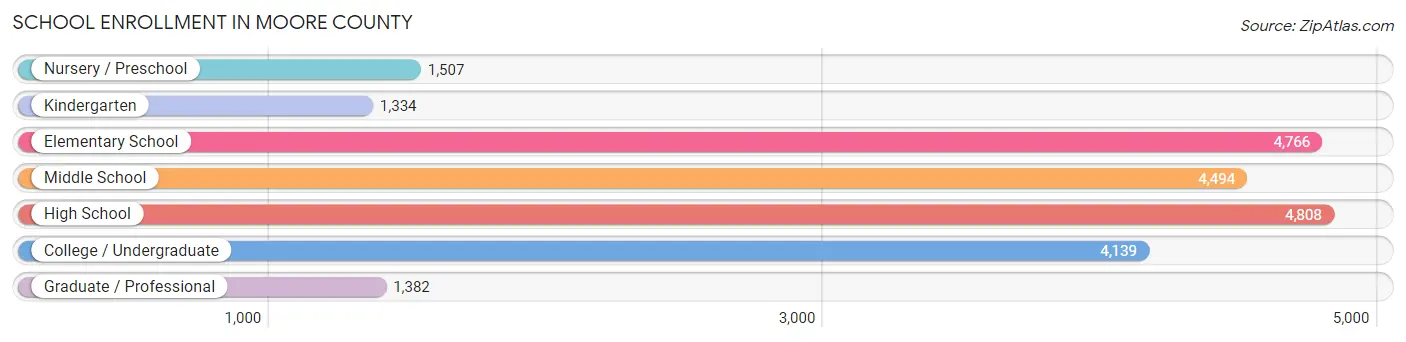
School Enrollment in Moore County
The most common levels of schooling among the 22,430 students in Moore County are high school (4,808 | 21.4%), elementary school (4,766 | 21.2%), and middle school (4,494 | 20.0%).
| School Level | # Students | % Students |
| Nursery / Preschool | 1,507 | 6.7% |
| Kindergarten | 1,334 | 5.9% |
| Elementary School | 4,766 | 21.2% |
| Middle School | 4,494 | 20.0% |
| High School | 4,808 | 21.4% |
| College / Undergraduate | 4,139 | 18.4% |
| Graduate / Professional | 1,382 | 6.2% |
| Total | 22,430 | 100.0% |
School Enrollment by Age by Funding Source in Moore County
Out of a total of 22,430 students who are enrolled in schools in Moore County, 4,531 (20.2%) attend a private institution, while the remaining 17,899 (79.8%) are enrolled in public schools. The age group of 3 to 4 year olds has the highest likelihood of being enrolled in private schools, with 586 (51.4% in the age bracket) enrolled. Conversely, the age group of 15 to 17 year olds has the lowest likelihood of being enrolled in a private school, with 3,211 (92.9% in the age bracket) attending a public institution.
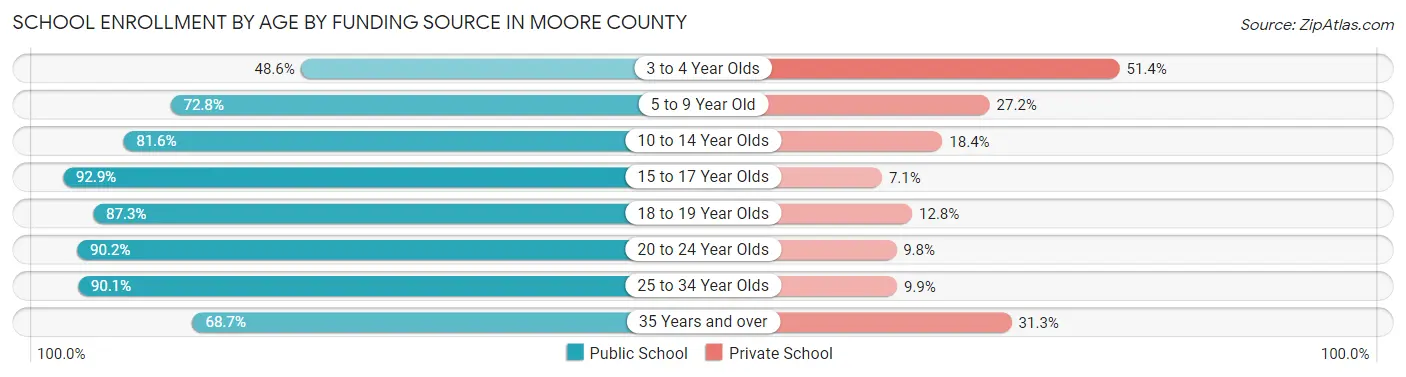
| Age Bracket | Public School | Private School |
| 3 to 4 Year Olds | 554 (48.6%) | 586 (51.4%) |
| 5 to 9 Year Old | 4,307 (72.8%) | 1,608 (27.2%) |
| 10 to 14 Year Olds | 4,619 (81.6%) | 1,041 (18.4%) |
| 15 to 17 Year Olds | 3,211 (92.9%) | 247 (7.1%) |
| 18 to 19 Year Olds | 1,300 (87.3%) | 190 (12.8%) |
| 20 to 24 Year Olds | 1,522 (90.2%) | 165 (9.8%) |
| 25 to 34 Year Olds | 1,116 (90.1%) | 123 (9.9%) |
| 35 Years and over | 1,265 (68.7%) | 576 (31.3%) |
| Total | 17,899 (79.8%) | 4,531 (20.2%) |
Educational Attainment by Field of Study in Moore County
Business (5,581 | 18.2%), education (4,246 | 13.8%), science & technology (2,914 | 9.5%), social sciences (2,900 | 9.5%), and arts & humanities (2,561 | 8.3%) are the most common fields of study among 30,696 individuals in Moore County who have obtained a bachelor's degree or higher.
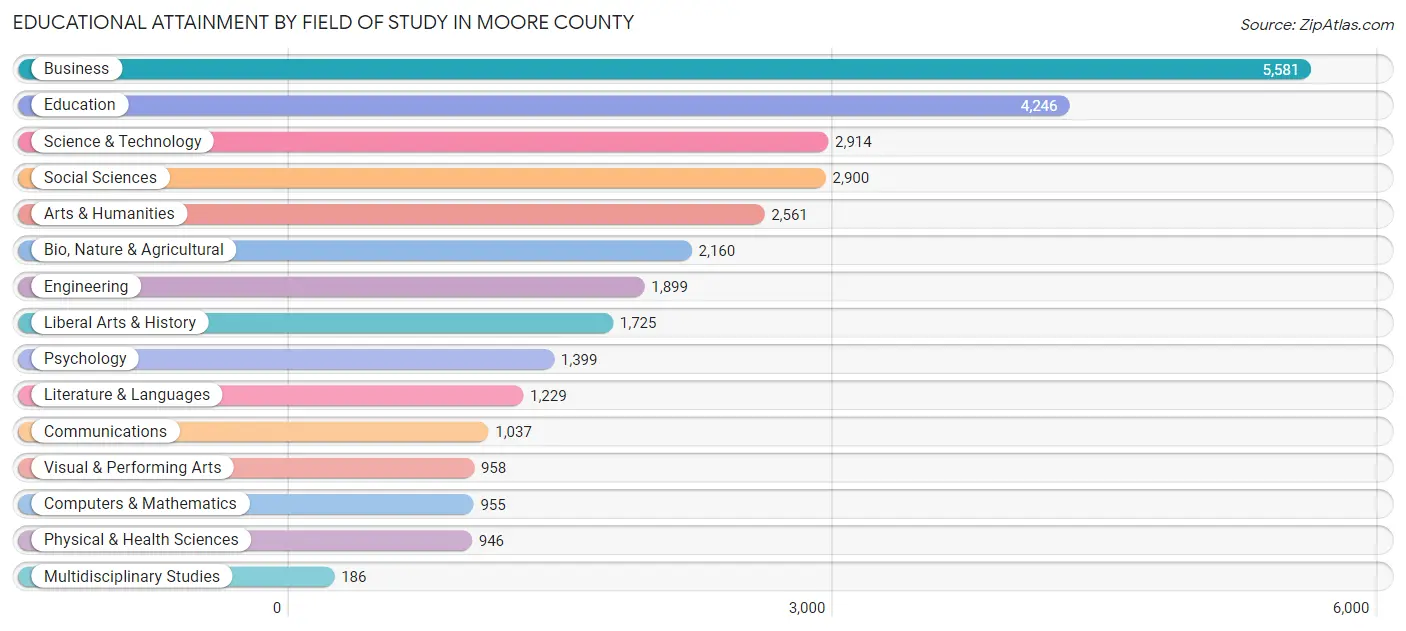
| Field of Study | # Graduates | % Graduates |
| Computers & Mathematics | 955 | 3.1% |
| Bio, Nature & Agricultural | 2,160 | 7.0% |
| Physical & Health Sciences | 946 | 3.1% |
| Psychology | 1,399 | 4.6% |
| Social Sciences | 2,900 | 9.5% |
| Engineering | 1,899 | 6.2% |
| Multidisciplinary Studies | 186 | 0.6% |
| Science & Technology | 2,914 | 9.5% |
| Business | 5,581 | 18.2% |
| Education | 4,246 | 13.8% |
| Literature & Languages | 1,229 | 4.0% |
| Liberal Arts & History | 1,725 | 5.6% |
| Visual & Performing Arts | 958 | 3.1% |
| Communications | 1,037 | 3.4% |
| Arts & Humanities | 2,561 | 8.3% |
| Total | 30,696 | 100.0% |
Transportation & Commute in Moore County
Vehicle Availability by Sex in Moore County
The most prevalent vehicle ownership categories in Moore County are males with 2 vehicles (10,054, accounting for 42.3%) and females with 2 vehicles (8,816, making up 49.3%).
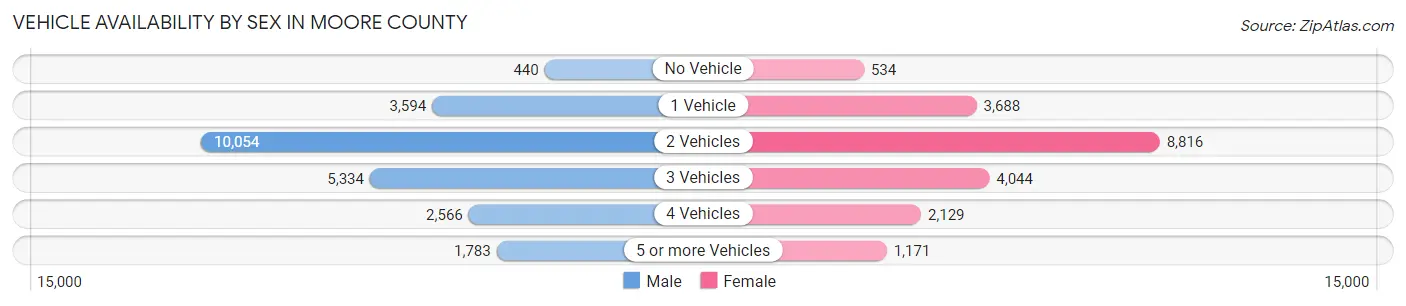
| Vehicles Available | Male | Female |
| No Vehicle | 440 (1.8%) | 534 (2.6%) |
| 1 Vehicle | 3,594 (15.1%) | 3,688 (18.1%) |
| 2 Vehicles | 10,054 (42.3%) | 8,816 (43.2%) |
| 3 Vehicles | 5,334 (22.4%) | 4,044 (19.8%) |
| 4 Vehicles | 2,566 (10.8%) | 2,129 (10.4%) |
| 5 or more Vehicles | 1,783 (7.5%) | 1,171 (5.8%) |
| Total | 23,771 (100.0%) | 20,382 (100.0%) |
Commute Time in Moore County
The most frequently occuring commute durations in Moore County are 10 to 14 minutes (6,601 commuters, 16.7%), 15 to 19 minutes (6,131 commuters, 15.5%), and 30 to 34 minutes (4,937 commuters, 12.5%).
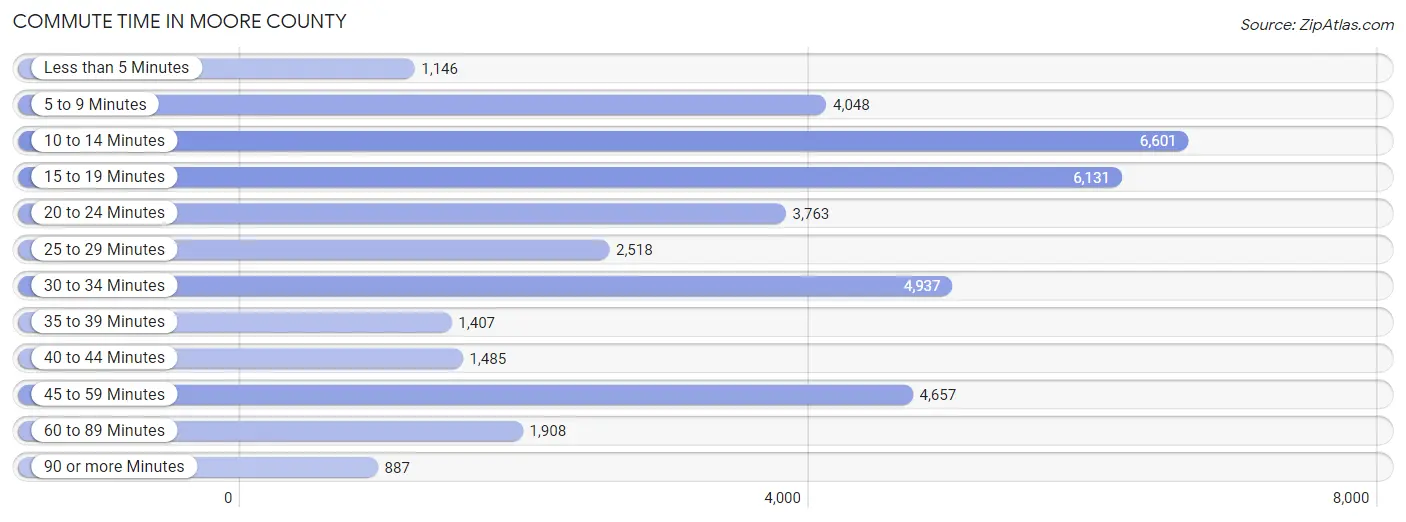
| Commute Time | # Commuters | % Commuters |
| Less than 5 Minutes | 1,146 | 2.9% |
| 5 to 9 Minutes | 4,048 | 10.2% |
| 10 to 14 Minutes | 6,601 | 16.7% |
| 15 to 19 Minutes | 6,131 | 15.5% |
| 20 to 24 Minutes | 3,763 | 9.5% |
| 25 to 29 Minutes | 2,518 | 6.4% |
| 30 to 34 Minutes | 4,937 | 12.5% |
| 35 to 39 Minutes | 1,407 | 3.6% |
| 40 to 44 Minutes | 1,485 | 3.8% |
| 45 to 59 Minutes | 4,657 | 11.8% |
| 60 to 89 Minutes | 1,908 | 4.8% |
| 90 or more Minutes | 887 | 2.2% |
Commute Time by Sex in Moore County
The most common commute times in Moore County are 45 to 59 minutes (3,136 commuters, 14.5%) for males and 10 to 14 minutes (3,519 commuters, 19.6%) for females.
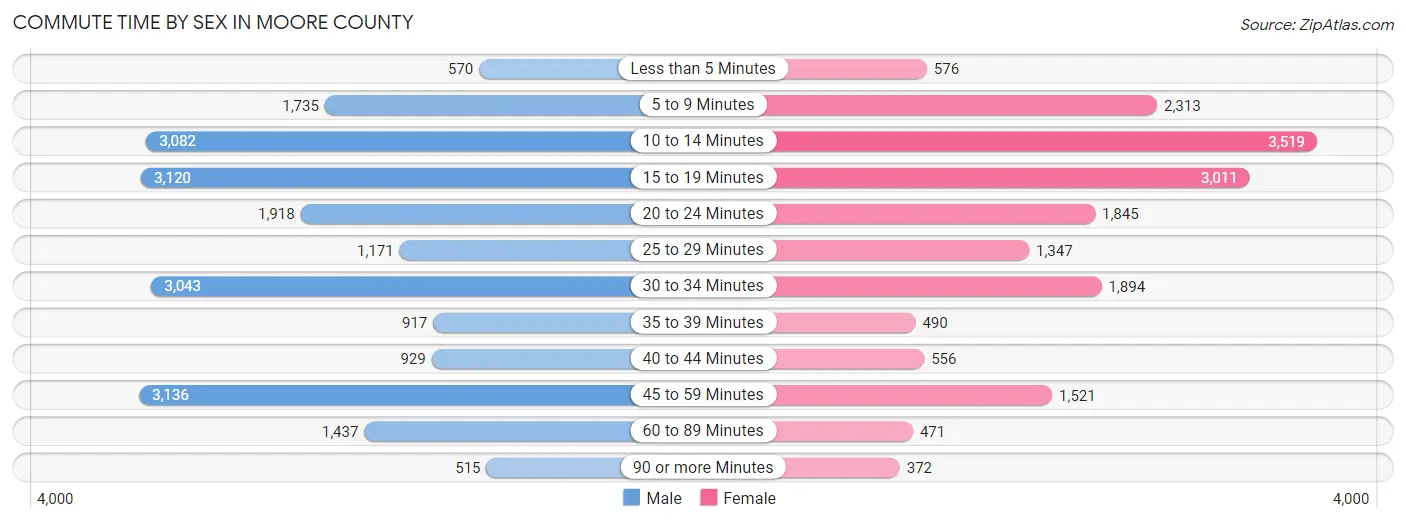
| Commute Time | Male | Female |
| Less than 5 Minutes | 570 (2.6%) | 576 (3.2%) |
| 5 to 9 Minutes | 1,735 (8.0%) | 2,313 (12.9%) |
| 10 to 14 Minutes | 3,082 (14.3%) | 3,519 (19.6%) |
| 15 to 19 Minutes | 3,120 (14.5%) | 3,011 (16.8%) |
| 20 to 24 Minutes | 1,918 (8.9%) | 1,845 (10.3%) |
| 25 to 29 Minutes | 1,171 (5.4%) | 1,347 (7.5%) |
| 30 to 34 Minutes | 3,043 (14.1%) | 1,894 (10.6%) |
| 35 to 39 Minutes | 917 (4.3%) | 490 (2.7%) |
| 40 to 44 Minutes | 929 (4.3%) | 556 (3.1%) |
| 45 to 59 Minutes | 3,136 (14.5%) | 1,521 (8.5%) |
| 60 to 89 Minutes | 1,437 (6.7%) | 471 (2.6%) |
| 90 or more Minutes | 515 (2.4%) | 372 (2.1%) |
Time of Departure to Work by Sex in Moore County
The most frequent times of departure to work in Moore County are 7:00 AM to 7:29 AM (3,313, 15.4%) for males and 7:30 AM to 7:59 AM (3,356, 18.7%) for females.
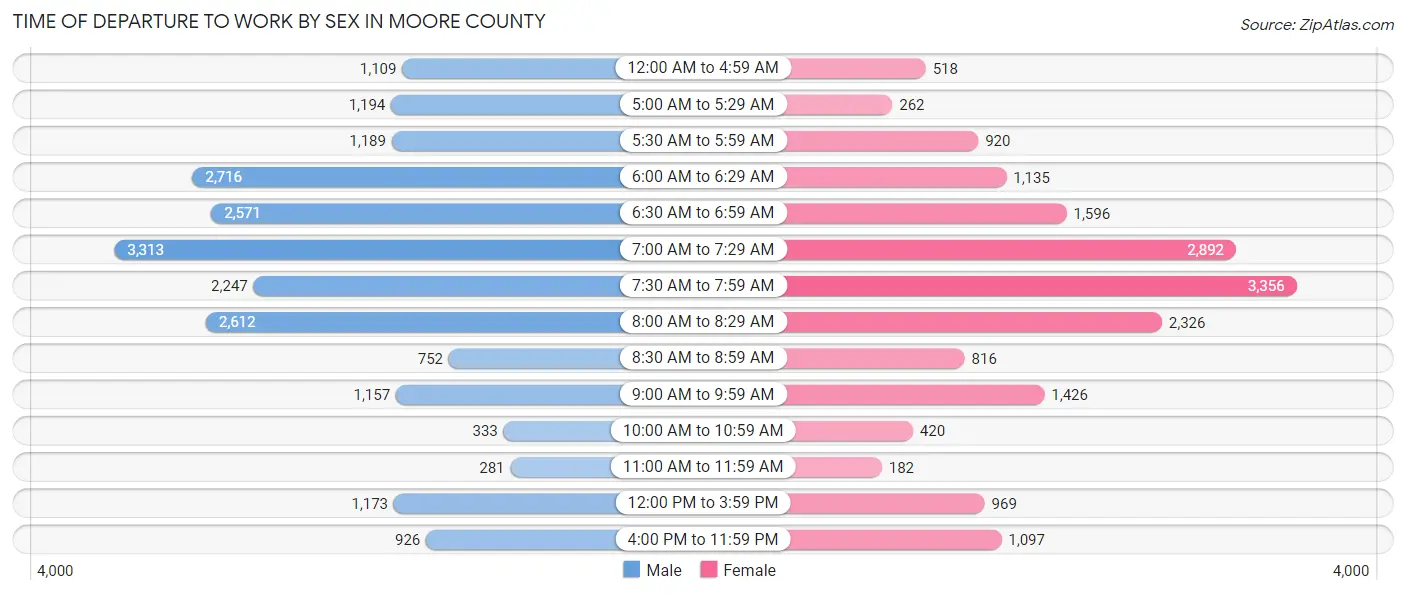
| Time of Departure | Male | Female |
| 12:00 AM to 4:59 AM | 1,109 (5.1%) | 518 (2.9%) |
| 5:00 AM to 5:29 AM | 1,194 (5.5%) | 262 (1.5%) |
| 5:30 AM to 5:59 AM | 1,189 (5.5%) | 920 (5.1%) |
| 6:00 AM to 6:29 AM | 2,716 (12.6%) | 1,135 (6.3%) |
| 6:30 AM to 6:59 AM | 2,571 (11.9%) | 1,596 (8.9%) |
| 7:00 AM to 7:29 AM | 3,313 (15.4%) | 2,892 (16.1%) |
| 7:30 AM to 7:59 AM | 2,247 (10.4%) | 3,356 (18.7%) |
| 8:00 AM to 8:29 AM | 2,612 (12.1%) | 2,326 (13.0%) |
| 8:30 AM to 8:59 AM | 752 (3.5%) | 816 (4.5%) |
| 9:00 AM to 9:59 AM | 1,157 (5.4%) | 1,426 (8.0%) |
| 10:00 AM to 10:59 AM | 333 (1.5%) | 420 (2.3%) |
| 11:00 AM to 11:59 AM | 281 (1.3%) | 182 (1.0%) |
| 12:00 PM to 3:59 PM | 1,173 (5.4%) | 969 (5.4%) |
| 4:00 PM to 11:59 PM | 926 (4.3%) | 1,097 (6.1%) |
| Total | 21,573 (100.0%) | 17,915 (100.0%) |
Housing Occupancy in Moore County
Occupancy by Ownership in Moore County
Of the total 41,782 dwellings in Moore County, owner-occupied units account for 32,227 (77.1%), while renter-occupied units make up 9,555 (22.9%).
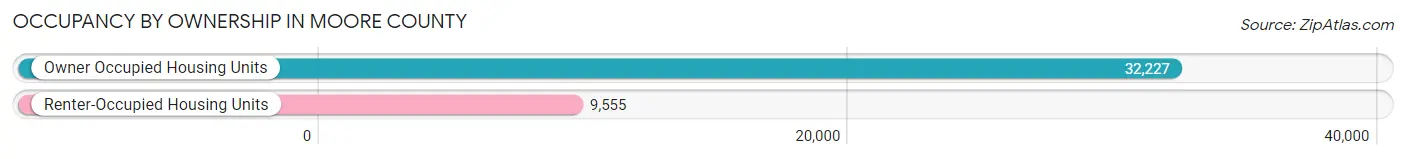
| Occupancy | # Housing Units | % Housing Units |
| Owner Occupied Housing Units | 32,227 | 77.1% |
| Renter-Occupied Housing Units | 9,555 | 22.9% |
| Total Occupied Housing Units | 41,782 | 100.0% |
Occupancy by Household Size in Moore County
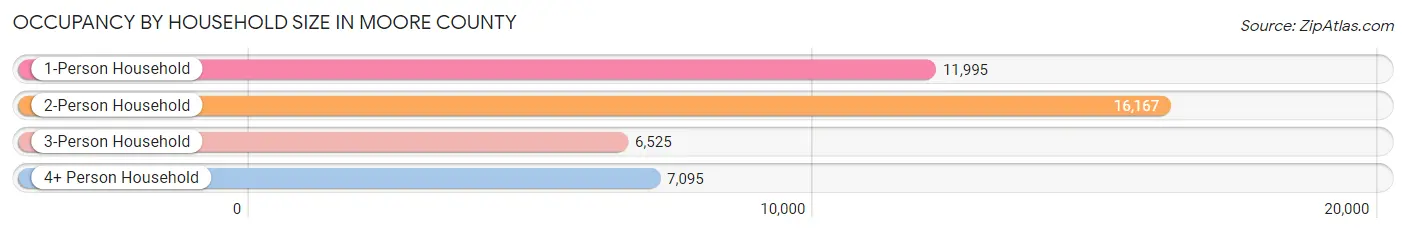
| Household Size | # Housing Units | % Housing Units |
| 1-Person Household | 11,995 | 28.7% |
| 2-Person Household | 16,167 | 38.7% |
| 3-Person Household | 6,525 | 15.6% |
| 4+ Person Household | 7,095 | 17.0% |
| Total Housing Units | 41,782 | 100.0% |
Occupancy by Ownership by Household Size in Moore County
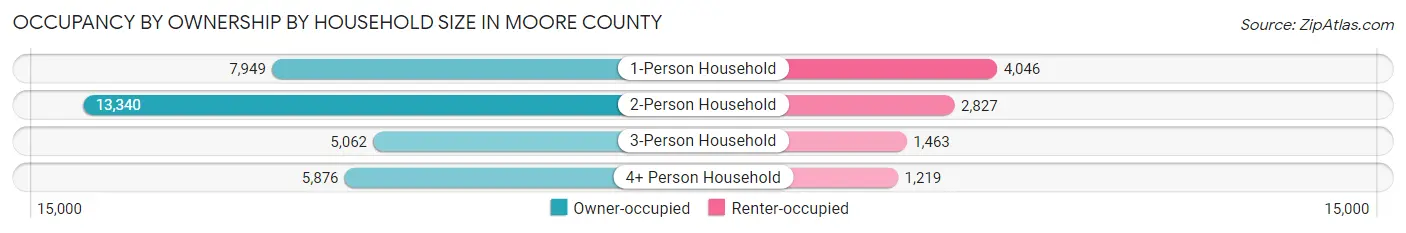
| Household Size | Owner-occupied | Renter-occupied |
| 1-Person Household | 7,949 (66.3%) | 4,046 (33.7%) |
| 2-Person Household | 13,340 (82.5%) | 2,827 (17.5%) |
| 3-Person Household | 5,062 (77.6%) | 1,463 (22.4%) |
| 4+ Person Household | 5,876 (82.8%) | 1,219 (17.2%) |
| Total Housing Units | 32,227 (77.1%) | 9,555 (22.9%) |
Occupancy by Educational Attainment in Moore County
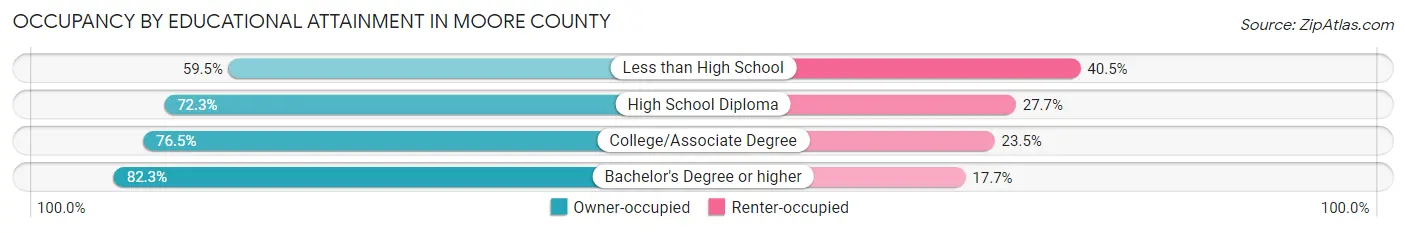
| Household Size | Owner-occupied | Renter-occupied |
| Less than High School | 1,586 (59.5%) | 1,079 (40.5%) |
| High School Diploma | 5,328 (72.3%) | 2,039 (27.7%) |
| College/Associate Degree | 10,830 (76.5%) | 3,325 (23.5%) |
| Bachelor's Degree or higher | 14,483 (82.3%) | 3,112 (17.7%) |
Occupancy by Age of Householder in Moore County
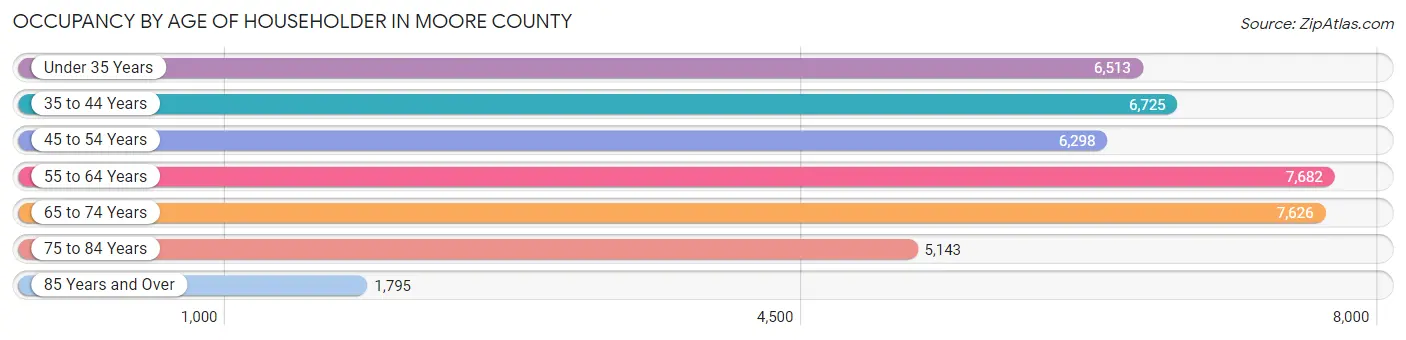
| Age Bracket | # Households | % Households |
| Under 35 Years | 6,513 | 15.6% |
| 35 to 44 Years | 6,725 | 16.1% |
| 45 to 54 Years | 6,298 | 15.1% |
| 55 to 64 Years | 7,682 | 18.4% |
| 65 to 74 Years | 7,626 | 18.2% |
| 75 to 84 Years | 5,143 | 12.3% |
| 85 Years and Over | 1,795 | 4.3% |
| Total | 41,782 | 100.0% |
Housing Finances in Moore County
Median Income by Occupancy in Moore County
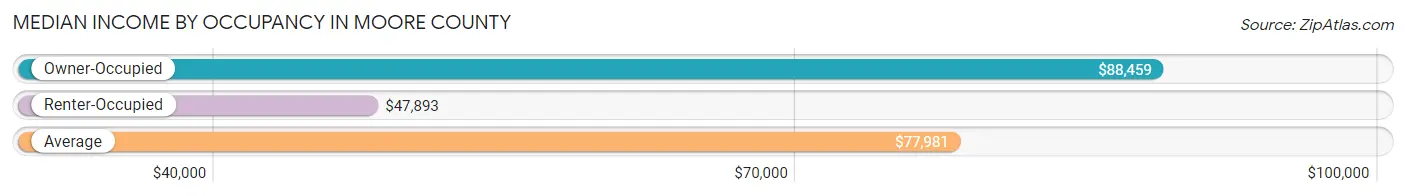
| Occupancy Type | # Households | Median Income |
| Owner-Occupied | 32,227 (77.1%) | $88,459 |
| Renter-Occupied | 9,555 (22.9%) | $47,893 |
| Average | 41,782 (100.0%) | $77,981 |
Occupancy by Householder Income Bracket in Moore County
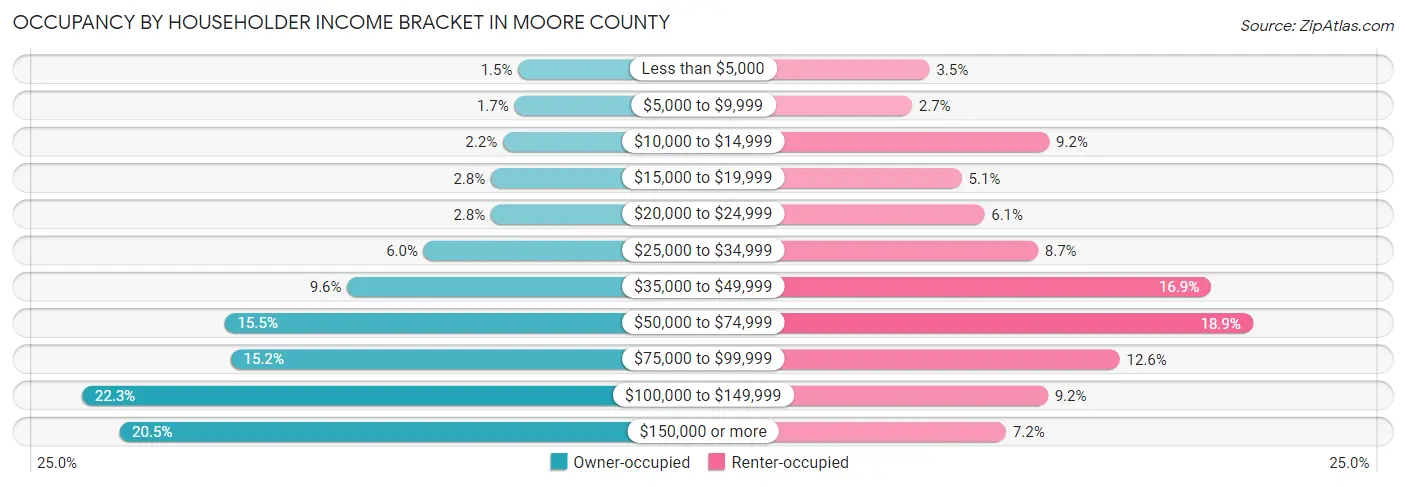
| Income Bracket | Owner-occupied | Renter-occupied |
| Less than $5,000 | 479 (1.5%) | 336 (3.5%) |
| $5,000 to $9,999 | 537 (1.7%) | 256 (2.7%) |
| $10,000 to $14,999 | 714 (2.2%) | 881 (9.2%) |
| $15,000 to $19,999 | 899 (2.8%) | 483 (5.1%) |
| $20,000 to $24,999 | 898 (2.8%) | 586 (6.1%) |
| $25,000 to $34,999 | 1,932 (6.0%) | 829 (8.7%) |
| $35,000 to $49,999 | 3,102 (9.6%) | 1,618 (16.9%) |
| $50,000 to $74,999 | 4,990 (15.5%) | 1,807 (18.9%) |
| $75,000 to $99,999 | 4,895 (15.2%) | 1,201 (12.6%) |
| $100,000 to $149,999 | 7,176 (22.3%) | 874 (9.1%) |
| $150,000 or more | 6,605 (20.5%) | 684 (7.2%) |
| Total | 32,227 (100.0%) | 9,555 (100.0%) |
Monthly Housing Cost Tiers in Moore County
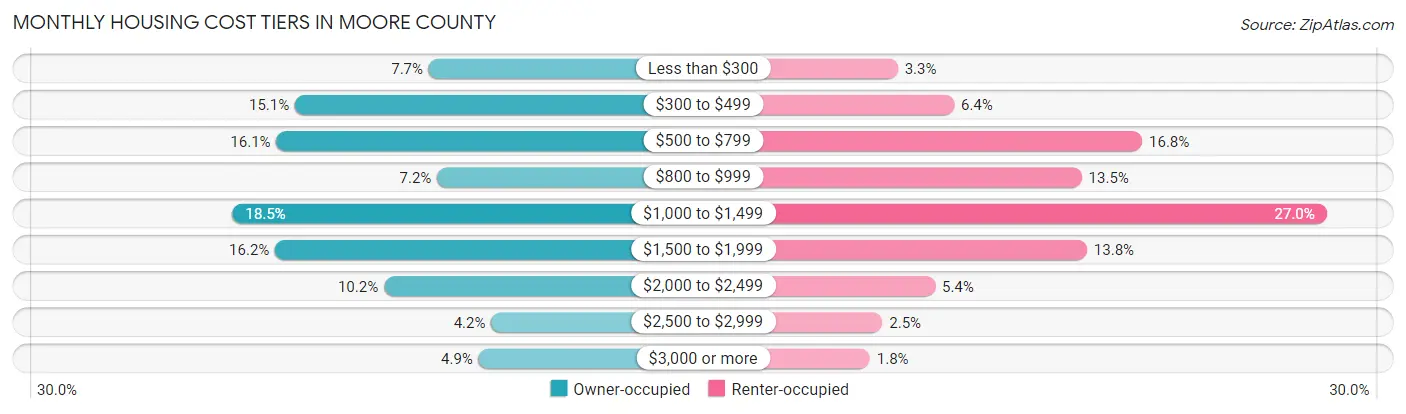
| Monthly Cost | Owner-occupied | Renter-occupied |
| Less than $300 | 2,471 (7.7%) | 318 (3.3%) |
| $300 to $499 | 4,852 (15.1%) | 615 (6.4%) |
| $500 to $799 | 5,185 (16.1%) | 1,608 (16.8%) |
| $800 to $999 | 2,323 (7.2%) | 1,289 (13.5%) |
| $1,000 to $1,499 | 5,969 (18.5%) | 2,582 (27.0%) |
| $1,500 to $1,999 | 5,208 (16.2%) | 1,317 (13.8%) |
| $2,000 to $2,499 | 3,271 (10.2%) | 515 (5.4%) |
| $2,500 to $2,999 | 1,361 (4.2%) | 237 (2.5%) |
| $3,000 or more | 1,587 (4.9%) | 171 (1.8%) |
| Total | 32,227 (100.0%) | 9,555 (100.0%) |
Physical Housing Characteristics in Moore County
Housing Structures in Moore County
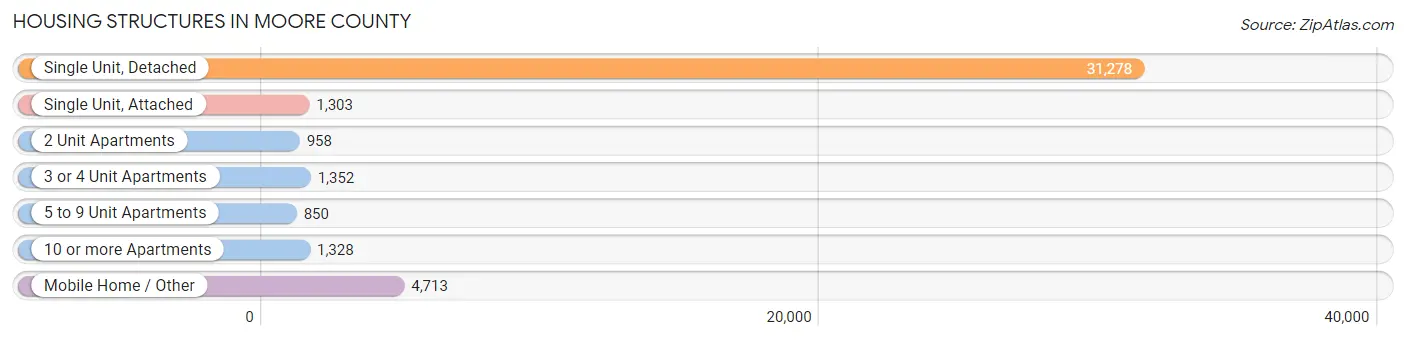
| Structure Type | # Housing Units | % Housing Units |
| Single Unit, Detached | 31,278 | 74.9% |
| Single Unit, Attached | 1,303 | 3.1% |
| 2 Unit Apartments | 958 | 2.3% |
| 3 or 4 Unit Apartments | 1,352 | 3.2% |
| 5 to 9 Unit Apartments | 850 | 2.0% |
| 10 or more Apartments | 1,328 | 3.2% |
| Mobile Home / Other | 4,713 | 11.3% |
| Total | 41,782 | 100.0% |
Housing Structures by Occupancy in Moore County
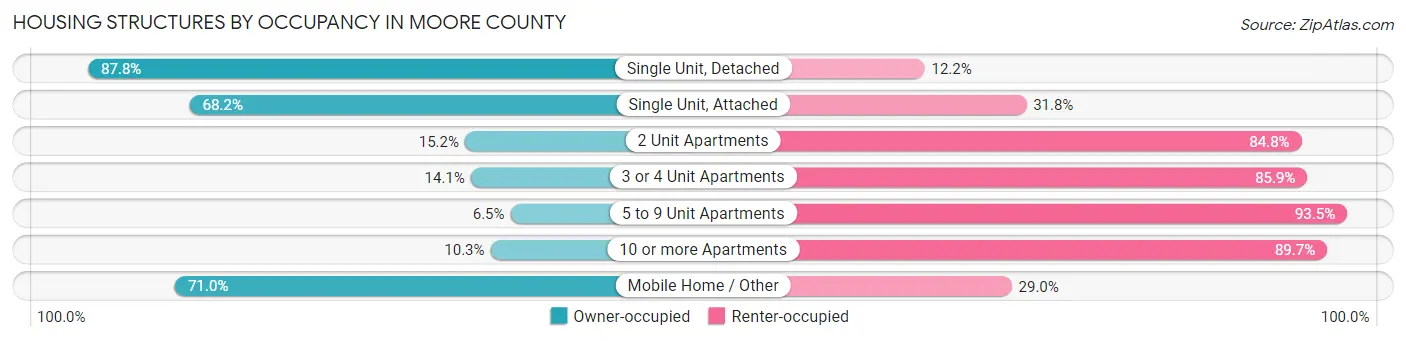
| Structure Type | Owner-occupied | Renter-occupied |
| Single Unit, Detached | 27,461 (87.8%) | 3,817 (12.2%) |
| Single Unit, Attached | 889 (68.2%) | 414 (31.8%) |
| 2 Unit Apartments | 146 (15.2%) | 812 (84.8%) |
| 3 or 4 Unit Apartments | 191 (14.1%) | 1,161 (85.9%) |
| 5 to 9 Unit Apartments | 55 (6.5%) | 795 (93.5%) |
| 10 or more Apartments | 137 (10.3%) | 1,191 (89.7%) |
| Mobile Home / Other | 3,348 (71.0%) | 1,365 (29.0%) |
| Total | 32,227 (77.1%) | 9,555 (22.9%) |
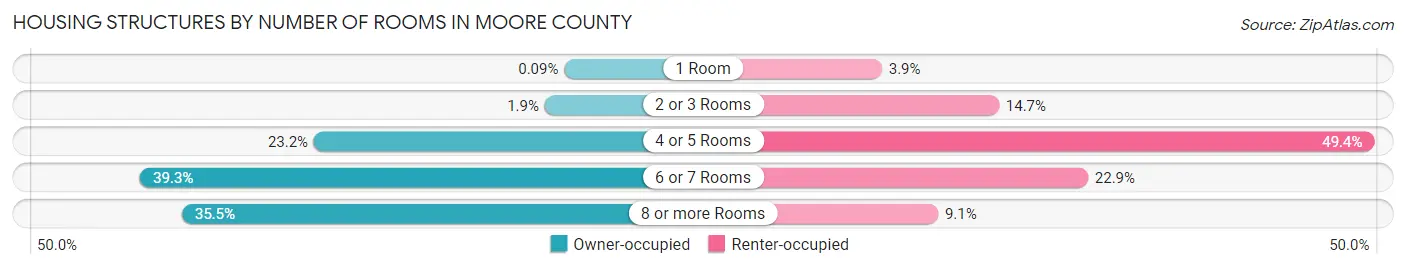
Housing Structures by Number of Rooms in Moore County
| Number of Rooms | Owner-occupied | Renter-occupied |
| 1 Room | 29 (0.1%) | 370 (3.9%) |
| 2 or 3 Rooms | 608 (1.9%) | 1,405 (14.7%) |
| 4 or 5 Rooms | 7,490 (23.2%) | 4,722 (49.4%) |
| 6 or 7 Rooms | 12,672 (39.3%) | 2,191 (22.9%) |
| 8 or more Rooms | 11,428 (35.5%) | 867 (9.1%) |
| Total | 32,227 (100.0%) | 9,555 (100.0%) |
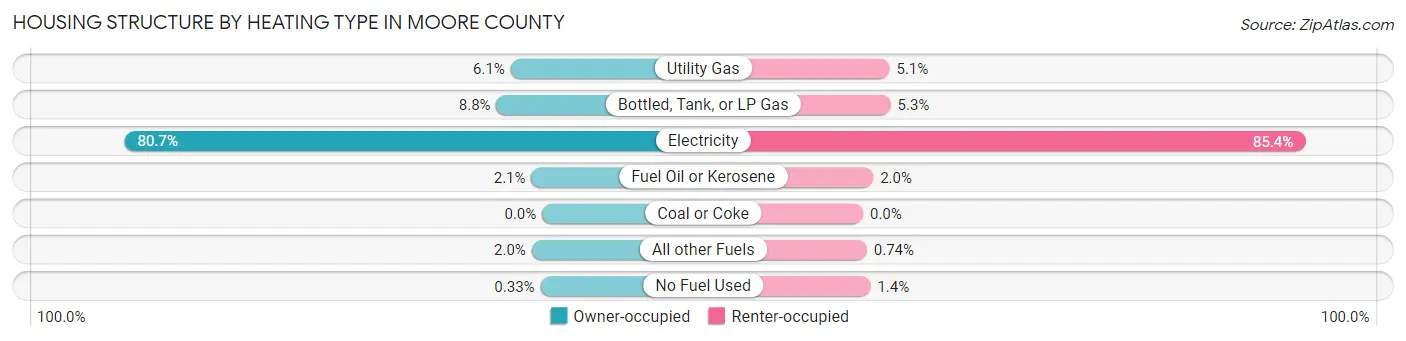
Housing Structure by Heating Type in Moore County
| Heating Type | Owner-occupied | Renter-occupied |
| Utility Gas | 1,959 (6.1%) | 489 (5.1%) |
| Bottled, Tank, or LP Gas | 2,845 (8.8%) | 508 (5.3%) |
| Electricity | 26,004 (80.7%) | 8,162 (85.4%) |
| Fuel Oil or Kerosene | 667 (2.1%) | 188 (2.0%) |
| Coal or Coke | 0 (0.0%) | 0 (0.0%) |
| All other Fuels | 647 (2.0%) | 71 (0.7%) |
| No Fuel Used | 105 (0.3%) | 137 (1.4%) |
| Total | 32,227 (100.0%) | 9,555 (100.0%) |
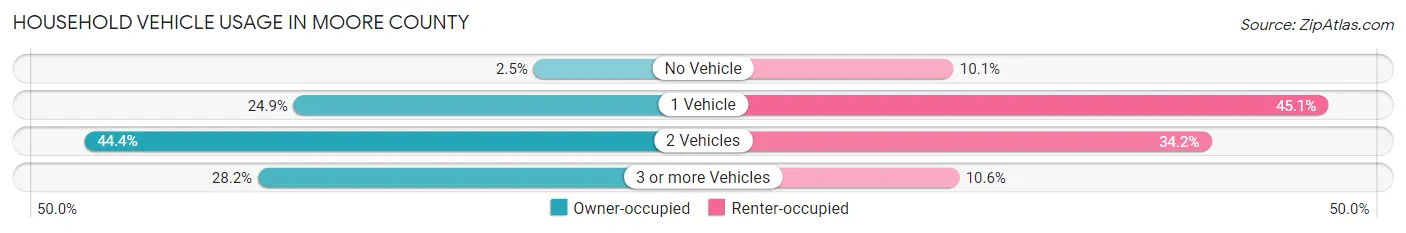
Household Vehicle Usage in Moore County
| Vehicles per Household | Owner-occupied | Renter-occupied |
| No Vehicle | 798 (2.5%) | 963 (10.1%) |
| 1 Vehicle | 8,017 (24.9%) | 4,310 (45.1%) |
| 2 Vehicles | 14,318 (44.4%) | 3,267 (34.2%) |
| 3 or more Vehicles | 9,094 (28.2%) | 1,015 (10.6%) |
| Total | 32,227 (100.0%) | 9,555 (100.0%) |
Real Estate & Mortgages in Moore County
Real Estate and Mortgage Overview in Moore County
| Characteristic | Without Mortgage | With Mortgage |
| Housing Units | 13,111 | 19,116 |
| Median Property Value | $243,600 | $296,100 |
| Median Household Income | $64,840 | $4,501 |
| Monthly Housing Costs | $473 | $1,540 |
| Real Estate Taxes | $1,494 | $231 |
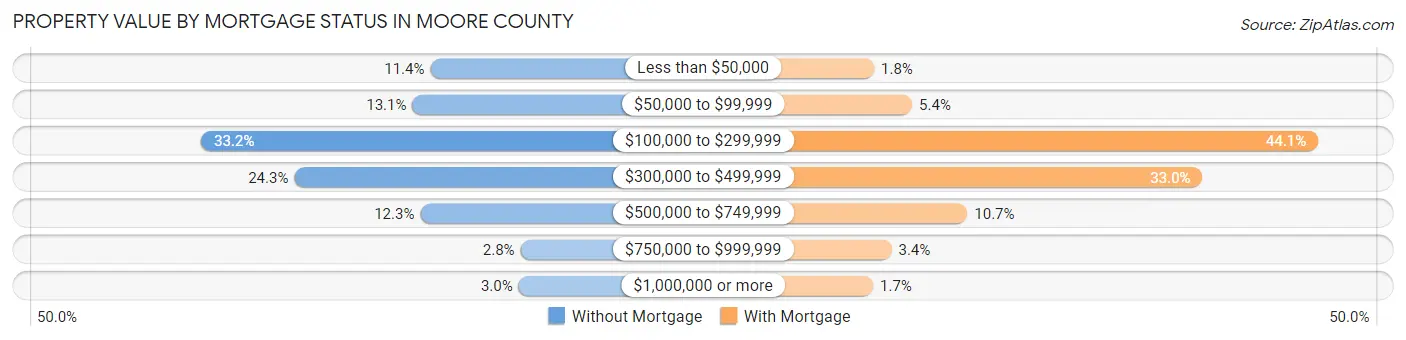
Property Value by Mortgage Status in Moore County
| Property Value | Without Mortgage | With Mortgage |
| Less than $50,000 | 1,489 (11.4%) | 339 (1.8%) |
| $50,000 to $99,999 | 1,715 (13.1%) | 1,030 (5.4%) |
| $100,000 to $299,999 | 4,351 (33.2%) | 8,421 (44.1%) |
| $300,000 to $499,999 | 3,188 (24.3%) | 6,314 (33.0%) |
| $500,000 to $749,999 | 1,615 (12.3%) | 2,036 (10.6%) |
| $750,000 to $999,999 | 365 (2.8%) | 656 (3.4%) |
| $1,000,000 or more | 388 (3.0%) | 320 (1.7%) |
| Total | 13,111 (100.0%) | 19,116 (100.0%) |
Household Income by Mortgage Status in Moore County
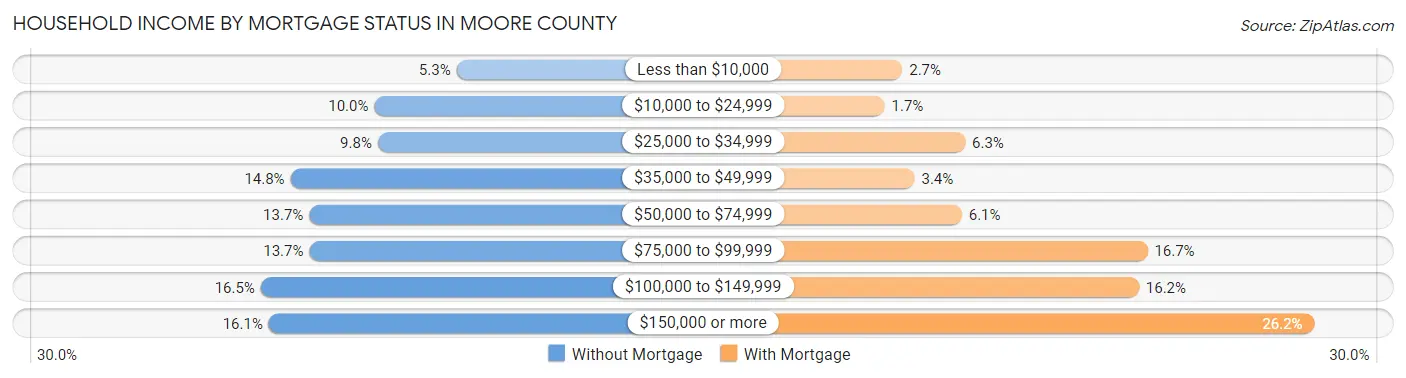
| Household Income | Without Mortgage | With Mortgage |
| Less than $10,000 | 698 (5.3%) | 510 (2.7%) |
| $10,000 to $24,999 | 1,314 (10.0%) | 318 (1.7%) |
| $25,000 to $34,999 | 1,288 (9.8%) | 1,197 (6.3%) |
| $35,000 to $49,999 | 1,942 (14.8%) | 644 (3.4%) |
| $50,000 to $74,999 | 1,801 (13.7%) | 1,160 (6.1%) |
| $75,000 to $99,999 | 1,800 (13.7%) | 3,189 (16.7%) |
| $100,000 to $149,999 | 2,164 (16.5%) | 3,095 (16.2%) |
| $150,000 or more | 2,104 (16.1%) | 5,012 (26.2%) |
| Total | 13,111 (100.0%) | 19,116 (100.0%) |
Property Value to Household Income Ratio in Moore County
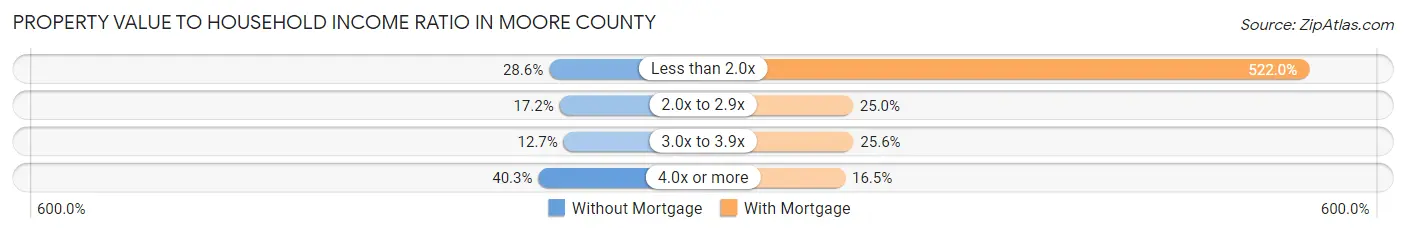
| Value-to-Income Ratio | Without Mortgage | With Mortgage |
| Less than 2.0x | 3,748 (28.6%) | 99,787 (522.0%) |
| 2.0x to 2.9x | 2,249 (17.2%) | 4,779 (25.0%) |
| 3.0x to 3.9x | 1,663 (12.7%) | 4,897 (25.6%) |
| 4.0x or more | 5,278 (40.3%) | 3,157 (16.5%) |
| Total | 13,111 (100.0%) | 19,116 (100.0%) |
Real Estate Taxes by Mortgage Status in Moore County
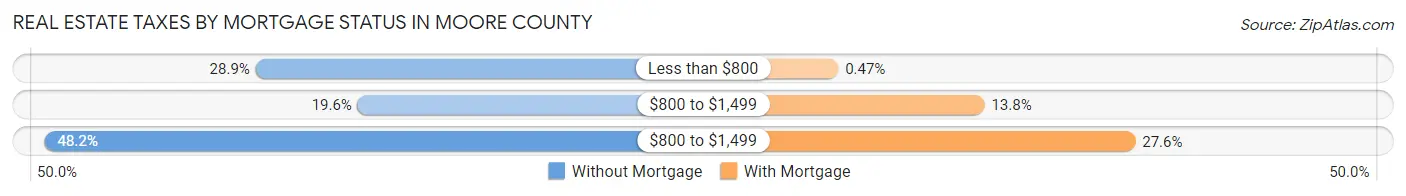
| Property Taxes | Without Mortgage | With Mortgage |
| Less than $800 | 3,789 (28.9%) | 90 (0.5%) |
| $800 to $1,499 | 2,567 (19.6%) | 2,644 (13.8%) |
| $800 to $1,499 | 6,317 (48.2%) | 5,276 (27.6%) |
| Total | 13,111 (100.0%) | 19,116 (100.0%) |
Health & Disability in Moore County
Health Insurance Coverage by Age in Moore County
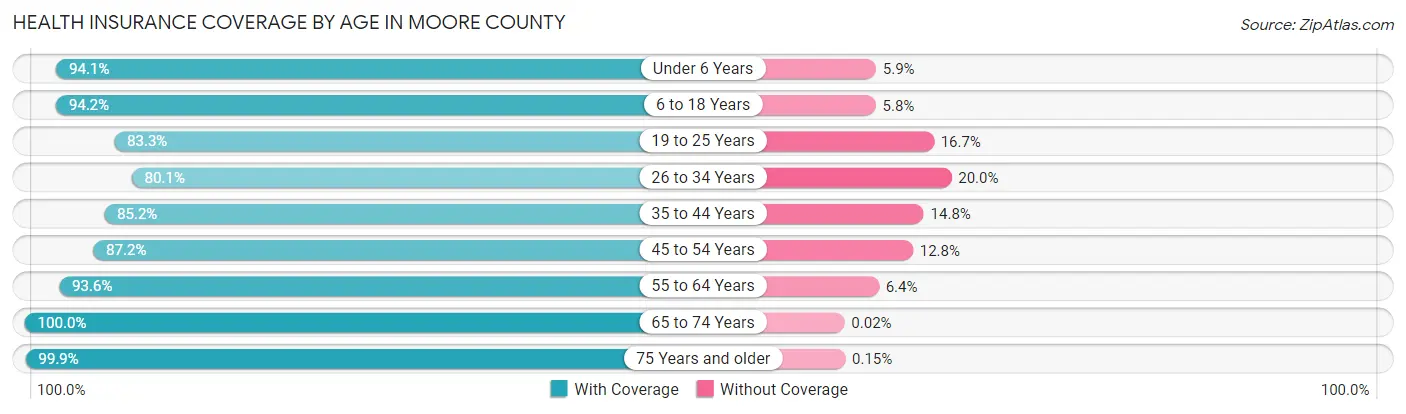
| Age Bracket | With Coverage | Without Coverage |
| Under 6 Years | 6,653 (94.1%) | 416 (5.9%) |
| 6 to 18 Years | 14,890 (94.2%) | 923 (5.8%) |
| 19 to 25 Years | 5,313 (83.3%) | 1,063 (16.7%) |
| 26 to 34 Years | 7,134 (80.0%) | 1,778 (20.0%) |
| 35 to 44 Years | 8,906 (85.2%) | 1,547 (14.8%) |
| 45 to 54 Years | 9,653 (87.2%) | 1,414 (12.8%) |
| 55 to 64 Years | 12,191 (93.6%) | 836 (6.4%) |
| 65 to 74 Years | 12,711 (100.0%) | 3 (0.0%) |
| 75 Years and older | 10,585 (99.9%) | 16 (0.2%) |
| Total | 88,036 (91.7%) | 7,996 (8.3%) |
Health Insurance Coverage by Citizenship Status in Moore County
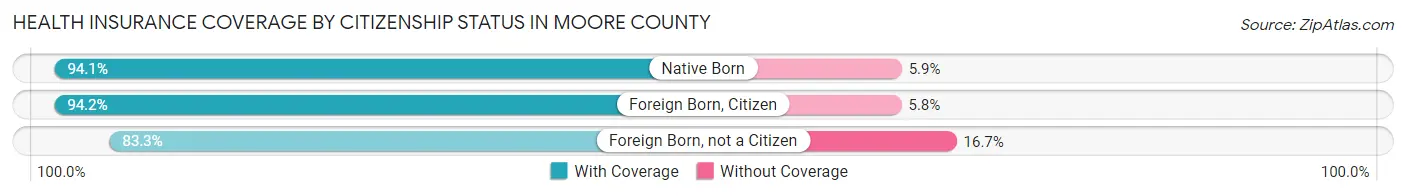
| Citizenship Status | With Coverage | Without Coverage |
| Native Born | 6,653 (94.1%) | 416 (5.9%) |
| Foreign Born, Citizen | 14,890 (94.2%) | 923 (5.8%) |
| Foreign Born, not a Citizen | 5,313 (83.3%) | 1,063 (16.7%) |
Health Insurance Coverage by Household Income in Moore County
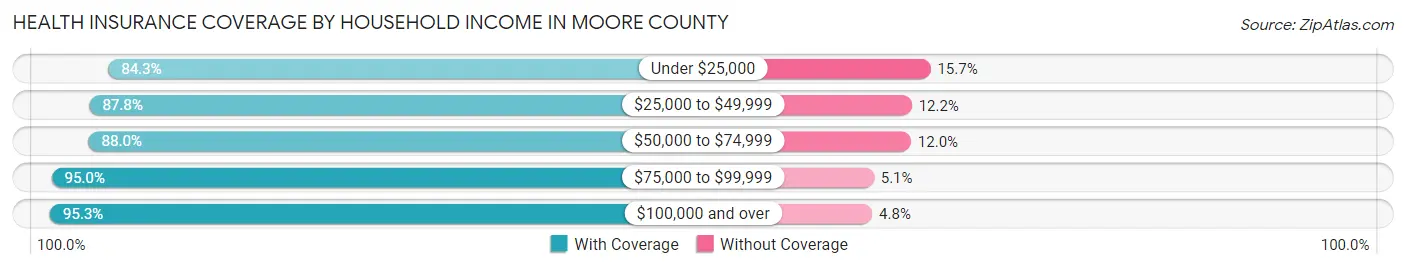
| Household Income | With Coverage | Without Coverage |
| Under $25,000 | 7,938 (84.3%) | 1,476 (15.7%) |
| $25,000 to $49,999 | 13,954 (87.8%) | 1,931 (12.2%) |
| $50,000 to $74,999 | 13,433 (88.0%) | 1,833 (12.0%) |
| $75,000 to $99,999 | 13,940 (95.0%) | 742 (5.1%) |
| $100,000 and over | 38,621 (95.3%) | 1,927 (4.8%) |
Public vs Private Health Insurance Coverage by Age in Moore County
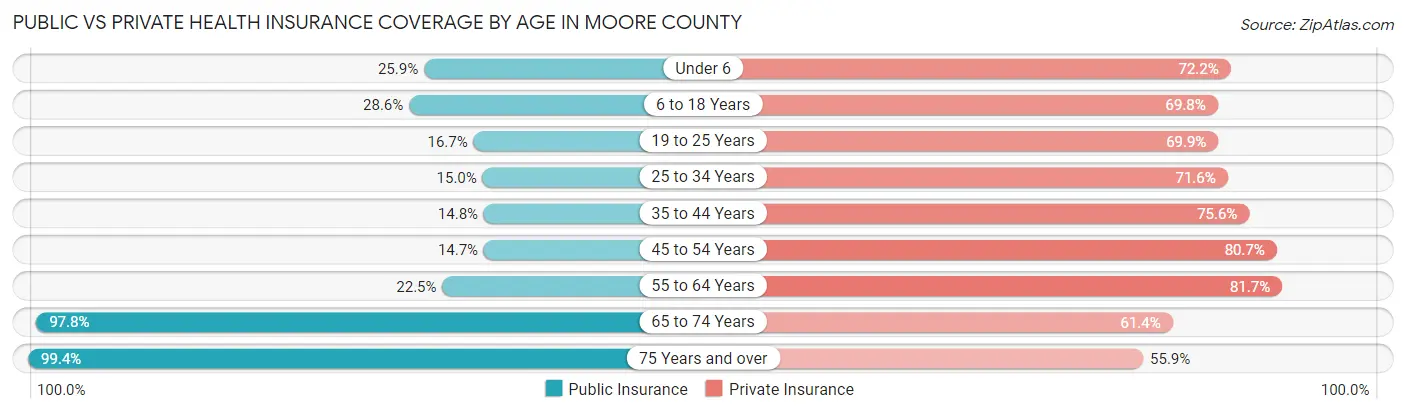
| Age Bracket | Public Insurance | Private Insurance |
| Under 6 | 1,829 (25.9%) | 5,100 (72.2%) |
| 6 to 18 Years | 4,527 (28.6%) | 11,029 (69.8%) |
| 19 to 25 Years | 1,063 (16.7%) | 4,454 (69.9%) |
| 25 to 34 Years | 1,336 (15.0%) | 6,380 (71.6%) |
| 35 to 44 Years | 1,542 (14.7%) | 7,904 (75.6%) |
| 45 to 54 Years | 1,631 (14.7%) | 8,933 (80.7%) |
| 55 to 64 Years | 2,926 (22.5%) | 10,645 (81.7%) |
| 65 to 74 Years | 12,440 (97.8%) | 7,804 (61.4%) |
| 75 Years and over | 10,535 (99.4%) | 5,929 (55.9%) |
| Total | 37,829 (39.4%) | 68,178 (71.0%) |
Disability Status by Sex by Age in Moore County
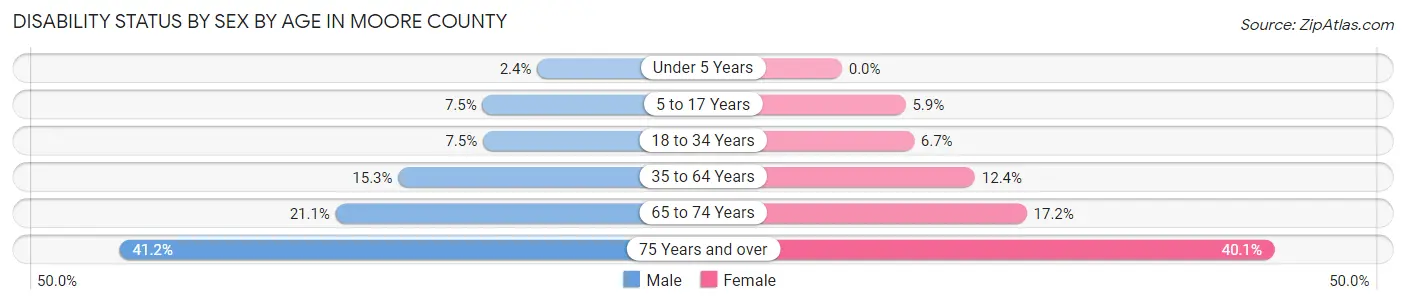
| Age Bracket | Male | Female |
| Under 5 Years | 74 (2.4%) | 0 (0.0%) |
| 5 to 17 Years | 617 (7.5%) | 446 (5.9%) |
| 18 to 34 Years | 577 (7.4%) | 586 (6.7%) |
| 35 to 64 Years | 2,482 (15.3%) | 2,264 (12.3%) |
| 65 to 74 Years | 1,244 (21.1%) | 1,171 (17.2%) |
| 75 Years and over | 1,853 (41.2%) | 2,446 (40.1%) |
Disability Class by Sex by Age in Moore County
Disability Class: Hearing Difficulty
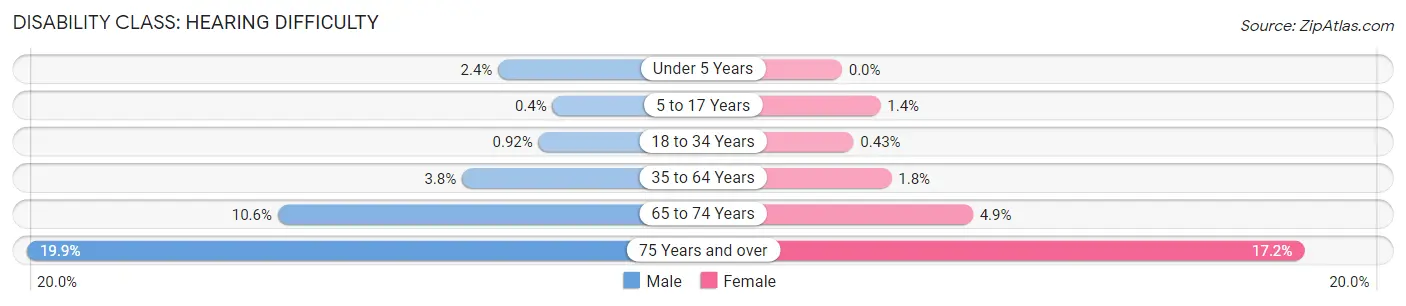
| Age Bracket | Male | Female |
| Under 5 Years | 74 (2.4%) | 0 (0.0%) |
| 5 to 17 Years | 33 (0.4%) | 108 (1.4%) |
| 18 to 34 Years | 71 (0.9%) | 38 (0.4%) |
| 35 to 64 Years | 610 (3.8%) | 337 (1.8%) |
| 65 to 74 Years | 624 (10.6%) | 332 (4.9%) |
| 75 Years and over | 896 (19.9%) | 1,047 (17.2%) |
Disability Class: Vision Difficulty
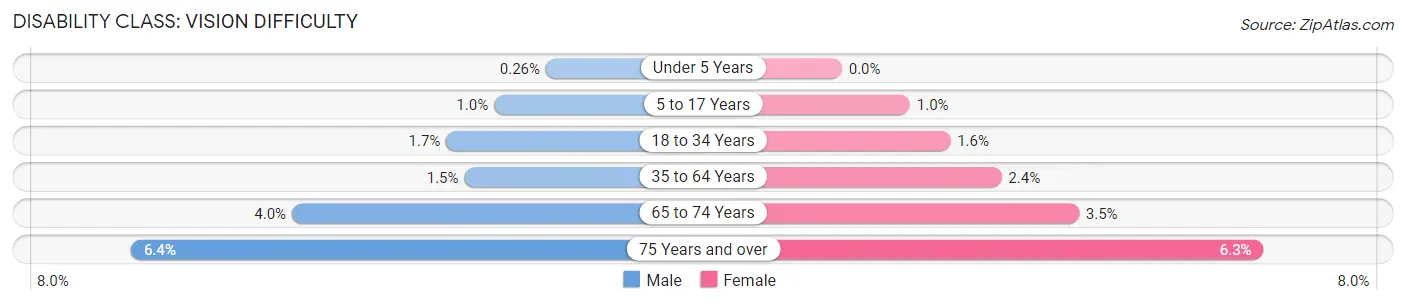
| Age Bracket | Male | Female |
| Under 5 Years | 8 (0.3%) | 0 (0.0%) |
| 5 to 17 Years | 85 (1.0%) | 76 (1.0%) |
| 18 to 34 Years | 135 (1.7%) | 141 (1.6%) |
| 35 to 64 Years | 238 (1.5%) | 434 (2.4%) |
| 65 to 74 Years | 237 (4.0%) | 240 (3.5%) |
| 75 Years and over | 289 (6.4%) | 382 (6.3%) |
Disability Class: Cognitive Difficulty
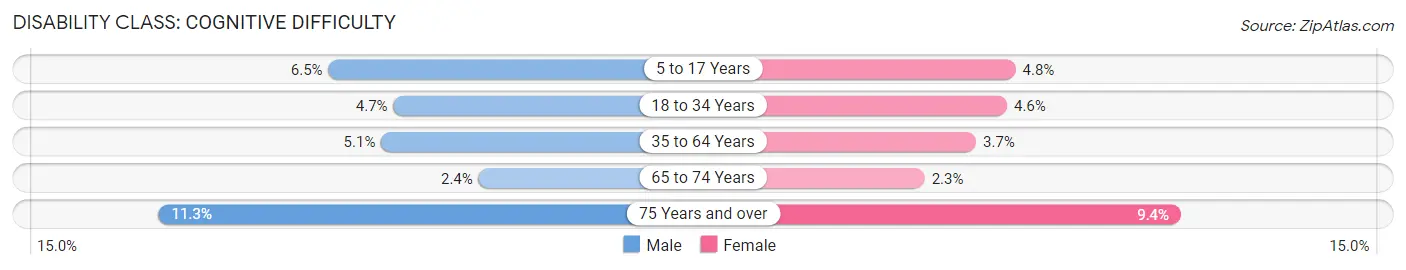
| Age Bracket | Male | Female |
| 5 to 17 Years | 538 (6.5%) | 365 (4.8%) |
| 18 to 34 Years | 366 (4.7%) | 403 (4.6%) |
| 35 to 64 Years | 822 (5.1%) | 686 (3.7%) |
| 65 to 74 Years | 139 (2.4%) | 158 (2.3%) |
| 75 Years and over | 507 (11.3%) | 576 (9.4%) |
Disability Class: Ambulatory Difficulty
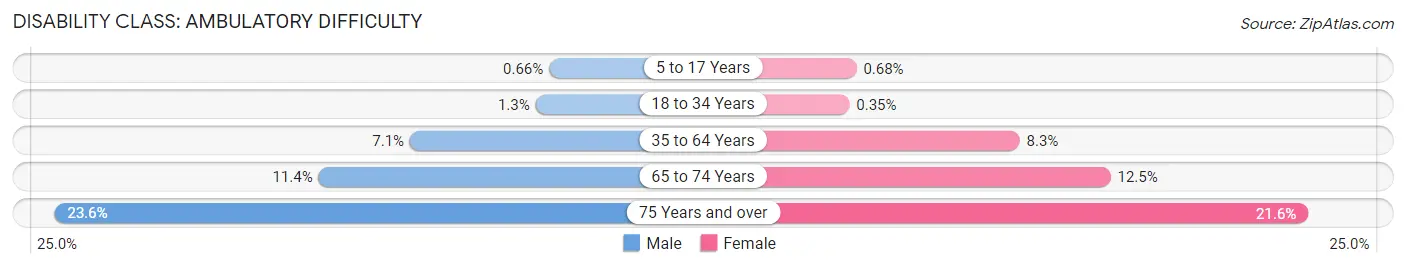
| Age Bracket | Male | Female |
| 5 to 17 Years | 54 (0.7%) | 51 (0.7%) |
| 18 to 34 Years | 100 (1.3%) | 31 (0.4%) |
| 35 to 64 Years | 1,155 (7.1%) | 1,512 (8.3%) |
| 65 to 74 Years | 669 (11.4%) | 851 (12.5%) |
| 75 Years and over | 1,063 (23.6%) | 1,320 (21.6%) |
Disability Class: Self-Care Difficulty
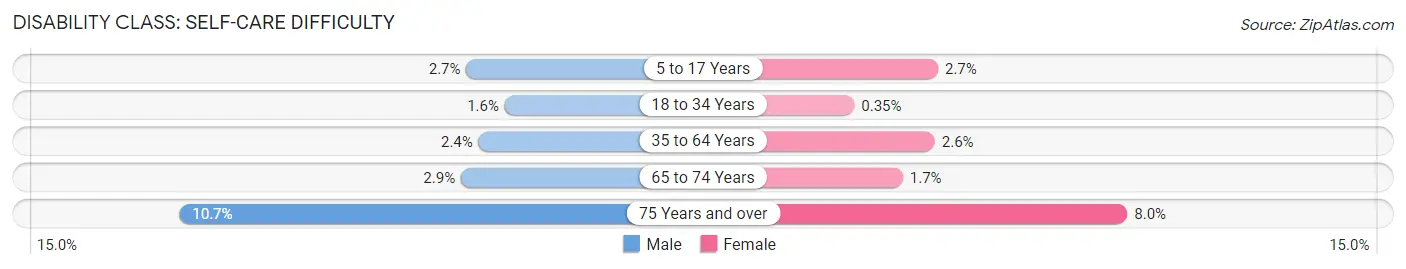
| Age Bracket | Male | Female |
| 5 to 17 Years | 222 (2.7%) | 202 (2.7%) |
| 18 to 34 Years | 126 (1.6%) | 31 (0.4%) |
| 35 to 64 Years | 383 (2.4%) | 474 (2.6%) |
| 65 to 74 Years | 168 (2.9%) | 116 (1.7%) |
| 75 Years and over | 481 (10.7%) | 485 (8.0%) |
Technology Access in Moore County
Computing Device Access in Moore County
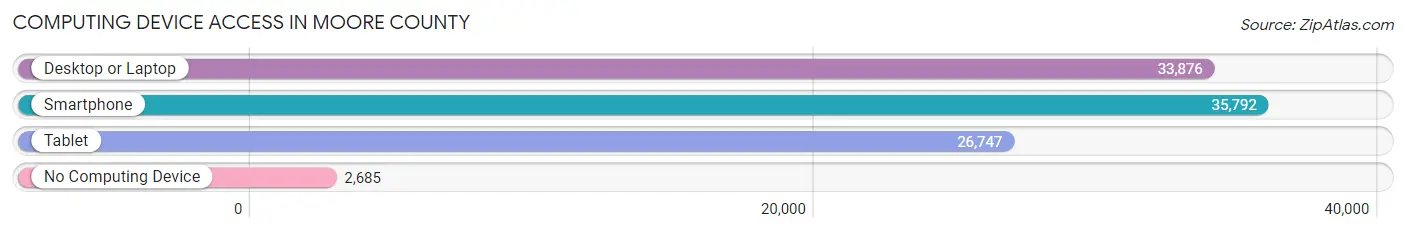
| Device Type | # Households | % Households |
| Desktop or Laptop | 33,876 | 81.1% |
| Smartphone | 35,792 | 85.7% |
| Tablet | 26,747 | 64.0% |
| No Computing Device | 2,685 | 6.4% |
| Total | 41,782 | 100.0% |
Internet Access in Moore County
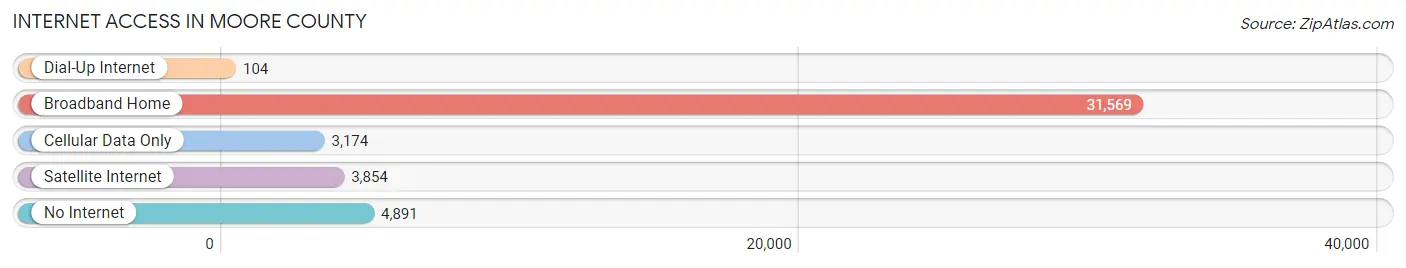
| Internet Type | # Households | % Households |
| Dial-Up Internet | 104 | 0.3% |
| Broadband Home | 31,569 | 75.6% |
| Cellular Data Only | 3,174 | 7.6% |
| Satellite Internet | 3,854 | 9.2% |
| No Internet | 4,891 | 11.7% |
| Total | 41,782 | 100.0% |
Moore County Summary
Introduction
Moore County is located in the central part of North Carolina, and is part of the Sandhills region. It is bordered by Lee, Hoke, Richmond, Montgomery, and Harnett counties. Moore County is home to the cities of Aberdeen, Pinehurst, Southern Pines, and Robbins. The county seat is Carthage. Moore County is known for its golf courses, resorts, and equestrian activities.
History
Moore County was formed in 1784 from Cumberland County. It was named for Alfred Moore, a Revolutionary War hero and associate justice of the United States Supreme Court. The county was originally part of the vast area of the state known as the “Granville District”, which was created in 1746.
The first settlers in Moore County were Scots-Irish immigrants who arrived in the late 1700s. They were followed by German and English settlers in the early 1800s. The county was largely agricultural, with cotton, tobacco, and corn being the main crops.
In the late 1800s, the county began to develop as a resort destination. The first golf course in the United States was built in Pinehurst in 1898. The area quickly became a popular destination for wealthy Northerners looking to escape the cold winters.
In the early 1900s, the county began to develop as an industrial center. The first textile mill was built in Aberdeen in 1906. The county also became a center for furniture manufacturing.
Geography
Moore County is located in the central part of North Carolina, and is part of the Sandhills region. It is bordered by Lee, Hoke, Richmond, Montgomery, and Harnett counties. The county covers an area of 545 square miles, and has a population of approximately 88,000 people.
The terrain of Moore County is mostly flat, with some rolling hills. The county is drained by the Deep and Little Rivers, which flow into the Cape Fear River. The county is home to several lakes, including Lake Pinehurst, Lake Auman, and Lake Tillery.
Economy
Moore County’s economy is largely based on tourism and manufacturing. The county is home to several resorts, golf courses, and equestrian centers. The county is also home to several furniture and textile manufacturers.
The county’s largest employers are Pinehurst Resort, First Health of the Carolinas, and Sandhills Community College. Other major employers include Moore Regional Hospital, Moore County Schools, and the Moore County Sheriff’s Office.
Demographics
As of the 2010 census, Moore County had a population of 88,247 people. The racial makeup of the county was 79.2% White, 14.3% African American, 0.5% Native American, 2.2% Asian, 0.1% Pacific Islander, and 3.7% from other races. Hispanic or Latino of any race were 6.2% of the population.
The median household income in Moore County was $45,945, and the median family income was $54,945. The per capita income was $25,945. About 11.2% of the population was below the poverty line.
Conclusion
Moore County is a vibrant and diverse county located in the central part of North Carolina. It is home to several resorts, golf courses, and equestrian centers, as well as furniture and textile manufacturers. The county has a population of 88,247 people, and is largely white and African American. The median household income is $45,945, and the per capita income is $25,945. Moore County is a great place to live, work, and play.
Common Questions
What is the Total Population of Moore County?
Total Population of Moore County is 100,759.
What is the Total Male Population of Moore County?
Total Male Population of Moore County is 49,243.
What is the Total Female Population of Moore County?
Total Female Population of Moore County is 51,516.
What is the Ratio of Males per 100 Females in Moore County?
There are 95.59 Males per 100 Females in Moore County.
What is the Ratio of Females per 100 Males in Moore County?
There are 104.62 Females per 100 Males in Moore County.
What is the Median Population Age in Moore County?
Median Population Age in Moore County is 43.0 Years.
What is the Average Family Size in Moore County
Average Family Size in Moore County is 2.9 People.
What is the Average Household Size in Moore County
Average Household Size in Moore County is 2.4 People.
What is Per Capita Income in Moore County?
Per Capita income in Moore County is $42,094.
What is the Median Family Income in Moore County?
Median Family Income in Moore County is $95,534.
What is the Median Household income in Moore County?
Median Household Income in Moore County is $77,981.
What is Income or Wage Gap in Moore County?
Income or Wage Gap in Moore County is 34.3%.
Women in Moore County earn 65.7 cents for every dollar earned by a man.
What is Family Income Deficit in Moore County?
Family Income Deficit in Moore County is $11,368.
Families that are below poverty line in Moore County earn $11,368 less on average than the poverty threshold level.
What is Inequality or Gini Index in Moore County?
Inequality or Gini Index in Moore County is 0.45.
How Large is the Labor Force in Moore County?
There are 47,179 People in the Labor Forcein in Moore County.
What is the Percentage of People in the Labor Force in Moore County?
57.9% of People are in the Labor Force in Moore County.
What is the Unemployment Rate in Moore County?
Unemployment Rate in Moore County is 4.6%.