Mecklenburg County, NC
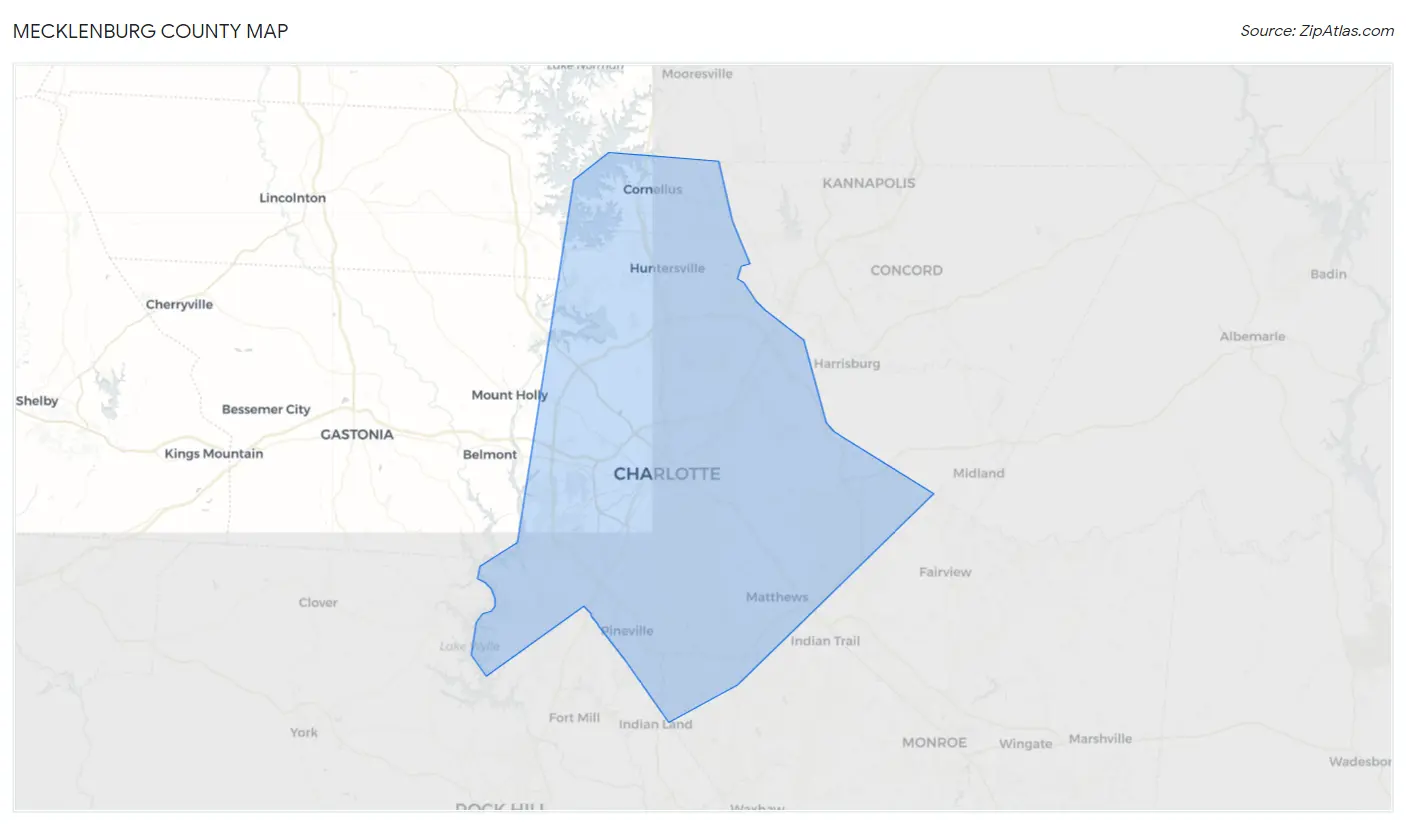
Mecklenburg County Map
Mecklenburg County Overview
1,115,403
TOTAL POPULATION
540,310
MALE POPULATION
575,093
FEMALE POPULATION
93.95
MALES / 100 FEMALES
106.44
FEMALES / 100 MALES
35.4
MEDIAN AGE
3.2
AVG FAMILY SIZE
2.5
AVG HOUSEHOLD SIZE
$48,625
PER CAPITA INCOME
$100,267
AVG FAMILY INCOME
$79,265
AVG HOUSEHOLD INCOME
24.2%
WAGE / INCOME GAP [ % ]
75.8¢/ $1
WAGE / INCOME GAP [ $ ]
$11,077
FAMILY INCOME DEFICIT
0.49
INEQUALITY / GINI INDEX
633,320
LABOR FORCE [ PEOPLE ]
71.4%
PERCENT IN LABOR FORCE
4.5%
UNEMPLOYMENT RATE
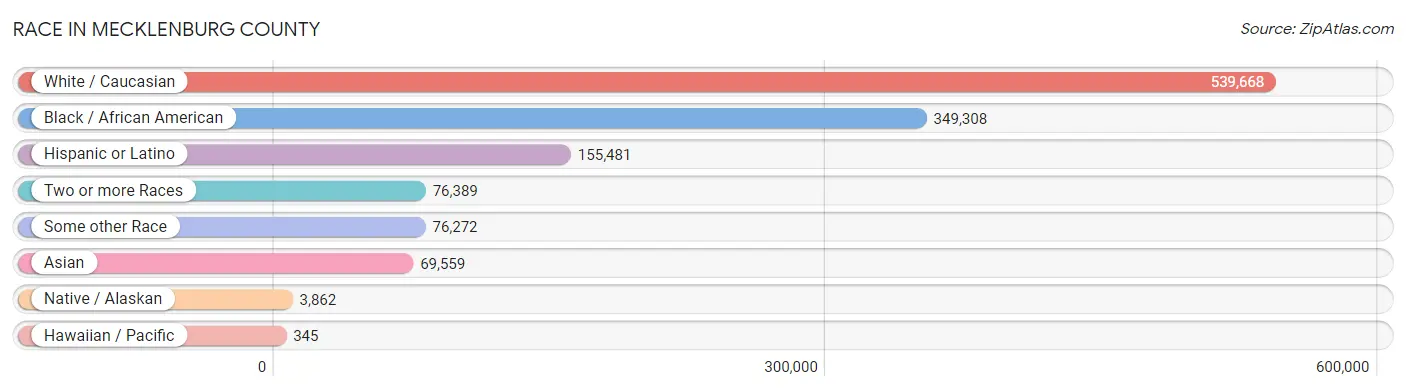
Race in Mecklenburg County
The most populous races in Mecklenburg County are White / Caucasian (539,668 | 48.4%), Black / African American (349,308 | 31.3%), and Hispanic or Latino (155,481 | 13.9%).
| Race | # Population | % Population |
| Asian | 69,559 | 6.2% |
| Black / African American | 349,308 | 31.3% |
| Hawaiian / Pacific | 345 | 0.0% |
| Hispanic or Latino | 155,481 | 13.9% |
| Native / Alaskan | 3,862 | 0.4% |
| White / Caucasian | 539,668 | 48.4% |
| Two or more Races | 76,389 | 6.9% |
| Some other Race | 76,272 | 6.8% |
| Total | 1,115,403 | 100.0% |
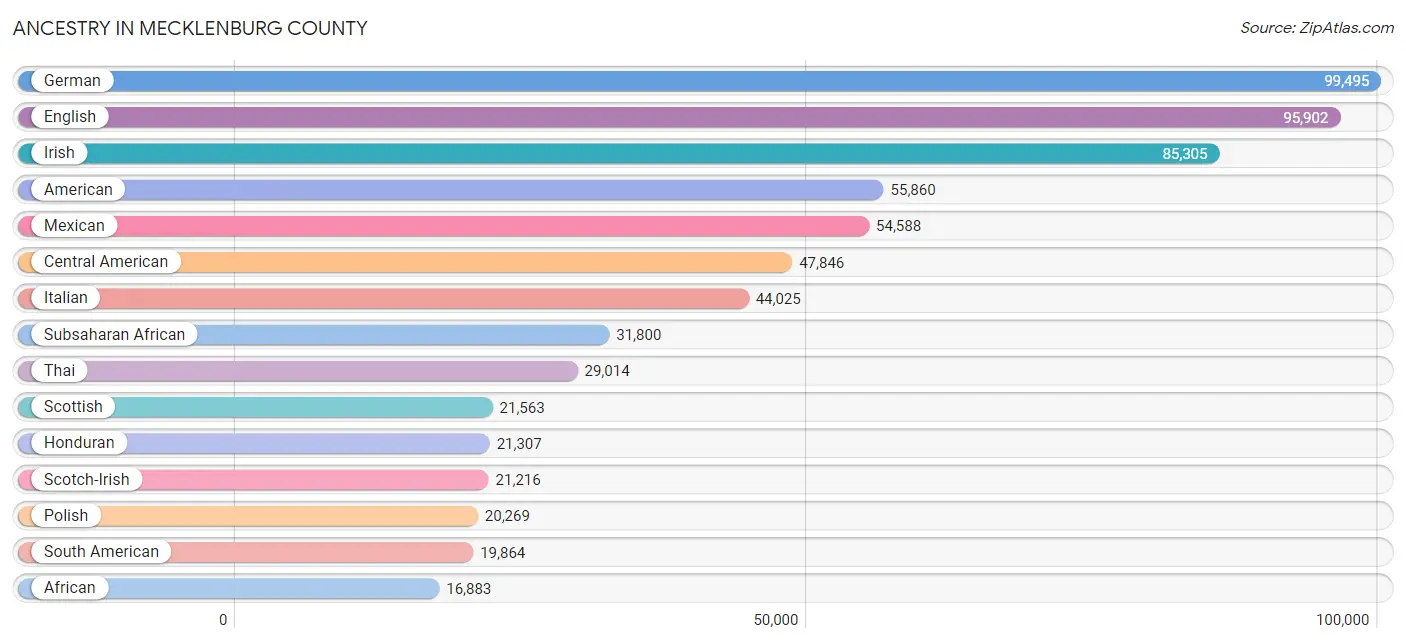
Ancestry in Mecklenburg County
The most populous ancestries reported in Mecklenburg County are German (99,495 | 8.9%), English (95,902 | 8.6%), Irish (85,305 | 7.6%), American (55,860 | 5.0%), and Mexican (54,588 | 4.9%), together accounting for 35.1% of all Mecklenburg County residents.
| Ancestry | # Population | % Population |
| Afghan | 501 | 0.0% |
| African | 16,883 | 1.5% |
| Alaskan Athabascan | 11 | 0.0% |
| Albanian | 445 | 0.0% |
| Alsatian | 44 | 0.0% |
| American | 55,860 | 5.0% |
| Apache | 267 | 0.0% |
| Arab | 9,120 | 0.8% |
| Argentinean | 867 | 0.1% |
| Armenian | 411 | 0.0% |
| Assyrian / Chaldean / Syriac | 6 | 0.0% |
| Australian | 212 | 0.0% |
| Austrian | 1,244 | 0.1% |
| Bahamian | 78 | 0.0% |
| Bangladeshi | 1,583 | 0.1% |
| Barbadian | 365 | 0.0% |
| Basque | 8 | 0.0% |
| Belgian | 540 | 0.1% |
| Belizean | 84 | 0.0% |
| Bermudan | 22 | 0.0% |
| Bhutanese | 2,300 | 0.2% |
| Blackfeet | 457 | 0.0% |
| Bolivian | 143 | 0.0% |
| Brazilian | 2,232 | 0.2% |
| British | 7,045 | 0.6% |
| British West Indian | 181 | 0.0% |
| Bulgarian | 377 | 0.0% |
| Burmese | 4,581 | 0.4% |
| Cajun | 86 | 0.0% |
| Cambodian | 79 | 0.0% |
| Canadian | 1,521 | 0.1% |
| Cape Verdean | 207 | 0.0% |
| Carpatho Rusyn | 11 | 0.0% |
| Celtic | 110 | 0.0% |
| Central American | 47,846 | 4.3% |
| Central American Indian | 1,286 | 0.1% |
| Cherokee | 3,097 | 0.3% |
| Cheyenne | 17 | 0.0% |
| Chickasaw | 38 | 0.0% |
| Chilean | 530 | 0.1% |
| Chippewa | 115 | 0.0% |
| Choctaw | 218 | 0.0% |
| Colombian | 6,991 | 0.6% |
| Costa Rican | 576 | 0.1% |
| Creek | 177 | 0.0% |
| Croatian | 515 | 0.1% |
| Crow | 11 | 0.0% |
| Cuban | 5,380 | 0.5% |
| Czech | 2,283 | 0.2% |
| Czechoslovakian | 436 | 0.0% |
| Danish | 1,314 | 0.1% |
| Delaware | 29 | 0.0% |
| Dominican | 9,104 | 0.8% |
| Dutch | 6,412 | 0.6% |
| Dutch West Indian | 45 | 0.0% |
| Eastern European | 2,412 | 0.2% |
| Ecuadorian | 5,390 | 0.5% |
| Egyptian | 738 | 0.1% |
| English | 95,902 | 8.6% |
| Estonian | 40 | 0.0% |
| Ethiopian | 3,221 | 0.3% |
| European | 14,539 | 1.3% |
| Filipino | 569 | 0.1% |
| Finnish | 958 | 0.1% |
| French | 16,632 | 1.5% |
| French American Indian | 20 | 0.0% |
| French Canadian | 3,801 | 0.3% |
| German | 99,495 | 8.9% |
| German Russian | 56 | 0.0% |
| Ghanaian | 1,094 | 0.1% |
| Greek | 5,867 | 0.5% |
| Guamanian / Chamorro | 172 | 0.0% |
| Guatemalan | 7,086 | 0.6% |
| Guyanese | 687 | 0.1% |
| Haitian | 1,414 | 0.1% |
| Honduran | 21,307 | 1.9% |
| Houma | 19 | 0.0% |
| Hungarian | 3,719 | 0.3% |
| Icelander | 24 | 0.0% |
| Indian (Asian) | 11,165 | 1.0% |
| Indonesian | 1,957 | 0.2% |
| Inupiat | 16 | 0.0% |
| Iranian | 1,374 | 0.1% |
| Iraqi | 146 | 0.0% |
| Irish | 85,305 | 7.6% |
| Iroquois | 124 | 0.0% |
| Israeli | 283 | 0.0% |
| Italian | 44,025 | 4.0% |
| Jamaican | 4,708 | 0.4% |
| Japanese | 1,492 | 0.1% |
| Jordanian | 471 | 0.0% |
| Kenyan | 271 | 0.0% |
| Kiowa | 30 | 0.0% |
| Korean | 4,941 | 0.4% |
| Laotian | 338 | 0.0% |
| Latvian | 122 | 0.0% |
| Lebanese | 3,571 | 0.3% |
| Liberian | 1,511 | 0.1% |
| Lithuanian | 1,222 | 0.1% |
| Lumbee | 1,346 | 0.1% |
| Luxembourger | 5 | 0.0% |
| Macedonian | 271 | 0.0% |
| Malaysian | 1,933 | 0.2% |
| Maltese | 50 | 0.0% |
| Mexican | 54,588 | 4.9% |
| Mexican American Indian | 793 | 0.1% |
| Mongolian | 37 | 0.0% |
| Moroccan | 642 | 0.1% |
| Native Hawaiian | 391 | 0.0% |
| Navajo | 81 | 0.0% |
| New Zealander | 22 | 0.0% |
| Nicaraguan | 1,514 | 0.1% |
| Nigerian | 2,005 | 0.2% |
| Northern European | 874 | 0.1% |
| Norwegian | 5,475 | 0.5% |
| Osage | 67 | 0.0% |
| Ottawa | 5 | 0.0% |
| Paiute | 55 | 0.0% |
| Pakistani | 1,056 | 0.1% |
| Palestinian | 723 | 0.1% |
| Panamanian | 1,555 | 0.1% |
| Paraguayan | 31 | 0.0% |
| Pennsylvania German | 90 | 0.0% |
| Peruvian | 2,463 | 0.2% |
| Polish | 20,269 | 1.8% |
| Portuguese | 2,281 | 0.2% |
| Pueblo | 11 | 0.0% |
| Puerto Rican | 12,135 | 1.1% |
| Romanian | 2,234 | 0.2% |
| Russian | 7,487 | 0.7% |
| Salvadoran | 15,702 | 1.4% |
| Samoan | 203 | 0.0% |
| Scandinavian | 1,540 | 0.1% |
| Scotch-Irish | 21,216 | 1.9% |
| Scottish | 21,563 | 1.9% |
| Seminole | 91 | 0.0% |
| Senegalese | 514 | 0.1% |
| Serbian | 557 | 0.1% |
| Shoshone | 50 | 0.0% |
| Sierra Leonean | 83 | 0.0% |
| Sioux | 99 | 0.0% |
| Slavic | 632 | 0.1% |
| Slovak | 1,624 | 0.2% |
| Slovene | 210 | 0.0% |
| Somali | 529 | 0.1% |
| South African | 642 | 0.1% |
| South American | 19,864 | 1.8% |
| South American Indian | 288 | 0.0% |
| Spaniard | 1,109 | 0.1% |
| Spanish | 1,471 | 0.1% |
| Sri Lankan | 11,039 | 1.0% |
| Subsaharan African | 31,800 | 2.9% |
| Sudanese | 241 | 0.0% |
| Swedish | 6,350 | 0.6% |
| Swiss | 1,661 | 0.2% |
| Syrian | 499 | 0.0% |
| Taiwanese | 95 | 0.0% |
| Thai | 29,014 | 2.6% |
| Tlingit-Haida | 15 | 0.0% |
| Tongan | 53 | 0.0% |
| Trinidadian and Tobagonian | 815 | 0.1% |
| Tsimshian | 9 | 0.0% |
| Turkish | 731 | 0.1% |
| U.S. Virgin Islander | 123 | 0.0% |
| Ugandan | 12 | 0.0% |
| Ukrainian | 4,272 | 0.4% |
| Uruguayan | 812 | 0.1% |
| Venezuelan | 2,632 | 0.2% |
| Vietnamese | 168 | 0.0% |
| Welsh | 5,506 | 0.5% |
| West Indian | 1,918 | 0.2% |
| Yaqui | 39 | 0.0% |
| Yugoslavian | 703 | 0.1% |
| Yuman | 18 | 0.0% |
| Yup'ik | 135 | 0.0% |
| Zimbabwean | 111 | 0.0% | View All 176 Rows |
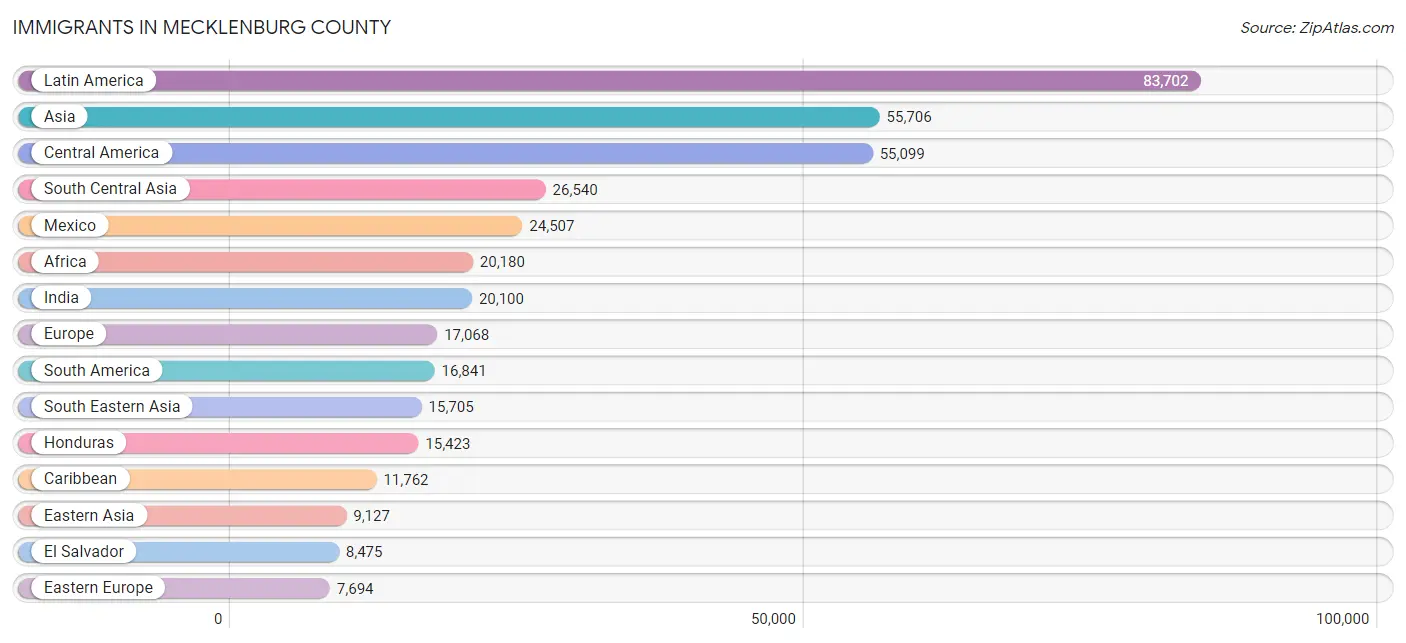
Immigrants in Mecklenburg County
The most numerous immigrant groups reported in Mecklenburg County came from Latin America (83,702 | 7.5%), Asia (55,706 | 5.0%), Central America (55,099 | 4.9%), South Central Asia (26,540 | 2.4%), and Mexico (24,507 | 2.2%), together accounting for 22.0% of all Mecklenburg County residents.
| Immigration Origin | # Population | % Population |
| Afghanistan | 522 | 0.1% |
| Africa | 20,180 | 1.8% |
| Albania | 263 | 0.0% |
| Argentina | 531 | 0.1% |
| Armenia | 11 | 0.0% |
| Asia | 55,706 | 5.0% |
| Australia | 221 | 0.0% |
| Austria | 162 | 0.0% |
| Azores | 17 | 0.0% |
| Bahamas | 80 | 0.0% |
| Bangladesh | 261 | 0.0% |
| Barbados | 413 | 0.0% |
| Belarus | 281 | 0.0% |
| Belgium | 155 | 0.0% |
| Belize | 44 | 0.0% |
| Bolivia | 65 | 0.0% |
| Bosnia and Herzegovina | 498 | 0.0% |
| Brazil | 2,137 | 0.2% |
| Bulgaria | 195 | 0.0% |
| Cabo Verde | 96 | 0.0% |
| Cambodia | 451 | 0.0% |
| Cameroon | 387 | 0.0% |
| Canada | 2,775 | 0.3% |
| Caribbean | 11,762 | 1.1% |
| Central America | 55,099 | 4.9% |
| Chile | 279 | 0.0% |
| China | 6,039 | 0.5% |
| Colombia | 4,340 | 0.4% |
| Congo | 1,285 | 0.1% |
| Costa Rica | 449 | 0.0% |
| Croatia | 158 | 0.0% |
| Cuba | 1,713 | 0.2% |
| Czechoslovakia | 127 | 0.0% |
| Denmark | 79 | 0.0% |
| Dominica | 91 | 0.0% |
| Dominican Republic | 4,653 | 0.4% |
| Eastern Africa | 5,171 | 0.5% |
| Eastern Asia | 9,127 | 0.8% |
| Eastern Europe | 7,694 | 0.7% |
| Ecuador | 3,775 | 0.3% |
| Egypt | 651 | 0.1% |
| El Salvador | 8,475 | 0.8% |
| England | 1,745 | 0.2% |
| Eritrea | 941 | 0.1% |
| Ethiopia | 2,033 | 0.2% |
| Europe | 17,068 | 1.5% |
| Fiji | 46 | 0.0% |
| France | 472 | 0.0% |
| Germany | 1,508 | 0.1% |
| Ghana | 1,082 | 0.1% |
| Greece | 967 | 0.1% |
| Grenada | 21 | 0.0% |
| Guatemala | 4,565 | 0.4% |
| Guyana | 735 | 0.1% |
| Haiti | 518 | 0.1% |
| Honduras | 15,423 | 1.4% |
| Hong Kong | 441 | 0.0% |
| Hungary | 105 | 0.0% |
| India | 20,100 | 1.8% |
| Indonesia | 367 | 0.0% |
| Iran | 1,034 | 0.1% |
| Iraq | 312 | 0.0% |
| Ireland | 308 | 0.0% |
| Israel | 278 | 0.0% |
| Italy | 631 | 0.1% |
| Jamaica | 2,799 | 0.3% |
| Japan | 865 | 0.1% |
| Jordan | 527 | 0.1% |
| Kazakhstan | 147 | 0.0% |
| Kenya | 453 | 0.0% |
| Korea | 2,223 | 0.2% |
| Kuwait | 324 | 0.0% |
| Laos | 921 | 0.1% |
| Latin America | 83,702 | 7.5% |
| Latvia | 67 | 0.0% |
| Lebanon | 1,109 | 0.1% |
| Liberia | 2,141 | 0.2% |
| Lithuania | 88 | 0.0% |
| Malaysia | 879 | 0.1% |
| Mexico | 24,507 | 2.2% |
| Middle Africa | 3,607 | 0.3% |
| Moldova | 627 | 0.1% |
| Morocco | 751 | 0.1% |
| Nepal | 2,019 | 0.2% |
| Netherlands | 235 | 0.0% |
| Nicaragua | 1,023 | 0.1% |
| Nigeria | 1,441 | 0.1% |
| North Macedonia | 65 | 0.0% |
| Northern Africa | 2,114 | 0.2% |
| Northern Europe | 4,648 | 0.4% |
| Norway | 127 | 0.0% |
| Oceania | 297 | 0.0% |
| Pakistan | 1,183 | 0.1% |
| Panama | 596 | 0.1% |
| Peru | 1,669 | 0.2% |
| Philippines | 2,408 | 0.2% |
| Poland | 576 | 0.1% |
| Portugal | 78 | 0.0% |
| Romania | 653 | 0.1% |
| Russia | 1,872 | 0.2% |
| Saudi Arabia | 212 | 0.0% |
| Scotland | 270 | 0.0% |
| Senegal | 382 | 0.0% |
| Serbia | 53 | 0.0% |
| Sierra Leone | 143 | 0.0% |
| Singapore | 84 | 0.0% |
| Somalia | 571 | 0.1% |
| South Africa | 1,209 | 0.1% |
| South America | 16,841 | 1.5% |
| South Central Asia | 26,540 | 2.4% |
| South Eastern Asia | 15,705 | 1.4% |
| Southern Europe | 2,033 | 0.2% |
| Spain | 351 | 0.0% |
| Sri Lanka | 154 | 0.0% |
| St. Vincent and the Grenadines | 24 | 0.0% |
| Sudan | 553 | 0.1% |
| Sweden | 195 | 0.0% |
| Switzerland | 82 | 0.0% |
| Syria | 551 | 0.1% |
| Taiwan | 641 | 0.1% |
| Thailand | 1,311 | 0.1% |
| Trinidad and Tobago | 1,103 | 0.1% |
| Turkey | 465 | 0.0% |
| Uganda | 292 | 0.0% |
| Ukraine | 1,802 | 0.2% |
| Uruguay | 403 | 0.0% |
| Uzbekistan | 59 | 0.0% |
| Venezuela | 2,837 | 0.3% |
| Vietnam | 7,202 | 0.6% |
| West Indies | 15 | 0.0% |
| Western Africa | 6,532 | 0.6% |
| Western Asia | 4,294 | 0.4% |
| Western Europe | 2,614 | 0.2% |
| Zaire | 1,877 | 0.2% |
| Zimbabwe | 410 | 0.0% | View All 135 Rows |
Sex and Age in Mecklenburg County
Sex and Age in Mecklenburg County
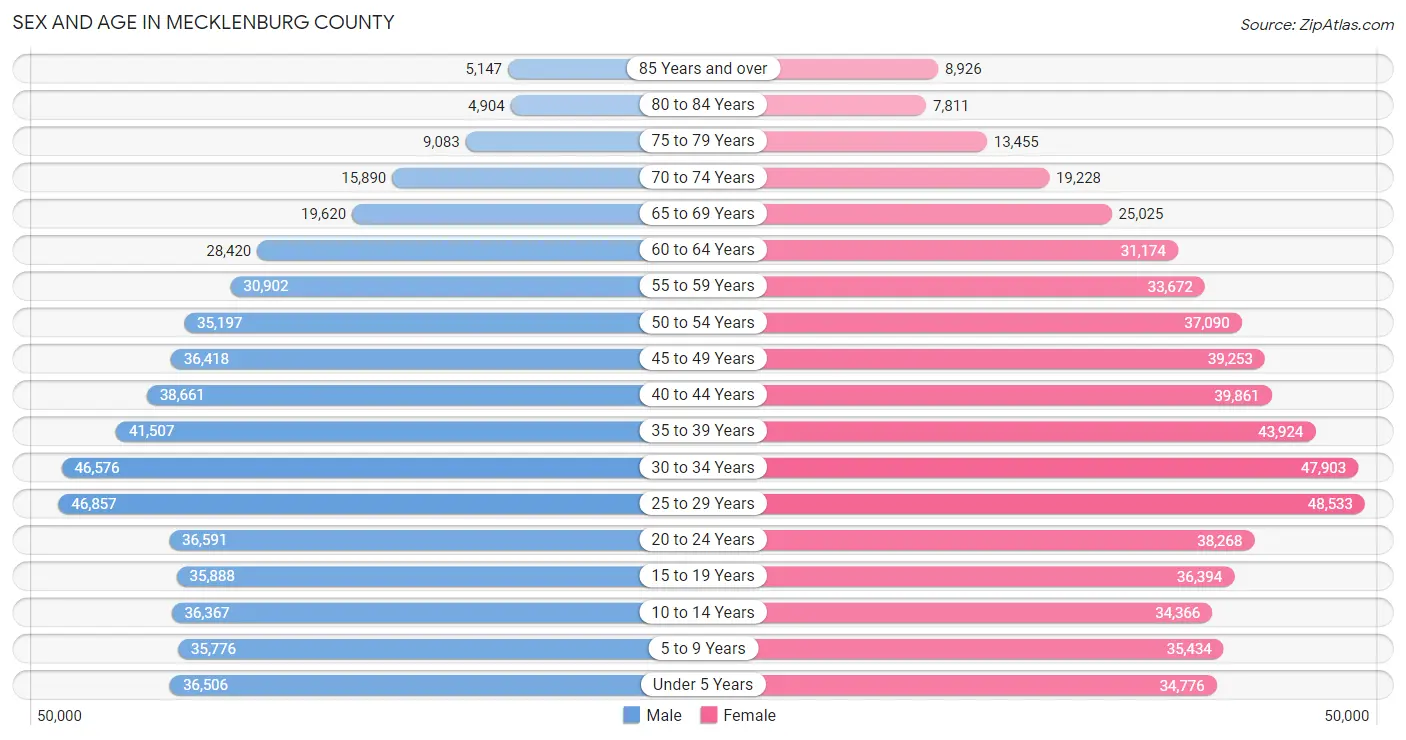
The most populous age groups in Mecklenburg County are 25 to 29 Years (46,857 | 8.7%) for men and 25 to 29 Years (48,533 | 8.4%) for women.
| Age Bracket | Male | Female |
| Under 5 Years | 36,506 (6.8%) | 34,776 (6.0%) |
| 5 to 9 Years | 35,776 (6.6%) | 35,434 (6.2%) |
| 10 to 14 Years | 36,367 (6.7%) | 34,366 (6.0%) |
| 15 to 19 Years | 35,888 (6.6%) | 36,394 (6.3%) |
| 20 to 24 Years | 36,591 (6.8%) | 38,268 (6.7%) |
| 25 to 29 Years | 46,857 (8.7%) | 48,533 (8.4%) |
| 30 to 34 Years | 46,576 (8.6%) | 47,903 (8.3%) |
| 35 to 39 Years | 41,507 (7.7%) | 43,924 (7.6%) |
| 40 to 44 Years | 38,661 (7.2%) | 39,861 (6.9%) |
| 45 to 49 Years | 36,418 (6.7%) | 39,253 (6.8%) |
| 50 to 54 Years | 35,197 (6.5%) | 37,090 (6.5%) |
| 55 to 59 Years | 30,902 (5.7%) | 33,672 (5.9%) |
| 60 to 64 Years | 28,420 (5.3%) | 31,174 (5.4%) |
| 65 to 69 Years | 19,620 (3.6%) | 25,025 (4.3%) |
| 70 to 74 Years | 15,890 (2.9%) | 19,228 (3.3%) |
| 75 to 79 Years | 9,083 (1.7%) | 13,455 (2.3%) |
| 80 to 84 Years | 4,904 (0.9%) | 7,811 (1.4%) |
| 85 Years and over | 5,147 (0.9%) | 8,926 (1.5%) |
| Total | 540,310 (100.0%) | 575,093 (100.0%) |
Families and Households in Mecklenburg County
Median Family Size in Mecklenburg County
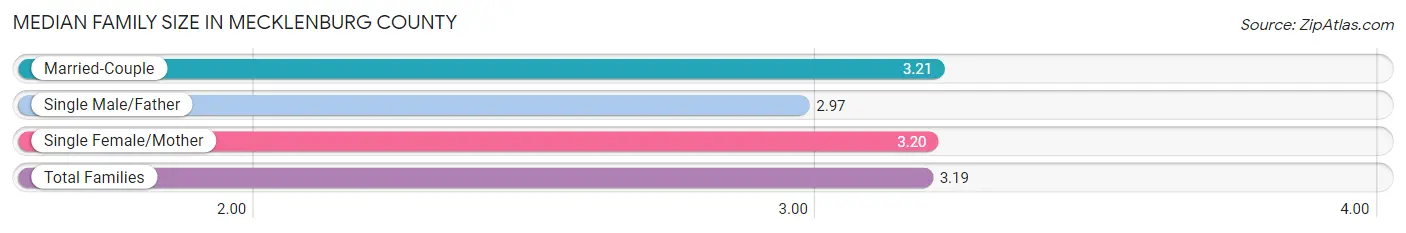
The median family size in Mecklenburg County is 3.19 persons per family, with married-couple families (186,725 | 70.6%) accounting for the largest median family size of 3.21 persons per family. On the other hand, single male/father families (19,770 | 7.5%) represent the smallest median family size with 2.97 persons per family.
| Family Type | # Families | Family Size |
| Married-Couple | 186,725 (70.6%) | 3.21 |
| Single Male/Father | 19,770 (7.5%) | 2.97 |
| Single Female/Mother | 58,026 (21.9%) | 3.20 |
| Total Families | 264,521 (100.0%) | 3.19 |
Median Household Size in Mecklenburg County
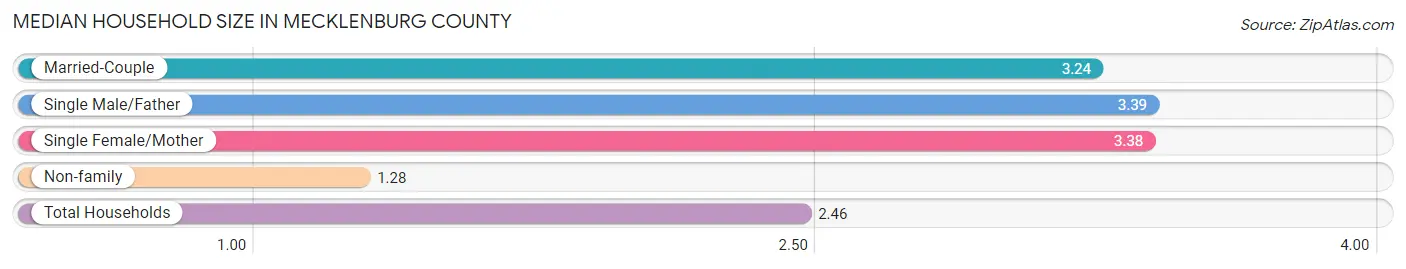
The median household size in Mecklenburg County is 2.46 persons per household, with single male/father households (19,770 | 4.4%) accounting for the largest median household size of 3.39 persons per household. non-family households (182,063 | 40.8%) represent the smallest median household size with 1.28 persons per household.
| Household Type | # Households | Household Size |
| Married-Couple | 186,725 (41.8%) | 3.24 |
| Single Male/Father | 19,770 (4.4%) | 3.39 |
| Single Female/Mother | 58,026 (13.0%) | 3.38 |
| Non-family | 182,063 (40.8%) | 1.28 |
| Total Households | 446,584 (100.0%) | 2.46 |
Household Size by Marriage Status in Mecklenburg County
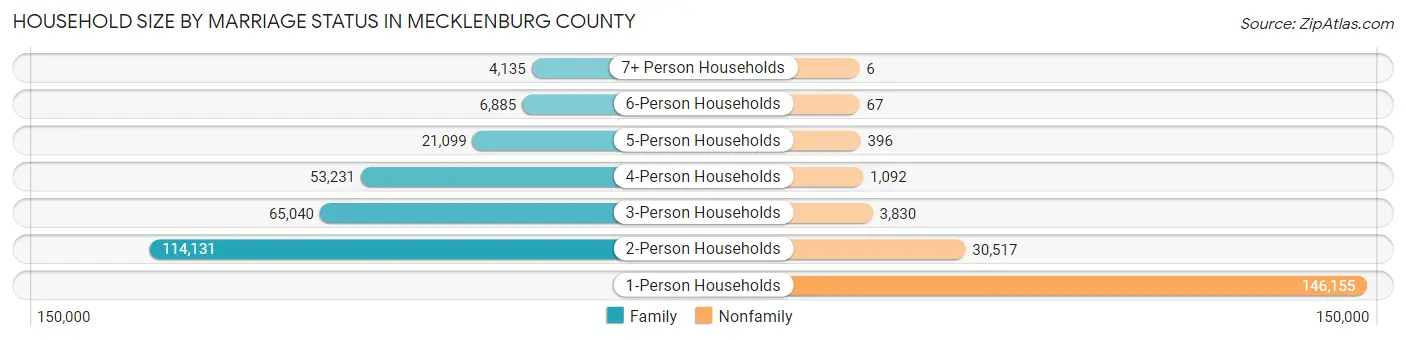
Out of a total of 446,584 households in Mecklenburg County, 264,521 (59.2%) are family households, while 182,063 (40.8%) are nonfamily households. The most numerous type of family households are 2-person households, comprising 114,131, and the most common type of nonfamily households are 1-person households, comprising 146,155.
| Household Size | Family Households | Nonfamily Households |
| 1-Person Households | - | 146,155 (32.7%) |
| 2-Person Households | 114,131 (25.6%) | 30,517 (6.8%) |
| 3-Person Households | 65,040 (14.6%) | 3,830 (0.9%) |
| 4-Person Households | 53,231 (11.9%) | 1,092 (0.2%) |
| 5-Person Households | 21,099 (4.7%) | 396 (0.1%) |
| 6-Person Households | 6,885 (1.5%) | 67 (0.0%) |
| 7+ Person Households | 4,135 (0.9%) | 6 (0.0%) |
| Total | 264,521 (59.2%) | 182,063 (40.8%) |
Female Fertility in Mecklenburg County
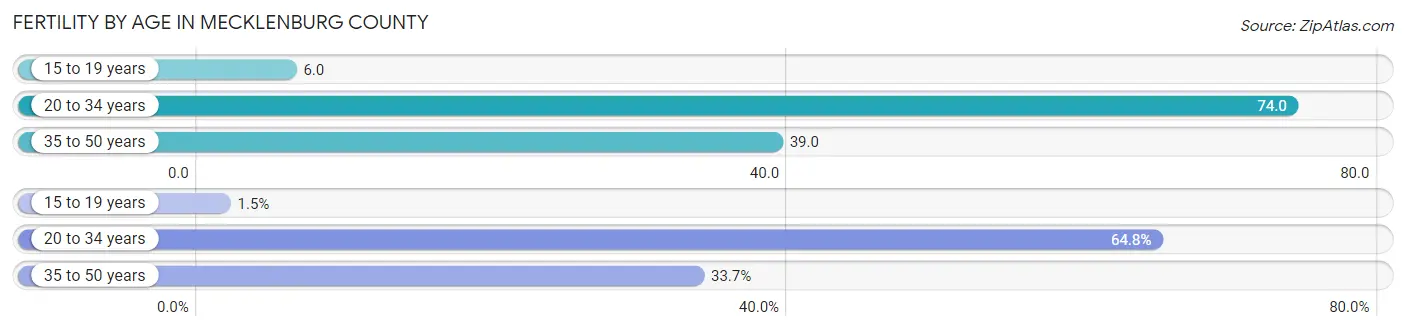
Fertility by Age in Mecklenburg County
Average fertility rate in Mecklenburg County is 51.0 births per 1,000 women. Women in the age bracket of 20 to 34 years have the highest fertility rate with 74.0 births per 1,000 women. Women in the age bracket of 20 to 34 years acount for 64.8% of all women with births.
| Age Bracket | Women with Births | Births / 1,000 Women |
| 15 to 19 years | 234 (1.5%) | 6.0 |
| 20 to 34 years | 9,926 (64.8%) | 74.0 |
| 35 to 50 years | 5,156 (33.7%) | 39.0 |
| Total | 15,316 (100.0%) | 51.0 |
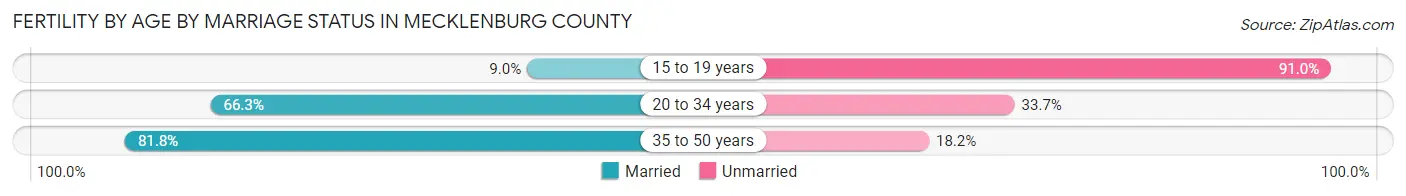
Fertility by Age by Marriage Status in Mecklenburg County
70.6% of women with births (15,316) in Mecklenburg County are married. The highest percentage of unmarried women with births falls into 15 to 19 years age bracket with 91.0% of them unmarried at the time of birth, while the lowest percentage of unmarried women with births belong to 35 to 50 years age bracket with 18.2% of them unmarried.
| Age Bracket | Married | Unmarried |
| 15 to 19 years | 21 (9.0%) | 213 (91.0%) |
| 20 to 34 years | 6,581 (66.3%) | 3,345 (33.7%) |
| 35 to 50 years | 4,218 (81.8%) | 938 (18.2%) |
| Total | 10,813 (70.6%) | 4,503 (29.4%) |
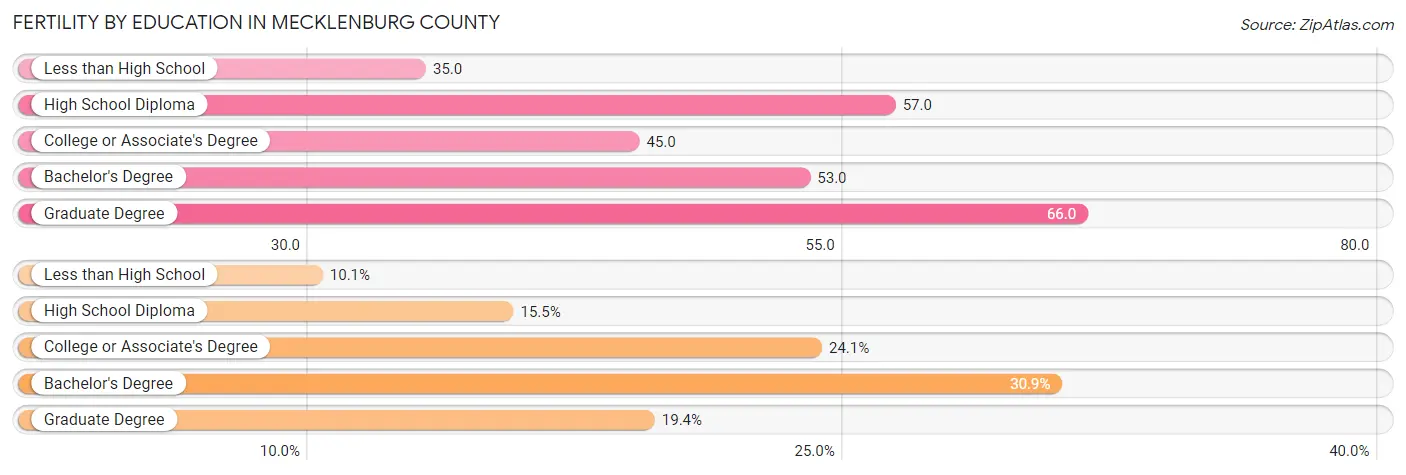
Fertility by Education in Mecklenburg County
Average fertility rate in Mecklenburg County is 51.0 births per 1,000 women. Women with the education attainment of graduate degree have the highest fertility rate of 66.0 births per 1,000 women, while women with the education attainment of less than high school have the lowest fertility at 35.0 births per 1,000 women. Women with the education attainment of bachelor's degree represent 30.9% of all women with births.
| Educational Attainment | Women with Births | Births / 1,000 Women |
| Less than High School | 1,547 (10.1%) | 35.0 |
| High School Diploma | 2,368 (15.5%) | 57.0 |
| College or Associate's Degree | 3,696 (24.1%) | 45.0 |
| Bachelor's Degree | 4,729 (30.9%) | 53.0 |
| Graduate Degree | 2,976 (19.4%) | 66.0 |
| Total | 15,316 (100.0%) | 51.0 |
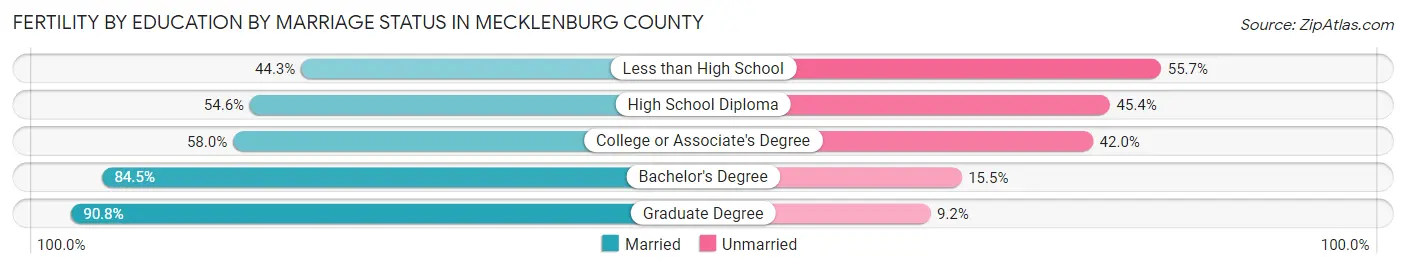
Fertility by Education by Marriage Status in Mecklenburg County
29.4% of women with births in Mecklenburg County are unmarried. Women with the educational attainment of graduate degree are most likely to be married with 90.8% of them married at childbirth, while women with the educational attainment of less than high school are least likely to be married with 55.7% of them unmarried at childbirth.
| Educational Attainment | Married | Unmarried |
| Less than High School | 685 (44.3%) | 862 (55.7%) |
| High School Diploma | 1,293 (54.6%) | 1,075 (45.4%) |
| College or Associate's Degree | 2,144 (58.0%) | 1,552 (42.0%) |
| Bachelor's Degree | 3,996 (84.5%) | 733 (15.5%) |
| Graduate Degree | 2,702 (90.8%) | 274 (9.2%) |
| Total | 10,813 (70.6%) | 4,503 (29.4%) |
Income in Mecklenburg County
Income Overview in Mecklenburg County
Per Capita Income in Mecklenburg County is $48,625, while median incomes of families and households are $100,267 and $79,265 respectively.
| Characteristic | Number | Measure |
| Per Capita Income | 1,115,403 | $48,625 |
| Median Family Income | 264,521 | $100,267 |
| Mean Family Income | 264,521 | $144,173 |
| Median Household Income | 446,584 | $79,265 |
| Mean Household Income | 446,584 | $117,987 |
| Income Deficit | 264,521 | $11,077 |
| Wage / Income Gap (%) | 1,115,403 | 24.22% |
| Wage / Income Gap ($) | 1,115,403 | 75.78¢ per $1 |
| Gini / Inequality Index | 1,115,403 | 0.49 |
Earnings by Sex in Mecklenburg County
Average Earnings in Mecklenburg County are $46,220, $53,184 for men and $40,304 for women, a difference of 24.2%.
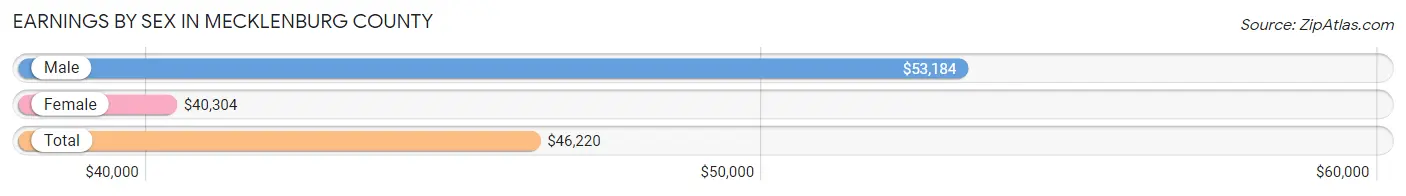
| Sex | Number | Average Earnings |
| Male | 335,823 (51.3%) | $53,184 |
| Female | 318,434 (48.7%) | $40,304 |
| Total | 654,257 (100.0%) | $46,220 |
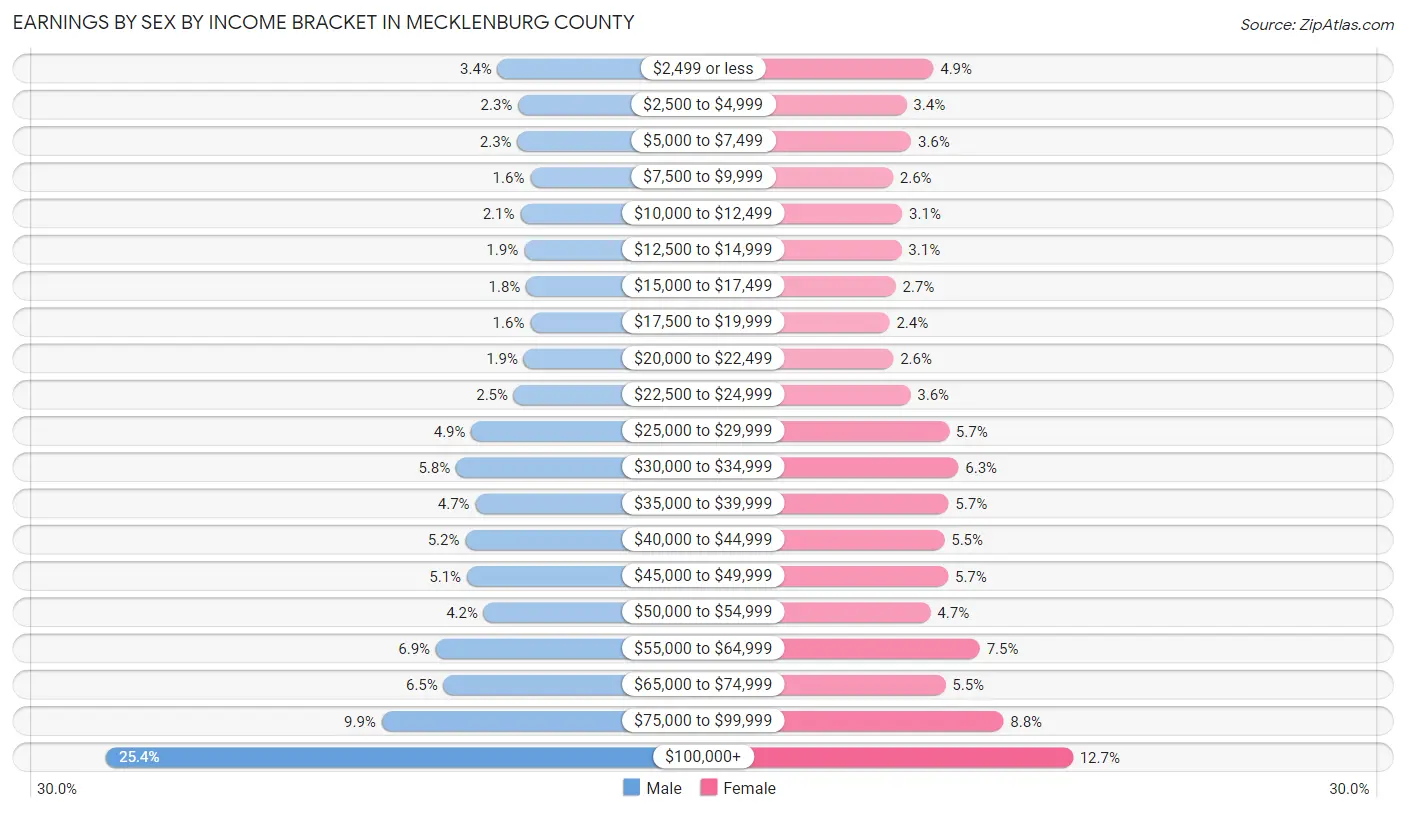
Earnings by Sex by Income Bracket in Mecklenburg County
The most common earnings brackets in Mecklenburg County are $100,000+ for men (85,378 | 25.4%) and $100,000+ for women (40,427 | 12.7%).
| Income | Male | Female |
| $2,499 or less | 11,458 (3.4%) | 15,481 (4.9%) |
| $2,500 to $4,999 | 7,575 (2.3%) | 10,673 (3.4%) |
| $5,000 to $7,499 | 7,732 (2.3%) | 11,505 (3.6%) |
| $7,500 to $9,999 | 5,309 (1.6%) | 8,255 (2.6%) |
| $10,000 to $12,499 | 7,202 (2.1%) | 9,911 (3.1%) |
| $12,500 to $14,999 | 6,484 (1.9%) | 9,778 (3.1%) |
| $15,000 to $17,499 | 6,064 (1.8%) | 8,738 (2.7%) |
| $17,500 to $19,999 | 5,310 (1.6%) | 7,645 (2.4%) |
| $20,000 to $22,499 | 6,502 (1.9%) | 8,301 (2.6%) |
| $22,500 to $24,999 | 8,390 (2.5%) | 11,354 (3.6%) |
| $25,000 to $29,999 | 16,436 (4.9%) | 18,275 (5.7%) |
| $30,000 to $34,999 | 19,324 (5.8%) | 19,963 (6.3%) |
| $35,000 to $39,999 | 15,652 (4.7%) | 18,167 (5.7%) |
| $40,000 to $44,999 | 17,553 (5.2%) | 17,461 (5.5%) |
| $45,000 to $49,999 | 17,270 (5.1%) | 18,128 (5.7%) |
| $50,000 to $54,999 | 14,065 (4.2%) | 14,951 (4.7%) |
| $55,000 to $64,999 | 23,108 (6.9%) | 23,773 (7.5%) |
| $65,000 to $74,999 | 21,672 (6.5%) | 17,638 (5.5%) |
| $75,000 to $99,999 | 33,339 (9.9%) | 28,010 (8.8%) |
| $100,000+ | 85,378 (25.4%) | 40,427 (12.7%) |
| Total | 335,823 (100.0%) | 318,434 (100.0%) |
Earnings by Sex by Educational Attainment in Mecklenburg County
Average earnings in Mecklenburg County are $61,182 for men and $45,375 for women, a difference of 25.8%. Men with an educational attainment of graduate degree enjoy the highest average annual earnings of $113,703, while those with less than high school education earn the least with $34,169. Women with an educational attainment of graduate degree earn the most with the average annual earnings of $69,335, while those with less than high school education have the smallest earnings of $23,160.
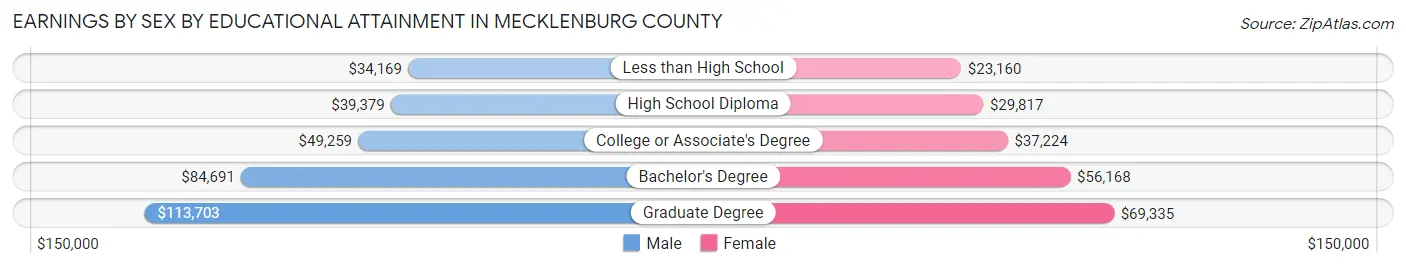
| Educational Attainment | Male Income | Female Income |
| Less than High School | $34,169 | $23,160 |
| High School Diploma | $39,379 | $29,817 |
| College or Associate's Degree | $49,259 | $37,224 |
| Bachelor's Degree | $84,691 | $56,168 |
| Graduate Degree | $113,703 | $69,335 |
| Total | $61,182 | $45,375 |
Family Income in Mecklenburg County
Family Income Brackets in Mecklenburg County
According to the Mecklenburg County family income data, there are 50,788 families falling into the $200,000+ income range, which is the most common income bracket and makes up 19.2% of all families. Conversely, the $10,000 to $14,999 income bracket is the least frequent group with only 4,497 families (1.7%) belonging to this category.
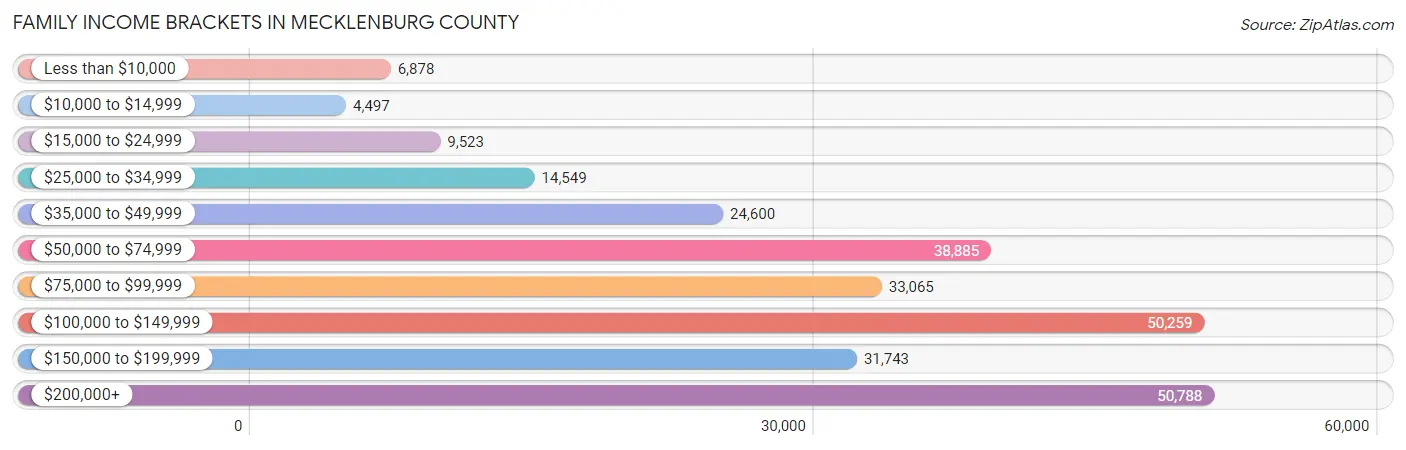
| Income Bracket | # Families | % Families |
| Less than $10,000 | 6,878 | 2.6% |
| $10,000 to $14,999 | 4,497 | 1.7% |
| $15,000 to $24,999 | 9,523 | 3.6% |
| $25,000 to $34,999 | 14,549 | 5.5% |
| $35,000 to $49,999 | 24,600 | 9.3% |
| $50,000 to $74,999 | 38,885 | 14.7% |
| $75,000 to $99,999 | 33,065 | 12.5% |
| $100,000 to $149,999 | 50,259 | 19.0% |
| $150,000 to $199,999 | 31,743 | 12.0% |
| $200,000+ | 50,788 | 19.2% |
Family Income by Famaliy Size in Mecklenburg County
4-person families (51,123 | 19.3%) account for the highest median family income in Mecklenburg County with $125,822 per family, while 2-person families (121,786 | 46.0%) have the highest median income of $45,413 per family member.
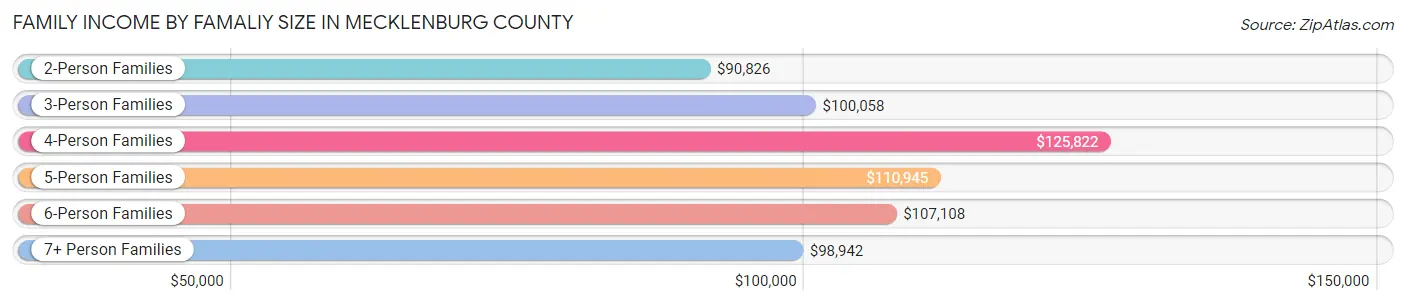
| Income Bracket | # Families | Median Income |
| 2-Person Families | 121,786 (46.0%) | $90,826 |
| 3-Person Families | 63,114 (23.9%) | $100,058 |
| 4-Person Families | 51,123 (19.3%) | $125,822 |
| 5-Person Families | 18,704 (7.1%) | $110,945 |
| 6-Person Families | 6,450 (2.4%) | $107,108 |
| 7+ Person Families | 3,344 (1.3%) | $98,942 |
| Total | 264,521 (100.0%) | $100,267 |
Family Income by Number of Earners in Mecklenburg County
The median family income in Mecklenburg County is $100,267, with families comprising 3+ earners (27,396) having the highest median family income of $135,458, while families with no earners (25,477) have the lowest median family income of $52,260, accounting for 10.4% and 9.6% of families, respectively.
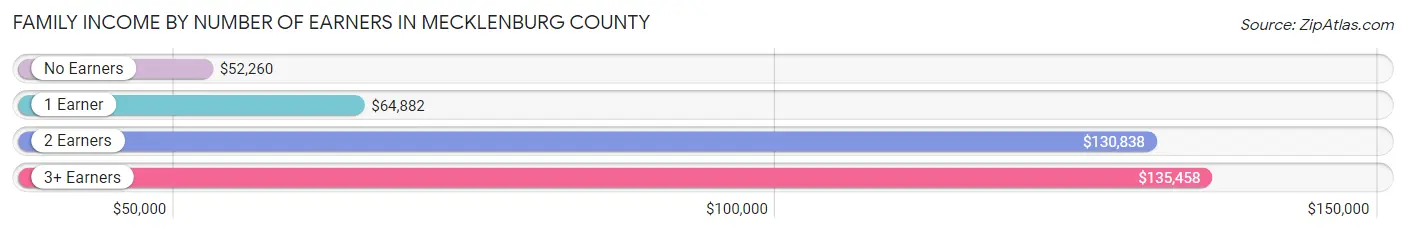
| Number of Earners | # Families | Median Income |
| No Earners | 25,477 (9.6%) | $52,260 |
| 1 Earner | 90,652 (34.3%) | $64,882 |
| 2 Earners | 120,996 (45.7%) | $130,838 |
| 3+ Earners | 27,396 (10.4%) | $135,458 |
| Total | 264,521 (100.0%) | $100,267 |
Household Income in Mecklenburg County
Household Income Brackets in Mecklenburg County
With 76,812 households falling in the category, the $50,000 to $74,999 income range is the most frequent in Mecklenburg County, accounting for 17.2% of all households. In contrast, only 12,058 households (2.7%) fall into the $10,000 to $14,999 income bracket, making it the least populous group.
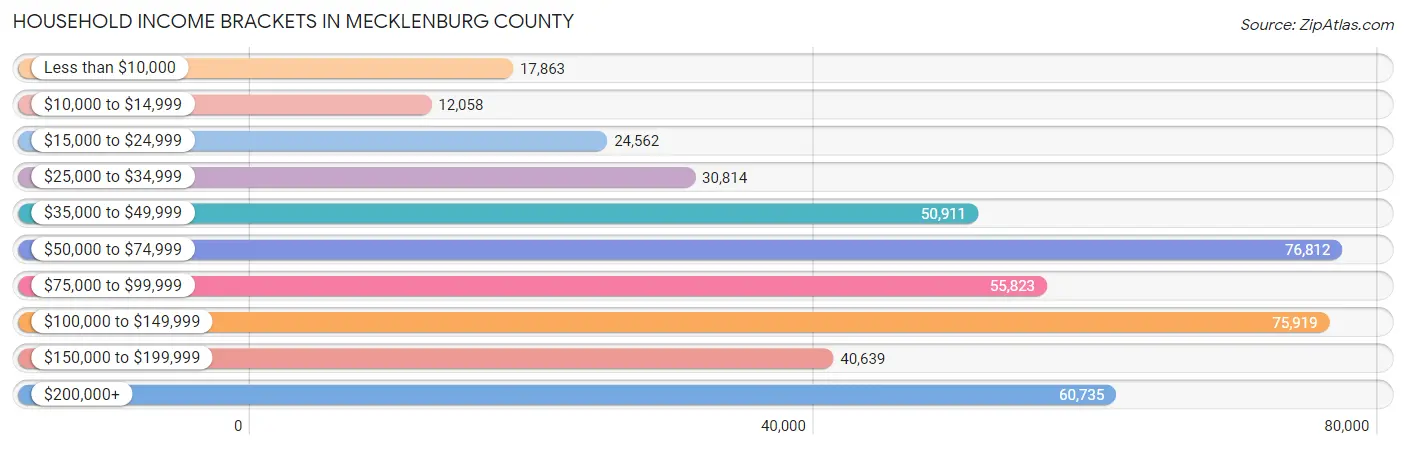
| Income Bracket | # Households | % Households |
| Less than $10,000 | 17,863 | 4.0% |
| $10,000 to $14,999 | 12,058 | 2.7% |
| $15,000 to $24,999 | 24,562 | 5.5% |
| $25,000 to $34,999 | 30,814 | 6.9% |
| $35,000 to $49,999 | 50,911 | 11.4% |
| $50,000 to $74,999 | 76,812 | 17.2% |
| $75,000 to $99,999 | 55,823 | 12.5% |
| $100,000 to $149,999 | 75,919 | 17.0% |
| $150,000 to $199,999 | 40,639 | 9.1% |
| $200,000+ | 60,735 | 13.6% |
Household Income by Householder Age in Mecklenburg County
The median household income in Mecklenburg County is $79,265, with the highest median household income of $92,966 found in the 45 to 64 years age bracket for the primary householder. A total of 161,621 households (36.2%) fall into this category. Meanwhile, the 15 to 24 years age bracket for the primary householder has the lowest median household income of $47,955, with 19,635 households (4.4%) in this group.
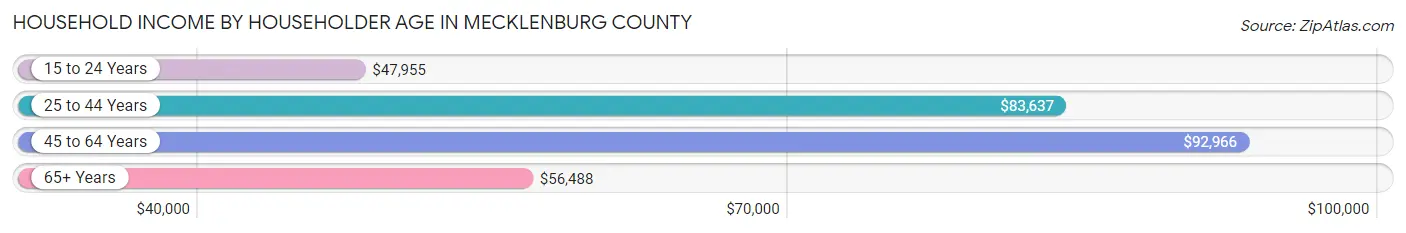
| Income Bracket | # Households | Median Income |
| 15 to 24 Years | 19,635 (4.4%) | $47,955 |
| 25 to 44 Years | 186,559 (41.8%) | $83,637 |
| 45 to 64 Years | 161,621 (36.2%) | $92,966 |
| 65+ Years | 78,769 (17.6%) | $56,488 |
| Total | 446,584 (100.0%) | $79,265 |
Poverty in Mecklenburg County
Income Below Poverty by Sex and Age in Mecklenburg County
With 9.4% poverty level for males and 11.6% for females among the residents of Mecklenburg County, 12 to 14 year old males and 18 to 24 year old females are the most vulnerable to poverty, with 3,885 males (18.2%) and 9,264 females (19.0%) in their respective age groups living below the poverty level.
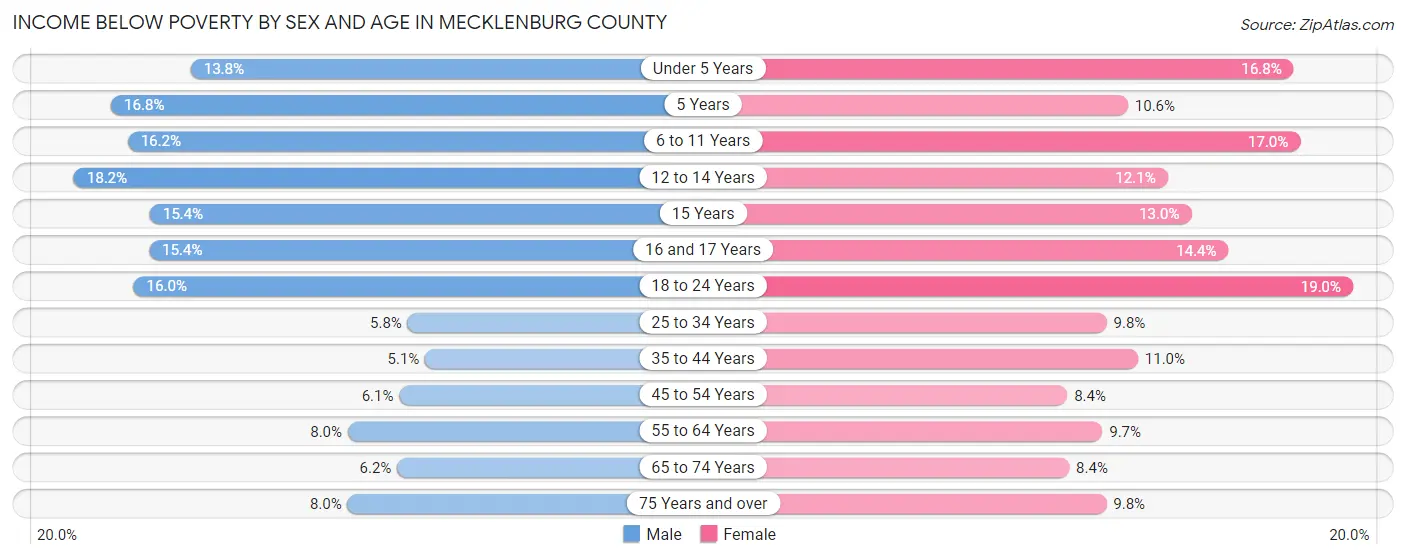
| Age Bracket | Male | Female |
| Under 5 Years | 4,984 (13.8%) | 5,778 (16.8%) |
| 5 Years | 1,074 (16.8%) | 745 (10.6%) |
| 6 to 11 Years | 6,928 (16.2%) | 6,852 (17.0%) |
| 12 to 14 Years | 3,885 (18.2%) | 2,498 (12.1%) |
| 15 Years | 1,182 (15.3%) | 969 (13.0%) |
| 16 and 17 Years | 2,121 (15.4%) | 1,982 (14.3%) |
| 18 to 24 Years | 7,480 (16.0%) | 9,264 (19.0%) |
| 25 to 34 Years | 5,358 (5.8%) | 9,471 (9.8%) |
| 35 to 44 Years | 4,097 (5.1%) | 9,206 (11.0%) |
| 45 to 54 Years | 4,344 (6.1%) | 6,382 (8.4%) |
| 55 to 64 Years | 4,722 (8.0%) | 6,247 (9.7%) |
| 65 to 74 Years | 2,159 (6.2%) | 3,699 (8.4%) |
| 75 Years and over | 1,499 (8.0%) | 2,870 (9.8%) |
| Total | 49,833 (9.4%) | 65,963 (11.6%) |
Income Above Poverty by Sex and Age in Mecklenburg County
According to the poverty statistics in Mecklenburg County, males aged 35 to 44 years and females aged 45 to 54 years are the age groups that are most secure financially, with 94.9% of males and 91.6% of females in these age groups living above the poverty line.
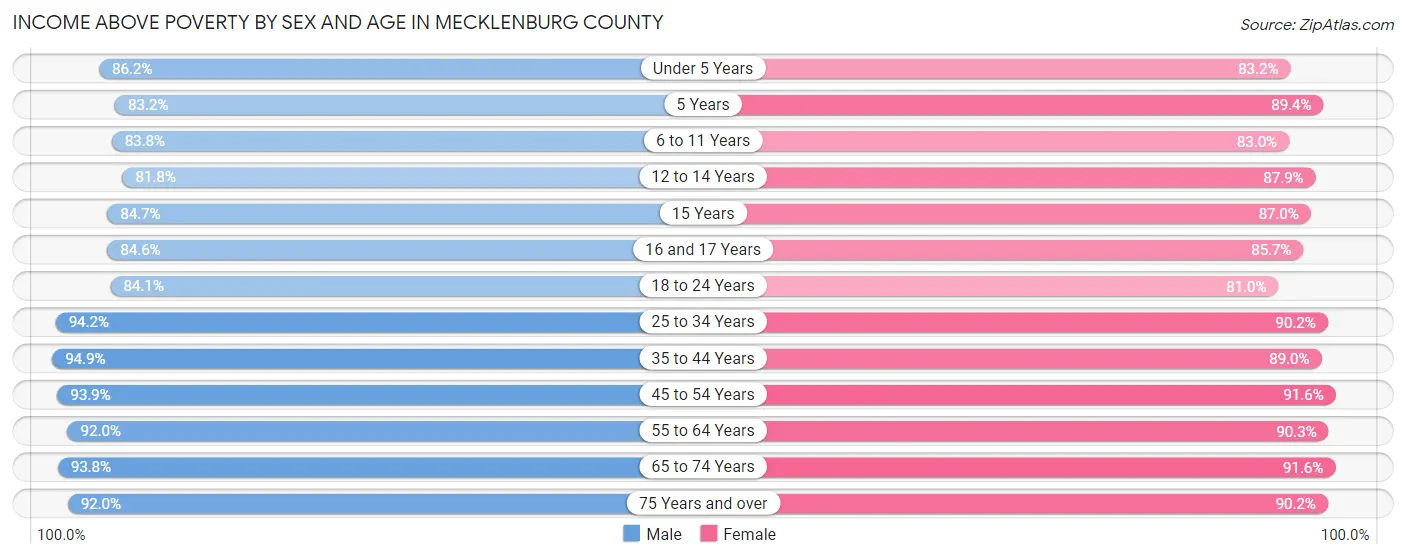
| Age Bracket | Male | Female |
| Under 5 Years | 31,050 (86.2%) | 28,679 (83.2%) |
| 5 Years | 5,324 (83.2%) | 6,273 (89.4%) |
| 6 to 11 Years | 35,920 (83.8%) | 33,426 (83.0%) |
| 12 to 14 Years | 17,501 (81.8%) | 18,159 (87.9%) |
| 15 Years | 6,516 (84.7%) | 6,500 (87.0%) |
| 16 and 17 Years | 11,666 (84.6%) | 11,833 (85.7%) |
| 18 to 24 Years | 39,431 (84.1%) | 39,566 (81.0%) |
| 25 to 34 Years | 87,364 (94.2%) | 86,875 (90.2%) |
| 35 to 44 Years | 75,765 (94.9%) | 74,535 (89.0%) |
| 45 to 54 Years | 67,020 (93.9%) | 69,840 (91.6%) |
| 55 to 64 Years | 54,325 (92.0%) | 58,386 (90.3%) |
| 65 to 74 Years | 32,809 (93.8%) | 40,131 (91.6%) |
| 75 Years and over | 17,226 (92.0%) | 26,348 (90.2%) |
| Total | 481,917 (90.6%) | 500,551 (88.4%) |
Income Below Poverty Among Married-Couple Families in Mecklenburg County
The poverty statistics for married-couple families in Mecklenburg County show that 3.2% or 5,899 of the total 186,725 families live below the poverty line. Families with 5 or more children have the highest poverty rate of 21.4%, comprising of 134 families. On the other hand, families with no children have the lowest poverty rate of 2.2%, which includes 2,272 families.
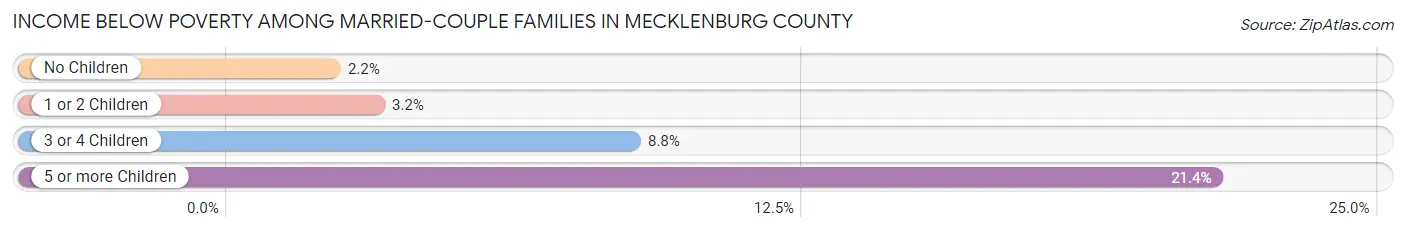
| Children | Above Poverty | Below Poverty |
| No Children | 98,987 (97.8%) | 2,272 (2.2%) |
| 1 or 2 Children | 68,559 (96.8%) | 2,263 (3.2%) |
| 3 or 4 Children | 12,789 (91.2%) | 1,230 (8.8%) |
| 5 or more Children | 491 (78.6%) | 134 (21.4%) |
| Total | 180,826 (96.8%) | 5,899 (3.2%) |
Income Below Poverty Among Single-Parent Households in Mecklenburg County
According to the poverty data in Mecklenburg County, 9.1% or 1,798 single-father households and 21.4% or 12,427 single-mother households are living below the poverty line. Among single-father households, those with 5 or more children have the highest poverty rate, with 134 households (93.7%) experiencing poverty. Likewise, among single-mother households, those with 5 or more children have the highest poverty rate, with 274 households (70.1%) falling below the poverty line.
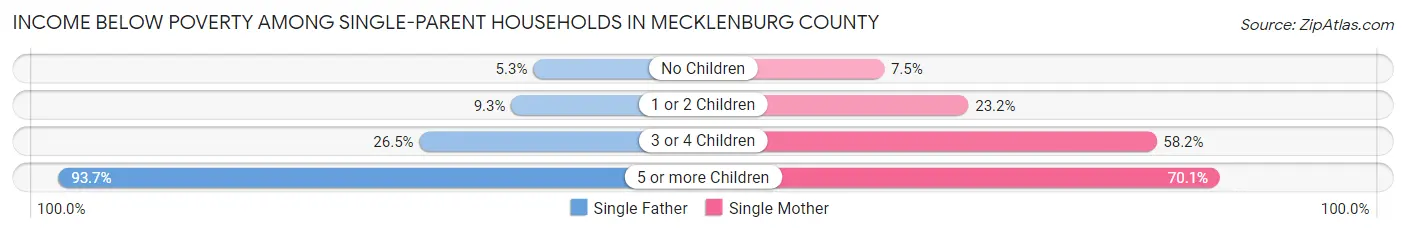
| Children | Single Father | Single Mother |
| No Children | 470 (5.3%) | 1,521 (7.5%) |
| 1 or 2 Children | 891 (9.3%) | 7,384 (23.2%) |
| 3 or 4 Children | 303 (26.5%) | 3,248 (58.2%) |
| 5 or more Children | 134 (93.7%) | 274 (70.1%) |
| Total | 1,798 (9.1%) | 12,427 (21.4%) |
Income Below Poverty Among Married-Couple vs Single-Parent Households in Mecklenburg County
The poverty data for Mecklenburg County shows that 5,899 of the married-couple family households (3.2%) and 14,225 of the single-parent households (18.3%) are living below the poverty level. Within the married-couple family households, those with 5 or more children have the highest poverty rate, with 134 households (21.4%) falling below the poverty line. Among the single-parent households, those with 5 or more children have the highest poverty rate, with 408 household (76.4%) living below poverty.
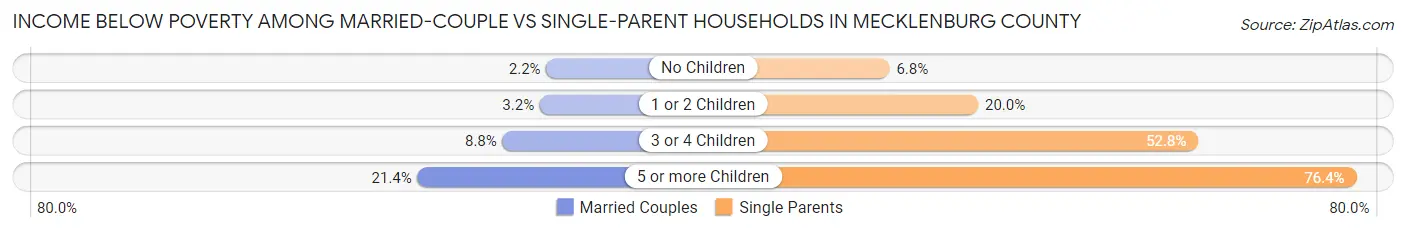
| Children | Married-Couple Families | Single-Parent Households |
| No Children | 2,272 (2.2%) | 1,991 (6.8%) |
| 1 or 2 Children | 2,263 (3.2%) | 8,275 (20.0%) |
| 3 or 4 Children | 1,230 (8.8%) | 3,551 (52.8%) |
| 5 or more Children | 134 (21.4%) | 408 (76.4%) |
| Total | 5,899 (3.2%) | 14,225 (18.3%) |
Employment Characteristics in Mecklenburg County
Employment by Class of Employer in Mecklenburg County
Among the 590,774 employed individuals in Mecklenburg County, private company employees (446,480 | 75.6%), not-for-profit organizations (39,790 | 6.7%), and self-employed (not incorporated) (28,722 | 4.9%) make up the most common classes of employment.
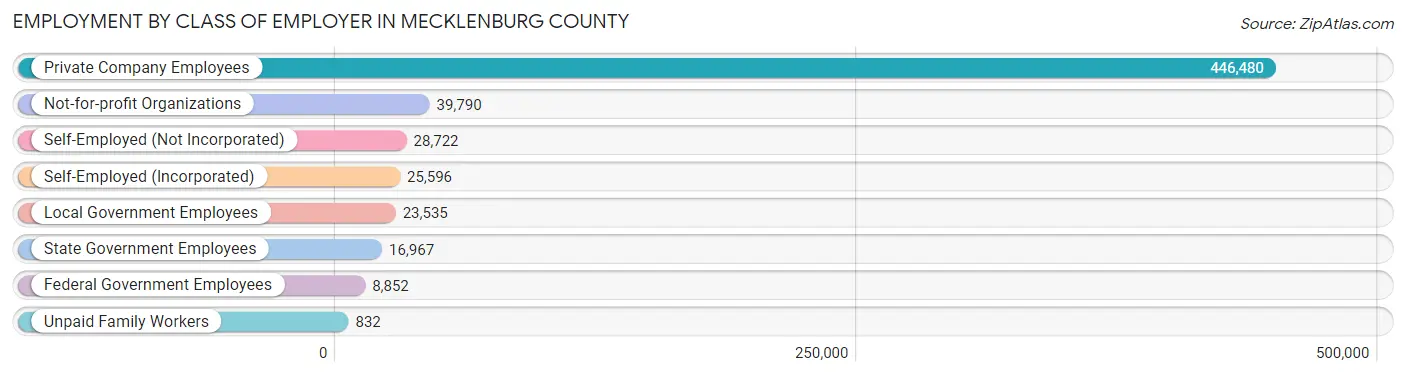
| Employer Class | # Employees | % Employees |
| Private Company Employees | 446,480 | 75.6% |
| Self-Employed (Incorporated) | 25,596 | 4.3% |
| Self-Employed (Not Incorporated) | 28,722 | 4.9% |
| Not-for-profit Organizations | 39,790 | 6.7% |
| Local Government Employees | 23,535 | 4.0% |
| State Government Employees | 16,967 | 2.9% |
| Federal Government Employees | 8,852 | 1.5% |
| Unpaid Family Workers | 832 | 0.1% |
| Total | 590,774 | 100.0% |
Employment Status by Age in Mecklenburg County
According to the labor force statistics for Mecklenburg County, out of the total population over 16 years of age (887,003), 71.4% or 633,320 individuals are in the labor force, with 4.5% or 28,499 of them unemployed. The age group with the highest labor force participation rate is 25 to 29 years, with 88.8% or 84,706 individuals in the labor force. Within the labor force, the 16 to 19 years age range has the highest percentage of unemployed individuals, with 15.3% or 3,670 of them being unemployed.
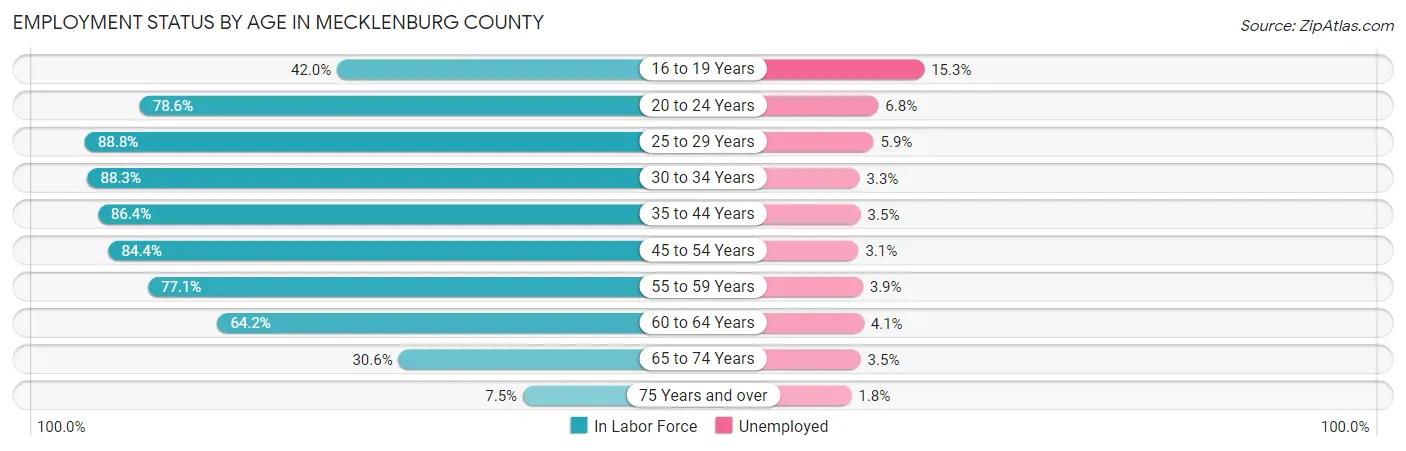
| Age Bracket | In Labor Force | Unemployed |
| 16 to 19 Years | 23,985 (42.0%) | 3,670 (15.3%) |
| 20 to 24 Years | 58,839 (78.6%) | 4,001 (6.8%) |
| 25 to 29 Years | 84,706 (88.8%) | 4,998 (5.9%) |
| 30 to 34 Years | 83,425 (88.3%) | 2,753 (3.3%) |
| 35 to 44 Years | 141,655 (86.4%) | 4,958 (3.5%) |
| 45 to 54 Years | 124,877 (84.4%) | 3,871 (3.1%) |
| 55 to 59 Years | 49,787 (77.1%) | 1,942 (3.9%) |
| 60 to 64 Years | 38,259 (64.2%) | 1,569 (4.1%) |
| 65 to 74 Years | 24,407 (30.6%) | 854 (3.5%) |
| 75 Years and over | 3,699 (7.5%) | 67 (1.8%) |
| Total | 633,320 (71.4%) | 28,499 (4.5%) |
Employment Status by Educational Attainment in Mecklenburg County
According to labor force statistics for Mecklenburg County, 83.5% of individuals (522,667) out of the total population between 25 and 64 years of age (625,948) are in the labor force, with 3.8% or 19,861 of them being unemployed. The group with the highest labor force participation rate are those with the educational attainment of bachelor's degree or higher, with 88.4% or 275,843 individuals in the labor force. Within the labor force, individuals with less than high school education have the highest percentage of unemployment, with 7.3% or 2,834 of them being unemployed.
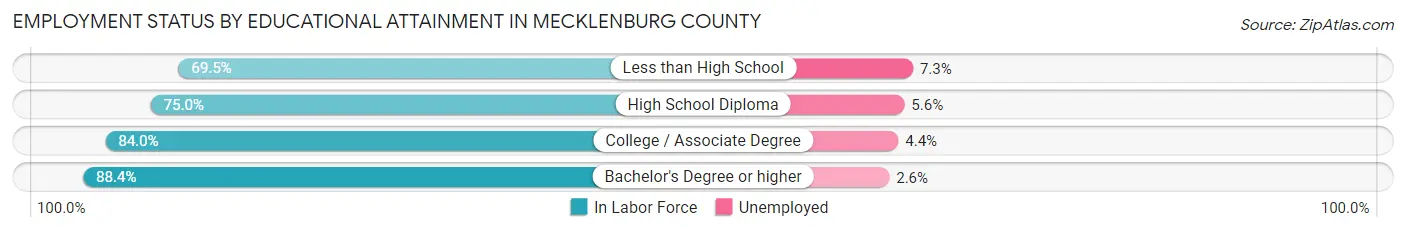
| Educational Attainment | In Labor Force | Unemployed |
| Less than High School | 38,819 (69.5%) | 4,077 (7.3%) |
| High School Diploma | 70,806 (75.0%) | 5,287 (5.6%) |
| College / Associate Degree | 137,462 (84.0%) | 7,200 (4.4%) |
| Bachelor's Degree or higher | 275,843 (88.4%) | 8,113 (2.6%) |
| Total | 522,667 (83.5%) | 23,786 (3.8%) |
Employment Occupations by Sex in Mecklenburg County
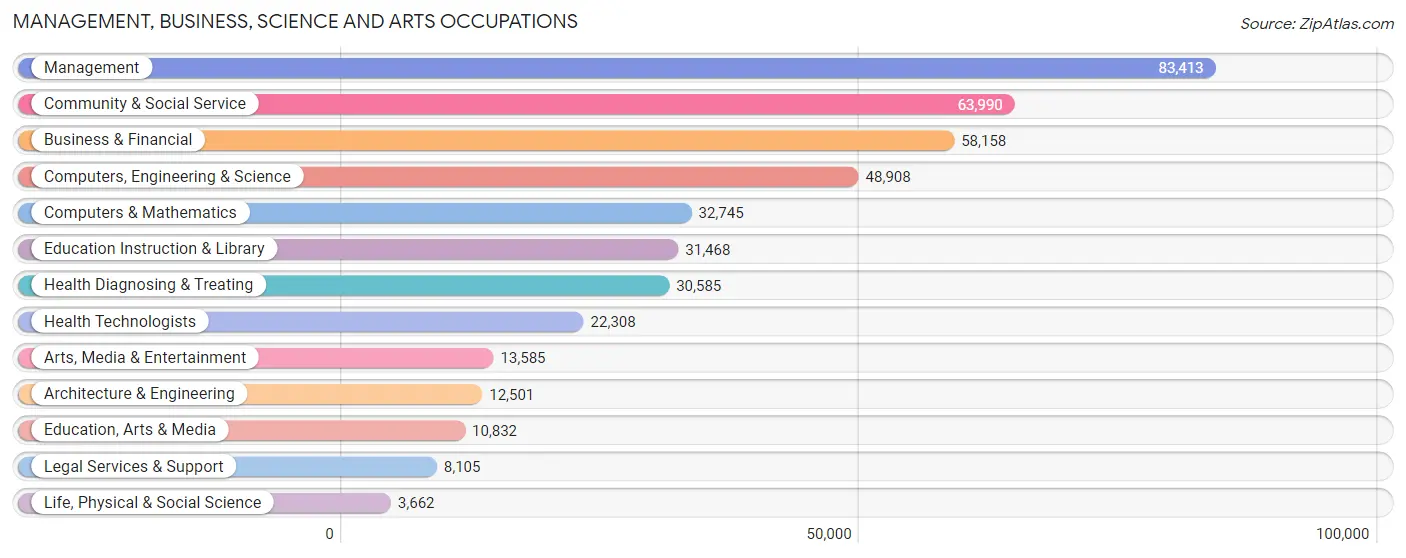
Management, Business, Science and Arts Occupations
The most common Management, Business, Science and Arts occupations in Mecklenburg County are Management (83,413 | 13.8%), Community & Social Service (63,990 | 10.6%), Business & Financial (58,158 | 9.6%), Computers, Engineering & Science (48,908 | 8.1%), and Computers & Mathematics (32,745 | 5.4%).
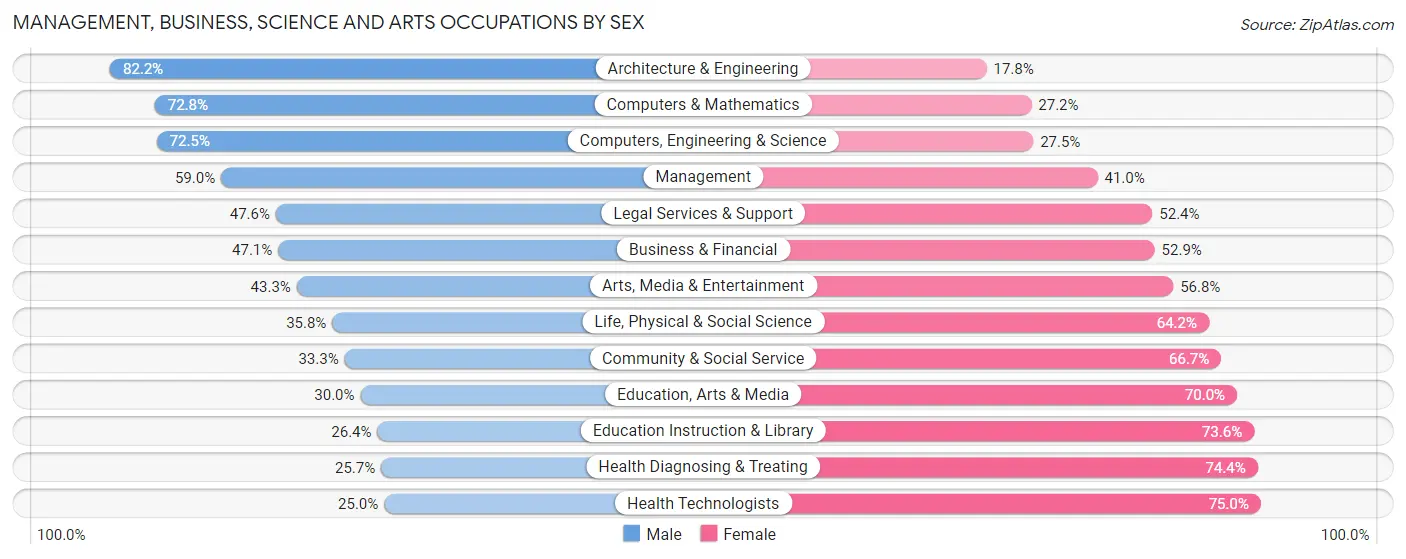
Management, Business, Science and Arts Occupations by Sex
Within the Management, Business, Science and Arts occupations in Mecklenburg County, the most male-oriented occupations are Architecture & Engineering (82.2%), Computers & Mathematics (72.8%), and Computers, Engineering & Science (72.5%), while the most female-oriented occupations are Health Technologists (75.0%), Health Diagnosing & Treating (74.4%), and Education Instruction & Library (73.6%).
| Occupation | Male | Female |
| Management | 49,239 (59.0%) | 34,174 (41.0%) |
| Business & Financial | 27,403 (47.1%) | 30,755 (52.9%) |
| Computers, Engineering & Science | 35,437 (72.5%) | 13,471 (27.5%) |
| Computers & Mathematics | 23,850 (72.8%) | 8,895 (27.2%) |
| Architecture & Engineering | 10,275 (82.2%) | 2,226 (17.8%) |
| Life, Physical & Social Science | 1,312 (35.8%) | 2,350 (64.2%) |
| Community & Social Service | 21,290 (33.3%) | 42,700 (66.7%) |
| Education, Arts & Media | 3,245 (30.0%) | 7,587 (70.0%) |
| Legal Services & Support | 3,858 (47.6%) | 4,247 (52.4%) |
| Education Instruction & Library | 8,312 (26.4%) | 23,156 (73.6%) |
| Arts, Media & Entertainment | 5,875 (43.2%) | 7,710 (56.8%) |
| Health Diagnosing & Treating | 7,845 (25.7%) | 22,740 (74.4%) |
| Health Technologists | 5,576 (25.0%) | 16,732 (75.0%) |
| Total (Category) | 141,214 (49.5%) | 143,840 (50.5%) |
| Total (Overall) | 312,161 (51.7%) | 291,625 (48.3%) |
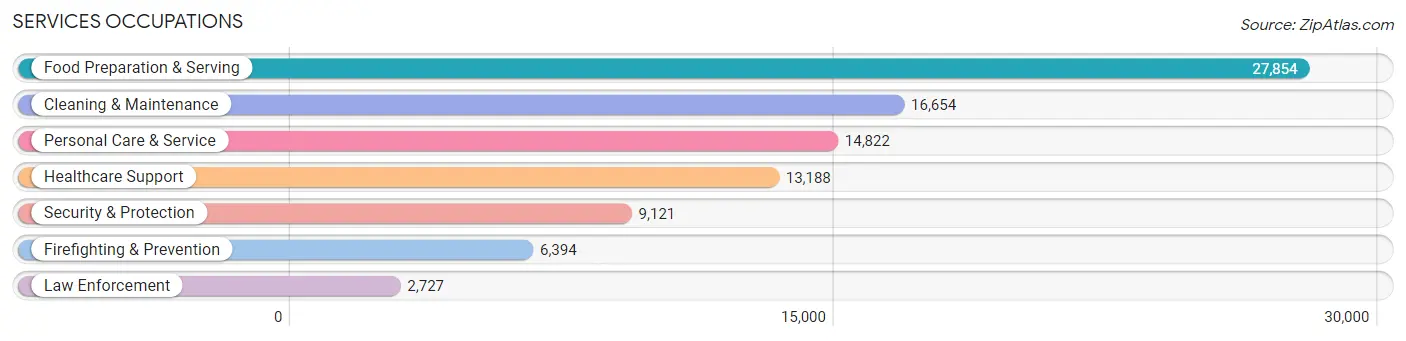
Services Occupations
The most common Services occupations in Mecklenburg County are Food Preparation & Serving (27,854 | 4.6%), Cleaning & Maintenance (16,654 | 2.8%), Personal Care & Service (14,822 | 2.5%), Healthcare Support (13,188 | 2.2%), and Security & Protection (9,121 | 1.5%).
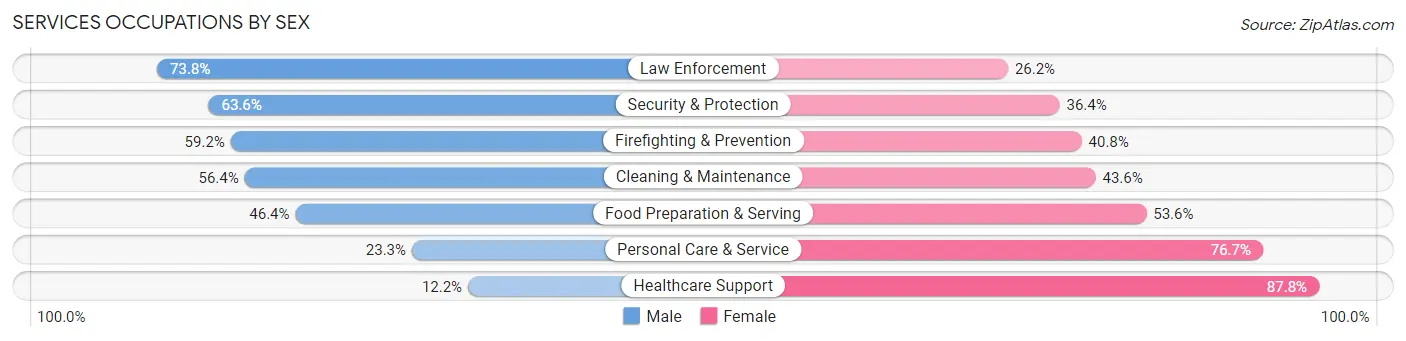
Services Occupations by Sex
Within the Services occupations in Mecklenburg County, the most male-oriented occupations are Law Enforcement (73.8%), Security & Protection (63.6%), and Firefighting & Prevention (59.2%), while the most female-oriented occupations are Healthcare Support (87.8%), Personal Care & Service (76.7%), and Food Preparation & Serving (53.6%).
| Occupation | Male | Female |
| Healthcare Support | 1,610 (12.2%) | 11,578 (87.8%) |
| Security & Protection | 5,797 (63.6%) | 3,324 (36.4%) |
| Firefighting & Prevention | 3,785 (59.2%) | 2,609 (40.8%) |
| Law Enforcement | 2,012 (73.8%) | 715 (26.2%) |
| Food Preparation & Serving | 12,918 (46.4%) | 14,936 (53.6%) |
| Cleaning & Maintenance | 9,400 (56.4%) | 7,254 (43.6%) |
| Personal Care & Service | 3,457 (23.3%) | 11,365 (76.7%) |
| Total (Category) | 33,182 (40.6%) | 48,457 (59.4%) |
| Total (Overall) | 312,161 (51.7%) | 291,625 (48.3%) |
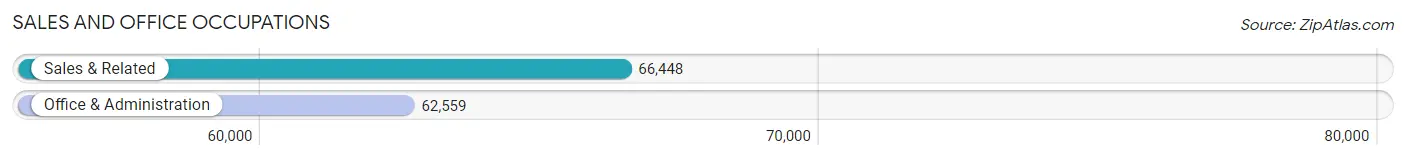
Sales and Office Occupations
The most common Sales and Office occupations in Mecklenburg County are Sales & Related (66,448 | 11.0%), and Office & Administration (62,559 | 10.4%).
Sales and Office Occupations by Sex
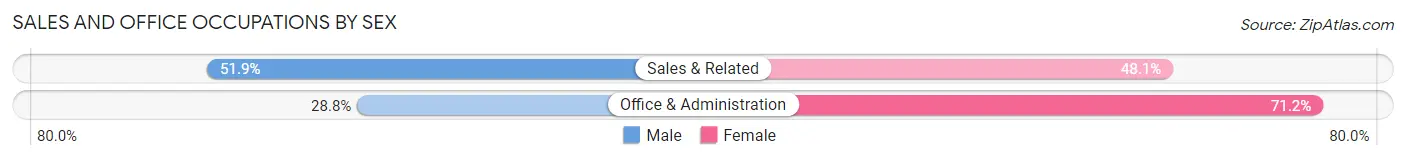
| Occupation | Male | Female |
| Sales & Related | 34,492 (51.9%) | 31,956 (48.1%) |
| Office & Administration | 18,042 (28.8%) | 44,517 (71.2%) |
| Total (Category) | 52,534 (40.7%) | 76,473 (59.3%) |
| Total (Overall) | 312,161 (51.7%) | 291,625 (48.3%) |
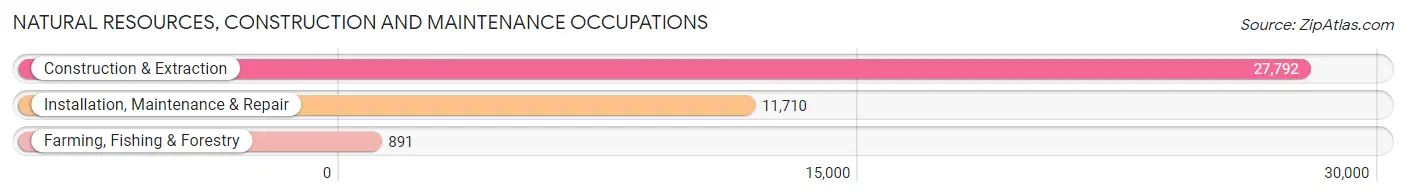
Natural Resources, Construction and Maintenance Occupations
The most common Natural Resources, Construction and Maintenance occupations in Mecklenburg County are Construction & Extraction (27,792 | 4.6%), Installation, Maintenance & Repair (11,710 | 1.9%), and Farming, Fishing & Forestry (891 | 0.2%).
Natural Resources, Construction and Maintenance Occupations by Sex
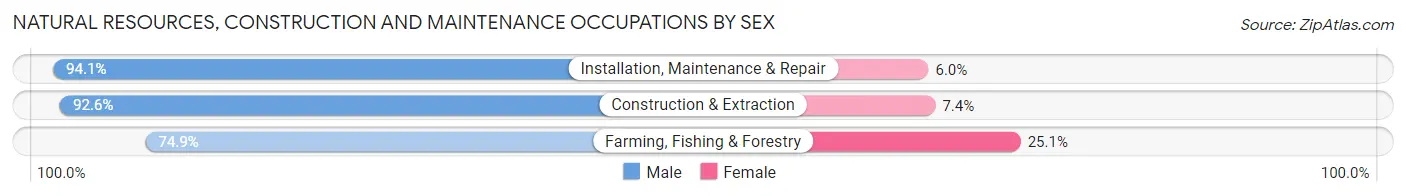
| Occupation | Male | Female |
| Farming, Fishing & Forestry | 667 (74.9%) | 224 (25.1%) |
| Construction & Extraction | 25,735 (92.6%) | 2,057 (7.4%) |
| Installation, Maintenance & Repair | 11,013 (94.1%) | 697 (5.9%) |
| Total (Category) | 37,415 (92.6%) | 2,978 (7.4%) |
| Total (Overall) | 312,161 (51.7%) | 291,625 (48.3%) |
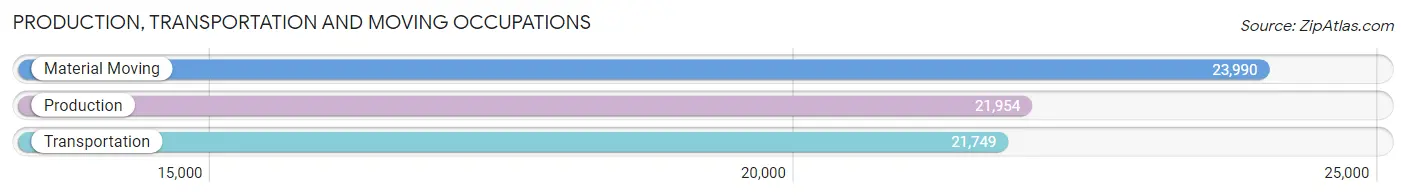
Production, Transportation and Moving Occupations
The most common Production, Transportation and Moving occupations in Mecklenburg County are Material Moving (23,990 | 4.0%), Production (21,954 | 3.6%), and Transportation (21,749 | 3.6%).
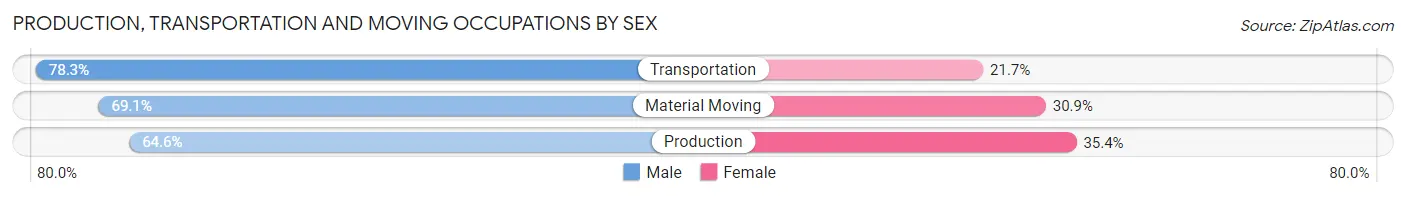
Production, Transportation and Moving Occupations by Sex
| Occupation | Male | Female |
| Production | 14,190 (64.6%) | 7,764 (35.4%) |
| Transportation | 17,039 (78.3%) | 4,710 (21.7%) |
| Material Moving | 16,587 (69.1%) | 7,403 (30.9%) |
| Total (Category) | 47,816 (70.6%) | 19,877 (29.4%) |
| Total (Overall) | 312,161 (51.7%) | 291,625 (48.3%) |
Employment Industries by Sex in Mecklenburg County
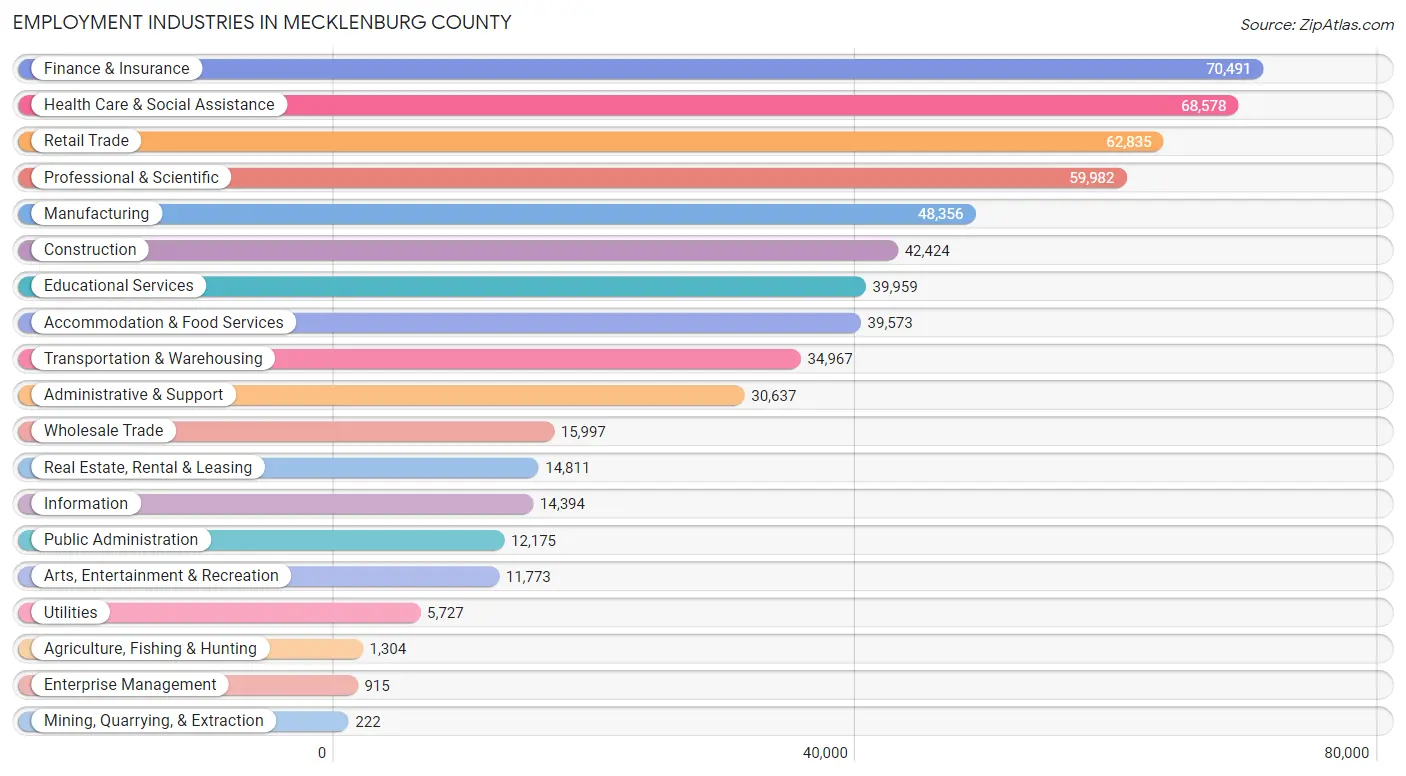
Employment Industries in Mecklenburg County
The major employment industries in Mecklenburg County include Finance & Insurance (70,491 | 11.7%), Health Care & Social Assistance (68,578 | 11.4%), Retail Trade (62,835 | 10.4%), Professional & Scientific (59,982 | 9.9%), and Manufacturing (48,356 | 8.0%).
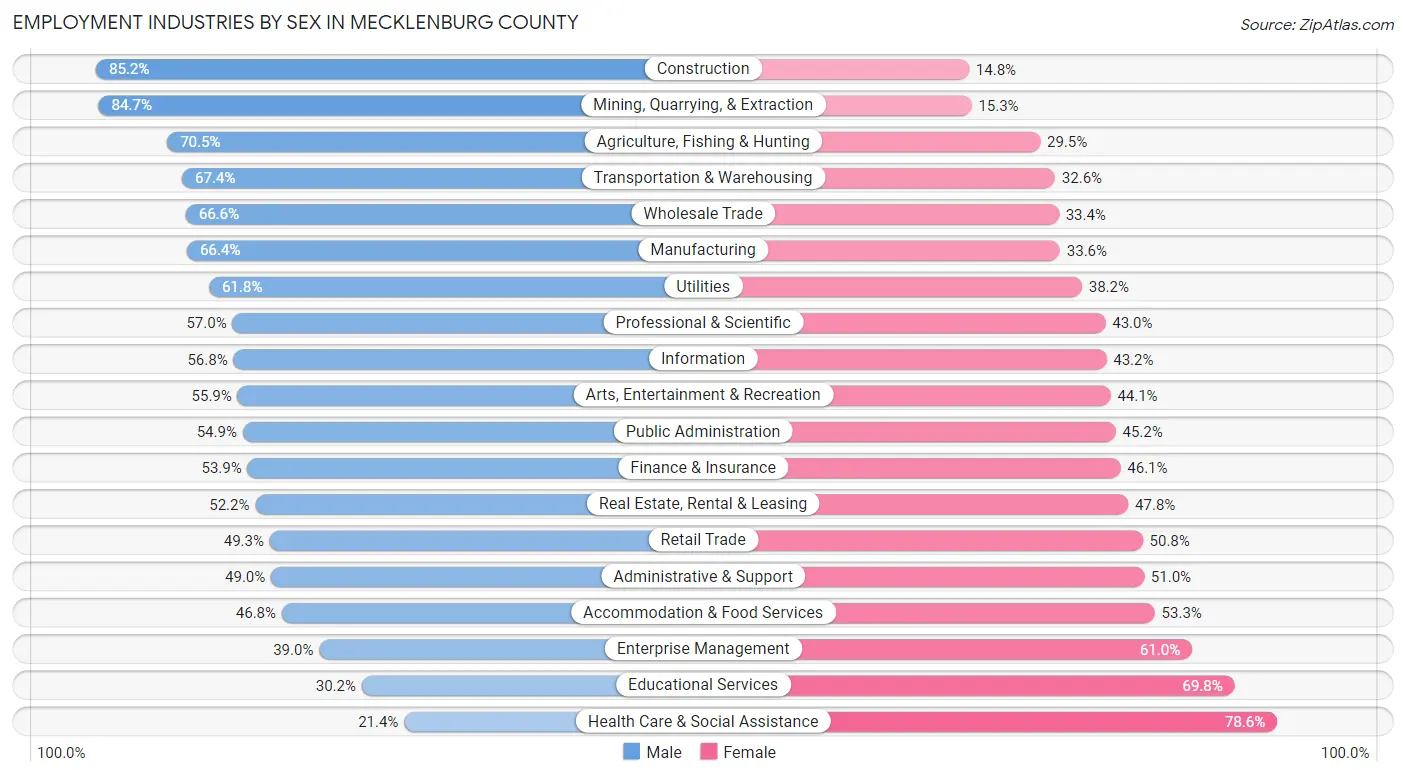
Employment Industries by Sex in Mecklenburg County
The Mecklenburg County industries that see more men than women are Construction (85.2%), Mining, Quarrying, & Extraction (84.7%), and Agriculture, Fishing & Hunting (70.5%), whereas the industries that tend to have a higher number of women are Health Care & Social Assistance (78.6%), Educational Services (69.8%), and Enterprise Management (61.0%).
| Industry | Male | Female |
| Agriculture, Fishing & Hunting | 919 (70.5%) | 385 (29.5%) |
| Mining, Quarrying, & Extraction | 188 (84.7%) | 34 (15.3%) |
| Construction | 36,146 (85.2%) | 6,278 (14.8%) |
| Manufacturing | 32,097 (66.4%) | 16,259 (33.6%) |
| Wholesale Trade | 10,658 (66.6%) | 5,339 (33.4%) |
| Retail Trade | 30,944 (49.2%) | 31,891 (50.7%) |
| Transportation & Warehousing | 23,567 (67.4%) | 11,400 (32.6%) |
| Utilities | 3,541 (61.8%) | 2,186 (38.2%) |
| Information | 8,170 (56.8%) | 6,224 (43.2%) |
| Finance & Insurance | 37,965 (53.9%) | 32,526 (46.1%) |
| Real Estate, Rental & Leasing | 7,738 (52.2%) | 7,073 (47.8%) |
| Professional & Scientific | 34,170 (57.0%) | 25,812 (43.0%) |
| Enterprise Management | 357 (39.0%) | 558 (61.0%) |
| Administrative & Support | 15,006 (49.0%) | 15,631 (51.0%) |
| Educational Services | 12,071 (30.2%) | 27,888 (69.8%) |
| Health Care & Social Assistance | 14,696 (21.4%) | 53,882 (78.6%) |
| Arts, Entertainment & Recreation | 6,582 (55.9%) | 5,191 (44.1%) |
| Accommodation & Food Services | 18,502 (46.8%) | 21,071 (53.2%) |
| Public Administration | 6,678 (54.8%) | 5,497 (45.2%) |
| Total | 312,161 (51.7%) | 291,625 (48.3%) |
Education in Mecklenburg County
School Enrollment in Mecklenburg County
The most common levels of schooling among the 270,983 students in Mecklenburg County are high school (56,578 | 20.9%), middle school (55,642 | 20.5%), and elementary school (55,223 | 20.4%).
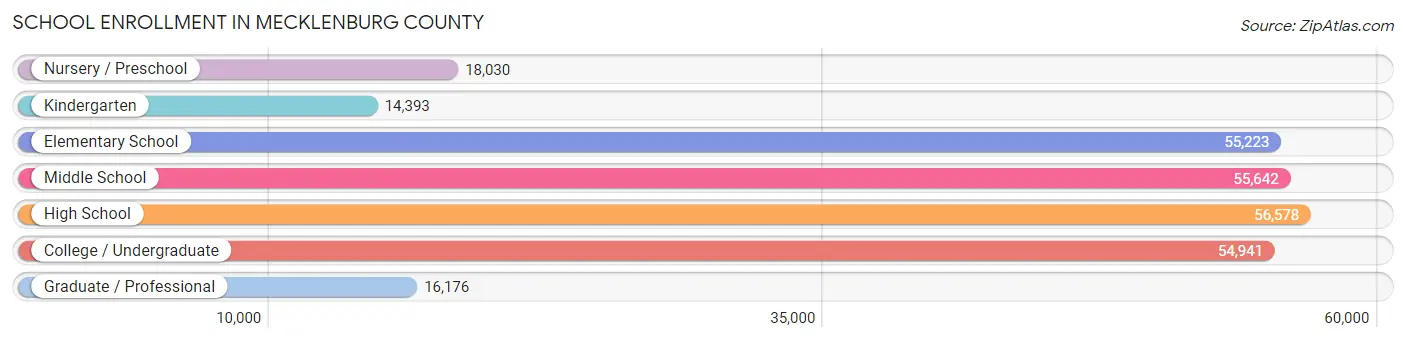
| School Level | # Students | % Students |
| Nursery / Preschool | 18,030 | 6.7% |
| Kindergarten | 14,393 | 5.3% |
| Elementary School | 55,223 | 20.4% |
| Middle School | 55,642 | 20.5% |
| High School | 56,578 | 20.9% |
| College / Undergraduate | 54,941 | 20.3% |
| Graduate / Professional | 16,176 | 6.0% |
| Total | 270,983 | 100.0% |
School Enrollment by Age by Funding Source in Mecklenburg County
Out of a total of 270,983 students who are enrolled in schools in Mecklenburg County, 48,777 (18.0%) attend a private institution, while the remaining 222,206 (82.0%) are enrolled in public schools. The age group of 3 to 4 year olds has the highest likelihood of being enrolled in private schools, with 7,926 (57.4% in the age bracket) enrolled. Conversely, the age group of 15 to 17 year olds has the lowest likelihood of being enrolled in a private school, with 36,436 (87.8% in the age bracket) attending a public institution.
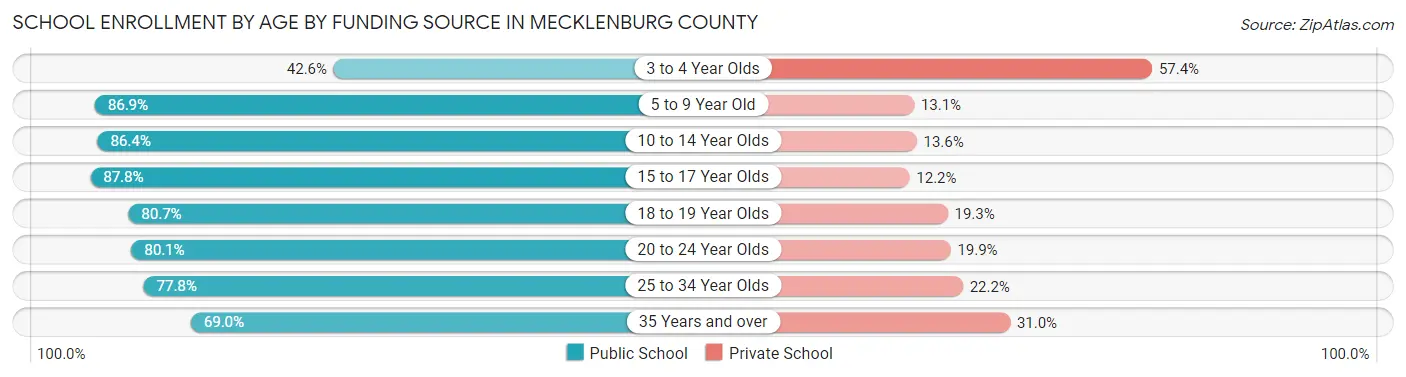
| Age Bracket | Public School | Private School |
| 3 to 4 Year Olds | 5,878 (42.6%) | 7,926 (57.4%) |
| 5 to 9 Year Old | 58,277 (86.9%) | 8,776 (13.1%) |
| 10 to 14 Year Olds | 59,967 (86.4%) | 9,421 (13.6%) |
| 15 to 17 Year Olds | 36,436 (87.8%) | 5,080 (12.2%) |
| 18 to 19 Year Olds | 16,443 (80.7%) | 3,943 (19.3%) |
| 20 to 24 Year Olds | 21,937 (80.1%) | 5,446 (19.9%) |
| 25 to 34 Year Olds | 12,986 (77.8%) | 3,699 (22.2%) |
| 35 Years and over | 10,195 (69.0%) | 4,573 (31.0%) |
| Total | 222,206 (82.0%) | 48,777 (18.0%) |
Educational Attainment by Field of Study in Mecklenburg County
Business (101,855 | 26.4%), social sciences (33,280 | 8.6%), education (29,872 | 7.7%), science & technology (29,532 | 7.6%), and engineering (29,129 | 7.5%) are the most common fields of study among 386,451 individuals in Mecklenburg County who have obtained a bachelor's degree or higher.
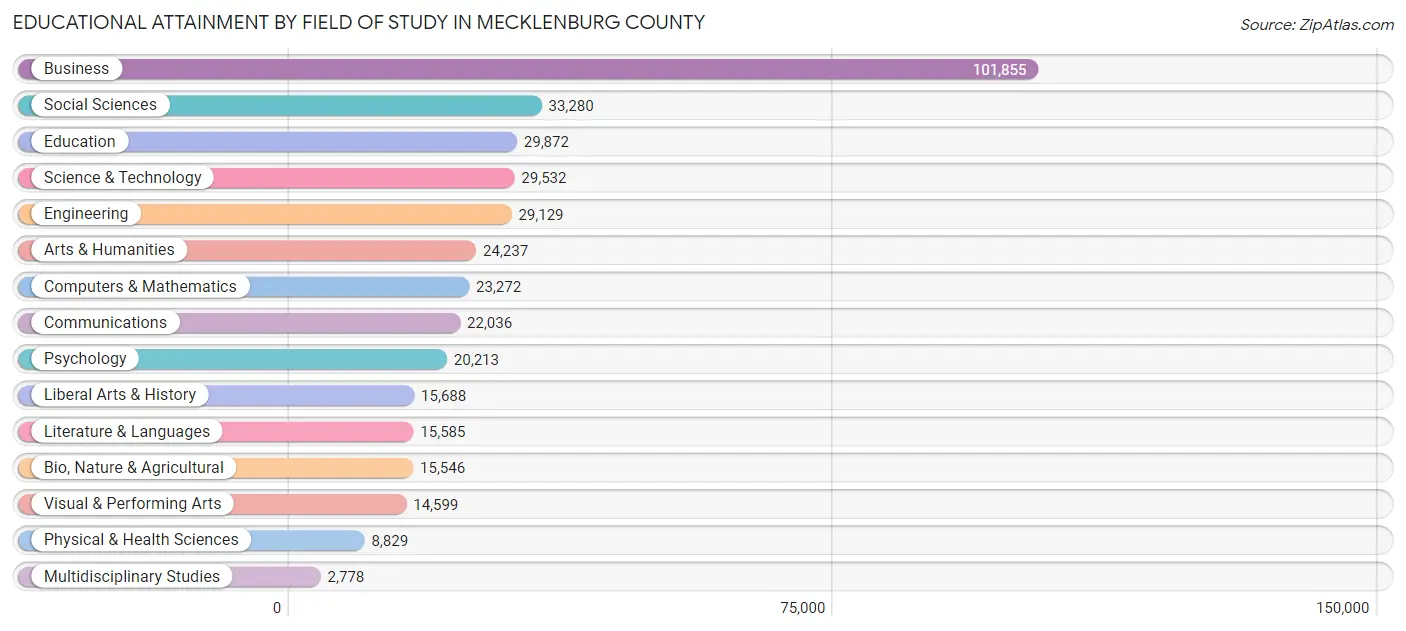
| Field of Study | # Graduates | % Graduates |
| Computers & Mathematics | 23,272 | 6.0% |
| Bio, Nature & Agricultural | 15,546 | 4.0% |
| Physical & Health Sciences | 8,829 | 2.3% |
| Psychology | 20,213 | 5.2% |
| Social Sciences | 33,280 | 8.6% |
| Engineering | 29,129 | 7.5% |
| Multidisciplinary Studies | 2,778 | 0.7% |
| Science & Technology | 29,532 | 7.6% |
| Business | 101,855 | 26.4% |
| Education | 29,872 | 7.7% |
| Literature & Languages | 15,585 | 4.0% |
| Liberal Arts & History | 15,688 | 4.1% |
| Visual & Performing Arts | 14,599 | 3.8% |
| Communications | 22,036 | 5.7% |
| Arts & Humanities | 24,237 | 6.3% |
| Total | 386,451 | 100.0% |
Transportation & Commute in Mecklenburg County
Vehicle Availability by Sex in Mecklenburg County
The most prevalent vehicle ownership categories in Mecklenburg County are males with 2 vehicles (138,404, accounting for 45.3%) and females with 2 vehicles (117,738, making up 49.1%).
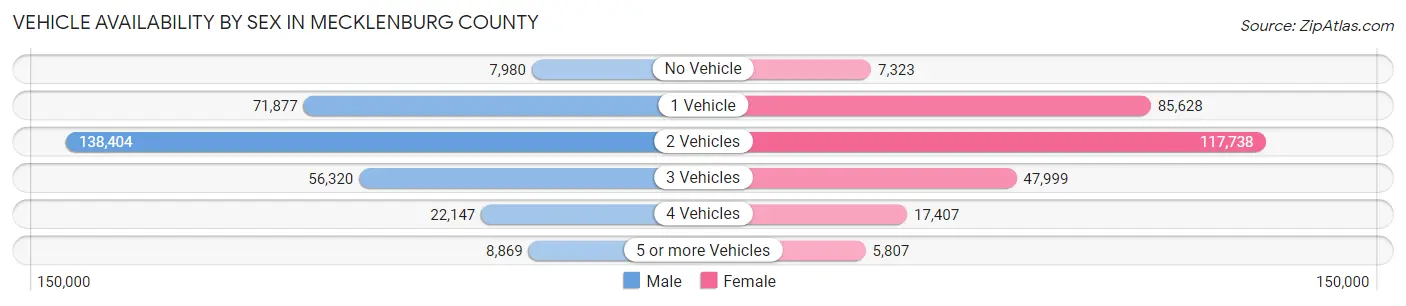
| Vehicles Available | Male | Female |
| No Vehicle | 7,980 (2.6%) | 7,323 (2.6%) |
| 1 Vehicle | 71,877 (23.5%) | 85,628 (30.4%) |
| 2 Vehicles | 138,404 (45.3%) | 117,738 (41.8%) |
| 3 Vehicles | 56,320 (18.4%) | 47,999 (17.0%) |
| 4 Vehicles | 22,147 (7.2%) | 17,407 (6.2%) |
| 5 or more Vehicles | 8,869 (2.9%) | 5,807 (2.1%) |
| Total | 305,597 (100.0%) | 281,902 (100.0%) |
Commute Time in Mecklenburg County
The most frequently occuring commute durations in Mecklenburg County are 20 to 24 minutes (79,831 commuters, 17.2%), 30 to 34 minutes (76,581 commuters, 16.5%), and 15 to 19 minutes (75,478 commuters, 16.3%).
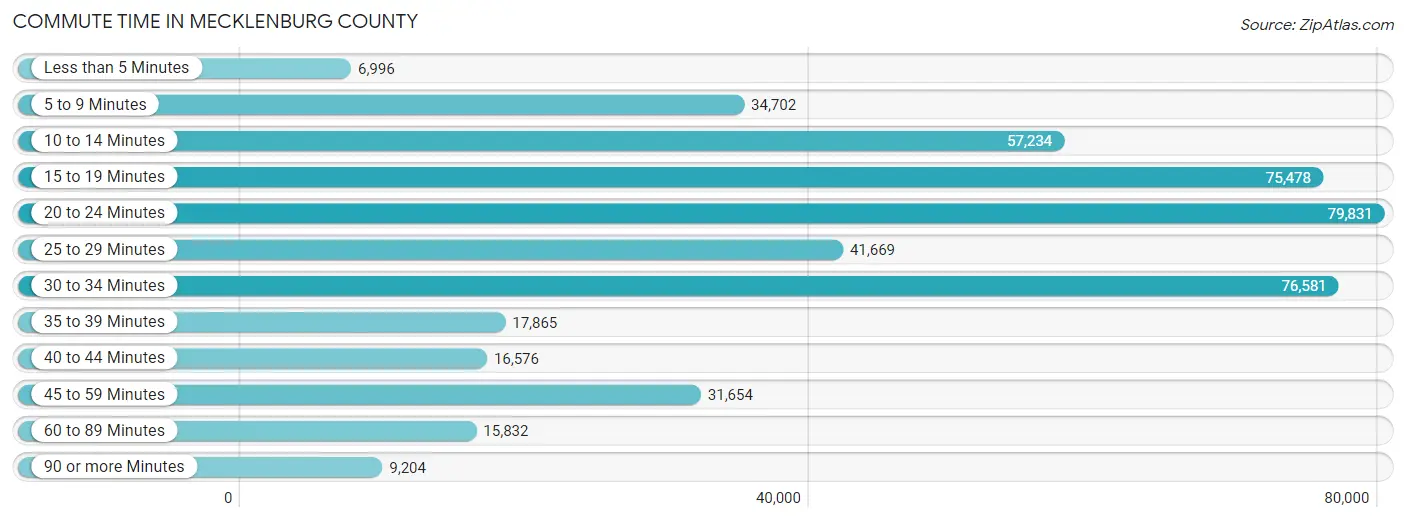
| Commute Time | # Commuters | % Commuters |
| Less than 5 Minutes | 6,996 | 1.5% |
| 5 to 9 Minutes | 34,702 | 7.5% |
| 10 to 14 Minutes | 57,234 | 12.3% |
| 15 to 19 Minutes | 75,478 | 16.3% |
| 20 to 24 Minutes | 79,831 | 17.2% |
| 25 to 29 Minutes | 41,669 | 9.0% |
| 30 to 34 Minutes | 76,581 | 16.5% |
| 35 to 39 Minutes | 17,865 | 3.8% |
| 40 to 44 Minutes | 16,576 | 3.6% |
| 45 to 59 Minutes | 31,654 | 6.8% |
| 60 to 89 Minutes | 15,832 | 3.4% |
| 90 or more Minutes | 9,204 | 2.0% |
Commute Time by Sex in Mecklenburg County
The most common commute times in Mecklenburg County are 30 to 34 minutes (42,019 commuters, 17.4%) for males and 20 to 24 minutes (38,505 commuters, 17.4%) for females.
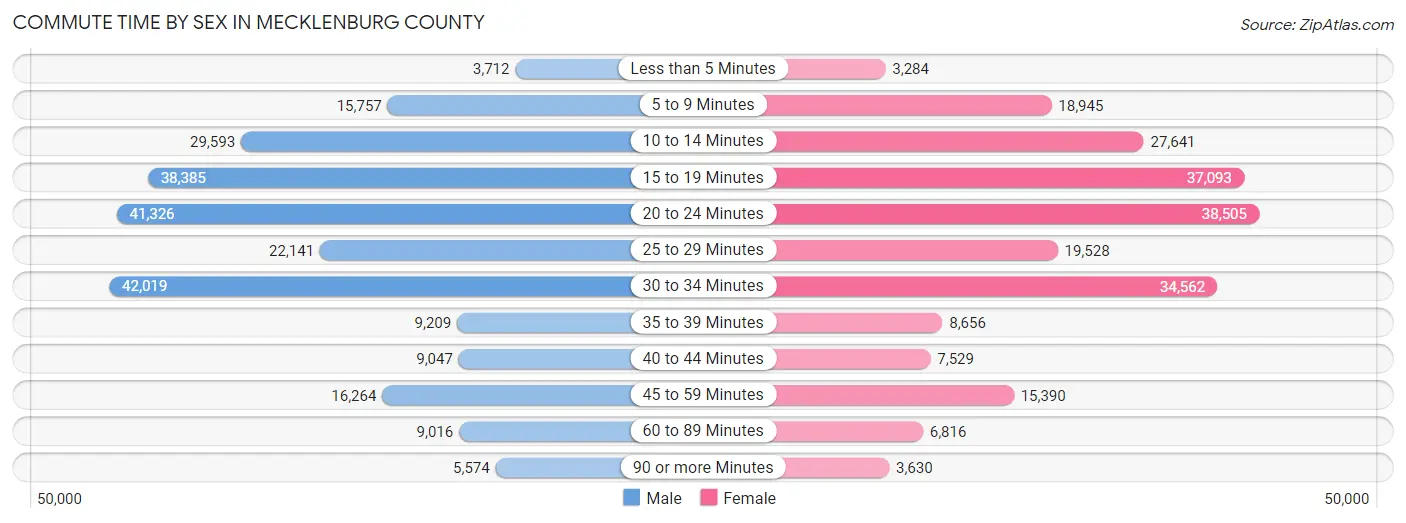
| Commute Time | Male | Female |
| Less than 5 Minutes | 3,712 (1.5%) | 3,284 (1.5%) |
| 5 to 9 Minutes | 15,757 (6.5%) | 18,945 (8.6%) |
| 10 to 14 Minutes | 29,593 (12.2%) | 27,641 (12.5%) |
| 15 to 19 Minutes | 38,385 (15.9%) | 37,093 (16.7%) |
| 20 to 24 Minutes | 41,326 (17.1%) | 38,505 (17.4%) |
| 25 to 29 Minutes | 22,141 (9.1%) | 19,528 (8.8%) |
| 30 to 34 Minutes | 42,019 (17.4%) | 34,562 (15.6%) |
| 35 to 39 Minutes | 9,209 (3.8%) | 8,656 (3.9%) |
| 40 to 44 Minutes | 9,047 (3.7%) | 7,529 (3.4%) |
| 45 to 59 Minutes | 16,264 (6.7%) | 15,390 (7.0%) |
| 60 to 89 Minutes | 9,016 (3.7%) | 6,816 (3.1%) |
| 90 or more Minutes | 5,574 (2.3%) | 3,630 (1.6%) |
Time of Departure to Work by Sex in Mecklenburg County
The most frequent times of departure to work in Mecklenburg County are 7:00 AM to 7:29 AM (36,311, 15.0%) for males and 7:00 AM to 7:29 AM (31,968, 14.4%) for females.
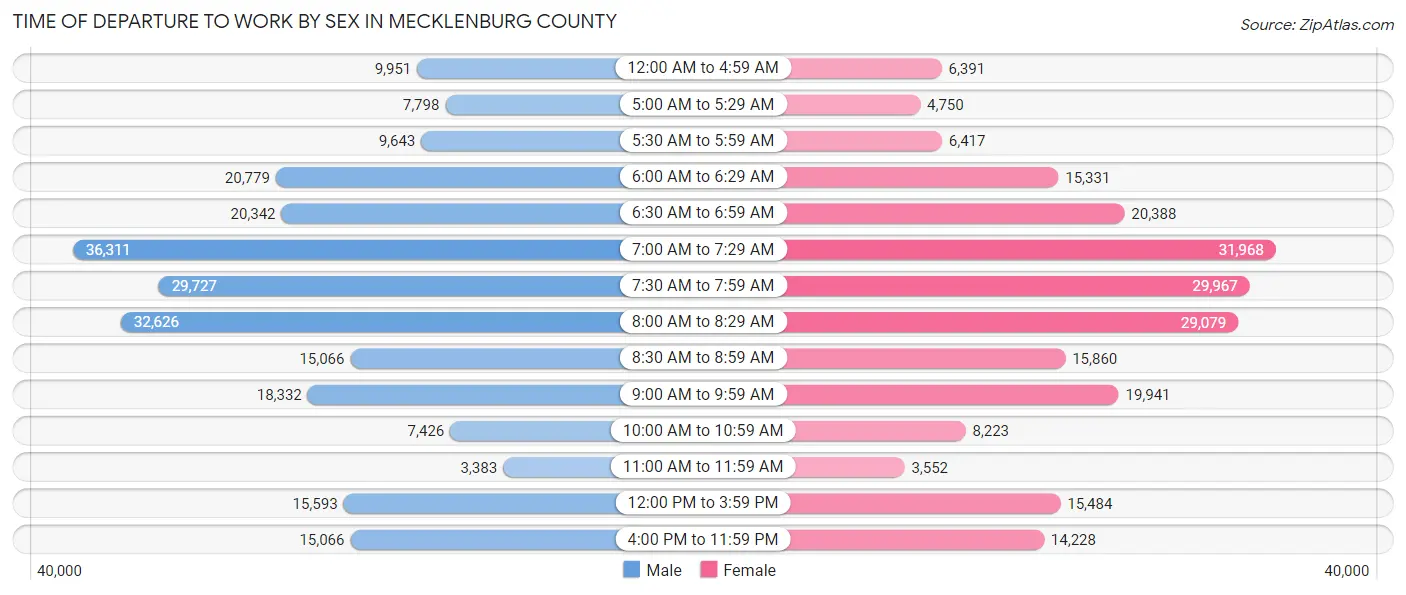
| Time of Departure | Male | Female |
| 12:00 AM to 4:59 AM | 9,951 (4.1%) | 6,391 (2.9%) |
| 5:00 AM to 5:29 AM | 7,798 (3.2%) | 4,750 (2.1%) |
| 5:30 AM to 5:59 AM | 9,643 (4.0%) | 6,417 (2.9%) |
| 6:00 AM to 6:29 AM | 20,779 (8.6%) | 15,331 (6.9%) |
| 6:30 AM to 6:59 AM | 20,342 (8.4%) | 20,388 (9.2%) |
| 7:00 AM to 7:29 AM | 36,311 (15.0%) | 31,968 (14.4%) |
| 7:30 AM to 7:59 AM | 29,727 (12.3%) | 29,967 (13.5%) |
| 8:00 AM to 8:29 AM | 32,626 (13.5%) | 29,079 (13.1%) |
| 8:30 AM to 8:59 AM | 15,066 (6.2%) | 15,860 (7.2%) |
| 9:00 AM to 9:59 AM | 18,332 (7.6%) | 19,941 (9.0%) |
| 10:00 AM to 10:59 AM | 7,426 (3.1%) | 8,223 (3.7%) |
| 11:00 AM to 11:59 AM | 3,383 (1.4%) | 3,552 (1.6%) |
| 12:00 PM to 3:59 PM | 15,593 (6.4%) | 15,484 (7.0%) |
| 4:00 PM to 11:59 PM | 15,066 (6.2%) | 14,228 (6.4%) |
| Total | 242,043 (100.0%) | 221,579 (100.0%) |
Housing Occupancy in Mecklenburg County
Occupancy by Ownership in Mecklenburg County
Of the total 446,584 dwellings in Mecklenburg County, owner-occupied units account for 249,519 (55.9%), while renter-occupied units make up 197,065 (44.1%).
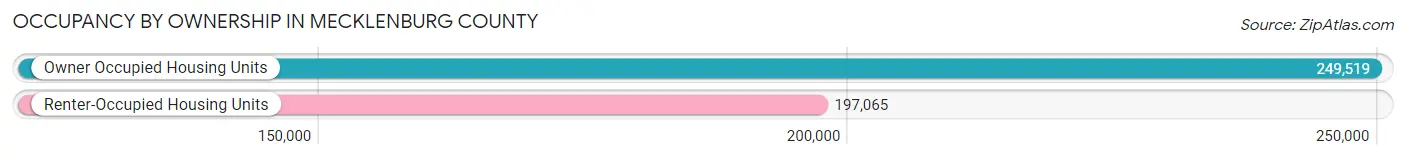
| Occupancy | # Housing Units | % Housing Units |
| Owner Occupied Housing Units | 249,519 | 55.9% |
| Renter-Occupied Housing Units | 197,065 | 44.1% |
| Total Occupied Housing Units | 446,584 | 100.0% |
Occupancy by Household Size in Mecklenburg County
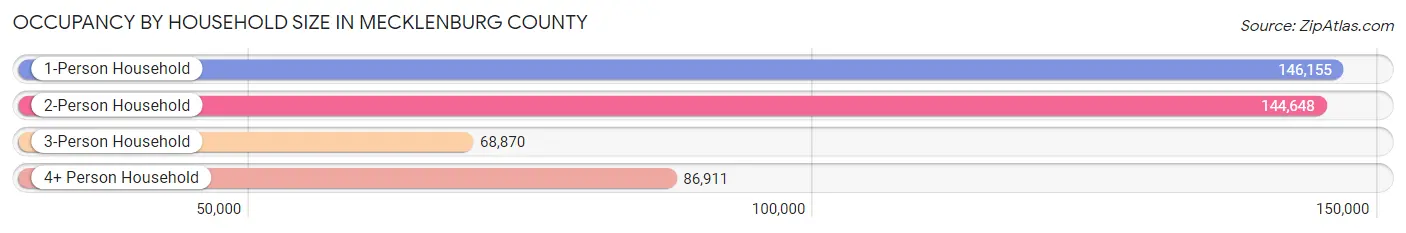
| Household Size | # Housing Units | % Housing Units |
| 1-Person Household | 146,155 | 32.7% |
| 2-Person Household | 144,648 | 32.4% |
| 3-Person Household | 68,870 | 15.4% |
| 4+ Person Household | 86,911 | 19.5% |
| Total Housing Units | 446,584 | 100.0% |
Occupancy by Ownership by Household Size in Mecklenburg County
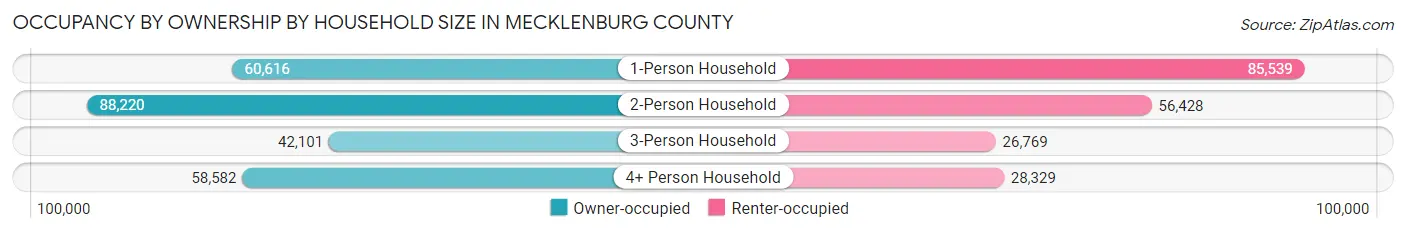
| Household Size | Owner-occupied | Renter-occupied |
| 1-Person Household | 60,616 (41.5%) | 85,539 (58.5%) |
| 2-Person Household | 88,220 (61.0%) | 56,428 (39.0%) |
| 3-Person Household | 42,101 (61.1%) | 26,769 (38.9%) |
| 4+ Person Household | 58,582 (67.4%) | 28,329 (32.6%) |
| Total Housing Units | 249,519 (55.9%) | 197,065 (44.1%) |
Occupancy by Educational Attainment in Mecklenburg County
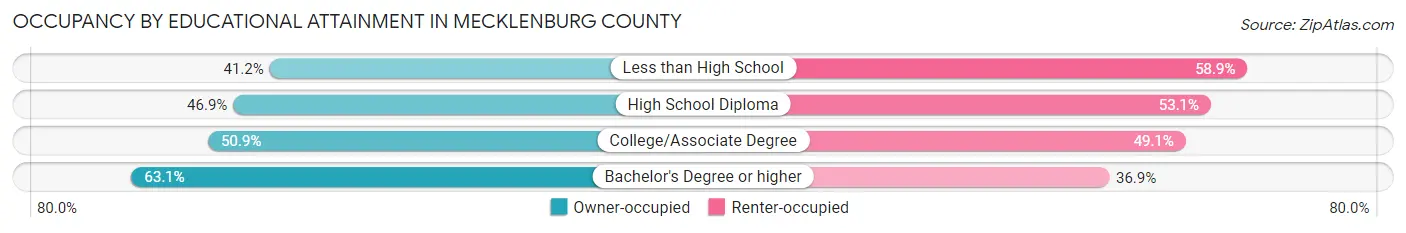
| Household Size | Owner-occupied | Renter-occupied |
| Less than High School | 13,032 (41.1%) | 18,634 (58.9%) |
| High School Diploma | 28,472 (46.9%) | 32,210 (53.1%) |
| College/Associate Degree | 64,367 (50.9%) | 62,066 (49.1%) |
| Bachelor's Degree or higher | 143,648 (63.1%) | 84,155 (36.9%) |
Occupancy by Age of Householder in Mecklenburg County
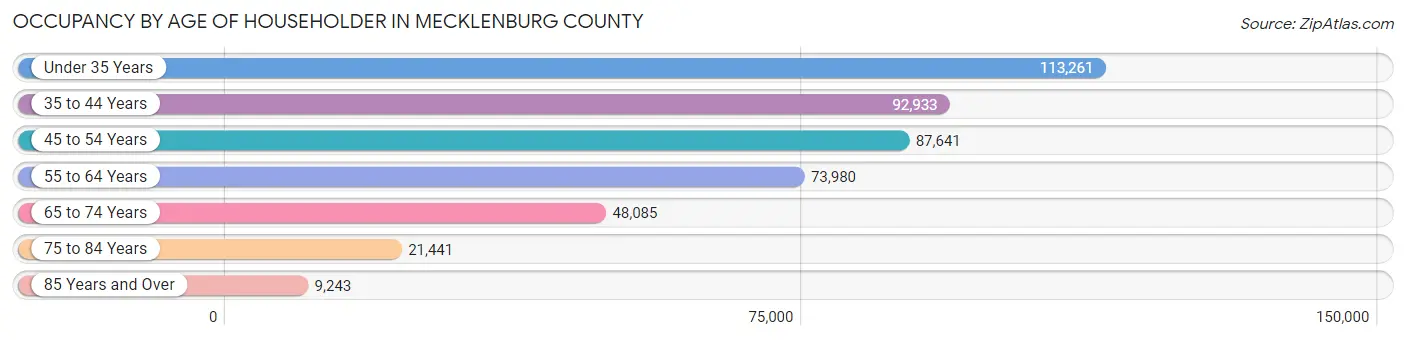
| Age Bracket | # Households | % Households |
| Under 35 Years | 113,261 | 25.4% |
| 35 to 44 Years | 92,933 | 20.8% |
| 45 to 54 Years | 87,641 | 19.6% |
| 55 to 64 Years | 73,980 | 16.6% |
| 65 to 74 Years | 48,085 | 10.8% |
| 75 to 84 Years | 21,441 | 4.8% |
| 85 Years and Over | 9,243 | 2.1% |
| Total | 446,584 | 100.0% |
Housing Finances in Mecklenburg County
Median Income by Occupancy in Mecklenburg County
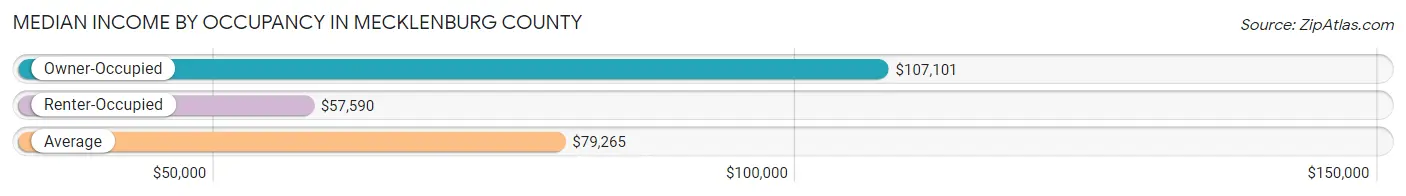
| Occupancy Type | # Households | Median Income |
| Owner-Occupied | 249,519 (55.9%) | $107,101 |
| Renter-Occupied | 197,065 (44.1%) | $57,590 |
| Average | 446,584 (100.0%) | $79,265 |
Occupancy by Householder Income Bracket in Mecklenburg County
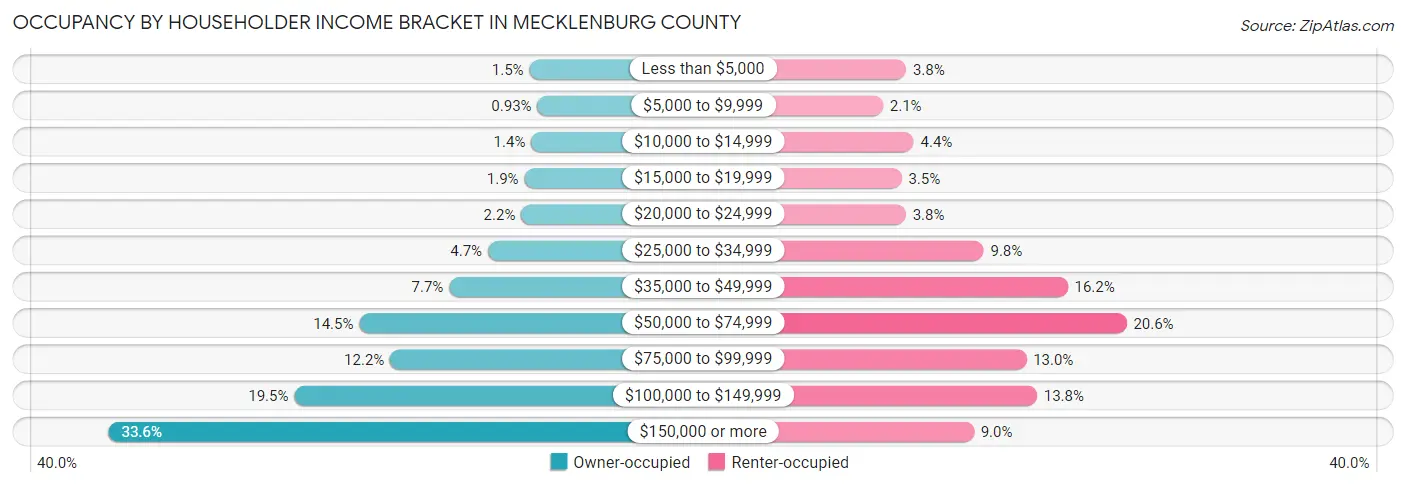
| Income Bracket | Owner-occupied | Renter-occupied |
| Less than $5,000 | 3,851 (1.5%) | 7,564 (3.8%) |
| $5,000 to $9,999 | 2,324 (0.9%) | 4,093 (2.1%) |
| $10,000 to $14,999 | 3,488 (1.4%) | 8,719 (4.4%) |
| $15,000 to $19,999 | 4,789 (1.9%) | 6,890 (3.5%) |
| $20,000 to $24,999 | 5,396 (2.2%) | 7,534 (3.8%) |
| $25,000 to $34,999 | 11,731 (4.7%) | 19,205 (9.8%) |
| $35,000 to $49,999 | 19,094 (7.6%) | 31,824 (16.2%) |
| $50,000 to $74,999 | 36,174 (14.5%) | 40,673 (20.6%) |
| $75,000 to $99,999 | 30,309 (12.1%) | 25,609 (13.0%) |
| $100,000 to $149,999 | 48,527 (19.5%) | 27,217 (13.8%) |
| $150,000 or more | 83,836 (33.6%) | 17,737 (9.0%) |
| Total | 249,519 (100.0%) | 197,065 (100.0%) |
Monthly Housing Cost Tiers in Mecklenburg County
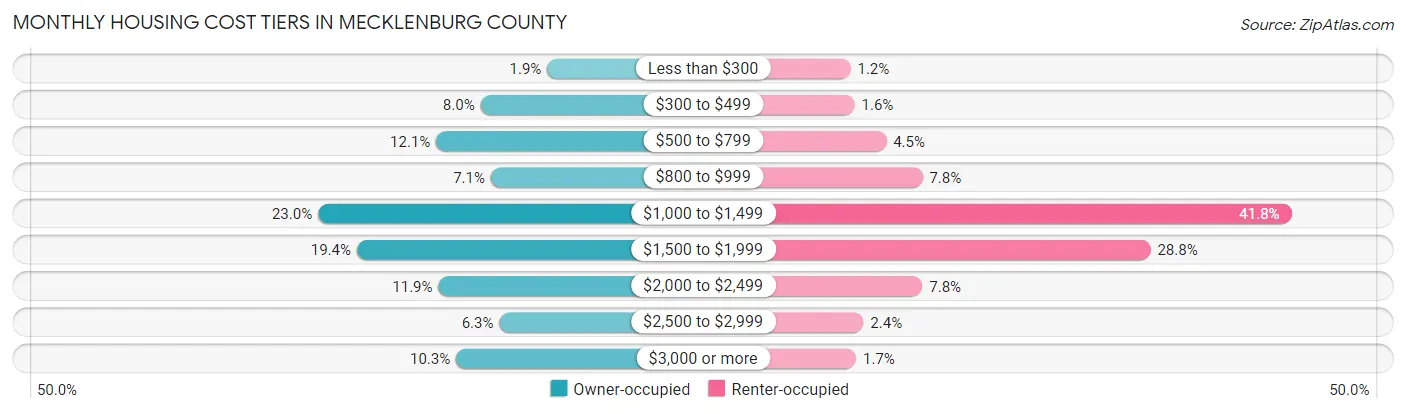
| Monthly Cost | Owner-occupied | Renter-occupied |
| Less than $300 | 4,708 (1.9%) | 2,394 (1.2%) |
| $300 to $499 | 20,048 (8.0%) | 3,110 (1.6%) |
| $500 to $799 | 30,217 (12.1%) | 8,850 (4.5%) |
| $800 to $999 | 17,657 (7.1%) | 15,435 (7.8%) |
| $1,000 to $1,499 | 57,361 (23.0%) | 82,355 (41.8%) |
| $1,500 to $1,999 | 48,448 (19.4%) | 56,792 (28.8%) |
| $2,000 to $2,499 | 29,709 (11.9%) | 15,402 (7.8%) |
| $2,500 to $2,999 | 15,717 (6.3%) | 4,715 (2.4%) |
| $3,000 or more | 25,654 (10.3%) | 3,395 (1.7%) |
| Total | 249,519 (100.0%) | 197,065 (100.0%) |
Physical Housing Characteristics in Mecklenburg County
Housing Structures in Mecklenburg County
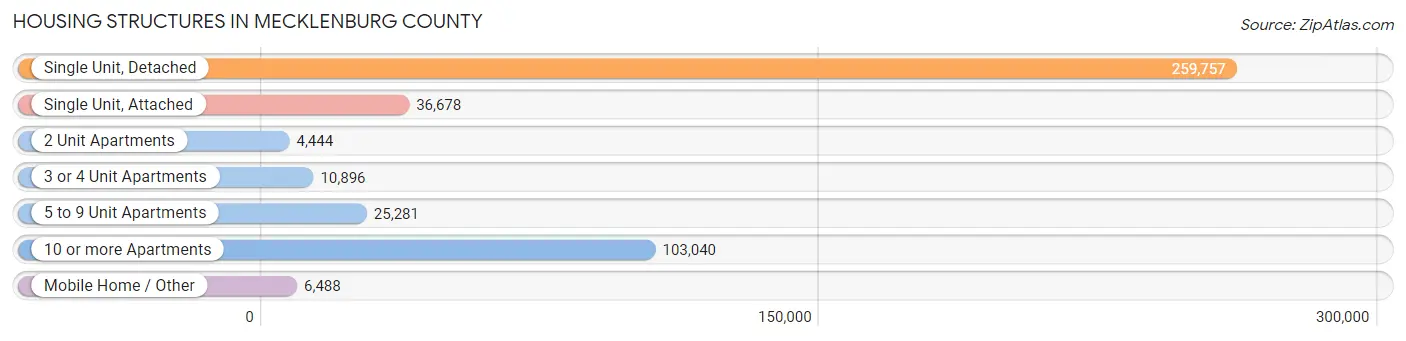
| Structure Type | # Housing Units | % Housing Units |
| Single Unit, Detached | 259,757 | 58.2% |
| Single Unit, Attached | 36,678 | 8.2% |
| 2 Unit Apartments | 4,444 | 1.0% |
| 3 or 4 Unit Apartments | 10,896 | 2.4% |
| 5 to 9 Unit Apartments | 25,281 | 5.7% |
| 10 or more Apartments | 103,040 | 23.1% |
| Mobile Home / Other | 6,488 | 1.5% |
| Total | 446,584 | 100.0% |
Housing Structures by Occupancy in Mecklenburg County
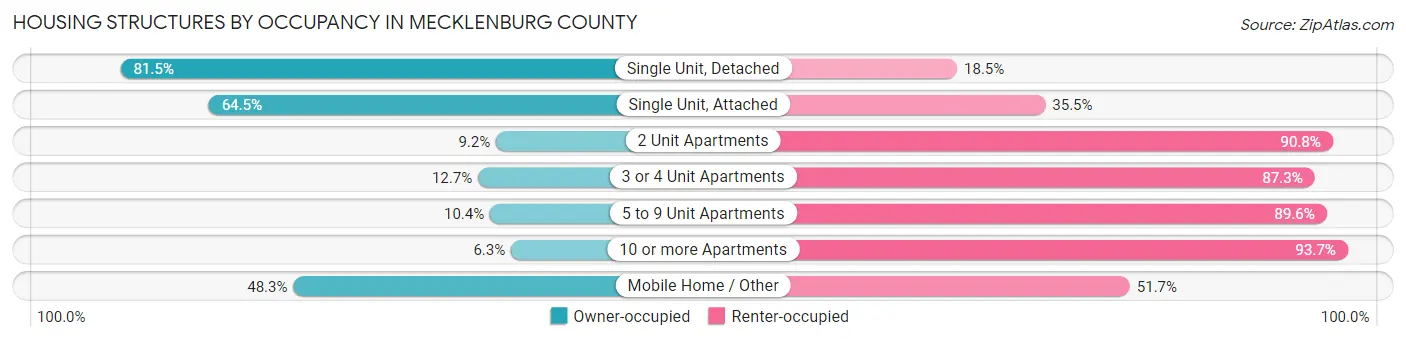
| Structure Type | Owner-occupied | Renter-occupied |
| Single Unit, Detached | 211,767 (81.5%) | 47,990 (18.5%) |
| Single Unit, Attached | 23,671 (64.5%) | 13,007 (35.5%) |
| 2 Unit Apartments | 410 (9.2%) | 4,034 (90.8%) |
| 3 or 4 Unit Apartments | 1,385 (12.7%) | 9,511 (87.3%) |
| 5 to 9 Unit Apartments | 2,626 (10.4%) | 22,655 (89.6%) |
| 10 or more Apartments | 6,528 (6.3%) | 96,512 (93.7%) |
| Mobile Home / Other | 3,132 (48.3%) | 3,356 (51.7%) |
| Total | 249,519 (55.9%) | 197,065 (44.1%) |
Housing Structures by Number of Rooms in Mecklenburg County
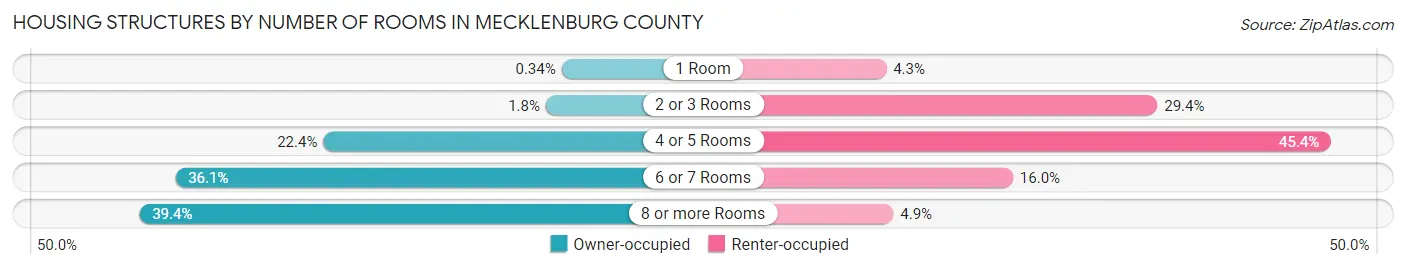
| Number of Rooms | Owner-occupied | Renter-occupied |
| 1 Room | 860 (0.3%) | 8,435 (4.3%) |
| 2 or 3 Rooms | 4,490 (1.8%) | 57,830 (29.3%) |
| 4 or 5 Rooms | 55,847 (22.4%) | 89,530 (45.4%) |
| 6 or 7 Rooms | 90,011 (36.1%) | 31,526 (16.0%) |
| 8 or more Rooms | 98,311 (39.4%) | 9,744 (4.9%) |
| Total | 249,519 (100.0%) | 197,065 (100.0%) |
Housing Structure by Heating Type in Mecklenburg County
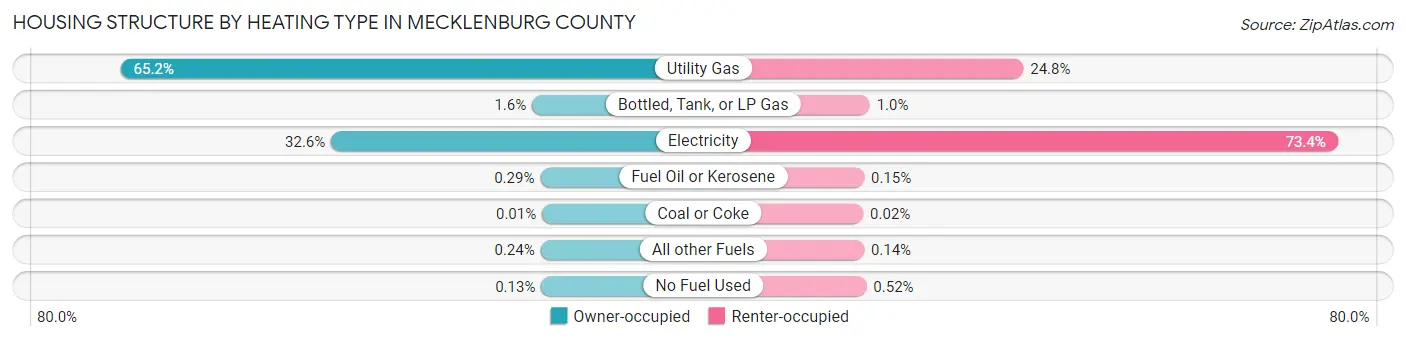
| Heating Type | Owner-occupied | Renter-occupied |
| Utility Gas | 162,574 (65.1%) | 48,814 (24.8%) |
| Bottled, Tank, or LP Gas | 3,873 (1.5%) | 2,035 (1.0%) |
| Electricity | 81,389 (32.6%) | 144,591 (73.4%) |
| Fuel Oil or Kerosene | 731 (0.3%) | 288 (0.2%) |
| Coal or Coke | 22 (0.0%) | 49 (0.0%) |
| All other Fuels | 607 (0.2%) | 271 (0.1%) |
| No Fuel Used | 323 (0.1%) | 1,017 (0.5%) |
| Total | 249,519 (100.0%) | 197,065 (100.0%) |
Household Vehicle Usage in Mecklenburg County
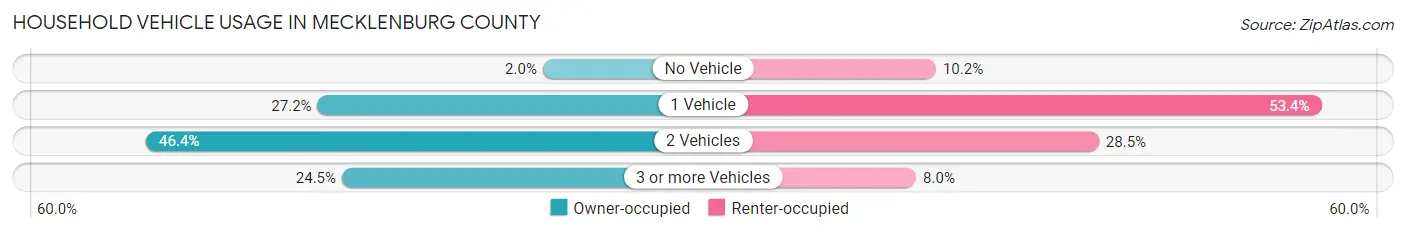
| Vehicles per Household | Owner-occupied | Renter-occupied |
| No Vehicle | 4,883 (2.0%) | 20,106 (10.2%) |
| 1 Vehicle | 67,874 (27.2%) | 105,154 (53.4%) |
| 2 Vehicles | 115,730 (46.4%) | 56,071 (28.4%) |
| 3 or more Vehicles | 61,032 (24.5%) | 15,734 (8.0%) |
| Total | 249,519 (100.0%) | 197,065 (100.0%) |
Real Estate & Mortgages in Mecklenburg County
Real Estate and Mortgage Overview in Mecklenburg County
| Characteristic | Without Mortgage | With Mortgage |
| Housing Units | 62,390 | 187,129 |
| Median Property Value | $319,800 | $338,900 |
| Median Household Income | $74,852 | $68,954 |
| Monthly Housing Costs | $574 | $25,120 |
| Real Estate Taxes | $2,617 | $2,456 |
Property Value by Mortgage Status in Mecklenburg County
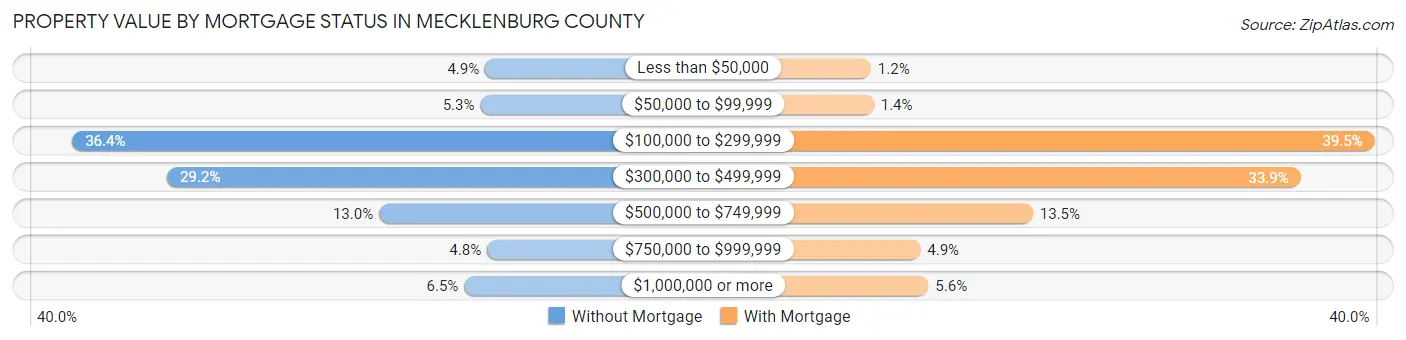
| Property Value | Without Mortgage | With Mortgage |
| Less than $50,000 | 3,071 (4.9%) | 2,196 (1.2%) |
| $50,000 to $99,999 | 3,296 (5.3%) | 2,602 (1.4%) |
| $100,000 to $299,999 | 22,692 (36.4%) | 73,997 (39.5%) |
| $300,000 to $499,999 | 18,185 (29.1%) | 63,428 (33.9%) |
| $500,000 to $749,999 | 8,113 (13.0%) | 25,277 (13.5%) |
| $750,000 to $999,999 | 2,974 (4.8%) | 9,242 (4.9%) |
| $1,000,000 or more | 4,059 (6.5%) | 10,387 (5.6%) |
| Total | 62,390 (100.0%) | 187,129 (100.0%) |
Household Income by Mortgage Status in Mecklenburg County
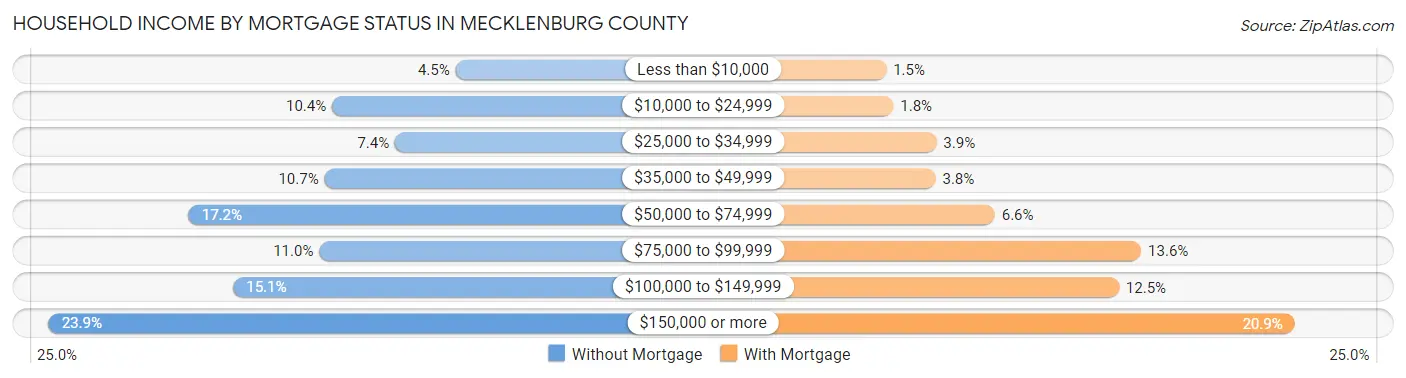
| Household Income | Without Mortgage | With Mortgage |
| Less than $10,000 | 2,798 (4.5%) | 2,729 (1.5%) |
| $10,000 to $24,999 | 6,463 (10.4%) | 3,377 (1.8%) |
| $25,000 to $34,999 | 4,593 (7.4%) | 7,210 (3.8%) |
| $35,000 to $49,999 | 6,690 (10.7%) | 7,138 (3.8%) |
| $50,000 to $74,999 | 10,720 (17.2%) | 12,404 (6.6%) |
| $75,000 to $99,999 | 6,846 (11.0%) | 25,454 (13.6%) |
| $100,000 to $149,999 | 9,398 (15.1%) | 23,463 (12.5%) |
| $150,000 or more | 14,882 (23.8%) | 39,129 (20.9%) |
| Total | 62,390 (100.0%) | 187,129 (100.0%) |
Property Value to Household Income Ratio in Mecklenburg County
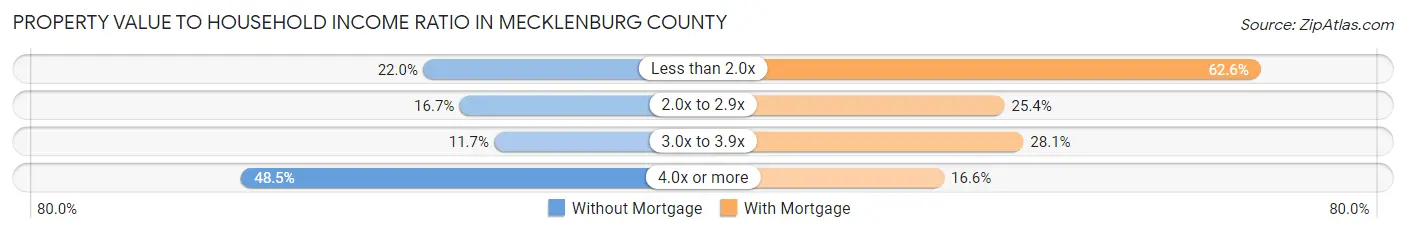
| Value-to-Income Ratio | Without Mortgage | With Mortgage |
| Less than 2.0x | 13,734 (22.0%) | 117,117 (62.6%) |
| 2.0x to 2.9x | 10,430 (16.7%) | 47,488 (25.4%) |
| 3.0x to 3.9x | 7,291 (11.7%) | 52,607 (28.1%) |
| 4.0x or more | 30,257 (48.5%) | 31,048 (16.6%) |
| Total | 62,390 (100.0%) | 187,129 (100.0%) |
Real Estate Taxes by Mortgage Status in Mecklenburg County
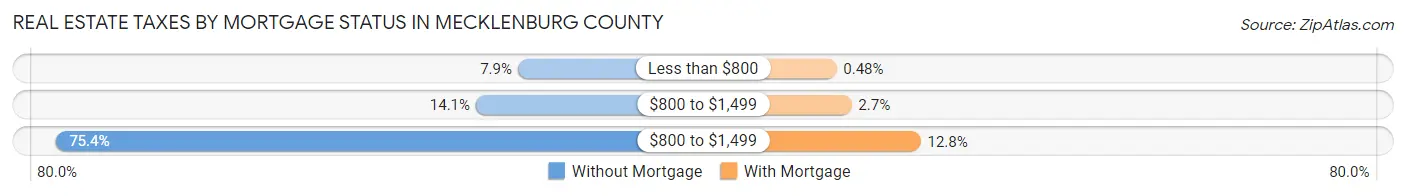
| Property Taxes | Without Mortgage | With Mortgage |
| Less than $800 | 4,947 (7.9%) | 897 (0.5%) |
| $800 to $1,499 | 8,775 (14.1%) | 5,023 (2.7%) |
| $800 to $1,499 | 47,022 (75.4%) | 23,909 (12.8%) |
| Total | 62,390 (100.0%) | 187,129 (100.0%) |
Health & Disability in Mecklenburg County
Health Insurance Coverage by Age in Mecklenburg County
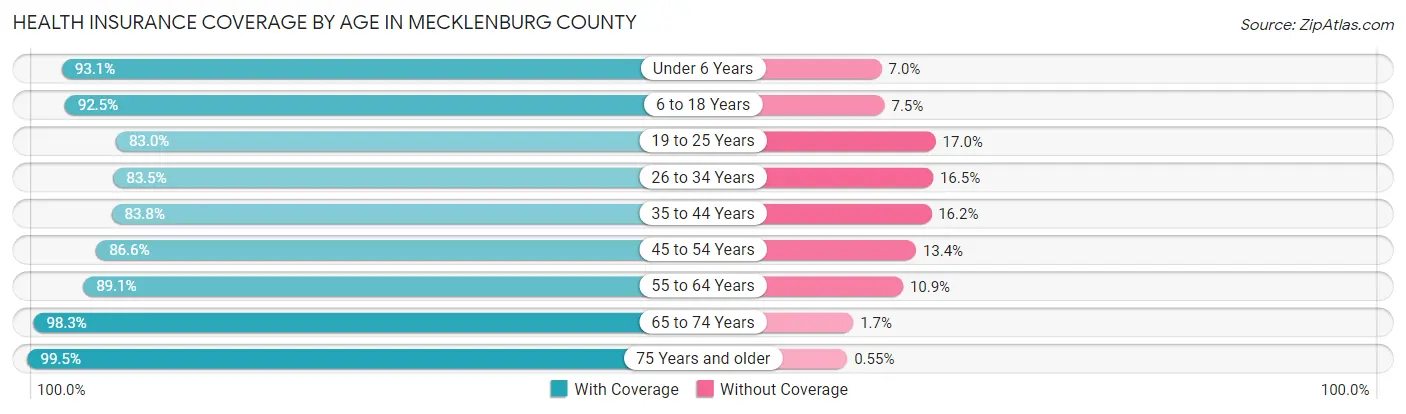
| Age Bracket | With Coverage | Without Coverage |
| Under 6 Years | 79,330 (93.0%) | 5,929 (7.0%) |
| 6 to 18 Years | 172,071 (92.5%) | 13,959 (7.5%) |
| 19 to 25 Years | 89,609 (83.0%) | 18,411 (17.0%) |
| 26 to 34 Years | 140,971 (83.5%) | 27,939 (16.5%) |
| 35 to 44 Years | 136,819 (83.8%) | 26,465 (16.2%) |
| 45 to 54 Years | 127,798 (86.6%) | 19,710 (13.4%) |
| 55 to 64 Years | 110,066 (89.1%) | 13,523 (10.9%) |
| 65 to 74 Years | 77,488 (98.3%) | 1,310 (1.7%) |
| 75 Years and older | 47,681 (99.5%) | 262 (0.5%) |
| Total | 981,833 (88.5%) | 127,508 (11.5%) |
Health Insurance Coverage by Citizenship Status in Mecklenburg County
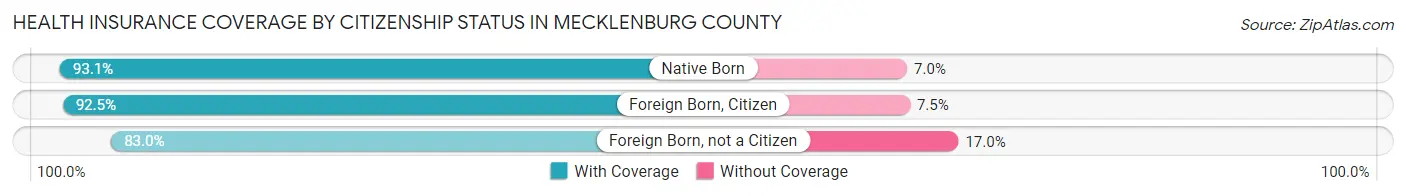
| Citizenship Status | With Coverage | Without Coverage |
| Native Born | 79,330 (93.0%) | 5,929 (7.0%) |
| Foreign Born, Citizen | 172,071 (92.5%) | 13,959 (7.5%) |
| Foreign Born, not a Citizen | 89,609 (83.0%) | 18,411 (17.0%) |
Health Insurance Coverage by Household Income in Mecklenburg County
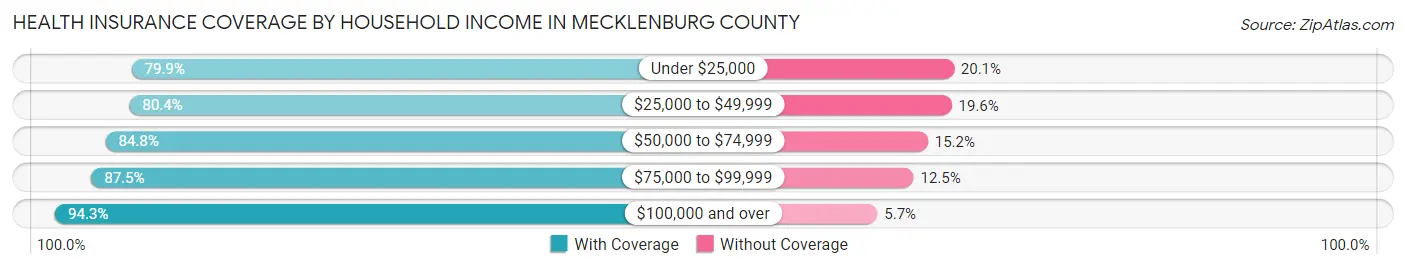
| Household Income | With Coverage | Without Coverage |
| Under $25,000 | 79,329 (79.9%) | 19,903 (20.1%) |
| $25,000 to $49,999 | 137,557 (80.4%) | 33,626 (19.6%) |
| $50,000 to $74,999 | 146,524 (84.8%) | 26,198 (15.2%) |
| $75,000 to $99,999 | 121,845 (87.5%) | 17,415 (12.5%) |
| $100,000 and over | 487,148 (94.3%) | 29,543 (5.7%) |
Public vs Private Health Insurance Coverage by Age in Mecklenburg County
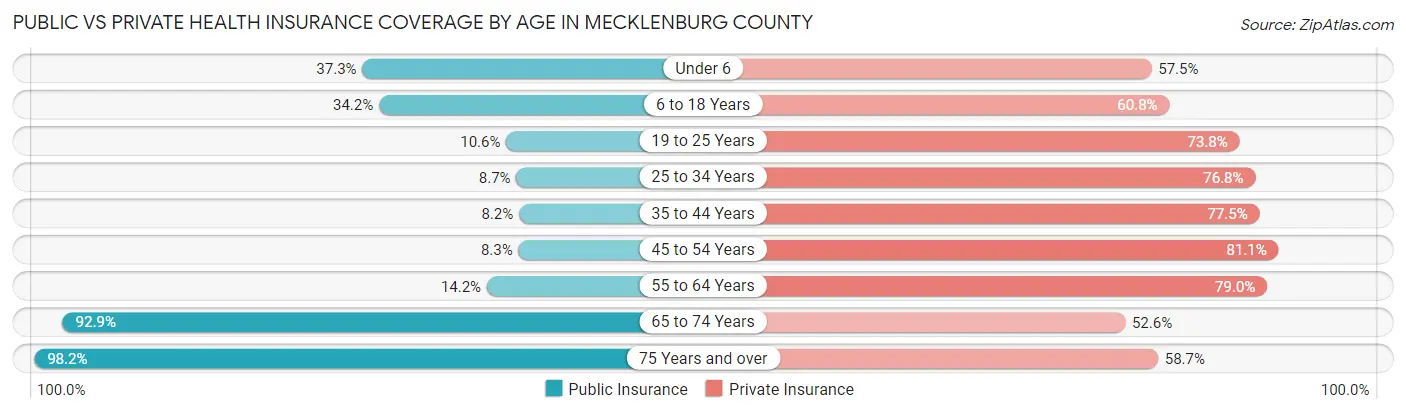
| Age Bracket | Public Insurance | Private Insurance |
| Under 6 | 31,805 (37.3%) | 48,978 (57.5%) |
| 6 to 18 Years | 63,645 (34.2%) | 113,109 (60.8%) |
| 19 to 25 Years | 11,441 (10.6%) | 79,753 (73.8%) |
| 25 to 34 Years | 14,704 (8.7%) | 129,658 (76.8%) |
| 35 to 44 Years | 13,423 (8.2%) | 126,599 (77.5%) |
| 45 to 54 Years | 12,277 (8.3%) | 119,583 (81.1%) |
| 55 to 64 Years | 17,522 (14.2%) | 97,578 (78.9%) |
| 65 to 74 Years | 73,233 (92.9%) | 41,420 (52.6%) |
| 75 Years and over | 47,084 (98.2%) | 28,121 (58.7%) |
| Total | 285,134 (25.7%) | 784,799 (70.7%) |
Disability Status by Sex by Age in Mecklenburg County
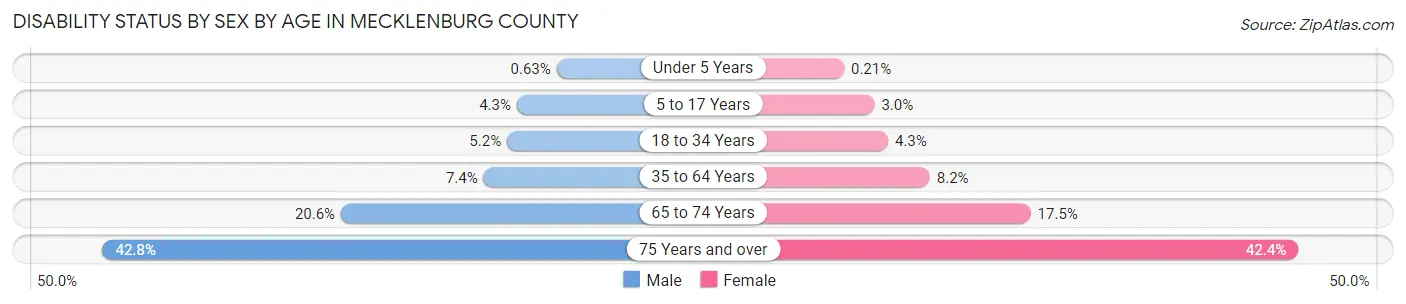
| Age Bracket | Male | Female |
| Under 5 Years | 229 (0.6%) | 74 (0.2%) |
| 5 to 17 Years | 4,047 (4.3%) | 2,763 (3.0%) |
| 18 to 34 Years | 7,475 (5.2%) | 6,406 (4.3%) |
| 35 to 64 Years | 15,554 (7.4%) | 18,331 (8.2%) |
| 65 to 74 Years | 7,216 (20.6%) | 7,682 (17.5%) |
| 75 Years and over | 8,007 (42.8%) | 12,375 (42.3%) |
Disability Class by Sex by Age in Mecklenburg County
Disability Class: Hearing Difficulty
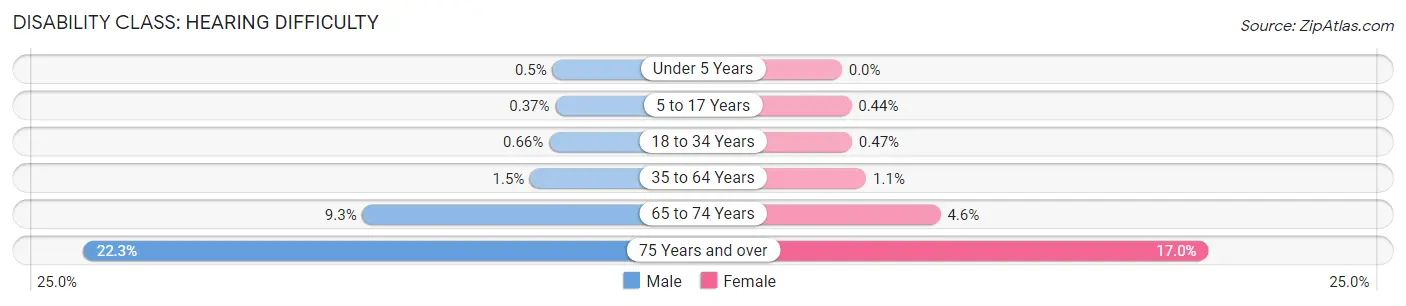
| Age Bracket | Male | Female |
| Under 5 Years | 184 (0.5%) | 0 (0.0%) |
| 5 to 17 Years | 343 (0.4%) | 402 (0.4%) |
| 18 to 34 Years | 946 (0.7%) | 695 (0.5%) |
| 35 to 64 Years | 3,222 (1.5%) | 2,527 (1.1%) |
| 65 to 74 Years | 3,259 (9.3%) | 2,006 (4.6%) |
| 75 Years and over | 4,166 (22.3%) | 4,969 (17.0%) |
Disability Class: Vision Difficulty
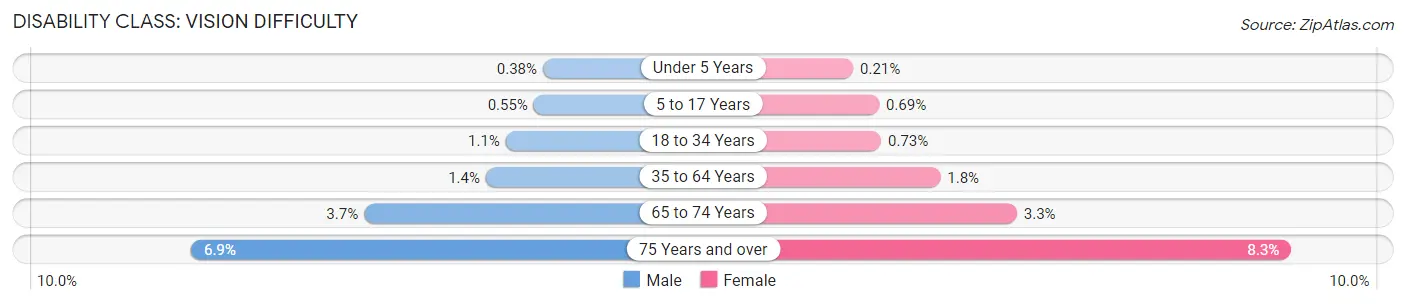
| Age Bracket | Male | Female |
| Under 5 Years | 137 (0.4%) | 74 (0.2%) |
| 5 to 17 Years | 513 (0.5%) | 625 (0.7%) |
| 18 to 34 Years | 1,529 (1.1%) | 1,095 (0.7%) |
| 35 to 64 Years | 3,012 (1.4%) | 4,115 (1.8%) |
| 65 to 74 Years | 1,295 (3.7%) | 1,424 (3.3%) |
| 75 Years and over | 1,294 (6.9%) | 2,437 (8.3%) |
Disability Class: Cognitive Difficulty
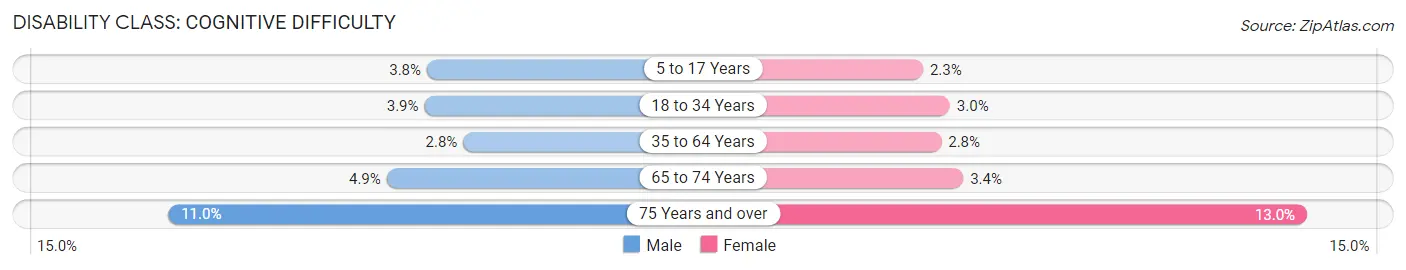
| Age Bracket | Male | Female |
| 5 to 17 Years | 3,562 (3.8%) | 2,062 (2.3%) |
| 18 to 34 Years | 5,533 (3.9%) | 4,493 (3.0%) |
| 35 to 64 Years | 5,865 (2.8%) | 6,215 (2.8%) |
| 65 to 74 Years | 1,721 (4.9%) | 1,481 (3.4%) |
| 75 Years and over | 2,059 (11.0%) | 3,783 (13.0%) |
Disability Class: Ambulatory Difficulty
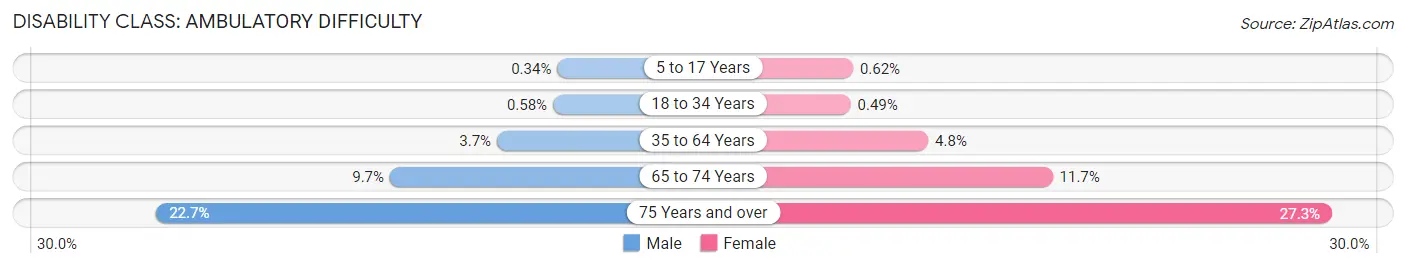
| Age Bracket | Male | Female |
| 5 to 17 Years | 322 (0.3%) | 567 (0.6%) |
| 18 to 34 Years | 827 (0.6%) | 733 (0.5%) |
| 35 to 64 Years | 7,759 (3.7%) | 10,803 (4.8%) |
| 65 to 74 Years | 3,377 (9.7%) | 5,144 (11.7%) |
| 75 Years and over | 4,245 (22.7%) | 7,973 (27.3%) |
Disability Class: Self-Care Difficulty
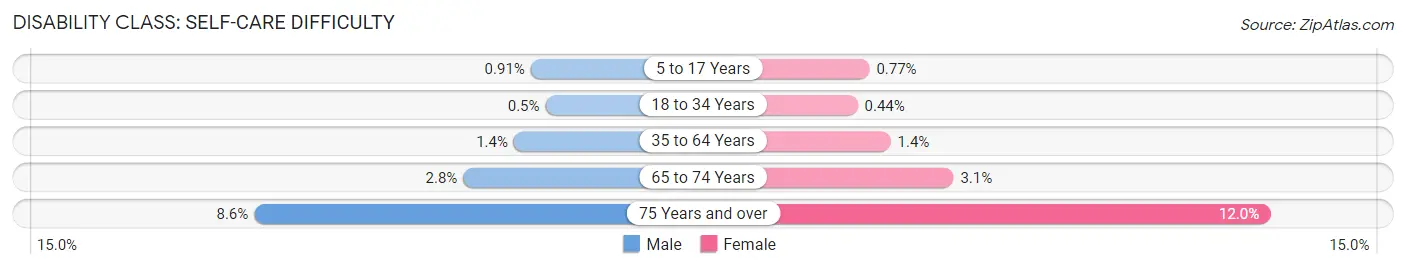
| Age Bracket | Male | Female |
| 5 to 17 Years | 855 (0.9%) | 702 (0.8%) |
| 18 to 34 Years | 712 (0.5%) | 657 (0.4%) |
| 35 to 64 Years | 2,886 (1.4%) | 3,053 (1.4%) |
| 65 to 74 Years | 974 (2.8%) | 1,362 (3.1%) |
| 75 Years and over | 1,612 (8.6%) | 3,491 (11.9%) |
Technology Access in Mecklenburg County
Computing Device Access in Mecklenburg County
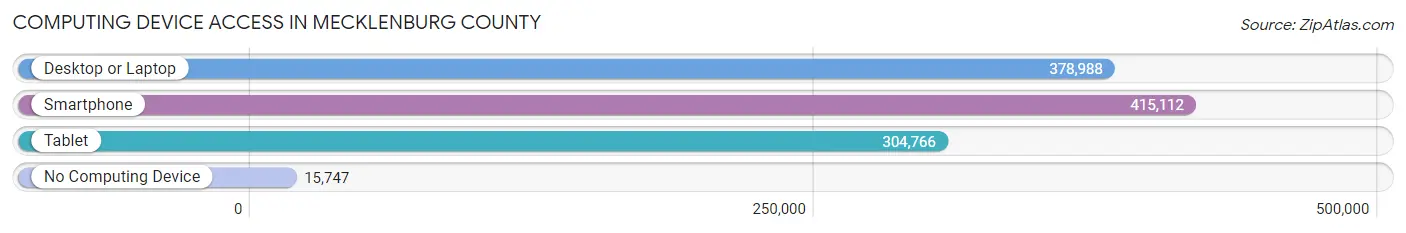
| Device Type | # Households | % Households |
| Desktop or Laptop | 378,988 | 84.9% |
| Smartphone | 415,112 | 92.9% |
| Tablet | 304,766 | 68.2% |
| No Computing Device | 15,747 | 3.5% |
| Total | 446,584 | 100.0% |
Internet Access in Mecklenburg County
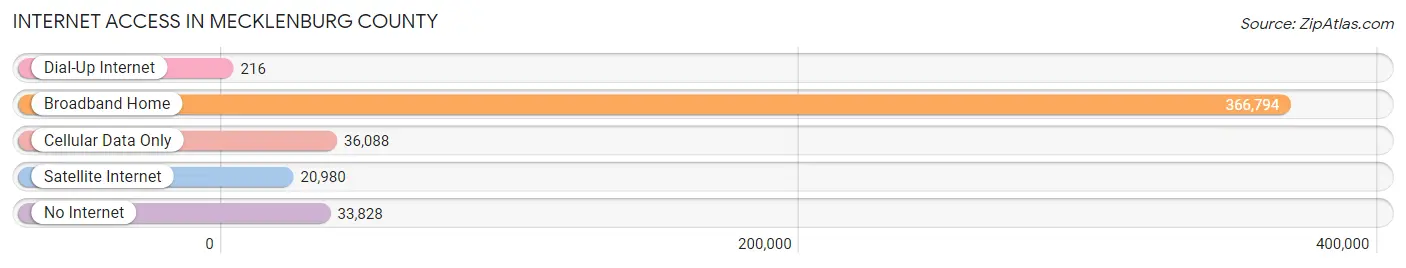
| Internet Type | # Households | % Households |
| Dial-Up Internet | 216 | 0.1% |
| Broadband Home | 366,794 | 82.1% |
| Cellular Data Only | 36,088 | 8.1% |
| Satellite Internet | 20,980 | 4.7% |
| No Internet | 33,828 | 7.6% |
| Total | 446,584 | 100.0% |
Mecklenburg County Summary
Mecklenburg County, North Carolina is located in the south-central part of the state and is the most populous county in the state. It is bordered by Cabarrus, Union, Gaston, Lincoln, Iredell, and Catawba counties. The county seat is Charlotte, the largest city in the state and the second-largest banking center in the United States.
History
Mecklenburg County was formed in 1762 from Anson County. It was named after the German region of Mecklenburg-Strelitz, the birthplace of King George III. The county was originally part of the British Province of North Carolina, and was one of the original eight counties of the state.
During the Revolutionary War, Mecklenburg County was the site of the Mecklenburg Declaration of Independence, which was signed on May 20, 1775. This document declared the independence of the colonies from Great Britain and was the first such declaration in the United States.
Geography
Mecklenburg County covers an area of 543 square miles and is located in the Piedmont region of North Carolina. The county is divided into two distinct regions: the Uwharrie Mountains in the west and the Catawba River Valley in the east. The county is home to several lakes, including Lake Norman, Mountain Island Lake, and Lake Wylie.
The county is home to several state parks, including Crowders Mountain State Park, Lake Norman State Park, and Latta Plantation Nature Preserve. The county is also home to several major cities, including Charlotte, Cornelius, Davidson, Huntersville, Matthews, Mint Hill, and Pineville.
Economy
Mecklenburg County has a diverse economy, with a mix of manufacturing, finance, and technology industries. The county is home to several Fortune 500 companies, including Bank of America, Duke Energy, Lowe’s, and Nucor.
The county is also home to several major universities, including the University of North Carolina at Charlotte, Johnson & Wales University, and Queens University of Charlotte.
Demographics
As of the 2010 census, Mecklenburg County had a population of 919,628. The population is racially diverse, with the largest racial group being White (63.2%), followed by African American (30.2%), Hispanic or Latino (5.3%), and Asian (2.2%).
The median household income in the county is $60,845, and the median home value is $212,400. The county has a poverty rate of 11.3%, and the unemployment rate is 4.2%.
Mecklenburg County is a vibrant and diverse county with a rich history and a strong economy. It is home to several major cities and universities, and is a great place to live and work.
Common Questions
What is the Total Population of Mecklenburg County?
Total Population of Mecklenburg County is 1,115,403.
What is the Total Male Population of Mecklenburg County?
Total Male Population of Mecklenburg County is 540,310.
What is the Total Female Population of Mecklenburg County?
Total Female Population of Mecklenburg County is 575,093.
What is the Ratio of Males per 100 Females in Mecklenburg County?
There are 93.95 Males per 100 Females in Mecklenburg County.
What is the Ratio of Females per 100 Males in Mecklenburg County?
There are 106.44 Females per 100 Males in Mecklenburg County.
What is the Median Population Age in Mecklenburg County?
Median Population Age in Mecklenburg County is 35.4 Years.
What is the Average Family Size in Mecklenburg County
Average Family Size in Mecklenburg County is 3.2 People.
What is the Average Household Size in Mecklenburg County
Average Household Size in Mecklenburg County is 2.5 People.
What is Per Capita Income in Mecklenburg County?
Per Capita income in Mecklenburg County is $48,625.
What is the Median Family Income in Mecklenburg County?
Median Family Income in Mecklenburg County is $100,267.
What is the Median Household income in Mecklenburg County?
Median Household Income in Mecklenburg County is $79,265.
What is Income or Wage Gap in Mecklenburg County?
Income or Wage Gap in Mecklenburg County is 24.2%.
Women in Mecklenburg County earn 75.8 cents for every dollar earned by a man.
What is Family Income Deficit in Mecklenburg County?
Family Income Deficit in Mecklenburg County is $11,077.
Families that are below poverty line in Mecklenburg County earn $11,077 less on average than the poverty threshold level.
What is Inequality or Gini Index in Mecklenburg County?
Inequality or Gini Index in Mecklenburg County is 0.49.
How Large is the Labor Force in Mecklenburg County?
There are 633,320 People in the Labor Forcein in Mecklenburg County.
What is the Percentage of People in the Labor Force in Mecklenburg County?
71.4% of People are in the Labor Force in Mecklenburg County.
What is the Unemployment Rate in Mecklenburg County?
Unemployment Rate in Mecklenburg County is 4.5%.