McDowell County, NC
McDowell County Map
McDowell County Overview
44,629
TOTAL POPULATION
22,521
MALE POPULATION
22,108
FEMALE POPULATION
101.87
MALES / 100 FEMALES
98.17
FEMALES / 100 MALES
44.3
MEDIAN AGE
2.8
AVG FAMILY SIZE
2.4
AVG HOUSEHOLD SIZE
$29,047
PER CAPITA INCOME
$65,510
AVG FAMILY INCOME
$53,532
AVG HOUSEHOLD INCOME
10.6%
WAGE / INCOME GAP [ % ]
89.4¢/ $1
WAGE / INCOME GAP [ $ ]
$10,380
FAMILY INCOME DEFICIT
0.44
INEQUALITY / GINI INDEX
19,873
LABOR FORCE [ PEOPLE ]
53.8%
PERCENT IN LABOR FORCE
5.5%
UNEMPLOYMENT RATE
McDowell County Area Codes
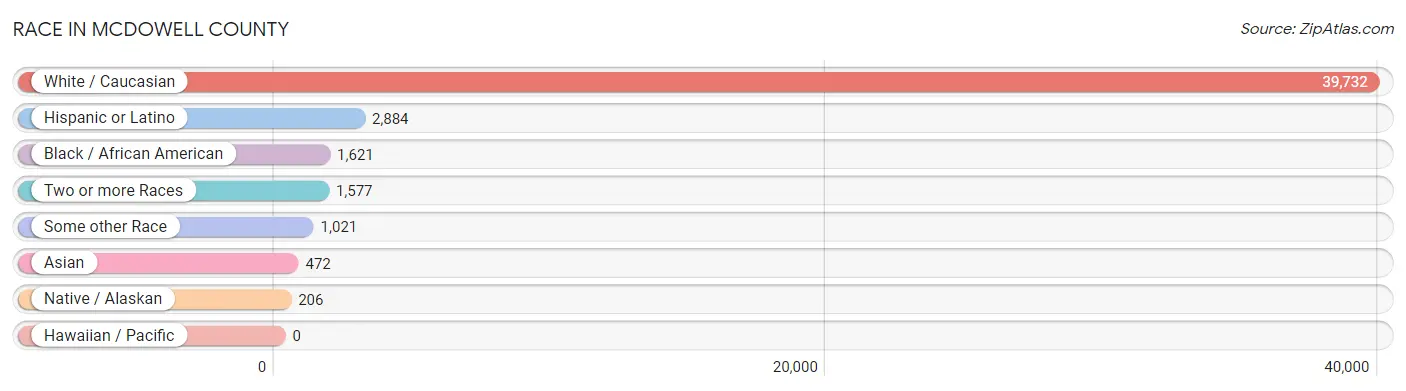
Race in McDowell County
The most populous races in McDowell County are White / Caucasian (39,732 | 89.0%), Hispanic or Latino (2,884 | 6.5%), and Black / African American (1,621 | 3.6%).
| Race | # Population | % Population |
| Asian | 472 | 1.1% |
| Black / African American | 1,621 | 3.6% |
| Hawaiian / Pacific | 0 | 0.0% |
| Hispanic or Latino | 2,884 | 6.5% |
| Native / Alaskan | 206 | 0.5% |
| White / Caucasian | 39,732 | 89.0% |
| Two or more Races | 1,577 | 3.5% |
| Some other Race | 1,021 | 2.3% |
| Total | 44,629 | 100.0% |
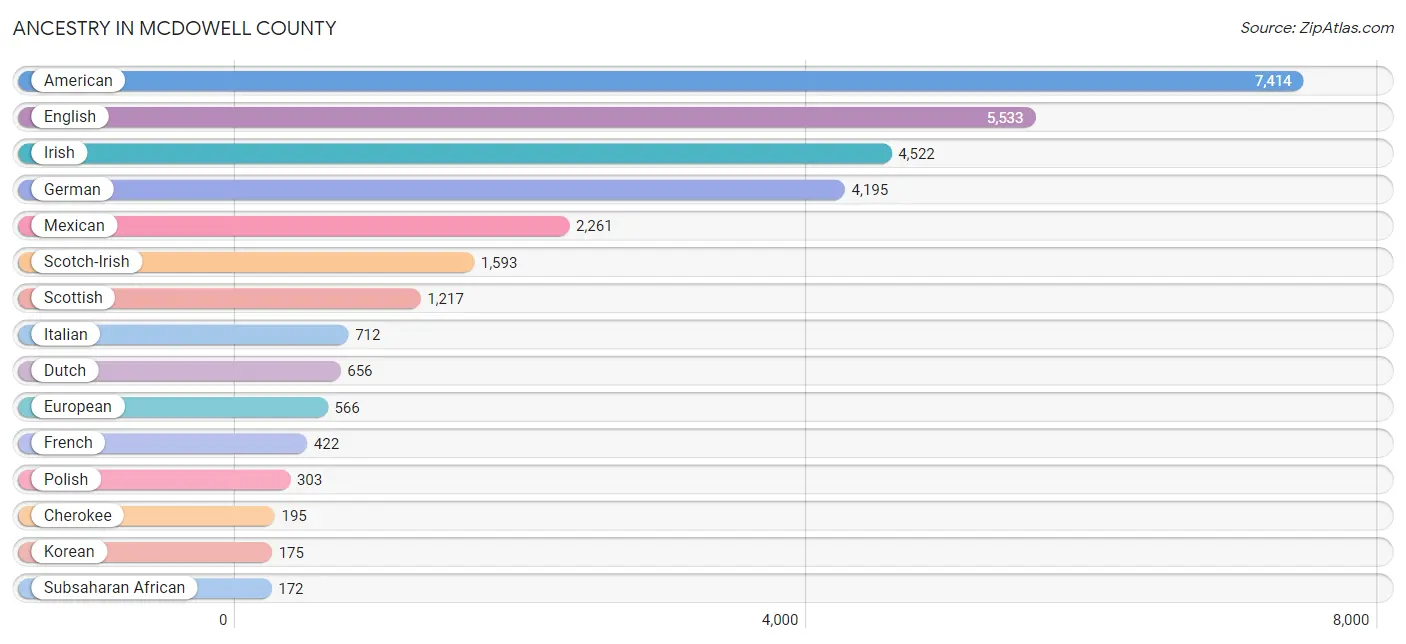
Ancestry in McDowell County
The most populous ancestries reported in McDowell County are American (7,414 | 16.6%), English (5,533 | 12.4%), Irish (4,522 | 10.1%), German (4,195 | 9.4%), and Mexican (2,261 | 5.1%), together accounting for 53.6% of all McDowell County residents.
| Ancestry | # Population | % Population |
| African | 167 | 0.4% |
| American | 7,414 | 16.6% |
| Apache | 9 | 0.0% |
| Arab | 30 | 0.1% |
| Argentinean | 22 | 0.1% |
| Australian | 58 | 0.1% |
| Austrian | 9 | 0.0% |
| Bangladeshi | 104 | 0.2% |
| Barbadian | 6 | 0.0% |
| Bhutanese | 28 | 0.1% |
| Brazilian | 7 | 0.0% |
| British | 160 | 0.4% |
| Burmese | 28 | 0.1% |
| Canadian | 68 | 0.2% |
| Central American | 147 | 0.3% |
| Cherokee | 195 | 0.4% |
| Chickasaw | 16 | 0.0% |
| Chippewa | 12 | 0.0% |
| Colombian | 20 | 0.0% |
| Costa Rican | 8 | 0.0% |
| Croatian | 12 | 0.0% |
| Cuban | 47 | 0.1% |
| Czech | 24 | 0.1% |
| Danish | 58 | 0.1% |
| Dominican | 132 | 0.3% |
| Dutch | 656 | 1.5% |
| Eastern European | 23 | 0.1% |
| English | 5,533 | 12.4% |
| European | 566 | 1.3% |
| Finnish | 37 | 0.1% |
| French | 422 | 0.9% |
| French Canadian | 72 | 0.2% |
| German | 4,195 | 9.4% |
| Greek | 57 | 0.1% |
| Guatemalan | 96 | 0.2% |
| Hungarian | 71 | 0.2% |
| Indian (Asian) | 112 | 0.3% |
| Inupiat | 9 | 0.0% |
| Irish | 4,522 | 10.1% |
| Israeli | 15 | 0.0% |
| Italian | 712 | 1.6% |
| Jamaican | 20 | 0.0% |
| Korean | 175 | 0.4% |
| Lebanese | 12 | 0.0% |
| Lithuanian | 32 | 0.1% |
| Lumbee | 36 | 0.1% |
| Mexican | 2,261 | 5.1% |
| Mexican American Indian | 29 | 0.1% |
| Northern European | 38 | 0.1% |
| Norwegian | 102 | 0.2% |
| Peruvian | 17 | 0.0% |
| Polish | 303 | 0.7% |
| Puerto Rican | 159 | 0.4% |
| Russian | 114 | 0.3% |
| Salvadoran | 43 | 0.1% |
| Scandinavian | 116 | 0.3% |
| Scotch-Irish | 1,593 | 3.6% |
| Scottish | 1,217 | 2.7% |
| Sioux | 8 | 0.0% |
| Slavic | 8 | 0.0% |
| Slovak | 13 | 0.0% |
| South American | 78 | 0.2% |
| Sri Lankan | 139 | 0.3% |
| Subsaharan African | 172 | 0.4% |
| Swedish | 107 | 0.2% |
| Swiss | 122 | 0.3% |
| Thai | 49 | 0.1% |
| Trinidadian and Tobagonian | 5 | 0.0% |
| Ugandan | 2 | 0.0% |
| Ukrainian | 18 | 0.0% |
| Venezuelan | 19 | 0.0% |
| Welsh | 117 | 0.3% | View All 72 Rows |
Immigrants in McDowell County
The most numerous immigrant groups reported in McDowell County came from Latin America (1,277 | 2.9%), Central America (1,138 | 2.5%), Mexico (1,029 | 2.3%), Asia (334 | 0.7%), and South Eastern Asia (312 | 0.7%), together accounting for 9.2% of all McDowell County residents.

| Immigration Origin | # Population | % Population |
| Africa | 3 | 0.0% |
| Argentina | 22 | 0.1% |
| Asia | 334 | 0.7% |
| Canada | 109 | 0.2% |
| Caribbean | 41 | 0.1% |
| Central America | 1,138 | 2.5% |
| Colombia | 20 | 0.0% |
| Costa Rica | 55 | 0.1% |
| Dominican Republic | 21 | 0.1% |
| Eastern Africa | 3 | 0.0% |
| Eastern Europe | 21 | 0.1% |
| Ecuador | 5 | 0.0% |
| El Salvador | 28 | 0.1% |
| England | 4 | 0.0% |
| Europe | 91 | 0.2% |
| Germany | 17 | 0.0% |
| Guatemala | 26 | 0.1% |
| India | 22 | 0.1% |
| Jamaica | 20 | 0.0% |
| Laos | 50 | 0.1% |
| Latin America | 1,277 | 2.9% |
| Mexico | 1,029 | 2.3% |
| Northern Europe | 51 | 0.1% |
| Philippines | 154 | 0.4% |
| Romania | 9 | 0.0% |
| Russia | 12 | 0.0% |
| Scotland | 30 | 0.1% |
| South America | 98 | 0.2% |
| South Central Asia | 22 | 0.1% |
| South Eastern Asia | 312 | 0.7% |
| Switzerland | 2 | 0.0% |
| Venezuela | 51 | 0.1% |
| Vietnam | 108 | 0.2% |
| Western Europe | 19 | 0.0% | View All 34 Rows |
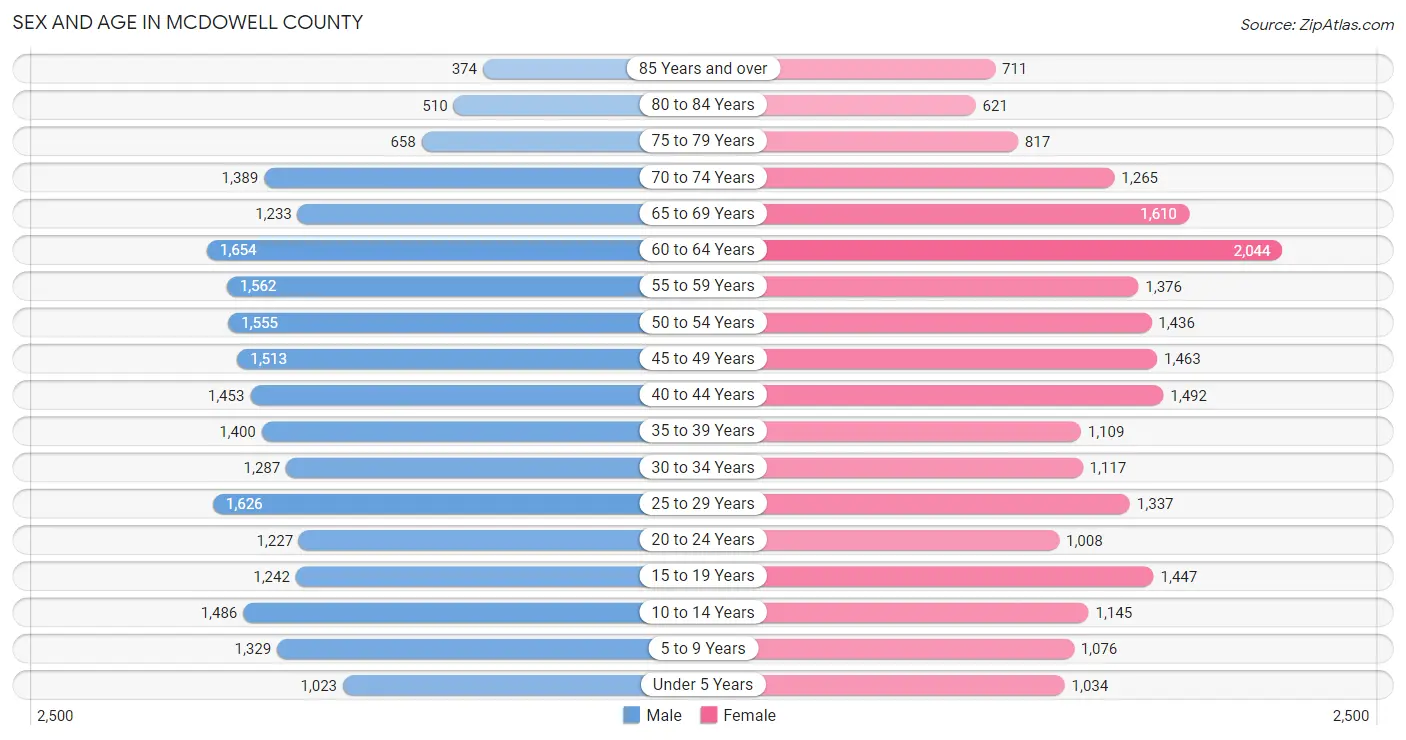
Sex and Age in McDowell County
Sex and Age in McDowell County
The most populous age groups in McDowell County are 60 to 64 Years (1,654 | 7.3%) for men and 60 to 64 Years (2,044 | 9.2%) for women.
| Age Bracket | Male | Female |
| Under 5 Years | 1,023 (4.5%) | 1,034 (4.7%) |
| 5 to 9 Years | 1,329 (5.9%) | 1,076 (4.9%) |
| 10 to 14 Years | 1,486 (6.6%) | 1,145 (5.2%) |
| 15 to 19 Years | 1,242 (5.5%) | 1,447 (6.6%) |
| 20 to 24 Years | 1,227 (5.4%) | 1,008 (4.6%) |
| 25 to 29 Years | 1,626 (7.2%) | 1,337 (6.0%) |
| 30 to 34 Years | 1,287 (5.7%) | 1,117 (5.1%) |
| 35 to 39 Years | 1,400 (6.2%) | 1,109 (5.0%) |
| 40 to 44 Years | 1,453 (6.5%) | 1,492 (6.8%) |
| 45 to 49 Years | 1,513 (6.7%) | 1,463 (6.6%) |
| 50 to 54 Years | 1,555 (6.9%) | 1,436 (6.5%) |
| 55 to 59 Years | 1,562 (6.9%) | 1,376 (6.2%) |
| 60 to 64 Years | 1,654 (7.3%) | 2,044 (9.2%) |
| 65 to 69 Years | 1,233 (5.5%) | 1,610 (7.3%) |
| 70 to 74 Years | 1,389 (6.2%) | 1,265 (5.7%) |
| 75 to 79 Years | 658 (2.9%) | 817 (3.7%) |
| 80 to 84 Years | 510 (2.3%) | 621 (2.8%) |
| 85 Years and over | 374 (1.7%) | 711 (3.2%) |
| Total | 22,521 (100.0%) | 22,108 (100.0%) |
Families and Households in McDowell County
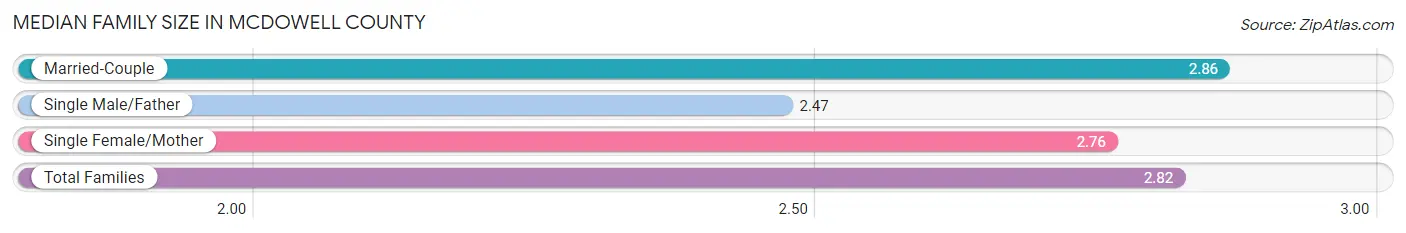
Median Family Size in McDowell County
The median family size in McDowell County is 2.82 persons per family, with married-couple families (9,520 | 74.8%) accounting for the largest median family size of 2.86 persons per family. On the other hand, single male/father families (838 | 6.6%) represent the smallest median family size with 2.47 persons per family.
| Family Type | # Families | Family Size |
| Married-Couple | 9,520 (74.8%) | 2.86 |
| Single Male/Father | 838 (6.6%) | 2.47 |
| Single Female/Mother | 2,378 (18.7%) | 2.76 |
| Total Families | 12,736 (100.0%) | 2.82 |
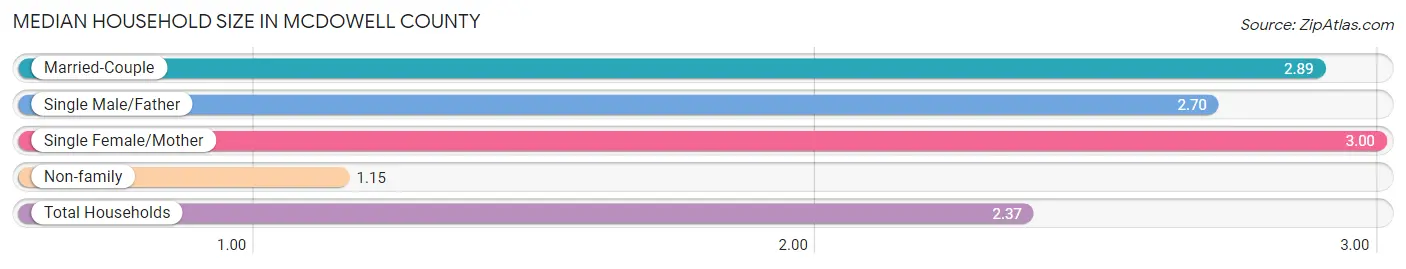
Median Household Size in McDowell County
The median household size in McDowell County is 2.37 persons per household, with single female/mother households (2,378 | 13.1%) accounting for the largest median household size of 3 persons per household. non-family households (5,448 | 30.0%) represent the smallest median household size with 1.15 persons per household.
| Household Type | # Households | Household Size |
| Married-Couple | 9,520 (52.3%) | 2.89 |
| Single Male/Father | 838 (4.6%) | 2.70 |
| Single Female/Mother | 2,378 (13.1%) | 3.00 |
| Non-family | 5,448 (30.0%) | 1.15 |
| Total Households | 18,184 (100.0%) | 2.37 |
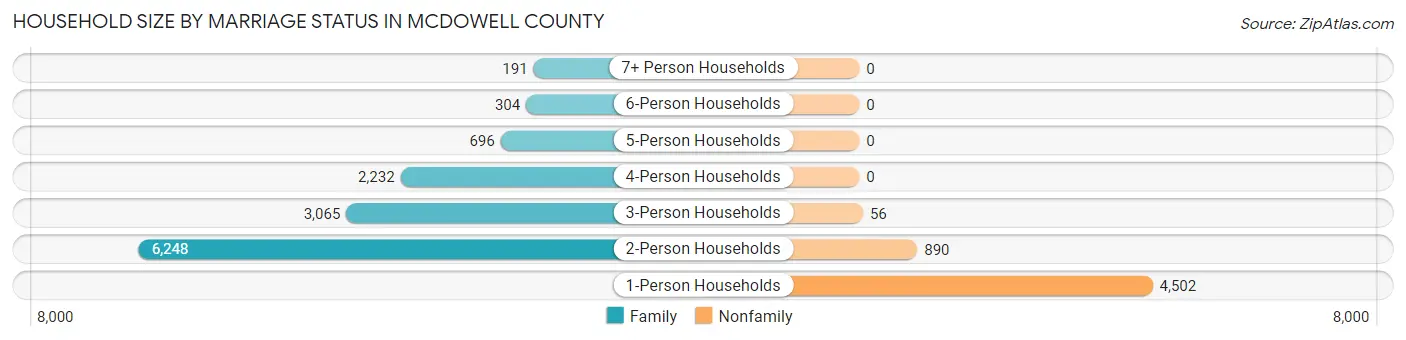
Household Size by Marriage Status in McDowell County
Out of a total of 18,184 households in McDowell County, 12,736 (70.0%) are family households, while 5,448 (30.0%) are nonfamily households. The most numerous type of family households are 2-person households, comprising 6,248, and the most common type of nonfamily households are 1-person households, comprising 4,502.
| Household Size | Family Households | Nonfamily Households |
| 1-Person Households | - | 4,502 (24.8%) |
| 2-Person Households | 6,248 (34.4%) | 890 (4.9%) |
| 3-Person Households | 3,065 (16.9%) | 56 (0.3%) |
| 4-Person Households | 2,232 (12.3%) | 0 (0.0%) |
| 5-Person Households | 696 (3.8%) | 0 (0.0%) |
| 6-Person Households | 304 (1.7%) | 0 (0.0%) |
| 7+ Person Households | 191 (1.1%) | 0 (0.0%) |
| Total | 12,736 (70.0%) | 5,448 (30.0%) |
Female Fertility in McDowell County
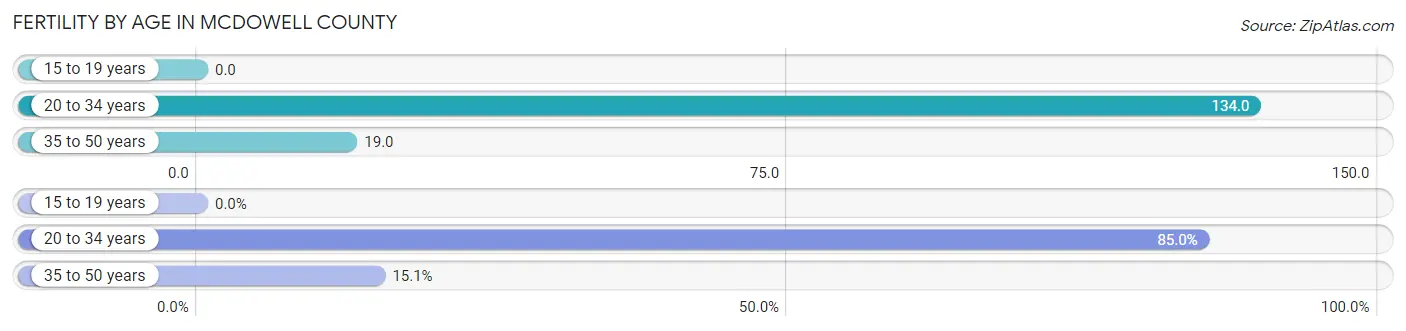
Fertility by Age in McDowell County
Average fertility rate in McDowell County is 59.0 births per 1,000 women. Women in the age bracket of 20 to 34 years have the highest fertility rate with 134.0 births per 1,000 women. Women in the age bracket of 20 to 34 years acount for 85.0% of all women with births.
| Age Bracket | Women with Births | Births / 1,000 Women |
| 15 to 19 years | 0 (0.0%) | 0.0 |
| 20 to 34 years | 463 (85.0%) | 134.0 |
| 35 to 50 years | 82 (15.0%) | 19.0 |
| Total | 545 (100.0%) | 59.0 |
Fertility by Age by Marriage Status in McDowell County
63.5% of women with births (545) in McDowell County are married. The highest percentage of unmarried women with births falls into 35 to 50 years age bracket with 50.0% of them unmarried at the time of birth, while the lowest percentage of unmarried women with births belong to 20 to 34 years age bracket with 34.1% of them unmarried.
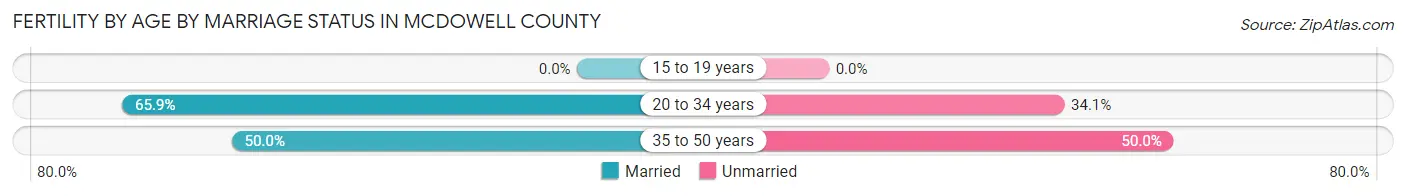
| Age Bracket | Married | Unmarried |
| 15 to 19 years | 0 (0.0%) | 0 (0.0%) |
| 20 to 34 years | 305 (65.9%) | 158 (34.1%) |
| 35 to 50 years | 41 (50.0%) | 41 (50.0%) |
| Total | 346 (63.5%) | 199 (36.5%) |
Fertility by Education in McDowell County
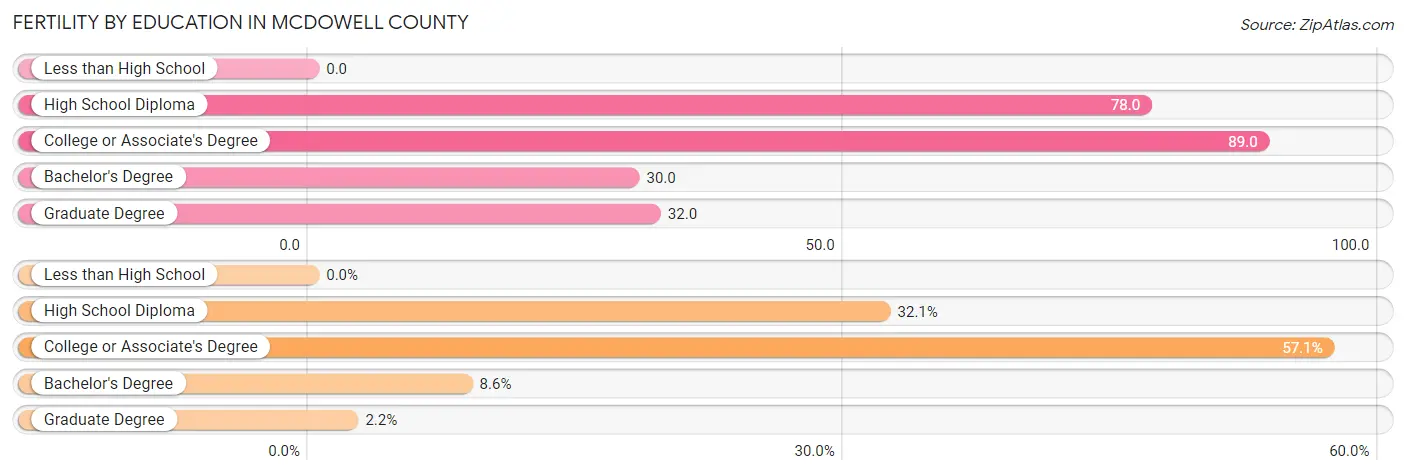
| Educational Attainment | Women with Births | Births / 1,000 Women |
| Less than High School | 0 (0.0%) | 0.0 |
| High School Diploma | 175 (32.1%) | 78.0 |
| College or Associate's Degree | 311 (57.1%) | 89.0 |
| Bachelor's Degree | 47 (8.6%) | 30.0 |
| Graduate Degree | 12 (2.2%) | 32.0 |
| Total | 545 (100.0%) | 59.0 |
Fertility by Education by Marriage Status in McDowell County
36.5% of women with births in McDowell County are unmarried. Women with the educational attainment of bachelor's degree are most likely to be married with 100.0% of them married at childbirth, while women with the educational attainment of high school diploma are least likely to be married with 49.7% of them unmarried at childbirth.
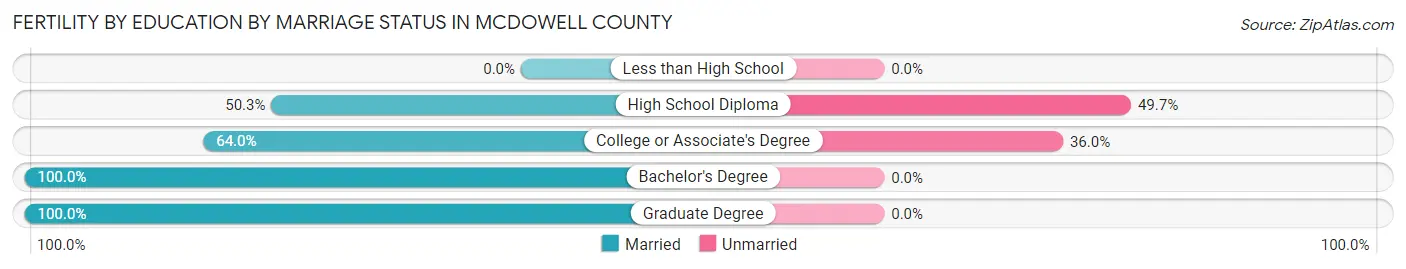
| Educational Attainment | Married | Unmarried |
| Less than High School | 0 (0.0%) | 0 (0.0%) |
| High School Diploma | 88 (50.3%) | 87 (49.7%) |
| College or Associate's Degree | 199 (64.0%) | 112 (36.0%) |
| Bachelor's Degree | 47 (100.0%) | 0 (0.0%) |
| Graduate Degree | 12 (100.0%) | 0 (0.0%) |
| Total | 346 (63.5%) | 199 (36.5%) |
Income in McDowell County
Income Overview in McDowell County
Per Capita Income in McDowell County is $29,047, while median incomes of families and households are $65,510 and $53,532 respectively.
| Characteristic | Number | Measure |
| Per Capita Income | 44,629 | $29,047 |
| Median Family Income | 12,736 | $65,510 |
| Mean Family Income | 12,736 | $81,857 |
| Median Household Income | 18,184 | $53,532 |
| Mean Household Income | 18,184 | $70,427 |
| Income Deficit | 12,736 | $10,380 |
| Wage / Income Gap (%) | 44,629 | 10.64% |
| Wage / Income Gap ($) | 44,629 | 89.36¢ per $1 |
| Gini / Inequality Index | 44,629 | 0.44 |
Earnings by Sex in McDowell County
Average Earnings in McDowell County are $35,498, $37,235 for men and $33,274 for women, a difference of 10.6%.
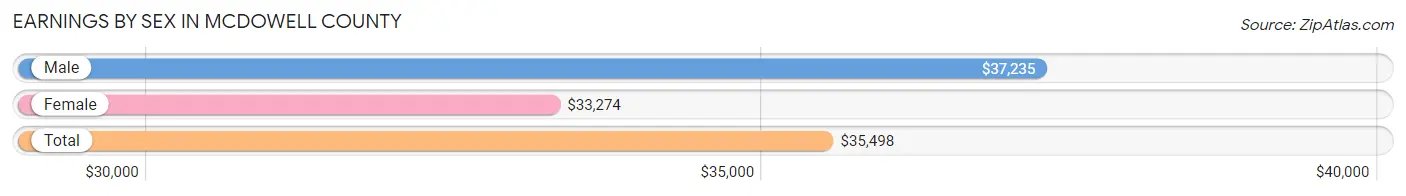
| Sex | Number | Average Earnings |
| Male | 10,642 (51.9%) | $37,235 |
| Female | 9,858 (48.1%) | $33,274 |
| Total | 20,500 (100.0%) | $35,498 |
Earnings by Sex by Income Bracket in McDowell County
The most common earnings brackets in McDowell County are $75,000 to $99,999 for men (1,002 | 9.4%) and $40,000 to $44,999 for women (1,124 | 11.4%).
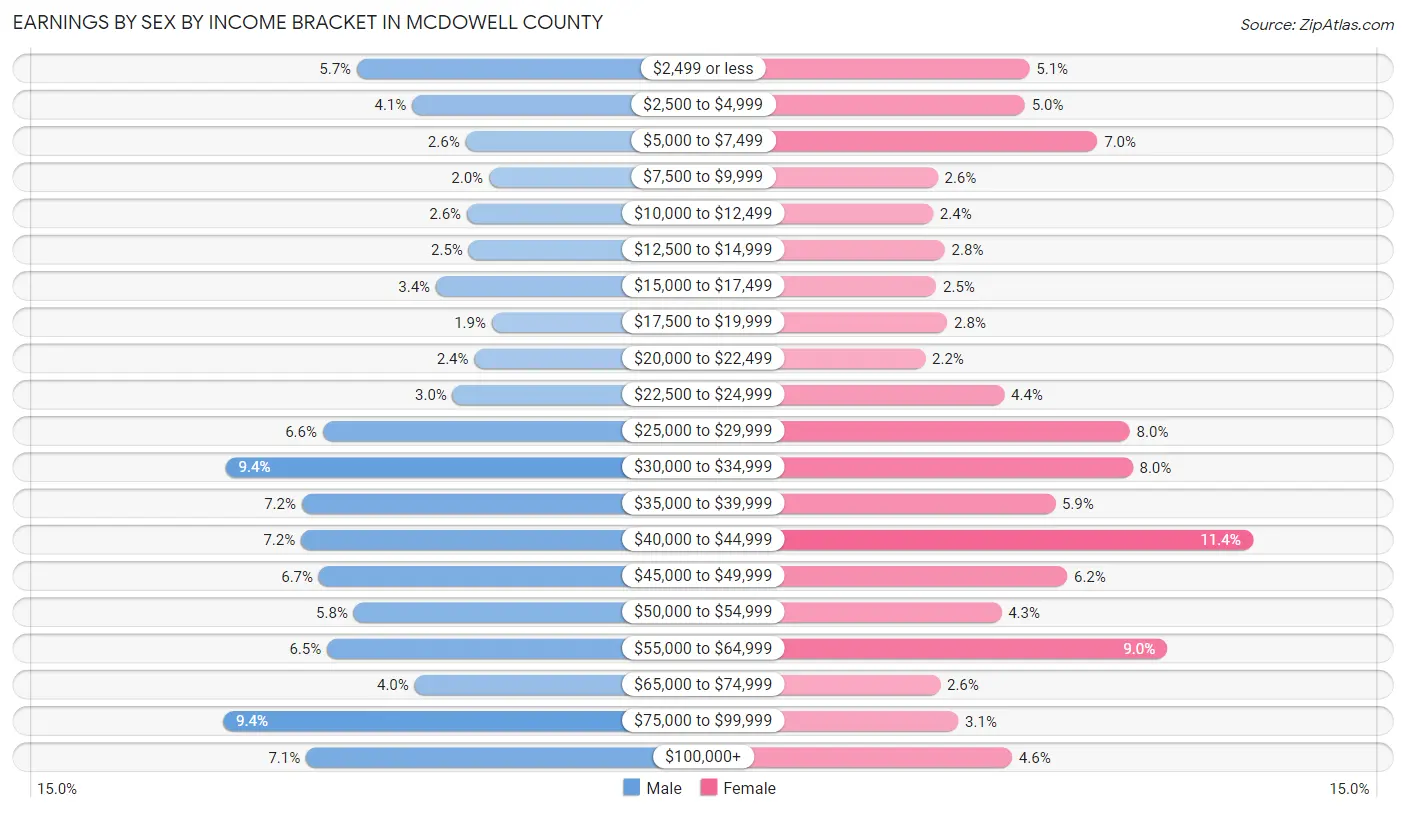
| Income | Male | Female |
| $2,499 or less | 602 (5.7%) | 506 (5.1%) |
| $2,500 to $4,999 | 437 (4.1%) | 493 (5.0%) |
| $5,000 to $7,499 | 278 (2.6%) | 694 (7.0%) |
| $7,500 to $9,999 | 208 (1.9%) | 251 (2.5%) |
| $10,000 to $12,499 | 274 (2.6%) | 239 (2.4%) |
| $12,500 to $14,999 | 268 (2.5%) | 271 (2.8%) |
| $15,000 to $17,499 | 366 (3.4%) | 247 (2.5%) |
| $17,500 to $19,999 | 199 (1.9%) | 278 (2.8%) |
| $20,000 to $22,499 | 251 (2.4%) | 217 (2.2%) |
| $22,500 to $24,999 | 316 (3.0%) | 436 (4.4%) |
| $25,000 to $29,999 | 705 (6.6%) | 784 (8.0%) |
| $30,000 to $34,999 | 995 (9.3%) | 792 (8.0%) |
| $35,000 to $39,999 | 767 (7.2%) | 577 (5.9%) |
| $40,000 to $44,999 | 769 (7.2%) | 1,124 (11.4%) |
| $45,000 to $49,999 | 716 (6.7%) | 610 (6.2%) |
| $50,000 to $54,999 | 612 (5.8%) | 428 (4.3%) |
| $55,000 to $64,999 | 692 (6.5%) | 887 (9.0%) |
| $65,000 to $74,999 | 430 (4.0%) | 258 (2.6%) |
| $75,000 to $99,999 | 1,002 (9.4%) | 309 (3.1%) |
| $100,000+ | 755 (7.1%) | 457 (4.6%) |
| Total | 10,642 (100.0%) | 9,858 (100.0%) |
Earnings by Sex by Educational Attainment in McDowell County
Average earnings in McDowell County are $40,964 for men and $36,778 for women, a difference of 10.2%. Men with an educational attainment of graduate degree enjoy the highest average annual earnings of $90,000, while those with less than high school education earn the least with $29,308. Women with an educational attainment of graduate degree earn the most with the average annual earnings of $54,773, while those with less than high school education have the smallest earnings of $17,639.
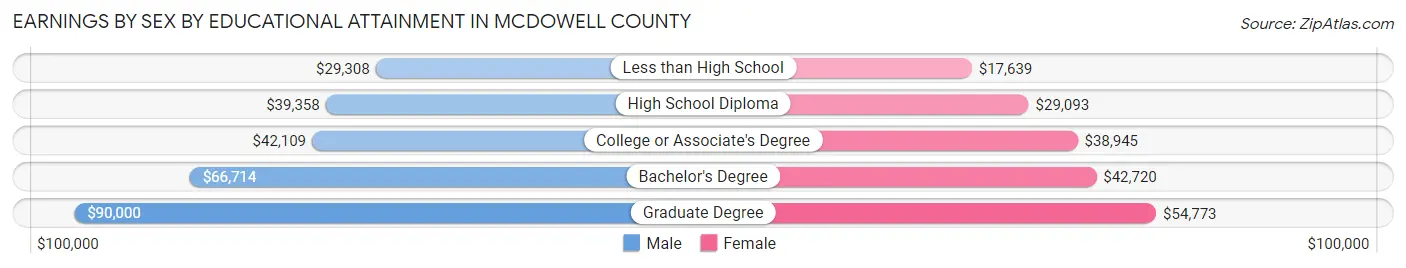
| Educational Attainment | Male Income | Female Income |
| Less than High School | $29,308 | $17,639 |
| High School Diploma | $39,358 | $29,093 |
| College or Associate's Degree | $42,109 | $38,945 |
| Bachelor's Degree | $66,714 | $42,720 |
| Graduate Degree | $90,000 | $54,773 |
| Total | $40,964 | $36,778 |
Family Income in McDowell County
Family Income Brackets in McDowell County
According to the McDowell County family income data, there are 2,789 families falling into the $50,000 to $74,999 income range, which is the most common income bracket and makes up 21.9% of all families. Conversely, the $10,000 to $14,999 income bracket is the least frequent group with only 331 families (2.6%) belonging to this category.
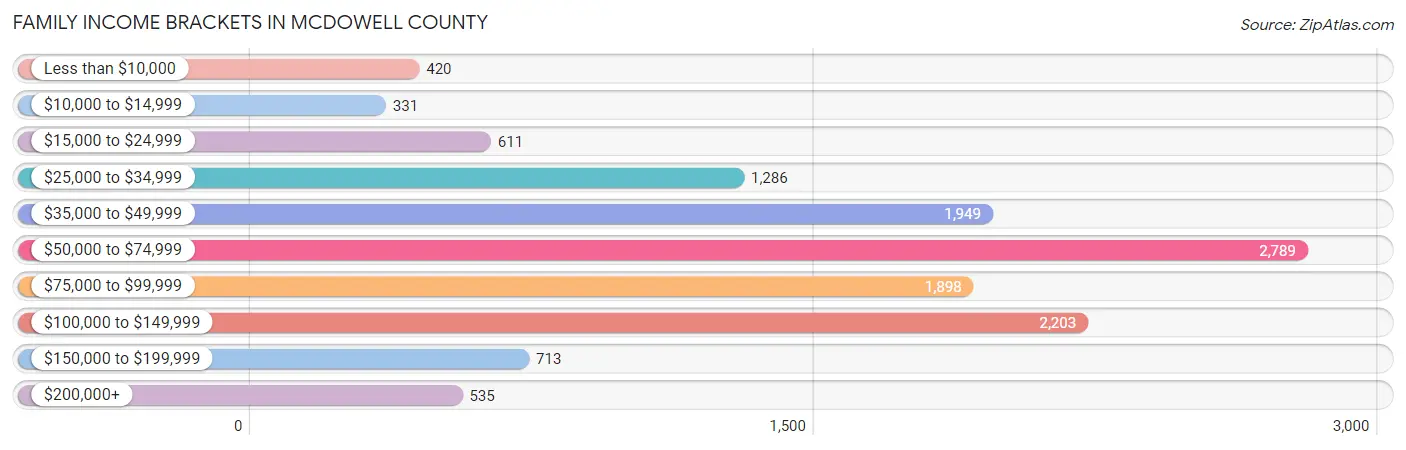
| Income Bracket | # Families | % Families |
| Less than $10,000 | 420 | 3.3% |
| $10,000 to $14,999 | 331 | 2.6% |
| $15,000 to $24,999 | 611 | 4.8% |
| $25,000 to $34,999 | 1,286 | 10.1% |
| $35,000 to $49,999 | 1,949 | 15.3% |
| $50,000 to $74,999 | 2,789 | 21.9% |
| $75,000 to $99,999 | 1,898 | 14.9% |
| $100,000 to $149,999 | 2,203 | 17.3% |
| $150,000 to $199,999 | 713 | 5.6% |
| $200,000+ | 535 | 4.2% |
Family Income by Famaliy Size in McDowell County
7+ person families (127 | 1.0%) account for the highest median family income in McDowell County with $106,939 per family, while 2-person families (6,699 | 52.6%) have the highest median income of $29,440 per family member.
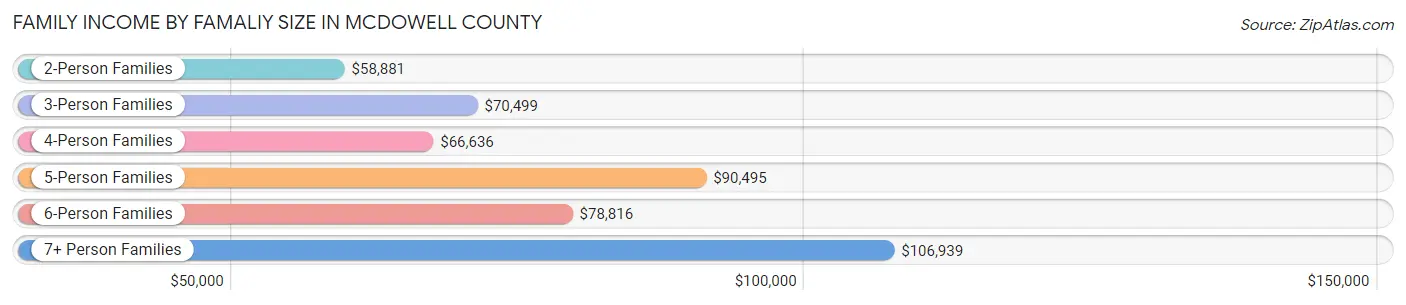
| Income Bracket | # Families | Median Income |
| 2-Person Families | 6,699 (52.6%) | $58,881 |
| 3-Person Families | 3,027 (23.8%) | $70,499 |
| 4-Person Families | 1,887 (14.8%) | $66,636 |
| 5-Person Families | 702 (5.5%) | $90,495 |
| 6-Person Families | 294 (2.3%) | $78,816 |
| 7+ Person Families | 127 (1.0%) | $106,939 |
| Total | 12,736 (100.0%) | $65,510 |
Family Income by Number of Earners in McDowell County
The median family income in McDowell County is $65,510, with families comprising 3+ earners (960) having the highest median family income of $124,744, while families with no earners (2,887) have the lowest median family income of $41,875, accounting for 7.5% and 22.7% of families, respectively.
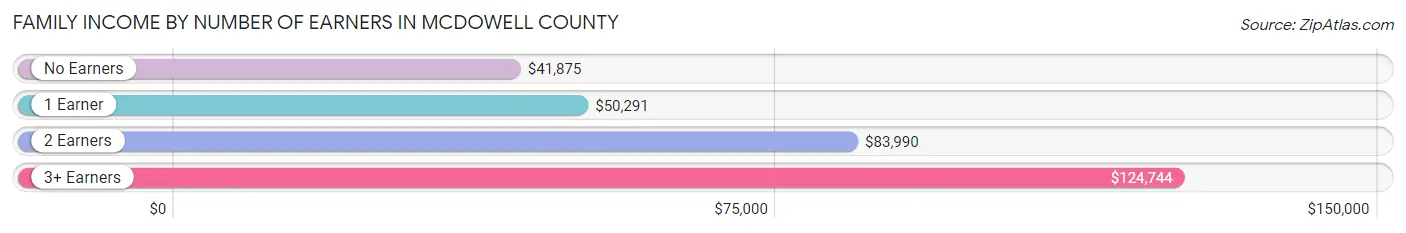
| Number of Earners | # Families | Median Income |
| No Earners | 2,887 (22.7%) | $41,875 |
| 1 Earner | 4,230 (33.2%) | $50,291 |
| 2 Earners | 4,659 (36.6%) | $83,990 |
| 3+ Earners | 960 (7.5%) | $124,744 |
| Total | 12,736 (100.0%) | $65,510 |
Household Income in McDowell County
Household Income Brackets in McDowell County
With 3,437 households falling in the category, the $50,000 to $74,999 income range is the most frequent in McDowell County, accounting for 18.9% of all households. In contrast, only 600 households (3.3%) fall into the $200,000+ income bracket, making it the least populous group.
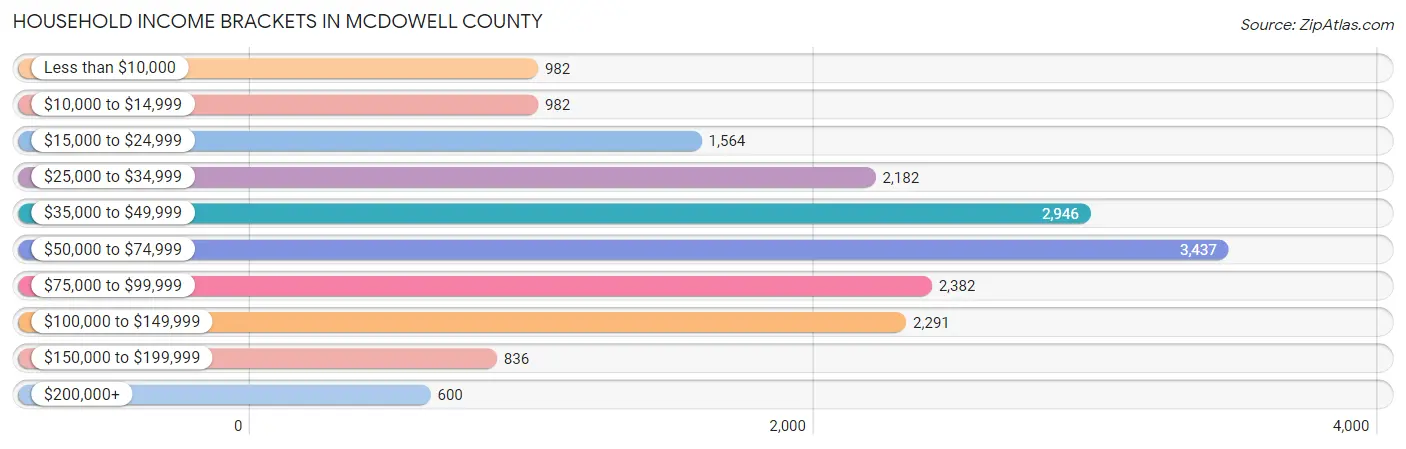
| Income Bracket | # Households | % Households |
| Less than $10,000 | 982 | 5.4% |
| $10,000 to $14,999 | 982 | 5.4% |
| $15,000 to $24,999 | 1,564 | 8.6% |
| $25,000 to $34,999 | 2,182 | 12.0% |
| $35,000 to $49,999 | 2,946 | 16.2% |
| $50,000 to $74,999 | 3,437 | 18.9% |
| $75,000 to $99,999 | 2,382 | 13.1% |
| $100,000 to $149,999 | 2,291 | 12.6% |
| $150,000 to $199,999 | 836 | 4.6% |
| $200,000+ | 600 | 3.3% |
Household Income by Householder Age in McDowell County
The median household income in McDowell County is $53,532, with the highest median household income of $64,109 found in the 25 to 44 years age bracket for the primary householder. A total of 4,872 households (26.8%) fall into this category. Meanwhile, the 65+ years age bracket for the primary householder has the lowest median household income of $46,774, with 5,736 households (31.5%) in this group.
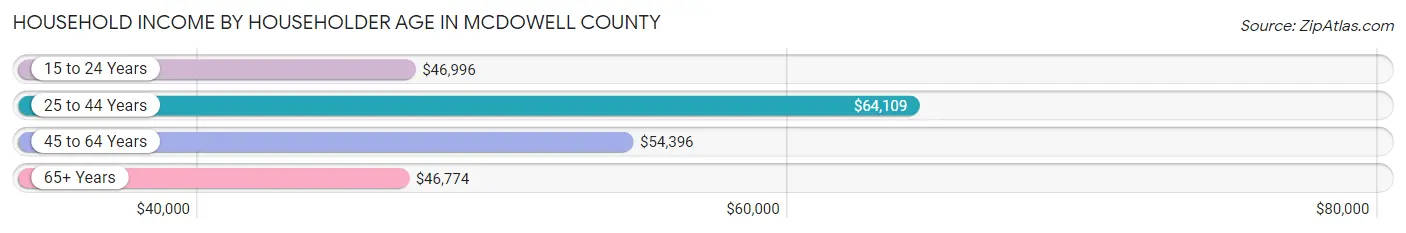
| Income Bracket | # Households | Median Income |
| 15 to 24 Years | 389 (2.1%) | $46,996 |
| 25 to 44 Years | 4,872 (26.8%) | $64,109 |
| 45 to 64 Years | 7,187 (39.5%) | $54,396 |
| 65+ Years | 5,736 (31.5%) | $46,774 |
| Total | 18,184 (100.0%) | $53,532 |
Poverty in McDowell County
Income Below Poverty by Sex and Age in McDowell County
With 13.4% poverty level for males and 16.5% for females among the residents of McDowell County, 16 and 17 year old males and under 5 year old females are the most vulnerable to poverty, with 147 males (27.3%) and 292 females (28.2%) in their respective age groups living below the poverty level.
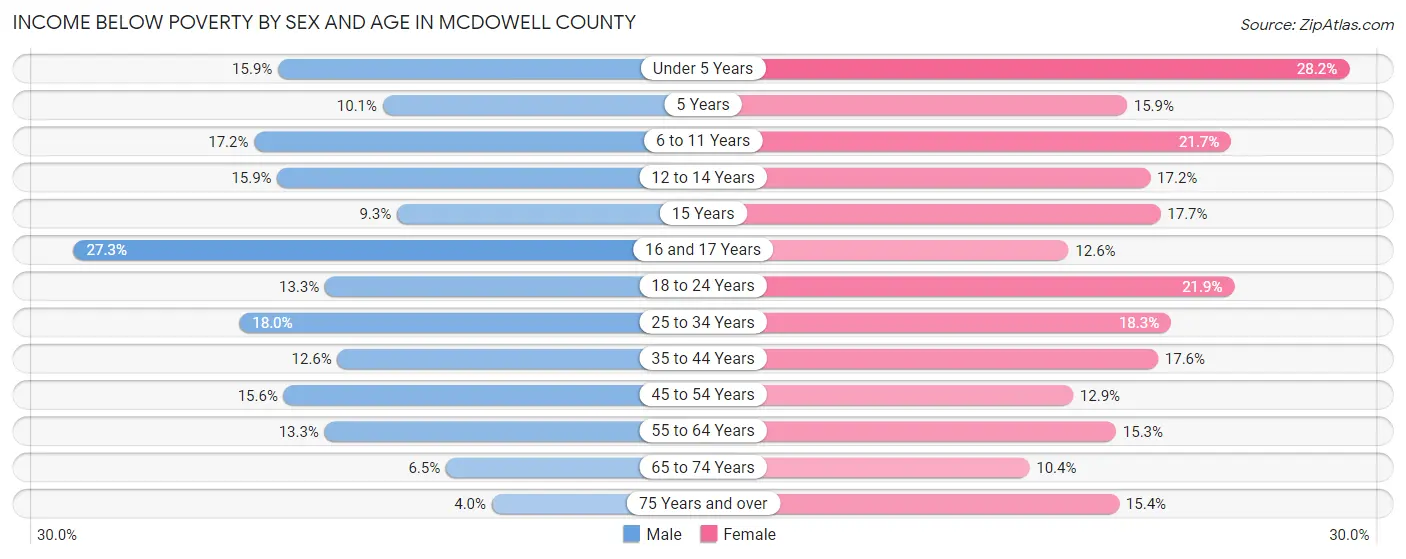
| Age Bracket | Male | Female |
| Under 5 Years | 159 (15.9%) | 292 (28.2%) |
| 5 Years | 38 (10.1%) | 20 (15.9%) |
| 6 to 11 Years | 234 (17.2%) | 286 (21.7%) |
| 12 to 14 Years | 159 (15.9%) | 124 (17.2%) |
| 15 Years | 25 (9.3%) | 58 (17.7%) |
| 16 and 17 Years | 147 (27.3%) | 67 (12.6%) |
| 18 to 24 Years | 197 (13.3%) | 349 (21.8%) |
| 25 to 34 Years | 468 (18.0%) | 449 (18.3%) |
| 35 to 44 Years | 321 (12.6%) | 456 (17.6%) |
| 45 to 54 Years | 463 (15.6%) | 373 (12.9%) |
| 55 to 64 Years | 424 (13.3%) | 521 (15.3%) |
| 65 to 74 Years | 167 (6.5%) | 298 (10.4%) |
| 75 Years and over | 60 (4.0%) | 308 (15.4%) |
| Total | 2,862 (13.4%) | 3,601 (16.5%) |
Income Above Poverty by Sex and Age in McDowell County
According to the poverty statistics in McDowell County, males aged 75 years and over and females aged 65 to 74 years are the age groups that are most secure financially, with 96.0% of males and 89.6% of females in these age groups living above the poverty line.
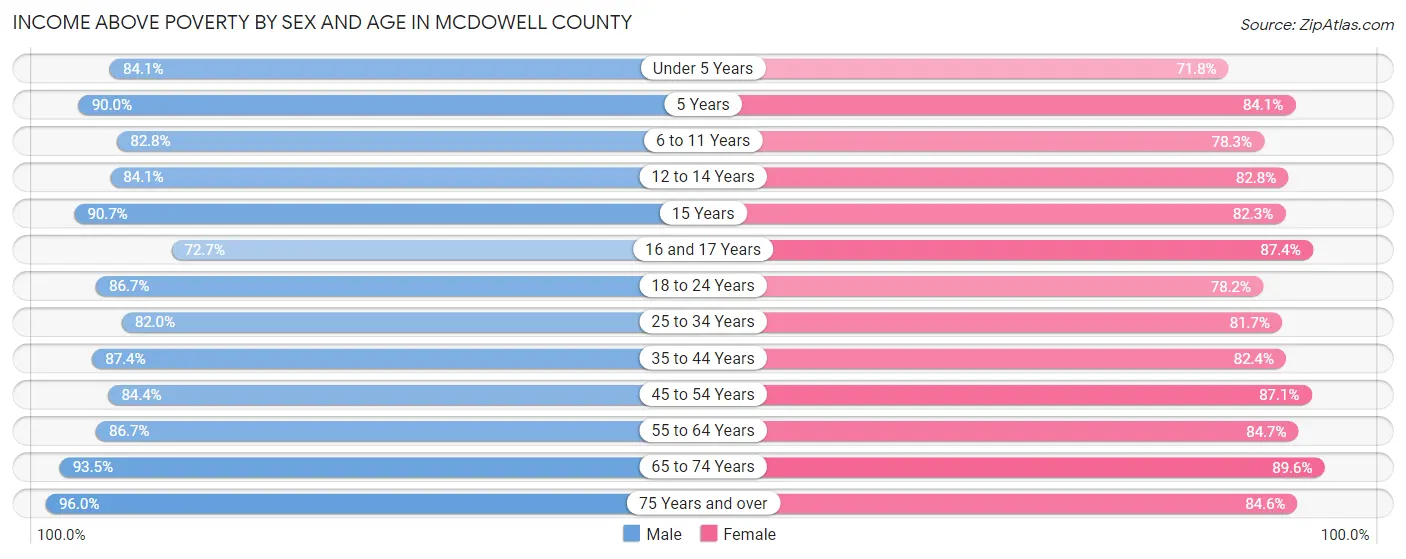
| Age Bracket | Male | Female |
| Under 5 Years | 842 (84.1%) | 742 (71.8%) |
| 5 Years | 340 (89.9%) | 106 (84.1%) |
| 6 to 11 Years | 1,126 (82.8%) | 1,033 (78.3%) |
| 12 to 14 Years | 840 (84.1%) | 598 (82.8%) |
| 15 Years | 245 (90.7%) | 269 (82.3%) |
| 16 and 17 Years | 392 (72.7%) | 464 (87.4%) |
| 18 to 24 Years | 1,287 (86.7%) | 1,248 (78.1%) |
| 25 to 34 Years | 2,126 (82.0%) | 2,000 (81.7%) |
| 35 to 44 Years | 2,233 (87.4%) | 2,135 (82.4%) |
| 45 to 54 Years | 2,510 (84.4%) | 2,526 (87.1%) |
| 55 to 64 Years | 2,766 (86.7%) | 2,894 (84.7%) |
| 65 to 74 Years | 2,391 (93.5%) | 2,556 (89.6%) |
| 75 Years and over | 1,446 (96.0%) | 1,688 (84.6%) |
| Total | 18,544 (86.6%) | 18,259 (83.5%) |
Income Below Poverty Among Married-Couple Families in McDowell County
The poverty statistics for married-couple families in McDowell County show that 7.5% or 719 of the total 9,520 families live below the poverty line. Families with 3 or 4 children have the highest poverty rate of 20.2%, comprising of 117 families. On the other hand, families with 5 or more children have the lowest poverty rate of 0.0%, which includes 0 families.

| Children | Above Poverty | Below Poverty |
| No Children | 5,962 (94.6%) | 339 (5.4%) |
| 1 or 2 Children | 2,354 (89.9%) | 263 (10.1%) |
| 3 or 4 Children | 462 (79.8%) | 117 (20.2%) |
| 5 or more Children | 23 (100.0%) | 0 (0.0%) |
| Total | 8,801 (92.4%) | 719 (7.5%) |
Income Below Poverty Among Single-Parent Households in McDowell County
According to the poverty data in McDowell County, 10.5% or 88 single-father households and 19.0% or 452 single-mother households are living below the poverty line. Among single-father households, those with 1 or 2 children have the highest poverty rate, with 34 households (14.2%) experiencing poverty. Likewise, among single-mother households, those with 5 or more children have the highest poverty rate, with 18 households (100.0%) falling below the poverty line.
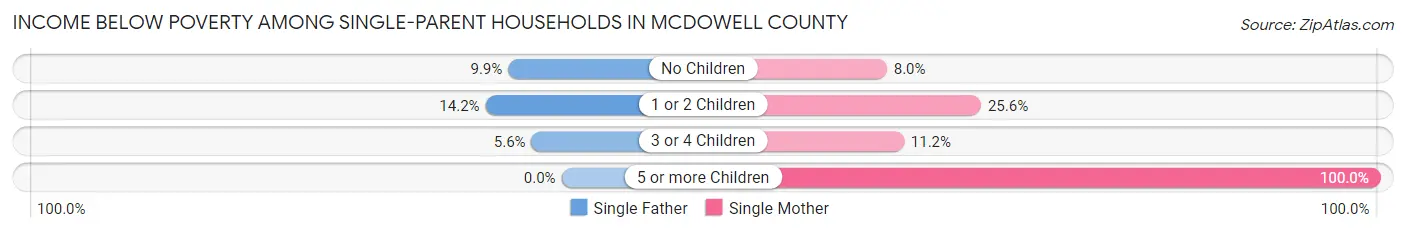
| Children | Single Father | Single Mother |
| No Children | 47 (9.9%) | 70 (8.0%) |
| 1 or 2 Children | 34 (14.2%) | 351 (25.6%) |
| 3 or 4 Children | 7 (5.6%) | 13 (11.2%) |
| 5 or more Children | 0 (0.0%) | 18 (100.0%) |
| Total | 88 (10.5%) | 452 (19.0%) |
Income Below Poverty Among Married-Couple vs Single-Parent Households in McDowell County
The poverty data for McDowell County shows that 719 of the married-couple family households (7.5%) and 540 of the single-parent households (16.8%) are living below the poverty level. Within the married-couple family households, those with 3 or 4 children have the highest poverty rate, with 117 households (20.2%) falling below the poverty line. Among the single-parent households, those with 5 or more children have the highest poverty rate, with 18 household (100.0%) living below poverty.
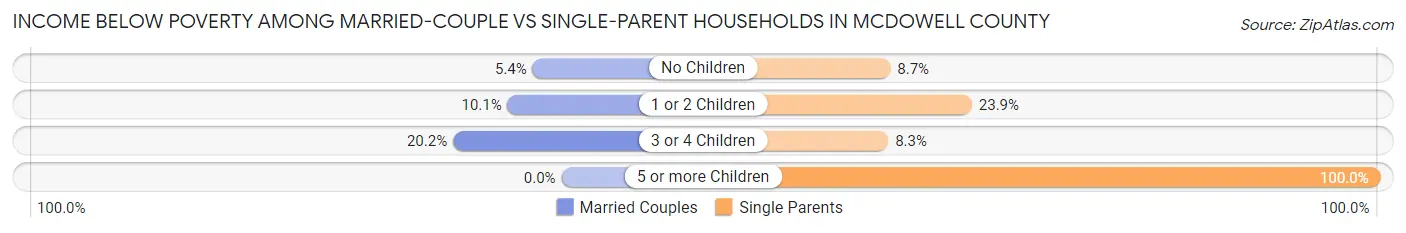
| Children | Married-Couple Families | Single-Parent Households |
| No Children | 339 (5.4%) | 117 (8.7%) |
| 1 or 2 Children | 263 (10.1%) | 385 (23.9%) |
| 3 or 4 Children | 117 (20.2%) | 20 (8.3%) |
| 5 or more Children | 0 (0.0%) | 18 (100.0%) |
| Total | 719 (7.5%) | 540 (16.8%) |
Employment Characteristics in McDowell County
Employment by Class of Employer in McDowell County
Among the 18,297 employed individuals in McDowell County, private company employees (12,865 | 70.3%), state government employees (1,363 | 7.4%), and local government employees (1,276 | 7.0%) make up the most common classes of employment.
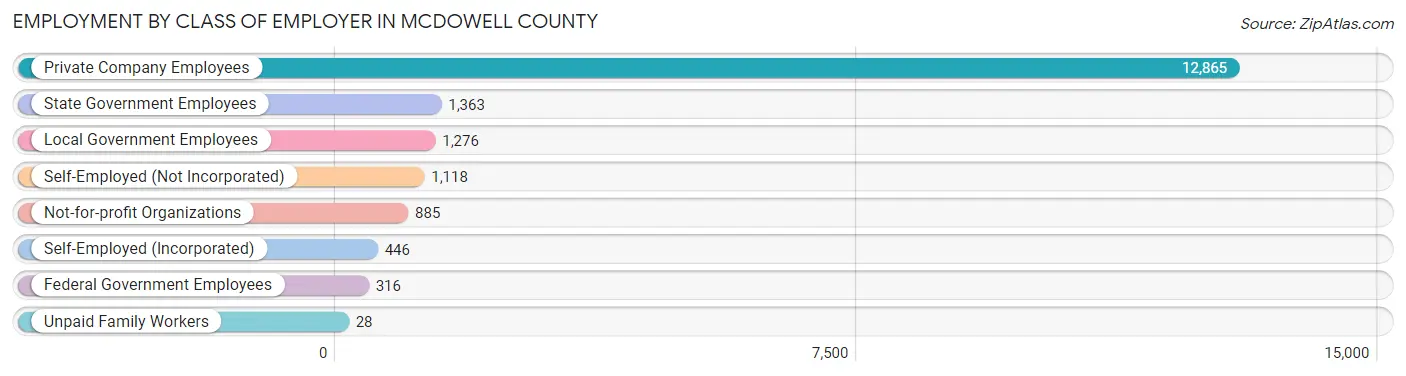
| Employer Class | # Employees | % Employees |
| Private Company Employees | 12,865 | 70.3% |
| Self-Employed (Incorporated) | 446 | 2.4% |
| Self-Employed (Not Incorporated) | 1,118 | 6.1% |
| Not-for-profit Organizations | 885 | 4.8% |
| Local Government Employees | 1,276 | 7.0% |
| State Government Employees | 1,363 | 7.4% |
| Federal Government Employees | 316 | 1.7% |
| Unpaid Family Workers | 28 | 0.2% |
| Total | 18,297 | 100.0% |
Employment Status by Age in McDowell County
According to the labor force statistics for McDowell County, out of the total population over 16 years of age (36,939), 53.8% or 19,873 individuals are in the labor force, with 5.5% or 1,093 of them unemployed. The age group with the highest labor force participation rate is 30 to 34 years, with 81.6% or 1,962 individuals in the labor force. Within the labor force, the 25 to 29 years age range has the highest percentage of unemployed individuals, with 10.3% or 239 of them being unemployed.

| Age Bracket | In Labor Force | Unemployed |
| 16 to 19 Years | 1,059 (50.6%) | 85 (8.0%) |
| 20 to 24 Years | 1,687 (75.5%) | 66 (3.9%) |
| 25 to 29 Years | 2,323 (78.4%) | 239 (10.3%) |
| 30 to 34 Years | 1,962 (81.6%) | 110 (5.6%) |
| 35 to 44 Years | 3,823 (70.1%) | 96 (2.5%) |
| 45 to 54 Years | 4,368 (73.2%) | 306 (7.0%) |
| 55 to 59 Years | 2,024 (68.9%) | 59 (2.9%) |
| 60 to 64 Years | 1,435 (38.8%) | 123 (8.6%) |
| 65 to 74 Years | 1,055 (19.2%) | 18 (1.7%) |
| 75 Years and over | 159 (4.3%) | 0 (0.0%) |
| Total | 19,873 (53.8%) | 1,093 (5.5%) |
Employment Status by Educational Attainment in McDowell County
According to labor force statistics for McDowell County, 68.0% of individuals (15,928) out of the total population between 25 and 64 years of age (23,424) are in the labor force, with 5.8% or 924 of them being unemployed. The group with the highest labor force participation rate are those with the educational attainment of bachelor's degree or higher, with 81.4% or 3,327 individuals in the labor force. Within the labor force, individuals with less than high school education have the highest percentage of unemployment, with 20.1% or 276 of them being unemployed.
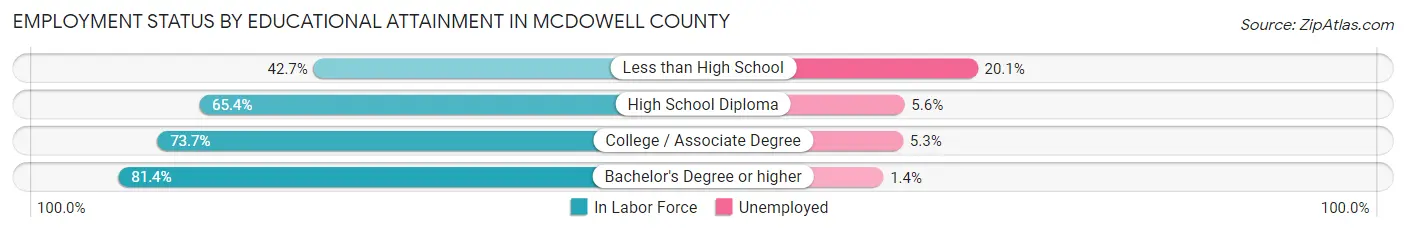
| Educational Attainment | In Labor Force | Unemployed |
| Less than High School | 1,372 (42.7%) | 646 (20.1%) |
| High School Diploma | 5,119 (65.4%) | 438 (5.6%) |
| College / Associate Degree | 6,115 (73.7%) | 440 (5.3%) |
| Bachelor's Degree or higher | 3,327 (81.4%) | 57 (1.4%) |
| Total | 15,928 (68.0%) | 1,359 (5.8%) |
Employment Occupations by Sex in McDowell County
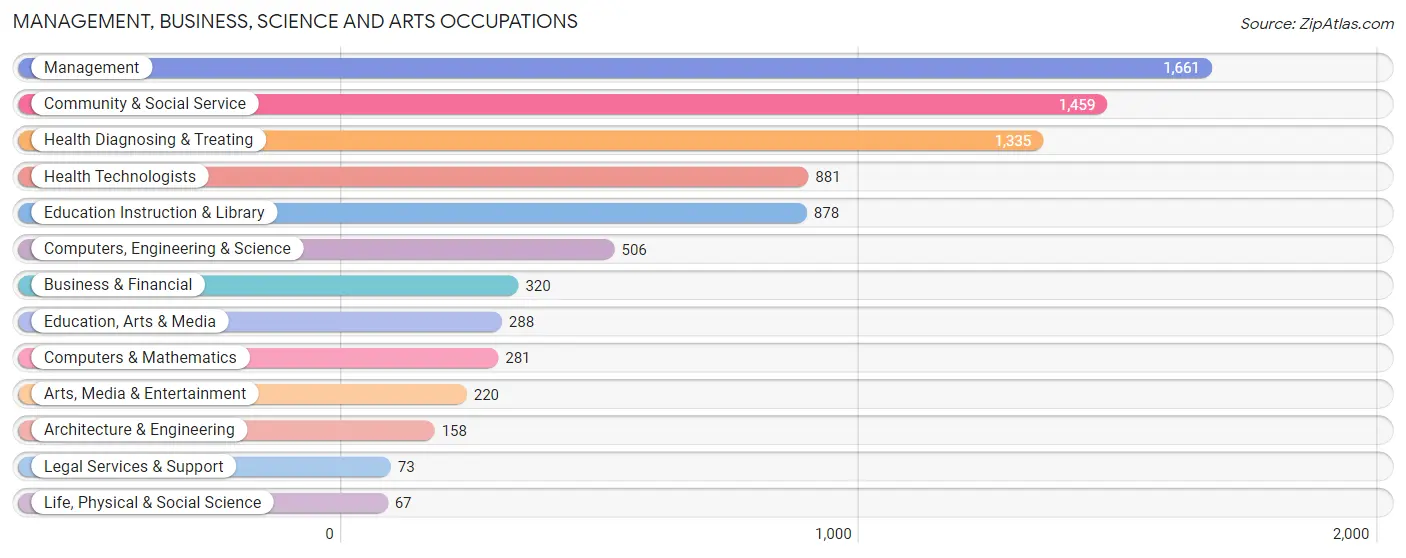
Management, Business, Science and Arts Occupations
The most common Management, Business, Science and Arts occupations in McDowell County are Management (1,661 | 8.8%), Community & Social Service (1,459 | 7.8%), Health Diagnosing & Treating (1,335 | 7.1%), Health Technologists (881 | 4.7%), and Education Instruction & Library (878 | 4.7%).
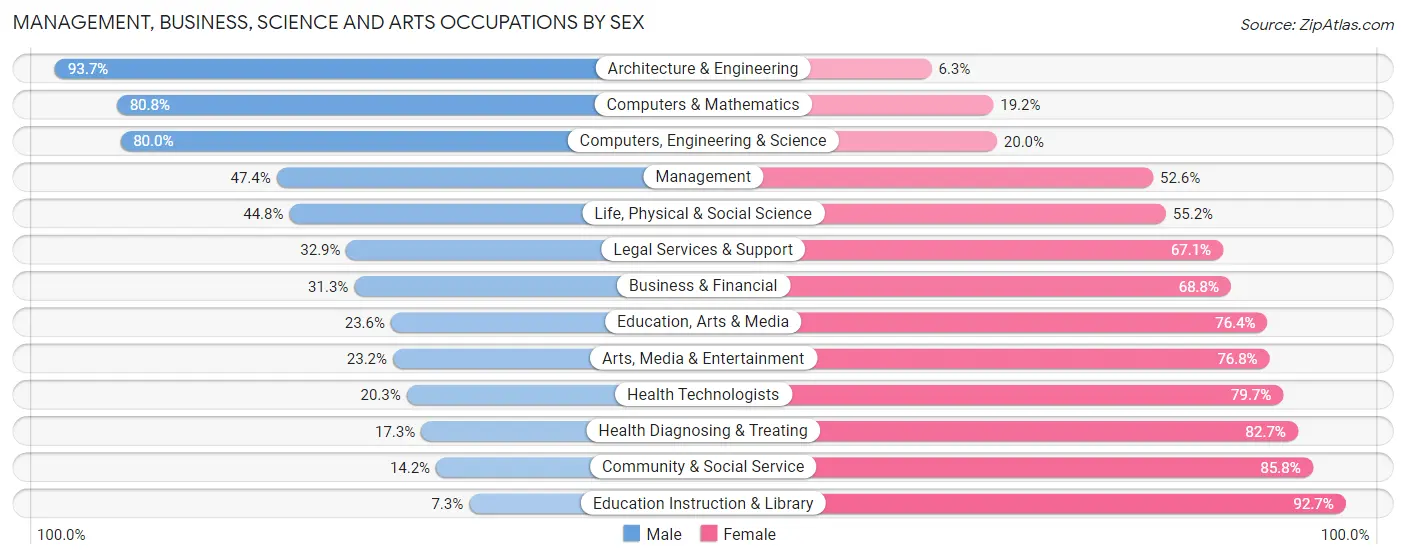
Management, Business, Science and Arts Occupations by Sex
Within the Management, Business, Science and Arts occupations in McDowell County, the most male-oriented occupations are Architecture & Engineering (93.7%), Computers & Mathematics (80.8%), and Computers, Engineering & Science (80.0%), while the most female-oriented occupations are Education Instruction & Library (92.7%), Community & Social Service (85.8%), and Health Diagnosing & Treating (82.7%).
| Occupation | Male | Female |
| Management | 788 (47.4%) | 873 (52.6%) |
| Business & Financial | 100 (31.2%) | 220 (68.8%) |
| Computers, Engineering & Science | 405 (80.0%) | 101 (20.0%) |
| Computers & Mathematics | 227 (80.8%) | 54 (19.2%) |
| Architecture & Engineering | 148 (93.7%) | 10 (6.3%) |
| Life, Physical & Social Science | 30 (44.8%) | 37 (55.2%) |
| Community & Social Service | 207 (14.2%) | 1,252 (85.8%) |
| Education, Arts & Media | 68 (23.6%) | 220 (76.4%) |
| Legal Services & Support | 24 (32.9%) | 49 (67.1%) |
| Education Instruction & Library | 64 (7.3%) | 814 (92.7%) |
| Arts, Media & Entertainment | 51 (23.2%) | 169 (76.8%) |
| Health Diagnosing & Treating | 231 (17.3%) | 1,104 (82.7%) |
| Health Technologists | 179 (20.3%) | 702 (79.7%) |
| Total (Category) | 1,731 (32.8%) | 3,550 (67.2%) |
| Total (Overall) | 9,714 (51.7%) | 9,079 (48.3%) |
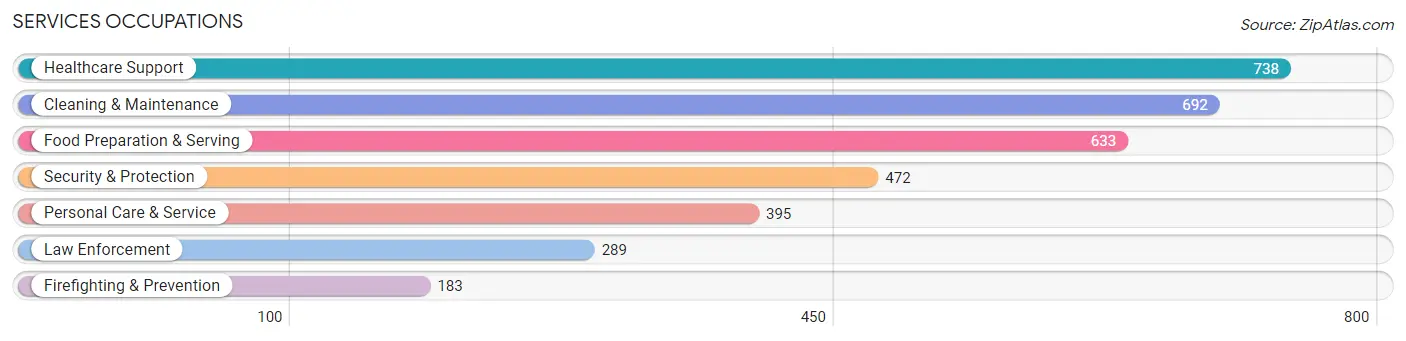
Services Occupations
The most common Services occupations in McDowell County are Healthcare Support (738 | 3.9%), Cleaning & Maintenance (692 | 3.7%), Food Preparation & Serving (633 | 3.4%), Security & Protection (472 | 2.5%), and Personal Care & Service (395 | 2.1%).
Services Occupations by Sex
Within the Services occupations in McDowell County, the most male-oriented occupations are Law Enforcement (84.1%), Security & Protection (79.2%), and Cleaning & Maintenance (73.1%), while the most female-oriented occupations are Food Preparation & Serving (82.8%), Healthcare Support (82.0%), and Personal Care & Service (73.4%).
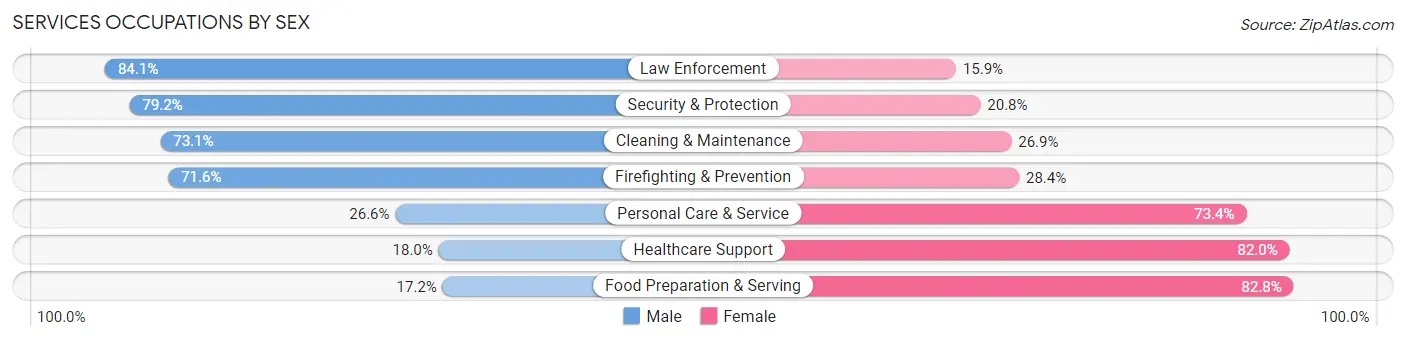
| Occupation | Male | Female |
| Healthcare Support | 133 (18.0%) | 605 (82.0%) |
| Security & Protection | 374 (79.2%) | 98 (20.8%) |
| Firefighting & Prevention | 131 (71.6%) | 52 (28.4%) |
| Law Enforcement | 243 (84.1%) | 46 (15.9%) |
| Food Preparation & Serving | 109 (17.2%) | 524 (82.8%) |
| Cleaning & Maintenance | 506 (73.1%) | 186 (26.9%) |
| Personal Care & Service | 105 (26.6%) | 290 (73.4%) |
| Total (Category) | 1,227 (41.9%) | 1,703 (58.1%) |
| Total (Overall) | 9,714 (51.7%) | 9,079 (48.3%) |
Sales and Office Occupations
The most common Sales and Office occupations in McDowell County are Office & Administration (1,735 | 9.2%), and Sales & Related (1,435 | 7.6%).

Sales and Office Occupations by Sex
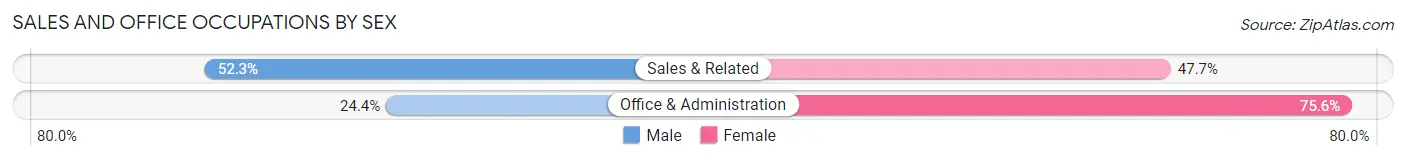
| Occupation | Male | Female |
| Sales & Related | 750 (52.3%) | 685 (47.7%) |
| Office & Administration | 423 (24.4%) | 1,312 (75.6%) |
| Total (Category) | 1,173 (37.0%) | 1,997 (63.0%) |
| Total (Overall) | 9,714 (51.7%) | 9,079 (48.3%) |
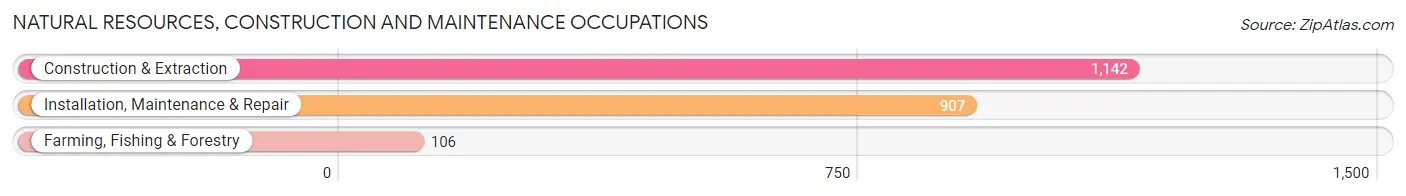
Natural Resources, Construction and Maintenance Occupations
The most common Natural Resources, Construction and Maintenance occupations in McDowell County are Construction & Extraction (1,142 | 6.1%), Installation, Maintenance & Repair (907 | 4.8%), and Farming, Fishing & Forestry (106 | 0.6%).
Natural Resources, Construction and Maintenance Occupations by Sex
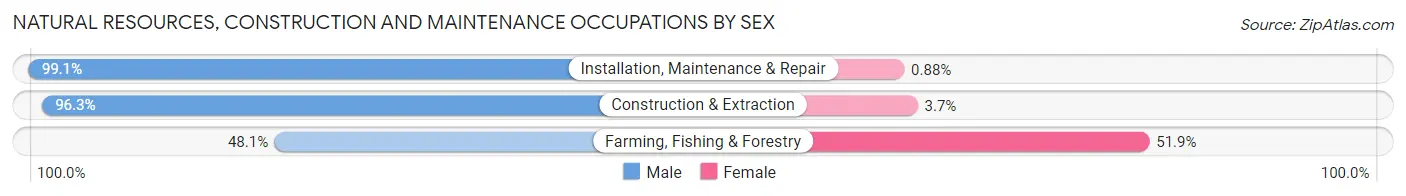
| Occupation | Male | Female |
| Farming, Fishing & Forestry | 51 (48.1%) | 55 (51.9%) |
| Construction & Extraction | 1,100 (96.3%) | 42 (3.7%) |
| Installation, Maintenance & Repair | 899 (99.1%) | 8 (0.9%) |
| Total (Category) | 2,050 (95.1%) | 105 (4.9%) |
| Total (Overall) | 9,714 (51.7%) | 9,079 (48.3%) |
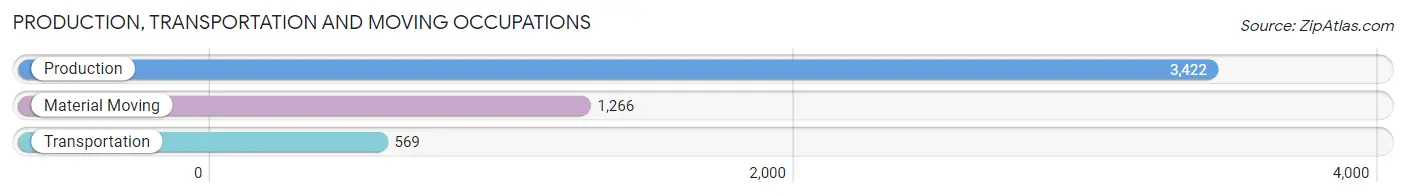
Production, Transportation and Moving Occupations
The most common Production, Transportation and Moving occupations in McDowell County are Production (3,422 | 18.2%), Material Moving (1,266 | 6.7%), and Transportation (569 | 3.0%).
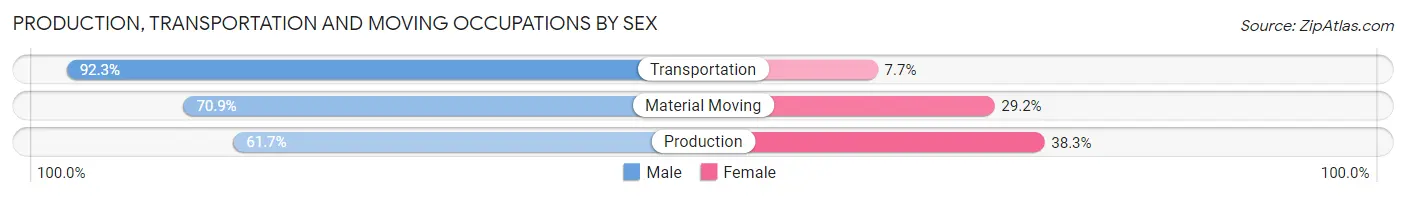
Production, Transportation and Moving Occupations by Sex
| Occupation | Male | Female |
| Production | 2,111 (61.7%) | 1,311 (38.3%) |
| Transportation | 525 (92.3%) | 44 (7.7%) |
| Material Moving | 897 (70.9%) | 369 (29.1%) |
| Total (Category) | 3,533 (67.2%) | 1,724 (32.8%) |
| Total (Overall) | 9,714 (51.7%) | 9,079 (48.3%) |
Employment Industries by Sex in McDowell County
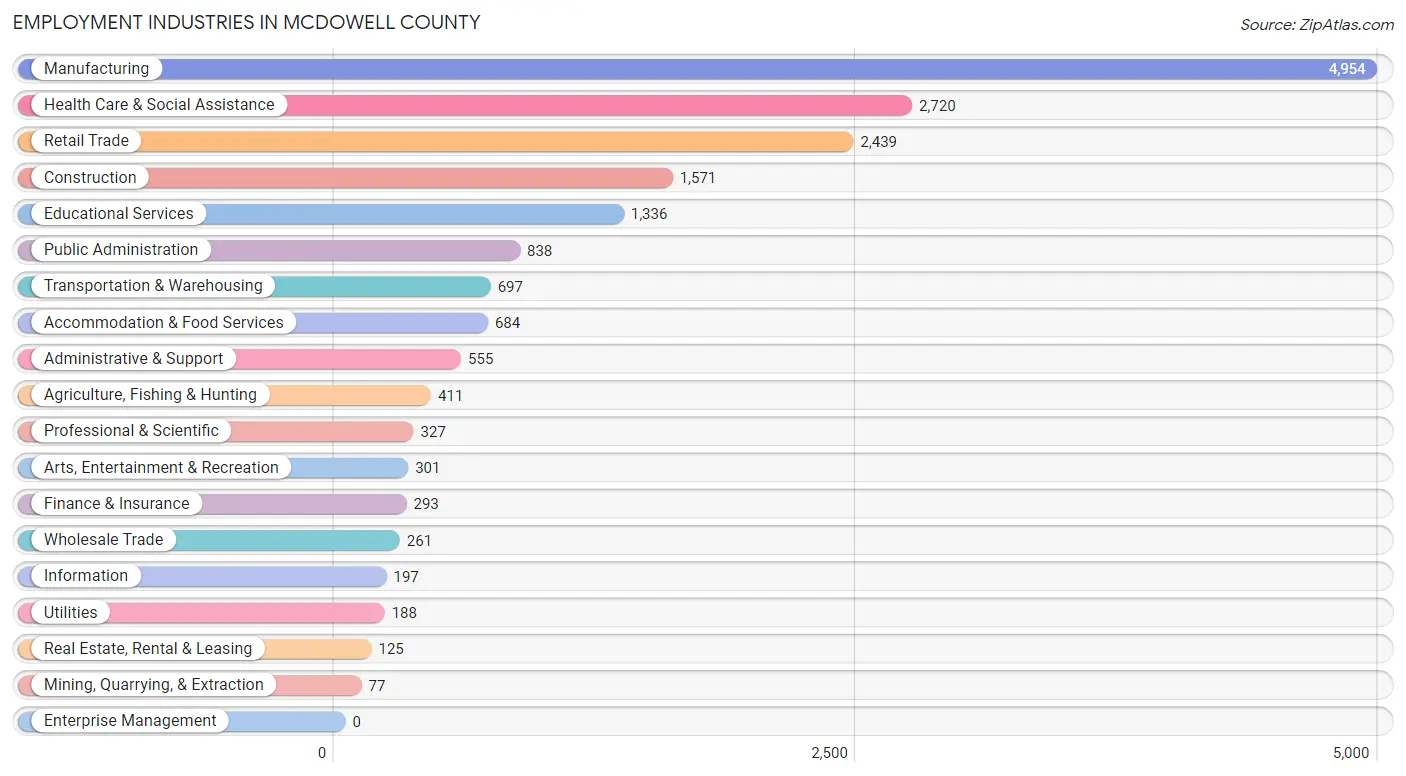
Employment Industries in McDowell County
The major employment industries in McDowell County include Manufacturing (4,954 | 26.4%), Health Care & Social Assistance (2,720 | 14.5%), Retail Trade (2,439 | 13.0%), Construction (1,571 | 8.4%), and Educational Services (1,336 | 7.1%).
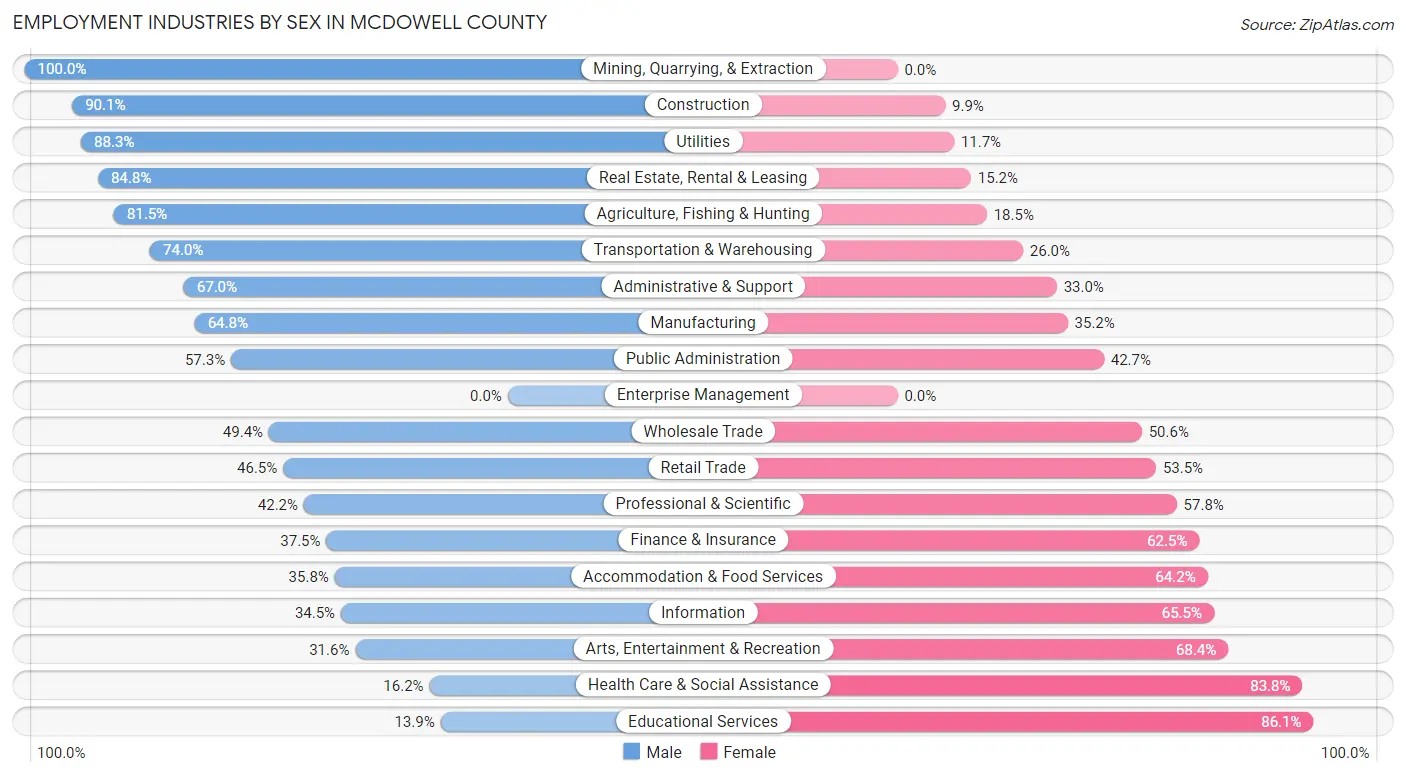
Employment Industries by Sex in McDowell County
The McDowell County industries that see more men than women are Mining, Quarrying, & Extraction (100.0%), Construction (90.1%), and Utilities (88.3%), whereas the industries that tend to have a higher number of women are Educational Services (86.1%), Health Care & Social Assistance (83.8%), and Arts, Entertainment & Recreation (68.4%).
| Industry | Male | Female |
| Agriculture, Fishing & Hunting | 335 (81.5%) | 76 (18.5%) |
| Mining, Quarrying, & Extraction | 77 (100.0%) | 0 (0.0%) |
| Construction | 1,416 (90.1%) | 155 (9.9%) |
| Manufacturing | 3,209 (64.8%) | 1,745 (35.2%) |
| Wholesale Trade | 129 (49.4%) | 132 (50.6%) |
| Retail Trade | 1,134 (46.5%) | 1,305 (53.5%) |
| Transportation & Warehousing | 516 (74.0%) | 181 (26.0%) |
| Utilities | 166 (88.3%) | 22 (11.7%) |
| Information | 68 (34.5%) | 129 (65.5%) |
| Finance & Insurance | 110 (37.5%) | 183 (62.5%) |
| Real Estate, Rental & Leasing | 106 (84.8%) | 19 (15.2%) |
| Professional & Scientific | 138 (42.2%) | 189 (57.8%) |
| Enterprise Management | 0 (0.0%) | 0 (0.0%) |
| Administrative & Support | 372 (67.0%) | 183 (33.0%) |
| Educational Services | 186 (13.9%) | 1,150 (86.1%) |
| Health Care & Social Assistance | 441 (16.2%) | 2,279 (83.8%) |
| Arts, Entertainment & Recreation | 95 (31.6%) | 206 (68.4%) |
| Accommodation & Food Services | 245 (35.8%) | 439 (64.2%) |
| Public Administration | 480 (57.3%) | 358 (42.7%) |
| Total | 9,714 (51.7%) | 9,079 (48.3%) |
Education in McDowell County
School Enrollment in McDowell County
The most common levels of schooling among the 8,635 students in McDowell County are high school (2,149 | 24.9%), middle school (2,029 | 23.5%), and elementary school (1,873 | 21.7%).
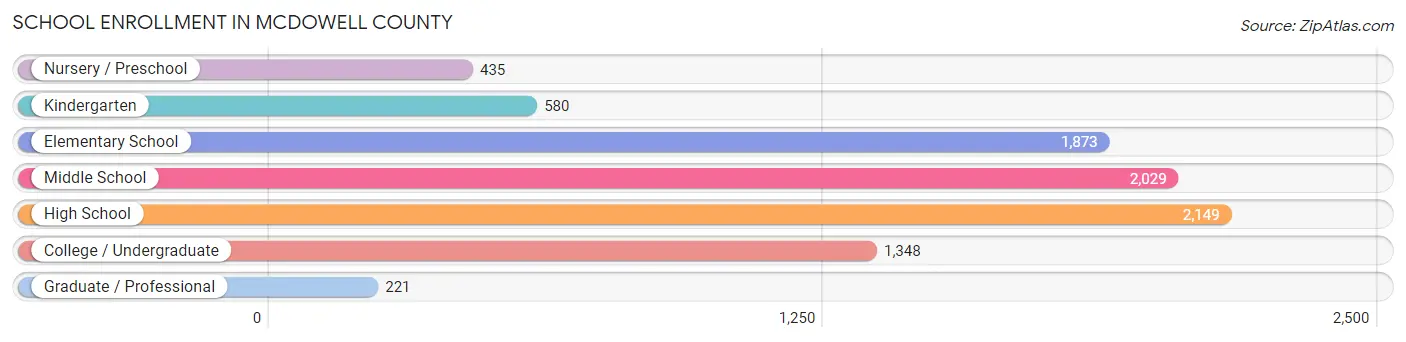
| School Level | # Students | % Students |
| Nursery / Preschool | 435 | 5.0% |
| Kindergarten | 580 | 6.7% |
| Elementary School | 1,873 | 21.7% |
| Middle School | 2,029 | 23.5% |
| High School | 2,149 | 24.9% |
| College / Undergraduate | 1,348 | 15.6% |
| Graduate / Professional | 221 | 2.6% |
| Total | 8,635 | 100.0% |
School Enrollment by Age by Funding Source in McDowell County
Out of a total of 8,635 students who are enrolled in schools in McDowell County, 1,097 (12.7%) attend a private institution, while the remaining 7,538 (87.3%) are enrolled in public schools. The age group of 3 to 4 year olds has the highest likelihood of being enrolled in private schools, with 120 (36.9% in the age bracket) enrolled. Conversely, the age group of 25 to 34 year olds has the lowest likelihood of being enrolled in a private school, with 242 (98.8% in the age bracket) attending a public institution.
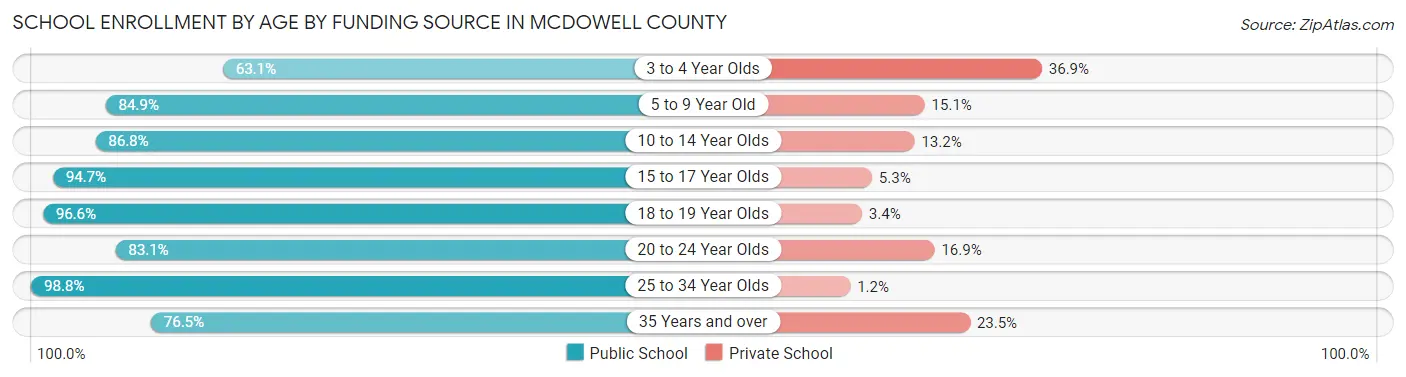
| Age Bracket | Public School | Private School |
| 3 to 4 Year Olds | 205 (63.1%) | 120 (36.9%) |
| 5 to 9 Year Old | 1,907 (84.9%) | 339 (15.1%) |
| 10 to 14 Year Olds | 2,284 (86.8%) | 347 (13.2%) |
| 15 to 17 Year Olds | 1,514 (94.7%) | 84 (5.3%) |
| 18 to 19 Year Olds | 681 (96.6%) | 24 (3.4%) |
| 20 to 24 Year Olds | 329 (83.1%) | 67 (16.9%) |
| 25 to 34 Year Olds | 242 (98.8%) | 3 (1.2%) |
| 35 Years and over | 374 (76.5%) | 115 (23.5%) |
| Total | 7,538 (87.3%) | 1,097 (12.7%) |
Educational Attainment by Field of Study in McDowell County
Business (1,210 | 19.5%), education (1,194 | 19.3%), science & technology (639 | 10.3%), arts & humanities (511 | 8.2%), and bio, nature & agricultural (378 | 6.1%) are the most common fields of study among 6,198 individuals in McDowell County who have obtained a bachelor's degree or higher.
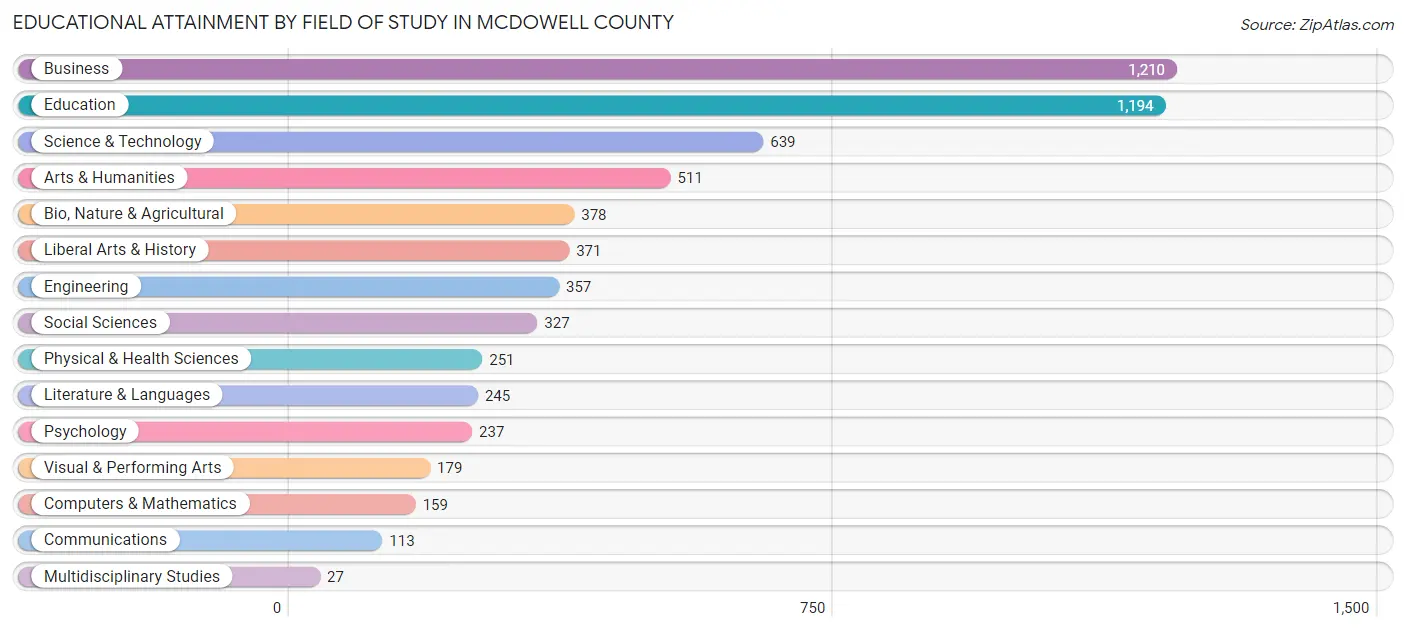
| Field of Study | # Graduates | % Graduates |
| Computers & Mathematics | 159 | 2.6% |
| Bio, Nature & Agricultural | 378 | 6.1% |
| Physical & Health Sciences | 251 | 4.1% |
| Psychology | 237 | 3.8% |
| Social Sciences | 327 | 5.3% |
| Engineering | 357 | 5.8% |
| Multidisciplinary Studies | 27 | 0.4% |
| Science & Technology | 639 | 10.3% |
| Business | 1,210 | 19.5% |
| Education | 1,194 | 19.3% |
| Literature & Languages | 245 | 4.0% |
| Liberal Arts & History | 371 | 6.0% |
| Visual & Performing Arts | 179 | 2.9% |
| Communications | 113 | 1.8% |
| Arts & Humanities | 511 | 8.2% |
| Total | 6,198 | 100.0% |
Transportation & Commute in McDowell County
Vehicle Availability by Sex in McDowell County
The most prevalent vehicle ownership categories in McDowell County are males with 2 vehicles (3,770, accounting for 40.0%) and females with 2 vehicles (3,444, making up 42.6%).
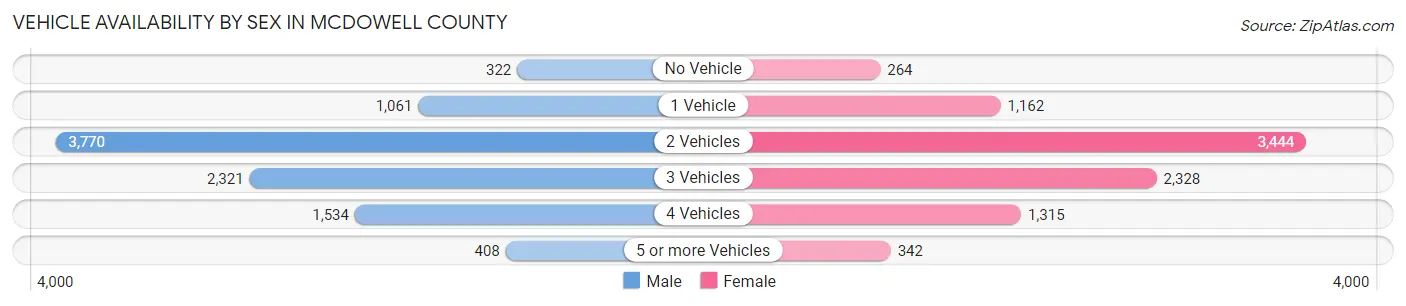
| Vehicles Available | Male | Female |
| No Vehicle | 322 (3.4%) | 264 (3.0%) |
| 1 Vehicle | 1,061 (11.3%) | 1,162 (13.1%) |
| 2 Vehicles | 3,770 (40.0%) | 3,444 (38.9%) |
| 3 Vehicles | 2,321 (24.6%) | 2,328 (26.3%) |
| 4 Vehicles | 1,534 (16.3%) | 1,315 (14.8%) |
| 5 or more Vehicles | 408 (4.3%) | 342 (3.9%) |
| Total | 9,416 (100.0%) | 8,855 (100.0%) |
Commute Time in McDowell County
The most frequently occuring commute durations in McDowell County are 15 to 19 minutes (2,925 commuters, 16.7%), 20 to 24 minutes (2,463 commuters, 14.0%), and 10 to 14 minutes (2,457 commuters, 14.0%).
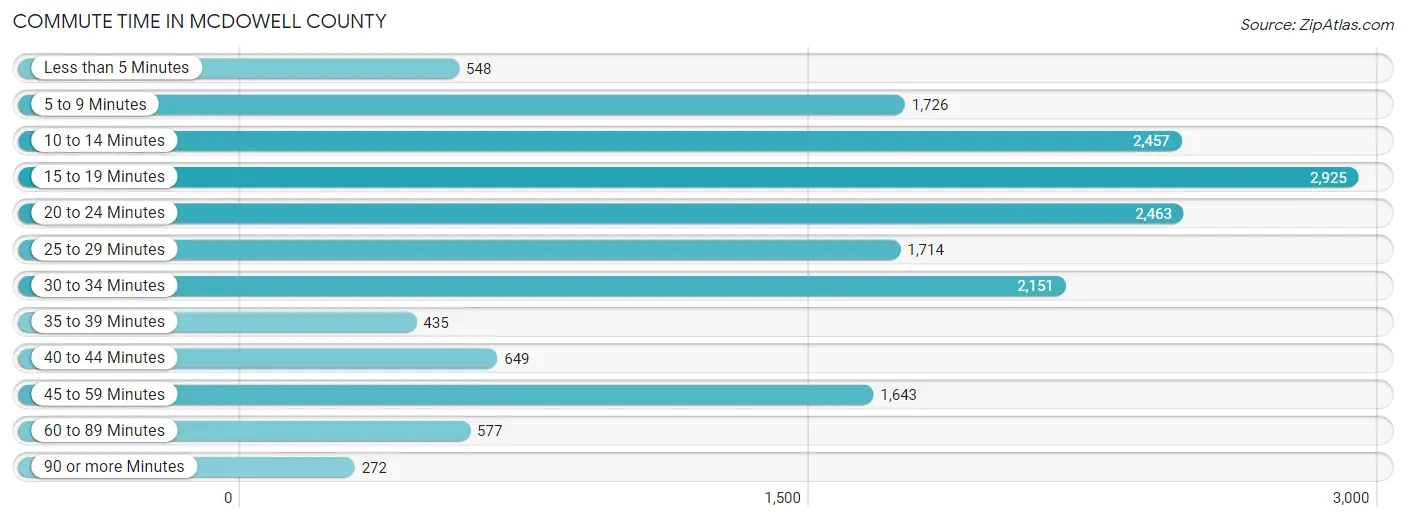
| Commute Time | # Commuters | % Commuters |
| Less than 5 Minutes | 548 | 3.1% |
| 5 to 9 Minutes | 1,726 | 9.8% |
| 10 to 14 Minutes | 2,457 | 14.0% |
| 15 to 19 Minutes | 2,925 | 16.7% |
| 20 to 24 Minutes | 2,463 | 14.0% |
| 25 to 29 Minutes | 1,714 | 9.8% |
| 30 to 34 Minutes | 2,151 | 12.2% |
| 35 to 39 Minutes | 435 | 2.5% |
| 40 to 44 Minutes | 649 | 3.7% |
| 45 to 59 Minutes | 1,643 | 9.4% |
| 60 to 89 Minutes | 577 | 3.3% |
| 90 or more Minutes | 272 | 1.5% |
Commute Time by Sex in McDowell County
The most common commute times in McDowell County are 10 to 14 minutes (1,442 commuters, 15.8%) for males and 15 to 19 minutes (1,486 commuters, 17.6%) for females.
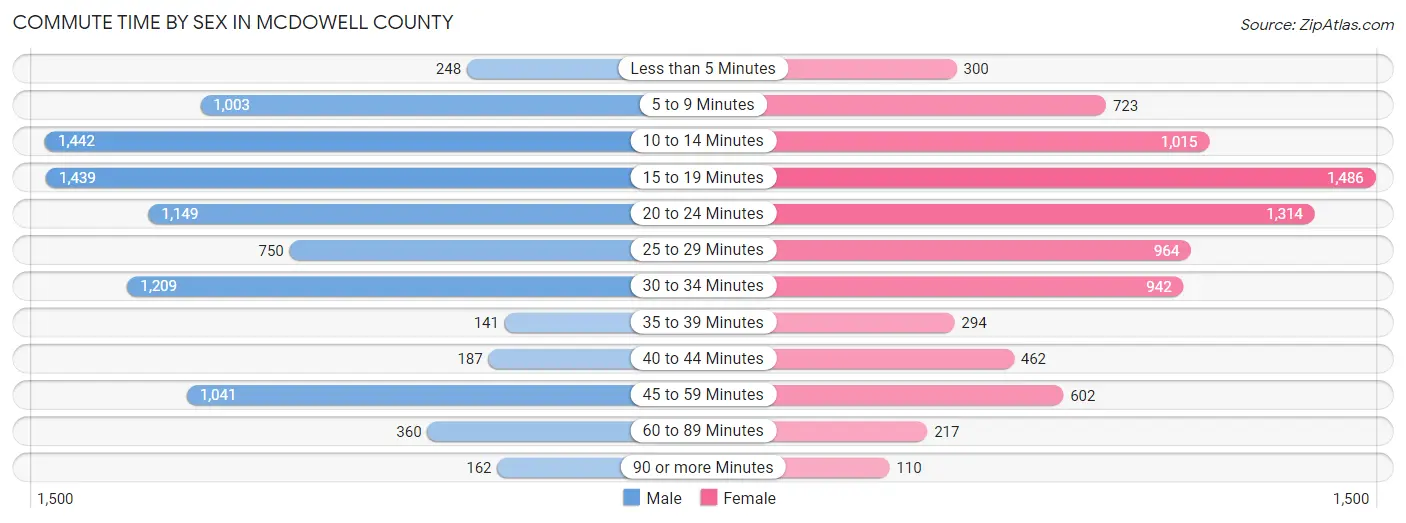
| Commute Time | Male | Female |
| Less than 5 Minutes | 248 (2.7%) | 300 (3.6%) |
| 5 to 9 Minutes | 1,003 (11.0%) | 723 (8.6%) |
| 10 to 14 Minutes | 1,442 (15.8%) | 1,015 (12.0%) |
| 15 to 19 Minutes | 1,439 (15.8%) | 1,486 (17.6%) |
| 20 to 24 Minutes | 1,149 (12.6%) | 1,314 (15.6%) |
| 25 to 29 Minutes | 750 (8.2%) | 964 (11.4%) |
| 30 to 34 Minutes | 1,209 (13.2%) | 942 (11.2%) |
| 35 to 39 Minutes | 141 (1.5%) | 294 (3.5%) |
| 40 to 44 Minutes | 187 (2.1%) | 462 (5.5%) |
| 45 to 59 Minutes | 1,041 (11.4%) | 602 (7.1%) |
| 60 to 89 Minutes | 360 (3.9%) | 217 (2.6%) |
| 90 or more Minutes | 162 (1.8%) | 110 (1.3%) |
Time of Departure to Work by Sex in McDowell County
The most frequent times of departure to work in McDowell County are 6:00 AM to 6:29 AM (1,536, 16.8%) for males and 7:00 AM to 7:29 AM (1,594, 18.9%) for females.
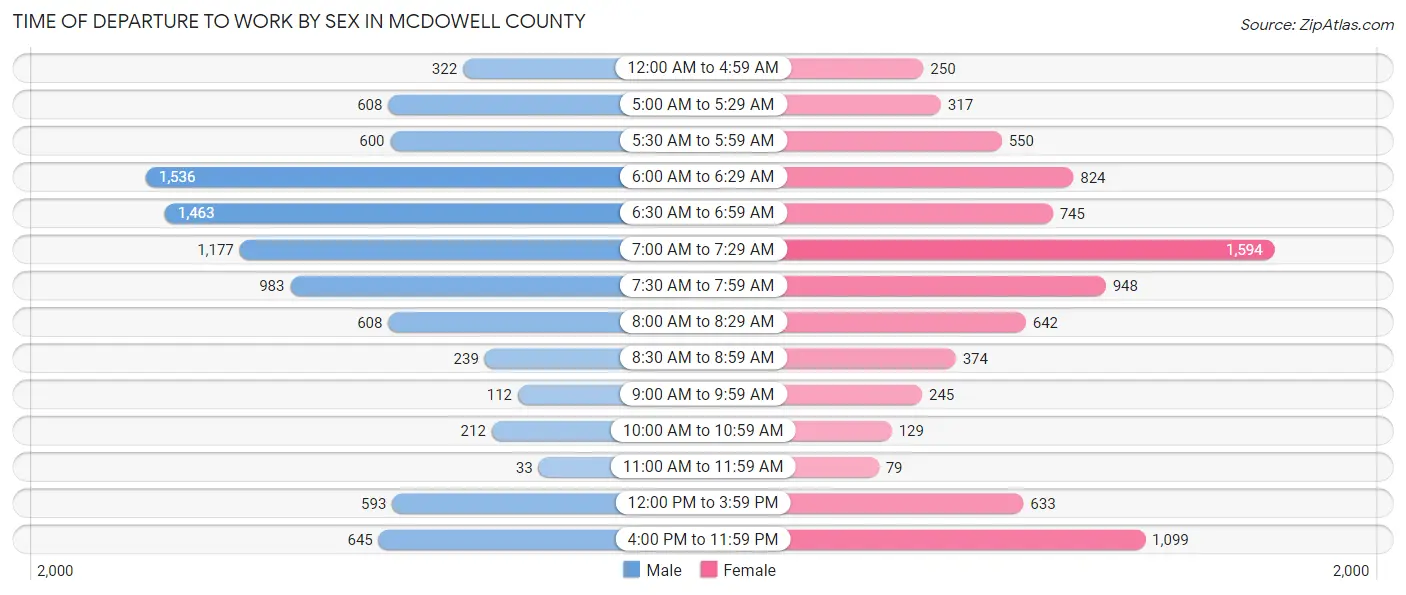
| Time of Departure | Male | Female |
| 12:00 AM to 4:59 AM | 322 (3.5%) | 250 (3.0%) |
| 5:00 AM to 5:29 AM | 608 (6.7%) | 317 (3.8%) |
| 5:30 AM to 5:59 AM | 600 (6.6%) | 550 (6.5%) |
| 6:00 AM to 6:29 AM | 1,536 (16.8%) | 824 (9.8%) |
| 6:30 AM to 6:59 AM | 1,463 (16.0%) | 745 (8.8%) |
| 7:00 AM to 7:29 AM | 1,177 (12.9%) | 1,594 (18.9%) |
| 7:30 AM to 7:59 AM | 983 (10.8%) | 948 (11.3%) |
| 8:00 AM to 8:29 AM | 608 (6.7%) | 642 (7.6%) |
| 8:30 AM to 8:59 AM | 239 (2.6%) | 374 (4.4%) |
| 9:00 AM to 9:59 AM | 112 (1.2%) | 245 (2.9%) |
| 10:00 AM to 10:59 AM | 212 (2.3%) | 129 (1.5%) |
| 11:00 AM to 11:59 AM | 33 (0.4%) | 79 (0.9%) |
| 12:00 PM to 3:59 PM | 593 (6.5%) | 633 (7.5%) |
| 4:00 PM to 11:59 PM | 645 (7.1%) | 1,099 (13.0%) |
| Total | 9,131 (100.0%) | 8,429 (100.0%) |
Housing Occupancy in McDowell County
Occupancy by Ownership in McDowell County
Of the total 18,184 dwellings in McDowell County, owner-occupied units account for 13,351 (73.4%), while renter-occupied units make up 4,833 (26.6%).
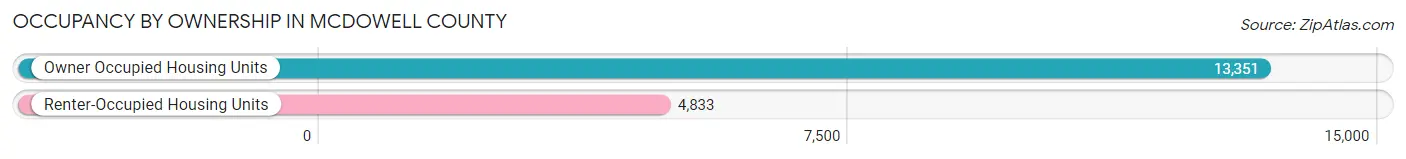
| Occupancy | # Housing Units | % Housing Units |
| Owner Occupied Housing Units | 13,351 | 73.4% |
| Renter-Occupied Housing Units | 4,833 | 26.6% |
| Total Occupied Housing Units | 18,184 | 100.0% |
Occupancy by Household Size in McDowell County
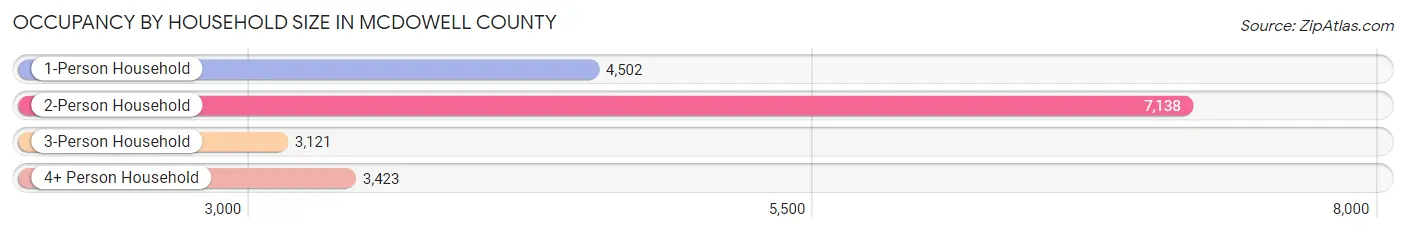
| Household Size | # Housing Units | % Housing Units |
| 1-Person Household | 4,502 | 24.8% |
| 2-Person Household | 7,138 | 39.3% |
| 3-Person Household | 3,121 | 17.2% |
| 4+ Person Household | 3,423 | 18.8% |
| Total Housing Units | 18,184 | 100.0% |
Occupancy by Ownership by Household Size in McDowell County
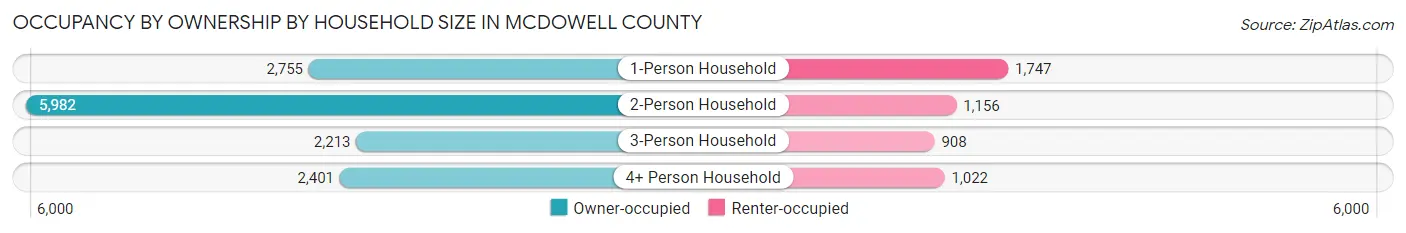
| Household Size | Owner-occupied | Renter-occupied |
| 1-Person Household | 2,755 (61.2%) | 1,747 (38.8%) |
| 2-Person Household | 5,982 (83.8%) | 1,156 (16.2%) |
| 3-Person Household | 2,213 (70.9%) | 908 (29.1%) |
| 4+ Person Household | 2,401 (70.1%) | 1,022 (29.9%) |
| Total Housing Units | 13,351 (73.4%) | 4,833 (26.6%) |
Occupancy by Educational Attainment in McDowell County
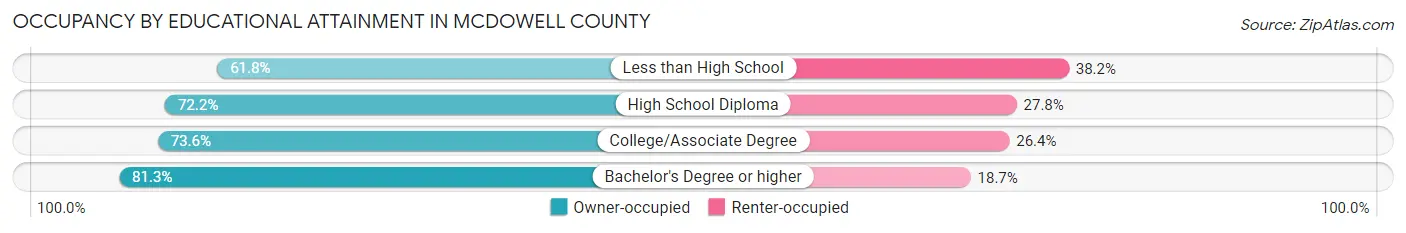
| Household Size | Owner-occupied | Renter-occupied |
| Less than High School | 1,308 (61.8%) | 808 (38.2%) |
| High School Diploma | 4,090 (72.2%) | 1,578 (27.8%) |
| College/Associate Degree | 4,786 (73.6%) | 1,717 (26.4%) |
| Bachelor's Degree or higher | 3,167 (81.3%) | 730 (18.7%) |
Occupancy by Age of Householder in McDowell County
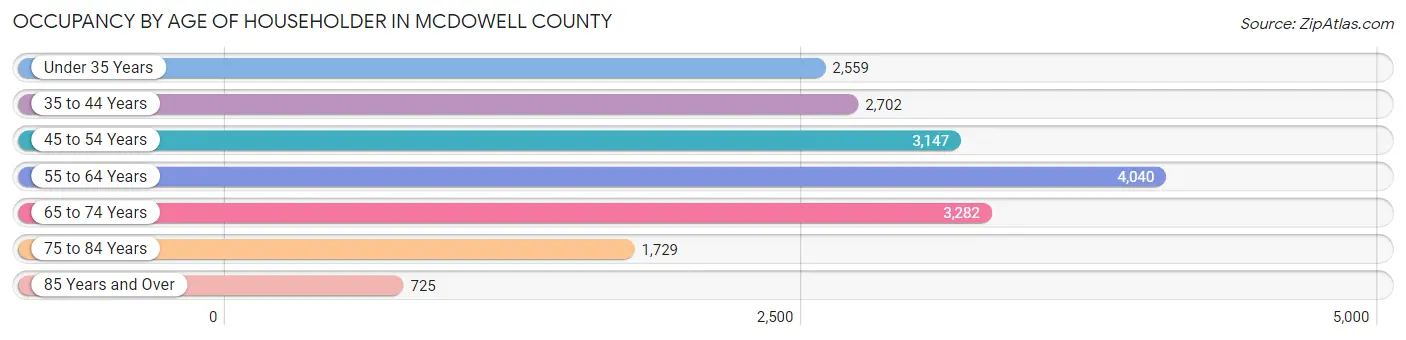
| Age Bracket | # Households | % Households |
| Under 35 Years | 2,559 | 14.1% |
| 35 to 44 Years | 2,702 | 14.9% |
| 45 to 54 Years | 3,147 | 17.3% |
| 55 to 64 Years | 4,040 | 22.2% |
| 65 to 74 Years | 3,282 | 18.0% |
| 75 to 84 Years | 1,729 | 9.5% |
| 85 Years and Over | 725 | 4.0% |
| Total | 18,184 | 100.0% |
Housing Finances in McDowell County
Median Income by Occupancy in McDowell County
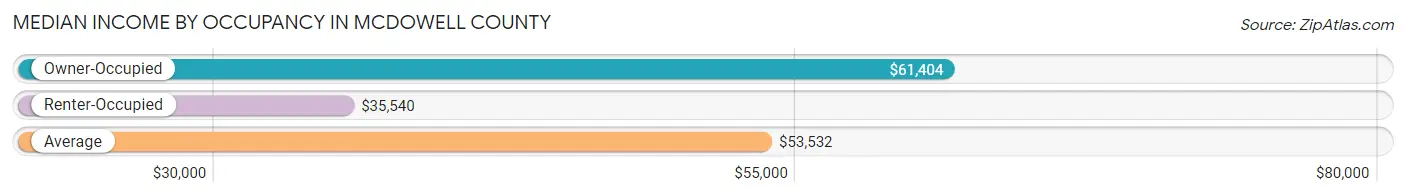
| Occupancy Type | # Households | Median Income |
| Owner-Occupied | 13,351 (73.4%) | $61,404 |
| Renter-Occupied | 4,833 (26.6%) | $35,540 |
| Average | 18,184 (100.0%) | $53,532 |
Occupancy by Householder Income Bracket in McDowell County
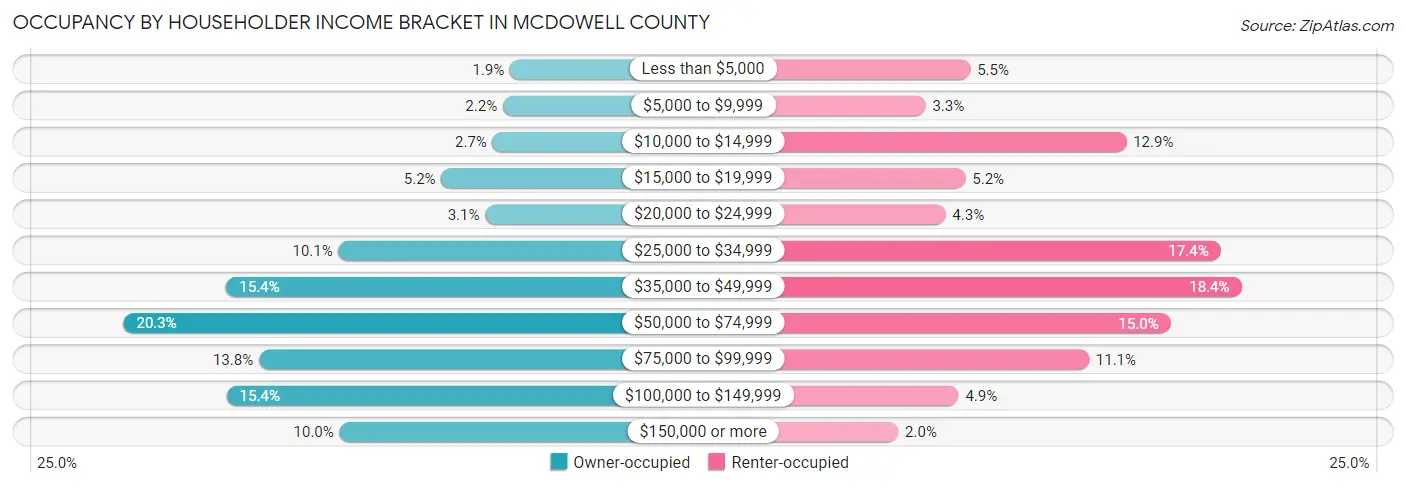
| Income Bracket | Owner-occupied | Renter-occupied |
| Less than $5,000 | 251 (1.9%) | 264 (5.5%) |
| $5,000 to $9,999 | 297 (2.2%) | 161 (3.3%) |
| $10,000 to $14,999 | 362 (2.7%) | 623 (12.9%) |
| $15,000 to $19,999 | 688 (5.1%) | 253 (5.2%) |
| $20,000 to $24,999 | 409 (3.1%) | 207 (4.3%) |
| $25,000 to $34,999 | 1,342 (10.1%) | 840 (17.4%) |
| $35,000 to $49,999 | 2,055 (15.4%) | 888 (18.4%) |
| $50,000 to $74,999 | 2,710 (20.3%) | 725 (15.0%) |
| $75,000 to $99,999 | 1,848 (13.8%) | 537 (11.1%) |
| $100,000 to $149,999 | 2,054 (15.4%) | 237 (4.9%) |
| $150,000 or more | 1,335 (10.0%) | 98 (2.0%) |
| Total | 13,351 (100.0%) | 4,833 (100.0%) |
Monthly Housing Cost Tiers in McDowell County
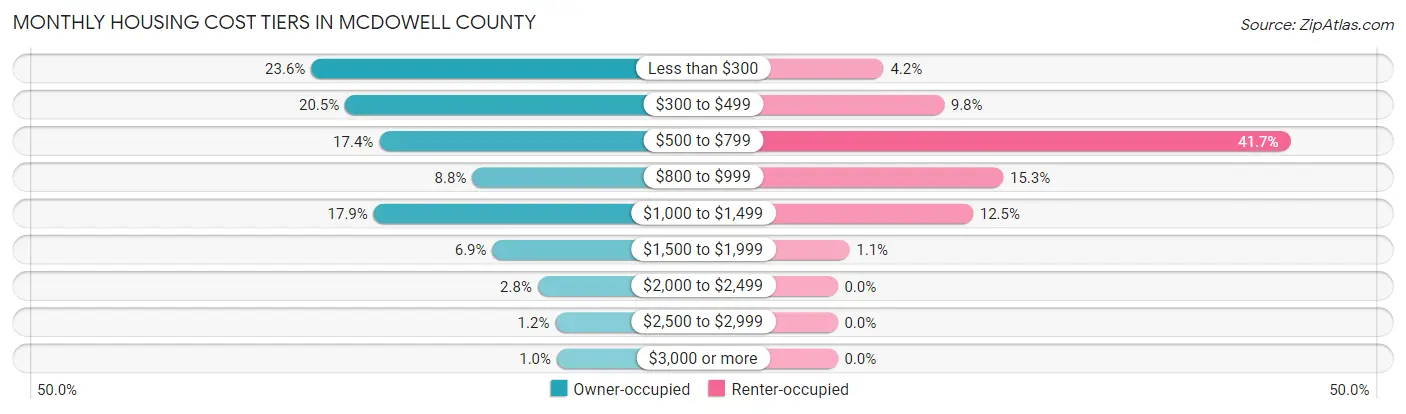
| Monthly Cost | Owner-occupied | Renter-occupied |
| Less than $300 | 3,154 (23.6%) | 205 (4.2%) |
| $300 to $499 | 2,737 (20.5%) | 473 (9.8%) |
| $500 to $799 | 2,318 (17.4%) | 2,015 (41.7%) |
| $800 to $999 | 1,173 (8.8%) | 737 (15.2%) |
| $1,000 to $1,499 | 2,386 (17.9%) | 602 (12.5%) |
| $1,500 to $1,999 | 927 (6.9%) | 53 (1.1%) |
| $2,000 to $2,499 | 369 (2.8%) | 0 (0.0%) |
| $2,500 to $2,999 | 154 (1.1%) | 0 (0.0%) |
| $3,000 or more | 133 (1.0%) | 0 (0.0%) |
| Total | 13,351 (100.0%) | 4,833 (100.0%) |
Physical Housing Characteristics in McDowell County
Housing Structures in McDowell County
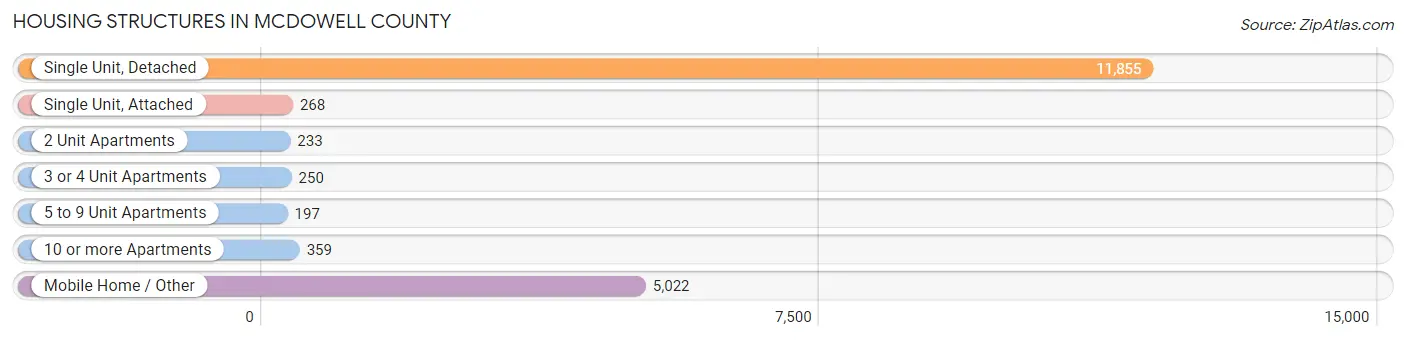
| Structure Type | # Housing Units | % Housing Units |
| Single Unit, Detached | 11,855 | 65.2% |
| Single Unit, Attached | 268 | 1.5% |
| 2 Unit Apartments | 233 | 1.3% |
| 3 or 4 Unit Apartments | 250 | 1.4% |
| 5 to 9 Unit Apartments | 197 | 1.1% |
| 10 or more Apartments | 359 | 2.0% |
| Mobile Home / Other | 5,022 | 27.6% |
| Total | 18,184 | 100.0% |
Housing Structures by Occupancy in McDowell County
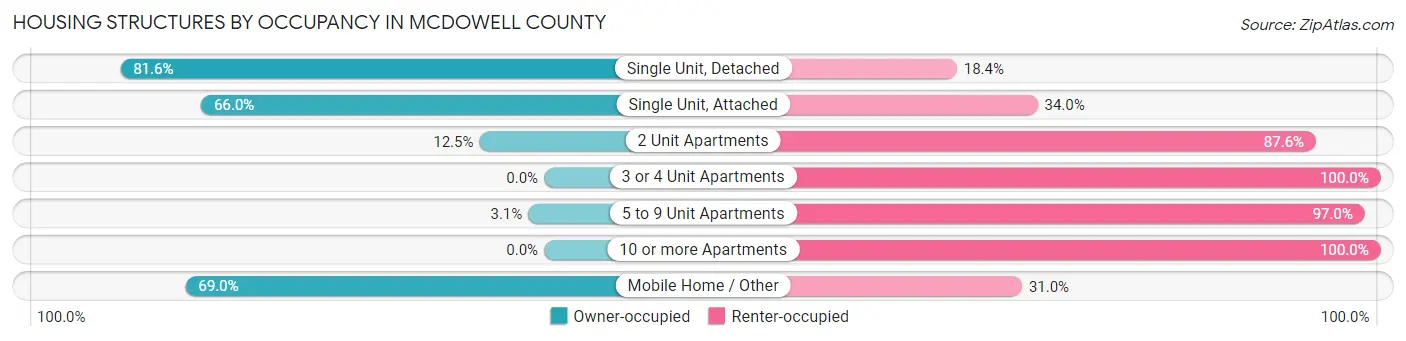
| Structure Type | Owner-occupied | Renter-occupied |
| Single Unit, Detached | 9,672 (81.6%) | 2,183 (18.4%) |
| Single Unit, Attached | 177 (66.0%) | 91 (34.0%) |
| 2 Unit Apartments | 29 (12.4%) | 204 (87.5%) |
| 3 or 4 Unit Apartments | 0 (0.0%) | 250 (100.0%) |
| 5 to 9 Unit Apartments | 6 (3.0%) | 191 (97.0%) |
| 10 or more Apartments | 0 (0.0%) | 359 (100.0%) |
| Mobile Home / Other | 3,467 (69.0%) | 1,555 (31.0%) |
| Total | 13,351 (73.4%) | 4,833 (26.6%) |
Housing Structures by Number of Rooms in McDowell County
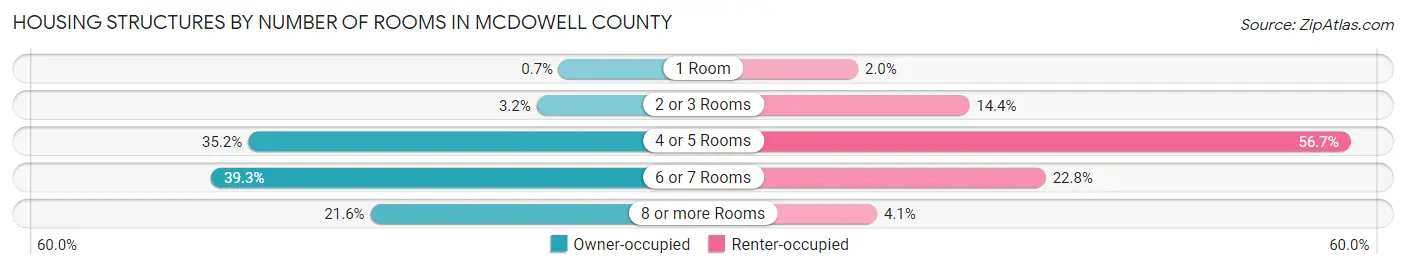
| Number of Rooms | Owner-occupied | Renter-occupied |
| 1 Room | 94 (0.7%) | 97 (2.0%) |
| 2 or 3 Rooms | 424 (3.2%) | 694 (14.4%) |
| 4 or 5 Rooms | 4,700 (35.2%) | 2,739 (56.7%) |
| 6 or 7 Rooms | 5,247 (39.3%) | 1,104 (22.8%) |
| 8 or more Rooms | 2,886 (21.6%) | 199 (4.1%) |
| Total | 13,351 (100.0%) | 4,833 (100.0%) |
Housing Structure by Heating Type in McDowell County
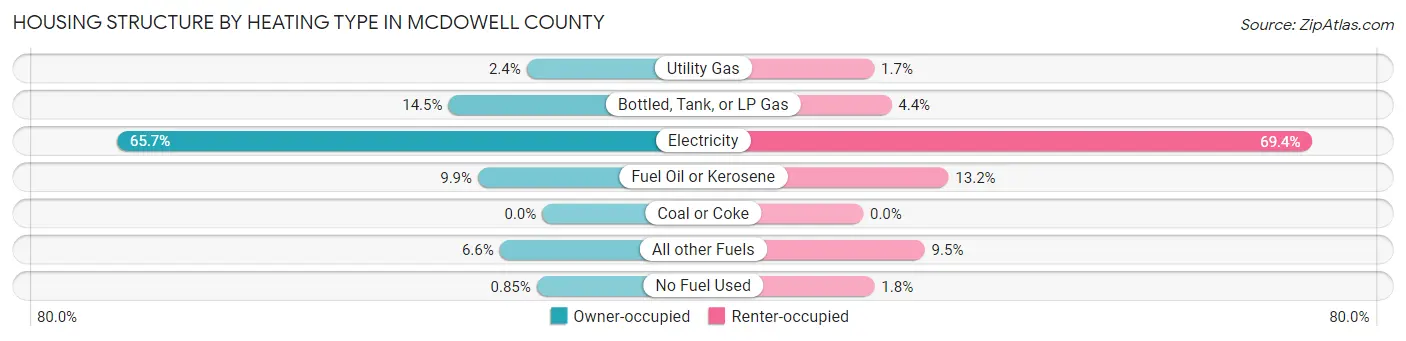
| Heating Type | Owner-occupied | Renter-occupied |
| Utility Gas | 321 (2.4%) | 83 (1.7%) |
| Bottled, Tank, or LP Gas | 1,936 (14.5%) | 211 (4.4%) |
| Electricity | 8,776 (65.7%) | 3,356 (69.4%) |
| Fuel Oil or Kerosene | 1,326 (9.9%) | 638 (13.2%) |
| Coal or Coke | 0 (0.0%) | 0 (0.0%) |
| All other Fuels | 879 (6.6%) | 460 (9.5%) |
| No Fuel Used | 113 (0.9%) | 85 (1.8%) |
| Total | 13,351 (100.0%) | 4,833 (100.0%) |
Household Vehicle Usage in McDowell County
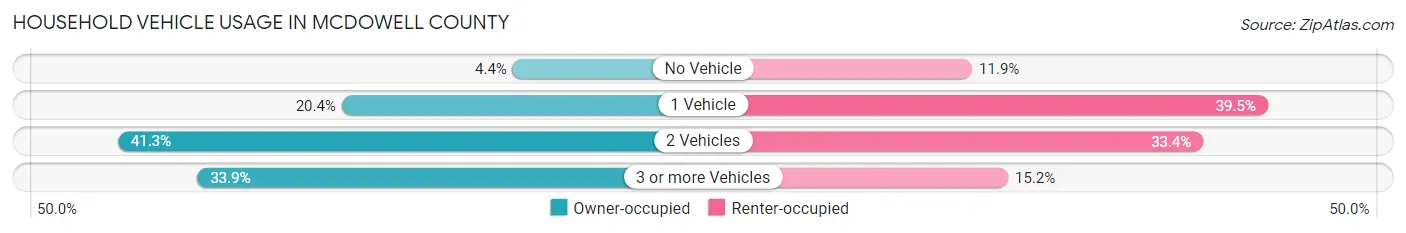
| Vehicles per Household | Owner-occupied | Renter-occupied |
| No Vehicle | 593 (4.4%) | 574 (11.9%) |
| 1 Vehicle | 2,723 (20.4%) | 1,907 (39.5%) |
| 2 Vehicles | 5,512 (41.3%) | 1,616 (33.4%) |
| 3 or more Vehicles | 4,523 (33.9%) | 736 (15.2%) |
| Total | 13,351 (100.0%) | 4,833 (100.0%) |
Real Estate & Mortgages in McDowell County
Real Estate and Mortgage Overview in McDowell County
| Characteristic | Without Mortgage | With Mortgage |
| Housing Units | 6,857 | 6,494 |
| Median Property Value | $120,300 | $182,300 |
| Median Household Income | $47,830 | $1,070 |
| Monthly Housing Costs | $317 | $133 |
| Real Estate Taxes | $719 | $129 |
Property Value by Mortgage Status in McDowell County
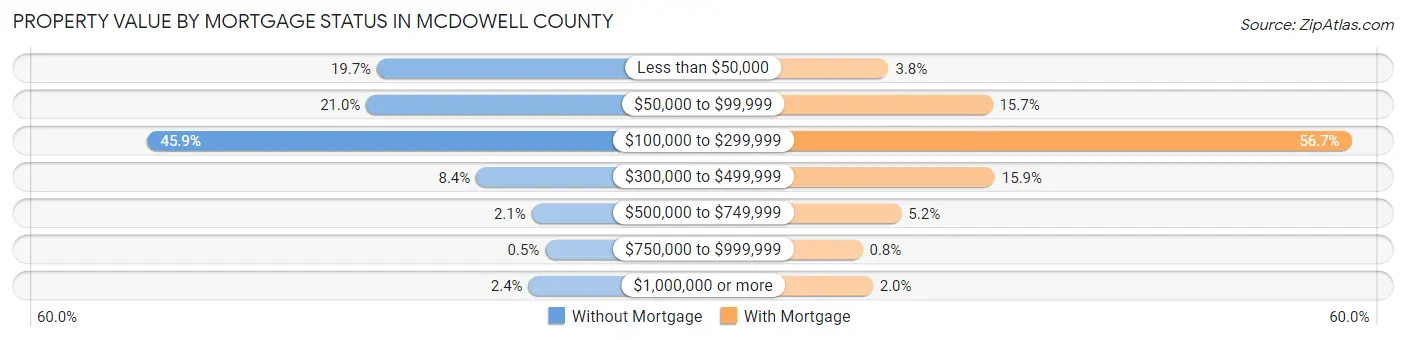
| Property Value | Without Mortgage | With Mortgage |
| Less than $50,000 | 1,353 (19.7%) | 244 (3.8%) |
| $50,000 to $99,999 | 1,437 (21.0%) | 1,016 (15.7%) |
| $100,000 to $299,999 | 3,150 (45.9%) | 3,680 (56.7%) |
| $300,000 to $499,999 | 576 (8.4%) | 1,034 (15.9%) |
| $500,000 to $749,999 | 141 (2.1%) | 340 (5.2%) |
| $750,000 to $999,999 | 34 (0.5%) | 52 (0.8%) |
| $1,000,000 or more | 166 (2.4%) | 128 (2.0%) |
| Total | 6,857 (100.0%) | 6,494 (100.0%) |
Household Income by Mortgage Status in McDowell County
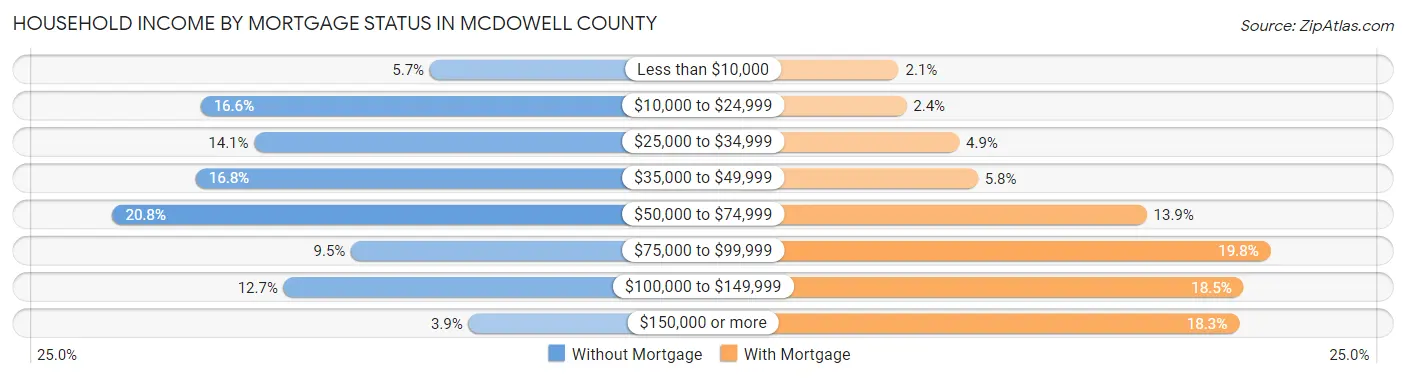
| Household Income | Without Mortgage | With Mortgage |
| Less than $10,000 | 391 (5.7%) | 133 (2.1%) |
| $10,000 to $24,999 | 1,139 (16.6%) | 157 (2.4%) |
| $25,000 to $34,999 | 964 (14.1%) | 320 (4.9%) |
| $35,000 to $49,999 | 1,155 (16.8%) | 378 (5.8%) |
| $50,000 to $74,999 | 1,427 (20.8%) | 900 (13.9%) |
| $75,000 to $99,999 | 648 (9.5%) | 1,283 (19.8%) |
| $100,000 to $149,999 | 868 (12.7%) | 1,200 (18.5%) |
| $150,000 or more | 265 (3.9%) | 1,186 (18.3%) |
| Total | 6,857 (100.0%) | 6,494 (100.0%) |
Property Value to Household Income Ratio in McDowell County
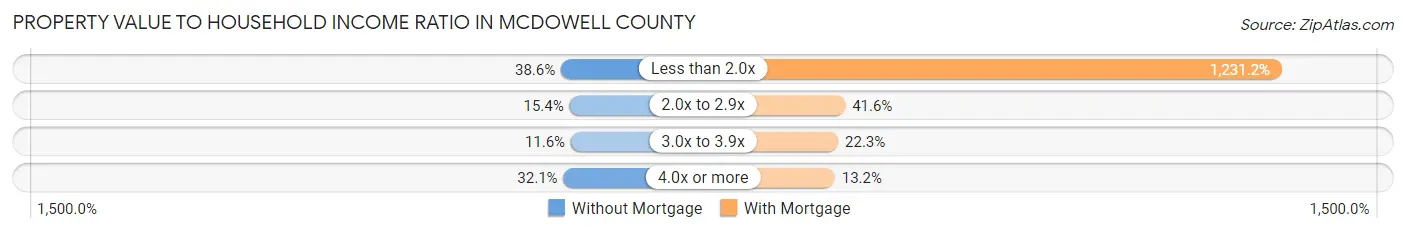
| Value-to-Income Ratio | Without Mortgage | With Mortgage |
| Less than 2.0x | 2,648 (38.6%) | 79,954 (1,231.2%) |
| 2.0x to 2.9x | 1,056 (15.4%) | 2,701 (41.6%) |
| 3.0x to 3.9x | 796 (11.6%) | 1,447 (22.3%) |
| 4.0x or more | 2,204 (32.1%) | 858 (13.2%) |
| Total | 6,857 (100.0%) | 6,494 (100.0%) |
Real Estate Taxes by Mortgage Status in McDowell County
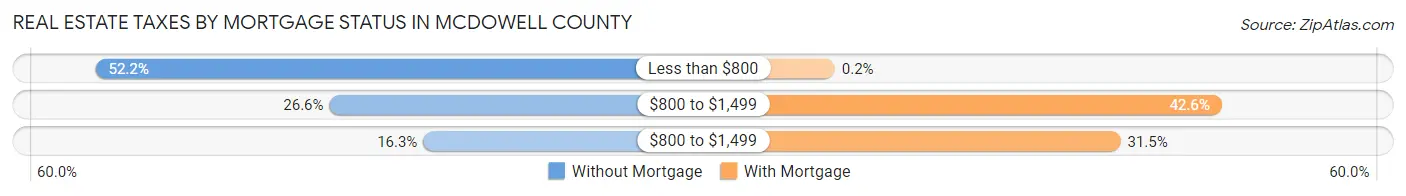
| Property Taxes | Without Mortgage | With Mortgage |
| Less than $800 | 3,581 (52.2%) | 13 (0.2%) |
| $800 to $1,499 | 1,824 (26.6%) | 2,766 (42.6%) |
| $800 to $1,499 | 1,119 (16.3%) | 2,046 (31.5%) |
| Total | 6,857 (100.0%) | 6,494 (100.0%) |
Health & Disability in McDowell County
Health Insurance Coverage by Age in McDowell County
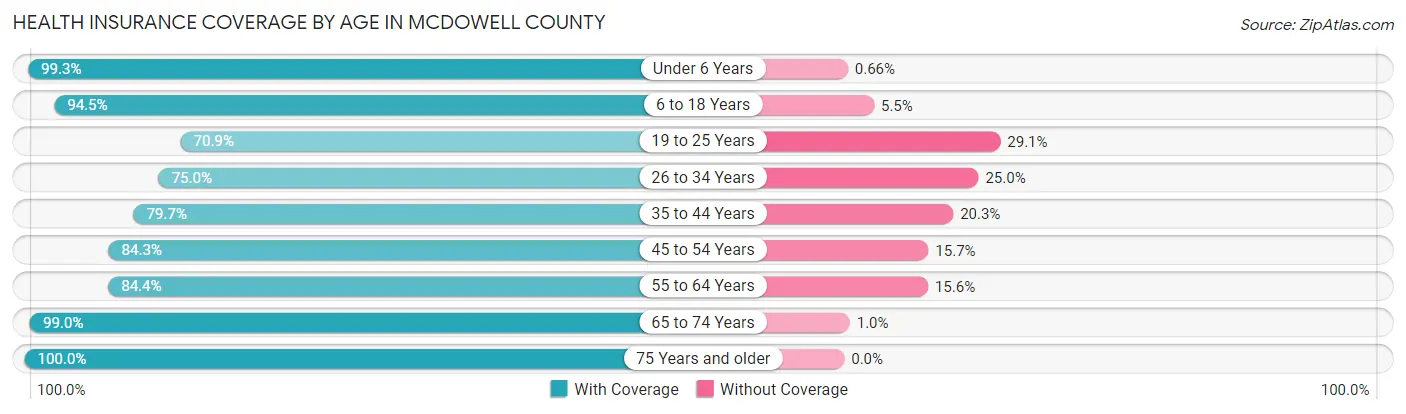
| Age Bracket | With Coverage | Without Coverage |
| Under 6 Years | 2,570 (99.3%) | 17 (0.7%) |
| 6 to 18 Years | 6,288 (94.5%) | 369 (5.5%) |
| 19 to 25 Years | 2,283 (70.9%) | 937 (29.1%) |
| 26 to 34 Years | 3,311 (75.0%) | 1,105 (25.0%) |
| 35 to 44 Years | 4,100 (79.7%) | 1,045 (20.3%) |
| 45 to 54 Years | 4,951 (84.3%) | 921 (15.7%) |
| 55 to 64 Years | 5,574 (84.4%) | 1,031 (15.6%) |
| 65 to 74 Years | 5,357 (99.0%) | 55 (1.0%) |
| 75 Years and older | 3,502 (100.0%) | 0 (0.0%) |
| Total | 37,936 (87.4%) | 5,480 (12.6%) |
Health Insurance Coverage by Citizenship Status in McDowell County
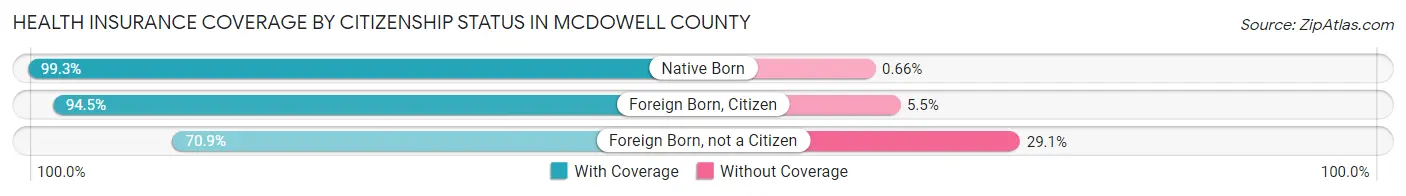
| Citizenship Status | With Coverage | Without Coverage |
| Native Born | 2,570 (99.3%) | 17 (0.7%) |
| Foreign Born, Citizen | 6,288 (94.5%) | 369 (5.5%) |
| Foreign Born, not a Citizen | 2,283 (70.9%) | 937 (29.1%) |
Health Insurance Coverage by Household Income in McDowell County
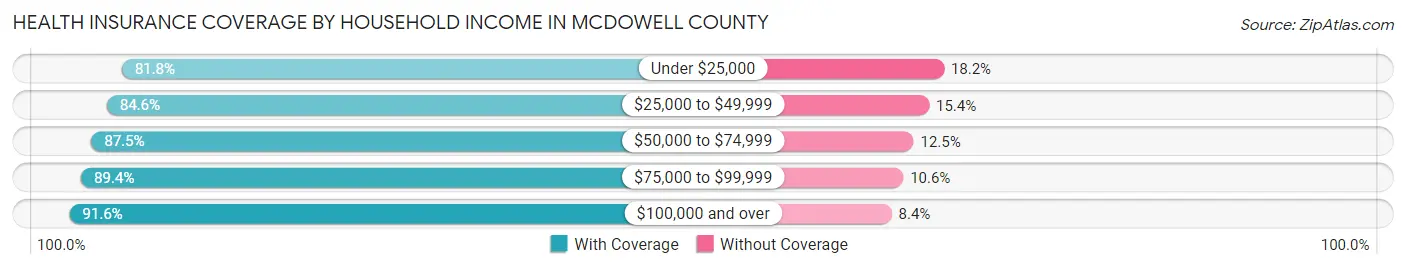
| Household Income | With Coverage | Without Coverage |
| Under $25,000 | 4,711 (81.8%) | 1,048 (18.2%) |
| $25,000 to $49,999 | 9,267 (84.6%) | 1,688 (15.4%) |
| $50,000 to $74,999 | 7,331 (87.5%) | 1,048 (12.5%) |
| $75,000 to $99,999 | 5,807 (89.4%) | 686 (10.6%) |
| $100,000 and over | 10,626 (91.6%) | 974 (8.4%) |
Public vs Private Health Insurance Coverage by Age in McDowell County
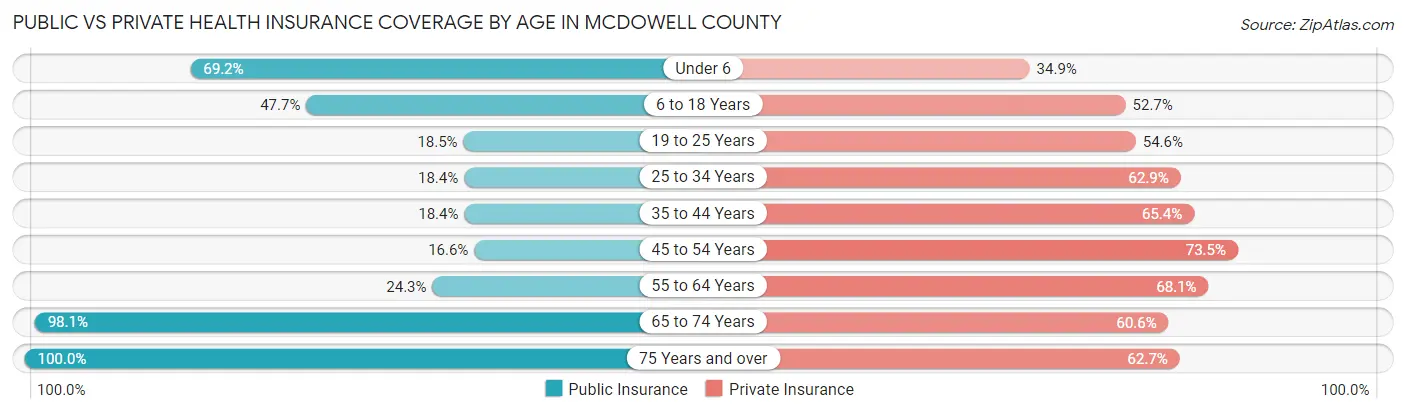
| Age Bracket | Public Insurance | Private Insurance |
| Under 6 | 1,791 (69.2%) | 902 (34.9%) |
| 6 to 18 Years | 3,177 (47.7%) | 3,507 (52.7%) |
| 19 to 25 Years | 597 (18.5%) | 1,757 (54.6%) |
| 25 to 34 Years | 814 (18.4%) | 2,777 (62.9%) |
| 35 to 44 Years | 946 (18.4%) | 3,364 (65.4%) |
| 45 to 54 Years | 972 (16.6%) | 4,316 (73.5%) |
| 55 to 64 Years | 1,606 (24.3%) | 4,495 (68.0%) |
| 65 to 74 Years | 5,310 (98.1%) | 3,282 (60.6%) |
| 75 Years and over | 3,502 (100.0%) | 2,196 (62.7%) |
| Total | 18,715 (43.1%) | 26,596 (61.3%) |
Disability Status by Sex by Age in McDowell County
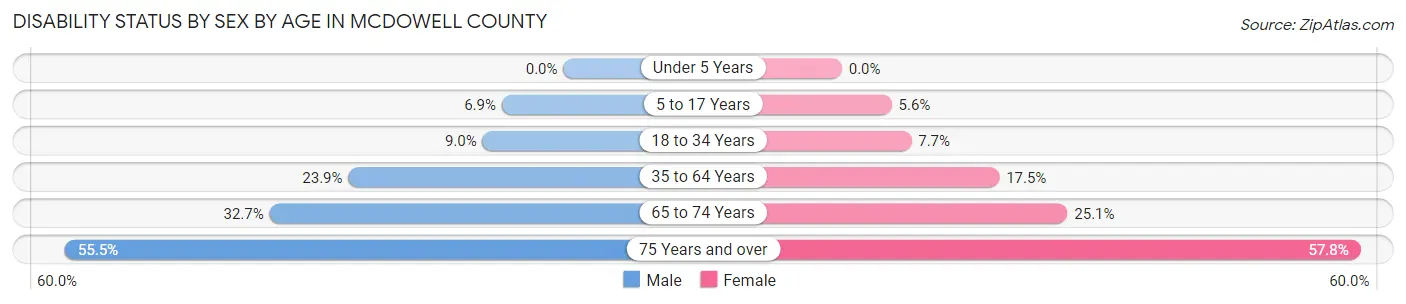
| Age Bracket | Male | Female |
| Under 5 Years | 0 (0.0%) | 0 (0.0%) |
| 5 to 17 Years | 248 (6.9%) | 171 (5.6%) |
| 18 to 34 Years | 367 (9.0%) | 313 (7.7%) |
| 35 to 64 Years | 2,087 (23.9%) | 1,561 (17.5%) |
| 65 to 74 Years | 837 (32.7%) | 717 (25.1%) |
| 75 Years and over | 836 (55.5%) | 1,153 (57.8%) |
Disability Class by Sex by Age in McDowell County
Disability Class: Hearing Difficulty
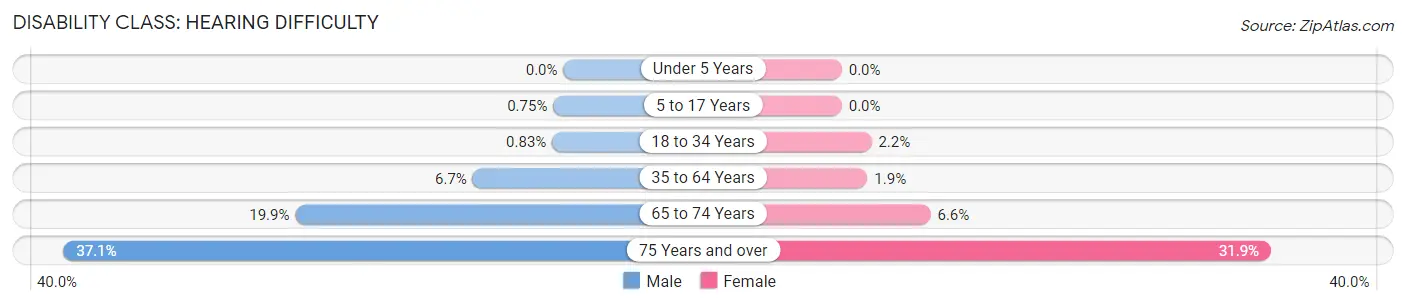
| Age Bracket | Male | Female |
| Under 5 Years | 0 (0.0%) | 0 (0.0%) |
| 5 to 17 Years | 27 (0.7%) | 0 (0.0%) |
| 18 to 34 Years | 34 (0.8%) | 89 (2.2%) |
| 35 to 64 Years | 587 (6.7%) | 169 (1.9%) |
| 65 to 74 Years | 509 (19.9%) | 188 (6.6%) |
| 75 Years and over | 559 (37.1%) | 636 (31.9%) |
Disability Class: Vision Difficulty
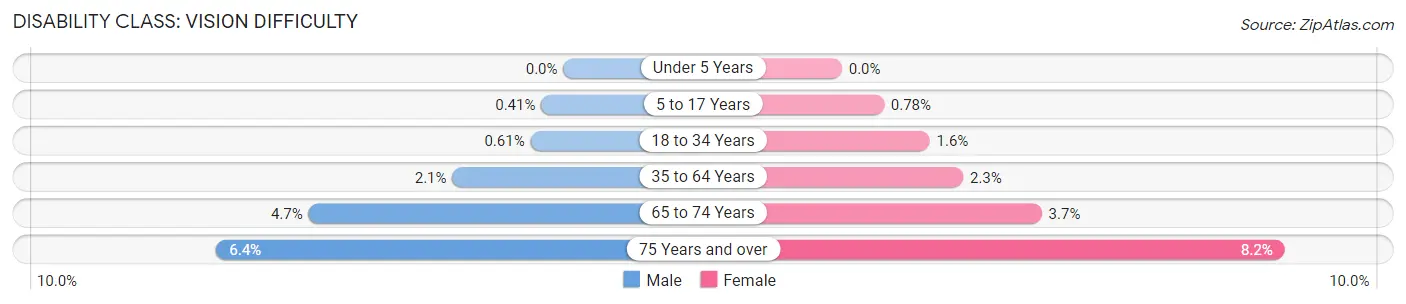
| Age Bracket | Male | Female |
| Under 5 Years | 0 (0.0%) | 0 (0.0%) |
| 5 to 17 Years | 15 (0.4%) | 24 (0.8%) |
| 18 to 34 Years | 25 (0.6%) | 66 (1.6%) |
| 35 to 64 Years | 180 (2.1%) | 200 (2.2%) |
| 65 to 74 Years | 121 (4.7%) | 106 (3.7%) |
| 75 Years and over | 97 (6.4%) | 164 (8.2%) |
Disability Class: Cognitive Difficulty
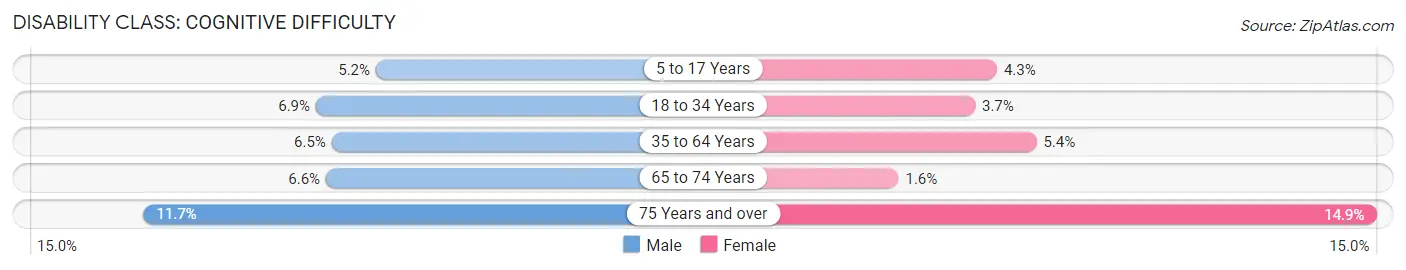
| Age Bracket | Male | Female |
| 5 to 17 Years | 189 (5.2%) | 133 (4.3%) |
| 18 to 34 Years | 281 (6.9%) | 150 (3.7%) |
| 35 to 64 Years | 562 (6.5%) | 483 (5.4%) |
| 65 to 74 Years | 169 (6.6%) | 45 (1.6%) |
| 75 Years and over | 176 (11.7%) | 297 (14.9%) |
Disability Class: Ambulatory Difficulty
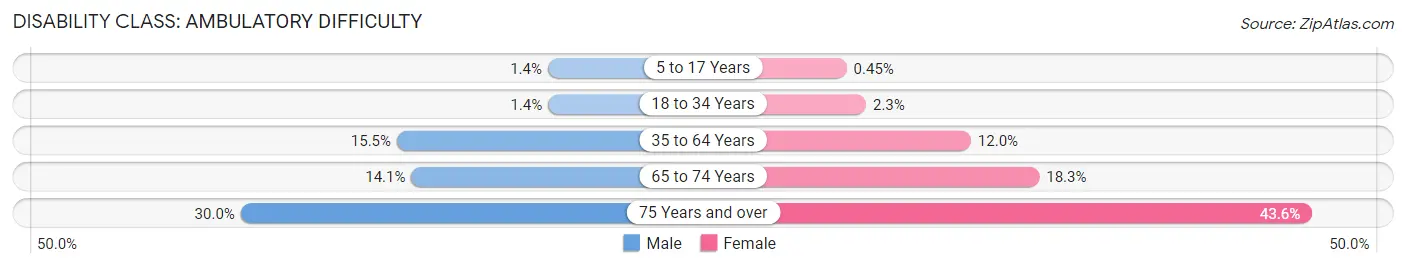
| Age Bracket | Male | Female |
| 5 to 17 Years | 52 (1.4%) | 14 (0.4%) |
| 18 to 34 Years | 58 (1.4%) | 91 (2.2%) |
| 35 to 64 Years | 1,347 (15.4%) | 1,067 (12.0%) |
| 65 to 74 Years | 361 (14.1%) | 523 (18.3%) |
| 75 Years and over | 451 (29.9%) | 871 (43.6%) |
Disability Class: Self-Care Difficulty
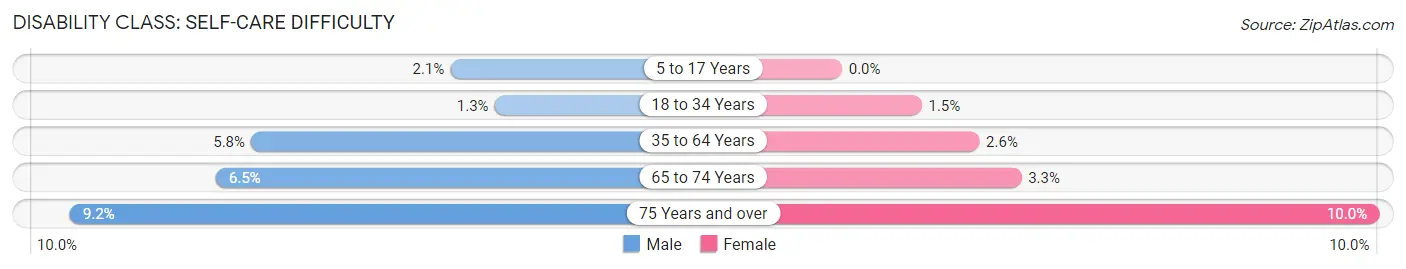
| Age Bracket | Male | Female |
| 5 to 17 Years | 76 (2.1%) | 0 (0.0%) |
| 18 to 34 Years | 52 (1.3%) | 60 (1.5%) |
| 35 to 64 Years | 506 (5.8%) | 227 (2.5%) |
| 65 to 74 Years | 165 (6.5%) | 95 (3.3%) |
| 75 Years and over | 138 (9.2%) | 199 (10.0%) |
Technology Access in McDowell County
Computing Device Access in McDowell County

| Device Type | # Households | % Households |
| Desktop or Laptop | 12,172 | 66.9% |
| Smartphone | 14,414 | 79.3% |
| Tablet | 9,675 | 53.2% |
| No Computing Device | 2,107 | 11.6% |
| Total | 18,184 | 100.0% |
Internet Access in McDowell County
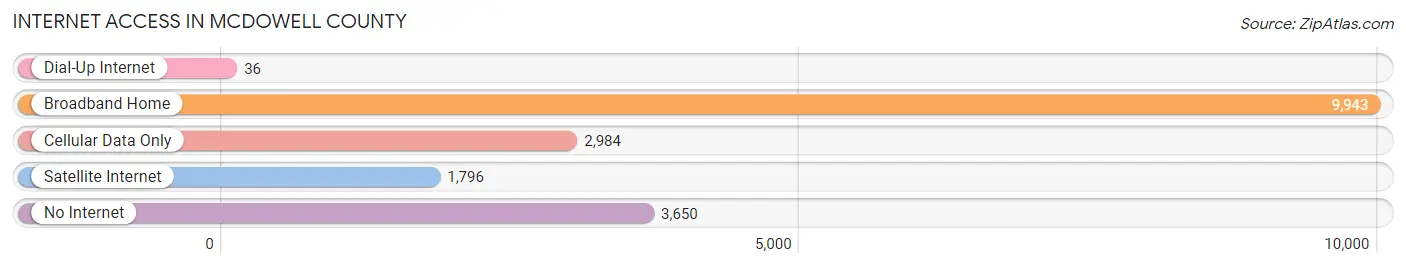
| Internet Type | # Households | % Households |
| Dial-Up Internet | 36 | 0.2% |
| Broadband Home | 9,943 | 54.7% |
| Cellular Data Only | 2,984 | 16.4% |
| Satellite Internet | 1,796 | 9.9% |
| No Internet | 3,650 | 20.1% |
| Total | 18,184 | 100.0% |
McDowell County Summary
McDowell County is located in the western part of North Carolina, in the foothills of the Appalachian Mountains. It is bordered by Burke, Rutherford, Cleveland, and Catawba counties. The county seat is Marion, and the county is named after Joseph McDowell, a Revolutionary War hero.
History
McDowell County was formed in 1842 from parts of Burke and Rutherford counties. It was named after Joseph McDowell, a Revolutionary War hero who fought in the Battle of Kings Mountain. The county was originally home to the Cherokee and Catawba tribes, and the first European settlers arrived in the late 1700s.
The county was largely agricultural until the late 19th century, when the railroad arrived and the county began to industrialize. The county was home to several coal mines, and the town of Marion became a major hub for the railroad. The county also became a major producer of textiles, and the town of Old Fort became a center for the industry.
Geography
McDowell County is located in the foothills of the Appalachian Mountains. The county is mostly mountainous, with the highest point being Mount Mitchell, which is the highest peak east of the Mississippi River. The county is also home to several rivers, including the Catawba, French Broad, and Pigeon.
The county has a total area of 517 square miles, of which 514 square miles is land and 3 square miles is water.
Economy
McDowell County has a diverse economy, with a mix of agriculture, manufacturing, and tourism. Agriculture is the largest sector of the economy, with the county producing a variety of crops, including corn, soybeans, and tobacco. The county is also home to several manufacturing companies, including a furniture factory and a paper mill.
Tourism is also an important part of the economy, with the county being home to several state parks, including Lake James State Park and South Mountains State Park. The county is also home to several wineries and breweries, as well as a variety of outdoor activities, such as hiking, camping, and fishing.
Demographics
As of the 2010 census, McDowell County had a population of 44,996. The population was 53.2% White, 39.3% Black or African American, 0.3% Native American, 0.7% Asian, 0.1% Pacific Islander, 4.2% from other races, and 2.3% from two or more races. Hispanic or Latino of any race were 8.2% of the population.
The median household income was $30,845, and the median family income was $37,945. The per capita income was $17,845. About 20.2% of the population was below the poverty line.
Common Questions
What is the Total Population of McDowell County?
Total Population of McDowell County is 44,629.
What is the Total Male Population of McDowell County?
Total Male Population of McDowell County is 22,521.
What is the Total Female Population of McDowell County?
Total Female Population of McDowell County is 22,108.
What is the Ratio of Males per 100 Females in McDowell County?
There are 101.87 Males per 100 Females in McDowell County.
What is the Ratio of Females per 100 Males in McDowell County?
There are 98.17 Females per 100 Males in McDowell County.
What is the Median Population Age in McDowell County?
Median Population Age in McDowell County is 44.3 Years.
What is the Average Family Size in McDowell County
Average Family Size in McDowell County is 2.8 People.
What is the Average Household Size in McDowell County
Average Household Size in McDowell County is 2.4 People.
What is Per Capita Income in McDowell County?
Per Capita income in McDowell County is $29,047.
What is the Median Family Income in McDowell County?
Median Family Income in McDowell County is $65,510.
What is the Median Household income in McDowell County?
Median Household Income in McDowell County is $53,532.
What is Income or Wage Gap in McDowell County?
Income or Wage Gap in McDowell County is 10.6%.
Women in McDowell County earn 89.4 cents for every dollar earned by a man.
What is Family Income Deficit in McDowell County?
Family Income Deficit in McDowell County is $10,380.
Families that are below poverty line in McDowell County earn $10,380 less on average than the poverty threshold level.
What is Inequality or Gini Index in McDowell County?
Inequality or Gini Index in McDowell County is 0.44.
How Large is the Labor Force in McDowell County?
There are 19,873 People in the Labor Forcein in McDowell County.
What is the Percentage of People in the Labor Force in McDowell County?
53.8% of People are in the Labor Force in McDowell County.
What is the Unemployment Rate in McDowell County?
Unemployment Rate in McDowell County is 5.5%.