Johnston County, NC
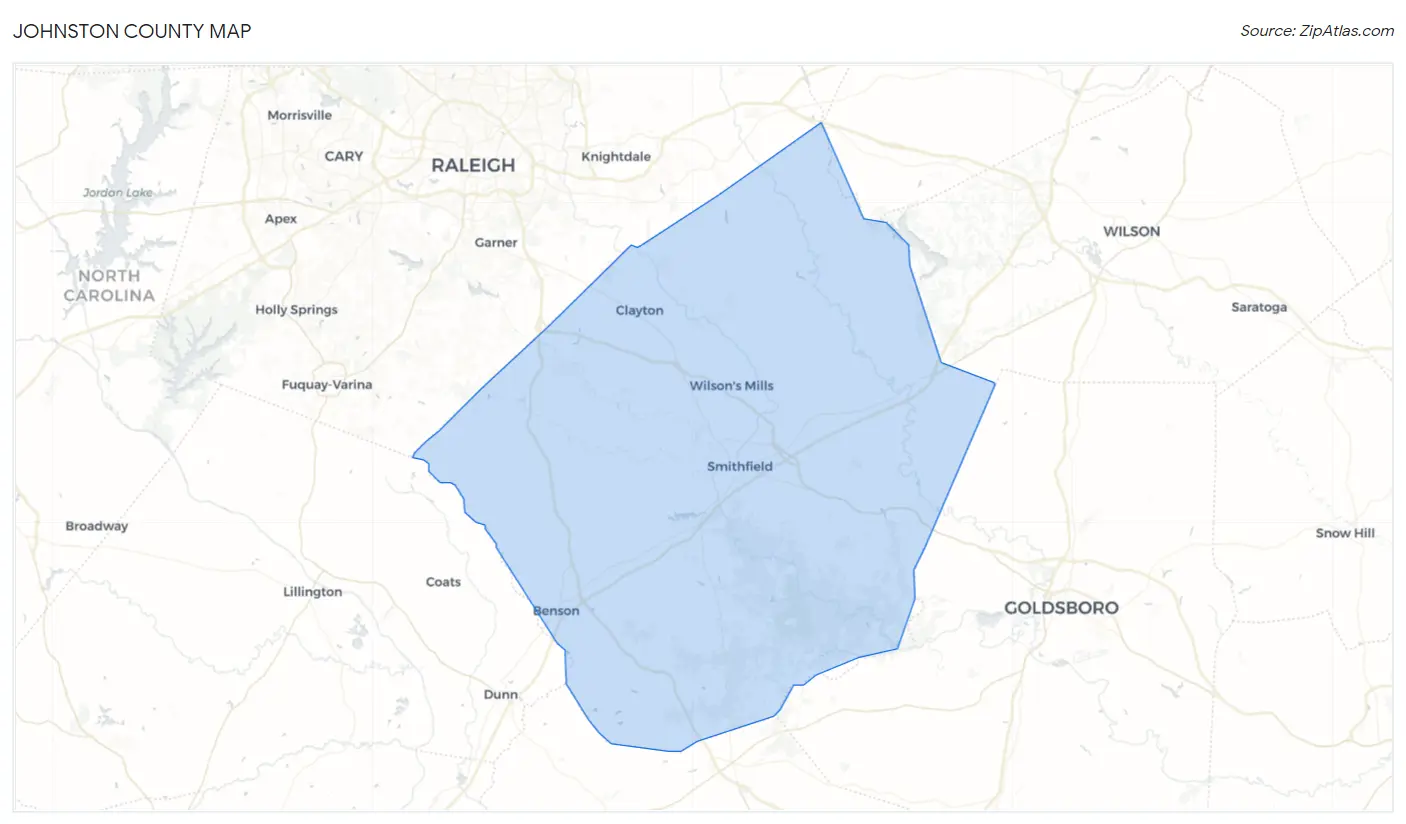
Johnston County Map
Johnston County Overview
219,042
TOTAL POPULATION
108,299
MALE POPULATION
110,743
FEMALE POPULATION
97.79
MALES / 100 FEMALES
102.26
FEMALES / 100 MALES
38.4
MEDIAN AGE
3.2
AVG FAMILY SIZE
2.7
AVG HOUSEHOLD SIZE
$35,078
PER CAPITA INCOME
$93,151
AVG FAMILY INCOME
$75,288
AVG HOUSEHOLD INCOME
23.8%
WAGE / INCOME GAP [ % ]
76.2¢/ $1
WAGE / INCOME GAP [ $ ]
$10,690
FAMILY INCOME DEFICIT
0.42
INEQUALITY / GINI INDEX
112,644
LABOR FORCE [ PEOPLE ]
66.0%
PERCENT IN LABOR FORCE
3.7%
UNEMPLOYMENT RATE
Johnston County Area Codes
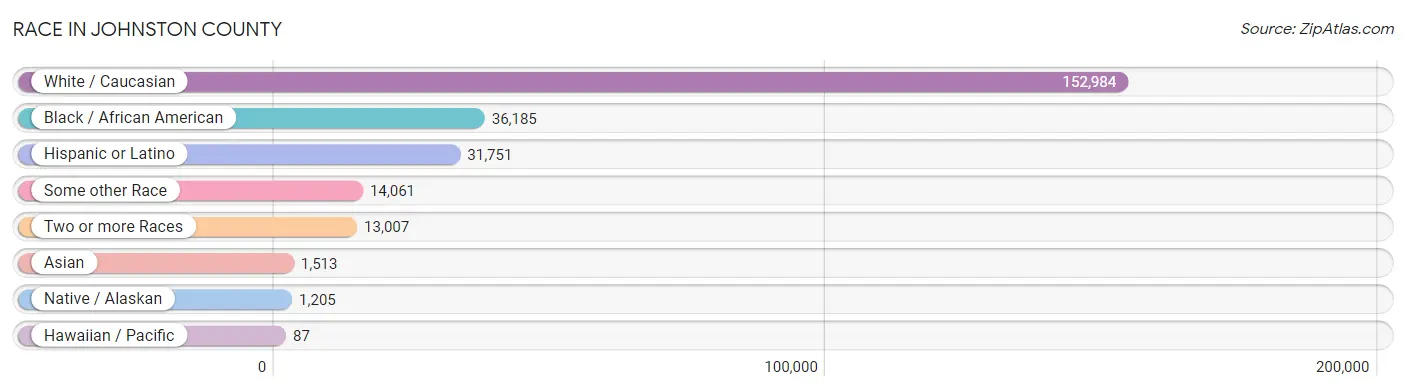
Race in Johnston County
The most populous races in Johnston County are White / Caucasian (152,984 | 69.8%), Black / African American (36,185 | 16.5%), and Hispanic or Latino (31,751 | 14.5%).
| Race | # Population | % Population |
| Asian | 1,513 | 0.7% |
| Black / African American | 36,185 | 16.5% |
| Hawaiian / Pacific | 87 | 0.0% |
| Hispanic or Latino | 31,751 | 14.5% |
| Native / Alaskan | 1,205 | 0.5% |
| White / Caucasian | 152,984 | 69.8% |
| Two or more Races | 13,007 | 5.9% |
| Some other Race | 14,061 | 6.4% |
| Total | 219,042 | 100.0% |
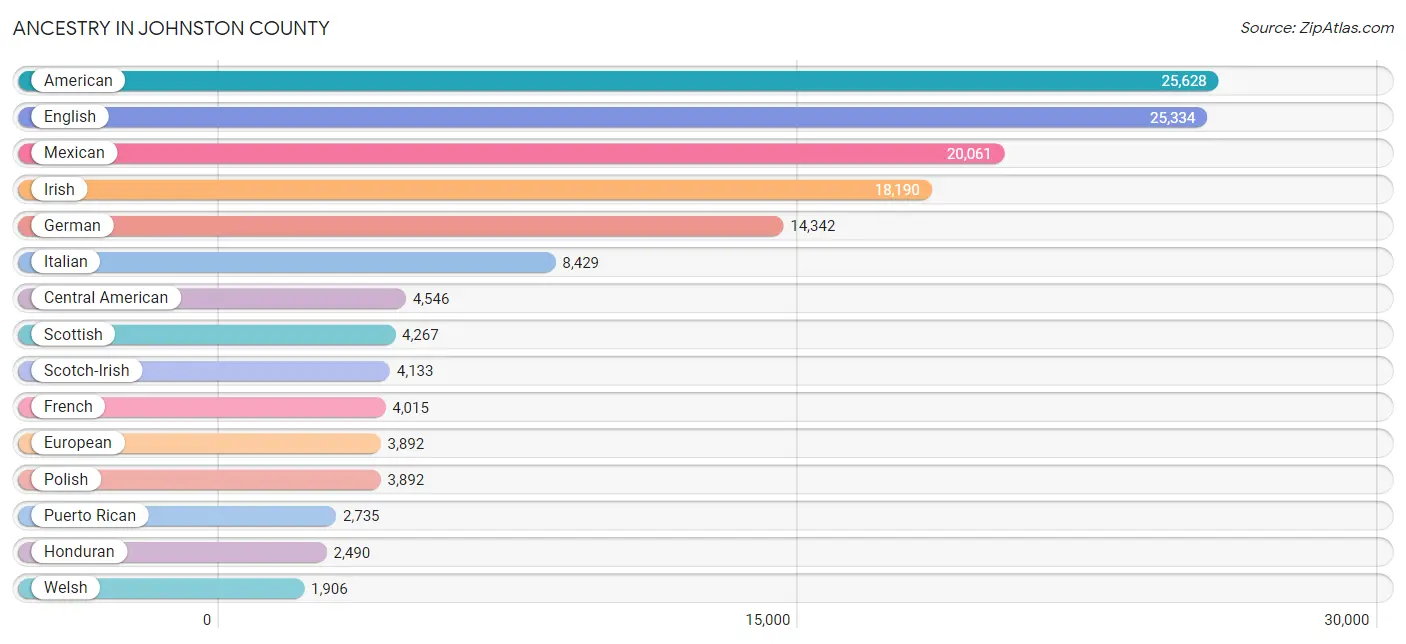
Ancestry in Johnston County
The most populous ancestries reported in Johnston County are American (25,628 | 11.7%), English (25,334 | 11.6%), Mexican (20,061 | 9.2%), Irish (18,190 | 8.3%), and German (14,342 | 6.6%), together accounting for 47.3% of all Johnston County residents.
| Ancestry | # Population | % Population |
| African | 1,151 | 0.5% |
| American | 25,628 | 11.7% |
| Arab | 1,205 | 0.5% |
| Argentinean | 35 | 0.0% |
| Armenian | 22 | 0.0% |
| Australian | 15 | 0.0% |
| Austrian | 335 | 0.2% |
| Bahamian | 75 | 0.0% |
| Bangladeshi | 14 | 0.0% |
| Barbadian | 8 | 0.0% |
| Belgian | 148 | 0.1% |
| Bhutanese | 238 | 0.1% |
| Blackfeet | 96 | 0.0% |
| Bolivian | 65 | 0.0% |
| Brazilian | 193 | 0.1% |
| British | 1,021 | 0.5% |
| Bulgarian | 118 | 0.1% |
| Burmese | 481 | 0.2% |
| Canadian | 161 | 0.1% |
| Celtic | 25 | 0.0% |
| Central American | 4,546 | 2.1% |
| Central American Indian | 110 | 0.1% |
| Cherokee | 1,448 | 0.7% |
| Chilean | 22 | 0.0% |
| Chippewa | 16 | 0.0% |
| Colombian | 664 | 0.3% |
| Costa Rican | 134 | 0.1% |
| Croatian | 188 | 0.1% |
| Cuban | 923 | 0.4% |
| Czech | 262 | 0.1% |
| Czechoslovakian | 173 | 0.1% |
| Danish | 380 | 0.2% |
| Dominican | 937 | 0.4% |
| Dutch | 1,205 | 0.5% |
| Eastern European | 461 | 0.2% |
| Ecuadorian | 302 | 0.1% |
| Egyptian | 269 | 0.1% |
| English | 25,334 | 11.6% |
| Ethiopian | 34 | 0.0% |
| European | 3,892 | 1.8% |
| Filipino | 6 | 0.0% |
| Finnish | 85 | 0.0% |
| French | 4,015 | 1.8% |
| French Canadian | 635 | 0.3% |
| German | 14,342 | 6.6% |
| Ghanaian | 44 | 0.0% |
| Greek | 538 | 0.3% |
| Guamanian / Chamorro | 14 | 0.0% |
| Guatemalan | 341 | 0.2% |
| Guyanese | 50 | 0.0% |
| Haitian | 198 | 0.1% |
| Honduran | 2,490 | 1.1% |
| Hungarian | 391 | 0.2% |
| Icelander | 9 | 0.0% |
| Indian (Asian) | 617 | 0.3% |
| Iranian | 36 | 0.0% |
| Irish | 18,190 | 8.3% |
| Iroquois | 20 | 0.0% |
| Israeli | 37 | 0.0% |
| Italian | 8,429 | 3.8% |
| Jamaican | 139 | 0.1% |
| Jordanian | 360 | 0.2% |
| Korean | 1,101 | 0.5% |
| Laotian | 138 | 0.1% |
| Latvian | 27 | 0.0% |
| Lebanese | 112 | 0.1% |
| Lithuanian | 64 | 0.0% |
| Lumbee | 130 | 0.1% |
| Malaysian | 35 | 0.0% |
| Mexican | 20,061 | 9.2% |
| Mexican American Indian | 765 | 0.4% |
| Moroccan | 34 | 0.0% |
| Native Hawaiian | 117 | 0.1% |
| Navajo | 21 | 0.0% |
| Nicaraguan | 726 | 0.3% |
| Nigerian | 91 | 0.0% |
| Northern European | 216 | 0.1% |
| Norwegian | 918 | 0.4% |
| Palestinian | 95 | 0.0% |
| Panamanian | 4 | 0.0% |
| Pennsylvania German | 24 | 0.0% |
| Peruvian | 457 | 0.2% |
| Polish | 3,892 | 1.8% |
| Portuguese | 91 | 0.0% |
| Puerto Rican | 2,735 | 1.3% |
| Romanian | 178 | 0.1% |
| Russian | 668 | 0.3% |
| Salvadoran | 851 | 0.4% |
| Samoan | 50 | 0.0% |
| Scandinavian | 868 | 0.4% |
| Scotch-Irish | 4,133 | 1.9% |
| Scottish | 4,267 | 1.9% |
| Senegalese | 11 | 0.0% |
| Serbian | 19 | 0.0% |
| Sioux | 12 | 0.0% |
| Slavic | 19 | 0.0% |
| Slovak | 134 | 0.1% |
| Slovene | 76 | 0.0% |
| South African | 115 | 0.1% |
| South American | 1,718 | 0.8% |
| South American Indian | 51 | 0.0% |
| Spaniard | 293 | 0.1% |
| Spanish | 46 | 0.0% |
| Sri Lankan | 100 | 0.1% |
| Subsaharan African | 1,755 | 0.8% |
| Swedish | 870 | 0.4% |
| Swiss | 373 | 0.2% |
| Taiwanese | 8 | 0.0% |
| Thai | 508 | 0.2% |
| Trinidadian and Tobagonian | 37 | 0.0% |
| Ukrainian | 227 | 0.1% |
| Uruguayan | 22 | 0.0% |
| Venezuelan | 151 | 0.1% |
| Welsh | 1,906 | 0.9% |
| West Indian | 132 | 0.1% |
| Yugoslavian | 23 | 0.0% | View All 116 Rows |
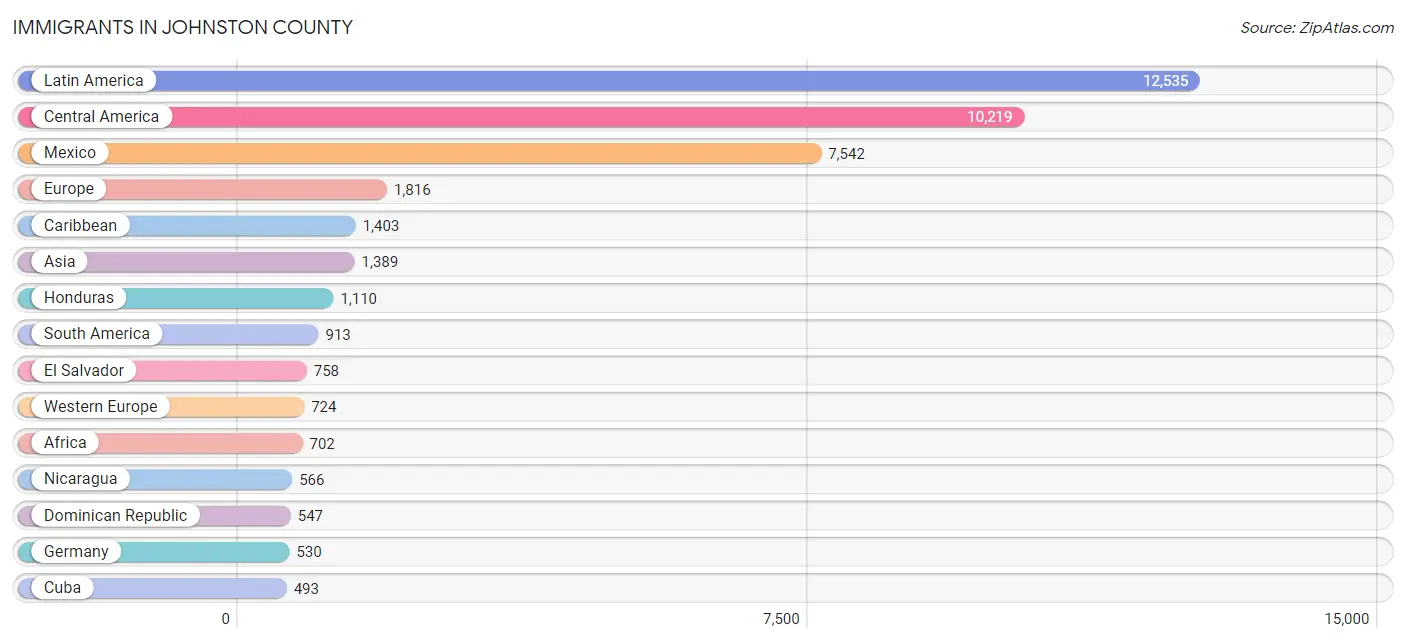
Immigrants in Johnston County
The most numerous immigrant groups reported in Johnston County came from Latin America (12,535 | 5.7%), Central America (10,219 | 4.7%), Mexico (7,542 | 3.4%), Europe (1,816 | 0.8%), and Caribbean (1,403 | 0.6%), together accounting for 15.3% of all Johnston County residents.
| Immigration Origin | # Population | % Population |
| Africa | 702 | 0.3% |
| Argentina | 28 | 0.0% |
| Asia | 1,389 | 0.6% |
| Australia | 15 | 0.0% |
| Bahamas | 75 | 0.0% |
| Barbados | 5 | 0.0% |
| Belarus | 18 | 0.0% |
| Belgium | 84 | 0.0% |
| Belize | 32 | 0.0% |
| Brazil | 95 | 0.0% |
| Bulgaria | 118 | 0.1% |
| Cambodia | 12 | 0.0% |
| Canada | 219 | 0.1% |
| Caribbean | 1,403 | 0.6% |
| Central America | 10,219 | 4.7% |
| Chile | 5 | 0.0% |
| China | 215 | 0.1% |
| Colombia | 263 | 0.1% |
| Congo | 224 | 0.1% |
| Croatia | 17 | 0.0% |
| Cuba | 493 | 0.2% |
| Denmark | 150 | 0.1% |
| Dominican Republic | 547 | 0.3% |
| Eastern Africa | 106 | 0.1% |
| Eastern Asia | 392 | 0.2% |
| Eastern Europe | 457 | 0.2% |
| Ecuador | 180 | 0.1% |
| Egypt | 35 | 0.0% |
| El Salvador | 758 | 0.4% |
| England | 171 | 0.1% |
| Ethiopia | 39 | 0.0% |
| Europe | 1,816 | 0.8% |
| France | 8 | 0.0% |
| Germany | 530 | 0.2% |
| Ghana | 23 | 0.0% |
| Guatemala | 187 | 0.1% |
| Guyana | 50 | 0.0% |
| Haiti | 103 | 0.1% |
| Honduras | 1,110 | 0.5% |
| Hungary | 18 | 0.0% |
| India | 99 | 0.1% |
| Indonesia | 88 | 0.0% |
| Iran | 15 | 0.0% |
| Ireland | 28 | 0.0% |
| Italy | 238 | 0.1% |
| Jamaica | 109 | 0.1% |
| Japan | 28 | 0.0% |
| Jordan | 153 | 0.1% |
| Kazakhstan | 3 | 0.0% |
| Korea | 149 | 0.1% |
| Kuwait | 79 | 0.0% |
| Laos | 25 | 0.0% |
| Latin America | 12,535 | 5.7% |
| Mexico | 7,542 | 3.4% |
| Middle Africa | 224 | 0.1% |
| Morocco | 67 | 0.0% |
| Netherlands | 87 | 0.0% |
| Nicaragua | 566 | 0.3% |
| Nigeria | 109 | 0.1% |
| Northern Africa | 141 | 0.1% |
| Northern Europe | 381 | 0.2% |
| Oceania | 15 | 0.0% |
| Pakistan | 68 | 0.0% |
| Panama | 24 | 0.0% |
| Peru | 163 | 0.1% |
| Philippines | 307 | 0.1% |
| Poland | 83 | 0.0% |
| Romania | 67 | 0.0% |
| Russia | 84 | 0.0% |
| Saudi Arabia | 6 | 0.0% |
| Scotland | 8 | 0.0% |
| South Africa | 25 | 0.0% |
| South America | 913 | 0.4% |
| South Central Asia | 185 | 0.1% |
| South Eastern Asia | 491 | 0.2% |
| Southern Europe | 254 | 0.1% |
| Spain | 16 | 0.0% |
| Switzerland | 15 | 0.0% |
| Taiwan | 13 | 0.0% |
| Trinidad and Tobago | 71 | 0.0% |
| Uganda | 67 | 0.0% |
| Ukraine | 52 | 0.0% |
| Uruguay | 22 | 0.0% |
| Venezuela | 107 | 0.1% |
| Vietnam | 59 | 0.0% |
| Western Africa | 189 | 0.1% |
| Western Asia | 288 | 0.1% |
| Western Europe | 724 | 0.3% |
| Yemen | 50 | 0.0% | View All 89 Rows |
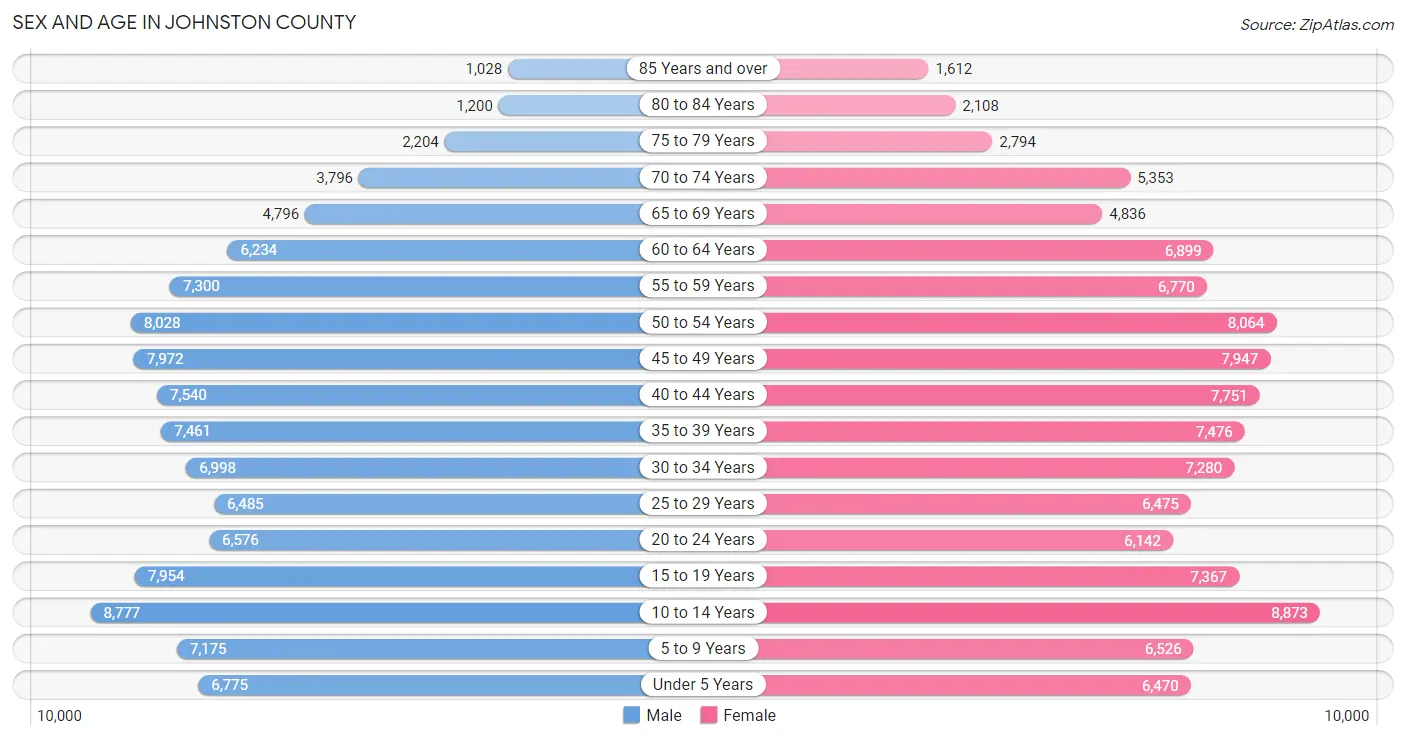
Sex and Age in Johnston County
Sex and Age in Johnston County
The most populous age groups in Johnston County are 10 to 14 Years (8,777 | 8.1%) for men and 10 to 14 Years (8,873 | 8.0%) for women.
| Age Bracket | Male | Female |
| Under 5 Years | 6,775 (6.3%) | 6,470 (5.8%) |
| 5 to 9 Years | 7,175 (6.6%) | 6,526 (5.9%) |
| 10 to 14 Years | 8,777 (8.1%) | 8,873 (8.0%) |
| 15 to 19 Years | 7,954 (7.3%) | 7,367 (6.7%) |
| 20 to 24 Years | 6,576 (6.1%) | 6,142 (5.6%) |
| 25 to 29 Years | 6,485 (6.0%) | 6,475 (5.9%) |
| 30 to 34 Years | 6,998 (6.5%) | 7,280 (6.6%) |
| 35 to 39 Years | 7,461 (6.9%) | 7,476 (6.8%) |
| 40 to 44 Years | 7,540 (7.0%) | 7,751 (7.0%) |
| 45 to 49 Years | 7,972 (7.4%) | 7,947 (7.2%) |
| 50 to 54 Years | 8,028 (7.4%) | 8,064 (7.3%) |
| 55 to 59 Years | 7,300 (6.7%) | 6,770 (6.1%) |
| 60 to 64 Years | 6,234 (5.8%) | 6,899 (6.2%) |
| 65 to 69 Years | 4,796 (4.4%) | 4,836 (4.4%) |
| 70 to 74 Years | 3,796 (3.5%) | 5,353 (4.8%) |
| 75 to 79 Years | 2,204 (2.0%) | 2,794 (2.5%) |
| 80 to 84 Years | 1,200 (1.1%) | 2,108 (1.9%) |
| 85 Years and over | 1,028 (0.9%) | 1,612 (1.5%) |
| Total | 108,299 (100.0%) | 110,743 (100.0%) |
Families and Households in Johnston County
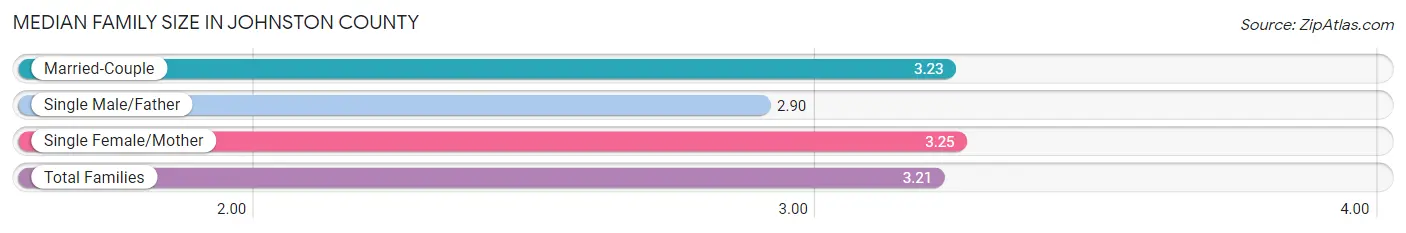
Median Family Size in Johnston County
The median family size in Johnston County is 3.21 persons per family, with single female/mother families (8,680 | 15.0%) accounting for the largest median family size of 3.25 persons per family. On the other hand, single male/father families (3,830 | 6.6%) represent the smallest median family size with 2.90 persons per family.
| Family Type | # Families | Family Size |
| Married-Couple | 45,383 (78.4%) | 3.23 |
| Single Male/Father | 3,830 (6.6%) | 2.90 |
| Single Female/Mother | 8,680 (15.0%) | 3.25 |
| Total Families | 57,893 (100.0%) | 3.21 |
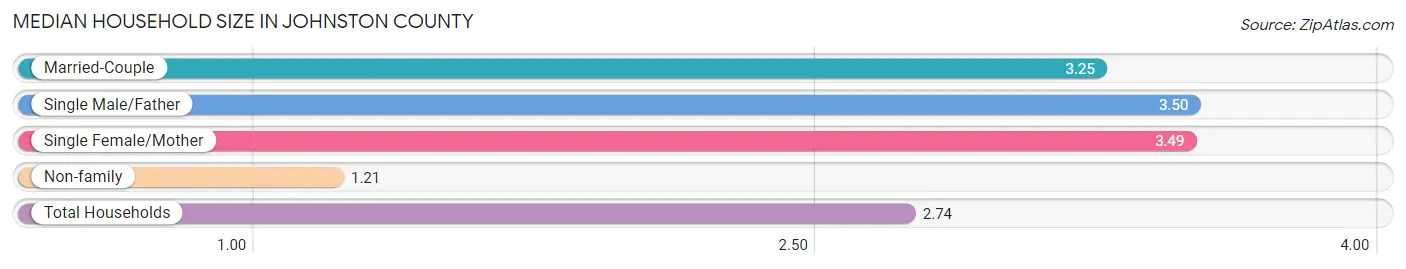
Median Household Size in Johnston County
The median household size in Johnston County is 2.74 persons per household, with single male/father households (3,830 | 4.8%) accounting for the largest median household size of 3.5 persons per household. non-family households (21,494 | 27.1%) represent the smallest median household size with 1.21 persons per household.
| Household Type | # Households | Household Size |
| Married-Couple | 45,383 (57.2%) | 3.25 |
| Single Male/Father | 3,830 (4.8%) | 3.50 |
| Single Female/Mother | 8,680 (10.9%) | 3.49 |
| Non-family | 21,494 (27.1%) | 1.21 |
| Total Households | 79,387 (100.0%) | 2.74 |
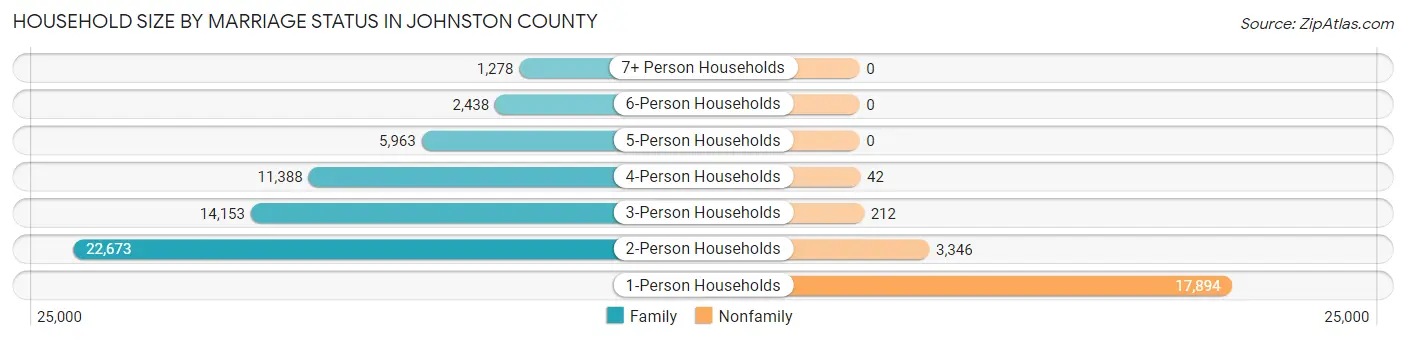
Household Size by Marriage Status in Johnston County
Out of a total of 79,387 households in Johnston County, 57,893 (72.9%) are family households, while 21,494 (27.1%) are nonfamily households. The most numerous type of family households are 2-person households, comprising 22,673, and the most common type of nonfamily households are 1-person households, comprising 17,894.
| Household Size | Family Households | Nonfamily Households |
| 1-Person Households | - | 17,894 (22.5%) |
| 2-Person Households | 22,673 (28.6%) | 3,346 (4.2%) |
| 3-Person Households | 14,153 (17.8%) | 212 (0.3%) |
| 4-Person Households | 11,388 (14.3%) | 42 (0.1%) |
| 5-Person Households | 5,963 (7.5%) | 0 (0.0%) |
| 6-Person Households | 2,438 (3.1%) | 0 (0.0%) |
| 7+ Person Households | 1,278 (1.6%) | 0 (0.0%) |
| Total | 57,893 (72.9%) | 21,494 (27.1%) |
Female Fertility in Johnston County
Fertility by Age in Johnston County
Average fertility rate in Johnston County is 66.0 births per 1,000 women. Women in the age bracket of 20 to 34 years have the highest fertility rate with 117.0 births per 1,000 women. Women in the age bracket of 20 to 34 years acount for 67.7% of all women with births.
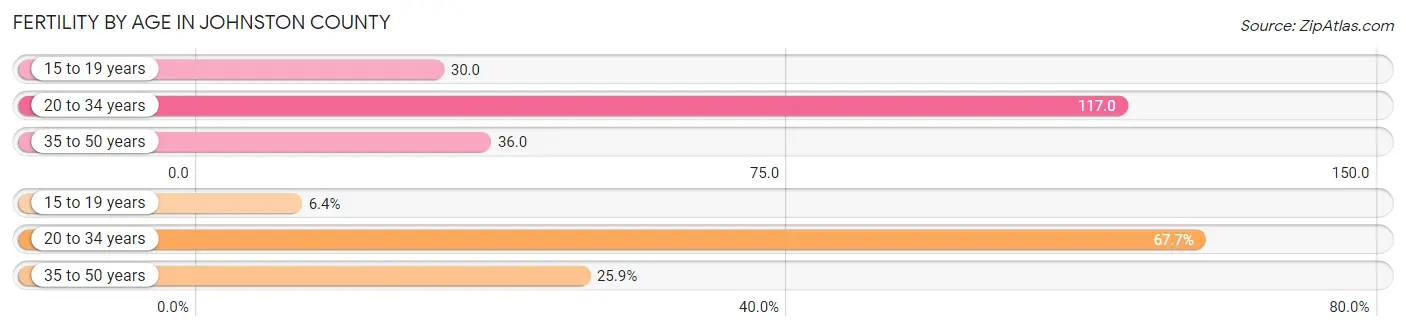
| Age Bracket | Women with Births | Births / 1,000 Women |
| 15 to 19 years | 219 (6.4%) | 30.0 |
| 20 to 34 years | 2,330 (67.7%) | 117.0 |
| 35 to 50 years | 892 (25.9%) | 36.0 |
| Total | 3,441 (100.0%) | 66.0 |
Fertility by Age by Marriage Status in Johnston County
67.6% of women with births (3,441) in Johnston County are married. The highest percentage of unmarried women with births falls into 15 to 19 years age bracket with 100.0% of them unmarried at the time of birth, while the lowest percentage of unmarried women with births belong to 35 to 50 years age bracket with 15.6% of them unmarried.
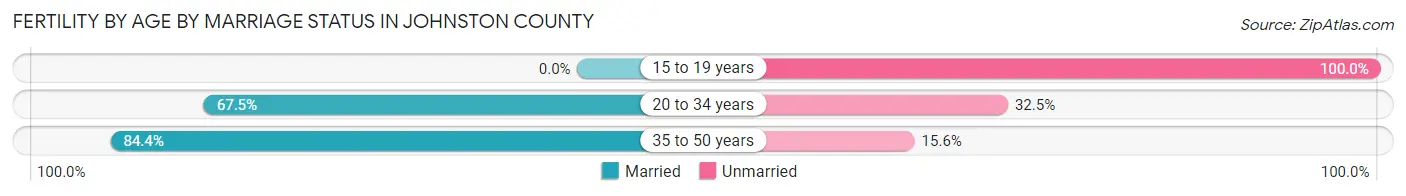
| Age Bracket | Married | Unmarried |
| 15 to 19 years | 0 (0.0%) | 219 (100.0%) |
| 20 to 34 years | 1,573 (67.5%) | 757 (32.5%) |
| 35 to 50 years | 753 (84.4%) | 139 (15.6%) |
| Total | 2,326 (67.6%) | 1,115 (32.4%) |
Fertility by Education in Johnston County
Average fertility rate in Johnston County is 66.0 births per 1,000 women. Women with the education attainment of bachelor's degree have the highest fertility rate of 99.0 births per 1,000 women, while women with the education attainment of less than high school have the lowest fertility at 27.0 births per 1,000 women. Women with the education attainment of college or associate's degree represent 36.7% of all women with births.
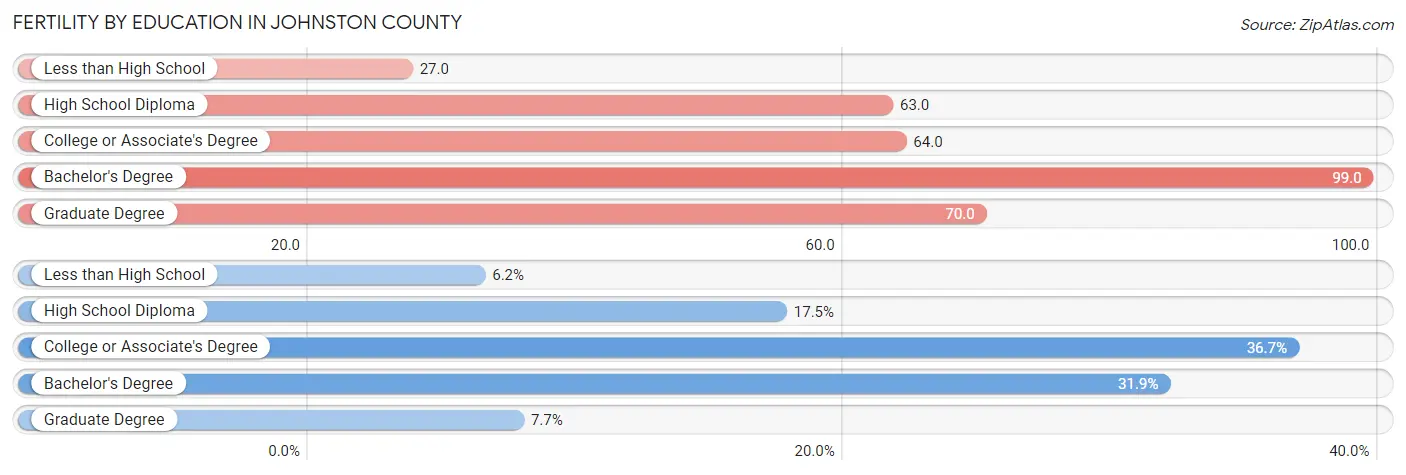
| Educational Attainment | Women with Births | Births / 1,000 Women |
| Less than High School | 214 (6.2%) | 27.0 |
| High School Diploma | 603 (17.5%) | 63.0 |
| College or Associate's Degree | 1,263 (36.7%) | 64.0 |
| Bachelor's Degree | 1,097 (31.9%) | 99.0 |
| Graduate Degree | 264 (7.7%) | 70.0 |
| Total | 3,441 (100.0%) | 66.0 |
Fertility by Education by Marriage Status in Johnston County
32.4% of women with births in Johnston County are unmarried. Women with the educational attainment of graduate degree are most likely to be married with 81.1% of them married at childbirth, while women with the educational attainment of high school diploma are least likely to be married with 63.0% of them unmarried at childbirth.
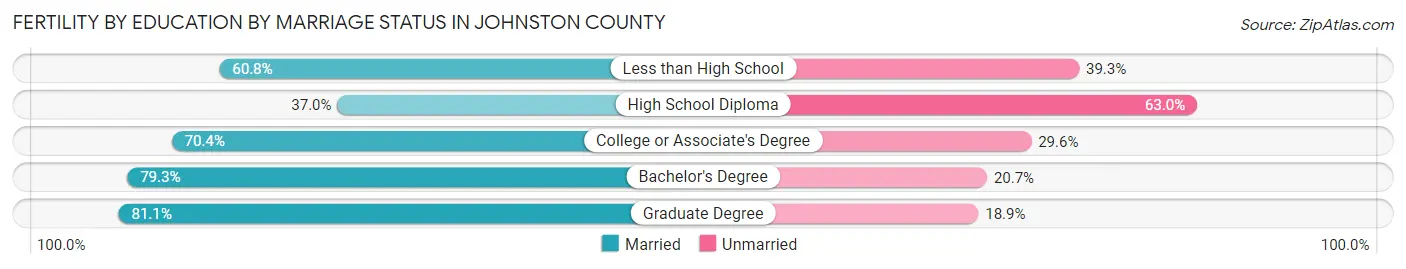
| Educational Attainment | Married | Unmarried |
| Less than High School | 130 (60.8%) | 84 (39.3%) |
| High School Diploma | 223 (37.0%) | 380 (63.0%) |
| College or Associate's Degree | 889 (70.4%) | 374 (29.6%) |
| Bachelor's Degree | 870 (79.3%) | 227 (20.7%) |
| Graduate Degree | 214 (81.1%) | 50 (18.9%) |
| Total | 2,326 (67.6%) | 1,115 (32.4%) |
Income in Johnston County
Income Overview in Johnston County
Per Capita Income in Johnston County is $35,078, while median incomes of families and households are $93,151 and $75,288 respectively.
| Characteristic | Number | Measure |
| Per Capita Income | 219,042 | $35,078 |
| Median Family Income | 57,893 | $93,151 |
| Mean Family Income | 57,893 | $106,923 |
| Median Household Income | 79,387 | $75,288 |
| Mean Household Income | 79,387 | $93,586 |
| Income Deficit | 57,893 | $10,690 |
| Wage / Income Gap (%) | 219,042 | 23.77% |
| Wage / Income Gap ($) | 219,042 | 76.23¢ per $1 |
| Gini / Inequality Index | 219,042 | 0.42 |
Earnings by Sex in Johnston County
Average Earnings in Johnston County are $42,838, $48,255 for men and $36,784 for women, a difference of 23.8%.
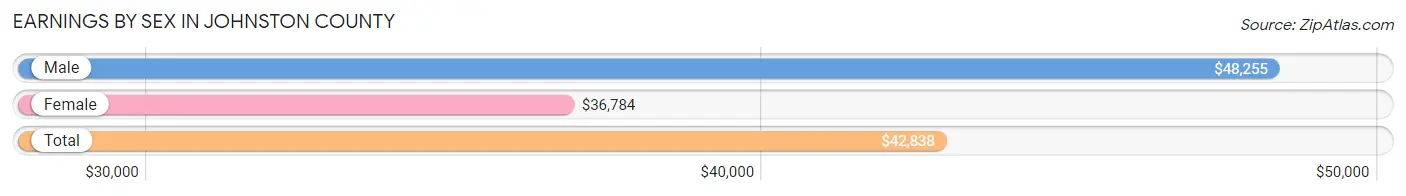
| Sex | Number | Average Earnings |
| Male | 61,692 (53.1%) | $48,255 |
| Female | 54,500 (46.9%) | $36,784 |
| Total | 116,192 (100.0%) | $42,838 |
Earnings by Sex by Income Bracket in Johnston County
The most common earnings brackets in Johnston County are $100,000+ for men (9,274 | 15.0%) and $55,000 to $64,999 for women (5,408 | 9.9%).
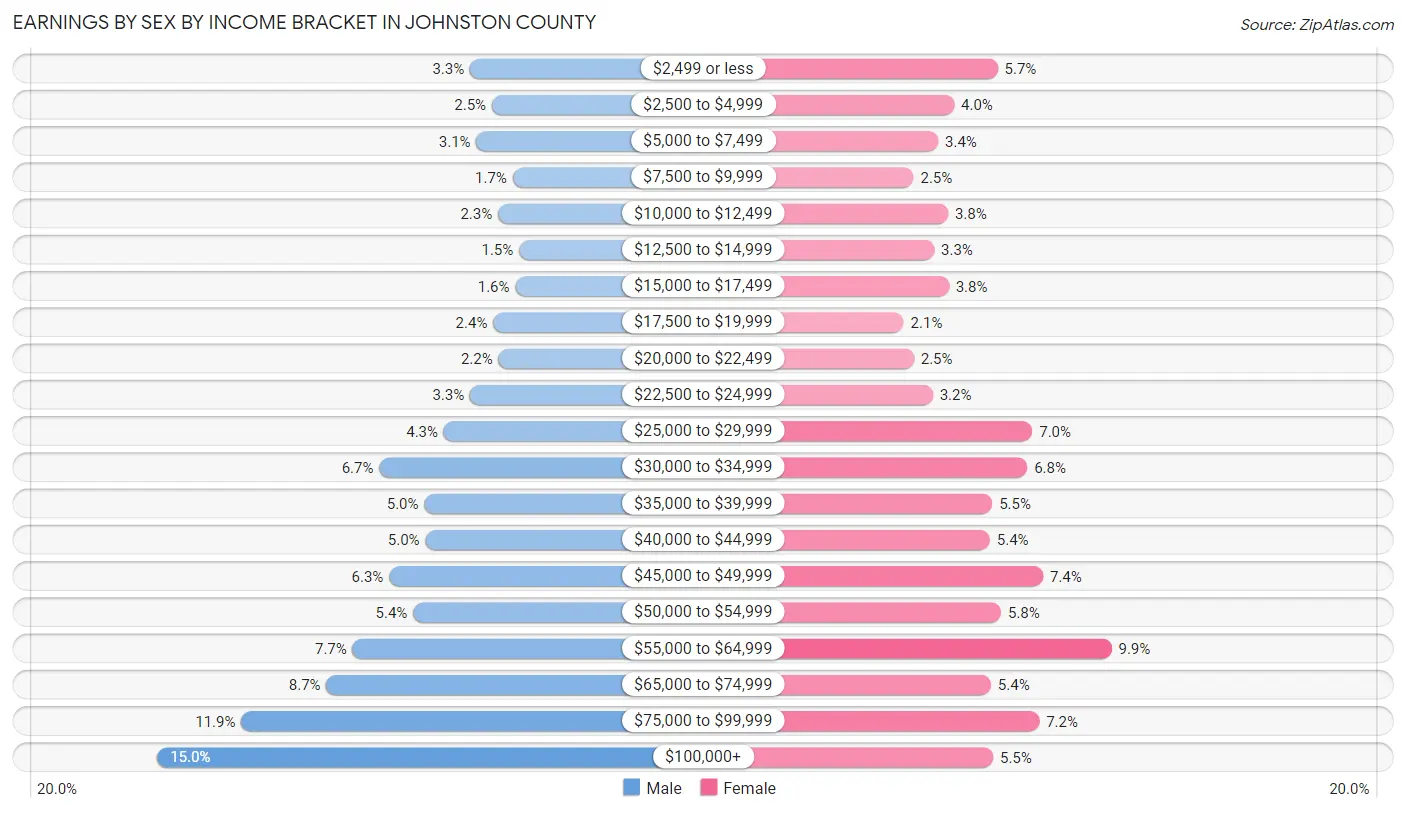
| Income | Male | Female |
| $2,499 or less | 2,039 (3.3%) | 3,081 (5.7%) |
| $2,500 to $4,999 | 1,534 (2.5%) | 2,191 (4.0%) |
| $5,000 to $7,499 | 1,892 (3.1%) | 1,866 (3.4%) |
| $7,500 to $9,999 | 1,053 (1.7%) | 1,365 (2.5%) |
| $10,000 to $12,499 | 1,393 (2.3%) | 2,065 (3.8%) |
| $12,500 to $14,999 | 904 (1.5%) | 1,782 (3.3%) |
| $15,000 to $17,499 | 996 (1.6%) | 2,083 (3.8%) |
| $17,500 to $19,999 | 1,508 (2.4%) | 1,161 (2.1%) |
| $20,000 to $22,499 | 1,382 (2.2%) | 1,368 (2.5%) |
| $22,500 to $24,999 | 2,044 (3.3%) | 1,754 (3.2%) |
| $25,000 to $29,999 | 2,649 (4.3%) | 3,788 (7.0%) |
| $30,000 to $34,999 | 4,137 (6.7%) | 3,682 (6.8%) |
| $35,000 to $39,999 | 3,098 (5.0%) | 2,969 (5.4%) |
| $40,000 to $44,999 | 3,075 (5.0%) | 2,920 (5.4%) |
| $45,000 to $49,999 | 3,910 (6.3%) | 4,007 (7.3%) |
| $50,000 to $54,999 | 3,358 (5.4%) | 3,149 (5.8%) |
| $55,000 to $64,999 | 4,756 (7.7%) | 5,408 (9.9%) |
| $65,000 to $74,999 | 5,359 (8.7%) | 2,945 (5.4%) |
| $75,000 to $99,999 | 7,331 (11.9%) | 3,928 (7.2%) |
| $100,000+ | 9,274 (15.0%) | 2,988 (5.5%) |
| Total | 61,692 (100.0%) | 54,500 (100.0%) |
Earnings by Sex by Educational Attainment in Johnston County
Average earnings in Johnston County are $54,671 for men and $42,048 for women, a difference of 23.1%. Men with an educational attainment of graduate degree enjoy the highest average annual earnings of $82,633, while those with less than high school education earn the least with $33,634. Women with an educational attainment of graduate degree earn the most with the average annual earnings of $59,158, while those with less than high school education have the smallest earnings of $21,077.
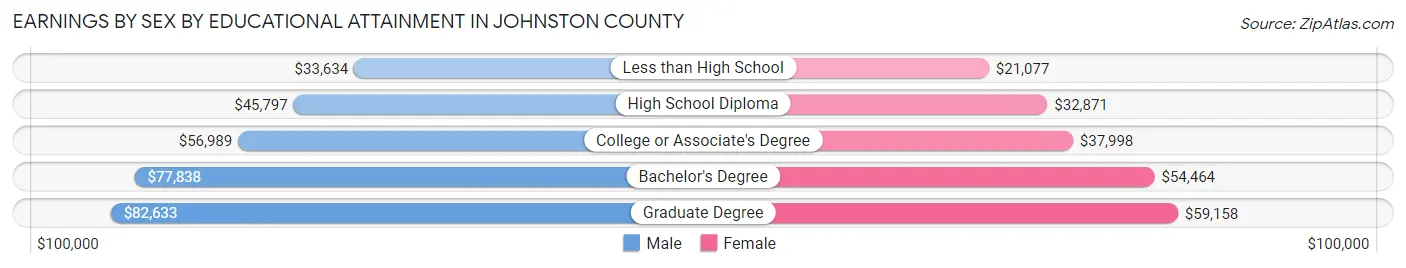
| Educational Attainment | Male Income | Female Income |
| Less than High School | $33,634 | $21,077 |
| High School Diploma | $45,797 | $32,871 |
| College or Associate's Degree | $56,989 | $37,998 |
| Bachelor's Degree | $77,838 | $54,464 |
| Graduate Degree | $82,633 | $59,158 |
| Total | $54,671 | $42,048 |
Family Income in Johnston County
Family Income Brackets in Johnston County
According to the Johnston County family income data, there are 15,400 families falling into the $100,000 to $149,999 income range, which is the most common income bracket and makes up 26.6% of all families. Conversely, the $10,000 to $14,999 income bracket is the least frequent group with only 579 families (1.0%) belonging to this category.
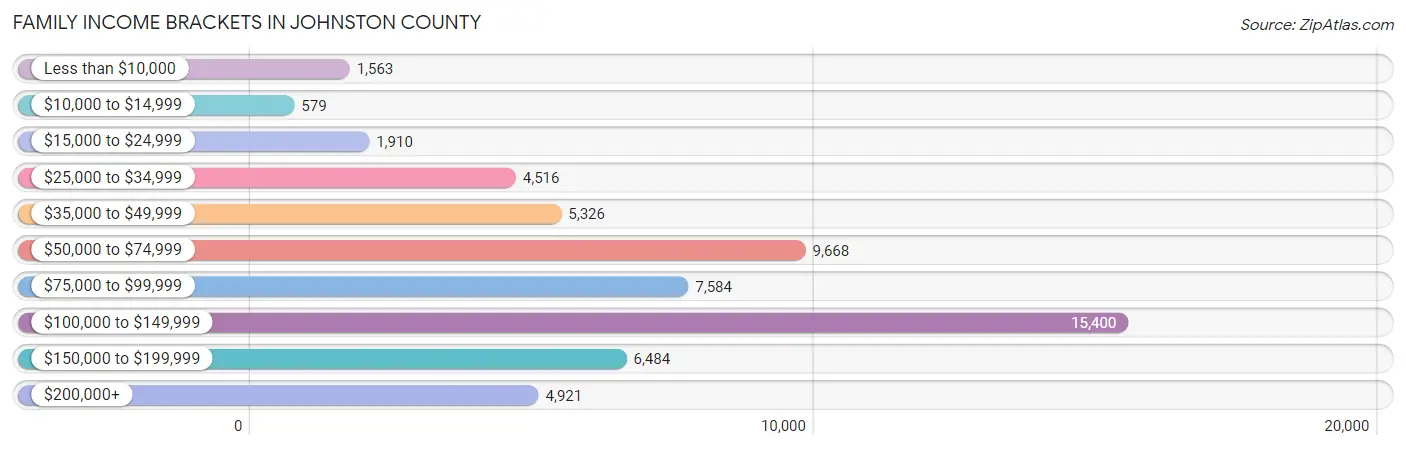
| Income Bracket | # Families | % Families |
| Less than $10,000 | 1,563 | 2.7% |
| $10,000 to $14,999 | 579 | 1.0% |
| $15,000 to $24,999 | 1,910 | 3.3% |
| $25,000 to $34,999 | 4,516 | 7.8% |
| $35,000 to $49,999 | 5,326 | 9.2% |
| $50,000 to $74,999 | 9,668 | 16.7% |
| $75,000 to $99,999 | 7,584 | 13.1% |
| $100,000 to $149,999 | 15,400 | 26.6% |
| $150,000 to $199,999 | 6,484 | 11.2% |
| $200,000+ | 4,921 | 8.5% |
Family Income by Famaliy Size in Johnston County
4-person families (11,093 | 19.2%) account for the highest median family income in Johnston County with $112,544 per family, while 2-person families (24,475 | 42.3%) have the highest median income of $38,850 per family member.
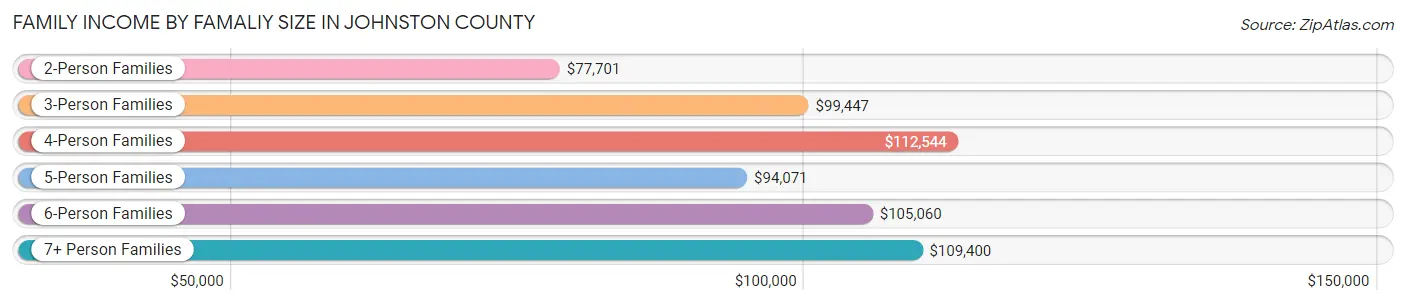
| Income Bracket | # Families | Median Income |
| 2-Person Families | 24,475 (42.3%) | $77,701 |
| 3-Person Families | 13,743 (23.7%) | $99,447 |
| 4-Person Families | 11,093 (19.2%) | $112,544 |
| 5-Person Families | 5,073 (8.8%) | $94,071 |
| 6-Person Families | 2,401 (4.2%) | $105,060 |
| 7+ Person Families | 1,108 (1.9%) | $109,400 |
| Total | 57,893 (100.0%) | $93,151 |
Family Income by Number of Earners in Johnston County
The median family income in Johnston County is $93,151, with families comprising 3+ earners (7,926) having the highest median family income of $129,840, while families with no earners (7,205) have the lowest median family income of $47,205, accounting for 13.7% and 12.4% of families, respectively.

| Number of Earners | # Families | Median Income |
| No Earners | 7,205 (12.4%) | $47,205 |
| 1 Earner | 18,140 (31.3%) | $62,966 |
| 2 Earners | 24,622 (42.5%) | $112,919 |
| 3+ Earners | 7,926 (13.7%) | $129,840 |
| Total | 57,893 (100.0%) | $93,151 |
Household Income in Johnston County
Household Income Brackets in Johnston County
With 17,386 households falling in the category, the $100,000 to $149,999 income range is the most frequent in Johnston County, accounting for 21.9% of all households. In contrast, only 2,937 households (3.7%) fall into the $10,000 to $14,999 income bracket, making it the least populous group.
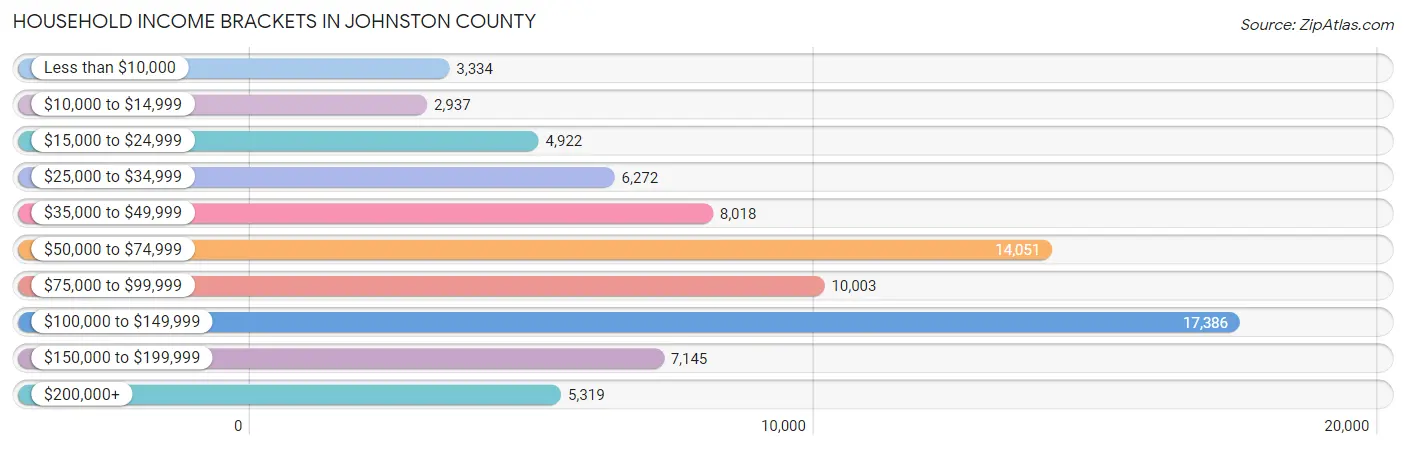
| Income Bracket | # Households | % Households |
| Less than $10,000 | 3,334 | 4.2% |
| $10,000 to $14,999 | 2,937 | 3.7% |
| $15,000 to $24,999 | 4,922 | 6.2% |
| $25,000 to $34,999 | 6,272 | 7.9% |
| $35,000 to $49,999 | 8,018 | 10.1% |
| $50,000 to $74,999 | 14,051 | 17.7% |
| $75,000 to $99,999 | 10,003 | 12.6% |
| $100,000 to $149,999 | 17,386 | 21.9% |
| $150,000 to $199,999 | 7,145 | 9.0% |
| $200,000+ | 5,319 | 6.7% |
Household Income by Householder Age in Johnston County
The median household income in Johnston County is $75,288, with the highest median household income of $92,308 found in the 45 to 64 years age bracket for the primary householder. A total of 32,350 households (40.7%) fall into this category. Meanwhile, the 15 to 24 years age bracket for the primary householder has the lowest median household income of $41,202, with 1,519 households (1.9%) in this group.
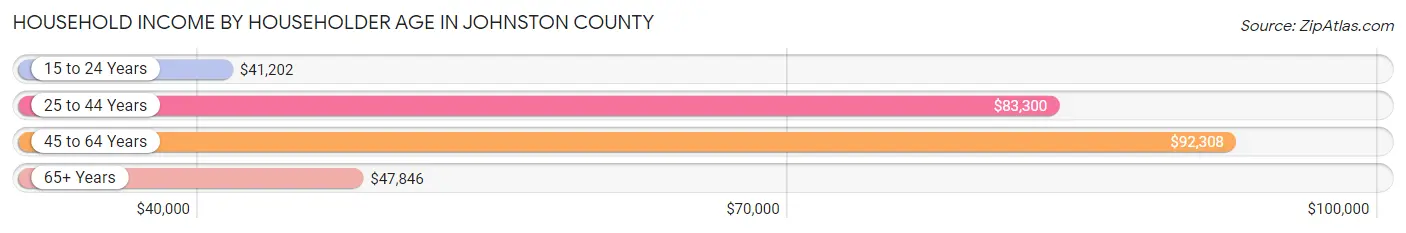
| Income Bracket | # Households | Median Income |
| 15 to 24 Years | 1,519 (1.9%) | $41,202 |
| 25 to 44 Years | 27,351 (34.4%) | $83,300 |
| 45 to 64 Years | 32,350 (40.7%) | $92,308 |
| 65+ Years | 18,167 (22.9%) | $47,846 |
| Total | 79,387 (100.0%) | $75,288 |
Poverty in Johnston County
Income Below Poverty by Sex and Age in Johnston County
With 9.5% poverty level for males and 11.8% for females among the residents of Johnston County, 15 year old males and 18 to 24 year old females are the most vulnerable to poverty, with 409 males (20.4%) and 1,766 females (20.5%) in their respective age groups living below the poverty level.
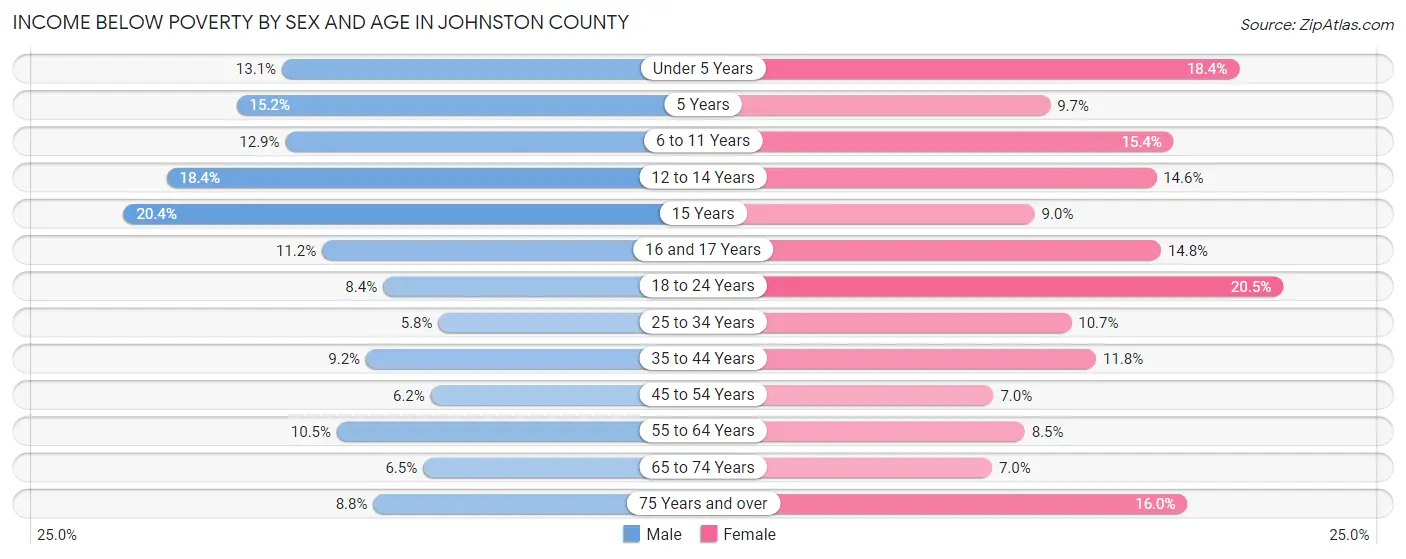
| Age Bracket | Male | Female |
| Under 5 Years | 866 (13.1%) | 1,180 (18.4%) |
| 5 Years | 246 (15.2%) | 113 (9.7%) |
| 6 to 11 Years | 1,125 (12.9%) | 1,226 (15.4%) |
| 12 to 14 Years | 965 (18.4%) | 852 (14.6%) |
| 15 Years | 409 (20.4%) | 158 (8.9%) |
| 16 and 17 Years | 346 (11.2%) | 460 (14.8%) |
| 18 to 24 Years | 784 (8.4%) | 1,766 (20.5%) |
| 25 to 34 Years | 772 (5.8%) | 1,463 (10.6%) |
| 35 to 44 Years | 1,354 (9.2%) | 1,794 (11.8%) |
| 45 to 54 Years | 971 (6.2%) | 1,127 (7.0%) |
| 55 to 64 Years | 1,407 (10.5%) | 1,161 (8.5%) |
| 65 to 74 Years | 552 (6.5%) | 704 (7.0%) |
| 75 Years and over | 382 (8.8%) | 1,002 (16.0%) |
| Total | 10,179 (9.5%) | 13,006 (11.8%) |
Income Above Poverty by Sex and Age in Johnston County
According to the poverty statistics in Johnston County, males aged 25 to 34 years and females aged 65 to 74 years are the age groups that are most secure financially, with 94.2% of males and 93.0% of females in these age groups living above the poverty line.
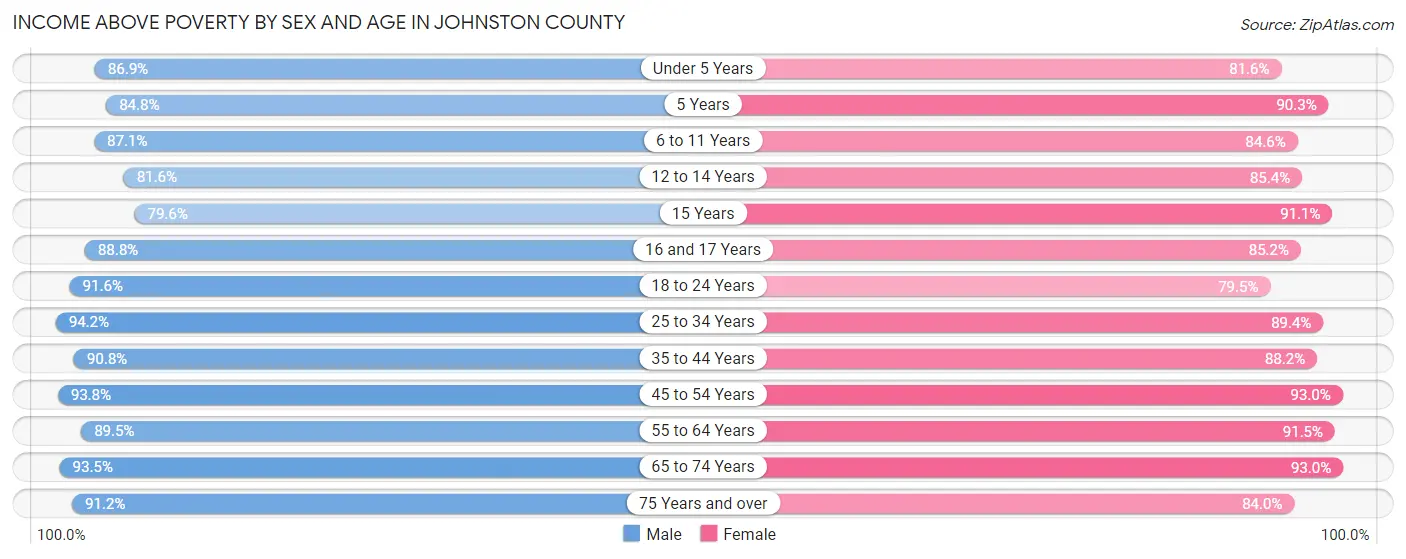
| Age Bracket | Male | Female |
| Under 5 Years | 5,765 (86.9%) | 5,224 (81.6%) |
| 5 Years | 1,377 (84.8%) | 1,055 (90.3%) |
| 6 to 11 Years | 7,595 (87.1%) | 6,736 (84.6%) |
| 12 to 14 Years | 4,276 (81.6%) | 4,986 (85.4%) |
| 15 Years | 1,595 (79.6%) | 1,608 (91.0%) |
| 16 and 17 Years | 2,742 (88.8%) | 2,646 (85.2%) |
| 18 to 24 Years | 8,578 (91.6%) | 6,856 (79.5%) |
| 25 to 34 Years | 12,549 (94.2%) | 12,276 (89.3%) |
| 35 to 44 Years | 13,432 (90.8%) | 13,414 (88.2%) |
| 45 to 54 Years | 14,789 (93.8%) | 14,878 (93.0%) |
| 55 to 64 Years | 11,977 (89.5%) | 12,508 (91.5%) |
| 65 to 74 Years | 7,930 (93.5%) | 9,403 (93.0%) |
| 75 Years and over | 3,950 (91.2%) | 5,248 (84.0%) |
| Total | 96,555 (90.5%) | 96,838 (88.2%) |
Income Below Poverty Among Married-Couple Families in Johnston County
The poverty statistics for married-couple families in Johnston County show that 4.3% or 1,932 of the total 45,383 families live below the poverty line. Families with 5 or more children have the highest poverty rate of 18.4%, comprising of 69 families. On the other hand, families with no children have the lowest poverty rate of 2.2%, which includes 524 families.
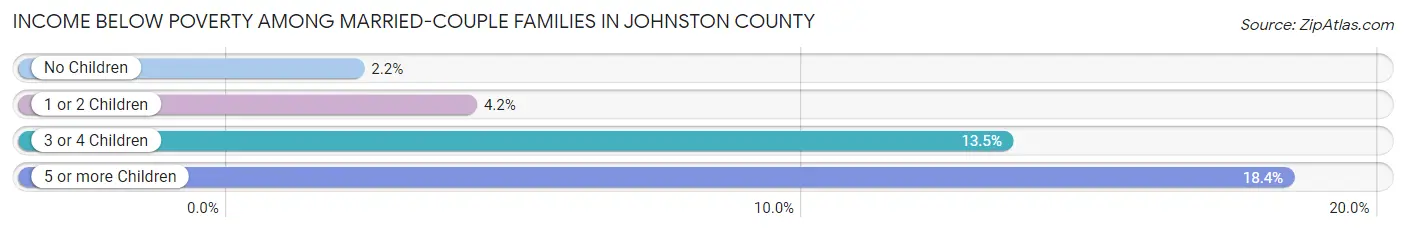
| Children | Above Poverty | Below Poverty |
| No Children | 23,276 (97.8%) | 524 (2.2%) |
| 1 or 2 Children | 15,634 (95.8%) | 678 (4.2%) |
| 3 or 4 Children | 4,235 (86.5%) | 661 (13.5%) |
| 5 or more Children | 306 (81.6%) | 69 (18.4%) |
| Total | 43,451 (95.7%) | 1,932 (4.3%) |
Income Below Poverty Among Single-Parent Households in Johnston County
According to the poverty data in Johnston County, 10.0% or 383 single-father households and 22.7% or 1,974 single-mother households are living below the poverty line. Among single-father households, those with 1 or 2 children have the highest poverty rate, with 250 households (13.8%) experiencing poverty. Likewise, among single-mother households, those with 5 or more children have the highest poverty rate, with 46 households (74.2%) falling below the poverty line.
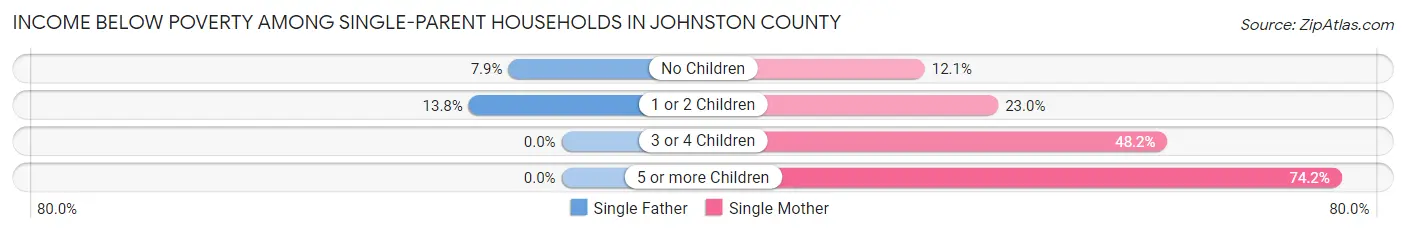
| Children | Single Father | Single Mother |
| No Children | 133 (7.9%) | 360 (12.1%) |
| 1 or 2 Children | 250 (13.8%) | 1,053 (23.0%) |
| 3 or 4 Children | 0 (0.0%) | 515 (48.2%) |
| 5 or more Children | 0 (0.0%) | 46 (74.2%) |
| Total | 383 (10.0%) | 1,974 (22.7%) |
Income Below Poverty Among Married-Couple vs Single-Parent Households in Johnston County
The poverty data for Johnston County shows that 1,932 of the married-couple family households (4.3%) and 2,357 of the single-parent households (18.8%) are living below the poverty level. Within the married-couple family households, those with 5 or more children have the highest poverty rate, with 69 households (18.4%) falling below the poverty line. Among the single-parent households, those with 3 or 4 children have the highest poverty rate, with 515 household (38.1%) living below poverty.
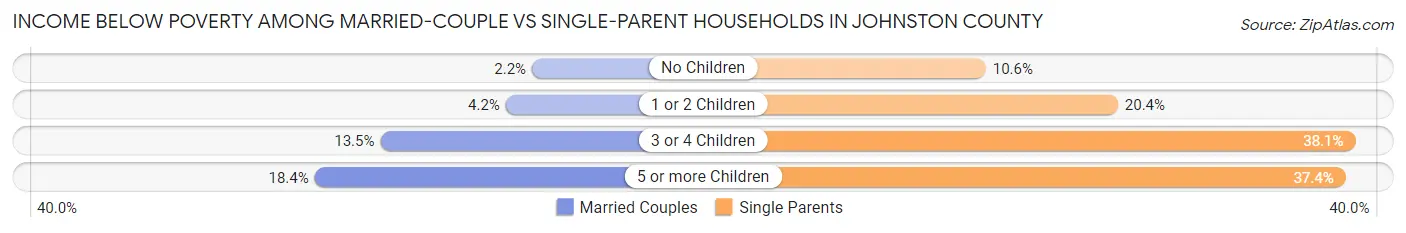
| Children | Married-Couple Families | Single-Parent Households |
| No Children | 524 (2.2%) | 493 (10.6%) |
| 1 or 2 Children | 678 (4.2%) | 1,303 (20.4%) |
| 3 or 4 Children | 661 (13.5%) | 515 (38.1%) |
| 5 or more Children | 69 (18.4%) | 46 (37.4%) |
| Total | 1,932 (4.3%) | 2,357 (18.8%) |
Employment Characteristics in Johnston County
Employment by Class of Employer in Johnston County
Among the 106,454 employed individuals in Johnston County, private company employees (72,739 | 68.3%), local government employees (7,858 | 7.4%), and state government employees (7,608 | 7.1%) make up the most common classes of employment.
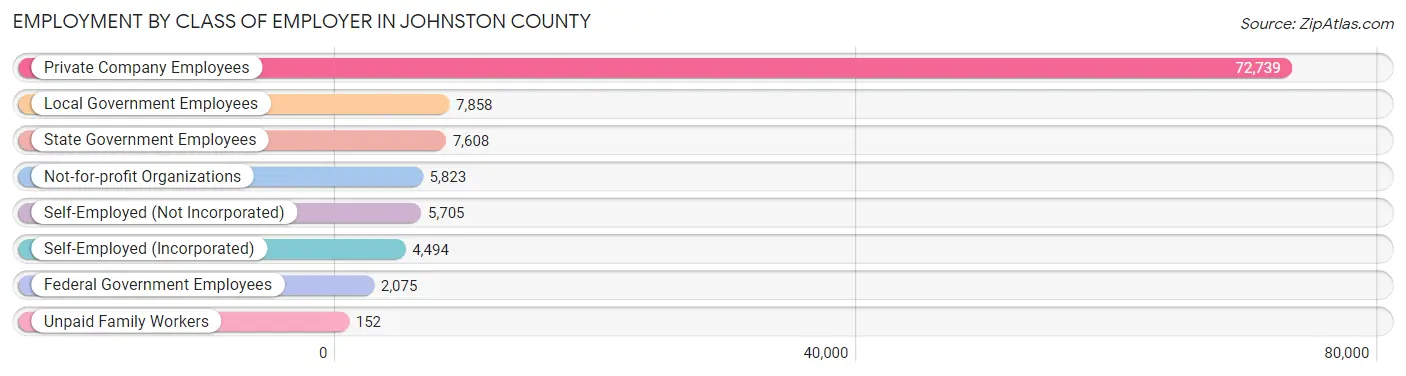
| Employer Class | # Employees | % Employees |
| Private Company Employees | 72,739 | 68.3% |
| Self-Employed (Incorporated) | 4,494 | 4.2% |
| Self-Employed (Not Incorporated) | 5,705 | 5.4% |
| Not-for-profit Organizations | 5,823 | 5.5% |
| Local Government Employees | 7,858 | 7.4% |
| State Government Employees | 7,608 | 7.1% |
| Federal Government Employees | 2,075 | 1.9% |
| Unpaid Family Workers | 152 | 0.1% |
| Total | 106,454 | 100.0% |
Employment Status by Age in Johnston County
According to the labor force statistics for Johnston County, out of the total population over 16 years of age (170,673), 66.0% or 112,644 individuals are in the labor force, with 3.7% or 4,168 of them unemployed. The age group with the highest labor force participation rate is 30 to 34 years, with 85.6% or 12,222 individuals in the labor force. Within the labor force, the 16 to 19 years age range has the highest percentage of unemployed individuals, with 14.7% or 742 of them being unemployed.
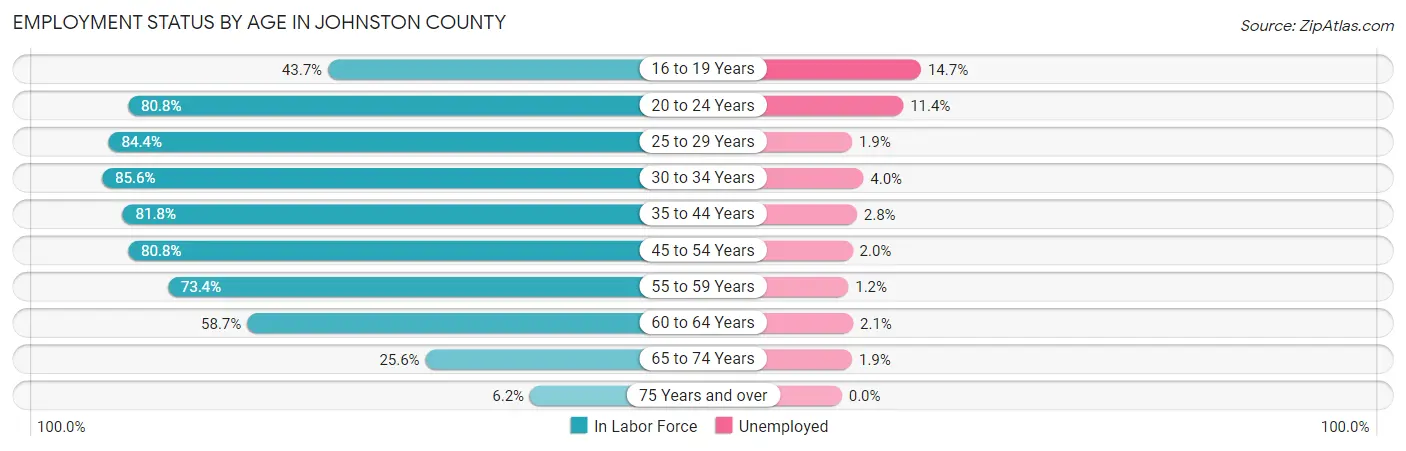
| Age Bracket | In Labor Force | Unemployed |
| 16 to 19 Years | 5,046 (43.7%) | 742 (14.7%) |
| 20 to 24 Years | 10,276 (80.8%) | 1,171 (11.4%) |
| 25 to 29 Years | 10,938 (84.4%) | 208 (1.9%) |
| 30 to 34 Years | 12,222 (85.6%) | 489 (4.0%) |
| 35 to 44 Years | 24,727 (81.8%) | 692 (2.8%) |
| 45 to 54 Years | 25,865 (80.8%) | 517 (2.0%) |
| 55 to 59 Years | 10,327 (73.4%) | 124 (1.2%) |
| 60 to 64 Years | 7,709 (58.7%) | 162 (2.1%) |
| 65 to 74 Years | 4,808 (25.6%) | 91 (1.9%) |
| 75 Years and over | 679 (6.2%) | 0 (0.0%) |
| Total | 112,644 (66.0%) | 4,168 (3.7%) |
Employment Status by Educational Attainment in Johnston County
According to labor force statistics for Johnston County, 78.7% of individuals (91,827) out of the total population between 25 and 64 years of age (116,680) are in the labor force, with 2.4% or 2,204 of them being unemployed. The group with the highest labor force participation rate are those with the educational attainment of bachelor's degree or higher, with 85.0% or 27,902 individuals in the labor force. Within the labor force, individuals with less than high school education have the highest percentage of unemployment, with 6.0% or 440 of them being unemployed.
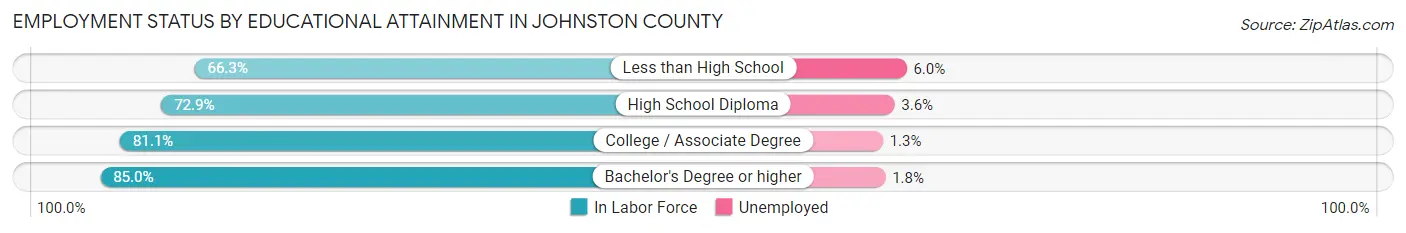
| Educational Attainment | In Labor Force | Unemployed |
| Less than High School | 7,339 (66.3%) | 664 (6.0%) |
| High School Diploma | 21,847 (72.9%) | 1,079 (3.6%) |
| College / Associate Degree | 34,724 (81.1%) | 557 (1.3%) |
| Bachelor's Degree or higher | 27,902 (85.0%) | 591 (1.8%) |
| Total | 91,827 (78.7%) | 2,800 (2.4%) |
Employment Occupations by Sex in Johnston County
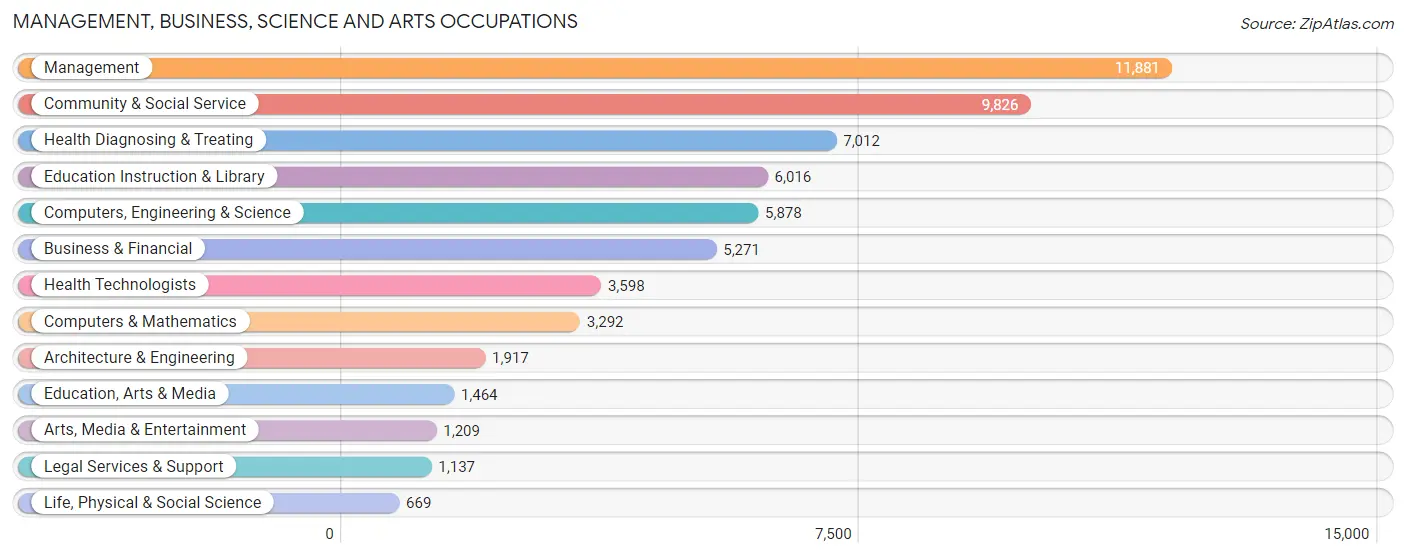
Management, Business, Science and Arts Occupations
The most common Management, Business, Science and Arts occupations in Johnston County are Management (11,881 | 11.0%), Community & Social Service (9,826 | 9.1%), Health Diagnosing & Treating (7,012 | 6.5%), Education Instruction & Library (6,016 | 5.6%), and Computers, Engineering & Science (5,878 | 5.4%).
Management, Business, Science and Arts Occupations by Sex
Within the Management, Business, Science and Arts occupations in Johnston County, the most male-oriented occupations are Architecture & Engineering (79.5%), Computers & Mathematics (74.2%), and Computers, Engineering & Science (73.4%), while the most female-oriented occupations are Health Technologists (81.5%), Education Instruction & Library (79.2%), and Health Diagnosing & Treating (78.9%).
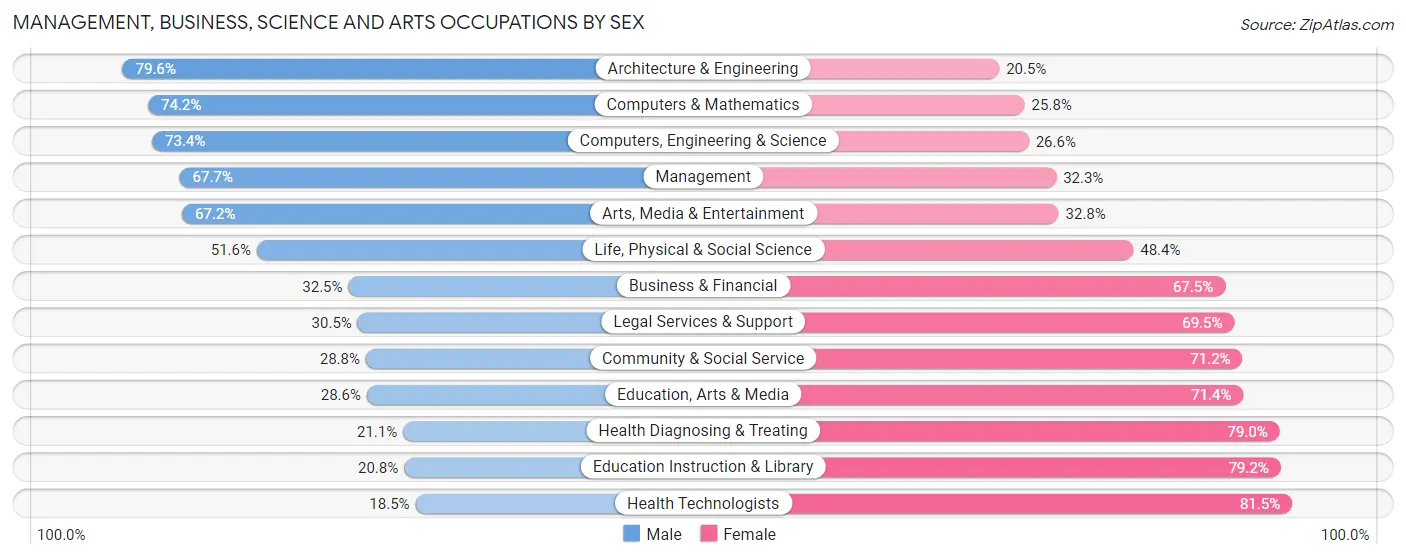
| Occupation | Male | Female |
| Management | 8,039 (67.7%) | 3,842 (32.3%) |
| Business & Financial | 1,711 (32.5%) | 3,560 (67.5%) |
| Computers, Engineering & Science | 4,314 (73.4%) | 1,564 (26.6%) |
| Computers & Mathematics | 2,444 (74.2%) | 848 (25.8%) |
| Architecture & Engineering | 1,525 (79.5%) | 392 (20.4%) |
| Life, Physical & Social Science | 345 (51.6%) | 324 (48.4%) |
| Community & Social Service | 2,832 (28.8%) | 6,994 (71.2%) |
| Education, Arts & Media | 419 (28.6%) | 1,045 (71.4%) |
| Legal Services & Support | 347 (30.5%) | 790 (69.5%) |
| Education Instruction & Library | 1,254 (20.8%) | 4,762 (79.2%) |
| Arts, Media & Entertainment | 812 (67.2%) | 397 (32.8%) |
| Health Diagnosing & Treating | 1,476 (21.0%) | 5,536 (78.9%) |
| Health Technologists | 665 (18.5%) | 2,933 (81.5%) |
| Total (Category) | 18,372 (46.1%) | 21,496 (53.9%) |
| Total (Overall) | 57,731 (53.4%) | 50,447 (46.6%) |
Services Occupations
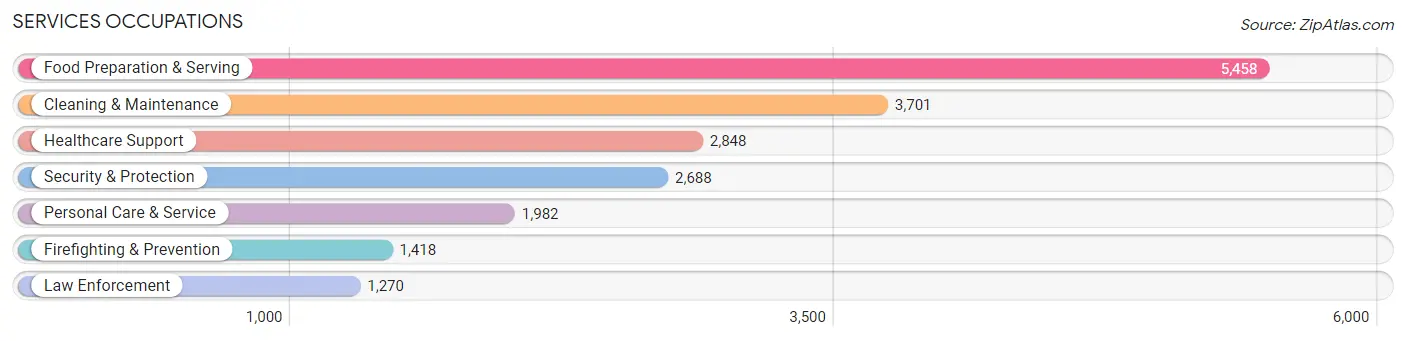
The most common Services occupations in Johnston County are Food Preparation & Serving (5,458 | 5.1%), Cleaning & Maintenance (3,701 | 3.4%), Healthcare Support (2,848 | 2.6%), Security & Protection (2,688 | 2.5%), and Personal Care & Service (1,982 | 1.8%).
Services Occupations by Sex
Within the Services occupations in Johnston County, the most male-oriented occupations are Law Enforcement (91.3%), Security & Protection (81.9%), and Firefighting & Prevention (73.5%), while the most female-oriented occupations are Healthcare Support (78.2%), Personal Care & Service (75.4%), and Food Preparation & Serving (68.3%).
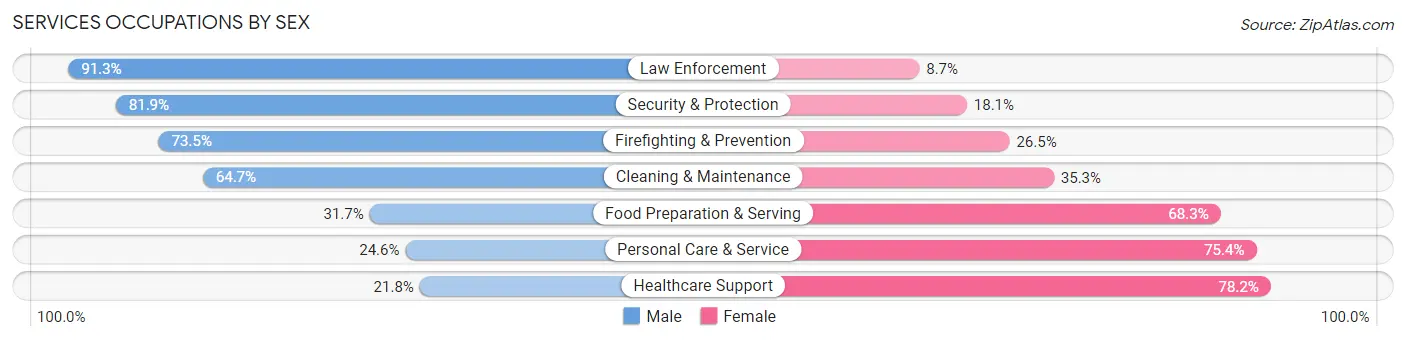
| Occupation | Male | Female |
| Healthcare Support | 620 (21.8%) | 2,228 (78.2%) |
| Security & Protection | 2,202 (81.9%) | 486 (18.1%) |
| Firefighting & Prevention | 1,042 (73.5%) | 376 (26.5%) |
| Law Enforcement | 1,160 (91.3%) | 110 (8.7%) |
| Food Preparation & Serving | 1,730 (31.7%) | 3,728 (68.3%) |
| Cleaning & Maintenance | 2,394 (64.7%) | 1,307 (35.3%) |
| Personal Care & Service | 488 (24.6%) | 1,494 (75.4%) |
| Total (Category) | 7,434 (44.6%) | 9,243 (55.4%) |
| Total (Overall) | 57,731 (53.4%) | 50,447 (46.6%) |
Sales and Office Occupations
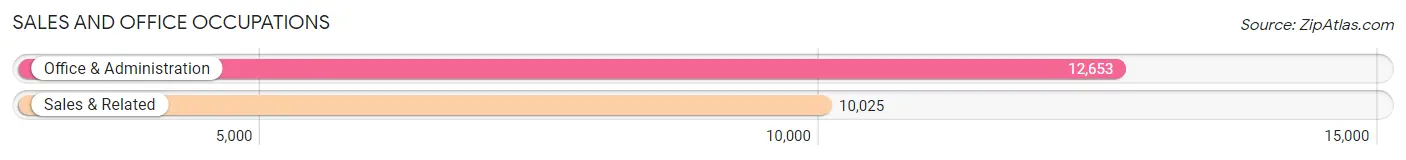
The most common Sales and Office occupations in Johnston County are Office & Administration (12,653 | 11.7%), and Sales & Related (10,025 | 9.3%).
Sales and Office Occupations by Sex

| Occupation | Male | Female |
| Sales & Related | 5,048 (50.3%) | 4,977 (49.6%) |
| Office & Administration | 2,038 (16.1%) | 10,615 (83.9%) |
| Total (Category) | 7,086 (31.2%) | 15,592 (68.8%) |
| Total (Overall) | 57,731 (53.4%) | 50,447 (46.6%) |
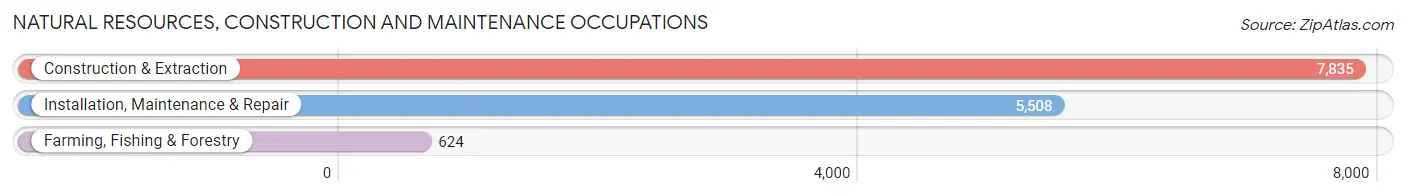
Natural Resources, Construction and Maintenance Occupations
The most common Natural Resources, Construction and Maintenance occupations in Johnston County are Construction & Extraction (7,835 | 7.2%), Installation, Maintenance & Repair (5,508 | 5.1%), and Farming, Fishing & Forestry (624 | 0.6%).
Natural Resources, Construction and Maintenance Occupations by Sex
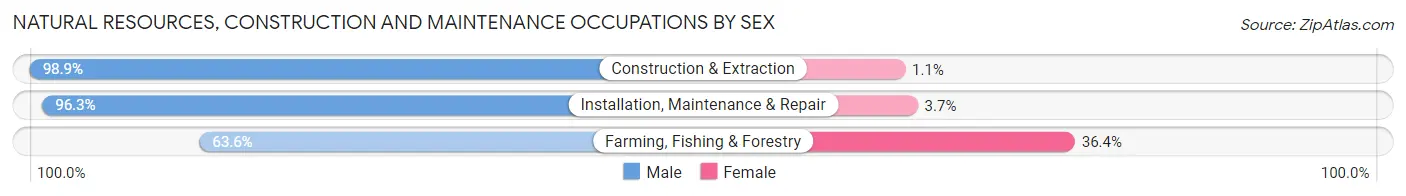
| Occupation | Male | Female |
| Farming, Fishing & Forestry | 397 (63.6%) | 227 (36.4%) |
| Construction & Extraction | 7,751 (98.9%) | 84 (1.1%) |
| Installation, Maintenance & Repair | 5,305 (96.3%) | 203 (3.7%) |
| Total (Category) | 13,453 (96.3%) | 514 (3.7%) |
| Total (Overall) | 57,731 (53.4%) | 50,447 (46.6%) |
Production, Transportation and Moving Occupations
The most common Production, Transportation and Moving occupations in Johnston County are Production (6,219 | 5.8%), Material Moving (5,158 | 4.8%), and Transportation (3,611 | 3.3%).

Production, Transportation and Moving Occupations by Sex
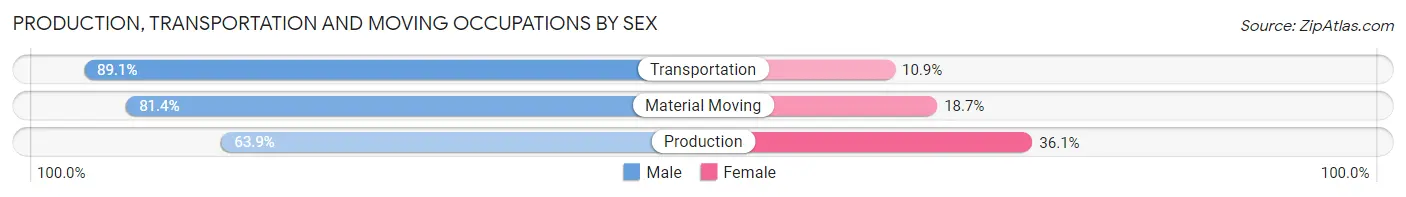
| Occupation | Male | Female |
| Production | 3,973 (63.9%) | 2,246 (36.1%) |
| Transportation | 3,217 (89.1%) | 394 (10.9%) |
| Material Moving | 4,196 (81.4%) | 962 (18.6%) |
| Total (Category) | 11,386 (76.0%) | 3,602 (24.0%) |
| Total (Overall) | 57,731 (53.4%) | 50,447 (46.6%) |
Employment Industries by Sex in Johnston County
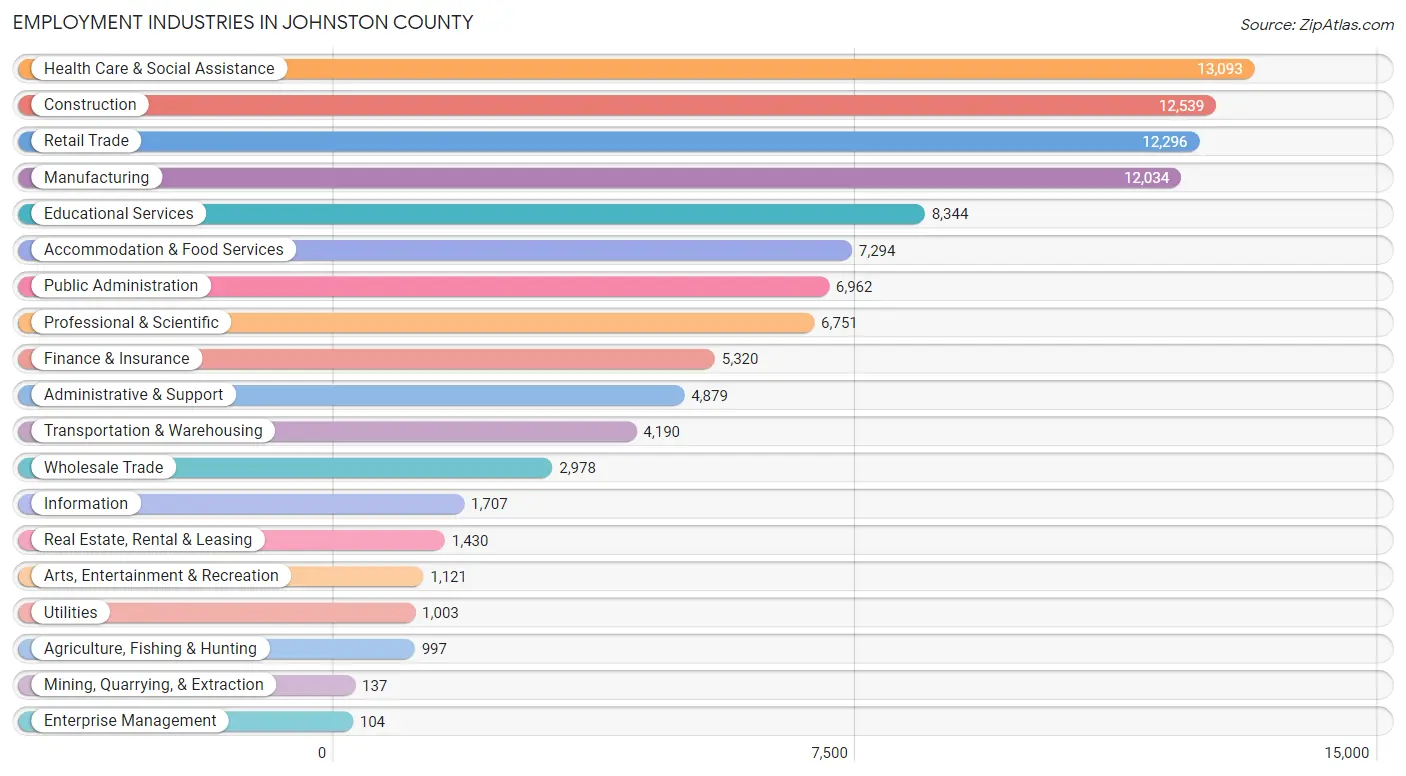
Employment Industries in Johnston County
The major employment industries in Johnston County include Health Care & Social Assistance (13,093 | 12.1%), Construction (12,539 | 11.6%), Retail Trade (12,296 | 11.4%), Manufacturing (12,034 | 11.1%), and Educational Services (8,344 | 7.7%).
Employment Industries by Sex in Johnston County
The Johnston County industries that see more men than women are Construction (93.9%), Utilities (91.2%), and Wholesale Trade (72.3%), whereas the industries that tend to have a higher number of women are Health Care & Social Assistance (78.8%), Educational Services (70.1%), and Real Estate, Rental & Leasing (65.9%).
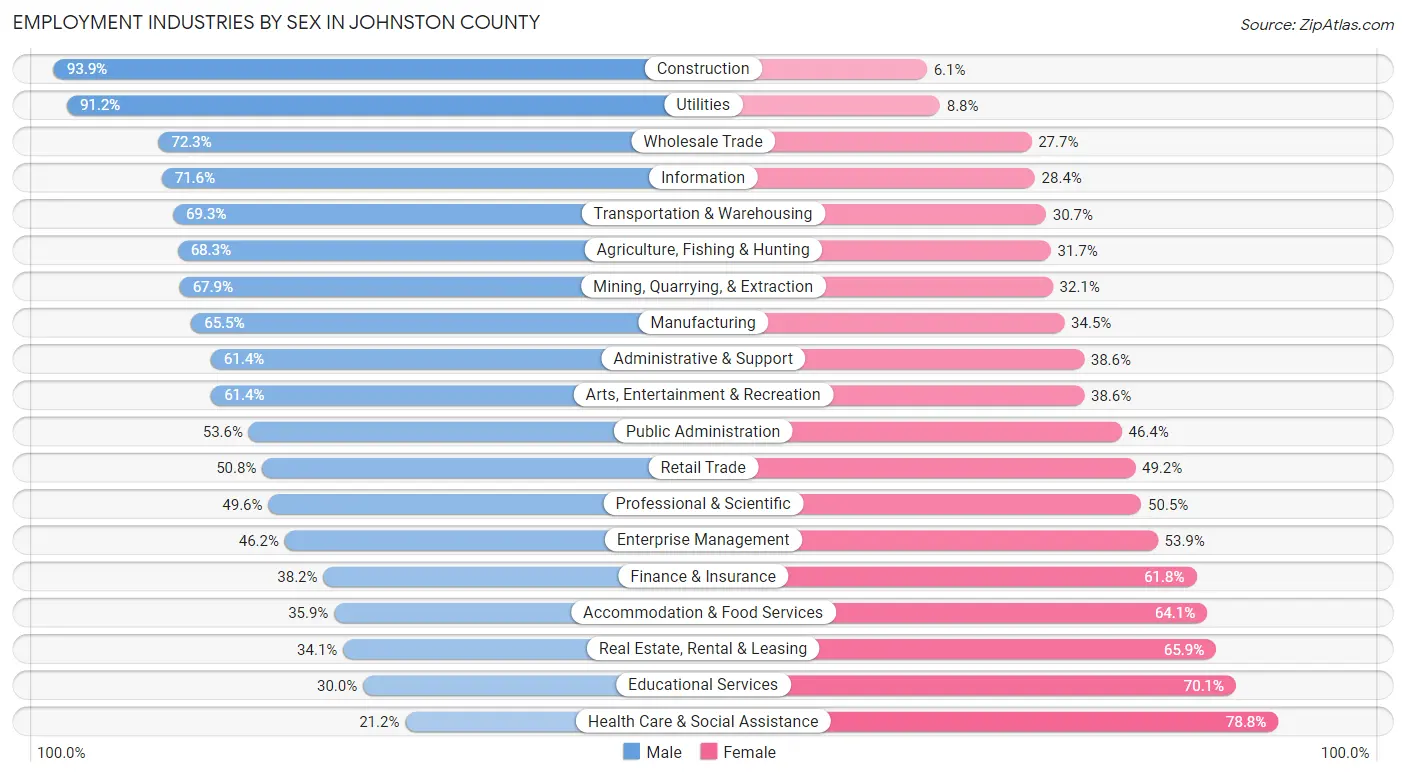
| Industry | Male | Female |
| Agriculture, Fishing & Hunting | 681 (68.3%) | 316 (31.7%) |
| Mining, Quarrying, & Extraction | 93 (67.9%) | 44 (32.1%) |
| Construction | 11,778 (93.9%) | 761 (6.1%) |
| Manufacturing | 7,881 (65.5%) | 4,153 (34.5%) |
| Wholesale Trade | 2,153 (72.3%) | 825 (27.7%) |
| Retail Trade | 6,247 (50.8%) | 6,049 (49.2%) |
| Transportation & Warehousing | 2,903 (69.3%) | 1,287 (30.7%) |
| Utilities | 915 (91.2%) | 88 (8.8%) |
| Information | 1,222 (71.6%) | 485 (28.4%) |
| Finance & Insurance | 2,030 (38.2%) | 3,290 (61.8%) |
| Real Estate, Rental & Leasing | 487 (34.1%) | 943 (65.9%) |
| Professional & Scientific | 3,345 (49.5%) | 3,406 (50.4%) |
| Enterprise Management | 48 (46.2%) | 56 (53.8%) |
| Administrative & Support | 2,997 (61.4%) | 1,882 (38.6%) |
| Educational Services | 2,499 (29.9%) | 5,845 (70.1%) |
| Health Care & Social Assistance | 2,777 (21.2%) | 10,316 (78.8%) |
| Arts, Entertainment & Recreation | 688 (61.4%) | 433 (38.6%) |
| Accommodation & Food Services | 2,620 (35.9%) | 4,674 (64.1%) |
| Public Administration | 3,731 (53.6%) | 3,231 (46.4%) |
| Total | 57,731 (53.4%) | 50,447 (46.6%) |
Education in Johnston County
School Enrollment in Johnston County
The most common levels of schooling among the 55,039 students in Johnston County are middle school (13,861 | 25.2%), high school (12,871 | 23.4%), and college / undergraduate (10,884 | 19.8%).
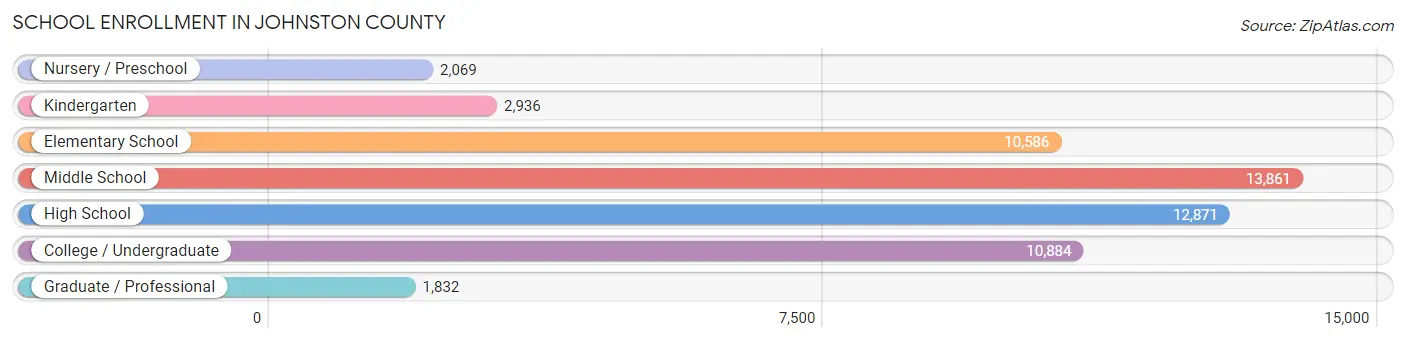
| School Level | # Students | % Students |
| Nursery / Preschool | 2,069 | 3.8% |
| Kindergarten | 2,936 | 5.3% |
| Elementary School | 10,586 | 19.2% |
| Middle School | 13,861 | 25.2% |
| High School | 12,871 | 23.4% |
| College / Undergraduate | 10,884 | 19.8% |
| Graduate / Professional | 1,832 | 3.3% |
| Total | 55,039 | 100.0% |
School Enrollment by Age by Funding Source in Johnston County
Out of a total of 55,039 students who are enrolled in schools in Johnston County, 6,990 (12.7%) attend a private institution, while the remaining 48,049 (87.3%) are enrolled in public schools. The age group of 3 to 4 year olds has the highest likelihood of being enrolled in private schools, with 840 (59.9% in the age bracket) enrolled. Conversely, the age group of 18 to 19 year olds has the lowest likelihood of being enrolled in a private school, with 3,460 (92.9% in the age bracket) attending a public institution.
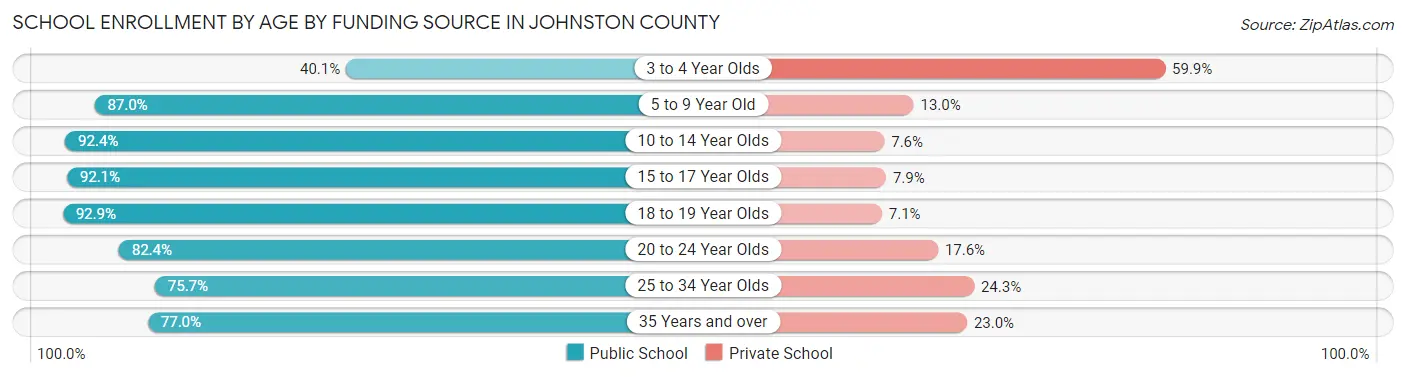
| Age Bracket | Public School | Private School |
| 3 to 4 Year Olds | 563 (40.1%) | 840 (59.9%) |
| 5 to 9 Year Old | 10,972 (87.0%) | 1,642 (13.0%) |
| 10 to 14 Year Olds | 15,764 (92.4%) | 1,290 (7.6%) |
| 15 to 17 Year Olds | 8,853 (92.1%) | 757 (7.9%) |
| 18 to 19 Year Olds | 3,460 (92.9%) | 265 (7.1%) |
| 20 to 24 Year Olds | 3,952 (82.4%) | 842 (17.6%) |
| 25 to 34 Year Olds | 2,156 (75.7%) | 691 (24.3%) |
| 35 Years and over | 2,305 (77.0%) | 687 (23.0%) |
| Total | 48,049 (87.3%) | 6,990 (12.7%) |
Educational Attainment by Field of Study in Johnston County
Business (8,961 | 21.7%), education (5,204 | 12.6%), arts & humanities (4,630 | 11.2%), science & technology (4,597 | 11.2%), and social sciences (2,940 | 7.1%) are the most common fields of study among 41,192 individuals in Johnston County who have obtained a bachelor's degree or higher.
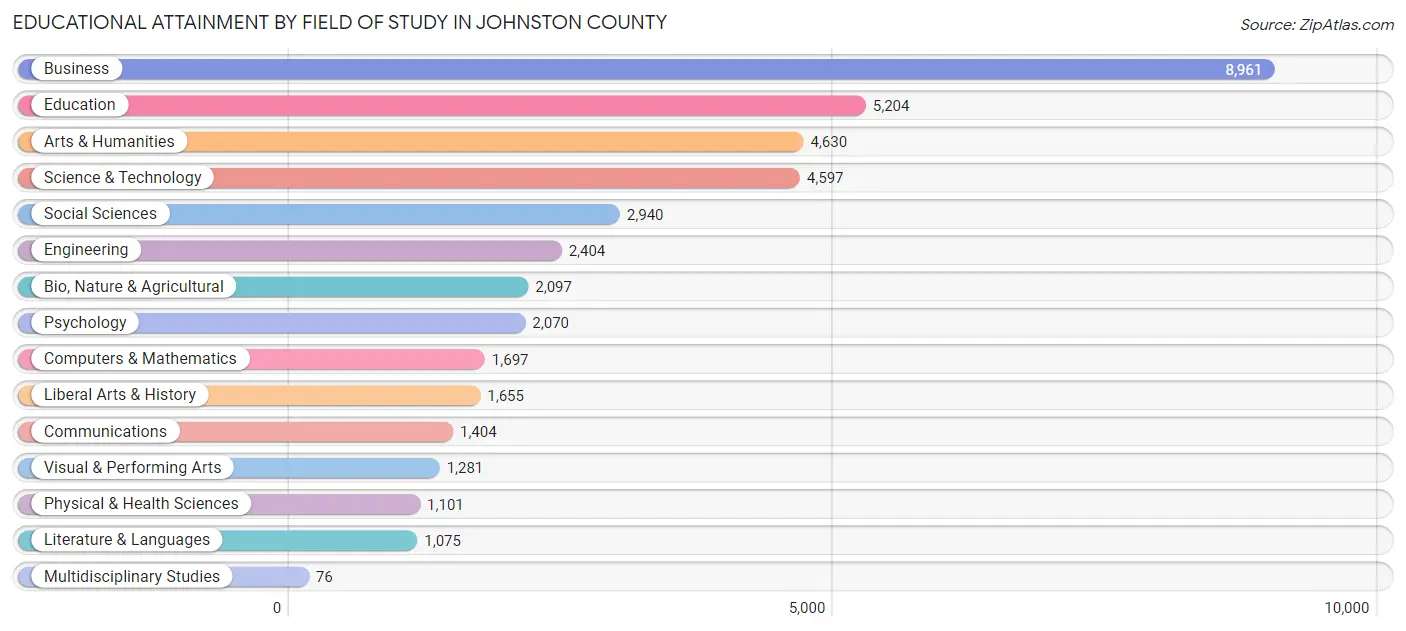
| Field of Study | # Graduates | % Graduates |
| Computers & Mathematics | 1,697 | 4.1% |
| Bio, Nature & Agricultural | 2,097 | 5.1% |
| Physical & Health Sciences | 1,101 | 2.7% |
| Psychology | 2,070 | 5.0% |
| Social Sciences | 2,940 | 7.1% |
| Engineering | 2,404 | 5.8% |
| Multidisciplinary Studies | 76 | 0.2% |
| Science & Technology | 4,597 | 11.2% |
| Business | 8,961 | 21.7% |
| Education | 5,204 | 12.6% |
| Literature & Languages | 1,075 | 2.6% |
| Liberal Arts & History | 1,655 | 4.0% |
| Visual & Performing Arts | 1,281 | 3.1% |
| Communications | 1,404 | 3.4% |
| Arts & Humanities | 4,630 | 11.2% |
| Total | 41,192 | 100.0% |
Transportation & Commute in Johnston County
Vehicle Availability by Sex in Johnston County
The most prevalent vehicle ownership categories in Johnston County are males with 2 vehicles (22,647, accounting for 39.5%) and females with 2 vehicles (18,689, making up 46.2%).
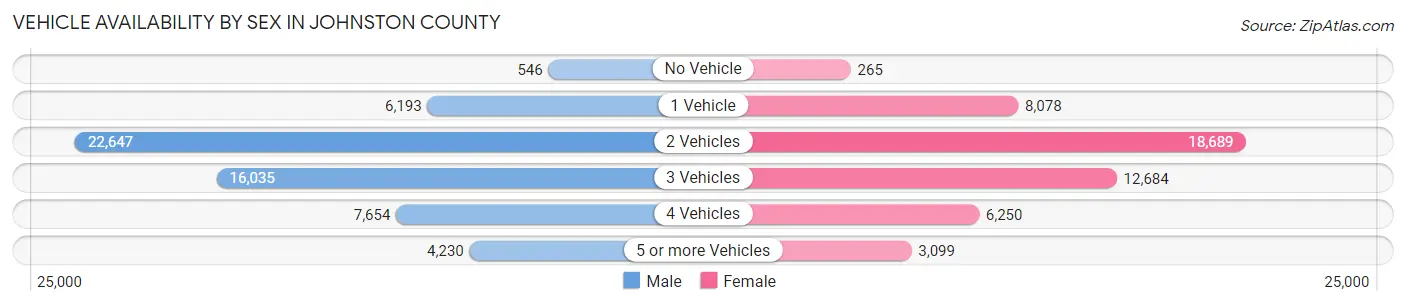
| Vehicles Available | Male | Female |
| No Vehicle | 546 (0.9%) | 265 (0.5%) |
| 1 Vehicle | 6,193 (10.8%) | 8,078 (16.5%) |
| 2 Vehicles | 22,647 (39.5%) | 18,689 (38.1%) |
| 3 Vehicles | 16,035 (28.0%) | 12,684 (25.9%) |
| 4 Vehicles | 7,654 (13.4%) | 6,250 (12.7%) |
| 5 or more Vehicles | 4,230 (7.4%) | 3,099 (6.3%) |
| Total | 57,305 (100.0%) | 49,065 (100.0%) |
Commute Time in Johnston County
The most frequently occuring commute durations in Johnston County are 45 to 59 minutes (15,171 commuters, 16.0%), 30 to 34 minutes (13,926 commuters, 14.7%), and 20 to 24 minutes (10,690 commuters, 11.3%).
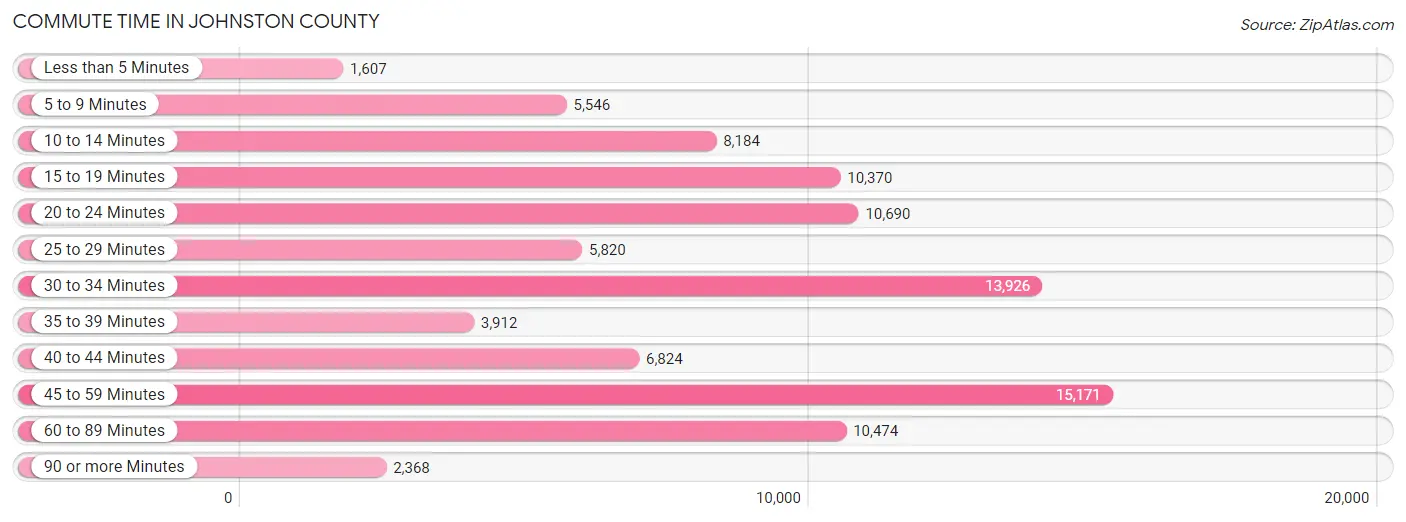
| Commute Time | # Commuters | % Commuters |
| Less than 5 Minutes | 1,607 | 1.7% |
| 5 to 9 Minutes | 5,546 | 5.8% |
| 10 to 14 Minutes | 8,184 | 8.6% |
| 15 to 19 Minutes | 10,370 | 10.9% |
| 20 to 24 Minutes | 10,690 | 11.3% |
| 25 to 29 Minutes | 5,820 | 6.1% |
| 30 to 34 Minutes | 13,926 | 14.7% |
| 35 to 39 Minutes | 3,912 | 4.1% |
| 40 to 44 Minutes | 6,824 | 7.2% |
| 45 to 59 Minutes | 15,171 | 16.0% |
| 60 to 89 Minutes | 10,474 | 11.0% |
| 90 or more Minutes | 2,368 | 2.5% |
Commute Time by Sex in Johnston County
The most common commute times in Johnston County are 45 to 59 minutes (9,004 commuters, 17.2%) for males and 45 to 59 minutes (6,167 commuters, 14.5%) for females.
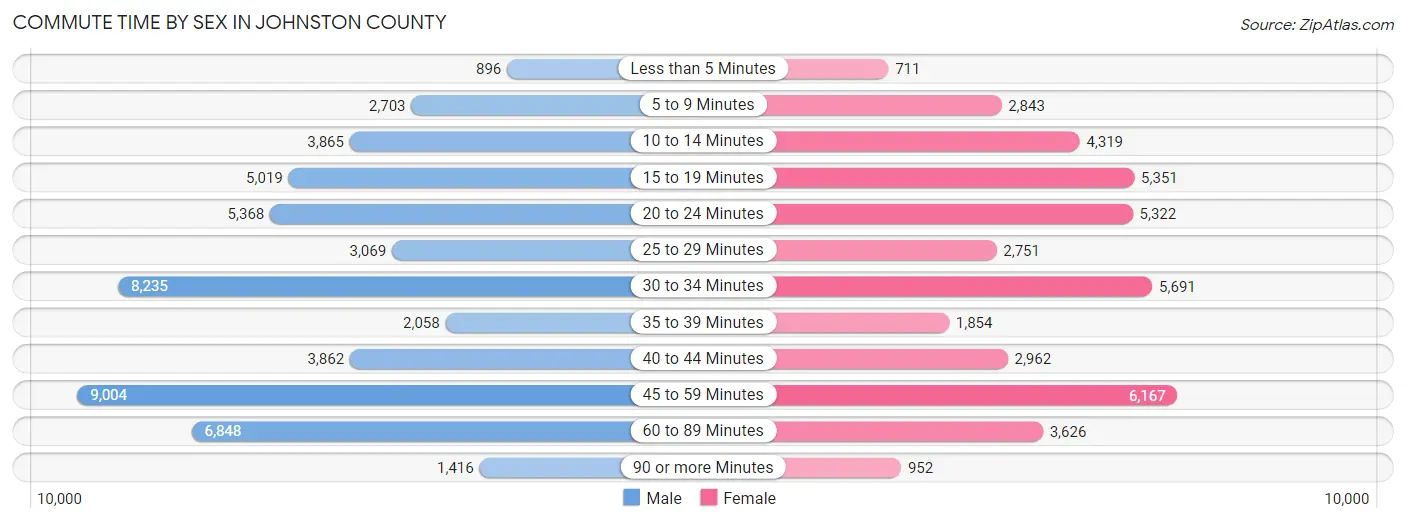
| Commute Time | Male | Female |
| Less than 5 Minutes | 896 (1.7%) | 711 (1.7%) |
| 5 to 9 Minutes | 2,703 (5.2%) | 2,843 (6.7%) |
| 10 to 14 Minutes | 3,865 (7.4%) | 4,319 (10.2%) |
| 15 to 19 Minutes | 5,019 (9.6%) | 5,351 (12.6%) |
| 20 to 24 Minutes | 5,368 (10.3%) | 5,322 (12.5%) |
| 25 to 29 Minutes | 3,069 (5.9%) | 2,751 (6.5%) |
| 30 to 34 Minutes | 8,235 (15.7%) | 5,691 (13.4%) |
| 35 to 39 Minutes | 2,058 (3.9%) | 1,854 (4.4%) |
| 40 to 44 Minutes | 3,862 (7.4%) | 2,962 (7.0%) |
| 45 to 59 Minutes | 9,004 (17.2%) | 6,167 (14.5%) |
| 60 to 89 Minutes | 6,848 (13.1%) | 3,626 (8.5%) |
| 90 or more Minutes | 1,416 (2.7%) | 952 (2.2%) |
Time of Departure to Work by Sex in Johnston County
The most frequent times of departure to work in Johnston County are 6:00 AM to 6:29 AM (8,584, 16.4%) for males and 7:00 AM to 7:29 AM (6,775, 15.9%) for females.
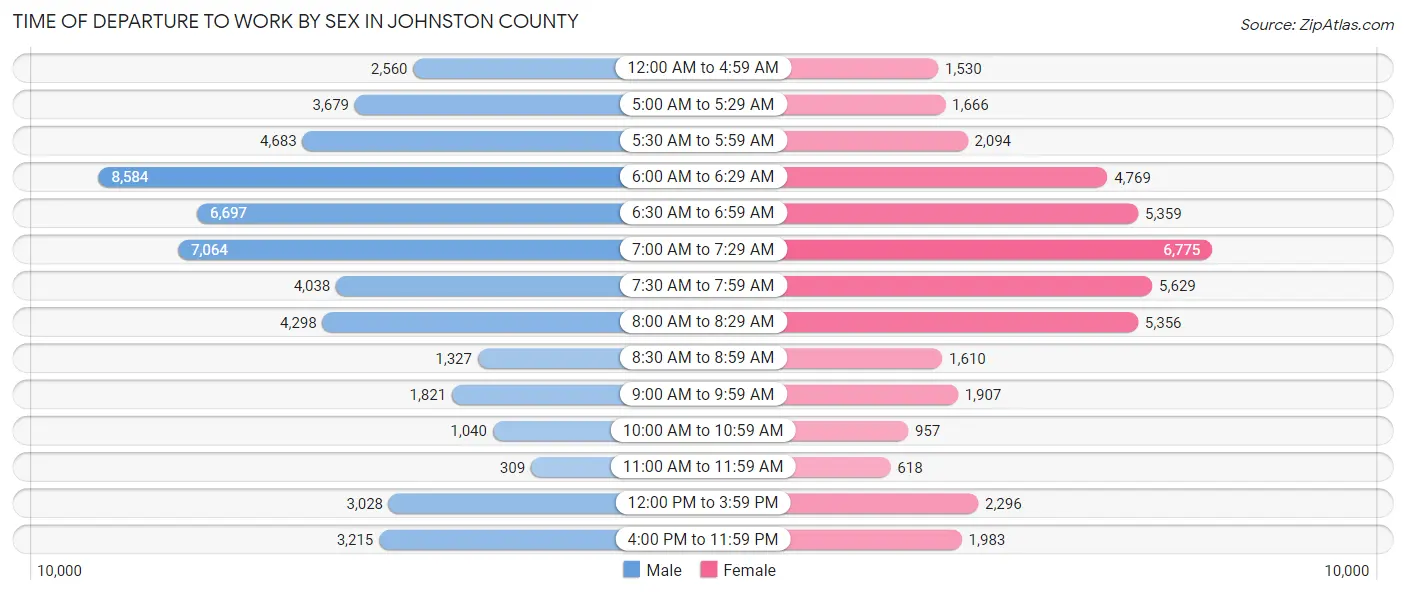
| Time of Departure | Male | Female |
| 12:00 AM to 4:59 AM | 2,560 (4.9%) | 1,530 (3.6%) |
| 5:00 AM to 5:29 AM | 3,679 (7.0%) | 1,666 (3.9%) |
| 5:30 AM to 5:59 AM | 4,683 (8.9%) | 2,094 (4.9%) |
| 6:00 AM to 6:29 AM | 8,584 (16.4%) | 4,769 (11.2%) |
| 6:30 AM to 6:59 AM | 6,697 (12.8%) | 5,359 (12.6%) |
| 7:00 AM to 7:29 AM | 7,064 (13.5%) | 6,775 (15.9%) |
| 7:30 AM to 7:59 AM | 4,038 (7.7%) | 5,629 (13.2%) |
| 8:00 AM to 8:29 AM | 4,298 (8.2%) | 5,356 (12.6%) |
| 8:30 AM to 8:59 AM | 1,327 (2.5%) | 1,610 (3.8%) |
| 9:00 AM to 9:59 AM | 1,821 (3.5%) | 1,907 (4.5%) |
| 10:00 AM to 10:59 AM | 1,040 (2.0%) | 957 (2.2%) |
| 11:00 AM to 11:59 AM | 309 (0.6%) | 618 (1.5%) |
| 12:00 PM to 3:59 PM | 3,028 (5.8%) | 2,296 (5.4%) |
| 4:00 PM to 11:59 PM | 3,215 (6.1%) | 1,983 (4.7%) |
| Total | 52,343 (100.0%) | 42,549 (100.0%) |
Housing Occupancy in Johnston County
Occupancy by Ownership in Johnston County
Of the total 79,387 dwellings in Johnston County, owner-occupied units account for 60,831 (76.6%), while renter-occupied units make up 18,556 (23.4%).
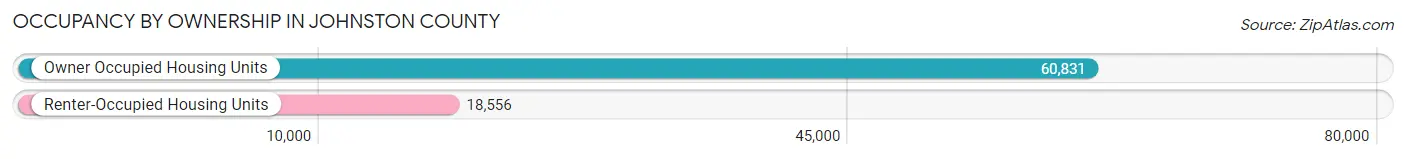
| Occupancy | # Housing Units | % Housing Units |
| Owner Occupied Housing Units | 60,831 | 76.6% |
| Renter-Occupied Housing Units | 18,556 | 23.4% |
| Total Occupied Housing Units | 79,387 | 100.0% |
Occupancy by Household Size in Johnston County
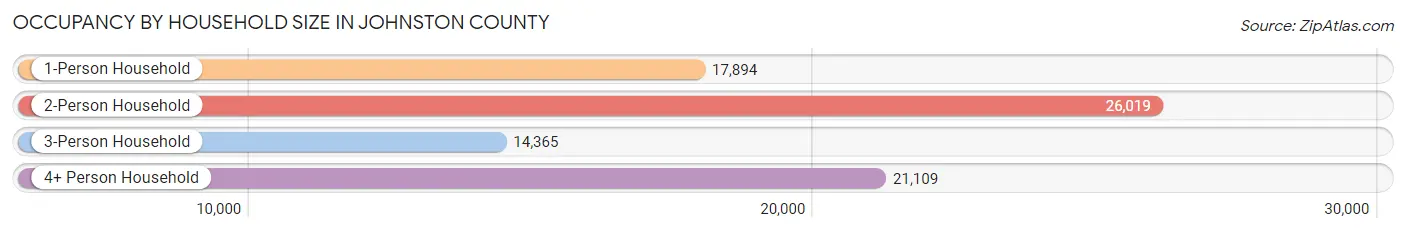
| Household Size | # Housing Units | % Housing Units |
| 1-Person Household | 17,894 | 22.5% |
| 2-Person Household | 26,019 | 32.8% |
| 3-Person Household | 14,365 | 18.1% |
| 4+ Person Household | 21,109 | 26.6% |
| Total Housing Units | 79,387 | 100.0% |
Occupancy by Ownership by Household Size in Johnston County
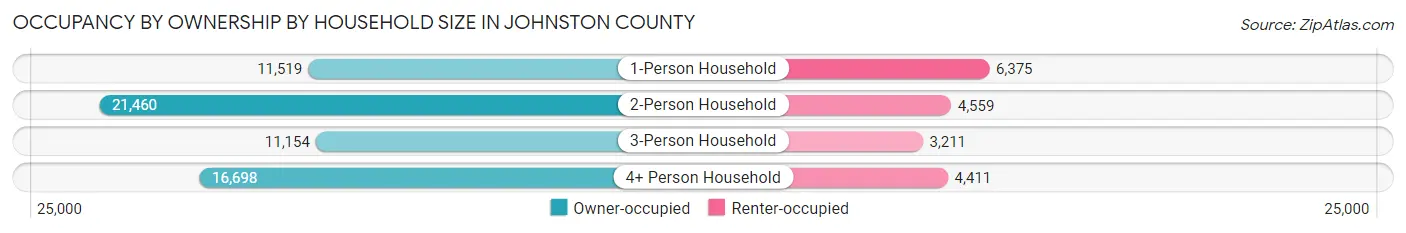
| Household Size | Owner-occupied | Renter-occupied |
| 1-Person Household | 11,519 (64.4%) | 6,375 (35.6%) |
| 2-Person Household | 21,460 (82.5%) | 4,559 (17.5%) |
| 3-Person Household | 11,154 (77.6%) | 3,211 (22.4%) |
| 4+ Person Household | 16,698 (79.1%) | 4,411 (20.9%) |
| Total Housing Units | 60,831 (76.6%) | 18,556 (23.4%) |
Occupancy by Educational Attainment in Johnston County
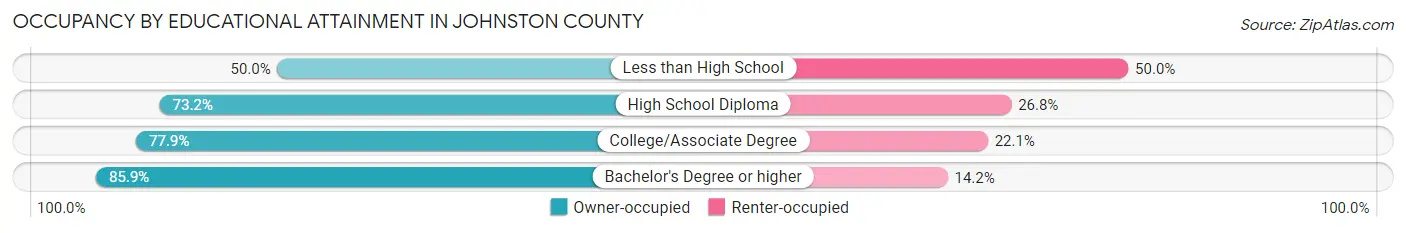
| Household Size | Owner-occupied | Renter-occupied |
| Less than High School | 3,544 (50.0%) | 3,538 (50.0%) |
| High School Diploma | 14,023 (73.2%) | 5,127 (26.8%) |
| College/Associate Degree | 23,182 (77.9%) | 6,581 (22.1%) |
| Bachelor's Degree or higher | 20,082 (85.9%) | 3,310 (14.1%) |
Occupancy by Age of Householder in Johnston County
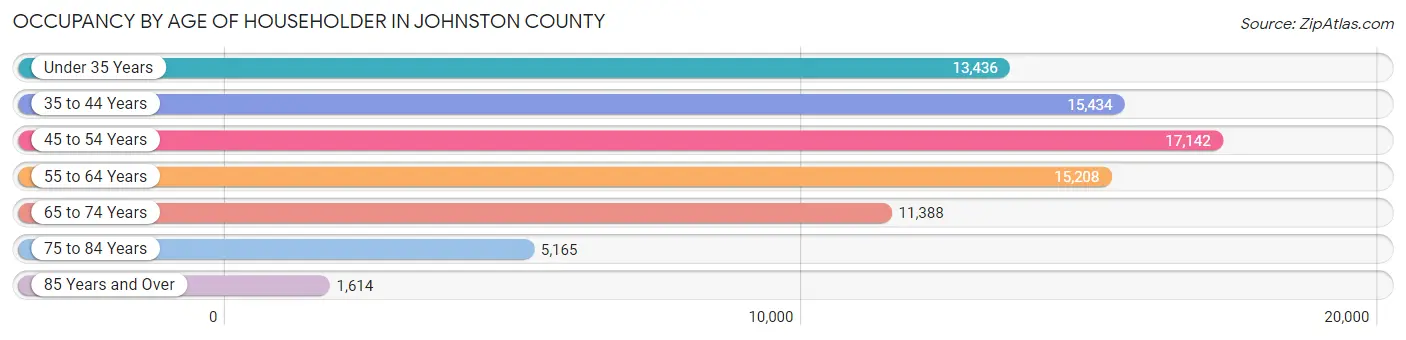
| Age Bracket | # Households | % Households |
| Under 35 Years | 13,436 | 16.9% |
| 35 to 44 Years | 15,434 | 19.4% |
| 45 to 54 Years | 17,142 | 21.6% |
| 55 to 64 Years | 15,208 | 19.2% |
| 65 to 74 Years | 11,388 | 14.3% |
| 75 to 84 Years | 5,165 | 6.5% |
| 85 Years and Over | 1,614 | 2.0% |
| Total | 79,387 | 100.0% |
Housing Finances in Johnston County
Median Income by Occupancy in Johnston County
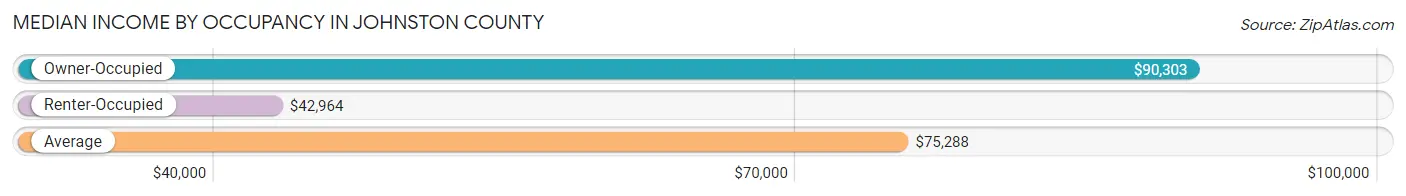
| Occupancy Type | # Households | Median Income |
| Owner-Occupied | 60,831 (76.6%) | $90,303 |
| Renter-Occupied | 18,556 (23.4%) | $42,964 |
| Average | 79,387 (100.0%) | $75,288 |
Occupancy by Householder Income Bracket in Johnston County
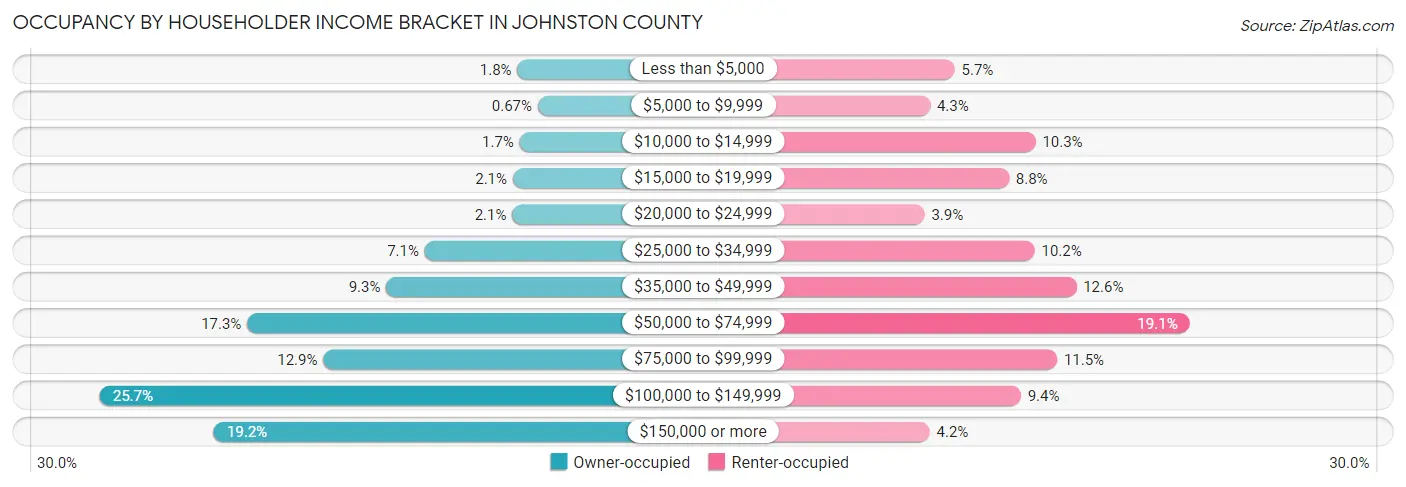
| Income Bracket | Owner-occupied | Renter-occupied |
| Less than $5,000 | 1,119 (1.8%) | 1,051 (5.7%) |
| $5,000 to $9,999 | 409 (0.7%) | 789 (4.3%) |
| $10,000 to $14,999 | 1,040 (1.7%) | 1,907 (10.3%) |
| $15,000 to $19,999 | 1,277 (2.1%) | 1,626 (8.8%) |
| $20,000 to $24,999 | 1,293 (2.1%) | 732 (3.9%) |
| $25,000 to $34,999 | 4,337 (7.1%) | 1,898 (10.2%) |
| $35,000 to $49,999 | 5,676 (9.3%) | 2,339 (12.6%) |
| $50,000 to $74,999 | 10,514 (17.3%) | 3,541 (19.1%) |
| $75,000 to $99,999 | 7,867 (12.9%) | 2,136 (11.5%) |
| $100,000 to $149,999 | 15,631 (25.7%) | 1,752 (9.4%) |
| $150,000 or more | 11,668 (19.2%) | 785 (4.2%) |
| Total | 60,831 (100.0%) | 18,556 (100.0%) |
Monthly Housing Cost Tiers in Johnston County
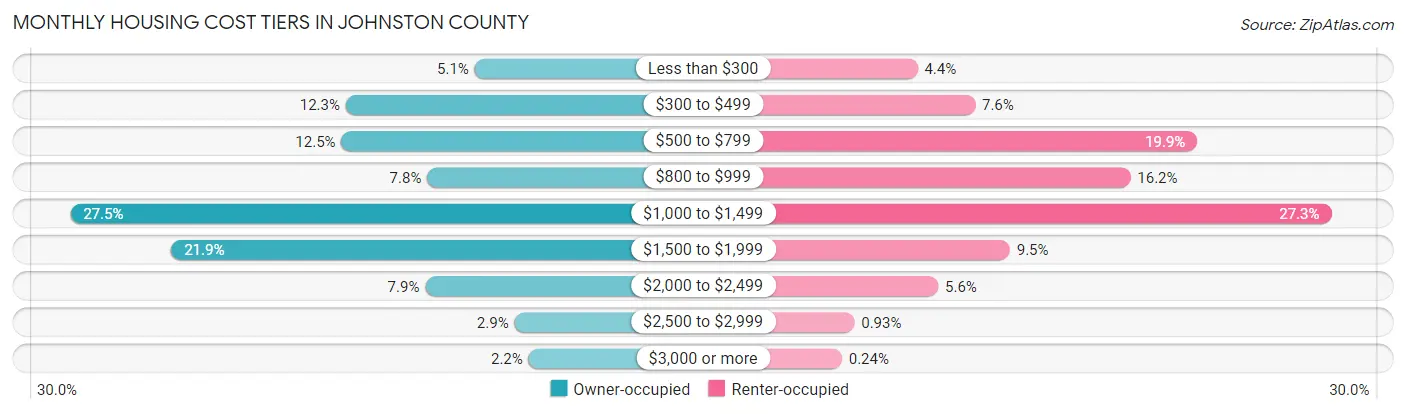
| Monthly Cost | Owner-occupied | Renter-occupied |
| Less than $300 | 3,126 (5.1%) | 821 (4.4%) |
| $300 to $499 | 7,458 (12.3%) | 1,411 (7.6%) |
| $500 to $799 | 7,601 (12.5%) | 3,687 (19.9%) |
| $800 to $999 | 4,722 (7.8%) | 3,002 (16.2%) |
| $1,000 to $1,499 | 16,716 (27.5%) | 5,062 (27.3%) |
| $1,500 to $1,999 | 13,320 (21.9%) | 1,767 (9.5%) |
| $2,000 to $2,499 | 4,787 (7.9%) | 1,032 (5.6%) |
| $2,500 to $2,999 | 1,788 (2.9%) | 172 (0.9%) |
| $3,000 or more | 1,313 (2.2%) | 45 (0.2%) |
| Total | 60,831 (100.0%) | 18,556 (100.0%) |
Physical Housing Characteristics in Johnston County
Housing Structures in Johnston County
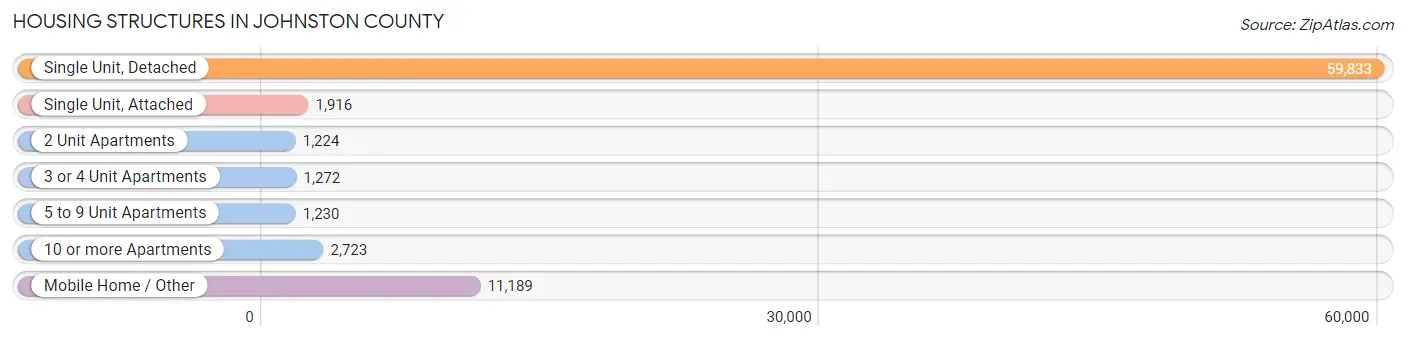
| Structure Type | # Housing Units | % Housing Units |
| Single Unit, Detached | 59,833 | 75.4% |
| Single Unit, Attached | 1,916 | 2.4% |
| 2 Unit Apartments | 1,224 | 1.5% |
| 3 or 4 Unit Apartments | 1,272 | 1.6% |
| 5 to 9 Unit Apartments | 1,230 | 1.5% |
| 10 or more Apartments | 2,723 | 3.4% |
| Mobile Home / Other | 11,189 | 14.1% |
| Total | 79,387 | 100.0% |
Housing Structures by Occupancy in Johnston County
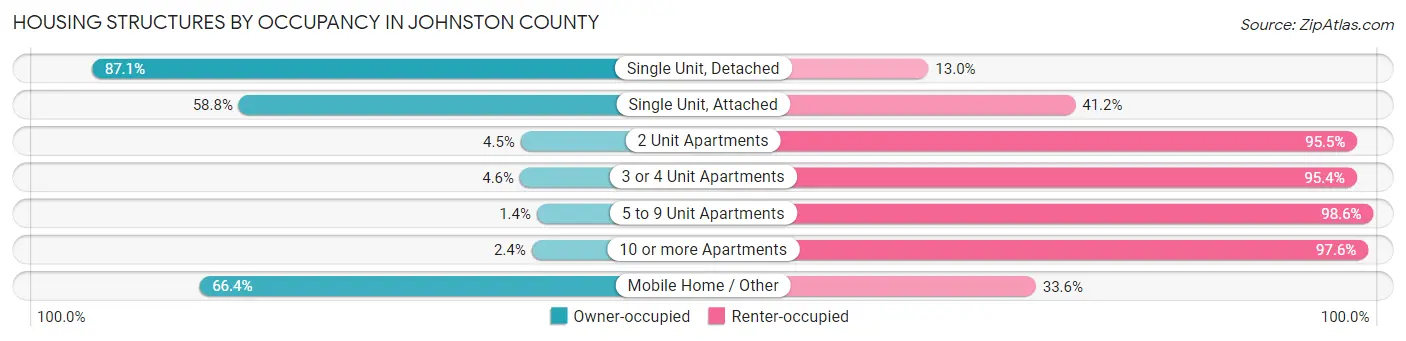
| Structure Type | Owner-occupied | Renter-occupied |
| Single Unit, Detached | 52,083 (87.1%) | 7,750 (13.0%) |
| Single Unit, Attached | 1,126 (58.8%) | 790 (41.2%) |
| 2 Unit Apartments | 55 (4.5%) | 1,169 (95.5%) |
| 3 or 4 Unit Apartments | 59 (4.6%) | 1,213 (95.4%) |
| 5 to 9 Unit Apartments | 17 (1.4%) | 1,213 (98.6%) |
| 10 or more Apartments | 65 (2.4%) | 2,658 (97.6%) |
| Mobile Home / Other | 7,426 (66.4%) | 3,763 (33.6%) |
| Total | 60,831 (76.6%) | 18,556 (23.4%) |
Housing Structures by Number of Rooms in Johnston County
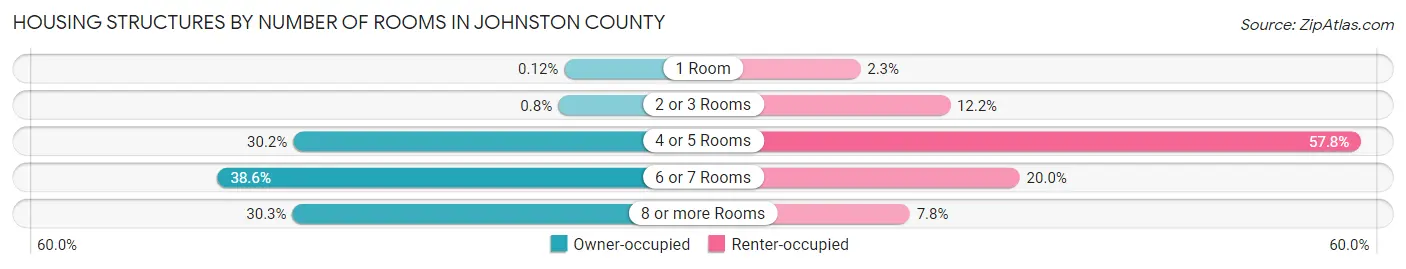
| Number of Rooms | Owner-occupied | Renter-occupied |
| 1 Room | 75 (0.1%) | 419 (2.3%) |
| 2 or 3 Rooms | 484 (0.8%) | 2,266 (12.2%) |
| 4 or 5 Rooms | 18,373 (30.2%) | 10,732 (57.8%) |
| 6 or 7 Rooms | 23,477 (38.6%) | 3,701 (20.0%) |
| 8 or more Rooms | 18,422 (30.3%) | 1,438 (7.7%) |
| Total | 60,831 (100.0%) | 18,556 (100.0%) |
Housing Structure by Heating Type in Johnston County

| Heating Type | Owner-occupied | Renter-occupied |
| Utility Gas | 7,449 (12.2%) | 1,282 (6.9%) |
| Bottled, Tank, or LP Gas | 5,713 (9.4%) | 1,268 (6.8%) |
| Electricity | 46,508 (76.4%) | 15,325 (82.6%) |
| Fuel Oil or Kerosene | 301 (0.5%) | 233 (1.3%) |
| Coal or Coke | 0 (0.0%) | 0 (0.0%) |
| All other Fuels | 620 (1.0%) | 282 (1.5%) |
| No Fuel Used | 240 (0.4%) | 166 (0.9%) |
| Total | 60,831 (100.0%) | 18,556 (100.0%) |
Household Vehicle Usage in Johnston County
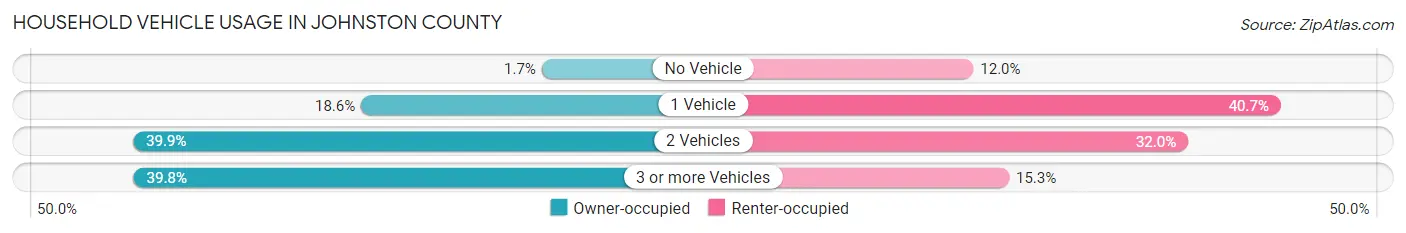
| Vehicles per Household | Owner-occupied | Renter-occupied |
| No Vehicle | 1,052 (1.7%) | 2,224 (12.0%) |
| 1 Vehicle | 11,306 (18.6%) | 7,548 (40.7%) |
| 2 Vehicles | 24,253 (39.9%) | 5,941 (32.0%) |
| 3 or more Vehicles | 24,220 (39.8%) | 2,843 (15.3%) |
| Total | 60,831 (100.0%) | 18,556 (100.0%) |
Real Estate & Mortgages in Johnston County
Real Estate and Mortgage Overview in Johnston County
| Characteristic | Without Mortgage | With Mortgage |
| Housing Units | 18,084 | 42,747 |
| Median Property Value | $171,900 | $257,900 |
| Median Household Income | $60,079 | $9,694 |
| Monthly Housing Costs | $466 | $1,313 |
| Real Estate Taxes | $1,359 | $699 |
Property Value by Mortgage Status in Johnston County
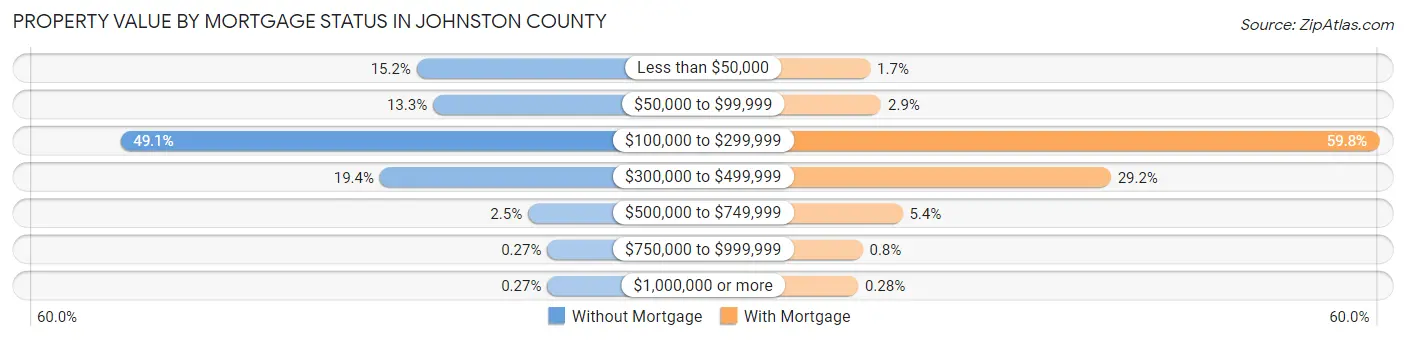
| Property Value | Without Mortgage | With Mortgage |
| Less than $50,000 | 2,747 (15.2%) | 715 (1.7%) |
| $50,000 to $99,999 | 2,410 (13.3%) | 1,250 (2.9%) |
| $100,000 to $299,999 | 8,872 (49.1%) | 25,566 (59.8%) |
| $300,000 to $499,999 | 3,511 (19.4%) | 12,464 (29.2%) |
| $500,000 to $749,999 | 447 (2.5%) | 2,291 (5.4%) |
| $750,000 to $999,999 | 48 (0.3%) | 341 (0.8%) |
| $1,000,000 or more | 49 (0.3%) | 120 (0.3%) |
| Total | 18,084 (100.0%) | 42,747 (100.0%) |
Household Income by Mortgage Status in Johnston County
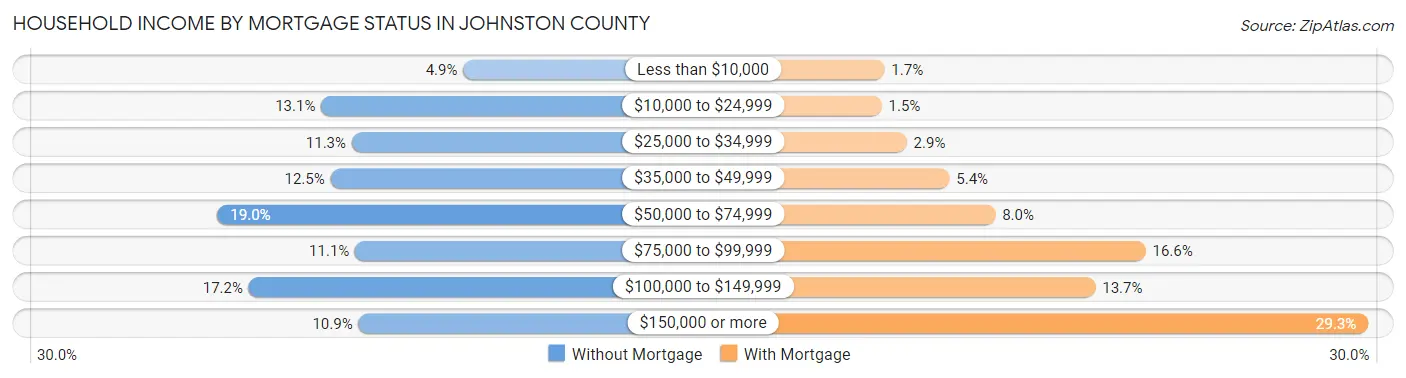
| Household Income | Without Mortgage | With Mortgage |
| Less than $10,000 | 891 (4.9%) | 705 (1.7%) |
| $10,000 to $24,999 | 2,360 (13.1%) | 637 (1.5%) |
| $25,000 to $34,999 | 2,044 (11.3%) | 1,250 (2.9%) |
| $35,000 to $49,999 | 2,265 (12.5%) | 2,293 (5.4%) |
| $50,000 to $74,999 | 3,432 (19.0%) | 3,411 (8.0%) |
| $75,000 to $99,999 | 2,009 (11.1%) | 7,082 (16.6%) |
| $100,000 to $149,999 | 3,109 (17.2%) | 5,858 (13.7%) |
| $150,000 or more | 1,974 (10.9%) | 12,522 (29.3%) |
| Total | 18,084 (100.0%) | 42,747 (100.0%) |
Property Value to Household Income Ratio in Johnston County
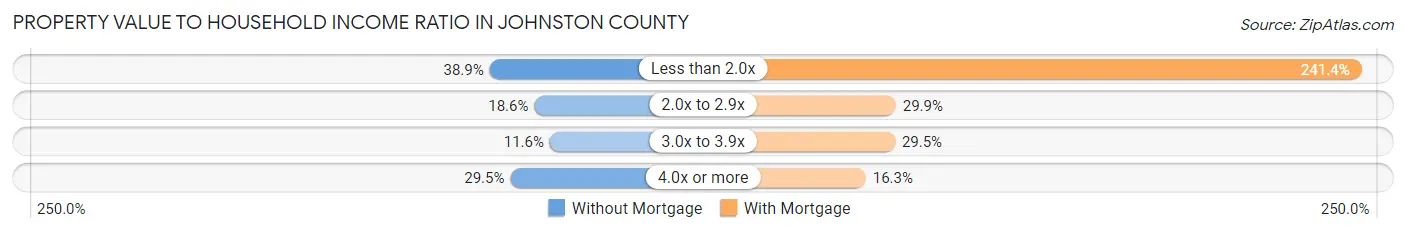
| Value-to-Income Ratio | Without Mortgage | With Mortgage |
| Less than 2.0x | 7,035 (38.9%) | 103,182 (241.4%) |
| 2.0x to 2.9x | 3,361 (18.6%) | 12,790 (29.9%) |
| 3.0x to 3.9x | 2,091 (11.6%) | 12,620 (29.5%) |
| 4.0x or more | 5,330 (29.5%) | 6,963 (16.3%) |
| Total | 18,084 (100.0%) | 42,747 (100.0%) |
Real Estate Taxes by Mortgage Status in Johnston County
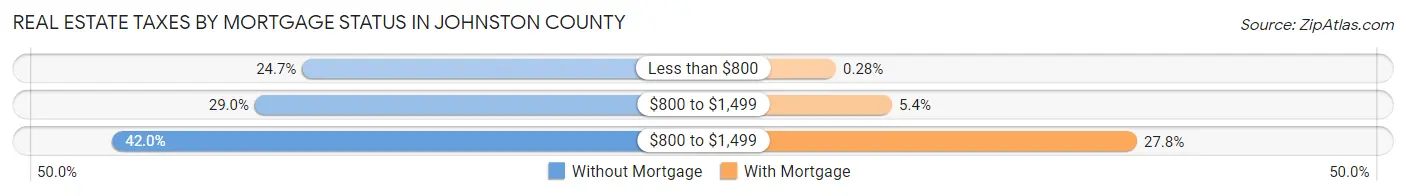
| Property Taxes | Without Mortgage | With Mortgage |
| Less than $800 | 4,457 (24.6%) | 119 (0.3%) |
| $800 to $1,499 | 5,240 (29.0%) | 2,308 (5.4%) |
| $800 to $1,499 | 7,593 (42.0%) | 11,867 (27.8%) |
| Total | 18,084 (100.0%) | 42,747 (100.0%) |
Health & Disability in Johnston County
Health Insurance Coverage by Age in Johnston County
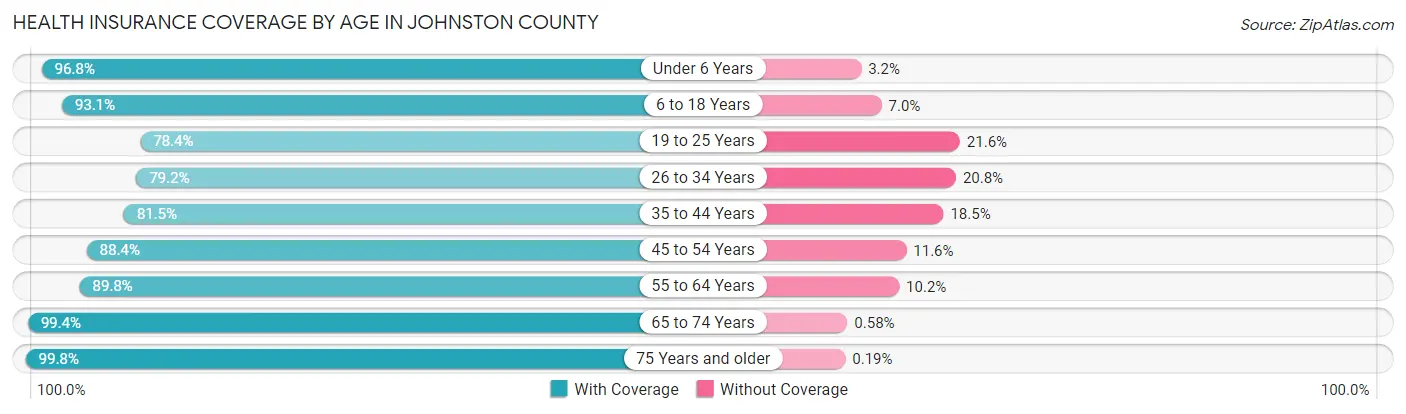
| Age Bracket | With Coverage | Without Coverage |
| Under 6 Years | 15,535 (96.8%) | 507 (3.2%) |
| 6 to 18 Years | 39,105 (93.0%) | 2,922 (7.0%) |
| 19 to 25 Years | 13,078 (78.4%) | 3,594 (21.6%) |
| 26 to 34 Years | 19,587 (79.2%) | 5,149 (20.8%) |
| 35 to 44 Years | 24,355 (81.5%) | 5,530 (18.5%) |
| 45 to 54 Years | 28,089 (88.4%) | 3,676 (11.6%) |
| 55 to 64 Years | 24,285 (89.8%) | 2,768 (10.2%) |
| 65 to 74 Years | 18,481 (99.4%) | 108 (0.6%) |
| 75 Years and older | 10,562 (99.8%) | 20 (0.2%) |
| Total | 193,077 (88.8%) | 24,274 (11.2%) |
Health Insurance Coverage by Citizenship Status in Johnston County
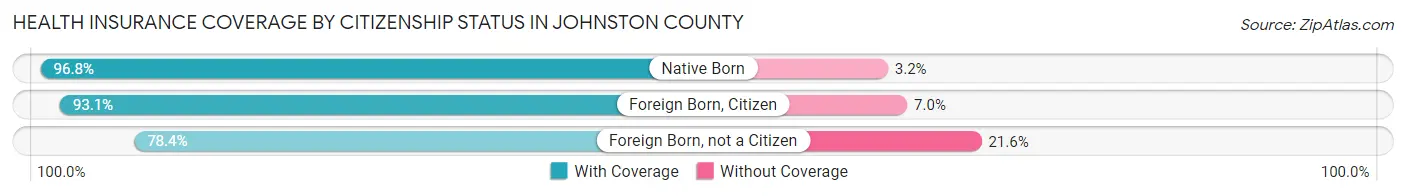
| Citizenship Status | With Coverage | Without Coverage |
| Native Born | 15,535 (96.8%) | 507 (3.2%) |
| Foreign Born, Citizen | 39,105 (93.0%) | 2,922 (7.0%) |
| Foreign Born, not a Citizen | 13,078 (78.4%) | 3,594 (21.6%) |
Health Insurance Coverage by Household Income in Johnston County

| Household Income | With Coverage | Without Coverage |
| Under $25,000 | 15,363 (84.3%) | 2,863 (15.7%) |
| $25,000 to $49,999 | 30,286 (83.3%) | 6,081 (16.7%) |
| $50,000 to $74,999 | 31,295 (83.9%) | 6,025 (16.1%) |
| $75,000 to $99,999 | 24,373 (88.0%) | 3,321 (12.0%) |
| $100,000 and over | 91,468 (93.9%) | 5,926 (6.1%) |
Public vs Private Health Insurance Coverage by Age in Johnston County
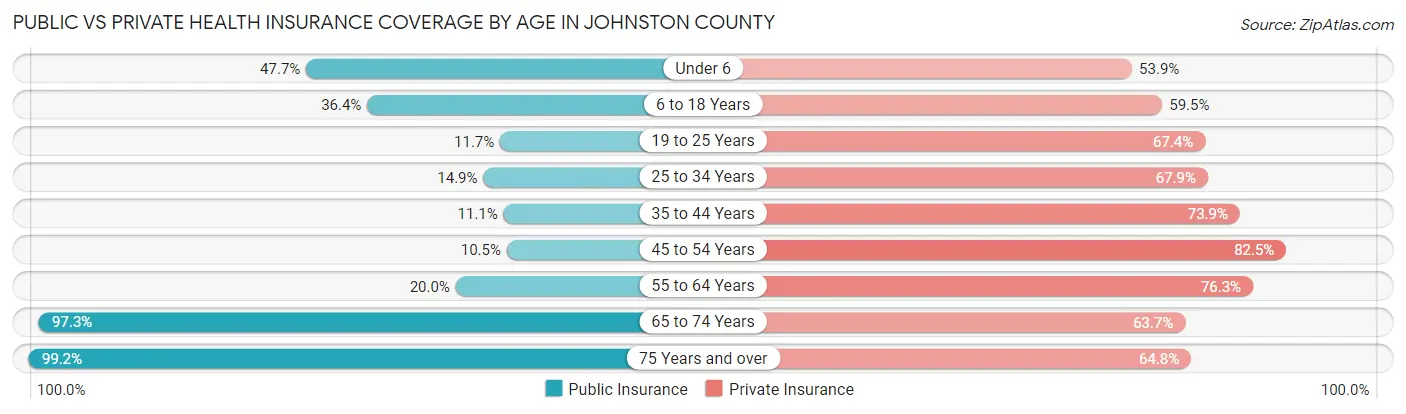
| Age Bracket | Public Insurance | Private Insurance |
| Under 6 | 7,659 (47.7%) | 8,647 (53.9%) |
| 6 to 18 Years | 15,300 (36.4%) | 25,002 (59.5%) |
| 19 to 25 Years | 1,958 (11.7%) | 11,240 (67.4%) |
| 25 to 34 Years | 3,673 (14.8%) | 16,800 (67.9%) |
| 35 to 44 Years | 3,315 (11.1%) | 22,076 (73.9%) |
| 45 to 54 Years | 3,334 (10.5%) | 26,200 (82.5%) |
| 55 to 64 Years | 5,404 (20.0%) | 20,645 (76.3%) |
| 65 to 74 Years | 18,094 (97.3%) | 11,847 (63.7%) |
| 75 Years and over | 10,497 (99.2%) | 6,859 (64.8%) |
| Total | 69,234 (31.9%) | 149,316 (68.7%) |
Disability Status by Sex by Age in Johnston County
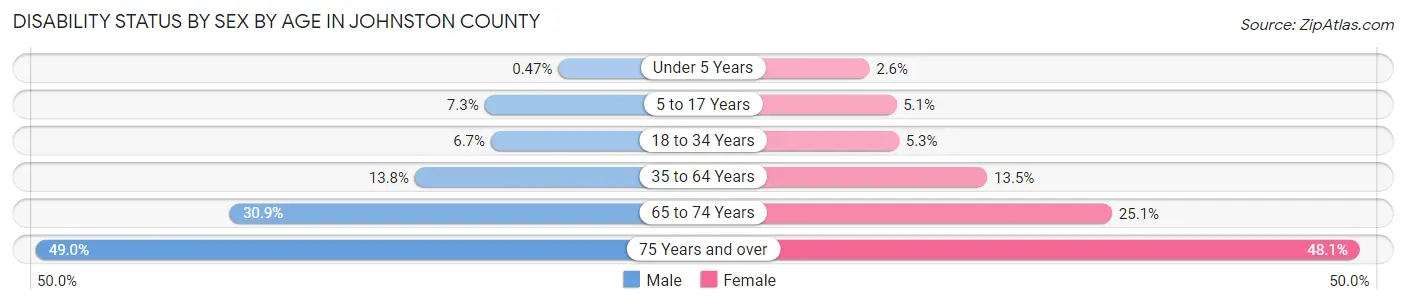
| Age Bracket | Male | Female |
| Under 5 Years | 32 (0.5%) | 165 (2.5%) |
| 5 to 17 Years | 1,540 (7.3%) | 1,023 (5.1%) |
| 18 to 34 Years | 1,519 (6.7%) | 1,182 (5.3%) |
| 35 to 64 Years | 6,037 (13.8%) | 6,053 (13.5%) |
| 65 to 74 Years | 2,624 (30.9%) | 2,534 (25.1%) |
| 75 Years and over | 2,121 (49.0%) | 3,004 (48.1%) |
Disability Class by Sex by Age in Johnston County
Disability Class: Hearing Difficulty
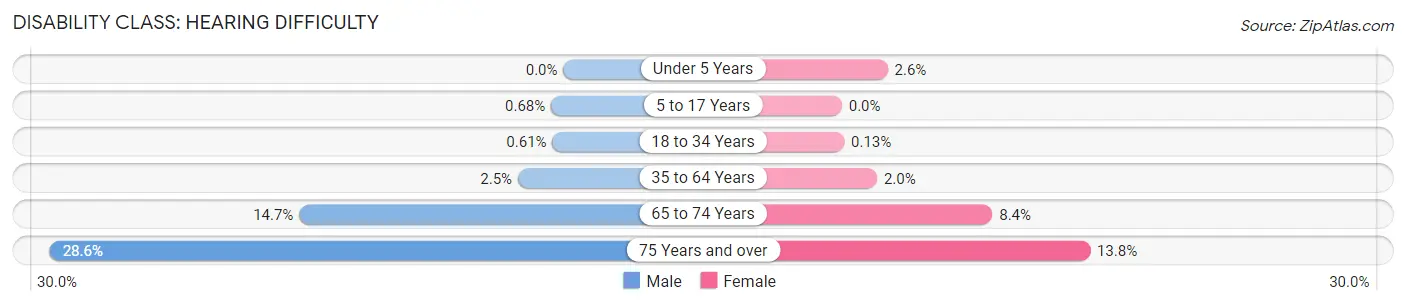
| Age Bracket | Male | Female |
| Under 5 Years | 0 (0.0%) | 165 (2.5%) |
| 5 to 17 Years | 143 (0.7%) | 0 (0.0%) |
| 18 to 34 Years | 138 (0.6%) | 28 (0.1%) |
| 35 to 64 Years | 1,107 (2.5%) | 880 (2.0%) |
| 65 to 74 Years | 1,248 (14.7%) | 847 (8.4%) |
| 75 Years and over | 1,239 (28.6%) | 864 (13.8%) |
Disability Class: Vision Difficulty
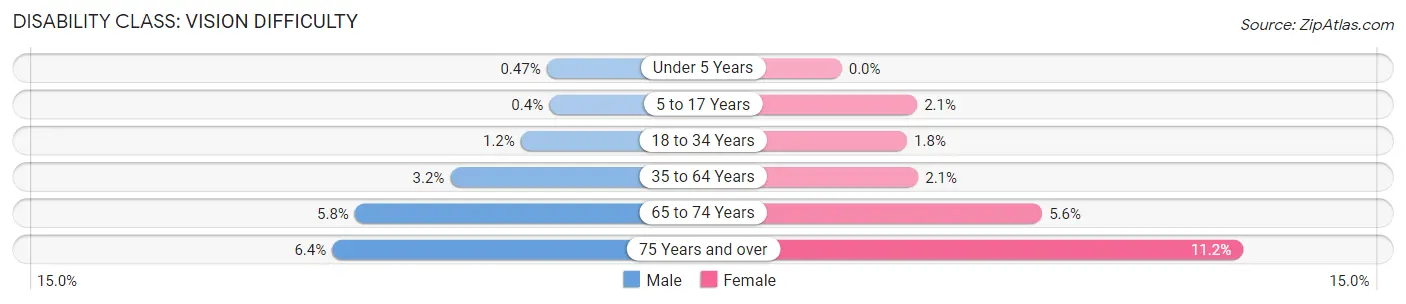
| Age Bracket | Male | Female |
| Under 5 Years | 32 (0.5%) | 0 (0.0%) |
| 5 to 17 Years | 84 (0.4%) | 425 (2.1%) |
| 18 to 34 Years | 269 (1.2%) | 407 (1.8%) |
| 35 to 64 Years | 1,382 (3.2%) | 955 (2.1%) |
| 65 to 74 Years | 493 (5.8%) | 564 (5.6%) |
| 75 Years and over | 279 (6.4%) | 698 (11.2%) |
Disability Class: Cognitive Difficulty
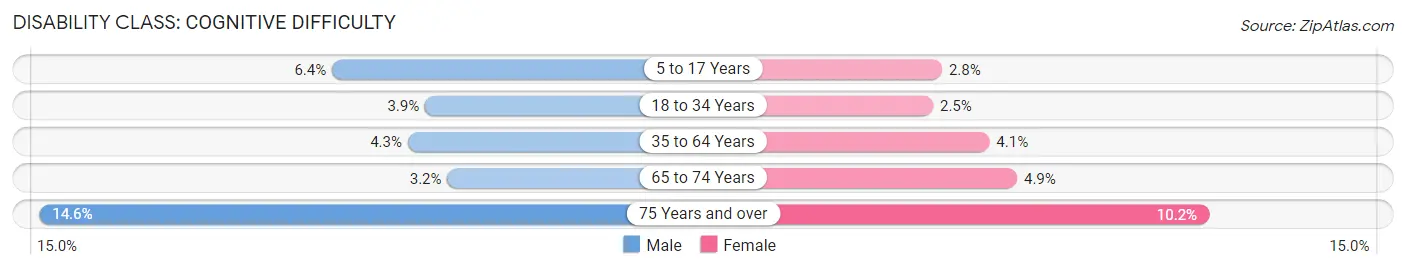
| Age Bracket | Male | Female |
| 5 to 17 Years | 1,354 (6.4%) | 566 (2.8%) |
| 18 to 34 Years | 869 (3.8%) | 569 (2.5%) |
| 35 to 64 Years | 1,898 (4.3%) | 1,846 (4.1%) |
| 65 to 74 Years | 274 (3.2%) | 493 (4.9%) |
| 75 Years and over | 632 (14.6%) | 639 (10.2%) |
Disability Class: Ambulatory Difficulty
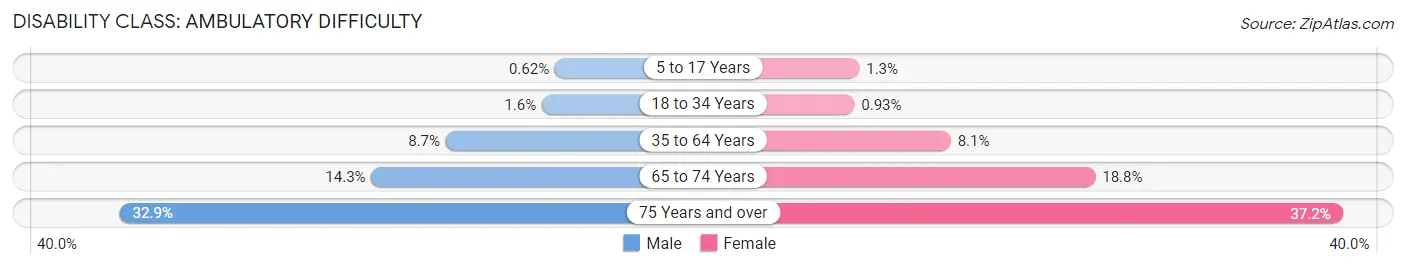
| Age Bracket | Male | Female |
| 5 to 17 Years | 130 (0.6%) | 264 (1.3%) |
| 18 to 34 Years | 356 (1.6%) | 207 (0.9%) |
| 35 to 64 Years | 3,825 (8.7%) | 3,629 (8.1%) |
| 65 to 74 Years | 1,209 (14.2%) | 1,902 (18.8%) |
| 75 Years and over | 1,427 (32.9%) | 2,324 (37.2%) |
Disability Class: Self-Care Difficulty
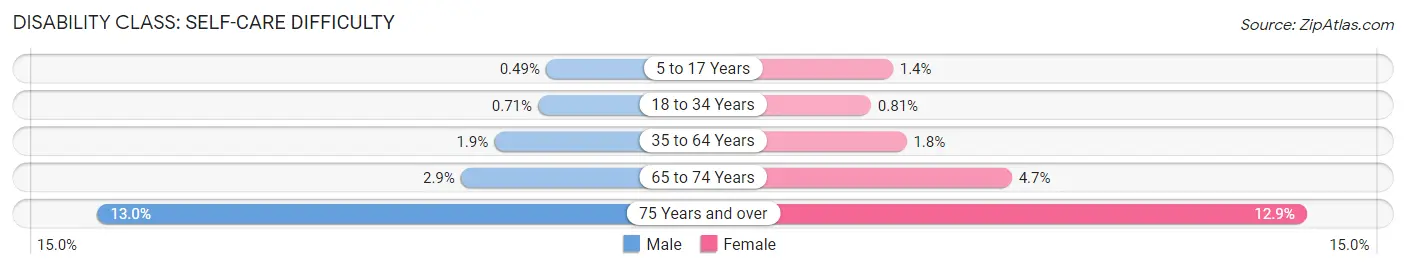
| Age Bracket | Male | Female |
| 5 to 17 Years | 104 (0.5%) | 287 (1.4%) |
| 18 to 34 Years | 160 (0.7%) | 181 (0.8%) |
| 35 to 64 Years | 846 (1.9%) | 806 (1.8%) |
| 65 to 74 Years | 243 (2.9%) | 478 (4.7%) |
| 75 Years and over | 562 (13.0%) | 809 (12.9%) |
Technology Access in Johnston County
Computing Device Access in Johnston County
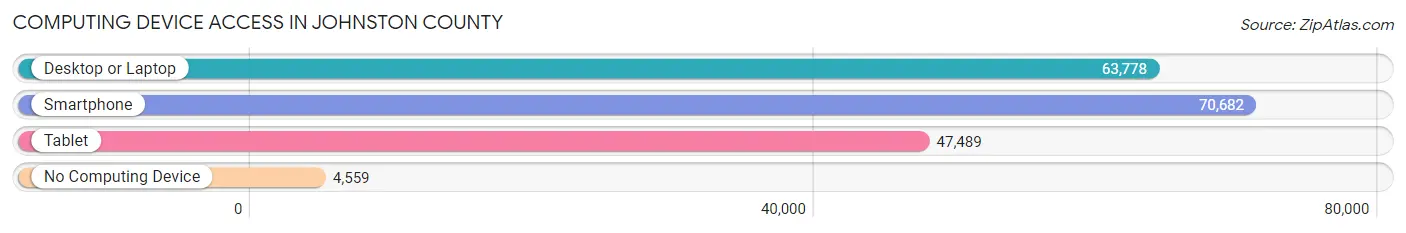
| Device Type | # Households | % Households |
| Desktop or Laptop | 63,778 | 80.3% |
| Smartphone | 70,682 | 89.0% |
| Tablet | 47,489 | 59.8% |
| No Computing Device | 4,559 | 5.7% |
| Total | 79,387 | 100.0% |
Internet Access in Johnston County
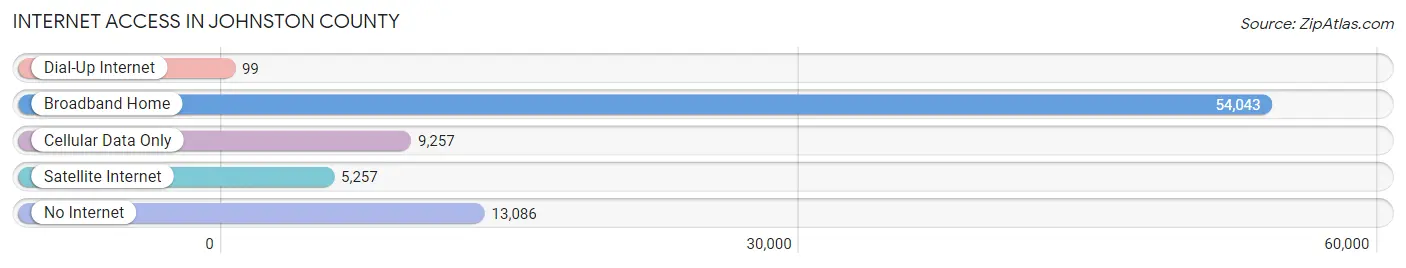
| Internet Type | # Households | % Households |
| Dial-Up Internet | 99 | 0.1% |
| Broadband Home | 54,043 | 68.1% |
| Cellular Data Only | 9,257 | 11.7% |
| Satellite Internet | 5,257 | 6.6% |
| No Internet | 13,086 | 16.5% |
| Total | 79,387 | 100.0% |
Johnston County Summary
Johnston County, North Carolina is located in the central part of the state, just south of the Virginia border. It is part of the Triangle region, which includes the cities of Raleigh, Durham, and Chapel Hill. The county is home to a population of over 170,000 people, making it the fifth most populous county in the state.
Geography
Johnston County is located in the Coastal Plain region of North Carolina, and is bordered by Wake, Harnett, Sampson, Wayne, and Wilson counties. The county is divided into two distinct regions: the northern part is mostly flat, while the southern part is hilly and contains the Neuse River. The county is home to several lakes, including Lake Benson, Lake Waccamaw, and Lake Benson. The county is also home to the Neuse River, which is the longest river in the state.
The county has a total area of 845 square miles, of which 837 square miles is land and 8 square miles is water. The county is home to several state parks, including Raven Rock State Park, Falls Lake State Recreation Area, and Cliffs of the Neuse State Park.
Economy
Johnston County has a diverse economy, with a mix of manufacturing, agriculture, and services. The county is home to several large employers, including Johnston County Schools, Johnston Community College, and Johnston Memorial Hospital. The county is also home to several large manufacturing companies, including Smithfield Foods, Inc., and Tyson Foods, Inc.
Agriculture is a major part of the county's economy, with tobacco, corn, soybeans, and cotton being the main crops. The county is also home to several wineries, including the Johnston County Winery and the Neuse River Winery.
Demographics
As of the 2010 census, Johnston County had a population of 168,878 people. The racial makeup of the county was 79.2% White, 15.3% African American, 0.5% Native American, 1.7% Asian, 0.1% Pacific Islander, 1.7% from other races, and 1.5% from two or more races. Hispanic or Latino of any race were 4.2% of the population.
The median income for a household in the county was $45,845, and the median income for a family was $54,845. The per capita income for the county was $21,845. About 11.2% of families and 14.2% of the population were below the poverty line, including 19.2% of those under age 18 and 11.2% of those age 65 or over.
Conclusion
Johnston County, North Carolina is a diverse county with a mix of manufacturing, agriculture, and services. It is home to a population of over 170,000 people, making it the fifth most populous county in the state. The county has a total area of 845 square miles, and is home to several state parks, lakes, and the Neuse River. The county has a diverse economy, with a mix of manufacturing, agriculture, and services. The county is also home to several large employers, including Johnston County Schools, Johnston Community College, and Johnston Memorial Hospital. The county has a population that is 79.2% White, 15.3% African American, 0.5% Native American, 1.7% Asian, 0.1% Pacific Islander, 1.7% from other races, and 1.5% from two or more races. The median income for a household in the county was $45,845, and the median income for a family was $54,845. About 11.2% of families and 14.2% of the population were below the poverty line. Johnston County is a diverse county with a mix of industries and a population that is growing.
Common Questions
What is the Total Population of Johnston County?
Total Population of Johnston County is 219,042.
What is the Total Male Population of Johnston County?
Total Male Population of Johnston County is 108,299.
What is the Total Female Population of Johnston County?
Total Female Population of Johnston County is 110,743.
What is the Ratio of Males per 100 Females in Johnston County?
There are 97.79 Males per 100 Females in Johnston County.
What is the Ratio of Females per 100 Males in Johnston County?
There are 102.26 Females per 100 Males in Johnston County.
What is the Median Population Age in Johnston County?
Median Population Age in Johnston County is 38.4 Years.
What is the Average Family Size in Johnston County
Average Family Size in Johnston County is 3.2 People.
What is the Average Household Size in Johnston County
Average Household Size in Johnston County is 2.7 People.
What is Per Capita Income in Johnston County?
Per Capita income in Johnston County is $35,078.
What is the Median Family Income in Johnston County?
Median Family Income in Johnston County is $93,151.
What is the Median Household income in Johnston County?
Median Household Income in Johnston County is $75,288.
What is Income or Wage Gap in Johnston County?
Income or Wage Gap in Johnston County is 23.8%.
Women in Johnston County earn 76.2 cents for every dollar earned by a man.
What is Family Income Deficit in Johnston County?
Family Income Deficit in Johnston County is $10,690.
Families that are below poverty line in Johnston County earn $10,690 less on average than the poverty threshold level.
What is Inequality or Gini Index in Johnston County?
Inequality or Gini Index in Johnston County is 0.42.
How Large is the Labor Force in Johnston County?
There are 112,644 People in the Labor Forcein in Johnston County.
What is the Percentage of People in the Labor Force in Johnston County?
66.0% of People are in the Labor Force in Johnston County.
What is the Unemployment Rate in Johnston County?
Unemployment Rate in Johnston County is 3.7%.