Iredell County, NC
Iredell County Map
Iredell County Overview
187,839
TOTAL POPULATION
93,283
MALE POPULATION
94,556
FEMALE POPULATION
98.65
MALES / 100 FEMALES
101.36
FEMALES / 100 MALES
40.8
MEDIAN AGE
3.0
AVG FAMILY SIZE
2.6
AVG HOUSEHOLD SIZE
$40,959
PER CAPITA INCOME
$86,894
AVG FAMILY INCOME
$73,103
AVG HOUSEHOLD INCOME
38.9%
WAGE / INCOME GAP [ % ]
61.1¢/ $1
WAGE / INCOME GAP [ $ ]
$9,581
FAMILY INCOME DEFICIT
0.46
INEQUALITY / GINI INDEX
97,880
LABOR FORCE [ PEOPLE ]
64.9%
PERCENT IN LABOR FORCE
4.6%
UNEMPLOYMENT RATE
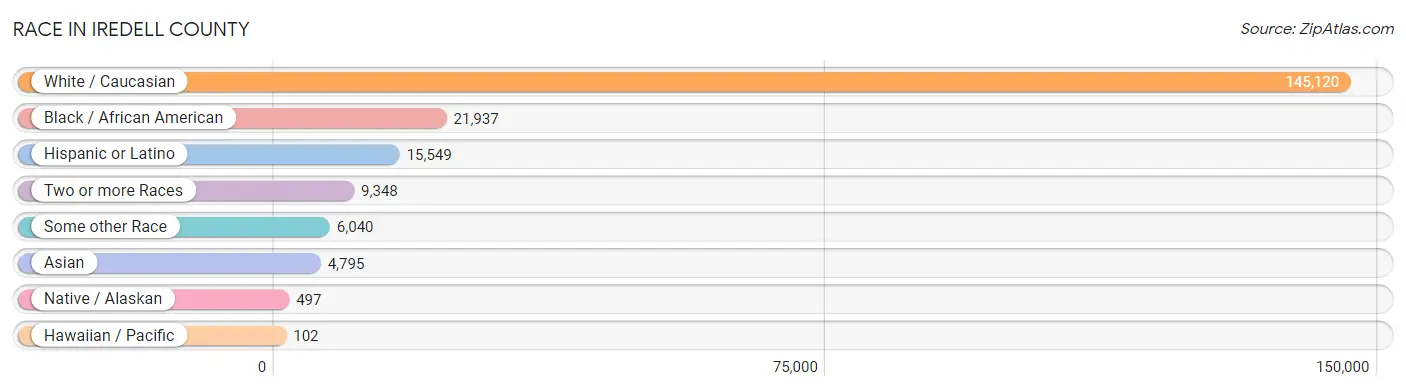
Race in Iredell County
The most populous races in Iredell County are White / Caucasian (145,120 | 77.3%), Black / African American (21,937 | 11.7%), and Hispanic or Latino (15,549 | 8.3%).
| Race | # Population | % Population |
| Asian | 4,795 | 2.5% |
| Black / African American | 21,937 | 11.7% |
| Hawaiian / Pacific | 102 | 0.1% |
| Hispanic or Latino | 15,549 | 8.3% |
| Native / Alaskan | 497 | 0.3% |
| White / Caucasian | 145,120 | 77.3% |
| Two or more Races | 9,348 | 5.0% |
| Some other Race | 6,040 | 3.2% |
| Total | 187,839 | 100.0% |
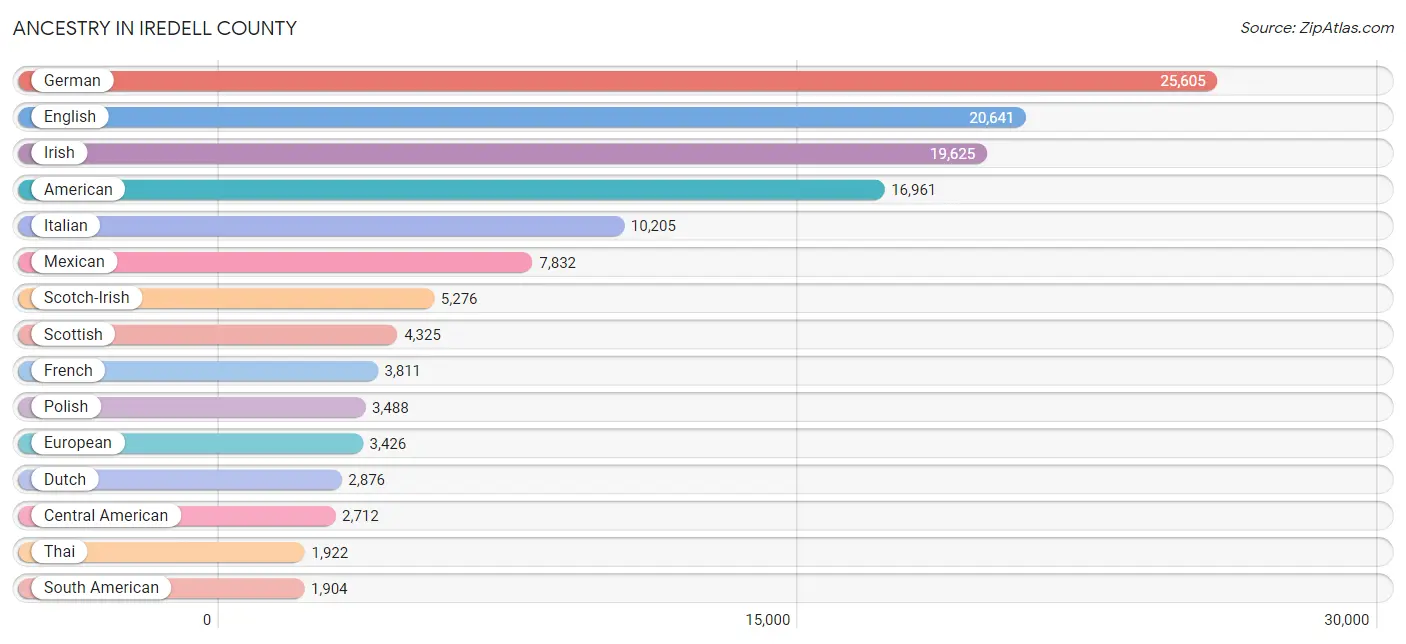
Ancestry in Iredell County
The most populous ancestries reported in Iredell County are German (25,605 | 13.6%), English (20,641 | 11.0%), Irish (19,625 | 10.4%), American (16,961 | 9.0%), and Italian (10,205 | 5.4%), together accounting for 49.5% of all Iredell County residents.
| Ancestry | # Population | % Population |
| African | 620 | 0.3% |
| Aleut | 7 | 0.0% |
| American | 16,961 | 9.0% |
| Apache | 187 | 0.1% |
| Arab | 480 | 0.3% |
| Argentinean | 27 | 0.0% |
| Armenian | 86 | 0.1% |
| Australian | 11 | 0.0% |
| Austrian | 119 | 0.1% |
| Bangladeshi | 747 | 0.4% |
| Barbadian | 63 | 0.0% |
| Basque | 3 | 0.0% |
| Belgian | 55 | 0.0% |
| Bhutanese | 656 | 0.4% |
| Blackfeet | 79 | 0.0% |
| Brazilian | 64 | 0.0% |
| British | 708 | 0.4% |
| Burmese | 520 | 0.3% |
| Cajun | 27 | 0.0% |
| Canadian | 393 | 0.2% |
| Celtic | 21 | 0.0% |
| Central American | 2,712 | 1.4% |
| Central American Indian | 141 | 0.1% |
| Cherokee | 766 | 0.4% |
| Chickasaw | 48 | 0.0% |
| Chilean | 14 | 0.0% |
| Chippewa | 4 | 0.0% |
| Choctaw | 48 | 0.0% |
| Colombian | 877 | 0.5% |
| Costa Rican | 47 | 0.0% |
| Croatian | 126 | 0.1% |
| Crow | 1 | 0.0% |
| Cuban | 365 | 0.2% |
| Czech | 318 | 0.2% |
| Czechoslovakian | 232 | 0.1% |
| Danish | 230 | 0.1% |
| Delaware | 4 | 0.0% |
| Dominican | 427 | 0.2% |
| Dutch | 2,876 | 1.5% |
| Eastern European | 424 | 0.2% |
| Ecuadorian | 358 | 0.2% |
| English | 20,641 | 11.0% |
| Estonian | 30 | 0.0% |
| European | 3,426 | 1.8% |
| Finnish | 201 | 0.1% |
| French | 3,811 | 2.0% |
| French Canadian | 902 | 0.5% |
| German | 25,605 | 13.6% |
| Ghanaian | 125 | 0.1% |
| Greek | 633 | 0.3% |
| Guatemalan | 293 | 0.2% |
| Haitian | 305 | 0.2% |
| Honduran | 947 | 0.5% |
| Hungarian | 773 | 0.4% |
| Indian (Asian) | 559 | 0.3% |
| Inupiat | 17 | 0.0% |
| Iranian | 142 | 0.1% |
| Irish | 19,625 | 10.4% |
| Iroquois | 54 | 0.0% |
| Israeli | 17 | 0.0% |
| Italian | 10,205 | 5.4% |
| Jamaican | 344 | 0.2% |
| Japanese | 56 | 0.0% |
| Kenyan | 12 | 0.0% |
| Korean | 510 | 0.3% |
| Latvian | 81 | 0.0% |
| Lebanese | 148 | 0.1% |
| Liberian | 31 | 0.0% |
| Lithuanian | 300 | 0.2% |
| Lumbee | 61 | 0.0% |
| Macedonian | 8 | 0.0% |
| Malaysian | 294 | 0.2% |
| Maltese | 59 | 0.0% |
| Mexican | 7,832 | 4.2% |
| Mexican American Indian | 333 | 0.2% |
| Moroccan | 22 | 0.0% |
| Native Hawaiian | 30 | 0.0% |
| Navajo | 27 | 0.0% |
| Nicaraguan | 259 | 0.1% |
| Nigerian | 65 | 0.0% |
| Northern European | 38 | 0.0% |
| Norwegian | 798 | 0.4% |
| Pakistani | 35 | 0.0% |
| Palestinian | 13 | 0.0% |
| Panamanian | 47 | 0.0% |
| Paraguayan | 15 | 0.0% |
| Pennsylvania German | 43 | 0.0% |
| Peruvian | 93 | 0.1% |
| Polish | 3,488 | 1.9% |
| Portuguese | 545 | 0.3% |
| Puerto Rican | 1,495 | 0.8% |
| Romanian | 465 | 0.3% |
| Russian | 647 | 0.3% |
| Salvadoran | 1,119 | 0.6% |
| Samoan | 35 | 0.0% |
| Scandinavian | 257 | 0.1% |
| Scotch-Irish | 5,276 | 2.8% |
| Scottish | 4,325 | 2.3% |
| Sioux | 42 | 0.0% |
| Slavic | 77 | 0.0% |
| Slovak | 255 | 0.1% |
| Slovene | 15 | 0.0% |
| South African | 60 | 0.0% |
| South American | 1,904 | 1.0% |
| South American Indian | 27 | 0.0% |
| Spaniard | 191 | 0.1% |
| Spanish | 226 | 0.1% |
| Sri Lankan | 468 | 0.3% |
| Subsaharan African | 1,100 | 0.6% |
| Swedish | 909 | 0.5% |
| Swiss | 345 | 0.2% |
| Syrian | 102 | 0.1% |
| Thai | 1,922 | 1.0% |
| Trinidadian and Tobagonian | 26 | 0.0% |
| Turkish | 381 | 0.2% |
| Ugandan | 24 | 0.0% |
| Ukrainian | 261 | 0.1% |
| Uruguayan | 14 | 0.0% |
| Venezuelan | 355 | 0.2% |
| Welsh | 881 | 0.5% |
| West Indian | 46 | 0.0% |
| Yugoslavian | 43 | 0.0% |
| Yuman | 30 | 0.0% | View All 123 Rows |
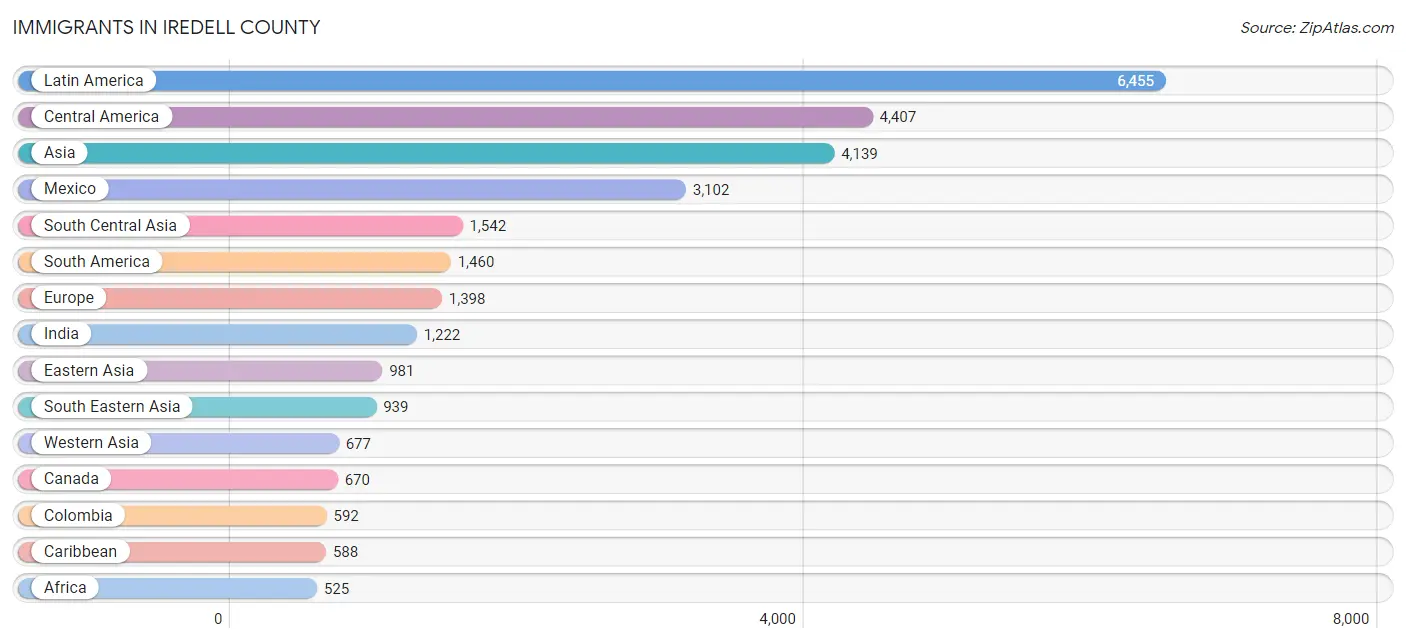
Immigrants in Iredell County
The most numerous immigrant groups reported in Iredell County came from Latin America (6,455 | 3.4%), Central America (4,407 | 2.4%), Asia (4,139 | 2.2%), Mexico (3,102 | 1.7%), and South Central Asia (1,542 | 0.8%), together accounting for 10.5% of all Iredell County residents.
| Immigration Origin | # Population | % Population |
| Africa | 525 | 0.3% |
| Argentina | 7 | 0.0% |
| Asia | 4,139 | 2.2% |
| Australia | 21 | 0.0% |
| Belgium | 12 | 0.0% |
| Belize | 38 | 0.0% |
| Brazil | 172 | 0.1% |
| Cambodia | 104 | 0.1% |
| Canada | 670 | 0.4% |
| Caribbean | 588 | 0.3% |
| Central America | 4,407 | 2.4% |
| Chile | 14 | 0.0% |
| China | 267 | 0.1% |
| Colombia | 592 | 0.3% |
| Costa Rica | 36 | 0.0% |
| Cuba | 95 | 0.1% |
| Dominican Republic | 80 | 0.0% |
| Eastern Africa | 107 | 0.1% |
| Eastern Asia | 981 | 0.5% |
| Eastern Europe | 372 | 0.2% |
| Ecuador | 218 | 0.1% |
| El Salvador | 440 | 0.2% |
| England | 239 | 0.1% |
| Europe | 1,398 | 0.7% |
| France | 23 | 0.0% |
| Germany | 308 | 0.2% |
| Ghana | 60 | 0.0% |
| Greece | 17 | 0.0% |
| Guatemala | 142 | 0.1% |
| Haiti | 144 | 0.1% |
| Honduras | 387 | 0.2% |
| Hong Kong | 15 | 0.0% |
| Hungary | 29 | 0.0% |
| India | 1,222 | 0.6% |
| Iran | 142 | 0.1% |
| Ireland | 46 | 0.0% |
| Italy | 129 | 0.1% |
| Jamaica | 175 | 0.1% |
| Japan | 402 | 0.2% |
| Kazakhstan | 26 | 0.0% |
| Kenya | 61 | 0.0% |
| Korea | 312 | 0.2% |
| Laos | 337 | 0.2% |
| Latin America | 6,455 | 3.4% |
| Lebanon | 10 | 0.0% |
| Liberia | 31 | 0.0% |
| Mexico | 3,102 | 1.7% |
| Micronesia | 11 | 0.0% |
| Moldova | 97 | 0.1% |
| Morocco | 8 | 0.0% |
| Netherlands | 25 | 0.0% |
| Nicaragua | 239 | 0.1% |
| Nigeria | 59 | 0.0% |
| Northern Africa | 8 | 0.0% |
| Northern Europe | 390 | 0.2% |
| Oceania | 52 | 0.0% |
| Pakistan | 38 | 0.0% |
| Panama | 23 | 0.0% |
| Peru | 94 | 0.1% |
| Philippines | 78 | 0.0% |
| Poland | 71 | 0.0% |
| Portugal | 71 | 0.0% |
| Romania | 70 | 0.0% |
| Russia | 71 | 0.0% |
| Scotland | 8 | 0.0% |
| South Africa | 194 | 0.1% |
| South America | 1,460 | 0.8% |
| South Central Asia | 1,542 | 0.8% |
| South Eastern Asia | 939 | 0.5% |
| Southern Europe | 244 | 0.1% |
| Spain | 27 | 0.0% |
| Sri Lanka | 65 | 0.0% |
| Sweden | 28 | 0.0% |
| Switzerland | 24 | 0.0% |
| Syria | 32 | 0.0% |
| Thailand | 152 | 0.1% |
| Trinidad and Tobago | 42 | 0.0% |
| Turkey | 312 | 0.2% |
| Uganda | 24 | 0.0% |
| Ukraine | 34 | 0.0% |
| Uruguay | 8 | 0.0% |
| Uzbekistan | 49 | 0.0% |
| Venezuela | 355 | 0.2% |
| Vietnam | 268 | 0.1% |
| Western Africa | 216 | 0.1% |
| Western Asia | 677 | 0.4% |
| Western Europe | 392 | 0.2% |
| Yemen | 323 | 0.2% | View All 88 Rows |
Sex and Age in Iredell County
Sex and Age in Iredell County
The most populous age groups in Iredell County are 50 to 54 Years (6,908 | 7.4%) for men and 50 to 54 Years (7,015 | 7.4%) for women.
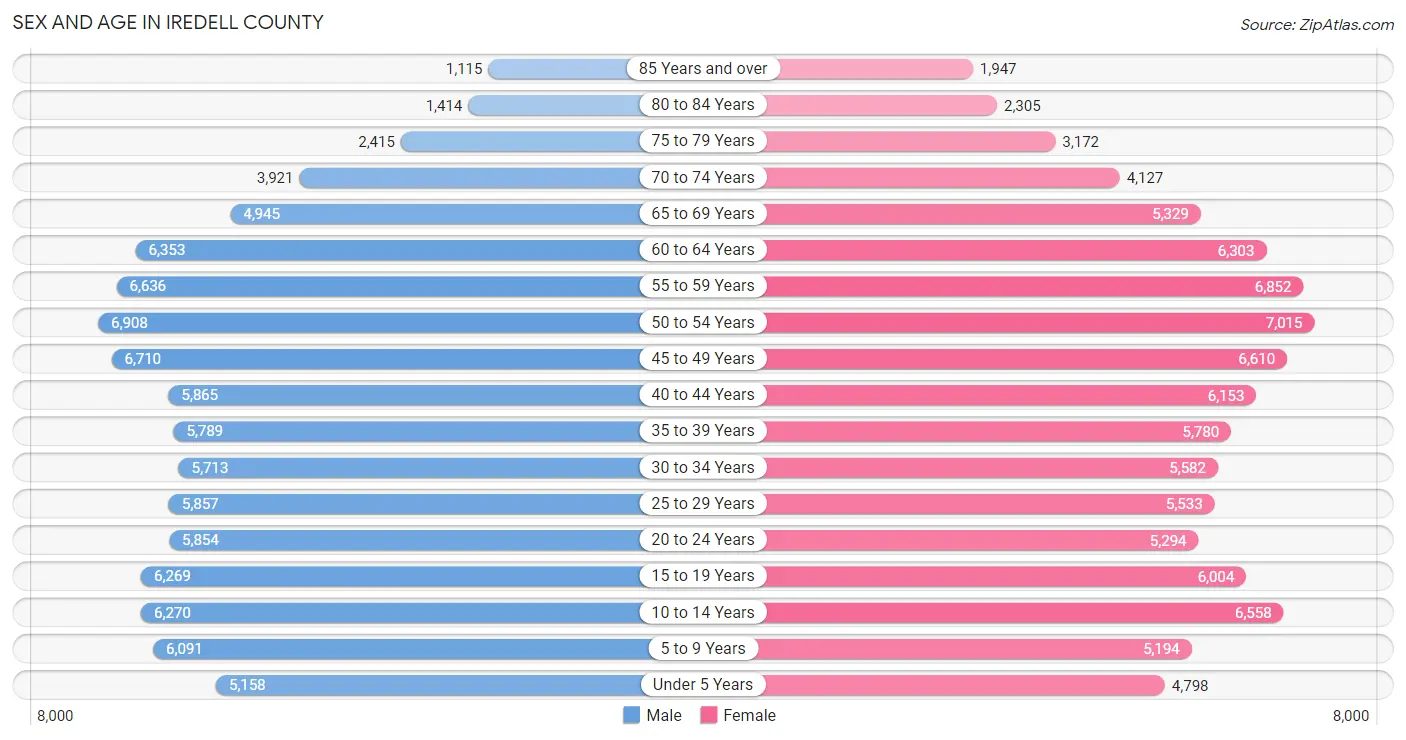
| Age Bracket | Male | Female |
| Under 5 Years | 5,158 (5.5%) | 4,798 (5.1%) |
| 5 to 9 Years | 6,091 (6.5%) | 5,194 (5.5%) |
| 10 to 14 Years | 6,270 (6.7%) | 6,558 (6.9%) |
| 15 to 19 Years | 6,269 (6.7%) | 6,004 (6.4%) |
| 20 to 24 Years | 5,854 (6.3%) | 5,294 (5.6%) |
| 25 to 29 Years | 5,857 (6.3%) | 5,533 (5.9%) |
| 30 to 34 Years | 5,713 (6.1%) | 5,582 (5.9%) |
| 35 to 39 Years | 5,789 (6.2%) | 5,780 (6.1%) |
| 40 to 44 Years | 5,865 (6.3%) | 6,153 (6.5%) |
| 45 to 49 Years | 6,710 (7.2%) | 6,610 (7.0%) |
| 50 to 54 Years | 6,908 (7.4%) | 7,015 (7.4%) |
| 55 to 59 Years | 6,636 (7.1%) | 6,852 (7.2%) |
| 60 to 64 Years | 6,353 (6.8%) | 6,303 (6.7%) |
| 65 to 69 Years | 4,945 (5.3%) | 5,329 (5.6%) |
| 70 to 74 Years | 3,921 (4.2%) | 4,127 (4.4%) |
| 75 to 79 Years | 2,415 (2.6%) | 3,172 (3.4%) |
| 80 to 84 Years | 1,414 (1.5%) | 2,305 (2.4%) |
| 85 Years and over | 1,115 (1.2%) | 1,947 (2.1%) |
| Total | 93,283 (100.0%) | 94,556 (100.0%) |
Families and Households in Iredell County
Median Family Size in Iredell County
The median family size in Iredell County is 3.04 persons per family, with married-couple families (39,742 | 76.7%) accounting for the largest median family size of 3.1 persons per family. On the other hand, single male/father families (3,264 | 6.3%) represent the smallest median family size with 2.64 persons per family.

| Family Type | # Families | Family Size |
| Married-Couple | 39,742 (76.7%) | 3.10 |
| Single Male/Father | 3,264 (6.3%) | 2.64 |
| Single Female/Mother | 8,839 (17.1%) | 2.95 |
| Total Families | 51,845 (100.0%) | 3.04 |
Median Household Size in Iredell County
The median household size in Iredell County is 2.58 persons per household, with single female/mother households (8,839 | 12.2%) accounting for the largest median household size of 3.18 persons per household. non-family households (20,451 | 28.3%) represent the smallest median household size with 1.21 persons per household.
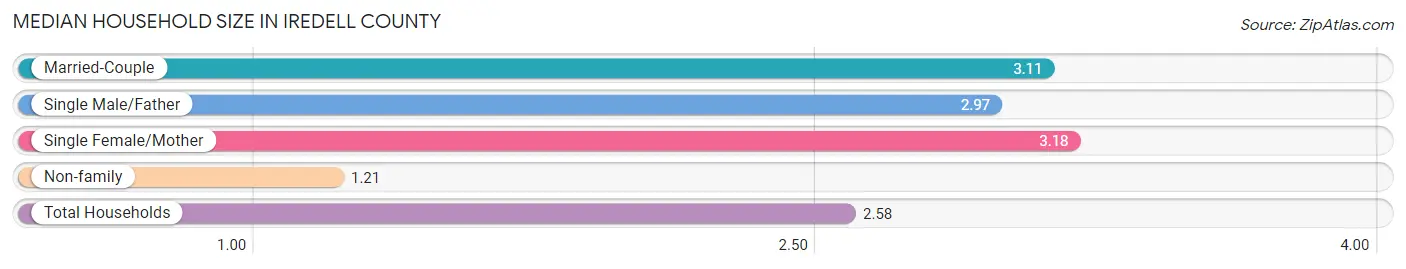
| Household Type | # Households | Household Size |
| Married-Couple | 39,742 (55.0%) | 3.11 |
| Single Male/Father | 3,264 (4.5%) | 2.97 |
| Single Female/Mother | 8,839 (12.2%) | 3.18 |
| Non-family | 20,451 (28.3%) | 1.21 |
| Total Households | 72,296 (100.0%) | 2.58 |
Household Size by Marriage Status in Iredell County
Out of a total of 72,296 households in Iredell County, 51,845 (71.7%) are family households, while 20,451 (28.3%) are nonfamily households. The most numerous type of family households are 2-person households, comprising 23,794, and the most common type of nonfamily households are 1-person households, comprising 17,112.
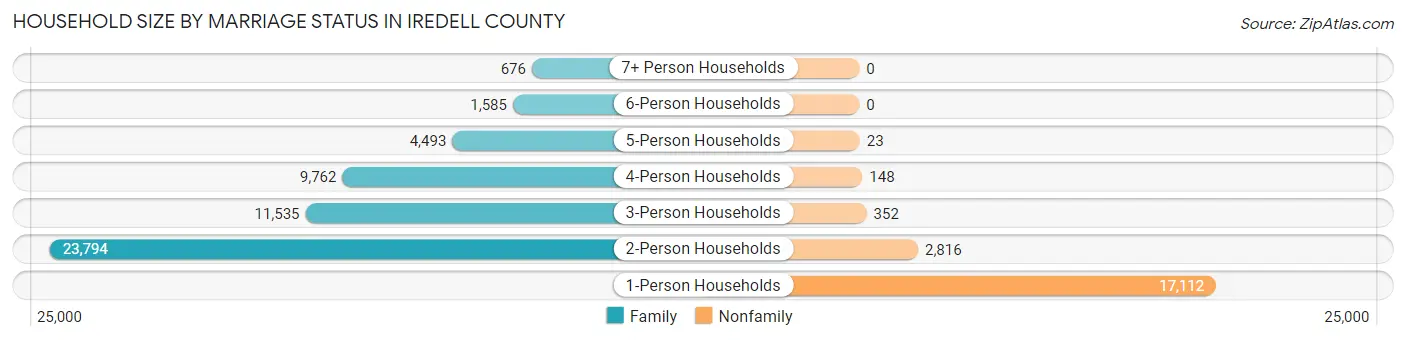
| Household Size | Family Households | Nonfamily Households |
| 1-Person Households | - | 17,112 (23.7%) |
| 2-Person Households | 23,794 (32.9%) | 2,816 (3.9%) |
| 3-Person Households | 11,535 (16.0%) | 352 (0.5%) |
| 4-Person Households | 9,762 (13.5%) | 148 (0.2%) |
| 5-Person Households | 4,493 (6.2%) | 23 (0.0%) |
| 6-Person Households | 1,585 (2.2%) | 0 (0.0%) |
| 7+ Person Households | 676 (0.9%) | 0 (0.0%) |
| Total | 51,845 (71.7%) | 20,451 (28.3%) |
Female Fertility in Iredell County
Fertility by Age in Iredell County
Average fertility rate in Iredell County is 66.0 births per 1,000 women. Women in the age bracket of 20 to 34 years have the highest fertility rate with 119.0 births per 1,000 women. Women in the age bracket of 20 to 34 years acount for 69.7% of all women with births.
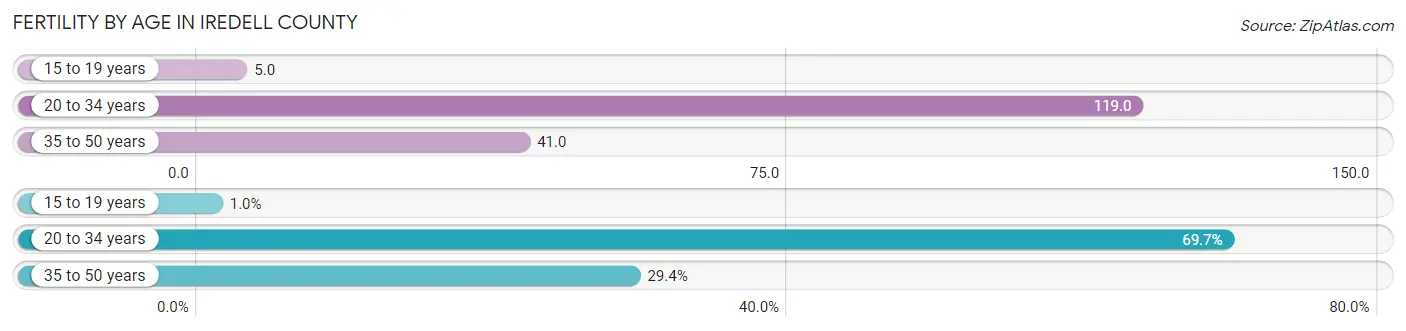
| Age Bracket | Women with Births | Births / 1,000 Women |
| 15 to 19 years | 28 (1.0%) | 5.0 |
| 20 to 34 years | 1,953 (69.7%) | 119.0 |
| 35 to 50 years | 823 (29.3%) | 41.0 |
| Total | 2,804 (100.0%) | 66.0 |
Fertility by Age by Marriage Status in Iredell County
78.1% of women with births (2,804) in Iredell County are married. The highest percentage of unmarried women with births falls into 15 to 19 years age bracket with 100.0% of them unmarried at the time of birth, while the lowest percentage of unmarried women with births belong to 35 to 50 years age bracket with 6.4% of them unmarried.

| Age Bracket | Married | Unmarried |
| 15 to 19 years | 0 (0.0%) | 28 (100.0%) |
| 20 to 34 years | 1,420 (72.7%) | 533 (27.3%) |
| 35 to 50 years | 770 (93.6%) | 53 (6.4%) |
| Total | 2,190 (78.1%) | 614 (21.9%) |
Fertility by Education in Iredell County
Average fertility rate in Iredell County is 66.0 births per 1,000 women. Women with the education attainment of graduate degree have the highest fertility rate of 111.0 births per 1,000 women, while women with the education attainment of less than high school have the lowest fertility at 45.0 births per 1,000 women. Women with the education attainment of college or associate's degree represent 33.9% of all women with births.
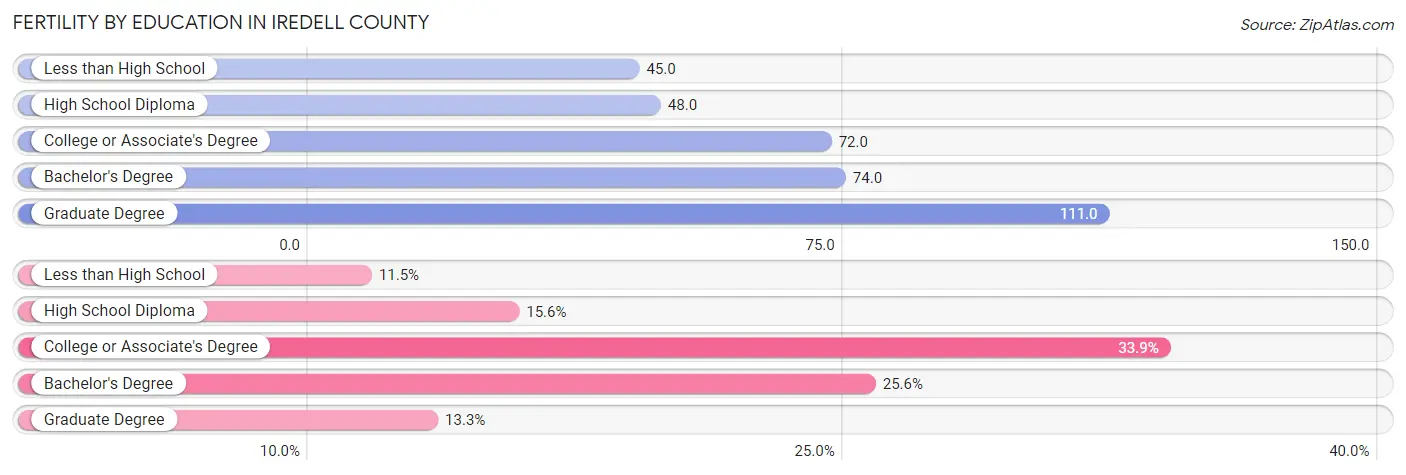
| Educational Attainment | Women with Births | Births / 1,000 Women |
| Less than High School | 322 (11.5%) | 45.0 |
| High School Diploma | 438 (15.6%) | 48.0 |
| College or Associate's Degree | 951 (33.9%) | 72.0 |
| Bachelor's Degree | 719 (25.6%) | 74.0 |
| Graduate Degree | 374 (13.3%) | 111.0 |
| Total | 2,804 (100.0%) | 66.0 |
Fertility by Education by Marriage Status in Iredell County
21.9% of women with births in Iredell County are unmarried. Women with the educational attainment of bachelor's degree are most likely to be married with 97.9% of them married at childbirth, while women with the educational attainment of high school diploma are least likely to be married with 69.4% of them unmarried at childbirth.
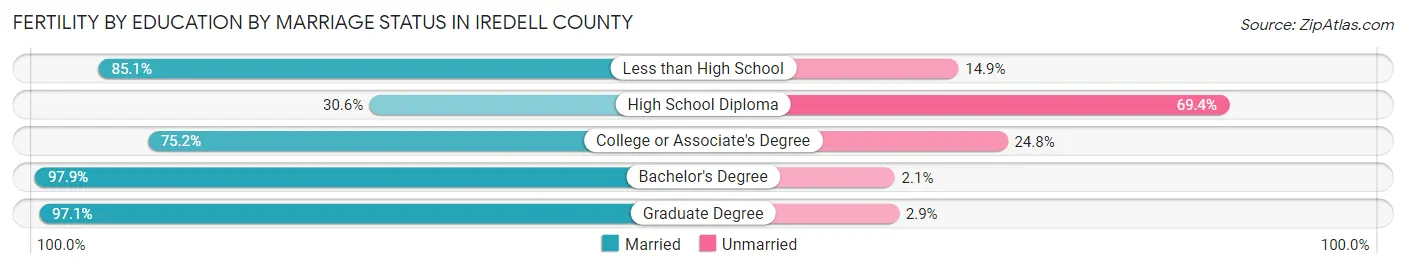
| Educational Attainment | Married | Unmarried |
| Less than High School | 274 (85.1%) | 48 (14.9%) |
| High School Diploma | 134 (30.6%) | 304 (69.4%) |
| College or Associate's Degree | 715 (75.2%) | 236 (24.8%) |
| Bachelor's Degree | 704 (97.9%) | 15 (2.1%) |
| Graduate Degree | 363 (97.1%) | 11 (2.9%) |
| Total | 2,190 (78.1%) | 614 (21.9%) |
Income in Iredell County
Income Overview in Iredell County
Per Capita Income in Iredell County is $40,959, while median incomes of families and households are $86,894 and $73,103 respectively.
| Characteristic | Number | Measure |
| Per Capita Income | 187,839 | $40,959 |
| Median Family Income | 51,845 | $86,894 |
| Mean Family Income | 51,845 | $119,166 |
| Median Household Income | 72,296 | $73,103 |
| Mean Household Income | 72,296 | $102,803 |
| Income Deficit | 51,845 | $9,581 |
| Wage / Income Gap (%) | 187,839 | 38.95% |
| Wage / Income Gap ($) | 187,839 | 61.05¢ per $1 |
| Gini / Inequality Index | 187,839 | 0.46 |
Earnings by Sex in Iredell County
Average Earnings in Iredell County are $40,244, $50,065 for men and $30,565 for women, a difference of 39.0%.
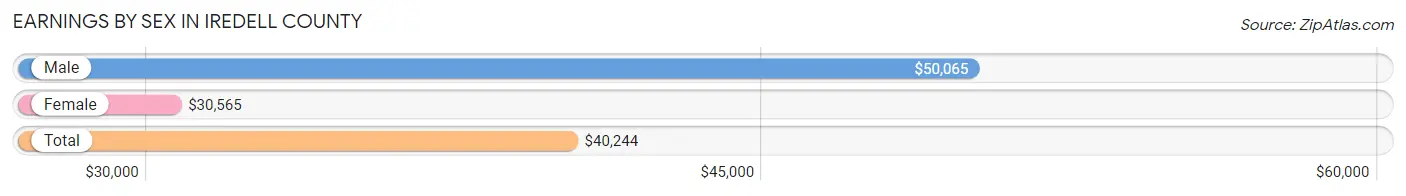
| Sex | Number | Average Earnings |
| Male | 55,054 (53.8%) | $50,065 |
| Female | 47,258 (46.2%) | $30,565 |
| Total | 102,312 (100.0%) | $40,244 |
Earnings by Sex by Income Bracket in Iredell County
The most common earnings brackets in Iredell County are $100,000+ for men (11,098 | 20.2%) and $100,000+ for women (3,876 | 8.2%).
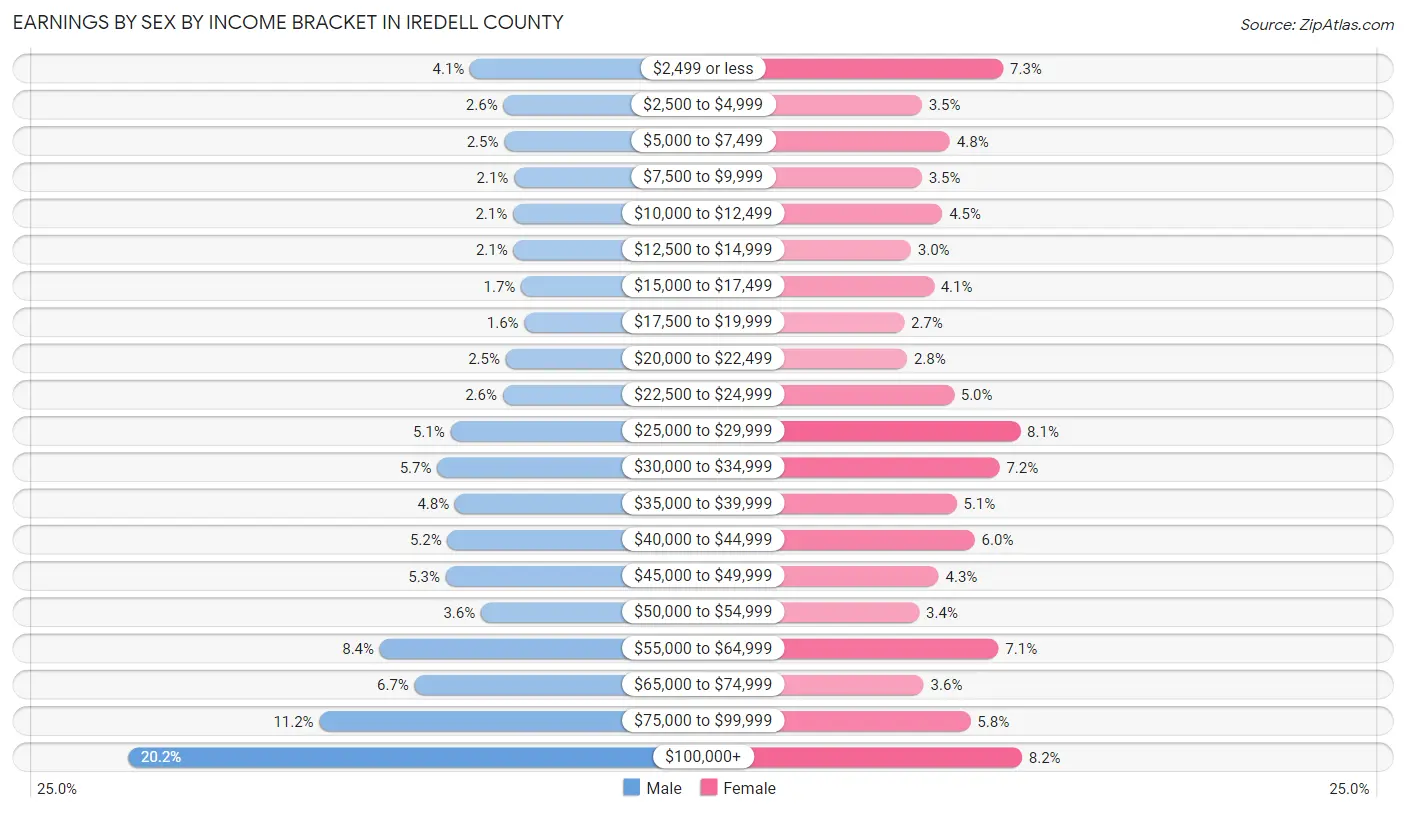
| Income | Male | Female |
| $2,499 or less | 2,274 (4.1%) | 3,459 (7.3%) |
| $2,500 to $4,999 | 1,413 (2.6%) | 1,660 (3.5%) |
| $5,000 to $7,499 | 1,391 (2.5%) | 2,283 (4.8%) |
| $7,500 to $9,999 | 1,141 (2.1%) | 1,657 (3.5%) |
| $10,000 to $12,499 | 1,168 (2.1%) | 2,113 (4.5%) |
| $12,500 to $14,999 | 1,155 (2.1%) | 1,419 (3.0%) |
| $15,000 to $17,499 | 957 (1.7%) | 1,922 (4.1%) |
| $17,500 to $19,999 | 873 (1.6%) | 1,266 (2.7%) |
| $20,000 to $22,499 | 1,355 (2.5%) | 1,332 (2.8%) |
| $22,500 to $24,999 | 1,434 (2.6%) | 2,369 (5.0%) |
| $25,000 to $29,999 | 2,782 (5.1%) | 3,836 (8.1%) |
| $30,000 to $34,999 | 3,124 (5.7%) | 3,381 (7.1%) |
| $35,000 to $39,999 | 2,667 (4.8%) | 2,427 (5.1%) |
| $40,000 to $44,999 | 2,859 (5.2%) | 2,831 (6.0%) |
| $45,000 to $49,999 | 2,904 (5.3%) | 2,034 (4.3%) |
| $50,000 to $54,999 | 1,991 (3.6%) | 1,600 (3.4%) |
| $55,000 to $64,999 | 4,604 (8.4%) | 3,356 (7.1%) |
| $65,000 to $74,999 | 3,703 (6.7%) | 1,703 (3.6%) |
| $75,000 to $99,999 | 6,161 (11.2%) | 2,734 (5.8%) |
| $100,000+ | 11,098 (20.2%) | 3,876 (8.2%) |
| Total | 55,054 (100.0%) | 47,258 (100.0%) |
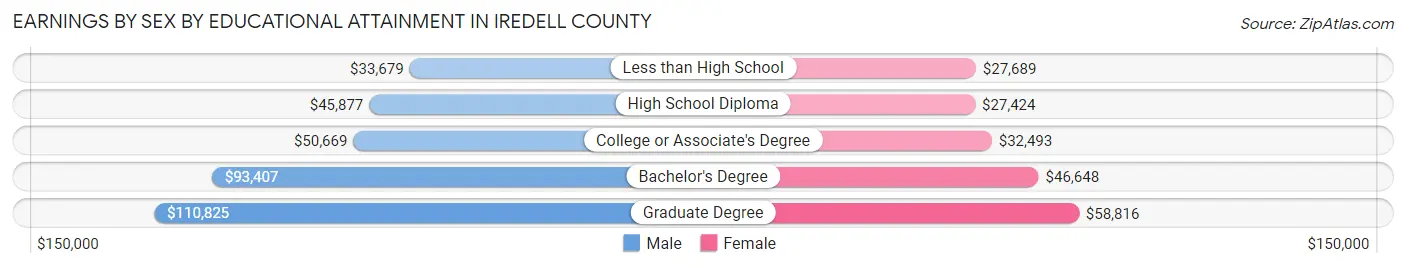
Earnings by Sex by Educational Attainment in Iredell County
Average earnings in Iredell County are $57,420 for men and $35,192 for women, a difference of 38.7%. Men with an educational attainment of graduate degree enjoy the highest average annual earnings of $110,825, while those with less than high school education earn the least with $33,679. Women with an educational attainment of graduate degree earn the most with the average annual earnings of $58,816, while those with high school diploma education have the smallest earnings of $27,424.
| Educational Attainment | Male Income | Female Income |
| Less than High School | $33,679 | $27,689 |
| High School Diploma | $45,877 | $27,424 |
| College or Associate's Degree | $50,669 | $32,493 |
| Bachelor's Degree | $93,407 | $46,648 |
| Graduate Degree | $110,825 | $58,816 |
| Total | $57,420 | $35,192 |
Family Income in Iredell County
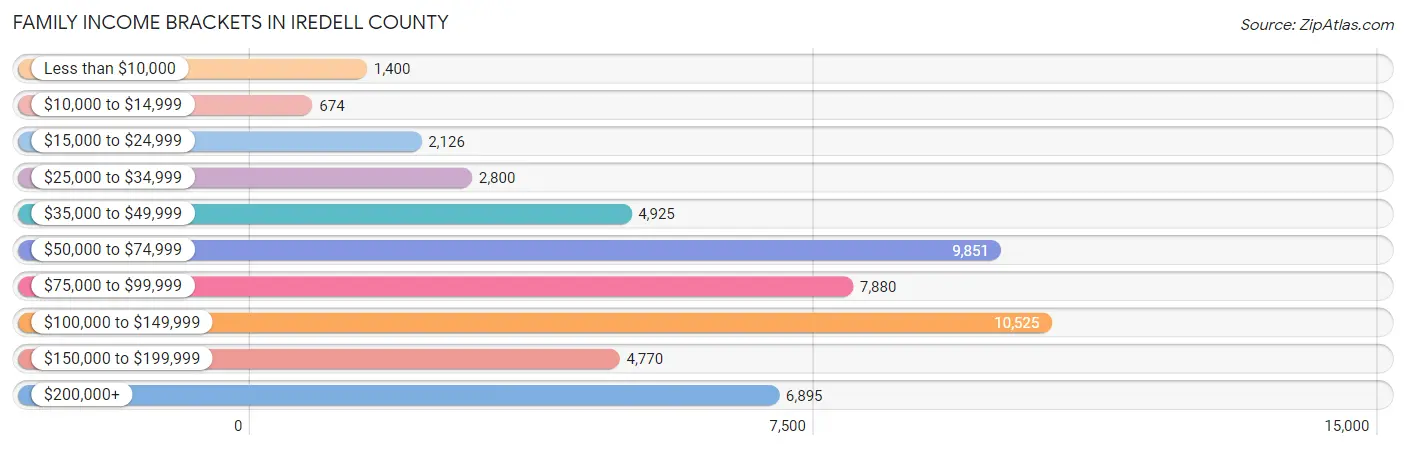
Family Income Brackets in Iredell County
According to the Iredell County family income data, there are 10,525 families falling into the $100,000 to $149,999 income range, which is the most common income bracket and makes up 20.3% of all families. Conversely, the $10,000 to $14,999 income bracket is the least frequent group with only 674 families (1.3%) belonging to this category.
| Income Bracket | # Families | % Families |
| Less than $10,000 | 1,400 | 2.7% |
| $10,000 to $14,999 | 674 | 1.3% |
| $15,000 to $24,999 | 2,126 | 4.1% |
| $25,000 to $34,999 | 2,800 | 5.4% |
| $35,000 to $49,999 | 4,925 | 9.5% |
| $50,000 to $74,999 | 9,851 | 19.0% |
| $75,000 to $99,999 | 7,880 | 15.2% |
| $100,000 to $149,999 | 10,525 | 20.3% |
| $150,000 to $199,999 | 4,770 | 9.2% |
| $200,000+ | 6,895 | 13.3% |
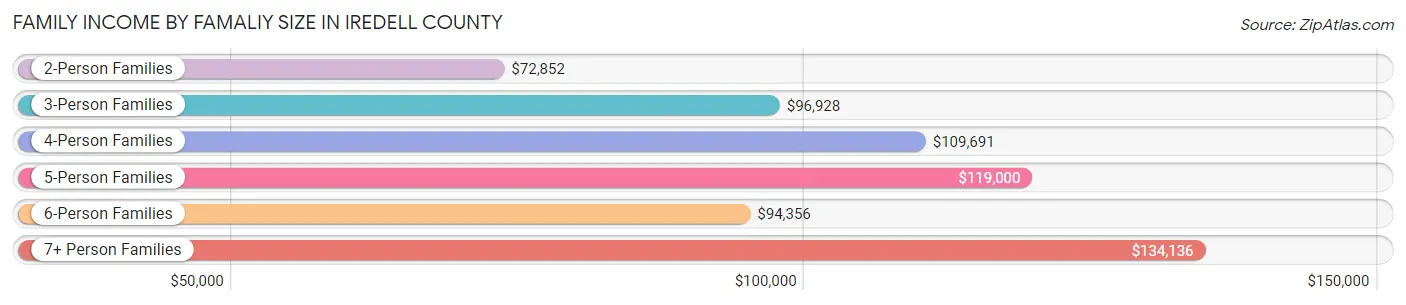
Family Income by Famaliy Size in Iredell County
7+ person families (582 | 1.1%) account for the highest median family income in Iredell County with $134,136 per family, while 2-person families (25,384 | 49.0%) have the highest median income of $36,426 per family member.
| Income Bracket | # Families | Median Income |
| 2-Person Families | 25,384 (49.0%) | $72,852 |
| 3-Person Families | 10,818 (20.9%) | $96,928 |
| 4-Person Families | 9,470 (18.3%) | $109,691 |
| 5-Person Families | 4,286 (8.3%) | $119,000 |
| 6-Person Families | 1,305 (2.5%) | $94,356 |
| 7+ Person Families | 582 (1.1%) | $134,136 |
| Total | 51,845 (100.0%) | $86,894 |
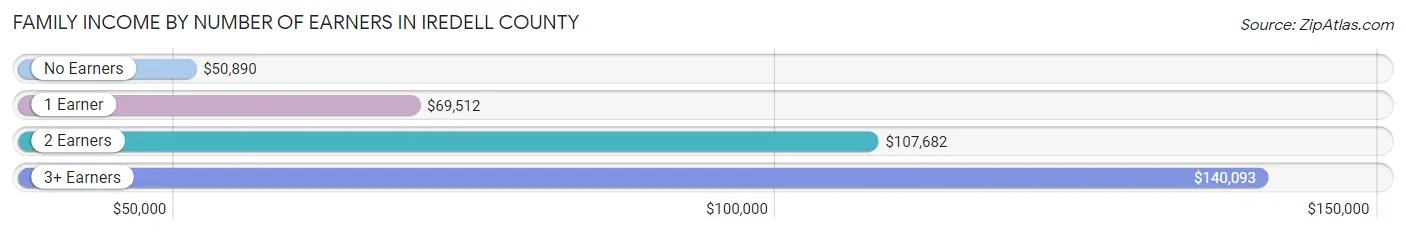
Family Income by Number of Earners in Iredell County
The median family income in Iredell County is $86,894, with families comprising 3+ earners (6,060) having the highest median family income of $140,093, while families with no earners (7,350) have the lowest median family income of $50,890, accounting for 11.7% and 14.2% of families, respectively.
| Number of Earners | # Families | Median Income |
| No Earners | 7,350 (14.2%) | $50,890 |
| 1 Earner | 16,689 (32.2%) | $69,512 |
| 2 Earners | 21,746 (41.9%) | $107,682 |
| 3+ Earners | 6,060 (11.7%) | $140,093 |
| Total | 51,845 (100.0%) | $86,894 |
Household Income in Iredell County
Household Income Brackets in Iredell County
With 13,519 households falling in the category, the $50,000 to $74,999 income range is the most frequent in Iredell County, accounting for 18.7% of all households. In contrast, only 2,024 households (2.8%) fall into the $10,000 to $14,999 income bracket, making it the least populous group.
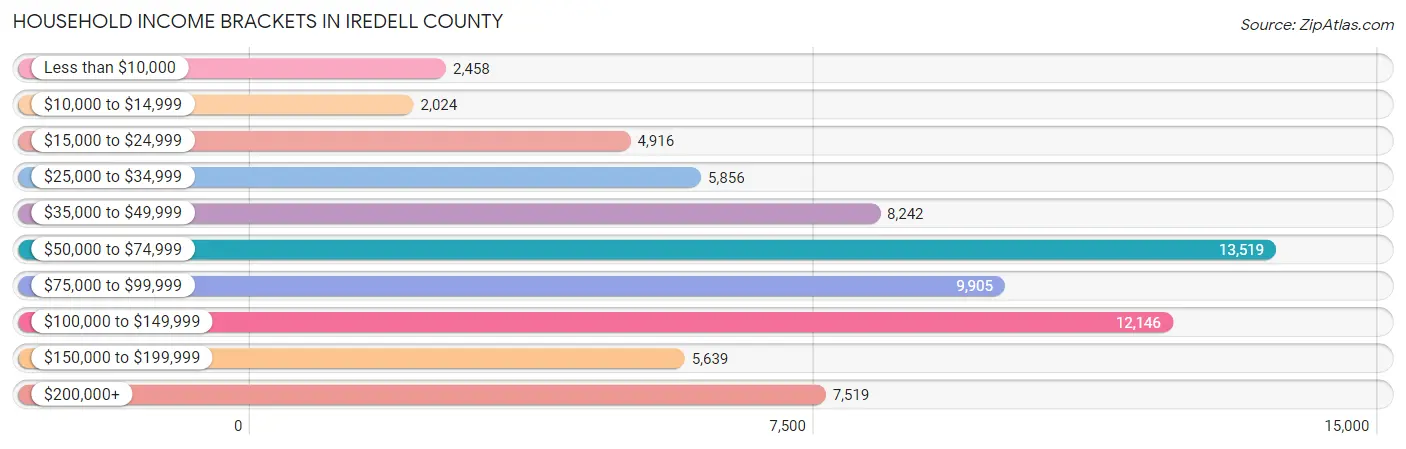
| Income Bracket | # Households | % Households |
| Less than $10,000 | 2,458 | 3.4% |
| $10,000 to $14,999 | 2,024 | 2.8% |
| $15,000 to $24,999 | 4,916 | 6.8% |
| $25,000 to $34,999 | 5,856 | 8.1% |
| $35,000 to $49,999 | 8,242 | 11.4% |
| $50,000 to $74,999 | 13,519 | 18.7% |
| $75,000 to $99,999 | 9,905 | 13.7% |
| $100,000 to $149,999 | 12,146 | 16.8% |
| $150,000 to $199,999 | 5,639 | 7.8% |
| $200,000+ | 7,519 | 10.4% |
Household Income by Householder Age in Iredell County
The median household income in Iredell County is $73,103, with the highest median household income of $88,616 found in the 45 to 64 years age bracket for the primary householder. A total of 29,730 households (41.1%) fall into this category. Meanwhile, the 15 to 24 years age bracket for the primary householder has the lowest median household income of $46,042, with 1,998 households (2.8%) in this group.
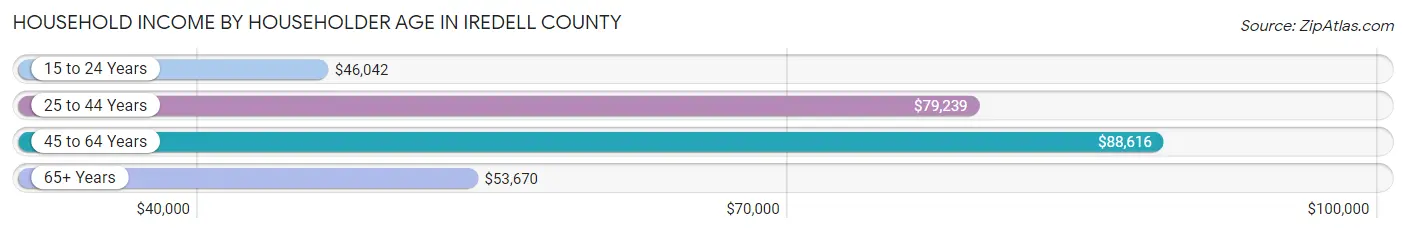
| Income Bracket | # Households | Median Income |
| 15 to 24 Years | 1,998 (2.8%) | $46,042 |
| 25 to 44 Years | 21,589 (29.9%) | $79,239 |
| 45 to 64 Years | 29,730 (41.1%) | $88,616 |
| 65+ Years | 18,979 (26.3%) | $53,670 |
| Total | 72,296 (100.0%) | $73,103 |
Poverty in Iredell County
Income Below Poverty by Sex and Age in Iredell County
With 8.4% poverty level for males and 10.5% for females among the residents of Iredell County, 5 year old males and 25 to 34 year old females are the most vulnerable to poverty, with 239 males (23.2%) and 1,792 females (16.2%) in their respective age groups living below the poverty level.
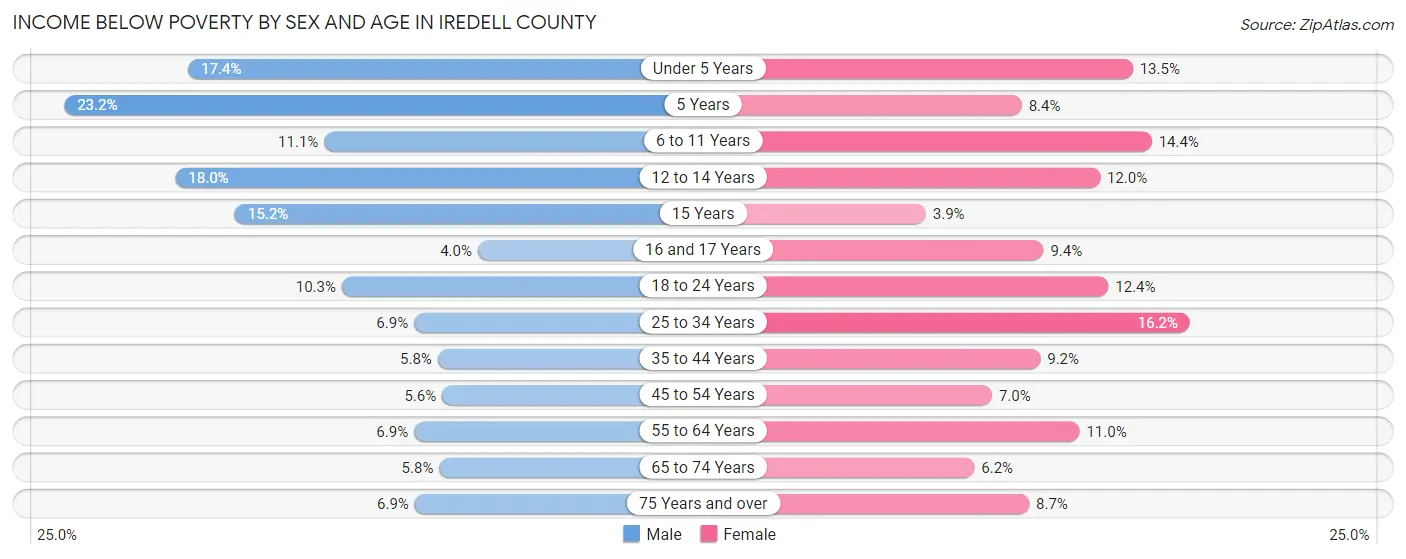
| Age Bracket | Male | Female |
| Under 5 Years | 876 (17.4%) | 644 (13.5%) |
| 5 Years | 239 (23.2%) | 70 (8.4%) |
| 6 to 11 Years | 854 (11.1%) | 984 (14.4%) |
| 12 to 14 Years | 620 (18.0%) | 442 (12.0%) |
| 15 Years | 234 (15.2%) | 55 (3.9%) |
| 16 and 17 Years | 103 (4.0%) | 240 (9.4%) |
| 18 to 24 Years | 806 (10.3%) | 900 (12.4%) |
| 25 to 34 Years | 788 (6.9%) | 1,792 (16.2%) |
| 35 to 44 Years | 673 (5.8%) | 1,096 (9.2%) |
| 45 to 54 Years | 758 (5.6%) | 949 (7.0%) |
| 55 to 64 Years | 886 (6.9%) | 1,443 (11.0%) |
| 65 to 74 Years | 510 (5.8%) | 577 (6.1%) |
| 75 Years and over | 336 (6.9%) | 630 (8.7%) |
| Total | 7,683 (8.4%) | 9,822 (10.5%) |
Income Above Poverty by Sex and Age in Iredell County
According to the poverty statistics in Iredell County, males aged 16 and 17 years and females aged 15 years are the age groups that are most secure financially, with 96.0% of males and 96.1% of females in these age groups living above the poverty line.
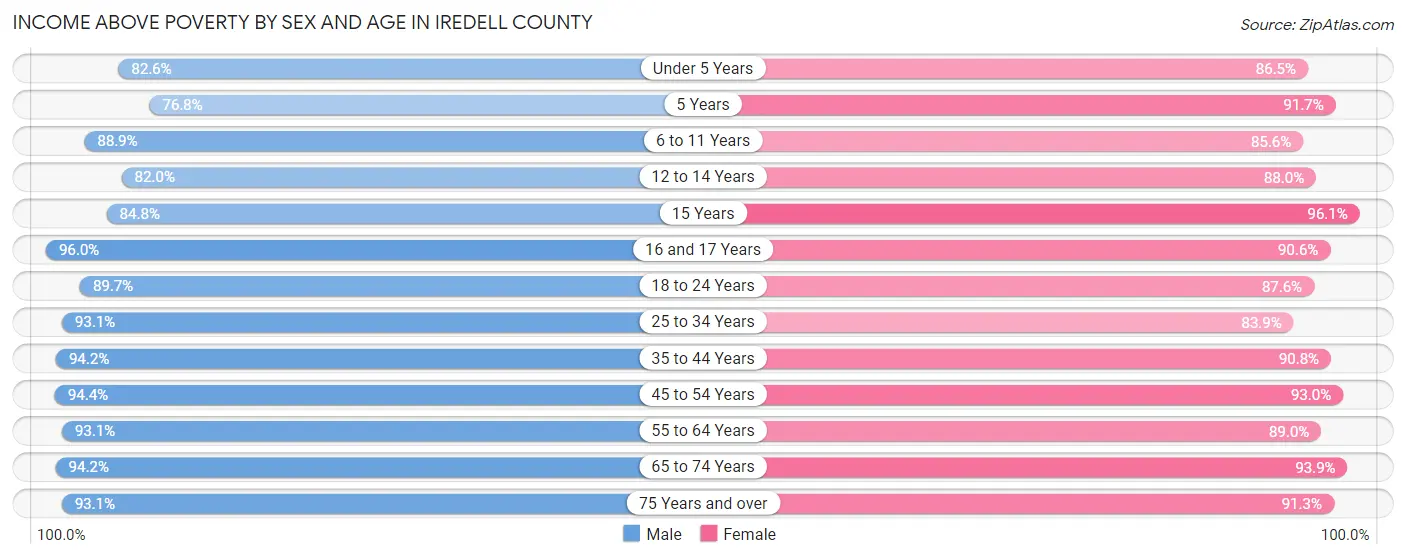
| Age Bracket | Male | Female |
| Under 5 Years | 4,155 (82.6%) | 4,126 (86.5%) |
| 5 Years | 793 (76.8%) | 768 (91.6%) |
| 6 to 11 Years | 6,840 (88.9%) | 5,861 (85.6%) |
| 12 to 14 Years | 2,825 (82.0%) | 3,247 (88.0%) |
| 15 Years | 1,301 (84.8%) | 1,354 (96.1%) |
| 16 and 17 Years | 2,493 (96.0%) | 2,325 (90.6%) |
| 18 to 24 Years | 7,032 (89.7%) | 6,375 (87.6%) |
| 25 to 34 Years | 10,580 (93.1%) | 9,304 (83.9%) |
| 35 to 44 Years | 10,861 (94.2%) | 10,798 (90.8%) |
| 45 to 54 Years | 12,717 (94.4%) | 12,676 (93.0%) |
| 55 to 64 Years | 11,902 (93.1%) | 11,645 (89.0%) |
| 65 to 74 Years | 8,337 (94.2%) | 8,806 (93.9%) |
| 75 Years and over | 4,535 (93.1%) | 6,621 (91.3%) |
| Total | 84,371 (91.6%) | 83,906 (89.5%) |
Income Below Poverty Among Married-Couple Families in Iredell County
The poverty statistics for married-couple families in Iredell County show that 4.0% or 1,577 of the total 39,742 families live below the poverty line. Families with 3 or 4 children have the highest poverty rate of 10.8%, comprising of 386 families. On the other hand, families with 5 or more children have the lowest poverty rate of 0.0%, which includes 0 families.
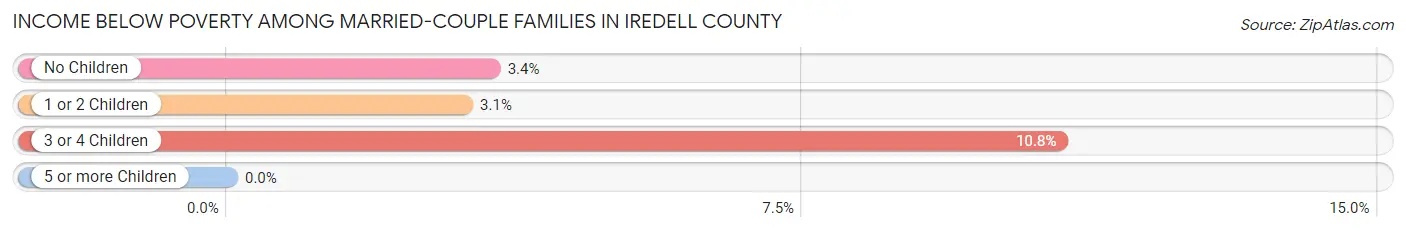
| Children | Above Poverty | Below Poverty |
| No Children | 22,351 (96.6%) | 795 (3.4%) |
| 1 or 2 Children | 12,491 (96.9%) | 396 (3.1%) |
| 3 or 4 Children | 3,176 (89.2%) | 386 (10.8%) |
| 5 or more Children | 147 (100.0%) | 0 (0.0%) |
| Total | 38,165 (96.0%) | 1,577 (4.0%) |
Income Below Poverty Among Single-Parent Households in Iredell County
According to the poverty data in Iredell County, 9.2% or 302 single-father households and 23.4% or 2,065 single-mother households are living below the poverty line. Among single-father households, those with 1 or 2 children have the highest poverty rate, with 210 households (12.8%) experiencing poverty. Likewise, among single-mother households, those with 3 or 4 children have the highest poverty rate, with 367 households (55.3%) falling below the poverty line.
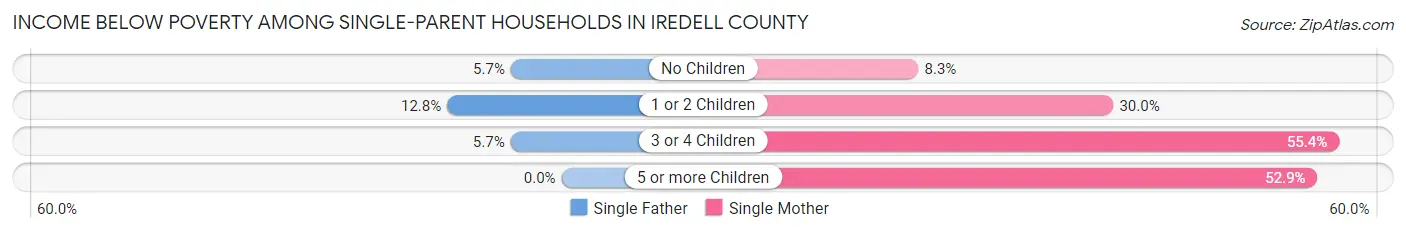
| Children | Single Father | Single Mother |
| No Children | 77 (5.7%) | 289 (8.3%) |
| 1 or 2 Children | 210 (12.8%) | 1,400 (30.0%) |
| 3 or 4 Children | 15 (5.7%) | 367 (55.3%) |
| 5 or more Children | 0 (0.0%) | 9 (52.9%) |
| Total | 302 (9.2%) | 2,065 (23.4%) |
Income Below Poverty Among Married-Couple vs Single-Parent Households in Iredell County
The poverty data for Iredell County shows that 1,577 of the married-couple family households (4.0%) and 2,367 of the single-parent households (19.6%) are living below the poverty level. Within the married-couple family households, those with 3 or 4 children have the highest poverty rate, with 386 households (10.8%) falling below the poverty line. Among the single-parent households, those with 5 or more children have the highest poverty rate, with 9 household (52.9%) living below poverty.
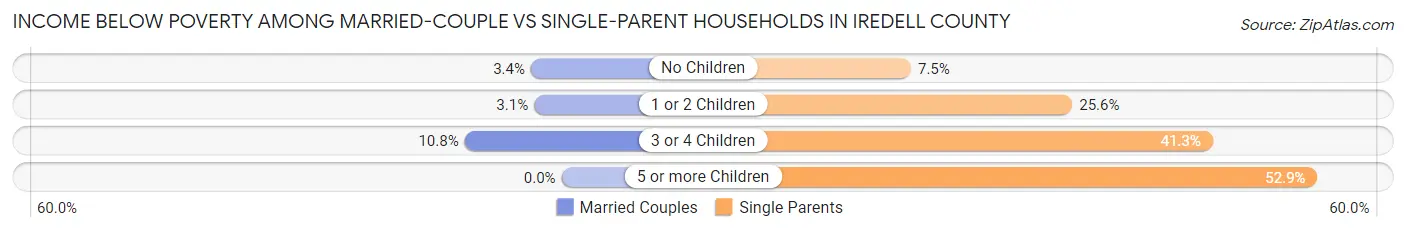
| Children | Married-Couple Families | Single-Parent Households |
| No Children | 795 (3.4%) | 366 (7.5%) |
| 1 or 2 Children | 396 (3.1%) | 1,610 (25.6%) |
| 3 or 4 Children | 386 (10.8%) | 382 (41.2%) |
| 5 or more Children | 0 (0.0%) | 9 (52.9%) |
| Total | 1,577 (4.0%) | 2,367 (19.6%) |
Employment Characteristics in Iredell County
Employment by Class of Employer in Iredell County
Among the 90,895 employed individuals in Iredell County, private company employees (67,407 | 74.2%), not-for-profit organizations (5,586 | 6.1%), and self-employed (not incorporated) (5,409 | 5.9%) make up the most common classes of employment.
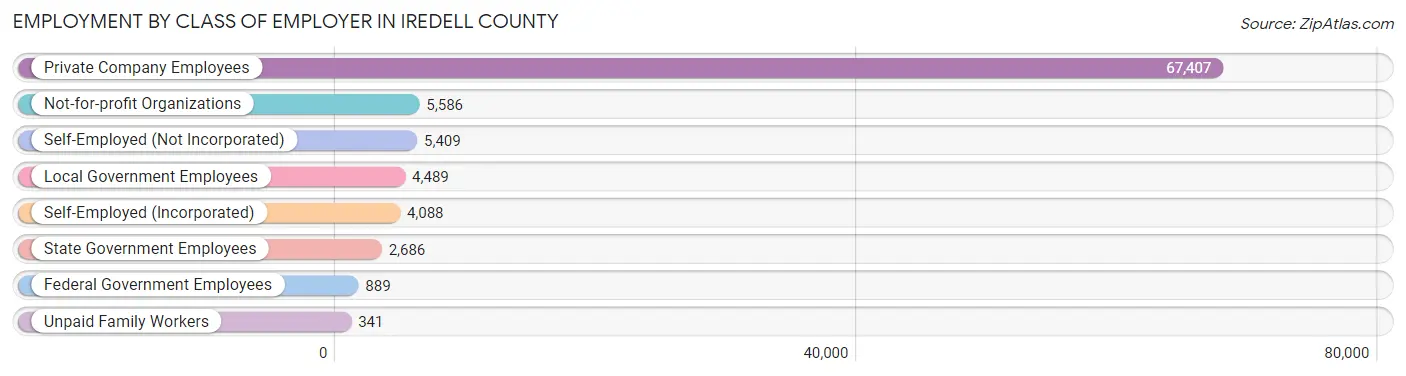
| Employer Class | # Employees | % Employees |
| Private Company Employees | 67,407 | 74.2% |
| Self-Employed (Incorporated) | 4,088 | 4.5% |
| Self-Employed (Not Incorporated) | 5,409 | 5.9% |
| Not-for-profit Organizations | 5,586 | 6.1% |
| Local Government Employees | 4,489 | 4.9% |
| State Government Employees | 2,686 | 3.0% |
| Federal Government Employees | 889 | 1.0% |
| Unpaid Family Workers | 341 | 0.4% |
| Total | 90,895 | 100.0% |
Employment Status by Age in Iredell County
According to the labor force statistics for Iredell County, out of the total population over 16 years of age (150,816), 64.9% or 97,880 individuals are in the labor force, with 4.6% or 4,502 of them unemployed. The age group with the highest labor force participation rate is 25 to 29 years, with 84.5% or 9,625 individuals in the labor force. Within the labor force, the 16 to 19 years age range has the highest percentage of unemployed individuals, with 18.0% or 847 of them being unemployed.
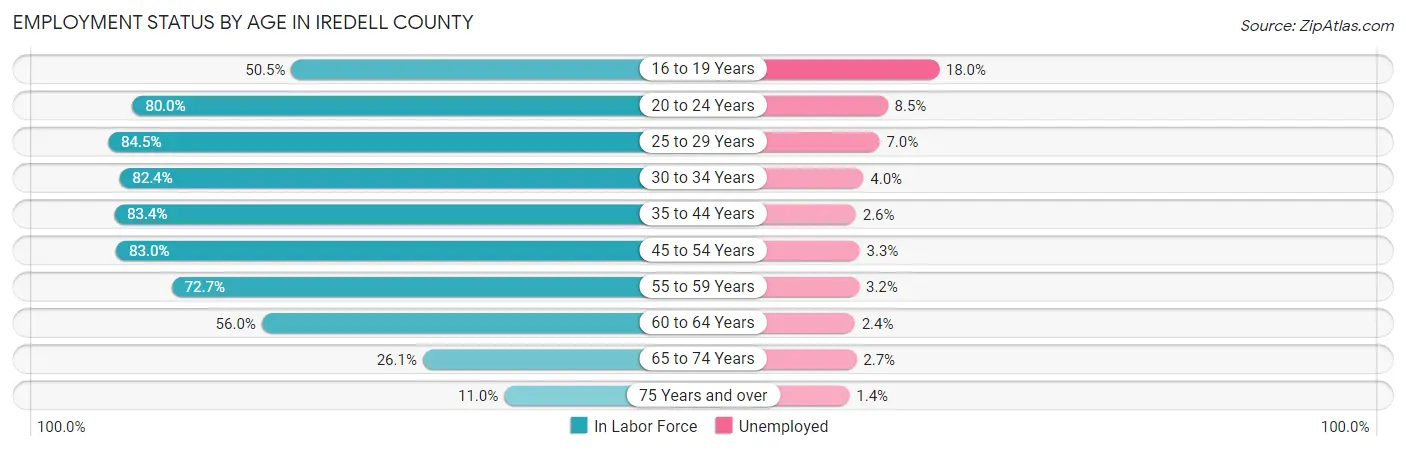
| Age Bracket | In Labor Force | Unemployed |
| 16 to 19 Years | 4,706 (50.5%) | 847 (18.0%) |
| 20 to 24 Years | 8,918 (80.0%) | 758 (8.5%) |
| 25 to 29 Years | 9,625 (84.5%) | 674 (7.0%) |
| 30 to 34 Years | 9,307 (82.4%) | 372 (4.0%) |
| 35 to 44 Years | 19,672 (83.4%) | 511 (2.6%) |
| 45 to 54 Years | 22,612 (83.0%) | 746 (3.3%) |
| 55 to 59 Years | 9,806 (72.7%) | 314 (3.2%) |
| 60 to 64 Years | 7,087 (56.0%) | 170 (2.4%) |
| 65 to 74 Years | 4,782 (26.1%) | 129 (2.7%) |
| 75 Years and over | 1,360 (11.0%) | 19 (1.4%) |
| Total | 97,880 (64.9%) | 4,502 (4.6%) |
Employment Status by Educational Attainment in Iredell County
According to labor force statistics for Iredell County, 78.4% of individuals (78,133) out of the total population between 25 and 64 years of age (99,659) are in the labor force, with 3.5% or 2,735 of them being unemployed. The group with the highest labor force participation rate are those with the educational attainment of bachelor's degree or higher, with 85.6% or 29,345 individuals in the labor force. Within the labor force, individuals with high school diploma education have the highest percentage of unemployment, with 4.7% or 843 of them being unemployed.
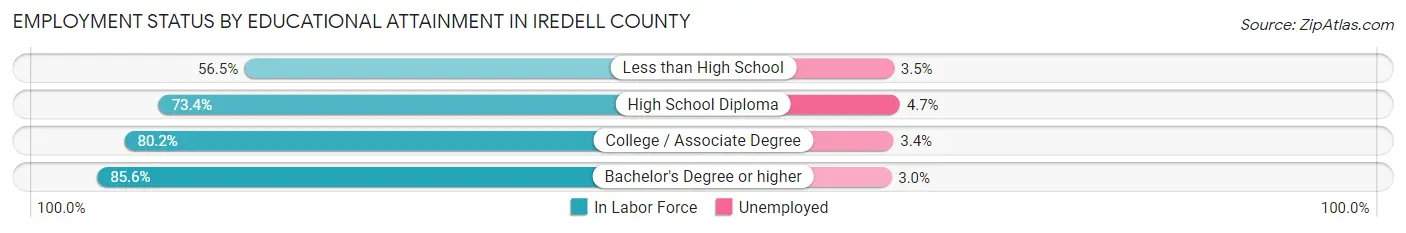
| Educational Attainment | In Labor Force | Unemployed |
| Less than High School | 4,833 (56.5%) | 299 (3.5%) |
| High School Diploma | 17,941 (73.4%) | 1,149 (4.7%) |
| College / Associate Degree | 25,969 (80.2%) | 1,101 (3.4%) |
| Bachelor's Degree or higher | 29,345 (85.6%) | 1,028 (3.0%) |
| Total | 78,133 (78.4%) | 3,488 (3.5%) |
Employment Occupations by Sex in Iredell County
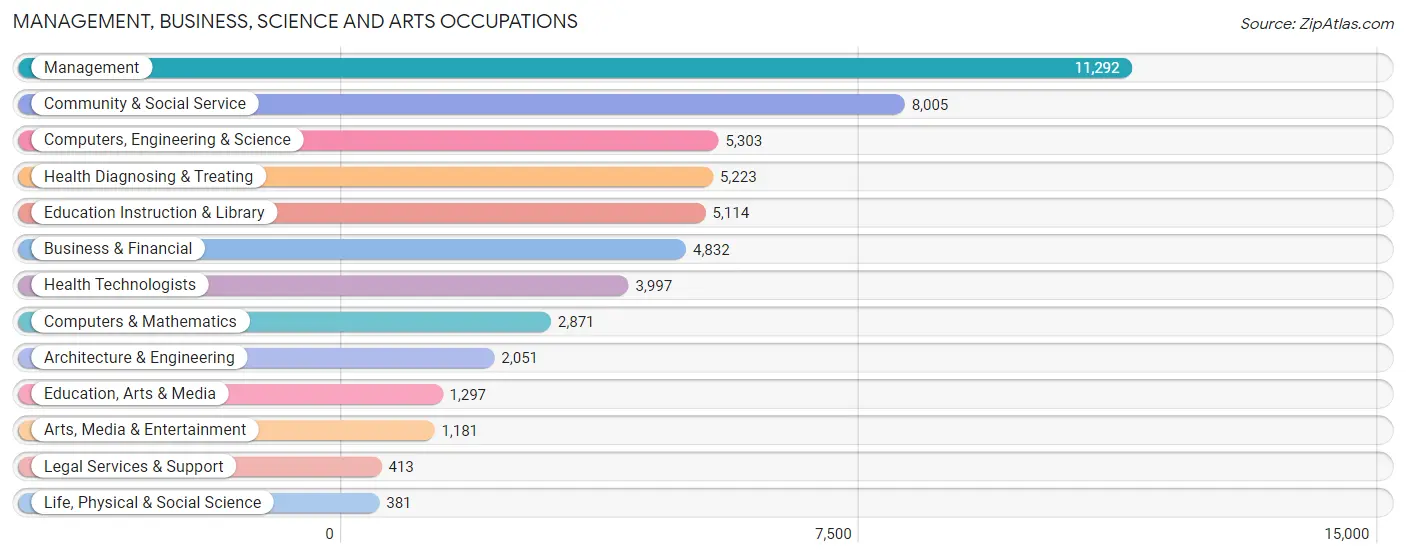
Management, Business, Science and Arts Occupations
The most common Management, Business, Science and Arts occupations in Iredell County are Management (11,292 | 12.1%), Community & Social Service (8,005 | 8.6%), Computers, Engineering & Science (5,303 | 5.7%), Health Diagnosing & Treating (5,223 | 5.6%), and Education Instruction & Library (5,114 | 5.5%).
Management, Business, Science and Arts Occupations by Sex
Within the Management, Business, Science and Arts occupations in Iredell County, the most male-oriented occupations are Architecture & Engineering (91.3%), Computers, Engineering & Science (84.0%), and Computers & Mathematics (82.7%), while the most female-oriented occupations are Education Instruction & Library (84.1%), Legal Services & Support (74.8%), and Community & Social Service (74.0%).
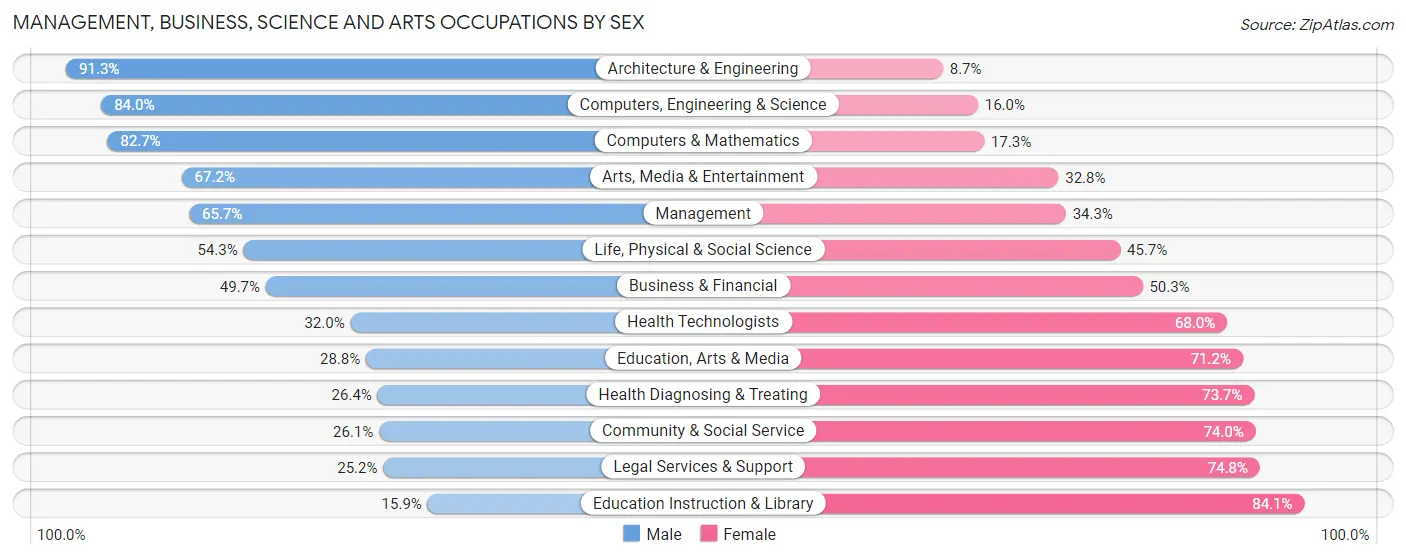
| Occupation | Male | Female |
| Management | 7,417 (65.7%) | 3,875 (34.3%) |
| Business & Financial | 2,400 (49.7%) | 2,432 (50.3%) |
| Computers, Engineering & Science | 4,455 (84.0%) | 848 (16.0%) |
| Computers & Mathematics | 2,375 (82.7%) | 496 (17.3%) |
| Architecture & Engineering | 1,873 (91.3%) | 178 (8.7%) |
| Life, Physical & Social Science | 207 (54.3%) | 174 (45.7%) |
| Community & Social Service | 2,085 (26.1%) | 5,920 (74.0%) |
| Education, Arts & Media | 373 (28.8%) | 924 (71.2%) |
| Legal Services & Support | 104 (25.2%) | 309 (74.8%) |
| Education Instruction & Library | 814 (15.9%) | 4,300 (84.1%) |
| Arts, Media & Entertainment | 794 (67.2%) | 387 (32.8%) |
| Health Diagnosing & Treating | 1,376 (26.4%) | 3,847 (73.7%) |
| Health Technologists | 1,280 (32.0%) | 2,717 (68.0%) |
| Total (Category) | 17,733 (51.2%) | 16,922 (48.8%) |
| Total (Overall) | 50,728 (54.4%) | 42,555 (45.6%) |
Services Occupations
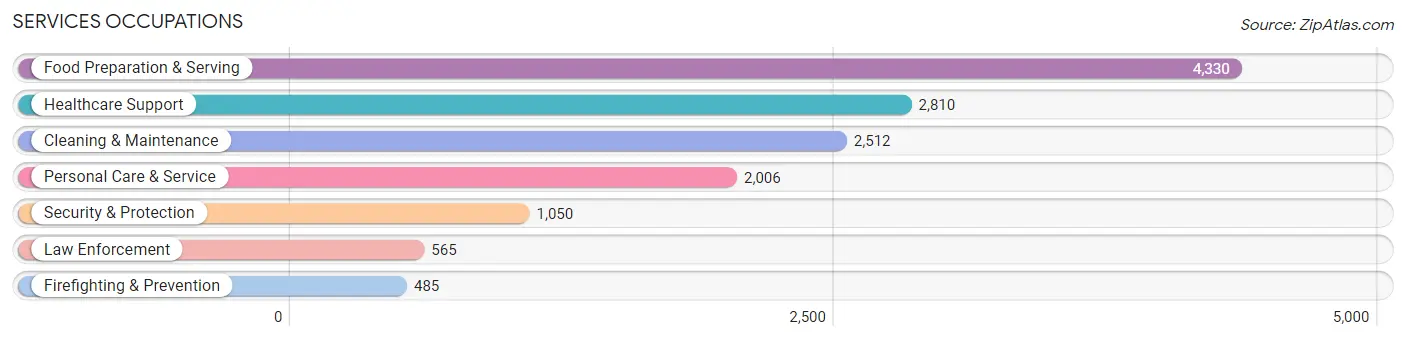
The most common Services occupations in Iredell County are Food Preparation & Serving (4,330 | 4.6%), Healthcare Support (2,810 | 3.0%), Cleaning & Maintenance (2,512 | 2.7%), Personal Care & Service (2,006 | 2.1%), and Security & Protection (1,050 | 1.1%).
Services Occupations by Sex
Within the Services occupations in Iredell County, the most male-oriented occupations are Law Enforcement (99.7%), Security & Protection (92.4%), and Firefighting & Prevention (83.9%), while the most female-oriented occupations are Healthcare Support (90.6%), Personal Care & Service (77.2%), and Food Preparation & Serving (61.7%).
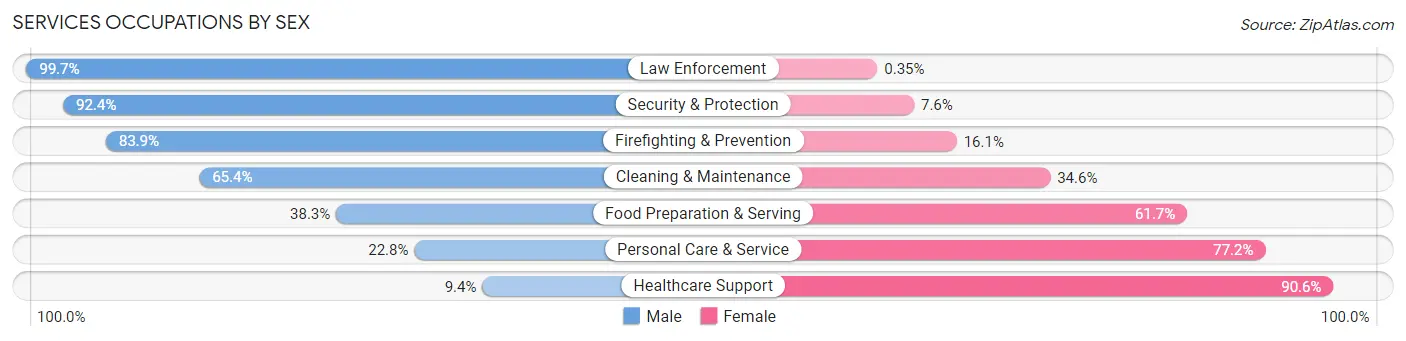
| Occupation | Male | Female |
| Healthcare Support | 263 (9.4%) | 2,547 (90.6%) |
| Security & Protection | 970 (92.4%) | 80 (7.6%) |
| Firefighting & Prevention | 407 (83.9%) | 78 (16.1%) |
| Law Enforcement | 563 (99.7%) | 2 (0.4%) |
| Food Preparation & Serving | 1,659 (38.3%) | 2,671 (61.7%) |
| Cleaning & Maintenance | 1,643 (65.4%) | 869 (34.6%) |
| Personal Care & Service | 458 (22.8%) | 1,548 (77.2%) |
| Total (Category) | 4,993 (39.3%) | 7,715 (60.7%) |
| Total (Overall) | 50,728 (54.4%) | 42,555 (45.6%) |
Sales and Office Occupations
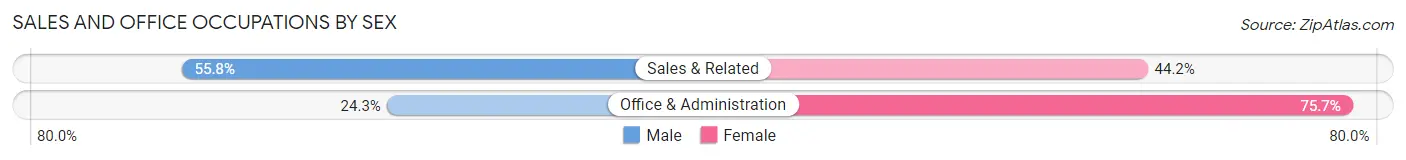
The most common Sales and Office occupations in Iredell County are Sales & Related (10,991 | 11.8%), and Office & Administration (10,413 | 11.2%).

Sales and Office Occupations by Sex
| Occupation | Male | Female |
| Sales & Related | 6,137 (55.8%) | 4,854 (44.2%) |
| Office & Administration | 2,530 (24.3%) | 7,883 (75.7%) |
| Total (Category) | 8,667 (40.5%) | 12,737 (59.5%) |
| Total (Overall) | 50,728 (54.4%) | 42,555 (45.6%) |
Natural Resources, Construction and Maintenance Occupations
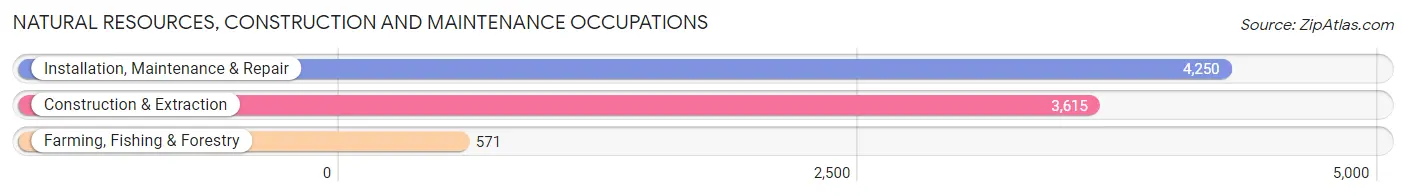
The most common Natural Resources, Construction and Maintenance occupations in Iredell County are Installation, Maintenance & Repair (4,250 | 4.6%), Construction & Extraction (3,615 | 3.9%), and Farming, Fishing & Forestry (571 | 0.6%).
Natural Resources, Construction and Maintenance Occupations by Sex
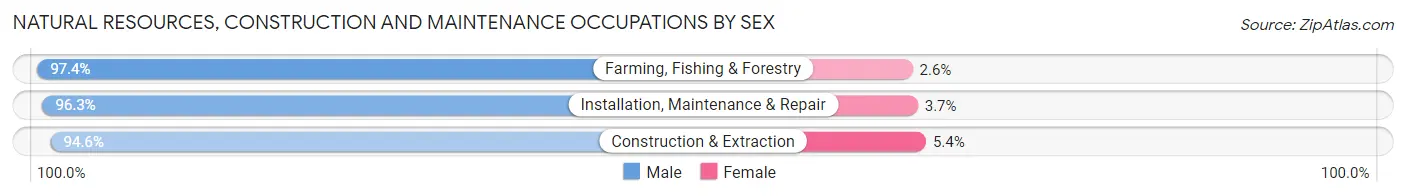
| Occupation | Male | Female |
| Farming, Fishing & Forestry | 556 (97.4%) | 15 (2.6%) |
| Construction & Extraction | 3,419 (94.6%) | 196 (5.4%) |
| Installation, Maintenance & Repair | 4,092 (96.3%) | 158 (3.7%) |
| Total (Category) | 8,067 (95.6%) | 369 (4.4%) |
| Total (Overall) | 50,728 (54.4%) | 42,555 (45.6%) |
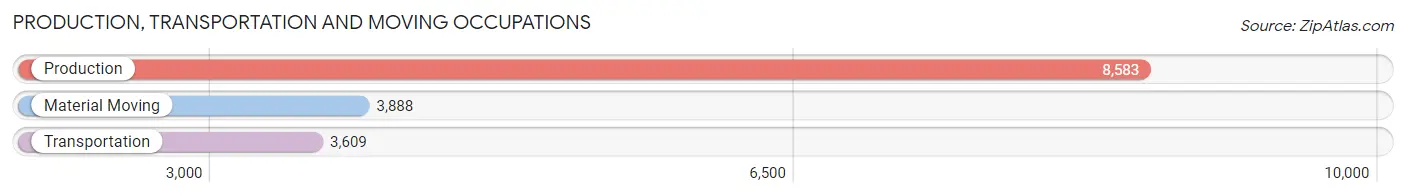
Production, Transportation and Moving Occupations
The most common Production, Transportation and Moving occupations in Iredell County are Production (8,583 | 9.2%), Material Moving (3,888 | 4.2%), and Transportation (3,609 | 3.9%).
Production, Transportation and Moving Occupations by Sex
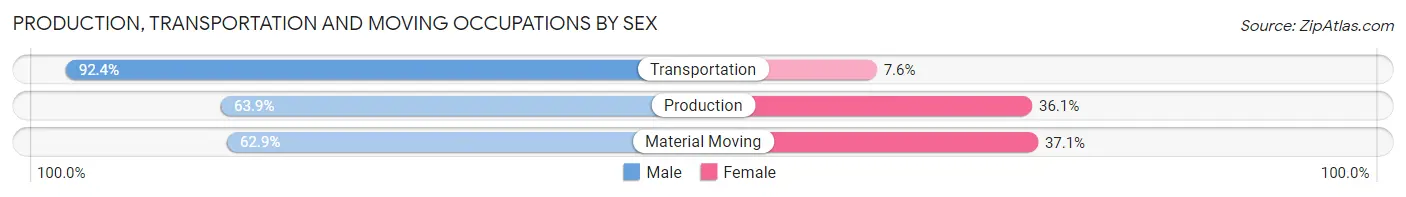
| Occupation | Male | Female |
| Production | 5,488 (63.9%) | 3,095 (36.1%) |
| Transportation | 3,336 (92.4%) | 273 (7.6%) |
| Material Moving | 2,444 (62.9%) | 1,444 (37.1%) |
| Total (Category) | 11,268 (70.1%) | 4,812 (29.9%) |
| Total (Overall) | 50,728 (54.4%) | 42,555 (45.6%) |
Employment Industries by Sex in Iredell County
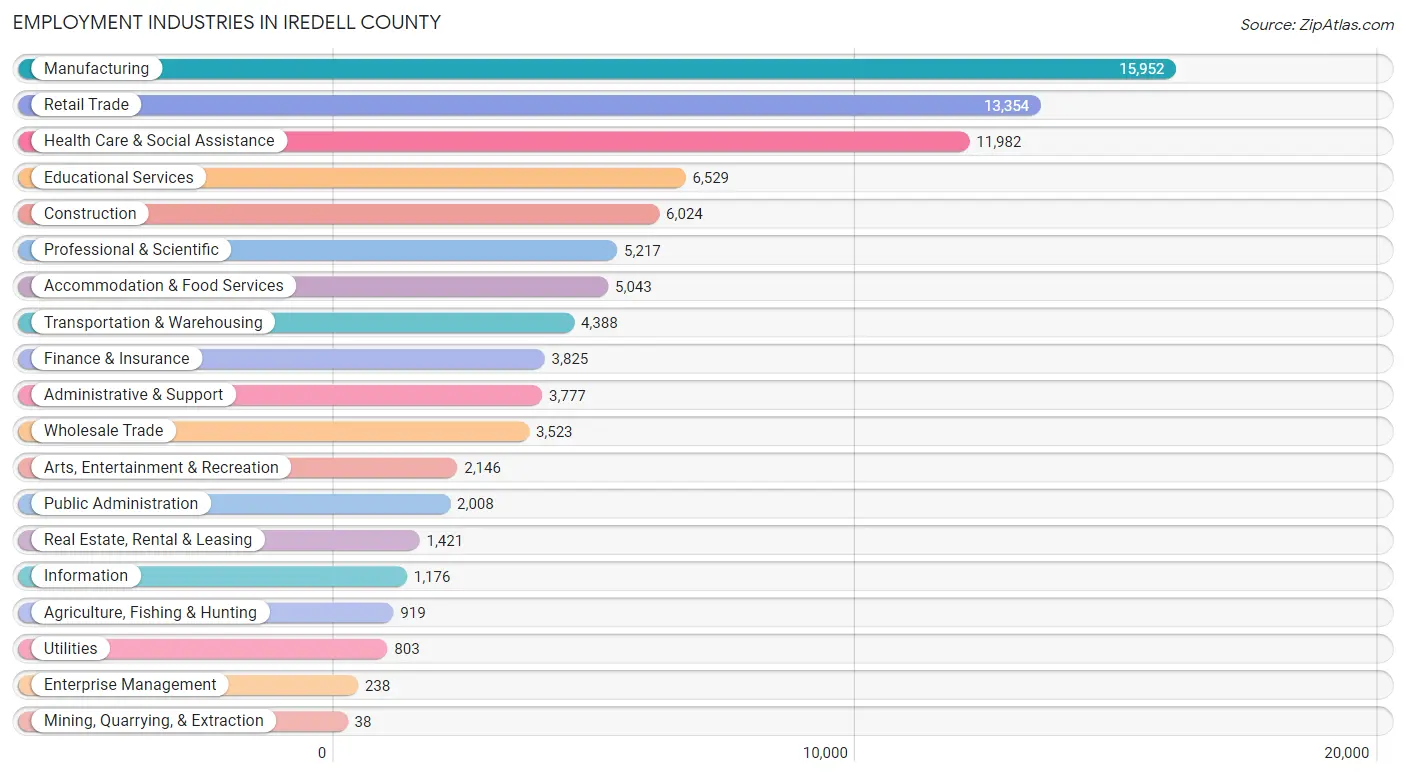
Employment Industries in Iredell County
The major employment industries in Iredell County include Manufacturing (15,952 | 17.1%), Retail Trade (13,354 | 14.3%), Health Care & Social Assistance (11,982 | 12.8%), Educational Services (6,529 | 7.0%), and Construction (6,024 | 6.5%).
Employment Industries by Sex in Iredell County
The Iredell County industries that see more men than women are Utilities (93.1%), Agriculture, Fishing & Hunting (87.6%), and Construction (87.4%), whereas the industries that tend to have a higher number of women are Health Care & Social Assistance (78.6%), Educational Services (76.7%), and Accommodation & Food Services (59.3%).
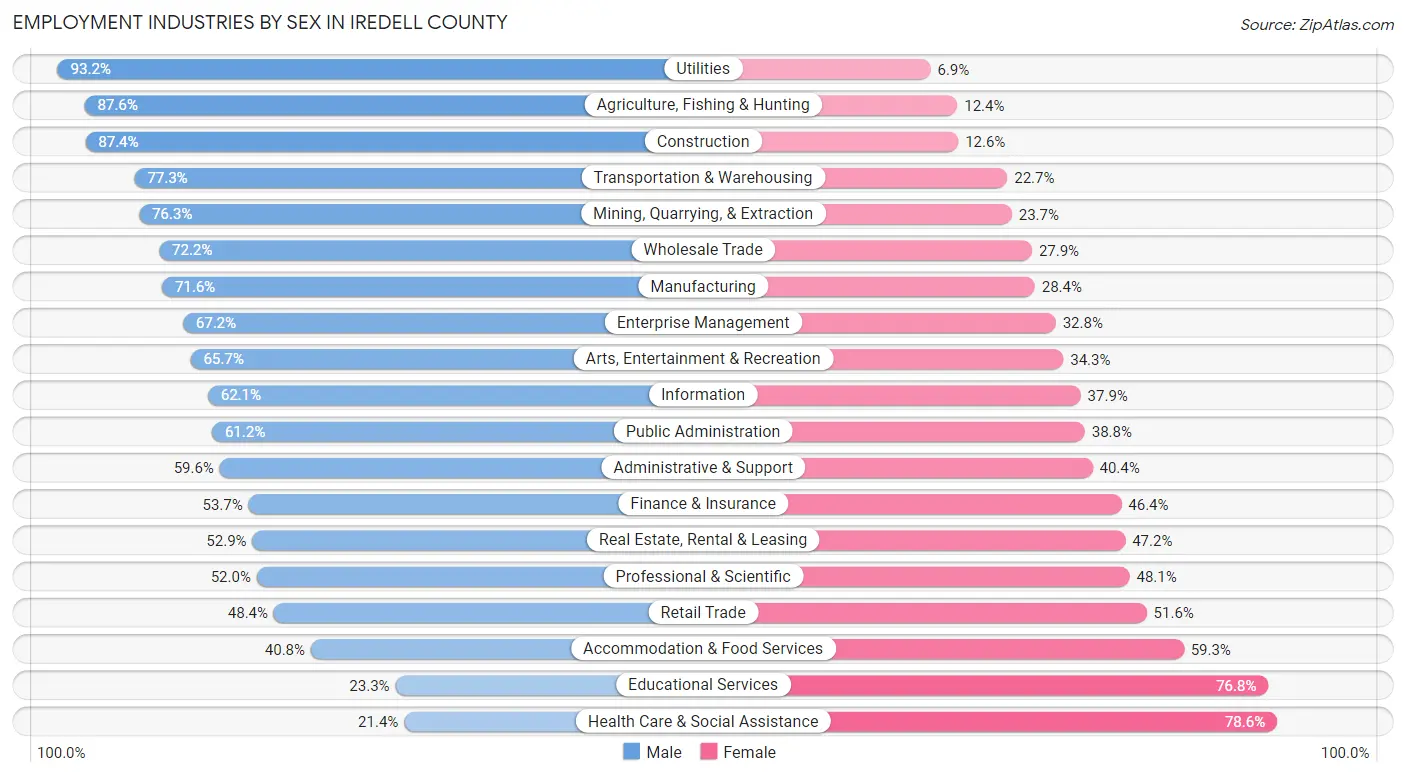
| Industry | Male | Female |
| Agriculture, Fishing & Hunting | 805 (87.6%) | 114 (12.4%) |
| Mining, Quarrying, & Extraction | 29 (76.3%) | 9 (23.7%) |
| Construction | 5,266 (87.4%) | 758 (12.6%) |
| Manufacturing | 11,415 (71.6%) | 4,537 (28.4%) |
| Wholesale Trade | 2,542 (72.2%) | 981 (27.9%) |
| Retail Trade | 6,465 (48.4%) | 6,889 (51.6%) |
| Transportation & Warehousing | 3,390 (77.3%) | 998 (22.7%) |
| Utilities | 748 (93.1%) | 55 (6.9%) |
| Information | 730 (62.1%) | 446 (37.9%) |
| Finance & Insurance | 2,052 (53.6%) | 1,773 (46.4%) |
| Real Estate, Rental & Leasing | 751 (52.8%) | 670 (47.1%) |
| Professional & Scientific | 2,710 (51.9%) | 2,507 (48.0%) |
| Enterprise Management | 160 (67.2%) | 78 (32.8%) |
| Administrative & Support | 2,252 (59.6%) | 1,525 (40.4%) |
| Educational Services | 1,518 (23.3%) | 5,011 (76.7%) |
| Health Care & Social Assistance | 2,569 (21.4%) | 9,413 (78.6%) |
| Arts, Entertainment & Recreation | 1,409 (65.7%) | 737 (34.3%) |
| Accommodation & Food Services | 2,055 (40.7%) | 2,988 (59.3%) |
| Public Administration | 1,229 (61.2%) | 779 (38.8%) |
| Total | 50,728 (54.4%) | 42,555 (45.6%) |
Education in Iredell County
School Enrollment in Iredell County
The most common levels of schooling among the 41,939 students in Iredell County are high school (10,336 | 24.6%), middle school (10,152 | 24.2%), and elementary school (8,800 | 21.0%).
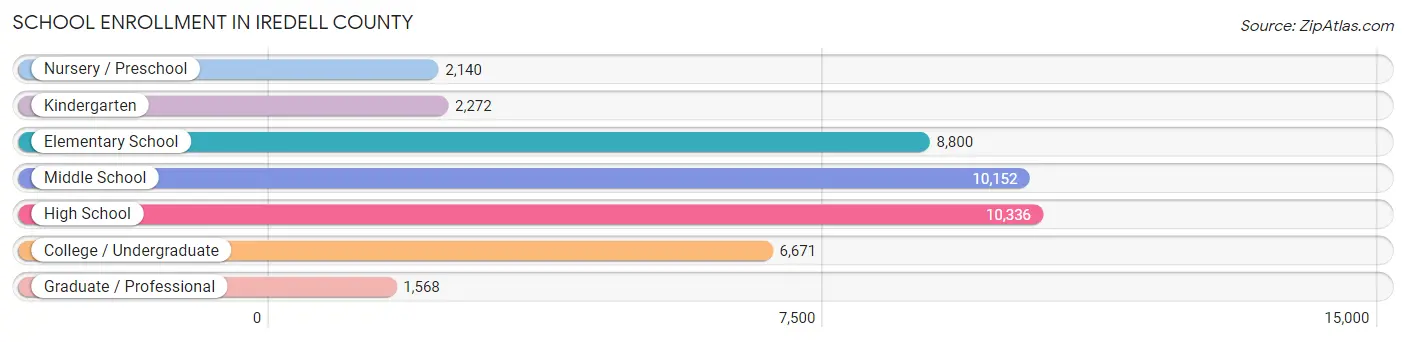
| School Level | # Students | % Students |
| Nursery / Preschool | 2,140 | 5.1% |
| Kindergarten | 2,272 | 5.4% |
| Elementary School | 8,800 | 21.0% |
| Middle School | 10,152 | 24.2% |
| High School | 10,336 | 24.6% |
| College / Undergraduate | 6,671 | 15.9% |
| Graduate / Professional | 1,568 | 3.7% |
| Total | 41,939 | 100.0% |
School Enrollment by Age by Funding Source in Iredell County
Out of a total of 41,939 students who are enrolled in schools in Iredell County, 6,752 (16.1%) attend a private institution, while the remaining 35,187 (83.9%) are enrolled in public schools. The age group of 3 to 4 year olds has the highest likelihood of being enrolled in private schools, with 841 (52.0% in the age bracket) enrolled. Conversely, the age group of 15 to 17 year olds has the lowest likelihood of being enrolled in a private school, with 6,937 (88.5% in the age bracket) attending a public institution.
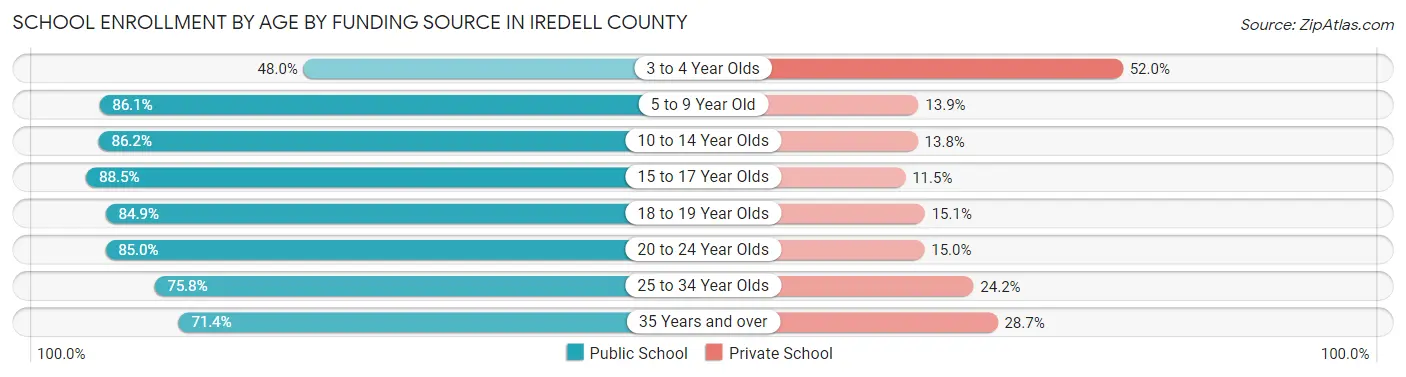
| Age Bracket | Public School | Private School |
| 3 to 4 Year Olds | 777 (48.0%) | 841 (52.0%) |
| 5 to 9 Year Old | 8,951 (86.1%) | 1,448 (13.9%) |
| 10 to 14 Year Olds | 10,857 (86.2%) | 1,735 (13.8%) |
| 15 to 17 Year Olds | 6,937 (88.5%) | 899 (11.5%) |
| 18 to 19 Year Olds | 2,126 (84.9%) | 378 (15.1%) |
| 20 to 24 Year Olds | 2,937 (85.0%) | 519 (15.0%) |
| 25 to 34 Year Olds | 1,330 (75.8%) | 424 (24.2%) |
| 35 Years and over | 1,270 (71.4%) | 510 (28.6%) |
| Total | 35,187 (83.9%) | 6,752 (16.1%) |
Educational Attainment by Field of Study in Iredell County
Business (10,866 | 23.5%), education (4,964 | 10.7%), science & technology (4,824 | 10.4%), engineering (4,085 | 8.8%), and arts & humanities (3,308 | 7.2%) are the most common fields of study among 46,187 individuals in Iredell County who have obtained a bachelor's degree or higher.
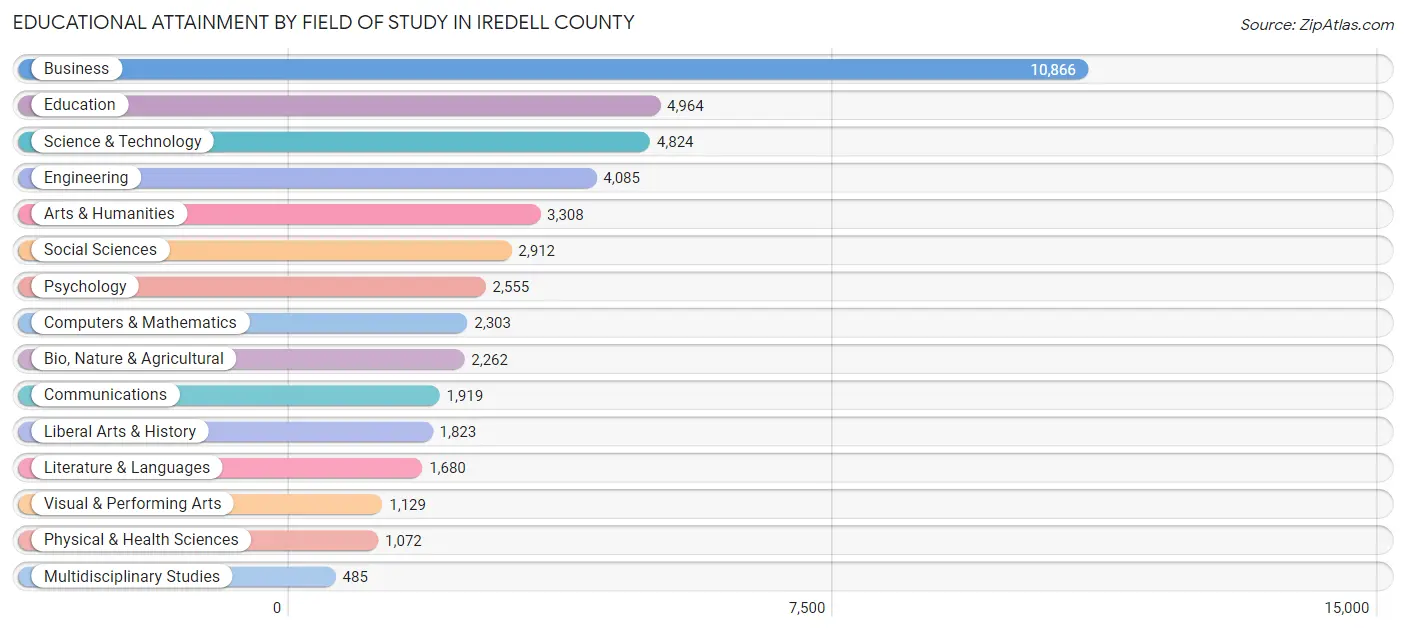
| Field of Study | # Graduates | % Graduates |
| Computers & Mathematics | 2,303 | 5.0% |
| Bio, Nature & Agricultural | 2,262 | 4.9% |
| Physical & Health Sciences | 1,072 | 2.3% |
| Psychology | 2,555 | 5.5% |
| Social Sciences | 2,912 | 6.3% |
| Engineering | 4,085 | 8.8% |
| Multidisciplinary Studies | 485 | 1.1% |
| Science & Technology | 4,824 | 10.4% |
| Business | 10,866 | 23.5% |
| Education | 4,964 | 10.7% |
| Literature & Languages | 1,680 | 3.6% |
| Liberal Arts & History | 1,823 | 4.0% |
| Visual & Performing Arts | 1,129 | 2.4% |
| Communications | 1,919 | 4.2% |
| Arts & Humanities | 3,308 | 7.2% |
| Total | 46,187 | 100.0% |
Transportation & Commute in Iredell County
Vehicle Availability by Sex in Iredell County
The most prevalent vehicle ownership categories in Iredell County are males with 2 vehicles (20,046, accounting for 40.2%) and females with 2 vehicles (15,560, making up 48.9%).
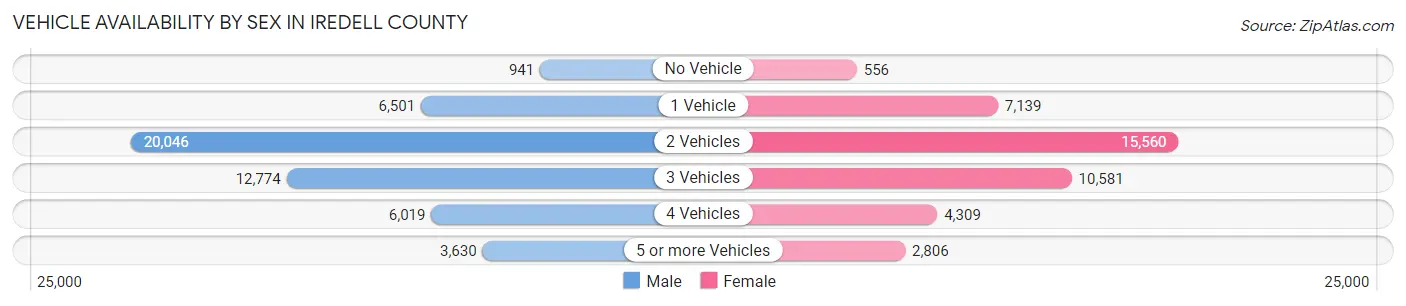
| Vehicles Available | Male | Female |
| No Vehicle | 941 (1.9%) | 556 (1.4%) |
| 1 Vehicle | 6,501 (13.0%) | 7,139 (17.4%) |
| 2 Vehicles | 20,046 (40.2%) | 15,560 (38.0%) |
| 3 Vehicles | 12,774 (25.6%) | 10,581 (25.8%) |
| 4 Vehicles | 6,019 (12.1%) | 4,309 (10.5%) |
| 5 or more Vehicles | 3,630 (7.3%) | 2,806 (6.9%) |
| Total | 49,911 (100.0%) | 40,951 (100.0%) |
Commute Time in Iredell County
The most frequently occuring commute durations in Iredell County are 15 to 19 minutes (14,077 commuters, 17.6%), 10 to 14 minutes (12,748 commuters, 16.0%), and 20 to 24 minutes (10,389 commuters, 13.0%).

| Commute Time | # Commuters | % Commuters |
| Less than 5 Minutes | 2,655 | 3.3% |
| 5 to 9 Minutes | 7,857 | 9.8% |
| 10 to 14 Minutes | 12,748 | 16.0% |
| 15 to 19 Minutes | 14,077 | 17.6% |
| 20 to 24 Minutes | 10,389 | 13.0% |
| 25 to 29 Minutes | 5,697 | 7.1% |
| 30 to 34 Minutes | 9,157 | 11.5% |
| 35 to 39 Minutes | 2,358 | 2.9% |
| 40 to 44 Minutes | 2,524 | 3.2% |
| 45 to 59 Minutes | 6,115 | 7.7% |
| 60 to 89 Minutes | 4,616 | 5.8% |
| 90 or more Minutes | 1,671 | 2.1% |
Commute Time by Sex in Iredell County
The most common commute times in Iredell County are 15 to 19 minutes (7,348 commuters, 16.5%) for males and 15 to 19 minutes (6,729 commuters, 19.0%) for females.
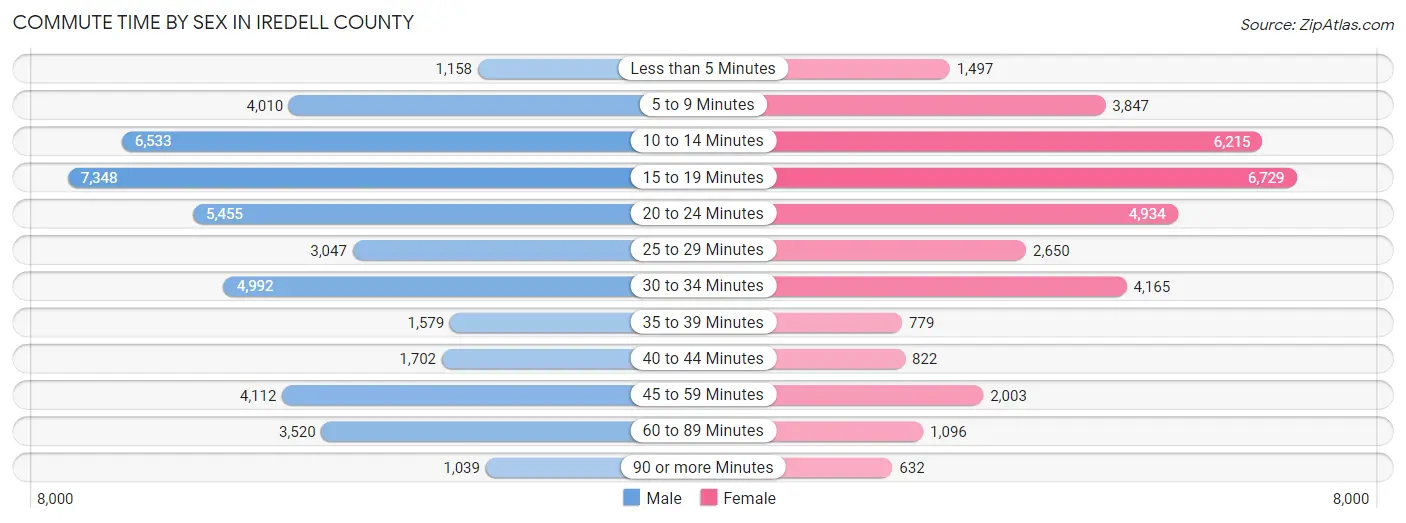
| Commute Time | Male | Female |
| Less than 5 Minutes | 1,158 (2.6%) | 1,497 (4.2%) |
| 5 to 9 Minutes | 4,010 (9.0%) | 3,847 (10.9%) |
| 10 to 14 Minutes | 6,533 (14.7%) | 6,215 (17.6%) |
| 15 to 19 Minutes | 7,348 (16.5%) | 6,729 (19.0%) |
| 20 to 24 Minutes | 5,455 (12.3%) | 4,934 (14.0%) |
| 25 to 29 Minutes | 3,047 (6.9%) | 2,650 (7.5%) |
| 30 to 34 Minutes | 4,992 (11.2%) | 4,165 (11.8%) |
| 35 to 39 Minutes | 1,579 (3.5%) | 779 (2.2%) |
| 40 to 44 Minutes | 1,702 (3.8%) | 822 (2.3%) |
| 45 to 59 Minutes | 4,112 (9.2%) | 2,003 (5.7%) |
| 60 to 89 Minutes | 3,520 (7.9%) | 1,096 (3.1%) |
| 90 or more Minutes | 1,039 (2.3%) | 632 (1.8%) |
Time of Departure to Work by Sex in Iredell County
The most frequent times of departure to work in Iredell County are 6:30 AM to 6:59 AM (6,479, 14.6%) for males and 7:00 AM to 7:29 AM (5,261, 14.9%) for females.
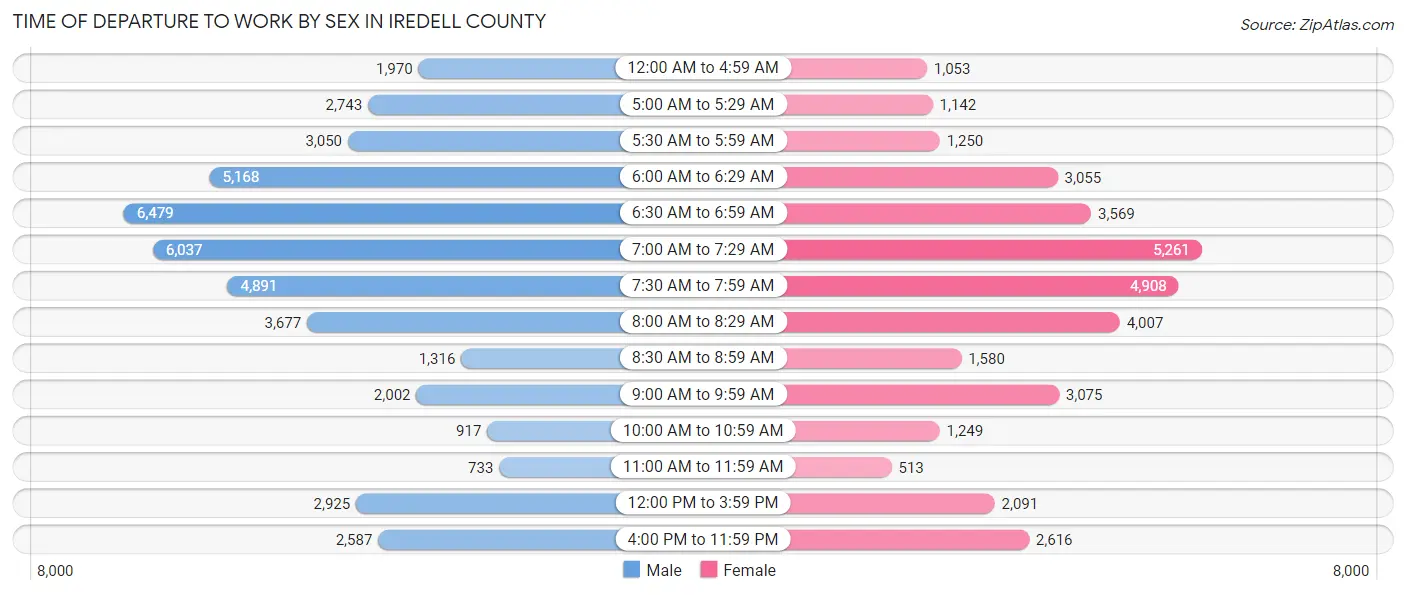
| Time of Departure | Male | Female |
| 12:00 AM to 4:59 AM | 1,970 (4.4%) | 1,053 (3.0%) |
| 5:00 AM to 5:29 AM | 2,743 (6.2%) | 1,142 (3.2%) |
| 5:30 AM to 5:59 AM | 3,050 (6.9%) | 1,250 (3.5%) |
| 6:00 AM to 6:29 AM | 5,168 (11.6%) | 3,055 (8.6%) |
| 6:30 AM to 6:59 AM | 6,479 (14.6%) | 3,569 (10.1%) |
| 7:00 AM to 7:29 AM | 6,037 (13.6%) | 5,261 (14.9%) |
| 7:30 AM to 7:59 AM | 4,891 (11.0%) | 4,908 (13.9%) |
| 8:00 AM to 8:29 AM | 3,677 (8.3%) | 4,007 (11.3%) |
| 8:30 AM to 8:59 AM | 1,316 (3.0%) | 1,580 (4.5%) |
| 9:00 AM to 9:59 AM | 2,002 (4.5%) | 3,075 (8.7%) |
| 10:00 AM to 10:59 AM | 917 (2.1%) | 1,249 (3.5%) |
| 11:00 AM to 11:59 AM | 733 (1.7%) | 513 (1.5%) |
| 12:00 PM to 3:59 PM | 2,925 (6.6%) | 2,091 (5.9%) |
| 4:00 PM to 11:59 PM | 2,587 (5.8%) | 2,616 (7.4%) |
| Total | 44,495 (100.0%) | 35,369 (100.0%) |
Housing Occupancy in Iredell County
Occupancy by Ownership in Iredell County
Of the total 72,296 dwellings in Iredell County, owner-occupied units account for 51,820 (71.7%), while renter-occupied units make up 20,476 (28.3%).
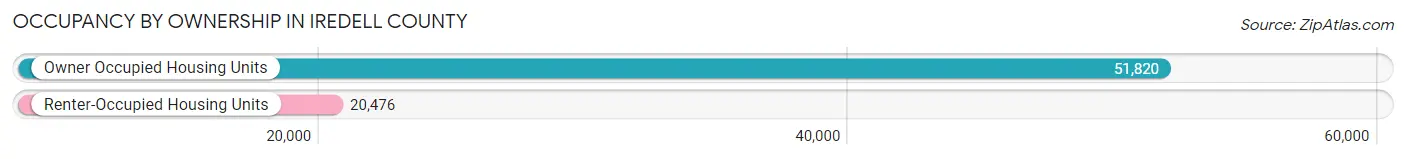
| Occupancy | # Housing Units | % Housing Units |
| Owner Occupied Housing Units | 51,820 | 71.7% |
| Renter-Occupied Housing Units | 20,476 | 28.3% |
| Total Occupied Housing Units | 72,296 | 100.0% |
Occupancy by Household Size in Iredell County
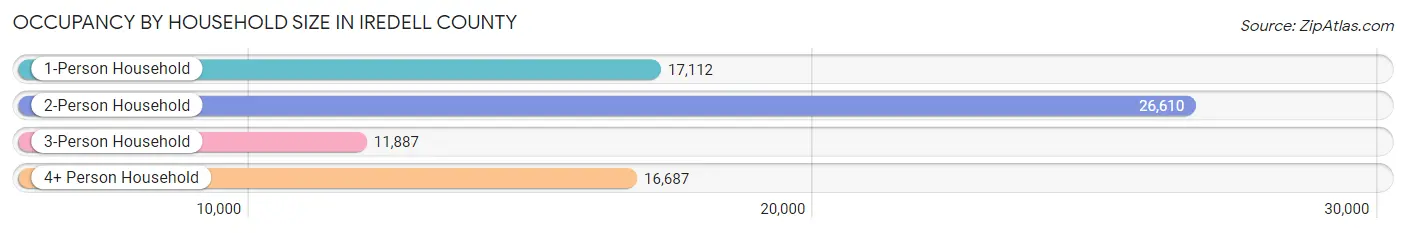
| Household Size | # Housing Units | % Housing Units |
| 1-Person Household | 17,112 | 23.7% |
| 2-Person Household | 26,610 | 36.8% |
| 3-Person Household | 11,887 | 16.4% |
| 4+ Person Household | 16,687 | 23.1% |
| Total Housing Units | 72,296 | 100.0% |
Occupancy by Ownership by Household Size in Iredell County
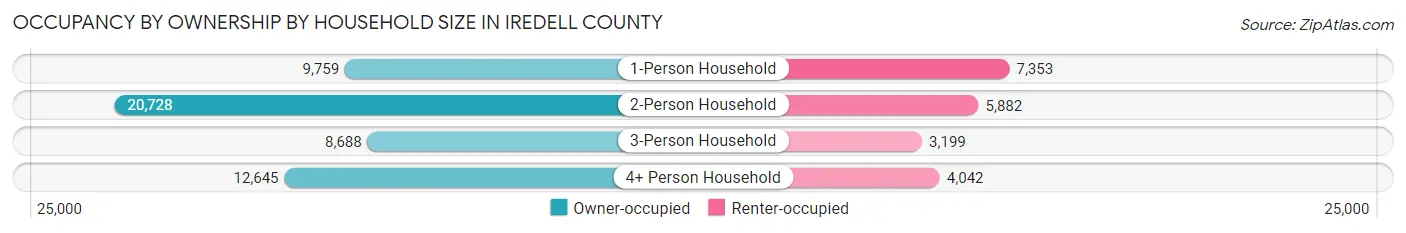
| Household Size | Owner-occupied | Renter-occupied |
| 1-Person Household | 9,759 (57.0%) | 7,353 (43.0%) |
| 2-Person Household | 20,728 (77.9%) | 5,882 (22.1%) |
| 3-Person Household | 8,688 (73.1%) | 3,199 (26.9%) |
| 4+ Person Household | 12,645 (75.8%) | 4,042 (24.2%) |
| Total Housing Units | 51,820 (71.7%) | 20,476 (28.3%) |
Occupancy by Educational Attainment in Iredell County
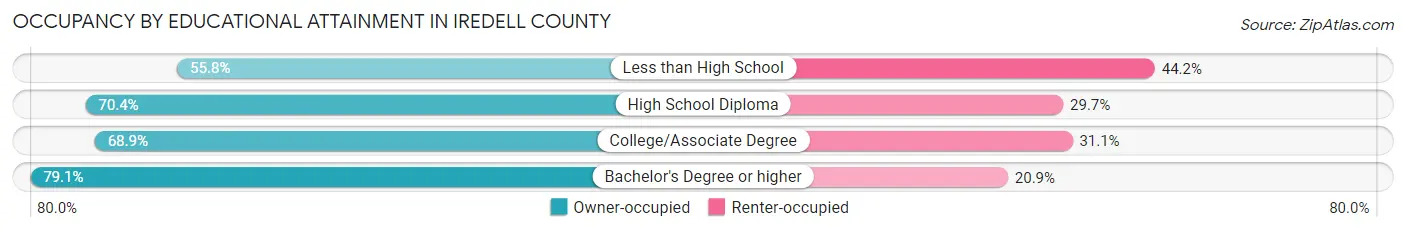
| Household Size | Owner-occupied | Renter-occupied |
| Less than High School | 3,202 (55.8%) | 2,535 (44.2%) |
| High School Diploma | 12,563 (70.4%) | 5,295 (29.6%) |
| College/Associate Degree | 16,626 (68.9%) | 7,515 (31.1%) |
| Bachelor's Degree or higher | 19,429 (79.1%) | 5,131 (20.9%) |
Occupancy by Age of Householder in Iredell County
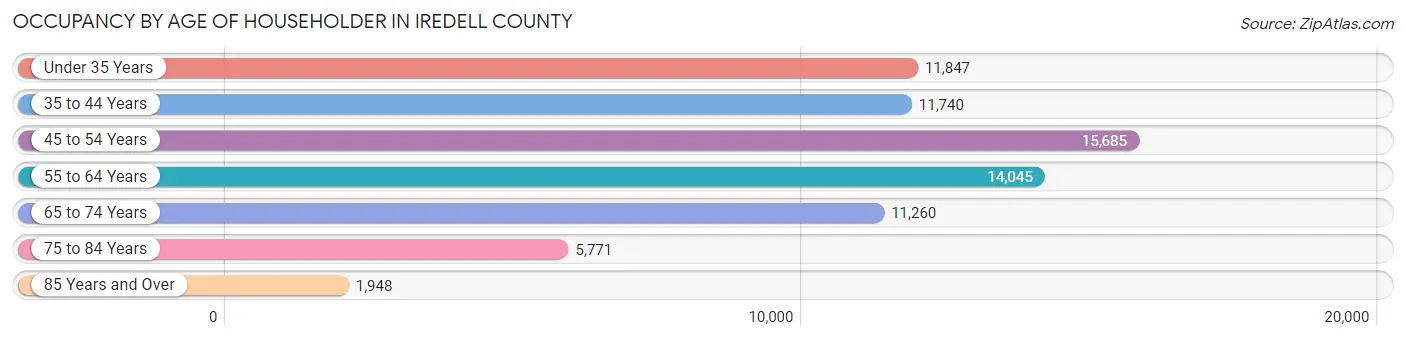
| Age Bracket | # Households | % Households |
| Under 35 Years | 11,847 | 16.4% |
| 35 to 44 Years | 11,740 | 16.2% |
| 45 to 54 Years | 15,685 | 21.7% |
| 55 to 64 Years | 14,045 | 19.4% |
| 65 to 74 Years | 11,260 | 15.6% |
| 75 to 84 Years | 5,771 | 8.0% |
| 85 Years and Over | 1,948 | 2.7% |
| Total | 72,296 | 100.0% |
Housing Finances in Iredell County
Median Income by Occupancy in Iredell County
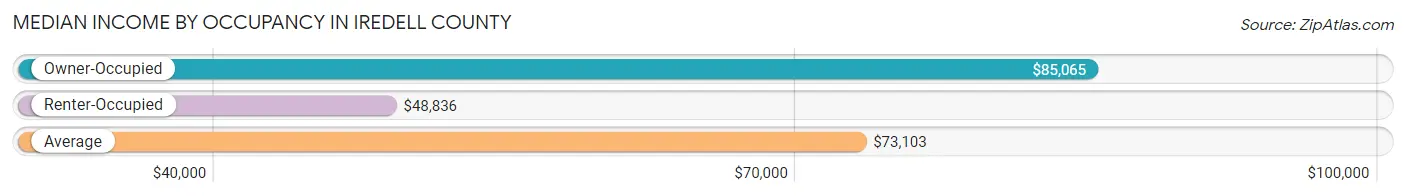
| Occupancy Type | # Households | Median Income |
| Owner-Occupied | 51,820 (71.7%) | $85,065 |
| Renter-Occupied | 20,476 (28.3%) | $48,836 |
| Average | 72,296 (100.0%) | $73,103 |
Occupancy by Householder Income Bracket in Iredell County
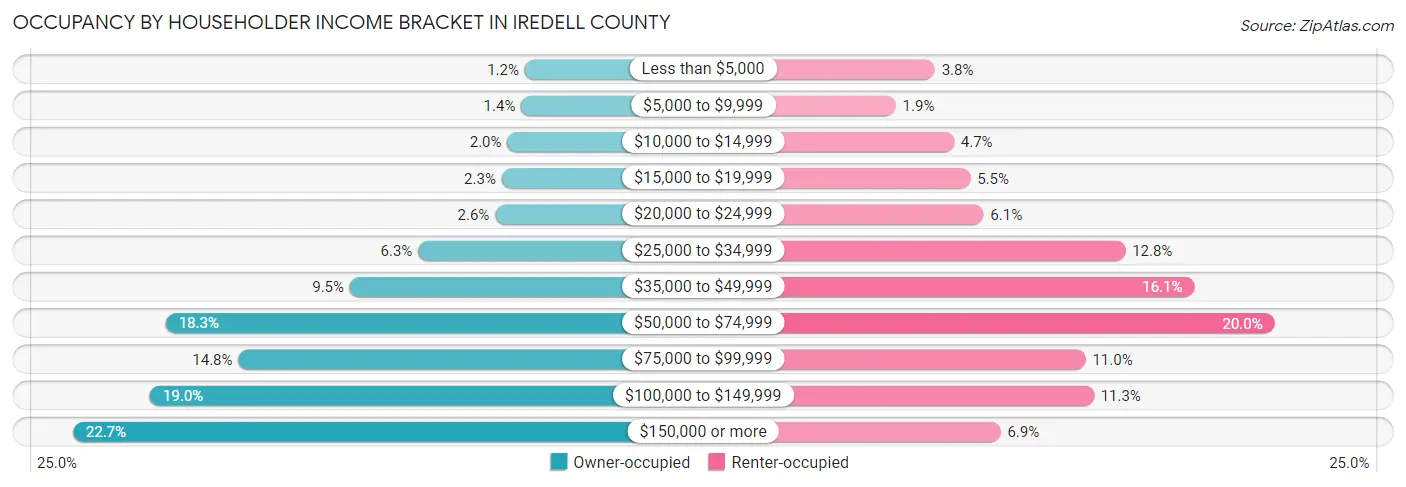
| Income Bracket | Owner-occupied | Renter-occupied |
| Less than $5,000 | 612 (1.2%) | 771 (3.8%) |
| $5,000 to $9,999 | 698 (1.3%) | 391 (1.9%) |
| $10,000 to $14,999 | 1,039 (2.0%) | 958 (4.7%) |
| $15,000 to $19,999 | 1,184 (2.3%) | 1,117 (5.5%) |
| $20,000 to $24,999 | 1,342 (2.6%) | 1,246 (6.1%) |
| $25,000 to $34,999 | 3,242 (6.3%) | 2,629 (12.8%) |
| $35,000 to $49,999 | 4,927 (9.5%) | 3,303 (16.1%) |
| $50,000 to $74,999 | 9,471 (18.3%) | 4,084 (20.0%) |
| $75,000 to $99,999 | 7,681 (14.8%) | 2,243 (11.0%) |
| $100,000 to $149,999 | 9,859 (19.0%) | 2,322 (11.3%) |
| $150,000 or more | 11,765 (22.7%) | 1,412 (6.9%) |
| Total | 51,820 (100.0%) | 20,476 (100.0%) |
Monthly Housing Cost Tiers in Iredell County
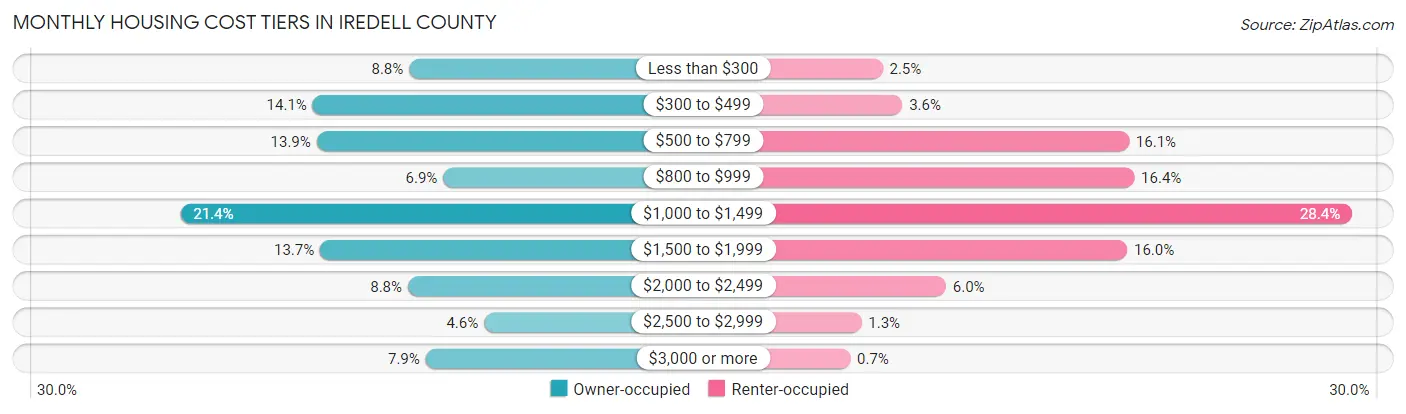
| Monthly Cost | Owner-occupied | Renter-occupied |
| Less than $300 | 4,539 (8.8%) | 510 (2.5%) |
| $300 to $499 | 7,303 (14.1%) | 733 (3.6%) |
| $500 to $799 | 7,189 (13.9%) | 3,297 (16.1%) |
| $800 to $999 | 3,567 (6.9%) | 3,357 (16.4%) |
| $1,000 to $1,499 | 11,092 (21.4%) | 5,820 (28.4%) |
| $1,500 to $1,999 | 7,090 (13.7%) | 3,277 (16.0%) |
| $2,000 to $2,499 | 4,578 (8.8%) | 1,227 (6.0%) |
| $2,500 to $2,999 | 2,392 (4.6%) | 270 (1.3%) |
| $3,000 or more | 4,070 (7.9%) | 144 (0.7%) |
| Total | 51,820 (100.0%) | 20,476 (100.0%) |
Physical Housing Characteristics in Iredell County
Housing Structures in Iredell County
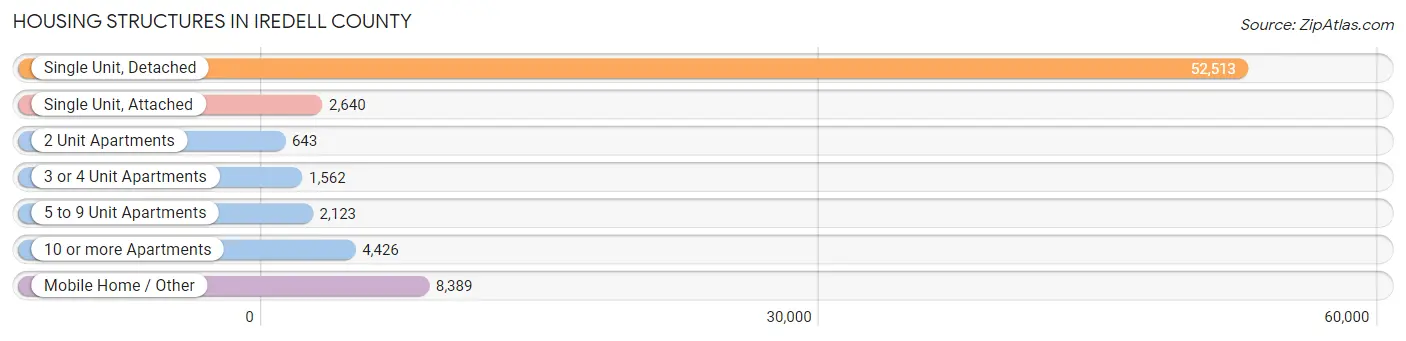
| Structure Type | # Housing Units | % Housing Units |
| Single Unit, Detached | 52,513 | 72.6% |
| Single Unit, Attached | 2,640 | 3.6% |
| 2 Unit Apartments | 643 | 0.9% |
| 3 or 4 Unit Apartments | 1,562 | 2.2% |
| 5 to 9 Unit Apartments | 2,123 | 2.9% |
| 10 or more Apartments | 4,426 | 6.1% |
| Mobile Home / Other | 8,389 | 11.6% |
| Total | 72,296 | 100.0% |
Housing Structures by Occupancy in Iredell County

| Structure Type | Owner-occupied | Renter-occupied |
| Single Unit, Detached | 44,849 (85.4%) | 7,664 (14.6%) |
| Single Unit, Attached | 1,259 (47.7%) | 1,381 (52.3%) |
| 2 Unit Apartments | 65 (10.1%) | 578 (89.9%) |
| 3 or 4 Unit Apartments | 99 (6.3%) | 1,463 (93.7%) |
| 5 to 9 Unit Apartments | 80 (3.8%) | 2,043 (96.2%) |
| 10 or more Apartments | 97 (2.2%) | 4,329 (97.8%) |
| Mobile Home / Other | 5,371 (64.0%) | 3,018 (36.0%) |
| Total | 51,820 (71.7%) | 20,476 (28.3%) |
Housing Structures by Number of Rooms in Iredell County
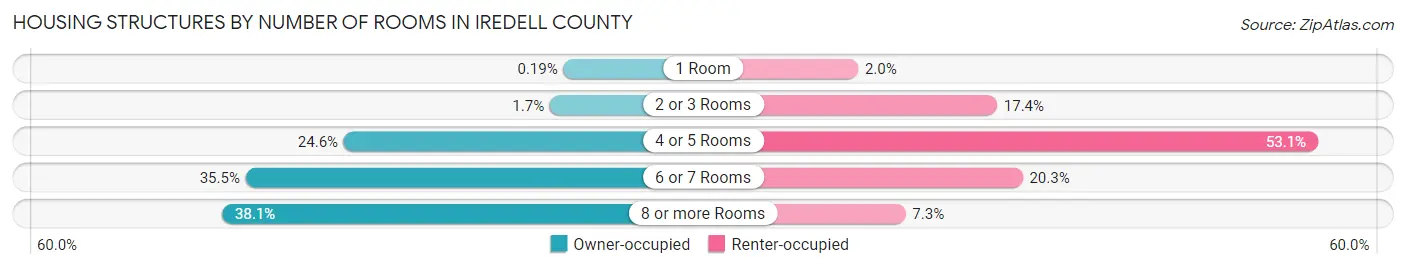
| Number of Rooms | Owner-occupied | Renter-occupied |
| 1 Room | 97 (0.2%) | 409 (2.0%) |
| 2 or 3 Rooms | 874 (1.7%) | 3,567 (17.4%) |
| 4 or 5 Rooms | 12,729 (24.6%) | 10,862 (53.0%) |
| 6 or 7 Rooms | 18,376 (35.5%) | 4,149 (20.3%) |
| 8 or more Rooms | 19,744 (38.1%) | 1,489 (7.3%) |
| Total | 51,820 (100.0%) | 20,476 (100.0%) |
Housing Structure by Heating Type in Iredell County
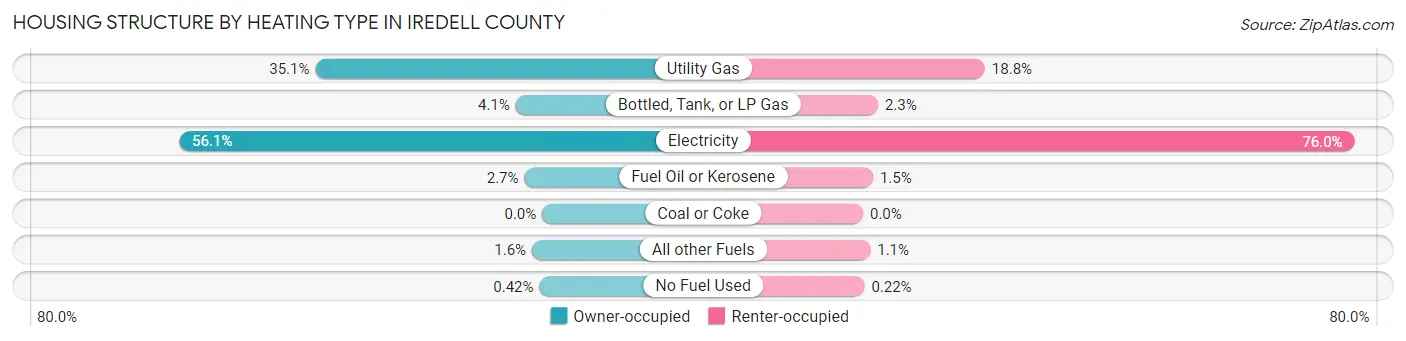
| Heating Type | Owner-occupied | Renter-occupied |
| Utility Gas | 18,166 (35.1%) | 3,858 (18.8%) |
| Bottled, Tank, or LP Gas | 2,119 (4.1%) | 476 (2.3%) |
| Electricity | 29,082 (56.1%) | 15,553 (76.0%) |
| Fuel Oil or Kerosene | 1,422 (2.7%) | 314 (1.5%) |
| Coal or Coke | 0 (0.0%) | 0 (0.0%) |
| All other Fuels | 814 (1.6%) | 229 (1.1%) |
| No Fuel Used | 217 (0.4%) | 46 (0.2%) |
| Total | 51,820 (100.0%) | 20,476 (100.0%) |
Household Vehicle Usage in Iredell County
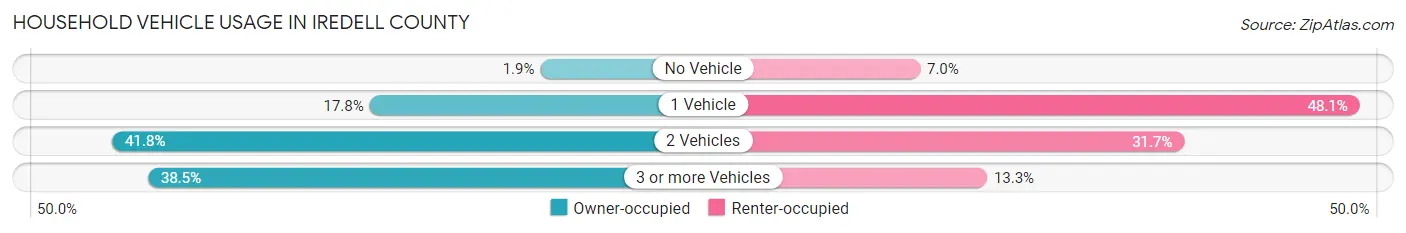
| Vehicles per Household | Owner-occupied | Renter-occupied |
| No Vehicle | 964 (1.9%) | 1,436 (7.0%) |
| 1 Vehicle | 9,224 (17.8%) | 9,839 (48.0%) |
| 2 Vehicles | 21,679 (41.8%) | 6,485 (31.7%) |
| 3 or more Vehicles | 19,953 (38.5%) | 2,716 (13.3%) |
| Total | 51,820 (100.0%) | 20,476 (100.0%) |
Real Estate & Mortgages in Iredell County
Real Estate and Mortgage Overview in Iredell County
| Characteristic | Without Mortgage | With Mortgage |
| Housing Units | 17,935 | 33,885 |
| Median Property Value | $215,000 | $283,300 |
| Median Household Income | $60,727 | $9,633 |
| Monthly Housing Costs | $419 | $4,043 |
| Real Estate Taxes | $1,310 | $660 |
Property Value by Mortgage Status in Iredell County
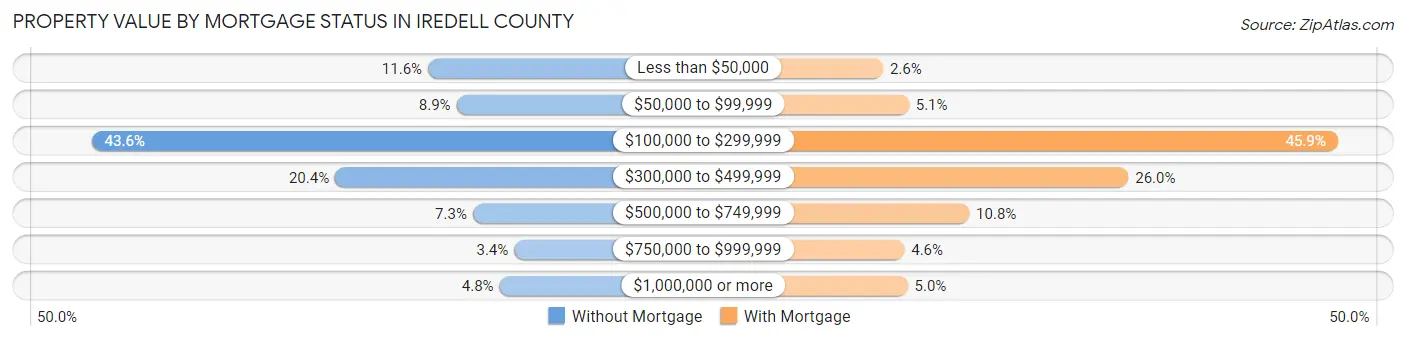
| Property Value | Without Mortgage | With Mortgage |
| Less than $50,000 | 2,079 (11.6%) | 884 (2.6%) |
| $50,000 to $99,999 | 1,590 (8.9%) | 1,719 (5.1%) |
| $100,000 to $299,999 | 7,822 (43.6%) | 15,560 (45.9%) |
| $300,000 to $499,999 | 3,666 (20.4%) | 8,802 (26.0%) |
| $500,000 to $749,999 | 1,313 (7.3%) | 3,667 (10.8%) |
| $750,000 to $999,999 | 607 (3.4%) | 1,573 (4.6%) |
| $1,000,000 or more | 858 (4.8%) | 1,680 (5.0%) |
| Total | 17,935 (100.0%) | 33,885 (100.0%) |
Household Income by Mortgage Status in Iredell County
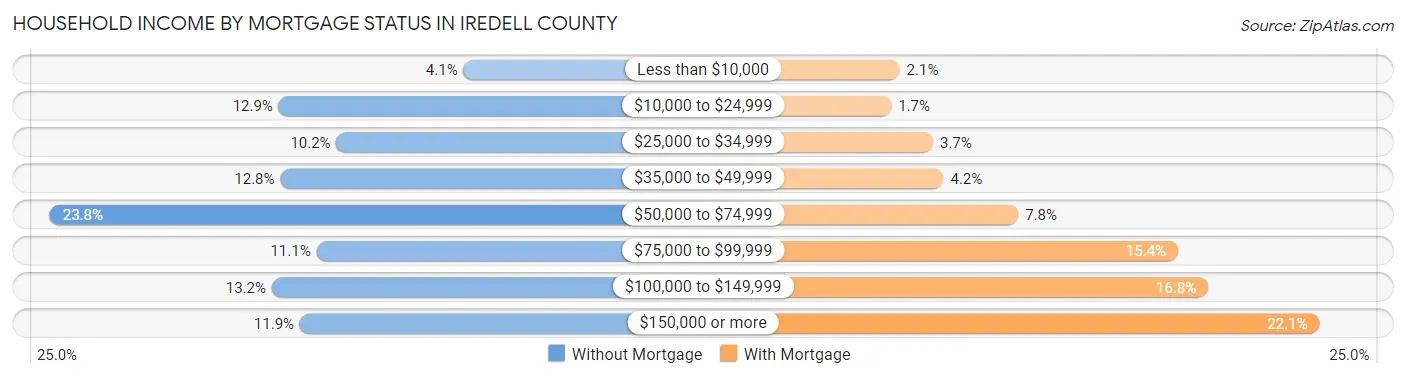
| Household Income | Without Mortgage | With Mortgage |
| Less than $10,000 | 735 (4.1%) | 711 (2.1%) |
| $10,000 to $24,999 | 2,314 (12.9%) | 575 (1.7%) |
| $25,000 to $34,999 | 1,821 (10.2%) | 1,251 (3.7%) |
| $35,000 to $49,999 | 2,300 (12.8%) | 1,421 (4.2%) |
| $50,000 to $74,999 | 4,269 (23.8%) | 2,627 (7.7%) |
| $75,000 to $99,999 | 1,991 (11.1%) | 5,202 (15.3%) |
| $100,000 to $149,999 | 2,373 (13.2%) | 5,690 (16.8%) |
| $150,000 or more | 2,132 (11.9%) | 7,486 (22.1%) |
| Total | 17,935 (100.0%) | 33,885 (100.0%) |
Property Value to Household Income Ratio in Iredell County
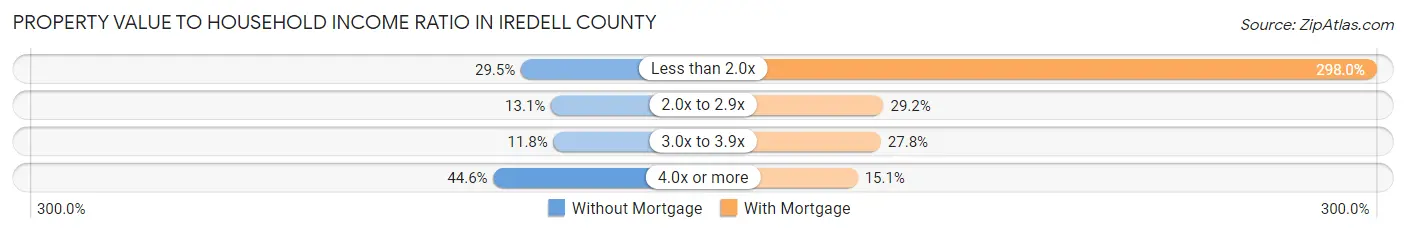
| Value-to-Income Ratio | Without Mortgage | With Mortgage |
| Less than 2.0x | 5,298 (29.5%) | 100,959 (297.9%) |
| 2.0x to 2.9x | 2,350 (13.1%) | 9,897 (29.2%) |
| 3.0x to 3.9x | 2,110 (11.8%) | 9,409 (27.8%) |
| 4.0x or more | 7,996 (44.6%) | 5,129 (15.1%) |
| Total | 17,935 (100.0%) | 33,885 (100.0%) |
Real Estate Taxes by Mortgage Status in Iredell County
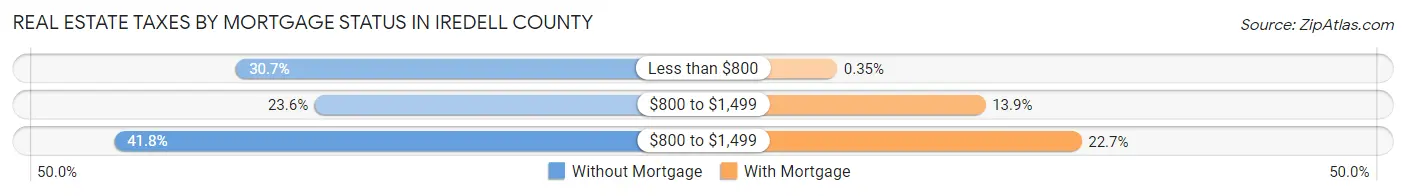
| Property Taxes | Without Mortgage | With Mortgage |
| Less than $800 | 5,500 (30.7%) | 118 (0.4%) |
| $800 to $1,499 | 4,228 (23.6%) | 4,709 (13.9%) |
| $800 to $1,499 | 7,499 (41.8%) | 7,682 (22.7%) |
| Total | 17,935 (100.0%) | 33,885 (100.0%) |
Health & Disability in Iredell County
Health Insurance Coverage by Age in Iredell County
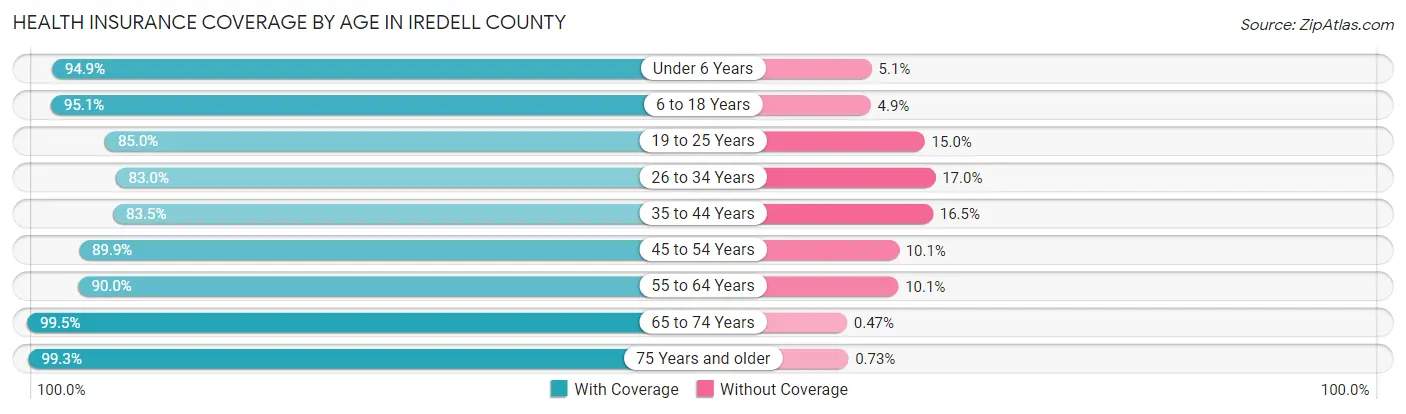
| Age Bracket | With Coverage | Without Coverage |
| Under 6 Years | 11,256 (94.9%) | 604 (5.1%) |
| 6 to 18 Years | 30,663 (95.1%) | 1,583 (4.9%) |
| 19 to 25 Years | 12,855 (85.0%) | 2,267 (15.0%) |
| 26 to 34 Years | 17,006 (83.0%) | 3,473 (17.0%) |
| 35 to 44 Years | 19,555 (83.5%) | 3,863 (16.5%) |
| 45 to 54 Years | 24,351 (89.9%) | 2,749 (10.1%) |
| 55 to 64 Years | 23,260 (89.9%) | 2,600 (10.1%) |
| 65 to 74 Years | 18,144 (99.5%) | 86 (0.5%) |
| 75 Years and older | 12,034 (99.3%) | 88 (0.7%) |
| Total | 169,124 (90.7%) | 17,313 (9.3%) |
Health Insurance Coverage by Citizenship Status in Iredell County
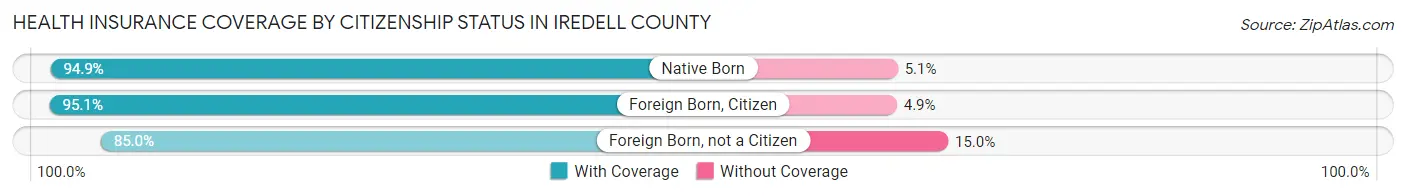
| Citizenship Status | With Coverage | Without Coverage |
| Native Born | 11,256 (94.9%) | 604 (5.1%) |
| Foreign Born, Citizen | 30,663 (95.1%) | 1,583 (4.9%) |
| Foreign Born, not a Citizen | 12,855 (85.0%) | 2,267 (15.0%) |
Health Insurance Coverage by Household Income in Iredell County
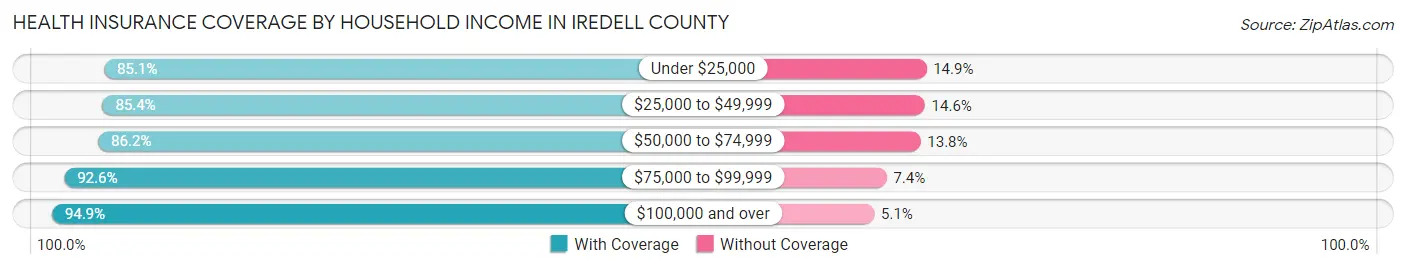
| Household Income | With Coverage | Without Coverage |
| Under $25,000 | 13,443 (85.1%) | 2,350 (14.9%) |
| $25,000 to $49,999 | 25,095 (85.4%) | 4,288 (14.6%) |
| $50,000 to $74,999 | 27,918 (86.2%) | 4,462 (13.8%) |
| $75,000 to $99,999 | 25,541 (92.6%) | 2,051 (7.4%) |
| $100,000 and over | 76,931 (94.9%) | 4,140 (5.1%) |
Public vs Private Health Insurance Coverage by Age in Iredell County
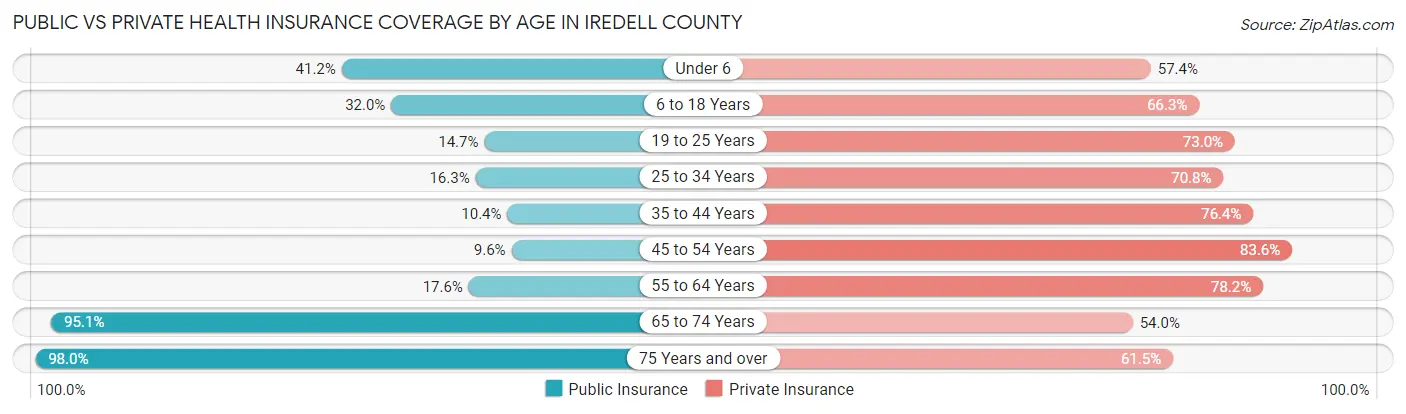
| Age Bracket | Public Insurance | Private Insurance |
| Under 6 | 4,882 (41.2%) | 6,803 (57.4%) |
| 6 to 18 Years | 10,303 (32.0%) | 21,390 (66.3%) |
| 19 to 25 Years | 2,219 (14.7%) | 11,033 (73.0%) |
| 25 to 34 Years | 3,340 (16.3%) | 14,503 (70.8%) |
| 35 to 44 Years | 2,434 (10.4%) | 17,884 (76.4%) |
| 45 to 54 Years | 2,609 (9.6%) | 22,651 (83.6%) |
| 55 to 64 Years | 4,543 (17.6%) | 20,217 (78.2%) |
| 65 to 74 Years | 17,333 (95.1%) | 9,845 (54.0%) |
| 75 Years and over | 11,882 (98.0%) | 7,454 (61.5%) |
| Total | 59,545 (31.9%) | 131,780 (70.7%) |
Disability Status by Sex by Age in Iredell County
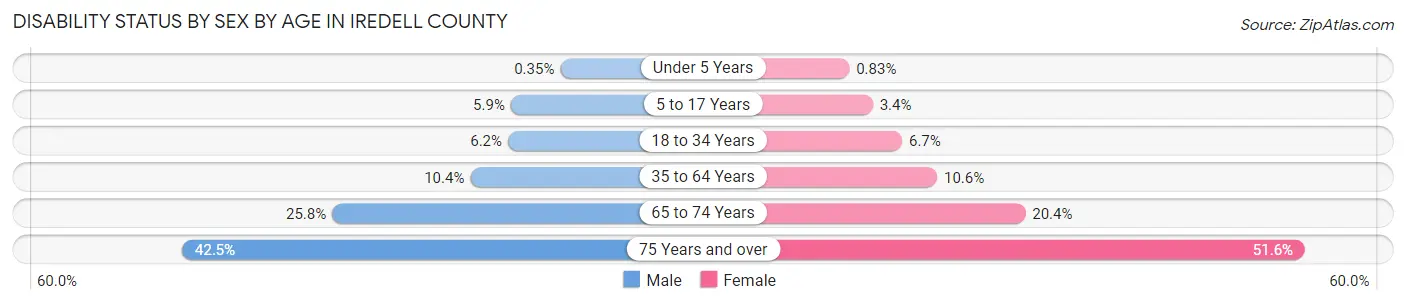
| Age Bracket | Male | Female |
| Under 5 Years | 18 (0.4%) | 40 (0.8%) |
| 5 to 17 Years | 966 (5.9%) | 541 (3.4%) |
| 18 to 34 Years | 1,186 (6.2%) | 1,232 (6.7%) |
| 35 to 64 Years | 3,918 (10.4%) | 4,096 (10.6%) |
| 65 to 74 Years | 2,279 (25.8%) | 1,918 (20.4%) |
| 75 Years and over | 2,069 (42.5%) | 3,739 (51.6%) |
Disability Class by Sex by Age in Iredell County
Disability Class: Hearing Difficulty
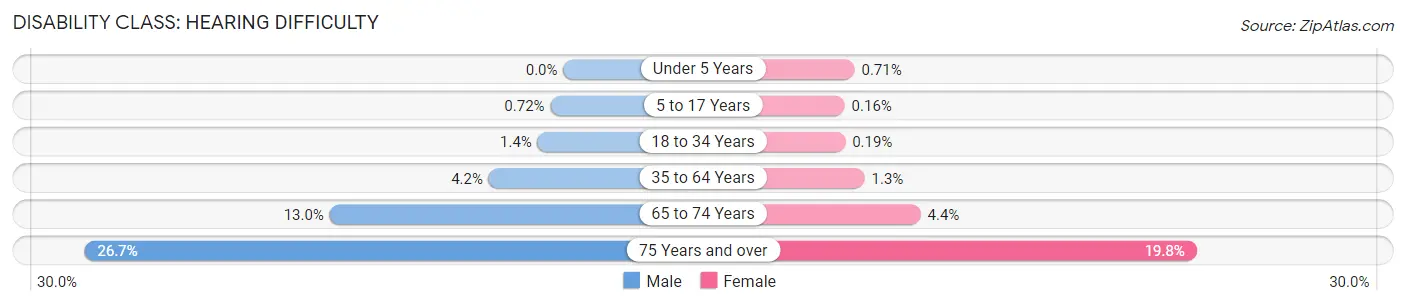
| Age Bracket | Male | Female |
| Under 5 Years | 0 (0.0%) | 34 (0.7%) |
| 5 to 17 Years | 119 (0.7%) | 25 (0.2%) |
| 18 to 34 Years | 274 (1.4%) | 34 (0.2%) |
| 35 to 64 Years | 1,569 (4.2%) | 492 (1.3%) |
| 65 to 74 Years | 1,151 (13.0%) | 412 (4.4%) |
| 75 Years and over | 1,299 (26.7%) | 1,433 (19.8%) |
Disability Class: Vision Difficulty
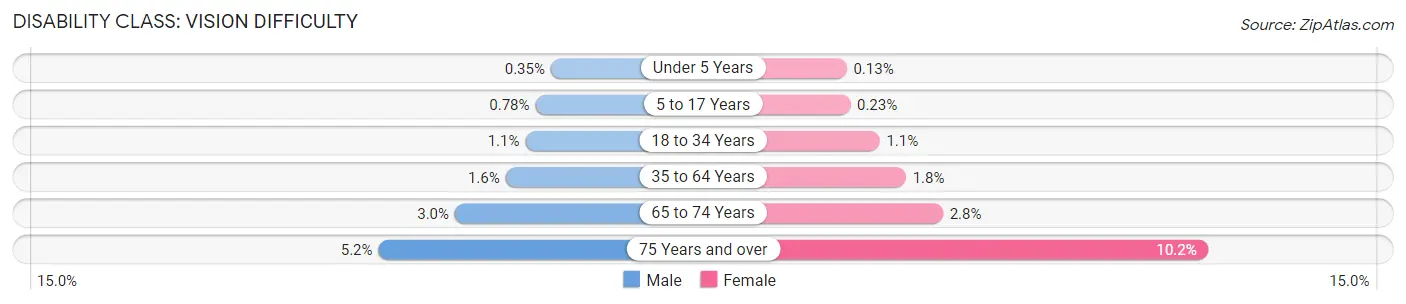
| Age Bracket | Male | Female |
| Under 5 Years | 18 (0.4%) | 6 (0.1%) |
| 5 to 17 Years | 129 (0.8%) | 36 (0.2%) |
| 18 to 34 Years | 204 (1.1%) | 193 (1.1%) |
| 35 to 64 Years | 607 (1.6%) | 687 (1.8%) |
| 65 to 74 Years | 267 (3.0%) | 264 (2.8%) |
| 75 Years and over | 251 (5.1%) | 740 (10.2%) |
Disability Class: Cognitive Difficulty

| Age Bracket | Male | Female |
| 5 to 17 Years | 773 (4.7%) | 457 (2.9%) |
| 18 to 34 Years | 830 (4.3%) | 608 (3.3%) |
| 35 to 64 Years | 1,437 (3.8%) | 1,596 (4.1%) |
| 65 to 74 Years | 346 (3.9%) | 317 (3.4%) |
| 75 Years and over | 443 (9.1%) | 1,258 (17.3%) |
Disability Class: Ambulatory Difficulty
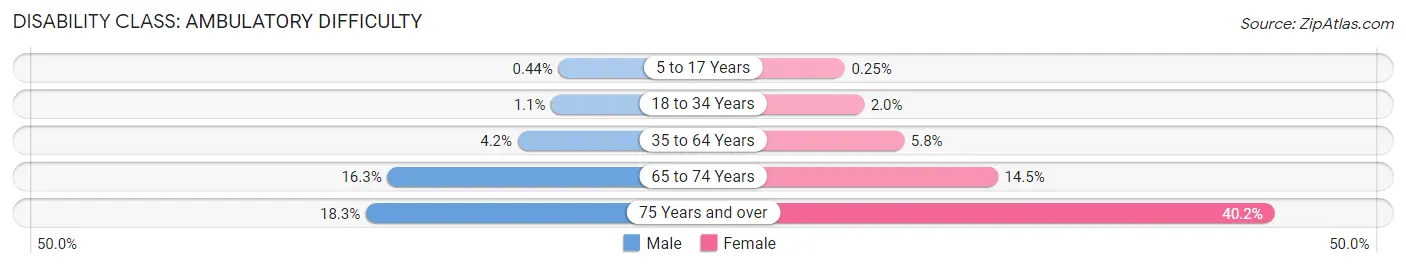
| Age Bracket | Male | Female |
| 5 to 17 Years | 72 (0.4%) | 40 (0.3%) |
| 18 to 34 Years | 215 (1.1%) | 374 (2.0%) |
| 35 to 64 Years | 1,595 (4.2%) | 2,222 (5.8%) |
| 65 to 74 Years | 1,444 (16.3%) | 1,356 (14.4%) |
| 75 Years and over | 892 (18.3%) | 2,912 (40.2%) |
Disability Class: Self-Care Difficulty
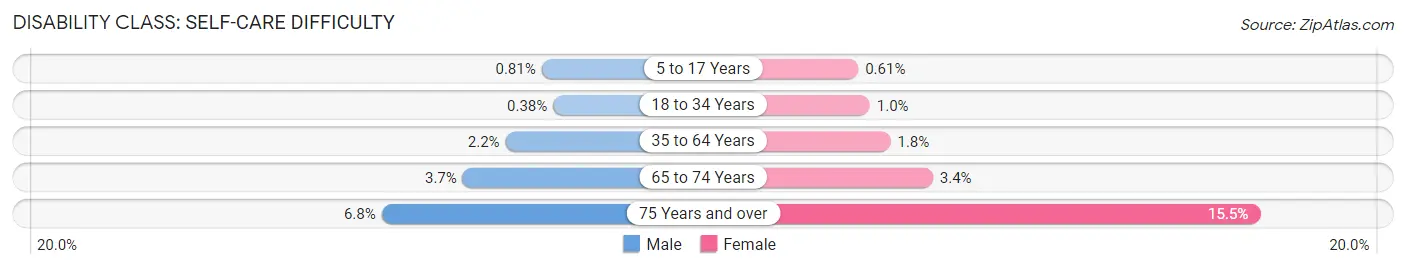
| Age Bracket | Male | Female |
| 5 to 17 Years | 134 (0.8%) | 96 (0.6%) |
| 18 to 34 Years | 73 (0.4%) | 191 (1.0%) |
| 35 to 64 Years | 812 (2.1%) | 700 (1.8%) |
| 65 to 74 Years | 331 (3.7%) | 317 (3.4%) |
| 75 Years and over | 329 (6.8%) | 1,126 (15.5%) |
Technology Access in Iredell County
Computing Device Access in Iredell County
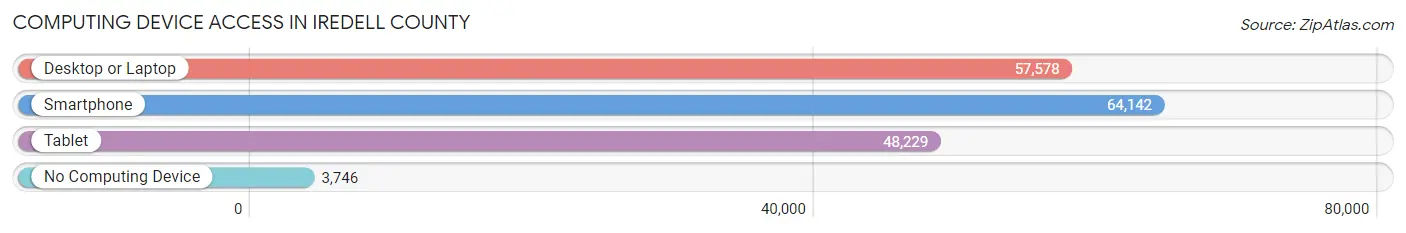
| Device Type | # Households | % Households |
| Desktop or Laptop | 57,578 | 79.6% |
| Smartphone | 64,142 | 88.7% |
| Tablet | 48,229 | 66.7% |
| No Computing Device | 3,746 | 5.2% |
| Total | 72,296 | 100.0% |
Internet Access in Iredell County
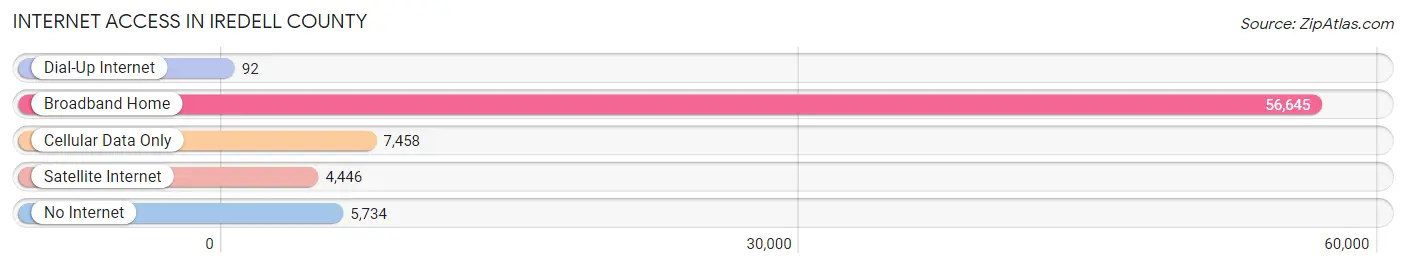
| Internet Type | # Households | % Households |
| Dial-Up Internet | 92 | 0.1% |
| Broadband Home | 56,645 | 78.3% |
| Cellular Data Only | 7,458 | 10.3% |
| Satellite Internet | 4,446 | 6.1% |
| No Internet | 5,734 | 7.9% |
| Total | 72,296 | 100.0% |
Iredell County Summary
Iredell County is located in the Piedmont region of North Carolina, and is part of the Charlotte metropolitan area. It is bordered by Alexander, Catawba, Davie, Rowan, and Mecklenburg counties. The county seat is Statesville, and the largest city is Mooresville. As of the 2010 census, the population was 159,437.
Geography
Iredell County is located in the Piedmont region of North Carolina, and is part of the Charlotte metropolitan area. It is bordered by Alexander, Catawba, Davie, Rowan, and Mecklenburg counties. The county is divided into two distinct regions: the northern and southern parts. The northern part is mountainous and is home to the Blue Ridge Mountains, while the southern part is more rolling and is home to the Uwharrie Mountains. The county is also home to several rivers, including the Catawba River, the South Yadkin River, and the Rocky River.
The county has a total area of 576 square miles, of which 571 square miles is land and 5.2 square miles is water. The highest point in the county is Pilot Mountain, which has an elevation of 2,903 feet.
Demographics
As of the 2010 census, there were 159,437 people, 61,945 households, and 43,945 families residing in the county. The population density was 278 people per square mile. There were 67,945 housing units at an average density of 118 per square mile. The racial makeup of the county was 84.2% White, 11.3% African American, 0.4% Native American, 2.2% Asian, 0.1% Pacific Islander, 0.9% from other races, and 1.0% from two or more races. Hispanic or Latino of any race were 2.7% of the population.
The median income for a household in the county was $45,845, and the median income for a family was $54,817. Males had a median income of $41,845 versus $30,817 for females. The per capita income for the county was $22,945. About 8.7% of families and 11.2% of the population were below the poverty line, including 15.2% of those under age 18 and 8.7% of those age 65 or over.
Economy
Iredell County is home to a diverse economy, with a variety of industries and businesses. The county is home to several large employers, including Lowe's Home Improvement, Mooresville-based RaceTrac Petroleum, and the Mooresville-based NASCAR Technical Institute. The county is also home to several smaller businesses, including manufacturing, retail, and service-based businesses.
The county is home to several major transportation routes, including Interstate 77, US Highway 21, and US Highway 70. The county is also home to several airports, including the Statesville Regional Airport and the Mooresville Municipal Airport.
The county is home to several educational institutions, including Mitchell Community College, the University of North Carolina at Charlotte, and Davidson College.
Conclusion
Iredell County is a diverse and vibrant county located in the Piedmont region of North Carolina. It is home to a variety of industries and businesses, and is a major transportation hub. The county is also home to several educational institutions, and has a population of 159,437 as of the 2010 census. The county has a diverse economy, and is a great place to live and work.
Common Questions
What is the Total Population of Iredell County?
Total Population of Iredell County is 187,839.
What is the Total Male Population of Iredell County?
Total Male Population of Iredell County is 93,283.
What is the Total Female Population of Iredell County?
Total Female Population of Iredell County is 94,556.
What is the Ratio of Males per 100 Females in Iredell County?
There are 98.65 Males per 100 Females in Iredell County.
What is the Ratio of Females per 100 Males in Iredell County?
There are 101.36 Females per 100 Males in Iredell County.
What is the Median Population Age in Iredell County?
Median Population Age in Iredell County is 40.8 Years.
What is the Average Family Size in Iredell County
Average Family Size in Iredell County is 3.0 People.
What is the Average Household Size in Iredell County
Average Household Size in Iredell County is 2.6 People.
What is Per Capita Income in Iredell County?
Per Capita income in Iredell County is $40,959.
What is the Median Family Income in Iredell County?
Median Family Income in Iredell County is $86,894.
What is the Median Household income in Iredell County?
Median Household Income in Iredell County is $73,103.
What is Income or Wage Gap in Iredell County?
Income or Wage Gap in Iredell County is 38.9%.
Women in Iredell County earn 61.1 cents for every dollar earned by a man.
What is Family Income Deficit in Iredell County?
Family Income Deficit in Iredell County is $9,581.
Families that are below poverty line in Iredell County earn $9,581 less on average than the poverty threshold level.
What is Inequality or Gini Index in Iredell County?
Inequality or Gini Index in Iredell County is 0.46.
How Large is the Labor Force in Iredell County?
There are 97,880 People in the Labor Forcein in Iredell County.
What is the Percentage of People in the Labor Force in Iredell County?
64.9% of People are in the Labor Force in Iredell County.
What is the Unemployment Rate in Iredell County?
Unemployment Rate in Iredell County is 4.6%.