Hyde County, NC
Hyde County Map
Hyde County Overview
4,636
TOTAL POPULATION
2,394
MALE POPULATION
2,242
FEMALE POPULATION
106.78
MALES / 100 FEMALES
93.65
FEMALES / 100 MALES
46.8
MEDIAN AGE
2.4
AVG FAMILY SIZE
2.0
AVG HOUSEHOLD SIZE
$19,258
PER CAPITA INCOME
$51,263
AVG FAMILY INCOME
$43,724
AVG HOUSEHOLD INCOME
47.8%
WAGE / INCOME GAP [ % ]
52.2¢/ $1
WAGE / INCOME GAP [ $ ]
$17,257
FAMILY INCOME DEFICIT
0.40
INEQUALITY / GINI INDEX
1,547
LABOR FORCE [ PEOPLE ]
40.7%
PERCENT IN LABOR FORCE
8.7%
UNEMPLOYMENT RATE
Hyde County Area Codes
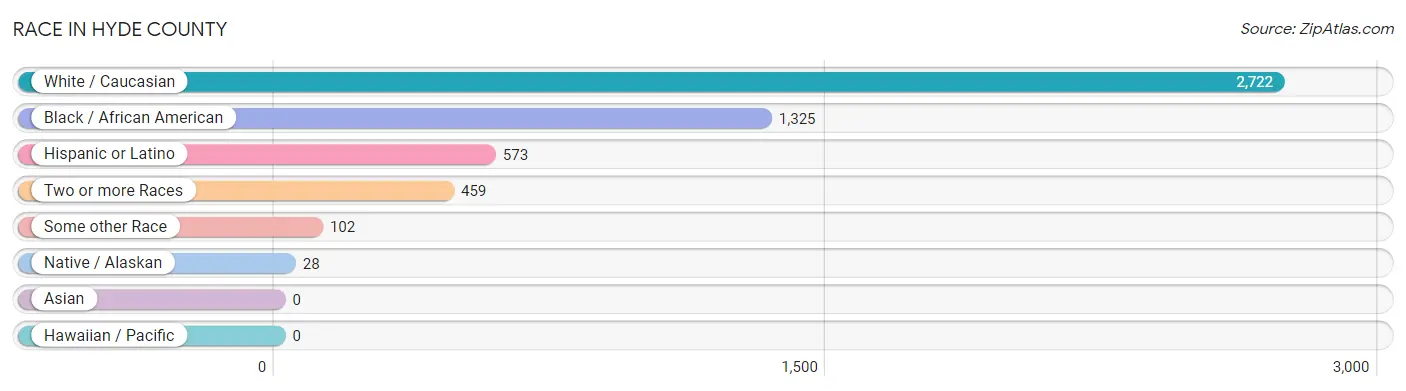
Race in Hyde County
The most populous races in Hyde County are White / Caucasian (2,722 | 58.7%), Black / African American (1,325 | 28.6%), and Hispanic or Latino (573 | 12.4%).
| Race | # Population | % Population |
| Asian | 0 | 0.0% |
| Black / African American | 1,325 | 28.6% |
| Hawaiian / Pacific | 0 | 0.0% |
| Hispanic or Latino | 573 | 12.4% |
| Native / Alaskan | 28 | 0.6% |
| White / Caucasian | 2,722 | 58.7% |
| Two or more Races | 459 | 9.9% |
| Some other Race | 102 | 2.2% |
| Total | 4,636 | 100.0% |
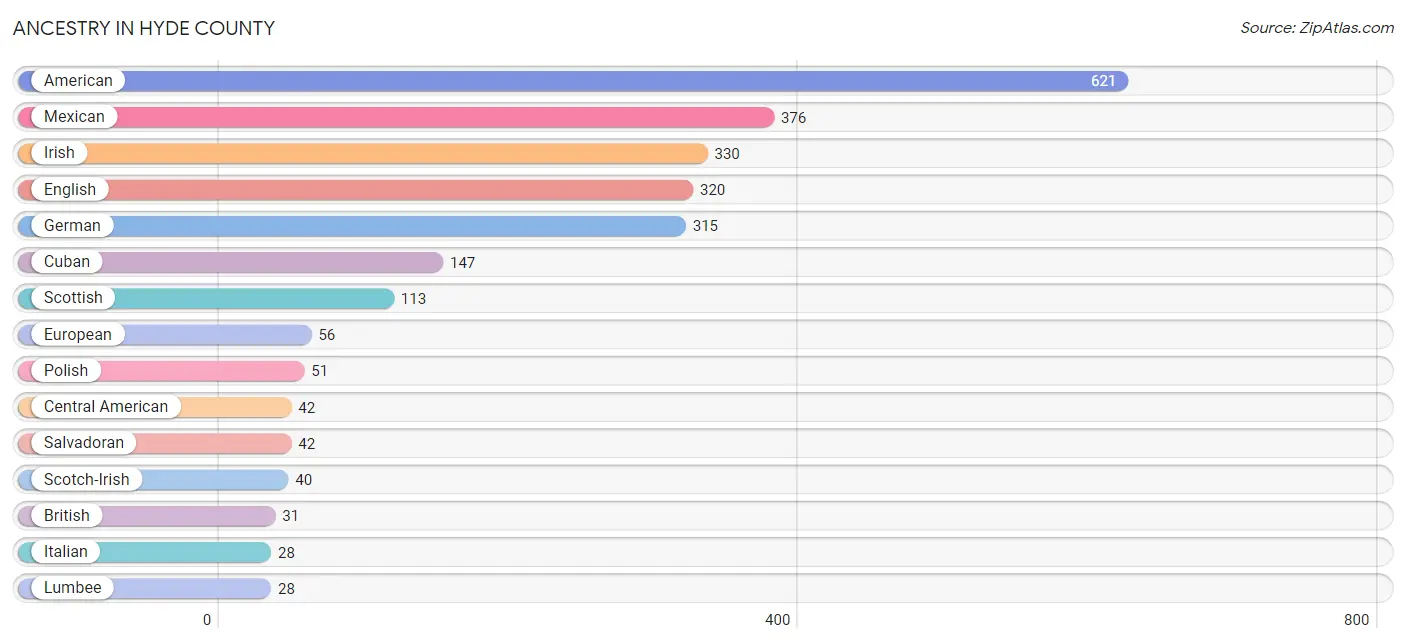
Ancestry in Hyde County
The most populous ancestries reported in Hyde County are American (621 | 13.4%), Mexican (376 | 8.1%), Irish (330 | 7.1%), English (320 | 6.9%), and German (315 | 6.8%), together accounting for 42.3% of all Hyde County residents.
| Ancestry | # Population | % Population |
| African | 4 | 0.1% |
| American | 621 | 13.4% |
| British | 31 | 0.7% |
| Central American | 42 | 0.9% |
| Cherokee | 9 | 0.2% |
| Cuban | 147 | 3.2% |
| Dutch | 23 | 0.5% |
| Eastern European | 10 | 0.2% |
| English | 320 | 6.9% |
| European | 56 | 1.2% |
| German | 315 | 6.8% |
| Hungarian | 3 | 0.1% |
| Irish | 330 | 7.1% |
| Italian | 28 | 0.6% |
| Lumbee | 28 | 0.6% |
| Mexican | 376 | 8.1% |
| Polish | 51 | 1.1% |
| Puerto Rican | 8 | 0.2% |
| Salvadoran | 42 | 0.9% |
| Scotch-Irish | 40 | 0.9% |
| Scottish | 113 | 2.4% |
| Subsaharan African | 4 | 0.1% |
| Swedish | 3 | 0.1% |
| Swiss | 1 | 0.0% |
| Welsh | 10 | 0.2% | View All 25 Rows |
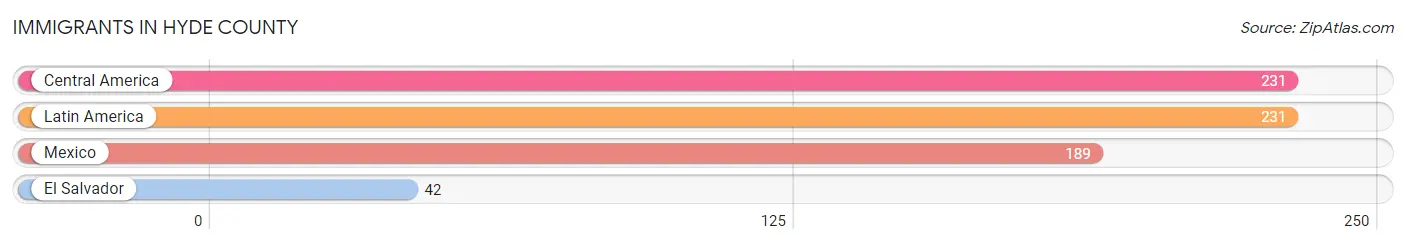
Immigrants in Hyde County
The most numerous immigrant groups reported in Hyde County came from Central America (231 | 5.0%), Latin America (231 | 5.0%), Mexico (189 | 4.1%), and El Salvador (42 | 0.9%), together accounting for 14.9% of all Hyde County residents.
| Immigration Origin | # Population | % Population |
| Central America | 231 | 5.0% |
| El Salvador | 42 | 0.9% |
| Latin America | 231 | 5.0% |
| Mexico | 189 | 4.1% | View All 4 Rows |
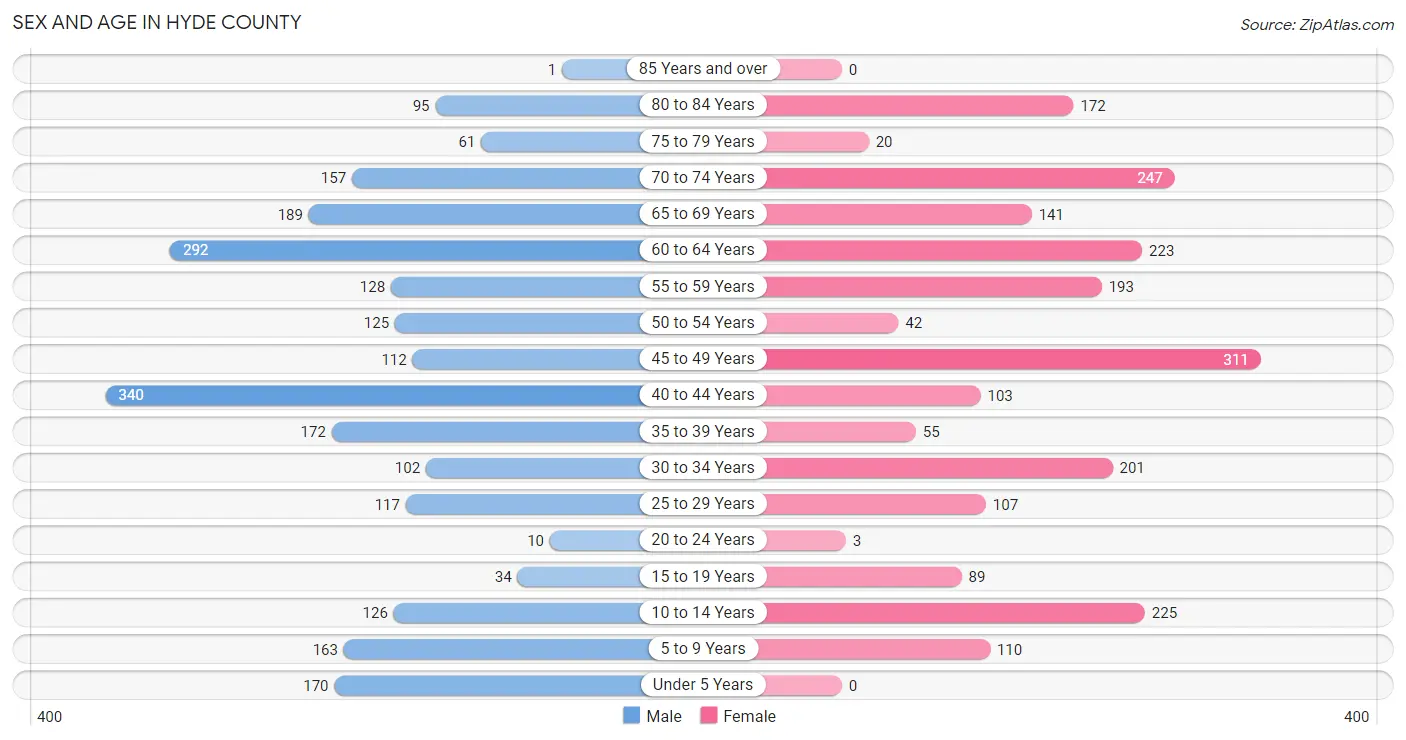
Sex and Age in Hyde County
Sex and Age in Hyde County
The most populous age groups in Hyde County are 40 to 44 Years (340 | 14.2%) for men and 45 to 49 Years (311 | 13.9%) for women.
| Age Bracket | Male | Female |
| Under 5 Years | 170 (7.1%) | 0 (0.0%) |
| 5 to 9 Years | 163 (6.8%) | 110 (4.9%) |
| 10 to 14 Years | 126 (5.3%) | 225 (10.0%) |
| 15 to 19 Years | 34 (1.4%) | 89 (4.0%) |
| 20 to 24 Years | 10 (0.4%) | 3 (0.1%) |
| 25 to 29 Years | 117 (4.9%) | 107 (4.8%) |
| 30 to 34 Years | 102 (4.3%) | 201 (9.0%) |
| 35 to 39 Years | 172 (7.2%) | 55 (2.5%) |
| 40 to 44 Years | 340 (14.2%) | 103 (4.6%) |
| 45 to 49 Years | 112 (4.7%) | 311 (13.9%) |
| 50 to 54 Years | 125 (5.2%) | 42 (1.9%) |
| 55 to 59 Years | 128 (5.3%) | 193 (8.6%) |
| 60 to 64 Years | 292 (12.2%) | 223 (10.0%) |
| 65 to 69 Years | 189 (7.9%) | 141 (6.3%) |
| 70 to 74 Years | 157 (6.6%) | 247 (11.0%) |
| 75 to 79 Years | 61 (2.5%) | 20 (0.9%) |
| 80 to 84 Years | 95 (4.0%) | 172 (7.7%) |
| 85 Years and over | 1 (0.0%) | 0 (0.0%) |
| Total | 2,394 (100.0%) | 2,242 (100.0%) |
Families and Households in Hyde County
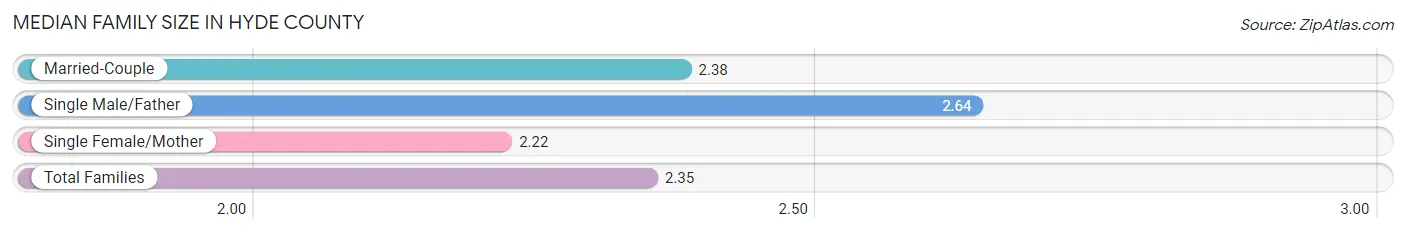
Median Family Size in Hyde County
The median family size in Hyde County is 2.35 persons per family, with single male/father families (90 | 6.8%) accounting for the largest median family size of 2.64 persons per family. On the other hand, single female/mother families (377 | 28.4%) represent the smallest median family size with 2.22 persons per family.
| Family Type | # Families | Family Size |
| Married-Couple | 859 (64.8%) | 2.38 |
| Single Male/Father | 90 (6.8%) | 2.64 |
| Single Female/Mother | 377 (28.4%) | 2.22 |
| Total Families | 1,326 (100.0%) | 2.35 |
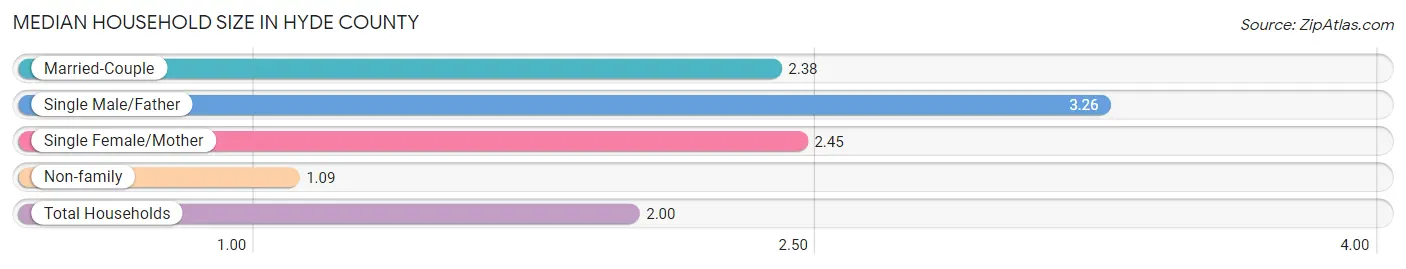
Median Household Size in Hyde County
The median household size in Hyde County is 2.00 persons per household, with single male/father households (90 | 4.5%) accounting for the largest median household size of 3.26 persons per household. non-family households (676 | 33.8%) represent the smallest median household size with 1.09 persons per household.
| Household Type | # Households | Household Size |
| Married-Couple | 859 (42.9%) | 2.38 |
| Single Male/Father | 90 (4.5%) | 3.26 |
| Single Female/Mother | 377 (18.8%) | 2.45 |
| Non-family | 676 (33.8%) | 1.09 |
| Total Households | 2,002 (100.0%) | 2.00 |
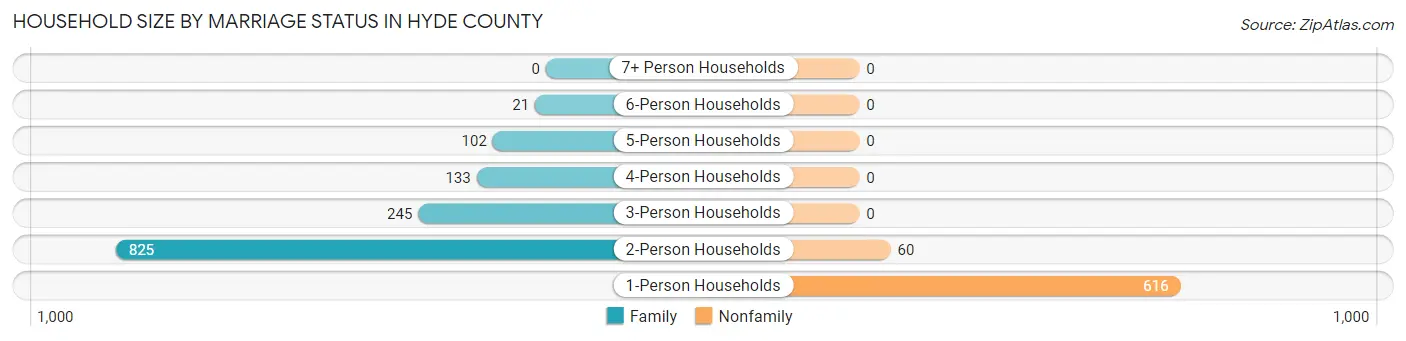
Household Size by Marriage Status in Hyde County
Out of a total of 2,002 households in Hyde County, 1,326 (66.2%) are family households, while 676 (33.8%) are nonfamily households. The most numerous type of family households are 2-person households, comprising 825, and the most common type of nonfamily households are 1-person households, comprising 616.
| Household Size | Family Households | Nonfamily Households |
| 1-Person Households | - | 616 (30.8%) |
| 2-Person Households | 825 (41.2%) | 60 (3.0%) |
| 3-Person Households | 245 (12.2%) | 0 (0.0%) |
| 4-Person Households | 133 (6.6%) | 0 (0.0%) |
| 5-Person Households | 102 (5.1%) | 0 (0.0%) |
| 6-Person Households | 21 (1.1%) | 0 (0.0%) |
| 7+ Person Households | 0 (0.0%) | 0 (0.0%) |
| Total | 1,326 (66.2%) | 676 (33.8%) |
Female Fertility in Hyde County
Fertility by Age in Hyde County
| Age Bracket | Women with Births | Births / 1,000 Women |
| 15 to 19 years | 0 (0.0%) | 0.0 |
| 20 to 34 years | 0 (0.0%) | 0.0 |
| 35 to 50 years | 0 (0.0%) | 0.0 |
| Total | 0 (0.0%) | 0.0 |
Fertility by Age by Marriage Status in Hyde County
| Age Bracket | Married | Unmarried |
| 15 to 19 years | 0 (0.0%) | 0 (0.0%) |
| 20 to 34 years | 0 (0.0%) | 0 (0.0%) |
| 35 to 50 years | 0 (0.0%) | 0 (0.0%) |
| Total | 0 (0.0%) | 0 (0.0%) |
Fertility by Education in Hyde County
| Educational Attainment | Women with Births | Births / 1,000 Women |
| Less than High School | 0 (0.0%) | 0.0 |
| High School Diploma | 0 (0.0%) | 0.0 |
| College or Associate's Degree | 0 (0.0%) | 0.0 |
| Bachelor's Degree | 0 (0.0%) | 0.0 |
| Graduate Degree | 0 (0.0%) | 0.0 |
| Total | 0 (0.0%) | 0.0 |
Fertility by Education by Marriage Status in Hyde County
| Educational Attainment | Married | Unmarried |
| Less than High School | 0 (0.0%) | 0 (0.0%) |
| High School Diploma | 0 (0.0%) | 0 (0.0%) |
| College or Associate's Degree | 0 (0.0%) | 0 (0.0%) |
| Bachelor's Degree | 0 (0.0%) | 0 (0.0%) |
| Graduate Degree | 0 (0.0%) | 0 (0.0%) |
| Total | 0 (0.0%) | 0 (0.0%) |
Income in Hyde County
Income Overview in Hyde County
Per Capita Income in Hyde County is $19,258, while median incomes of families and households are $51,263 and $43,724 respectively.
| Characteristic | Number | Measure |
| Per Capita Income | 4,636 | $19,258 |
| Median Family Income | 1,326 | $51,263 |
| Mean Family Income | 1,326 | $52,492 |
| Median Household Income | 2,002 | $43,724 |
| Mean Household Income | 2,002 | $49,100 |
| Income Deficit | 1,326 | $17,257 |
| Wage / Income Gap (%) | 4,636 | 47.79% |
| Wage / Income Gap ($) | 4,636 | 52.21¢ per $1 |
| Gini / Inequality Index | 4,636 | 0.40 |
Earnings by Sex in Hyde County
Average Earnings in Hyde County are $22,444, $33,839 for men and $17,669 for women, a difference of 47.8%.
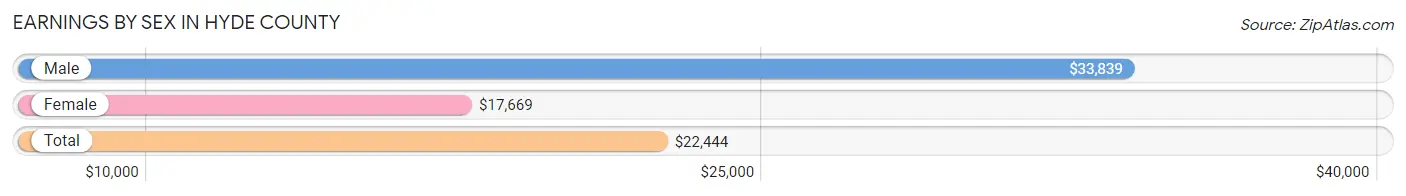
| Sex | Number | Average Earnings |
| Male | 860 (48.2%) | $33,839 |
| Female | 925 (51.8%) | $17,669 |
| Total | 1,785 (100.0%) | $22,444 |
Earnings by Sex by Income Bracket in Hyde County
The most common earnings brackets in Hyde County are $55,000 to $64,999 for men (148 | 17.2%) and $2,499 or less for women (142 | 15.3%).
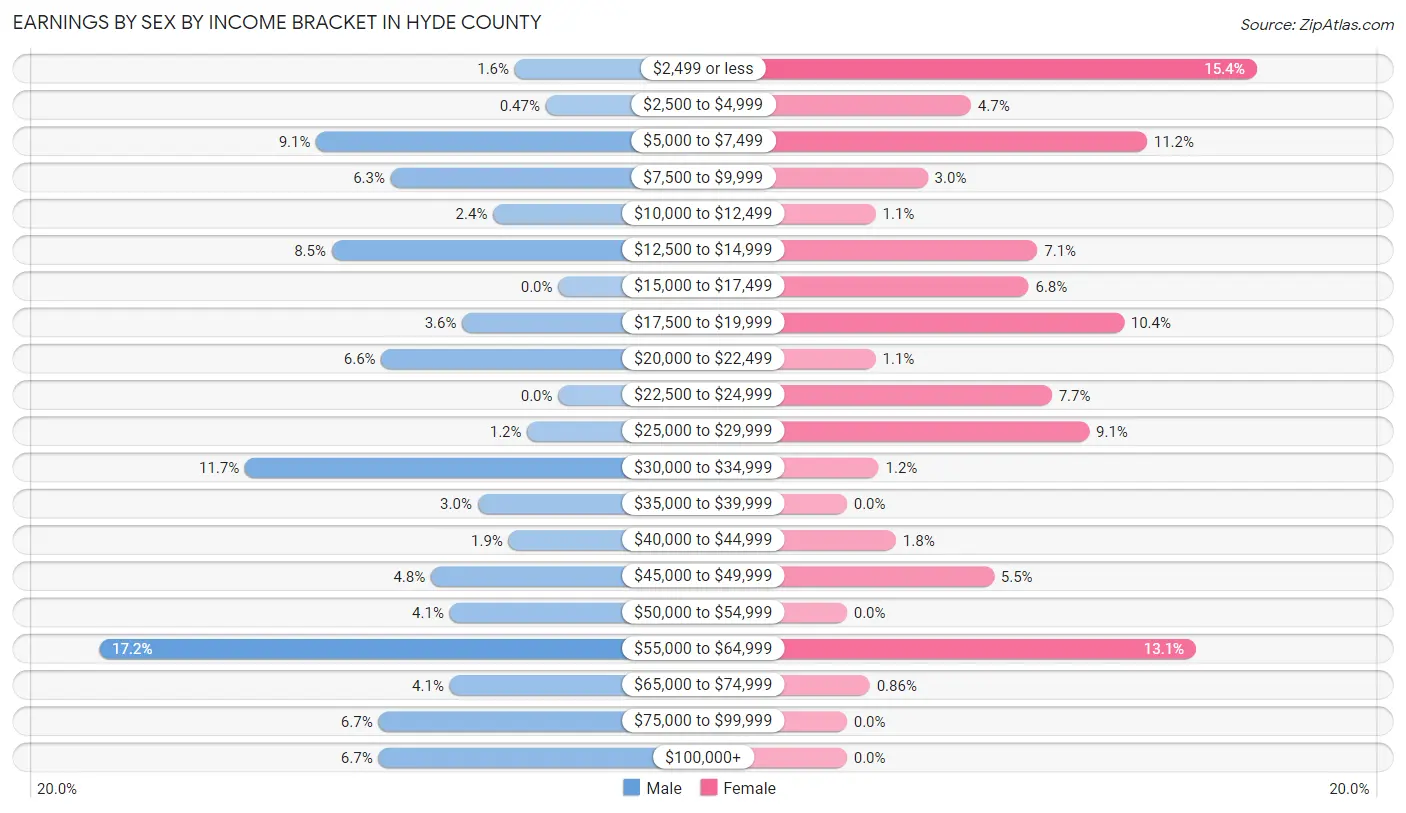
| Income | Male | Female |
| $2,499 or less | 14 (1.6%) | 142 (15.3%) |
| $2,500 to $4,999 | 4 (0.5%) | 43 (4.6%) |
| $5,000 to $7,499 | 78 (9.1%) | 104 (11.2%) |
| $7,500 to $9,999 | 54 (6.3%) | 28 (3.0%) |
| $10,000 to $12,499 | 21 (2.4%) | 10 (1.1%) |
| $12,500 to $14,999 | 73 (8.5%) | 66 (7.1%) |
| $15,000 to $17,499 | 0 (0.0%) | 63 (6.8%) |
| $17,500 to $19,999 | 31 (3.6%) | 96 (10.4%) |
| $20,000 to $22,499 | 57 (6.6%) | 10 (1.1%) |
| $22,500 to $24,999 | 0 (0.0%) | 71 (7.7%) |
| $25,000 to $29,999 | 10 (1.2%) | 84 (9.1%) |
| $30,000 to $34,999 | 101 (11.7%) | 11 (1.2%) |
| $35,000 to $39,999 | 26 (3.0%) | 0 (0.0%) |
| $40,000 to $44,999 | 16 (1.9%) | 17 (1.8%) |
| $45,000 to $49,999 | 41 (4.8%) | 51 (5.5%) |
| $50,000 to $54,999 | 35 (4.1%) | 0 (0.0%) |
| $55,000 to $64,999 | 148 (17.2%) | 121 (13.1%) |
| $65,000 to $74,999 | 35 (4.1%) | 8 (0.9%) |
| $75,000 to $99,999 | 58 (6.7%) | 0 (0.0%) |
| $100,000+ | 58 (6.7%) | 0 (0.0%) |
| Total | 860 (100.0%) | 925 (100.0%) |
Earnings by Sex by Educational Attainment in Hyde County
Average earnings in Hyde County are $34,286 for men and $17,891 for women, a difference of 47.8%. Men with an educational attainment of college or associate's degree enjoy the highest average annual earnings of $55,308, while those with high school diploma education earn the least with $31,056. Women with an educational attainment of graduate degree earn the most with the average annual earnings of $55,227, while those with high school diploma education have the smallest earnings of $17,936.
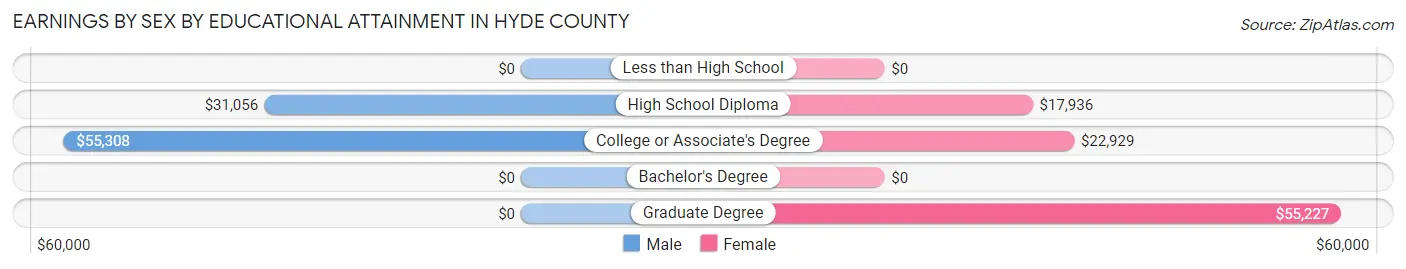
| Educational Attainment | Male Income | Female Income |
| Less than High School | - | - |
| High School Diploma | $31,056 | $17,936 |
| College or Associate's Degree | $55,308 | $22,929 |
| Bachelor's Degree | - | - |
| Graduate Degree | - | - |
| Total | $34,286 | $17,891 |
Family Income in Hyde County
Family Income Brackets in Hyde County
According to the Hyde County family income data, there are 362 families falling into the $50,000 to $74,999 income range, which is the most common income bracket and makes up 27.3% of all families.
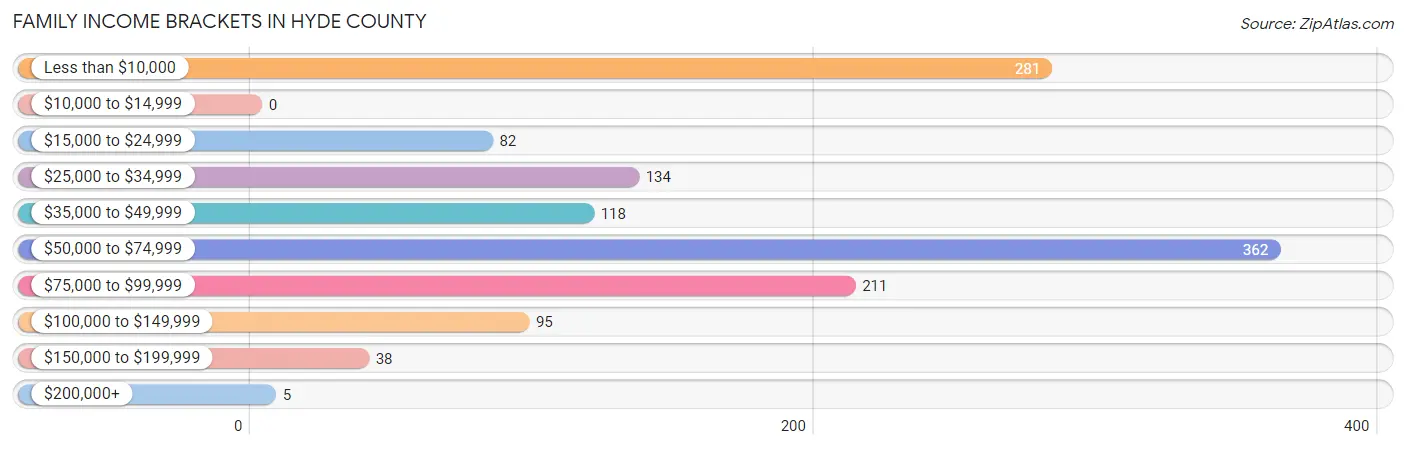
| Income Bracket | # Families | % Families |
| Less than $10,000 | 281 | 21.2% |
| $10,000 to $14,999 | 0 | 0.0% |
| $15,000 to $24,999 | 82 | 6.2% |
| $25,000 to $34,999 | 134 | 10.1% |
| $35,000 to $49,999 | 118 | 8.9% |
| $50,000 to $74,999 | 362 | 27.3% |
| $75,000 to $99,999 | 211 | 15.9% |
| $100,000 to $149,999 | 95 | 7.2% |
| $150,000 to $199,999 | 38 | 2.9% |
| $200,000+ | 5 | 0.4% |
Family Income by Famaliy Size in Hyde County
2-person families (865 | 65.2%) account for the highest median family income in Hyde County with $55,806 per family, while 2-person families (865 | 65.2%) have the highest median income of $27,903 per family member.
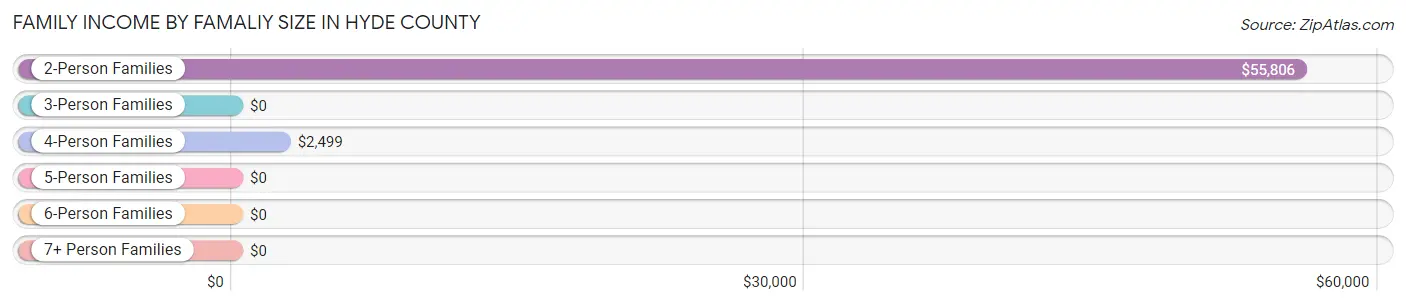
| Income Bracket | # Families | Median Income |
| 2-Person Families | 865 (65.2%) | $55,806 |
| 3-Person Families | 273 (20.6%) | $0 |
| 4-Person Families | 167 (12.6%) | $2,499 |
| 5-Person Families | 0 (0.0%) | $0 |
| 6-Person Families | 21 (1.6%) | $0 |
| 7+ Person Families | 0 (0.0%) | $0 |
| Total | 1,326 (100.0%) | $51,263 |
Family Income by Number of Earners in Hyde County
The median family income in Hyde County is $51,263, with families comprising 3+ earners (94) having the highest median family income of $84,031, while families with no earners (355) have the lowest median family income of $19,682, accounting for 7.1% and 26.8% of families, respectively.
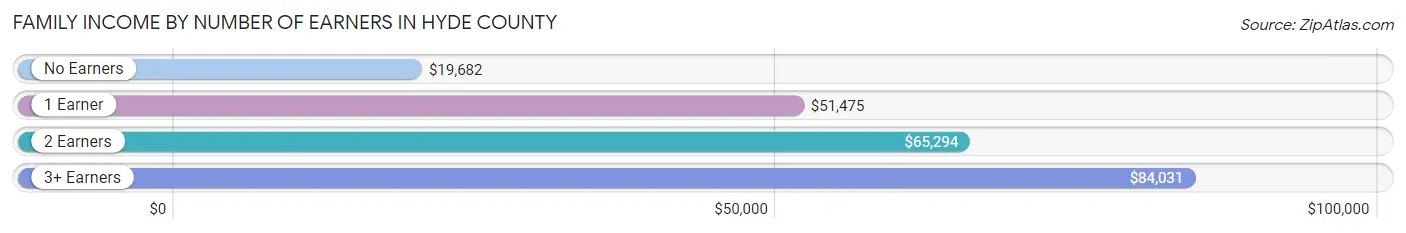
| Number of Earners | # Families | Median Income |
| No Earners | 355 (26.8%) | $19,682 |
| 1 Earner | 483 (36.4%) | $51,475 |
| 2 Earners | 394 (29.7%) | $65,294 |
| 3+ Earners | 94 (7.1%) | $84,031 |
| Total | 1,326 (100.0%) | $51,263 |
Household Income in Hyde County
Household Income Brackets in Hyde County
With 498 households falling in the category, the $50,000 to $74,999 income range is the most frequent in Hyde County, accounting for 24.9% of all households. In contrast, only 4 households (0.2%) fall into the $200,000+ income bracket, making it the least populous group.
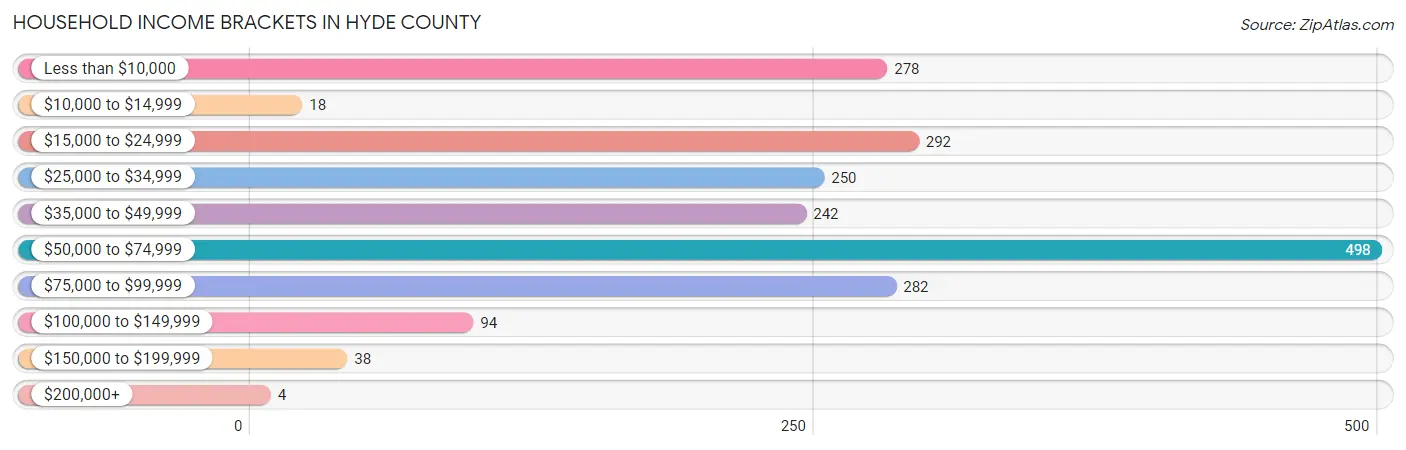
| Income Bracket | # Households | % Households |
| Less than $10,000 | 278 | 13.9% |
| $10,000 to $14,999 | 18 | 0.9% |
| $15,000 to $24,999 | 292 | 14.6% |
| $25,000 to $34,999 | 250 | 12.5% |
| $35,000 to $49,999 | 242 | 12.1% |
| $50,000 to $74,999 | 498 | 24.9% |
| $75,000 to $99,999 | 282 | 14.1% |
| $100,000 to $149,999 | 94 | 4.7% |
| $150,000 to $199,999 | 38 | 1.9% |
| $200,000+ | 4 | 0.2% |
Household Income by Householder Age in Hyde County
The median household income in Hyde County is $43,724, with the highest median household income of $65,282 found in the 45 to 64 years age bracket for the primary householder. A total of 784 households (39.2%) fall into this category.
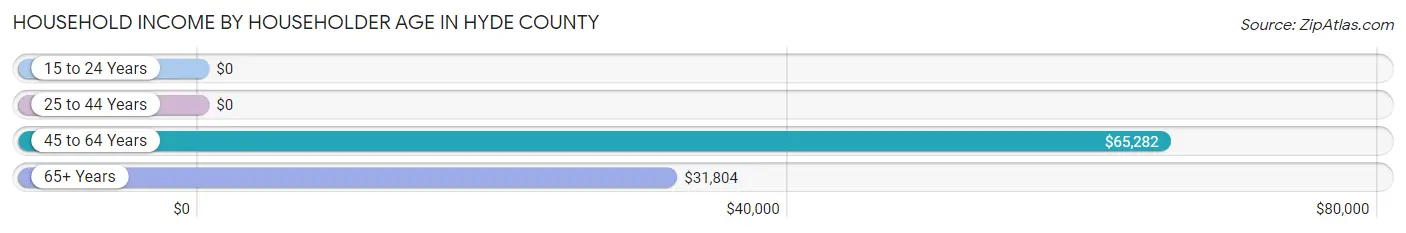
| Income Bracket | # Households | Median Income |
| 15 to 24 Years | 0 (0.0%) | $0 |
| 25 to 44 Years | 451 (22.5%) | $0 |
| 45 to 64 Years | 784 (39.2%) | $65,282 |
| 65+ Years | 767 (38.3%) | $31,804 |
| Total | 2,002 (100.0%) | $43,724 |
Poverty in Hyde County
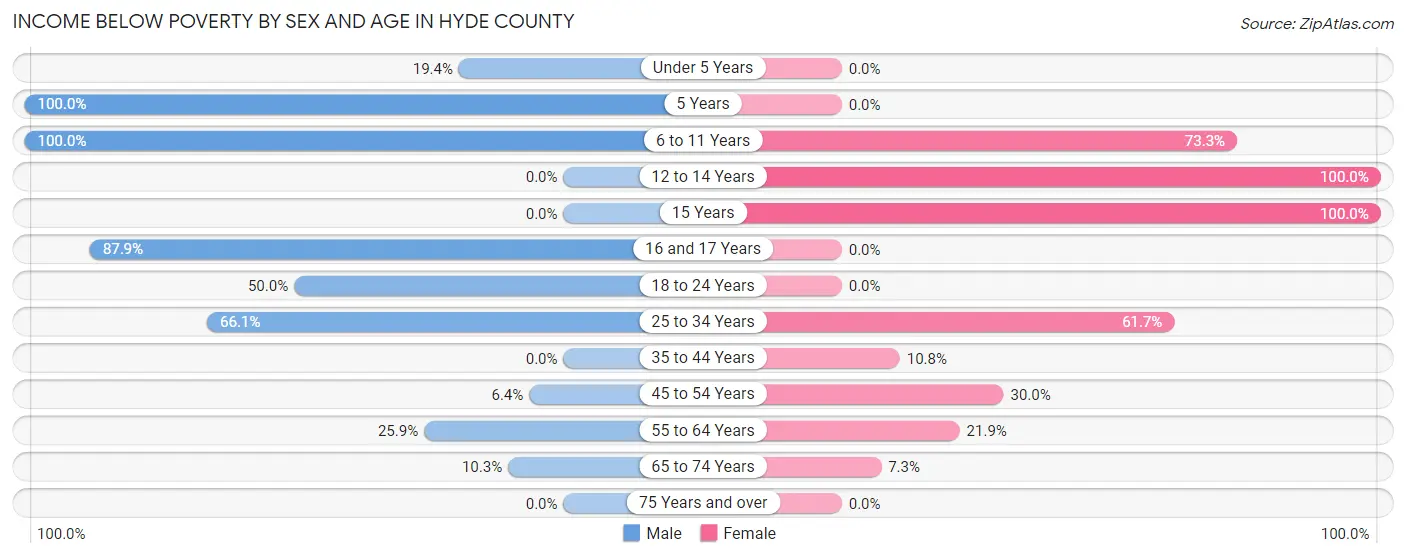
Income Below Poverty by Sex and Age in Hyde County
With 25.8% poverty level for males and 33.3% for females among the residents of Hyde County, 5 year old males and 12 to 14 year old females are the most vulnerable to poverty, with 82 males (100.0%) and 80 females (100.0%) in their respective age groups living below the poverty level.
| Age Bracket | Male | Female |
| Under 5 Years | 33 (19.4%) | 0 (0.0%) |
| 5 Years | 82 (100.0%) | 0 (0.0%) |
| 6 to 11 Years | 113 (100.0%) | 187 (73.3%) |
| 12 to 14 Years | 0 (0.0%) | 80 (100.0%) |
| 15 Years | 0 (0.0%) | 42 (100.0%) |
| 16 and 17 Years | 29 (87.9%) | 0 (0.0%) |
| 18 to 24 Years | 1 (50.0%) | 0 (0.0%) |
| 25 to 34 Years | 80 (66.1%) | 190 (61.7%) |
| 35 to 44 Years | 0 (0.0%) | 17 (10.8%) |
| 45 to 54 Years | 8 (6.4%) | 106 (30.0%) |
| 55 to 64 Years | 89 (25.9%) | 91 (21.9%) |
| 65 to 74 Years | 33 (10.3%) | 28 (7.3%) |
| 75 Years and over | 0 (0.0%) | 0 (0.0%) |
| Total | 468 (25.8%) | 741 (33.3%) |
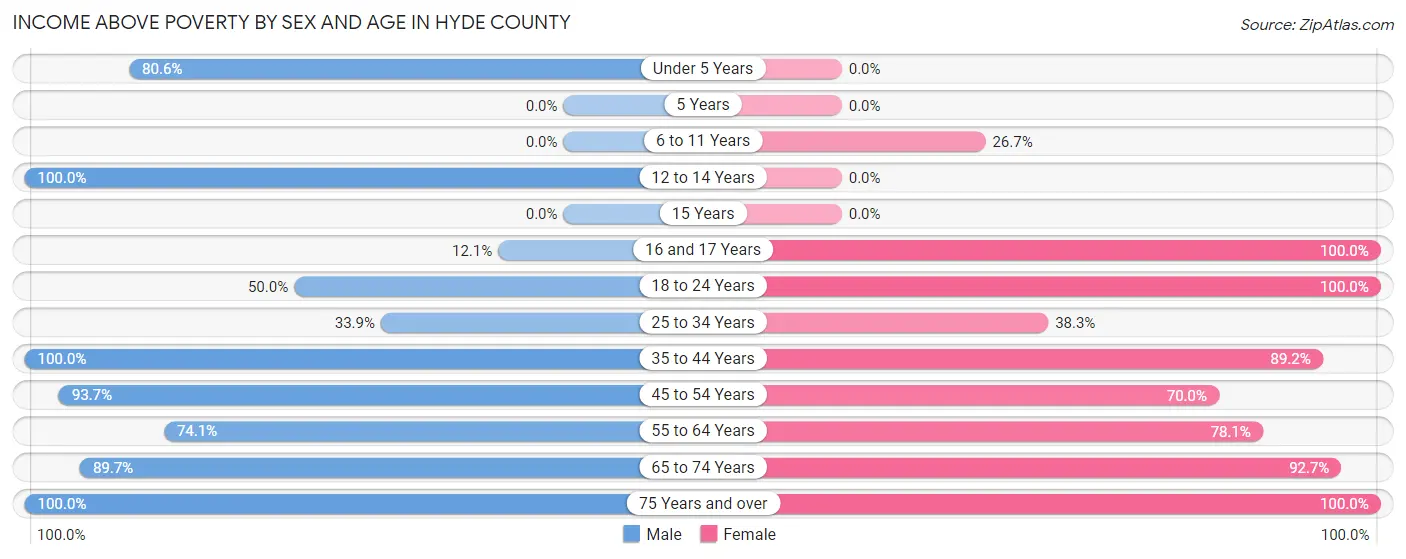
Income Above Poverty by Sex and Age in Hyde County
According to the poverty statistics in Hyde County, males aged 12 to 14 years and females aged 16 and 17 years are the age groups that are most secure financially, with 100.0% of males and 100.0% of females in these age groups living above the poverty line.
| Age Bracket | Male | Female |
| Under 5 Years | 137 (80.6%) | 0 (0.0%) |
| 5 Years | 0 (0.0%) | 0 (0.0%) |
| 6 to 11 Years | 0 (0.0%) | 68 (26.7%) |
| 12 to 14 Years | 94 (100.0%) | 0 (0.0%) |
| 15 Years | 0 (0.0%) | 0 (0.0%) |
| 16 and 17 Years | 4 (12.1%) | 46 (100.0%) |
| 18 to 24 Years | 1 (50.0%) | 4 (100.0%) |
| 25 to 34 Years | 41 (33.9%) | 118 (38.3%) |
| 35 to 44 Years | 275 (100.0%) | 141 (89.2%) |
| 45 to 54 Years | 118 (93.6%) | 247 (70.0%) |
| 55 to 64 Years | 255 (74.1%) | 325 (78.1%) |
| 65 to 74 Years | 288 (89.7%) | 355 (92.7%) |
| 75 Years and over | 134 (100.0%) | 182 (100.0%) |
| Total | 1,347 (74.2%) | 1,486 (66.7%) |
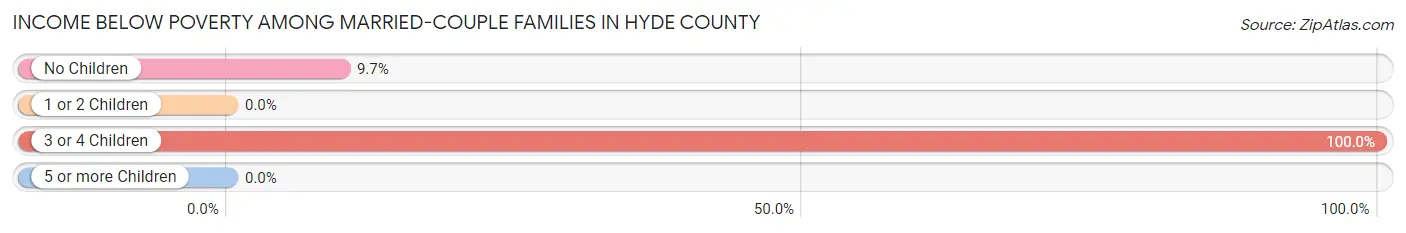
Income Below Poverty Among Married-Couple Families in Hyde County
The poverty statistics for married-couple families in Hyde County show that 9.7% or 83 of the total 859 families live below the poverty line. Families with 3 or 4 children have the highest poverty rate of 100.0%, comprising of 9 families. On the other hand, families with 1 or 2 children have the lowest poverty rate of 0.0%, which includes 0 families.
| Children | Above Poverty | Below Poverty |
| No Children | 686 (90.3%) | 74 (9.7%) |
| 1 or 2 Children | 90 (100.0%) | 0 (0.0%) |
| 3 or 4 Children | 0 (0.0%) | 9 (100.0%) |
| 5 or more Children | 0 (0.0%) | 0 (0.0%) |
| Total | 776 (90.3%) | 83 (9.7%) |
Income Below Poverty Among Single-Parent Households in Hyde County
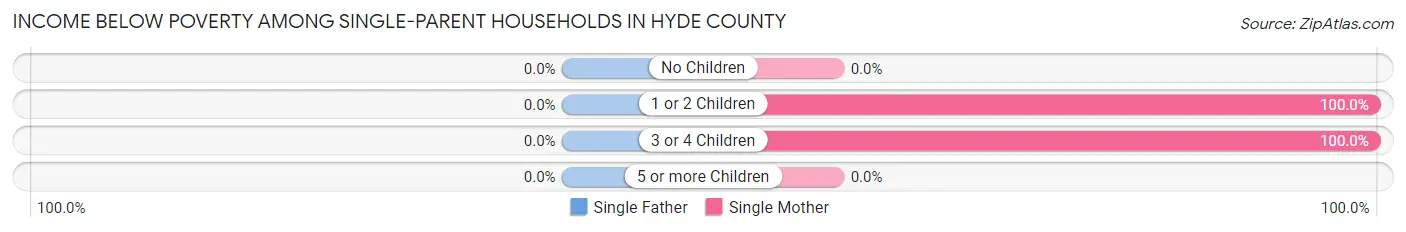
| Children | Single Father | Single Mother |
| No Children | 0 (0.0%) | 0 (0.0%) |
| 1 or 2 Children | 0 (0.0%) | 155 (100.0%) |
| 3 or 4 Children | 0 (0.0%) | 102 (100.0%) |
| 5 or more Children | 0 (0.0%) | 0 (0.0%) |
| Total | 0 (0.0%) | 257 (68.2%) |
Income Below Poverty Among Married-Couple vs Single-Parent Households in Hyde County
The poverty data for Hyde County shows that 83 of the married-couple family households (9.7%) and 257 of the single-parent households (55.0%) are living below the poverty level. Within the married-couple family households, those with 3 or 4 children have the highest poverty rate, with 9 households (100.0%) falling below the poverty line. Among the single-parent households, those with 3 or 4 children have the highest poverty rate, with 102 household (100.0%) living below poverty.
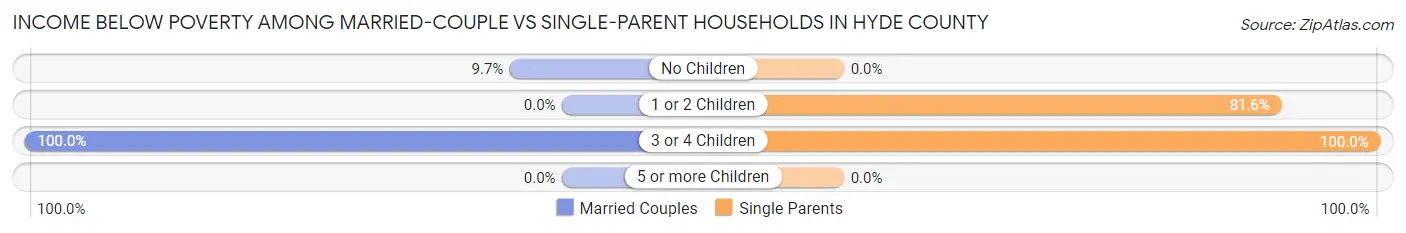
| Children | Married-Couple Families | Single-Parent Households |
| No Children | 74 (9.7%) | 0 (0.0%) |
| 1 or 2 Children | 0 (0.0%) | 155 (81.6%) |
| 3 or 4 Children | 9 (100.0%) | 102 (100.0%) |
| 5 or more Children | 0 (0.0%) | 0 (0.0%) |
| Total | 83 (9.7%) | 257 (55.0%) |
Employment Characteristics in Hyde County
Employment by Class of Employer in Hyde County
Among the 1,325 employed individuals in Hyde County, private company employees (592 | 44.7%), self-employed (not incorporated) (223 | 16.8%), and local government employees (215 | 16.2%) make up the most common classes of employment.
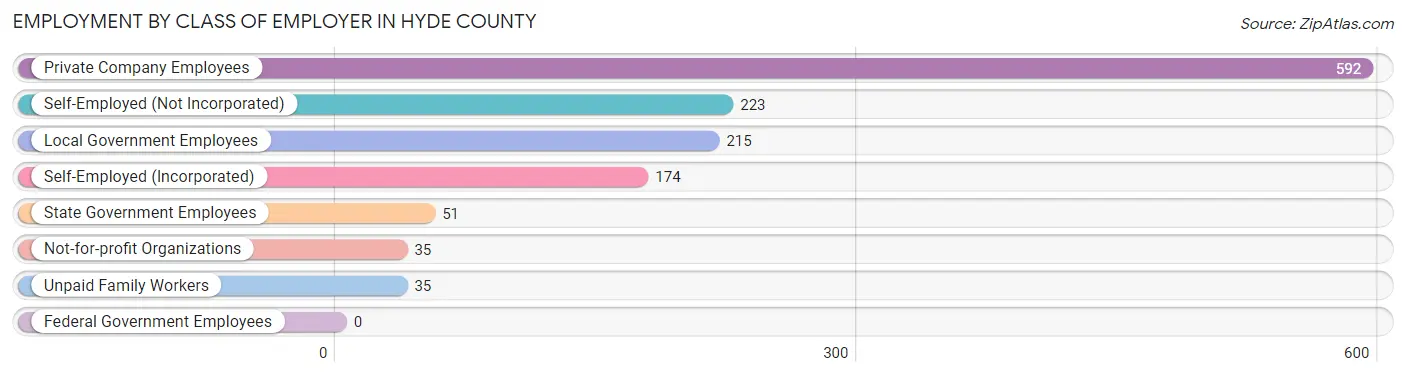
| Employer Class | # Employees | % Employees |
| Private Company Employees | 592 | 44.7% |
| Self-Employed (Incorporated) | 174 | 13.1% |
| Self-Employed (Not Incorporated) | 223 | 16.8% |
| Not-for-profit Organizations | 35 | 2.6% |
| Local Government Employees | 215 | 16.2% |
| State Government Employees | 51 | 3.8% |
| Federal Government Employees | 0 | 0.0% |
| Unpaid Family Workers | 35 | 2.6% |
| Total | 1,325 | 100.0% |
Employment Status by Age in Hyde County
According to the labor force statistics for Hyde County, out of the total population over 16 years of age (3,800), 40.7% or 1,547 individuals are in the labor force, with 8.7% or 135 of them unemployed. The age group with the highest labor force participation rate is 45 to 54 years, with 60.3% or 356 individuals in the labor force. Within the labor force, the 30 to 34 years age range has the highest percentage of unemployed individuals, with 66.9% or 87 of them being unemployed.
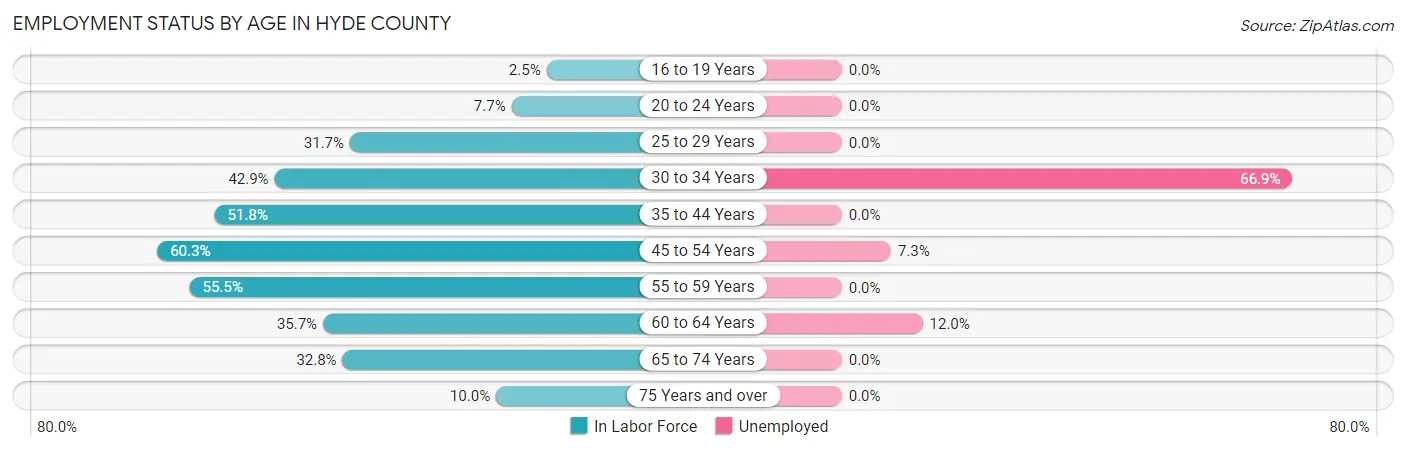
| Age Bracket | In Labor Force | Unemployed |
| 16 to 19 Years | 2 (2.5%) | 0 (0.0%) |
| 20 to 24 Years | 1 (7.7%) | 0 (0.0%) |
| 25 to 29 Years | 71 (31.7%) | 0 (0.0%) |
| 30 to 34 Years | 130 (42.9%) | 87 (66.9%) |
| 35 to 44 Years | 347 (51.8%) | 0 (0.0%) |
| 45 to 54 Years | 356 (60.3%) | 26 (7.3%) |
| 55 to 59 Years | 178 (55.5%) | 0 (0.0%) |
| 60 to 64 Years | 184 (35.7%) | 22 (12.0%) |
| 65 to 74 Years | 241 (32.8%) | 0 (0.0%) |
| 75 Years and over | 35 (10.0%) | 0 (0.0%) |
| Total | 1,547 (40.7%) | 135 (8.7%) |
Employment Status by Educational Attainment in Hyde County
According to labor force statistics for Hyde County, 48.3% of individuals (1,267) out of the total population between 25 and 64 years of age (2,623) are in the labor force, with 10.7% or 136 of them being unemployed. The group with the highest labor force participation rate are those with the educational attainment of college / associate degree, with 52.7% or 384 individuals in the labor force. Within the labor force, individuals with less than high school education have the highest percentage of unemployment, with 44.5% or 113 of them being unemployed.
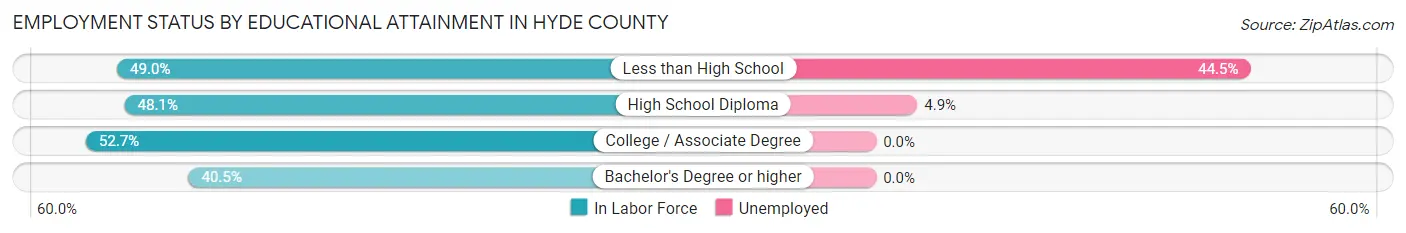
| Educational Attainment | In Labor Force | Unemployed |
| Less than High School | 254 (49.0%) | 231 (44.5%) |
| High School Diploma | 445 (48.1%) | 45 (4.9%) |
| College / Associate Degree | 384 (52.7%) | 0 (0.0%) |
| Bachelor's Degree or higher | 183 (40.5%) | 0 (0.0%) |
| Total | 1,267 (48.3%) | 281 (10.7%) |
Employment Occupations by Sex in Hyde County
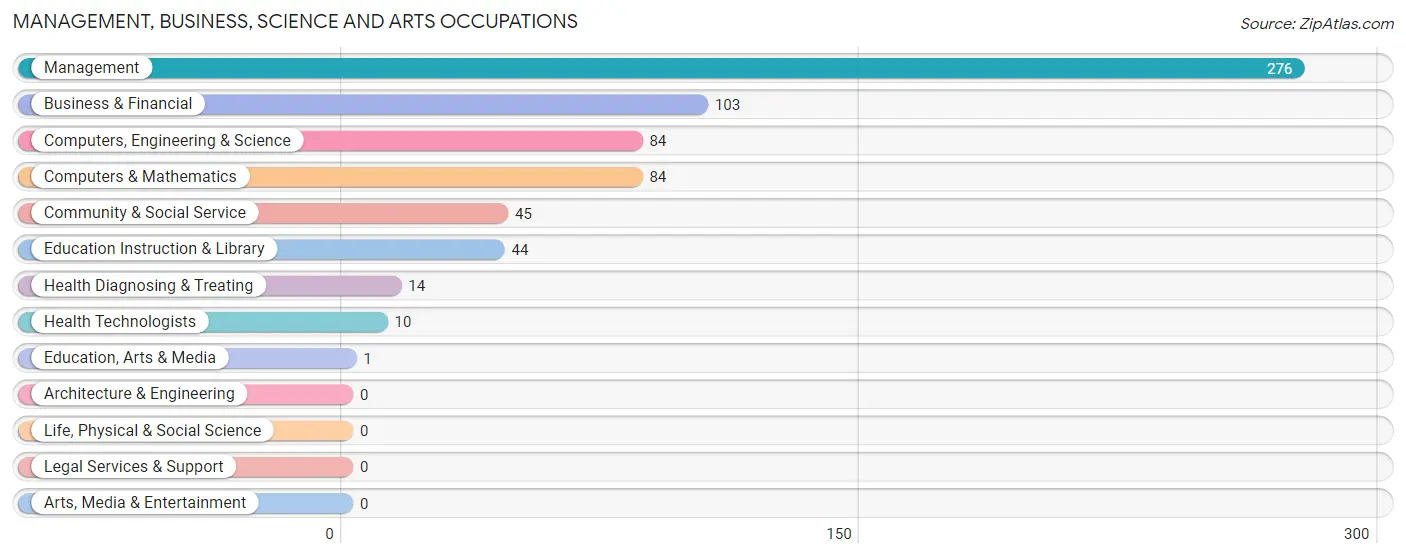
Management, Business, Science and Arts Occupations
The most common Management, Business, Science and Arts occupations in Hyde County are Management (276 | 19.6%), Business & Financial (103 | 7.3%), Computers, Engineering & Science (84 | 6.0%), Computers & Mathematics (84 | 6.0%), and Community & Social Service (45 | 3.2%).
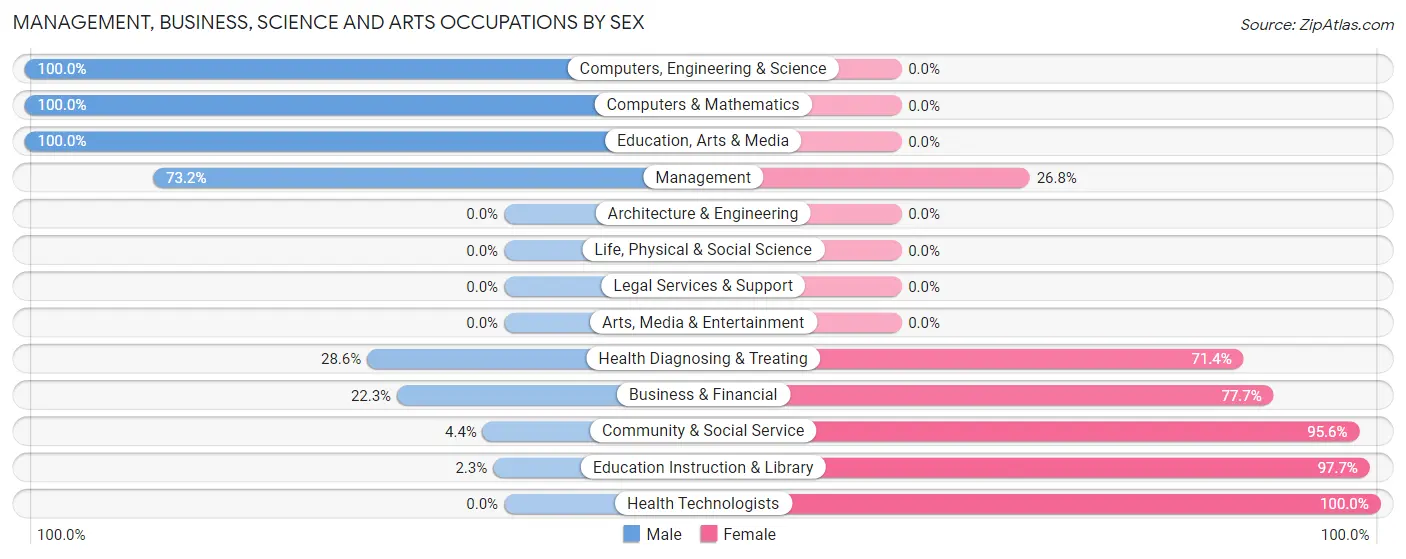
Management, Business, Science and Arts Occupations by Sex
Within the Management, Business, Science and Arts occupations in Hyde County, the most male-oriented occupations are Computers, Engineering & Science (100.0%), Computers & Mathematics (100.0%), and Education, Arts & Media (100.0%), while the most female-oriented occupations are Health Technologists (100.0%), Education Instruction & Library (97.7%), and Community & Social Service (95.6%).
| Occupation | Male | Female |
| Management | 202 (73.2%) | 74 (26.8%) |
| Business & Financial | 23 (22.3%) | 80 (77.7%) |
| Computers, Engineering & Science | 84 (100.0%) | 0 (0.0%) |
| Computers & Mathematics | 84 (100.0%) | 0 (0.0%) |
| Architecture & Engineering | 0 (0.0%) | 0 (0.0%) |
| Life, Physical & Social Science | 0 (0.0%) | 0 (0.0%) |
| Community & Social Service | 2 (4.4%) | 43 (95.6%) |
| Education, Arts & Media | 1 (100.0%) | 0 (0.0%) |
| Legal Services & Support | 0 (0.0%) | 0 (0.0%) |
| Education Instruction & Library | 1 (2.3%) | 43 (97.7%) |
| Arts, Media & Entertainment | 0 (0.0%) | 0 (0.0%) |
| Health Diagnosing & Treating | 4 (28.6%) | 10 (71.4%) |
| Health Technologists | 0 (0.0%) | 10 (100.0%) |
| Total (Category) | 315 (60.3%) | 207 (39.7%) |
| Total (Overall) | 730 (51.8%) | 680 (48.2%) |
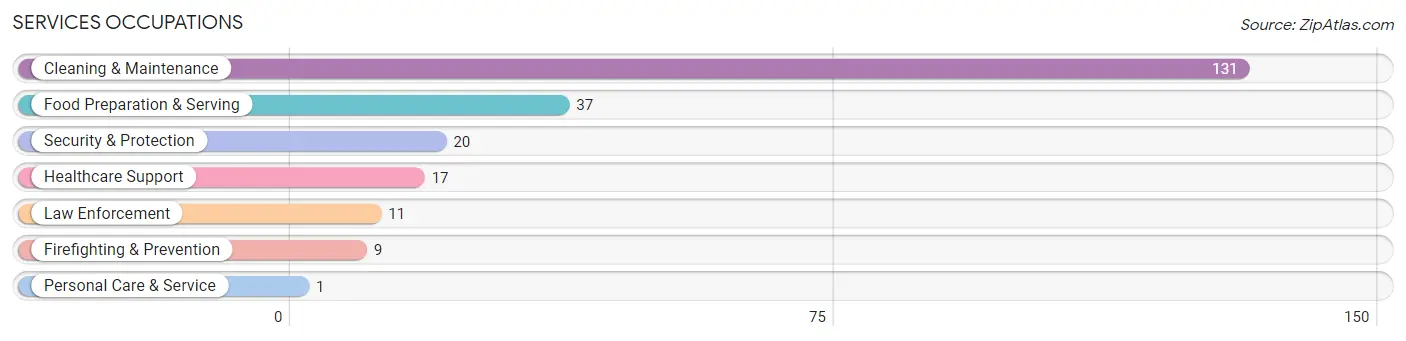
Services Occupations
The most common Services occupations in Hyde County are Cleaning & Maintenance (131 | 9.3%), Food Preparation & Serving (37 | 2.6%), Security & Protection (20 | 1.4%), Healthcare Support (17 | 1.2%), and Law Enforcement (11 | 0.8%).
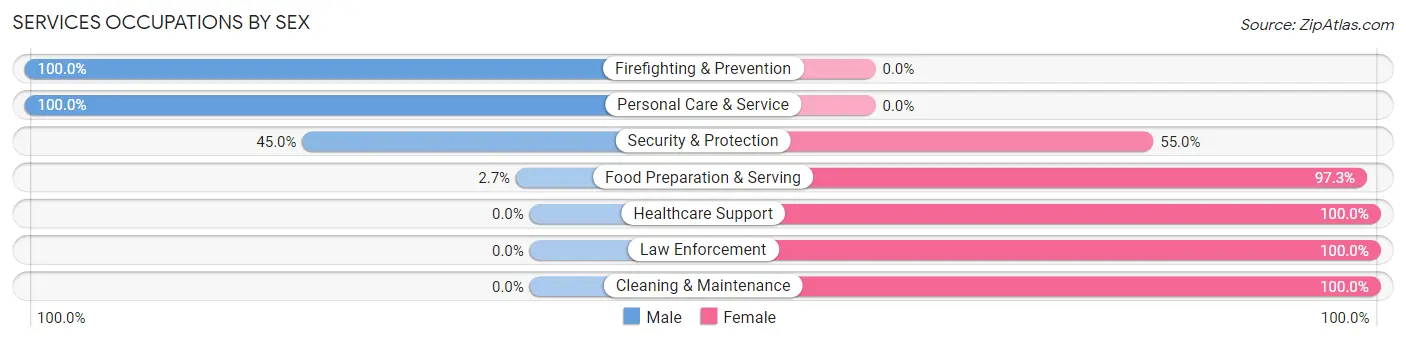
Services Occupations by Sex
Within the Services occupations in Hyde County, the most male-oriented occupations are Firefighting & Prevention (100.0%), Personal Care & Service (100.0%), and Security & Protection (45.0%), while the most female-oriented occupations are Healthcare Support (100.0%), Law Enforcement (100.0%), and Cleaning & Maintenance (100.0%).
| Occupation | Male | Female |
| Healthcare Support | 0 (0.0%) | 17 (100.0%) |
| Security & Protection | 9 (45.0%) | 11 (55.0%) |
| Firefighting & Prevention | 9 (100.0%) | 0 (0.0%) |
| Law Enforcement | 0 (0.0%) | 11 (100.0%) |
| Food Preparation & Serving | 1 (2.7%) | 36 (97.3%) |
| Cleaning & Maintenance | 0 (0.0%) | 131 (100.0%) |
| Personal Care & Service | 1 (100.0%) | 0 (0.0%) |
| Total (Category) | 11 (5.3%) | 195 (94.7%) |
| Total (Overall) | 730 (51.8%) | 680 (48.2%) |
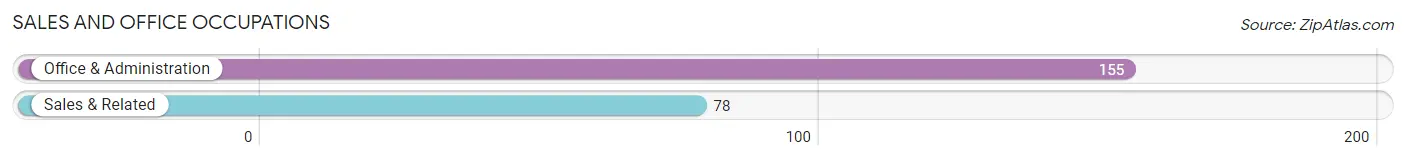
Sales and Office Occupations
The most common Sales and Office occupations in Hyde County are Office & Administration (155 | 11.0%), and Sales & Related (78 | 5.5%).
Sales and Office Occupations by Sex
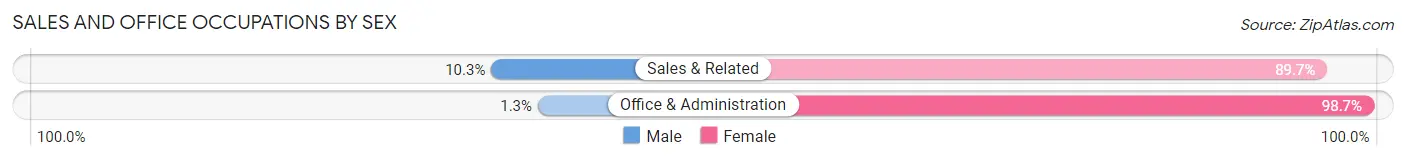
| Occupation | Male | Female |
| Sales & Related | 8 (10.3%) | 70 (89.7%) |
| Office & Administration | 2 (1.3%) | 153 (98.7%) |
| Total (Category) | 10 (4.3%) | 223 (95.7%) |
| Total (Overall) | 730 (51.8%) | 680 (48.2%) |
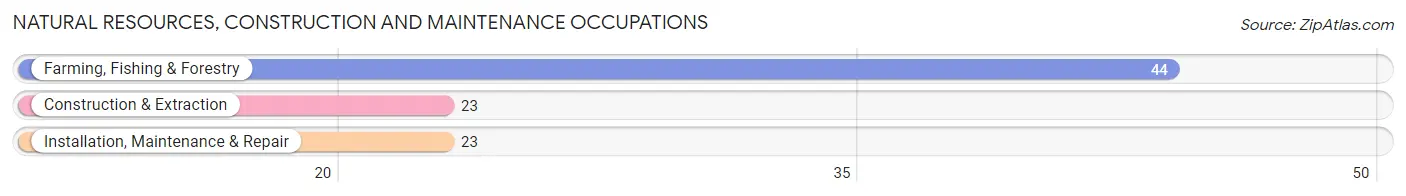
Natural Resources, Construction and Maintenance Occupations
The most common Natural Resources, Construction and Maintenance occupations in Hyde County are Farming, Fishing & Forestry (44 | 3.1%), Construction & Extraction (23 | 1.6%), and Installation, Maintenance & Repair (23 | 1.6%).
Natural Resources, Construction and Maintenance Occupations by Sex
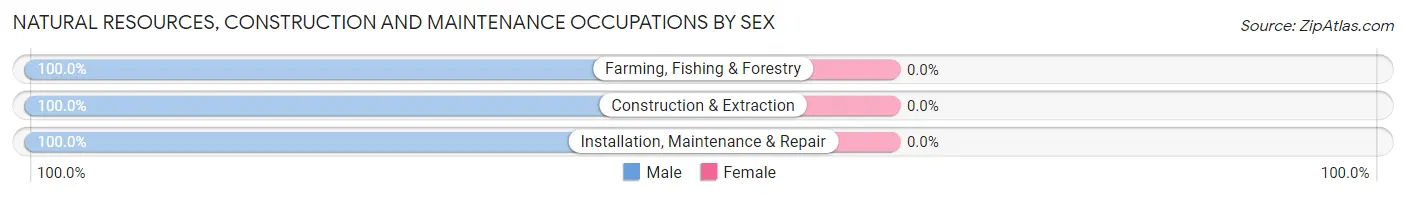
| Occupation | Male | Female |
| Farming, Fishing & Forestry | 44 (100.0%) | 0 (0.0%) |
| Construction & Extraction | 23 (100.0%) | 0 (0.0%) |
| Installation, Maintenance & Repair | 23 (100.0%) | 0 (0.0%) |
| Total (Category) | 90 (100.0%) | 0 (0.0%) |
| Total (Overall) | 730 (51.8%) | 680 (48.2%) |
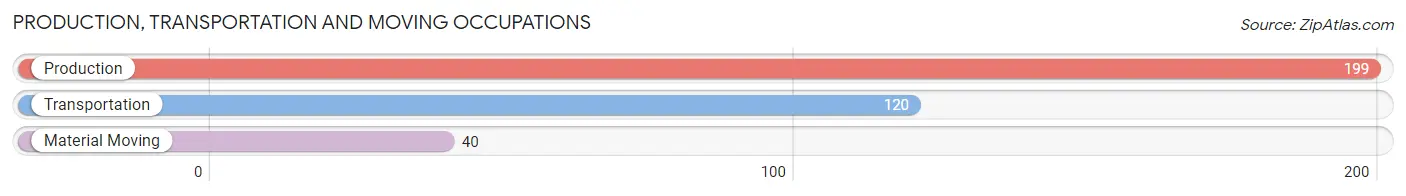
Production, Transportation and Moving Occupations
The most common Production, Transportation and Moving occupations in Hyde County are Production (199 | 14.1%), Transportation (120 | 8.5%), and Material Moving (40 | 2.8%).
Production, Transportation and Moving Occupations by Sex
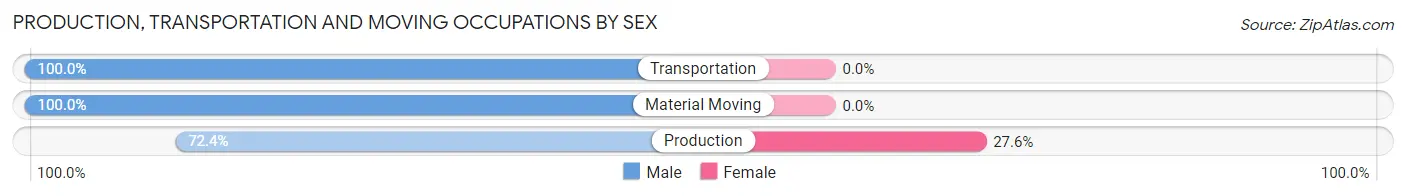
| Occupation | Male | Female |
| Production | 144 (72.4%) | 55 (27.6%) |
| Transportation | 120 (100.0%) | 0 (0.0%) |
| Material Moving | 40 (100.0%) | 0 (0.0%) |
| Total (Category) | 304 (84.7%) | 55 (15.3%) |
| Total (Overall) | 730 (51.8%) | 680 (48.2%) |
Employment Industries by Sex in Hyde County
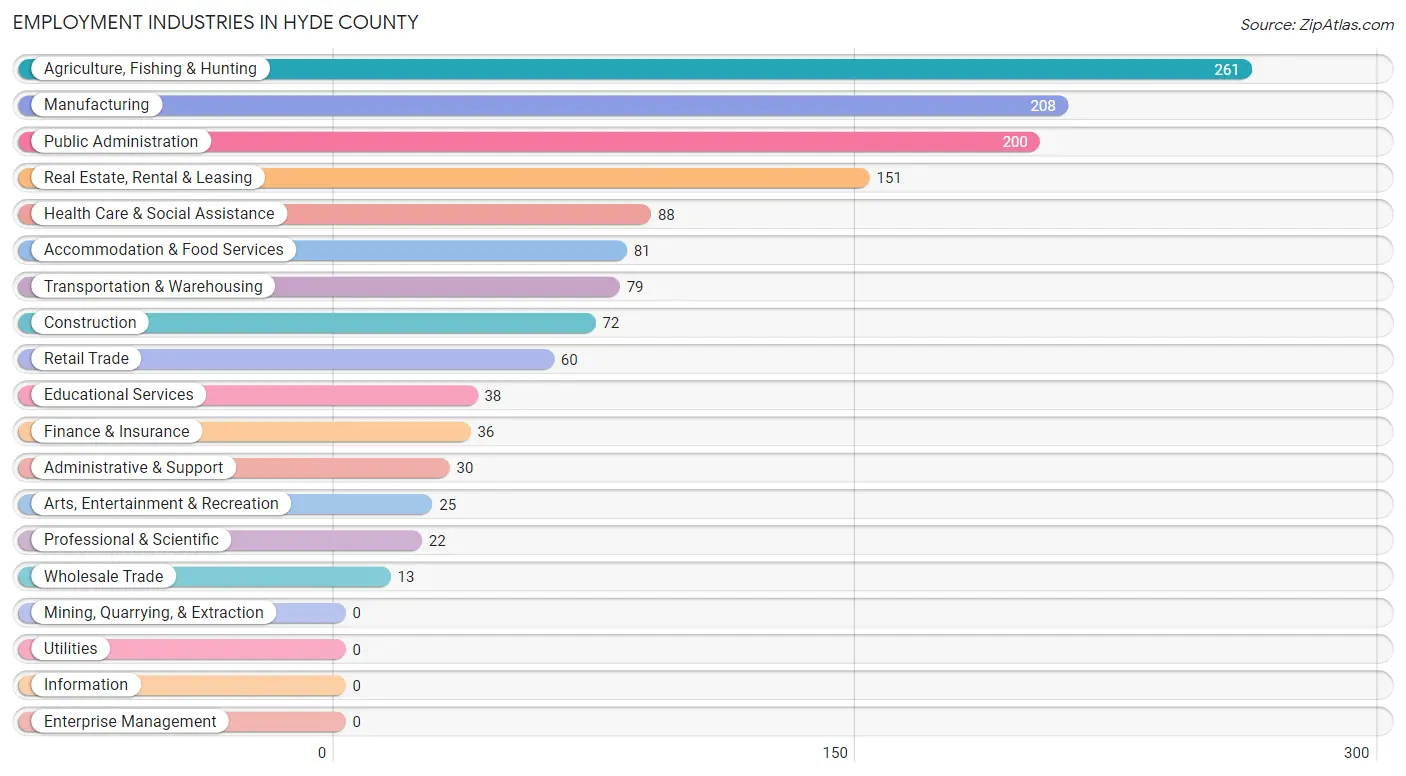
Employment Industries in Hyde County
The major employment industries in Hyde County include Agriculture, Fishing & Hunting (261 | 18.5%), Manufacturing (208 | 14.7%), Public Administration (200 | 14.2%), Real Estate, Rental & Leasing (151 | 10.7%), and Health Care & Social Assistance (88 | 6.2%).
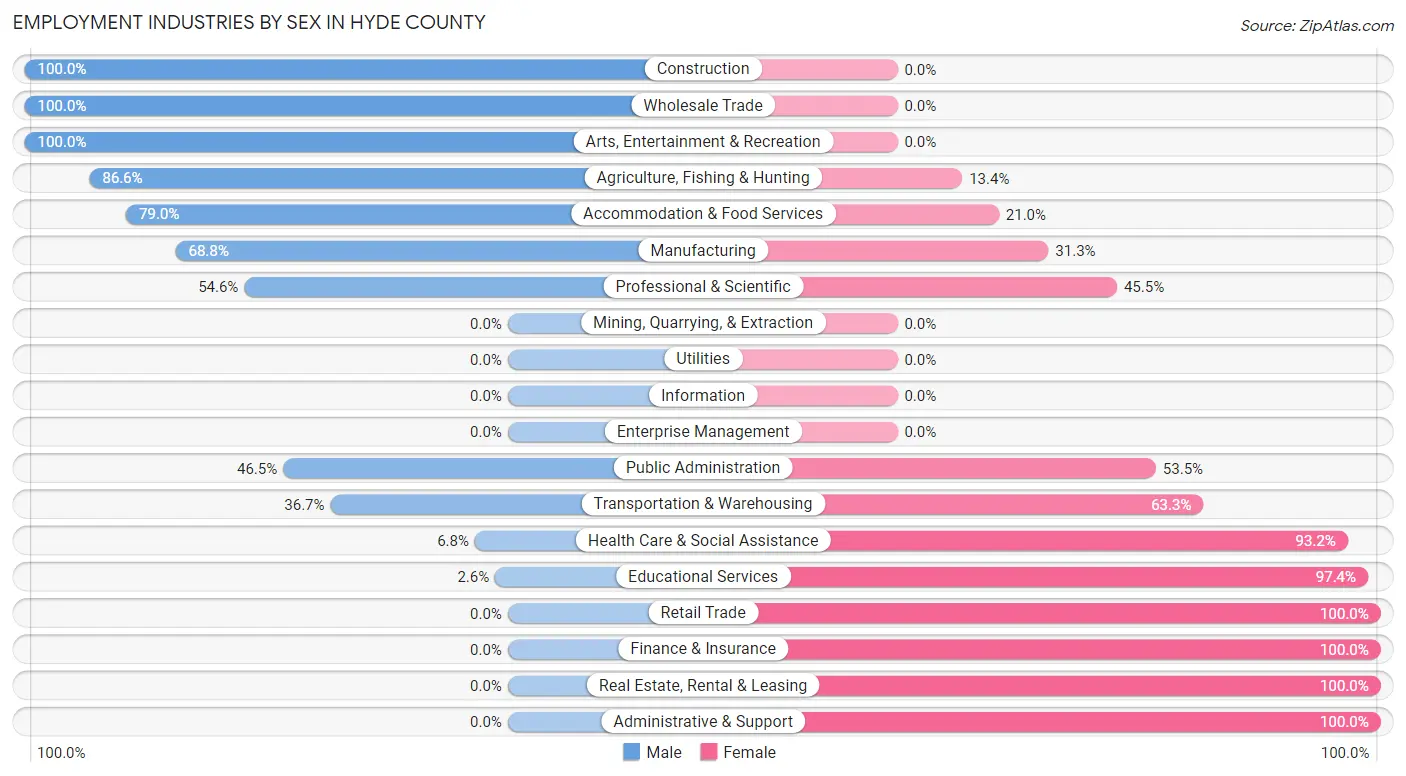
Employment Industries by Sex in Hyde County
The Hyde County industries that see more men than women are Construction (100.0%), Wholesale Trade (100.0%), and Arts, Entertainment & Recreation (100.0%), whereas the industries that tend to have a higher number of women are Retail Trade (100.0%), Finance & Insurance (100.0%), and Real Estate, Rental & Leasing (100.0%).
| Industry | Male | Female |
| Agriculture, Fishing & Hunting | 226 (86.6%) | 35 (13.4%) |
| Mining, Quarrying, & Extraction | 0 (0.0%) | 0 (0.0%) |
| Construction | 72 (100.0%) | 0 (0.0%) |
| Manufacturing | 143 (68.8%) | 65 (31.2%) |
| Wholesale Trade | 13 (100.0%) | 0 (0.0%) |
| Retail Trade | 0 (0.0%) | 60 (100.0%) |
| Transportation & Warehousing | 29 (36.7%) | 50 (63.3%) |
| Utilities | 0 (0.0%) | 0 (0.0%) |
| Information | 0 (0.0%) | 0 (0.0%) |
| Finance & Insurance | 0 (0.0%) | 36 (100.0%) |
| Real Estate, Rental & Leasing | 0 (0.0%) | 151 (100.0%) |
| Professional & Scientific | 12 (54.5%) | 10 (45.5%) |
| Enterprise Management | 0 (0.0%) | 0 (0.0%) |
| Administrative & Support | 0 (0.0%) | 30 (100.0%) |
| Educational Services | 1 (2.6%) | 37 (97.4%) |
| Health Care & Social Assistance | 6 (6.8%) | 82 (93.2%) |
| Arts, Entertainment & Recreation | 25 (100.0%) | 0 (0.0%) |
| Accommodation & Food Services | 64 (79.0%) | 17 (21.0%) |
| Public Administration | 93 (46.5%) | 107 (53.5%) |
| Total | 730 (51.8%) | 680 (48.2%) |
Education in Hyde County
School Enrollment in Hyde County
The most common levels of schooling among the 788 students in Hyde County are middle school (351 | 44.5%), elementary school (256 | 32.5%), and high school (104 | 13.2%).
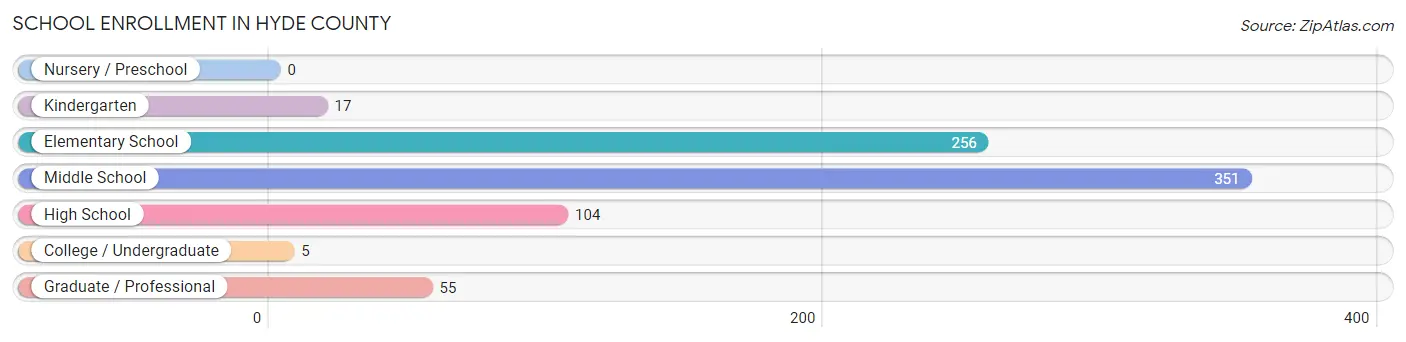
| School Level | # Students | % Students |
| Nursery / Preschool | 0 | 0.0% |
| Kindergarten | 17 | 2.2% |
| Elementary School | 256 | 32.5% |
| Middle School | 351 | 44.5% |
| High School | 104 | 13.2% |
| College / Undergraduate | 5 | 0.6% |
| Graduate / Professional | 55 | 7.0% |
| Total | 788 | 100.0% |
School Enrollment by Age by Funding Source in Hyde County
Out of a total of 788 students who are enrolled in schools in Hyde County, 50 (6.3%) attend a private institution, while the remaining 738 (93.7%) are enrolled in public schools. The age group of 10 to 14 year olds has the highest likelihood of being enrolled in private schools, with 50 (14.2% in the age bracket) enrolled. Conversely, the age group of 5 to 9 year old has the lowest likelihood of being enrolled in a private school, with 273 (100.0% in the age bracket) attending a public institution.
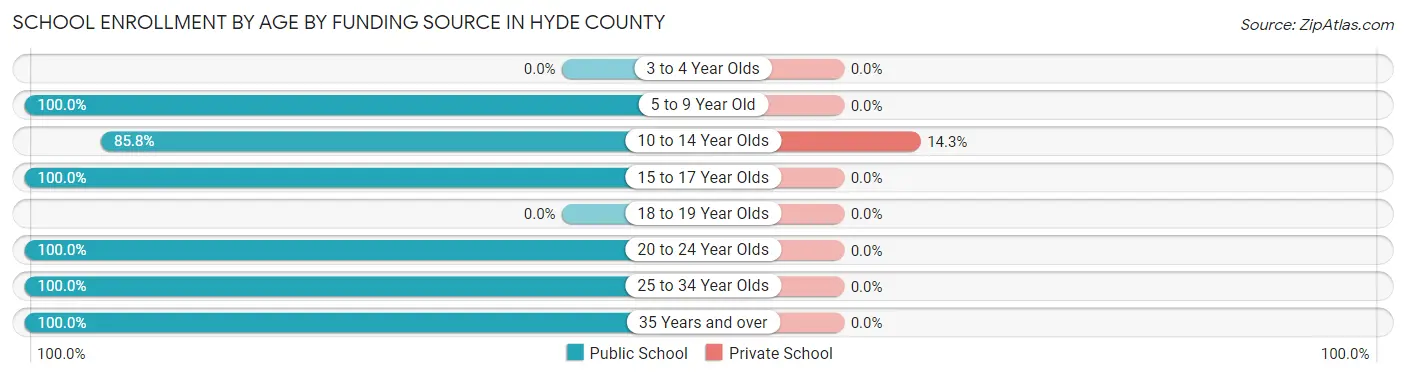
| Age Bracket | Public School | Private School |
| 3 to 4 Year Olds | 0 (0.0%) | 0 (0.0%) |
| 5 to 9 Year Old | 273 (100.0%) | 0 (0.0%) |
| 10 to 14 Year Olds | 301 (85.8%) | 50 (14.2%) |
| 15 to 17 Year Olds | 92 (100.0%) | 0 (0.0%) |
| 18 to 19 Year Olds | 0 (0.0%) | 0 (0.0%) |
| 20 to 24 Year Olds | 1 (100.0%) | 0 (0.0%) |
| 25 to 34 Year Olds | 40 (100.0%) | 0 (0.0%) |
| 35 Years and over | 31 (100.0%) | 0 (0.0%) |
| Total | 738 (93.7%) | 50 (6.3%) |
Educational Attainment by Field of Study in Hyde County
Education (104 | 19.7%), social sciences (103 | 19.5%), liberal arts & history (77 | 14.6%), business (70 | 13.3%), and bio, nature & agricultural (68 | 12.9%) are the most common fields of study among 528 individuals in Hyde County who have obtained a bachelor's degree or higher.
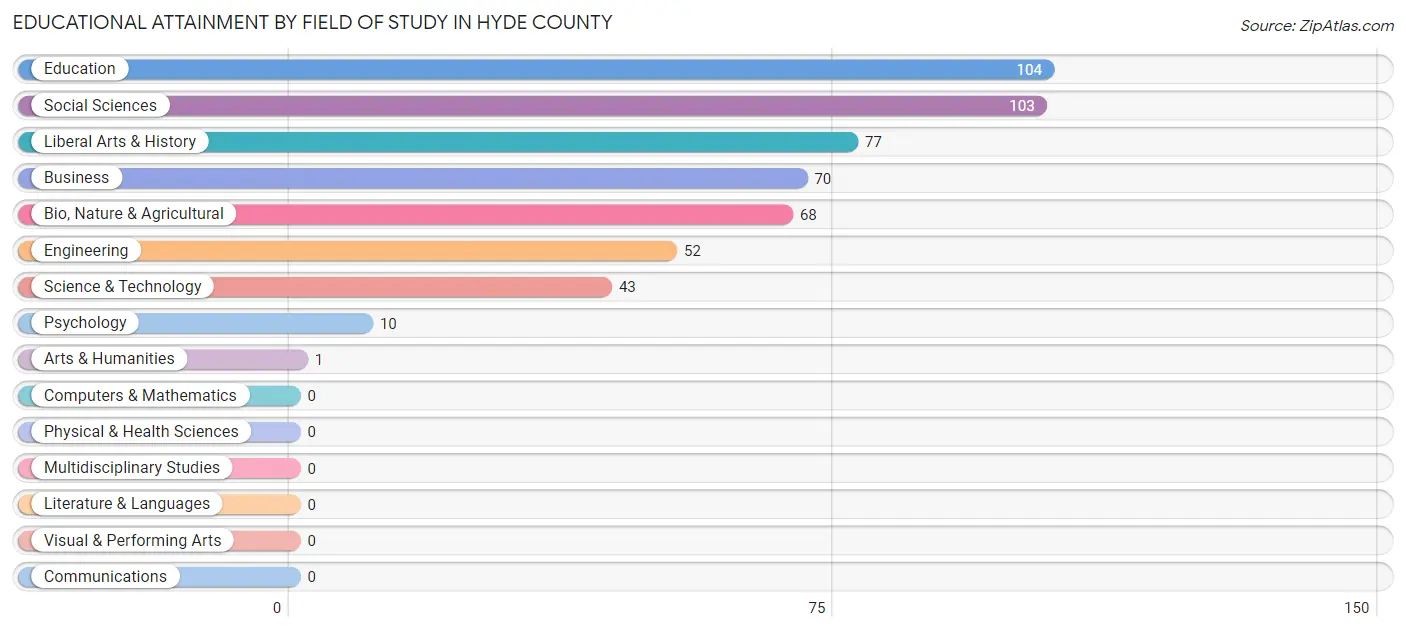
| Field of Study | # Graduates | % Graduates |
| Computers & Mathematics | 0 | 0.0% |
| Bio, Nature & Agricultural | 68 | 12.9% |
| Physical & Health Sciences | 0 | 0.0% |
| Psychology | 10 | 1.9% |
| Social Sciences | 103 | 19.5% |
| Engineering | 52 | 9.9% |
| Multidisciplinary Studies | 0 | 0.0% |
| Science & Technology | 43 | 8.1% |
| Business | 70 | 13.3% |
| Education | 104 | 19.7% |
| Literature & Languages | 0 | 0.0% |
| Liberal Arts & History | 77 | 14.6% |
| Visual & Performing Arts | 0 | 0.0% |
| Communications | 0 | 0.0% |
| Arts & Humanities | 1 | 0.2% |
| Total | 528 | 100.0% |
Transportation & Commute in Hyde County
Vehicle Availability by Sex in Hyde County
The most prevalent vehicle ownership categories in Hyde County are males with 2 vehicles (276, accounting for 42.2%) and females with 2 vehicles (391, making up 41.2%).
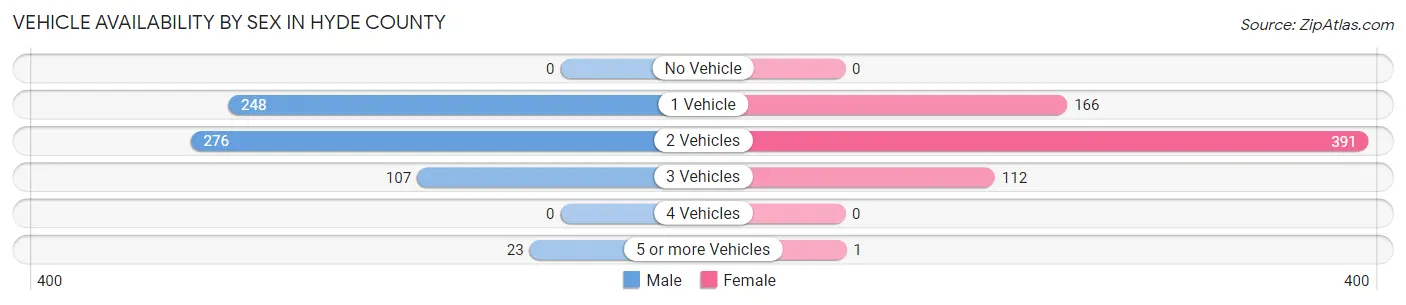
| Vehicles Available | Male | Female |
| No Vehicle | 0 (0.0%) | 0 (0.0%) |
| 1 Vehicle | 248 (37.9%) | 166 (24.8%) |
| 2 Vehicles | 276 (42.2%) | 391 (58.4%) |
| 3 Vehicles | 107 (16.4%) | 112 (16.7%) |
| 4 Vehicles | 0 (0.0%) | 0 (0.0%) |
| 5 or more Vehicles | 23 (3.5%) | 1 (0.2%) |
| Total | 654 (100.0%) | 670 (100.0%) |
Commute Time in Hyde County
The most frequently occuring commute durations in Hyde County are 20 to 24 minutes (245 commuters, 19.2%), 10 to 14 minutes (218 commuters, 17.1%), and 30 to 34 minutes (187 commuters, 14.7%).
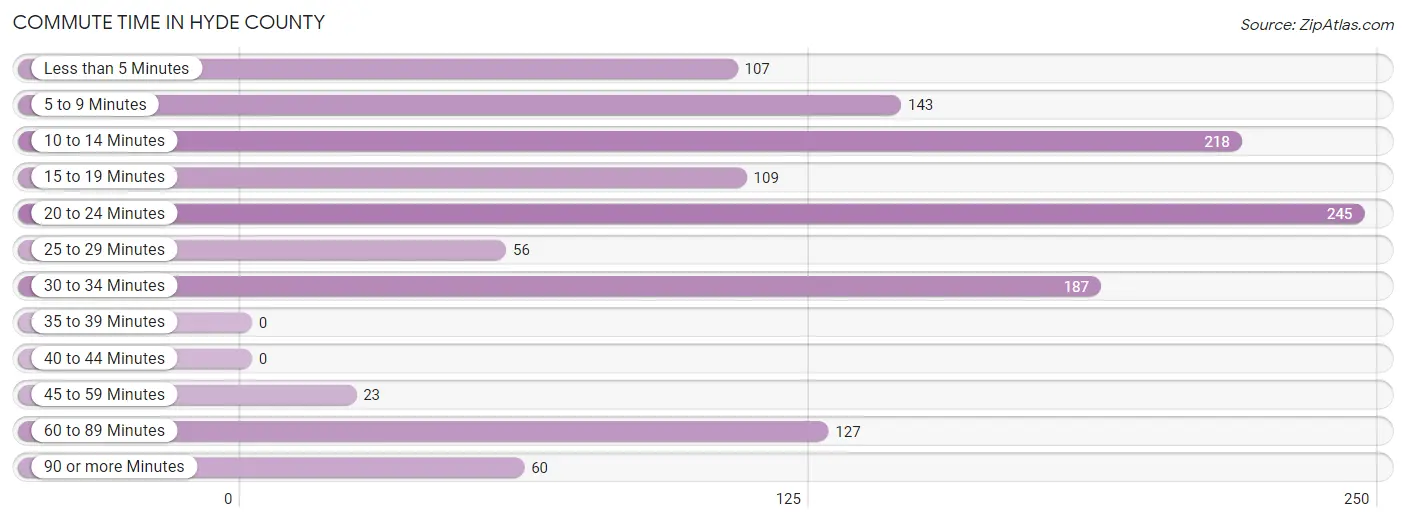
| Commute Time | # Commuters | % Commuters |
| Less than 5 Minutes | 107 | 8.4% |
| 5 to 9 Minutes | 143 | 11.2% |
| 10 to 14 Minutes | 218 | 17.1% |
| 15 to 19 Minutes | 109 | 8.6% |
| 20 to 24 Minutes | 245 | 19.2% |
| 25 to 29 Minutes | 56 | 4.4% |
| 30 to 34 Minutes | 187 | 14.7% |
| 35 to 39 Minutes | 0 | 0.0% |
| 40 to 44 Minutes | 0 | 0.0% |
| 45 to 59 Minutes | 23 | 1.8% |
| 60 to 89 Minutes | 127 | 10.0% |
| 90 or more Minutes | 60 | 4.7% |
Commute Time by Sex in Hyde County
The most common commute times in Hyde County are 10 to 14 minutes (146 commuters, 23.7%) for males and 20 to 24 minutes (195 commuters, 29.5%) for females.
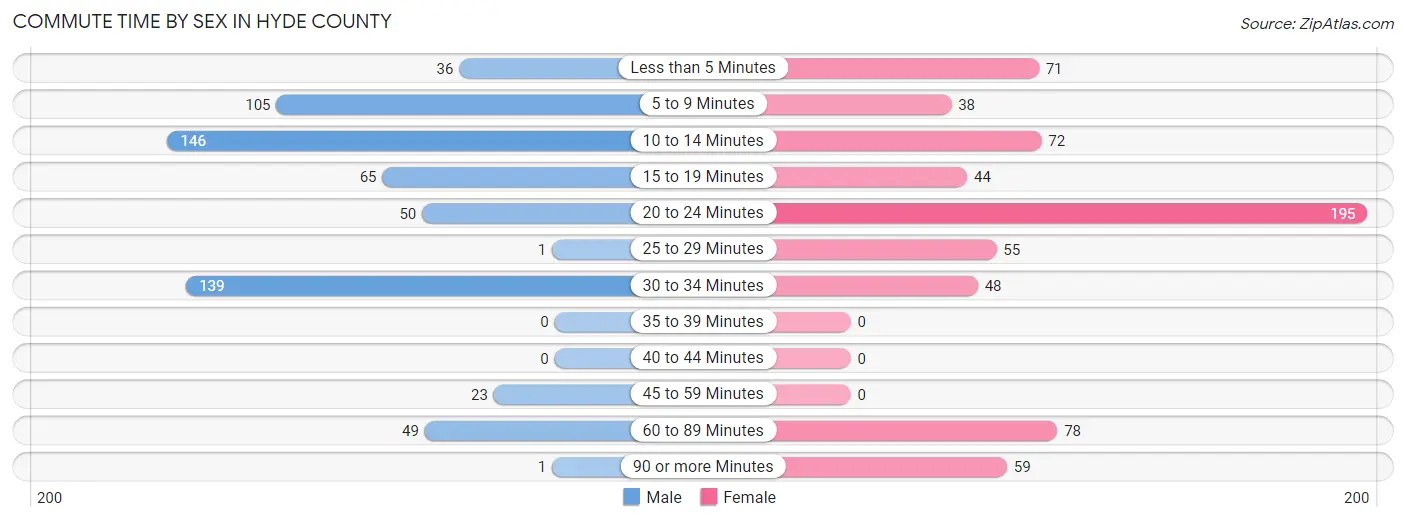
| Commute Time | Male | Female |
| Less than 5 Minutes | 36 (5.9%) | 71 (10.8%) |
| 5 to 9 Minutes | 105 (17.1%) | 38 (5.8%) |
| 10 to 14 Minutes | 146 (23.7%) | 72 (10.9%) |
| 15 to 19 Minutes | 65 (10.6%) | 44 (6.7%) |
| 20 to 24 Minutes | 50 (8.1%) | 195 (29.5%) |
| 25 to 29 Minutes | 1 (0.2%) | 55 (8.3%) |
| 30 to 34 Minutes | 139 (22.6%) | 48 (7.3%) |
| 35 to 39 Minutes | 0 (0.0%) | 0 (0.0%) |
| 40 to 44 Minutes | 0 (0.0%) | 0 (0.0%) |
| 45 to 59 Minutes | 23 (3.7%) | 0 (0.0%) |
| 60 to 89 Minutes | 49 (8.0%) | 78 (11.8%) |
| 90 or more Minutes | 1 (0.2%) | 59 (8.9%) |
Time of Departure to Work by Sex in Hyde County
The most frequent times of departure to work in Hyde County are 8:00 AM to 8:29 AM (170, 27.6%) for males and 7:00 AM to 7:29 AM (240, 36.4%) for females.
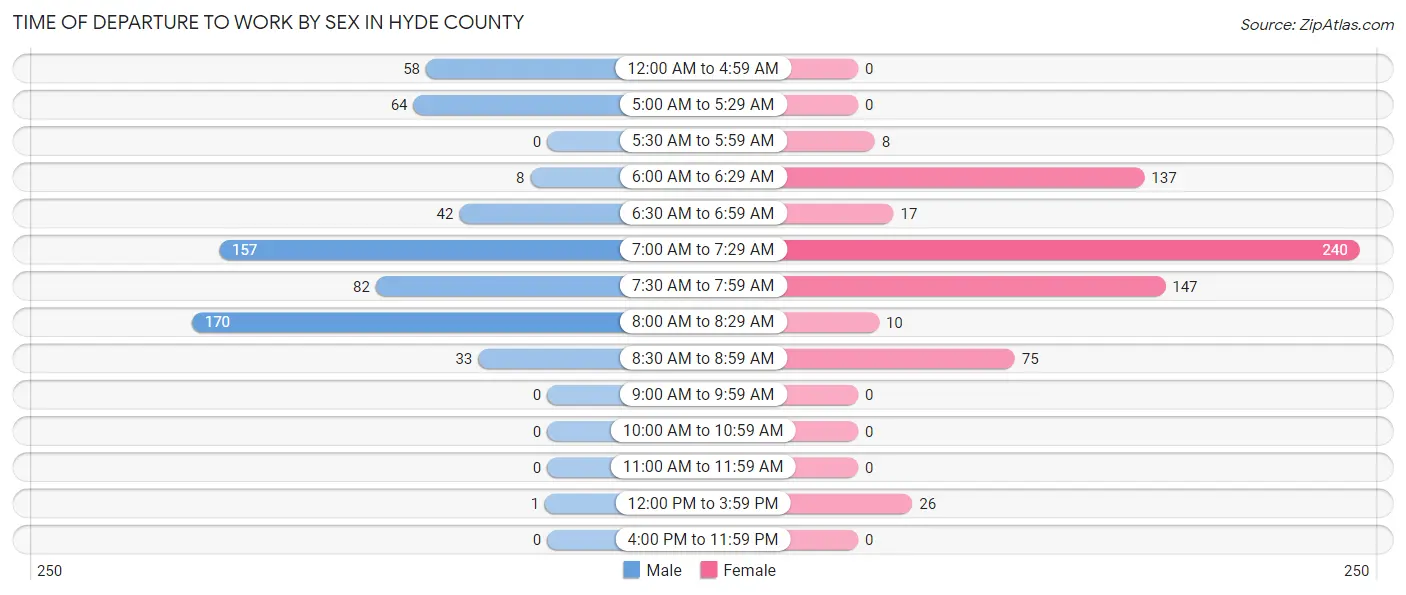
| Time of Departure | Male | Female |
| 12:00 AM to 4:59 AM | 58 (9.4%) | 0 (0.0%) |
| 5:00 AM to 5:29 AM | 64 (10.4%) | 0 (0.0%) |
| 5:30 AM to 5:59 AM | 0 (0.0%) | 8 (1.2%) |
| 6:00 AM to 6:29 AM | 8 (1.3%) | 137 (20.8%) |
| 6:30 AM to 6:59 AM | 42 (6.8%) | 17 (2.6%) |
| 7:00 AM to 7:29 AM | 157 (25.5%) | 240 (36.4%) |
| 7:30 AM to 7:59 AM | 82 (13.3%) | 147 (22.3%) |
| 8:00 AM to 8:29 AM | 170 (27.6%) | 10 (1.5%) |
| 8:30 AM to 8:59 AM | 33 (5.4%) | 75 (11.4%) |
| 9:00 AM to 9:59 AM | 0 (0.0%) | 0 (0.0%) |
| 10:00 AM to 10:59 AM | 0 (0.0%) | 0 (0.0%) |
| 11:00 AM to 11:59 AM | 0 (0.0%) | 0 (0.0%) |
| 12:00 PM to 3:59 PM | 1 (0.2%) | 26 (3.9%) |
| 4:00 PM to 11:59 PM | 0 (0.0%) | 0 (0.0%) |
| Total | 615 (100.0%) | 660 (100.0%) |
Housing Occupancy in Hyde County
Occupancy by Ownership in Hyde County
Of the total 2,002 dwellings in Hyde County, owner-occupied units account for 1,418 (70.8%), while renter-occupied units make up 584 (29.2%).
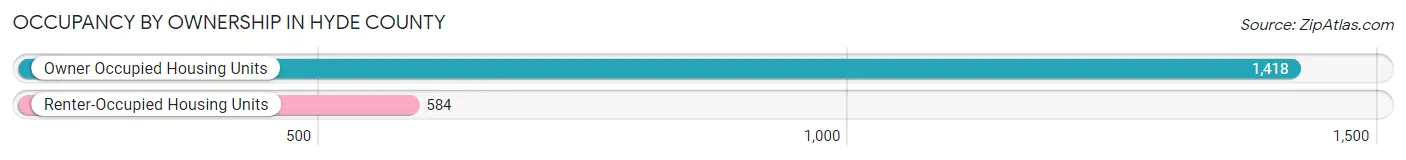
| Occupancy | # Housing Units | % Housing Units |
| Owner Occupied Housing Units | 1,418 | 70.8% |
| Renter-Occupied Housing Units | 584 | 29.2% |
| Total Occupied Housing Units | 2,002 | 100.0% |
Occupancy by Household Size in Hyde County
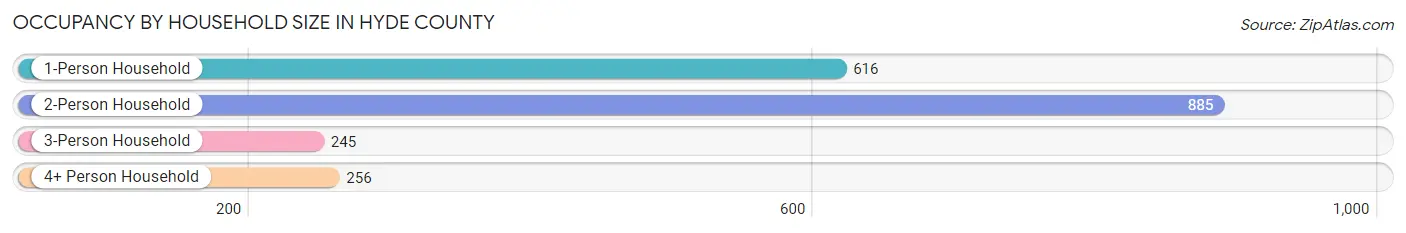
| Household Size | # Housing Units | % Housing Units |
| 1-Person Household | 616 | 30.8% |
| 2-Person Household | 885 | 44.2% |
| 3-Person Household | 245 | 12.2% |
| 4+ Person Household | 256 | 12.8% |
| Total Housing Units | 2,002 | 100.0% |
Occupancy by Ownership by Household Size in Hyde County
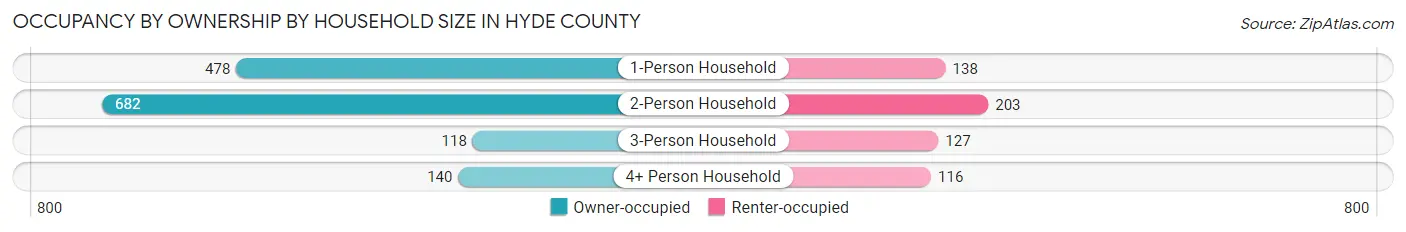
| Household Size | Owner-occupied | Renter-occupied |
| 1-Person Household | 478 (77.6%) | 138 (22.4%) |
| 2-Person Household | 682 (77.1%) | 203 (22.9%) |
| 3-Person Household | 118 (48.2%) | 127 (51.8%) |
| 4+ Person Household | 140 (54.7%) | 116 (45.3%) |
| Total Housing Units | 1,418 (70.8%) | 584 (29.2%) |
Occupancy by Educational Attainment in Hyde County
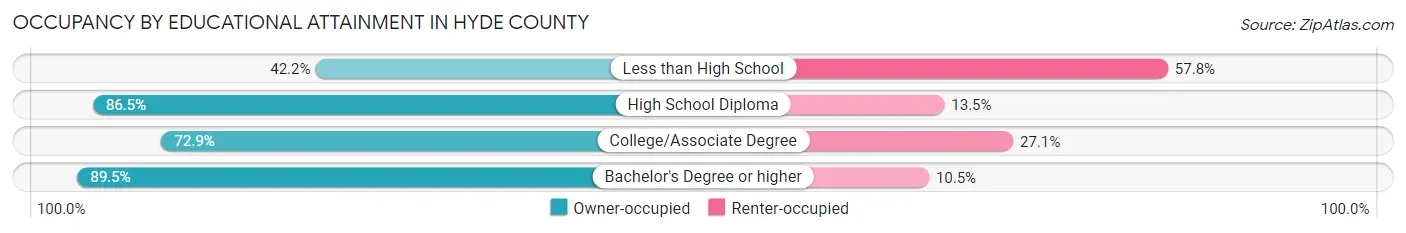
| Household Size | Owner-occupied | Renter-occupied |
| Less than High School | 234 (42.2%) | 321 (57.8%) |
| High School Diploma | 499 (86.5%) | 78 (13.5%) |
| College/Associate Degree | 411 (72.9%) | 153 (27.1%) |
| Bachelor's Degree or higher | 274 (89.5%) | 32 (10.5%) |
Occupancy by Age of Householder in Hyde County
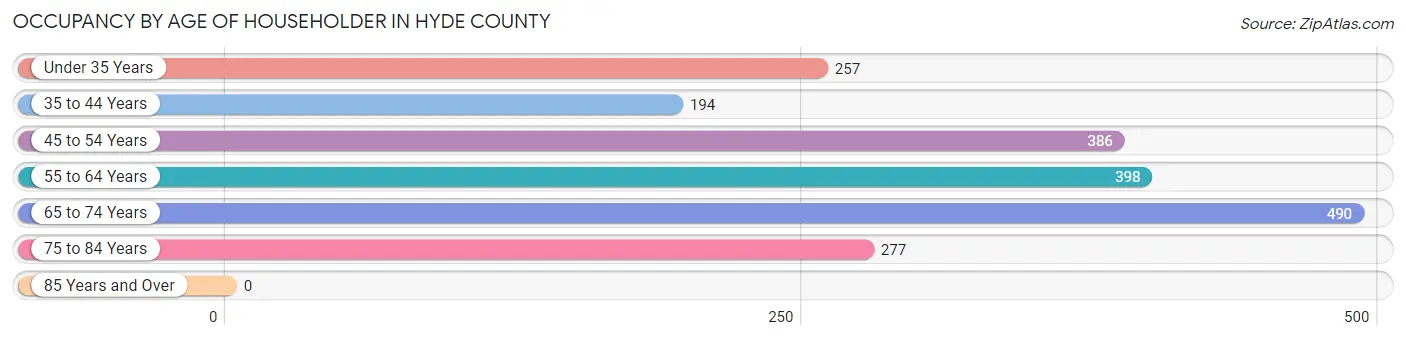
| Age Bracket | # Households | % Households |
| Under 35 Years | 257 | 12.8% |
| 35 to 44 Years | 194 | 9.7% |
| 45 to 54 Years | 386 | 19.3% |
| 55 to 64 Years | 398 | 19.9% |
| 65 to 74 Years | 490 | 24.5% |
| 75 to 84 Years | 277 | 13.8% |
| 85 Years and Over | 0 | 0.0% |
| Total | 2,002 | 100.0% |
Housing Finances in Hyde County
Median Income by Occupancy in Hyde County

| Occupancy Type | # Households | Median Income |
| Owner-Occupied | 1,418 (70.8%) | $52,026 |
| Renter-Occupied | 584 (29.2%) | $24,063 |
| Average | 2,002 (100.0%) | $43,724 |
Occupancy by Householder Income Bracket in Hyde County
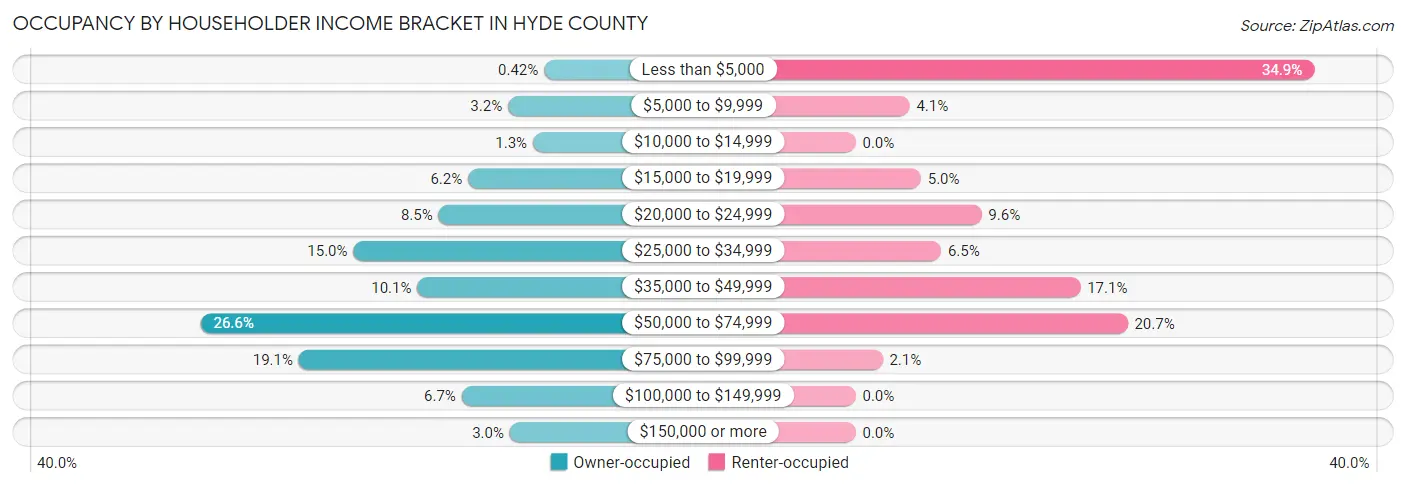
| Income Bracket | Owner-occupied | Renter-occupied |
| Less than $5,000 | 6 (0.4%) | 204 (34.9%) |
| $5,000 to $9,999 | 45 (3.2%) | 24 (4.1%) |
| $10,000 to $14,999 | 18 (1.3%) | 0 (0.0%) |
| $15,000 to $19,999 | 88 (6.2%) | 29 (5.0%) |
| $20,000 to $24,999 | 120 (8.5%) | 56 (9.6%) |
| $25,000 to $34,999 | 212 (14.9%) | 38 (6.5%) |
| $35,000 to $49,999 | 143 (10.1%) | 100 (17.1%) |
| $50,000 to $74,999 | 377 (26.6%) | 121 (20.7%) |
| $75,000 to $99,999 | 271 (19.1%) | 12 (2.1%) |
| $100,000 to $149,999 | 95 (6.7%) | 0 (0.0%) |
| $150,000 or more | 43 (3.0%) | 0 (0.0%) |
| Total | 1,418 (100.0%) | 584 (100.0%) |
Monthly Housing Cost Tiers in Hyde County
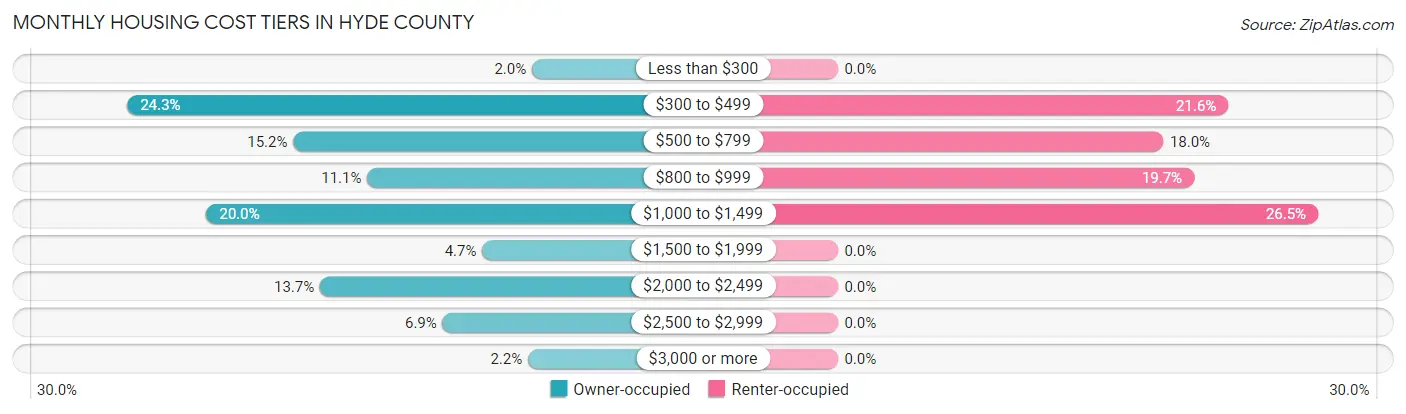
| Monthly Cost | Owner-occupied | Renter-occupied |
| Less than $300 | 28 (2.0%) | 0 (0.0%) |
| $300 to $499 | 345 (24.3%) | 126 (21.6%) |
| $500 to $799 | 215 (15.2%) | 105 (18.0%) |
| $800 to $999 | 157 (11.1%) | 115 (19.7%) |
| $1,000 to $1,499 | 283 (20.0%) | 155 (26.5%) |
| $1,500 to $1,999 | 67 (4.7%) | 0 (0.0%) |
| $2,000 to $2,499 | 194 (13.7%) | 0 (0.0%) |
| $2,500 to $2,999 | 98 (6.9%) | 0 (0.0%) |
| $3,000 or more | 31 (2.2%) | 0 (0.0%) |
| Total | 1,418 (100.0%) | 584 (100.0%) |
Physical Housing Characteristics in Hyde County
Housing Structures in Hyde County
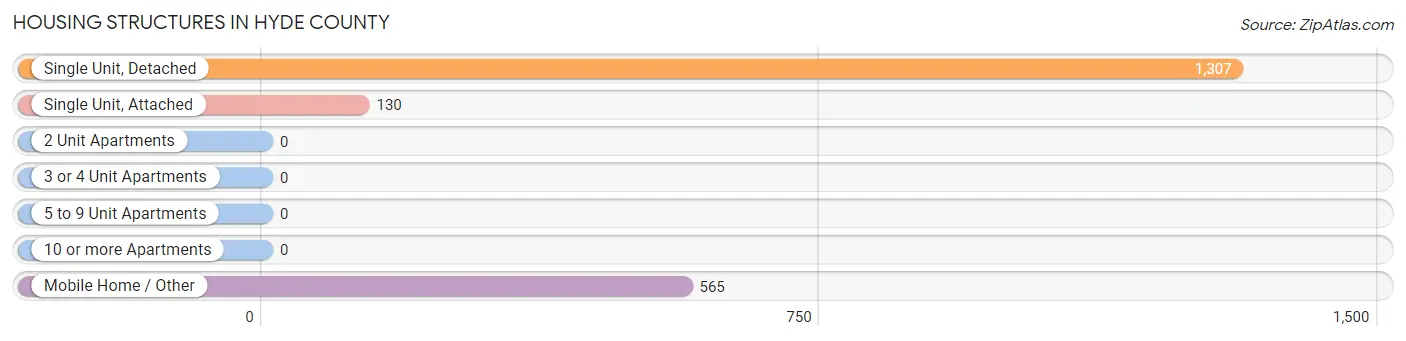
| Structure Type | # Housing Units | % Housing Units |
| Single Unit, Detached | 1,307 | 65.3% |
| Single Unit, Attached | 130 | 6.5% |
| 2 Unit Apartments | 0 | 0.0% |
| 3 or 4 Unit Apartments | 0 | 0.0% |
| 5 to 9 Unit Apartments | 0 | 0.0% |
| 10 or more Apartments | 0 | 0.0% |
| Mobile Home / Other | 565 | 28.2% |
| Total | 2,002 | 100.0% |
Housing Structures by Occupancy in Hyde County
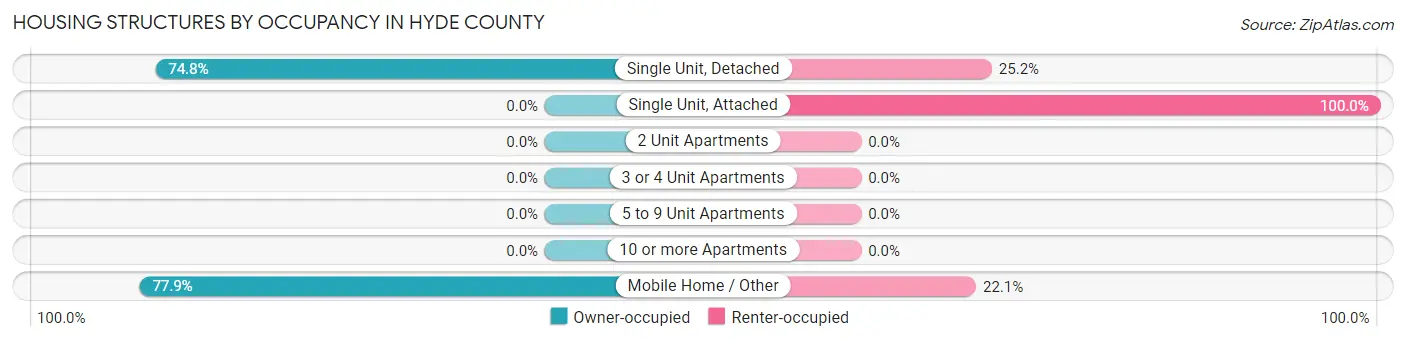
| Structure Type | Owner-occupied | Renter-occupied |
| Single Unit, Detached | 978 (74.8%) | 329 (25.2%) |
| Single Unit, Attached | 0 (0.0%) | 130 (100.0%) |
| 2 Unit Apartments | 0 (0.0%) | 0 (0.0%) |
| 3 or 4 Unit Apartments | 0 (0.0%) | 0 (0.0%) |
| 5 to 9 Unit Apartments | 0 (0.0%) | 0 (0.0%) |
| 10 or more Apartments | 0 (0.0%) | 0 (0.0%) |
| Mobile Home / Other | 440 (77.9%) | 125 (22.1%) |
| Total | 1,418 (70.8%) | 584 (29.2%) |
Housing Structures by Number of Rooms in Hyde County
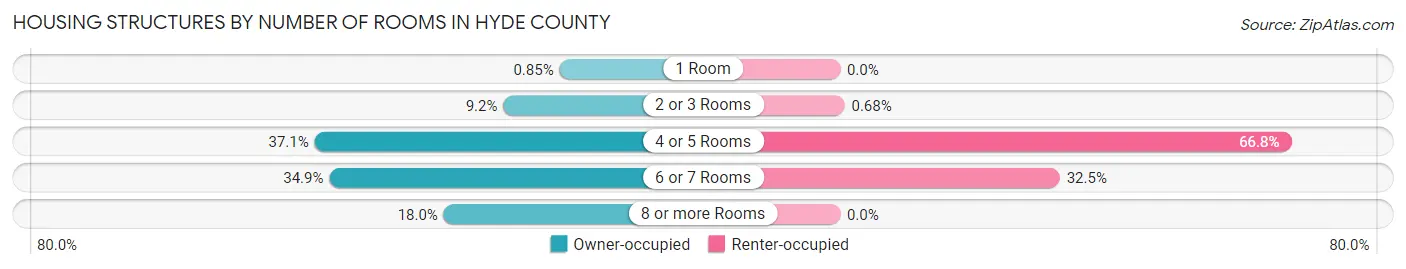
| Number of Rooms | Owner-occupied | Renter-occupied |
| 1 Room | 12 (0.9%) | 0 (0.0%) |
| 2 or 3 Rooms | 130 (9.2%) | 4 (0.7%) |
| 4 or 5 Rooms | 526 (37.1%) | 390 (66.8%) |
| 6 or 7 Rooms | 495 (34.9%) | 190 (32.5%) |
| 8 or more Rooms | 255 (18.0%) | 0 (0.0%) |
| Total | 1,418 (100.0%) | 584 (100.0%) |
Housing Structure by Heating Type in Hyde County
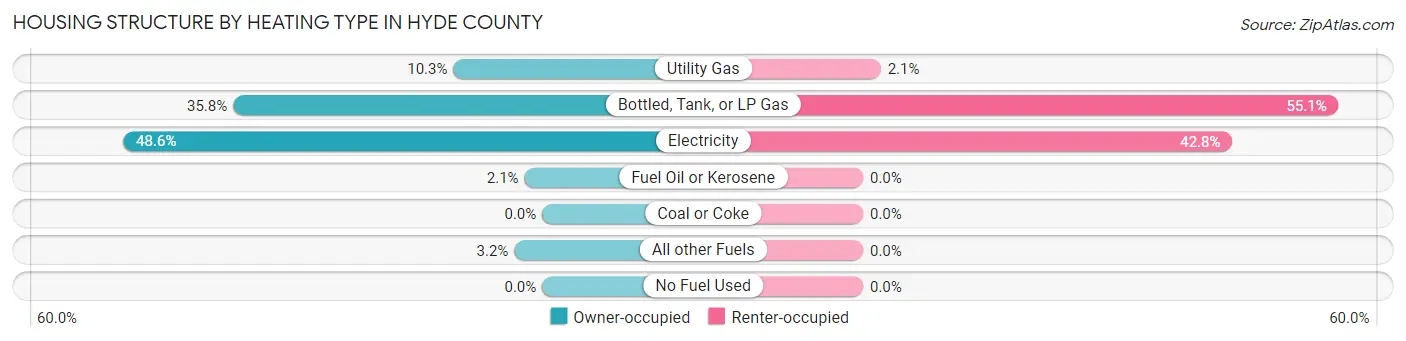
| Heating Type | Owner-occupied | Renter-occupied |
| Utility Gas | 146 (10.3%) | 12 (2.1%) |
| Bottled, Tank, or LP Gas | 508 (35.8%) | 322 (55.1%) |
| Electricity | 689 (48.6%) | 250 (42.8%) |
| Fuel Oil or Kerosene | 29 (2.1%) | 0 (0.0%) |
| Coal or Coke | 0 (0.0%) | 0 (0.0%) |
| All other Fuels | 46 (3.2%) | 0 (0.0%) |
| No Fuel Used | 0 (0.0%) | 0 (0.0%) |
| Total | 1,418 (100.0%) | 584 (100.0%) |
Household Vehicle Usage in Hyde County
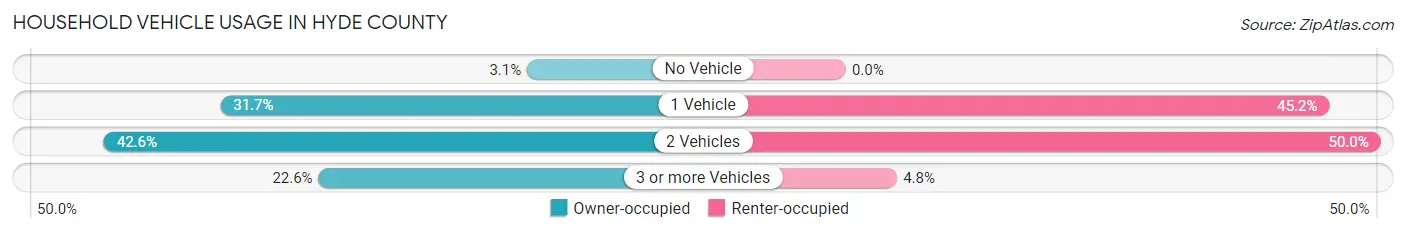
| Vehicles per Household | Owner-occupied | Renter-occupied |
| No Vehicle | 44 (3.1%) | 0 (0.0%) |
| 1 Vehicle | 450 (31.7%) | 264 (45.2%) |
| 2 Vehicles | 604 (42.6%) | 292 (50.0%) |
| 3 or more Vehicles | 320 (22.6%) | 28 (4.8%) |
| Total | 1,418 (100.0%) | 584 (100.0%) |
Real Estate & Mortgages in Hyde County
Real Estate and Mortgage Overview in Hyde County
| Characteristic | Without Mortgage | With Mortgage |
| Housing Units | 702 | 716 |
| Median Property Value | $77,300 | $146,100 |
| Median Household Income | $37,500 | $5 |
| Monthly Housing Costs | $513 | $31 |
| Real Estate Taxes | $911 | $18 |
Property Value by Mortgage Status in Hyde County
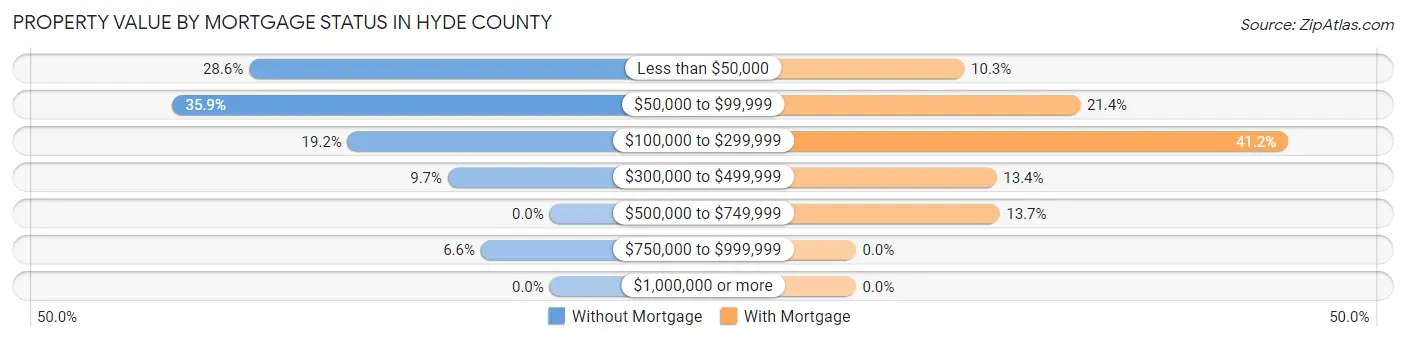
| Property Value | Without Mortgage | With Mortgage |
| Less than $50,000 | 201 (28.6%) | 74 (10.3%) |
| $50,000 to $99,999 | 252 (35.9%) | 153 (21.4%) |
| $100,000 to $299,999 | 135 (19.2%) | 295 (41.2%) |
| $300,000 to $499,999 | 68 (9.7%) | 96 (13.4%) |
| $500,000 to $749,999 | 0 (0.0%) | 98 (13.7%) |
| $750,000 to $999,999 | 46 (6.6%) | 0 (0.0%) |
| $1,000,000 or more | 0 (0.0%) | 0 (0.0%) |
| Total | 702 (100.0%) | 716 (100.0%) |
Household Income by Mortgage Status in Hyde County
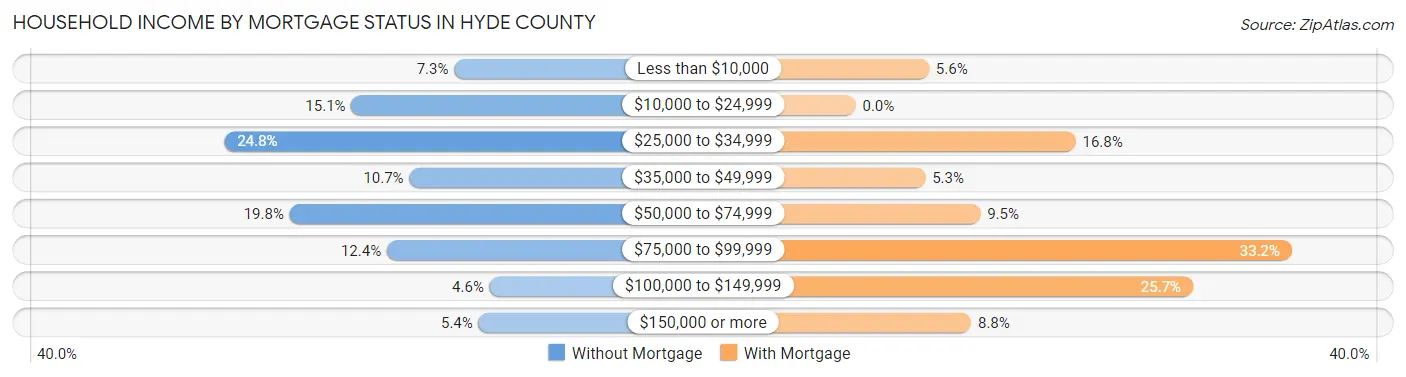
| Household Income | Without Mortgage | With Mortgage |
| Less than $10,000 | 51 (7.3%) | 40 (5.6%) |
| $10,000 to $24,999 | 106 (15.1%) | 0 (0.0%) |
| $25,000 to $34,999 | 174 (24.8%) | 120 (16.8%) |
| $35,000 to $49,999 | 75 (10.7%) | 38 (5.3%) |
| $50,000 to $74,999 | 139 (19.8%) | 68 (9.5%) |
| $75,000 to $99,999 | 87 (12.4%) | 238 (33.2%) |
| $100,000 to $149,999 | 32 (4.6%) | 184 (25.7%) |
| $150,000 or more | 38 (5.4%) | 63 (8.8%) |
| Total | 702 (100.0%) | 716 (100.0%) |
Property Value to Household Income Ratio in Hyde County
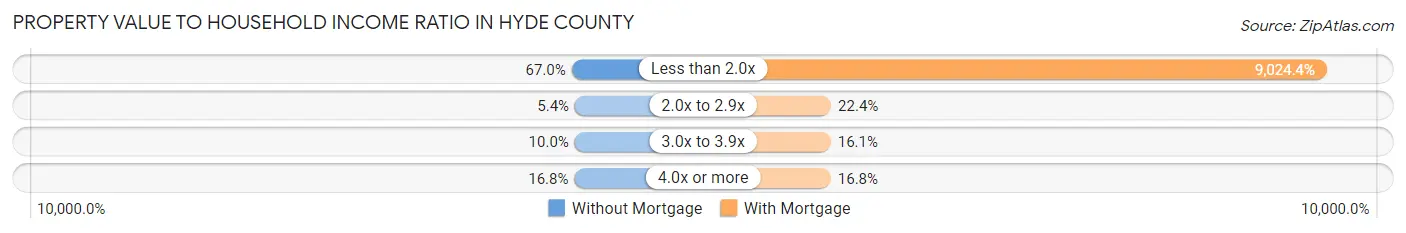
| Value-to-Income Ratio | Without Mortgage | With Mortgage |
| Less than 2.0x | 470 (66.9%) | 64,615 (9,024.4%) |
| 2.0x to 2.9x | 38 (5.4%) | 160 (22.4%) |
| 3.0x to 3.9x | 70 (10.0%) | 115 (16.1%) |
| 4.0x or more | 118 (16.8%) | 120 (16.8%) |
| Total | 702 (100.0%) | 716 (100.0%) |
Real Estate Taxes by Mortgage Status in Hyde County
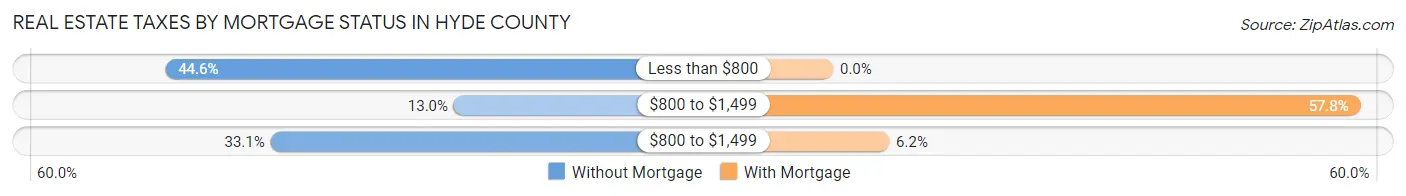
| Property Taxes | Without Mortgage | With Mortgage |
| Less than $800 | 313 (44.6%) | 0 (0.0%) |
| $800 to $1,499 | 91 (13.0%) | 414 (57.8%) |
| $800 to $1,499 | 232 (33.1%) | 44 (6.1%) |
| Total | 702 (100.0%) | 716 (100.0%) |
Health & Disability in Hyde County
Health Insurance Coverage by Age in Hyde County
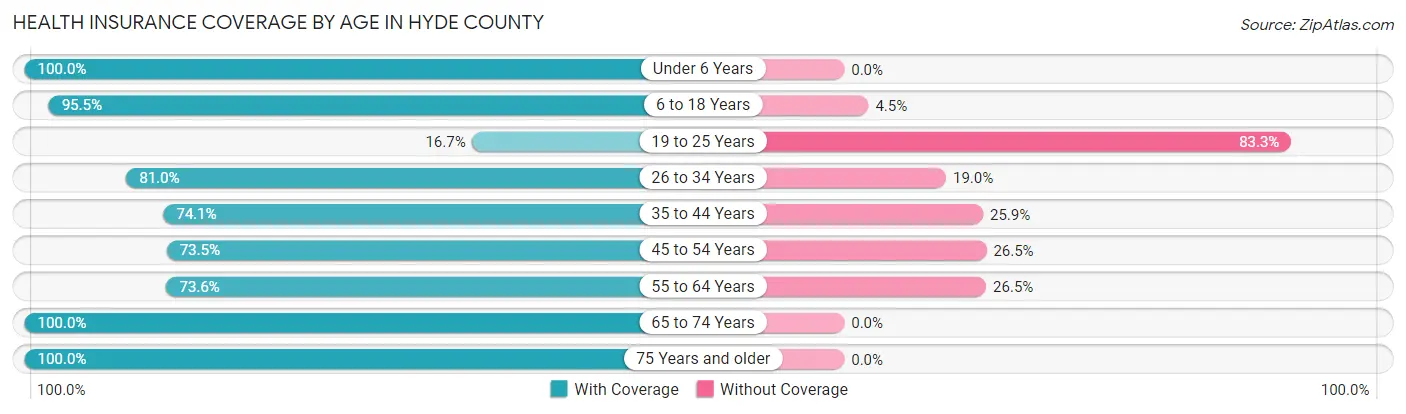
| Age Bracket | With Coverage | Without Coverage |
| Under 6 Years | 252 (100.0%) | 0 (0.0%) |
| 6 to 18 Years | 635 (95.5%) | 30 (4.5%) |
| 19 to 25 Years | 1 (16.7%) | 5 (83.3%) |
| 26 to 34 Years | 346 (81.0%) | 81 (19.0%) |
| 35 to 44 Years | 321 (74.1%) | 112 (25.9%) |
| 45 to 54 Years | 352 (73.5%) | 127 (26.5%) |
| 55 to 64 Years | 559 (73.6%) | 201 (26.5%) |
| 65 to 74 Years | 704 (100.0%) | 0 (0.0%) |
| 75 Years and older | 316 (100.0%) | 0 (0.0%) |
| Total | 3,486 (86.2%) | 556 (13.8%) |
Health Insurance Coverage by Citizenship Status in Hyde County
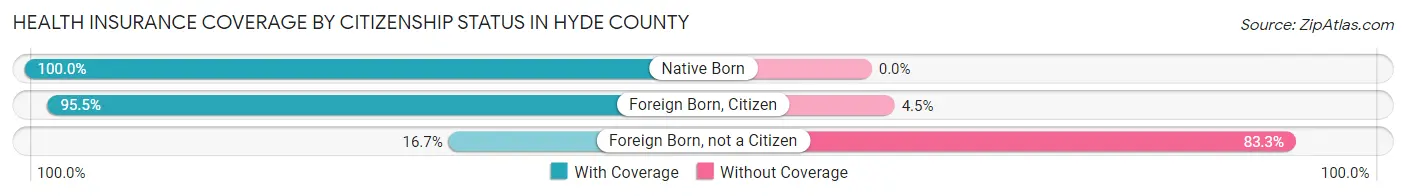
| Citizenship Status | With Coverage | Without Coverage |
| Native Born | 252 (100.0%) | 0 (0.0%) |
| Foreign Born, Citizen | 635 (95.5%) | 30 (4.5%) |
| Foreign Born, not a Citizen | 1 (16.7%) | 5 (83.3%) |
Health Insurance Coverage by Household Income in Hyde County
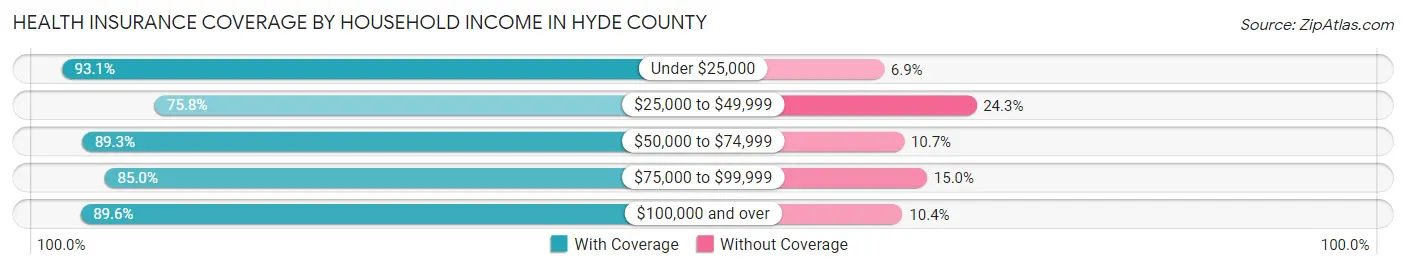
| Household Income | With Coverage | Without Coverage |
| Under $25,000 | 1,006 (93.1%) | 75 (6.9%) |
| $25,000 to $49,999 | 628 (75.7%) | 201 (24.2%) |
| $50,000 to $74,999 | 1,101 (89.3%) | 132 (10.7%) |
| $75,000 to $99,999 | 510 (85.0%) | 90 (15.0%) |
| $100,000 and over | 232 (89.6%) | 27 (10.4%) |
Public vs Private Health Insurance Coverage by Age in Hyde County
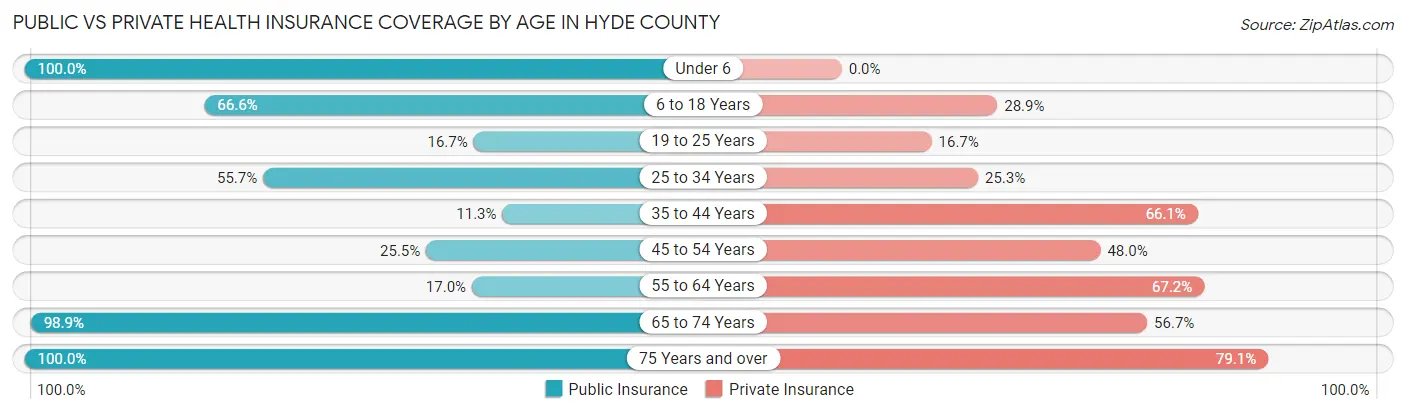
| Age Bracket | Public Insurance | Private Insurance |
| Under 6 | 252 (100.0%) | 0 (0.0%) |
| 6 to 18 Years | 443 (66.6%) | 192 (28.9%) |
| 19 to 25 Years | 1 (16.7%) | 1 (16.7%) |
| 25 to 34 Years | 238 (55.7%) | 108 (25.3%) |
| 35 to 44 Years | 49 (11.3%) | 286 (66.0%) |
| 45 to 54 Years | 122 (25.5%) | 230 (48.0%) |
| 55 to 64 Years | 129 (17.0%) | 511 (67.2%) |
| 65 to 74 Years | 696 (98.9%) | 399 (56.7%) |
| 75 Years and over | 316 (100.0%) | 250 (79.1%) |
| Total | 2,246 (55.6%) | 1,977 (48.9%) |
Disability Status by Sex by Age in Hyde County
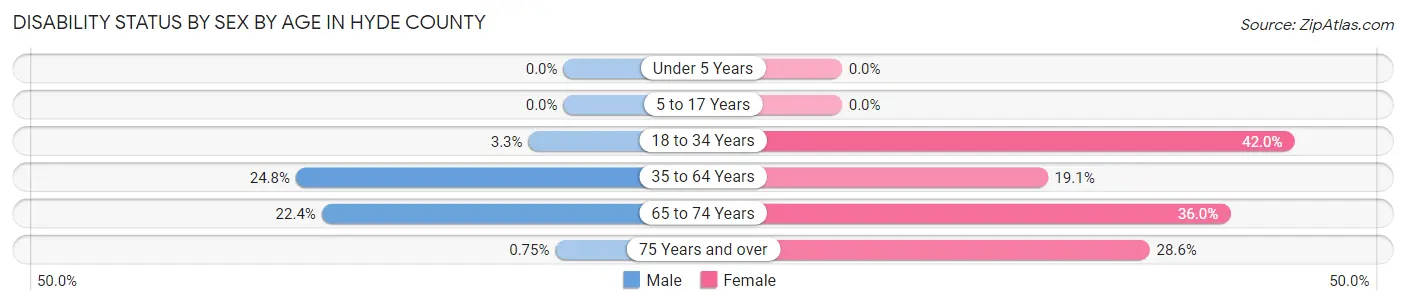
| Age Bracket | Male | Female |
| Under 5 Years | 0 (0.0%) | 0 (0.0%) |
| 5 to 17 Years | 0 (0.0%) | 0 (0.0%) |
| 18 to 34 Years | 4 (3.3%) | 131 (42.0%) |
| 35 to 64 Years | 185 (24.8%) | 177 (19.1%) |
| 65 to 74 Years | 72 (22.4%) | 138 (36.0%) |
| 75 Years and over | 1 (0.7%) | 52 (28.6%) |
Disability Class by Sex by Age in Hyde County
Disability Class: Hearing Difficulty
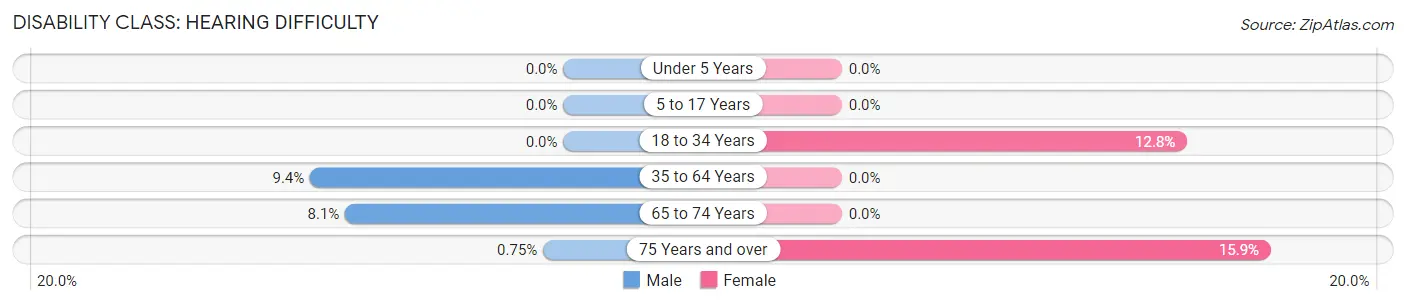
| Age Bracket | Male | Female |
| Under 5 Years | 0 (0.0%) | 0 (0.0%) |
| 5 to 17 Years | 0 (0.0%) | 0 (0.0%) |
| 18 to 34 Years | 0 (0.0%) | 40 (12.8%) |
| 35 to 64 Years | 70 (9.4%) | 0 (0.0%) |
| 65 to 74 Years | 26 (8.1%) | 0 (0.0%) |
| 75 Years and over | 1 (0.7%) | 29 (15.9%) |
Disability Class: Vision Difficulty
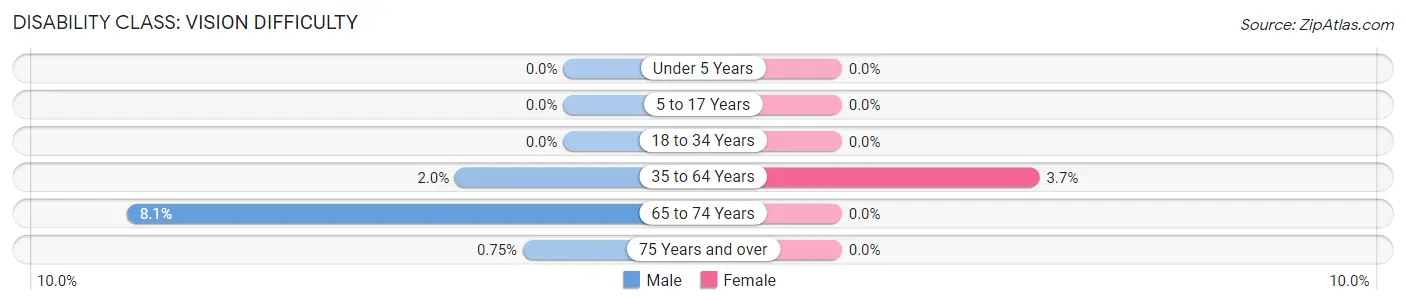
| Age Bracket | Male | Female |
| Under 5 Years | 0 (0.0%) | 0 (0.0%) |
| 5 to 17 Years | 0 (0.0%) | 0 (0.0%) |
| 18 to 34 Years | 0 (0.0%) | 0 (0.0%) |
| 35 to 64 Years | 15 (2.0%) | 34 (3.7%) |
| 65 to 74 Years | 26 (8.1%) | 0 (0.0%) |
| 75 Years and over | 1 (0.7%) | 0 (0.0%) |
Disability Class: Cognitive Difficulty
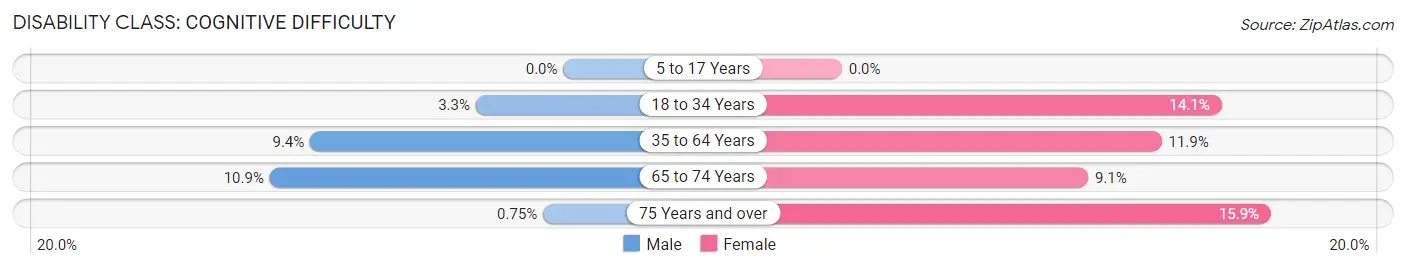
| Age Bracket | Male | Female |
| 5 to 17 Years | 0 (0.0%) | 0 (0.0%) |
| 18 to 34 Years | 4 (3.3%) | 44 (14.1%) |
| 35 to 64 Years | 70 (9.4%) | 110 (11.9%) |
| 65 to 74 Years | 35 (10.9%) | 35 (9.1%) |
| 75 Years and over | 1 (0.7%) | 29 (15.9%) |
Disability Class: Ambulatory Difficulty
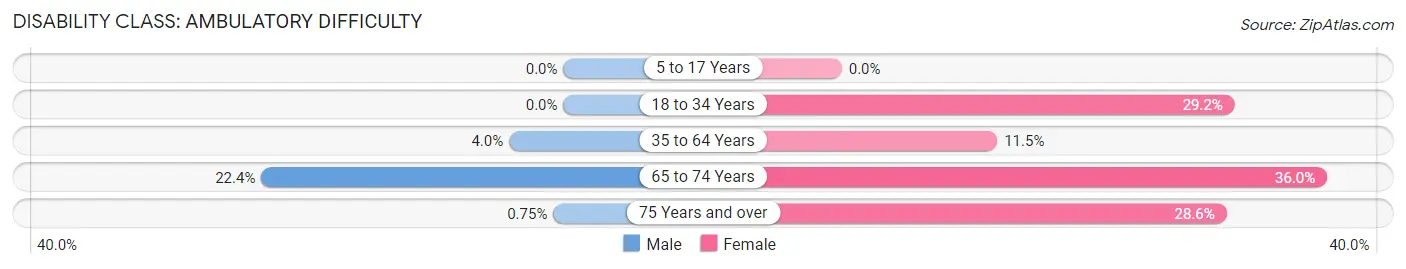
| Age Bracket | Male | Female |
| 5 to 17 Years | 0 (0.0%) | 0 (0.0%) |
| 18 to 34 Years | 0 (0.0%) | 91 (29.2%) |
| 35 to 64 Years | 30 (4.0%) | 107 (11.5%) |
| 65 to 74 Years | 72 (22.4%) | 138 (36.0%) |
| 75 Years and over | 1 (0.7%) | 52 (28.6%) |
Disability Class: Self-Care Difficulty
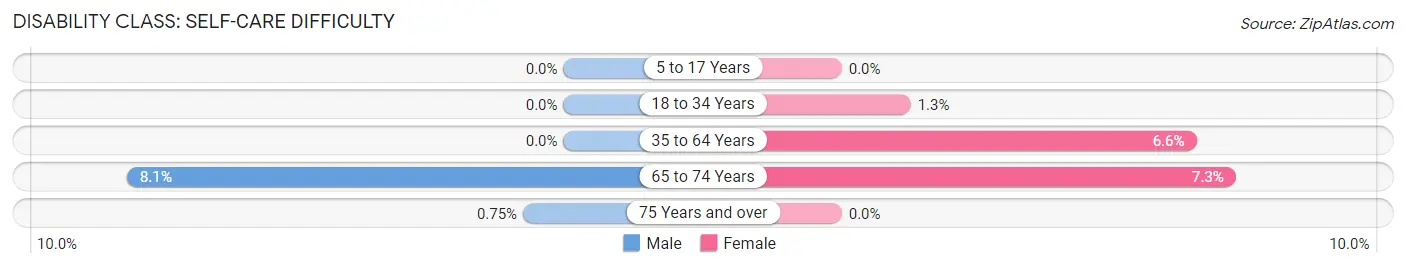
| Age Bracket | Male | Female |
| 5 to 17 Years | 0 (0.0%) | 0 (0.0%) |
| 18 to 34 Years | 0 (0.0%) | 4 (1.3%) |
| 35 to 64 Years | 0 (0.0%) | 61 (6.6%) |
| 65 to 74 Years | 26 (8.1%) | 28 (7.3%) |
| 75 Years and over | 1 (0.7%) | 0 (0.0%) |
Technology Access in Hyde County
Computing Device Access in Hyde County
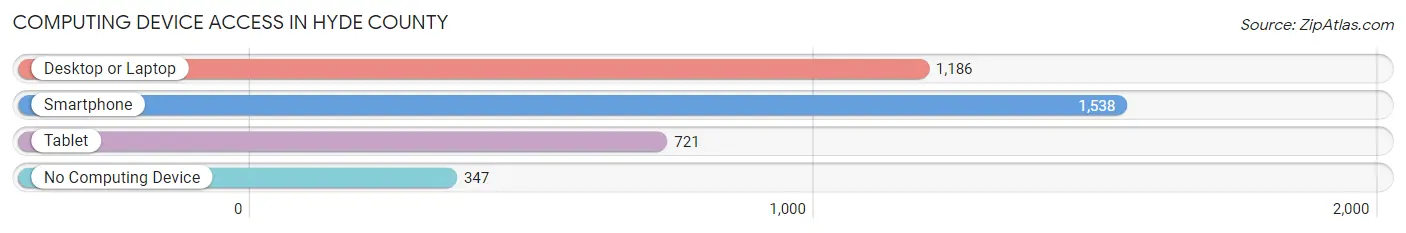
| Device Type | # Households | % Households |
| Desktop or Laptop | 1,186 | 59.2% |
| Smartphone | 1,538 | 76.8% |
| Tablet | 721 | 36.0% |
| No Computing Device | 347 | 17.3% |
| Total | 2,002 | 100.0% |
Internet Access in Hyde County
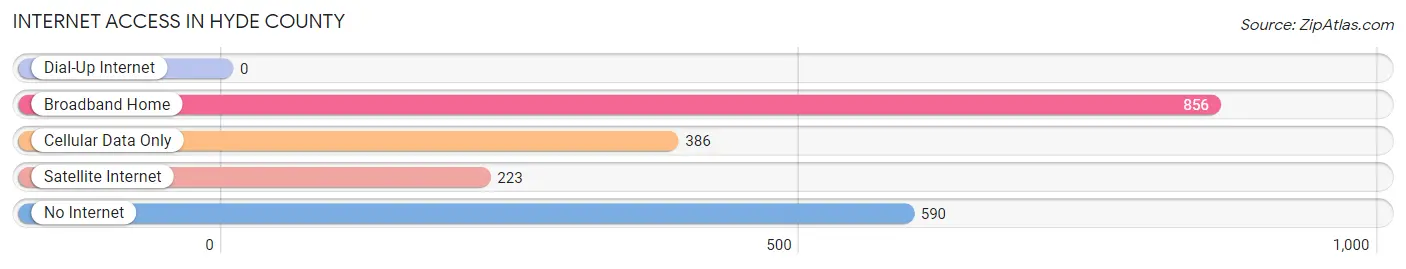
| Internet Type | # Households | % Households |
| Dial-Up Internet | 0 | 0.0% |
| Broadband Home | 856 | 42.8% |
| Cellular Data Only | 386 | 19.3% |
| Satellite Internet | 223 | 11.1% |
| No Internet | 590 | 29.5% |
| Total | 2,002 | 100.0% |
Hyde County Summary
Hyde County is a county located in the U.S. state of North Carolina. As of the 2010 census, the population was 5,810, making it the least populous county in the state. It is located in the Inner Banks region of the state and is part of the Albemarle-Pamlico region. The county seat is Swan Quarter.
History
Hyde County was formed in 1705 from the eastern part of Tyrrell County. It was named for Edward Hyde, who was the governor of the Province of North Carolina from 1711 to 1715. The county was originally part of the Albemarle Sound region, which was settled by English colonists in the early 1700s. The county was home to several Native American tribes, including the Hatteras, Coree, and Machapunga.
In the late 1700s, the county was home to a large number of Quakers, who had migrated from Pennsylvania. The Quakers were instrumental in the development of the county, establishing schools, churches, and businesses.
In the early 1800s, the county was home to a large number of freed slaves, who had been freed by the British during the Revolutionary War. The freed slaves established their own communities in the county, and many of them became successful farmers.
In the late 1800s, the county was home to a large number of fishermen, who harvested oysters, shrimp, and other seafood from the Pamlico Sound. The seafood industry was a major source of income for the county, and it remains an important part of the local economy today.
Geography
Hyde County is located in the Inner Banks region of North Carolina. It is bordered by Dare County to the north, Tyrrell County to the west, and Beaufort County to the south. The county is located on the Pamlico Sound, which is part of the Atlantic Ocean. The county is home to several islands, including Ocracoke Island, which is the southernmost point in the state.
The county has a total area of 517 square miles, of which 486 square miles is land and 31 square miles is water. The county is mostly flat, with some rolling hills in the northern part of the county. The highest point in the county is the summit of Cedar Island, which is located in the northern part of the county and has an elevation of 40 feet.
Economy
The economy of Hyde County is largely based on tourism, fishing, and agriculture. The county is home to several popular tourist destinations, including Ocracoke Island, which is a popular destination for beachgoers and fishermen. The county is also home to several seafood processing plants, which process seafood harvested from the Pamlico Sound.
Agriculture is also an important part of the local economy. The county is home to several large farms, which produce corn, soybeans, wheat, and other crops. The county is also home to several wineries, which produce a variety of wines.
Demographics
As of the 2010 census, there were 5,810 people, 2,521 households, and 1,619 families living in the county. The population density was 12 people per square mile. There were 3,093 housing units at an average density of 6 per square mile. The racial makeup of the county was 73.3% White, 22.2% African American, 0.5% Native American, 0.3% Asian, 0.1% Pacific Islander, 2.2% from other races, and 1.6% from two or more races. Hispanic or Latino of any race were 4.2% of the population.
The median income for a household in the county was $30,938, and the median income for a family was $37,917. Males had a median income of $27,917 versus $21,917 for females. The per capita income for the county was $16,945. About 17.2% of families and 21.2% of the population were below the poverty line, including 28.2% of those under age 18 and 16.2% of those age 65 or over.
Common Questions
What is the Total Population of Hyde County?
Total Population of Hyde County is 4,636.
What is the Total Male Population of Hyde County?
Total Male Population of Hyde County is 2,394.
What is the Total Female Population of Hyde County?
Total Female Population of Hyde County is 2,242.
What is the Ratio of Males per 100 Females in Hyde County?
There are 106.78 Males per 100 Females in Hyde County.
What is the Ratio of Females per 100 Males in Hyde County?
There are 93.65 Females per 100 Males in Hyde County.
What is the Median Population Age in Hyde County?
Median Population Age in Hyde County is 46.8 Years.
What is the Average Family Size in Hyde County
Average Family Size in Hyde County is 2.4 People.
What is the Average Household Size in Hyde County
Average Household Size in Hyde County is 2.0 People.
What is Per Capita Income in Hyde County?
Per Capita income in Hyde County is $19,258.
What is the Median Family Income in Hyde County?
Median Family Income in Hyde County is $51,263.
What is the Median Household income in Hyde County?
Median Household Income in Hyde County is $43,724.
What is Income or Wage Gap in Hyde County?
Income or Wage Gap in Hyde County is 47.8%.
Women in Hyde County earn 52.2 cents for every dollar earned by a man.
What is Family Income Deficit in Hyde County?
Family Income Deficit in Hyde County is $17,257.
Families that are below poverty line in Hyde County earn $17,257 less on average than the poverty threshold level.
What is Inequality or Gini Index in Hyde County?
Inequality or Gini Index in Hyde County is 0.40.
How Large is the Labor Force in Hyde County?
There are 1,547 People in the Labor Forcein in Hyde County.
What is the Percentage of People in the Labor Force in Hyde County?
40.7% of People are in the Labor Force in Hyde County.
What is the Unemployment Rate in Hyde County?
Unemployment Rate in Hyde County is 8.7%.