Henderson County, NC
Henderson County Map
Henderson County Overview
116,469
TOTAL POPULATION
56,226
MALE POPULATION
60,243
FEMALE POPULATION
93.33
MALES / 100 FEMALES
107.14
FEMALES / 100 MALES
47.7
MEDIAN AGE
2.8
AVG FAMILY SIZE
2.3
AVG HOUSEHOLD SIZE
$37,457
PER CAPITA INCOME
$81,406
AVG FAMILY INCOME
$65,508
AVG HOUSEHOLD INCOME
28.7%
WAGE / INCOME GAP [ % ]
71.3¢/ $1
WAGE / INCOME GAP [ $ ]
$10,139
FAMILY INCOME DEFICIT
0.45
INEQUALITY / GINI INDEX
56,581
LABOR FORCE [ PEOPLE ]
58.0%
PERCENT IN LABOR FORCE
3.5%
UNEMPLOYMENT RATE
Henderson County Area Codes
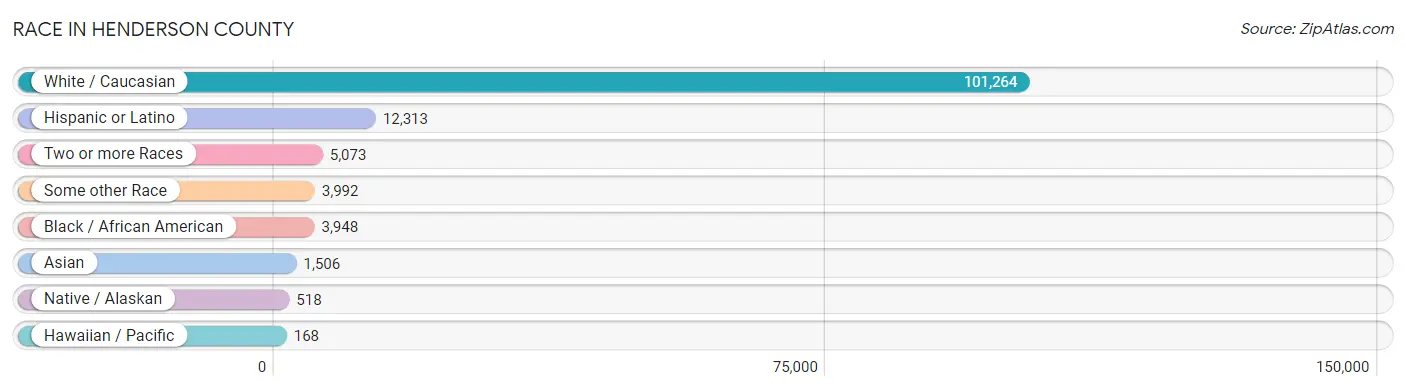
Race in Henderson County
The most populous races in Henderson County are White / Caucasian (101,264 | 87.0%), Hispanic or Latino (12,313 | 10.6%), and Two or more Races (5,073 | 4.4%).
| Race | # Population | % Population |
| Asian | 1,506 | 1.3% |
| Black / African American | 3,948 | 3.4% |
| Hawaiian / Pacific | 168 | 0.1% |
| Hispanic or Latino | 12,313 | 10.6% |
| Native / Alaskan | 518 | 0.4% |
| White / Caucasian | 101,264 | 87.0% |
| Two or more Races | 5,073 | 4.4% |
| Some other Race | 3,992 | 3.4% |
| Total | 116,469 | 100.0% |
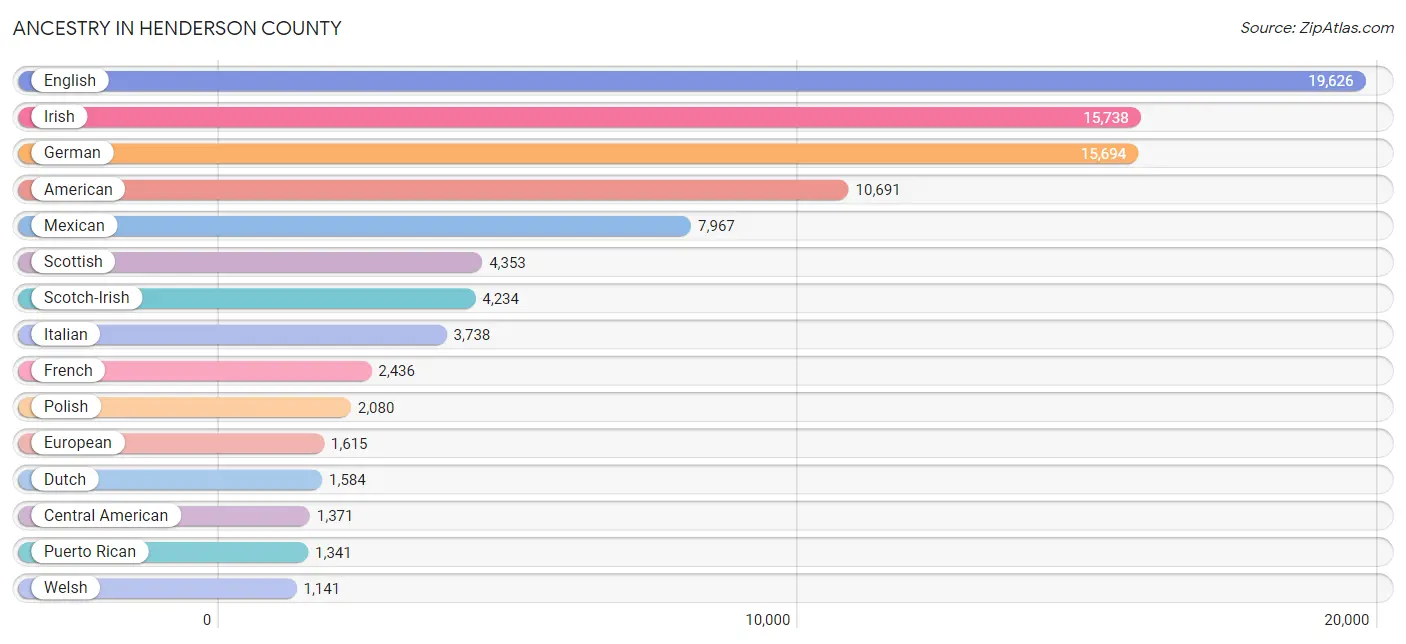
Ancestry in Henderson County
The most populous ancestries reported in Henderson County are English (19,626 | 16.9%), Irish (15,738 | 13.5%), German (15,694 | 13.5%), American (10,691 | 9.2%), and Mexican (7,967 | 6.8%), together accounting for 59.9% of all Henderson County residents.
| Ancestry | # Population | % Population |
| African | 162 | 0.1% |
| Albanian | 16 | 0.0% |
| Alsatian | 8 | 0.0% |
| American | 10,691 | 9.2% |
| Apache | 6 | 0.0% |
| Arab | 252 | 0.2% |
| Argentinean | 202 | 0.2% |
| Armenian | 54 | 0.1% |
| Australian | 23 | 0.0% |
| Austrian | 280 | 0.2% |
| Bahamian | 23 | 0.0% |
| Belgian | 60 | 0.1% |
| Bhutanese | 42 | 0.0% |
| Blackfeet | 16 | 0.0% |
| Brazilian | 27 | 0.0% |
| British | 802 | 0.7% |
| Burmese | 336 | 0.3% |
| Cajun | 51 | 0.0% |
| Canadian | 256 | 0.2% |
| Celtic | 51 | 0.0% |
| Central American | 1,371 | 1.2% |
| Central American Indian | 96 | 0.1% |
| Cherokee | 659 | 0.6% |
| Chilean | 191 | 0.2% |
| Chippewa | 7 | 0.0% |
| Choctaw | 13 | 0.0% |
| Colombian | 344 | 0.3% |
| Costa Rican | 127 | 0.1% |
| Creek | 5 | 0.0% |
| Croatian | 71 | 0.1% |
| Cuban | 159 | 0.1% |
| Czech | 287 | 0.3% |
| Czechoslovakian | 288 | 0.3% |
| Danish | 224 | 0.2% |
| Dominican | 145 | 0.1% |
| Dutch | 1,584 | 1.4% |
| Eastern European | 339 | 0.3% |
| Ecuadorian | 27 | 0.0% |
| English | 19,626 | 16.9% |
| Ethiopian | 16 | 0.0% |
| European | 1,615 | 1.4% |
| Finnish | 345 | 0.3% |
| French | 2,436 | 2.1% |
| French Canadian | 682 | 0.6% |
| German | 15,694 | 13.5% |
| Ghanaian | 54 | 0.1% |
| Greek | 182 | 0.2% |
| Guatemalan | 265 | 0.2% |
| Guyanese | 25 | 0.0% |
| Haitian | 28 | 0.0% |
| Honduran | 223 | 0.2% |
| Hungarian | 778 | 0.7% |
| Icelander | 25 | 0.0% |
| Indian (Asian) | 267 | 0.2% |
| Iranian | 15 | 0.0% |
| Iraqi | 12 | 0.0% |
| Irish | 15,738 | 13.5% |
| Iroquois | 15 | 0.0% |
| Israeli | 31 | 0.0% |
| Italian | 3,738 | 3.2% |
| Jamaican | 82 | 0.1% |
| Japanese | 415 | 0.4% |
| Kenyan | 29 | 0.0% |
| Korean | 354 | 0.3% |
| Laotian | 38 | 0.0% |
| Latvian | 10 | 0.0% |
| Lebanese | 82 | 0.1% |
| Lithuanian | 174 | 0.2% |
| Lumbee | 146 | 0.1% |
| Luxembourger | 2 | 0.0% |
| Macedonian | 15 | 0.0% |
| Mexican | 7,967 | 6.8% |
| Moroccan | 46 | 0.0% |
| Nicaraguan | 39 | 0.0% |
| Nigerian | 9 | 0.0% |
| Northern European | 89 | 0.1% |
| Norwegian | 862 | 0.7% |
| Pakistani | 75 | 0.1% |
| Panamanian | 30 | 0.0% |
| Paraguayan | 3 | 0.0% |
| Pennsylvania German | 44 | 0.0% |
| Peruvian | 6 | 0.0% |
| Polish | 2,080 | 1.8% |
| Portuguese | 241 | 0.2% |
| Puerto Rican | 1,341 | 1.1% |
| Romanian | 70 | 0.1% |
| Russian | 495 | 0.4% |
| Salvadoran | 687 | 0.6% |
| Scandinavian | 202 | 0.2% |
| Scotch-Irish | 4,234 | 3.6% |
| Scottish | 4,353 | 3.7% |
| Serbian | 8 | 0.0% |
| Shoshone | 53 | 0.1% |
| Slavic | 51 | 0.0% |
| Slovak | 154 | 0.1% |
| Slovene | 9 | 0.0% |
| South African | 34 | 0.0% |
| South American | 822 | 0.7% |
| Spaniard | 143 | 0.1% |
| Spanish | 137 | 0.1% |
| Sri Lankan | 165 | 0.1% |
| Subsaharan African | 312 | 0.3% |
| Swedish | 1,054 | 0.9% |
| Swiss | 328 | 0.3% |
| Syrian | 23 | 0.0% |
| Thai | 168 | 0.1% |
| Turkish | 16 | 0.0% |
| Ukrainian | 431 | 0.4% |
| Uruguayan | 22 | 0.0% |
| Venezuelan | 27 | 0.0% |
| Welsh | 1,141 | 1.0% |
| Yugoslavian | 15 | 0.0% | View All 112 Rows |
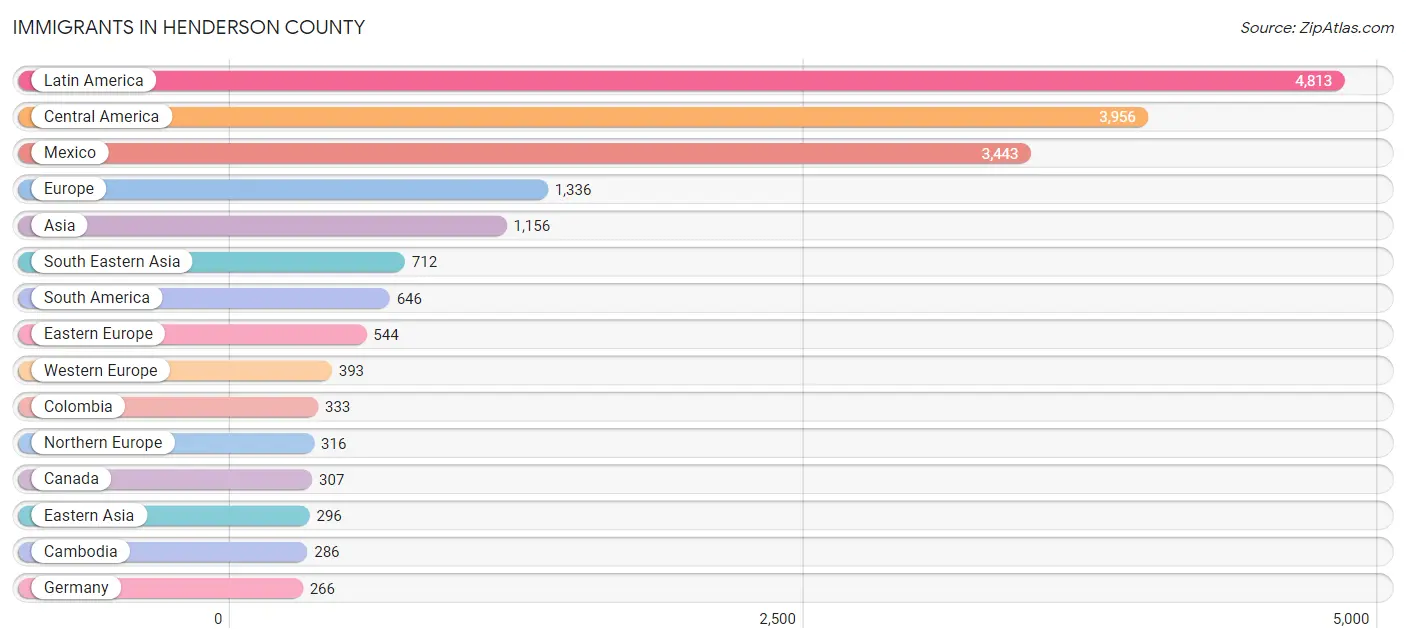
Immigrants in Henderson County
The most numerous immigrant groups reported in Henderson County came from Latin America (4,813 | 4.1%), Central America (3,956 | 3.4%), Mexico (3,443 | 3.0%), Europe (1,336 | 1.1%), and Asia (1,156 | 1.0%), together accounting for 12.6% of all Henderson County residents.
| Immigration Origin | # Population | % Population |
| Africa | 168 | 0.1% |
| Argentina | 74 | 0.1% |
| Asia | 1,156 | 1.0% |
| Australia | 17 | 0.0% |
| Austria | 28 | 0.0% |
| Belgium | 22 | 0.0% |
| Brazil | 62 | 0.1% |
| Cambodia | 286 | 0.3% |
| Canada | 307 | 0.3% |
| Caribbean | 211 | 0.2% |
| Central America | 3,956 | 3.4% |
| Chile | 63 | 0.1% |
| China | 189 | 0.2% |
| Colombia | 333 | 0.3% |
| Croatia | 10 | 0.0% |
| Cuba | 57 | 0.1% |
| Czechoslovakia | 29 | 0.0% |
| Dominican Republic | 92 | 0.1% |
| Eastern Africa | 51 | 0.0% |
| Eastern Asia | 296 | 0.3% |
| Eastern Europe | 544 | 0.5% |
| Ecuador | 27 | 0.0% |
| El Salvador | 224 | 0.2% |
| England | 140 | 0.1% |
| Ethiopia | 16 | 0.0% |
| Europe | 1,336 | 1.1% |
| France | 21 | 0.0% |
| Germany | 266 | 0.2% |
| Ghana | 27 | 0.0% |
| Grenada | 38 | 0.0% |
| Guatemala | 152 | 0.1% |
| Guyana | 29 | 0.0% |
| Honduras | 122 | 0.1% |
| Hong Kong | 70 | 0.1% |
| Hungary | 69 | 0.1% |
| India | 54 | 0.1% |
| Indonesia | 20 | 0.0% |
| Iran | 15 | 0.0% |
| Iraq | 12 | 0.0% |
| Ireland | 7 | 0.0% |
| Italy | 45 | 0.0% |
| Jamaica | 24 | 0.0% |
| Japan | 3 | 0.0% |
| Kenya | 29 | 0.0% |
| Korea | 104 | 0.1% |
| Latin America | 4,813 | 4.1% |
| Lebanon | 14 | 0.0% |
| Lithuania | 6 | 0.0% |
| Mexico | 3,443 | 3.0% |
| Micronesia | 95 | 0.1% |
| Morocco | 46 | 0.0% |
| Netherlands | 41 | 0.0% |
| Nicaragua | 15 | 0.0% |
| Nigeria | 9 | 0.0% |
| North Macedonia | 15 | 0.0% |
| Northern Africa | 46 | 0.0% |
| Northern Europe | 316 | 0.3% |
| Oceania | 119 | 0.1% |
| Peru | 6 | 0.0% |
| Philippines | 163 | 0.1% |
| Poland | 48 | 0.0% |
| Portugal | 14 | 0.0% |
| Romania | 107 | 0.1% |
| Russia | 70 | 0.1% |
| Saudi Arabia | 30 | 0.0% |
| Scotland | 1 | 0.0% |
| Singapore | 34 | 0.0% |
| South Africa | 35 | 0.0% |
| South America | 646 | 0.5% |
| South Central Asia | 69 | 0.1% |
| South Eastern Asia | 712 | 0.6% |
| Southern Europe | 83 | 0.1% |
| Spain | 24 | 0.0% |
| Sweden | 5 | 0.0% |
| Syria | 7 | 0.0% |
| Thailand | 85 | 0.1% |
| Turkey | 16 | 0.0% |
| Ukraine | 190 | 0.2% |
| Uruguay | 22 | 0.0% |
| Venezuela | 27 | 0.0% |
| Vietnam | 124 | 0.1% |
| Western Africa | 36 | 0.0% |
| Western Asia | 79 | 0.1% |
| Western Europe | 393 | 0.3% | View All 84 Rows |
Sex and Age in Henderson County
Sex and Age in Henderson County
The most populous age groups in Henderson County are 55 to 59 Years (4,089 | 7.3%) for men and 65 to 69 Years (4,884 | 8.1%) for women.
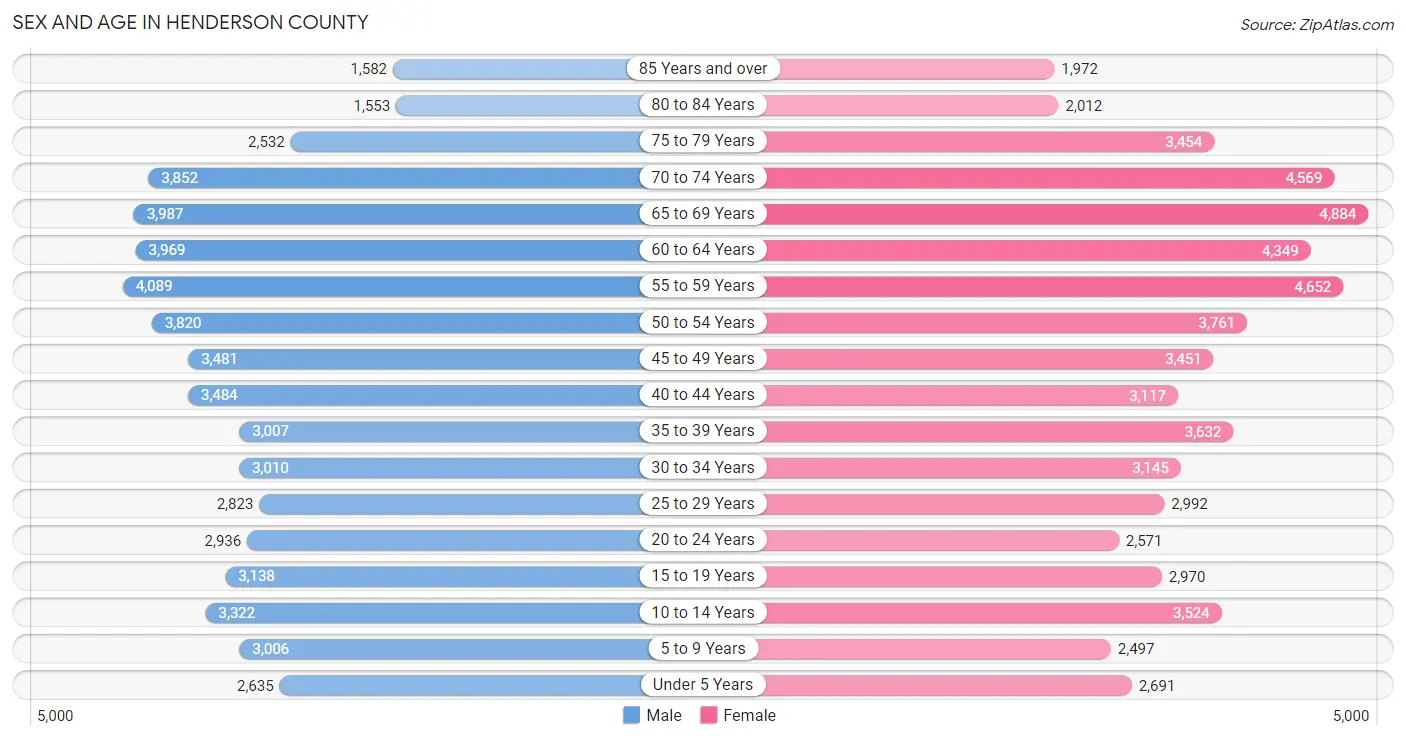
| Age Bracket | Male | Female |
| Under 5 Years | 2,635 (4.7%) | 2,691 (4.5%) |
| 5 to 9 Years | 3,006 (5.3%) | 2,497 (4.1%) |
| 10 to 14 Years | 3,322 (5.9%) | 3,524 (5.9%) |
| 15 to 19 Years | 3,138 (5.6%) | 2,970 (4.9%) |
| 20 to 24 Years | 2,936 (5.2%) | 2,571 (4.3%) |
| 25 to 29 Years | 2,823 (5.0%) | 2,992 (5.0%) |
| 30 to 34 Years | 3,010 (5.3%) | 3,145 (5.2%) |
| 35 to 39 Years | 3,007 (5.3%) | 3,632 (6.0%) |
| 40 to 44 Years | 3,484 (6.2%) | 3,117 (5.2%) |
| 45 to 49 Years | 3,481 (6.2%) | 3,451 (5.7%) |
| 50 to 54 Years | 3,820 (6.8%) | 3,761 (6.2%) |
| 55 to 59 Years | 4,089 (7.3%) | 4,652 (7.7%) |
| 60 to 64 Years | 3,969 (7.1%) | 4,349 (7.2%) |
| 65 to 69 Years | 3,987 (7.1%) | 4,884 (8.1%) |
| 70 to 74 Years | 3,852 (6.9%) | 4,569 (7.6%) |
| 75 to 79 Years | 2,532 (4.5%) | 3,454 (5.7%) |
| 80 to 84 Years | 1,553 (2.8%) | 2,012 (3.3%) |
| 85 Years and over | 1,582 (2.8%) | 1,972 (3.3%) |
| Total | 56,226 (100.0%) | 60,243 (100.0%) |
Families and Households in Henderson County
Median Family Size in Henderson County
The median family size in Henderson County is 2.80 persons per family, with single female/mother families (5,035 | 15.1%) accounting for the largest median family size of 2.88 persons per family. On the other hand, single male/father families (1,605 | 4.8%) represent the smallest median family size with 2.60 persons per family.
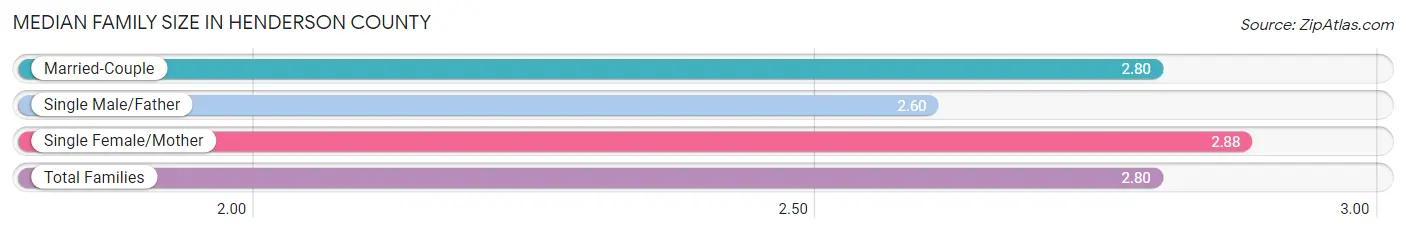
| Family Type | # Families | Family Size |
| Married-Couple | 26,778 (80.1%) | 2.80 |
| Single Male/Father | 1,605 (4.8%) | 2.60 |
| Single Female/Mother | 5,035 (15.1%) | 2.88 |
| Total Families | 33,418 (100.0%) | 2.80 |
Median Household Size in Henderson County
The median household size in Henderson County is 2.33 persons per household, with single female/mother households (5,035 | 10.2%) accounting for the largest median household size of 3.1 persons per household. non-family households (16,076 | 32.5%) represent the smallest median household size with 1.18 persons per household.
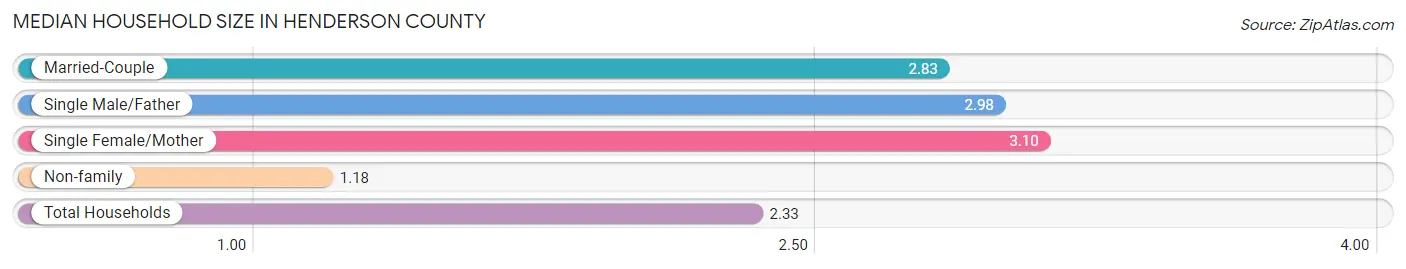
| Household Type | # Households | Household Size |
| Married-Couple | 26,778 (54.1%) | 2.83 |
| Single Male/Father | 1,605 (3.2%) | 2.98 |
| Single Female/Mother | 5,035 (10.2%) | 3.10 |
| Non-family | 16,076 (32.5%) | 1.18 |
| Total Households | 49,494 (100.0%) | 2.33 |
Household Size by Marriage Status in Henderson County
Out of a total of 49,494 households in Henderson County, 33,418 (67.5%) are family households, while 16,076 (32.5%) are nonfamily households. The most numerous type of family households are 2-person households, comprising 18,952, and the most common type of nonfamily households are 1-person households, comprising 13,929.
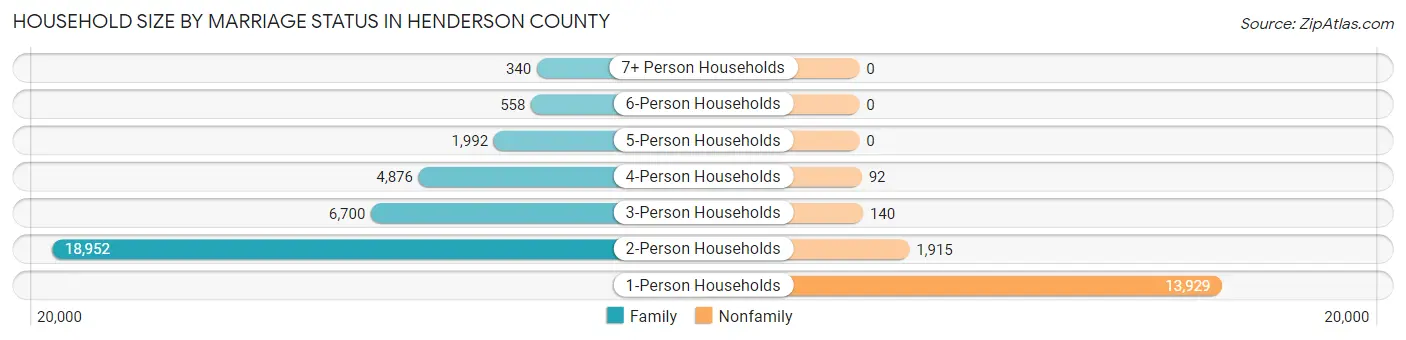
| Household Size | Family Households | Nonfamily Households |
| 1-Person Households | - | 13,929 (28.1%) |
| 2-Person Households | 18,952 (38.3%) | 1,915 (3.9%) |
| 3-Person Households | 6,700 (13.5%) | 140 (0.3%) |
| 4-Person Households | 4,876 (9.9%) | 92 (0.2%) |
| 5-Person Households | 1,992 (4.0%) | 0 (0.0%) |
| 6-Person Households | 558 (1.1%) | 0 (0.0%) |
| 7+ Person Households | 340 (0.7%) | 0 (0.0%) |
| Total | 33,418 (67.5%) | 16,076 (32.5%) |
Female Fertility in Henderson County
Fertility by Age in Henderson County
Average fertility rate in Henderson County is 59.0 births per 1,000 women. Women in the age bracket of 20 to 34 years have the highest fertility rate with 94.0 births per 1,000 women. Women in the age bracket of 20 to 34 years acount for 61.9% of all women with births.
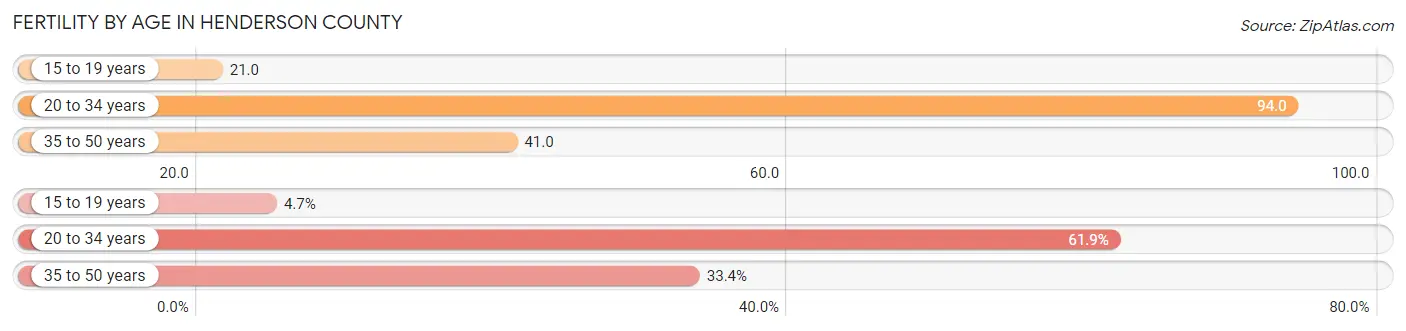
| Age Bracket | Women with Births | Births / 1,000 Women |
| 15 to 19 years | 62 (4.7%) | 21.0 |
| 20 to 34 years | 820 (61.9%) | 94.0 |
| 35 to 50 years | 442 (33.4%) | 41.0 |
| Total | 1,324 (100.0%) | 59.0 |
Fertility by Age by Marriage Status in Henderson County
83.8% of women with births (1,324) in Henderson County are married. The highest percentage of unmarried women with births falls into 35 to 50 years age bracket with 20.6% of them unmarried at the time of birth, while the lowest percentage of unmarried women with births belong to 20 to 34 years age bracket with 13.9% of them unmarried.
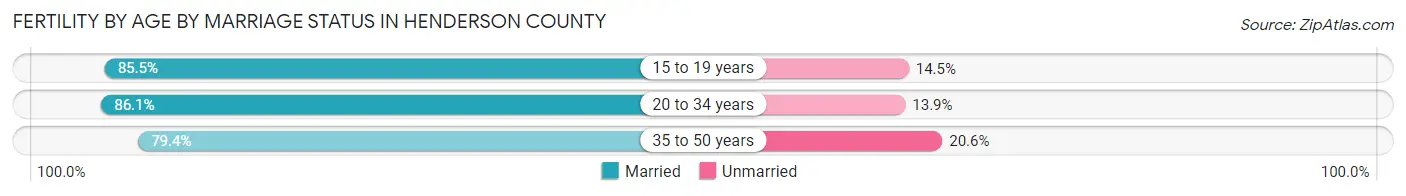
| Age Bracket | Married | Unmarried |
| 15 to 19 years | 53 (85.5%) | 9 (14.5%) |
| 20 to 34 years | 706 (86.1%) | 114 (13.9%) |
| 35 to 50 years | 351 (79.4%) | 91 (20.6%) |
| Total | 1,110 (83.8%) | 214 (16.2%) |
Fertility by Education in Henderson County
Average fertility rate in Henderson County is 59.0 births per 1,000 women. Women with the education attainment of graduate degree have the highest fertility rate of 146.0 births per 1,000 women, while women with the education attainment of less than high school have the lowest fertility at 24.0 births per 1,000 women. Women with the education attainment of college or associate's degree represent 39.0% of all women with births.
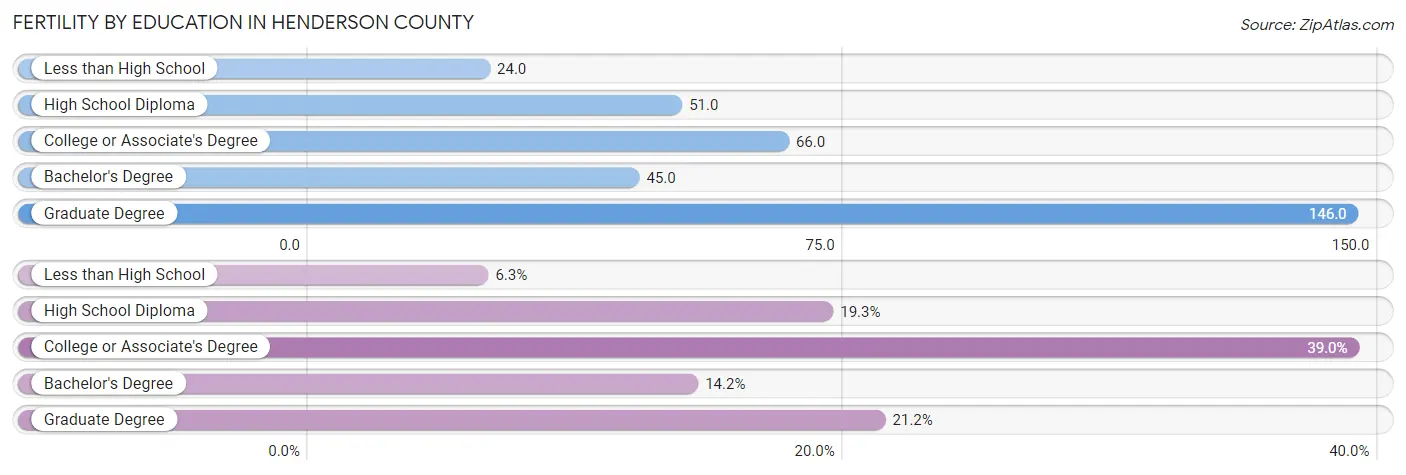
| Educational Attainment | Women with Births | Births / 1,000 Women |
| Less than High School | 84 (6.3%) | 24.0 |
| High School Diploma | 255 (19.3%) | 51.0 |
| College or Associate's Degree | 516 (39.0%) | 66.0 |
| Bachelor's Degree | 188 (14.2%) | 45.0 |
| Graduate Degree | 281 (21.2%) | 146.0 |
| Total | 1,324 (100.0%) | 59.0 |
Fertility by Education by Marriage Status in Henderson County
16.2% of women with births in Henderson County are unmarried. Women with the educational attainment of bachelor's degree are most likely to be married with 100.0% of them married at childbirth, while women with the educational attainment of high school diploma are least likely to be married with 29.4% of them unmarried at childbirth.
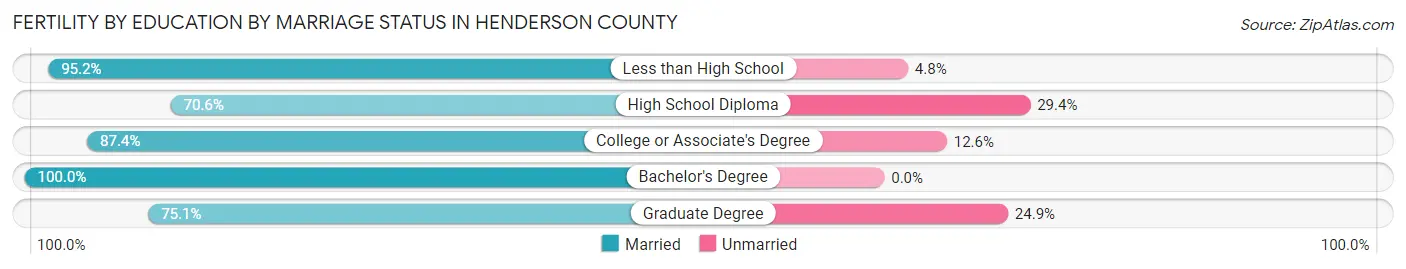
| Educational Attainment | Married | Unmarried |
| Less than High School | 80 (95.2%) | 4 (4.8%) |
| High School Diploma | 180 (70.6%) | 75 (29.4%) |
| College or Associate's Degree | 451 (87.4%) | 65 (12.6%) |
| Bachelor's Degree | 188 (100.0%) | 0 (0.0%) |
| Graduate Degree | 211 (75.1%) | 70 (24.9%) |
| Total | 1,110 (83.8%) | 214 (16.2%) |
Income in Henderson County
Income Overview in Henderson County
Per Capita Income in Henderson County is $37,457, while median incomes of families and households are $81,406 and $65,508 respectively.
| Characteristic | Number | Measure |
| Per Capita Income | 116,469 | $37,457 |
| Median Family Income | 33,418 | $81,406 |
| Mean Family Income | 33,418 | $102,583 |
| Median Household Income | 49,494 | $65,508 |
| Mean Household Income | 49,494 | $86,842 |
| Income Deficit | 33,418 | $10,139 |
| Wage / Income Gap (%) | 116,469 | 28.66% |
| Wage / Income Gap ($) | 116,469 | 71.34¢ per $1 |
| Gini / Inequality Index | 116,469 | 0.45 |
Earnings by Sex in Henderson County
Average Earnings in Henderson County are $34,500, $40,873 for men and $29,157 for women, a difference of 28.7%.
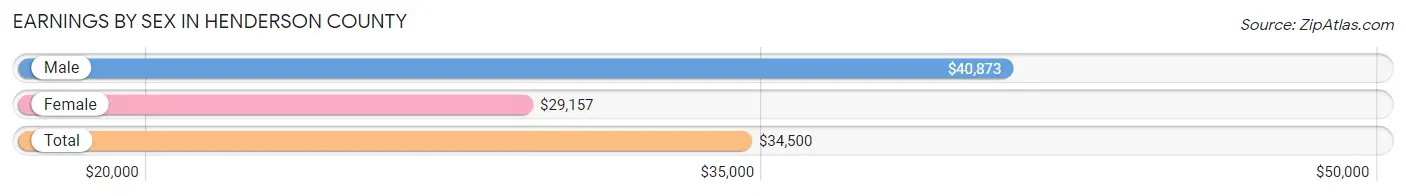
| Sex | Number | Average Earnings |
| Male | 30,603 (51.7%) | $40,873 |
| Female | 28,641 (48.3%) | $29,157 |
| Total | 59,244 (100.0%) | $34,500 |
Earnings by Sex by Income Bracket in Henderson County
The most common earnings brackets in Henderson County are $100,000+ for men (4,122 | 13.5%) and $25,000 to $29,999 for women (2,768 | 9.7%).

| Income | Male | Female |
| $2,499 or less | 1,577 (5.1%) | 1,726 (6.0%) |
| $2,500 to $4,999 | 896 (2.9%) | 1,160 (4.1%) |
| $5,000 to $7,499 | 904 (2.9%) | 1,298 (4.5%) |
| $7,500 to $9,999 | 626 (2.1%) | 782 (2.7%) |
| $10,000 to $12,499 | 941 (3.1%) | 1,799 (6.3%) |
| $12,500 to $14,999 | 748 (2.4%) | 1,254 (4.4%) |
| $15,000 to $17,499 | 399 (1.3%) | 1,114 (3.9%) |
| $17,500 to $19,999 | 1,000 (3.3%) | 852 (3.0%) |
| $20,000 to $22,499 | 654 (2.1%) | 1,148 (4.0%) |
| $22,500 to $24,999 | 1,069 (3.5%) | 956 (3.3%) |
| $25,000 to $29,999 | 2,558 (8.4%) | 2,768 (9.7%) |
| $30,000 to $34,999 | 1,924 (6.3%) | 1,898 (6.6%) |
| $35,000 to $39,999 | 1,740 (5.7%) | 2,122 (7.4%) |
| $40,000 to $44,999 | 1,508 (4.9%) | 1,341 (4.7%) |
| $45,000 to $49,999 | 1,611 (5.3%) | 1,520 (5.3%) |
| $50,000 to $54,999 | 1,634 (5.3%) | 908 (3.2%) |
| $55,000 to $64,999 | 2,196 (7.2%) | 1,778 (6.2%) |
| $65,000 to $74,999 | 1,674 (5.5%) | 984 (3.4%) |
| $75,000 to $99,999 | 2,822 (9.2%) | 1,686 (5.9%) |
| $100,000+ | 4,122 (13.5%) | 1,547 (5.4%) |
| Total | 30,603 (100.0%) | 28,641 (100.0%) |
Earnings by Sex by Educational Attainment in Henderson County
Average earnings in Henderson County are $46,699 for men and $32,737 for women, a difference of 29.9%. Men with an educational attainment of graduate degree enjoy the highest average annual earnings of $79,854, while those with less than high school education earn the least with $27,071. Women with an educational attainment of graduate degree earn the most with the average annual earnings of $54,516, while those with less than high school education have the smallest earnings of $20,064.
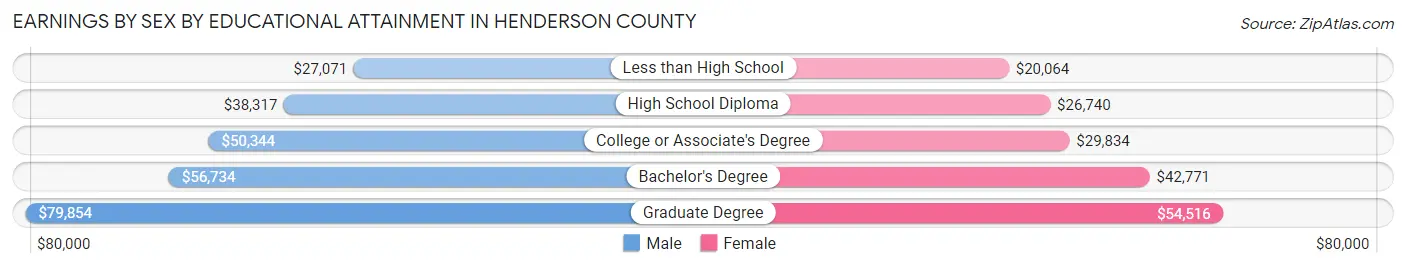
| Educational Attainment | Male Income | Female Income |
| Less than High School | $27,071 | $20,064 |
| High School Diploma | $38,317 | $26,740 |
| College or Associate's Degree | $50,344 | $29,834 |
| Bachelor's Degree | $56,734 | $42,771 |
| Graduate Degree | $79,854 | $54,516 |
| Total | $46,699 | $32,737 |
Family Income in Henderson County
Family Income Brackets in Henderson County
According to the Henderson County family income data, there are 6,784 families falling into the $100,000 to $149,999 income range, which is the most common income bracket and makes up 20.3% of all families. Conversely, the $10,000 to $14,999 income bracket is the least frequent group with only 802 families (2.4%) belonging to this category.
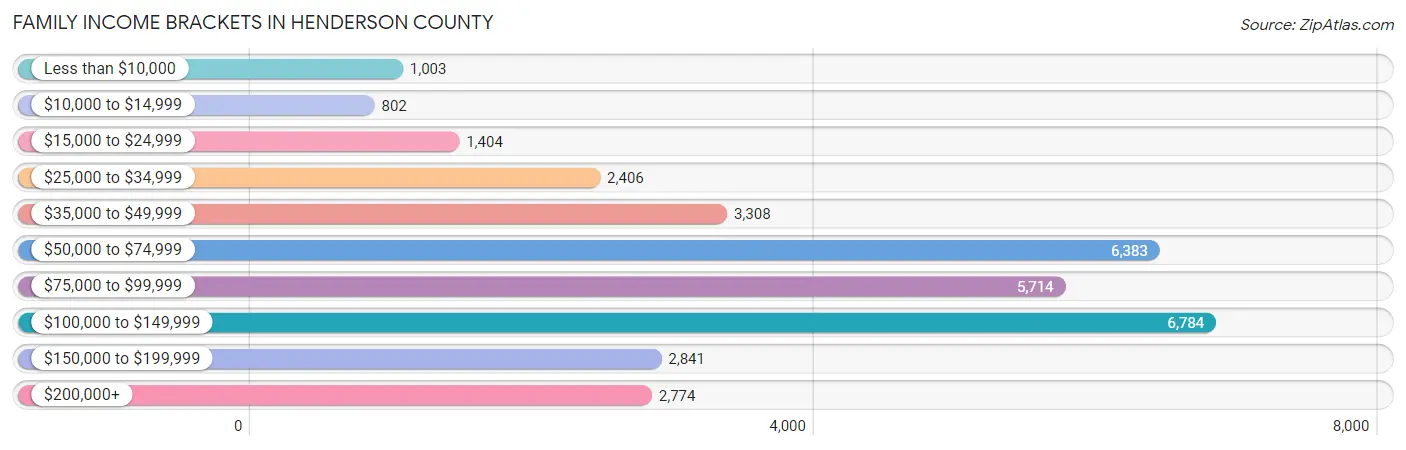
| Income Bracket | # Families | % Families |
| Less than $10,000 | 1,003 | 3.0% |
| $10,000 to $14,999 | 802 | 2.4% |
| $15,000 to $24,999 | 1,404 | 4.2% |
| $25,000 to $34,999 | 2,406 | 7.2% |
| $35,000 to $49,999 | 3,308 | 9.9% |
| $50,000 to $74,999 | 6,383 | 19.1% |
| $75,000 to $99,999 | 5,714 | 17.1% |
| $100,000 to $149,999 | 6,784 | 20.3% |
| $150,000 to $199,999 | 2,841 | 8.5% |
| $200,000+ | 2,774 | 8.3% |
Family Income by Famaliy Size in Henderson County
7+ person families (253 | 0.8%) account for the highest median family income in Henderson County with $141,157 per family, while 2-person families (19,802 | 59.3%) have the highest median income of $38,418 per family member.
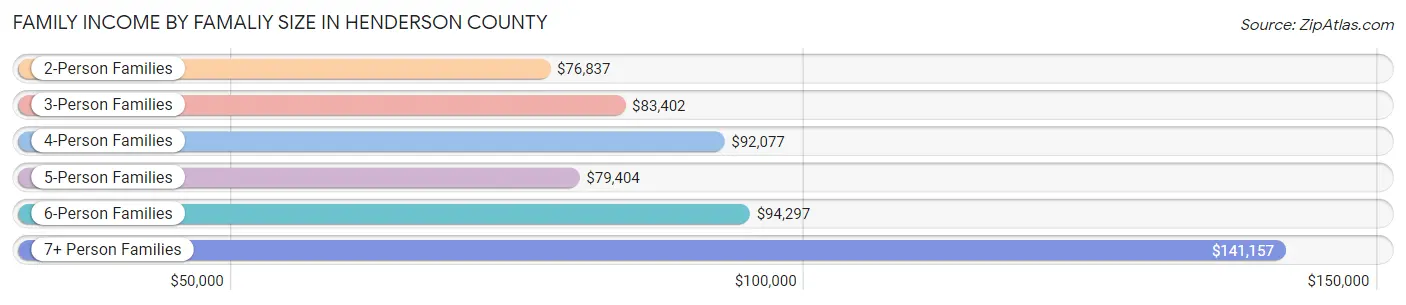
| Income Bracket | # Families | Median Income |
| 2-Person Families | 19,802 (59.3%) | $76,837 |
| 3-Person Families | 6,472 (19.4%) | $83,402 |
| 4-Person Families | 4,832 (14.5%) | $92,077 |
| 5-Person Families | 1,561 (4.7%) | $79,404 |
| 6-Person Families | 498 (1.5%) | $94,297 |
| 7+ Person Families | 253 (0.8%) | $141,157 |
| Total | 33,418 (100.0%) | $81,406 |
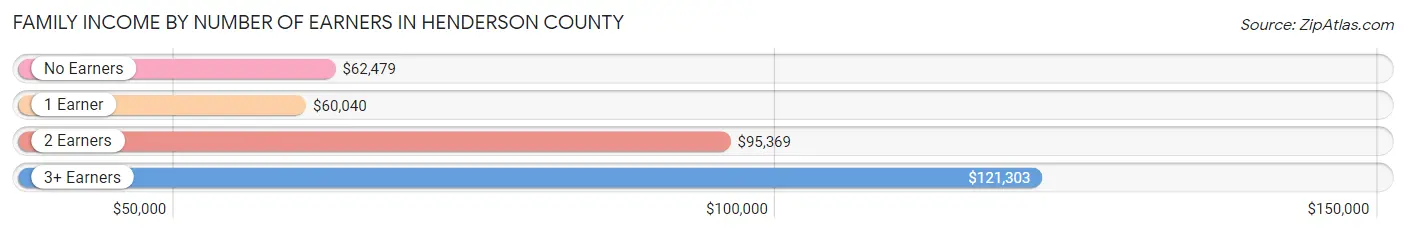
Family Income by Number of Earners in Henderson County
The median family income in Henderson County is $81,406, with families comprising 3+ earners (3,136) having the highest median family income of $121,303, while families with 1 earner (9,650) have the lowest median family income of $60,040, accounting for 9.4% and 28.9% of families, respectively.
| Number of Earners | # Families | Median Income |
| No Earners | 7,611 (22.8%) | $62,479 |
| 1 Earner | 9,650 (28.9%) | $60,040 |
| 2 Earners | 13,021 (39.0%) | $95,369 |
| 3+ Earners | 3,136 (9.4%) | $121,303 |
| Total | 33,418 (100.0%) | $81,406 |
Household Income in Henderson County
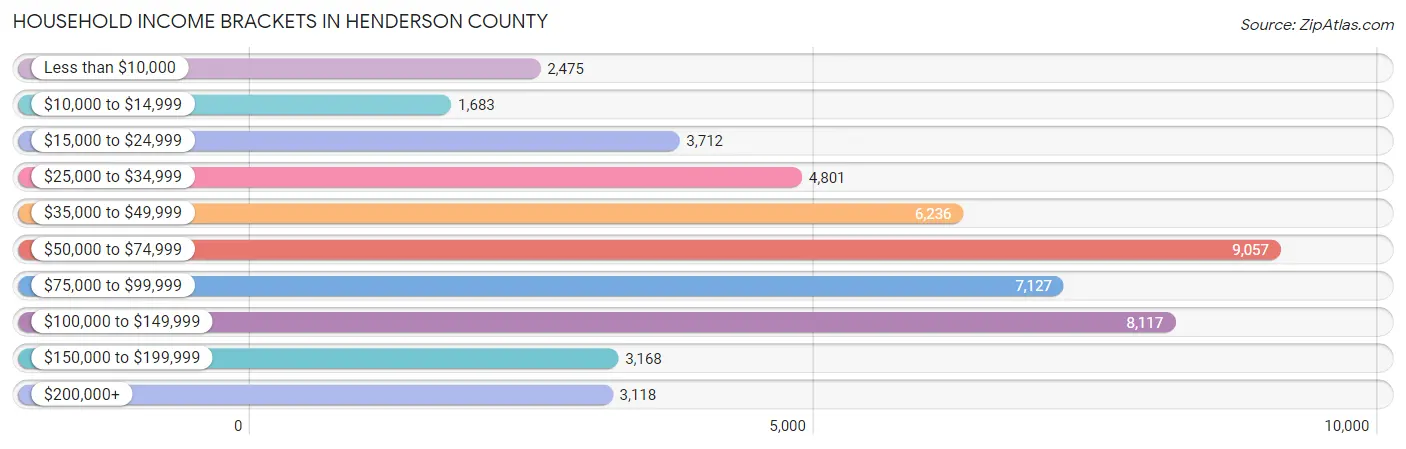
Household Income Brackets in Henderson County
With 9,057 households falling in the category, the $50,000 to $74,999 income range is the most frequent in Henderson County, accounting for 18.3% of all households. In contrast, only 1,683 households (3.4%) fall into the $10,000 to $14,999 income bracket, making it the least populous group.
| Income Bracket | # Households | % Households |
| Less than $10,000 | 2,475 | 5.0% |
| $10,000 to $14,999 | 1,683 | 3.4% |
| $15,000 to $24,999 | 3,712 | 7.5% |
| $25,000 to $34,999 | 4,801 | 9.7% |
| $35,000 to $49,999 | 6,236 | 12.6% |
| $50,000 to $74,999 | 9,057 | 18.3% |
| $75,000 to $99,999 | 7,127 | 14.4% |
| $100,000 to $149,999 | 8,117 | 16.4% |
| $150,000 to $199,999 | 3,168 | 6.4% |
| $200,000+ | 3,118 | 6.3% |
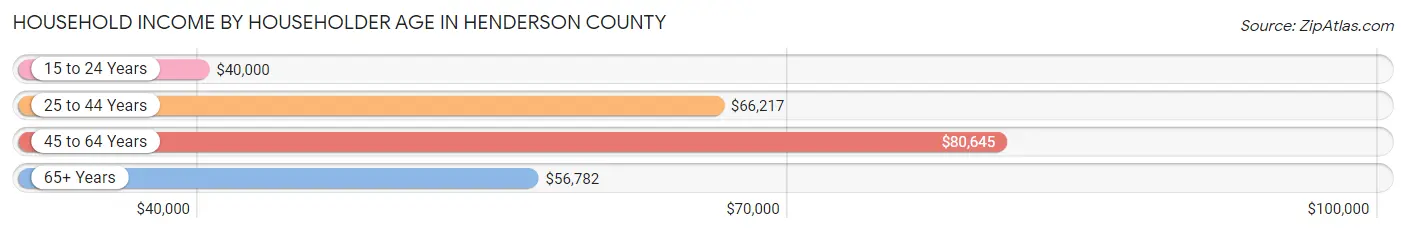
Household Income by Householder Age in Henderson County
The median household income in Henderson County is $65,508, with the highest median household income of $80,645 found in the 45 to 64 years age bracket for the primary householder. A total of 17,173 households (34.7%) fall into this category. Meanwhile, the 15 to 24 years age bracket for the primary householder has the lowest median household income of $40,000, with 1,130 households (2.3%) in this group.
| Income Bracket | # Households | Median Income |
| 15 to 24 Years | 1,130 (2.3%) | $40,000 |
| 25 to 44 Years | 12,159 (24.6%) | $66,217 |
| 45 to 64 Years | 17,173 (34.7%) | $80,645 |
| 65+ Years | 19,032 (38.5%) | $56,782 |
| Total | 49,494 (100.0%) | $65,508 |
Poverty in Henderson County
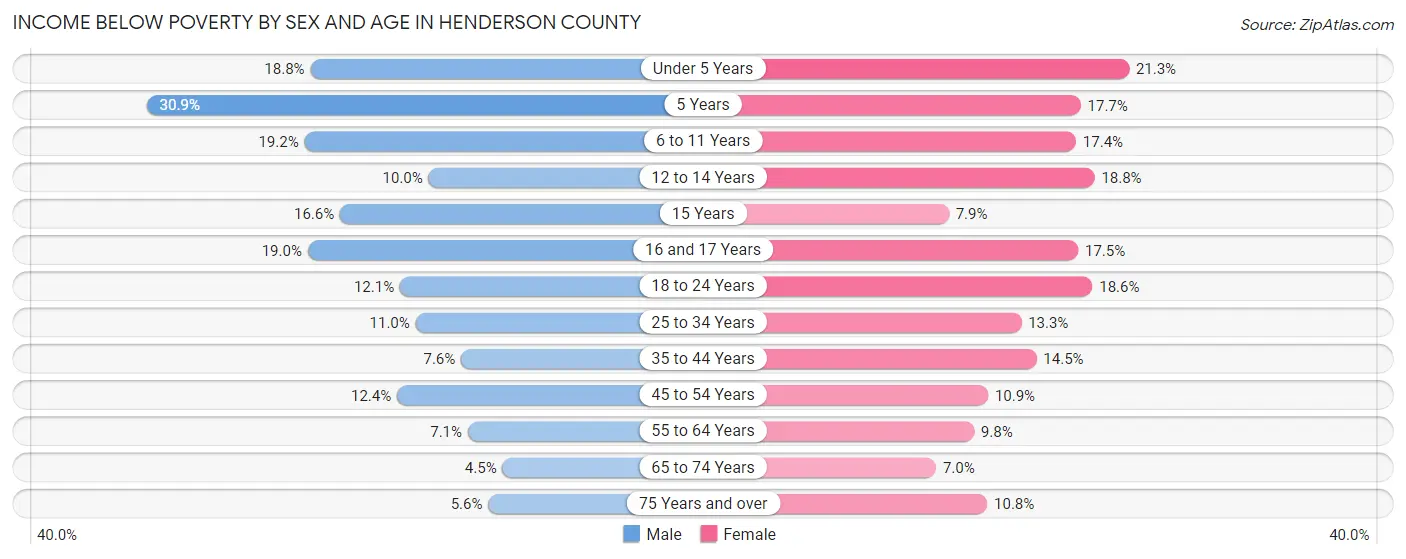
Income Below Poverty by Sex and Age in Henderson County
With 10.2% poverty level for males and 12.5% for females among the residents of Henderson County, 5 year old males and under 5 year old females are the most vulnerable to poverty, with 129 males (30.9%) and 566 females (21.3%) in their respective age groups living below the poverty level.
| Age Bracket | Male | Female |
| Under 5 Years | 487 (18.8%) | 566 (21.3%) |
| 5 Years | 129 (30.9%) | 119 (17.7%) |
| 6 to 11 Years | 757 (19.2%) | 526 (17.4%) |
| 12 to 14 Years | 188 (10.0%) | 407 (18.8%) |
| 15 Years | 101 (16.6%) | 50 (7.9%) |
| 16 and 17 Years | 267 (19.0%) | 235 (17.5%) |
| 18 to 24 Years | 489 (12.1%) | 664 (18.6%) |
| 25 to 34 Years | 637 (11.0%) | 817 (13.3%) |
| 35 to 44 Years | 487 (7.6%) | 970 (14.4%) |
| 45 to 54 Years | 896 (12.3%) | 780 (10.8%) |
| 55 to 64 Years | 569 (7.1%) | 882 (9.8%) |
| 65 to 74 Years | 350 (4.5%) | 653 (7.0%) |
| 75 Years and over | 306 (5.6%) | 755 (10.8%) |
| Total | 5,663 (10.2%) | 7,424 (12.5%) |
Income Above Poverty by Sex and Age in Henderson County
According to the poverty statistics in Henderson County, males aged 65 to 74 years and females aged 65 to 74 years are the age groups that are most secure financially, with 95.5% of males and 93.0% of females in these age groups living above the poverty line.
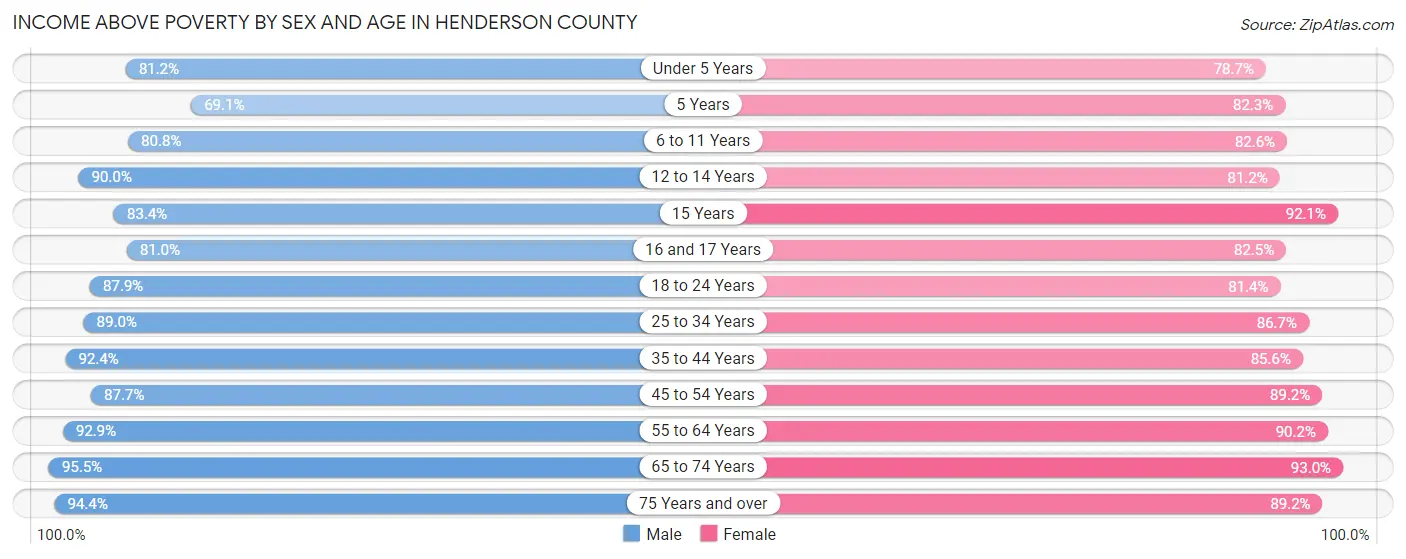
| Age Bracket | Male | Female |
| Under 5 Years | 2,106 (81.2%) | 2,089 (78.7%) |
| 5 Years | 288 (69.1%) | 552 (82.3%) |
| 6 to 11 Years | 3,181 (80.8%) | 2,500 (82.6%) |
| 12 to 14 Years | 1,691 (90.0%) | 1,762 (81.2%) |
| 15 Years | 508 (83.4%) | 580 (92.1%) |
| 16 and 17 Years | 1,140 (81.0%) | 1,105 (82.5%) |
| 18 to 24 Years | 3,541 (87.9%) | 2,905 (81.4%) |
| 25 to 34 Years | 5,172 (89.0%) | 5,315 (86.7%) |
| 35 to 44 Years | 5,932 (92.4%) | 5,745 (85.6%) |
| 45 to 54 Years | 6,360 (87.6%) | 6,410 (89.1%) |
| 55 to 64 Years | 7,452 (92.9%) | 8,110 (90.2%) |
| 65 to 74 Years | 7,389 (95.5%) | 8,693 (93.0%) |
| 75 Years and over | 5,185 (94.4%) | 6,239 (89.2%) |
| Total | 49,945 (89.8%) | 52,005 (87.5%) |
Income Below Poverty Among Married-Couple Families in Henderson County
The poverty statistics for married-couple families in Henderson County show that 4.9% or 1,317 of the total 26,778 families live below the poverty line. Families with 3 or 4 children have the highest poverty rate of 13.1%, comprising of 163 families. On the other hand, families with 5 or more children have the lowest poverty rate of 0.0%, which includes 0 families.
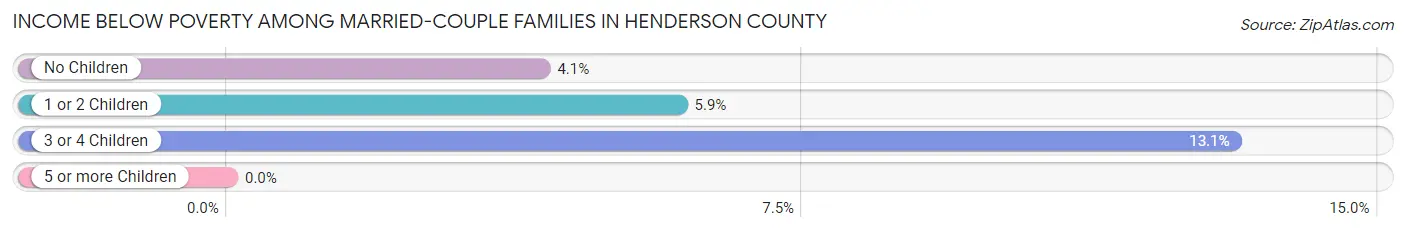
| Children | Above Poverty | Below Poverty |
| No Children | 18,124 (95.9%) | 770 (4.1%) |
| 1 or 2 Children | 6,159 (94.1%) | 384 (5.9%) |
| 3 or 4 Children | 1,081 (86.9%) | 163 (13.1%) |
| 5 or more Children | 97 (100.0%) | 0 (0.0%) |
| Total | 25,461 (95.1%) | 1,317 (4.9%) |
Income Below Poverty Among Single-Parent Households in Henderson County
According to the poverty data in Henderson County, 8.7% or 140 single-father households and 28.1% or 1,417 single-mother households are living below the poverty line. Among single-father households, those with 1 or 2 children have the highest poverty rate, with 111 households (15.7%) experiencing poverty. Likewise, among single-mother households, those with 3 or 4 children have the highest poverty rate, with 340 households (69.4%) falling below the poverty line.
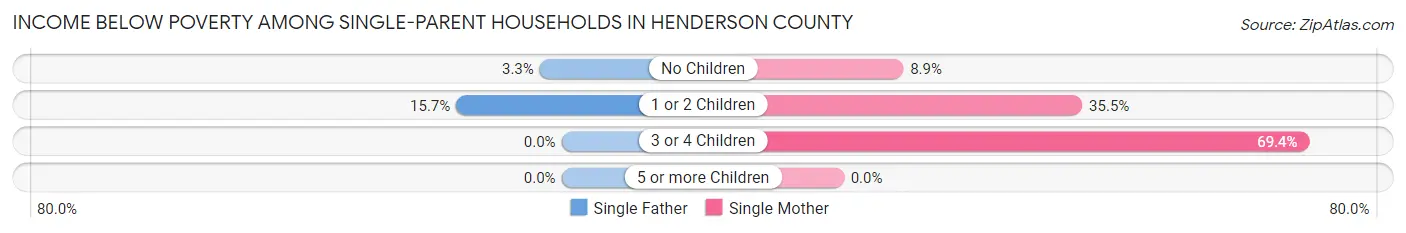
| Children | Single Father | Single Mother |
| No Children | 29 (3.3%) | 179 (8.9%) |
| 1 or 2 Children | 111 (15.7%) | 898 (35.5%) |
| 3 or 4 Children | 0 (0.0%) | 340 (69.4%) |
| 5 or more Children | 0 (0.0%) | 0 (0.0%) |
| Total | 140 (8.7%) | 1,417 (28.1%) |
Income Below Poverty Among Married-Couple vs Single-Parent Households in Henderson County
The poverty data for Henderson County shows that 1,317 of the married-couple family households (4.9%) and 1,557 of the single-parent households (23.4%) are living below the poverty level. Within the married-couple family households, those with 3 or 4 children have the highest poverty rate, with 163 households (13.1%) falling below the poverty line. Among the single-parent households, those with 3 or 4 children have the highest poverty rate, with 340 household (68.3%) living below poverty.
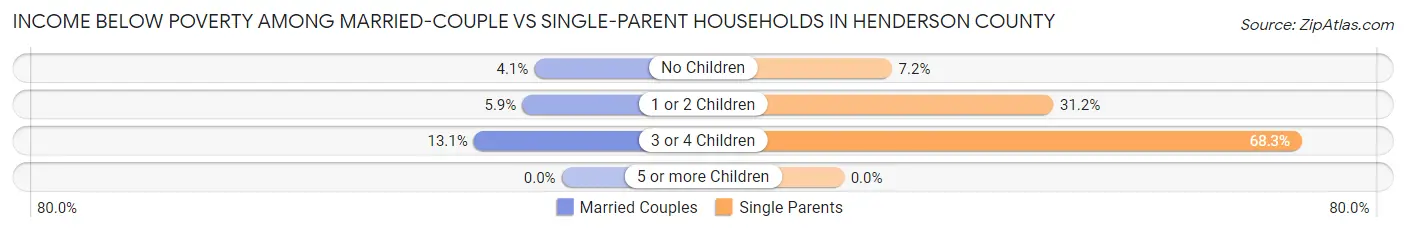
| Children | Married-Couple Families | Single-Parent Households |
| No Children | 770 (4.1%) | 208 (7.1%) |
| 1 or 2 Children | 384 (5.9%) | 1,009 (31.2%) |
| 3 or 4 Children | 163 (13.1%) | 340 (68.3%) |
| 5 or more Children | 0 (0.0%) | 0 (0.0%) |
| Total | 1,317 (4.9%) | 1,557 (23.4%) |
Employment Characteristics in Henderson County
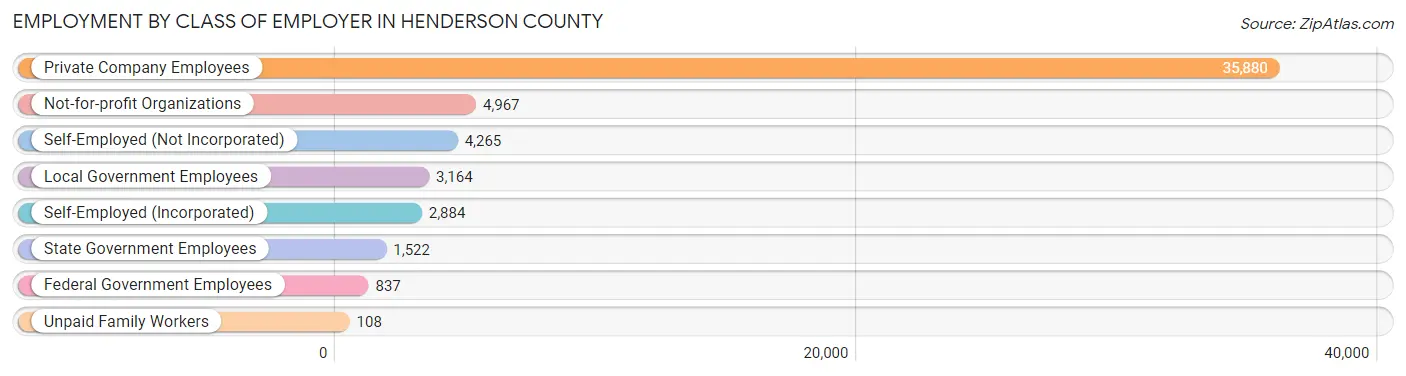
Employment by Class of Employer in Henderson County
Among the 53,627 employed individuals in Henderson County, private company employees (35,880 | 66.9%), not-for-profit organizations (4,967 | 9.3%), and self-employed (not incorporated) (4,265 | 8.0%) make up the most common classes of employment.
| Employer Class | # Employees | % Employees |
| Private Company Employees | 35,880 | 66.9% |
| Self-Employed (Incorporated) | 2,884 | 5.4% |
| Self-Employed (Not Incorporated) | 4,265 | 8.0% |
| Not-for-profit Organizations | 4,967 | 9.3% |
| Local Government Employees | 3,164 | 5.9% |
| State Government Employees | 1,522 | 2.8% |
| Federal Government Employees | 837 | 1.6% |
| Unpaid Family Workers | 108 | 0.2% |
| Total | 53,627 | 100.0% |
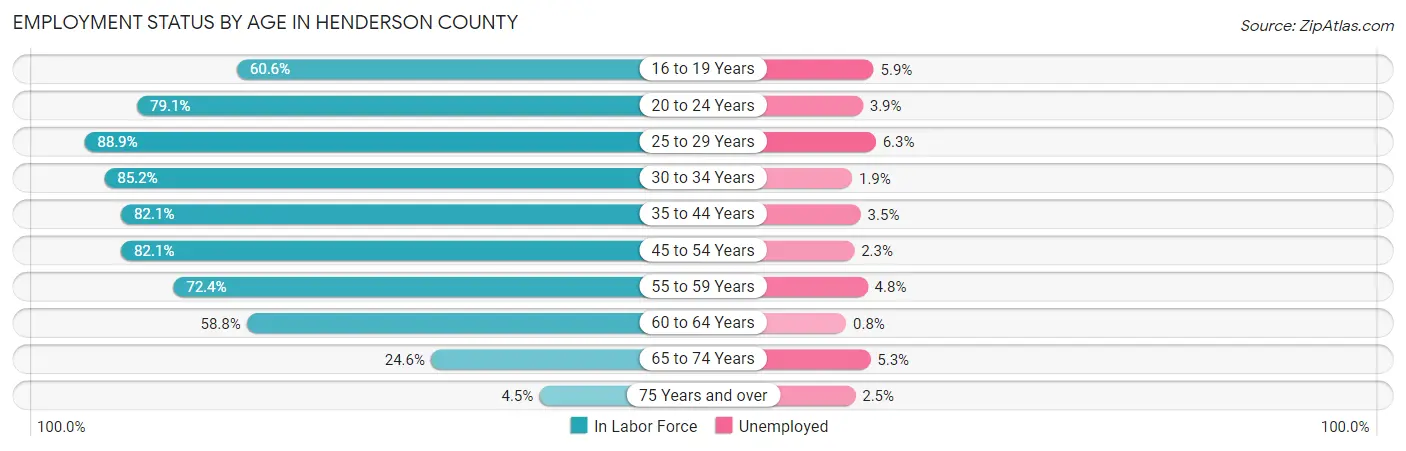
Employment Status by Age in Henderson County
According to the labor force statistics for Henderson County, out of the total population over 16 years of age (97,554), 58.0% or 56,581 individuals are in the labor force, with 3.5% or 1,980 of them unemployed. The age group with the highest labor force participation rate is 25 to 29 years, with 88.9% or 5,170 individuals in the labor force. Within the labor force, the 25 to 29 years age range has the highest percentage of unemployed individuals, with 6.3% or 326 of them being unemployed.
| Age Bracket | In Labor Force | Unemployed |
| 16 to 19 Years | 2,950 (60.6%) | 174 (5.9%) |
| 20 to 24 Years | 4,356 (79.1%) | 170 (3.9%) |
| 25 to 29 Years | 5,170 (88.9%) | 326 (6.3%) |
| 30 to 34 Years | 5,244 (85.2%) | 100 (1.9%) |
| 35 to 44 Years | 10,870 (82.1%) | 380 (3.5%) |
| 45 to 54 Years | 11,915 (82.1%) | 274 (2.3%) |
| 55 to 59 Years | 6,328 (72.4%) | 304 (4.8%) |
| 60 to 64 Years | 4,891 (58.8%) | 39 (0.8%) |
| 65 to 74 Years | 4,254 (24.6%) | 225 (5.3%) |
| 75 Years and over | 590 (4.5%) | 15 (2.5%) |
| Total | 56,581 (58.0%) | 1,980 (3.5%) |
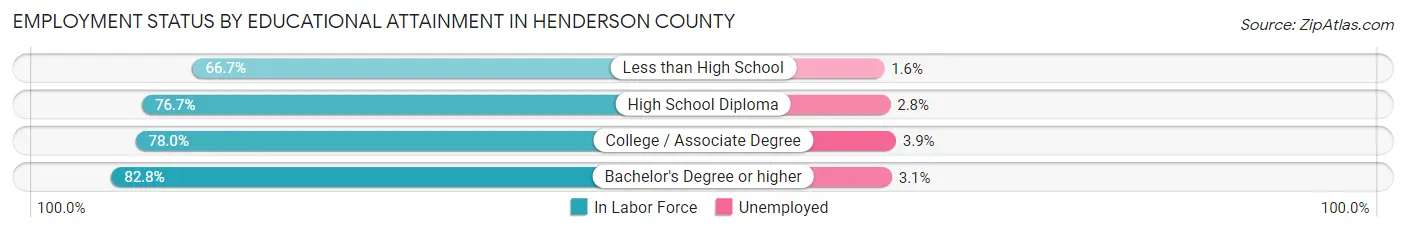
Employment Status by Educational Attainment in Henderson County
According to labor force statistics for Henderson County, 78.2% of individuals (44,404) out of the total population between 25 and 64 years of age (56,782) are in the labor force, with 3.2% or 1,421 of them being unemployed. The group with the highest labor force participation rate are those with the educational attainment of bachelor's degree or higher, with 82.8% or 14,945 individuals in the labor force. Within the labor force, individuals with college / associate degree education have the highest percentage of unemployment, with 3.9% or 587 of them being unemployed.
| Educational Attainment | In Labor Force | Unemployed |
| Less than High School | 3,282 (66.7%) | 79 (1.6%) |
| High School Diploma | 11,130 (76.7%) | 406 (2.8%) |
| College / Associate Degree | 15,055 (78.0%) | 753 (3.9%) |
| Bachelor's Degree or higher | 14,945 (82.8%) | 560 (3.1%) |
| Total | 44,404 (78.2%) | 1,817 (3.2%) |
Employment Occupations by Sex in Henderson County
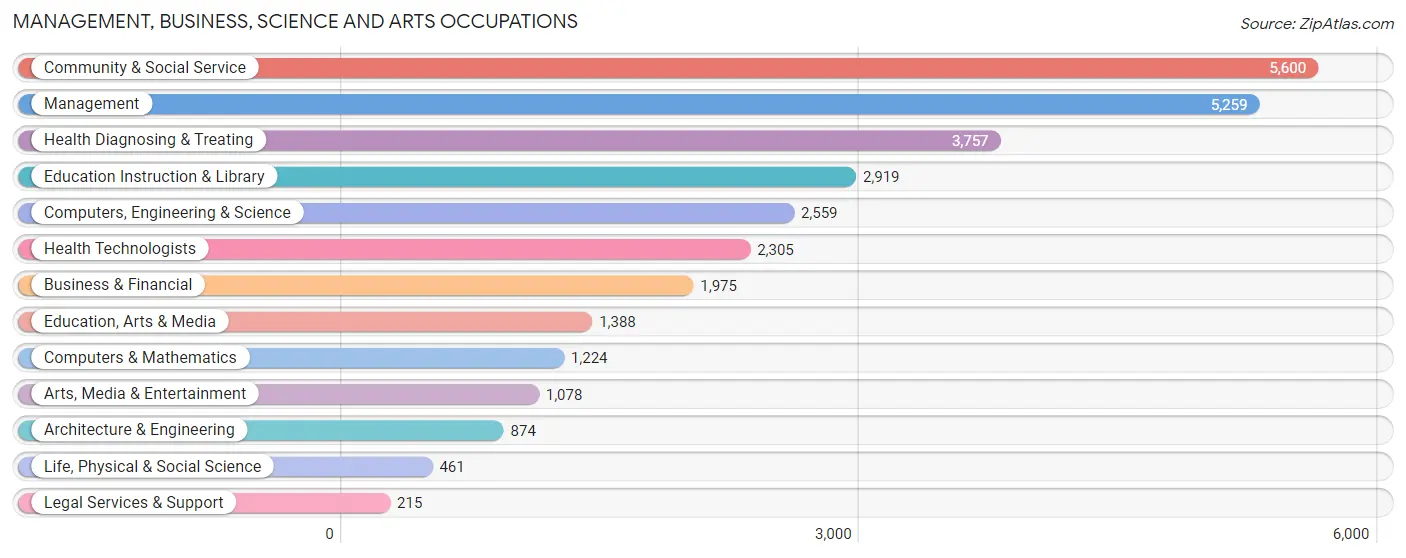
Management, Business, Science and Arts Occupations
The most common Management, Business, Science and Arts occupations in Henderson County are Community & Social Service (5,600 | 10.3%), Management (5,259 | 9.6%), Health Diagnosing & Treating (3,757 | 6.9%), Education Instruction & Library (2,919 | 5.3%), and Computers, Engineering & Science (2,559 | 4.7%).
Management, Business, Science and Arts Occupations by Sex
Within the Management, Business, Science and Arts occupations in Henderson County, the most male-oriented occupations are Architecture & Engineering (87.5%), Computers & Mathematics (86.4%), and Computers, Engineering & Science (81.3%), while the most female-oriented occupations are Education Instruction & Library (80.8%), Health Diagnosing & Treating (75.2%), and Health Technologists (73.6%).
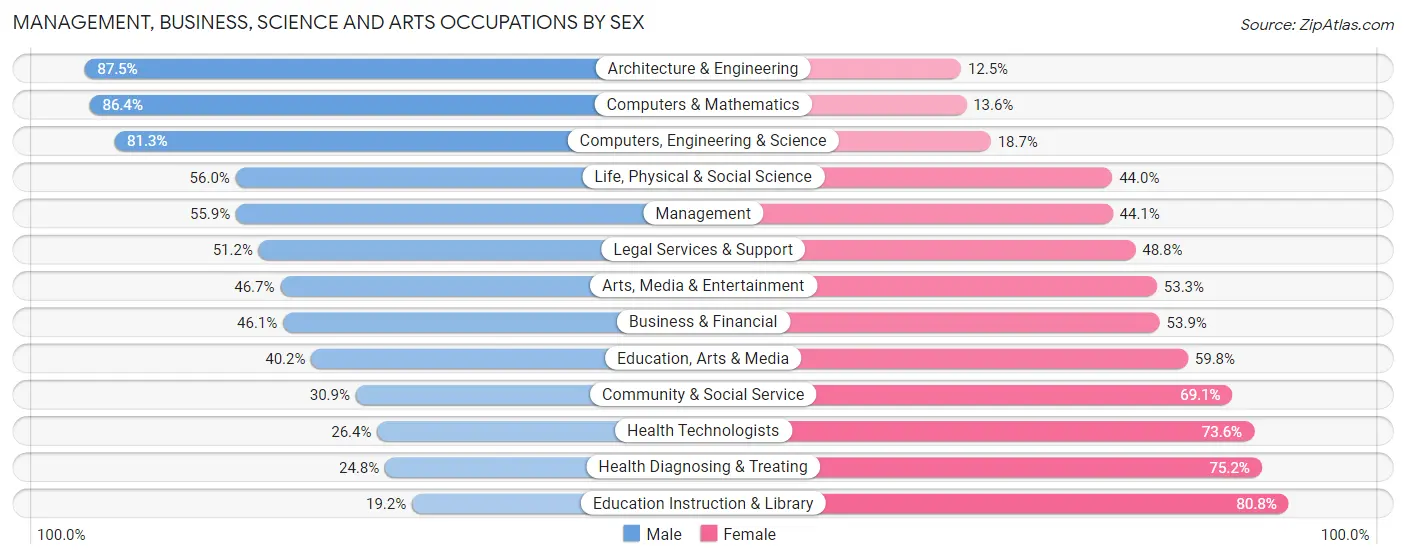
| Occupation | Male | Female |
| Management | 2,939 (55.9%) | 2,320 (44.1%) |
| Business & Financial | 910 (46.1%) | 1,065 (53.9%) |
| Computers, Engineering & Science | 2,081 (81.3%) | 478 (18.7%) |
| Computers & Mathematics | 1,058 (86.4%) | 166 (13.6%) |
| Architecture & Engineering | 765 (87.5%) | 109 (12.5%) |
| Life, Physical & Social Science | 258 (56.0%) | 203 (44.0%) |
| Community & Social Service | 1,731 (30.9%) | 3,869 (69.1%) |
| Education, Arts & Media | 558 (40.2%) | 830 (59.8%) |
| Legal Services & Support | 110 (51.2%) | 105 (48.8%) |
| Education Instruction & Library | 560 (19.2%) | 2,359 (80.8%) |
| Arts, Media & Entertainment | 503 (46.7%) | 575 (53.3%) |
| Health Diagnosing & Treating | 932 (24.8%) | 2,825 (75.2%) |
| Health Technologists | 609 (26.4%) | 1,696 (73.6%) |
| Total (Category) | 8,593 (44.9%) | 10,557 (55.1%) |
| Total (Overall) | 28,357 (52.0%) | 26,197 (48.0%) |
Services Occupations
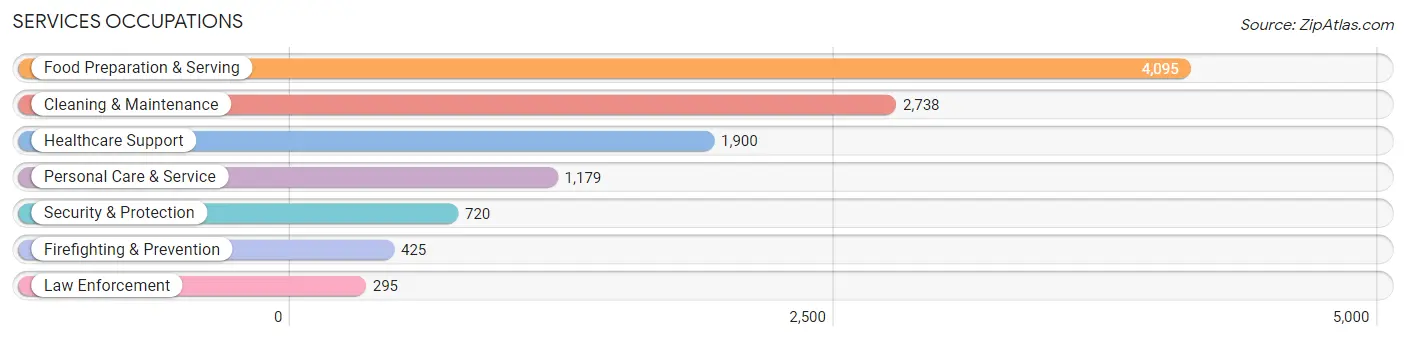
The most common Services occupations in Henderson County are Food Preparation & Serving (4,095 | 7.5%), Cleaning & Maintenance (2,738 | 5.0%), Healthcare Support (1,900 | 3.5%), Personal Care & Service (1,179 | 2.2%), and Security & Protection (720 | 1.3%).
Services Occupations by Sex
Within the Services occupations in Henderson County, the most male-oriented occupations are Firefighting & Prevention (83.1%), Security & Protection (81.1%), and Law Enforcement (78.3%), while the most female-oriented occupations are Healthcare Support (89.9%), Personal Care & Service (80.7%), and Food Preparation & Serving (57.4%).
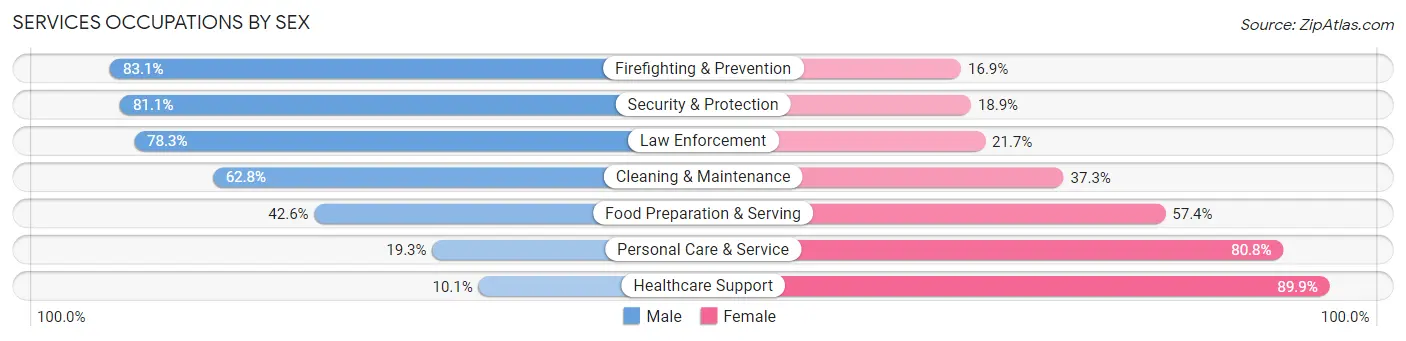
| Occupation | Male | Female |
| Healthcare Support | 192 (10.1%) | 1,708 (89.9%) |
| Security & Protection | 584 (81.1%) | 136 (18.9%) |
| Firefighting & Prevention | 353 (83.1%) | 72 (16.9%) |
| Law Enforcement | 231 (78.3%) | 64 (21.7%) |
| Food Preparation & Serving | 1,745 (42.6%) | 2,350 (57.4%) |
| Cleaning & Maintenance | 1,718 (62.7%) | 1,020 (37.2%) |
| Personal Care & Service | 227 (19.3%) | 952 (80.7%) |
| Total (Category) | 4,466 (42.0%) | 6,166 (58.0%) |
| Total (Overall) | 28,357 (52.0%) | 26,197 (48.0%) |
Sales and Office Occupations
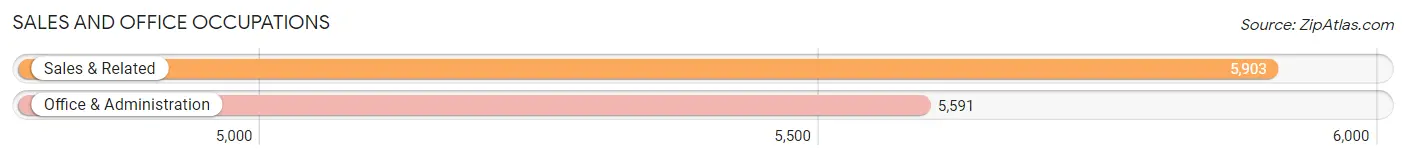
The most common Sales and Office occupations in Henderson County are Sales & Related (5,903 | 10.8%), and Office & Administration (5,591 | 10.2%).
Sales and Office Occupations by Sex
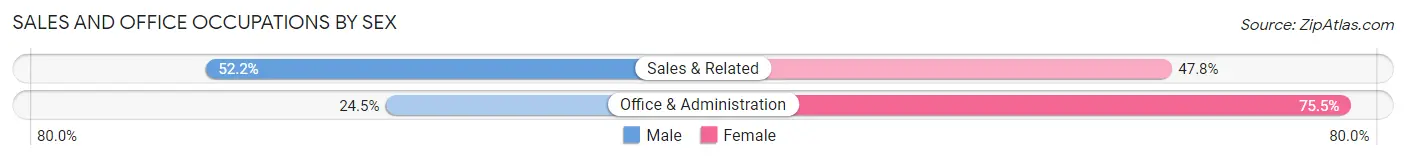
| Occupation | Male | Female |
| Sales & Related | 3,080 (52.2%) | 2,823 (47.8%) |
| Office & Administration | 1,371 (24.5%) | 4,220 (75.5%) |
| Total (Category) | 4,451 (38.7%) | 7,043 (61.3%) |
| Total (Overall) | 28,357 (52.0%) | 26,197 (48.0%) |
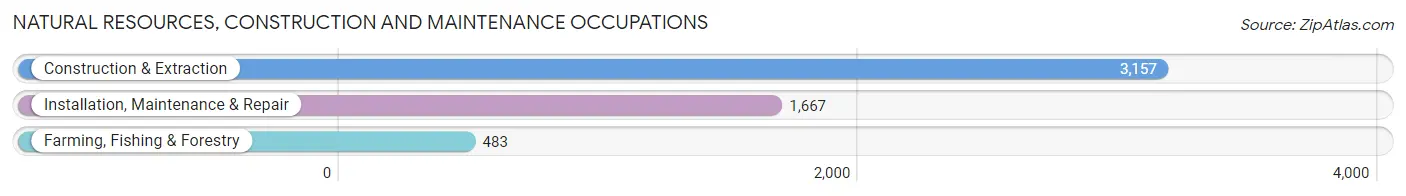
Natural Resources, Construction and Maintenance Occupations
The most common Natural Resources, Construction and Maintenance occupations in Henderson County are Construction & Extraction (3,157 | 5.8%), Installation, Maintenance & Repair (1,667 | 3.1%), and Farming, Fishing & Forestry (483 | 0.9%).
Natural Resources, Construction and Maintenance Occupations by Sex
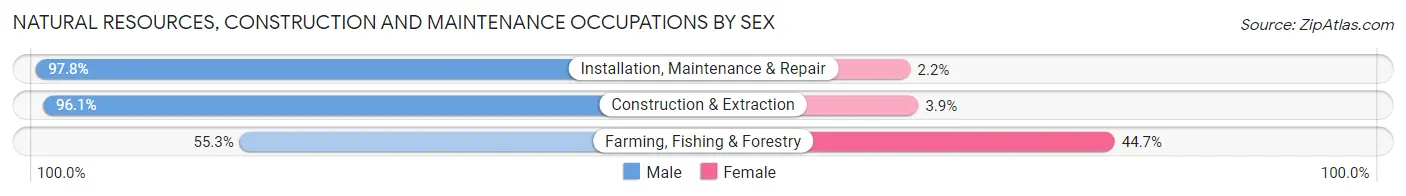
| Occupation | Male | Female |
| Farming, Fishing & Forestry | 267 (55.3%) | 216 (44.7%) |
| Construction & Extraction | 3,035 (96.1%) | 122 (3.9%) |
| Installation, Maintenance & Repair | 1,630 (97.8%) | 37 (2.2%) |
| Total (Category) | 4,932 (92.9%) | 375 (7.1%) |
| Total (Overall) | 28,357 (52.0%) | 26,197 (48.0%) |
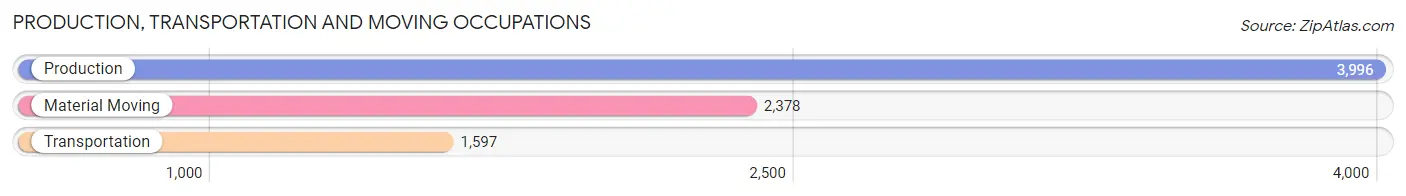
Production, Transportation and Moving Occupations
The most common Production, Transportation and Moving occupations in Henderson County are Production (3,996 | 7.3%), Material Moving (2,378 | 4.4%), and Transportation (1,597 | 2.9%).
Production, Transportation and Moving Occupations by Sex
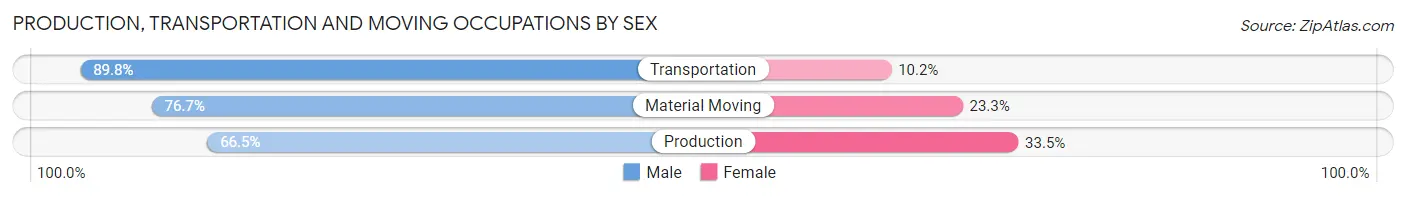
| Occupation | Male | Female |
| Production | 2,657 (66.5%) | 1,339 (33.5%) |
| Transportation | 1,434 (89.8%) | 163 (10.2%) |
| Material Moving | 1,824 (76.7%) | 554 (23.3%) |
| Total (Category) | 5,915 (74.2%) | 2,056 (25.8%) |
| Total (Overall) | 28,357 (52.0%) | 26,197 (48.0%) |
Employment Industries by Sex in Henderson County
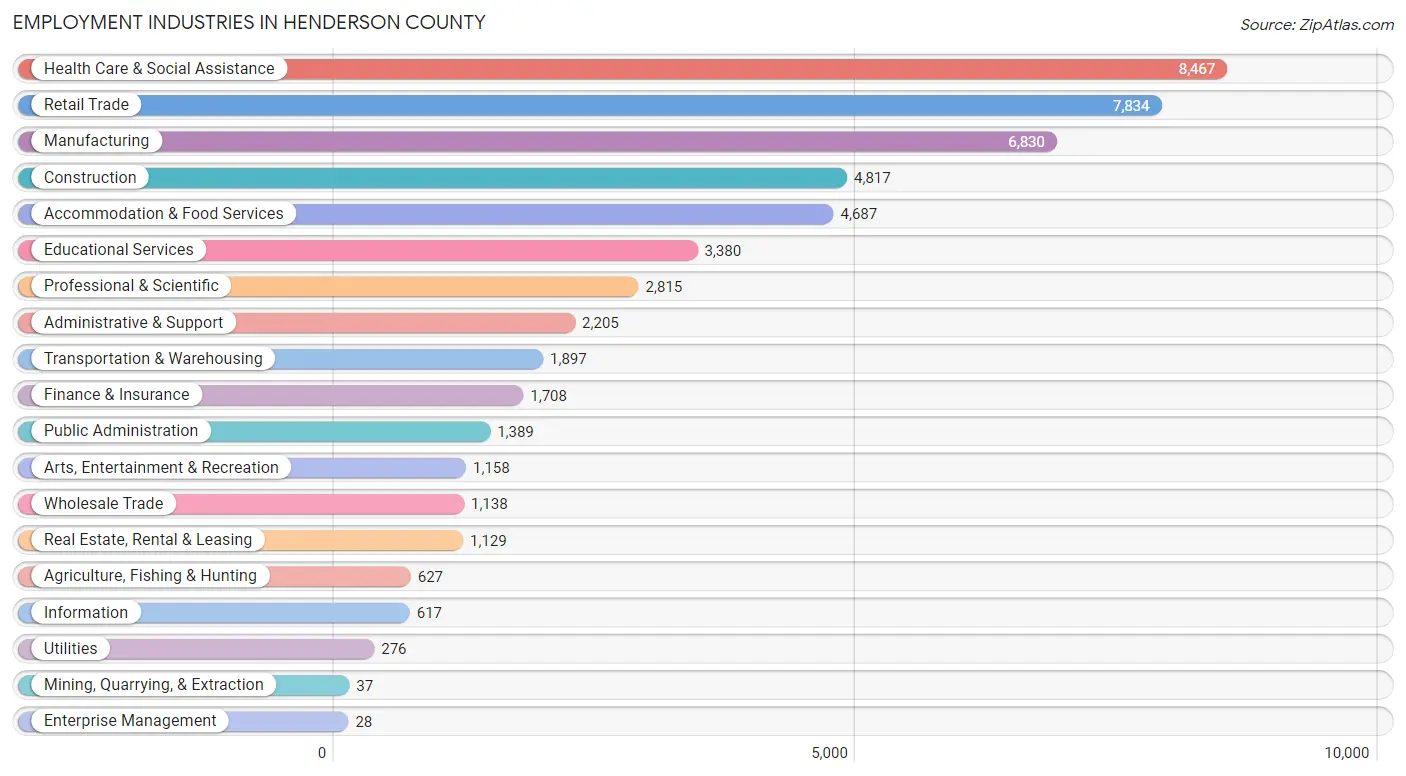
Employment Industries in Henderson County
The major employment industries in Henderson County include Health Care & Social Assistance (8,467 | 15.5%), Retail Trade (7,834 | 14.4%), Manufacturing (6,830 | 12.5%), Construction (4,817 | 8.8%), and Accommodation & Food Services (4,687 | 8.6%).
Employment Industries by Sex in Henderson County
The Henderson County industries that see more men than women are Utilities (100.0%), Construction (87.4%), and Wholesale Trade (80.0%), whereas the industries that tend to have a higher number of women are Enterprise Management (100.0%), Mining, Quarrying, & Extraction (83.8%), and Health Care & Social Assistance (78.2%).
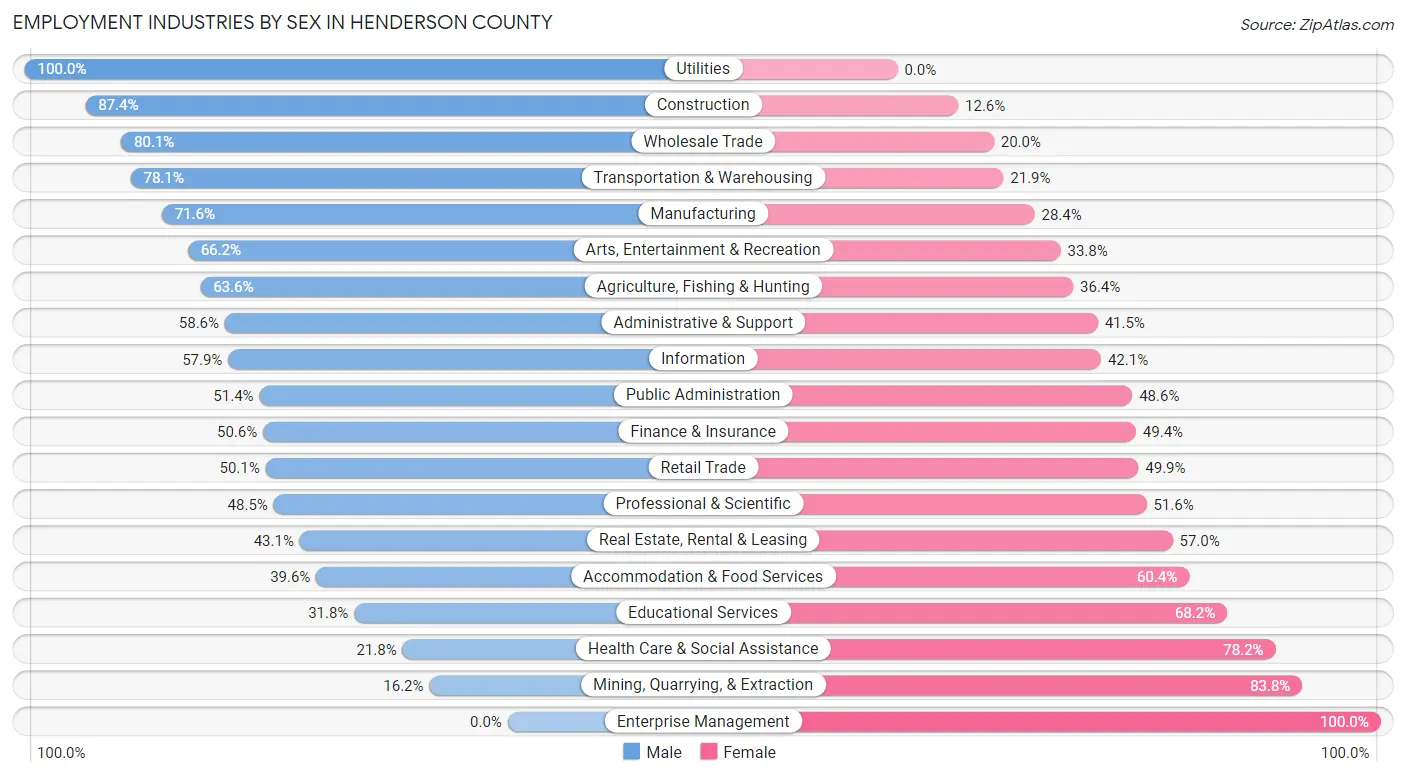
| Industry | Male | Female |
| Agriculture, Fishing & Hunting | 399 (63.6%) | 228 (36.4%) |
| Mining, Quarrying, & Extraction | 6 (16.2%) | 31 (83.8%) |
| Construction | 4,212 (87.4%) | 605 (12.6%) |
| Manufacturing | 4,891 (71.6%) | 1,939 (28.4%) |
| Wholesale Trade | 911 (80.0%) | 227 (20.0%) |
| Retail Trade | 3,927 (50.1%) | 3,907 (49.9%) |
| Transportation & Warehousing | 1,481 (78.1%) | 416 (21.9%) |
| Utilities | 276 (100.0%) | 0 (0.0%) |
| Information | 357 (57.9%) | 260 (42.1%) |
| Finance & Insurance | 865 (50.6%) | 843 (49.4%) |
| Real Estate, Rental & Leasing | 486 (43.0%) | 643 (57.0%) |
| Professional & Scientific | 1,364 (48.4%) | 1,451 (51.5%) |
| Enterprise Management | 0 (0.0%) | 28 (100.0%) |
| Administrative & Support | 1,291 (58.6%) | 914 (41.4%) |
| Educational Services | 1,074 (31.8%) | 2,306 (68.2%) |
| Health Care & Social Assistance | 1,843 (21.8%) | 6,624 (78.2%) |
| Arts, Entertainment & Recreation | 767 (66.2%) | 391 (33.8%) |
| Accommodation & Food Services | 1,858 (39.6%) | 2,829 (60.4%) |
| Public Administration | 714 (51.4%) | 675 (48.6%) |
| Total | 28,357 (52.0%) | 26,197 (48.0%) |
Education in Henderson County
School Enrollment in Henderson County
The most common levels of schooling among the 22,045 students in Henderson County are high school (5,608 | 25.4%), middle school (5,144 | 23.3%), and elementary school (4,603 | 20.9%).
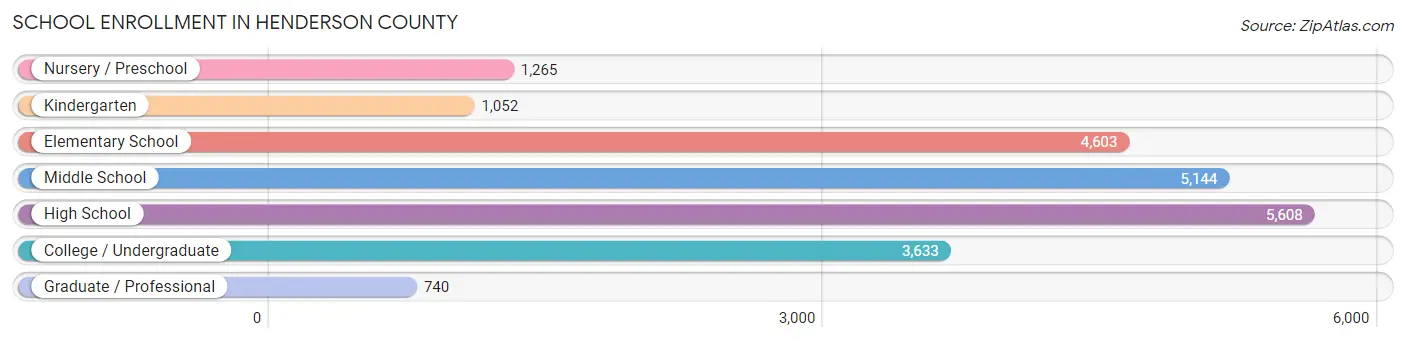
| School Level | # Students | % Students |
| Nursery / Preschool | 1,265 | 5.7% |
| Kindergarten | 1,052 | 4.8% |
| Elementary School | 4,603 | 20.9% |
| Middle School | 5,144 | 23.3% |
| High School | 5,608 | 25.4% |
| College / Undergraduate | 3,633 | 16.5% |
| Graduate / Professional | 740 | 3.4% |
| Total | 22,045 | 100.0% |
School Enrollment by Age by Funding Source in Henderson County
Out of a total of 22,045 students who are enrolled in schools in Henderson County, 4,475 (20.3%) attend a private institution, while the remaining 17,570 (79.7%) are enrolled in public schools. The age group of 3 to 4 year olds has the highest likelihood of being enrolled in private schools, with 722 (69.5% in the age bracket) enrolled. Conversely, the age group of 18 to 19 year olds has the lowest likelihood of being enrolled in a private school, with 1,231 (94.3% in the age bracket) attending a public institution.
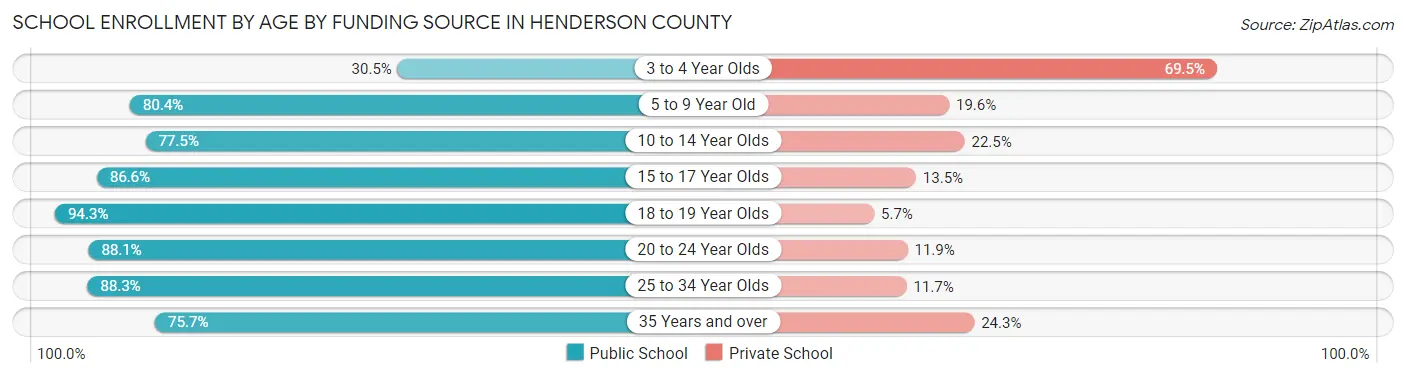
| Age Bracket | Public School | Private School |
| 3 to 4 Year Olds | 317 (30.5%) | 722 (69.5%) |
| 5 to 9 Year Old | 4,139 (80.4%) | 1,010 (19.6%) |
| 10 to 14 Year Olds | 5,180 (77.5%) | 1,506 (22.5%) |
| 15 to 17 Year Olds | 3,283 (86.6%) | 510 (13.5%) |
| 18 to 19 Year Olds | 1,231 (94.3%) | 74 (5.7%) |
| 20 to 24 Year Olds | 1,429 (88.1%) | 193 (11.9%) |
| 25 to 34 Year Olds | 995 (88.3%) | 132 (11.7%) |
| 35 Years and over | 1,002 (75.7%) | 322 (24.3%) |
| Total | 17,570 (79.7%) | 4,475 (20.3%) |
Educational Attainment by Field of Study in Henderson County
Business (5,582 | 17.5%), education (4,715 | 14.8%), science & technology (3,454 | 10.8%), engineering (2,083 | 6.6%), and arts & humanities (1,991 | 6.3%) are the most common fields of study among 31,825 individuals in Henderson County who have obtained a bachelor's degree or higher.
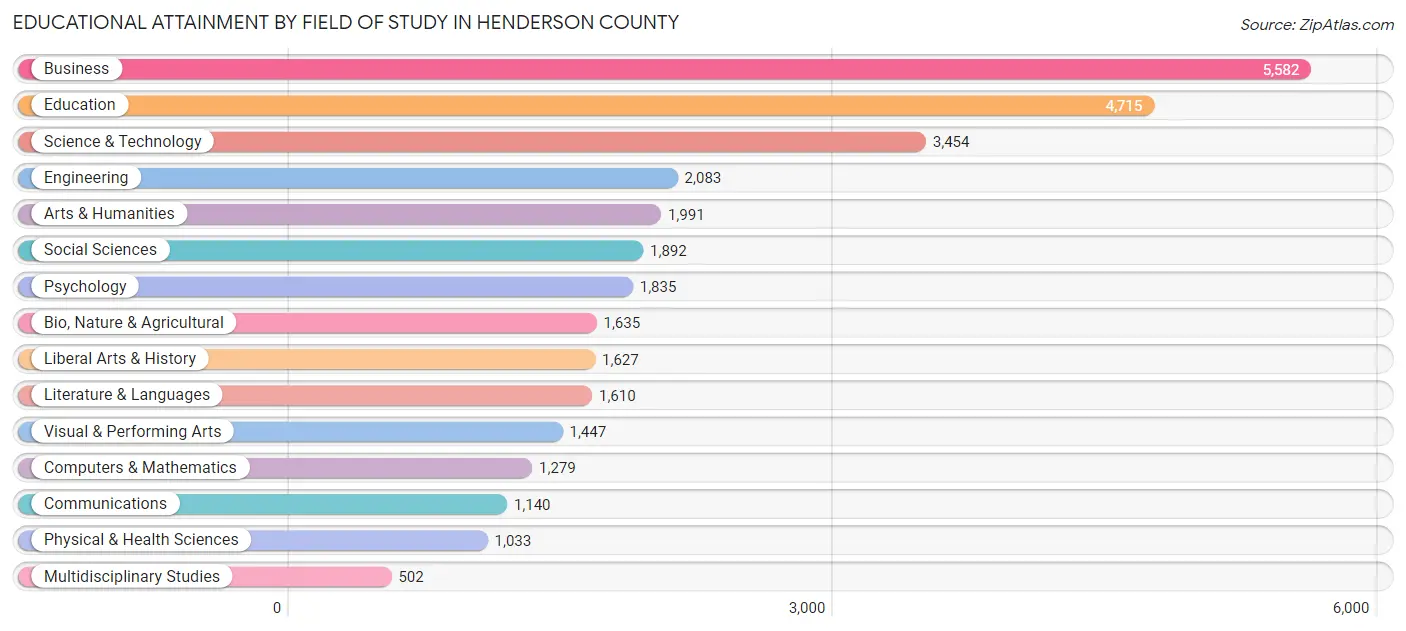
| Field of Study | # Graduates | % Graduates |
| Computers & Mathematics | 1,279 | 4.0% |
| Bio, Nature & Agricultural | 1,635 | 5.1% |
| Physical & Health Sciences | 1,033 | 3.3% |
| Psychology | 1,835 | 5.8% |
| Social Sciences | 1,892 | 5.9% |
| Engineering | 2,083 | 6.6% |
| Multidisciplinary Studies | 502 | 1.6% |
| Science & Technology | 3,454 | 10.8% |
| Business | 5,582 | 17.5% |
| Education | 4,715 | 14.8% |
| Literature & Languages | 1,610 | 5.1% |
| Liberal Arts & History | 1,627 | 5.1% |
| Visual & Performing Arts | 1,447 | 4.5% |
| Communications | 1,140 | 3.6% |
| Arts & Humanities | 1,991 | 6.3% |
| Total | 31,825 | 100.0% |
Transportation & Commute in Henderson County
Vehicle Availability by Sex in Henderson County
The most prevalent vehicle ownership categories in Henderson County are males with 2 vehicles (11,921, accounting for 42.8%) and females with 2 vehicles (10,703, making up 46.4%).
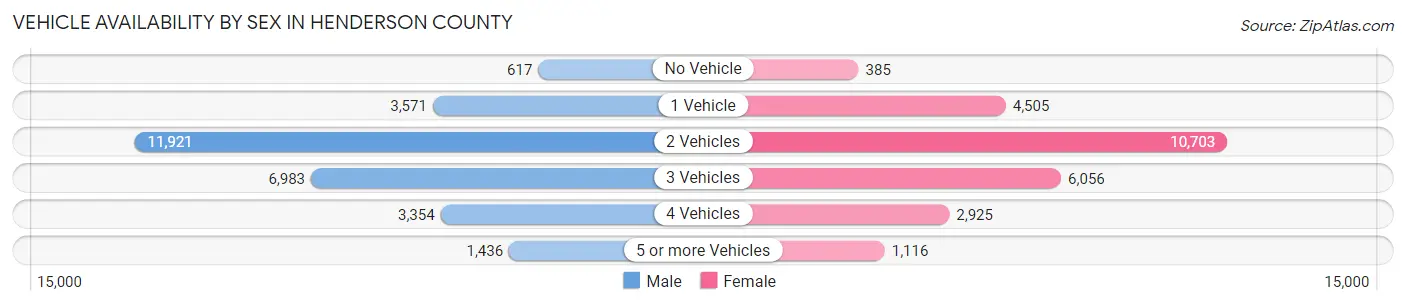
| Vehicles Available | Male | Female |
| No Vehicle | 617 (2.2%) | 385 (1.5%) |
| 1 Vehicle | 3,571 (12.8%) | 4,505 (17.5%) |
| 2 Vehicles | 11,921 (42.8%) | 10,703 (41.7%) |
| 3 Vehicles | 6,983 (25.0%) | 6,056 (23.6%) |
| 4 Vehicles | 3,354 (12.0%) | 2,925 (11.4%) |
| 5 or more Vehicles | 1,436 (5.1%) | 1,116 (4.3%) |
| Total | 27,882 (100.0%) | 25,690 (100.0%) |
Commute Time in Henderson County
The most frequently occuring commute durations in Henderson County are 20 to 24 minutes (9,293 commuters, 18.9%), 15 to 19 minutes (7,931 commuters, 16.1%), and 10 to 14 minutes (7,232 commuters, 14.7%).
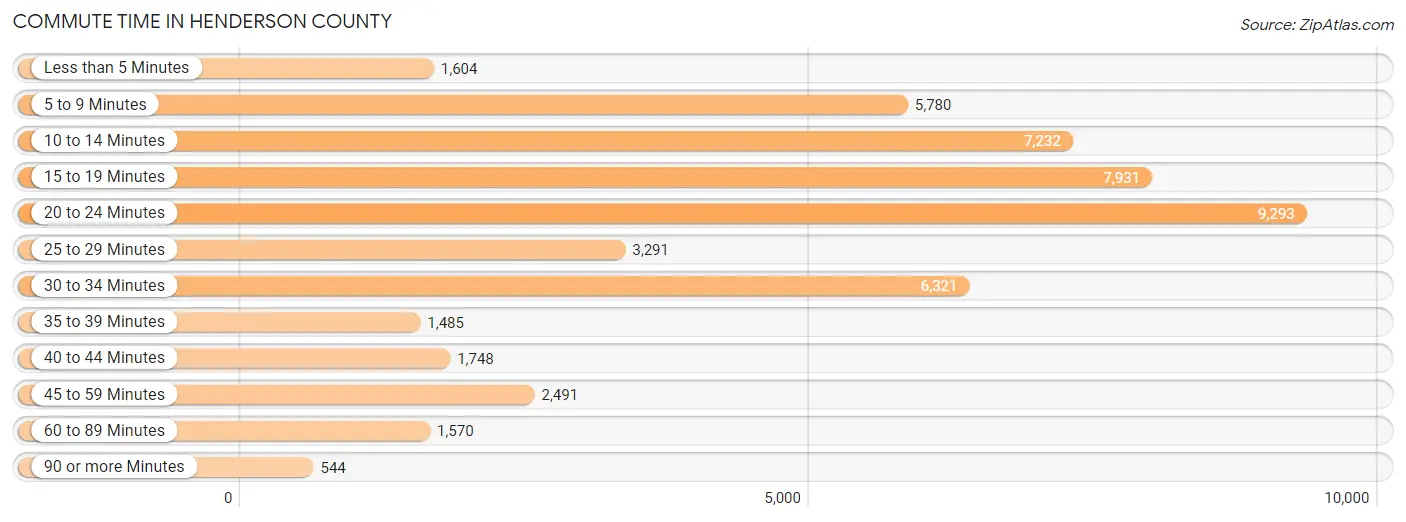
| Commute Time | # Commuters | % Commuters |
| Less than 5 Minutes | 1,604 | 3.3% |
| 5 to 9 Minutes | 5,780 | 11.7% |
| 10 to 14 Minutes | 7,232 | 14.7% |
| 15 to 19 Minutes | 7,931 | 16.1% |
| 20 to 24 Minutes | 9,293 | 18.9% |
| 25 to 29 Minutes | 3,291 | 6.7% |
| 30 to 34 Minutes | 6,321 | 12.8% |
| 35 to 39 Minutes | 1,485 | 3.0% |
| 40 to 44 Minutes | 1,748 | 3.5% |
| 45 to 59 Minutes | 2,491 | 5.1% |
| 60 to 89 Minutes | 1,570 | 3.2% |
| 90 or more Minutes | 544 | 1.1% |
Commute Time by Sex in Henderson County
The most common commute times in Henderson County are 20 to 24 minutes (4,836 commuters, 18.7%) for males and 20 to 24 minutes (4,457 commuters, 19.0%) for females.
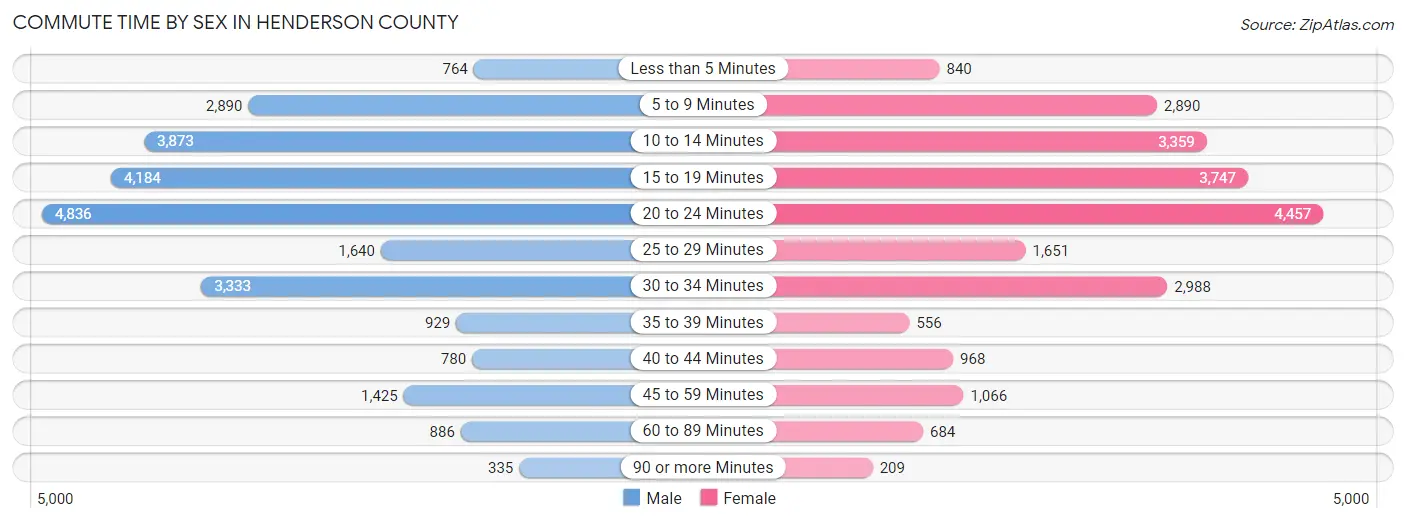
| Commute Time | Male | Female |
| Less than 5 Minutes | 764 (2.9%) | 840 (3.6%) |
| 5 to 9 Minutes | 2,890 (11.2%) | 2,890 (12.3%) |
| 10 to 14 Minutes | 3,873 (15.0%) | 3,359 (14.3%) |
| 15 to 19 Minutes | 4,184 (16.2%) | 3,747 (16.0%) |
| 20 to 24 Minutes | 4,836 (18.7%) | 4,457 (19.0%) |
| 25 to 29 Minutes | 1,640 (6.3%) | 1,651 (7.0%) |
| 30 to 34 Minutes | 3,333 (12.9%) | 2,988 (12.8%) |
| 35 to 39 Minutes | 929 (3.6%) | 556 (2.4%) |
| 40 to 44 Minutes | 780 (3.0%) | 968 (4.1%) |
| 45 to 59 Minutes | 1,425 (5.5%) | 1,066 (4.5%) |
| 60 to 89 Minutes | 886 (3.4%) | 684 (2.9%) |
| 90 or more Minutes | 335 (1.3%) | 209 (0.9%) |
Time of Departure to Work by Sex in Henderson County
The most frequent times of departure to work in Henderson County are 7:00 AM to 7:29 AM (3,630, 14.0%) for males and 7:00 AM to 7:29 AM (3,871, 16.5%) for females.
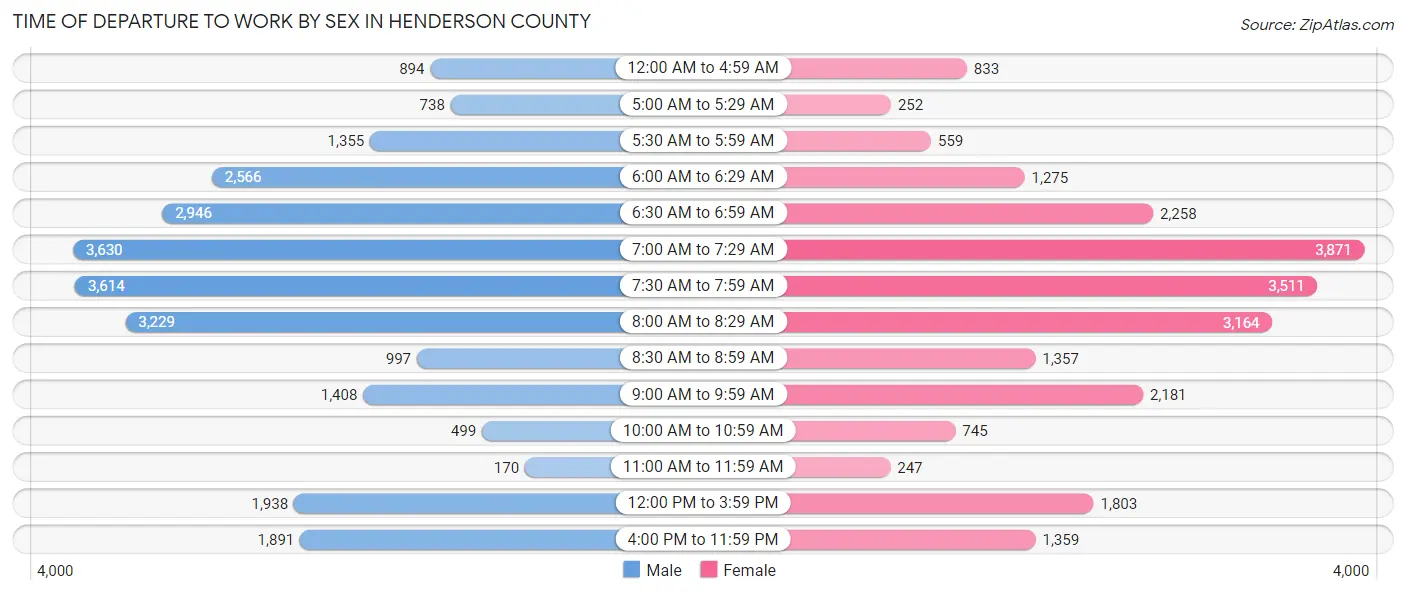
| Time of Departure | Male | Female |
| 12:00 AM to 4:59 AM | 894 (3.5%) | 833 (3.6%) |
| 5:00 AM to 5:29 AM | 738 (2.9%) | 252 (1.1%) |
| 5:30 AM to 5:59 AM | 1,355 (5.2%) | 559 (2.4%) |
| 6:00 AM to 6:29 AM | 2,566 (9.9%) | 1,275 (5.4%) |
| 6:30 AM to 6:59 AM | 2,946 (11.4%) | 2,258 (9.6%) |
| 7:00 AM to 7:29 AM | 3,630 (14.0%) | 3,871 (16.5%) |
| 7:30 AM to 7:59 AM | 3,614 (14.0%) | 3,511 (15.0%) |
| 8:00 AM to 8:29 AM | 3,229 (12.5%) | 3,164 (13.5%) |
| 8:30 AM to 8:59 AM | 997 (3.8%) | 1,357 (5.8%) |
| 9:00 AM to 9:59 AM | 1,408 (5.4%) | 2,181 (9.3%) |
| 10:00 AM to 10:59 AM | 499 (1.9%) | 745 (3.2%) |
| 11:00 AM to 11:59 AM | 170 (0.7%) | 247 (1.1%) |
| 12:00 PM to 3:59 PM | 1,938 (7.5%) | 1,803 (7.7%) |
| 4:00 PM to 11:59 PM | 1,891 (7.3%) | 1,359 (5.8%) |
| Total | 25,875 (100.0%) | 23,415 (100.0%) |
Housing Occupancy in Henderson County
Occupancy by Ownership in Henderson County
Of the total 49,494 dwellings in Henderson County, owner-occupied units account for 36,832 (74.4%), while renter-occupied units make up 12,662 (25.6%).
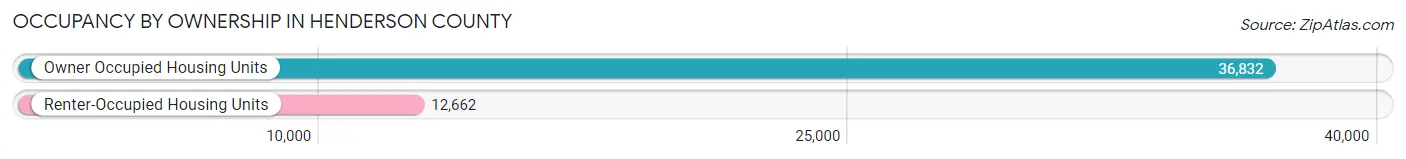
| Occupancy | # Housing Units | % Housing Units |
| Owner Occupied Housing Units | 36,832 | 74.4% |
| Renter-Occupied Housing Units | 12,662 | 25.6% |
| Total Occupied Housing Units | 49,494 | 100.0% |
Occupancy by Household Size in Henderson County
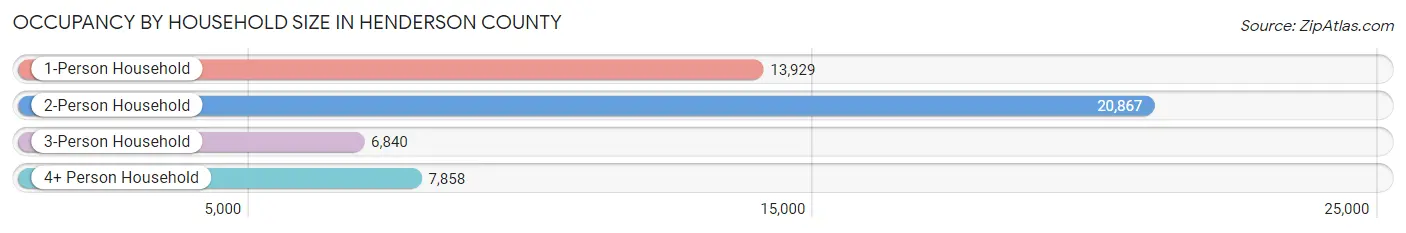
| Household Size | # Housing Units | % Housing Units |
| 1-Person Household | 13,929 | 28.1% |
| 2-Person Household | 20,867 | 42.2% |
| 3-Person Household | 6,840 | 13.8% |
| 4+ Person Household | 7,858 | 15.9% |
| Total Housing Units | 49,494 | 100.0% |
Occupancy by Ownership by Household Size in Henderson County
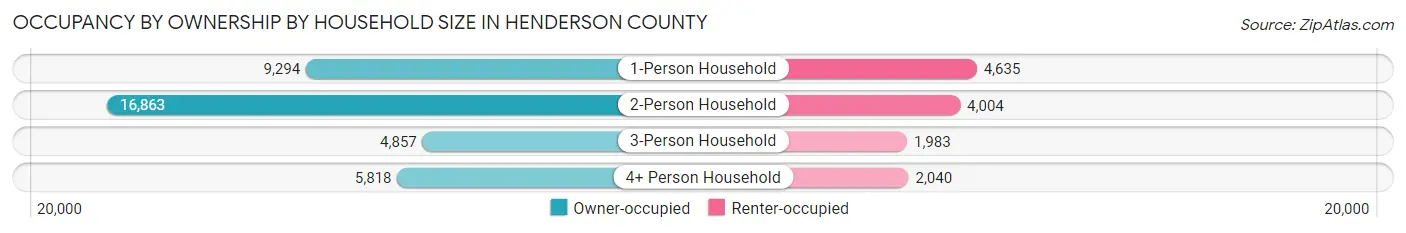
| Household Size | Owner-occupied | Renter-occupied |
| 1-Person Household | 9,294 (66.7%) | 4,635 (33.3%) |
| 2-Person Household | 16,863 (80.8%) | 4,004 (19.2%) |
| 3-Person Household | 4,857 (71.0%) | 1,983 (29.0%) |
| 4+ Person Household | 5,818 (74.0%) | 2,040 (26.0%) |
| Total Housing Units | 36,832 (74.4%) | 12,662 (25.6%) |
Occupancy by Educational Attainment in Henderson County
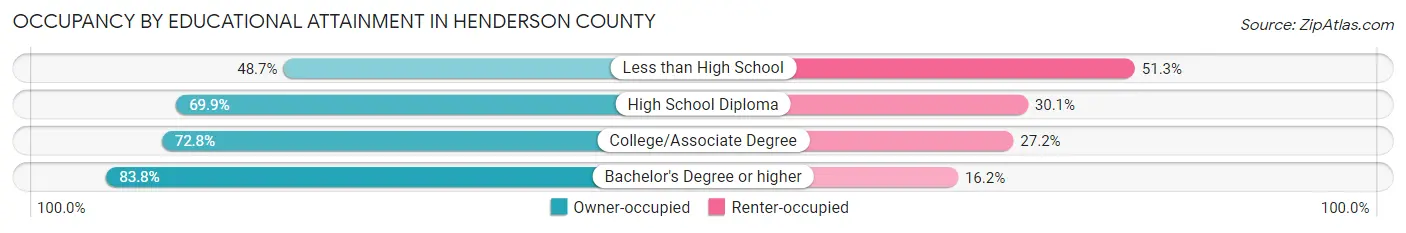
| Household Size | Owner-occupied | Renter-occupied |
| Less than High School | 1,771 (48.7%) | 1,865 (51.3%) |
| High School Diploma | 7,970 (69.9%) | 3,427 (30.1%) |
| College/Associate Degree | 11,798 (72.8%) | 4,410 (27.2%) |
| Bachelor's Degree or higher | 15,293 (83.8%) | 2,960 (16.2%) |
Occupancy by Age of Householder in Henderson County
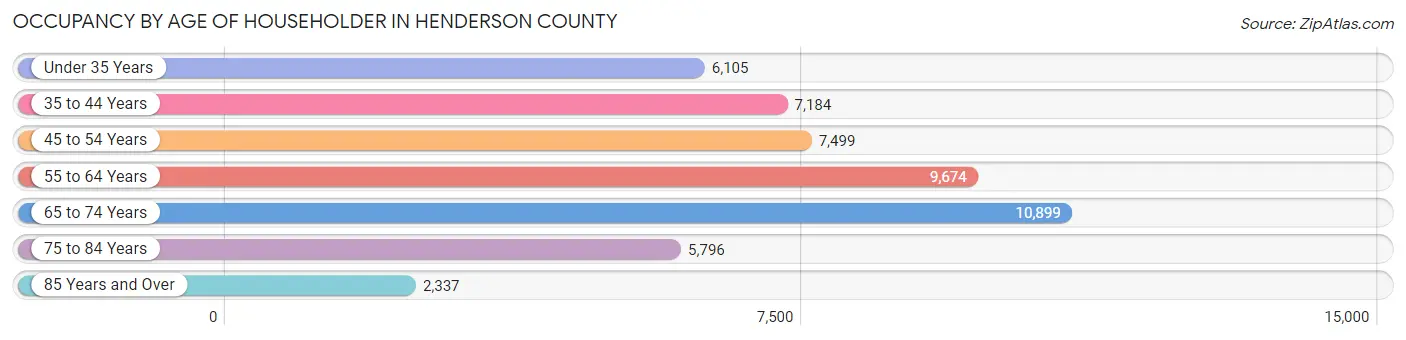
| Age Bracket | # Households | % Households |
| Under 35 Years | 6,105 | 12.3% |
| 35 to 44 Years | 7,184 | 14.5% |
| 45 to 54 Years | 7,499 | 15.1% |
| 55 to 64 Years | 9,674 | 19.6% |
| 65 to 74 Years | 10,899 | 22.0% |
| 75 to 84 Years | 5,796 | 11.7% |
| 85 Years and Over | 2,337 | 4.7% |
| Total | 49,494 | 100.0% |
Housing Finances in Henderson County
Median Income by Occupancy in Henderson County
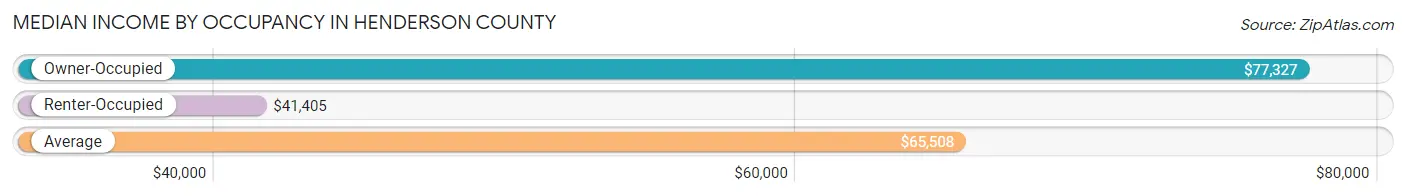
| Occupancy Type | # Households | Median Income |
| Owner-Occupied | 36,832 (74.4%) | $77,327 |
| Renter-Occupied | 12,662 (25.6%) | $41,405 |
| Average | 49,494 (100.0%) | $65,508 |
Occupancy by Householder Income Bracket in Henderson County
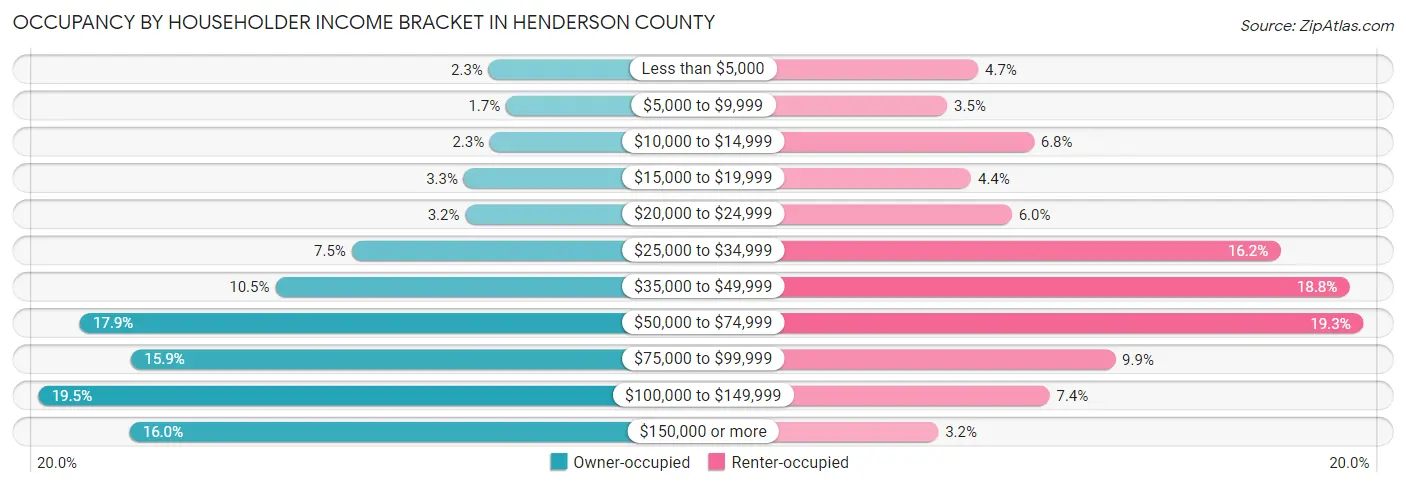
| Income Bracket | Owner-occupied | Renter-occupied |
| Less than $5,000 | 854 (2.3%) | 591 (4.7%) |
| $5,000 to $9,999 | 610 (1.7%) | 442 (3.5%) |
| $10,000 to $14,999 | 836 (2.3%) | 860 (6.8%) |
| $15,000 to $19,999 | 1,205 (3.3%) | 557 (4.4%) |
| $20,000 to $24,999 | 1,183 (3.2%) | 753 (5.9%) |
| $25,000 to $34,999 | 2,778 (7.5%) | 2,047 (16.2%) |
| $35,000 to $49,999 | 3,849 (10.4%) | 2,380 (18.8%) |
| $50,000 to $74,999 | 6,590 (17.9%) | 2,445 (19.3%) |
| $75,000 to $99,999 | 5,869 (15.9%) | 1,252 (9.9%) |
| $100,000 to $149,999 | 7,167 (19.5%) | 936 (7.4%) |
| $150,000 or more | 5,891 (16.0%) | 399 (3.2%) |
| Total | 36,832 (100.0%) | 12,662 (100.0%) |
Monthly Housing Cost Tiers in Henderson County
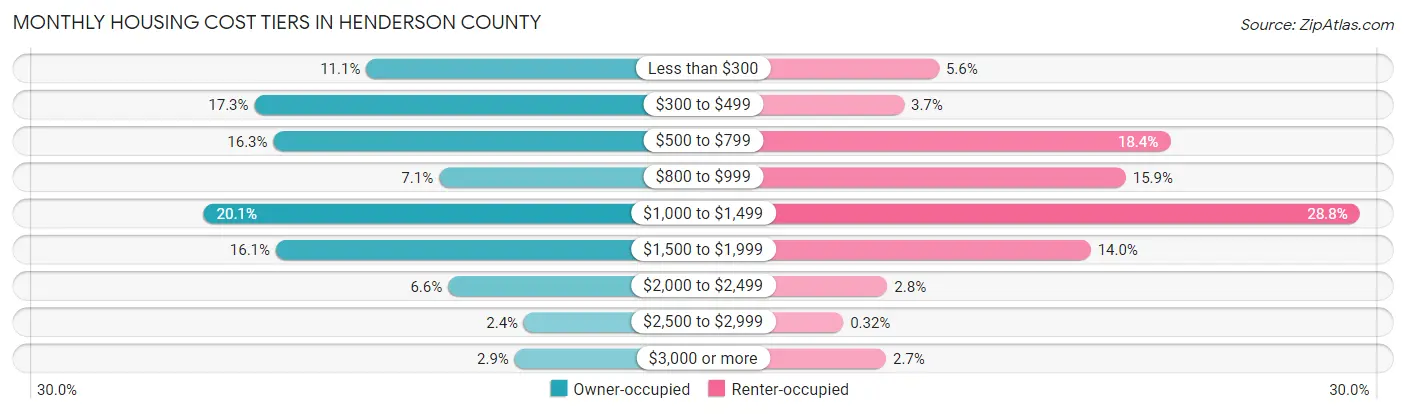
| Monthly Cost | Owner-occupied | Renter-occupied |
| Less than $300 | 4,099 (11.1%) | 710 (5.6%) |
| $300 to $499 | 6,375 (17.3%) | 466 (3.7%) |
| $500 to $799 | 5,989 (16.3%) | 2,326 (18.4%) |
| $800 to $999 | 2,617 (7.1%) | 2,017 (15.9%) |
| $1,000 to $1,499 | 7,408 (20.1%) | 3,652 (28.8%) |
| $1,500 to $1,999 | 5,938 (16.1%) | 1,771 (14.0%) |
| $2,000 to $2,499 | 2,436 (6.6%) | 349 (2.8%) |
| $2,500 to $2,999 | 890 (2.4%) | 41 (0.3%) |
| $3,000 or more | 1,080 (2.9%) | 340 (2.7%) |
| Total | 36,832 (100.0%) | 12,662 (100.0%) |
Physical Housing Characteristics in Henderson County
Housing Structures in Henderson County

| Structure Type | # Housing Units | % Housing Units |
| Single Unit, Detached | 34,281 | 69.3% |
| Single Unit, Attached | 1,990 | 4.0% |
| 2 Unit Apartments | 945 | 1.9% |
| 3 or 4 Unit Apartments | 1,627 | 3.3% |
| 5 to 9 Unit Apartments | 1,183 | 2.4% |
| 10 or more Apartments | 2,008 | 4.1% |
| Mobile Home / Other | 7,460 | 15.1% |
| Total | 49,494 | 100.0% |
Housing Structures by Occupancy in Henderson County

| Structure Type | Owner-occupied | Renter-occupied |
| Single Unit, Detached | 29,489 (86.0%) | 4,792 (14.0%) |
| Single Unit, Attached | 1,529 (76.8%) | 461 (23.2%) |
| 2 Unit Apartments | 147 (15.6%) | 798 (84.4%) |
| 3 or 4 Unit Apartments | 491 (30.2%) | 1,136 (69.8%) |
| 5 to 9 Unit Apartments | 329 (27.8%) | 854 (72.2%) |
| 10 or more Apartments | 267 (13.3%) | 1,741 (86.7%) |
| Mobile Home / Other | 4,580 (61.4%) | 2,880 (38.6%) |
| Total | 36,832 (74.4%) | 12,662 (25.6%) |
Housing Structures by Number of Rooms in Henderson County
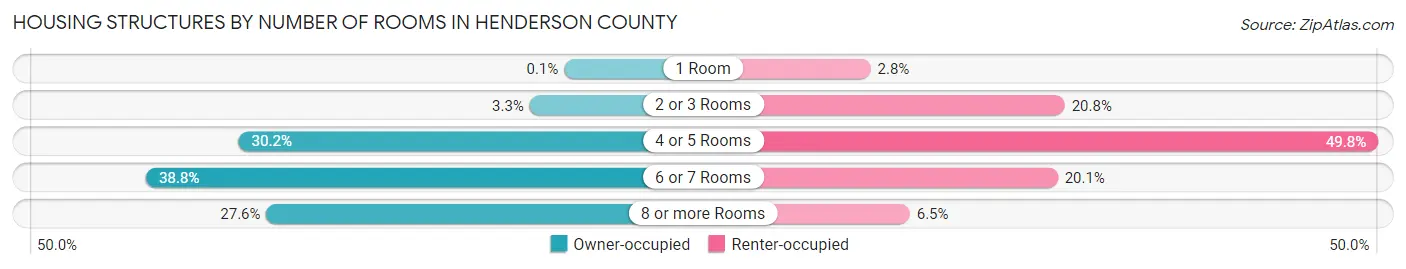
| Number of Rooms | Owner-occupied | Renter-occupied |
| 1 Room | 38 (0.1%) | 360 (2.8%) |
| 2 or 3 Rooms | 1,210 (3.3%) | 2,633 (20.8%) |
| 4 or 5 Rooms | 11,125 (30.2%) | 6,301 (49.8%) |
| 6 or 7 Rooms | 14,280 (38.8%) | 2,550 (20.1%) |
| 8 or more Rooms | 10,179 (27.6%) | 818 (6.5%) |
| Total | 36,832 (100.0%) | 12,662 (100.0%) |
Housing Structure by Heating Type in Henderson County
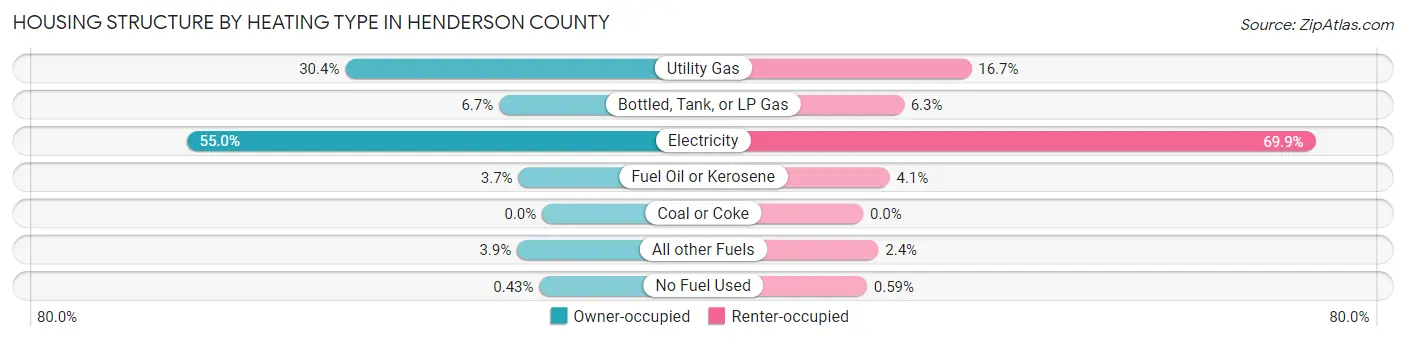
| Heating Type | Owner-occupied | Renter-occupied |
| Utility Gas | 11,207 (30.4%) | 2,118 (16.7%) |
| Bottled, Tank, or LP Gas | 2,450 (6.7%) | 796 (6.3%) |
| Electricity | 20,240 (54.9%) | 8,854 (69.9%) |
| Fuel Oil or Kerosene | 1,349 (3.7%) | 519 (4.1%) |
| Coal or Coke | 0 (0.0%) | 0 (0.0%) |
| All other Fuels | 1,427 (3.9%) | 300 (2.4%) |
| No Fuel Used | 159 (0.4%) | 75 (0.6%) |
| Total | 36,832 (100.0%) | 12,662 (100.0%) |
Household Vehicle Usage in Henderson County
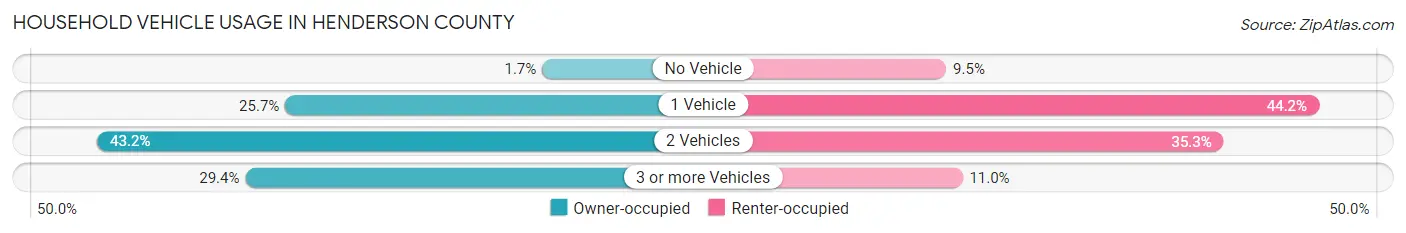
| Vehicles per Household | Owner-occupied | Renter-occupied |
| No Vehicle | 624 (1.7%) | 1,196 (9.5%) |
| 1 Vehicle | 9,458 (25.7%) | 5,602 (44.2%) |
| 2 Vehicles | 15,922 (43.2%) | 4,475 (35.3%) |
| 3 or more Vehicles | 10,828 (29.4%) | 1,389 (11.0%) |
| Total | 36,832 (100.0%) | 12,662 (100.0%) |
Real Estate & Mortgages in Henderson County
Real Estate and Mortgage Overview in Henderson County
| Characteristic | Without Mortgage | With Mortgage |
| Housing Units | 16,297 | 20,535 |
| Median Property Value | $265,900 | $306,700 |
| Median Household Income | $55,936 | $3,868 |
| Monthly Housing Costs | $433 | $1,018 |
| Real Estate Taxes | $1,527 | $351 |
Property Value by Mortgage Status in Henderson County
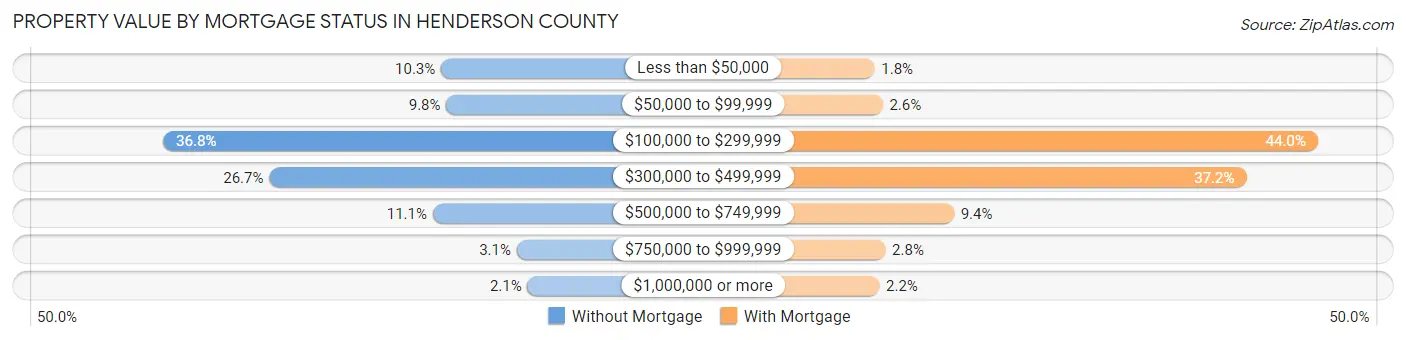
| Property Value | Without Mortgage | With Mortgage |
| Less than $50,000 | 1,684 (10.3%) | 368 (1.8%) |
| $50,000 to $99,999 | 1,602 (9.8%) | 526 (2.6%) |
| $100,000 to $299,999 | 5,998 (36.8%) | 9,039 (44.0%) |
| $300,000 to $499,999 | 4,351 (26.7%) | 7,642 (37.2%) |
| $500,000 to $749,999 | 1,812 (11.1%) | 1,921 (9.3%) |
| $750,000 to $999,999 | 508 (3.1%) | 580 (2.8%) |
| $1,000,000 or more | 342 (2.1%) | 459 (2.2%) |
| Total | 16,297 (100.0%) | 20,535 (100.0%) |
Household Income by Mortgage Status in Henderson County
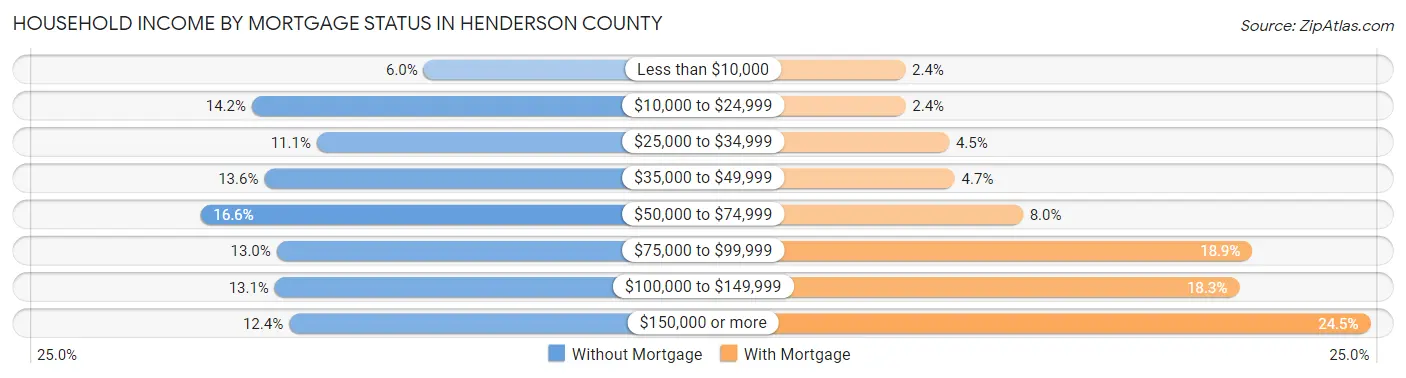
| Household Income | Without Mortgage | With Mortgage |
| Less than $10,000 | 978 (6.0%) | 484 (2.4%) |
| $10,000 to $24,999 | 2,311 (14.2%) | 486 (2.4%) |
| $25,000 to $34,999 | 1,808 (11.1%) | 913 (4.4%) |
| $35,000 to $49,999 | 2,215 (13.6%) | 970 (4.7%) |
| $50,000 to $74,999 | 2,710 (16.6%) | 1,634 (8.0%) |
| $75,000 to $99,999 | 2,118 (13.0%) | 3,880 (18.9%) |
| $100,000 to $149,999 | 2,134 (13.1%) | 3,751 (18.3%) |
| $150,000 or more | 2,023 (12.4%) | 5,033 (24.5%) |
| Total | 16,297 (100.0%) | 20,535 (100.0%) |
Property Value to Household Income Ratio in Henderson County
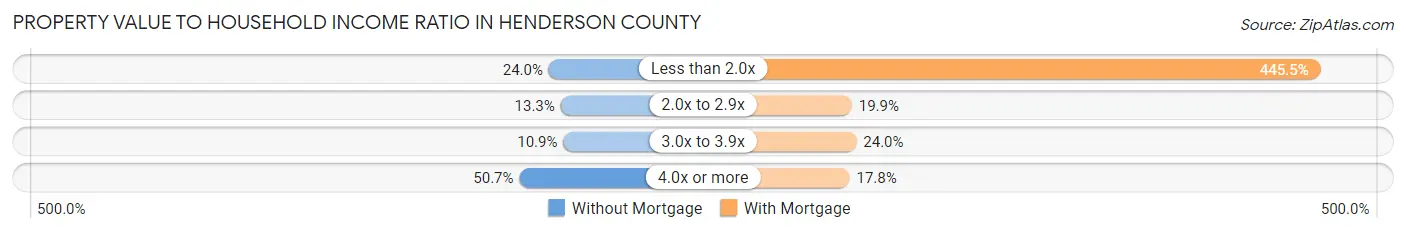
| Value-to-Income Ratio | Without Mortgage | With Mortgage |
| Less than 2.0x | 3,908 (24.0%) | 91,484 (445.5%) |
| 2.0x to 2.9x | 2,168 (13.3%) | 4,085 (19.9%) |
| 3.0x to 3.9x | 1,772 (10.9%) | 4,932 (24.0%) |
| 4.0x or more | 8,267 (50.7%) | 3,656 (17.8%) |
| Total | 16,297 (100.0%) | 20,535 (100.0%) |
Real Estate Taxes by Mortgage Status in Henderson County
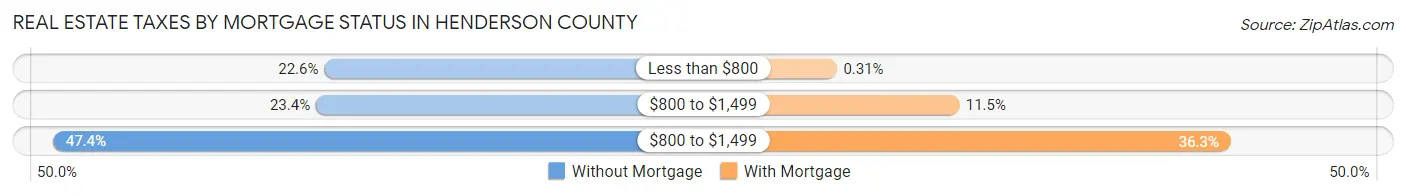
| Property Taxes | Without Mortgage | With Mortgage |
| Less than $800 | 3,688 (22.6%) | 63 (0.3%) |
| $800 to $1,499 | 3,812 (23.4%) | 2,358 (11.5%) |
| $800 to $1,499 | 7,728 (47.4%) | 7,458 (36.3%) |
| Total | 16,297 (100.0%) | 20,535 (100.0%) |
Health & Disability in Henderson County
Health Insurance Coverage by Age in Henderson County
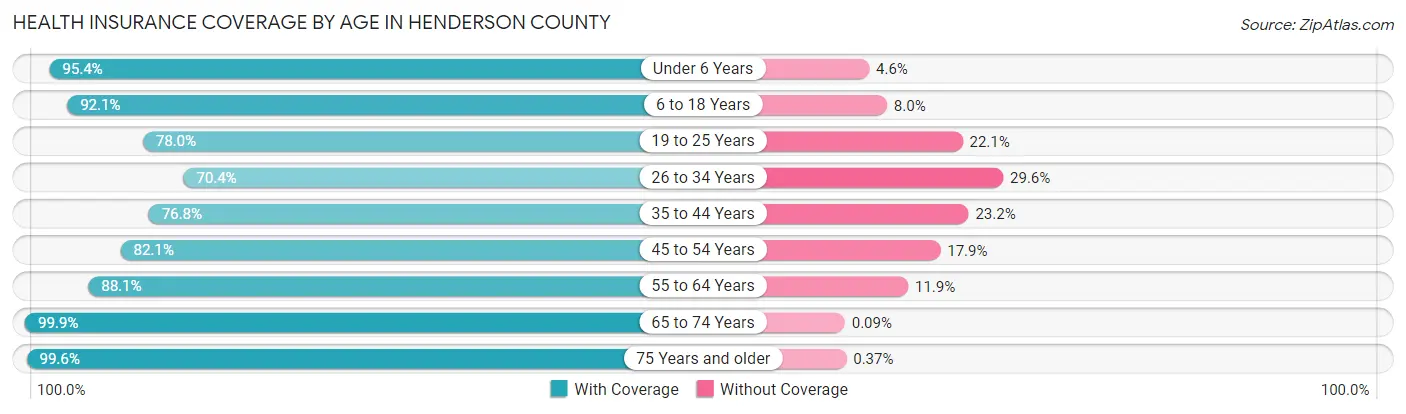
| Age Bracket | With Coverage | Without Coverage |
| Under 6 Years | 6,117 (95.4%) | 297 (4.6%) |
| 6 to 18 Years | 15,100 (92.0%) | 1,305 (8.0%) |
| 19 to 25 Years | 5,925 (77.9%) | 1,676 (22.1%) |
| 26 to 34 Years | 7,596 (70.4%) | 3,197 (29.6%) |
| 35 to 44 Years | 10,078 (76.8%) | 3,038 (23.2%) |
| 45 to 54 Years | 11,860 (82.1%) | 2,586 (17.9%) |
| 55 to 64 Years | 14,991 (88.1%) | 2,022 (11.9%) |
| 65 to 74 Years | 17,070 (99.9%) | 15 (0.1%) |
| 75 Years and older | 12,439 (99.6%) | 46 (0.4%) |
| Total | 101,176 (87.7%) | 14,182 (12.3%) |
Health Insurance Coverage by Citizenship Status in Henderson County
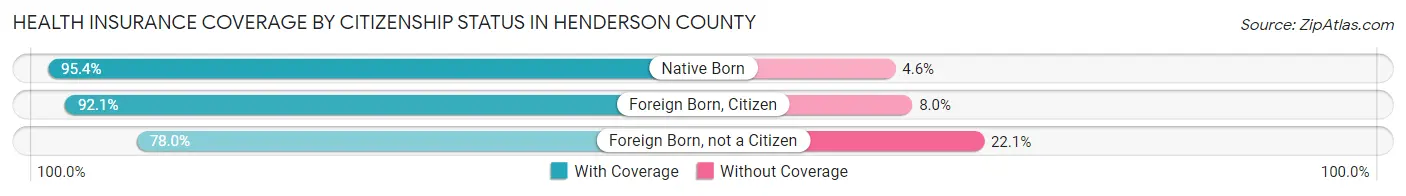
| Citizenship Status | With Coverage | Without Coverage |
| Native Born | 6,117 (95.4%) | 297 (4.6%) |
| Foreign Born, Citizen | 15,100 (92.0%) | 1,305 (8.0%) |
| Foreign Born, not a Citizen | 5,925 (77.9%) | 1,676 (22.1%) |
Health Insurance Coverage by Household Income in Henderson County
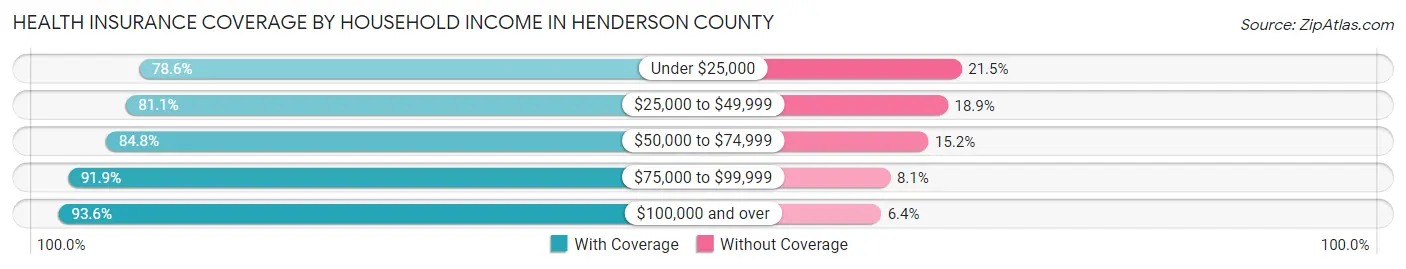
| Household Income | With Coverage | Without Coverage |
| Under $25,000 | 9,740 (78.5%) | 2,659 (21.4%) |
| $25,000 to $49,999 | 17,564 (81.1%) | 4,088 (18.9%) |
| $50,000 to $74,999 | 18,148 (84.8%) | 3,258 (15.2%) |
| $75,000 to $99,999 | 17,716 (91.9%) | 1,559 (8.1%) |
| $100,000 and over | 37,749 (93.6%) | 2,566 (6.4%) |
Public vs Private Health Insurance Coverage by Age in Henderson County
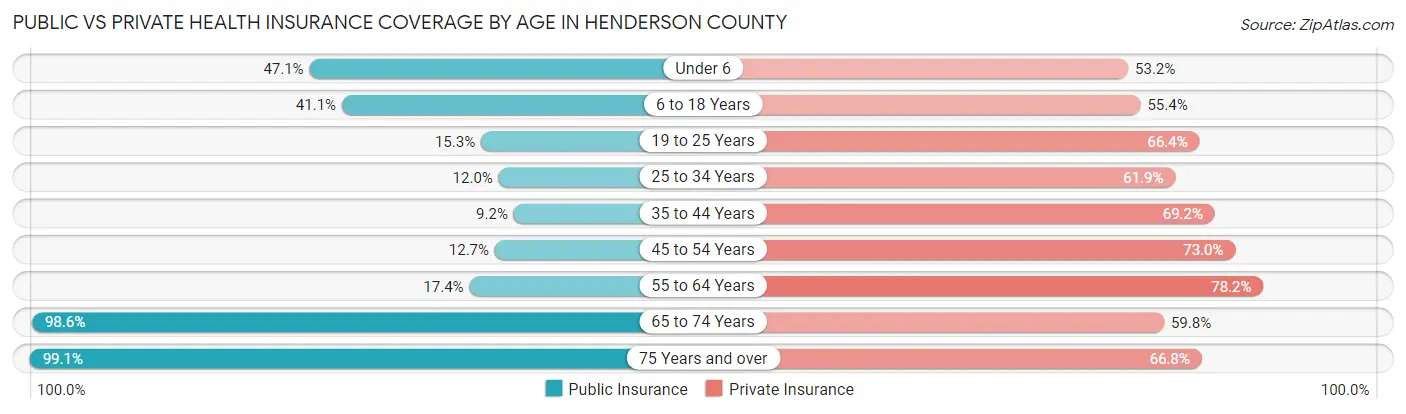
| Age Bracket | Public Insurance | Private Insurance |
| Under 6 | 3,023 (47.1%) | 3,409 (53.1%) |
| 6 to 18 Years | 6,742 (41.1%) | 9,095 (55.4%) |
| 19 to 25 Years | 1,162 (15.3%) | 5,047 (66.4%) |
| 25 to 34 Years | 1,296 (12.0%) | 6,681 (61.9%) |
| 35 to 44 Years | 1,208 (9.2%) | 9,080 (69.2%) |
| 45 to 54 Years | 1,836 (12.7%) | 10,550 (73.0%) |
| 55 to 64 Years | 2,967 (17.4%) | 13,311 (78.2%) |
| 65 to 74 Years | 16,850 (98.6%) | 10,216 (59.8%) |
| 75 Years and over | 12,367 (99.1%) | 8,341 (66.8%) |
| Total | 47,451 (41.1%) | 75,730 (65.6%) |
Disability Status by Sex by Age in Henderson County
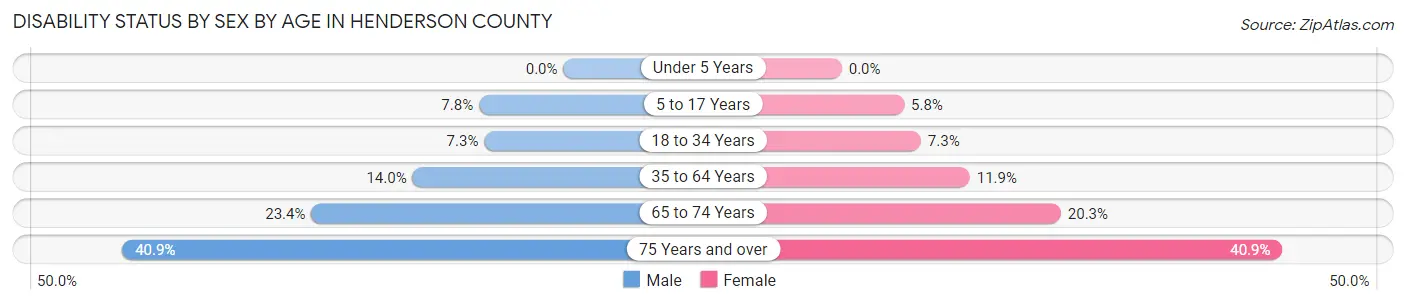
| Age Bracket | Male | Female |
| Under 5 Years | 0 (0.0%) | 0 (0.0%) |
| 5 to 17 Years | 653 (7.8%) | 462 (5.8%) |
| 18 to 34 Years | 724 (7.3%) | 712 (7.3%) |
| 35 to 64 Years | 3,036 (14.0%) | 2,720 (11.9%) |
| 65 to 74 Years | 1,810 (23.4%) | 1,900 (20.3%) |
| 75 Years and over | 2,248 (40.9%) | 2,859 (40.9%) |
Disability Class by Sex by Age in Henderson County
Disability Class: Hearing Difficulty
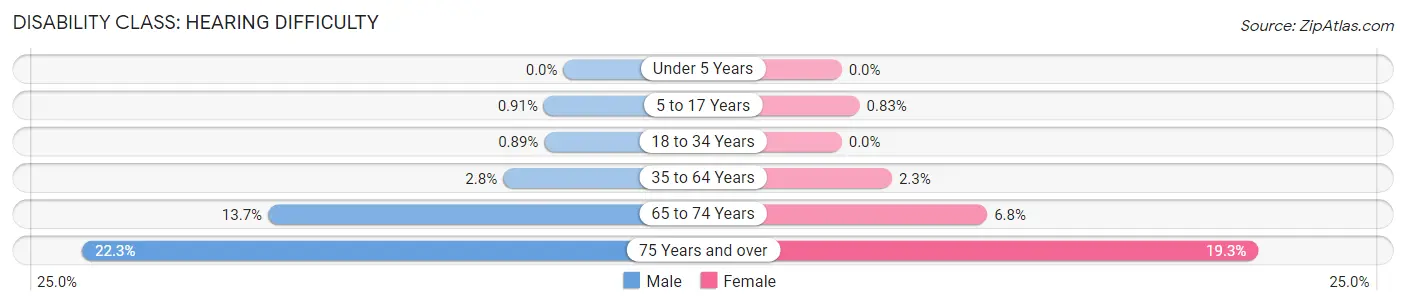
| Age Bracket | Male | Female |
| Under 5 Years | 0 (0.0%) | 0 (0.0%) |
| 5 to 17 Years | 76 (0.9%) | 66 (0.8%) |
| 18 to 34 Years | 88 (0.9%) | 0 (0.0%) |
| 35 to 64 Years | 608 (2.8%) | 534 (2.3%) |
| 65 to 74 Years | 1,061 (13.7%) | 631 (6.8%) |
| 75 Years and over | 1,226 (22.3%) | 1,351 (19.3%) |
Disability Class: Vision Difficulty
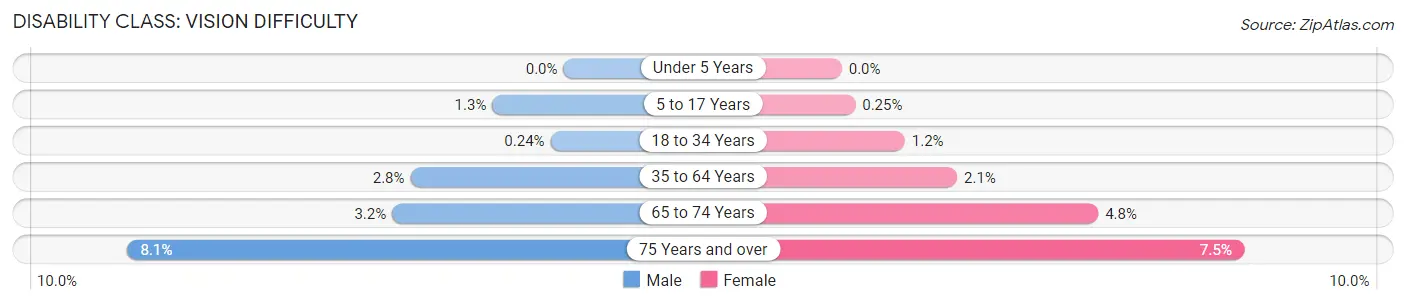
| Age Bracket | Male | Female |
| Under 5 Years | 0 (0.0%) | 0 (0.0%) |
| 5 to 17 Years | 110 (1.3%) | 20 (0.3%) |
| 18 to 34 Years | 24 (0.2%) | 113 (1.2%) |
| 35 to 64 Years | 616 (2.8%) | 491 (2.1%) |
| 65 to 74 Years | 246 (3.2%) | 445 (4.8%) |
| 75 Years and over | 444 (8.1%) | 522 (7.5%) |
Disability Class: Cognitive Difficulty
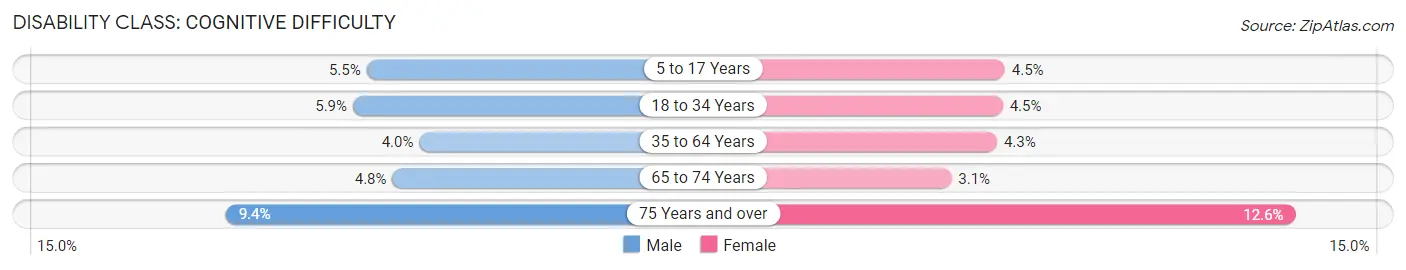
| Age Bracket | Male | Female |
| 5 to 17 Years | 457 (5.5%) | 363 (4.5%) |
| 18 to 34 Years | 578 (5.9%) | 434 (4.5%) |
| 35 to 64 Years | 870 (4.0%) | 989 (4.3%) |
| 65 to 74 Years | 368 (4.8%) | 285 (3.0%) |
| 75 Years and over | 516 (9.4%) | 883 (12.6%) |
Disability Class: Ambulatory Difficulty
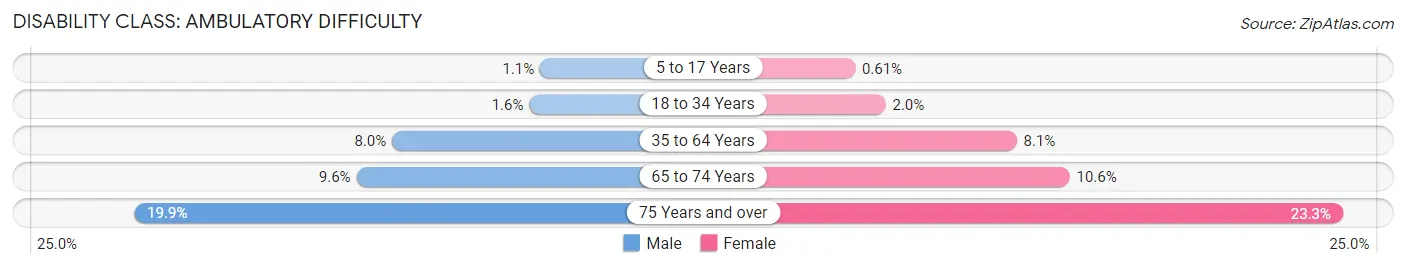
| Age Bracket | Male | Female |
| 5 to 17 Years | 90 (1.1%) | 49 (0.6%) |
| 18 to 34 Years | 156 (1.6%) | 197 (2.0%) |
| 35 to 64 Years | 1,724 (8.0%) | 1,858 (8.1%) |
| 65 to 74 Years | 743 (9.6%) | 988 (10.6%) |
| 75 Years and over | 1,094 (19.9%) | 1,626 (23.3%) |
Disability Class: Self-Care Difficulty
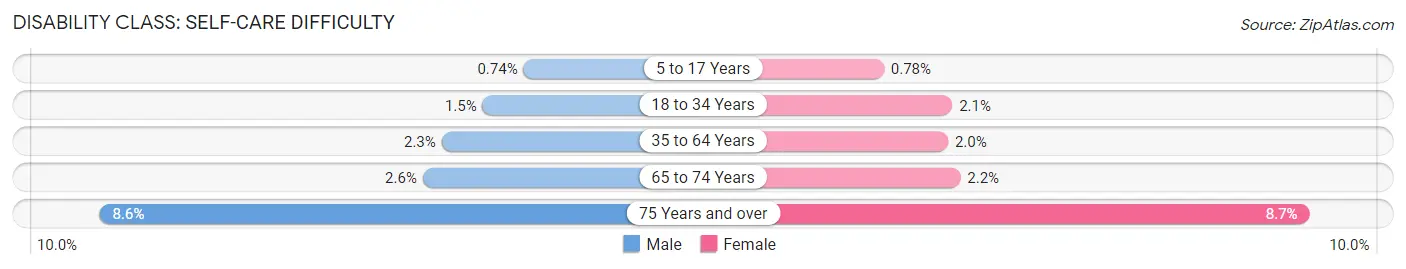
| Age Bracket | Male | Female |
| 5 to 17 Years | 62 (0.7%) | 62 (0.8%) |
| 18 to 34 Years | 148 (1.5%) | 199 (2.1%) |
| 35 to 64 Years | 491 (2.3%) | 452 (2.0%) |
| 65 to 74 Years | 202 (2.6%) | 206 (2.2%) |
| 75 Years and over | 473 (8.6%) | 607 (8.7%) |
Technology Access in Henderson County
Computing Device Access in Henderson County

| Device Type | # Households | % Households |
| Desktop or Laptop | 39,526 | 79.9% |
| Smartphone | 43,054 | 87.0% |
| Tablet | 30,747 | 62.1% |
| No Computing Device | 2,887 | 5.8% |
| Total | 49,494 | 100.0% |
Internet Access in Henderson County
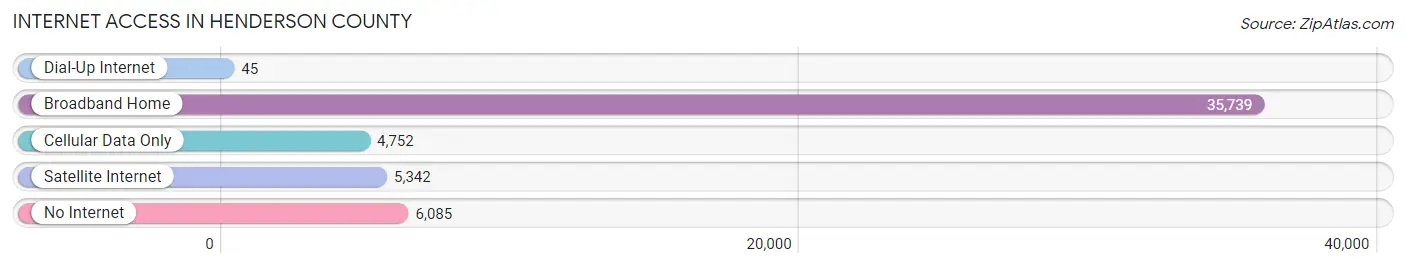
| Internet Type | # Households | % Households |
| Dial-Up Internet | 45 | 0.1% |
| Broadband Home | 35,739 | 72.2% |
| Cellular Data Only | 4,752 | 9.6% |
| Satellite Internet | 5,342 | 10.8% |
| No Internet | 6,085 | 12.3% |
| Total | 49,494 | 100.0% |
Henderson County Summary
Henderson County is located in the western part of North Carolina, and is part of the Blue Ridge Mountains region. It is bordered by Buncombe County to the north, Polk County to the east, Transylvania County to the south, and the state of South Carolina to the west. The county seat is Hendersonville, and the county has a population of 111,368 as of the 2020 census.
History
Henderson County was formed in 1838 from parts of Buncombe and Rutherford counties. It was named for Leonard Henderson, a North Carolina Supreme Court justice. The county was originally part of the Cherokee Nation, and the area was home to many Cherokee settlements. The county was also home to several Revolutionary War battles, including the Battle of Musgrove Mill in 1780.
In the late 19th century, Henderson County became a popular tourist destination due to its scenic beauty and mild climate. The county was home to several resorts, including the Grove Park Inn, which opened in 1913. The county also became a popular retirement destination, and today it is home to many retirees.
Geography
Henderson County is located in the Blue Ridge Mountains region of western North Carolina. The county is mostly mountainous, with elevations ranging from 1,000 to 5,000 feet. The highest point in the county is Mount Pisgah, which has an elevation of 5,721 feet. The county is home to several rivers, including the French Broad, Mills, and Broad Rivers.
The county is home to several state parks, including DuPont State Forest, Gorges State Park, and Pisgah National Forest. The county is also home to several lakes, including Lake Summit, Lake Lure, and Lake Adger.
Economy
Henderson County has a diverse economy, with a mix of manufacturing, agriculture, and tourism. The county is home to several large employers, including General Electric, Continental Teves, and Ecusta Paper Corporation. The county is also home to several wineries, breweries, and distilleries.
Agriculture is an important part of the county's economy, with the county producing apples, peaches, and other fruits and vegetables. The county is also home to several livestock farms, including beef and dairy cattle, sheep, and goats.
Tourism is also an important part of the county's economy, with the county being home to several popular attractions, including the Biltmore Estate, Chimney Rock State Park, and the Blue Ridge Parkway. The county is also home to several popular festivals, including the Apple Festival and the North Carolina Apple Festival.
Demographics
As of the 2020 census, Henderson County had a population of 111,368. The population is mostly white (90.2%), with small percentages of African American (4.3%), Hispanic (2.7%), and Asian (1.7%) residents. The median household income is $50,945, and the median home value is $223,400.
The county is home to several colleges and universities, including Blue Ridge Community College, Brevard College, and Western Carolina University. The county is also home to several public school districts, including Henderson County Public Schools, Transylvania County Schools, and Polk County Schools.
Conclusion
Henderson County is a beautiful and diverse county located in the western part of North Carolina. The county has a rich history, and is home to several popular attractions and festivals. The county has a diverse economy, with a mix of manufacturing, agriculture, and tourism. The county is also home to several colleges and universities, and public school districts. The population is mostly white, with small percentages of African American, Hispanic, and Asian residents.
Common Questions
What is the Total Population of Henderson County?
Total Population of Henderson County is 116,469.
What is the Total Male Population of Henderson County?
Total Male Population of Henderson County is 56,226.
What is the Total Female Population of Henderson County?
Total Female Population of Henderson County is 60,243.
What is the Ratio of Males per 100 Females in Henderson County?
There are 93.33 Males per 100 Females in Henderson County.
What is the Ratio of Females per 100 Males in Henderson County?
There are 107.14 Females per 100 Males in Henderson County.
What is the Median Population Age in Henderson County?
Median Population Age in Henderson County is 47.7 Years.
What is the Average Family Size in Henderson County
Average Family Size in Henderson County is 2.8 People.
What is the Average Household Size in Henderson County
Average Household Size in Henderson County is 2.3 People.
What is Per Capita Income in Henderson County?
Per Capita income in Henderson County is $37,457.
What is the Median Family Income in Henderson County?
Median Family Income in Henderson County is $81,406.
What is the Median Household income in Henderson County?
Median Household Income in Henderson County is $65,508.
What is Income or Wage Gap in Henderson County?
Income or Wage Gap in Henderson County is 28.7%.
Women in Henderson County earn 71.3 cents for every dollar earned by a man.
What is Family Income Deficit in Henderson County?
Family Income Deficit in Henderson County is $10,139.
Families that are below poverty line in Henderson County earn $10,139 less on average than the poverty threshold level.
What is Inequality or Gini Index in Henderson County?
Inequality or Gini Index in Henderson County is 0.45.
How Large is the Labor Force in Henderson County?
There are 56,581 People in the Labor Forcein in Henderson County.
What is the Percentage of People in the Labor Force in Henderson County?
58.0% of People are in the Labor Force in Henderson County.
What is the Unemployment Rate in Henderson County?
Unemployment Rate in Henderson County is 3.5%.