Harnett County, NC
Harnett County Map
Harnett County Overview
134,718
TOTAL POPULATION
67,115
MALE POPULATION
67,603
FEMALE POPULATION
99.28
MALES / 100 FEMALES
100.73
FEMALES / 100 MALES
35.2
MEDIAN AGE
3.4
AVG FAMILY SIZE
2.8
AVG HOUSEHOLD SIZE
$29,678
PER CAPITA INCOME
$78,039
AVG FAMILY INCOME
$64,992
AVG HOUSEHOLD INCOME
34.1%
WAGE / INCOME GAP [ % ]
65.9¢/ $1
WAGE / INCOME GAP [ $ ]
$11,300
FAMILY INCOME DEFICIT
0.43
INEQUALITY / GINI INDEX
61,914
LABOR FORCE [ PEOPLE ]
59.6%
PERCENT IN LABOR FORCE
5.3%
UNEMPLOYMENT RATE
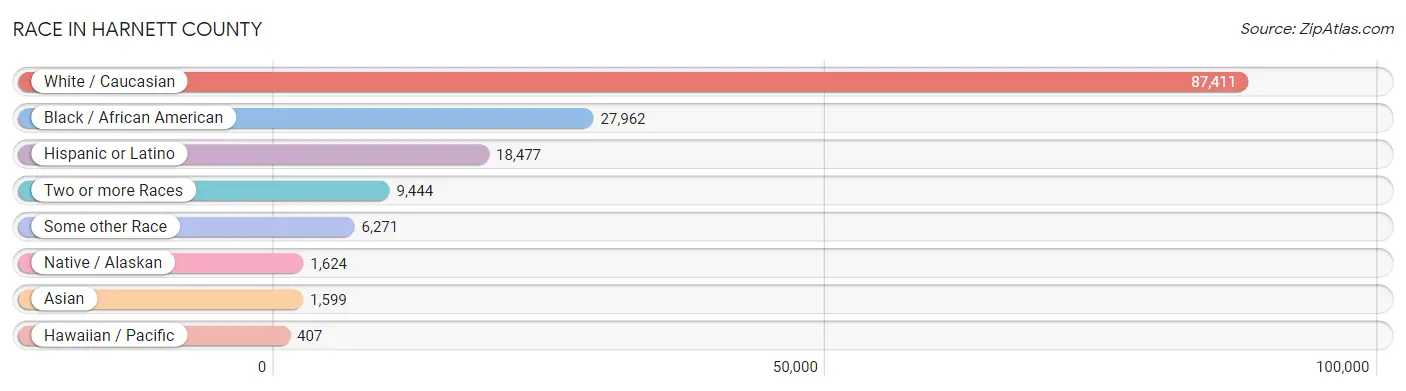
Race in Harnett County
The most populous races in Harnett County are White / Caucasian (87,411 | 64.9%), Black / African American (27,962 | 20.8%), and Hispanic or Latino (18,477 | 13.7%).
| Race | # Population | % Population |
| Asian | 1,599 | 1.2% |
| Black / African American | 27,962 | 20.8% |
| Hawaiian / Pacific | 407 | 0.3% |
| Hispanic or Latino | 18,477 | 13.7% |
| Native / Alaskan | 1,624 | 1.2% |
| White / Caucasian | 87,411 | 64.9% |
| Two or more Races | 9,444 | 7.0% |
| Some other Race | 6,271 | 4.6% |
| Total | 134,718 | 100.0% |
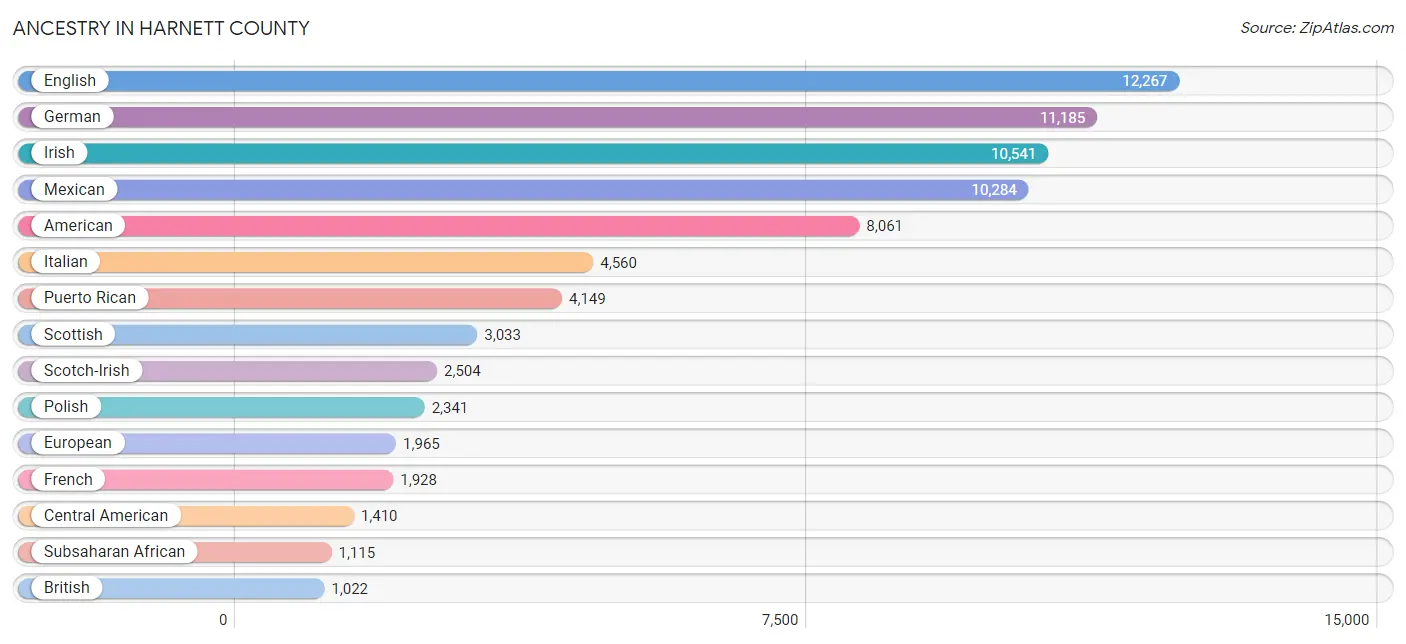
Ancestry in Harnett County
The most populous ancestries reported in Harnett County are English (12,267 | 9.1%), German (11,185 | 8.3%), Irish (10,541 | 7.8%), Mexican (10,284 | 7.6%), and American (8,061 | 6.0%), together accounting for 38.8% of all Harnett County residents.
| Ancestry | # Population | % Population |
| Afghan | 29 | 0.0% |
| African | 764 | 0.6% |
| Albanian | 24 | 0.0% |
| American | 8,061 | 6.0% |
| Apache | 3 | 0.0% |
| Arab | 250 | 0.2% |
| Argentinean | 4 | 0.0% |
| Armenian | 84 | 0.1% |
| Australian | 2 | 0.0% |
| Austrian | 69 | 0.1% |
| Bangladeshi | 123 | 0.1% |
| Barbadian | 14 | 0.0% |
| Belgian | 11 | 0.0% |
| Bermudan | 18 | 0.0% |
| Bhutanese | 232 | 0.2% |
| Blackfeet | 61 | 0.1% |
| Bolivian | 6 | 0.0% |
| Brazilian | 194 | 0.1% |
| British | 1,022 | 0.8% |
| British West Indian | 29 | 0.0% |
| Bulgarian | 11 | 0.0% |
| Burmese | 594 | 0.4% |
| Cajun | 2 | 0.0% |
| Canadian | 307 | 0.2% |
| Celtic | 3 | 0.0% |
| Central American | 1,410 | 1.1% |
| Central American Indian | 128 | 0.1% |
| Cherokee | 526 | 0.4% |
| Chickasaw | 11 | 0.0% |
| Chilean | 9 | 0.0% |
| Choctaw | 72 | 0.1% |
| Colombian | 165 | 0.1% |
| Colville | 27 | 0.0% |
| Costa Rican | 72 | 0.1% |
| Creek | 12 | 0.0% |
| Croatian | 24 | 0.0% |
| Cuban | 787 | 0.6% |
| Czech | 94 | 0.1% |
| Czechoslovakian | 17 | 0.0% |
| Danish | 399 | 0.3% |
| Delaware | 9 | 0.0% |
| Dominican | 339 | 0.3% |
| Dutch | 509 | 0.4% |
| Eastern European | 197 | 0.2% |
| Ecuadorian | 106 | 0.1% |
| English | 12,267 | 9.1% |
| European | 1,965 | 1.5% |
| Fijian | 15 | 0.0% |
| Finnish | 42 | 0.0% |
| French | 1,928 | 1.4% |
| French American Indian | 7 | 0.0% |
| French Canadian | 431 | 0.3% |
| German | 11,185 | 8.3% |
| Ghanaian | 110 | 0.1% |
| Greek | 382 | 0.3% |
| Guamanian / Chamorro | 223 | 0.2% |
| Guatemalan | 317 | 0.2% |
| Guyanese | 31 | 0.0% |
| Haitian | 149 | 0.1% |
| Honduran | 379 | 0.3% |
| Hungarian | 190 | 0.1% |
| Indian (Asian) | 357 | 0.3% |
| Inupiat | 12 | 0.0% |
| Iranian | 54 | 0.0% |
| Irish | 10,541 | 7.8% |
| Iroquois | 86 | 0.1% |
| Israeli | 5 | 0.0% |
| Italian | 4,560 | 3.4% |
| Jamaican | 664 | 0.5% |
| Jordanian | 9 | 0.0% |
| Korean | 893 | 0.7% |
| Latvian | 3 | 0.0% |
| Lebanese | 101 | 0.1% |
| Lithuanian | 119 | 0.1% |
| Lumbee | 436 | 0.3% |
| Macedonian | 36 | 0.0% |
| Malaysian | 66 | 0.1% |
| Maltese | 16 | 0.0% |
| Mexican | 10,284 | 7.6% |
| Mexican American Indian | 428 | 0.3% |
| Mongolian | 58 | 0.0% |
| Moroccan | 57 | 0.0% |
| Native Hawaiian | 223 | 0.2% |
| Navajo | 79 | 0.1% |
| New Zealander | 27 | 0.0% |
| Nicaraguan | 134 | 0.1% |
| Nigerian | 84 | 0.1% |
| Northern European | 102 | 0.1% |
| Norwegian | 642 | 0.5% |
| Osage | 2 | 0.0% |
| Pakistani | 178 | 0.1% |
| Panamanian | 124 | 0.1% |
| Pennsylvania German | 28 | 0.0% |
| Peruvian | 84 | 0.1% |
| Polish | 2,341 | 1.7% |
| Portuguese | 301 | 0.2% |
| Pueblo | 17 | 0.0% |
| Puerto Rican | 4,149 | 3.1% |
| Romanian | 123 | 0.1% |
| Russian | 299 | 0.2% |
| Salvadoran | 384 | 0.3% |
| Samoan | 287 | 0.2% |
| Scandinavian | 221 | 0.2% |
| Scotch-Irish | 2,504 | 1.9% |
| Scottish | 3,033 | 2.2% |
| Seminole | 24 | 0.0% |
| Serbian | 18 | 0.0% |
| Sioux | 9 | 0.0% |
| Slavic | 19 | 0.0% |
| Slovak | 112 | 0.1% |
| South American | 382 | 0.3% |
| South American Indian | 119 | 0.1% |
| Spaniard | 223 | 0.2% |
| Spanish | 68 | 0.1% |
| Sri Lankan | 359 | 0.3% |
| Subsaharan African | 1,115 | 0.8% |
| Swedish | 601 | 0.4% |
| Swiss | 59 | 0.0% |
| Thai | 236 | 0.2% |
| Turkish | 14 | 0.0% |
| Ukrainian | 117 | 0.1% |
| Venezuelan | 8 | 0.0% |
| Welsh | 319 | 0.2% |
| West Indian | 203 | 0.2% |
| Yaqui | 4 | 0.0% |
| Yugoslavian | 62 | 0.1% | View All 126 Rows |
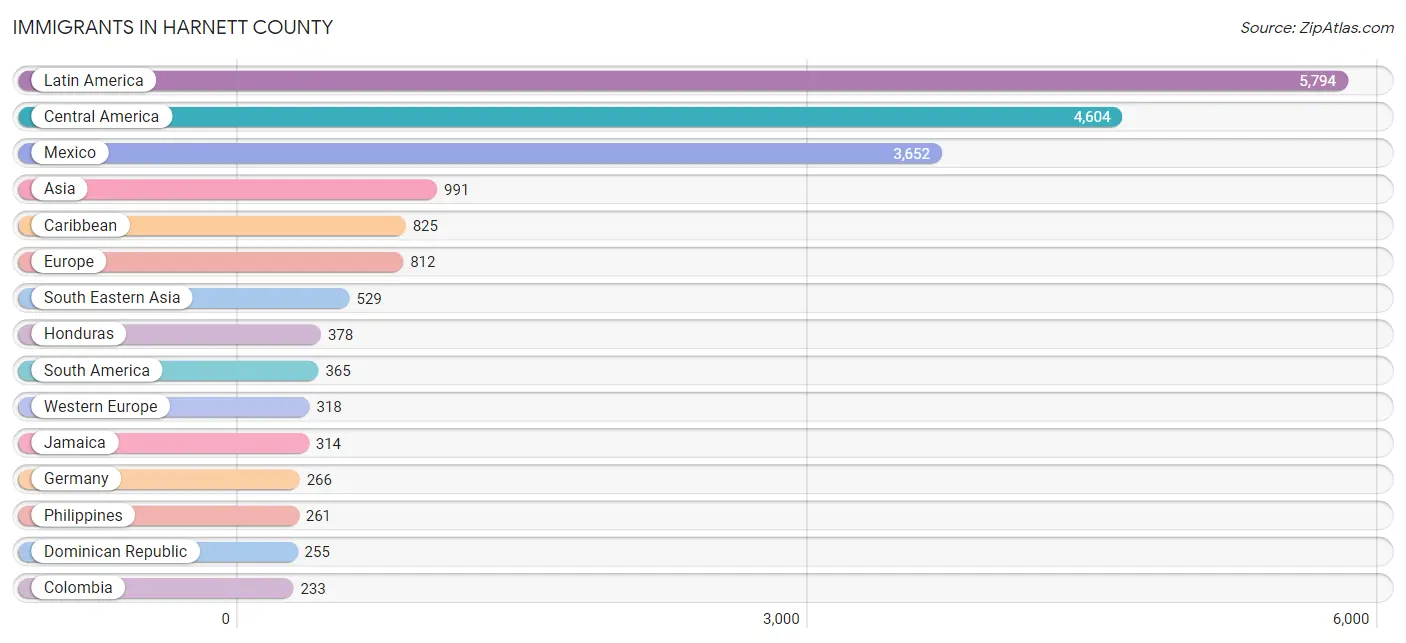
Immigrants in Harnett County
The most numerous immigrant groups reported in Harnett County came from Latin America (5,794 | 4.3%), Central America (4,604 | 3.4%), Mexico (3,652 | 2.7%), Asia (991 | 0.7%), and Caribbean (825 | 0.6%), together accounting for 11.8% of all Harnett County residents.
| Immigration Origin | # Population | % Population |
| Afghanistan | 26 | 0.0% |
| Africa | 186 | 0.1% |
| Albania | 18 | 0.0% |
| Armenia | 34 | 0.0% |
| Asia | 991 | 0.7% |
| Australia | 81 | 0.1% |
| Bangladesh | 8 | 0.0% |
| Barbados | 8 | 0.0% |
| Brazil | 100 | 0.1% |
| Bulgaria | 11 | 0.0% |
| Cameroon | 12 | 0.0% |
| Canada | 123 | 0.1% |
| Caribbean | 825 | 0.6% |
| Central America | 4,604 | 3.4% |
| China | 122 | 0.1% |
| Colombia | 233 | 0.2% |
| Costa Rica | 39 | 0.0% |
| Croatia | 13 | 0.0% |
| Cuba | 117 | 0.1% |
| Czechoslovakia | 15 | 0.0% |
| Dominica | 7 | 0.0% |
| Dominican Republic | 255 | 0.2% |
| Eastern Africa | 18 | 0.0% |
| Eastern Asia | 207 | 0.2% |
| Eastern Europe | 225 | 0.2% |
| Ecuador | 11 | 0.0% |
| El Salvador | 203 | 0.2% |
| England | 71 | 0.1% |
| Europe | 812 | 0.6% |
| France | 41 | 0.0% |
| Germany | 266 | 0.2% |
| Ghana | 42 | 0.0% |
| Guatemala | 178 | 0.1% |
| Guyana | 5 | 0.0% |
| Haiti | 78 | 0.1% |
| Honduras | 378 | 0.3% |
| Hong Kong | 10 | 0.0% |
| India | 75 | 0.1% |
| Ireland | 1 | 0.0% |
| Italy | 59 | 0.0% |
| Jamaica | 314 | 0.2% |
| Japan | 21 | 0.0% |
| Kazakhstan | 6 | 0.0% |
| Kenya | 4 | 0.0% |
| Korea | 64 | 0.1% |
| Laos | 42 | 0.0% |
| Latin America | 5,794 | 4.3% |
| Lebanon | 3 | 0.0% |
| Malaysia | 6 | 0.0% |
| Mexico | 3,652 | 2.7% |
| Middle Africa | 12 | 0.0% |
| Netherlands | 11 | 0.0% |
| Nicaragua | 74 | 0.1% |
| Nigeria | 66 | 0.1% |
| Northern Europe | 157 | 0.1% |
| Oceania | 122 | 0.1% |
| Panama | 80 | 0.1% |
| Peru | 8 | 0.0% |
| Philippines | 261 | 0.2% |
| Poland | 23 | 0.0% |
| Portugal | 47 | 0.0% |
| Romania | 13 | 0.0% |
| Russia | 44 | 0.0% |
| Saudi Arabia | 15 | 0.0% |
| Scotland | 21 | 0.0% |
| Serbia | 9 | 0.0% |
| Sierra Leone | 6 | 0.0% |
| South America | 365 | 0.3% |
| South Central Asia | 131 | 0.1% |
| South Eastern Asia | 529 | 0.4% |
| Southern Europe | 112 | 0.1% |
| Spain | 6 | 0.0% |
| Sweden | 14 | 0.0% |
| Thailand | 66 | 0.1% |
| Trinidad and Tobago | 10 | 0.0% |
| Turkey | 5 | 0.0% |
| Ukraine | 58 | 0.0% |
| Uzbekistan | 16 | 0.0% |
| Venezuela | 8 | 0.0% |
| Vietnam | 154 | 0.1% |
| Western Africa | 148 | 0.1% |
| Western Asia | 124 | 0.1% |
| Western Europe | 318 | 0.2% | View All 83 Rows |
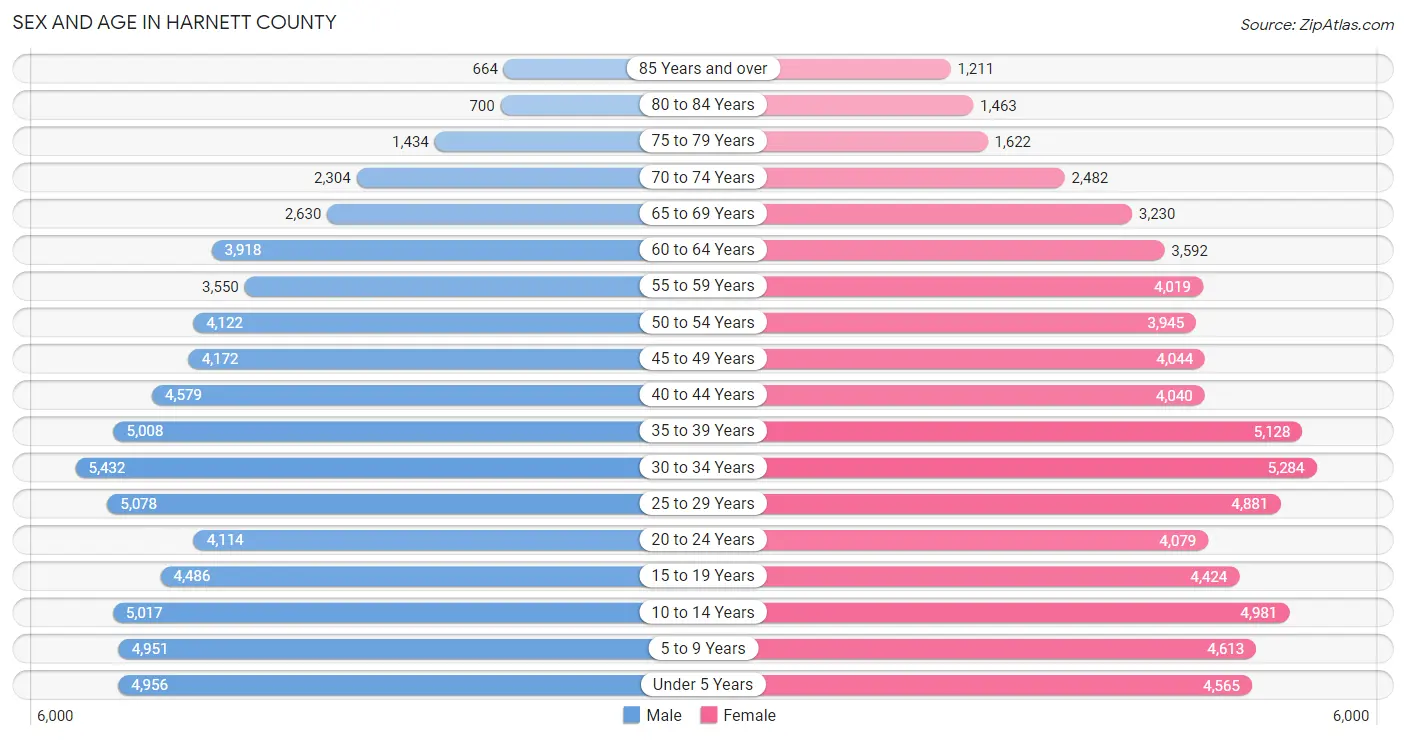
Sex and Age in Harnett County
Sex and Age in Harnett County
The most populous age groups in Harnett County are 30 to 34 Years (5,432 | 8.1%) for men and 30 to 34 Years (5,284 | 7.8%) for women.
| Age Bracket | Male | Female |
| Under 5 Years | 4,956 (7.4%) | 4,565 (6.8%) |
| 5 to 9 Years | 4,951 (7.4%) | 4,613 (6.8%) |
| 10 to 14 Years | 5,017 (7.5%) | 4,981 (7.4%) |
| 15 to 19 Years | 4,486 (6.7%) | 4,424 (6.5%) |
| 20 to 24 Years | 4,114 (6.1%) | 4,079 (6.0%) |
| 25 to 29 Years | 5,078 (7.6%) | 4,881 (7.2%) |
| 30 to 34 Years | 5,432 (8.1%) | 5,284 (7.8%) |
| 35 to 39 Years | 5,008 (7.5%) | 5,128 (7.6%) |
| 40 to 44 Years | 4,579 (6.8%) | 4,040 (6.0%) |
| 45 to 49 Years | 4,172 (6.2%) | 4,044 (6.0%) |
| 50 to 54 Years | 4,122 (6.1%) | 3,945 (5.8%) |
| 55 to 59 Years | 3,550 (5.3%) | 4,019 (5.9%) |
| 60 to 64 Years | 3,918 (5.8%) | 3,592 (5.3%) |
| 65 to 69 Years | 2,630 (3.9%) | 3,230 (4.8%) |
| 70 to 74 Years | 2,304 (3.4%) | 2,482 (3.7%) |
| 75 to 79 Years | 1,434 (2.1%) | 1,622 (2.4%) |
| 80 to 84 Years | 700 (1.0%) | 1,463 (2.2%) |
| 85 Years and over | 664 (1.0%) | 1,211 (1.8%) |
| Total | 67,115 (100.0%) | 67,603 (100.0%) |
Families and Households in Harnett County
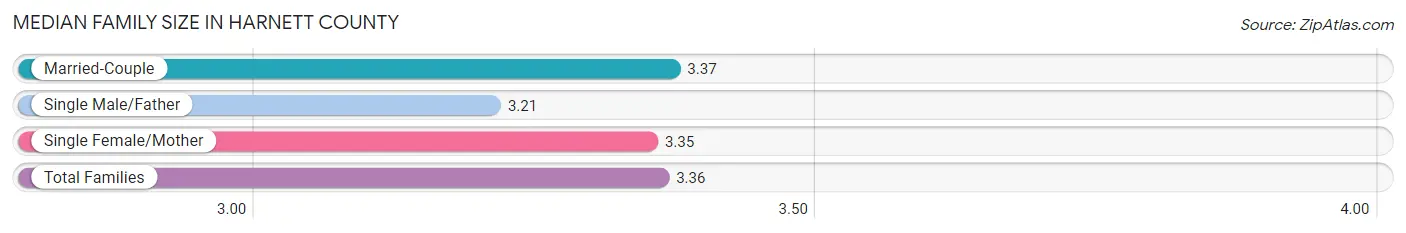
Median Family Size in Harnett County
The median family size in Harnett County is 3.36 persons per family, with married-couple families (24,356 | 74.5%) accounting for the largest median family size of 3.37 persons per family. On the other hand, single male/father families (2,468 | 7.5%) represent the smallest median family size with 3.21 persons per family.
| Family Type | # Families | Family Size |
| Married-Couple | 24,356 (74.5%) | 3.37 |
| Single Male/Father | 2,468 (7.5%) | 3.21 |
| Single Female/Mother | 5,881 (18.0%) | 3.35 |
| Total Families | 32,705 (100.0%) | 3.36 |
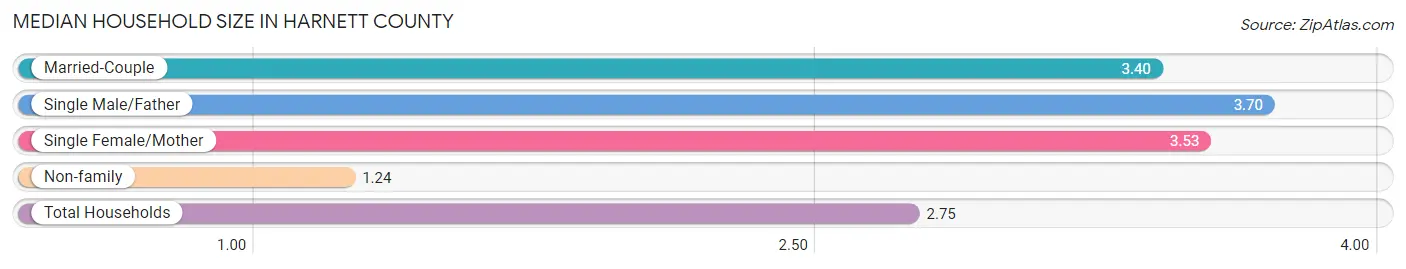
Median Household Size in Harnett County
The median household size in Harnett County is 2.75 persons per household, with single male/father households (2,468 | 5.2%) accounting for the largest median household size of 3.7 persons per household. non-family households (15,165 | 31.7%) represent the smallest median household size with 1.24 persons per household.
| Household Type | # Households | Household Size |
| Married-Couple | 24,356 (50.9%) | 3.40 |
| Single Male/Father | 2,468 (5.2%) | 3.70 |
| Single Female/Mother | 5,881 (12.3%) | 3.53 |
| Non-family | 15,165 (31.7%) | 1.24 |
| Total Households | 47,870 (100.0%) | 2.75 |
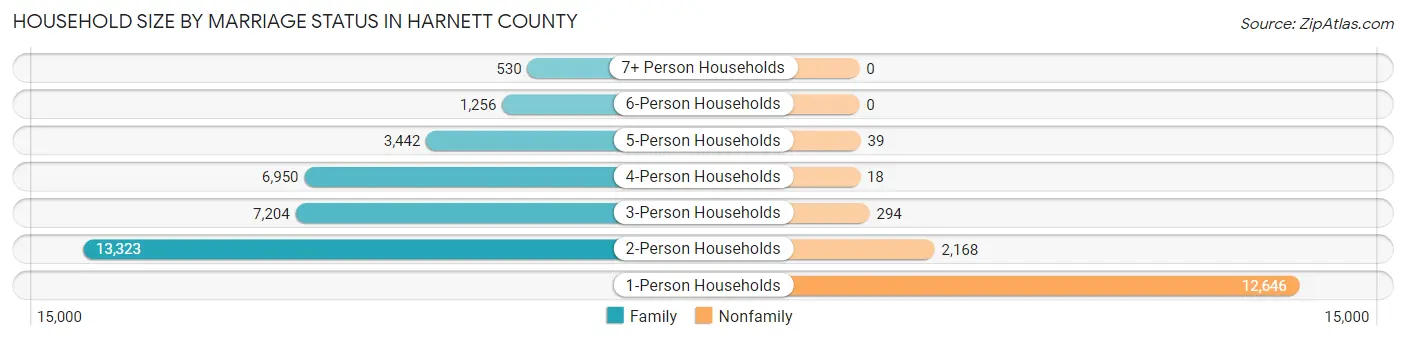
Household Size by Marriage Status in Harnett County
Out of a total of 47,870 households in Harnett County, 32,705 (68.3%) are family households, while 15,165 (31.7%) are nonfamily households. The most numerous type of family households are 2-person households, comprising 13,323, and the most common type of nonfamily households are 1-person households, comprising 12,646.
| Household Size | Family Households | Nonfamily Households |
| 1-Person Households | - | 12,646 (26.4%) |
| 2-Person Households | 13,323 (27.8%) | 2,168 (4.5%) |
| 3-Person Households | 7,204 (15.0%) | 294 (0.6%) |
| 4-Person Households | 6,950 (14.5%) | 18 (0.0%) |
| 5-Person Households | 3,442 (7.2%) | 39 (0.1%) |
| 6-Person Households | 1,256 (2.6%) | 0 (0.0%) |
| 7+ Person Households | 530 (1.1%) | 0 (0.0%) |
| Total | 32,705 (68.3%) | 15,165 (31.7%) |
Female Fertility in Harnett County
Fertility by Age in Harnett County
Average fertility rate in Harnett County is 44.0 births per 1,000 women. Women in the age bracket of 20 to 34 years have the highest fertility rate with 70.0 births per 1,000 women. Women in the age bracket of 20 to 34 years acount for 69.1% of all women with births.
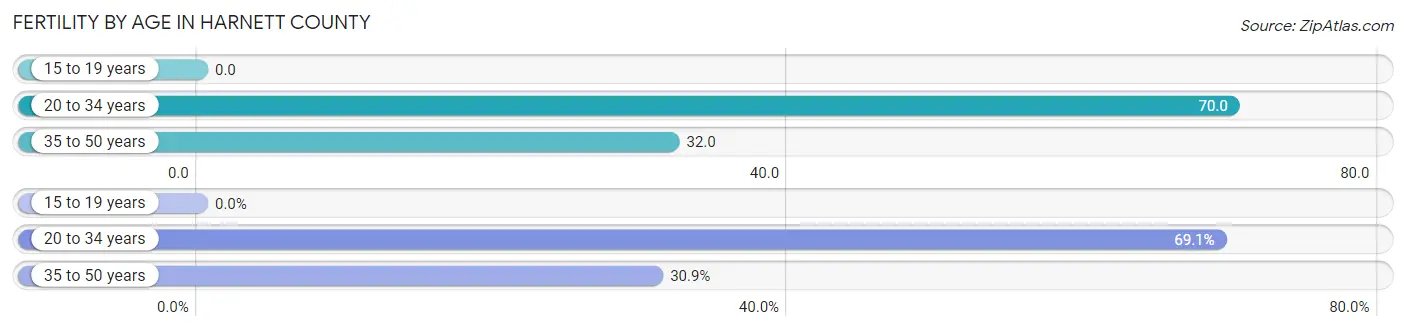
| Age Bracket | Women with Births | Births / 1,000 Women |
| 15 to 19 years | 0 (0.0%) | 0.0 |
| 20 to 34 years | 998 (69.1%) | 70.0 |
| 35 to 50 years | 446 (30.9%) | 32.0 |
| Total | 1,444 (100.0%) | 44.0 |
Fertility by Age by Marriage Status in Harnett County
72.9% of women with births (1,444) in Harnett County are married. The highest percentage of unmarried women with births falls into 35 to 50 years age bracket with 47.1% of them unmarried at the time of birth, while the lowest percentage of unmarried women with births belong to 20 to 34 years age bracket with 18.2% of them unmarried.
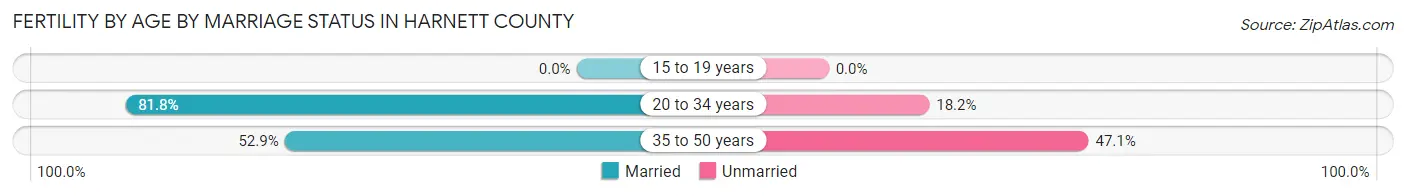
| Age Bracket | Married | Unmarried |
| 15 to 19 years | 0 (0.0%) | 0 (0.0%) |
| 20 to 34 years | 816 (81.8%) | 182 (18.2%) |
| 35 to 50 years | 236 (52.9%) | 210 (47.1%) |
| Total | 1,053 (72.9%) | 391 (27.1%) |
Fertility by Education in Harnett County
Average fertility rate in Harnett County is 44.0 births per 1,000 women. Women with the education attainment of bachelor's degree have the highest fertility rate of 60.0 births per 1,000 women, while women with the education attainment of less than high school have the lowest fertility at 11.0 births per 1,000 women. Women with the education attainment of college or associate's degree represent 46.4% of all women with births.
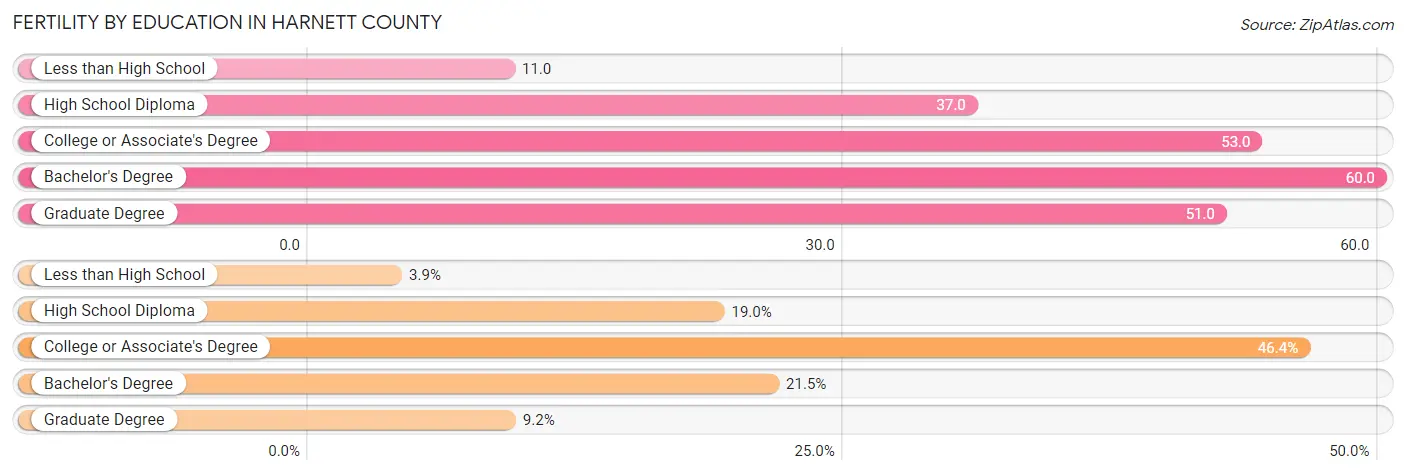
| Educational Attainment | Women with Births | Births / 1,000 Women |
| Less than High School | 56 (3.9%) | 11.0 |
| High School Diploma | 274 (19.0%) | 37.0 |
| College or Associate's Degree | 670 (46.4%) | 53.0 |
| Bachelor's Degree | 311 (21.5%) | 60.0 |
| Graduate Degree | 133 (9.2%) | 51.0 |
| Total | 1,444 (100.0%) | 44.0 |
Fertility by Education by Marriage Status in Harnett County
27.1% of women with births in Harnett County are unmarried. Women with the educational attainment of graduate degree are most likely to be married with 100.0% of them married at childbirth, while women with the educational attainment of college or associate's degree are least likely to be married with 41.2% of them unmarried at childbirth.
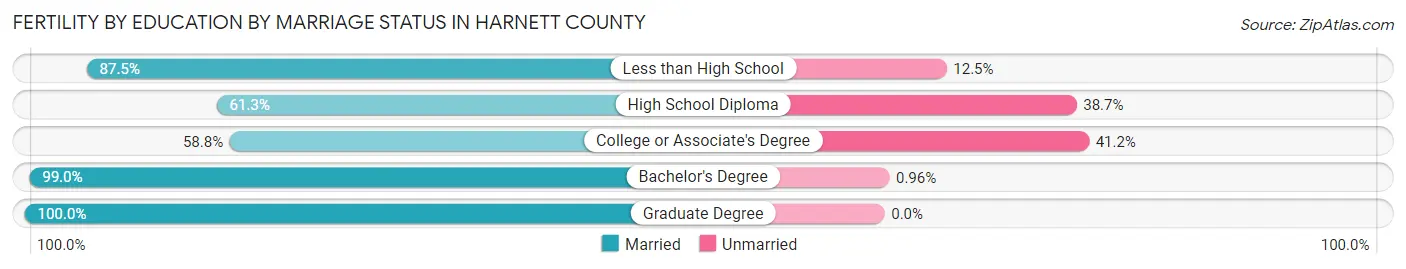
| Educational Attainment | Married | Unmarried |
| Less than High School | 49 (87.5%) | 7 (12.5%) |
| High School Diploma | 168 (61.3%) | 106 (38.7%) |
| College or Associate's Degree | 394 (58.8%) | 276 (41.2%) |
| Bachelor's Degree | 308 (99.0%) | 3 (1.0%) |
| Graduate Degree | 133 (100.0%) | 0 (0.0%) |
| Total | 1,053 (72.9%) | 391 (27.1%) |
Income in Harnett County
Income Overview in Harnett County
Per Capita Income in Harnett County is $29,678, while median incomes of families and households are $78,039 and $64,992 respectively.
| Characteristic | Number | Measure |
| Per Capita Income | 134,718 | $29,678 |
| Median Family Income | 32,705 | $78,039 |
| Mean Family Income | 32,705 | $91,264 |
| Median Household Income | 47,870 | $64,992 |
| Mean Household Income | 47,870 | $79,400 |
| Income Deficit | 32,705 | $11,300 |
| Wage / Income Gap (%) | 134,718 | 34.11% |
| Wage / Income Gap ($) | 134,718 | 65.89¢ per $1 |
| Gini / Inequality Index | 134,718 | 0.43 |
Earnings by Sex in Harnett County
Average Earnings in Harnett County are $37,946, $46,119 for men and $30,386 for women, a difference of 34.1%.
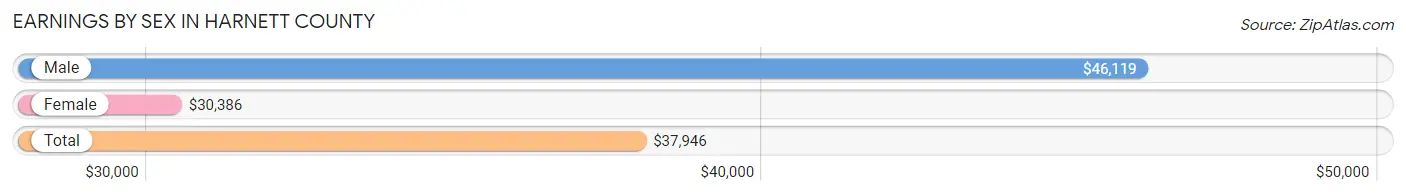
| Sex | Number | Average Earnings |
| Male | 35,781 (55.3%) | $46,119 |
| Female | 28,951 (44.7%) | $30,386 |
| Total | 64,732 (100.0%) | $37,946 |
Earnings by Sex by Income Bracket in Harnett County
The most common earnings brackets in Harnett County are $100,000+ for men (4,216 | 11.8%) and $2,499 or less for women (2,231 | 7.7%).
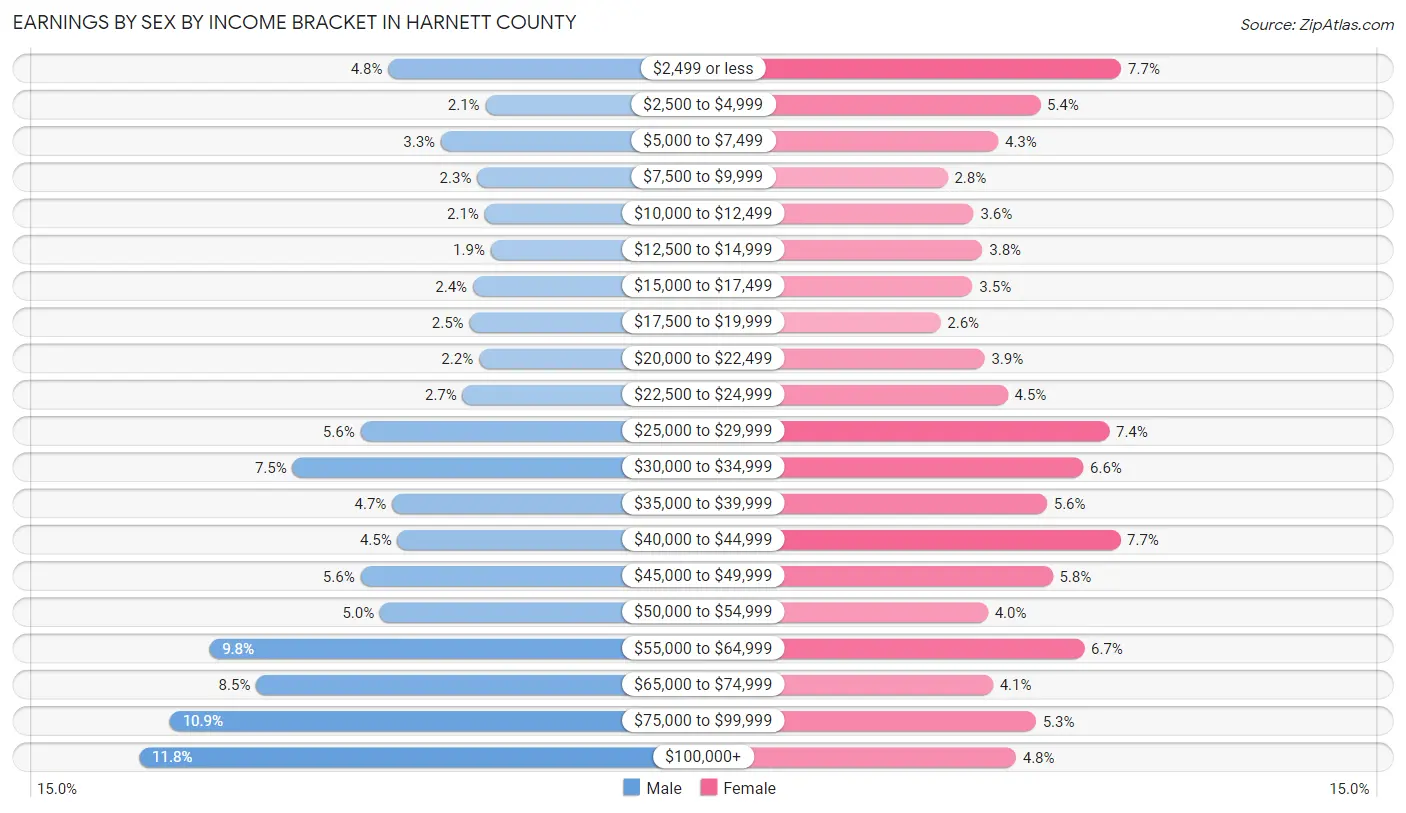
| Income | Male | Female |
| $2,499 or less | 1,712 (4.8%) | 2,231 (7.7%) |
| $2,500 to $4,999 | 735 (2.1%) | 1,572 (5.4%) |
| $5,000 to $7,499 | 1,182 (3.3%) | 1,231 (4.3%) |
| $7,500 to $9,999 | 815 (2.3%) | 819 (2.8%) |
| $10,000 to $12,499 | 741 (2.1%) | 1,030 (3.6%) |
| $12,500 to $14,999 | 680 (1.9%) | 1,103 (3.8%) |
| $15,000 to $17,499 | 857 (2.4%) | 1,022 (3.5%) |
| $17,500 to $19,999 | 894 (2.5%) | 761 (2.6%) |
| $20,000 to $22,499 | 797 (2.2%) | 1,121 (3.9%) |
| $22,500 to $24,999 | 964 (2.7%) | 1,308 (4.5%) |
| $25,000 to $29,999 | 1,990 (5.6%) | 2,135 (7.4%) |
| $30,000 to $34,999 | 2,673 (7.5%) | 1,922 (6.6%) |
| $35,000 to $39,999 | 1,670 (4.7%) | 1,627 (5.6%) |
| $40,000 to $44,999 | 1,618 (4.5%) | 2,222 (7.7%) |
| $45,000 to $49,999 | 1,988 (5.6%) | 1,673 (5.8%) |
| $50,000 to $54,999 | 1,793 (5.0%) | 1,147 (4.0%) |
| $55,000 to $64,999 | 3,510 (9.8%) | 1,931 (6.7%) |
| $65,000 to $74,999 | 3,037 (8.5%) | 1,186 (4.1%) |
| $75,000 to $99,999 | 3,909 (10.9%) | 1,536 (5.3%) |
| $100,000+ | 4,216 (11.8%) | 1,374 (4.8%) |
| Total | 35,781 (100.0%) | 28,951 (100.0%) |
Earnings by Sex by Educational Attainment in Harnett County
Average earnings in Harnett County are $51,926 for men and $35,547 for women, a difference of 31.5%. Men with an educational attainment of graduate degree enjoy the highest average annual earnings of $83,545, while those with less than high school education earn the least with $31,958. Women with an educational attainment of graduate degree earn the most with the average annual earnings of $56,197, while those with less than high school education have the smallest earnings of $21,832.
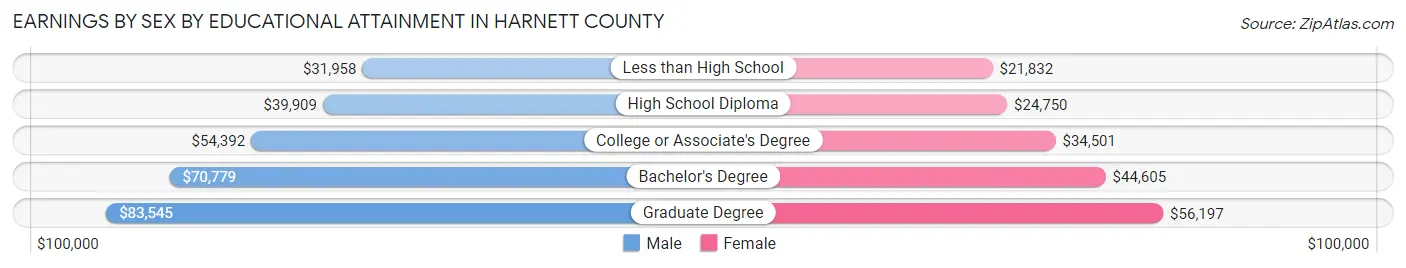
| Educational Attainment | Male Income | Female Income |
| Less than High School | $31,958 | $21,832 |
| High School Diploma | $39,909 | $24,750 |
| College or Associate's Degree | $54,392 | $34,501 |
| Bachelor's Degree | $70,779 | $44,605 |
| Graduate Degree | $83,545 | $56,197 |
| Total | $51,926 | $35,547 |
Family Income in Harnett County
Family Income Brackets in Harnett County
According to the Harnett County family income data, there are 6,443 families falling into the $100,000 to $149,999 income range, which is the most common income bracket and makes up 19.7% of all families. Conversely, the $10,000 to $14,999 income bracket is the least frequent group with only 687 families (2.1%) belonging to this category.
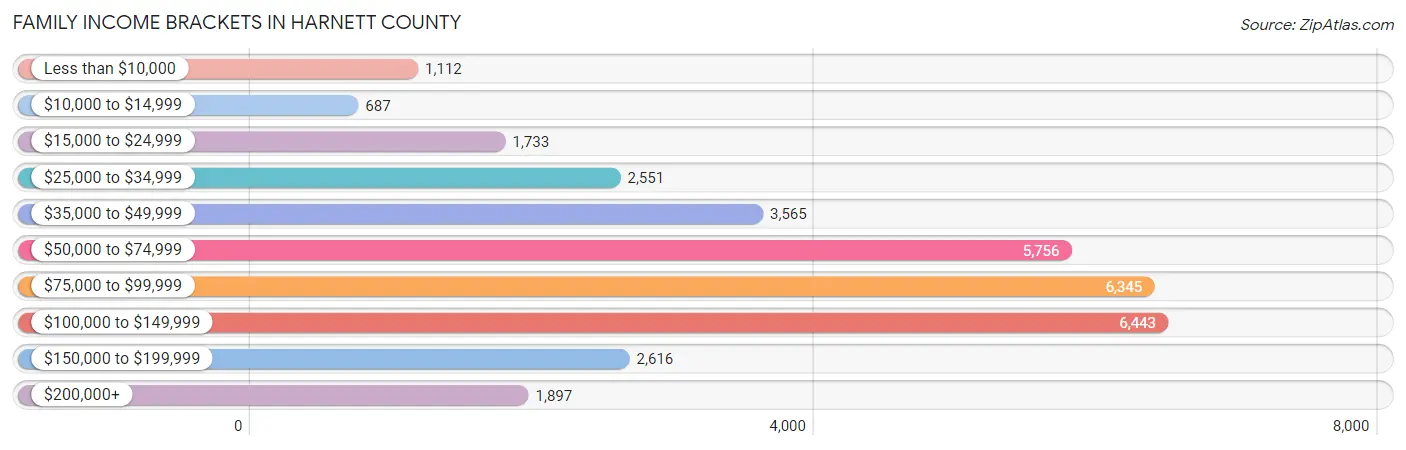
| Income Bracket | # Families | % Families |
| Less than $10,000 | 1,112 | 3.4% |
| $10,000 to $14,999 | 687 | 2.1% |
| $15,000 to $24,999 | 1,733 | 5.3% |
| $25,000 to $34,999 | 2,551 | 7.8% |
| $35,000 to $49,999 | 3,565 | 10.9% |
| $50,000 to $74,999 | 5,756 | 17.6% |
| $75,000 to $99,999 | 6,345 | 19.4% |
| $100,000 to $149,999 | 6,443 | 19.7% |
| $150,000 to $199,999 | 2,616 | 8.0% |
| $200,000+ | 1,897 | 5.8% |
Family Income by Famaliy Size in Harnett County
6-person families (997 | 3.0%) account for the highest median family income in Harnett County with $91,008 per family, while 2-person families (14,231 | 43.5%) have the highest median income of $36,194 per family member.
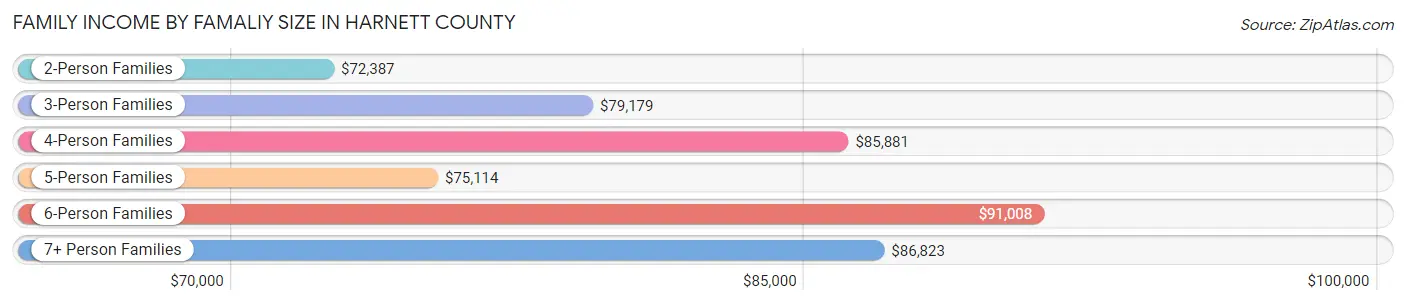
| Income Bracket | # Families | Median Income |
| 2-Person Families | 14,231 (43.5%) | $72,387 |
| 3-Person Families | 7,051 (21.6%) | $79,179 |
| 4-Person Families | 6,506 (19.9%) | $85,881 |
| 5-Person Families | 3,473 (10.6%) | $75,114 |
| 6-Person Families | 997 (3.0%) | $91,008 |
| 7+ Person Families | 447 (1.4%) | $86,823 |
| Total | 32,705 (100.0%) | $78,039 |
Family Income by Number of Earners in Harnett County
The median family income in Harnett County is $78,039, with families comprising 3+ earners (2,982) having the highest median family income of $125,603, while families with no earners (5,117) have the lowest median family income of $42,630, accounting for 9.1% and 15.7% of families, respectively.
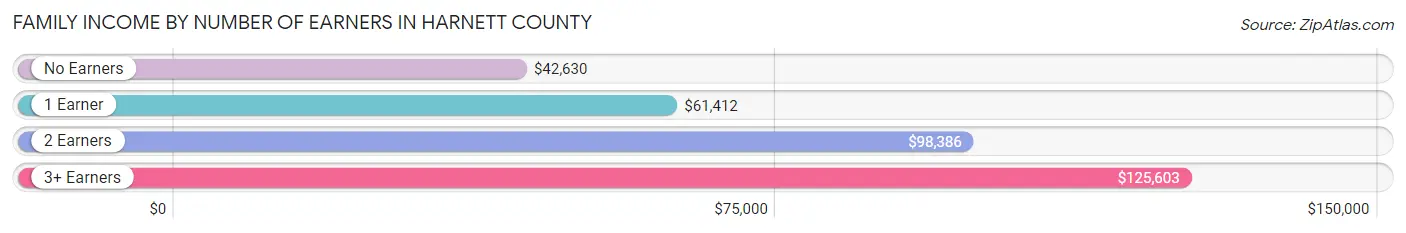
| Number of Earners | # Families | Median Income |
| No Earners | 5,117 (15.7%) | $42,630 |
| 1 Earner | 11,801 (36.1%) | $61,412 |
| 2 Earners | 12,805 (39.2%) | $98,386 |
| 3+ Earners | 2,982 (9.1%) | $125,603 |
| Total | 32,705 (100.0%) | $78,039 |
Household Income in Harnett County
Household Income Brackets in Harnett County
With 8,377 households falling in the category, the $50,000 to $74,999 income range is the most frequent in Harnett County, accounting for 17.5% of all households. In contrast, only 2,106 households (4.4%) fall into the $10,000 to $14,999 income bracket, making it the least populous group.
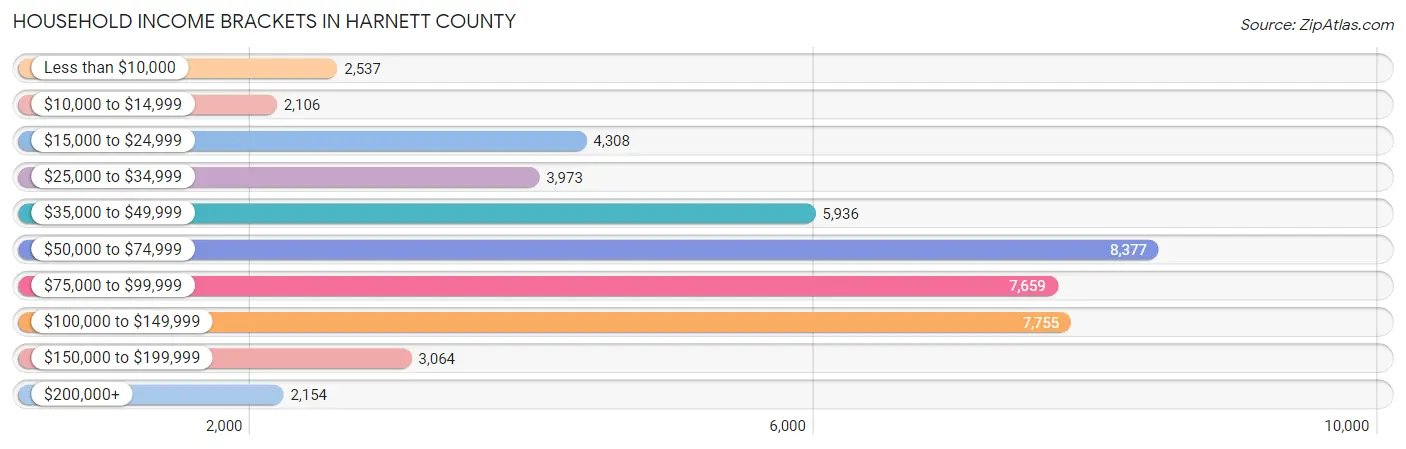
| Income Bracket | # Households | % Households |
| Less than $10,000 | 2,537 | 5.3% |
| $10,000 to $14,999 | 2,106 | 4.4% |
| $15,000 to $24,999 | 4,308 | 9.0% |
| $25,000 to $34,999 | 3,973 | 8.3% |
| $35,000 to $49,999 | 5,936 | 12.4% |
| $50,000 to $74,999 | 8,377 | 17.5% |
| $75,000 to $99,999 | 7,659 | 16.0% |
| $100,000 to $149,999 | 7,755 | 16.2% |
| $150,000 to $199,999 | 3,064 | 6.4% |
| $200,000+ | 2,154 | 4.5% |
Household Income by Householder Age in Harnett County
The median household income in Harnett County is $64,992, with the highest median household income of $75,100 found in the 25 to 44 years age bracket for the primary householder. A total of 18,674 households (39.0%) fall into this category. Meanwhile, the 15 to 24 years age bracket for the primary householder has the lowest median household income of $38,760, with 1,449 households (3.0%) in this group.
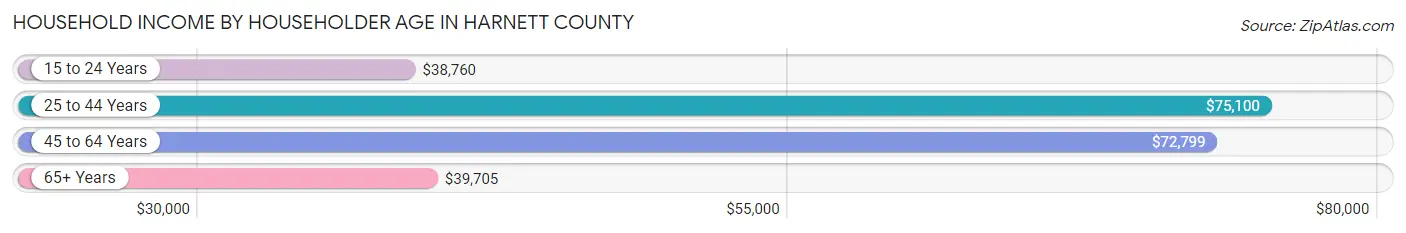
| Income Bracket | # Households | Median Income |
| 15 to 24 Years | 1,449 (3.0%) | $38,760 |
| 25 to 44 Years | 18,674 (39.0%) | $75,100 |
| 45 to 64 Years | 17,011 (35.5%) | $72,799 |
| 65+ Years | 10,736 (22.4%) | $39,705 |
| Total | 47,870 (100.0%) | $64,992 |
Poverty in Harnett County
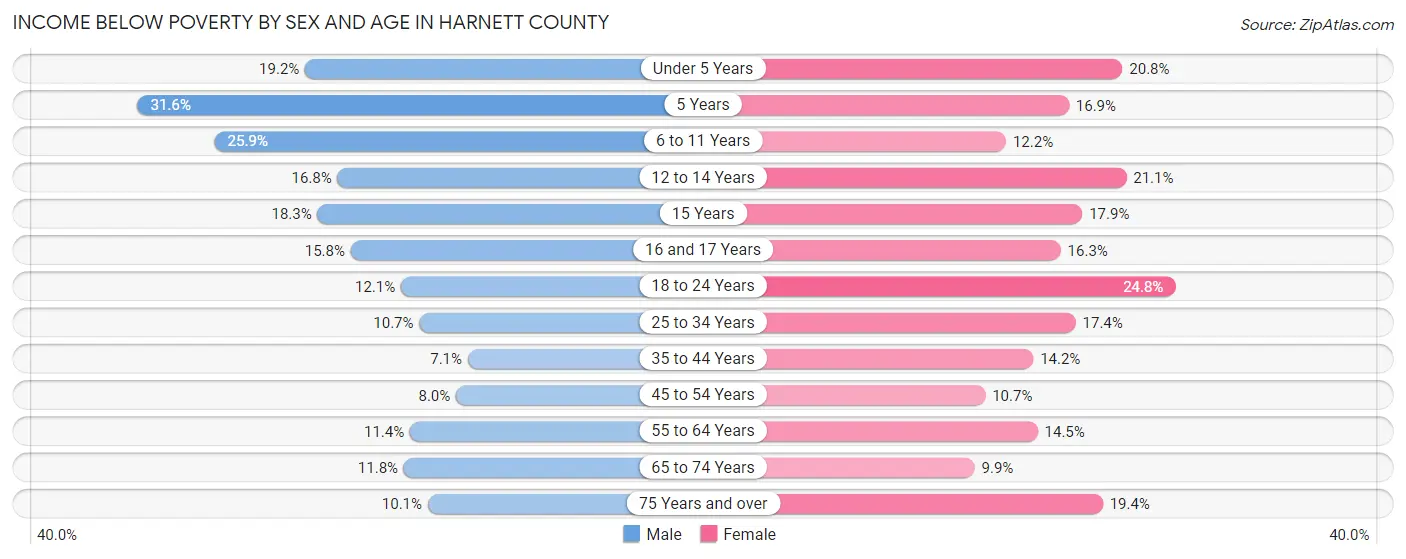
Income Below Poverty by Sex and Age in Harnett County
With 13.0% poverty level for males and 15.8% for females among the residents of Harnett County, 5 year old males and 18 to 24 year old females are the most vulnerable to poverty, with 343 males (31.6%) and 1,322 females (24.7%) in their respective age groups living below the poverty level.
| Age Bracket | Male | Female |
| Under 5 Years | 940 (19.2%) | 948 (20.8%) |
| 5 Years | 343 (31.6%) | 157 (16.9%) |
| 6 to 11 Years | 1,491 (25.9%) | 703 (12.2%) |
| 12 to 14 Years | 513 (16.8%) | 569 (21.1%) |
| 15 Years | 186 (18.2%) | 131 (17.8%) |
| 16 and 17 Years | 266 (15.8%) | 300 (16.3%) |
| 18 to 24 Years | 603 (12.0%) | 1,322 (24.7%) |
| 25 to 34 Years | 1,104 (10.7%) | 1,765 (17.4%) |
| 35 to 44 Years | 661 (7.1%) | 1,303 (14.2%) |
| 45 to 54 Years | 638 (8.0%) | 850 (10.6%) |
| 55 to 64 Years | 832 (11.4%) | 1,102 (14.5%) |
| 65 to 74 Years | 574 (11.8%) | 553 (9.9%) |
| 75 Years and over | 274 (10.1%) | 765 (19.4%) |
| Total | 8,425 (13.0%) | 10,468 (15.8%) |
Income Above Poverty by Sex and Age in Harnett County
According to the poverty statistics in Harnett County, males aged 35 to 44 years and females aged 65 to 74 years are the age groups that are most secure financially, with 92.9% of males and 90.1% of females in these age groups living above the poverty line.

| Age Bracket | Male | Female |
| Under 5 Years | 3,964 (80.8%) | 3,603 (79.2%) |
| 5 Years | 742 (68.4%) | 774 (83.1%) |
| 6 to 11 Years | 4,267 (74.1%) | 5,065 (87.8%) |
| 12 to 14 Years | 2,547 (83.2%) | 2,125 (78.9%) |
| 15 Years | 833 (81.8%) | 603 (82.2%) |
| 16 and 17 Years | 1,420 (84.2%) | 1,546 (83.8%) |
| 18 to 24 Years | 4,401 (87.9%) | 4,019 (75.2%) |
| 25 to 34 Years | 9,219 (89.3%) | 8,400 (82.6%) |
| 35 to 44 Years | 8,661 (92.9%) | 7,865 (85.8%) |
| 45 to 54 Years | 7,380 (92.0%) | 7,133 (89.3%) |
| 55 to 64 Years | 6,482 (88.6%) | 6,478 (85.5%) |
| 65 to 74 Years | 4,274 (88.2%) | 5,055 (90.1%) |
| 75 Years and over | 2,451 (89.9%) | 3,184 (80.6%) |
| Total | 56,641 (87.1%) | 55,850 (84.2%) |
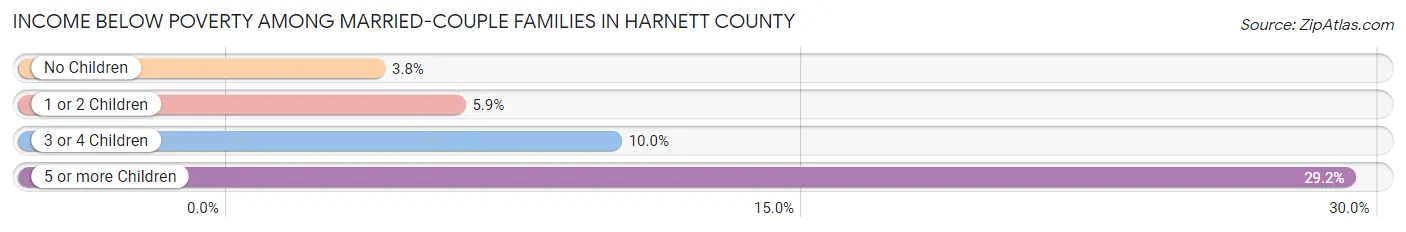
Income Below Poverty Among Married-Couple Families in Harnett County
The poverty statistics for married-couple families in Harnett County show that 5.4% or 1,317 of the total 24,356 families live below the poverty line. Families with 5 or more children have the highest poverty rate of 29.2%, comprising of 33 families. On the other hand, families with no children have the lowest poverty rate of 3.8%, which includes 499 families.
| Children | Above Poverty | Below Poverty |
| No Children | 12,482 (96.2%) | 499 (3.8%) |
| 1 or 2 Children | 7,928 (94.1%) | 501 (5.9%) |
| 3 or 4 Children | 2,549 (90.0%) | 284 (10.0%) |
| 5 or more Children | 80 (70.8%) | 33 (29.2%) |
| Total | 23,039 (94.6%) | 1,317 (5.4%) |
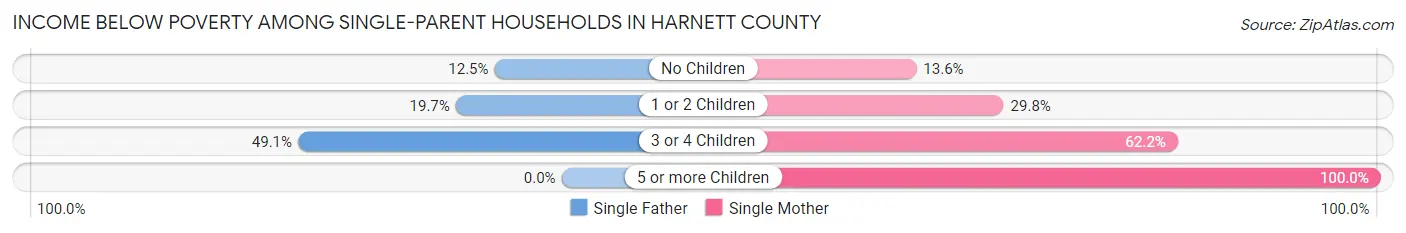
Income Below Poverty Among Single-Parent Households in Harnett County
According to the poverty data in Harnett County, 21.0% or 519 single-father households and 29.6% or 1,744 single-mother households are living below the poverty line. Among single-father households, those with 3 or 4 children have the highest poverty rate, with 164 households (49.1%) experiencing poverty. Likewise, among single-mother households, those with 5 or more children have the highest poverty rate, with 98 households (100.0%) falling below the poverty line.
| Children | Single Father | Single Mother |
| No Children | 114 (12.5%) | 278 (13.6%) |
| 1 or 2 Children | 241 (19.7%) | 876 (29.8%) |
| 3 or 4 Children | 164 (49.1%) | 492 (62.2%) |
| 5 or more Children | 0 (0.0%) | 98 (100.0%) |
| Total | 519 (21.0%) | 1,744 (29.6%) |
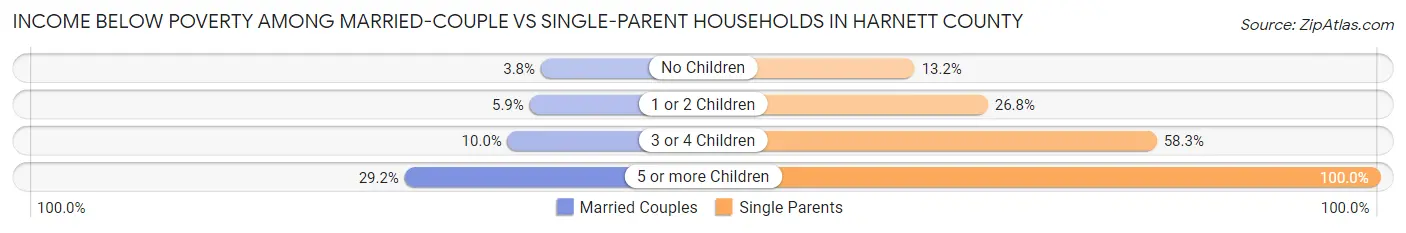
Income Below Poverty Among Married-Couple vs Single-Parent Households in Harnett County
The poverty data for Harnett County shows that 1,317 of the married-couple family households (5.4%) and 2,263 of the single-parent households (27.1%) are living below the poverty level. Within the married-couple family households, those with 5 or more children have the highest poverty rate, with 33 households (29.2%) falling below the poverty line. Among the single-parent households, those with 5 or more children have the highest poverty rate, with 98 household (100.0%) living below poverty.
| Children | Married-Couple Families | Single-Parent Households |
| No Children | 499 (3.8%) | 392 (13.2%) |
| 1 or 2 Children | 501 (5.9%) | 1,117 (26.8%) |
| 3 or 4 Children | 284 (10.0%) | 656 (58.3%) |
| 5 or more Children | 33 (29.2%) | 98 (100.0%) |
| Total | 1,317 (5.4%) | 2,263 (27.1%) |
Employment Characteristics in Harnett County
Employment by Class of Employer in Harnett County
Among the 57,835 employed individuals in Harnett County, private company employees (36,528 | 63.2%), federal government employees (7,884 | 13.6%), and state government employees (3,222 | 5.6%) make up the most common classes of employment.
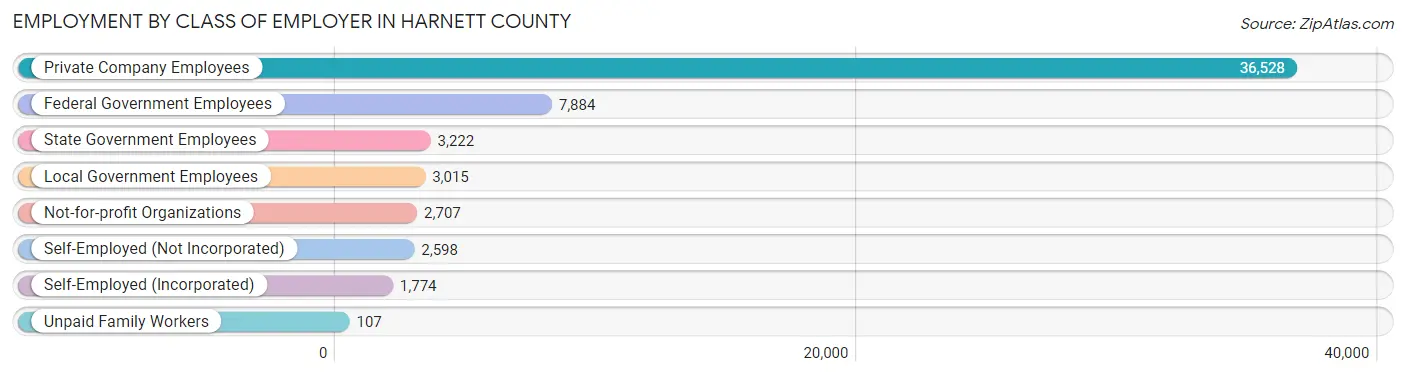
| Employer Class | # Employees | % Employees |
| Private Company Employees | 36,528 | 63.2% |
| Self-Employed (Incorporated) | 1,774 | 3.1% |
| Self-Employed (Not Incorporated) | 2,598 | 4.5% |
| Not-for-profit Organizations | 2,707 | 4.7% |
| Local Government Employees | 3,015 | 5.2% |
| State Government Employees | 3,222 | 5.6% |
| Federal Government Employees | 7,884 | 13.6% |
| Unpaid Family Workers | 107 | 0.2% |
| Total | 57,835 | 100.0% |
Employment Status by Age in Harnett County
According to the labor force statistics for Harnett County, out of the total population over 16 years of age (103,882), 59.6% or 61,914 individuals are in the labor force, with 5.3% or 3,281 of them unemployed. The age group with the highest labor force participation rate is 35 to 44 years, with 79.6% or 14,929 individuals in the labor force. Within the labor force, the 16 to 19 years age range has the highest percentage of unemployed individuals, with 10.2% or 281 of them being unemployed.
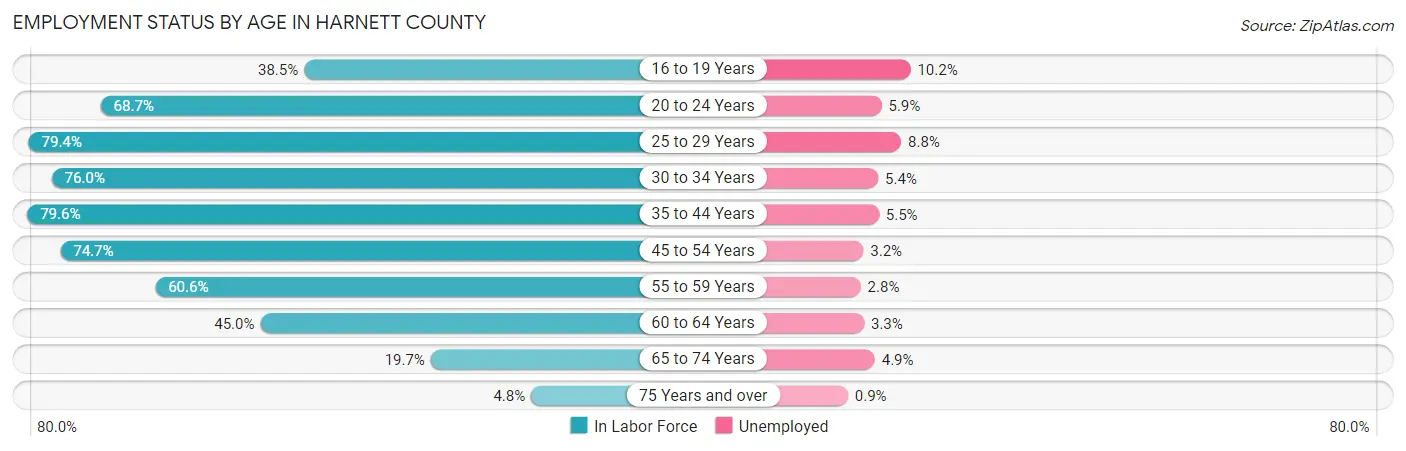
| Age Bracket | In Labor Force | Unemployed |
| 16 to 19 Years | 2,755 (38.5%) | 281 (10.2%) |
| 20 to 24 Years | 5,629 (68.7%) | 332 (5.9%) |
| 25 to 29 Years | 7,907 (79.4%) | 696 (8.8%) |
| 30 to 34 Years | 8,144 (76.0%) | 440 (5.4%) |
| 35 to 44 Years | 14,929 (79.6%) | 821 (5.5%) |
| 45 to 54 Years | 12,163 (74.7%) | 389 (3.2%) |
| 55 to 59 Years | 4,587 (60.6%) | 128 (2.8%) |
| 60 to 64 Years | 3,380 (45.0%) | 112 (3.3%) |
| 65 to 74 Years | 2,097 (19.7%) | 103 (4.9%) |
| 75 Years and over | 341 (4.8%) | 3 (0.9%) |
| Total | 61,914 (59.6%) | 3,281 (5.3%) |
Employment Status by Educational Attainment in Harnett County
According to labor force statistics for Harnett County, 72.2% of individuals (51,112) out of the total population between 25 and 64 years of age (70,792) are in the labor force, with 4.9% or 2,504 of them being unemployed. The group with the highest labor force participation rate are those with the educational attainment of bachelor's degree or higher, with 82.9% or 14,402 individuals in the labor force. Within the labor force, individuals with less than high school education have the highest percentage of unemployment, with 5.8% or 226 of them being unemployed.

| Educational Attainment | In Labor Force | Unemployed |
| Less than High School | 3,889 (54.1%) | 417 (5.8%) |
| High School Diploma | 13,085 (66.8%) | 1,019 (5.2%) |
| College / Associate Degree | 19,742 (74.1%) | 1,412 (5.3%) |
| Bachelor's Degree or higher | 14,402 (82.9%) | 678 (3.9%) |
| Total | 51,112 (72.2%) | 3,469 (4.9%) |
Employment Occupations by Sex in Harnett County
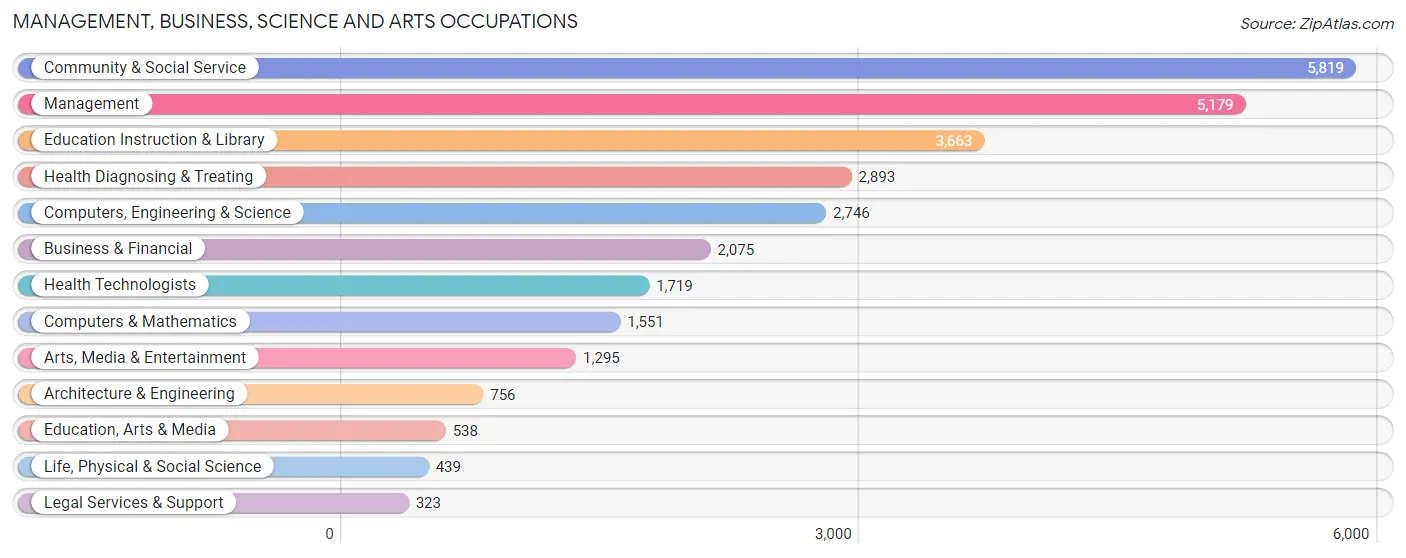
Management, Business, Science and Arts Occupations
The most common Management, Business, Science and Arts occupations in Harnett County are Community & Social Service (5,819 | 10.7%), Management (5,179 | 9.6%), Education Instruction & Library (3,663 | 6.8%), Health Diagnosing & Treating (2,893 | 5.3%), and Computers, Engineering & Science (2,746 | 5.1%).
Management, Business, Science and Arts Occupations by Sex
Within the Management, Business, Science and Arts occupations in Harnett County, the most male-oriented occupations are Computers & Mathematics (74.5%), Architecture & Engineering (71.0%), and Arts, Media & Entertainment (70.8%), while the most female-oriented occupations are Education Instruction & Library (82.8%), Health Technologists (81.9%), and Health Diagnosing & Treating (79.7%).
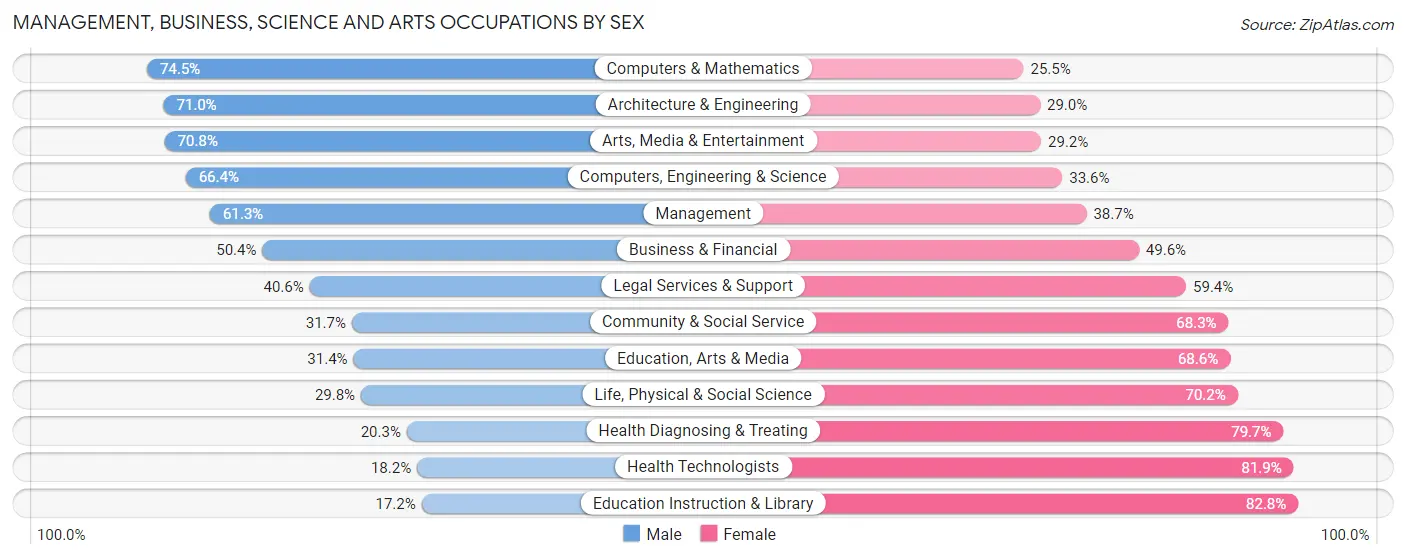
| Occupation | Male | Female |
| Management | 3,177 (61.3%) | 2,002 (38.7%) |
| Business & Financial | 1,046 (50.4%) | 1,029 (49.6%) |
| Computers, Engineering & Science | 1,823 (66.4%) | 923 (33.6%) |
| Computers & Mathematics | 1,155 (74.5%) | 396 (25.5%) |
| Architecture & Engineering | 537 (71.0%) | 219 (29.0%) |
| Life, Physical & Social Science | 131 (29.8%) | 308 (70.2%) |
| Community & Social Service | 1,847 (31.7%) | 3,972 (68.3%) |
| Education, Arts & Media | 169 (31.4%) | 369 (68.6%) |
| Legal Services & Support | 131 (40.6%) | 192 (59.4%) |
| Education Instruction & Library | 630 (17.2%) | 3,033 (82.8%) |
| Arts, Media & Entertainment | 917 (70.8%) | 378 (29.2%) |
| Health Diagnosing & Treating | 587 (20.3%) | 2,306 (79.7%) |
| Health Technologists | 312 (18.1%) | 1,407 (81.9%) |
| Total (Category) | 8,480 (45.3%) | 10,232 (54.7%) |
| Total (Overall) | 28,372 (52.4%) | 25,785 (47.6%) |
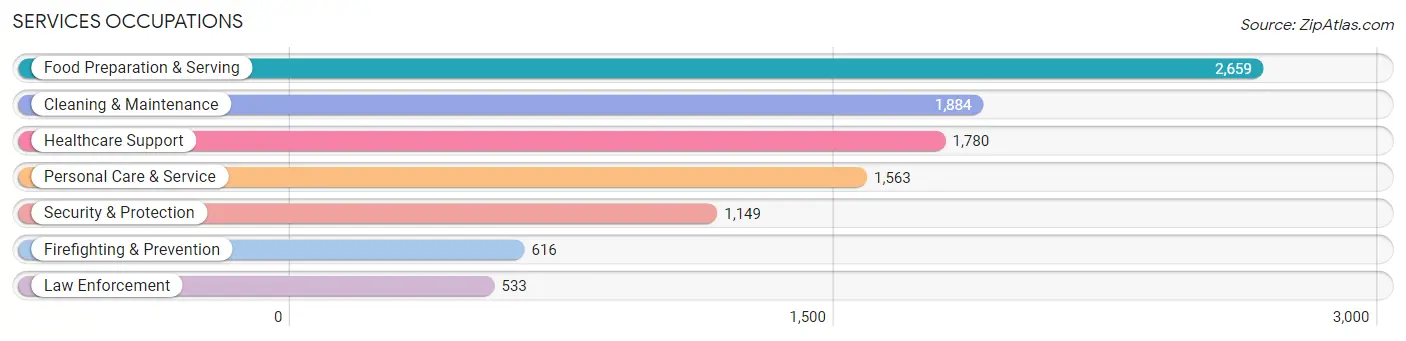
Services Occupations
The most common Services occupations in Harnett County are Food Preparation & Serving (2,659 | 4.9%), Cleaning & Maintenance (1,884 | 3.5%), Healthcare Support (1,780 | 3.3%), Personal Care & Service (1,563 | 2.9%), and Security & Protection (1,149 | 2.1%).
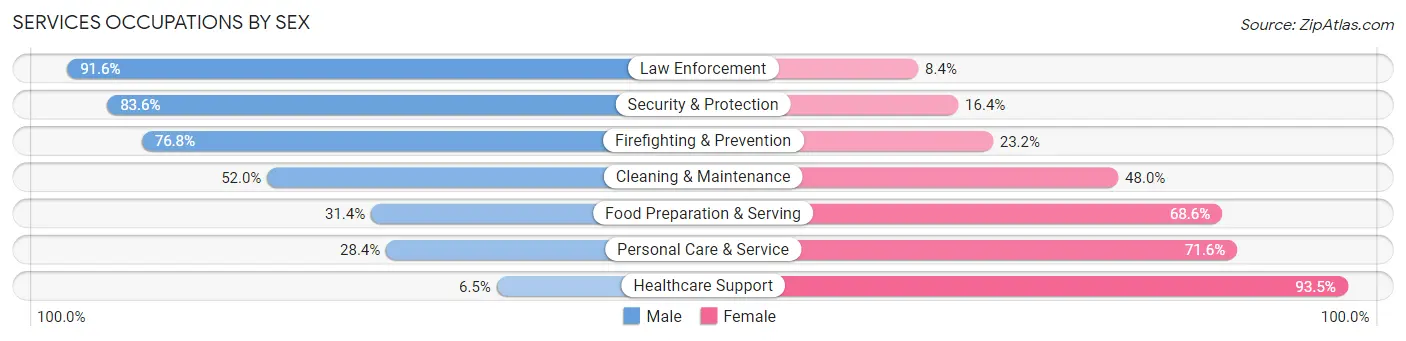
Services Occupations by Sex
Within the Services occupations in Harnett County, the most male-oriented occupations are Law Enforcement (91.6%), Security & Protection (83.6%), and Firefighting & Prevention (76.8%), while the most female-oriented occupations are Healthcare Support (93.5%), Personal Care & Service (71.6%), and Food Preparation & Serving (68.6%).
| Occupation | Male | Female |
| Healthcare Support | 116 (6.5%) | 1,664 (93.5%) |
| Security & Protection | 961 (83.6%) | 188 (16.4%) |
| Firefighting & Prevention | 473 (76.8%) | 143 (23.2%) |
| Law Enforcement | 488 (91.6%) | 45 (8.4%) |
| Food Preparation & Serving | 835 (31.4%) | 1,824 (68.6%) |
| Cleaning & Maintenance | 979 (52.0%) | 905 (48.0%) |
| Personal Care & Service | 444 (28.4%) | 1,119 (71.6%) |
| Total (Category) | 3,335 (36.9%) | 5,700 (63.1%) |
| Total (Overall) | 28,372 (52.4%) | 25,785 (47.6%) |
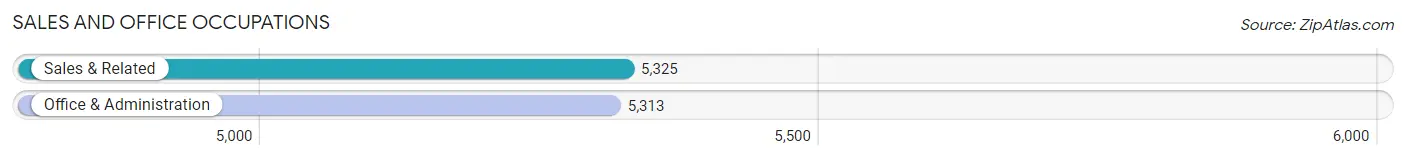
Sales and Office Occupations
The most common Sales and Office occupations in Harnett County are Sales & Related (5,325 | 9.8%), and Office & Administration (5,313 | 9.8%).
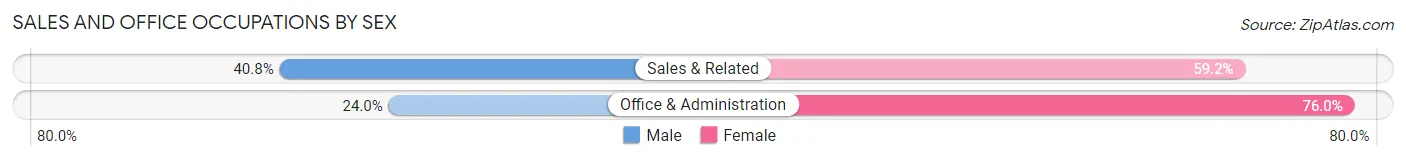
Sales and Office Occupations by Sex
| Occupation | Male | Female |
| Sales & Related | 2,172 (40.8%) | 3,153 (59.2%) |
| Office & Administration | 1,275 (24.0%) | 4,038 (76.0%) |
| Total (Category) | 3,447 (32.4%) | 7,191 (67.6%) |
| Total (Overall) | 28,372 (52.4%) | 25,785 (47.6%) |
Natural Resources, Construction and Maintenance Occupations
The most common Natural Resources, Construction and Maintenance occupations in Harnett County are Construction & Extraction (4,296 | 7.9%), Installation, Maintenance & Repair (2,177 | 4.0%), and Farming, Fishing & Forestry (337 | 0.6%).

Natural Resources, Construction and Maintenance Occupations by Sex
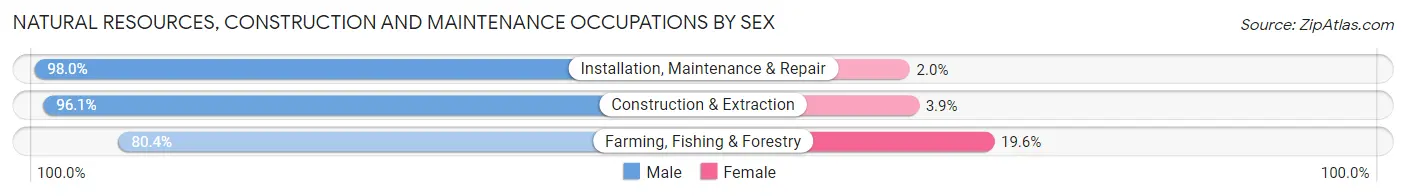
| Occupation | Male | Female |
| Farming, Fishing & Forestry | 271 (80.4%) | 66 (19.6%) |
| Construction & Extraction | 4,128 (96.1%) | 168 (3.9%) |
| Installation, Maintenance & Repair | 2,133 (98.0%) | 44 (2.0%) |
| Total (Category) | 6,532 (95.9%) | 278 (4.1%) |
| Total (Overall) | 28,372 (52.4%) | 25,785 (47.6%) |
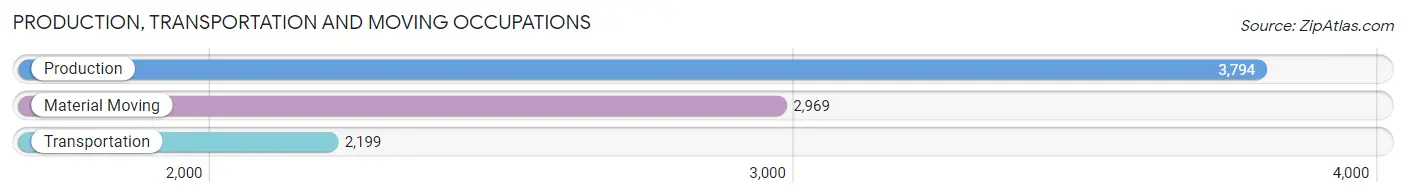
Production, Transportation and Moving Occupations
The most common Production, Transportation and Moving occupations in Harnett County are Production (3,794 | 7.0%), Material Moving (2,969 | 5.5%), and Transportation (2,199 | 4.1%).
Production, Transportation and Moving Occupations by Sex
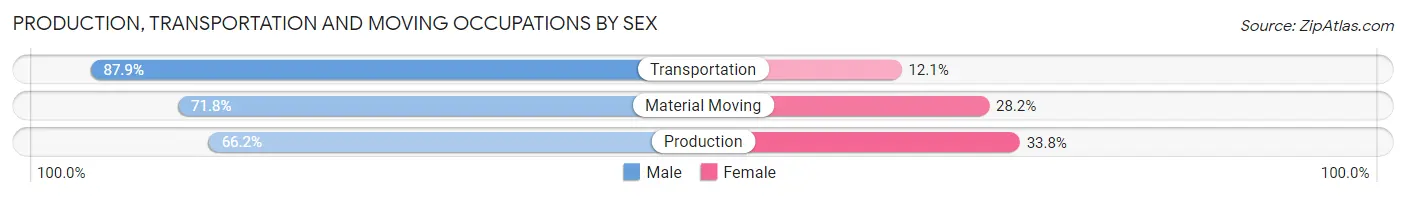
| Occupation | Male | Female |
| Production | 2,512 (66.2%) | 1,282 (33.8%) |
| Transportation | 1,933 (87.9%) | 266 (12.1%) |
| Material Moving | 2,133 (71.8%) | 836 (28.2%) |
| Total (Category) | 6,578 (73.4%) | 2,384 (26.6%) |
| Total (Overall) | 28,372 (52.4%) | 25,785 (47.6%) |
Employment Industries by Sex in Harnett County
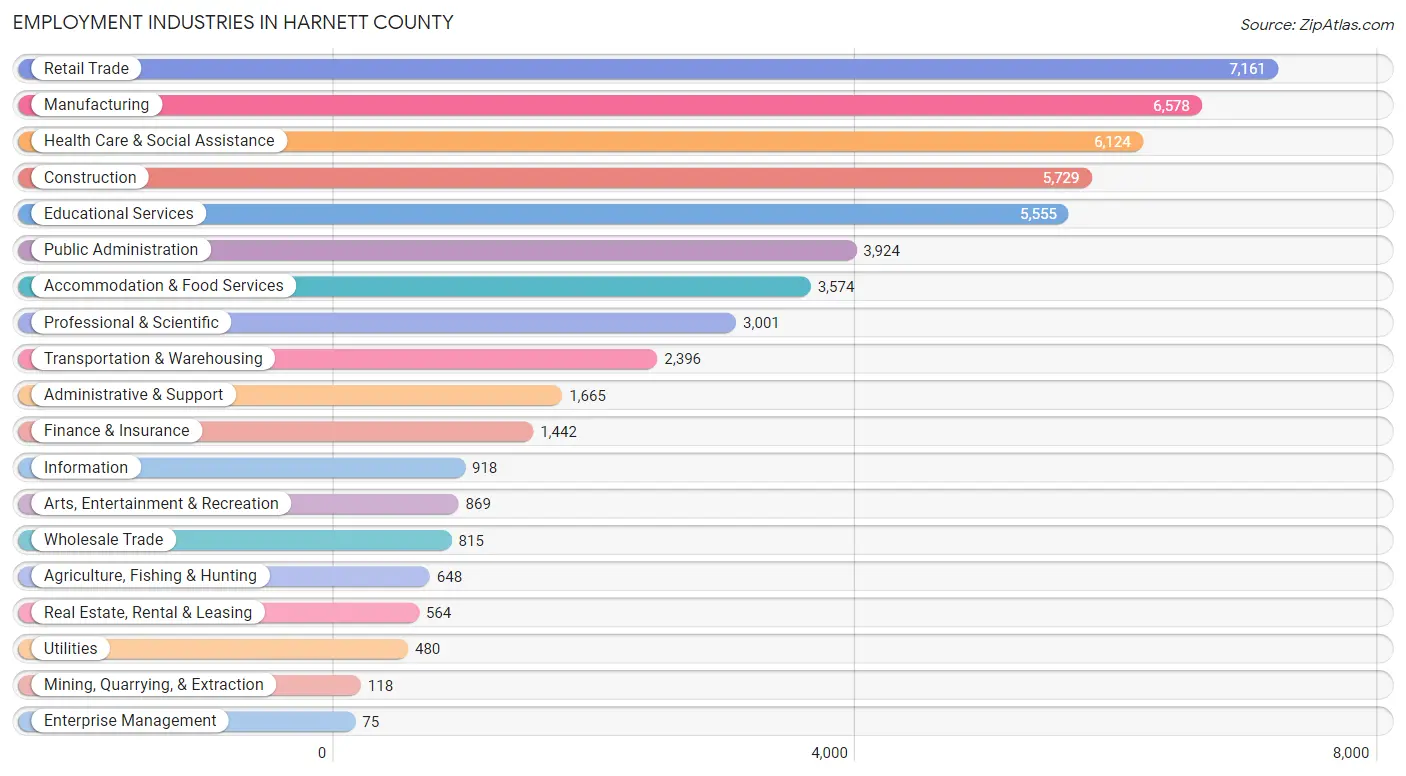
Employment Industries in Harnett County
The major employment industries in Harnett County include Retail Trade (7,161 | 13.2%), Manufacturing (6,578 | 12.1%), Health Care & Social Assistance (6,124 | 11.3%), Construction (5,729 | 10.6%), and Educational Services (5,555 | 10.3%).
Employment Industries by Sex in Harnett County
The Harnett County industries that see more men than women are Mining, Quarrying, & Extraction (100.0%), Construction (91.8%), and Utilities (90.4%), whereas the industries that tend to have a higher number of women are Enterprise Management (94.7%), Health Care & Social Assistance (85.1%), and Educational Services (74.9%).
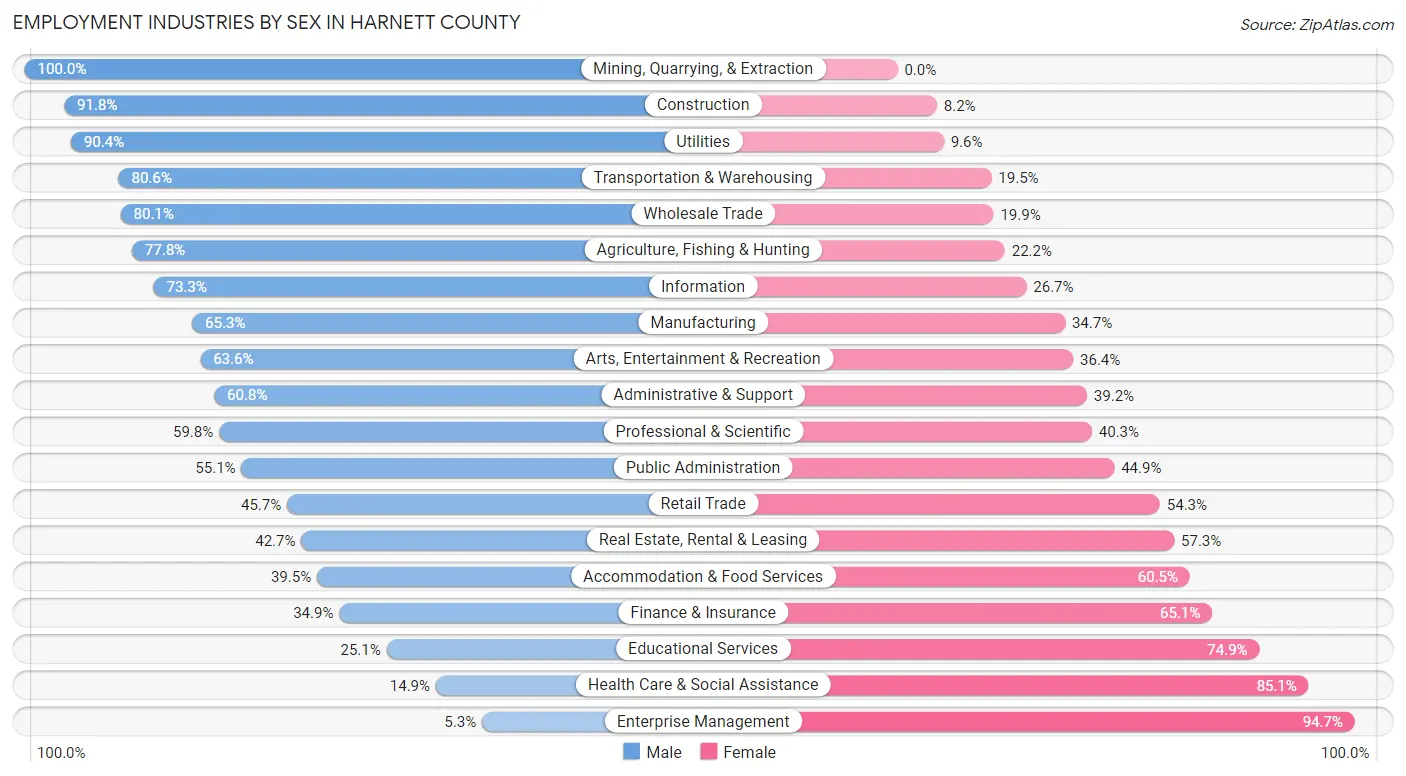
| Industry | Male | Female |
| Agriculture, Fishing & Hunting | 504 (77.8%) | 144 (22.2%) |
| Mining, Quarrying, & Extraction | 118 (100.0%) | 0 (0.0%) |
| Construction | 5,261 (91.8%) | 468 (8.2%) |
| Manufacturing | 4,297 (65.3%) | 2,281 (34.7%) |
| Wholesale Trade | 653 (80.1%) | 162 (19.9%) |
| Retail Trade | 3,271 (45.7%) | 3,890 (54.3%) |
| Transportation & Warehousing | 1,930 (80.5%) | 466 (19.5%) |
| Utilities | 434 (90.4%) | 46 (9.6%) |
| Information | 673 (73.3%) | 245 (26.7%) |
| Finance & Insurance | 503 (34.9%) | 939 (65.1%) |
| Real Estate, Rental & Leasing | 241 (42.7%) | 323 (57.3%) |
| Professional & Scientific | 1,793 (59.8%) | 1,208 (40.3%) |
| Enterprise Management | 4 (5.3%) | 71 (94.7%) |
| Administrative & Support | 1,012 (60.8%) | 653 (39.2%) |
| Educational Services | 1,393 (25.1%) | 4,162 (74.9%) |
| Health Care & Social Assistance | 911 (14.9%) | 5,213 (85.1%) |
| Arts, Entertainment & Recreation | 553 (63.6%) | 316 (36.4%) |
| Accommodation & Food Services | 1,411 (39.5%) | 2,163 (60.5%) |
| Public Administration | 2,163 (55.1%) | 1,761 (44.9%) |
| Total | 28,372 (52.4%) | 25,785 (47.6%) |
Education in Harnett County
School Enrollment in Harnett County
The most common levels of schooling among the 36,635 students in Harnett County are college / undergraduate (8,330 | 22.7%), middle school (7,791 | 21.3%), and high school (7,426 | 20.3%).
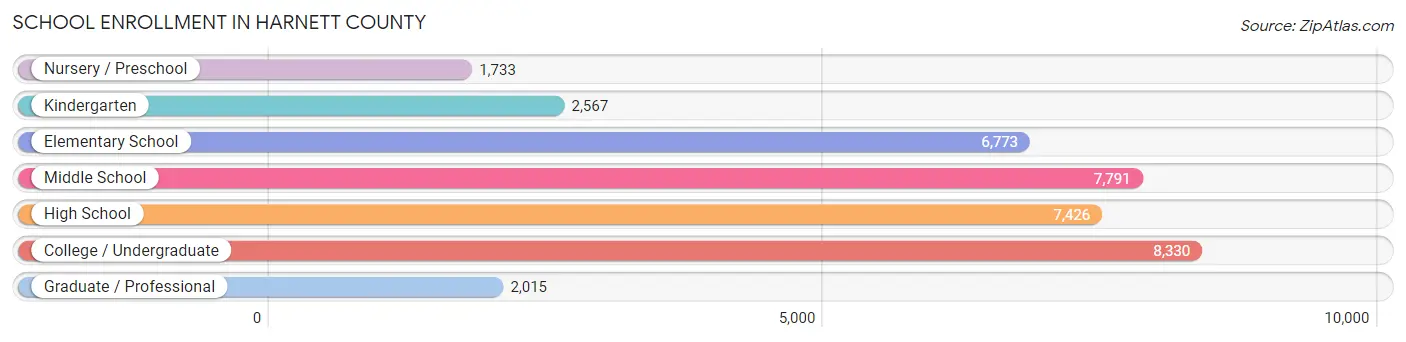
| School Level | # Students | % Students |
| Nursery / Preschool | 1,733 | 4.7% |
| Kindergarten | 2,567 | 7.0% |
| Elementary School | 6,773 | 18.5% |
| Middle School | 7,791 | 21.3% |
| High School | 7,426 | 20.3% |
| College / Undergraduate | 8,330 | 22.7% |
| Graduate / Professional | 2,015 | 5.5% |
| Total | 36,635 | 100.0% |
School Enrollment by Age by Funding Source in Harnett County
Out of a total of 36,635 students who are enrolled in schools in Harnett County, 8,646 (23.6%) attend a private institution, while the remaining 27,989 (76.4%) are enrolled in public schools. The age group of 20 to 24 year olds has the highest likelihood of being enrolled in private schools, with 1,690 (55.2% in the age bracket) enrolled. Conversely, the age group of 15 to 17 year olds has the lowest likelihood of being enrolled in a private school, with 4,467 (88.8% in the age bracket) attending a public institution.
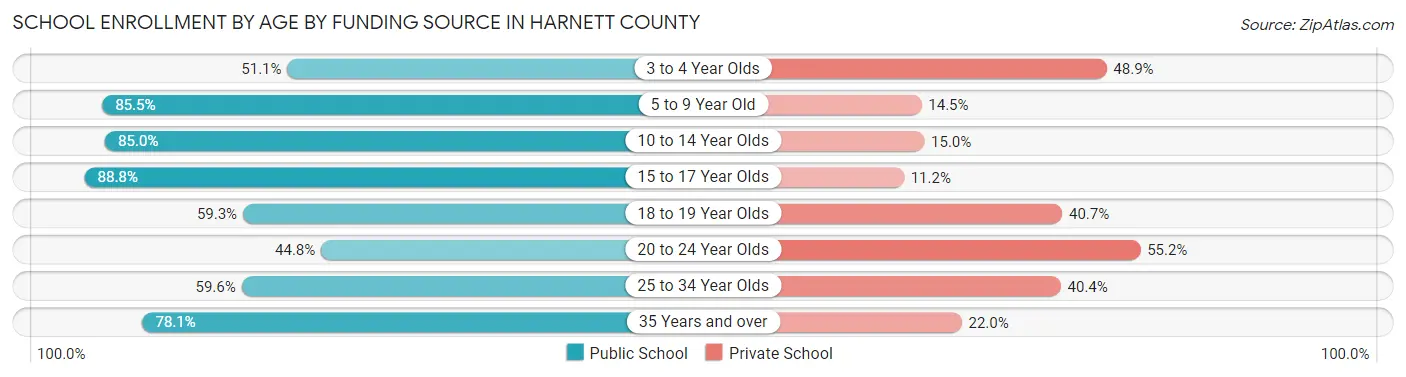
| Age Bracket | Public School | Private School |
| 3 to 4 Year Olds | 770 (51.1%) | 738 (48.9%) |
| 5 to 9 Year Old | 7,595 (85.5%) | 1,285 (14.5%) |
| 10 to 14 Year Olds | 8,227 (85.0%) | 1,450 (15.0%) |
| 15 to 17 Year Olds | 4,467 (88.8%) | 563 (11.2%) |
| 18 to 19 Year Olds | 1,542 (59.3%) | 1,057 (40.7%) |
| 20 to 24 Year Olds | 1,370 (44.8%) | 1,690 (55.2%) |
| 25 to 34 Year Olds | 1,840 (59.6%) | 1,248 (40.4%) |
| 35 Years and over | 2,180 (78.0%) | 613 (22.0%) |
| Total | 27,989 (76.4%) | 8,646 (23.6%) |
Educational Attainment by Field of Study in Harnett County
Business (4,205 | 19.7%), education (3,046 | 14.2%), arts & humanities (2,490 | 11.6%), bio, nature & agricultural (1,919 | 9.0%), and science & technology (1,880 | 8.8%) are the most common fields of study among 21,390 individuals in Harnett County who have obtained a bachelor's degree or higher.
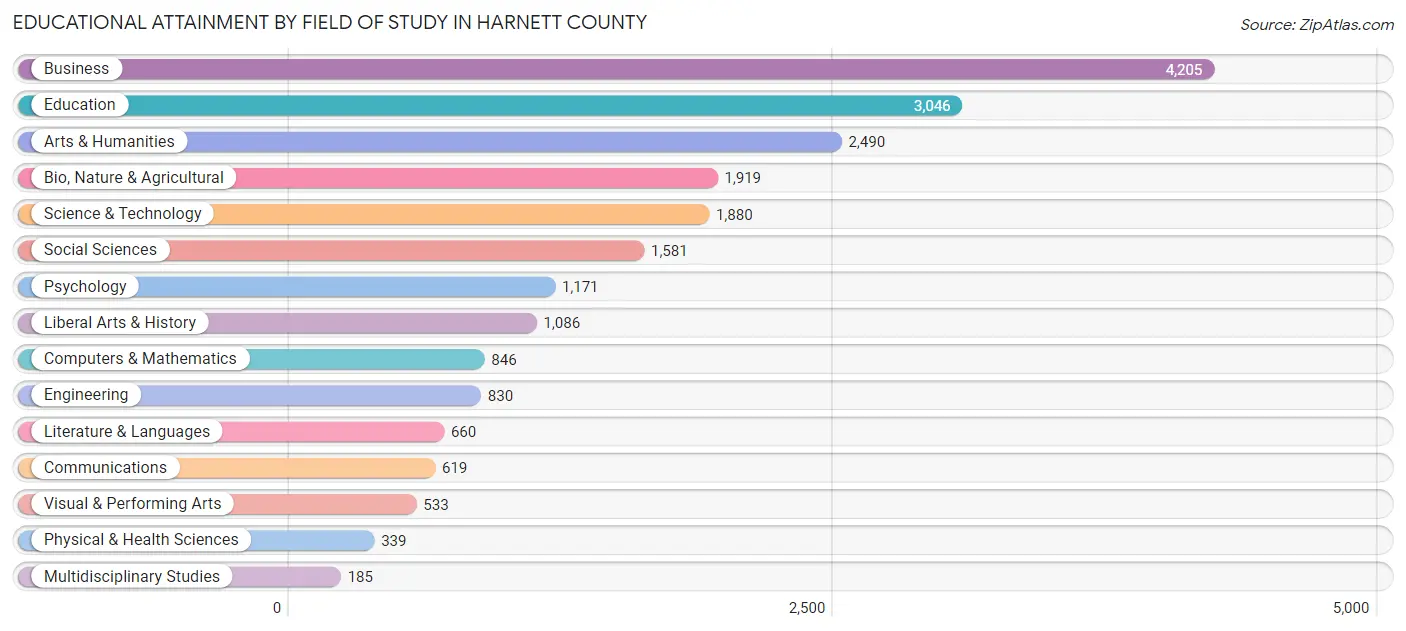
| Field of Study | # Graduates | % Graduates |
| Computers & Mathematics | 846 | 4.0% |
| Bio, Nature & Agricultural | 1,919 | 9.0% |
| Physical & Health Sciences | 339 | 1.6% |
| Psychology | 1,171 | 5.5% |
| Social Sciences | 1,581 | 7.4% |
| Engineering | 830 | 3.9% |
| Multidisciplinary Studies | 185 | 0.9% |
| Science & Technology | 1,880 | 8.8% |
| Business | 4,205 | 19.7% |
| Education | 3,046 | 14.2% |
| Literature & Languages | 660 | 3.1% |
| Liberal Arts & History | 1,086 | 5.1% |
| Visual & Performing Arts | 533 | 2.5% |
| Communications | 619 | 2.9% |
| Arts & Humanities | 2,490 | 11.6% |
| Total | 21,390 | 100.0% |
Transportation & Commute in Harnett County
Vehicle Availability by Sex in Harnett County
The most prevalent vehicle ownership categories in Harnett County are males with 2 vehicles (12,389, accounting for 39.2%) and females with 2 vehicles (8,893, making up 48.1%).
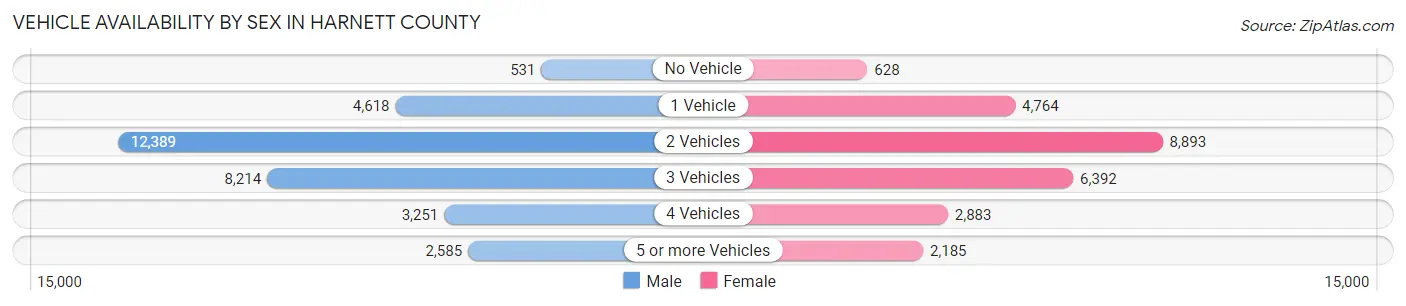
| Vehicles Available | Male | Female |
| No Vehicle | 531 (1.7%) | 628 (2.4%) |
| 1 Vehicle | 4,618 (14.6%) | 4,764 (18.5%) |
| 2 Vehicles | 12,389 (39.2%) | 8,893 (34.5%) |
| 3 Vehicles | 8,214 (26.0%) | 6,392 (24.8%) |
| 4 Vehicles | 3,251 (10.3%) | 2,883 (11.2%) |
| 5 or more Vehicles | 2,585 (8.2%) | 2,185 (8.5%) |
| Total | 31,588 (100.0%) | 25,745 (100.0%) |
Commute Time in Harnett County
The most frequently occuring commute durations in Harnett County are 30 to 34 minutes (8,045 commuters, 14.7%), 20 to 24 minutes (7,241 commuters, 13.3%), and 45 to 59 minutes (7,110 commuters, 13.0%).
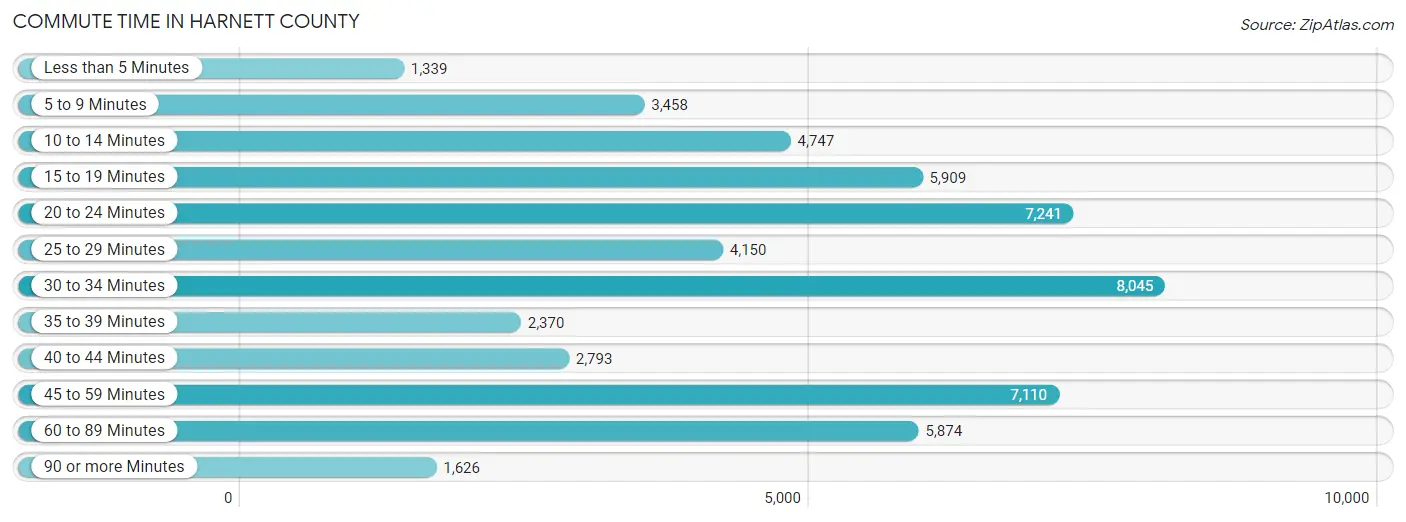
| Commute Time | # Commuters | % Commuters |
| Less than 5 Minutes | 1,339 | 2.5% |
| 5 to 9 Minutes | 3,458 | 6.3% |
| 10 to 14 Minutes | 4,747 | 8.7% |
| 15 to 19 Minutes | 5,909 | 10.8% |
| 20 to 24 Minutes | 7,241 | 13.3% |
| 25 to 29 Minutes | 4,150 | 7.6% |
| 30 to 34 Minutes | 8,045 | 14.7% |
| 35 to 39 Minutes | 2,370 | 4.3% |
| 40 to 44 Minutes | 2,793 | 5.1% |
| 45 to 59 Minutes | 7,110 | 13.0% |
| 60 to 89 Minutes | 5,874 | 10.7% |
| 90 or more Minutes | 1,626 | 3.0% |
Commute Time by Sex in Harnett County
The most common commute times in Harnett County are 30 to 34 minutes (5,015 commuters, 16.5%) for males and 45 to 59 minutes (3,393 commuters, 14.0%) for females.
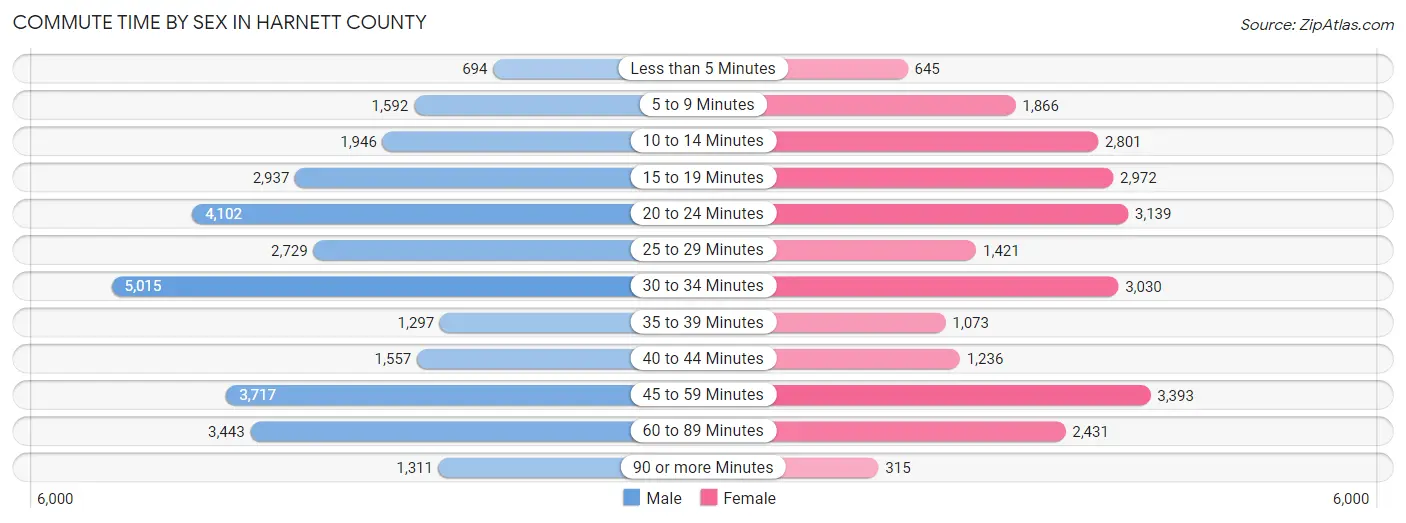
| Commute Time | Male | Female |
| Less than 5 Minutes | 694 (2.3%) | 645 (2.6%) |
| 5 to 9 Minutes | 1,592 (5.2%) | 1,866 (7.7%) |
| 10 to 14 Minutes | 1,946 (6.4%) | 2,801 (11.5%) |
| 15 to 19 Minutes | 2,937 (9.7%) | 2,972 (12.2%) |
| 20 to 24 Minutes | 4,102 (13.5%) | 3,139 (12.9%) |
| 25 to 29 Minutes | 2,729 (9.0%) | 1,421 (5.8%) |
| 30 to 34 Minutes | 5,015 (16.5%) | 3,030 (12.5%) |
| 35 to 39 Minutes | 1,297 (4.3%) | 1,073 (4.4%) |
| 40 to 44 Minutes | 1,557 (5.1%) | 1,236 (5.1%) |
| 45 to 59 Minutes | 3,717 (12.2%) | 3,393 (14.0%) |
| 60 to 89 Minutes | 3,443 (11.4%) | 2,431 (10.0%) |
| 90 or more Minutes | 1,311 (4.3%) | 315 (1.3%) |
Time of Departure to Work by Sex in Harnett County
The most frequent times of departure to work in Harnett County are 6:00 AM to 6:29 AM (4,249, 14.0%) for males and 7:00 AM to 7:29 AM (4,315, 17.7%) for females.
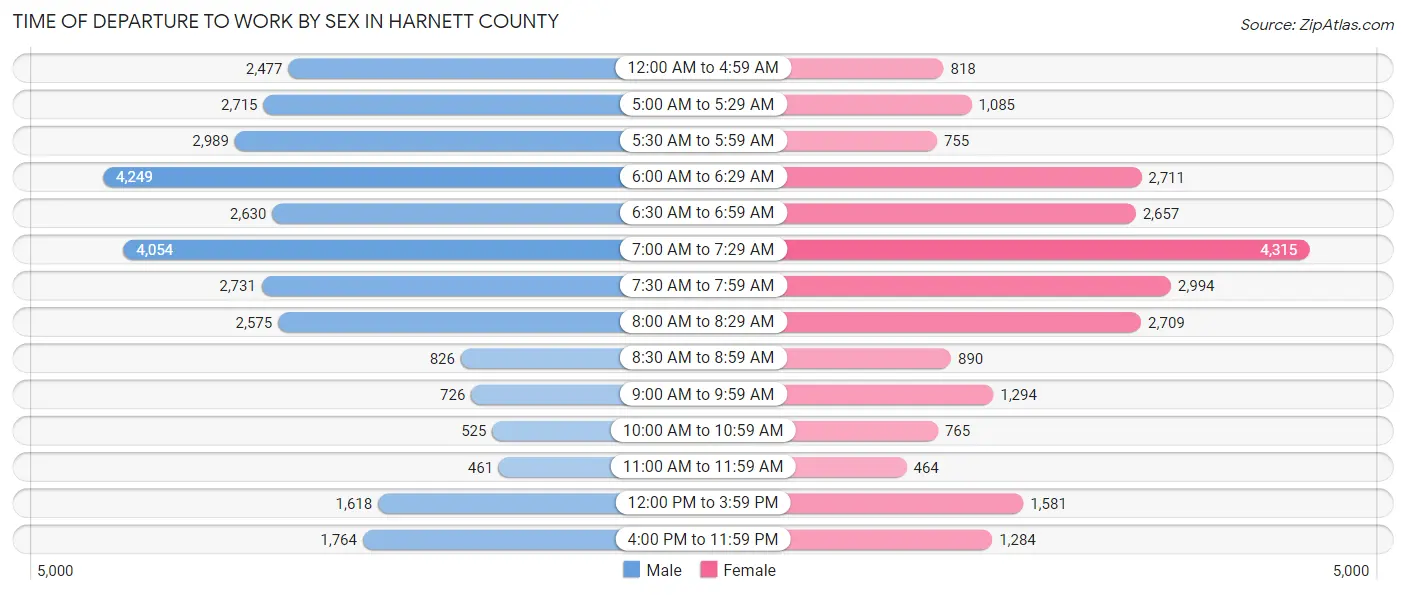
| Time of Departure | Male | Female |
| 12:00 AM to 4:59 AM | 2,477 (8.2%) | 818 (3.4%) |
| 5:00 AM to 5:29 AM | 2,715 (8.9%) | 1,085 (4.5%) |
| 5:30 AM to 5:59 AM | 2,989 (9.9%) | 755 (3.1%) |
| 6:00 AM to 6:29 AM | 4,249 (14.0%) | 2,711 (11.2%) |
| 6:30 AM to 6:59 AM | 2,630 (8.7%) | 2,657 (10.9%) |
| 7:00 AM to 7:29 AM | 4,054 (13.4%) | 4,315 (17.7%) |
| 7:30 AM to 7:59 AM | 2,731 (9.0%) | 2,994 (12.3%) |
| 8:00 AM to 8:29 AM | 2,575 (8.5%) | 2,709 (11.1%) |
| 8:30 AM to 8:59 AM | 826 (2.7%) | 890 (3.7%) |
| 9:00 AM to 9:59 AM | 726 (2.4%) | 1,294 (5.3%) |
| 10:00 AM to 10:59 AM | 525 (1.7%) | 765 (3.2%) |
| 11:00 AM to 11:59 AM | 461 (1.5%) | 464 (1.9%) |
| 12:00 PM to 3:59 PM | 1,618 (5.3%) | 1,581 (6.5%) |
| 4:00 PM to 11:59 PM | 1,764 (5.8%) | 1,284 (5.3%) |
| Total | 30,340 (100.0%) | 24,322 (100.0%) |
Housing Occupancy in Harnett County
Occupancy by Ownership in Harnett County
Of the total 47,870 dwellings in Harnett County, owner-occupied units account for 32,728 (68.4%), while renter-occupied units make up 15,142 (31.6%).

| Occupancy | # Housing Units | % Housing Units |
| Owner Occupied Housing Units | 32,728 | 68.4% |
| Renter-Occupied Housing Units | 15,142 | 31.6% |
| Total Occupied Housing Units | 47,870 | 100.0% |
Occupancy by Household Size in Harnett County
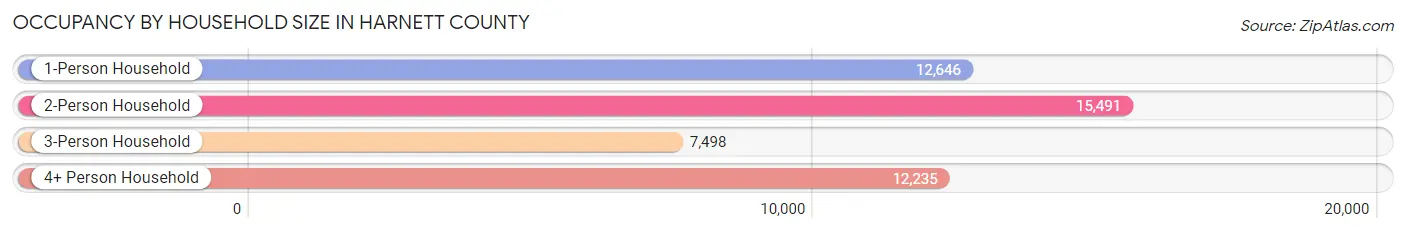
| Household Size | # Housing Units | % Housing Units |
| 1-Person Household | 12,646 | 26.4% |
| 2-Person Household | 15,491 | 32.4% |
| 3-Person Household | 7,498 | 15.7% |
| 4+ Person Household | 12,235 | 25.6% |
| Total Housing Units | 47,870 | 100.0% |
Occupancy by Ownership by Household Size in Harnett County
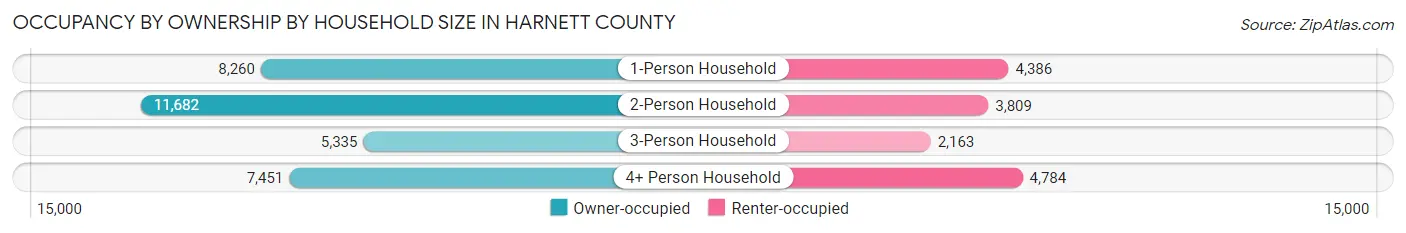
| Household Size | Owner-occupied | Renter-occupied |
| 1-Person Household | 8,260 (65.3%) | 4,386 (34.7%) |
| 2-Person Household | 11,682 (75.4%) | 3,809 (24.6%) |
| 3-Person Household | 5,335 (71.2%) | 2,163 (28.8%) |
| 4+ Person Household | 7,451 (60.9%) | 4,784 (39.1%) |
| Total Housing Units | 32,728 (68.4%) | 15,142 (31.6%) |
Occupancy by Educational Attainment in Harnett County
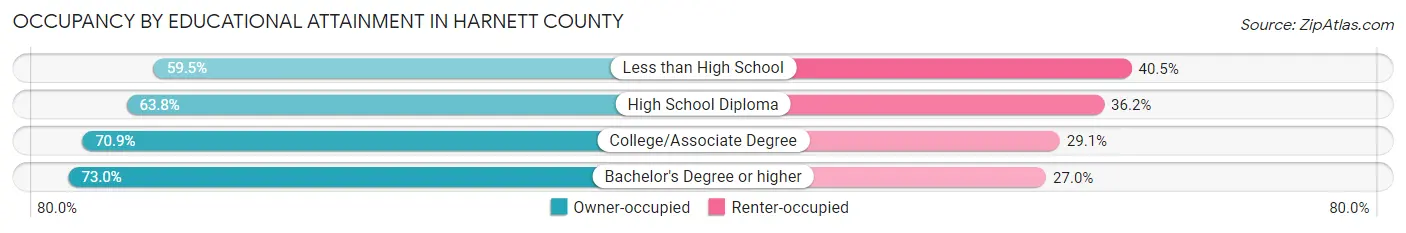
| Household Size | Owner-occupied | Renter-occupied |
| Less than High School | 3,124 (59.5%) | 2,127 (40.5%) |
| High School Diploma | 7,843 (63.8%) | 4,443 (36.2%) |
| College/Associate Degree | 12,787 (70.9%) | 5,259 (29.1%) |
| Bachelor's Degree or higher | 8,974 (73.0%) | 3,313 (27.0%) |
Occupancy by Age of Householder in Harnett County
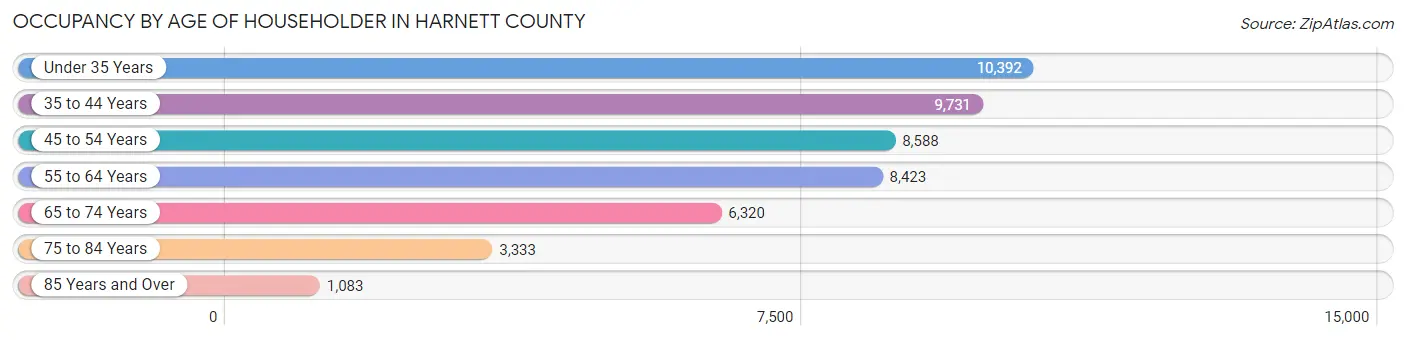
| Age Bracket | # Households | % Households |
| Under 35 Years | 10,392 | 21.7% |
| 35 to 44 Years | 9,731 | 20.3% |
| 45 to 54 Years | 8,588 | 17.9% |
| 55 to 64 Years | 8,423 | 17.6% |
| 65 to 74 Years | 6,320 | 13.2% |
| 75 to 84 Years | 3,333 | 7.0% |
| 85 Years and Over | 1,083 | 2.3% |
| Total | 47,870 | 100.0% |
Housing Finances in Harnett County
Median Income by Occupancy in Harnett County
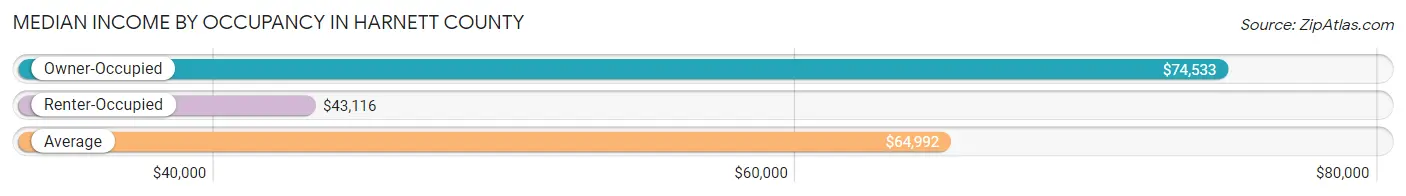
| Occupancy Type | # Households | Median Income |
| Owner-Occupied | 32,728 (68.4%) | $74,533 |
| Renter-Occupied | 15,142 (31.6%) | $43,116 |
| Average | 47,870 (100.0%) | $64,992 |
Occupancy by Householder Income Bracket in Harnett County
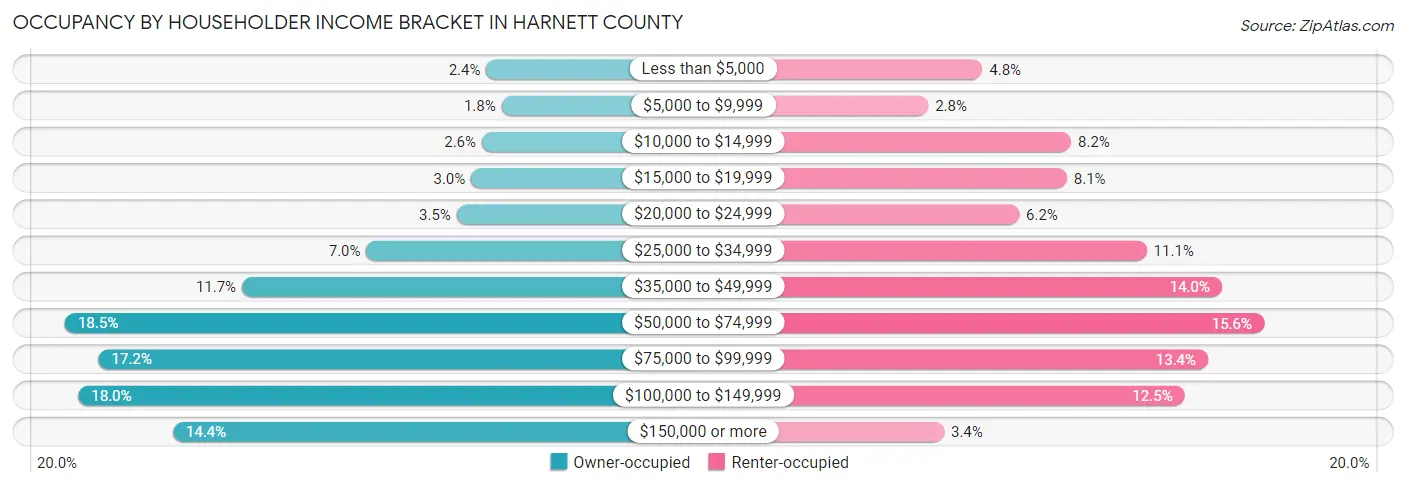
| Income Bracket | Owner-occupied | Renter-occupied |
| Less than $5,000 | 788 (2.4%) | 731 (4.8%) |
| $5,000 to $9,999 | 598 (1.8%) | 420 (2.8%) |
| $10,000 to $14,999 | 846 (2.6%) | 1,243 (8.2%) |
| $15,000 to $19,999 | 980 (3.0%) | 1,219 (8.1%) |
| $20,000 to $24,999 | 1,159 (3.5%) | 944 (6.2%) |
| $25,000 to $34,999 | 2,283 (7.0%) | 1,679 (11.1%) |
| $35,000 to $49,999 | 3,837 (11.7%) | 2,112 (14.0%) |
| $50,000 to $74,999 | 6,042 (18.5%) | 2,354 (15.5%) |
| $75,000 to $99,999 | 5,622 (17.2%) | 2,032 (13.4%) |
| $100,000 to $149,999 | 5,875 (17.9%) | 1,897 (12.5%) |
| $150,000 or more | 4,698 (14.3%) | 511 (3.4%) |
| Total | 32,728 (100.0%) | 15,142 (100.0%) |
Monthly Housing Cost Tiers in Harnett County
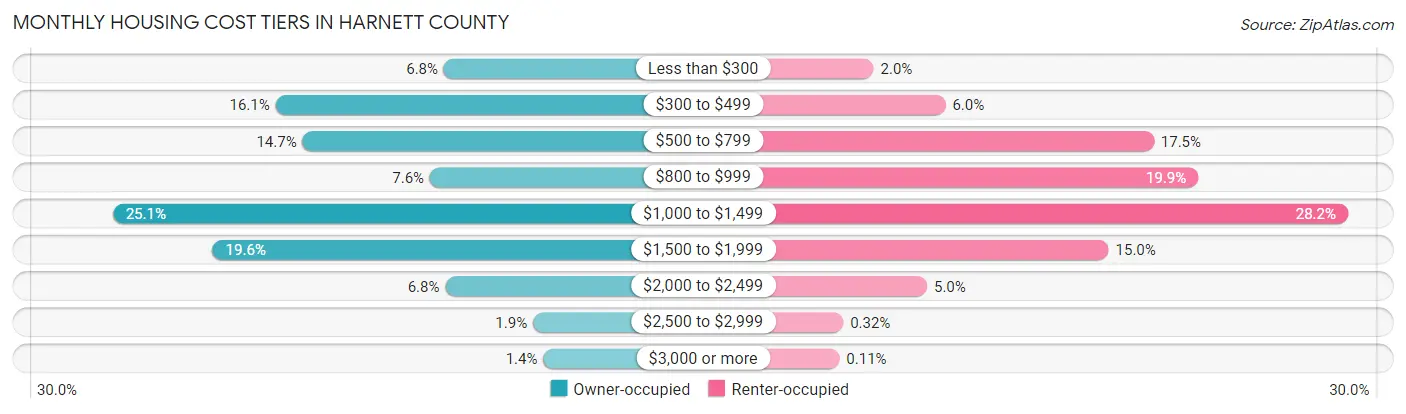
| Monthly Cost | Owner-occupied | Renter-occupied |
| Less than $300 | 2,240 (6.8%) | 303 (2.0%) |
| $300 to $499 | 5,281 (16.1%) | 904 (6.0%) |
| $500 to $799 | 4,794 (14.6%) | 2,647 (17.5%) |
| $800 to $999 | 2,489 (7.6%) | 3,016 (19.9%) |
| $1,000 to $1,499 | 8,223 (25.1%) | 4,269 (28.2%) |
| $1,500 to $1,999 | 6,418 (19.6%) | 2,269 (15.0%) |
| $2,000 to $2,499 | 2,214 (6.8%) | 750 (5.0%) |
| $2,500 to $2,999 | 627 (1.9%) | 49 (0.3%) |
| $3,000 or more | 442 (1.3%) | 17 (0.1%) |
| Total | 32,728 (100.0%) | 15,142 (100.0%) |
Physical Housing Characteristics in Harnett County
Housing Structures in Harnett County
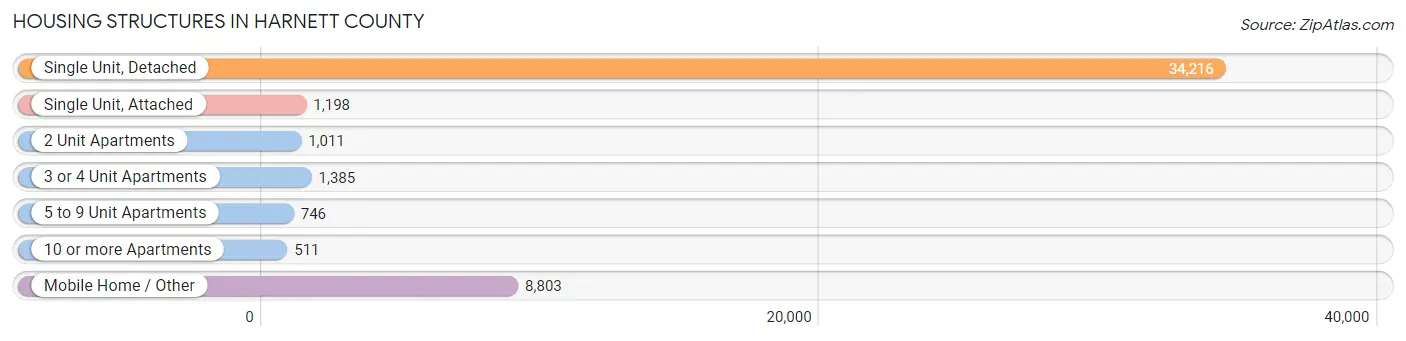
| Structure Type | # Housing Units | % Housing Units |
| Single Unit, Detached | 34,216 | 71.5% |
| Single Unit, Attached | 1,198 | 2.5% |
| 2 Unit Apartments | 1,011 | 2.1% |
| 3 or 4 Unit Apartments | 1,385 | 2.9% |
| 5 to 9 Unit Apartments | 746 | 1.6% |
| 10 or more Apartments | 511 | 1.1% |
| Mobile Home / Other | 8,803 | 18.4% |
| Total | 47,870 | 100.0% |
Housing Structures by Occupancy in Harnett County
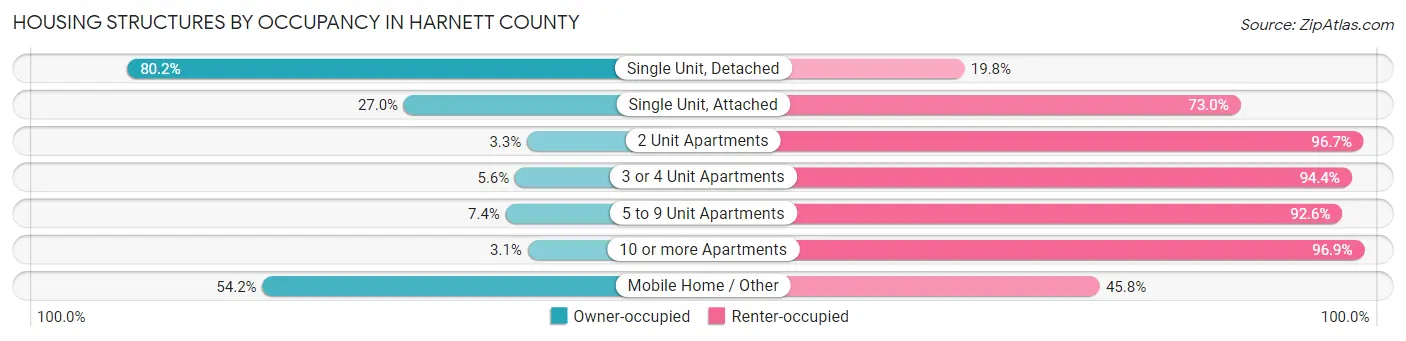
| Structure Type | Owner-occupied | Renter-occupied |
| Single Unit, Detached | 27,452 (80.2%) | 6,764 (19.8%) |
| Single Unit, Attached | 323 (27.0%) | 875 (73.0%) |
| 2 Unit Apartments | 33 (3.3%) | 978 (96.7%) |
| 3 or 4 Unit Apartments | 77 (5.6%) | 1,308 (94.4%) |
| 5 to 9 Unit Apartments | 55 (7.4%) | 691 (92.6%) |
| 10 or more Apartments | 16 (3.1%) | 495 (96.9%) |
| Mobile Home / Other | 4,772 (54.2%) | 4,031 (45.8%) |
| Total | 32,728 (68.4%) | 15,142 (31.6%) |
Housing Structures by Number of Rooms in Harnett County
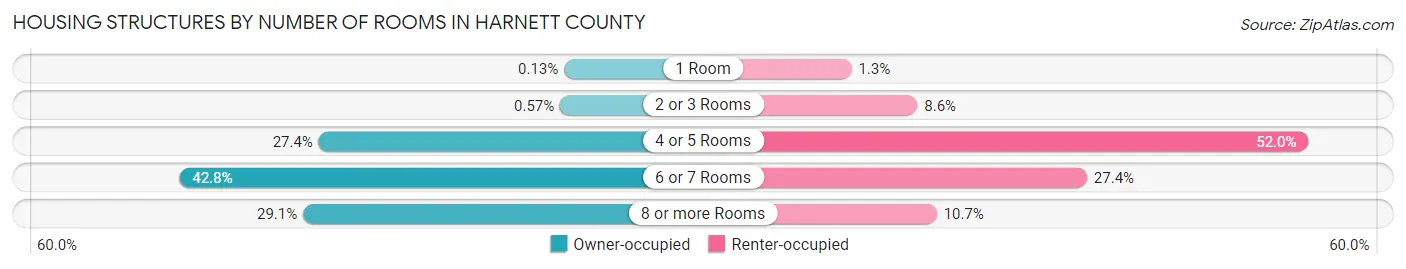
| Number of Rooms | Owner-occupied | Renter-occupied |
| 1 Room | 42 (0.1%) | 194 (1.3%) |
| 2 or 3 Rooms | 188 (0.6%) | 1,300 (8.6%) |
| 4 or 5 Rooms | 8,956 (27.4%) | 7,871 (52.0%) |
| 6 or 7 Rooms | 14,018 (42.8%) | 4,151 (27.4%) |
| 8 or more Rooms | 9,524 (29.1%) | 1,626 (10.7%) |
| Total | 32,728 (100.0%) | 15,142 (100.0%) |
Housing Structure by Heating Type in Harnett County
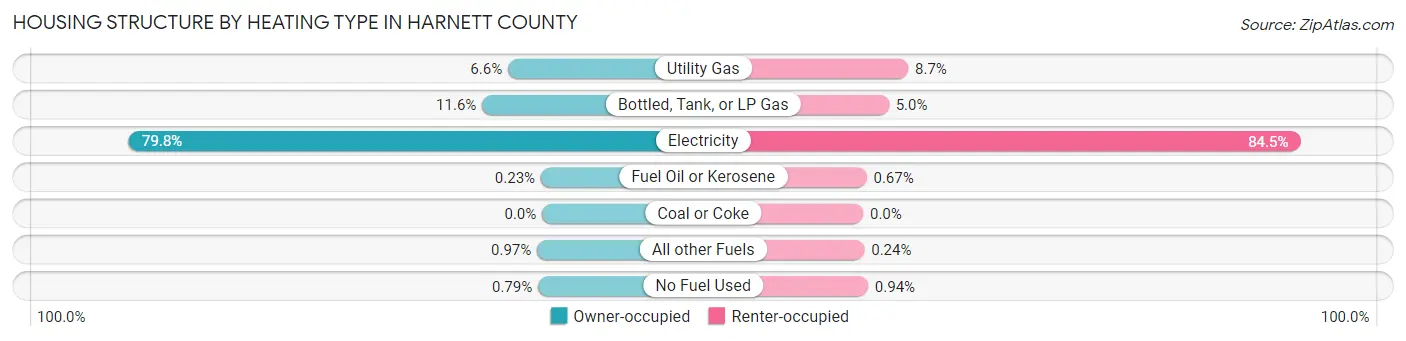
| Heating Type | Owner-occupied | Renter-occupied |
| Utility Gas | 2,156 (6.6%) | 1,319 (8.7%) |
| Bottled, Tank, or LP Gas | 3,791 (11.6%) | 751 (5.0%) |
| Electricity | 26,131 (79.8%) | 12,791 (84.5%) |
| Fuel Oil or Kerosene | 76 (0.2%) | 102 (0.7%) |
| Coal or Coke | 0 (0.0%) | 0 (0.0%) |
| All other Fuels | 316 (1.0%) | 37 (0.2%) |
| No Fuel Used | 258 (0.8%) | 142 (0.9%) |
| Total | 32,728 (100.0%) | 15,142 (100.0%) |
Household Vehicle Usage in Harnett County

| Vehicles per Household | Owner-occupied | Renter-occupied |
| No Vehicle | 934 (2.9%) | 1,110 (7.3%) |
| 1 Vehicle | 7,632 (23.3%) | 5,899 (39.0%) |
| 2 Vehicles | 12,064 (36.9%) | 5,700 (37.6%) |
| 3 or more Vehicles | 12,098 (37.0%) | 2,433 (16.1%) |
| Total | 32,728 (100.0%) | 15,142 (100.0%) |
Real Estate & Mortgages in Harnett County
Real Estate and Mortgage Overview in Harnett County
| Characteristic | Without Mortgage | With Mortgage |
| Housing Units | 11,770 | 20,958 |
| Median Property Value | $149,600 | $221,000 |
| Median Household Income | $50,304 | $3,790 |
| Monthly Housing Costs | $426 | $438 |
| Real Estate Taxes | $1,144 | $467 |
Property Value by Mortgage Status in Harnett County
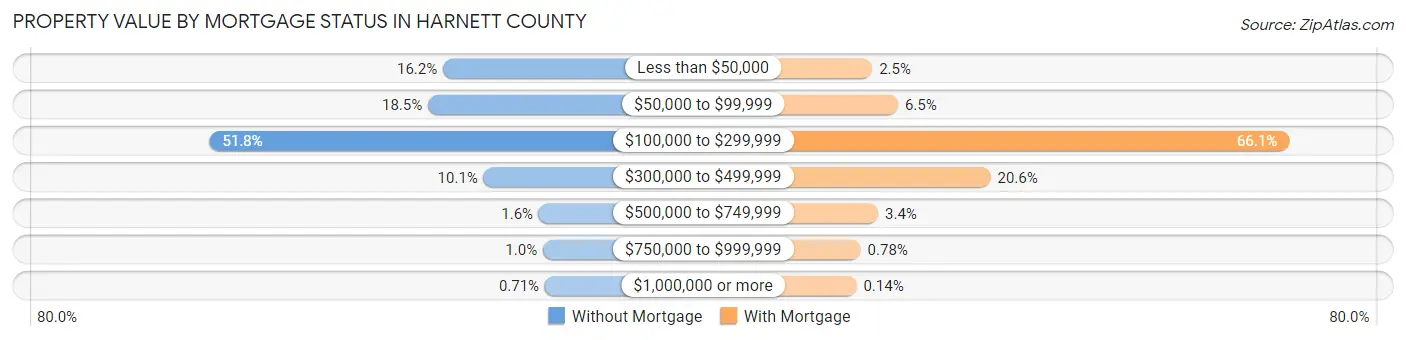
| Property Value | Without Mortgage | With Mortgage |
| Less than $50,000 | 1,911 (16.2%) | 532 (2.5%) |
| $50,000 to $99,999 | 2,180 (18.5%) | 1,355 (6.5%) |
| $100,000 to $299,999 | 6,102 (51.8%) | 13,847 (66.1%) |
| $300,000 to $499,999 | 1,183 (10.1%) | 4,312 (20.6%) |
| $500,000 to $749,999 | 192 (1.6%) | 720 (3.4%) |
| $750,000 to $999,999 | 119 (1.0%) | 163 (0.8%) |
| $1,000,000 or more | 83 (0.7%) | 29 (0.1%) |
| Total | 11,770 (100.0%) | 20,958 (100.0%) |
Household Income by Mortgage Status in Harnett County
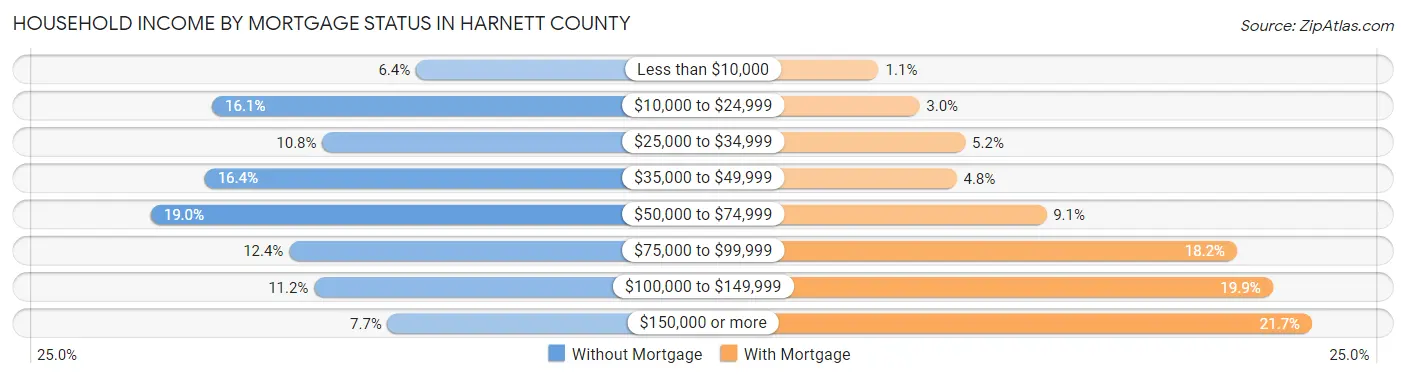
| Household Income | Without Mortgage | With Mortgage |
| Less than $10,000 | 748 (6.4%) | 231 (1.1%) |
| $10,000 to $24,999 | 1,892 (16.1%) | 638 (3.0%) |
| $25,000 to $34,999 | 1,274 (10.8%) | 1,093 (5.2%) |
| $35,000 to $49,999 | 1,933 (16.4%) | 1,009 (4.8%) |
| $50,000 to $74,999 | 2,235 (19.0%) | 1,904 (9.1%) |
| $75,000 to $99,999 | 1,460 (12.4%) | 3,807 (18.2%) |
| $100,000 to $149,999 | 1,320 (11.2%) | 4,162 (19.9%) |
| $150,000 or more | 908 (7.7%) | 4,555 (21.7%) |
| Total | 11,770 (100.0%) | 20,958 (100.0%) |
Property Value to Household Income Ratio in Harnett County
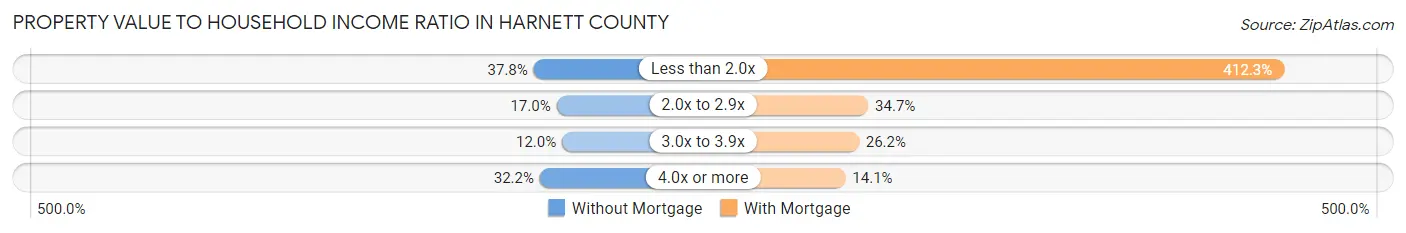
| Value-to-Income Ratio | Without Mortgage | With Mortgage |
| Less than 2.0x | 4,445 (37.8%) | 86,417 (412.3%) |
| 2.0x to 2.9x | 2,004 (17.0%) | 7,280 (34.7%) |
| 3.0x to 3.9x | 1,407 (11.9%) | 5,495 (26.2%) |
| 4.0x or more | 3,785 (32.2%) | 2,948 (14.1%) |
| Total | 11,770 (100.0%) | 20,958 (100.0%) |
Real Estate Taxes by Mortgage Status in Harnett County
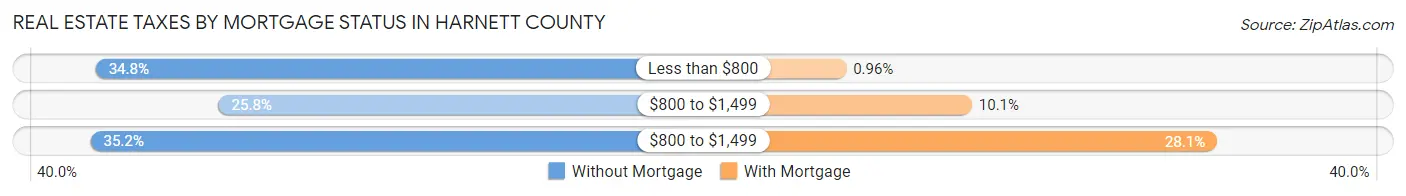
| Property Taxes | Without Mortgage | With Mortgage |
| Less than $800 | 4,096 (34.8%) | 201 (1.0%) |
| $800 to $1,499 | 3,039 (25.8%) | 2,125 (10.1%) |
| $800 to $1,499 | 4,141 (35.2%) | 5,881 (28.1%) |
| Total | 11,770 (100.0%) | 20,958 (100.0%) |
Health & Disability in Harnett County
Health Insurance Coverage by Age in Harnett County
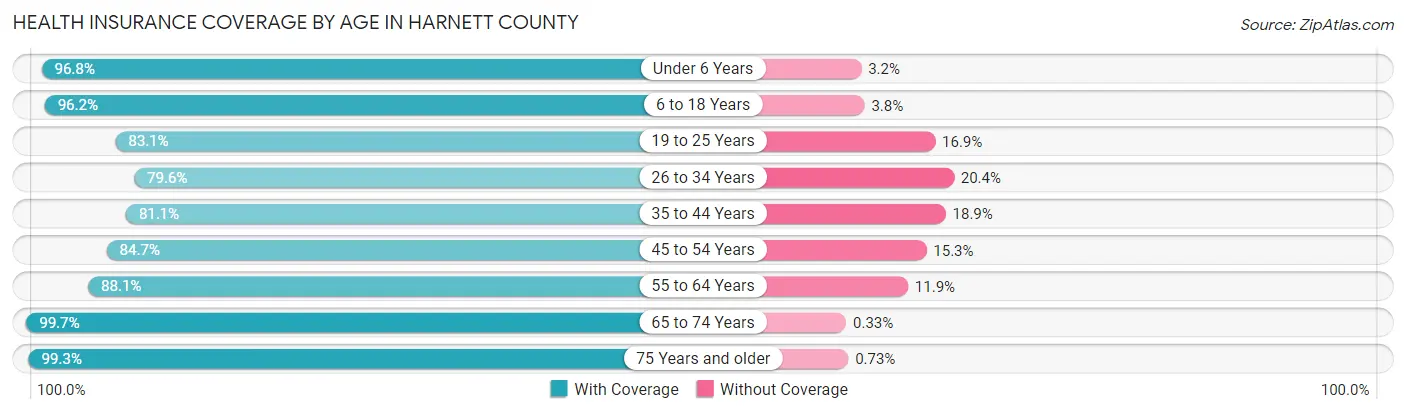
| Age Bracket | With Coverage | Without Coverage |
| Under 6 Years | 11,189 (96.8%) | 365 (3.2%) |
| 6 to 18 Years | 23,977 (96.2%) | 938 (3.8%) |
| 19 to 25 Years | 9,415 (83.1%) | 1,919 (16.9%) |
| 26 to 34 Years | 12,755 (79.6%) | 3,273 (20.4%) |
| 35 to 44 Years | 13,702 (81.1%) | 3,192 (18.9%) |
| 45 to 54 Years | 13,214 (84.7%) | 2,387 (15.3%) |
| 55 to 64 Years | 13,110 (88.1%) | 1,764 (11.9%) |
| 65 to 74 Years | 10,421 (99.7%) | 35 (0.3%) |
| 75 Years and older | 6,625 (99.3%) | 49 (0.7%) |
| Total | 114,408 (89.1%) | 13,922 (10.8%) |
Health Insurance Coverage by Citizenship Status in Harnett County
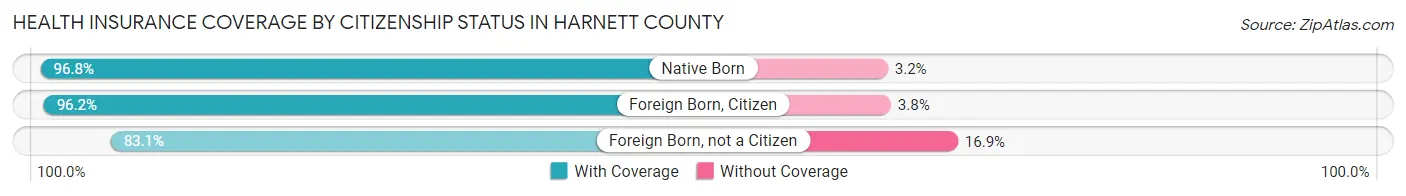
| Citizenship Status | With Coverage | Without Coverage |
| Native Born | 11,189 (96.8%) | 365 (3.2%) |
| Foreign Born, Citizen | 23,977 (96.2%) | 938 (3.8%) |
| Foreign Born, not a Citizen | 9,415 (83.1%) | 1,919 (16.9%) |
Health Insurance Coverage by Household Income in Harnett County
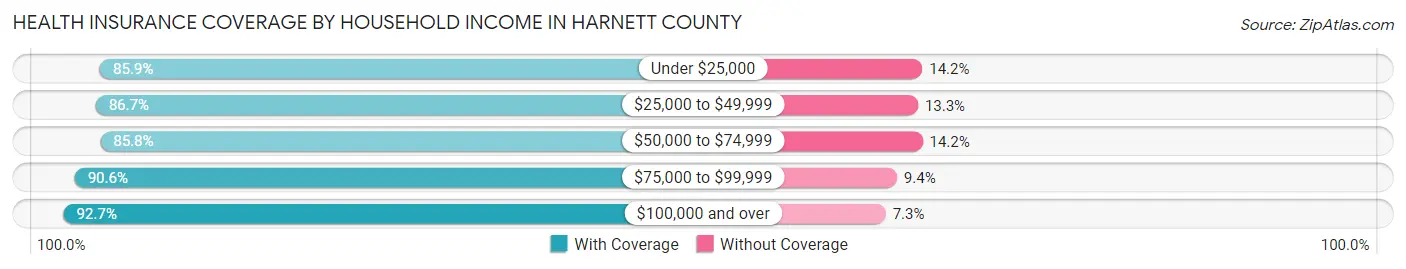
| Household Income | With Coverage | Without Coverage |
| Under $25,000 | 14,935 (85.9%) | 2,462 (14.1%) |
| $25,000 to $49,999 | 19,662 (86.7%) | 3,025 (13.3%) |
| $50,000 to $74,999 | 19,737 (85.8%) | 3,263 (14.2%) |
| $75,000 to $99,999 | 19,486 (90.6%) | 2,020 (9.4%) |
| $100,000 and over | 39,023 (92.7%) | 3,070 (7.3%) |
Public vs Private Health Insurance Coverage by Age in Harnett County
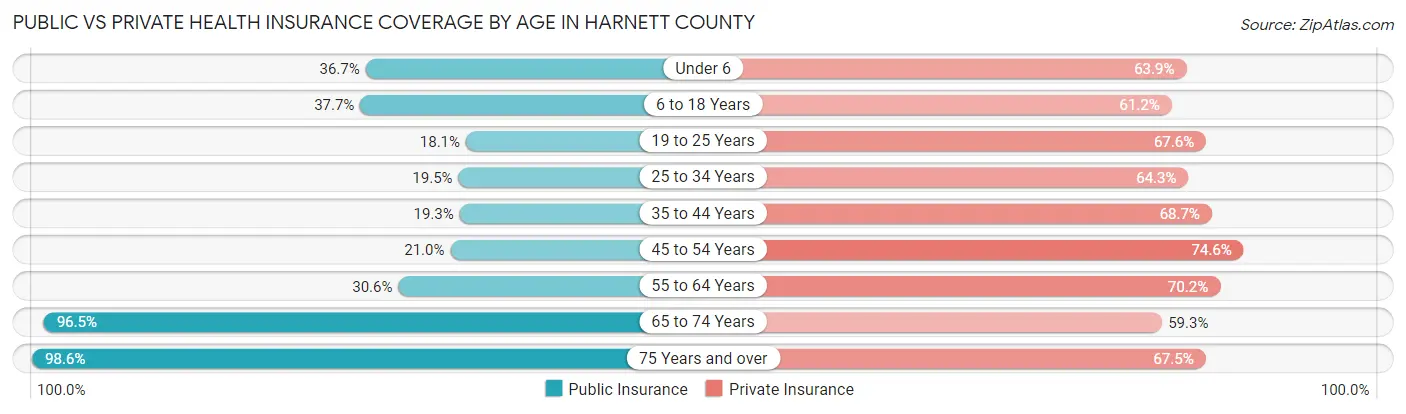
| Age Bracket | Public Insurance | Private Insurance |
| Under 6 | 4,243 (36.7%) | 7,386 (63.9%) |
| 6 to 18 Years | 9,396 (37.7%) | 15,253 (61.2%) |
| 19 to 25 Years | 2,051 (18.1%) | 7,661 (67.6%) |
| 25 to 34 Years | 3,123 (19.5%) | 10,308 (64.3%) |
| 35 to 44 Years | 3,255 (19.3%) | 11,598 (68.6%) |
| 45 to 54 Years | 3,273 (21.0%) | 11,635 (74.6%) |
| 55 to 64 Years | 4,557 (30.6%) | 10,442 (70.2%) |
| 65 to 74 Years | 10,085 (96.5%) | 6,199 (59.3%) |
| 75 Years and over | 6,582 (98.6%) | 4,505 (67.5%) |
| Total | 46,565 (36.3%) | 84,987 (66.2%) |
Disability Status by Sex by Age in Harnett County
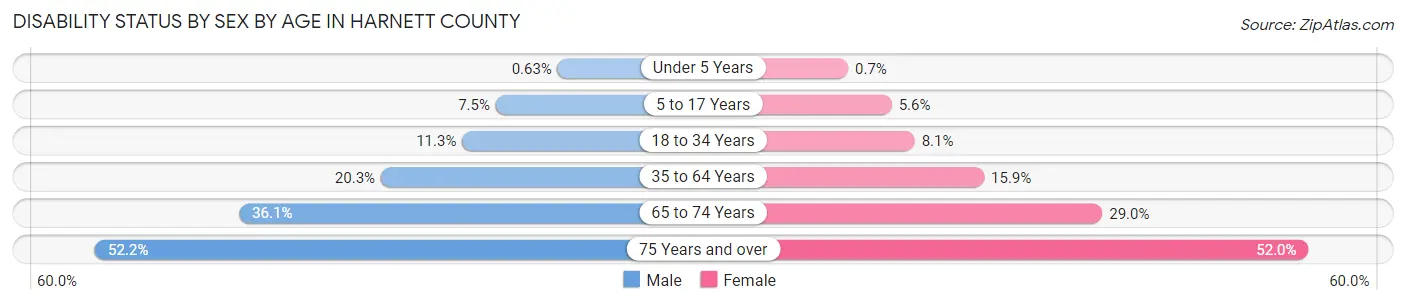
| Age Bracket | Male | Female |
| Under 5 Years | 31 (0.6%) | 32 (0.7%) |
| 5 to 17 Years | 953 (7.5%) | 677 (5.6%) |
| 18 to 34 Years | 1,541 (11.3%) | 1,281 (8.1%) |
| 35 to 64 Years | 4,655 (20.3%) | 3,878 (15.9%) |
| 65 to 74 Years | 1,750 (36.1%) | 1,627 (29.0%) |
| 75 Years and over | 1,421 (52.1%) | 2,052 (52.0%) |
Disability Class by Sex by Age in Harnett County
Disability Class: Hearing Difficulty
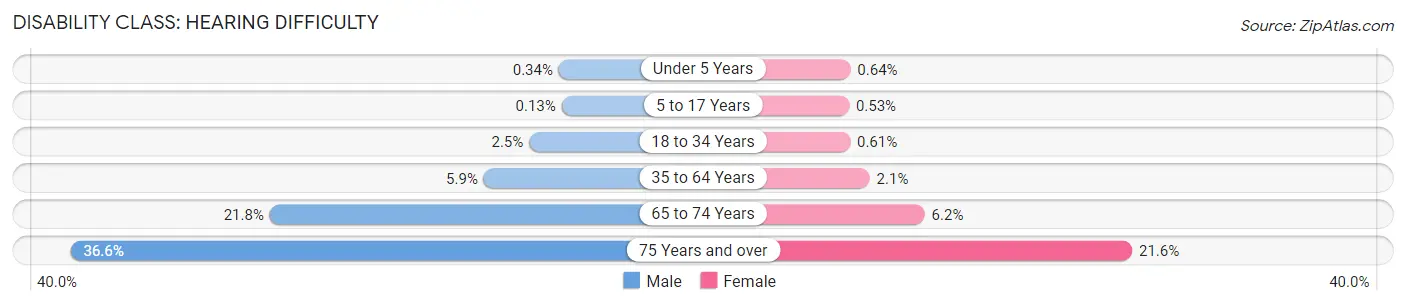
| Age Bracket | Male | Female |
| Under 5 Years | 17 (0.3%) | 29 (0.6%) |
| 5 to 17 Years | 16 (0.1%) | 65 (0.5%) |
| 18 to 34 Years | 347 (2.5%) | 96 (0.6%) |
| 35 to 64 Years | 1,355 (5.9%) | 506 (2.1%) |
| 65 to 74 Years | 1,057 (21.8%) | 345 (6.1%) |
| 75 Years and over | 997 (36.6%) | 851 (21.5%) |
Disability Class: Vision Difficulty
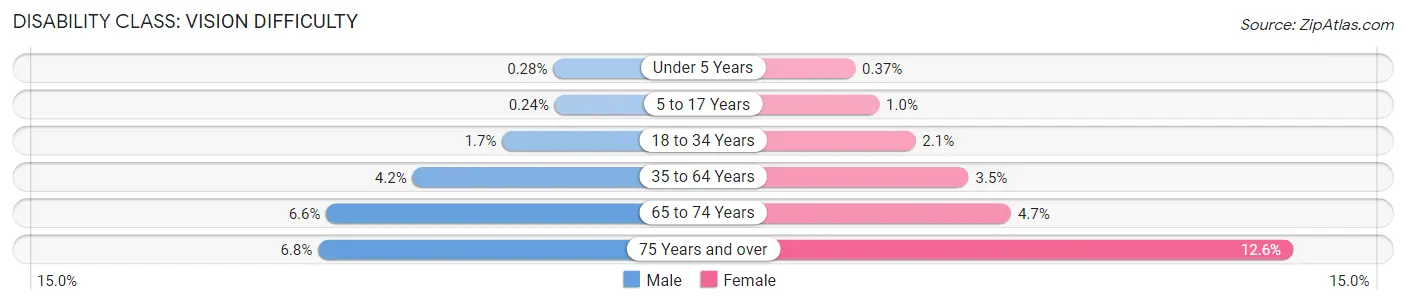
| Age Bracket | Male | Female |
| Under 5 Years | 14 (0.3%) | 17 (0.4%) |
| 5 to 17 Years | 30 (0.2%) | 127 (1.0%) |
| 18 to 34 Years | 233 (1.7%) | 324 (2.1%) |
| 35 to 64 Years | 962 (4.2%) | 863 (3.5%) |
| 65 to 74 Years | 320 (6.6%) | 264 (4.7%) |
| 75 Years and over | 186 (6.8%) | 496 (12.6%) |
Disability Class: Cognitive Difficulty
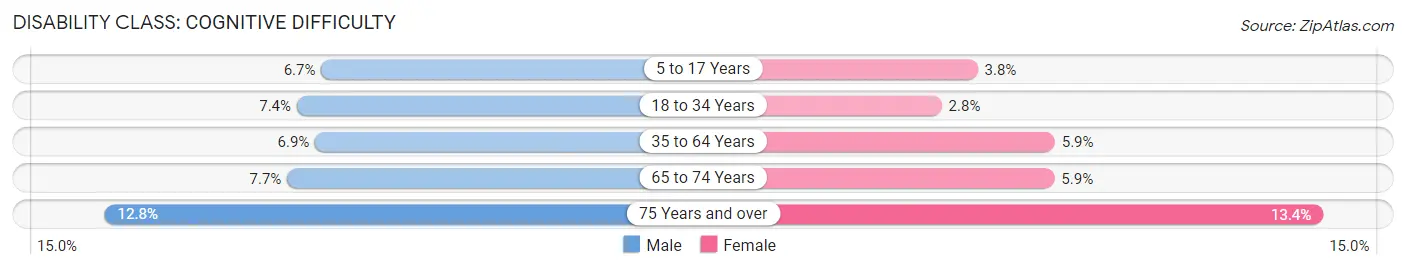
| Age Bracket | Male | Female |
| 5 to 17 Years | 854 (6.7%) | 460 (3.8%) |
| 18 to 34 Years | 1,015 (7.4%) | 438 (2.8%) |
| 35 to 64 Years | 1,584 (6.9%) | 1,451 (5.9%) |
| 65 to 74 Years | 373 (7.7%) | 332 (5.9%) |
| 75 Years and over | 348 (12.8%) | 529 (13.4%) |
Disability Class: Ambulatory Difficulty
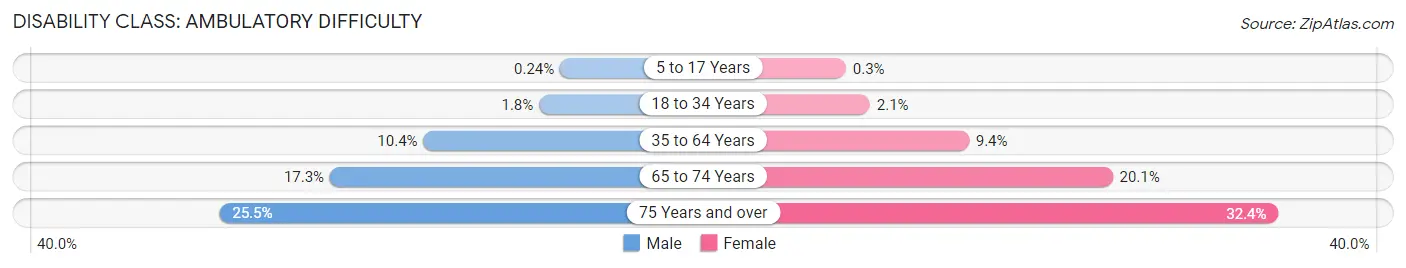
| Age Bracket | Male | Female |
| 5 to 17 Years | 31 (0.2%) | 37 (0.3%) |
| 18 to 34 Years | 247 (1.8%) | 328 (2.1%) |
| 35 to 64 Years | 2,381 (10.4%) | 2,306 (9.4%) |
| 65 to 74 Years | 840 (17.3%) | 1,127 (20.1%) |
| 75 Years and over | 696 (25.5%) | 1,280 (32.4%) |
Disability Class: Self-Care Difficulty
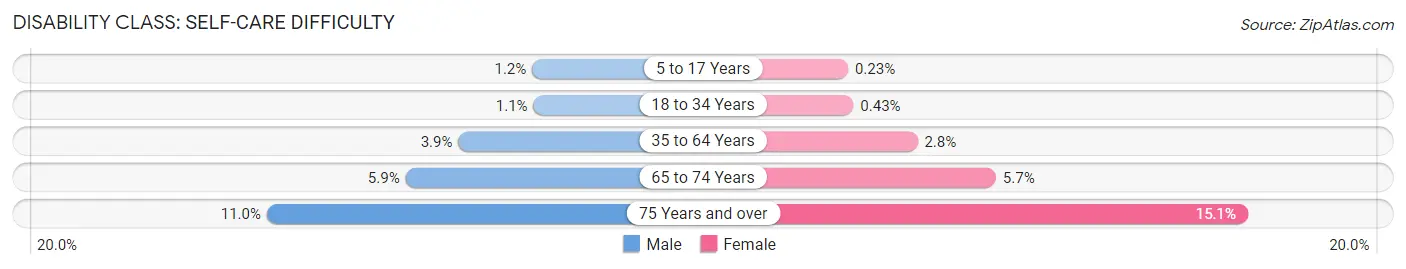
| Age Bracket | Male | Female |
| 5 to 17 Years | 147 (1.2%) | 28 (0.2%) |
| 18 to 34 Years | 152 (1.1%) | 68 (0.4%) |
| 35 to 64 Years | 894 (3.9%) | 688 (2.8%) |
| 65 to 74 Years | 284 (5.9%) | 321 (5.7%) |
| 75 Years and over | 300 (11.0%) | 595 (15.1%) |
Technology Access in Harnett County
Computing Device Access in Harnett County

| Device Type | # Households | % Households |
| Desktop or Laptop | 36,557 | 76.4% |
| Smartphone | 42,449 | 88.7% |
| Tablet | 30,126 | 62.9% |
| No Computing Device | 3,342 | 7.0% |
| Total | 47,870 | 100.0% |
Internet Access in Harnett County
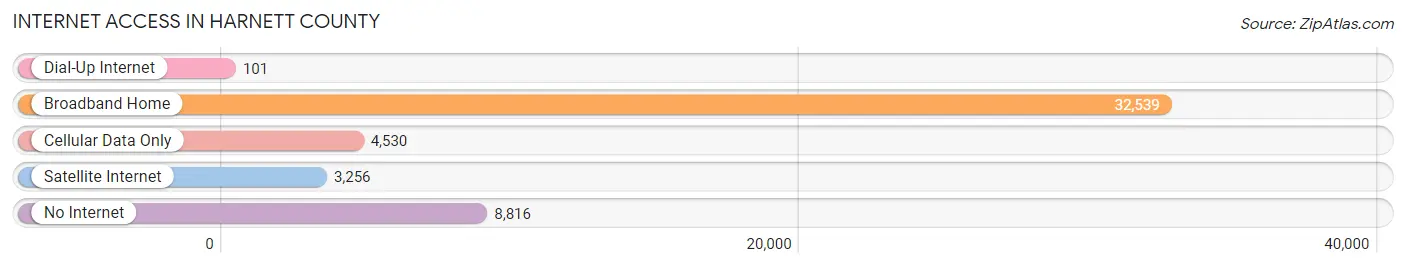
| Internet Type | # Households | % Households |
| Dial-Up Internet | 101 | 0.2% |
| Broadband Home | 32,539 | 68.0% |
| Cellular Data Only | 4,530 | 9.5% |
| Satellite Internet | 3,256 | 6.8% |
| No Internet | 8,816 | 18.4% |
| Total | 47,870 | 100.0% |
Harnett County Summary
Harnett County is located in the central part of North Carolina, and is part of the greater Triangle region. It is bordered by Lee County to the north, Johnston County to the east, Cumberland County to the south, and Chatham County to the west. The county seat is Lillington, and the largest city is Dunn. The county was formed in 1855 from parts of Cumberland and Johnston counties, and was named for American Revolutionary War hero Cornelius Harnett.
Geography
Harnett County covers an area of 545 square miles, and is located in the Coastal Plain region of North Carolina. The terrain is mostly flat, with some rolling hills in the northern part of the county. The Cape Fear River forms the western border of the county, and the Neuse River forms the eastern border. The county is home to several lakes, including Raven Rock Lake, Anderson Creek, and White Oak Lake.
Climate
Harnett County has a humid subtropical climate, with hot, humid summers and mild winters. The average annual temperature is around 65°F, and the average annual precipitation is around 45 inches.
Demographics
As of the 2010 census, Harnett County had a population of 114,678. The racial makeup of the county was 68.3% White, 24.2% African American, 4.2% Hispanic or Latino, 1.2% Asian, 0.4% Native American, and 1.7% from other races. The median household income was $45,845, and the median family income was $54,837.
Economy
Harnett County has a diverse economy, with a mix of agriculture, manufacturing, and services. The county is home to several large employers, including Campbell Soup Company, General Electric, and Duke Energy. Agriculture is a major part of the economy, with the county producing corn, soybeans, cotton, and tobacco. The county is also home to several wineries, and is a popular destination for outdoor recreation.
History
Harnett County was formed in 1855 from parts of Cumberland and Johnston counties. The county was named for American Revolutionary War hero Cornelius Harnett. The county seat was originally located in the town of Buies Creek, but was moved to Lillington in 1867.
During the Civil War, Harnett County was the site of several battles, including the Battle of Averasboro and the Battle of Bentonville. After the war, the county experienced a period of growth and prosperity, with the development of the railroad and the establishment of several towns.
In the early 20th century, the county was a major producer of tobacco, and the town of Dunn became known as the “Tobacco Capital of the World.” The county also experienced a period of growth and development, with the establishment of several industries, including textiles, furniture, and food processing.
Today, Harnett County is a vibrant and diverse community, with a strong economy and a rich history. The county is home to several large employers, and is a popular destination for outdoor recreation.
Common Questions
What is the Total Population of Harnett County?
Total Population of Harnett County is 134,718.
What is the Total Male Population of Harnett County?
Total Male Population of Harnett County is 67,115.
What is the Total Female Population of Harnett County?
Total Female Population of Harnett County is 67,603.
What is the Ratio of Males per 100 Females in Harnett County?
There are 99.28 Males per 100 Females in Harnett County.
What is the Ratio of Females per 100 Males in Harnett County?
There are 100.73 Females per 100 Males in Harnett County.
What is the Median Population Age in Harnett County?
Median Population Age in Harnett County is 35.2 Years.
What is the Average Family Size in Harnett County
Average Family Size in Harnett County is 3.4 People.
What is the Average Household Size in Harnett County
Average Household Size in Harnett County is 2.8 People.
What is Per Capita Income in Harnett County?
Per Capita income in Harnett County is $29,678.
What is the Median Family Income in Harnett County?
Median Family Income in Harnett County is $78,039.
What is the Median Household income in Harnett County?
Median Household Income in Harnett County is $64,992.
What is Income or Wage Gap in Harnett County?
Income or Wage Gap in Harnett County is 34.1%.
Women in Harnett County earn 65.9 cents for every dollar earned by a man.
What is Family Income Deficit in Harnett County?
Family Income Deficit in Harnett County is $11,300.
Families that are below poverty line in Harnett County earn $11,300 less on average than the poverty threshold level.
What is Inequality or Gini Index in Harnett County?
Inequality or Gini Index in Harnett County is 0.43.
How Large is the Labor Force in Harnett County?
There are 61,914 People in the Labor Forcein in Harnett County.
What is the Percentage of People in the Labor Force in Harnett County?
59.6% of People are in the Labor Force in Harnett County.
What is the Unemployment Rate in Harnett County?
Unemployment Rate in Harnett County is 5.3%.