Guilford County, NC
Guilford County Map
Guilford County Overview
539,557
TOTAL POPULATION
256,731
MALE POPULATION
282,826
FEMALE POPULATION
90.77
MALES / 100 FEMALES
110.16
FEMALES / 100 MALES
37.2
MEDIAN AGE
3.1
AVG FAMILY SIZE
2.4
AVG HOUSEHOLD SIZE
$36,563
PER CAPITA INCOME
$80,635
AVG FAMILY INCOME
$62,880
AVG HOUSEHOLD INCOME
24.1%
WAGE / INCOME GAP [ % ]
75.9¢/ $1
WAGE / INCOME GAP [ $ ]
$11,040
FAMILY INCOME DEFICIT
0.49
INEQUALITY / GINI INDEX
278,466
LABOR FORCE [ PEOPLE ]
64.1%
PERCENT IN LABOR FORCE
5.2%
UNEMPLOYMENT RATE
Guilford County Area Codes
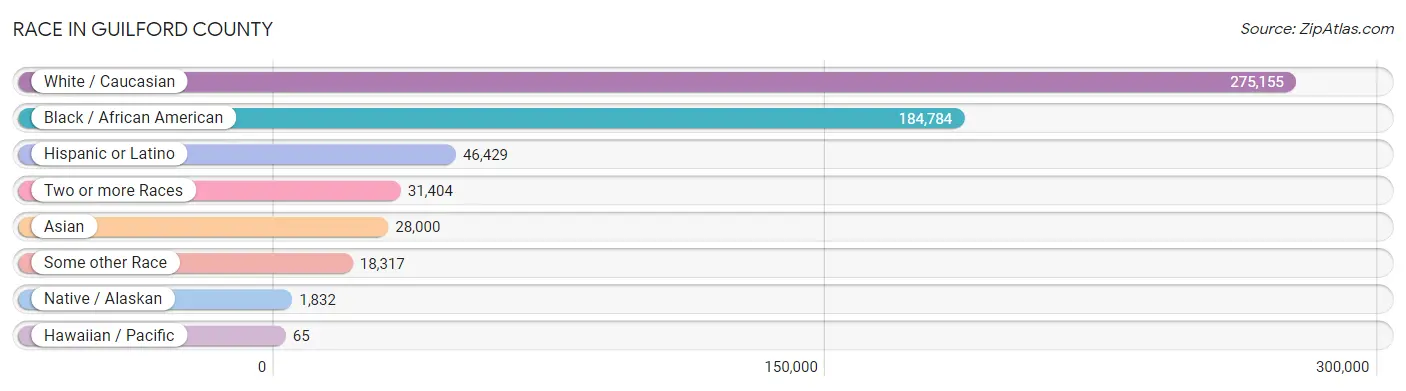
Race in Guilford County
The most populous races in Guilford County are White / Caucasian (275,155 | 51.0%), Black / African American (184,784 | 34.3%), and Hispanic or Latino (46,429 | 8.6%).
| Race | # Population | % Population |
| Asian | 28,000 | 5.2% |
| Black / African American | 184,784 | 34.3% |
| Hawaiian / Pacific | 65 | 0.0% |
| Hispanic or Latino | 46,429 | 8.6% |
| Native / Alaskan | 1,832 | 0.3% |
| White / Caucasian | 275,155 | 51.0% |
| Two or more Races | 31,404 | 5.8% |
| Some other Race | 18,317 | 3.4% |
| Total | 539,557 | 100.0% |
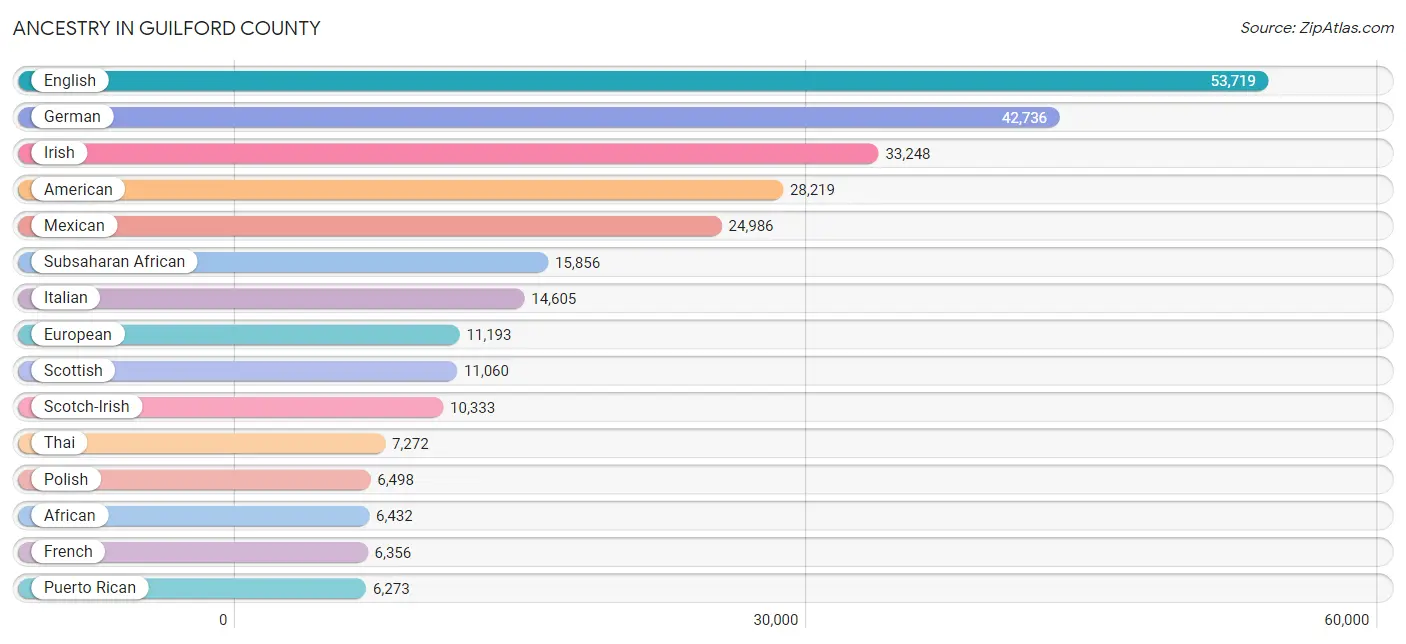
Ancestry in Guilford County
The most populous ancestries reported in Guilford County are English (53,719 | 10.0%), German (42,736 | 7.9%), Irish (33,248 | 6.2%), American (28,219 | 5.2%), and Mexican (24,986 | 4.6%), together accounting for 33.9% of all Guilford County residents.
| Ancestry | # Population | % Population |
| Afghan | 234 | 0.0% |
| African | 6,432 | 1.2% |
| Alaska Native | 8 | 0.0% |
| Albanian | 28 | 0.0% |
| Alsatian | 25 | 0.0% |
| American | 28,219 | 5.2% |
| Apache | 6 | 0.0% |
| Arab | 3,607 | 0.7% |
| Arapaho | 22 | 0.0% |
| Argentinean | 516 | 0.1% |
| Armenian | 118 | 0.0% |
| Australian | 139 | 0.0% |
| Austrian | 585 | 0.1% |
| Bahamian | 186 | 0.0% |
| Bangladeshi | 469 | 0.1% |
| Barbadian | 297 | 0.1% |
| Basque | 35 | 0.0% |
| Belgian | 353 | 0.1% |
| Bermudan | 61 | 0.0% |
| Bhutanese | 835 | 0.2% |
| Blackfeet | 569 | 0.1% |
| Bolivian | 48 | 0.0% |
| Brazilian | 320 | 0.1% |
| British | 2,519 | 0.5% |
| British West Indian | 447 | 0.1% |
| Bulgarian | 210 | 0.0% |
| Burmese | 1,701 | 0.3% |
| Cajun | 57 | 0.0% |
| Cambodian | 12 | 0.0% |
| Canadian | 978 | 0.2% |
| Cape Verdean | 12 | 0.0% |
| Celtic | 4 | 0.0% |
| Central American | 5,268 | 1.0% |
| Central American Indian | 292 | 0.1% |
| Cherokee | 2,250 | 0.4% |
| Chickasaw | 2 | 0.0% |
| Chilean | 121 | 0.0% |
| Chippewa | 54 | 0.0% |
| Choctaw | 75 | 0.0% |
| Colombian | 1,308 | 0.2% |
| Costa Rican | 189 | 0.0% |
| Creek | 359 | 0.1% |
| Croatian | 248 | 0.1% |
| Crow | 17 | 0.0% |
| Cuban | 1,363 | 0.3% |
| Czech | 646 | 0.1% |
| Czechoslovakian | 393 | 0.1% |
| Danish | 823 | 0.2% |
| Delaware | 25 | 0.0% |
| Dominican | 1,897 | 0.4% |
| Dutch | 3,382 | 0.6% |
| Eastern European | 990 | 0.2% |
| Ecuadorian | 557 | 0.1% |
| Egyptian | 282 | 0.1% |
| English | 53,719 | 10.0% |
| Estonian | 88 | 0.0% |
| Ethiopian | 397 | 0.1% |
| European | 11,193 | 2.1% |
| Filipino | 118 | 0.0% |
| Finnish | 239 | 0.0% |
| French | 6,356 | 1.2% |
| French Canadian | 1,594 | 0.3% |
| German | 42,736 | 7.9% |
| Ghanaian | 386 | 0.1% |
| Greek | 1,217 | 0.2% |
| Guamanian / Chamorro | 256 | 0.1% |
| Guatemalan | 967 | 0.2% |
| Guyanese | 314 | 0.1% |
| Haitian | 634 | 0.1% |
| Honduran | 977 | 0.2% |
| Hungarian | 952 | 0.2% |
| Icelander | 57 | 0.0% |
| Indian (Asian) | 3,707 | 0.7% |
| Indonesian | 712 | 0.1% |
| Inupiat | 6 | 0.0% |
| Iranian | 316 | 0.1% |
| Iraqi | 280 | 0.1% |
| Irish | 33,248 | 6.2% |
| Iroquois | 85 | 0.0% |
| Israeli | 135 | 0.0% |
| Italian | 14,605 | 2.7% |
| Jamaican | 1,533 | 0.3% |
| Japanese | 1,692 | 0.3% |
| Jordanian | 406 | 0.1% |
| Kenyan | 85 | 0.0% |
| Korean | 2,553 | 0.5% |
| Laotian | 7 | 0.0% |
| Latvian | 63 | 0.0% |
| Lebanese | 637 | 0.1% |
| Liberian | 337 | 0.1% |
| Lithuanian | 610 | 0.1% |
| Lumbee | 937 | 0.2% |
| Luxembourger | 13 | 0.0% |
| Malaysian | 1,741 | 0.3% |
| Maltese | 18 | 0.0% |
| Mexican | 24,986 | 4.6% |
| Mexican American Indian | 519 | 0.1% |
| Mongolian | 124 | 0.0% |
| Moroccan | 369 | 0.1% |
| Native Hawaiian | 155 | 0.0% |
| Navajo | 117 | 0.0% |
| New Zealander | 78 | 0.0% |
| Nicaraguan | 94 | 0.0% |
| Nigerian | 3,053 | 0.6% |
| Northern European | 488 | 0.1% |
| Norwegian | 2,191 | 0.4% |
| Pakistani | 371 | 0.1% |
| Palestinian | 94 | 0.0% |
| Panamanian | 377 | 0.1% |
| Pennsylvania German | 122 | 0.0% |
| Peruvian | 310 | 0.1% |
| Polish | 6,498 | 1.2% |
| Portuguese | 590 | 0.1% |
| Puerto Rican | 6,273 | 1.2% |
| Romanian | 390 | 0.1% |
| Russian | 1,287 | 0.2% |
| Salvadoran | 2,664 | 0.5% |
| Samoan | 1 | 0.0% |
| Scandinavian | 717 | 0.1% |
| Scotch-Irish | 10,333 | 1.9% |
| Scottish | 11,060 | 2.1% |
| Seminole | 41 | 0.0% |
| Senegalese | 764 | 0.1% |
| Serbian | 129 | 0.0% |
| Sierra Leonean | 154 | 0.0% |
| Sioux | 8 | 0.0% |
| Slavic | 94 | 0.0% |
| Slovak | 702 | 0.1% |
| Slovene | 148 | 0.0% |
| Somali | 264 | 0.1% |
| South African | 78 | 0.0% |
| South American | 3,331 | 0.6% |
| South American Indian | 12 | 0.0% |
| Spaniard | 670 | 0.1% |
| Spanish | 359 | 0.1% |
| Sri Lankan | 5,977 | 1.1% |
| Subsaharan African | 15,856 | 2.9% |
| Sudanese | 1,685 | 0.3% |
| Swedish | 2,637 | 0.5% |
| Swiss | 654 | 0.1% |
| Syrian | 305 | 0.1% |
| Thai | 7,272 | 1.3% |
| Trinidadian and Tobagonian | 258 | 0.1% |
| Turkish | 222 | 0.0% |
| U.S. Virgin Islander | 118 | 0.0% |
| Ugandan | 1 | 0.0% |
| Ukrainian | 618 | 0.1% |
| Uruguayan | 78 | 0.0% |
| Venezuelan | 352 | 0.1% |
| Vietnamese | 138 | 0.0% |
| Welsh | 2,278 | 0.4% |
| West Indian | 337 | 0.1% |
| Yugoslavian | 212 | 0.0% |
| Zimbabwean | 57 | 0.0% | View All 154 Rows |
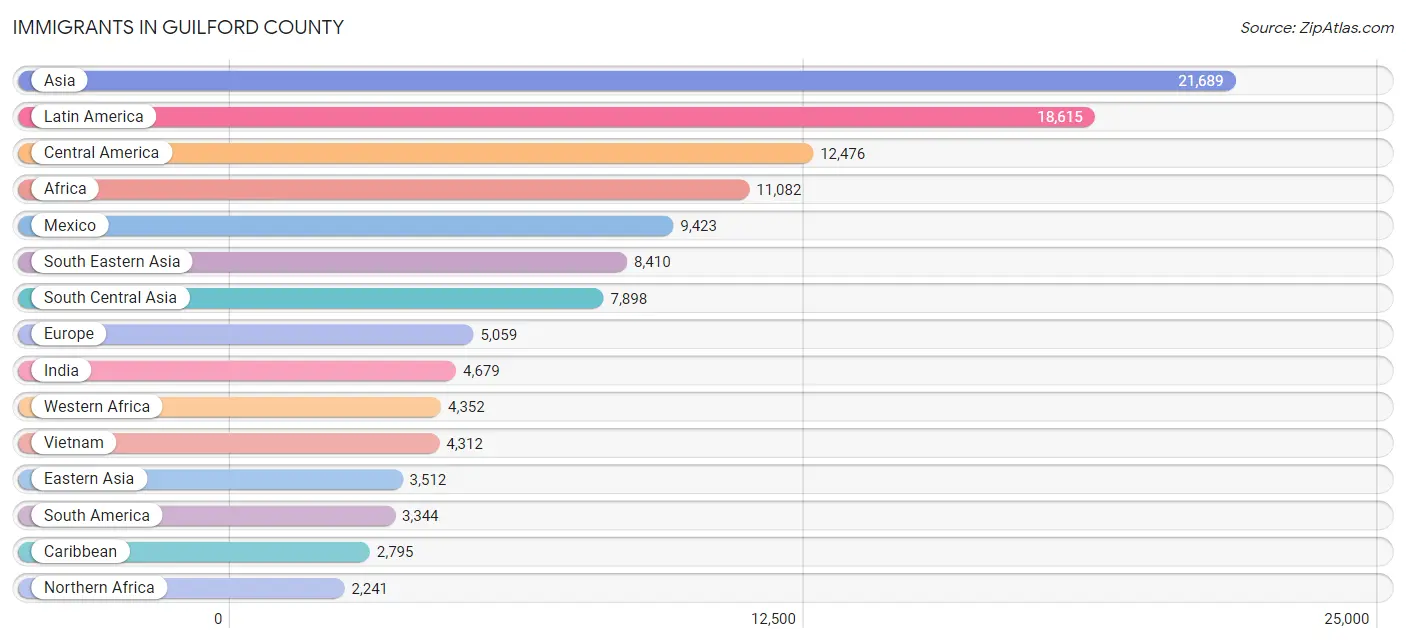
Immigrants in Guilford County
The most numerous immigrant groups reported in Guilford County came from Asia (21,689 | 4.0%), Latin America (18,615 | 3.5%), Central America (12,476 | 2.3%), Africa (11,082 | 2.1%), and Mexico (9,423 | 1.8%), together accounting for 13.6% of all Guilford County residents.
| Immigration Origin | # Population | % Population |
| Afghanistan | 148 | 0.0% |
| Africa | 11,082 | 2.1% |
| Albania | 59 | 0.0% |
| Argentina | 422 | 0.1% |
| Armenia | 13 | 0.0% |
| Asia | 21,689 | 4.0% |
| Australia | 28 | 0.0% |
| Austria | 60 | 0.0% |
| Azores | 5 | 0.0% |
| Bahamas | 128 | 0.0% |
| Bangladesh | 163 | 0.0% |
| Barbados | 189 | 0.0% |
| Belarus | 40 | 0.0% |
| Belgium | 3 | 0.0% |
| Bosnia and Herzegovina | 561 | 0.1% |
| Brazil | 822 | 0.2% |
| Bulgaria | 132 | 0.0% |
| Cambodia | 572 | 0.1% |
| Cameroon | 137 | 0.0% |
| Canada | 1,249 | 0.2% |
| Caribbean | 2,795 | 0.5% |
| Central America | 12,476 | 2.3% |
| Chile | 163 | 0.0% |
| China | 1,977 | 0.4% |
| Colombia | 759 | 0.1% |
| Congo | 235 | 0.0% |
| Costa Rica | 91 | 0.0% |
| Croatia | 14 | 0.0% |
| Cuba | 426 | 0.1% |
| Czechoslovakia | 13 | 0.0% |
| Denmark | 24 | 0.0% |
| Dominica | 213 | 0.0% |
| Dominican Republic | 557 | 0.1% |
| Eastern Africa | 1,699 | 0.3% |
| Eastern Asia | 3,512 | 0.6% |
| Eastern Europe | 1,726 | 0.3% |
| Ecuador | 324 | 0.1% |
| Egypt | 165 | 0.0% |
| El Salvador | 1,119 | 0.2% |
| England | 682 | 0.1% |
| Eritrea | 217 | 0.0% |
| Ethiopia | 135 | 0.0% |
| Europe | 5,059 | 0.9% |
| France | 185 | 0.0% |
| Germany | 613 | 0.1% |
| Ghana | 427 | 0.1% |
| Greece | 109 | 0.0% |
| Guatemala | 549 | 0.1% |
| Guyana | 248 | 0.1% |
| Haiti | 227 | 0.0% |
| Honduras | 995 | 0.2% |
| Hong Kong | 145 | 0.0% |
| Hungary | 73 | 0.0% |
| India | 4,679 | 0.9% |
| Indonesia | 60 | 0.0% |
| Iran | 261 | 0.1% |
| Iraq | 379 | 0.1% |
| Ireland | 112 | 0.0% |
| Israel | 77 | 0.0% |
| Italy | 757 | 0.1% |
| Jamaica | 614 | 0.1% |
| Japan | 546 | 0.1% |
| Jordan | 261 | 0.1% |
| Kazakhstan | 20 | 0.0% |
| Kenya | 237 | 0.0% |
| Korea | 989 | 0.2% |
| Kuwait | 85 | 0.0% |
| Laos | 556 | 0.1% |
| Latin America | 18,615 | 3.5% |
| Latvia | 13 | 0.0% |
| Lebanon | 63 | 0.0% |
| Liberia | 357 | 0.1% |
| Malaysia | 242 | 0.0% |
| Mexico | 9,423 | 1.8% |
| Middle Africa | 1,757 | 0.3% |
| Morocco | 123 | 0.0% |
| Nepal | 713 | 0.1% |
| Netherlands | 103 | 0.0% |
| Nicaragua | 69 | 0.0% |
| Nigeria | 1,745 | 0.3% |
| Northern Africa | 2,241 | 0.4% |
| Northern Europe | 1,326 | 0.3% |
| Oceania | 88 | 0.0% |
| Pakistan | 1,484 | 0.3% |
| Panama | 230 | 0.0% |
| Peru | 197 | 0.0% |
| Philippines | 1,555 | 0.3% |
| Poland | 154 | 0.0% |
| Portugal | 22 | 0.0% |
| Romania | 201 | 0.0% |
| Russia | 360 | 0.1% |
| Saudi Arabia | 374 | 0.1% |
| Scotland | 60 | 0.0% |
| Senegal | 435 | 0.1% |
| Serbia | 16 | 0.0% |
| Sierra Leone | 123 | 0.0% |
| Somalia | 213 | 0.0% |
| South Africa | 109 | 0.0% |
| South America | 3,344 | 0.6% |
| South Central Asia | 7,898 | 1.5% |
| South Eastern Asia | 8,410 | 1.6% |
| Southern Europe | 980 | 0.2% |
| Spain | 92 | 0.0% |
| Sri Lanka | 186 | 0.0% |
| Sudan | 1,661 | 0.3% |
| Sweden | 149 | 0.0% |
| Switzerland | 27 | 0.0% |
| Syria | 122 | 0.0% |
| Taiwan | 117 | 0.0% |
| Thailand | 667 | 0.1% |
| Trinidad and Tobago | 249 | 0.1% |
| Turkey | 290 | 0.1% |
| Uganda | 175 | 0.0% |
| Ukraine | 57 | 0.0% |
| Uruguay | 54 | 0.0% |
| Venezuela | 304 | 0.1% |
| Vietnam | 4,312 | 0.8% |
| Western Africa | 4,352 | 0.8% |
| Western Asia | 1,783 | 0.3% |
| Western Europe | 991 | 0.2% |
| Zaire | 896 | 0.2% |
| Zimbabwe | 82 | 0.0% | View All 122 Rows |
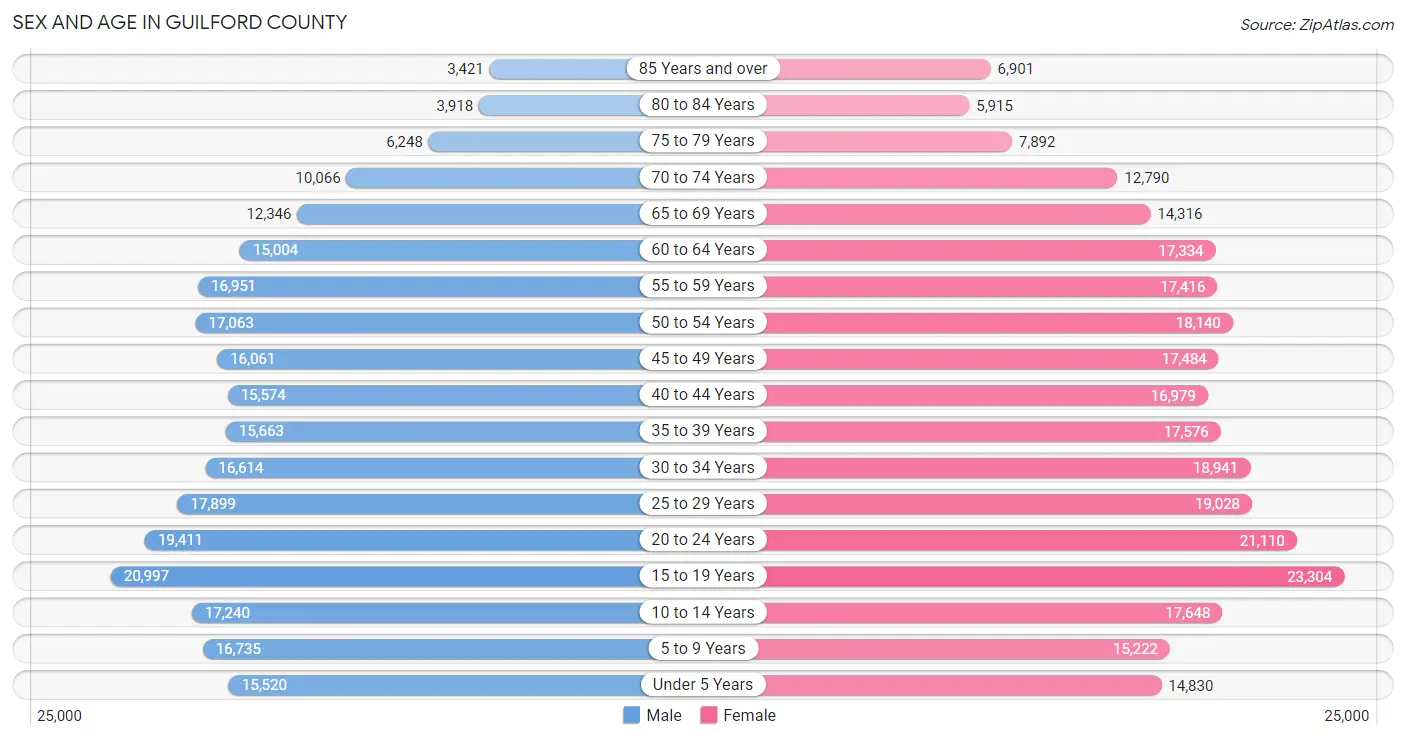
Sex and Age in Guilford County
Sex and Age in Guilford County
The most populous age groups in Guilford County are 15 to 19 Years (20,997 | 8.2%) for men and 15 to 19 Years (23,304 | 8.2%) for women.
| Age Bracket | Male | Female |
| Under 5 Years | 15,520 (6.0%) | 14,830 (5.2%) |
| 5 to 9 Years | 16,735 (6.5%) | 15,222 (5.4%) |
| 10 to 14 Years | 17,240 (6.7%) | 17,648 (6.2%) |
| 15 to 19 Years | 20,997 (8.2%) | 23,304 (8.2%) |
| 20 to 24 Years | 19,411 (7.6%) | 21,110 (7.5%) |
| 25 to 29 Years | 17,899 (7.0%) | 19,028 (6.7%) |
| 30 to 34 Years | 16,614 (6.5%) | 18,941 (6.7%) |
| 35 to 39 Years | 15,663 (6.1%) | 17,576 (6.2%) |
| 40 to 44 Years | 15,574 (6.1%) | 16,979 (6.0%) |
| 45 to 49 Years | 16,061 (6.3%) | 17,484 (6.2%) |
| 50 to 54 Years | 17,063 (6.7%) | 18,140 (6.4%) |
| 55 to 59 Years | 16,951 (6.6%) | 17,416 (6.2%) |
| 60 to 64 Years | 15,004 (5.8%) | 17,334 (6.1%) |
| 65 to 69 Years | 12,346 (4.8%) | 14,316 (5.1%) |
| 70 to 74 Years | 10,066 (3.9%) | 12,790 (4.5%) |
| 75 to 79 Years | 6,248 (2.4%) | 7,892 (2.8%) |
| 80 to 84 Years | 3,918 (1.5%) | 5,915 (2.1%) |
| 85 Years and over | 3,421 (1.3%) | 6,901 (2.4%) |
| Total | 256,731 (100.0%) | 282,826 (100.0%) |
Families and Households in Guilford County
Median Family Size in Guilford County
The median family size in Guilford County is 3.06 persons per family, with married-couple families (89,004 | 67.2%) accounting for the largest median family size of 3.12 persons per family. On the other hand, single male/father families (10,503 | 7.9%) represent the smallest median family size with 2.66 persons per family.
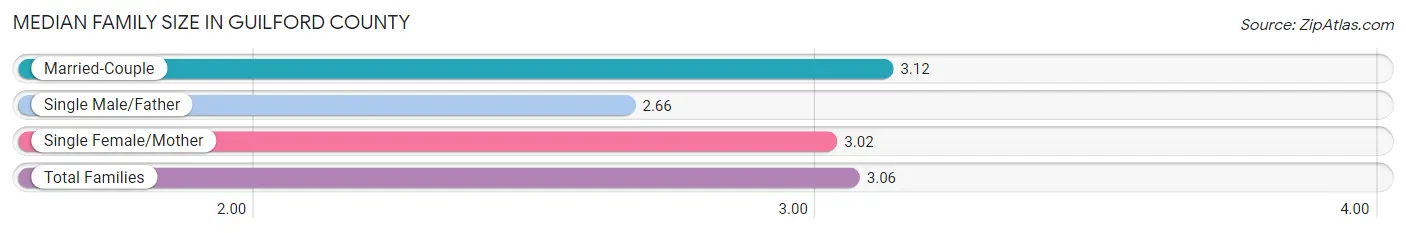
| Family Type | # Families | Family Size |
| Married-Couple | 89,004 (67.2%) | 3.12 |
| Single Male/Father | 10,503 (7.9%) | 2.66 |
| Single Female/Mother | 32,998 (24.9%) | 3.02 |
| Total Families | 132,505 (100.0%) | 3.06 |
Median Household Size in Guilford County
The median household size in Guilford County is 2.43 persons per household, with single female/mother households (32,998 | 15.5%) accounting for the largest median household size of 3.21 persons per household. non-family households (80,320 | 37.7%) represent the smallest median household size with 1.26 persons per household.
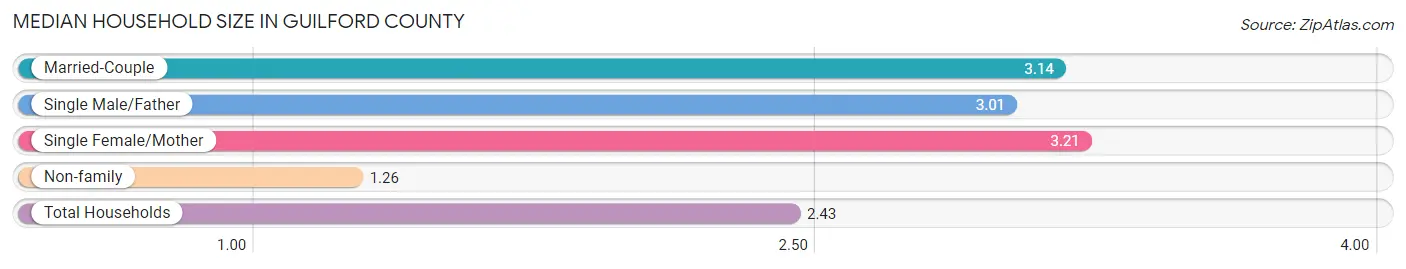
| Household Type | # Households | Household Size |
| Married-Couple | 89,004 (41.8%) | 3.14 |
| Single Male/Father | 10,503 (4.9%) | 3.01 |
| Single Female/Mother | 32,998 (15.5%) | 3.21 |
| Non-family | 80,320 (37.7%) | 1.26 |
| Total Households | 212,825 (100.0%) | 2.43 |
Household Size by Marriage Status in Guilford County
Out of a total of 212,825 households in Guilford County, 132,505 (62.3%) are family households, while 80,320 (37.7%) are nonfamily households. The most numerous type of family households are 2-person households, comprising 60,642, and the most common type of nonfamily households are 1-person households, comprising 66,036.
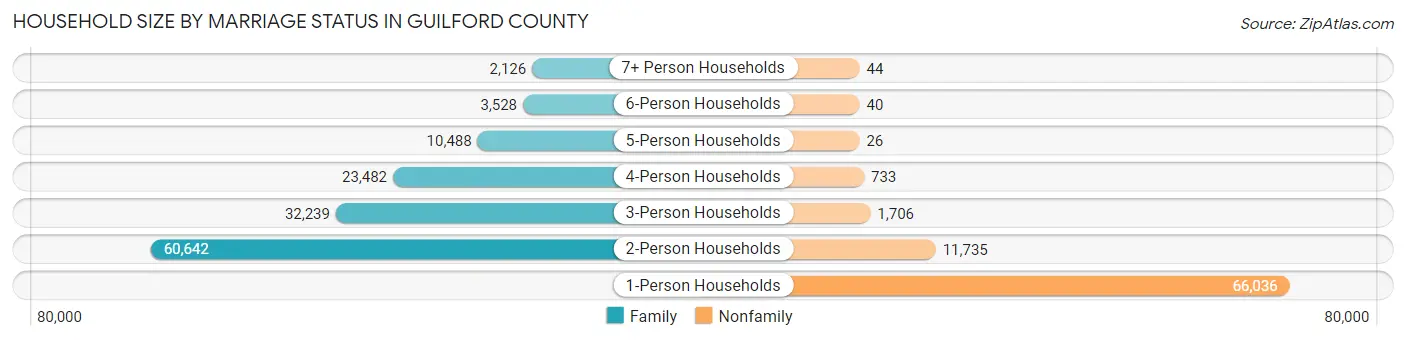
| Household Size | Family Households | Nonfamily Households |
| 1-Person Households | - | 66,036 (31.0%) |
| 2-Person Households | 60,642 (28.5%) | 11,735 (5.5%) |
| 3-Person Households | 32,239 (15.1%) | 1,706 (0.8%) |
| 4-Person Households | 23,482 (11.0%) | 733 (0.3%) |
| 5-Person Households | 10,488 (4.9%) | 26 (0.0%) |
| 6-Person Households | 3,528 (1.7%) | 40 (0.0%) |
| 7+ Person Households | 2,126 (1.0%) | 44 (0.0%) |
| Total | 132,505 (62.3%) | 80,320 (37.7%) |
Female Fertility in Guilford County
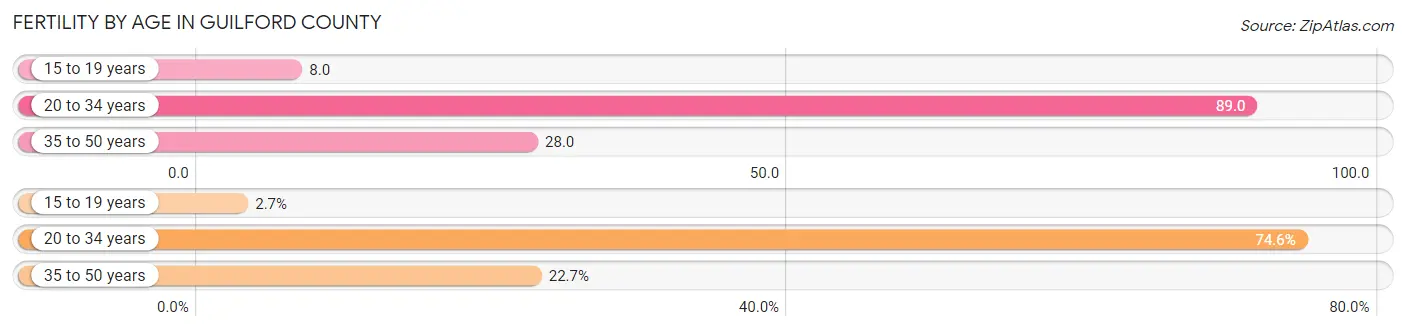
Fertility by Age in Guilford County
Average fertility rate in Guilford County is 51.0 births per 1,000 women. Women in the age bracket of 20 to 34 years have the highest fertility rate with 89.0 births per 1,000 women. Women in the age bracket of 20 to 34 years acount for 74.6% of all women with births.
| Age Bracket | Women with Births | Births / 1,000 Women |
| 15 to 19 years | 192 (2.7%) | 8.0 |
| 20 to 34 years | 5,257 (74.6%) | 89.0 |
| 35 to 50 years | 1,596 (22.7%) | 28.0 |
| Total | 7,045 (100.0%) | 51.0 |
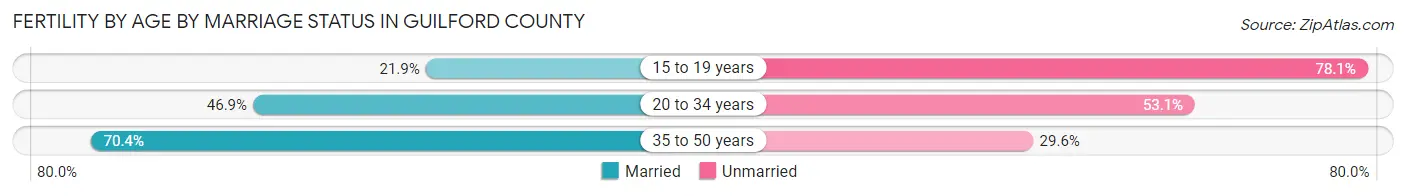
Fertility by Age by Marriage Status in Guilford County
51.6% of women with births (7,045) in Guilford County are married. The highest percentage of unmarried women with births falls into 15 to 19 years age bracket with 78.1% of them unmarried at the time of birth, while the lowest percentage of unmarried women with births belong to 35 to 50 years age bracket with 29.6% of them unmarried.
| Age Bracket | Married | Unmarried |
| 15 to 19 years | 42 (21.9%) | 150 (78.1%) |
| 20 to 34 years | 2,466 (46.9%) | 2,791 (53.1%) |
| 35 to 50 years | 1,124 (70.4%) | 472 (29.6%) |
| Total | 3,635 (51.6%) | 3,410 (48.4%) |
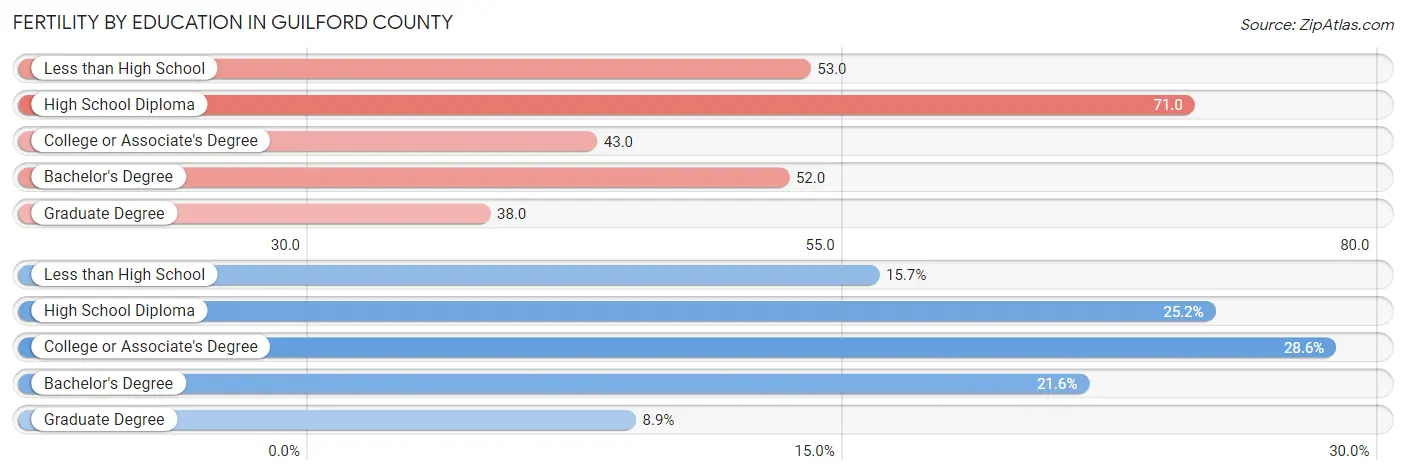
Fertility by Education in Guilford County
Average fertility rate in Guilford County is 51.0 births per 1,000 women. Women with the education attainment of high school diploma have the highest fertility rate of 71.0 births per 1,000 women, while women with the education attainment of graduate degree have the lowest fertility at 38.0 births per 1,000 women. Women with the education attainment of college or associate's degree represent 28.6% of all women with births.
| Educational Attainment | Women with Births | Births / 1,000 Women |
| Less than High School | 1,108 (15.7%) | 53.0 |
| High School Diploma | 1,774 (25.2%) | 71.0 |
| College or Associate's Degree | 2,013 (28.6%) | 43.0 |
| Bachelor's Degree | 1,524 (21.6%) | 52.0 |
| Graduate Degree | 626 (8.9%) | 38.0 |
| Total | 7,045 (100.0%) | 51.0 |
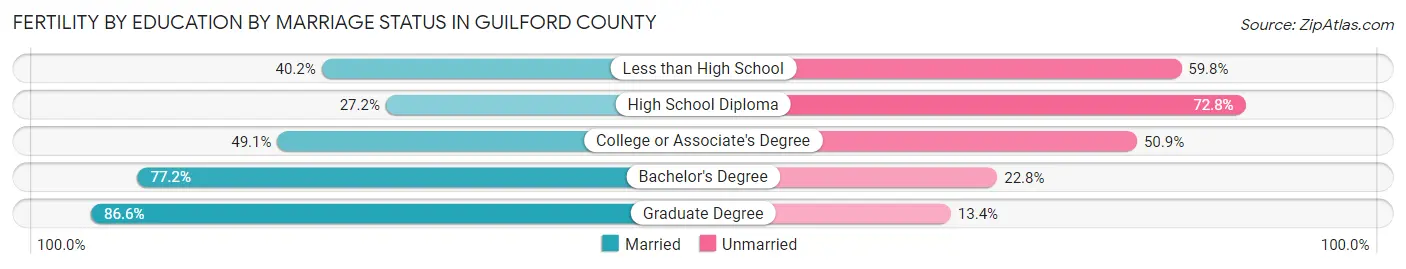
Fertility by Education by Marriage Status in Guilford County
48.4% of women with births in Guilford County are unmarried. Women with the educational attainment of graduate degree are most likely to be married with 86.6% of them married at childbirth, while women with the educational attainment of high school diploma are least likely to be married with 72.8% of them unmarried at childbirth.
| Educational Attainment | Married | Unmarried |
| Less than High School | 445 (40.2%) | 663 (59.8%) |
| High School Diploma | 483 (27.2%) | 1,291 (72.8%) |
| College or Associate's Degree | 988 (49.1%) | 1,025 (50.9%) |
| Bachelor's Degree | 1,177 (77.2%) | 347 (22.8%) |
| Graduate Degree | 542 (86.6%) | 84 (13.4%) |
| Total | 3,635 (51.6%) | 3,410 (48.4%) |
Income in Guilford County
Income Overview in Guilford County
Per Capita Income in Guilford County is $36,563, while median incomes of families and households are $80,635 and $62,880 respectively.
| Characteristic | Number | Measure |
| Per Capita Income | 539,557 | $36,563 |
| Median Family Income | 132,505 | $80,635 |
| Mean Family Income | 132,505 | $107,738 |
| Median Household Income | 212,825 | $62,880 |
| Mean Household Income | 212,825 | $90,034 |
| Income Deficit | 132,505 | $11,040 |
| Wage / Income Gap (%) | 539,557 | 24.14% |
| Wage / Income Gap ($) | 539,557 | 75.86¢ per $1 |
| Gini / Inequality Index | 539,557 | 0.49 |
Earnings by Sex in Guilford County
Average Earnings in Guilford County are $36,562, $42,401 for men and $32,165 for women, a difference of 24.1%.
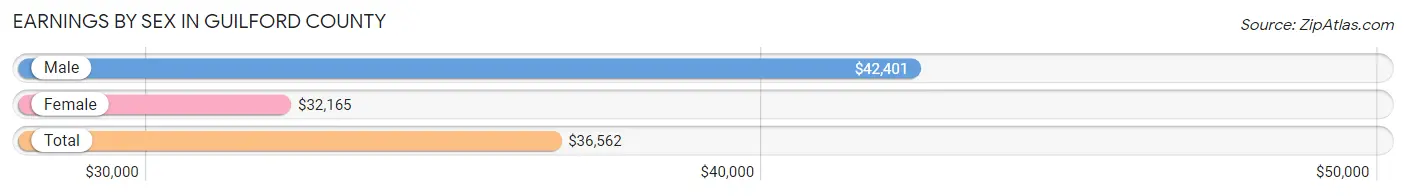
| Sex | Number | Average Earnings |
| Male | 146,137 (49.9%) | $42,401 |
| Female | 146,755 (50.1%) | $32,165 |
| Total | 292,892 (100.0%) | $36,562 |
Earnings by Sex by Income Bracket in Guilford County
The most common earnings brackets in Guilford County are $100,000+ for men (24,275 | 16.6%) and $2,499 or less for women (10,318 | 7.0%).
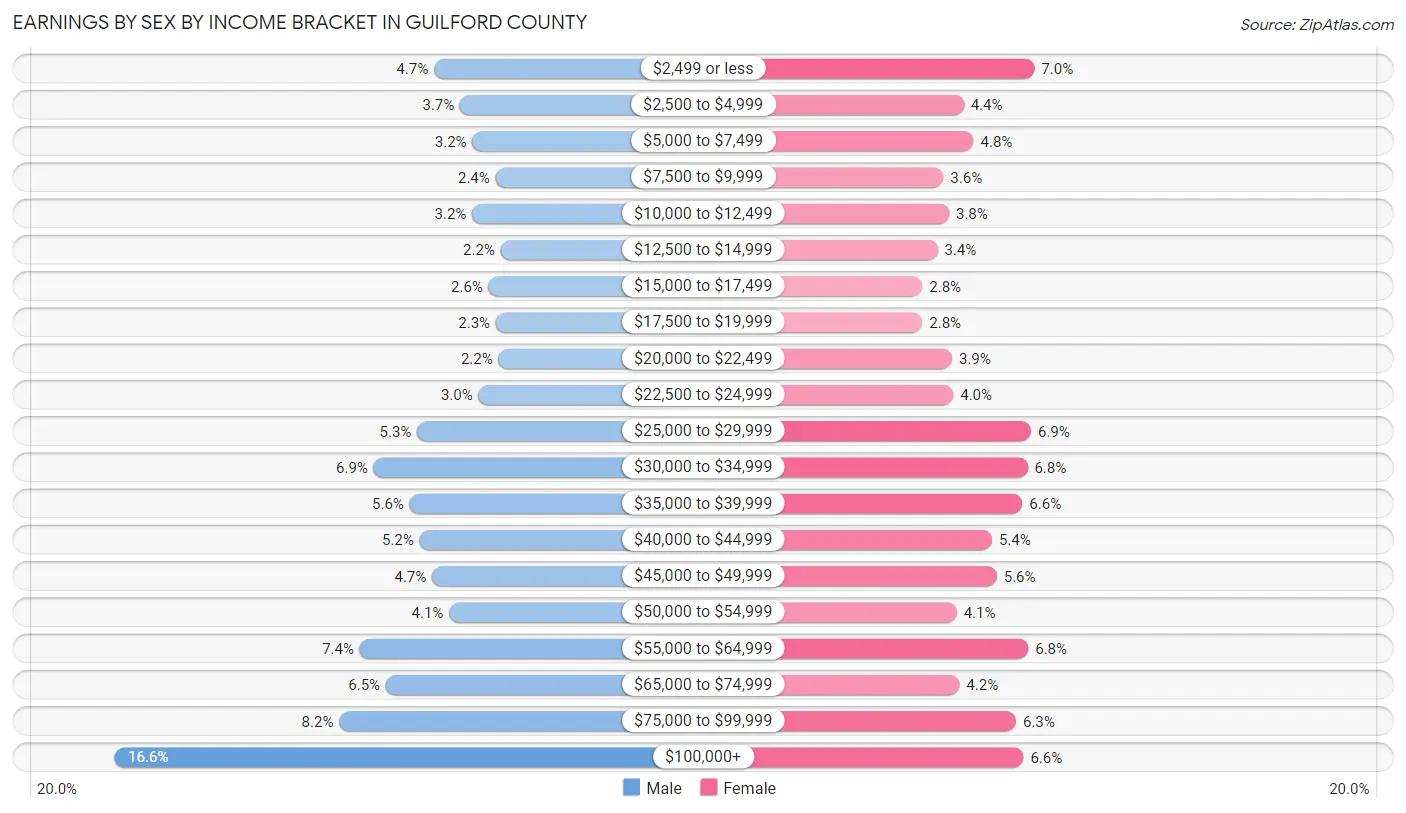
| Income | Male | Female |
| $2,499 or less | 6,813 (4.7%) | 10,318 (7.0%) |
| $2,500 to $4,999 | 5,378 (3.7%) | 6,425 (4.4%) |
| $5,000 to $7,499 | 4,709 (3.2%) | 6,973 (4.8%) |
| $7,500 to $9,999 | 3,428 (2.4%) | 5,310 (3.6%) |
| $10,000 to $12,499 | 4,713 (3.2%) | 5,615 (3.8%) |
| $12,500 to $14,999 | 3,162 (2.2%) | 4,990 (3.4%) |
| $15,000 to $17,499 | 3,817 (2.6%) | 4,146 (2.8%) |
| $17,500 to $19,999 | 3,416 (2.3%) | 4,148 (2.8%) |
| $20,000 to $22,499 | 3,280 (2.2%) | 5,789 (3.9%) |
| $22,500 to $24,999 | 4,366 (3.0%) | 5,853 (4.0%) |
| $25,000 to $29,999 | 7,737 (5.3%) | 10,124 (6.9%) |
| $30,000 to $34,999 | 10,111 (6.9%) | 9,930 (6.8%) |
| $35,000 to $39,999 | 8,143 (5.6%) | 9,656 (6.6%) |
| $40,000 to $44,999 | 7,598 (5.2%) | 7,981 (5.4%) |
| $45,000 to $49,999 | 6,905 (4.7%) | 8,252 (5.6%) |
| $50,000 to $54,999 | 5,977 (4.1%) | 6,050 (4.1%) |
| $55,000 to $64,999 | 10,875 (7.4%) | 9,973 (6.8%) |
| $65,000 to $74,999 | 9,442 (6.5%) | 6,200 (4.2%) |
| $75,000 to $99,999 | 11,992 (8.2%) | 9,307 (6.3%) |
| $100,000+ | 24,275 (16.6%) | 9,715 (6.6%) |
| Total | 146,137 (100.0%) | 146,755 (100.0%) |
Earnings by Sex by Educational Attainment in Guilford County
Average earnings in Guilford County are $50,135 for men and $37,633 for women, a difference of 24.9%. Men with an educational attainment of graduate degree enjoy the highest average annual earnings of $89,926, while those with less than high school education earn the least with $30,409. Women with an educational attainment of graduate degree earn the most with the average annual earnings of $59,031, while those with less than high school education have the smallest earnings of $21,734.
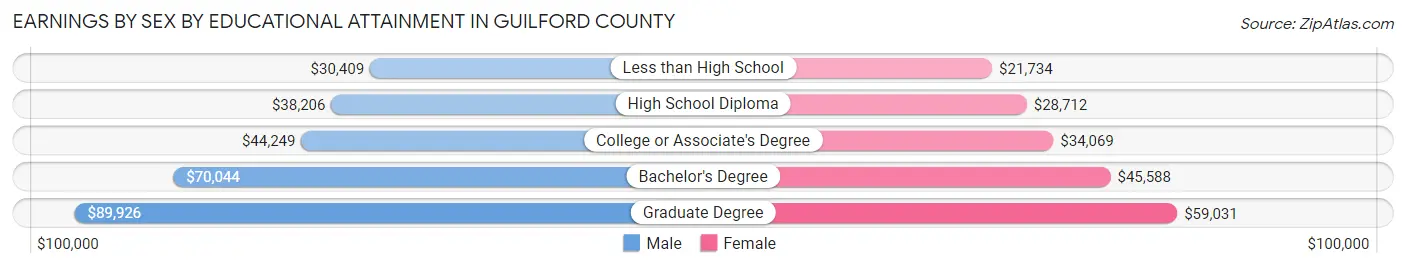
| Educational Attainment | Male Income | Female Income |
| Less than High School | $30,409 | $21,734 |
| High School Diploma | $38,206 | $28,712 |
| College or Associate's Degree | $44,249 | $34,069 |
| Bachelor's Degree | $70,044 | $45,588 |
| Graduate Degree | $89,926 | $59,031 |
| Total | $50,135 | $37,633 |
Family Income in Guilford County
Family Income Brackets in Guilford County
According to the Guilford County family income data, there are 26,103 families falling into the $100,000 to $149,999 income range, which is the most common income bracket and makes up 19.7% of all families. Conversely, the $10,000 to $14,999 income bracket is the least frequent group with only 3,445 families (2.6%) belonging to this category.
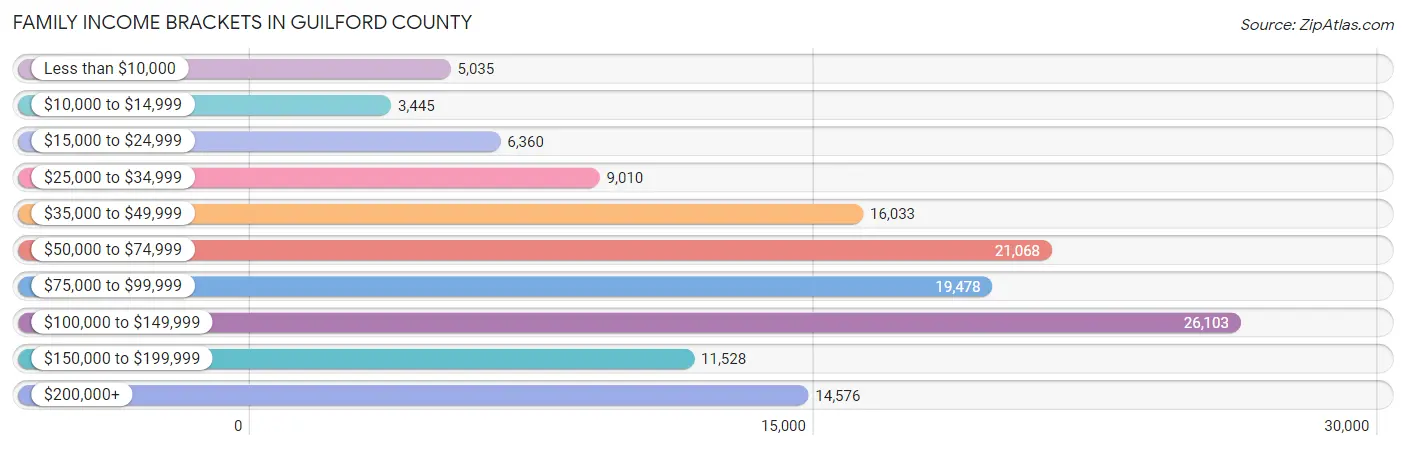
| Income Bracket | # Families | % Families |
| Less than $10,000 | 5,035 | 3.8% |
| $10,000 to $14,999 | 3,445 | 2.6% |
| $15,000 to $24,999 | 6,360 | 4.8% |
| $25,000 to $34,999 | 9,010 | 6.8% |
| $35,000 to $49,999 | 16,033 | 12.1% |
| $50,000 to $74,999 | 21,068 | 15.9% |
| $75,000 to $99,999 | 19,478 | 14.7% |
| $100,000 to $149,999 | 26,103 | 19.7% |
| $150,000 to $199,999 | 11,528 | 8.7% |
| $200,000+ | 14,576 | 11.0% |
Family Income by Famaliy Size in Guilford County
4-person families (22,649 | 17.1%) account for the highest median family income in Guilford County with $104,241 per family, while 2-person families (65,343 | 49.3%) have the highest median income of $36,308 per family member.
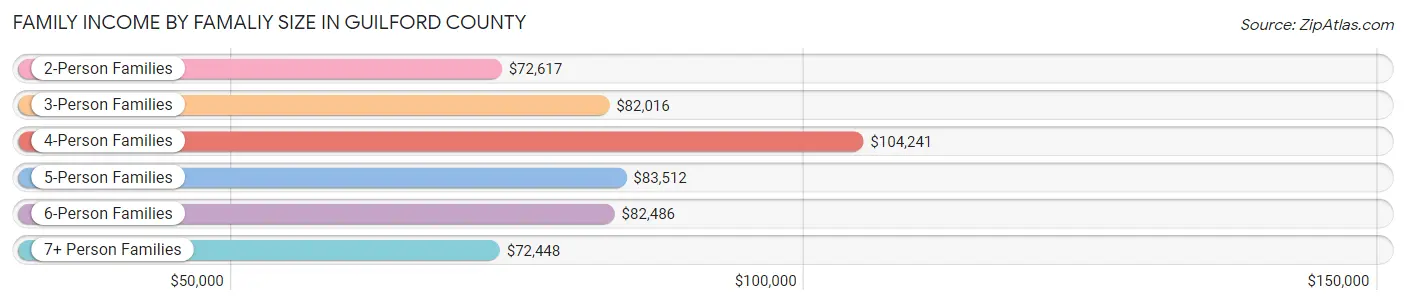
| Income Bracket | # Families | Median Income |
| 2-Person Families | 65,343 (49.3%) | $72,617 |
| 3-Person Families | 30,549 (23.1%) | $82,016 |
| 4-Person Families | 22,649 (17.1%) | $104,241 |
| 5-Person Families | 9,027 (6.8%) | $83,512 |
| 6-Person Families | 3,023 (2.3%) | $82,486 |
| 7+ Person Families | 1,914 (1.4%) | $72,448 |
| Total | 132,505 (100.0%) | $80,635 |
Family Income by Number of Earners in Guilford County
The median family income in Guilford County is $80,635, with families comprising 3+ earners (13,253) having the highest median family income of $124,303, while families with no earners (19,060) have the lowest median family income of $49,707, accounting for 10.0% and 14.4% of families, respectively.
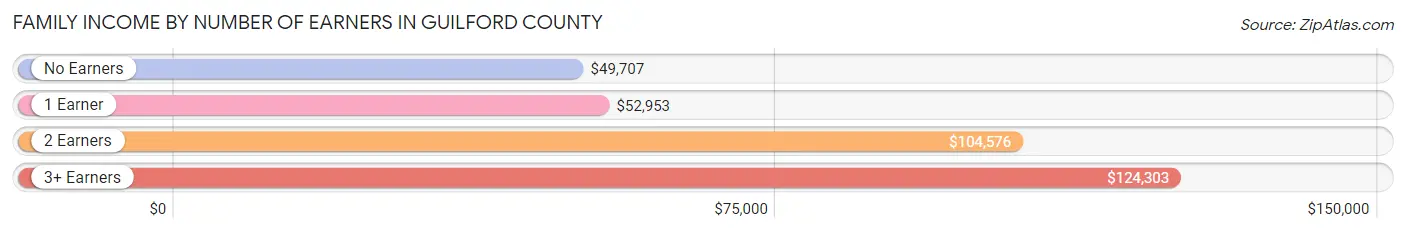
| Number of Earners | # Families | Median Income |
| No Earners | 19,060 (14.4%) | $49,707 |
| 1 Earner | 46,058 (34.8%) | $52,953 |
| 2 Earners | 54,134 (40.8%) | $104,576 |
| 3+ Earners | 13,253 (10.0%) | $124,303 |
| Total | 132,505 (100.0%) | $80,635 |
Household Income in Guilford County
Household Income Brackets in Guilford County
With 34,690 households falling in the category, the $50,000 to $74,999 income range is the most frequent in Guilford County, accounting for 16.3% of all households. In contrast, only 9,364 households (4.4%) fall into the $10,000 to $14,999 income bracket, making it the least populous group.
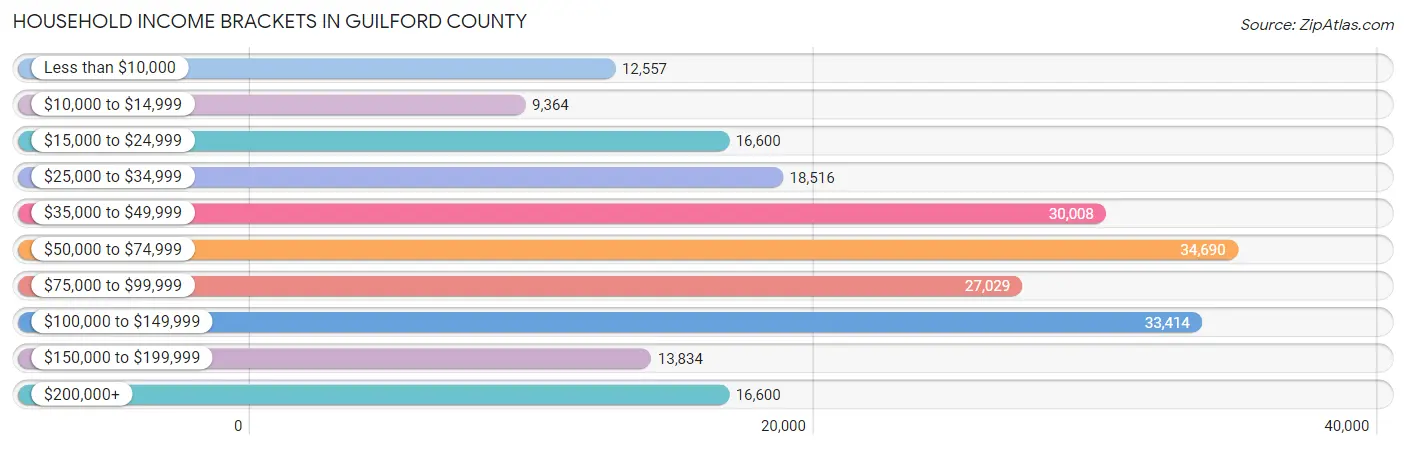
| Income Bracket | # Households | % Households |
| Less than $10,000 | 12,557 | 5.9% |
| $10,000 to $14,999 | 9,364 | 4.4% |
| $15,000 to $24,999 | 16,600 | 7.8% |
| $25,000 to $34,999 | 18,516 | 8.7% |
| $35,000 to $49,999 | 30,008 | 14.1% |
| $50,000 to $74,999 | 34,690 | 16.3% |
| $75,000 to $99,999 | 27,029 | 12.7% |
| $100,000 to $149,999 | 33,414 | 15.7% |
| $150,000 to $199,999 | 13,834 | 6.5% |
| $200,000+ | 16,600 | 7.8% |
Household Income by Householder Age in Guilford County
The median household income in Guilford County is $62,880, with the highest median household income of $78,194 found in the 45 to 64 years age bracket for the primary householder. A total of 79,285 households (37.2%) fall into this category. Meanwhile, the 15 to 24 years age bracket for the primary householder has the lowest median household income of $35,671, with 10,129 households (4.8%) in this group.
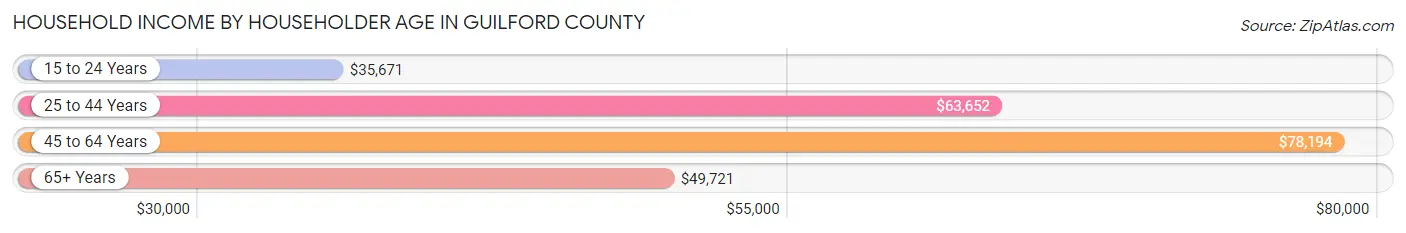
| Income Bracket | # Households | Median Income |
| 15 to 24 Years | 10,129 (4.8%) | $35,671 |
| 25 to 44 Years | 71,291 (33.5%) | $63,652 |
| 45 to 64 Years | 79,285 (37.2%) | $78,194 |
| 65+ Years | 52,120 (24.5%) | $49,721 |
| Total | 212,825 (100.0%) | $62,880 |
Poverty in Guilford County
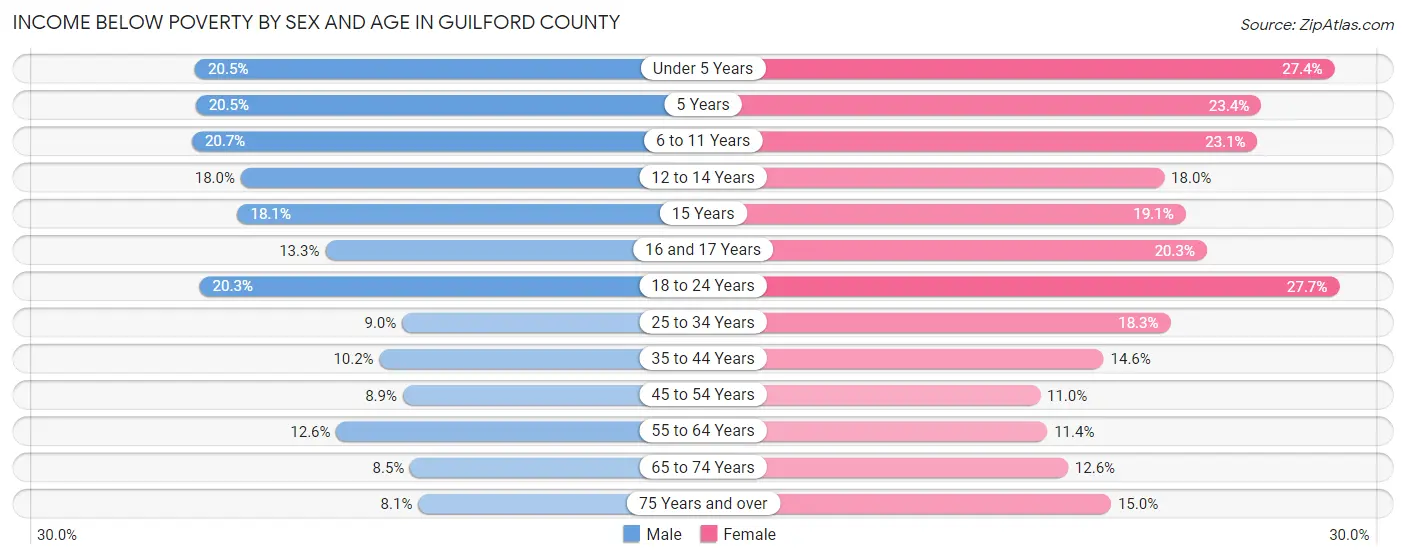
Income Below Poverty by Sex and Age in Guilford County
With 13.0% poverty level for males and 17.0% for females among the residents of Guilford County, 6 to 11 year old males and 18 to 24 year old females are the most vulnerable to poverty, with 4,232 males (20.7%) and 6,791 females (27.7%) in their respective age groups living below the poverty level.
| Age Bracket | Male | Female |
| Under 5 Years | 3,146 (20.5%) | 3,979 (27.4%) |
| 5 Years | 563 (20.5%) | 521 (23.4%) |
| 6 to 11 Years | 4,232 (20.7%) | 4,510 (23.1%) |
| 12 to 14 Years | 1,796 (18.0%) | 1,893 (17.9%) |
| 15 Years | 718 (18.1%) | 758 (19.1%) |
| 16 and 17 Years | 887 (13.3%) | 1,286 (20.3%) |
| 18 to 24 Years | 4,718 (20.3%) | 6,791 (27.7%) |
| 25 to 34 Years | 3,054 (9.0%) | 6,917 (18.3%) |
| 35 to 44 Years | 3,181 (10.2%) | 5,035 (14.6%) |
| 45 to 54 Years | 2,941 (8.9%) | 3,925 (11.0%) |
| 55 to 64 Years | 4,011 (12.6%) | 3,957 (11.4%) |
| 65 to 74 Years | 1,890 (8.5%) | 3,381 (12.6%) |
| 75 Years and over | 1,054 (8.1%) | 2,941 (15.0%) |
| Total | 32,191 (13.0%) | 45,894 (17.0%) |
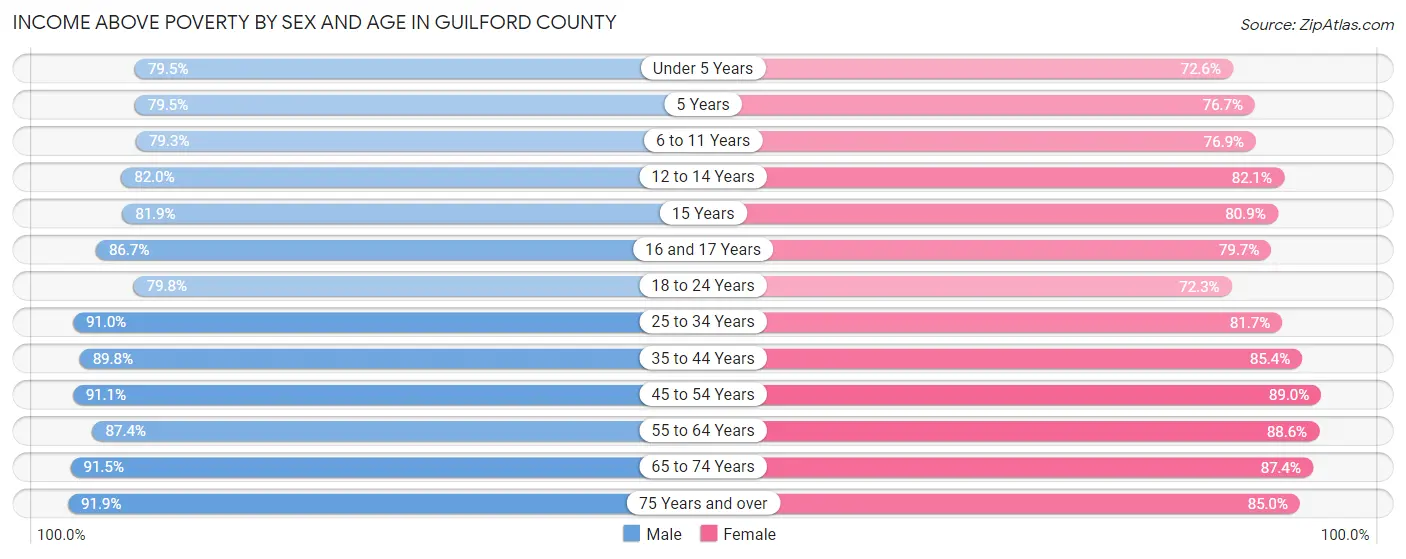
Income Above Poverty by Sex and Age in Guilford County
According to the poverty statistics in Guilford County, males aged 75 years and over and females aged 45 to 54 years are the age groups that are most secure financially, with 91.9% of males and 89.0% of females in these age groups living above the poverty line.
| Age Bracket | Male | Female |
| Under 5 Years | 12,203 (79.5%) | 10,529 (72.6%) |
| 5 Years | 2,187 (79.5%) | 1,710 (76.6%) |
| 6 to 11 Years | 16,235 (79.3%) | 14,977 (76.9%) |
| 12 to 14 Years | 8,205 (82.0%) | 8,651 (82.1%) |
| 15 Years | 3,241 (81.9%) | 3,203 (80.9%) |
| 16 and 17 Years | 5,802 (86.7%) | 5,043 (79.7%) |
| 18 to 24 Years | 18,578 (79.7%) | 17,738 (72.3%) |
| 25 to 34 Years | 30,946 (91.0%) | 30,905 (81.7%) |
| 35 to 44 Years | 27,872 (89.8%) | 29,489 (85.4%) |
| 45 to 54 Years | 29,969 (91.1%) | 31,631 (89.0%) |
| 55 to 64 Years | 27,724 (87.4%) | 30,627 (88.6%) |
| 65 to 74 Years | 20,268 (91.5%) | 23,476 (87.4%) |
| 75 Years and over | 11,985 (91.9%) | 16,680 (85.0%) |
| Total | 215,215 (87.0%) | 224,659 (83.0%) |
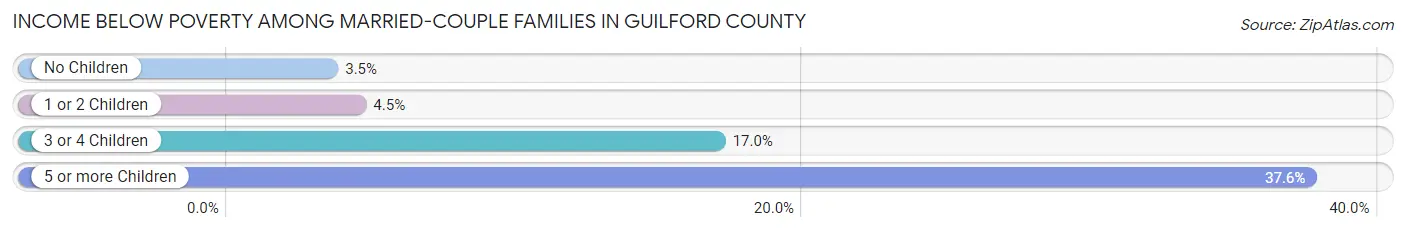
Income Below Poverty Among Married-Couple Families in Guilford County
The poverty statistics for married-couple families in Guilford County show that 5.1% or 4,518 of the total 89,004 families live below the poverty line. Families with 5 or more children have the highest poverty rate of 37.6%, comprising of 287 families. On the other hand, families with no children have the lowest poverty rate of 3.5%, which includes 1,819 families.
| Children | Above Poverty | Below Poverty |
| No Children | 50,279 (96.5%) | 1,819 (3.5%) |
| 1 or 2 Children | 28,444 (95.5%) | 1,331 (4.5%) |
| 3 or 4 Children | 5,286 (83.0%) | 1,081 (17.0%) |
| 5 or more Children | 477 (62.4%) | 287 (37.6%) |
| Total | 84,486 (94.9%) | 4,518 (5.1%) |
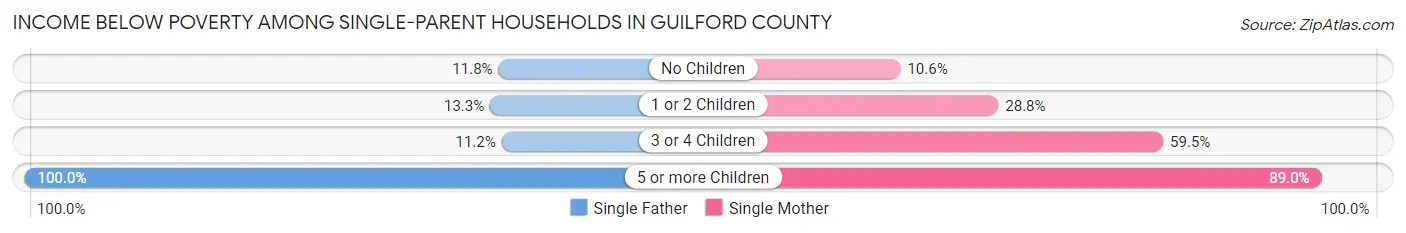
Income Below Poverty Among Single-Parent Households in Guilford County
According to the poverty data in Guilford County, 12.6% or 1,321 single-father households and 26.2% or 8,648 single-mother households are living below the poverty line. Among single-father households, those with 5 or more children have the highest poverty rate, with 14 households (100.0%) experiencing poverty. Likewise, among single-mother households, those with 5 or more children have the highest poverty rate, with 315 households (89.0%) falling below the poverty line.
| Children | Single Father | Single Mother |
| No Children | 577 (11.7%) | 1,229 (10.6%) |
| 1 or 2 Children | 670 (13.3%) | 5,074 (28.8%) |
| 3 or 4 Children | 60 (11.2%) | 2,030 (59.5%) |
| 5 or more Children | 14 (100.0%) | 315 (89.0%) |
| Total | 1,321 (12.6%) | 8,648 (26.2%) |
Income Below Poverty Among Married-Couple vs Single-Parent Households in Guilford County
The poverty data for Guilford County shows that 4,518 of the married-couple family households (5.1%) and 9,969 of the single-parent households (22.9%) are living below the poverty level. Within the married-couple family households, those with 5 or more children have the highest poverty rate, with 287 households (37.6%) falling below the poverty line. Among the single-parent households, those with 5 or more children have the highest poverty rate, with 329 household (89.4%) living below poverty.
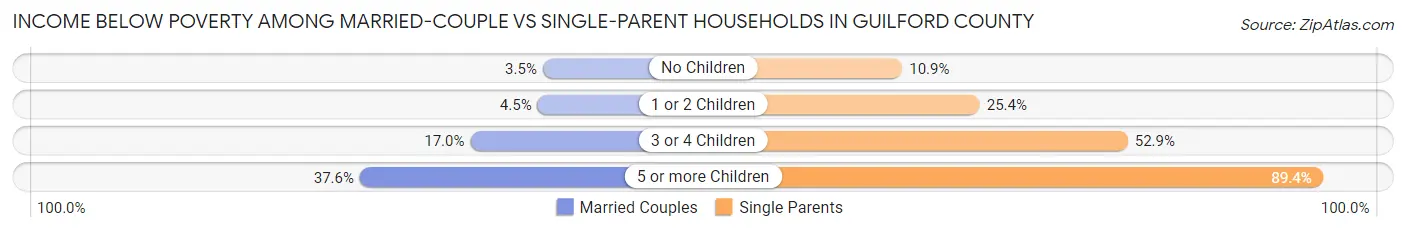
| Children | Married-Couple Families | Single-Parent Households |
| No Children | 1,819 (3.5%) | 1,806 (10.9%) |
| 1 or 2 Children | 1,331 (4.5%) | 5,744 (25.4%) |
| 3 or 4 Children | 1,081 (17.0%) | 2,090 (52.9%) |
| 5 or more Children | 287 (37.6%) | 329 (89.4%) |
| Total | 4,518 (5.1%) | 9,969 (22.9%) |
Employment Characteristics in Guilford County
Employment by Class of Employer in Guilford County
Among the 257,749 employed individuals in Guilford County, private company employees (179,490 | 69.6%), not-for-profit organizations (21,412 | 8.3%), and local government employees (15,269 | 5.9%) make up the most common classes of employment.
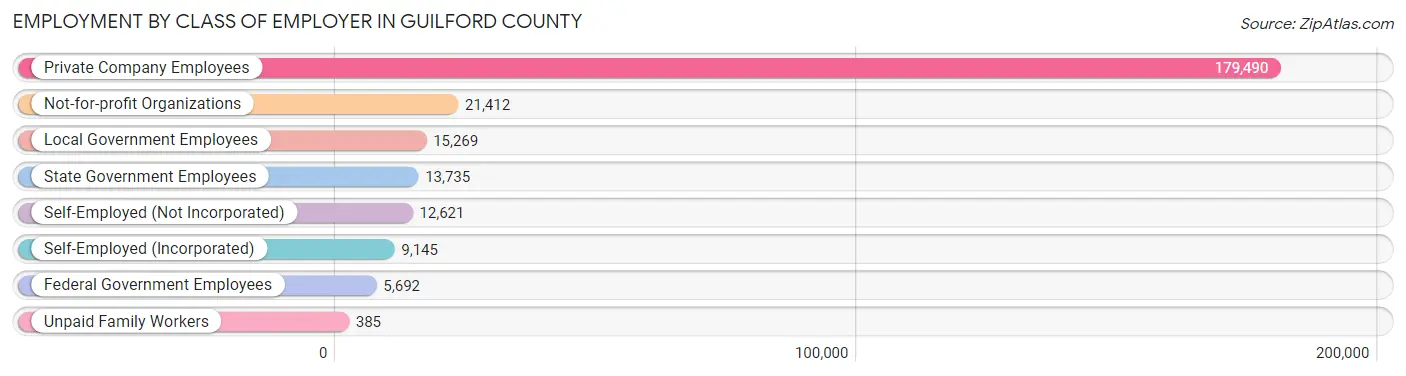
| Employer Class | # Employees | % Employees |
| Private Company Employees | 179,490 | 69.6% |
| Self-Employed (Incorporated) | 9,145 | 3.5% |
| Self-Employed (Not Incorporated) | 12,621 | 4.9% |
| Not-for-profit Organizations | 21,412 | 8.3% |
| Local Government Employees | 15,269 | 5.9% |
| State Government Employees | 13,735 | 5.3% |
| Federal Government Employees | 5,692 | 2.2% |
| Unpaid Family Workers | 385 | 0.2% |
| Total | 257,749 | 100.0% |
Employment Status by Age in Guilford County
According to the labor force statistics for Guilford County, out of the total population over 16 years of age (434,425), 64.1% or 278,466 individuals are in the labor force, with 5.2% or 14,480 of them unemployed. The age group with the highest labor force participation rate is 25 to 29 years, with 85.7% or 31,646 individuals in the labor force. Within the labor force, the 16 to 19 years age range has the highest percentage of unemployed individuals, with 15.7% or 2,090 of them being unemployed.
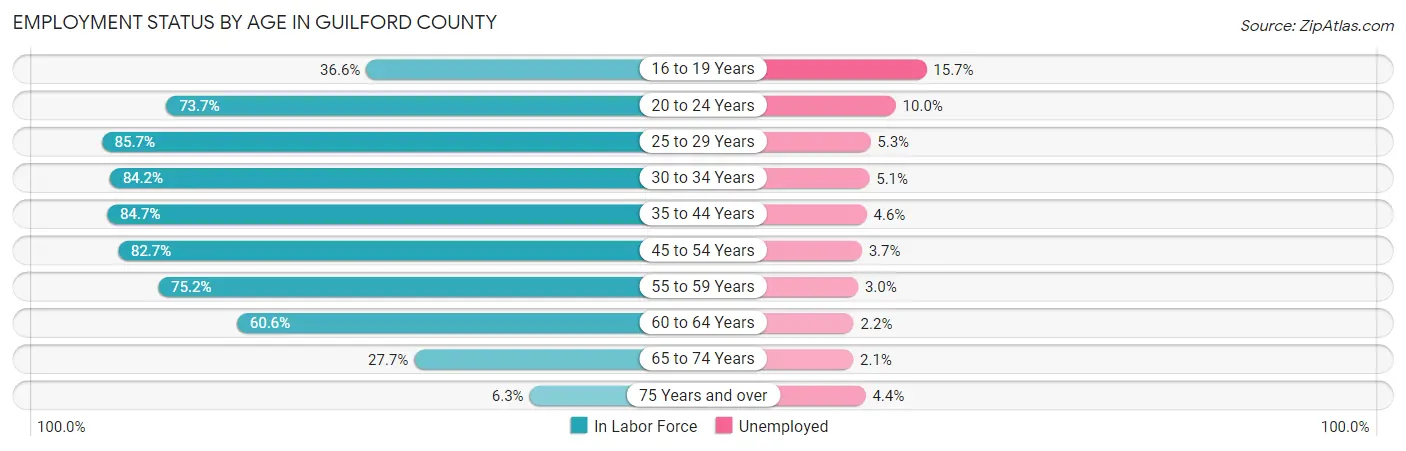
| Age Bracket | In Labor Force | Unemployed |
| 16 to 19 Years | 13,309 (36.6%) | 2,090 (15.7%) |
| 20 to 24 Years | 29,864 (73.7%) | 2,986 (10.0%) |
| 25 to 29 Years | 31,646 (85.7%) | 1,677 (5.3%) |
| 30 to 34 Years | 29,937 (84.2%) | 1,527 (5.1%) |
| 35 to 44 Years | 55,726 (84.7%) | 2,563 (4.6%) |
| 45 to 54 Years | 56,855 (82.7%) | 2,104 (3.7%) |
| 55 to 59 Years | 25,844 (75.2%) | 775 (3.0%) |
| 60 to 64 Years | 19,597 (60.6%) | 431 (2.2%) |
| 65 to 74 Years | 13,716 (27.7%) | 288 (2.1%) |
| 75 Years and over | 2,161 (6.3%) | 95 (4.4%) |
| Total | 278,466 (64.1%) | 14,480 (5.2%) |
Employment Status by Educational Attainment in Guilford County
According to labor force statistics for Guilford County, 80.2% of individuals (219,529) out of the total population between 25 and 64 years of age (273,727) are in the labor force, with 4.1% or 9,001 of them being unemployed. The group with the highest labor force participation rate are those with the educational attainment of bachelor's degree or higher, with 86.9% or 92,994 individuals in the labor force. Within the labor force, individuals with less than high school education have the highest percentage of unemployment, with 6.6% or 1,080 of them being unemployed.
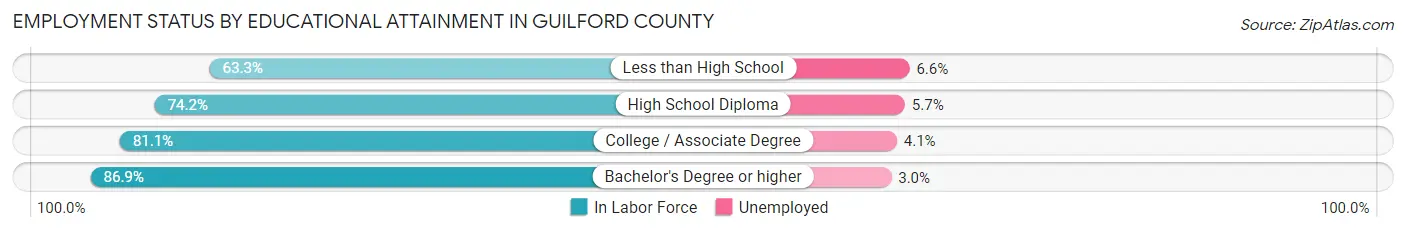
| Educational Attainment | In Labor Force | Unemployed |
| Less than High School | 16,366 (63.3%) | 1,706 (6.6%) |
| High School Diploma | 42,420 (74.2%) | 3,259 (5.7%) |
| College / Associate Degree | 67,873 (81.1%) | 3,431 (4.1%) |
| Bachelor's Degree or higher | 92,994 (86.9%) | 3,210 (3.0%) |
| Total | 219,529 (80.2%) | 11,223 (4.1%) |
Employment Occupations by Sex in Guilford County
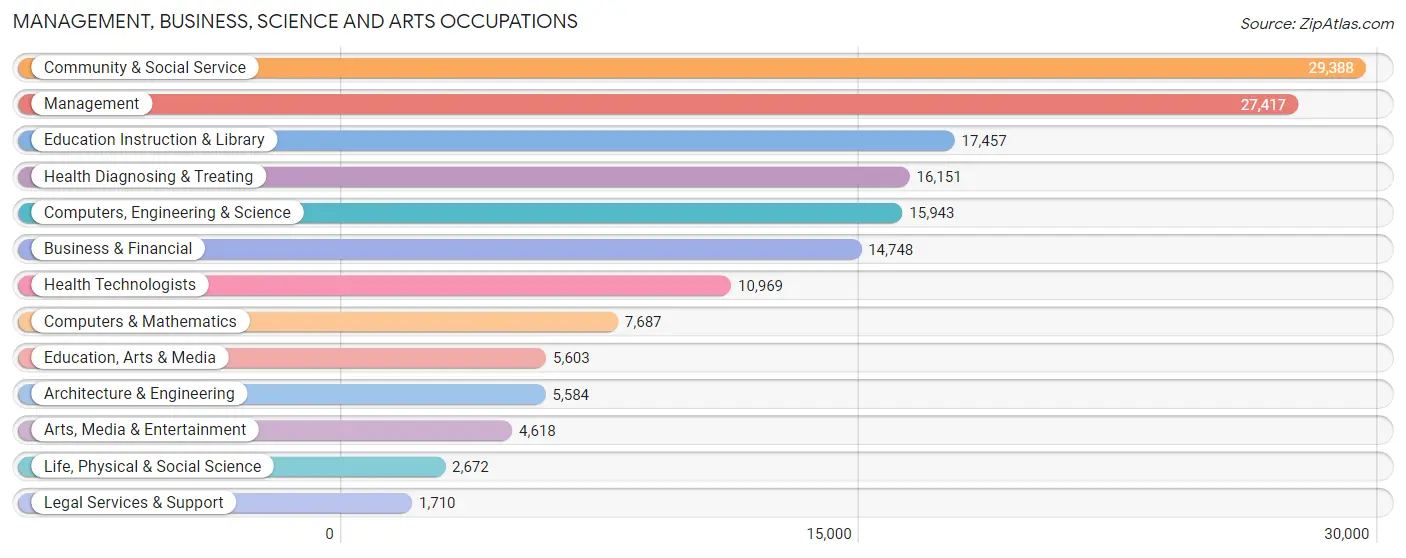
Management, Business, Science and Arts Occupations
The most common Management, Business, Science and Arts occupations in Guilford County are Community & Social Service (29,388 | 11.2%), Management (27,417 | 10.4%), Education Instruction & Library (17,457 | 6.6%), Health Diagnosing & Treating (16,151 | 6.1%), and Computers, Engineering & Science (15,943 | 6.0%).
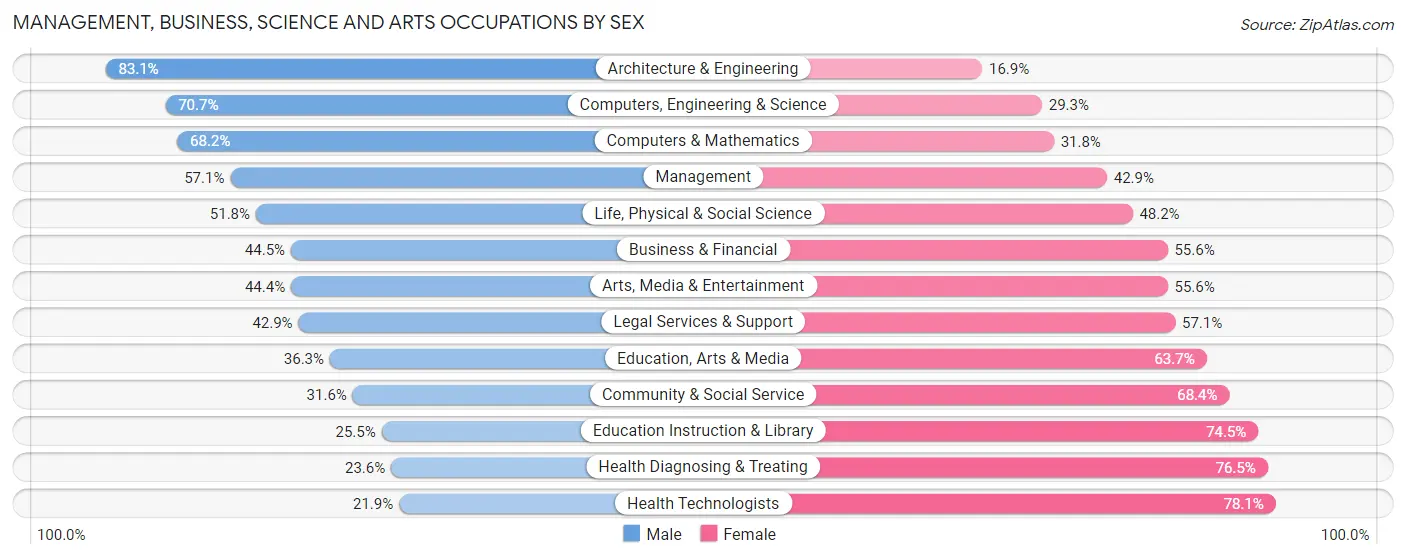
Management, Business, Science and Arts Occupations by Sex
Within the Management, Business, Science and Arts occupations in Guilford County, the most male-oriented occupations are Architecture & Engineering (83.1%), Computers, Engineering & Science (70.7%), and Computers & Mathematics (68.2%), while the most female-oriented occupations are Health Technologists (78.1%), Health Diagnosing & Treating (76.4%), and Education Instruction & Library (74.5%).
| Occupation | Male | Female |
| Management | 15,654 (57.1%) | 11,763 (42.9%) |
| Business & Financial | 6,556 (44.5%) | 8,192 (55.5%) |
| Computers, Engineering & Science | 11,266 (70.7%) | 4,677 (29.3%) |
| Computers & Mathematics | 5,241 (68.2%) | 2,446 (31.8%) |
| Architecture & Engineering | 4,642 (83.1%) | 942 (16.9%) |
| Life, Physical & Social Science | 1,383 (51.8%) | 1,289 (48.2%) |
| Community & Social Service | 9,276 (31.6%) | 20,112 (68.4%) |
| Education, Arts & Media | 2,035 (36.3%) | 3,568 (63.7%) |
| Legal Services & Support | 733 (42.9%) | 977 (57.1%) |
| Education Instruction & Library | 4,456 (25.5%) | 13,001 (74.5%) |
| Arts, Media & Entertainment | 2,052 (44.4%) | 2,566 (55.6%) |
| Health Diagnosing & Treating | 3,804 (23.5%) | 12,347 (76.4%) |
| Health Technologists | 2,400 (21.9%) | 8,569 (78.1%) |
| Total (Category) | 46,556 (44.9%) | 57,091 (55.1%) |
| Total (Overall) | 132,614 (50.3%) | 130,970 (49.7%) |
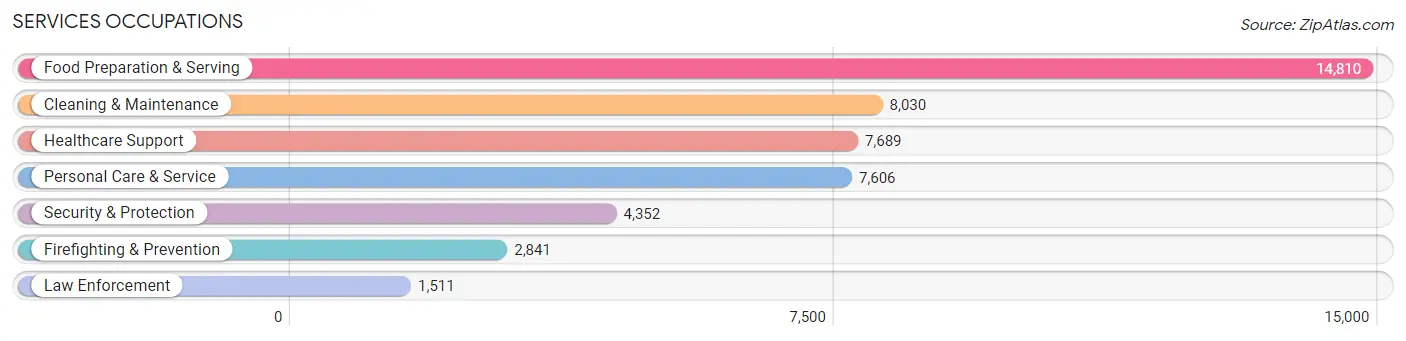
Services Occupations
The most common Services occupations in Guilford County are Food Preparation & Serving (14,810 | 5.6%), Cleaning & Maintenance (8,030 | 3.0%), Healthcare Support (7,689 | 2.9%), Personal Care & Service (7,606 | 2.9%), and Security & Protection (4,352 | 1.7%).
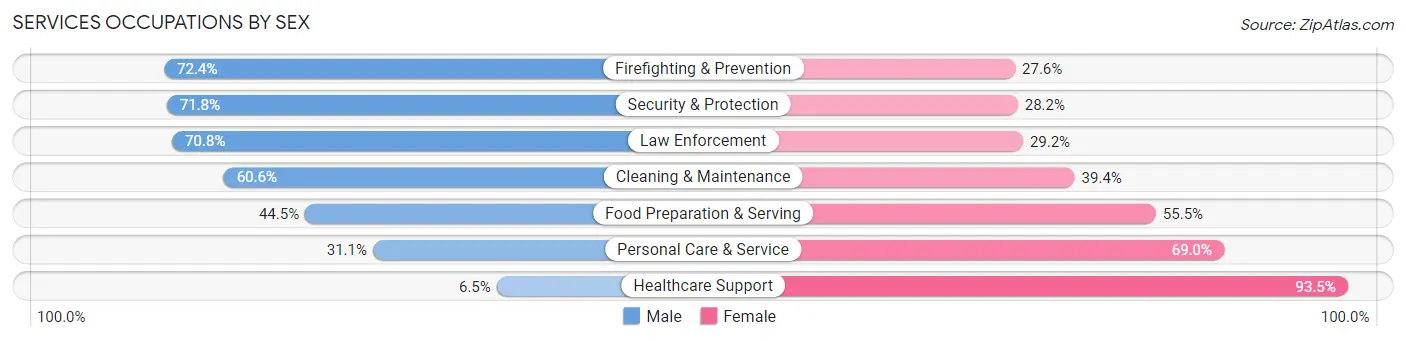
Services Occupations by Sex
Within the Services occupations in Guilford County, the most male-oriented occupations are Firefighting & Prevention (72.4%), Security & Protection (71.8%), and Law Enforcement (70.8%), while the most female-oriented occupations are Healthcare Support (93.5%), Personal Care & Service (69.0%), and Food Preparation & Serving (55.5%).
| Occupation | Male | Female |
| Healthcare Support | 502 (6.5%) | 7,187 (93.5%) |
| Security & Protection | 3,126 (71.8%) | 1,226 (28.2%) |
| Firefighting & Prevention | 2,056 (72.4%) | 785 (27.6%) |
| Law Enforcement | 1,070 (70.8%) | 441 (29.2%) |
| Food Preparation & Serving | 6,587 (44.5%) | 8,223 (55.5%) |
| Cleaning & Maintenance | 4,864 (60.6%) | 3,166 (39.4%) |
| Personal Care & Service | 2,362 (31.0%) | 5,244 (69.0%) |
| Total (Category) | 17,441 (41.0%) | 25,046 (59.0%) |
| Total (Overall) | 132,614 (50.3%) | 130,970 (49.7%) |
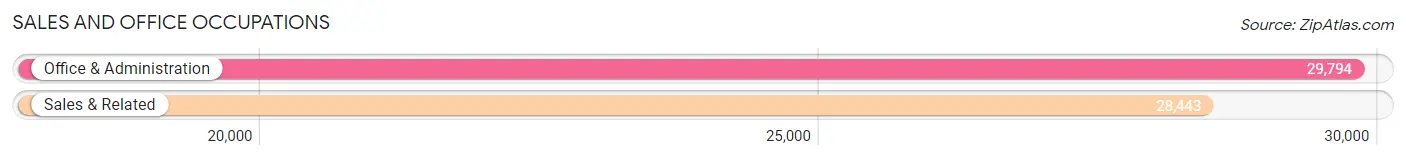
Sales and Office Occupations
The most common Sales and Office occupations in Guilford County are Office & Administration (29,794 | 11.3%), and Sales & Related (28,443 | 10.8%).
Sales and Office Occupations by Sex
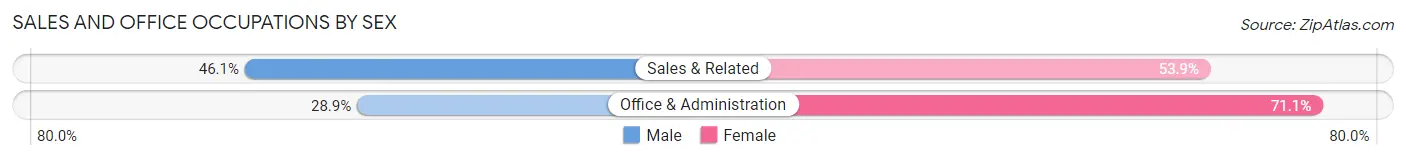
| Occupation | Male | Female |
| Sales & Related | 13,118 (46.1%) | 15,325 (53.9%) |
| Office & Administration | 8,600 (28.9%) | 21,194 (71.1%) |
| Total (Category) | 21,718 (37.3%) | 36,519 (62.7%) |
| Total (Overall) | 132,614 (50.3%) | 130,970 (49.7%) |
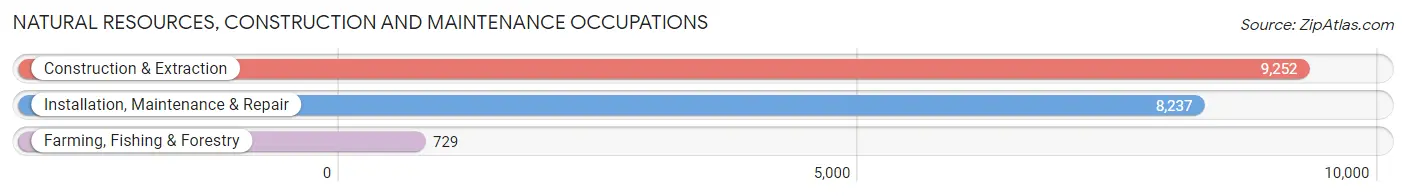
Natural Resources, Construction and Maintenance Occupations
The most common Natural Resources, Construction and Maintenance occupations in Guilford County are Construction & Extraction (9,252 | 3.5%), Installation, Maintenance & Repair (8,237 | 3.1%), and Farming, Fishing & Forestry (729 | 0.3%).
Natural Resources, Construction and Maintenance Occupations by Sex
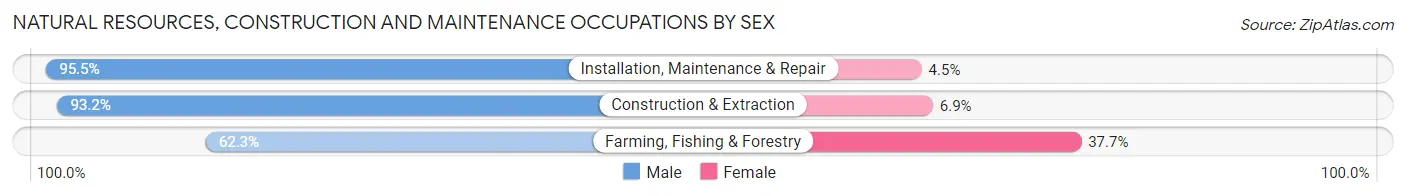
| Occupation | Male | Female |
| Farming, Fishing & Forestry | 454 (62.3%) | 275 (37.7%) |
| Construction & Extraction | 8,618 (93.1%) | 634 (6.9%) |
| Installation, Maintenance & Repair | 7,865 (95.5%) | 372 (4.5%) |
| Total (Category) | 16,937 (93.0%) | 1,281 (7.0%) |
| Total (Overall) | 132,614 (50.3%) | 130,970 (49.7%) |
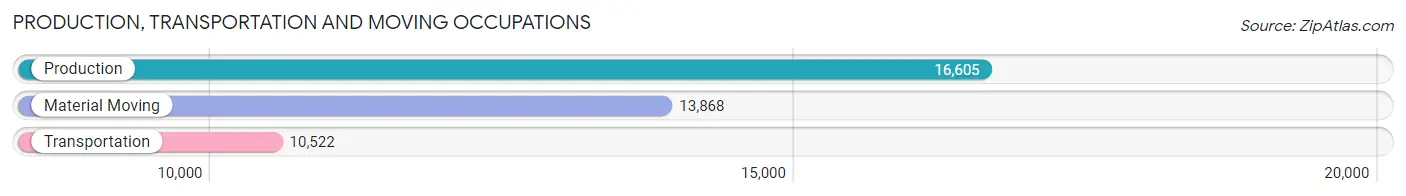
Production, Transportation and Moving Occupations
The most common Production, Transportation and Moving occupations in Guilford County are Production (16,605 | 6.3%), Material Moving (13,868 | 5.3%), and Transportation (10,522 | 4.0%).
Production, Transportation and Moving Occupations by Sex
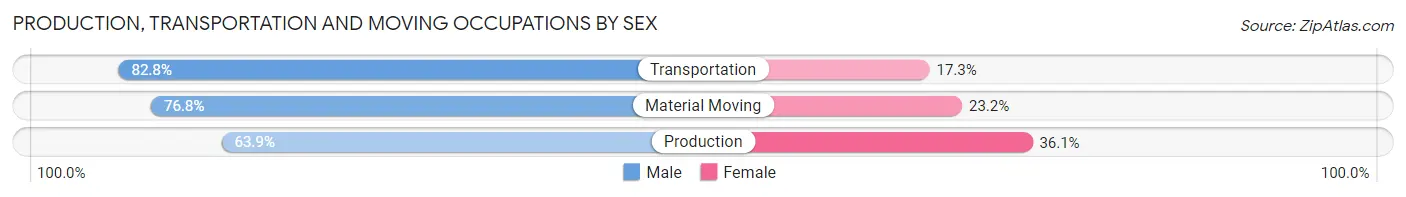
| Occupation | Male | Female |
| Production | 10,606 (63.9%) | 5,999 (36.1%) |
| Transportation | 8,707 (82.8%) | 1,815 (17.2%) |
| Material Moving | 10,649 (76.8%) | 3,219 (23.2%) |
| Total (Category) | 29,962 (73.1%) | 11,033 (26.9%) |
| Total (Overall) | 132,614 (50.3%) | 130,970 (49.7%) |
Employment Industries by Sex in Guilford County
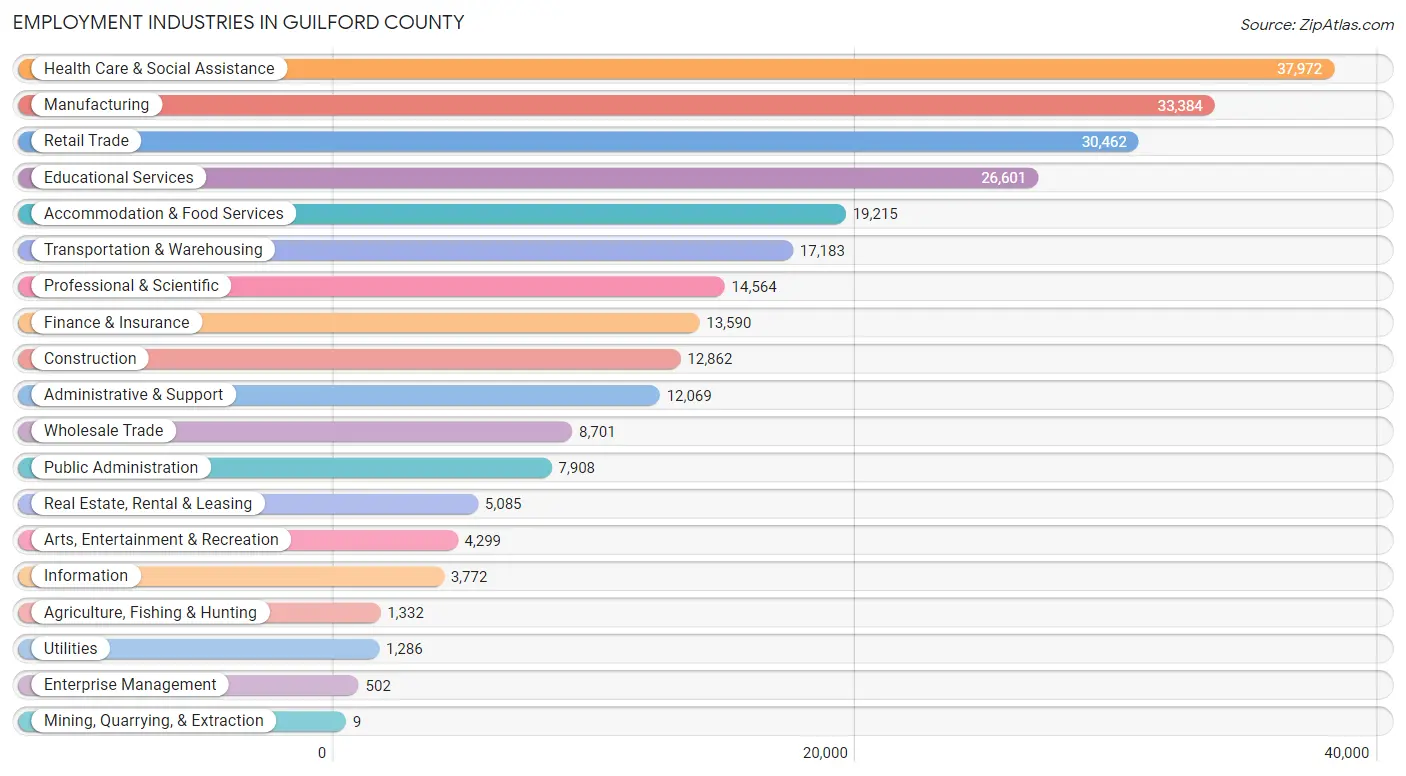
Employment Industries in Guilford County
The major employment industries in Guilford County include Health Care & Social Assistance (37,972 | 14.4%), Manufacturing (33,384 | 12.7%), Retail Trade (30,462 | 11.6%), Educational Services (26,601 | 10.1%), and Accommodation & Food Services (19,215 | 7.3%).
Employment Industries by Sex in Guilford County
The Guilford County industries that see more men than women are Construction (89.7%), Utilities (88.5%), and Transportation & Warehousing (77.0%), whereas the industries that tend to have a higher number of women are Mining, Quarrying, & Extraction (100.0%), Health Care & Social Assistance (79.8%), and Educational Services (70.1%).
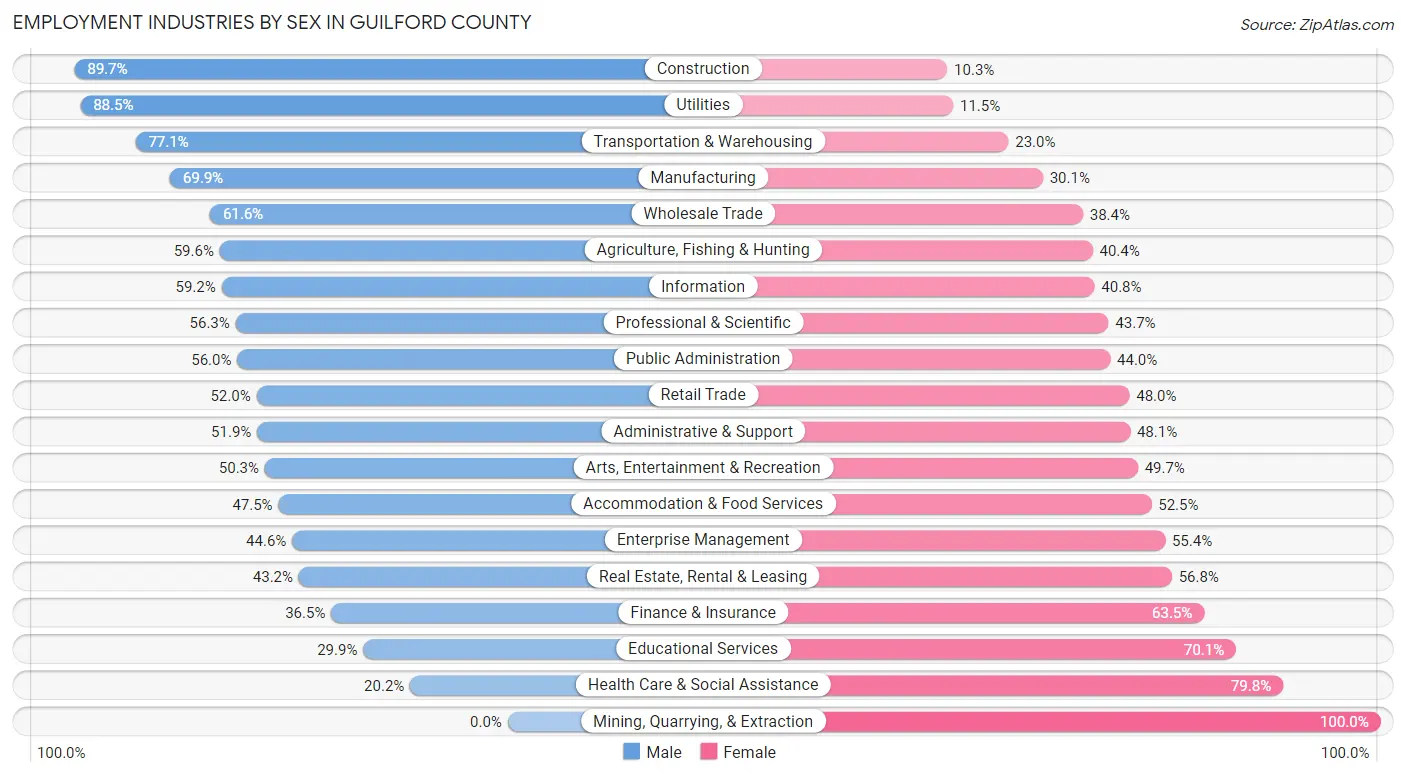
| Industry | Male | Female |
| Agriculture, Fishing & Hunting | 794 (59.6%) | 538 (40.4%) |
| Mining, Quarrying, & Extraction | 0 (0.0%) | 9 (100.0%) |
| Construction | 11,538 (89.7%) | 1,324 (10.3%) |
| Manufacturing | 23,342 (69.9%) | 10,042 (30.1%) |
| Wholesale Trade | 5,362 (61.6%) | 3,339 (38.4%) |
| Retail Trade | 15,841 (52.0%) | 14,621 (48.0%) |
| Transportation & Warehousing | 13,240 (77.0%) | 3,943 (23.0%) |
| Utilities | 1,138 (88.5%) | 148 (11.5%) |
| Information | 2,234 (59.2%) | 1,538 (40.8%) |
| Finance & Insurance | 4,964 (36.5%) | 8,626 (63.5%) |
| Real Estate, Rental & Leasing | 2,198 (43.2%) | 2,887 (56.8%) |
| Professional & Scientific | 8,204 (56.3%) | 6,360 (43.7%) |
| Enterprise Management | 224 (44.6%) | 278 (55.4%) |
| Administrative & Support | 6,259 (51.9%) | 5,810 (48.1%) |
| Educational Services | 7,957 (29.9%) | 18,644 (70.1%) |
| Health Care & Social Assistance | 7,669 (20.2%) | 30,303 (79.8%) |
| Arts, Entertainment & Recreation | 2,161 (50.3%) | 2,138 (49.7%) |
| Accommodation & Food Services | 9,119 (47.5%) | 10,096 (52.5%) |
| Public Administration | 4,427 (56.0%) | 3,481 (44.0%) |
| Total | 132,614 (50.3%) | 130,970 (49.7%) |
Education in Guilford County
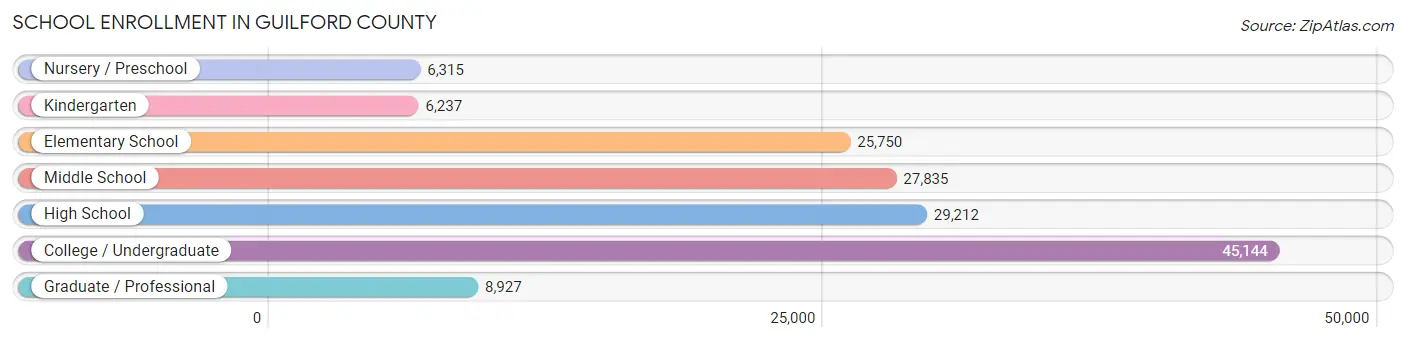
School Enrollment in Guilford County
The most common levels of schooling among the 149,420 students in Guilford County are college / undergraduate (45,144 | 30.2%), high school (29,212 | 19.6%), and middle school (27,835 | 18.6%).
| School Level | # Students | % Students |
| Nursery / Preschool | 6,315 | 4.2% |
| Kindergarten | 6,237 | 4.2% |
| Elementary School | 25,750 | 17.2% |
| Middle School | 27,835 | 18.6% |
| High School | 29,212 | 19.6% |
| College / Undergraduate | 45,144 | 30.2% |
| Graduate / Professional | 8,927 | 6.0% |
| Total | 149,420 | 100.0% |
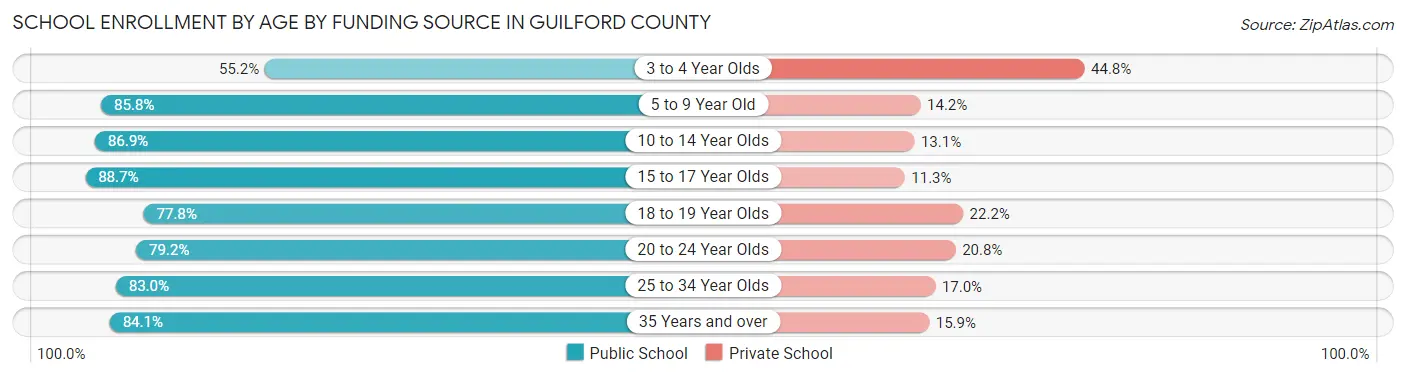
School Enrollment by Age by Funding Source in Guilford County
Out of a total of 149,420 students who are enrolled in schools in Guilford County, 25,103 (16.8%) attend a private institution, while the remaining 124,317 (83.2%) are enrolled in public schools. The age group of 3 to 4 year olds has the highest likelihood of being enrolled in private schools, with 2,199 (44.8% in the age bracket) enrolled. Conversely, the age group of 15 to 17 year olds has the lowest likelihood of being enrolled in a private school, with 17,878 (88.7% in the age bracket) attending a public institution.
| Age Bracket | Public School | Private School |
| 3 to 4 Year Olds | 2,712 (55.2%) | 2,199 (44.8%) |
| 5 to 9 Year Old | 25,971 (85.8%) | 4,313 (14.2%) |
| 10 to 14 Year Olds | 29,295 (86.9%) | 4,415 (13.1%) |
| 15 to 17 Year Olds | 17,878 (88.7%) | 2,277 (11.3%) |
| 18 to 19 Year Olds | 15,258 (77.8%) | 4,344 (22.2%) |
| 20 to 24 Year Olds | 15,331 (79.2%) | 4,018 (20.8%) |
| 25 to 34 Year Olds | 8,542 (83.0%) | 1,749 (17.0%) |
| 35 Years and over | 9,355 (84.1%) | 1,763 (15.9%) |
| Total | 124,317 (83.2%) | 25,103 (16.8%) |
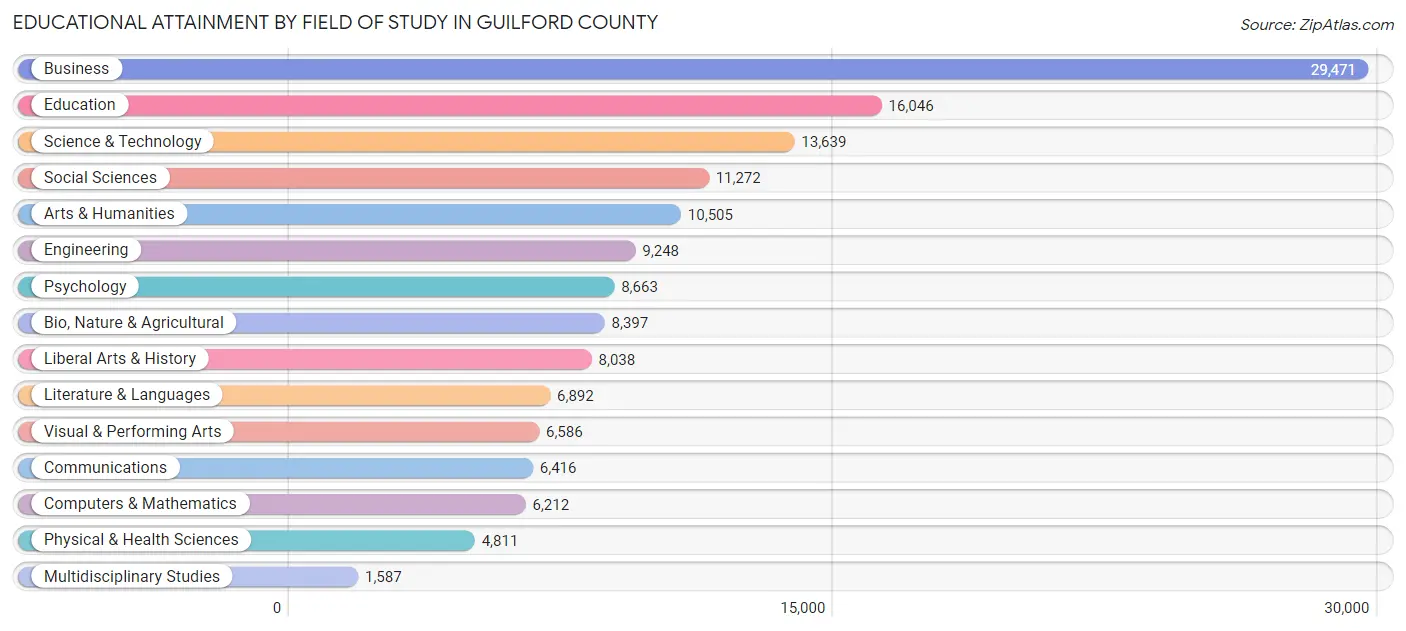
Educational Attainment by Field of Study in Guilford County
Business (29,471 | 19.9%), education (16,046 | 10.9%), science & technology (13,639 | 9.2%), social sciences (11,272 | 7.6%), and arts & humanities (10,505 | 7.1%) are the most common fields of study among 147,783 individuals in Guilford County who have obtained a bachelor's degree or higher.
| Field of Study | # Graduates | % Graduates |
| Computers & Mathematics | 6,212 | 4.2% |
| Bio, Nature & Agricultural | 8,397 | 5.7% |
| Physical & Health Sciences | 4,811 | 3.3% |
| Psychology | 8,663 | 5.9% |
| Social Sciences | 11,272 | 7.6% |
| Engineering | 9,248 | 6.3% |
| Multidisciplinary Studies | 1,587 | 1.1% |
| Science & Technology | 13,639 | 9.2% |
| Business | 29,471 | 19.9% |
| Education | 16,046 | 10.9% |
| Literature & Languages | 6,892 | 4.7% |
| Liberal Arts & History | 8,038 | 5.4% |
| Visual & Performing Arts | 6,586 | 4.5% |
| Communications | 6,416 | 4.3% |
| Arts & Humanities | 10,505 | 7.1% |
| Total | 147,783 | 100.0% |
Transportation & Commute in Guilford County
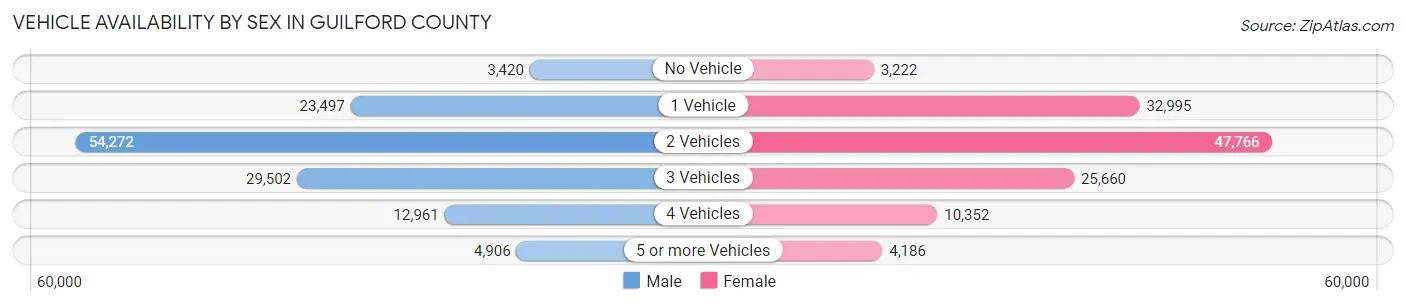
Vehicle Availability by Sex in Guilford County
The most prevalent vehicle ownership categories in Guilford County are males with 2 vehicles (54,272, accounting for 42.2%) and females with 2 vehicles (47,766, making up 43.7%).
| Vehicles Available | Male | Female |
| No Vehicle | 3,420 (2.7%) | 3,222 (2.6%) |
| 1 Vehicle | 23,497 (18.3%) | 32,995 (26.6%) |
| 2 Vehicles | 54,272 (42.2%) | 47,766 (38.5%) |
| 3 Vehicles | 29,502 (23.0%) | 25,660 (20.7%) |
| 4 Vehicles | 12,961 (10.1%) | 10,352 (8.3%) |
| 5 or more Vehicles | 4,906 (3.8%) | 4,186 (3.4%) |
| Total | 128,558 (100.0%) | 124,181 (100.0%) |
Commute Time in Guilford County
The most frequently occuring commute durations in Guilford County are 15 to 19 minutes (48,769 commuters, 21.1%), 20 to 24 minutes (41,143 commuters, 17.8%), and 10 to 14 minutes (37,964 commuters, 16.4%).
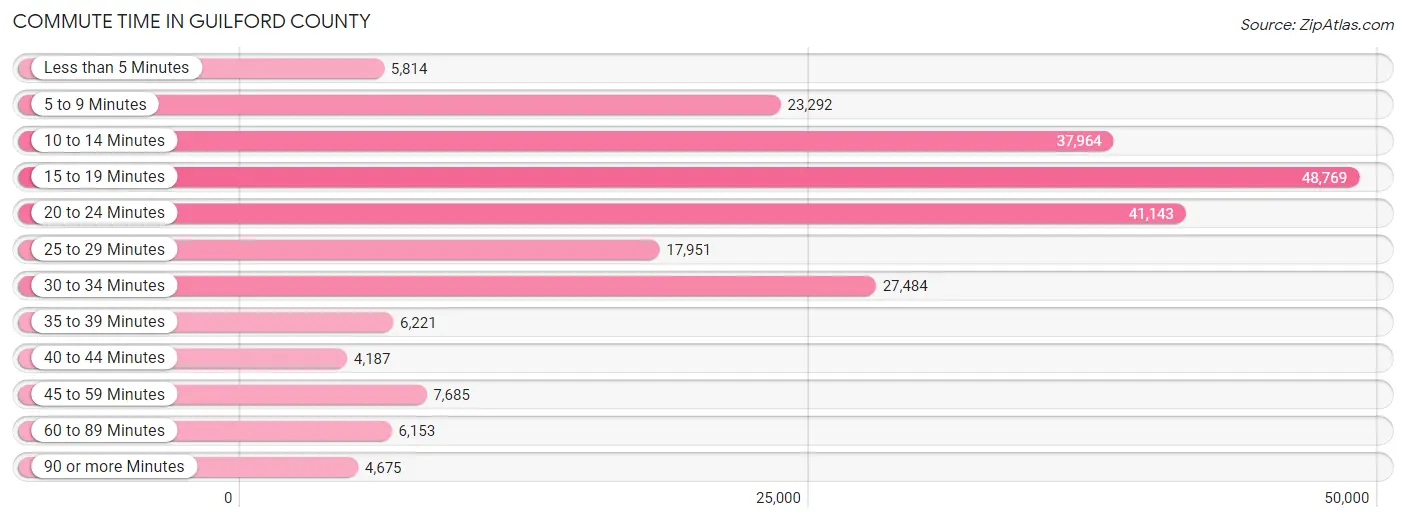
| Commute Time | # Commuters | % Commuters |
| Less than 5 Minutes | 5,814 | 2.5% |
| 5 to 9 Minutes | 23,292 | 10.1% |
| 10 to 14 Minutes | 37,964 | 16.4% |
| 15 to 19 Minutes | 48,769 | 21.1% |
| 20 to 24 Minutes | 41,143 | 17.8% |
| 25 to 29 Minutes | 17,951 | 7.8% |
| 30 to 34 Minutes | 27,484 | 11.9% |
| 35 to 39 Minutes | 6,221 | 2.7% |
| 40 to 44 Minutes | 4,187 | 1.8% |
| 45 to 59 Minutes | 7,685 | 3.3% |
| 60 to 89 Minutes | 6,153 | 2.7% |
| 90 or more Minutes | 4,675 | 2.0% |
Commute Time by Sex in Guilford County
The most common commute times in Guilford County are 15 to 19 minutes (23,811 commuters, 20.2%) for males and 15 to 19 minutes (24,958 commuters, 22.0%) for females.
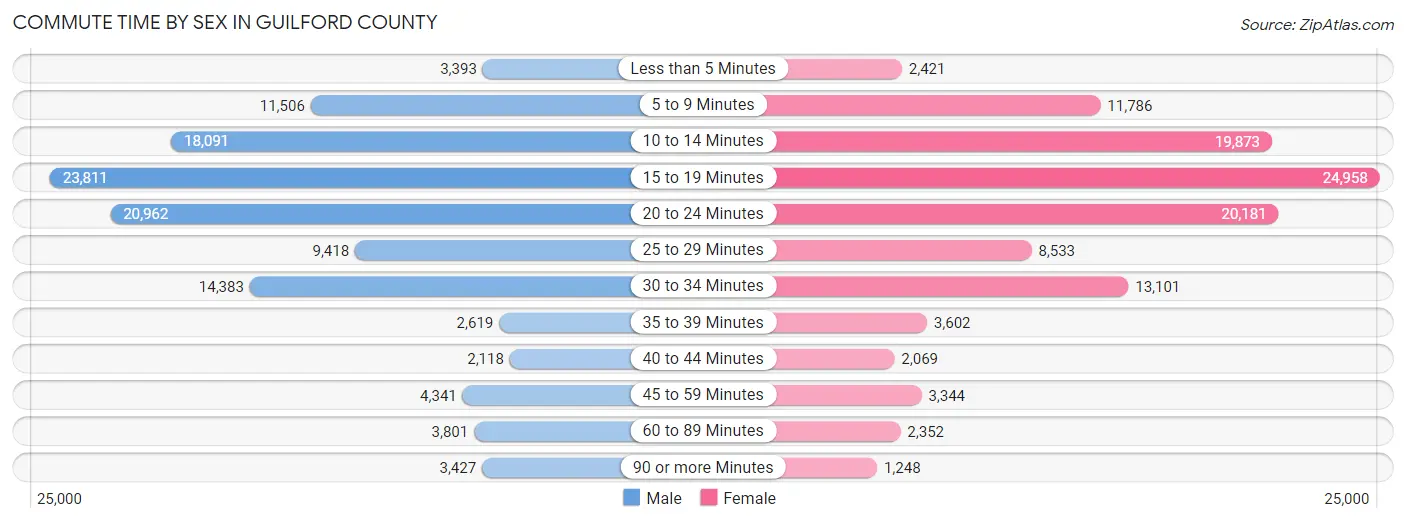
| Commute Time | Male | Female |
| Less than 5 Minutes | 3,393 (2.9%) | 2,421 (2.1%) |
| 5 to 9 Minutes | 11,506 (9.8%) | 11,786 (10.4%) |
| 10 to 14 Minutes | 18,091 (15.3%) | 19,873 (17.5%) |
| 15 to 19 Minutes | 23,811 (20.2%) | 24,958 (22.0%) |
| 20 to 24 Minutes | 20,962 (17.8%) | 20,181 (17.8%) |
| 25 to 29 Minutes | 9,418 (8.0%) | 8,533 (7.5%) |
| 30 to 34 Minutes | 14,383 (12.2%) | 13,101 (11.6%) |
| 35 to 39 Minutes | 2,619 (2.2%) | 3,602 (3.2%) |
| 40 to 44 Minutes | 2,118 (1.8%) | 2,069 (1.8%) |
| 45 to 59 Minutes | 4,341 (3.7%) | 3,344 (2.9%) |
| 60 to 89 Minutes | 3,801 (3.2%) | 2,352 (2.1%) |
| 90 or more Minutes | 3,427 (2.9%) | 1,248 (1.1%) |
Time of Departure to Work by Sex in Guilford County
The most frequent times of departure to work in Guilford County are 7:00 AM to 7:29 AM (17,471, 14.8%) for males and 7:30 AM to 7:59 AM (18,349, 16.2%) for females.
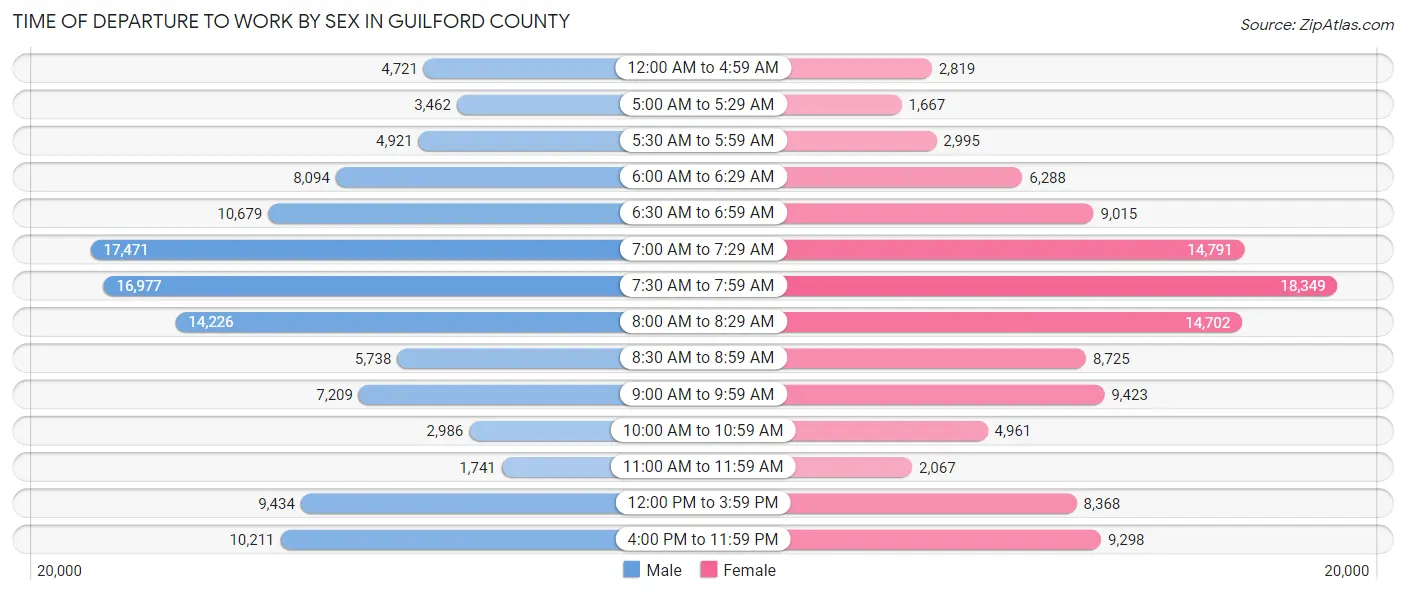
| Time of Departure | Male | Female |
| 12:00 AM to 4:59 AM | 4,721 (4.0%) | 2,819 (2.5%) |
| 5:00 AM to 5:29 AM | 3,462 (2.9%) | 1,667 (1.5%) |
| 5:30 AM to 5:59 AM | 4,921 (4.2%) | 2,995 (2.6%) |
| 6:00 AM to 6:29 AM | 8,094 (6.9%) | 6,288 (5.5%) |
| 6:30 AM to 6:59 AM | 10,679 (9.1%) | 9,015 (7.9%) |
| 7:00 AM to 7:29 AM | 17,471 (14.8%) | 14,791 (13.0%) |
| 7:30 AM to 7:59 AM | 16,977 (14.4%) | 18,349 (16.2%) |
| 8:00 AM to 8:29 AM | 14,226 (12.1%) | 14,702 (13.0%) |
| 8:30 AM to 8:59 AM | 5,738 (4.9%) | 8,725 (7.7%) |
| 9:00 AM to 9:59 AM | 7,209 (6.1%) | 9,423 (8.3%) |
| 10:00 AM to 10:59 AM | 2,986 (2.5%) | 4,961 (4.4%) |
| 11:00 AM to 11:59 AM | 1,741 (1.5%) | 2,067 (1.8%) |
| 12:00 PM to 3:59 PM | 9,434 (8.0%) | 8,368 (7.4%) |
| 4:00 PM to 11:59 PM | 10,211 (8.7%) | 9,298 (8.2%) |
| Total | 117,870 (100.0%) | 113,468 (100.0%) |
Housing Occupancy in Guilford County
Occupancy by Ownership in Guilford County
Of the total 212,825 dwellings in Guilford County, owner-occupied units account for 126,702 (59.5%), while renter-occupied units make up 86,123 (40.5%).
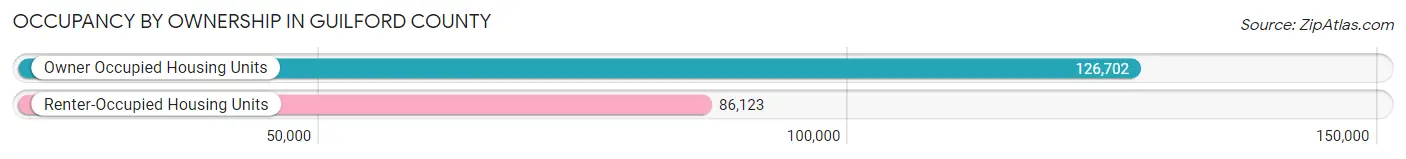
| Occupancy | # Housing Units | % Housing Units |
| Owner Occupied Housing Units | 126,702 | 59.5% |
| Renter-Occupied Housing Units | 86,123 | 40.5% |
| Total Occupied Housing Units | 212,825 | 100.0% |
Occupancy by Household Size in Guilford County
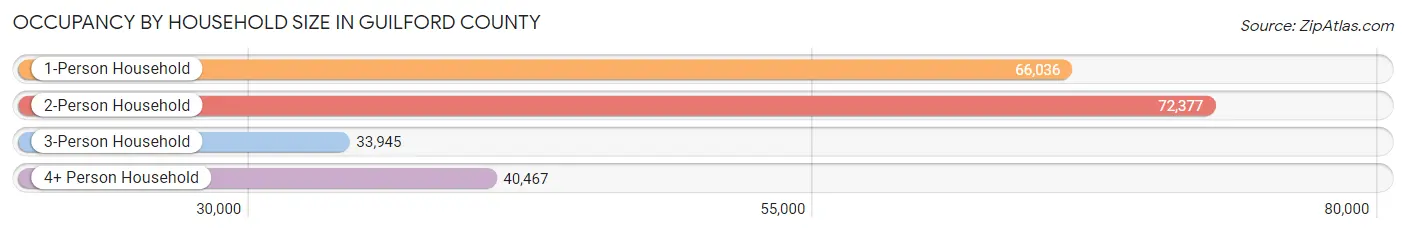
| Household Size | # Housing Units | % Housing Units |
| 1-Person Household | 66,036 | 31.0% |
| 2-Person Household | 72,377 | 34.0% |
| 3-Person Household | 33,945 | 16.0% |
| 4+ Person Household | 40,467 | 19.0% |
| Total Housing Units | 212,825 | 100.0% |
Occupancy by Ownership by Household Size in Guilford County
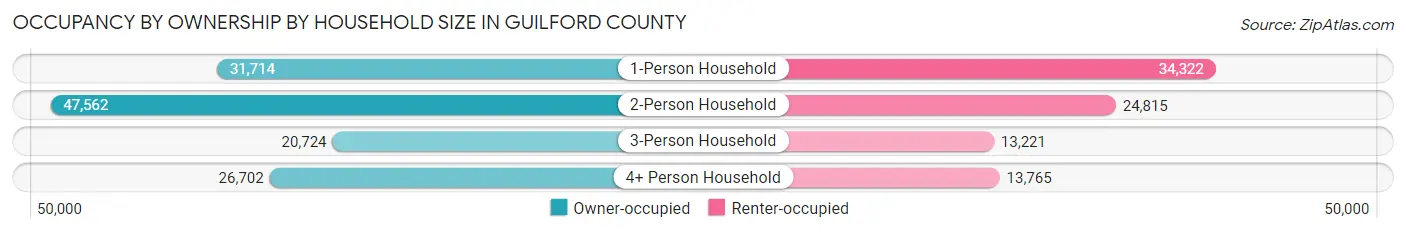
| Household Size | Owner-occupied | Renter-occupied |
| 1-Person Household | 31,714 (48.0%) | 34,322 (52.0%) |
| 2-Person Household | 47,562 (65.7%) | 24,815 (34.3%) |
| 3-Person Household | 20,724 (61.1%) | 13,221 (39.0%) |
| 4+ Person Household | 26,702 (66.0%) | 13,765 (34.0%) |
| Total Housing Units | 126,702 (59.5%) | 86,123 (40.5%) |
Occupancy by Educational Attainment in Guilford County
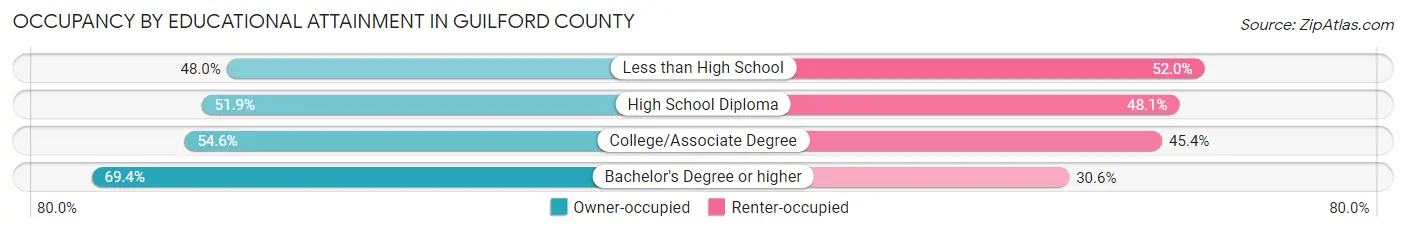
| Household Size | Owner-occupied | Renter-occupied |
| Less than High School | 8,124 (48.0%) | 8,816 (52.0%) |
| High School Diploma | 21,837 (51.9%) | 20,231 (48.1%) |
| College/Associate Degree | 36,962 (54.6%) | 30,690 (45.4%) |
| Bachelor's Degree or higher | 59,779 (69.4%) | 26,386 (30.6%) |
Occupancy by Age of Householder in Guilford County
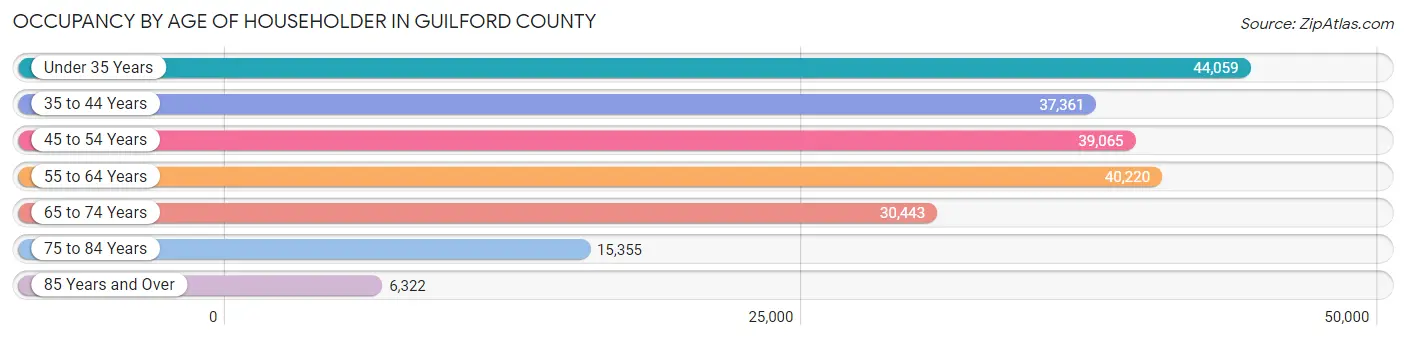
| Age Bracket | # Households | % Households |
| Under 35 Years | 44,059 | 20.7% |
| 35 to 44 Years | 37,361 | 17.5% |
| 45 to 54 Years | 39,065 | 18.4% |
| 55 to 64 Years | 40,220 | 18.9% |
| 65 to 74 Years | 30,443 | 14.3% |
| 75 to 84 Years | 15,355 | 7.2% |
| 85 Years and Over | 6,322 | 3.0% |
| Total | 212,825 | 100.0% |
Housing Finances in Guilford County
Median Income by Occupancy in Guilford County
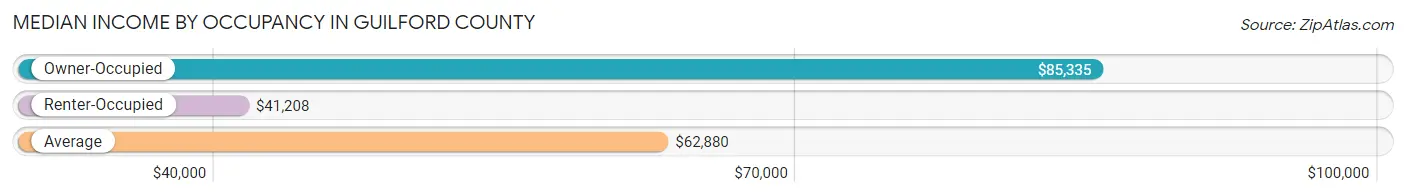
| Occupancy Type | # Households | Median Income |
| Owner-Occupied | 126,702 (59.5%) | $85,335 |
| Renter-Occupied | 86,123 (40.5%) | $41,208 |
| Average | 212,825 (100.0%) | $62,880 |
Occupancy by Householder Income Bracket in Guilford County
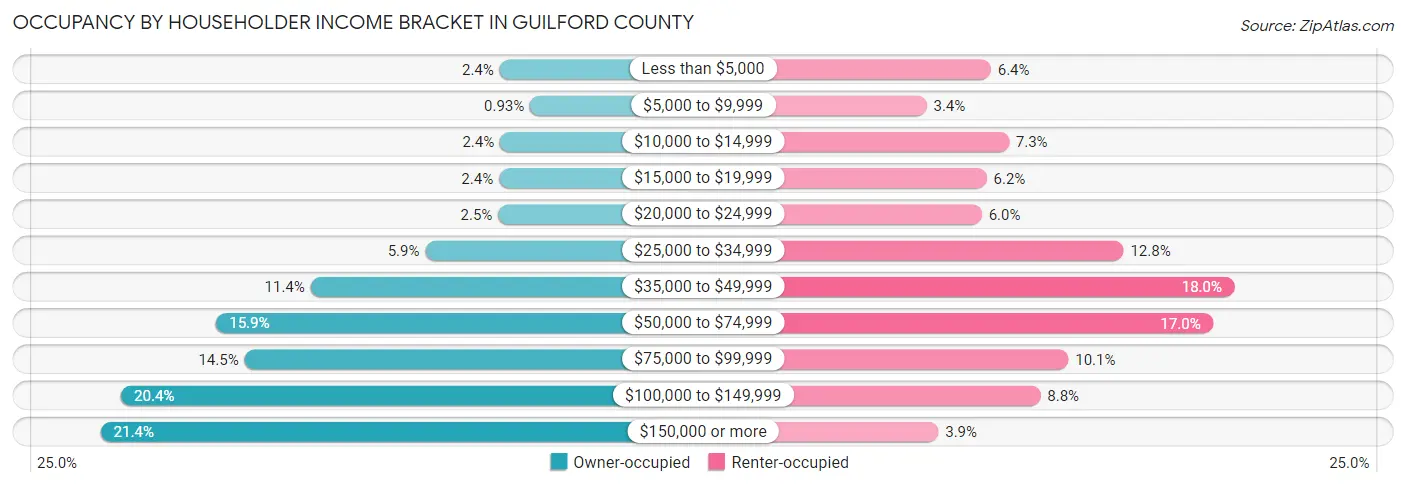
| Income Bracket | Owner-occupied | Renter-occupied |
| Less than $5,000 | 3,014 (2.4%) | 5,543 (6.4%) |
| $5,000 to $9,999 | 1,172 (0.9%) | 2,911 (3.4%) |
| $10,000 to $14,999 | 2,986 (2.4%) | 6,291 (7.3%) |
| $15,000 to $19,999 | 3,051 (2.4%) | 5,372 (6.2%) |
| $20,000 to $24,999 | 3,100 (2.5%) | 5,172 (6.0%) |
| $25,000 to $34,999 | 7,495 (5.9%) | 10,985 (12.8%) |
| $35,000 to $49,999 | 14,424 (11.4%) | 15,515 (18.0%) |
| $50,000 to $74,999 | 20,102 (15.9%) | 14,638 (17.0%) |
| $75,000 to $99,999 | 18,413 (14.5%) | 8,722 (10.1%) |
| $100,000 to $149,999 | 25,852 (20.4%) | 7,583 (8.8%) |
| $150,000 or more | 27,093 (21.4%) | 3,391 (3.9%) |
| Total | 126,702 (100.0%) | 86,123 (100.0%) |
Monthly Housing Cost Tiers in Guilford County
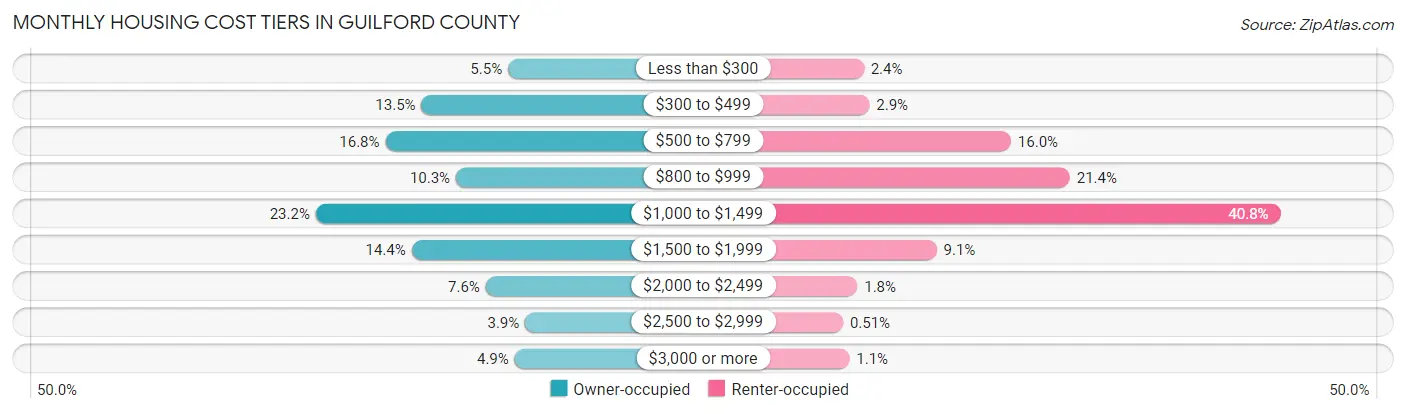
| Monthly Cost | Owner-occupied | Renter-occupied |
| Less than $300 | 6,973 (5.5%) | 2,088 (2.4%) |
| $300 to $499 | 17,073 (13.5%) | 2,532 (2.9%) |
| $500 to $799 | 21,267 (16.8%) | 13,755 (16.0%) |
| $800 to $999 | 13,035 (10.3%) | 18,422 (21.4%) |
| $1,000 to $1,499 | 29,391 (23.2%) | 35,121 (40.8%) |
| $1,500 to $1,999 | 18,226 (14.4%) | 7,864 (9.1%) |
| $2,000 to $2,499 | 9,562 (7.5%) | 1,580 (1.8%) |
| $2,500 to $2,999 | 4,973 (3.9%) | 442 (0.5%) |
| $3,000 or more | 6,202 (4.9%) | 948 (1.1%) |
| Total | 126,702 (100.0%) | 86,123 (100.0%) |
Physical Housing Characteristics in Guilford County
Housing Structures in Guilford County
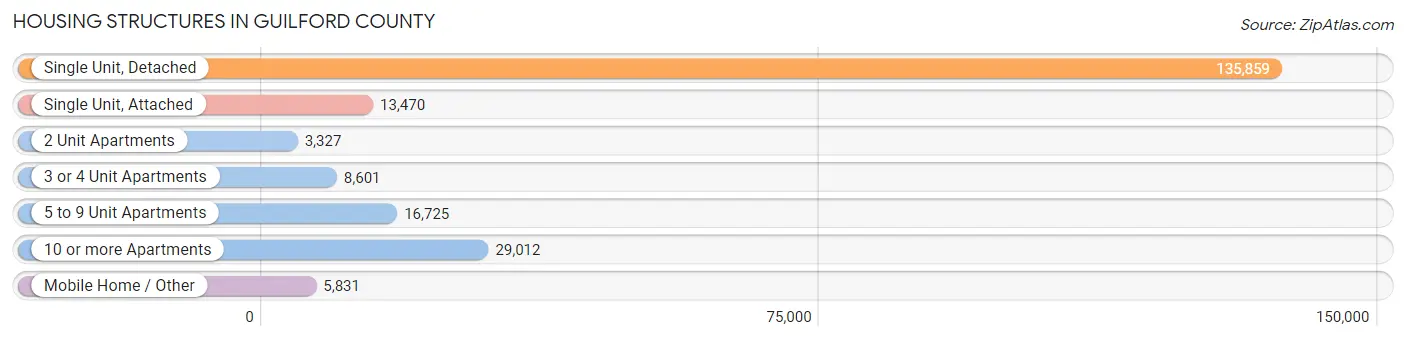
| Structure Type | # Housing Units | % Housing Units |
| Single Unit, Detached | 135,859 | 63.8% |
| Single Unit, Attached | 13,470 | 6.3% |
| 2 Unit Apartments | 3,327 | 1.6% |
| 3 or 4 Unit Apartments | 8,601 | 4.0% |
| 5 to 9 Unit Apartments | 16,725 | 7.9% |
| 10 or more Apartments | 29,012 | 13.6% |
| Mobile Home / Other | 5,831 | 2.7% |
| Total | 212,825 | 100.0% |
Housing Structures by Occupancy in Guilford County
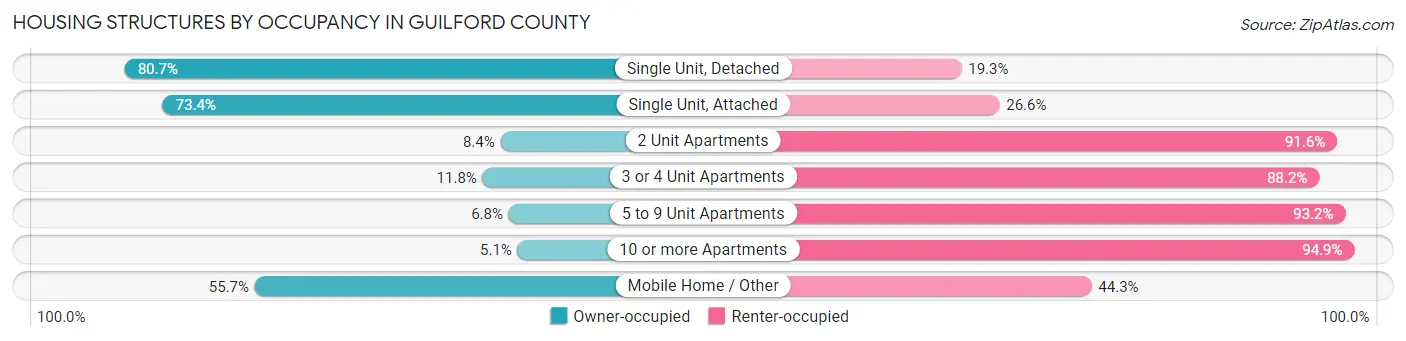
| Structure Type | Owner-occupied | Renter-occupied |
| Single Unit, Detached | 109,670 (80.7%) | 26,189 (19.3%) |
| Single Unit, Attached | 9,889 (73.4%) | 3,581 (26.6%) |
| 2 Unit Apartments | 278 (8.4%) | 3,049 (91.6%) |
| 3 or 4 Unit Apartments | 1,016 (11.8%) | 7,585 (88.2%) |
| 5 to 9 Unit Apartments | 1,134 (6.8%) | 15,591 (93.2%) |
| 10 or more Apartments | 1,469 (5.1%) | 27,543 (94.9%) |
| Mobile Home / Other | 3,246 (55.7%) | 2,585 (44.3%) |
| Total | 126,702 (59.5%) | 86,123 (40.5%) |
Housing Structures by Number of Rooms in Guilford County
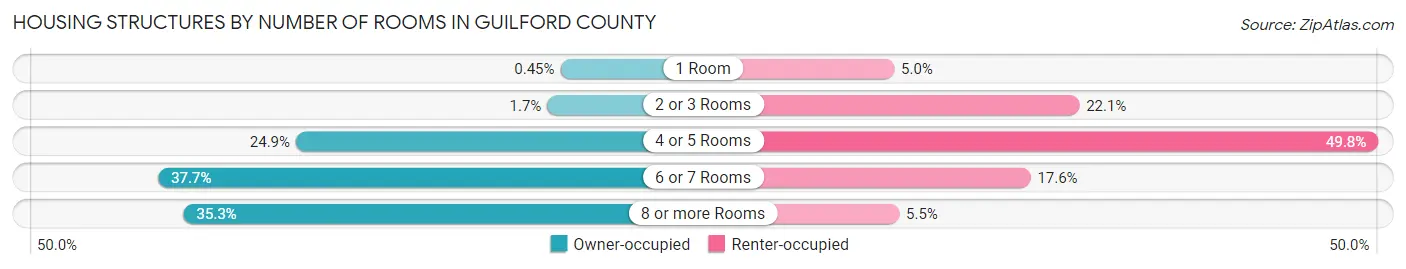
| Number of Rooms | Owner-occupied | Renter-occupied |
| 1 Room | 570 (0.4%) | 4,319 (5.0%) |
| 2 or 3 Rooms | 2,117 (1.7%) | 19,055 (22.1%) |
| 4 or 5 Rooms | 31,556 (24.9%) | 42,861 (49.8%) |
| 6 or 7 Rooms | 47,715 (37.7%) | 15,178 (17.6%) |
| 8 or more Rooms | 44,744 (35.3%) | 4,710 (5.5%) |
| Total | 126,702 (100.0%) | 86,123 (100.0%) |
Housing Structure by Heating Type in Guilford County
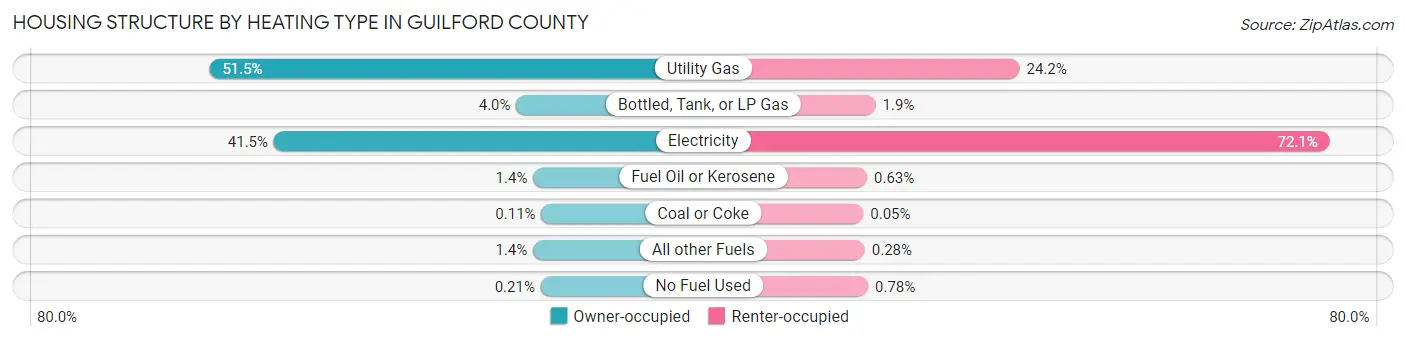
| Heating Type | Owner-occupied | Renter-occupied |
| Utility Gas | 65,203 (51.5%) | 20,831 (24.2%) |
| Bottled, Tank, or LP Gas | 5,045 (4.0%) | 1,673 (1.9%) |
| Electricity | 52,541 (41.5%) | 62,116 (72.1%) |
| Fuel Oil or Kerosene | 1,733 (1.4%) | 543 (0.6%) |
| Coal or Coke | 144 (0.1%) | 40 (0.1%) |
| All other Fuels | 1,765 (1.4%) | 245 (0.3%) |
| No Fuel Used | 271 (0.2%) | 675 (0.8%) |
| Total | 126,702 (100.0%) | 86,123 (100.0%) |
Household Vehicle Usage in Guilford County
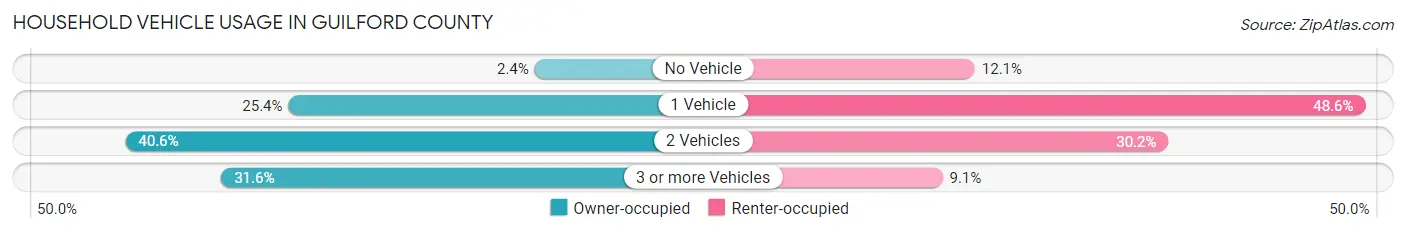
| Vehicles per Household | Owner-occupied | Renter-occupied |
| No Vehicle | 3,026 (2.4%) | 10,444 (12.1%) |
| 1 Vehicle | 32,157 (25.4%) | 41,840 (48.6%) |
| 2 Vehicles | 51,427 (40.6%) | 25,990 (30.2%) |
| 3 or more Vehicles | 40,092 (31.6%) | 7,849 (9.1%) |
| Total | 126,702 (100.0%) | 86,123 (100.0%) |
Real Estate & Mortgages in Guilford County
Real Estate and Mortgage Overview in Guilford County
| Characteristic | Without Mortgage | With Mortgage |
| Housing Units | 43,113 | 83,589 |
| Median Property Value | $191,800 | $226,200 |
| Median Household Income | $65,095 | $20,322 |
| Monthly Housing Costs | $481 | $6,143 |
| Real Estate Taxes | $1,790 | $1,266 |
Property Value by Mortgage Status in Guilford County
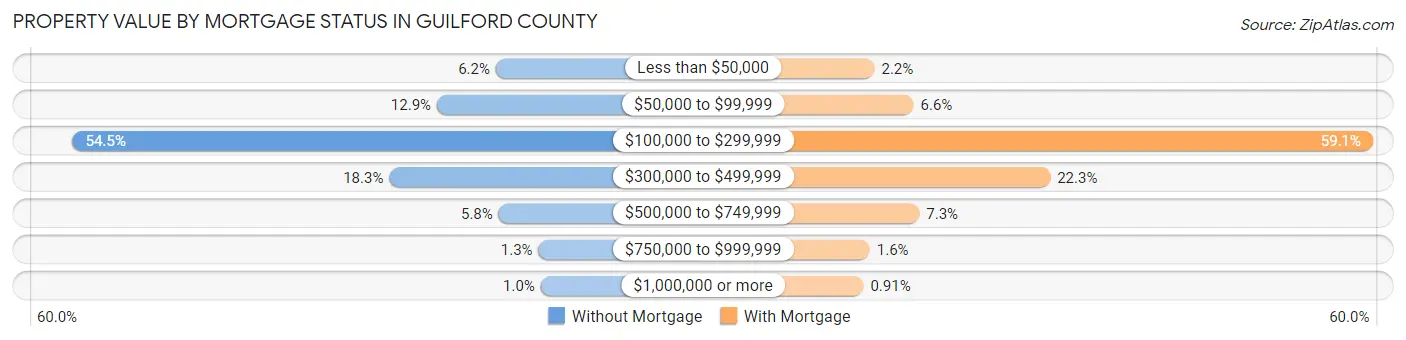
| Property Value | Without Mortgage | With Mortgage |
| Less than $50,000 | 2,650 (6.1%) | 1,814 (2.2%) |
| $50,000 to $99,999 | 5,552 (12.9%) | 5,542 (6.6%) |
| $100,000 to $299,999 | 23,505 (54.5%) | 49,419 (59.1%) |
| $300,000 to $499,999 | 7,903 (18.3%) | 18,600 (22.3%) |
| $500,000 to $749,999 | 2,512 (5.8%) | 6,093 (7.3%) |
| $750,000 to $999,999 | 551 (1.3%) | 1,359 (1.6%) |
| $1,000,000 or more | 440 (1.0%) | 762 (0.9%) |
| Total | 43,113 (100.0%) | 83,589 (100.0%) |
Household Income by Mortgage Status in Guilford County
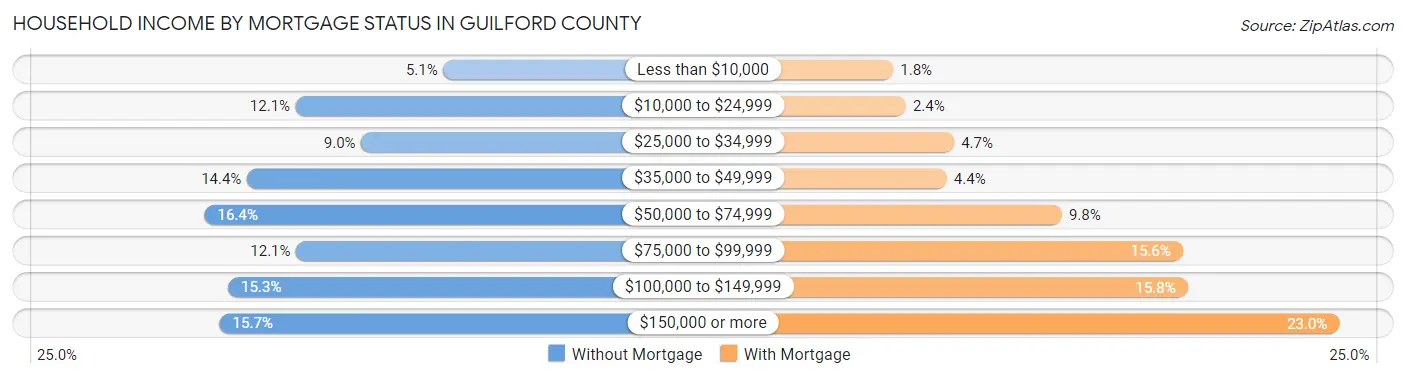
| Household Income | Without Mortgage | With Mortgage |
| Less than $10,000 | 2,178 (5.1%) | 1,506 (1.8%) |
| $10,000 to $24,999 | 5,210 (12.1%) | 2,008 (2.4%) |
| $25,000 to $34,999 | 3,863 (9.0%) | 3,927 (4.7%) |
| $35,000 to $49,999 | 6,209 (14.4%) | 3,632 (4.3%) |
| $50,000 to $74,999 | 7,083 (16.4%) | 8,215 (9.8%) |
| $75,000 to $99,999 | 5,200 (12.1%) | 13,019 (15.6%) |
| $100,000 to $149,999 | 6,599 (15.3%) | 13,213 (15.8%) |
| $150,000 or more | 6,771 (15.7%) | 19,253 (23.0%) |
| Total | 43,113 (100.0%) | 83,589 (100.0%) |
Property Value to Household Income Ratio in Guilford County
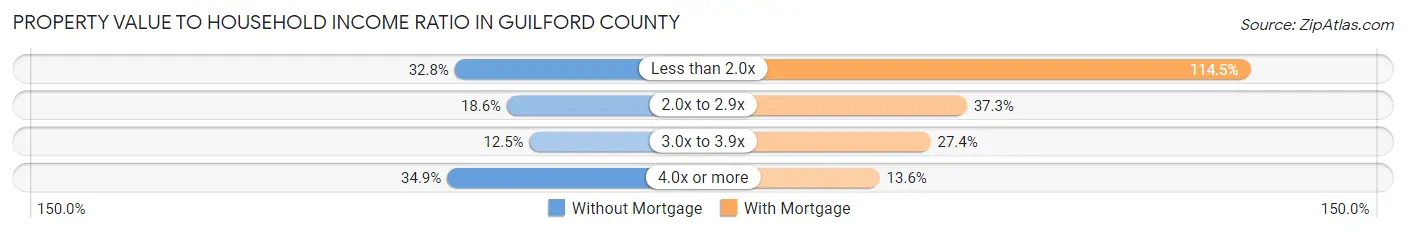
| Value-to-Income Ratio | Without Mortgage | With Mortgage |
| Less than 2.0x | 14,156 (32.8%) | 95,734 (114.5%) |
| 2.0x to 2.9x | 8,020 (18.6%) | 31,145 (37.3%) |
| 3.0x to 3.9x | 5,378 (12.5%) | 22,924 (27.4%) |
| 4.0x or more | 15,047 (34.9%) | 11,326 (13.6%) |
| Total | 43,113 (100.0%) | 83,589 (100.0%) |
Real Estate Taxes by Mortgage Status in Guilford County
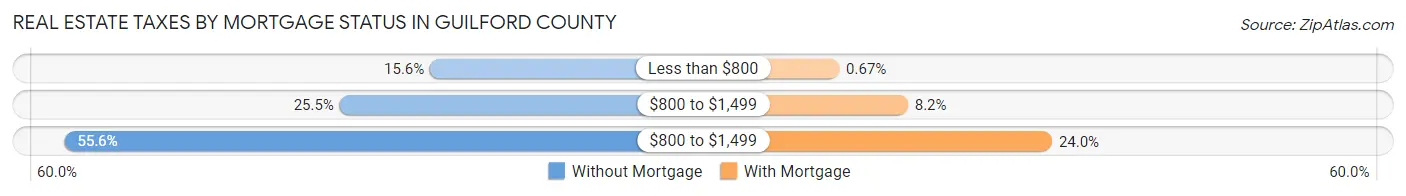
| Property Taxes | Without Mortgage | With Mortgage |
| Less than $800 | 6,710 (15.6%) | 558 (0.7%) |
| $800 to $1,499 | 10,981 (25.5%) | 6,845 (8.2%) |
| $800 to $1,499 | 23,989 (55.6%) | 20,051 (24.0%) |
| Total | 43,113 (100.0%) | 83,589 (100.0%) |
Health & Disability in Guilford County
Health Insurance Coverage by Age in Guilford County
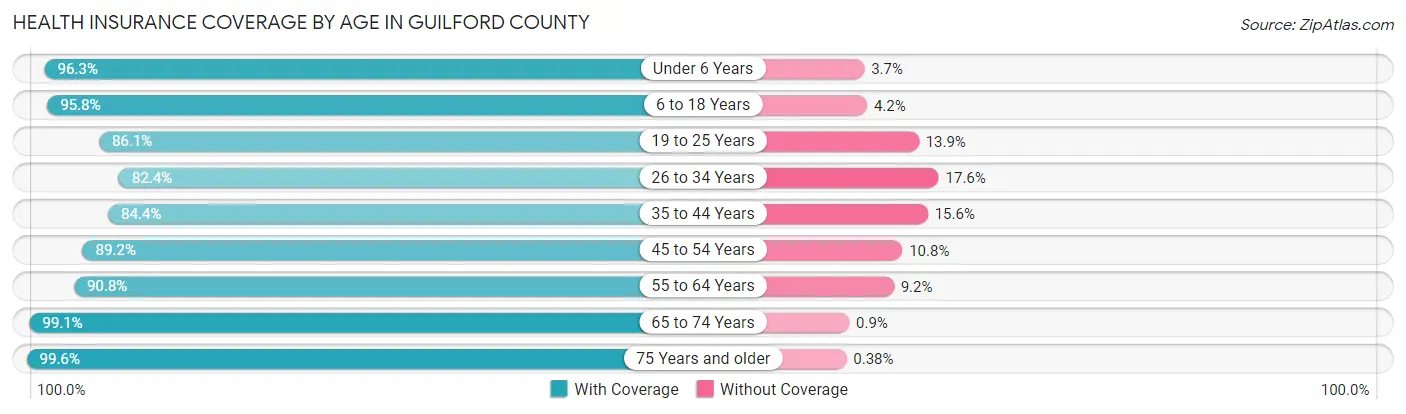
| Age Bracket | With Coverage | Without Coverage |
| Under 6 Years | 34,155 (96.3%) | 1,320 (3.7%) |
| 6 to 18 Years | 91,115 (95.8%) | 4,020 (4.2%) |
| 19 to 25 Years | 50,320 (86.1%) | 8,101 (13.9%) |
| 26 to 34 Years | 52,897 (82.4%) | 11,291 (17.6%) |
| 35 to 44 Years | 55,253 (84.4%) | 10,184 (15.6%) |
| 45 to 54 Years | 61,065 (89.2%) | 7,401 (10.8%) |
| 55 to 64 Years | 60,208 (90.8%) | 6,111 (9.2%) |
| 65 to 74 Years | 48,573 (99.1%) | 442 (0.9%) |
| 75 Years and older | 32,535 (99.6%) | 125 (0.4%) |
| Total | 486,121 (90.8%) | 48,995 (9.2%) |
Health Insurance Coverage by Citizenship Status in Guilford County
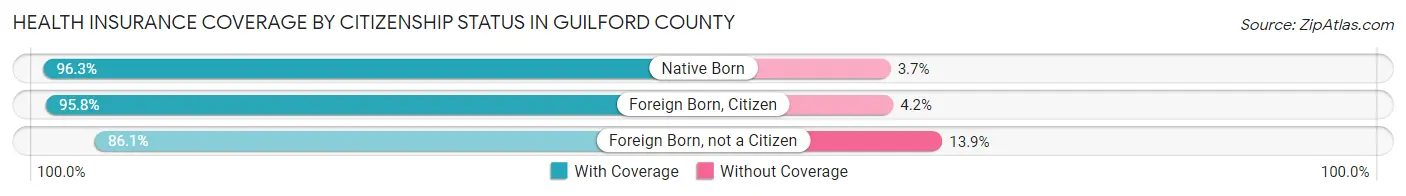
| Citizenship Status | With Coverage | Without Coverage |
| Native Born | 34,155 (96.3%) | 1,320 (3.7%) |
| Foreign Born, Citizen | 91,115 (95.8%) | 4,020 (4.2%) |
| Foreign Born, not a Citizen | 50,320 (86.1%) | 8,101 (13.9%) |
Health Insurance Coverage by Household Income in Guilford County
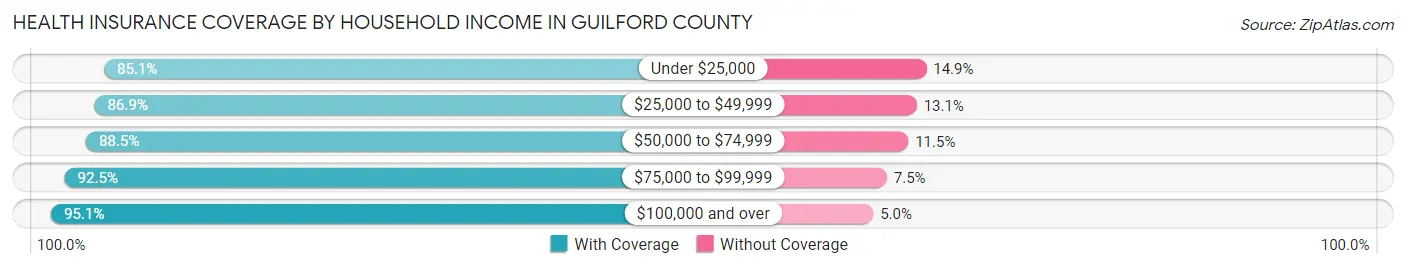
| Household Income | With Coverage | Without Coverage |
| Under $25,000 | 57,539 (85.1%) | 10,066 (14.9%) |
| $25,000 to $49,999 | 87,432 (86.9%) | 13,181 (13.1%) |
| $50,000 to $74,999 | 74,058 (88.5%) | 9,635 (11.5%) |
| $75,000 to $99,999 | 66,988 (92.5%) | 5,443 (7.5%) |
| $100,000 and over | 182,949 (95.1%) | 9,518 (5.0%) |
Public vs Private Health Insurance Coverage by Age in Guilford County
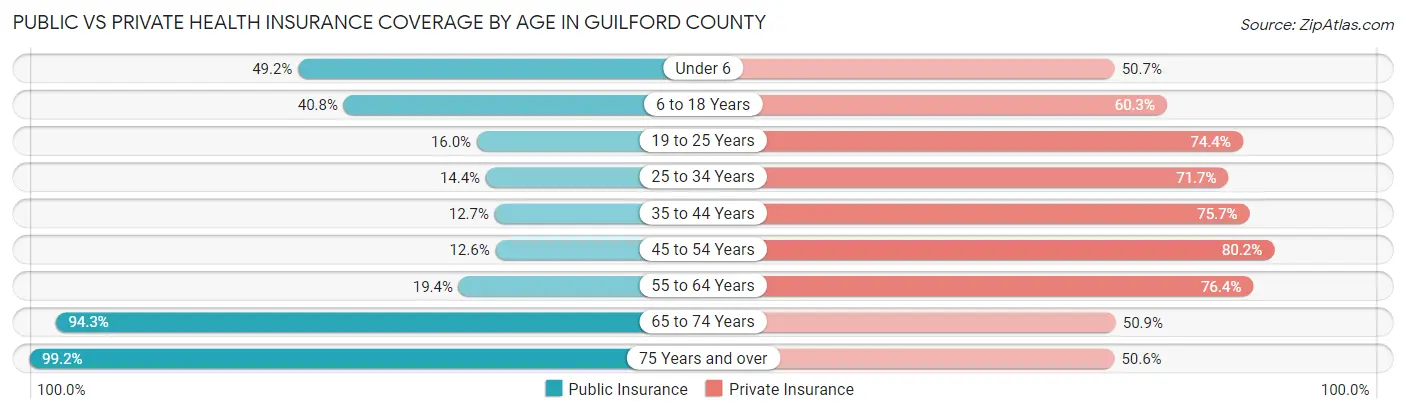
| Age Bracket | Public Insurance | Private Insurance |
| Under 6 | 17,460 (49.2%) | 17,973 (50.7%) |
| 6 to 18 Years | 38,765 (40.7%) | 57,386 (60.3%) |
| 19 to 25 Years | 9,372 (16.0%) | 43,466 (74.4%) |
| 25 to 34 Years | 9,223 (14.4%) | 46,047 (71.7%) |
| 35 to 44 Years | 8,330 (12.7%) | 49,504 (75.6%) |
| 45 to 54 Years | 8,630 (12.6%) | 54,935 (80.2%) |
| 55 to 64 Years | 12,873 (19.4%) | 50,642 (76.4%) |
| 65 to 74 Years | 46,208 (94.3%) | 24,930 (50.9%) |
| 75 Years and over | 32,382 (99.2%) | 16,529 (50.6%) |
| Total | 183,243 (34.2%) | 361,412 (67.5%) |
Disability Status by Sex by Age in Guilford County
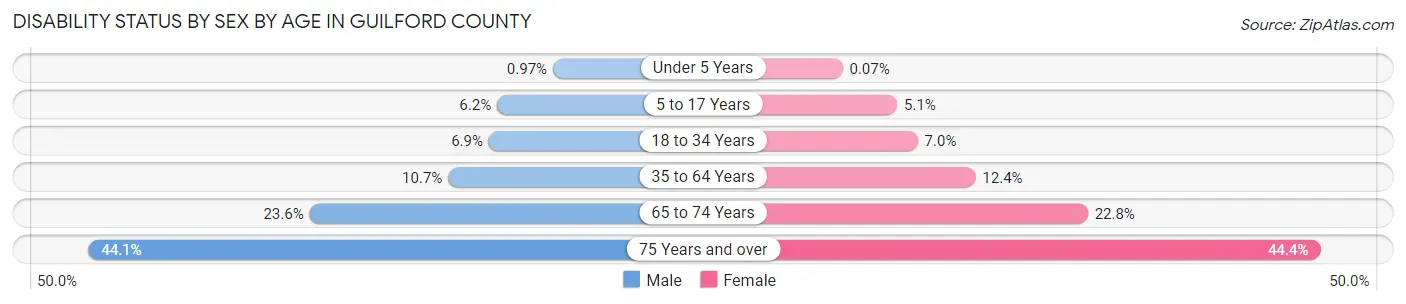
| Age Bracket | Male | Female |
| Under 5 Years | 151 (1.0%) | 10 (0.1%) |
| 5 to 17 Years | 2,750 (6.2%) | 2,218 (5.1%) |
| 18 to 34 Years | 4,381 (6.9%) | 5,048 (7.0%) |
| 35 to 64 Years | 10,218 (10.7%) | 12,971 (12.4%) |
| 65 to 74 Years | 5,221 (23.6%) | 6,129 (22.8%) |
| 75 Years and over | 5,748 (44.1%) | 8,711 (44.4%) |
Disability Class by Sex by Age in Guilford County
Disability Class: Hearing Difficulty
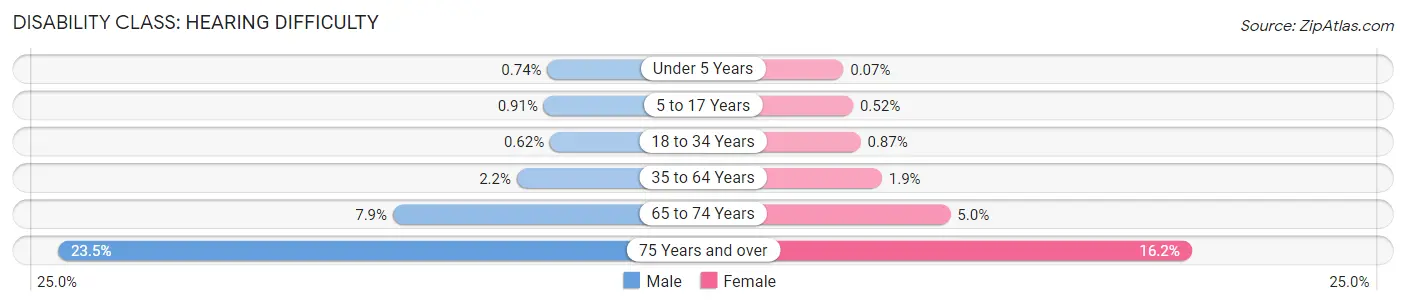
| Age Bracket | Male | Female |
| Under 5 Years | 115 (0.7%) | 10 (0.1%) |
| 5 to 17 Years | 408 (0.9%) | 223 (0.5%) |
| 18 to 34 Years | 393 (0.6%) | 627 (0.9%) |
| 35 to 64 Years | 2,063 (2.2%) | 1,945 (1.9%) |
| 65 to 74 Years | 1,752 (7.9%) | 1,353 (5.0%) |
| 75 Years and over | 3,057 (23.4%) | 3,185 (16.2%) |
Disability Class: Vision Difficulty
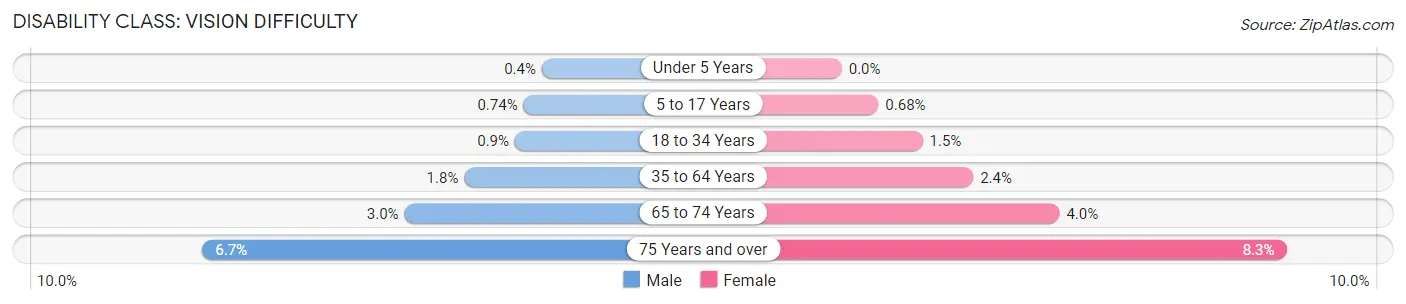
| Age Bracket | Male | Female |
| Under 5 Years | 62 (0.4%) | 0 (0.0%) |
| 5 to 17 Years | 328 (0.7%) | 292 (0.7%) |
| 18 to 34 Years | 570 (0.9%) | 1,077 (1.5%) |
| 35 to 64 Years | 1,759 (1.8%) | 2,553 (2.4%) |
| 65 to 74 Years | 653 (2.9%) | 1,084 (4.0%) |
| 75 Years and over | 873 (6.7%) | 1,618 (8.3%) |
Disability Class: Cognitive Difficulty
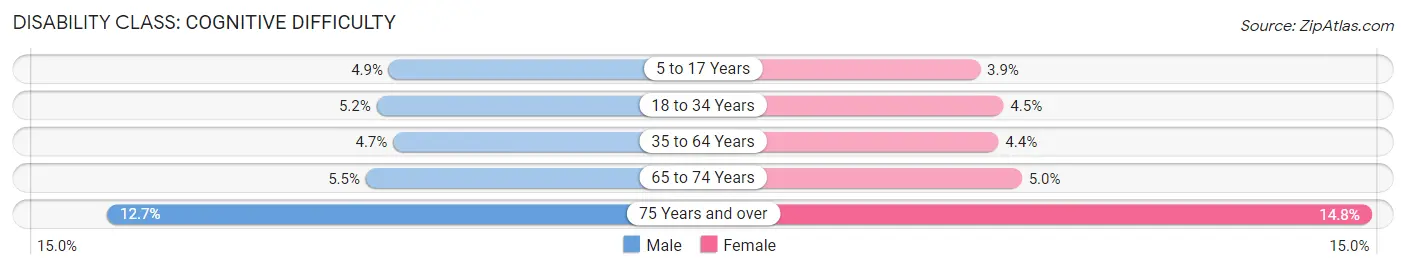
| Age Bracket | Male | Female |
| 5 to 17 Years | 2,169 (4.9%) | 1,663 (3.8%) |
| 18 to 34 Years | 3,295 (5.2%) | 3,226 (4.5%) |
| 35 to 64 Years | 4,534 (4.7%) | 4,561 (4.4%) |
| 65 to 74 Years | 1,219 (5.5%) | 1,346 (5.0%) |
| 75 Years and over | 1,656 (12.7%) | 2,895 (14.7%) |
Disability Class: Ambulatory Difficulty
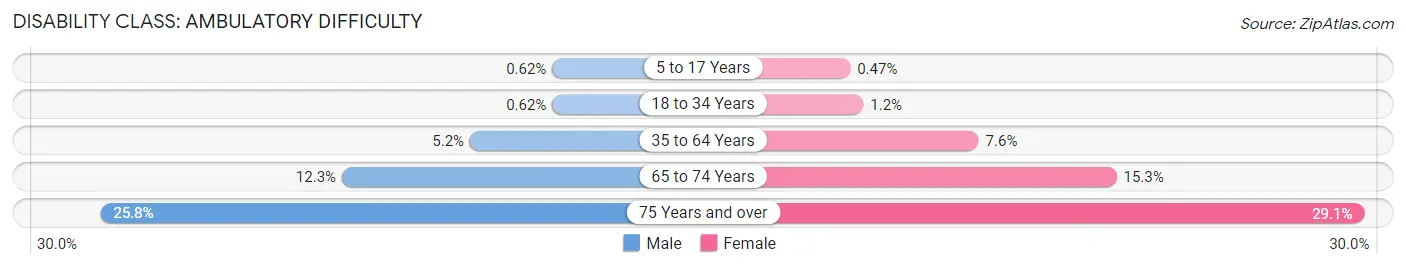
| Age Bracket | Male | Female |
| 5 to 17 Years | 277 (0.6%) | 202 (0.5%) |
| 18 to 34 Years | 391 (0.6%) | 862 (1.2%) |
| 35 to 64 Years | 4,967 (5.2%) | 7,973 (7.6%) |
| 65 to 74 Years | 2,733 (12.3%) | 4,109 (15.3%) |
| 75 Years and over | 3,361 (25.8%) | 5,707 (29.1%) |
Disability Class: Self-Care Difficulty
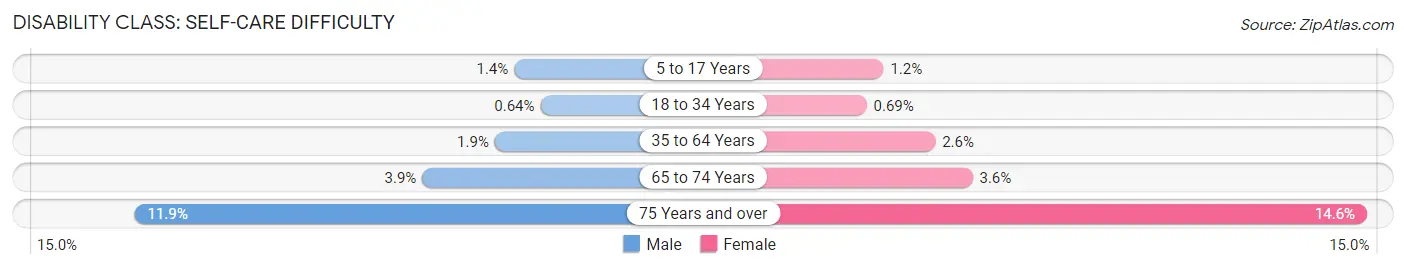
| Age Bracket | Male | Female |
| 5 to 17 Years | 611 (1.4%) | 503 (1.2%) |
| 18 to 34 Years | 403 (0.6%) | 492 (0.7%) |
| 35 to 64 Years | 1,824 (1.9%) | 2,724 (2.6%) |
| 65 to 74 Years | 870 (3.9%) | 977 (3.6%) |
| 75 Years and over | 1,557 (11.9%) | 2,868 (14.6%) |
Technology Access in Guilford County
Computing Device Access in Guilford County
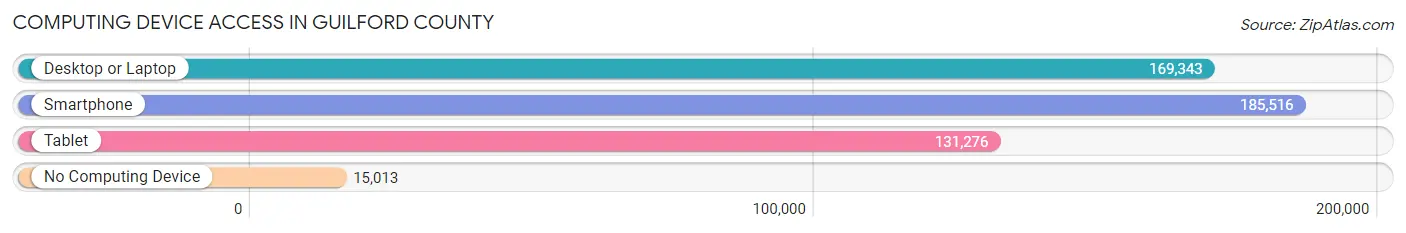
| Device Type | # Households | % Households |
| Desktop or Laptop | 169,343 | 79.6% |
| Smartphone | 185,516 | 87.2% |
| Tablet | 131,276 | 61.7% |
| No Computing Device | 15,013 | 7.0% |
| Total | 212,825 | 100.0% |
Internet Access in Guilford County
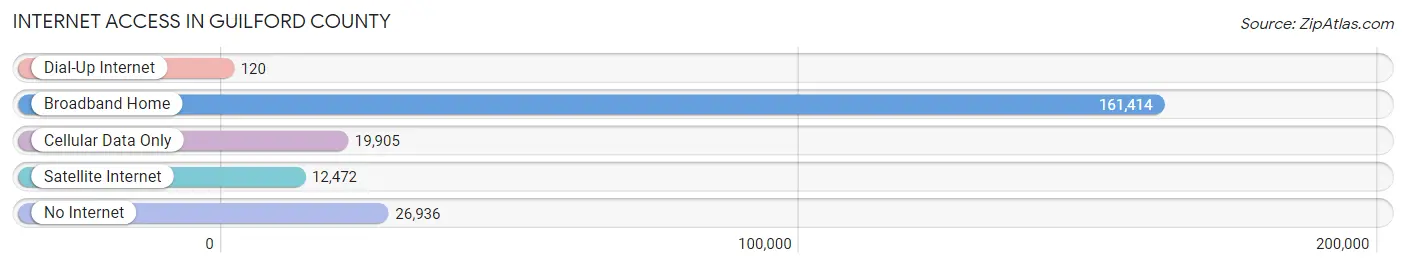
| Internet Type | # Households | % Households |
| Dial-Up Internet | 120 | 0.1% |
| Broadband Home | 161,414 | 75.8% |
| Cellular Data Only | 19,905 | 9.3% |
| Satellite Internet | 12,472 | 5.9% |
| No Internet | 26,936 | 12.7% |
| Total | 212,825 | 100.0% |
Guilford County Summary
Guilford County is located in the Piedmont region of North Carolina, and is the third most populous county in the state. It is bordered by Forsyth, Davidson, Randolph, Alamance, Rockingham, and Randolph counties. The county seat is Greensboro, and the county is home to a population of 536,453 people as of the 2020 census.
Geography
Guilford County is located in the Piedmont region of North Carolina, and is bordered by Forsyth, Davidson, Randolph, Alamance, Rockingham, and Randolph counties. The county covers an area of 845 square miles, and is home to a variety of terrain, including rolling hills, flat plains, and wooded areas. The county is home to several rivers, including the Haw, Deep, and Cape Fear rivers. The county is also home to several lakes, including High Rock Lake, Lake Townsend, and Lake Brandt.
History
Guilford County was formed in 1771 from parts of Rowan and Orange counties. It was named for Francis North, 1st Earl of Guilford, who was the Prime Minister of Great Britain at the time. The county was initially divided into six townships, and the county seat was established in Greensboro in 1781.
The county was home to several Native American tribes prior to European settlement, including the Catawba, Cherokee, and Tuscarora. The county was also home to several early settlers, including Quakers, Scots-Irish, and German immigrants.
The county was an important center of the Revolutionary War, and was the site of several battles, including the Battle of Guilford Courthouse in 1781. The county was also home to several prominent figures during the Civil War, including General Robert E. Lee and General Stonewall Jackson.
Economy
Guilford County is home to a diverse economy, with a variety of industries, including manufacturing, healthcare, education, and tourism. The county is home to several major employers, including Honda Aircraft Company, Volvo Trucks North America, and Cone Health. The county is also home to several universities, including the University of North Carolina at Greensboro, North Carolina A&T State University, and Guilford College.
The county is home to several major shopping centers, including the Four Seasons Town Centre, Friendly Center, and the Greensboro Coliseum Complex. The county is also home to several major attractions, including the Greensboro Science Center, the Greensboro Children’s Museum, and the International Civil Rights Center and Museum.
Demographics
As of the 2020 census, Guilford County had a population of 536,453 people. The racial makeup of the county was 68.2% White, 24.2% Black or African American, 4.2% Hispanic or Latino, 2.2% Asian, and 1.2% other. The median household income was $54,945, and the median home value was $179,400.
Guilford County is home to a variety of religious denominations, including Christianity, Judaism, Islam, and Buddhism. The county is also home to a variety of cultural attractions, including the Greensboro Symphony Orchestra, the Greensboro Ballet, and the Greensboro Opera.
Common Questions
What is the Total Population of Guilford County?
Total Population of Guilford County is 539,557.
What is the Total Male Population of Guilford County?
Total Male Population of Guilford County is 256,731.
What is the Total Female Population of Guilford County?
Total Female Population of Guilford County is 282,826.
What is the Ratio of Males per 100 Females in Guilford County?
There are 90.77 Males per 100 Females in Guilford County.
What is the Ratio of Females per 100 Males in Guilford County?
There are 110.16 Females per 100 Males in Guilford County.
What is the Median Population Age in Guilford County?
Median Population Age in Guilford County is 37.2 Years.
What is the Average Family Size in Guilford County
Average Family Size in Guilford County is 3.1 People.
What is the Average Household Size in Guilford County
Average Household Size in Guilford County is 2.4 People.
What is Per Capita Income in Guilford County?
Per Capita income in Guilford County is $36,563.
What is the Median Family Income in Guilford County?
Median Family Income in Guilford County is $80,635.
What is the Median Household income in Guilford County?
Median Household Income in Guilford County is $62,880.
What is Income or Wage Gap in Guilford County?
Income or Wage Gap in Guilford County is 24.1%.
Women in Guilford County earn 75.9 cents for every dollar earned by a man.
What is Family Income Deficit in Guilford County?
Family Income Deficit in Guilford County is $11,040.
Families that are below poverty line in Guilford County earn $11,040 less on average than the poverty threshold level.
What is Inequality or Gini Index in Guilford County?
Inequality or Gini Index in Guilford County is 0.49.
How Large is the Labor Force in Guilford County?
There are 278,466 People in the Labor Forcein in Guilford County.
What is the Percentage of People in the Labor Force in Guilford County?
64.1% of People are in the Labor Force in Guilford County.
What is the Unemployment Rate in Guilford County?
Unemployment Rate in Guilford County is 5.2%.