Granville County, NC
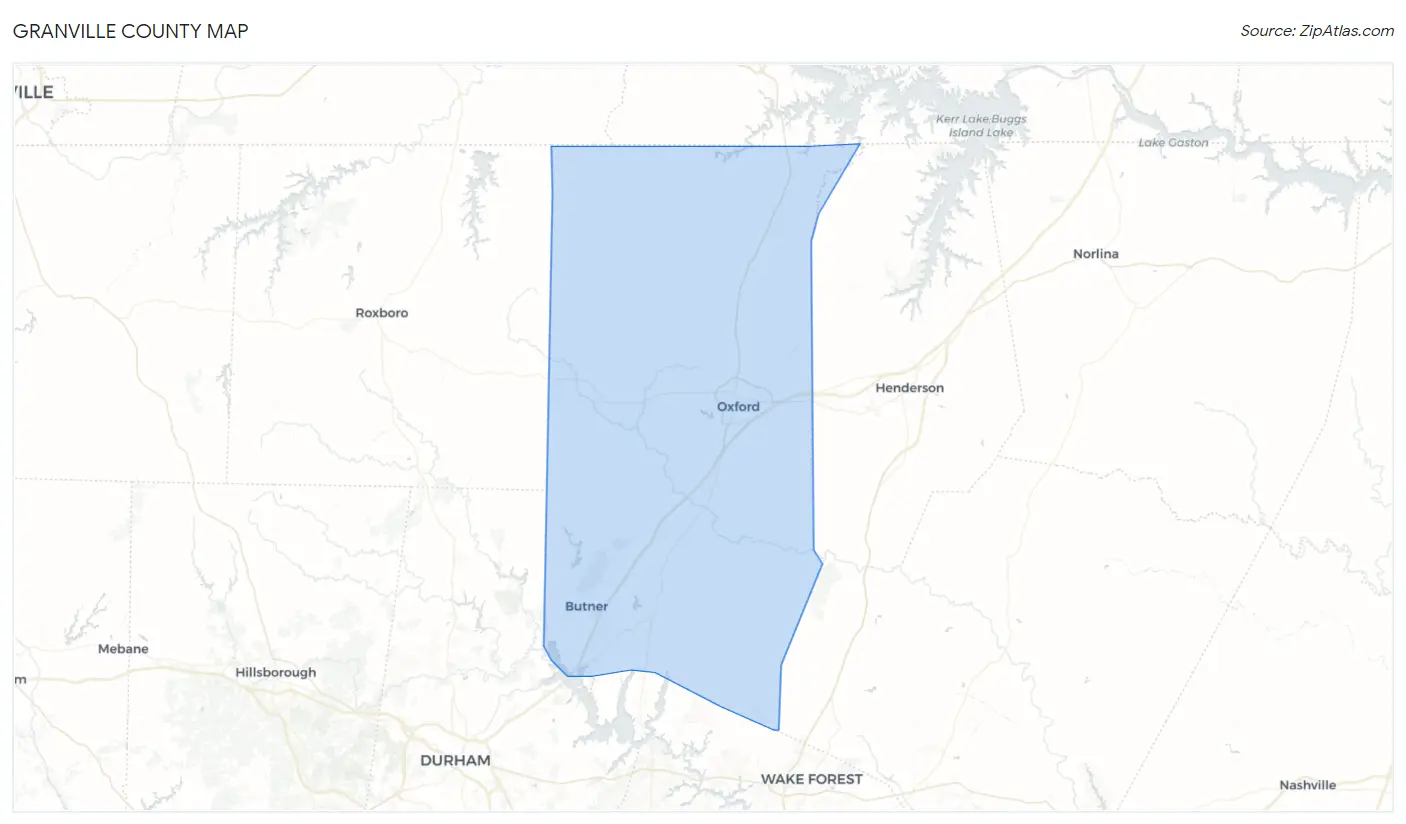
Granville County Map
Granville County Overview
61,161
TOTAL POPULATION
31,552
MALE POPULATION
29,609
FEMALE POPULATION
106.56
MALES / 100 FEMALES
93.84
FEMALES / 100 MALES
42.5
MEDIAN AGE
3.2
AVG FAMILY SIZE
2.6
AVG HOUSEHOLD SIZE
$31,604
PER CAPITA INCOME
$81,516
AVG FAMILY INCOME
$68,079
AVG HOUSEHOLD INCOME
12.9%
WAGE / INCOME GAP [ % ]
87.1¢/ $1
WAGE / INCOME GAP [ $ ]
$10,712
FAMILY INCOME DEFICIT
0.44
INEQUALITY / GINI INDEX
28,306
LABOR FORCE [ PEOPLE ]
56.0%
PERCENT IN LABOR FORCE
4.7%
UNEMPLOYMENT RATE
Granville County Area Codes
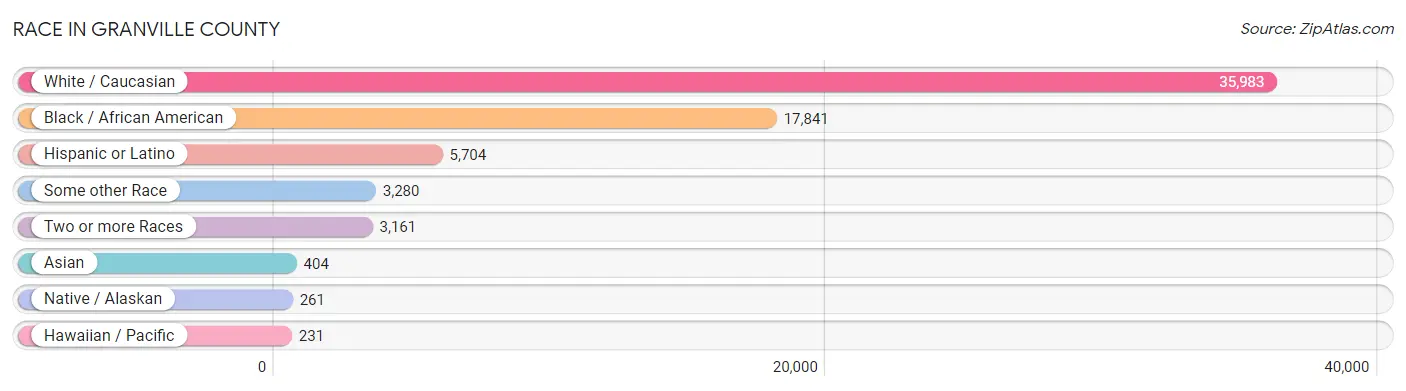
Race in Granville County
The most populous races in Granville County are White / Caucasian (35,983 | 58.8%), Black / African American (17,841 | 29.2%), and Hispanic or Latino (5,704 | 9.3%).
| Race | # Population | % Population |
| Asian | 404 | 0.7% |
| Black / African American | 17,841 | 29.2% |
| Hawaiian / Pacific | 231 | 0.4% |
| Hispanic or Latino | 5,704 | 9.3% |
| Native / Alaskan | 261 | 0.4% |
| White / Caucasian | 35,983 | 58.8% |
| Two or more Races | 3,161 | 5.2% |
| Some other Race | 3,280 | 5.4% |
| Total | 61,161 | 100.0% |
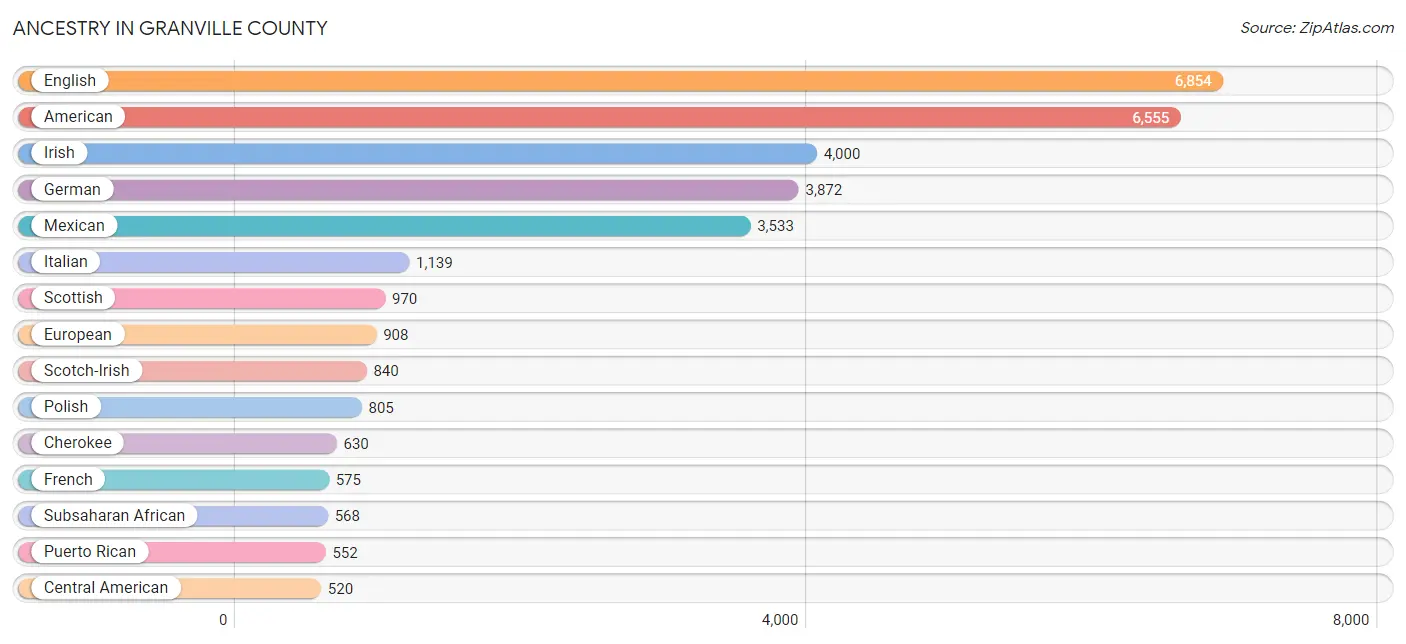
Ancestry in Granville County
The most populous ancestries reported in Granville County are English (6,854 | 11.2%), American (6,555 | 10.7%), Irish (4,000 | 6.5%), German (3,872 | 6.3%), and Mexican (3,533 | 5.8%), together accounting for 40.6% of all Granville County residents.
| Ancestry | # Population | % Population |
| African | 430 | 0.7% |
| American | 6,555 | 10.7% |
| Arab | 205 | 0.3% |
| Argentinean | 17 | 0.0% |
| Australian | 38 | 0.1% |
| Austrian | 28 | 0.1% |
| Bahamian | 23 | 0.0% |
| Bangladeshi | 19 | 0.0% |
| Barbadian | 5 | 0.0% |
| Belgian | 5 | 0.0% |
| Bhutanese | 36 | 0.1% |
| Blackfeet | 18 | 0.0% |
| British | 347 | 0.6% |
| Burmese | 215 | 0.4% |
| Canadian | 145 | 0.2% |
| Central American | 520 | 0.9% |
| Central American Indian | 49 | 0.1% |
| Cherokee | 630 | 1.0% |
| Choctaw | 126 | 0.2% |
| Colombian | 47 | 0.1% |
| Cuban | 149 | 0.2% |
| Czech | 127 | 0.2% |
| Czechoslovakian | 18 | 0.0% |
| Danish | 27 | 0.0% |
| Dominican | 2 | 0.0% |
| Dutch | 379 | 0.6% |
| Eastern European | 6 | 0.0% |
| Ecuadorian | 32 | 0.1% |
| Egyptian | 53 | 0.1% |
| English | 6,854 | 11.2% |
| European | 908 | 1.5% |
| Finnish | 6 | 0.0% |
| French | 575 | 0.9% |
| French Canadian | 142 | 0.2% |
| German | 3,872 | 6.3% |
| Ghanaian | 11 | 0.0% |
| Greek | 10 | 0.0% |
| Guamanian / Chamorro | 147 | 0.2% |
| Guatemalan | 32 | 0.1% |
| Honduran | 101 | 0.2% |
| Hungarian | 126 | 0.2% |
| Indian (Asian) | 26 | 0.0% |
| Iranian | 3 | 0.0% |
| Irish | 4,000 | 6.5% |
| Iroquois | 13 | 0.0% |
| Italian | 1,139 | 1.9% |
| Japanese | 32 | 0.1% |
| Korean | 176 | 0.3% |
| Lebanese | 8 | 0.0% |
| Lithuanian | 43 | 0.1% |
| Lumbee | 115 | 0.2% |
| Mexican | 3,533 | 5.8% |
| Mexican American Indian | 24 | 0.0% |
| Native Hawaiian | 38 | 0.1% |
| Nicaraguan | 8 | 0.0% |
| Nigerian | 117 | 0.2% |
| Northern European | 2 | 0.0% |
| Norwegian | 252 | 0.4% |
| Panamanian | 3 | 0.0% |
| Polish | 805 | 1.3% |
| Portuguese | 58 | 0.1% |
| Puerto Rican | 552 | 0.9% |
| Russian | 137 | 0.2% |
| Salvadoran | 376 | 0.6% |
| Samoan | 21 | 0.0% |
| Scandinavian | 71 | 0.1% |
| Scotch-Irish | 840 | 1.4% |
| Scottish | 970 | 1.6% |
| Slovak | 42 | 0.1% |
| Slovene | 26 | 0.0% |
| South American | 96 | 0.2% |
| Spaniard | 41 | 0.1% |
| Spanish | 207 | 0.3% |
| Sri Lankan | 17 | 0.0% |
| Subsaharan African | 568 | 0.9% |
| Swedish | 217 | 0.4% |
| Swiss | 39 | 0.1% |
| Thai | 225 | 0.4% |
| Turkish | 22 | 0.0% |
| Ukrainian | 47 | 0.1% |
| Welsh | 369 | 0.6% |
| West Indian | 71 | 0.1% | View All 82 Rows |
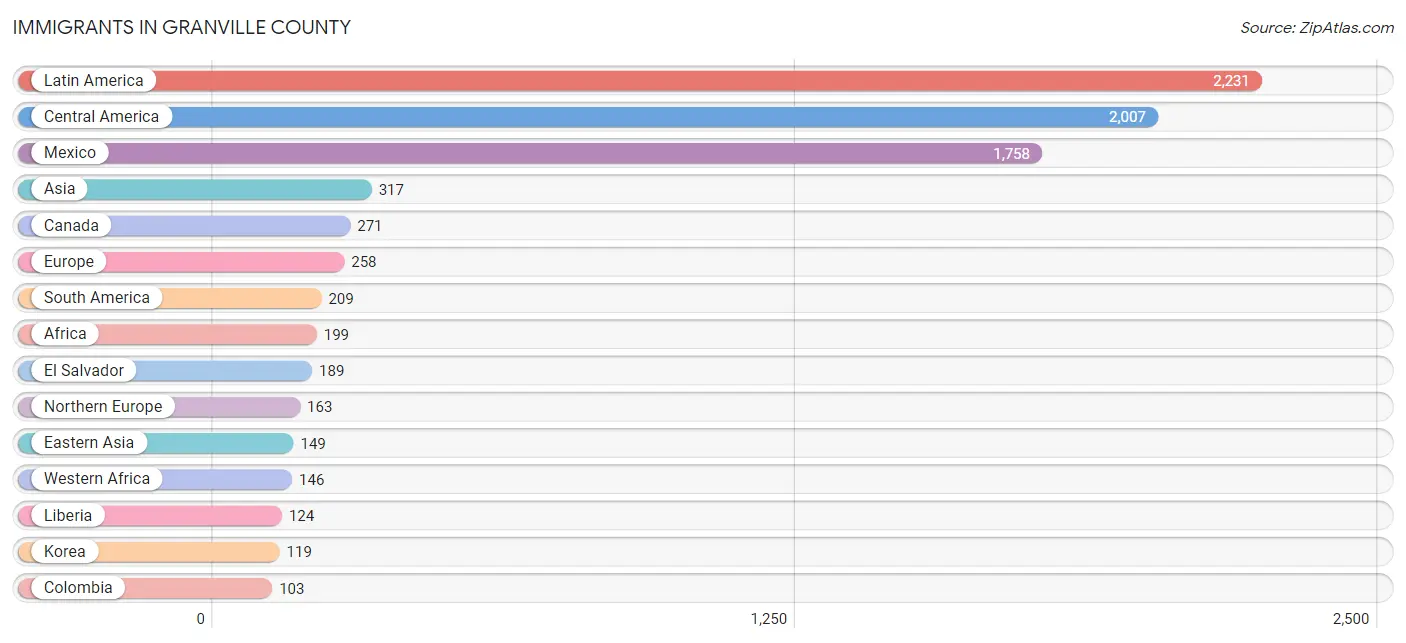
Immigrants in Granville County
The most numerous immigrant groups reported in Granville County came from Latin America (2,231 | 3.6%), Central America (2,007 | 3.3%), Mexico (1,758 | 2.9%), Asia (317 | 0.5%), and Canada (271 | 0.4%), together accounting for 10.8% of all Granville County residents.
| Immigration Origin | # Population | % Population |
| Africa | 199 | 0.3% |
| Asia | 317 | 0.5% |
| Bahamas | 13 | 0.0% |
| Canada | 271 | 0.4% |
| Caribbean | 15 | 0.0% |
| Central America | 2,007 | 3.3% |
| China | 30 | 0.1% |
| Colombia | 103 | 0.2% |
| Dominican Republic | 2 | 0.0% |
| Eastern Asia | 149 | 0.2% |
| Ecuador | 64 | 0.1% |
| Egypt | 53 | 0.1% |
| El Salvador | 189 | 0.3% |
| England | 91 | 0.2% |
| Europe | 258 | 0.4% |
| Germany | 83 | 0.1% |
| Guatemala | 24 | 0.0% |
| Guyana | 42 | 0.1% |
| Honduras | 33 | 0.1% |
| India | 67 | 0.1% |
| Ireland | 8 | 0.0% |
| Korea | 119 | 0.2% |
| Latin America | 2,231 | 3.6% |
| Liberia | 124 | 0.2% |
| Mexico | 1,758 | 2.9% |
| Nigeria | 22 | 0.0% |
| Northern Africa | 53 | 0.1% |
| Northern Europe | 163 | 0.3% |
| Pakistan | 15 | 0.0% |
| Panama | 3 | 0.0% |
| Philippines | 28 | 0.1% |
| Scotland | 33 | 0.1% |
| South America | 209 | 0.3% |
| South Central Asia | 82 | 0.1% |
| South Eastern Asia | 35 | 0.1% |
| Switzerland | 12 | 0.0% |
| Turkey | 22 | 0.0% |
| Vietnam | 7 | 0.0% |
| Western Africa | 146 | 0.2% |
| Western Asia | 51 | 0.1% |
| Western Europe | 95 | 0.2% |
| Yemen | 29 | 0.1% | View All 42 Rows |
Sex and Age in Granville County
Sex and Age in Granville County
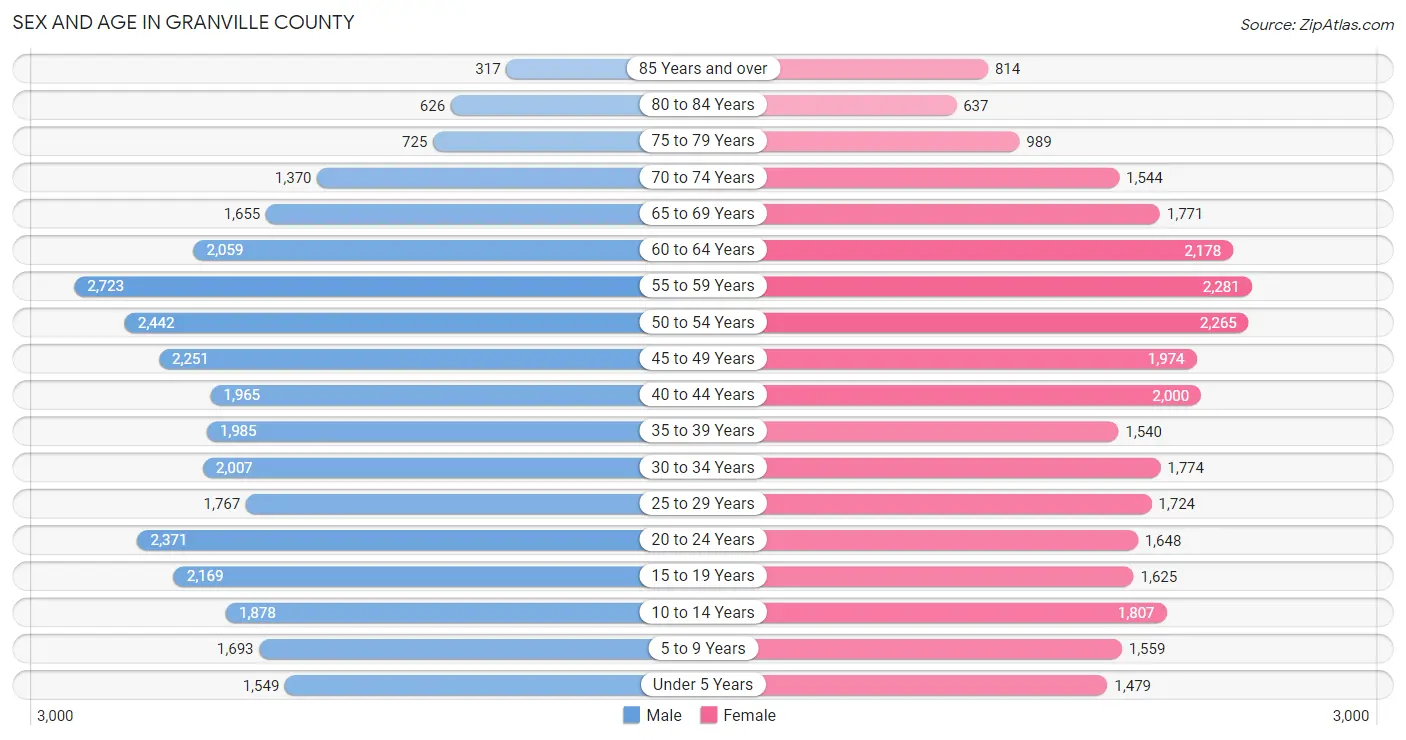
The most populous age groups in Granville County are 55 to 59 Years (2,723 | 8.6%) for men and 55 to 59 Years (2,281 | 7.7%) for women.
| Age Bracket | Male | Female |
| Under 5 Years | 1,549 (4.9%) | 1,479 (5.0%) |
| 5 to 9 Years | 1,693 (5.4%) | 1,559 (5.3%) |
| 10 to 14 Years | 1,878 (5.9%) | 1,807 (6.1%) |
| 15 to 19 Years | 2,169 (6.9%) | 1,625 (5.5%) |
| 20 to 24 Years | 2,371 (7.5%) | 1,648 (5.6%) |
| 25 to 29 Years | 1,767 (5.6%) | 1,724 (5.8%) |
| 30 to 34 Years | 2,007 (6.4%) | 1,774 (6.0%) |
| 35 to 39 Years | 1,985 (6.3%) | 1,540 (5.2%) |
| 40 to 44 Years | 1,965 (6.2%) | 2,000 (6.8%) |
| 45 to 49 Years | 2,251 (7.1%) | 1,974 (6.7%) |
| 50 to 54 Years | 2,442 (7.7%) | 2,265 (7.6%) |
| 55 to 59 Years | 2,723 (8.6%) | 2,281 (7.7%) |
| 60 to 64 Years | 2,059 (6.5%) | 2,178 (7.4%) |
| 65 to 69 Years | 1,655 (5.2%) | 1,771 (6.0%) |
| 70 to 74 Years | 1,370 (4.3%) | 1,544 (5.2%) |
| 75 to 79 Years | 725 (2.3%) | 989 (3.3%) |
| 80 to 84 Years | 626 (2.0%) | 637 (2.1%) |
| 85 Years and over | 317 (1.0%) | 814 (2.8%) |
| Total | 31,552 (100.0%) | 29,609 (100.0%) |
Families and Households in Granville County
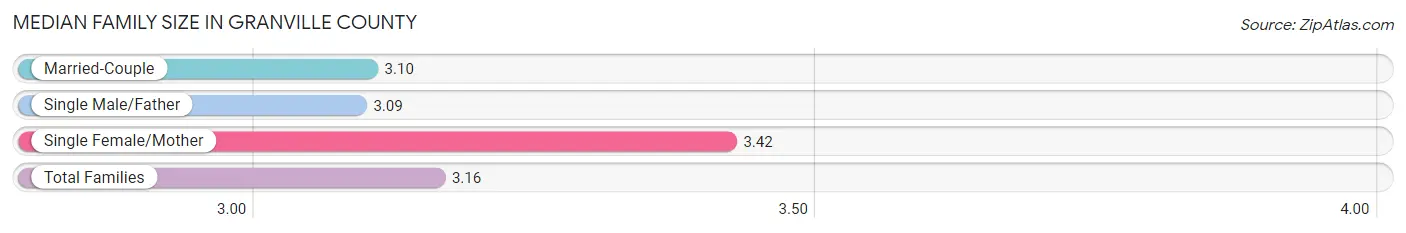
Median Family Size in Granville County
The median family size in Granville County is 3.16 persons per family, with single female/mother families (3,068 | 20.1%) accounting for the largest median family size of 3.42 persons per family. On the other hand, single male/father families (1,107 | 7.3%) represent the smallest median family size with 3.09 persons per family.
| Family Type | # Families | Family Size |
| Married-Couple | 11,077 (72.6%) | 3.10 |
| Single Male/Father | 1,107 (7.3%) | 3.09 |
| Single Female/Mother | 3,068 (20.1%) | 3.42 |
| Total Families | 15,252 (100.0%) | 3.16 |
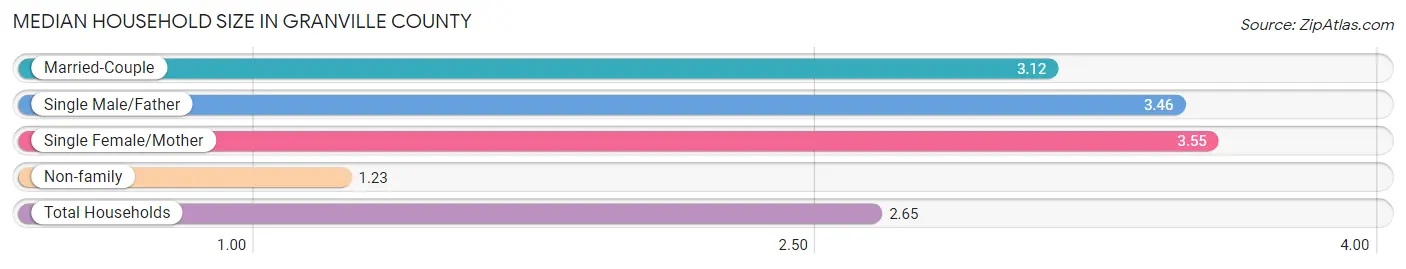
Median Household Size in Granville County
The median household size in Granville County is 2.65 persons per household, with single female/mother households (3,068 | 14.3%) accounting for the largest median household size of 3.55 persons per household. non-family households (6,253 | 29.1%) represent the smallest median household size with 1.23 persons per household.
| Household Type | # Households | Household Size |
| Married-Couple | 11,077 (51.5%) | 3.12 |
| Single Male/Father | 1,107 (5.1%) | 3.46 |
| Single Female/Mother | 3,068 (14.3%) | 3.55 |
| Non-family | 6,253 (29.1%) | 1.23 |
| Total Households | 21,505 (100.0%) | 2.65 |
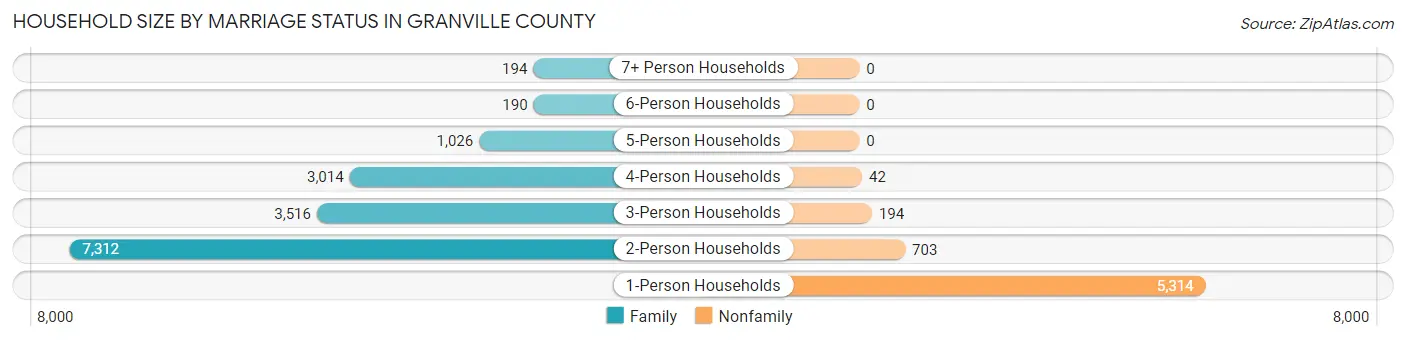
Household Size by Marriage Status in Granville County
Out of a total of 21,505 households in Granville County, 15,252 (70.9%) are family households, while 6,253 (29.1%) are nonfamily households. The most numerous type of family households are 2-person households, comprising 7,312, and the most common type of nonfamily households are 1-person households, comprising 5,314.
| Household Size | Family Households | Nonfamily Households |
| 1-Person Households | - | 5,314 (24.7%) |
| 2-Person Households | 7,312 (34.0%) | 703 (3.3%) |
| 3-Person Households | 3,516 (16.4%) | 194 (0.9%) |
| 4-Person Households | 3,014 (14.0%) | 42 (0.2%) |
| 5-Person Households | 1,026 (4.8%) | 0 (0.0%) |
| 6-Person Households | 190 (0.9%) | 0 (0.0%) |
| 7+ Person Households | 194 (0.9%) | 0 (0.0%) |
| Total | 15,252 (70.9%) | 6,253 (29.1%) |
Female Fertility in Granville County
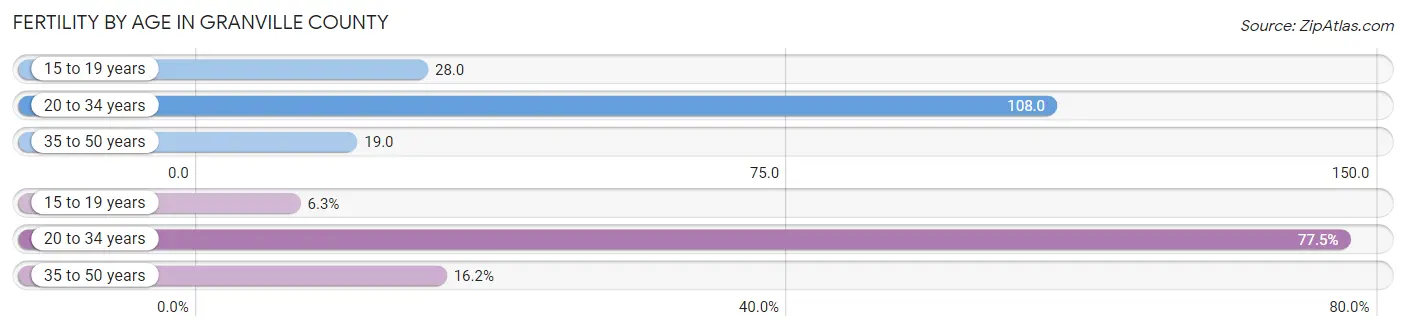
Fertility by Age in Granville County
Average fertility rate in Granville County is 56.0 births per 1,000 women. Women in the age bracket of 20 to 34 years have the highest fertility rate with 108.0 births per 1,000 women. Women in the age bracket of 20 to 34 years acount for 77.5% of all women with births.
| Age Bracket | Women with Births | Births / 1,000 Women |
| 15 to 19 years | 45 (6.3%) | 28.0 |
| 20 to 34 years | 555 (77.5%) | 108.0 |
| 35 to 50 years | 116 (16.2%) | 19.0 |
| Total | 716 (100.0%) | 56.0 |
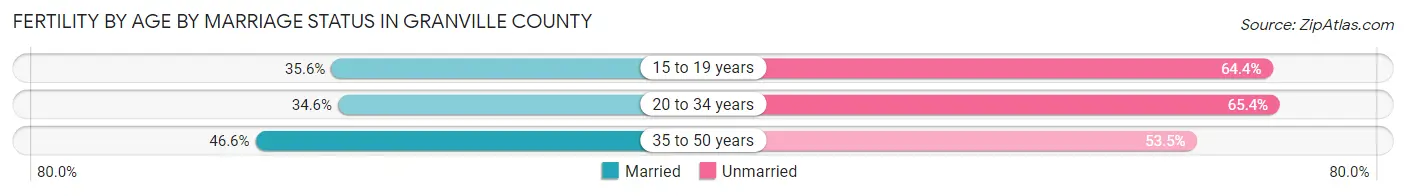
Fertility by Age by Marriage Status in Granville County
36.6% of women with births (716) in Granville County are married. The highest percentage of unmarried women with births falls into 20 to 34 years age bracket with 65.4% of them unmarried at the time of birth, while the lowest percentage of unmarried women with births belong to 35 to 50 years age bracket with 53.4% of them unmarried.
| Age Bracket | Married | Unmarried |
| 15 to 19 years | 16 (35.6%) | 29 (64.4%) |
| 20 to 34 years | 192 (34.6%) | 363 (65.4%) |
| 35 to 50 years | 54 (46.6%) | 62 (53.4%) |
| Total | 262 (36.6%) | 454 (63.4%) |
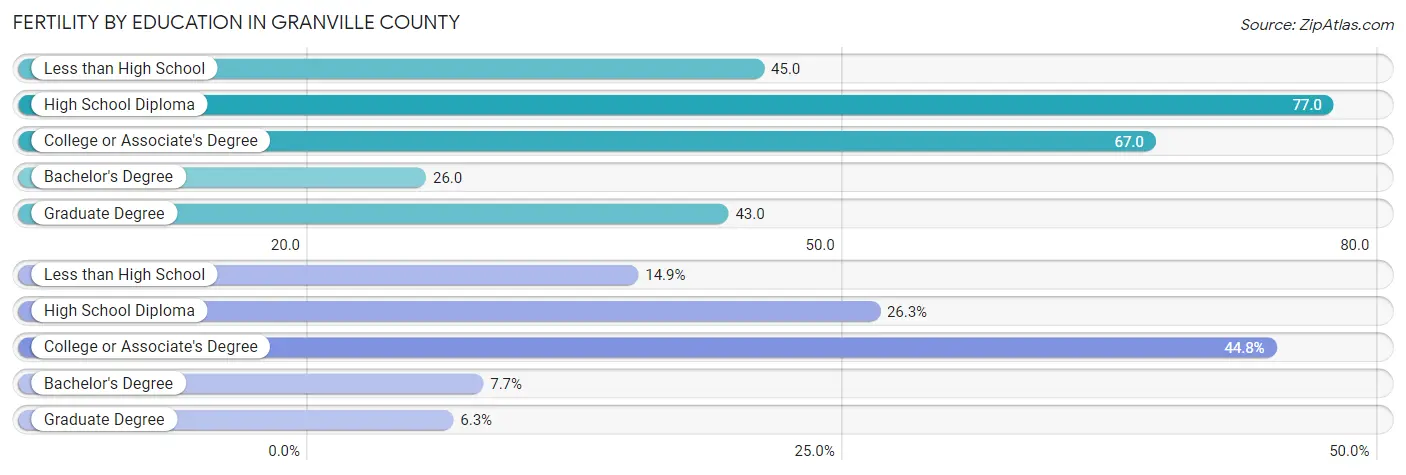
Fertility by Education in Granville County
Average fertility rate in Granville County is 56.0 births per 1,000 women. Women with the education attainment of high school diploma have the highest fertility rate of 77.0 births per 1,000 women, while women with the education attainment of bachelor's degree have the lowest fertility at 26.0 births per 1,000 women. Women with the education attainment of college or associate's degree represent 44.8% of all women with births.
| Educational Attainment | Women with Births | Births / 1,000 Women |
| Less than High School | 107 (14.9%) | 45.0 |
| High School Diploma | 188 (26.3%) | 77.0 |
| College or Associate's Degree | 321 (44.8%) | 67.0 |
| Bachelor's Degree | 55 (7.7%) | 26.0 |
| Graduate Degree | 45 (6.3%) | 43.0 |
| Total | 716 (100.0%) | 56.0 |
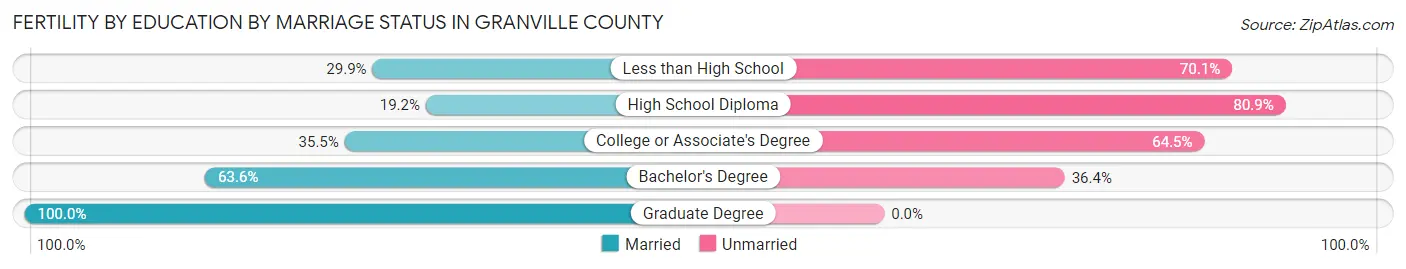
Fertility by Education by Marriage Status in Granville County
63.4% of women with births in Granville County are unmarried. Women with the educational attainment of graduate degree are most likely to be married with 100.0% of them married at childbirth, while women with the educational attainment of high school diploma are least likely to be married with 80.8% of them unmarried at childbirth.
| Educational Attainment | Married | Unmarried |
| Less than High School | 32 (29.9%) | 75 (70.1%) |
| High School Diploma | 36 (19.2%) | 152 (80.8%) |
| College or Associate's Degree | 114 (35.5%) | 207 (64.5%) |
| Bachelor's Degree | 35 (63.6%) | 20 (36.4%) |
| Graduate Degree | 45 (100.0%) | 0 (0.0%) |
| Total | 262 (36.6%) | 454 (63.4%) |
Income in Granville County
Income Overview in Granville County
Per Capita Income in Granville County is $31,604, while median incomes of families and households are $81,516 and $68,079 respectively.
| Characteristic | Number | Measure |
| Per Capita Income | 61,161 | $31,604 |
| Median Family Income | 15,252 | $81,516 |
| Mean Family Income | 15,252 | $97,223 |
| Median Household Income | 21,505 | $68,079 |
| Mean Household Income | 21,505 | $85,612 |
| Income Deficit | 15,252 | $10,712 |
| Wage / Income Gap (%) | 61,161 | 12.93% |
| Wage / Income Gap ($) | 61,161 | 87.07¢ per $1 |
| Gini / Inequality Index | 61,161 | 0.44 |
Earnings by Sex in Granville County
Average Earnings in Granville County are $40,153, $43,287 for men and $37,692 for women, a difference of 12.9%.
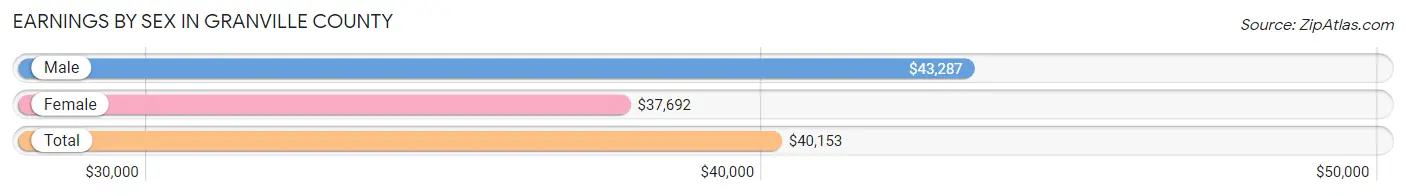
| Sex | Number | Average Earnings |
| Male | 15,377 (51.4%) | $43,287 |
| Female | 14,538 (48.6%) | $37,692 |
| Total | 29,915 (100.0%) | $40,153 |
Earnings by Sex by Income Bracket in Granville County
The most common earnings brackets in Granville County are $100,000+ for men (2,148 | 14.0%) and $35,000 to $39,999 for women (1,127 | 7.7%).
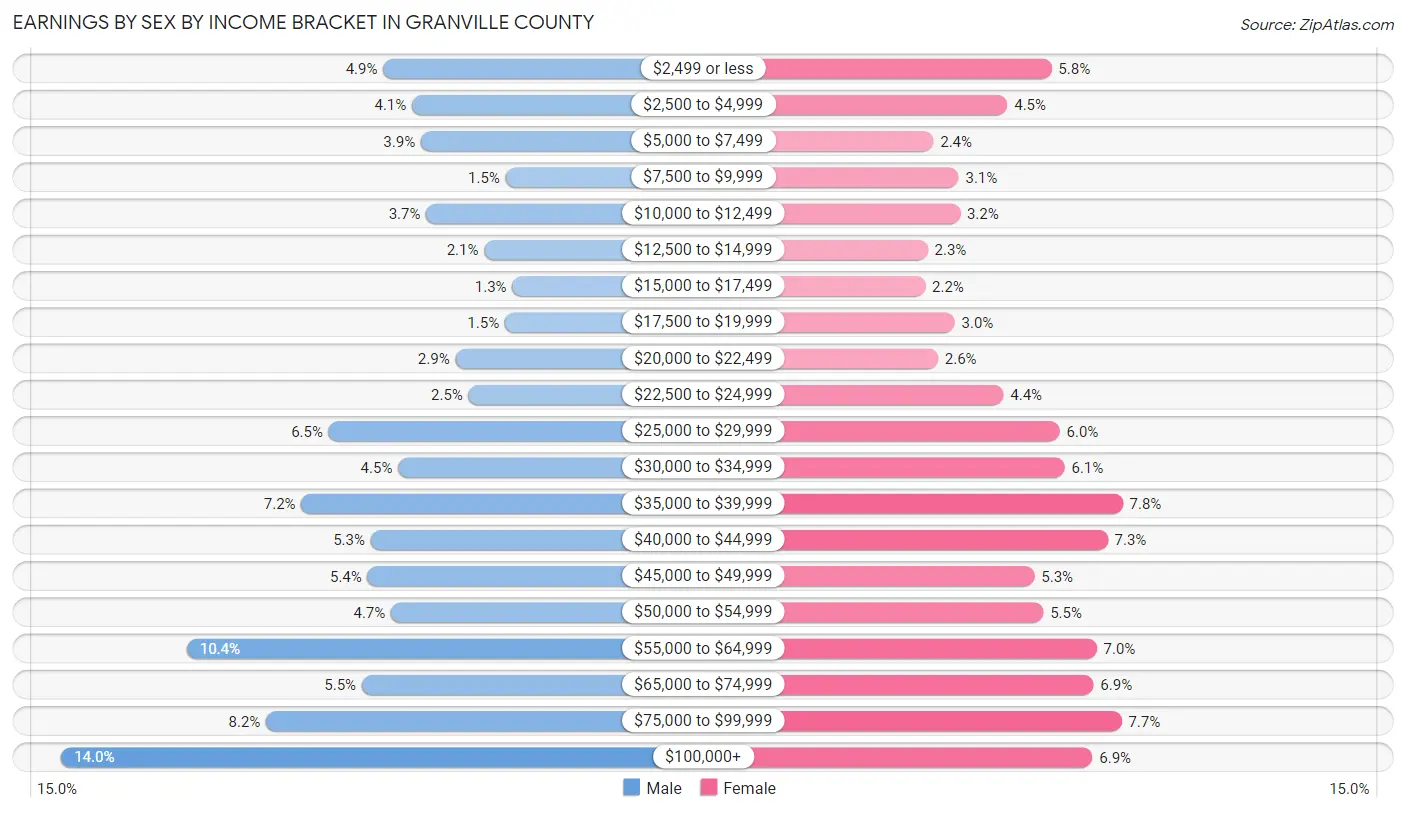
| Income | Male | Female |
| $2,499 or less | 756 (4.9%) | 836 (5.8%) |
| $2,500 to $4,999 | 632 (4.1%) | 655 (4.5%) |
| $5,000 to $7,499 | 594 (3.9%) | 354 (2.4%) |
| $7,500 to $9,999 | 228 (1.5%) | 457 (3.1%) |
| $10,000 to $12,499 | 570 (3.7%) | 462 (3.2%) |
| $12,500 to $14,999 | 320 (2.1%) | 330 (2.3%) |
| $15,000 to $17,499 | 199 (1.3%) | 320 (2.2%) |
| $17,500 to $19,999 | 230 (1.5%) | 441 (3.0%) |
| $20,000 to $22,499 | 445 (2.9%) | 372 (2.6%) |
| $22,500 to $24,999 | 387 (2.5%) | 639 (4.4%) |
| $25,000 to $29,999 | 992 (6.5%) | 869 (6.0%) |
| $30,000 to $34,999 | 692 (4.5%) | 889 (6.1%) |
| $35,000 to $39,999 | 1,110 (7.2%) | 1,127 (7.7%) |
| $40,000 to $44,999 | 811 (5.3%) | 1,065 (7.3%) |
| $45,000 to $49,999 | 824 (5.4%) | 766 (5.3%) |
| $50,000 to $54,999 | 723 (4.7%) | 802 (5.5%) |
| $55,000 to $64,999 | 1,605 (10.4%) | 1,021 (7.0%) |
| $65,000 to $74,999 | 849 (5.5%) | 1,007 (6.9%) |
| $75,000 to $99,999 | 1,262 (8.2%) | 1,123 (7.7%) |
| $100,000+ | 2,148 (14.0%) | 1,003 (6.9%) |
| Total | 15,377 (100.0%) | 14,538 (100.0%) |
Earnings by Sex by Educational Attainment in Granville County
Average earnings in Granville County are $48,576 for men and $41,651 for women, a difference of 14.3%. Men with an educational attainment of graduate degree enjoy the highest average annual earnings of $74,583, while those with less than high school education earn the least with $30,208. Women with an educational attainment of graduate degree earn the most with the average annual earnings of $63,267, while those with less than high school education have the smallest earnings of $18,527.
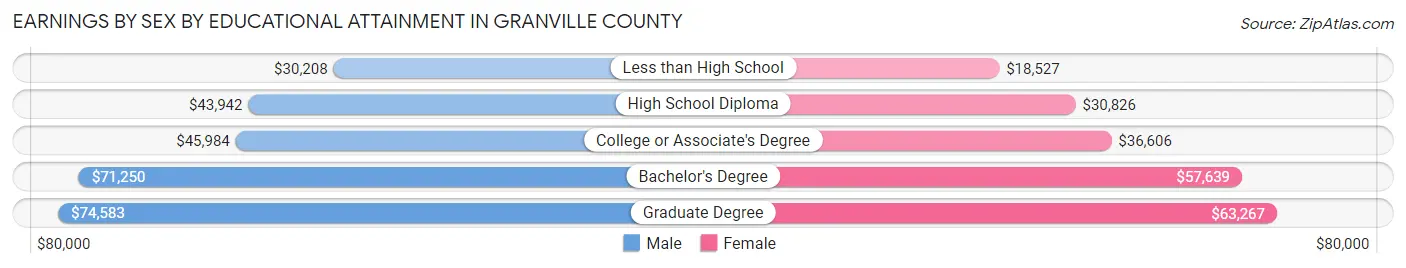
| Educational Attainment | Male Income | Female Income |
| Less than High School | $30,208 | $18,527 |
| High School Diploma | $43,942 | $30,826 |
| College or Associate's Degree | $45,984 | $36,606 |
| Bachelor's Degree | $71,250 | $57,639 |
| Graduate Degree | $74,583 | $63,267 |
| Total | $48,576 | $41,651 |
Family Income in Granville County
Family Income Brackets in Granville County
According to the Granville County family income data, there are 3,157 families falling into the $100,000 to $149,999 income range, which is the most common income bracket and makes up 20.7% of all families. Conversely, the $10,000 to $14,999 income bracket is the least frequent group with only 549 families (3.6%) belonging to this category.
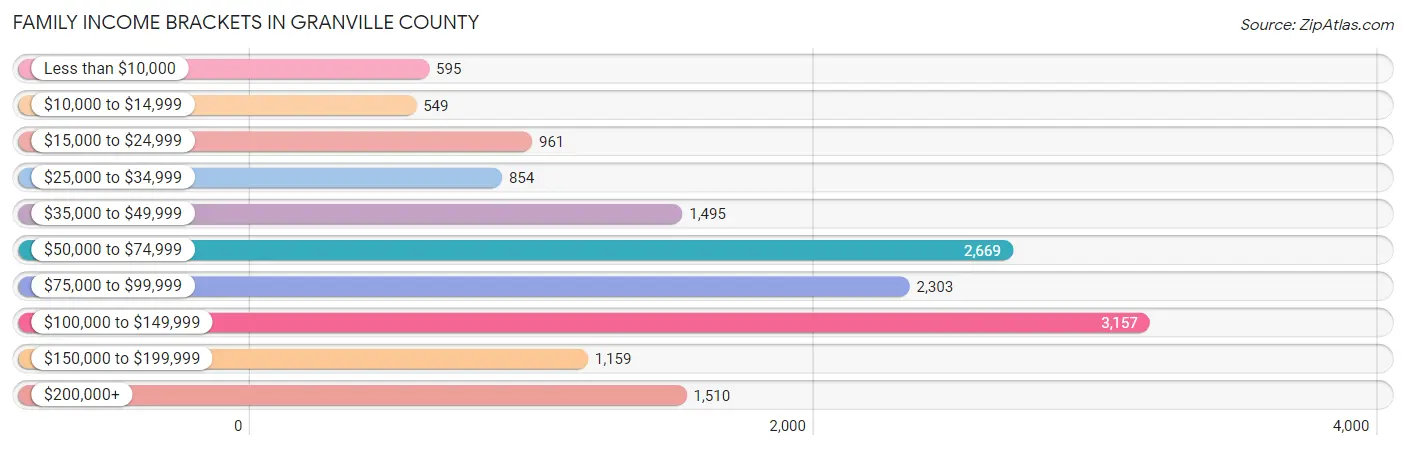
| Income Bracket | # Families | % Families |
| Less than $10,000 | 595 | 3.9% |
| $10,000 to $14,999 | 549 | 3.6% |
| $15,000 to $24,999 | 961 | 6.3% |
| $25,000 to $34,999 | 854 | 5.6% |
| $35,000 to $49,999 | 1,495 | 9.8% |
| $50,000 to $74,999 | 2,669 | 17.5% |
| $75,000 to $99,999 | 2,303 | 15.1% |
| $100,000 to $149,999 | 3,157 | 20.7% |
| $150,000 to $199,999 | 1,159 | 7.6% |
| $200,000+ | 1,510 | 9.9% |
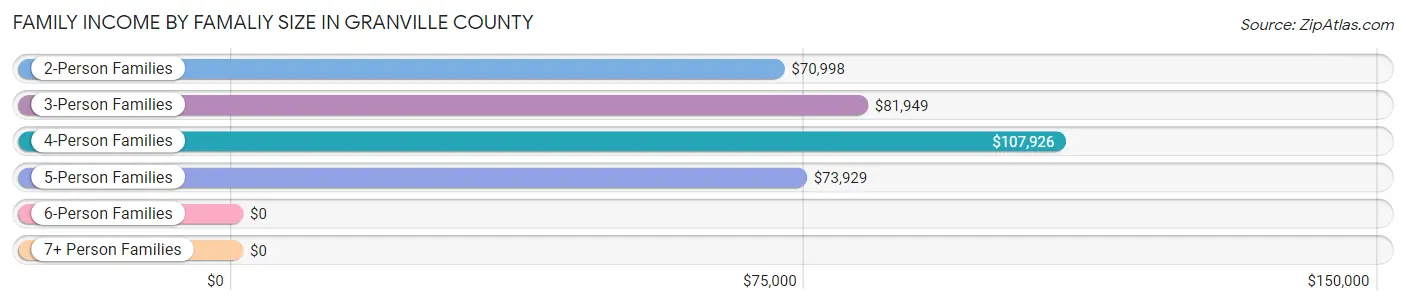
Family Income by Famaliy Size in Granville County
4-person families (2,688 | 17.6%) account for the highest median family income in Granville County with $107,926 per family, while 2-person families (7,653 | 50.2%) have the highest median income of $35,499 per family member.
| Income Bracket | # Families | Median Income |
| 2-Person Families | 7,653 (50.2%) | $70,998 |
| 3-Person Families | 3,659 (24.0%) | $81,949 |
| 4-Person Families | 2,688 (17.6%) | $107,926 |
| 5-Person Families | 868 (5.7%) | $73,929 |
| 6-Person Families | 207 (1.4%) | $0 |
| 7+ Person Families | 177 (1.2%) | $0 |
| Total | 15,252 (100.0%) | $81,516 |
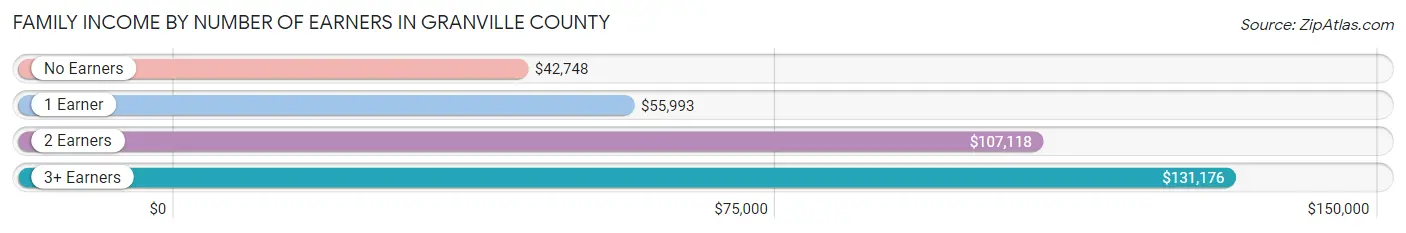
Family Income by Number of Earners in Granville County
The median family income in Granville County is $81,516, with families comprising 3+ earners (1,542) having the highest median family income of $131,176, while families with no earners (2,846) have the lowest median family income of $42,748, accounting for 10.1% and 18.7% of families, respectively.
| Number of Earners | # Families | Median Income |
| No Earners | 2,846 (18.7%) | $42,748 |
| 1 Earner | 4,704 (30.8%) | $55,993 |
| 2 Earners | 6,160 (40.4%) | $107,118 |
| 3+ Earners | 1,542 (10.1%) | $131,176 |
| Total | 15,252 (100.0%) | $81,516 |
Household Income in Granville County
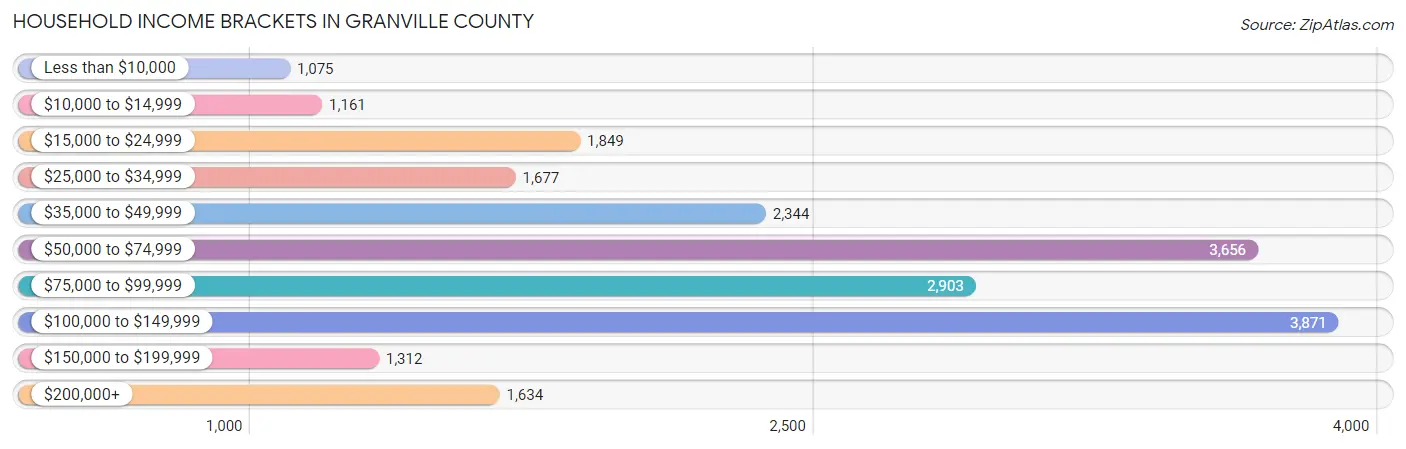
Household Income Brackets in Granville County
With 3,871 households falling in the category, the $100,000 to $149,999 income range is the most frequent in Granville County, accounting for 18.0% of all households. In contrast, only 1,075 households (5.0%) fall into the less than $10,000 income bracket, making it the least populous group.
| Income Bracket | # Households | % Households |
| Less than $10,000 | 1,075 | 5.0% |
| $10,000 to $14,999 | 1,161 | 5.4% |
| $15,000 to $24,999 | 1,849 | 8.6% |
| $25,000 to $34,999 | 1,677 | 7.8% |
| $35,000 to $49,999 | 2,344 | 10.9% |
| $50,000 to $74,999 | 3,656 | 17.0% |
| $75,000 to $99,999 | 2,903 | 13.5% |
| $100,000 to $149,999 | 3,871 | 18.0% |
| $150,000 to $199,999 | 1,312 | 6.1% |
| $200,000+ | 1,634 | 7.6% |
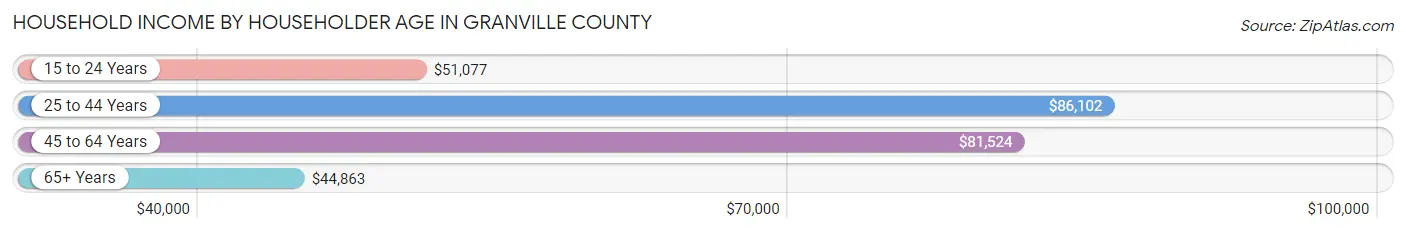
Household Income by Householder Age in Granville County
The median household income in Granville County is $68,079, with the highest median household income of $86,102 found in the 25 to 44 years age bracket for the primary householder. A total of 5,323 households (24.7%) fall into this category. Meanwhile, the 65+ years age bracket for the primary householder has the lowest median household income of $44,863, with 6,219 households (28.9%) in this group.
| Income Bracket | # Households | Median Income |
| 15 to 24 Years | 342 (1.6%) | $51,077 |
| 25 to 44 Years | 5,323 (24.7%) | $86,102 |
| 45 to 64 Years | 9,621 (44.7%) | $81,524 |
| 65+ Years | 6,219 (28.9%) | $44,863 |
| Total | 21,505 (100.0%) | $68,079 |
Poverty in Granville County
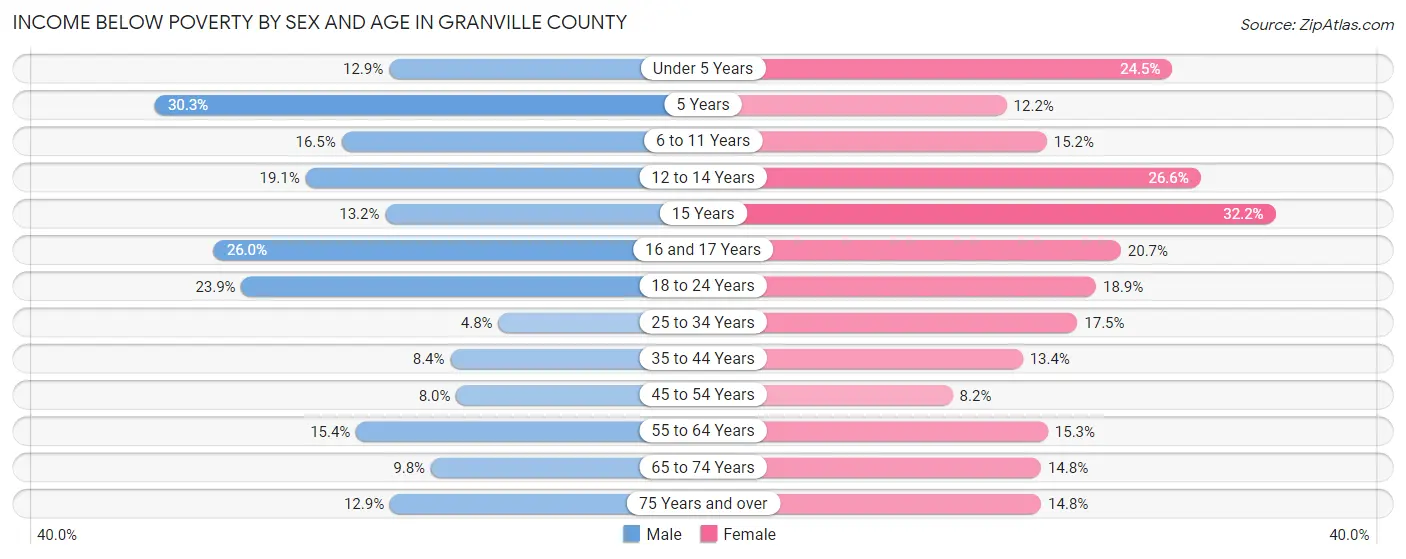
Income Below Poverty by Sex and Age in Granville County
With 13.1% poverty level for males and 15.6% for females among the residents of Granville County, 5 year old males and 15 year old females are the most vulnerable to poverty, with 94 males (30.3%) and 103 females (32.2%) in their respective age groups living below the poverty level.
| Age Bracket | Male | Female |
| Under 5 Years | 193 (12.9%) | 357 (24.5%) |
| 5 Years | 94 (30.3%) | 41 (12.2%) |
| 6 to 11 Years | 354 (16.5%) | 312 (15.2%) |
| 12 to 14 Years | 191 (19.1%) | 253 (26.6%) |
| 15 Years | 39 (13.2%) | 103 (32.2%) |
| 16 and 17 Years | 253 (26.0%) | 162 (20.7%) |
| 18 to 24 Years | 667 (23.9%) | 407 (18.9%) |
| 25 to 34 Years | 155 (4.8%) | 608 (17.5%) |
| 35 to 44 Years | 249 (8.4%) | 472 (13.4%) |
| 45 to 54 Years | 329 (8.0%) | 347 (8.2%) |
| 55 to 64 Years | 678 (15.4%) | 674 (15.3%) |
| 65 to 74 Years | 286 (9.8%) | 482 (14.8%) |
| 75 Years and over | 195 (12.9%) | 344 (14.8%) |
| Total | 3,683 (13.1%) | 4,562 (15.6%) |
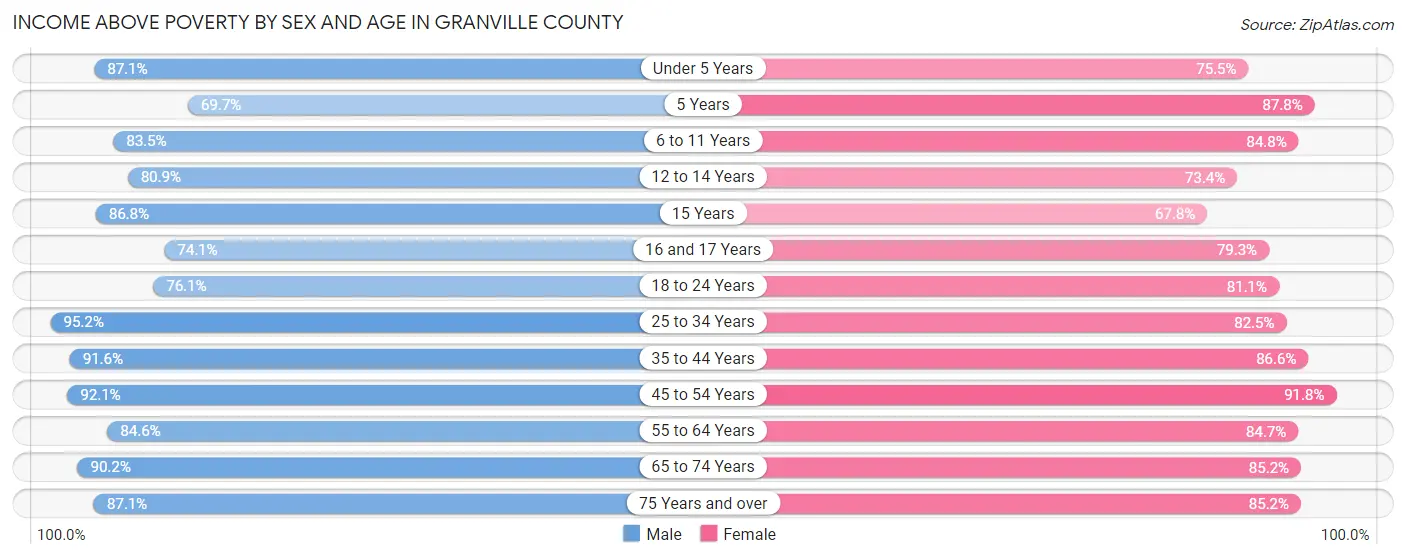
Income Above Poverty by Sex and Age in Granville County
According to the poverty statistics in Granville County, males aged 25 to 34 years and females aged 45 to 54 years are the age groups that are most secure financially, with 95.2% of males and 91.8% of females in these age groups living above the poverty line.
| Age Bracket | Male | Female |
| Under 5 Years | 1,298 (87.1%) | 1,098 (75.5%) |
| 5 Years | 216 (69.7%) | 294 (87.8%) |
| 6 to 11 Years | 1,795 (83.5%) | 1,738 (84.8%) |
| 12 to 14 Years | 807 (80.9%) | 697 (73.4%) |
| 15 Years | 256 (86.8%) | 217 (67.8%) |
| 16 and 17 Years | 722 (74.1%) | 620 (79.3%) |
| 18 to 24 Years | 2,124 (76.1%) | 1,749 (81.1%) |
| 25 to 34 Years | 3,060 (95.2%) | 2,869 (82.5%) |
| 35 to 44 Years | 2,719 (91.6%) | 3,043 (86.6%) |
| 45 to 54 Years | 3,810 (92.0%) | 3,868 (91.8%) |
| 55 to 64 Years | 3,731 (84.6%) | 3,732 (84.7%) |
| 65 to 74 Years | 2,622 (90.2%) | 2,777 (85.2%) |
| 75 Years and over | 1,320 (87.1%) | 1,981 (85.2%) |
| Total | 24,480 (86.9%) | 24,683 (84.4%) |
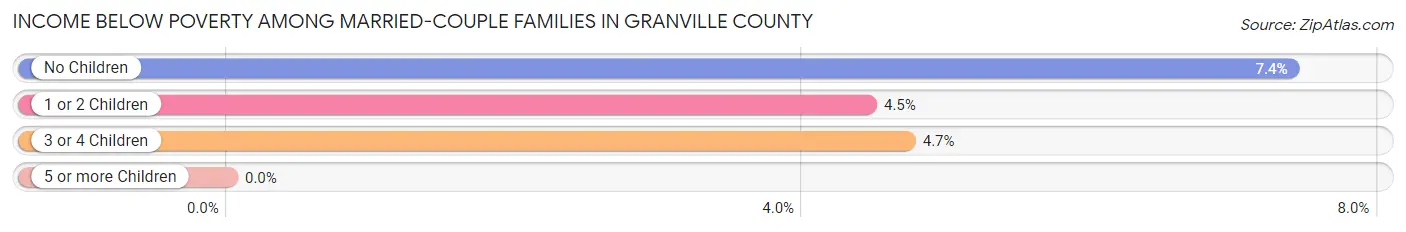
Income Below Poverty Among Married-Couple Families in Granville County
The poverty statistics for married-couple families in Granville County show that 6.4% or 710 of the total 11,077 families live below the poverty line. Families with no children have the highest poverty rate of 7.4%, comprising of 549 families. On the other hand, families with 5 or more children have the lowest poverty rate of 0.0%, which includes 0 families.
| Children | Above Poverty | Below Poverty |
| No Children | 6,875 (92.6%) | 549 (7.4%) |
| 1 or 2 Children | 2,982 (95.6%) | 139 (4.4%) |
| 3 or 4 Children | 444 (95.3%) | 22 (4.7%) |
| 5 or more Children | 66 (100.0%) | 0 (0.0%) |
| Total | 10,367 (93.6%) | 710 (6.4%) |
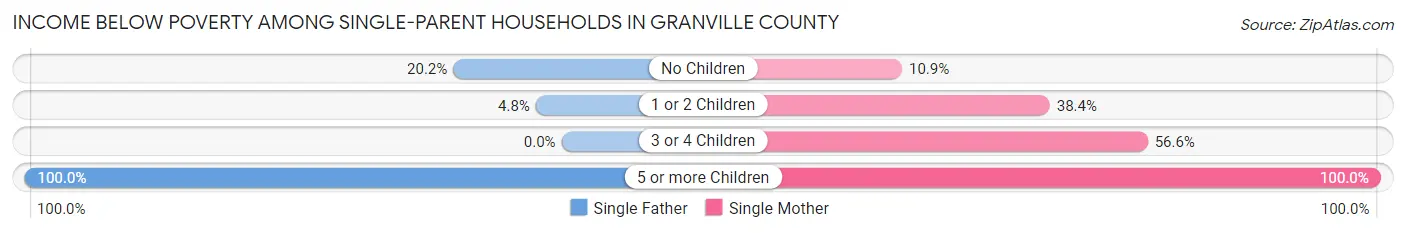
Income Below Poverty Among Single-Parent Households in Granville County
According to the poverty data in Granville County, 11.6% or 128 single-father households and 28.7% or 880 single-mother households are living below the poverty line. Among single-father households, those with 5 or more children have the highest poverty rate, with 10 households (100.0%) experiencing poverty. Likewise, among single-mother households, those with 5 or more children have the highest poverty rate, with 13 households (100.0%) falling below the poverty line.
| Children | Single Father | Single Mother |
| No Children | 87 (20.2%) | 143 (10.9%) |
| 1 or 2 Children | 31 (4.8%) | 549 (38.4%) |
| 3 or 4 Children | 0 (0.0%) | 175 (56.6%) |
| 5 or more Children | 10 (100.0%) | 13 (100.0%) |
| Total | 128 (11.6%) | 880 (28.7%) |
Income Below Poverty Among Married-Couple vs Single-Parent Households in Granville County
The poverty data for Granville County shows that 710 of the married-couple family households (6.4%) and 1,008 of the single-parent households (24.1%) are living below the poverty level. Within the married-couple family households, those with no children have the highest poverty rate, with 549 households (7.4%) falling below the poverty line. Among the single-parent households, those with 5 or more children have the highest poverty rate, with 23 household (100.0%) living below poverty.
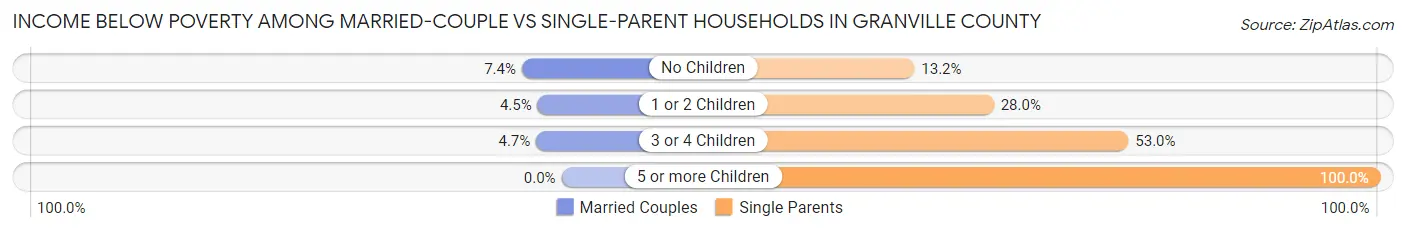
| Children | Married-Couple Families | Single-Parent Households |
| No Children | 549 (7.4%) | 230 (13.2%) |
| 1 or 2 Children | 139 (4.4%) | 580 (28.0%) |
| 3 or 4 Children | 22 (4.7%) | 175 (53.0%) |
| 5 or more Children | 0 (0.0%) | 23 (100.0%) |
| Total | 710 (6.4%) | 1,008 (24.1%) |
Employment Characteristics in Granville County
Employment by Class of Employer in Granville County
Among the 26,260 employed individuals in Granville County, private company employees (17,212 | 65.5%), local government employees (2,726 | 10.4%), and state government employees (1,940 | 7.4%) make up the most common classes of employment.
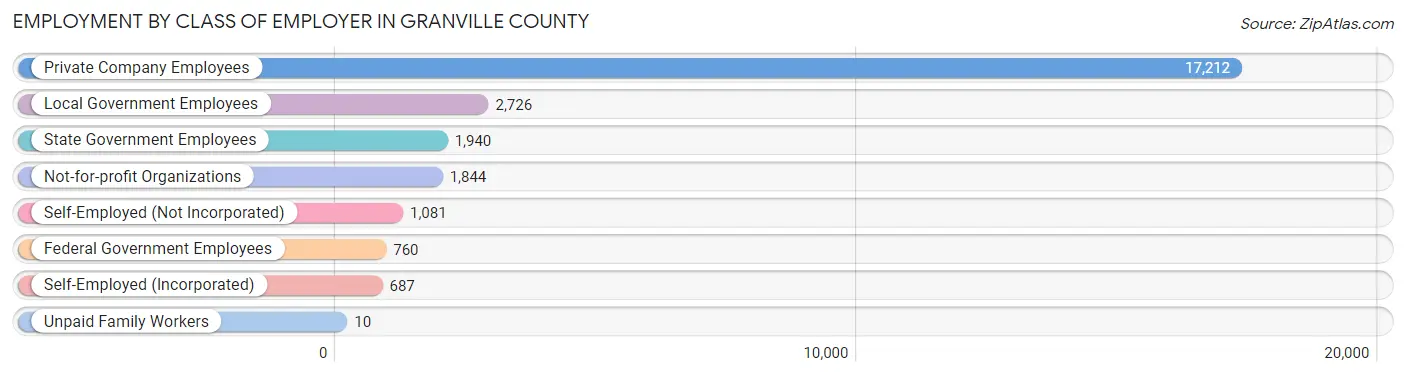
| Employer Class | # Employees | % Employees |
| Private Company Employees | 17,212 | 65.5% |
| Self-Employed (Incorporated) | 687 | 2.6% |
| Self-Employed (Not Incorporated) | 1,081 | 4.1% |
| Not-for-profit Organizations | 1,844 | 7.0% |
| Local Government Employees | 2,726 | 10.4% |
| State Government Employees | 1,940 | 7.4% |
| Federal Government Employees | 760 | 2.9% |
| Unpaid Family Workers | 10 | 0.0% |
| Total | 26,260 | 100.0% |
Employment Status by Age in Granville County
According to the labor force statistics for Granville County, out of the total population over 16 years of age (50,547), 56.0% or 28,306 individuals are in the labor force, with 4.7% or 1,330 of them unemployed. The age group with the highest labor force participation rate is 25 to 29 years, with 81.9% or 2,859 individuals in the labor force. Within the labor force, the 16 to 19 years age range has the highest percentage of unemployed individuals, with 17.7% or 168 of them being unemployed.
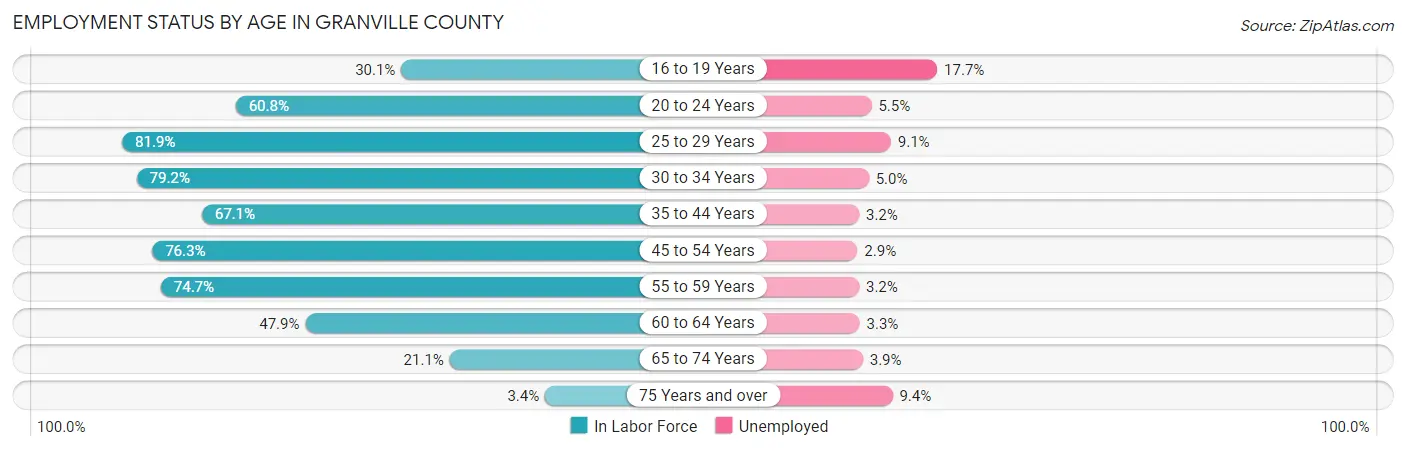
| Age Bracket | In Labor Force | Unemployed |
| 16 to 19 Years | 947 (30.1%) | 168 (17.7%) |
| 20 to 24 Years | 2,444 (60.8%) | 134 (5.5%) |
| 25 to 29 Years | 2,859 (81.9%) | 260 (9.1%) |
| 30 to 34 Years | 2,995 (79.2%) | 150 (5.0%) |
| 35 to 44 Years | 5,026 (67.1%) | 161 (3.2%) |
| 45 to 54 Years | 6,815 (76.3%) | 198 (2.9%) |
| 55 to 59 Years | 3,738 (74.7%) | 120 (3.2%) |
| 60 to 64 Years | 2,030 (47.9%) | 67 (3.3%) |
| 65 to 74 Years | 1,338 (21.1%) | 52 (3.9%) |
| 75 Years and over | 140 (3.4%) | 13 (9.4%) |
| Total | 28,306 (56.0%) | 1,330 (4.7%) |
Employment Status by Educational Attainment in Granville County
According to labor force statistics for Granville County, 71.3% of individuals (23,483) out of the total population between 25 and 64 years of age (32,935) are in the labor force, with 4.1% or 963 of them being unemployed. The group with the highest labor force participation rate are those with the educational attainment of bachelor's degree or higher, with 88.4% or 7,261 individuals in the labor force. Within the labor force, individuals with high school diploma education have the highest percentage of unemployment, with 7.6% or 449 of them being unemployed.
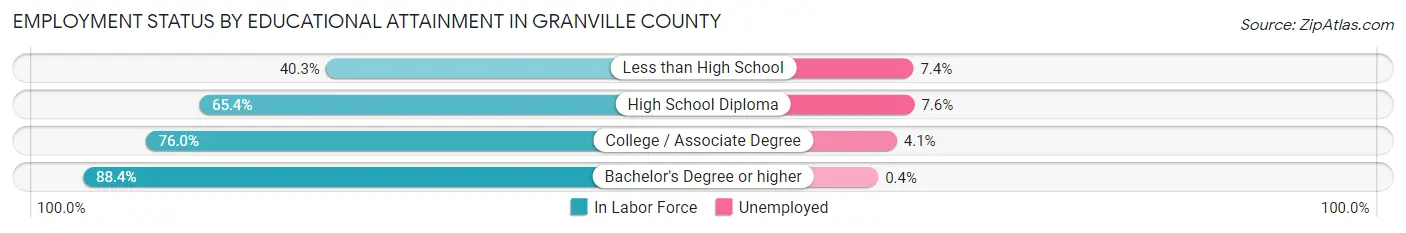
| Educational Attainment | In Labor Force | Unemployed |
| Less than High School | 1,832 (40.3%) | 336 (7.4%) |
| High School Diploma | 5,914 (65.4%) | 687 (7.6%) |
| College / Associate Degree | 8,461 (76.0%) | 456 (4.1%) |
| Bachelor's Degree or higher | 7,261 (88.4%) | 33 (0.4%) |
| Total | 23,483 (71.3%) | 1,350 (4.1%) |
Employment Occupations by Sex in Granville County
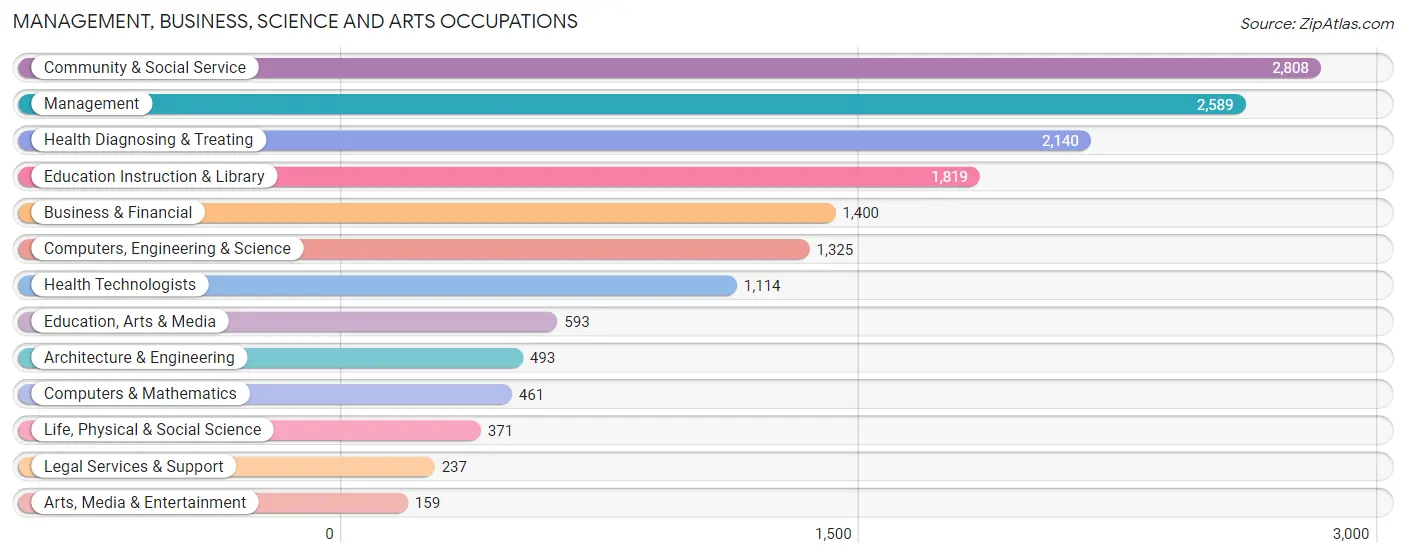
Management, Business, Science and Arts Occupations
The most common Management, Business, Science and Arts occupations in Granville County are Community & Social Service (2,808 | 10.4%), Management (2,589 | 9.6%), Health Diagnosing & Treating (2,140 | 8.0%), Education Instruction & Library (1,819 | 6.8%), and Business & Financial (1,400 | 5.2%).
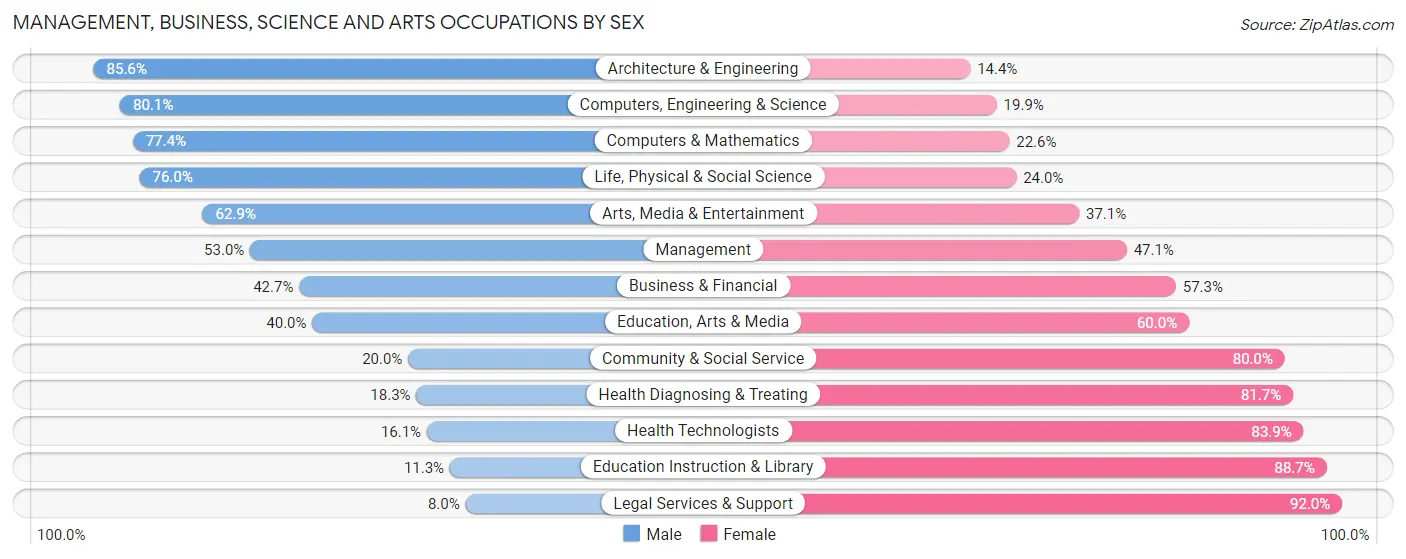
Management, Business, Science and Arts Occupations by Sex
Within the Management, Business, Science and Arts occupations in Granville County, the most male-oriented occupations are Architecture & Engineering (85.6%), Computers, Engineering & Science (80.1%), and Computers & Mathematics (77.4%), while the most female-oriented occupations are Legal Services & Support (92.0%), Education Instruction & Library (88.7%), and Health Technologists (83.9%).
| Occupation | Male | Female |
| Management | 1,371 (52.9%) | 1,218 (47.0%) |
| Business & Financial | 598 (42.7%) | 802 (57.3%) |
| Computers, Engineering & Science | 1,061 (80.1%) | 264 (19.9%) |
| Computers & Mathematics | 357 (77.4%) | 104 (22.6%) |
| Architecture & Engineering | 422 (85.6%) | 71 (14.4%) |
| Life, Physical & Social Science | 282 (76.0%) | 89 (24.0%) |
| Community & Social Service | 561 (20.0%) | 2,247 (80.0%) |
| Education, Arts & Media | 237 (40.0%) | 356 (60.0%) |
| Legal Services & Support | 19 (8.0%) | 218 (92.0%) |
| Education Instruction & Library | 205 (11.3%) | 1,614 (88.7%) |
| Arts, Media & Entertainment | 100 (62.9%) | 59 (37.1%) |
| Health Diagnosing & Treating | 391 (18.3%) | 1,749 (81.7%) |
| Health Technologists | 179 (16.1%) | 935 (83.9%) |
| Total (Category) | 3,982 (38.8%) | 6,280 (61.2%) |
| Total (Overall) | 13,479 (50.1%) | 13,435 (49.9%) |
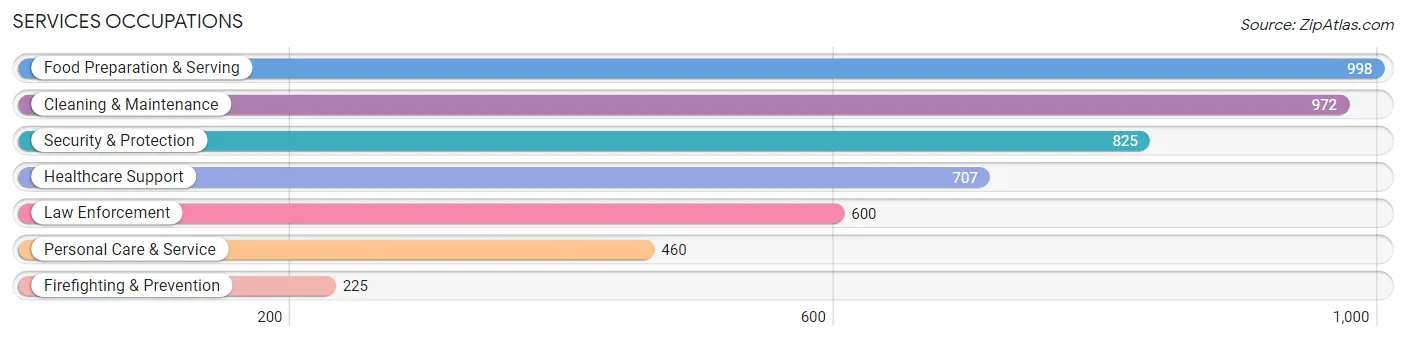
Services Occupations
The most common Services occupations in Granville County are Food Preparation & Serving (998 | 3.7%), Cleaning & Maintenance (972 | 3.6%), Security & Protection (825 | 3.1%), Healthcare Support (707 | 2.6%), and Law Enforcement (600 | 2.2%).
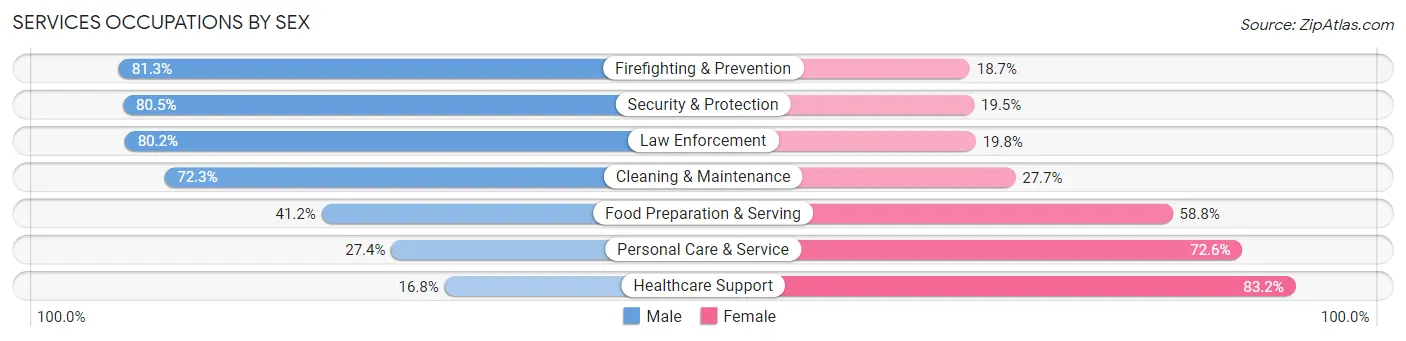
Services Occupations by Sex
Within the Services occupations in Granville County, the most male-oriented occupations are Firefighting & Prevention (81.3%), Security & Protection (80.5%), and Law Enforcement (80.2%), while the most female-oriented occupations are Healthcare Support (83.2%), Personal Care & Service (72.6%), and Food Preparation & Serving (58.8%).
| Occupation | Male | Female |
| Healthcare Support | 119 (16.8%) | 588 (83.2%) |
| Security & Protection | 664 (80.5%) | 161 (19.5%) |
| Firefighting & Prevention | 183 (81.3%) | 42 (18.7%) |
| Law Enforcement | 481 (80.2%) | 119 (19.8%) |
| Food Preparation & Serving | 411 (41.2%) | 587 (58.8%) |
| Cleaning & Maintenance | 703 (72.3%) | 269 (27.7%) |
| Personal Care & Service | 126 (27.4%) | 334 (72.6%) |
| Total (Category) | 2,023 (51.1%) | 1,939 (48.9%) |
| Total (Overall) | 13,479 (50.1%) | 13,435 (49.9%) |
Sales and Office Occupations
The most common Sales and Office occupations in Granville County are Office & Administration (3,494 | 13.0%), and Sales & Related (2,259 | 8.4%).

Sales and Office Occupations by Sex

| Occupation | Male | Female |
| Sales & Related | 1,220 (54.0%) | 1,039 (46.0%) |
| Office & Administration | 579 (16.6%) | 2,915 (83.4%) |
| Total (Category) | 1,799 (31.3%) | 3,954 (68.7%) |
| Total (Overall) | 13,479 (50.1%) | 13,435 (49.9%) |
Natural Resources, Construction and Maintenance Occupations
The most common Natural Resources, Construction and Maintenance occupations in Granville County are Installation, Maintenance & Repair (1,294 | 4.8%), Construction & Extraction (1,150 | 4.3%), and Farming, Fishing & Forestry (176 | 0.6%).
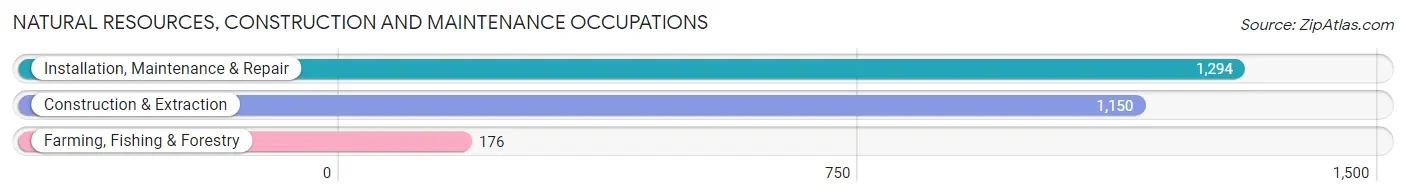
Natural Resources, Construction and Maintenance Occupations by Sex
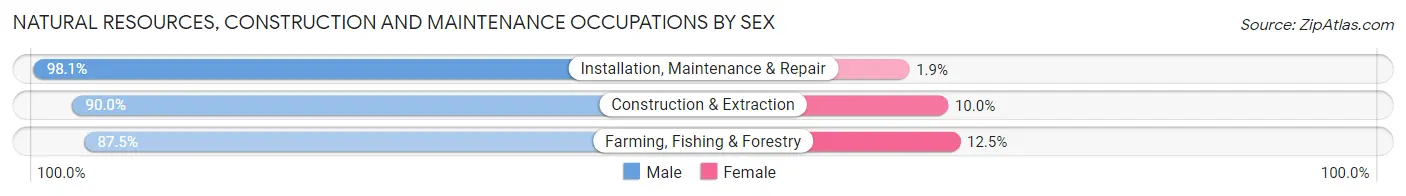
| Occupation | Male | Female |
| Farming, Fishing & Forestry | 154 (87.5%) | 22 (12.5%) |
| Construction & Extraction | 1,035 (90.0%) | 115 (10.0%) |
| Installation, Maintenance & Repair | 1,269 (98.1%) | 25 (1.9%) |
| Total (Category) | 2,458 (93.8%) | 162 (6.2%) |
| Total (Overall) | 13,479 (50.1%) | 13,435 (49.9%) |
Production, Transportation and Moving Occupations
The most common Production, Transportation and Moving occupations in Granville County are Production (1,991 | 7.4%), Material Moving (1,517 | 5.6%), and Transportation (809 | 3.0%).
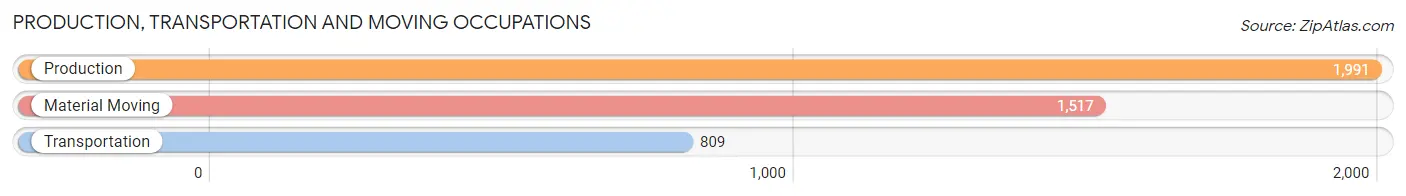
Production, Transportation and Moving Occupations by Sex
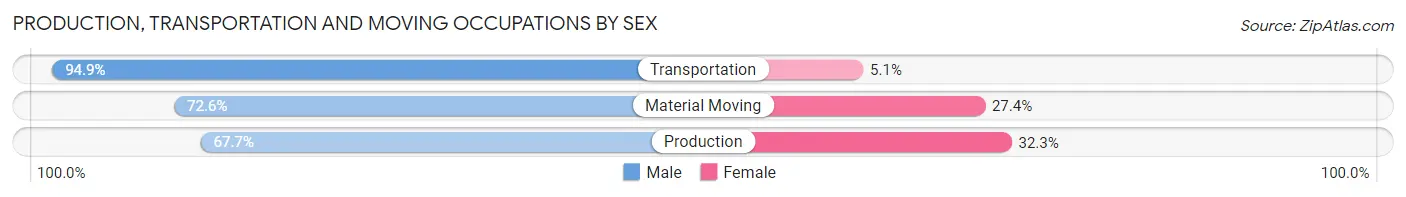
| Occupation | Male | Female |
| Production | 1,348 (67.7%) | 643 (32.3%) |
| Transportation | 768 (94.9%) | 41 (5.1%) |
| Material Moving | 1,101 (72.6%) | 416 (27.4%) |
| Total (Category) | 3,217 (74.5%) | 1,100 (25.5%) |
| Total (Overall) | 13,479 (50.1%) | 13,435 (49.9%) |
Employment Industries by Sex in Granville County
Employment Industries in Granville County
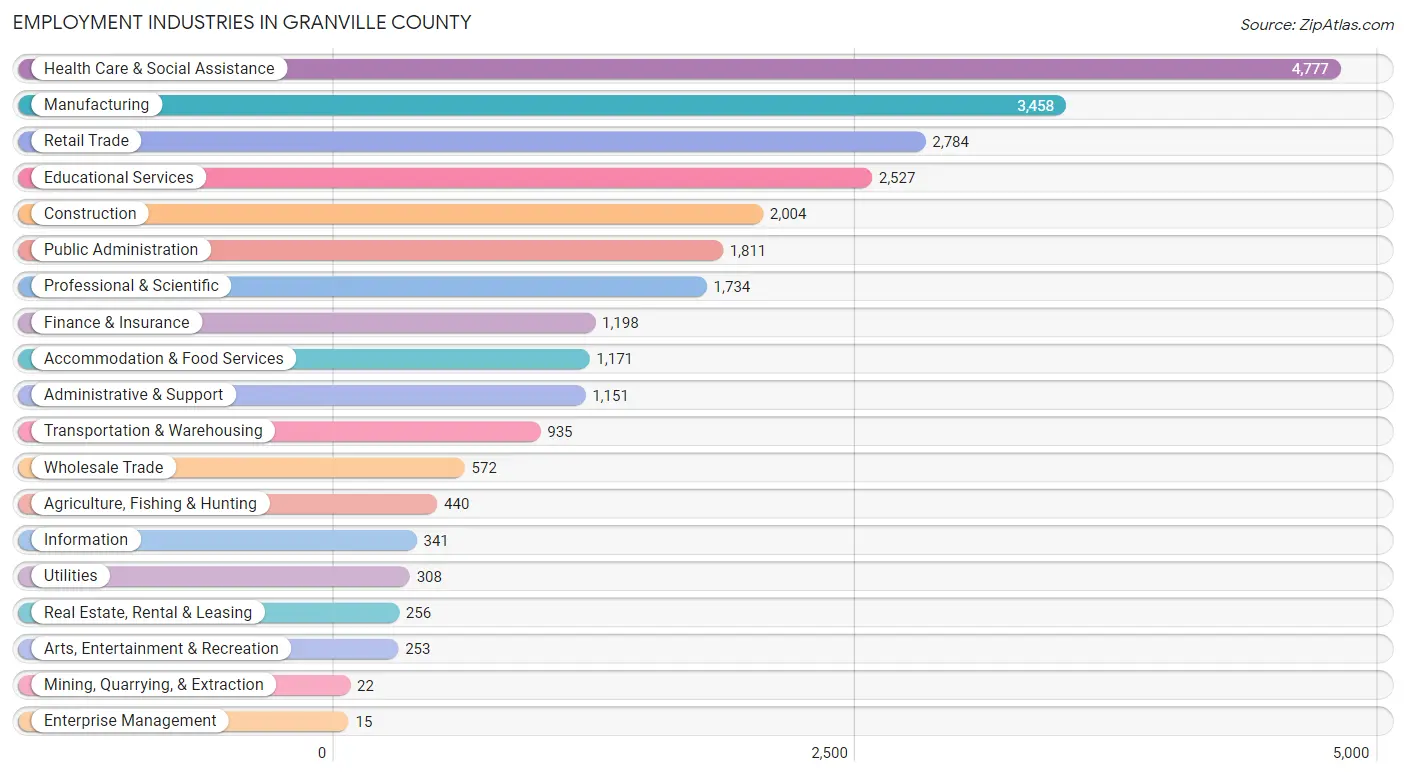
The major employment industries in Granville County include Health Care & Social Assistance (4,777 | 17.7%), Manufacturing (3,458 | 12.9%), Retail Trade (2,784 | 10.3%), Educational Services (2,527 | 9.4%), and Construction (2,004 | 7.4%).
Employment Industries by Sex in Granville County
The Granville County industries that see more men than women are Mining, Quarrying, & Extraction (100.0%), Utilities (97.7%), and Wholesale Trade (86.0%), whereas the industries that tend to have a higher number of women are Enterprise Management (100.0%), Health Care & Social Assistance (85.7%), and Educational Services (78.8%).
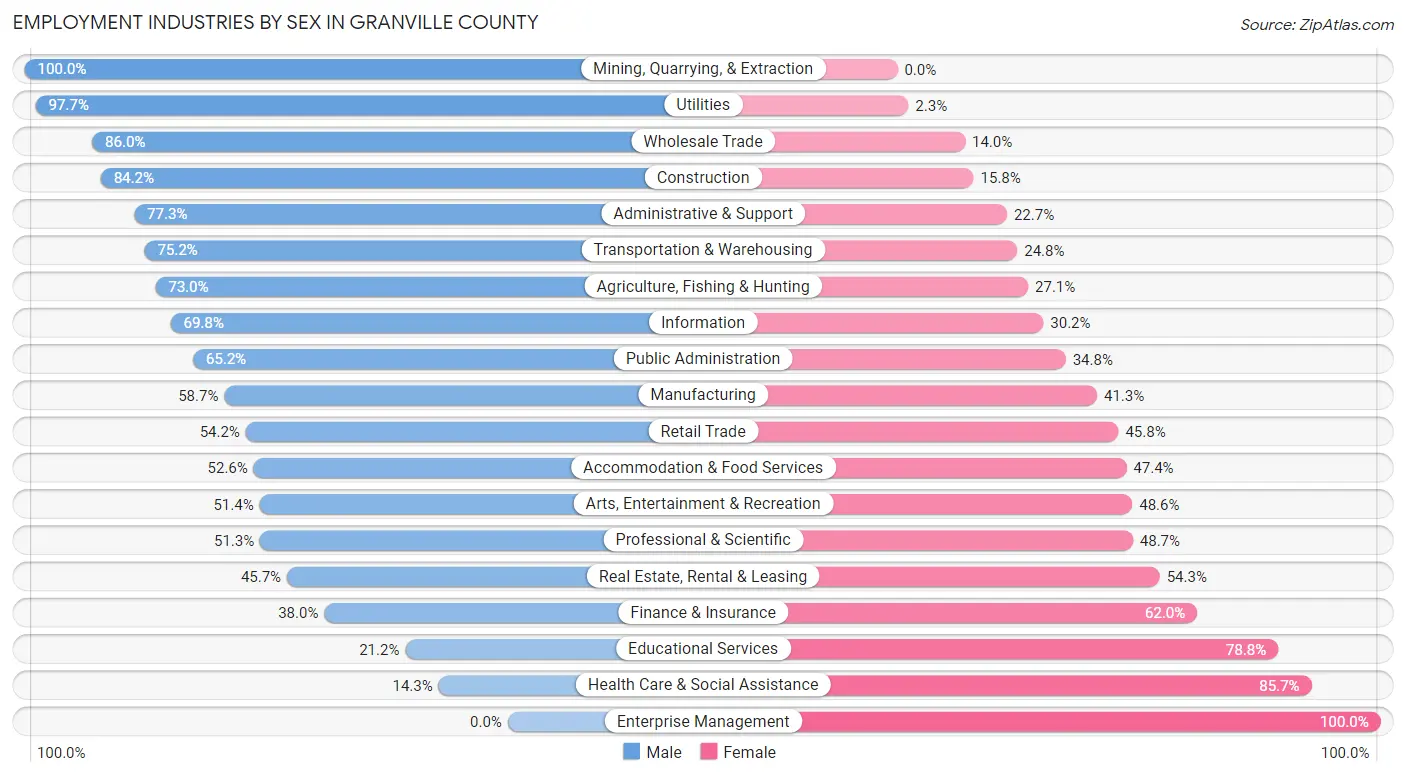
| Industry | Male | Female |
| Agriculture, Fishing & Hunting | 321 (73.0%) | 119 (27.1%) |
| Mining, Quarrying, & Extraction | 22 (100.0%) | 0 (0.0%) |
| Construction | 1,688 (84.2%) | 316 (15.8%) |
| Manufacturing | 2,029 (58.7%) | 1,429 (41.3%) |
| Wholesale Trade | 492 (86.0%) | 80 (14.0%) |
| Retail Trade | 1,510 (54.2%) | 1,274 (45.8%) |
| Transportation & Warehousing | 703 (75.2%) | 232 (24.8%) |
| Utilities | 301 (97.7%) | 7 (2.3%) |
| Information | 238 (69.8%) | 103 (30.2%) |
| Finance & Insurance | 455 (38.0%) | 743 (62.0%) |
| Real Estate, Rental & Leasing | 117 (45.7%) | 139 (54.3%) |
| Professional & Scientific | 889 (51.3%) | 845 (48.7%) |
| Enterprise Management | 0 (0.0%) | 15 (100.0%) |
| Administrative & Support | 890 (77.3%) | 261 (22.7%) |
| Educational Services | 536 (21.2%) | 1,991 (78.8%) |
| Health Care & Social Assistance | 684 (14.3%) | 4,093 (85.7%) |
| Arts, Entertainment & Recreation | 130 (51.4%) | 123 (48.6%) |
| Accommodation & Food Services | 616 (52.6%) | 555 (47.4%) |
| Public Administration | 1,180 (65.2%) | 631 (34.8%) |
| Total | 13,479 (50.1%) | 13,435 (49.9%) |
Education in Granville County
School Enrollment in Granville County
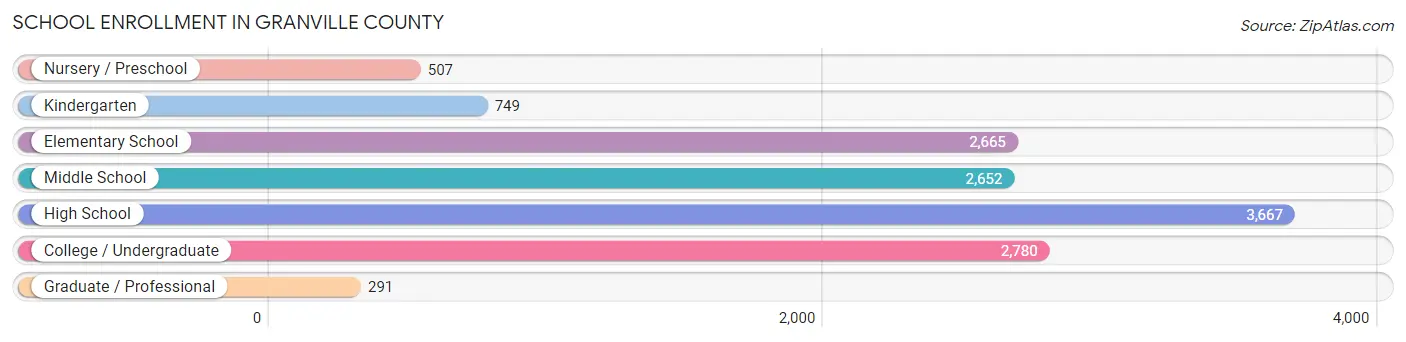
The most common levels of schooling among the 13,311 students in Granville County are high school (3,667 | 27.6%), college / undergraduate (2,780 | 20.9%), and elementary school (2,665 | 20.0%).
| School Level | # Students | % Students |
| Nursery / Preschool | 507 | 3.8% |
| Kindergarten | 749 | 5.6% |
| Elementary School | 2,665 | 20.0% |
| Middle School | 2,652 | 19.9% |
| High School | 3,667 | 27.6% |
| College / Undergraduate | 2,780 | 20.9% |
| Graduate / Professional | 291 | 2.2% |
| Total | 13,311 | 100.0% |
School Enrollment by Age by Funding Source in Granville County
Out of a total of 13,311 students who are enrolled in schools in Granville County, 1,717 (12.9%) attend a private institution, while the remaining 11,594 (87.1%) are enrolled in public schools. The age group of 3 to 4 year olds has the highest likelihood of being enrolled in private schools, with 215 (56.3% in the age bracket) enrolled. Conversely, the age group of 18 to 19 year olds has the lowest likelihood of being enrolled in a private school, with 826 (94.2% in the age bracket) attending a public institution.
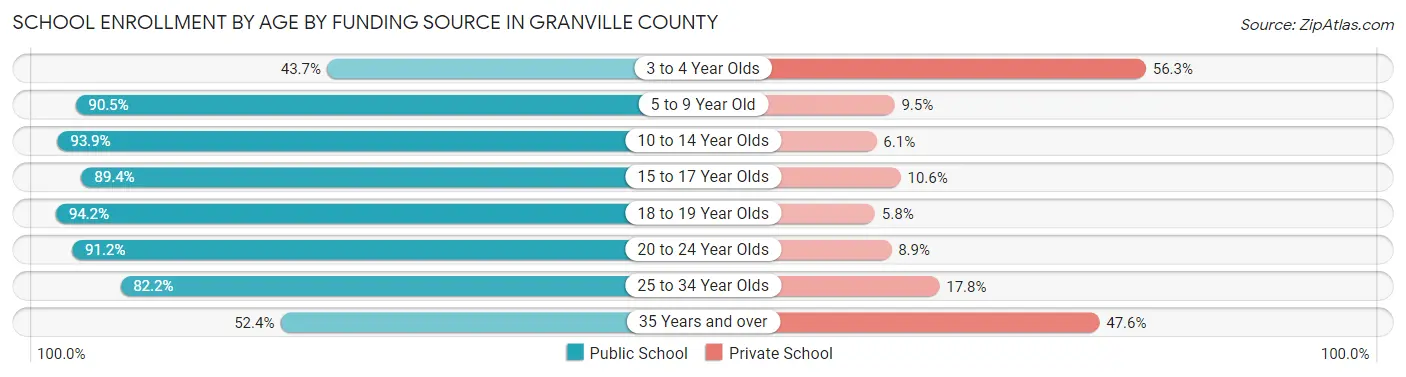
| Age Bracket | Public School | Private School |
| 3 to 4 Year Olds | 167 (43.7%) | 215 (56.3%) |
| 5 to 9 Year Old | 2,699 (90.5%) | 282 (9.5%) |
| 10 to 14 Year Olds | 3,434 (93.9%) | 223 (6.1%) |
| 15 to 17 Year Olds | 2,102 (89.4%) | 249 (10.6%) |
| 18 to 19 Year Olds | 826 (94.2%) | 51 (5.8%) |
| 20 to 24 Year Olds | 1,452 (91.1%) | 141 (8.8%) |
| 25 to 34 Year Olds | 397 (82.2%) | 86 (17.8%) |
| 35 Years and over | 517 (52.4%) | 470 (47.6%) |
| Total | 11,594 (87.1%) | 1,717 (12.9%) |
Educational Attainment by Field of Study in Granville County
Business (2,141 | 19.3%), science & technology (1,489 | 13.4%), education (1,222 | 11.0%), social sciences (962 | 8.7%), and bio, nature & agricultural (949 | 8.5%) are the most common fields of study among 11,108 individuals in Granville County who have obtained a bachelor's degree or higher.
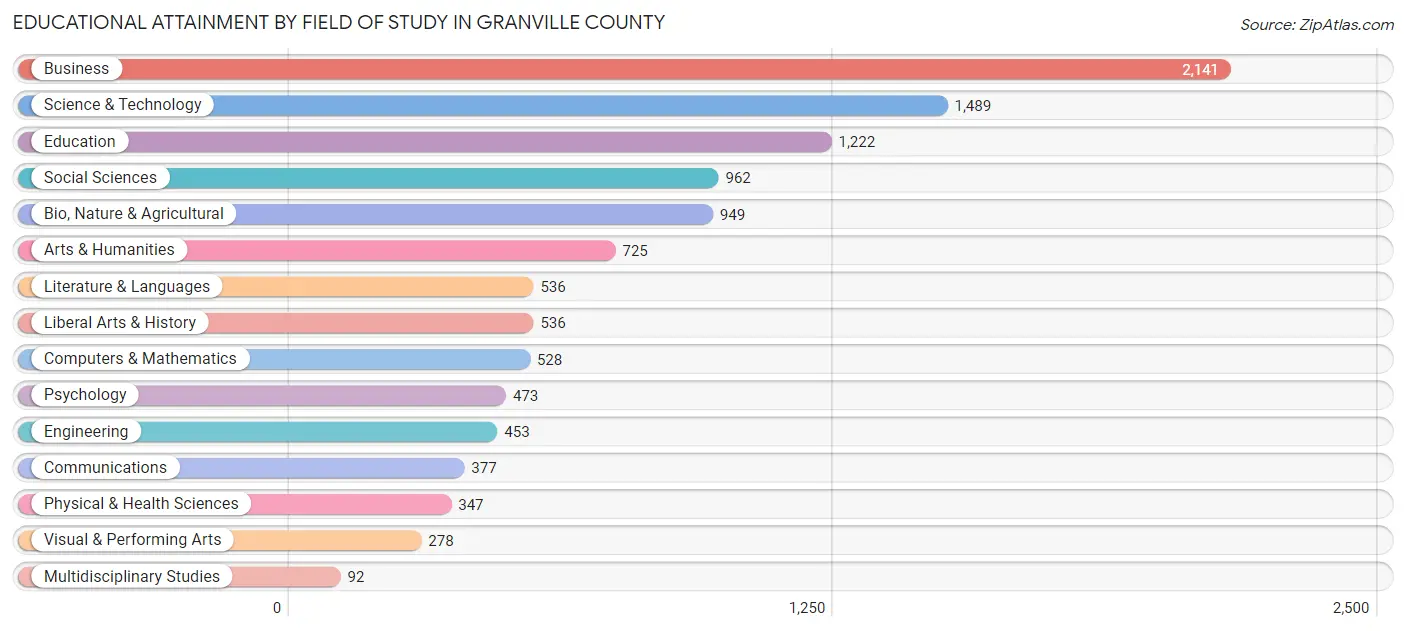
| Field of Study | # Graduates | % Graduates |
| Computers & Mathematics | 528 | 4.8% |
| Bio, Nature & Agricultural | 949 | 8.5% |
| Physical & Health Sciences | 347 | 3.1% |
| Psychology | 473 | 4.3% |
| Social Sciences | 962 | 8.7% |
| Engineering | 453 | 4.1% |
| Multidisciplinary Studies | 92 | 0.8% |
| Science & Technology | 1,489 | 13.4% |
| Business | 2,141 | 19.3% |
| Education | 1,222 | 11.0% |
| Literature & Languages | 536 | 4.8% |
| Liberal Arts & History | 536 | 4.8% |
| Visual & Performing Arts | 278 | 2.5% |
| Communications | 377 | 3.4% |
| Arts & Humanities | 725 | 6.5% |
| Total | 11,108 | 100.0% |
Transportation & Commute in Granville County
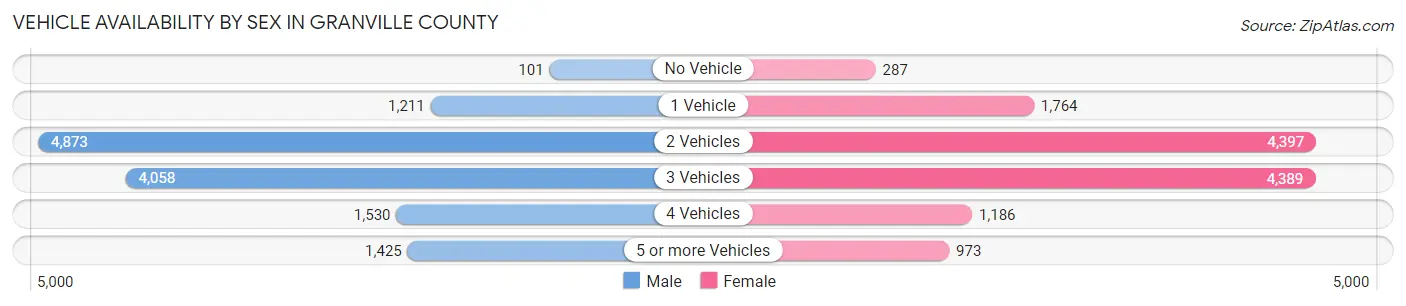
Vehicle Availability by Sex in Granville County
The most prevalent vehicle ownership categories in Granville County are males with 2 vehicles (4,873, accounting for 36.9%) and females with 2 vehicles (4,397, making up 37.5%).
| Vehicles Available | Male | Female |
| No Vehicle | 101 (0.8%) | 287 (2.2%) |
| 1 Vehicle | 1,211 (9.2%) | 1,764 (13.6%) |
| 2 Vehicles | 4,873 (36.9%) | 4,397 (33.8%) |
| 3 Vehicles | 4,058 (30.7%) | 4,389 (33.8%) |
| 4 Vehicles | 1,530 (11.6%) | 1,186 (9.1%) |
| 5 or more Vehicles | 1,425 (10.8%) | 973 (7.5%) |
| Total | 13,198 (100.0%) | 12,996 (100.0%) |
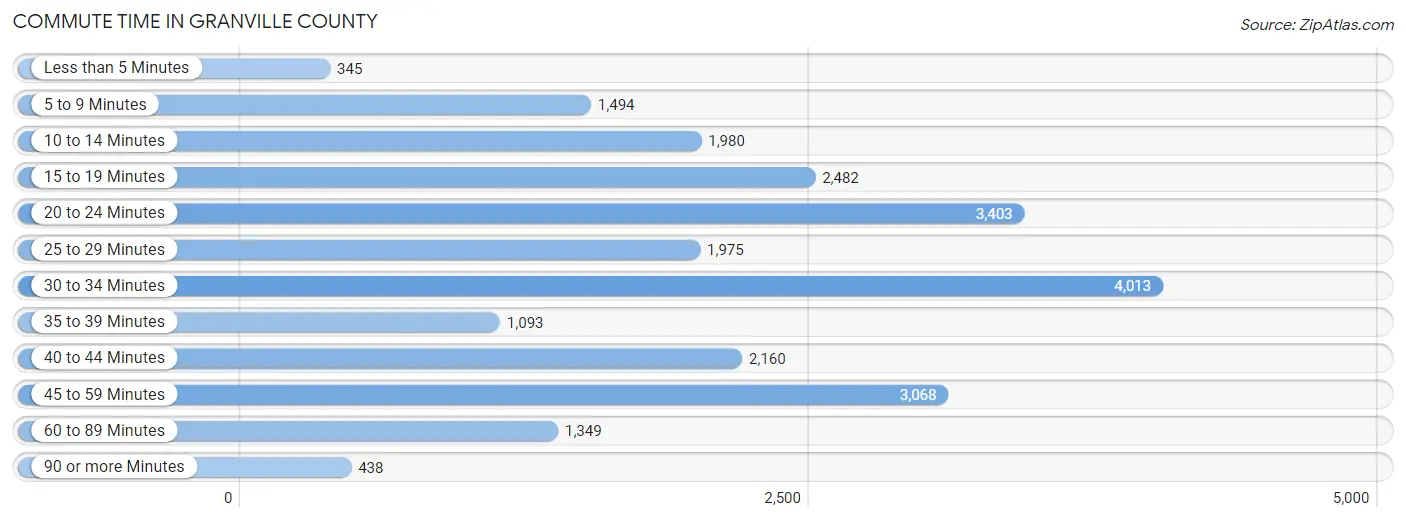
Commute Time in Granville County
The most frequently occuring commute durations in Granville County are 30 to 34 minutes (4,013 commuters, 16.9%), 20 to 24 minutes (3,403 commuters, 14.3%), and 45 to 59 minutes (3,068 commuters, 12.9%).
| Commute Time | # Commuters | % Commuters |
| Less than 5 Minutes | 345 | 1.5% |
| 5 to 9 Minutes | 1,494 | 6.3% |
| 10 to 14 Minutes | 1,980 | 8.3% |
| 15 to 19 Minutes | 2,482 | 10.4% |
| 20 to 24 Minutes | 3,403 | 14.3% |
| 25 to 29 Minutes | 1,975 | 8.3% |
| 30 to 34 Minutes | 4,013 | 16.9% |
| 35 to 39 Minutes | 1,093 | 4.6% |
| 40 to 44 Minutes | 2,160 | 9.1% |
| 45 to 59 Minutes | 3,068 | 12.9% |
| 60 to 89 Minutes | 1,349 | 5.7% |
| 90 or more Minutes | 438 | 1.8% |
Commute Time by Sex in Granville County
The most common commute times in Granville County are 30 to 34 minutes (2,087 commuters, 17.4%) for males and 30 to 34 minutes (1,926 commuters, 16.3%) for females.

| Commute Time | Male | Female |
| Less than 5 Minutes | 250 (2.1%) | 95 (0.8%) |
| 5 to 9 Minutes | 637 (5.3%) | 857 (7.3%) |
| 10 to 14 Minutes | 959 (8.0%) | 1,021 (8.7%) |
| 15 to 19 Minutes | 1,296 (10.8%) | 1,186 (10.1%) |
| 20 to 24 Minutes | 1,538 (12.8%) | 1,865 (15.8%) |
| 25 to 29 Minutes | 734 (6.1%) | 1,241 (10.5%) |
| 30 to 34 Minutes | 2,087 (17.4%) | 1,926 (16.3%) |
| 35 to 39 Minutes | 530 (4.4%) | 563 (4.8%) |
| 40 to 44 Minutes | 1,078 (9.0%) | 1,082 (9.2%) |
| 45 to 59 Minutes | 1,827 (15.2%) | 1,241 (10.5%) |
| 60 to 89 Minutes | 827 (6.9%) | 522 (4.4%) |
| 90 or more Minutes | 247 (2.1%) | 191 (1.6%) |
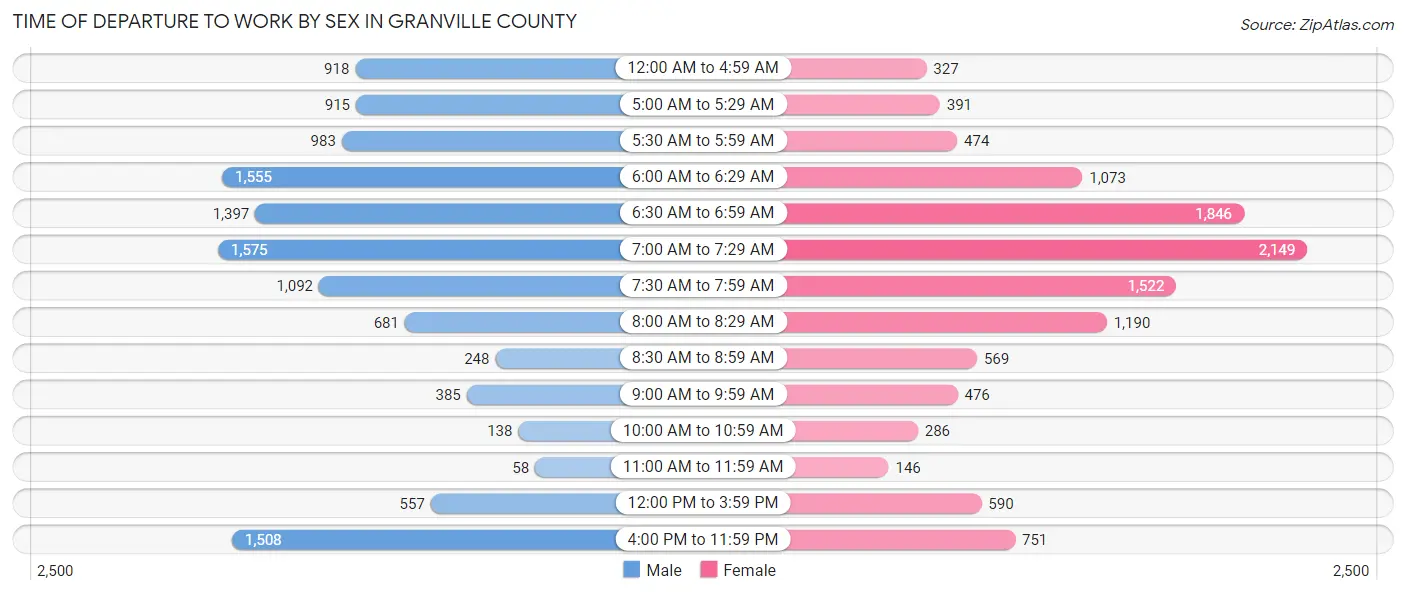
Time of Departure to Work by Sex in Granville County
The most frequent times of departure to work in Granville County are 7:00 AM to 7:29 AM (1,575, 13.1%) for males and 7:00 AM to 7:29 AM (2,149, 18.2%) for females.
| Time of Departure | Male | Female |
| 12:00 AM to 4:59 AM | 918 (7.6%) | 327 (2.8%) |
| 5:00 AM to 5:29 AM | 915 (7.6%) | 391 (3.3%) |
| 5:30 AM to 5:59 AM | 983 (8.2%) | 474 (4.0%) |
| 6:00 AM to 6:29 AM | 1,555 (13.0%) | 1,073 (9.1%) |
| 6:30 AM to 6:59 AM | 1,397 (11.6%) | 1,846 (15.7%) |
| 7:00 AM to 7:29 AM | 1,575 (13.1%) | 2,149 (18.2%) |
| 7:30 AM to 7:59 AM | 1,092 (9.1%) | 1,522 (12.9%) |
| 8:00 AM to 8:29 AM | 681 (5.7%) | 1,190 (10.1%) |
| 8:30 AM to 8:59 AM | 248 (2.1%) | 569 (4.8%) |
| 9:00 AM to 9:59 AM | 385 (3.2%) | 476 (4.0%) |
| 10:00 AM to 10:59 AM | 138 (1.1%) | 286 (2.4%) |
| 11:00 AM to 11:59 AM | 58 (0.5%) | 146 (1.2%) |
| 12:00 PM to 3:59 PM | 557 (4.6%) | 590 (5.0%) |
| 4:00 PM to 11:59 PM | 1,508 (12.6%) | 751 (6.4%) |
| Total | 12,010 (100.0%) | 11,790 (100.0%) |
Housing Occupancy in Granville County
Occupancy by Ownership in Granville County
Of the total 21,505 dwellings in Granville County, owner-occupied units account for 16,449 (76.5%), while renter-occupied units make up 5,056 (23.5%).
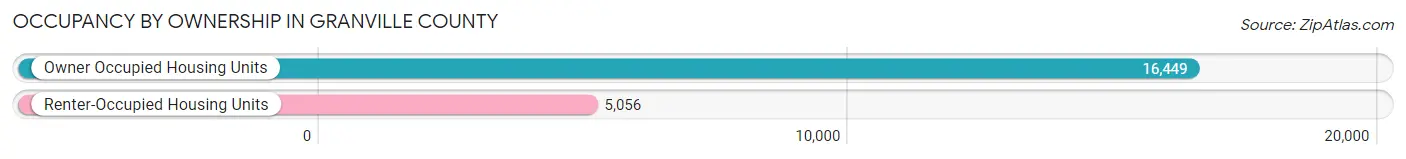
| Occupancy | # Housing Units | % Housing Units |
| Owner Occupied Housing Units | 16,449 | 76.5% |
| Renter-Occupied Housing Units | 5,056 | 23.5% |
| Total Occupied Housing Units | 21,505 | 100.0% |
Occupancy by Household Size in Granville County
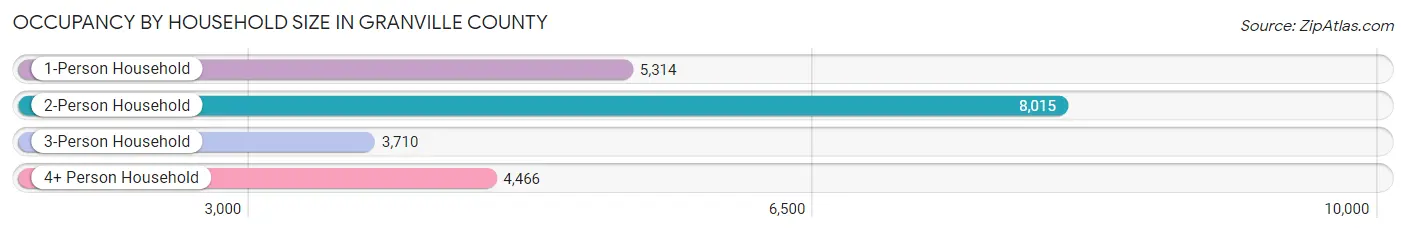
| Household Size | # Housing Units | % Housing Units |
| 1-Person Household | 5,314 | 24.7% |
| 2-Person Household | 8,015 | 37.3% |
| 3-Person Household | 3,710 | 17.2% |
| 4+ Person Household | 4,466 | 20.8% |
| Total Housing Units | 21,505 | 100.0% |
Occupancy by Ownership by Household Size in Granville County
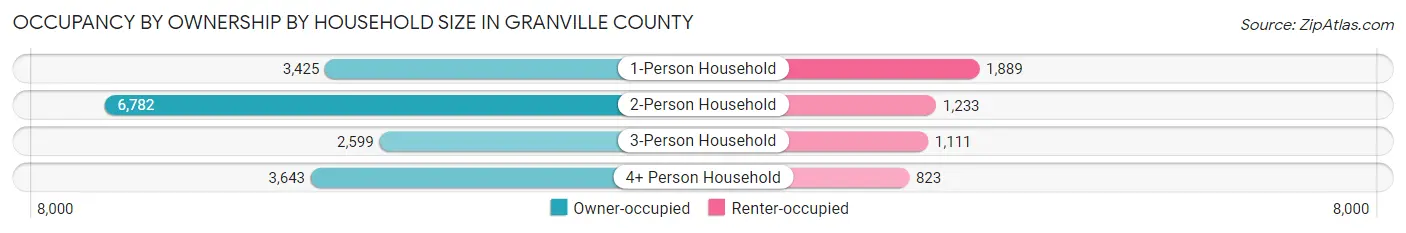
| Household Size | Owner-occupied | Renter-occupied |
| 1-Person Household | 3,425 (64.4%) | 1,889 (35.5%) |
| 2-Person Household | 6,782 (84.6%) | 1,233 (15.4%) |
| 3-Person Household | 2,599 (70.1%) | 1,111 (29.9%) |
| 4+ Person Household | 3,643 (81.6%) | 823 (18.4%) |
| Total Housing Units | 16,449 (76.5%) | 5,056 (23.5%) |
Occupancy by Educational Attainment in Granville County
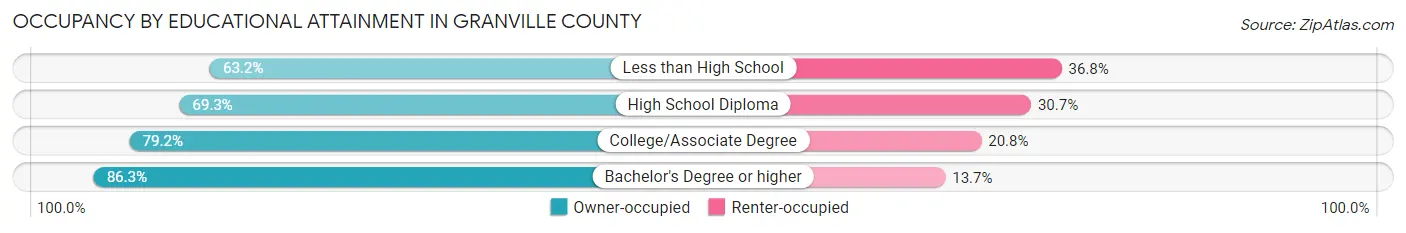
| Household Size | Owner-occupied | Renter-occupied |
| Less than High School | 1,388 (63.2%) | 807 (36.8%) |
| High School Diploma | 4,302 (69.3%) | 1,906 (30.7%) |
| College/Associate Degree | 6,071 (79.2%) | 1,598 (20.8%) |
| Bachelor's Degree or higher | 4,688 (86.3%) | 745 (13.7%) |
Occupancy by Age of Householder in Granville County
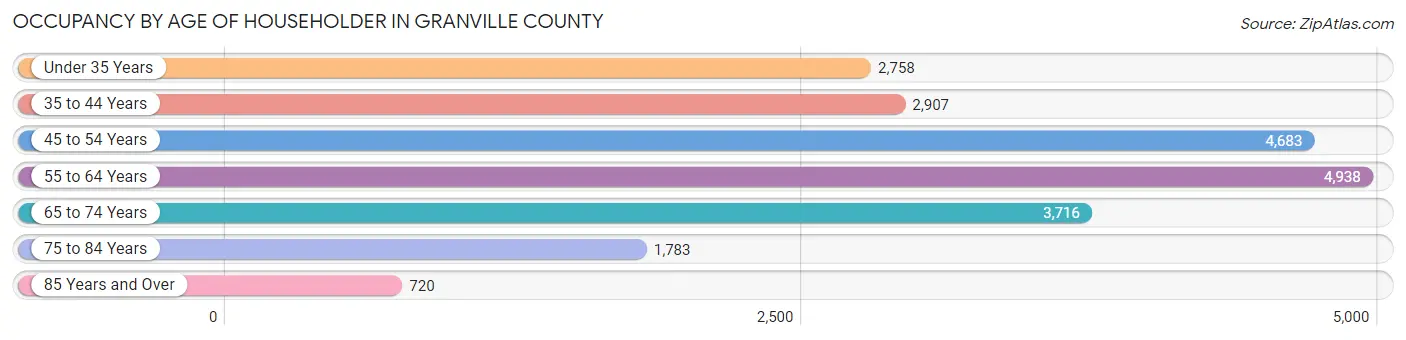
| Age Bracket | # Households | % Households |
| Under 35 Years | 2,758 | 12.8% |
| 35 to 44 Years | 2,907 | 13.5% |
| 45 to 54 Years | 4,683 | 21.8% |
| 55 to 64 Years | 4,938 | 23.0% |
| 65 to 74 Years | 3,716 | 17.3% |
| 75 to 84 Years | 1,783 | 8.3% |
| 85 Years and Over | 720 | 3.4% |
| Total | 21,505 | 100.0% |
Housing Finances in Granville County
Median Income by Occupancy in Granville County
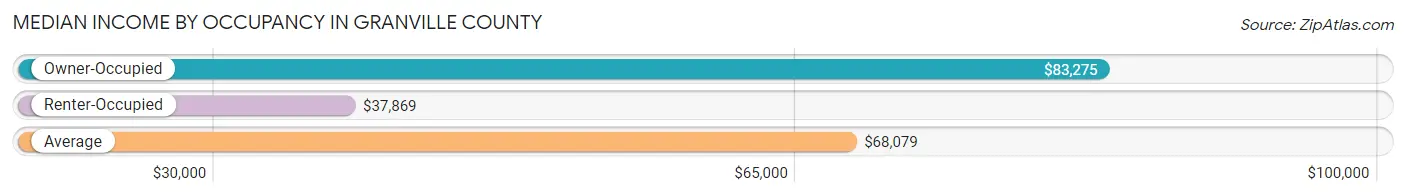
| Occupancy Type | # Households | Median Income |
| Owner-Occupied | 16,449 (76.5%) | $83,275 |
| Renter-Occupied | 5,056 (23.5%) | $37,869 |
| Average | 21,505 (100.0%) | $68,079 |
Occupancy by Householder Income Bracket in Granville County
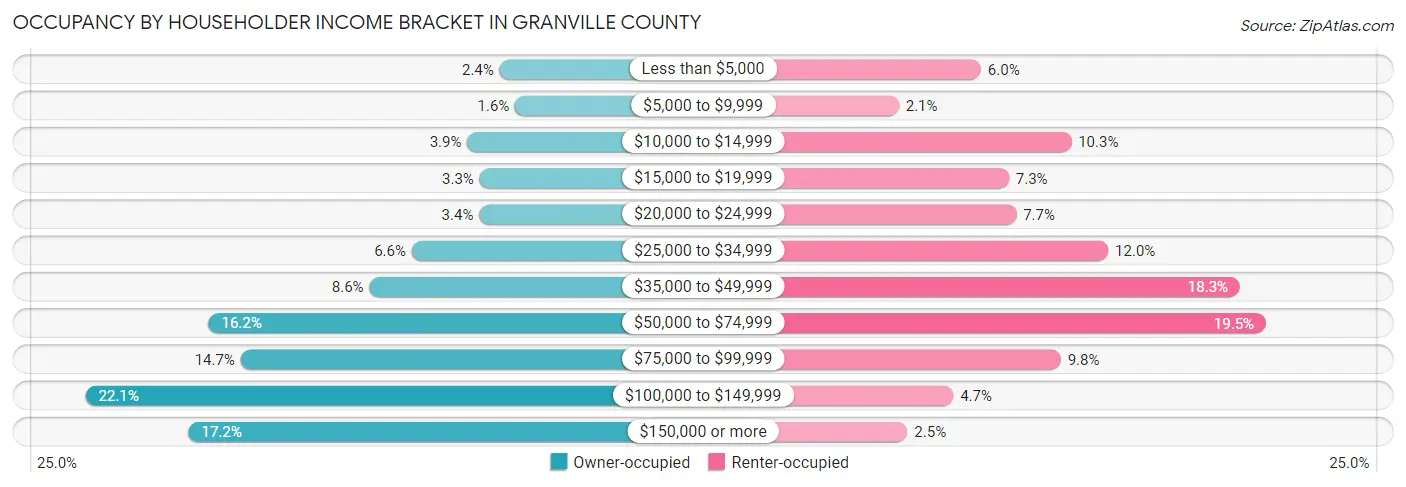
| Income Bracket | Owner-occupied | Renter-occupied |
| Less than $5,000 | 391 (2.4%) | 302 (6.0%) |
| $5,000 to $9,999 | 270 (1.6%) | 104 (2.1%) |
| $10,000 to $14,999 | 645 (3.9%) | 519 (10.3%) |
| $15,000 to $19,999 | 548 (3.3%) | 369 (7.3%) |
| $20,000 to $24,999 | 551 (3.4%) | 387 (7.6%) |
| $25,000 to $34,999 | 1,079 (6.6%) | 608 (12.0%) |
| $35,000 to $49,999 | 1,412 (8.6%) | 925 (18.3%) |
| $50,000 to $74,999 | 2,672 (16.2%) | 988 (19.5%) |
| $75,000 to $99,999 | 2,419 (14.7%) | 494 (9.8%) |
| $100,000 to $149,999 | 3,635 (22.1%) | 235 (4.6%) |
| $150,000 or more | 2,827 (17.2%) | 125 (2.5%) |
| Total | 16,449 (100.0%) | 5,056 (100.0%) |
Monthly Housing Cost Tiers in Granville County
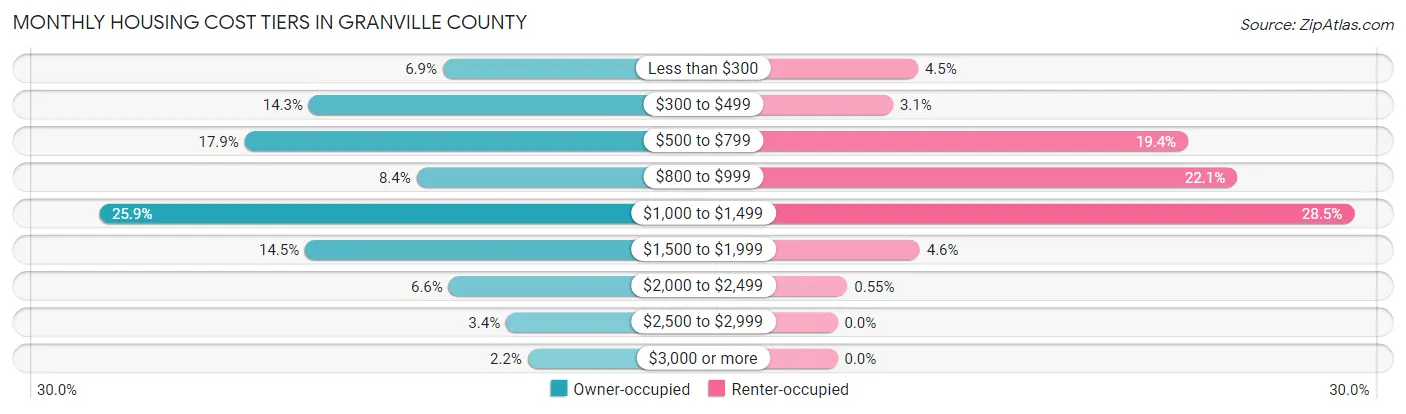
| Monthly Cost | Owner-occupied | Renter-occupied |
| Less than $300 | 1,135 (6.9%) | 225 (4.4%) |
| $300 to $499 | 2,353 (14.3%) | 155 (3.1%) |
| $500 to $799 | 2,936 (17.8%) | 979 (19.4%) |
| $800 to $999 | 1,373 (8.4%) | 1,116 (22.1%) |
| $1,000 to $1,499 | 4,259 (25.9%) | 1,443 (28.5%) |
| $1,500 to $1,999 | 2,387 (14.5%) | 230 (4.5%) |
| $2,000 to $2,499 | 1,082 (6.6%) | 28 (0.5%) |
| $2,500 to $2,999 | 561 (3.4%) | 0 (0.0%) |
| $3,000 or more | 363 (2.2%) | 0 (0.0%) |
| Total | 16,449 (100.0%) | 5,056 (100.0%) |
Physical Housing Characteristics in Granville County
Housing Structures in Granville County
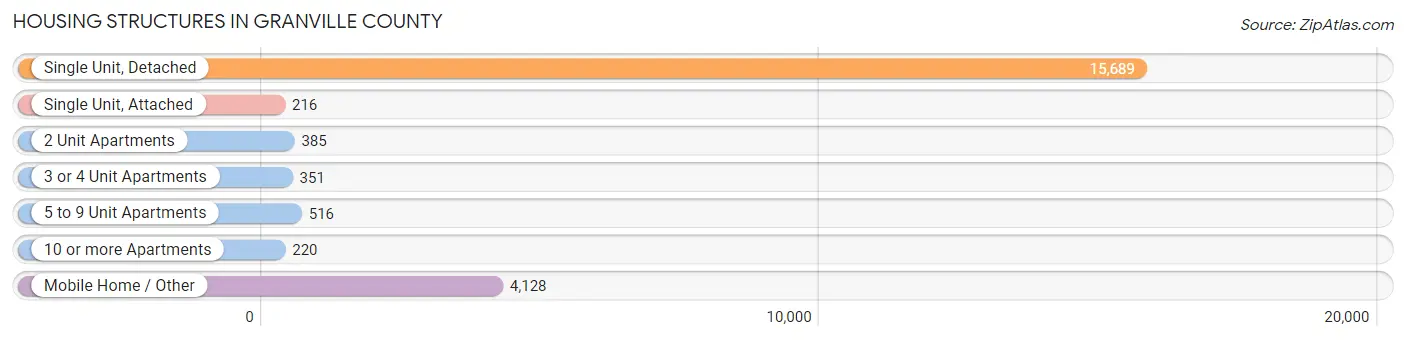
| Structure Type | # Housing Units | % Housing Units |
| Single Unit, Detached | 15,689 | 73.0% |
| Single Unit, Attached | 216 | 1.0% |
| 2 Unit Apartments | 385 | 1.8% |
| 3 or 4 Unit Apartments | 351 | 1.6% |
| 5 to 9 Unit Apartments | 516 | 2.4% |
| 10 or more Apartments | 220 | 1.0% |
| Mobile Home / Other | 4,128 | 19.2% |
| Total | 21,505 | 100.0% |
Housing Structures by Occupancy in Granville County
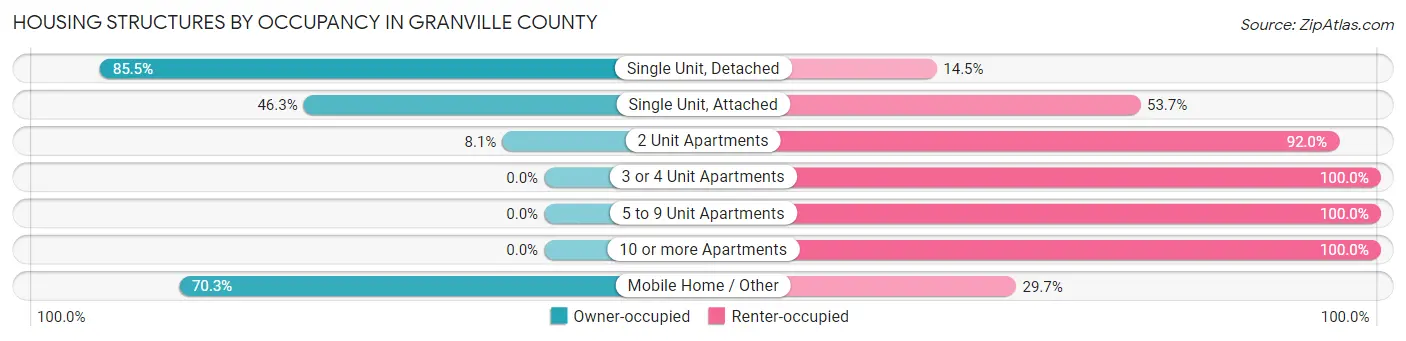
| Structure Type | Owner-occupied | Renter-occupied |
| Single Unit, Detached | 13,417 (85.5%) | 2,272 (14.5%) |
| Single Unit, Attached | 100 (46.3%) | 116 (53.7%) |
| 2 Unit Apartments | 31 (8.1%) | 354 (91.9%) |
| 3 or 4 Unit Apartments | 0 (0.0%) | 351 (100.0%) |
| 5 to 9 Unit Apartments | 0 (0.0%) | 516 (100.0%) |
| 10 or more Apartments | 0 (0.0%) | 220 (100.0%) |
| Mobile Home / Other | 2,901 (70.3%) | 1,227 (29.7%) |
| Total | 16,449 (76.5%) | 5,056 (23.5%) |
Housing Structures by Number of Rooms in Granville County
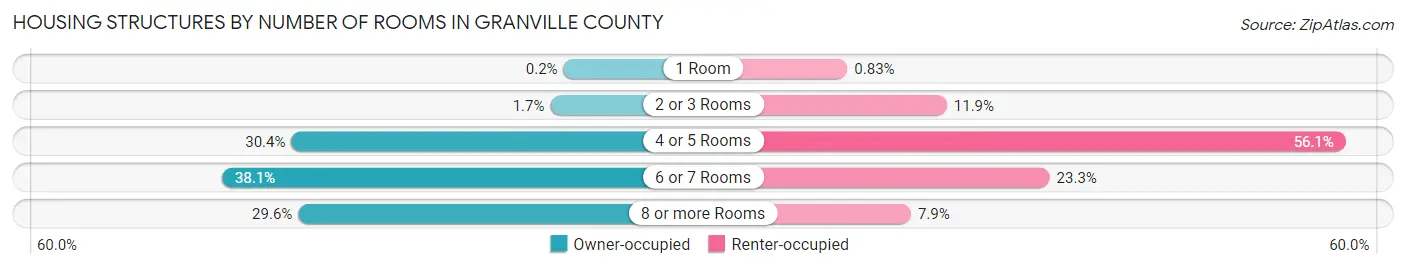
| Number of Rooms | Owner-occupied | Renter-occupied |
| 1 Room | 33 (0.2%) | 42 (0.8%) |
| 2 or 3 Rooms | 273 (1.7%) | 600 (11.9%) |
| 4 or 5 Rooms | 5,000 (30.4%) | 2,838 (56.1%) |
| 6 or 7 Rooms | 6,267 (38.1%) | 1,177 (23.3%) |
| 8 or more Rooms | 4,876 (29.6%) | 399 (7.9%) |
| Total | 16,449 (100.0%) | 5,056 (100.0%) |
Housing Structure by Heating Type in Granville County
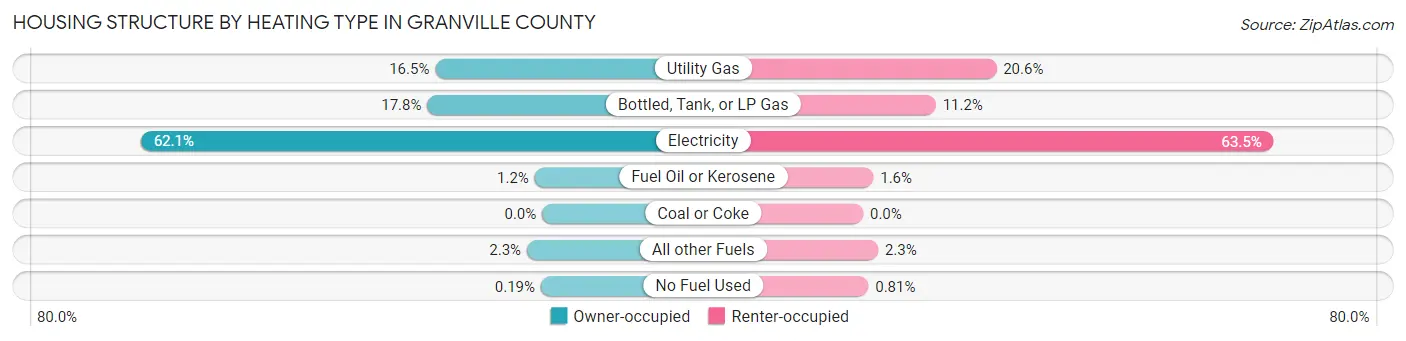
| Heating Type | Owner-occupied | Renter-occupied |
| Utility Gas | 2,718 (16.5%) | 1,041 (20.6%) |
| Bottled, Tank, or LP Gas | 2,919 (17.7%) | 568 (11.2%) |
| Electricity | 10,207 (62.1%) | 3,209 (63.5%) |
| Fuel Oil or Kerosene | 189 (1.1%) | 80 (1.6%) |
| Coal or Coke | 0 (0.0%) | 0 (0.0%) |
| All other Fuels | 385 (2.3%) | 117 (2.3%) |
| No Fuel Used | 31 (0.2%) | 41 (0.8%) |
| Total | 16,449 (100.0%) | 5,056 (100.0%) |
Household Vehicle Usage in Granville County
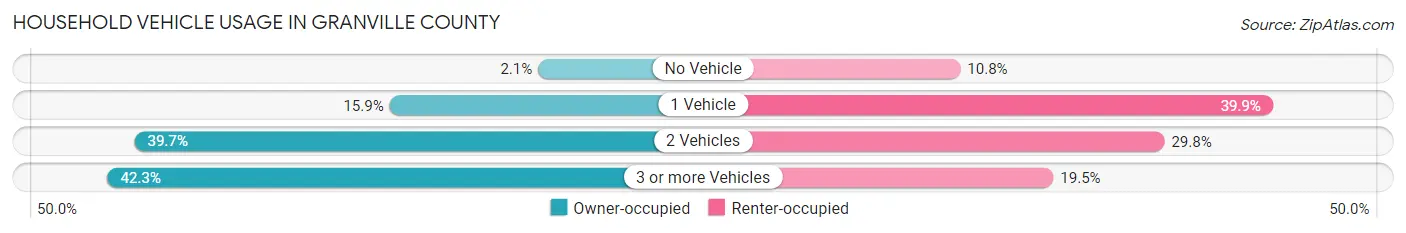
| Vehicles per Household | Owner-occupied | Renter-occupied |
| No Vehicle | 341 (2.1%) | 545 (10.8%) |
| 1 Vehicle | 2,622 (15.9%) | 2,019 (39.9%) |
| 2 Vehicles | 6,535 (39.7%) | 1,508 (29.8%) |
| 3 or more Vehicles | 6,951 (42.3%) | 984 (19.5%) |
| Total | 16,449 (100.0%) | 5,056 (100.0%) |
Real Estate & Mortgages in Granville County
Real Estate and Mortgage Overview in Granville County
| Characteristic | Without Mortgage | With Mortgage |
| Housing Units | 6,386 | 10,063 |
| Median Property Value | $180,600 | $228,200 |
| Median Household Income | $54,798 | $2,204 |
| Monthly Housing Costs | $481 | $363 |
| Real Estate Taxes | $1,372 | $92 |
Property Value by Mortgage Status in Granville County
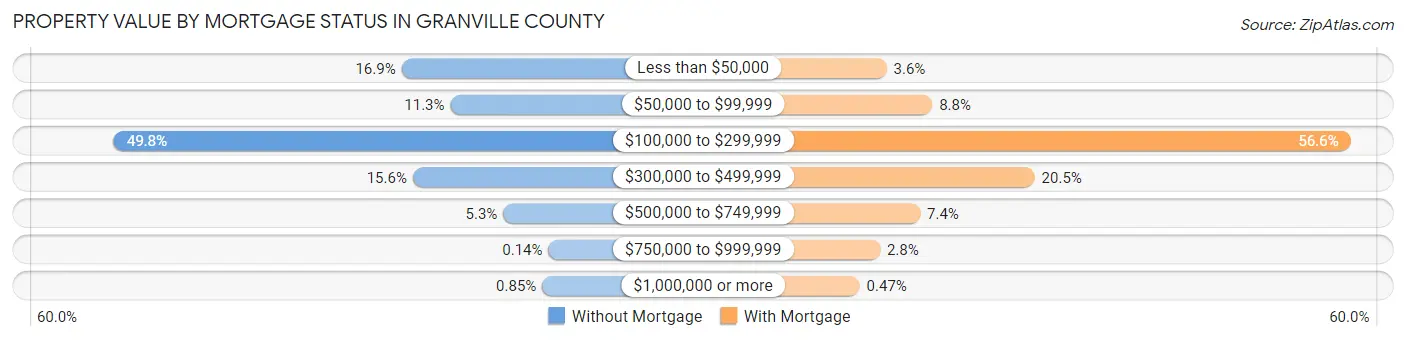
| Property Value | Without Mortgage | With Mortgage |
| Less than $50,000 | 1,081 (16.9%) | 357 (3.5%) |
| $50,000 to $99,999 | 724 (11.3%) | 882 (8.8%) |
| $100,000 to $299,999 | 3,180 (49.8%) | 5,693 (56.6%) |
| $300,000 to $499,999 | 999 (15.6%) | 2,060 (20.5%) |
| $500,000 to $749,999 | 339 (5.3%) | 743 (7.4%) |
| $750,000 to $999,999 | 9 (0.1%) | 281 (2.8%) |
| $1,000,000 or more | 54 (0.9%) | 47 (0.5%) |
| Total | 6,386 (100.0%) | 10,063 (100.0%) |
Household Income by Mortgage Status in Granville County
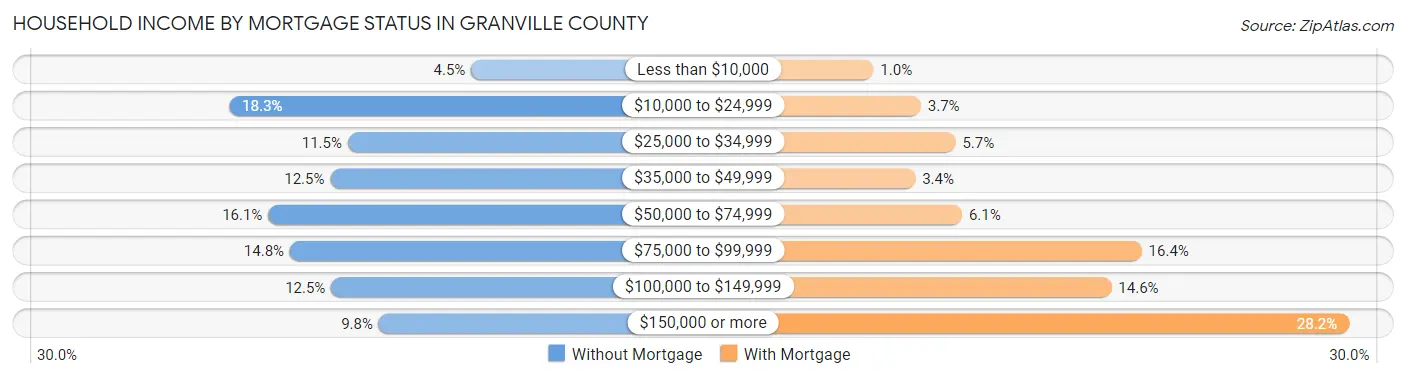
| Household Income | Without Mortgage | With Mortgage |
| Less than $10,000 | 286 (4.5%) | 103 (1.0%) |
| $10,000 to $24,999 | 1,169 (18.3%) | 375 (3.7%) |
| $25,000 to $34,999 | 736 (11.5%) | 575 (5.7%) |
| $35,000 to $49,999 | 800 (12.5%) | 343 (3.4%) |
| $50,000 to $74,999 | 1,027 (16.1%) | 612 (6.1%) |
| $75,000 to $99,999 | 948 (14.8%) | 1,645 (16.4%) |
| $100,000 to $149,999 | 797 (12.5%) | 1,471 (14.6%) |
| $150,000 or more | 623 (9.8%) | 2,838 (28.2%) |
| Total | 6,386 (100.0%) | 10,063 (100.0%) |
Property Value to Household Income Ratio in Granville County
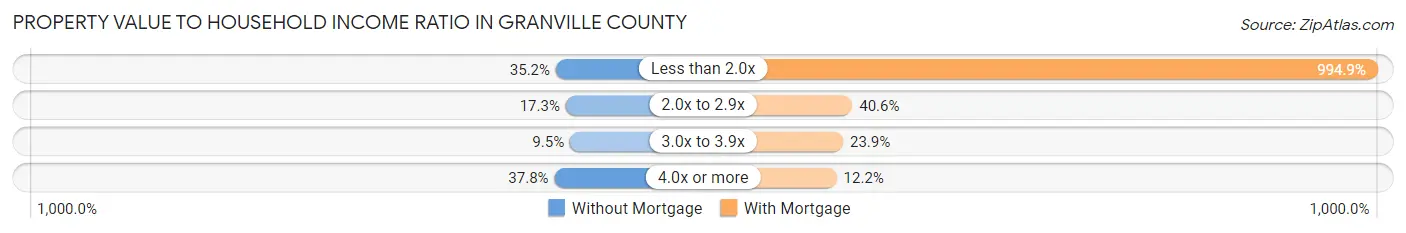
| Value-to-Income Ratio | Without Mortgage | With Mortgage |
| Less than 2.0x | 2,247 (35.2%) | 100,112 (994.8%) |
| 2.0x to 2.9x | 1,103 (17.3%) | 4,085 (40.6%) |
| 3.0x to 3.9x | 608 (9.5%) | 2,404 (23.9%) |
| 4.0x or more | 2,414 (37.8%) | 1,230 (12.2%) |
| Total | 6,386 (100.0%) | 10,063 (100.0%) |
Real Estate Taxes by Mortgage Status in Granville County
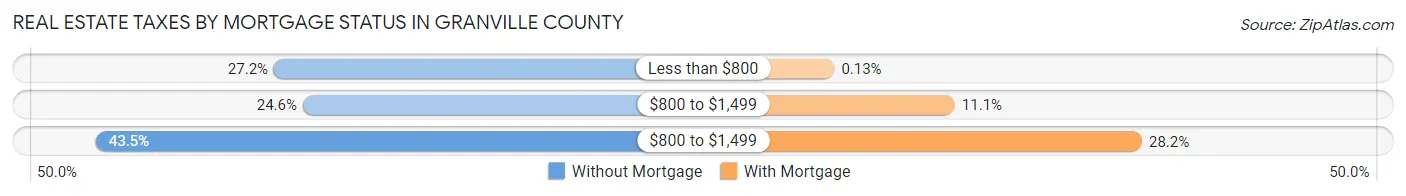
| Property Taxes | Without Mortgage | With Mortgage |
| Less than $800 | 1,739 (27.2%) | 13 (0.1%) |
| $800 to $1,499 | 1,570 (24.6%) | 1,120 (11.1%) |
| $800 to $1,499 | 2,777 (43.5%) | 2,840 (28.2%) |
| Total | 6,386 (100.0%) | 10,063 (100.0%) |
Health & Disability in Granville County
Health Insurance Coverage by Age in Granville County
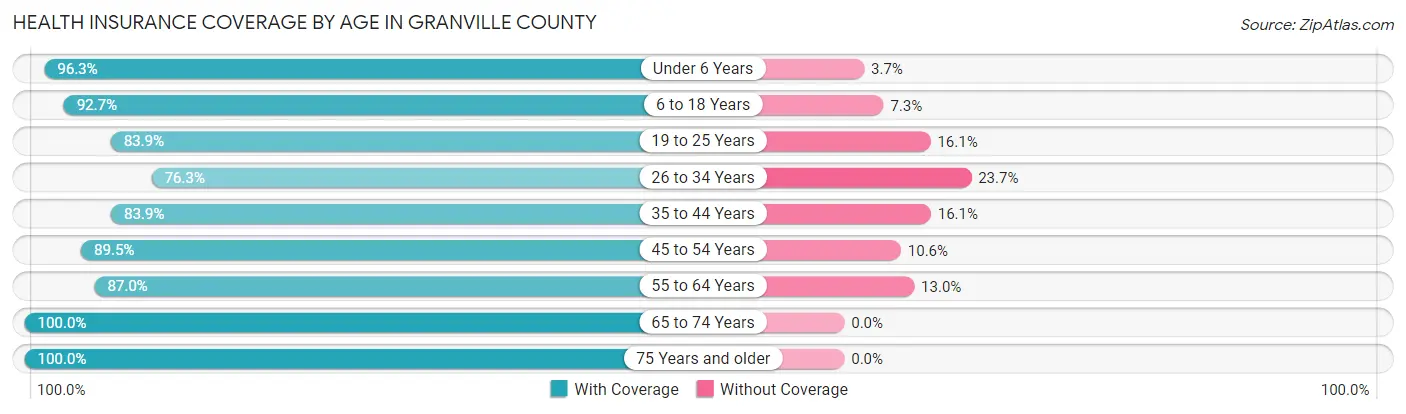
| Age Bracket | With Coverage | Without Coverage |
| Under 6 Years | 3,550 (96.3%) | 136 (3.7%) |
| 6 to 18 Years | 8,819 (92.7%) | 694 (7.3%) |
| 19 to 25 Years | 3,853 (83.9%) | 738 (16.1%) |
| 26 to 34 Years | 4,630 (76.3%) | 1,436 (23.7%) |
| 35 to 44 Years | 5,437 (83.9%) | 1,046 (16.1%) |
| 45 to 54 Years | 7,463 (89.4%) | 880 (10.5%) |
| 55 to 64 Years | 7,666 (87.0%) | 1,149 (13.0%) |
| 65 to 74 Years | 6,167 (100.0%) | 0 (0.0%) |
| 75 Years and older | 3,840 (100.0%) | 0 (0.0%) |
| Total | 51,425 (89.4%) | 6,079 (10.6%) |
Health Insurance Coverage by Citizenship Status in Granville County
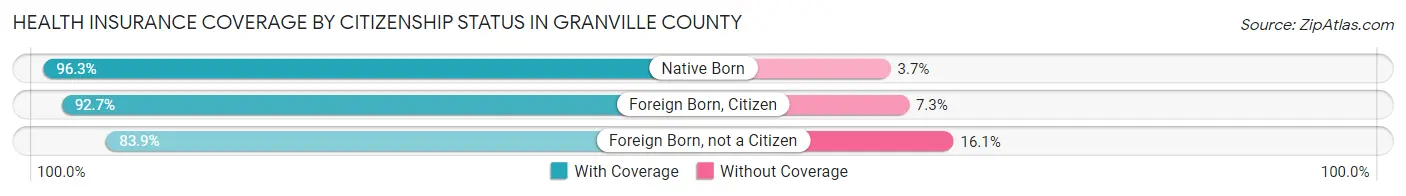
| Citizenship Status | With Coverage | Without Coverage |
| Native Born | 3,550 (96.3%) | 136 (3.7%) |
| Foreign Born, Citizen | 8,819 (92.7%) | 694 (7.3%) |
| Foreign Born, not a Citizen | 3,853 (83.9%) | 738 (16.1%) |
Health Insurance Coverage by Household Income in Granville County
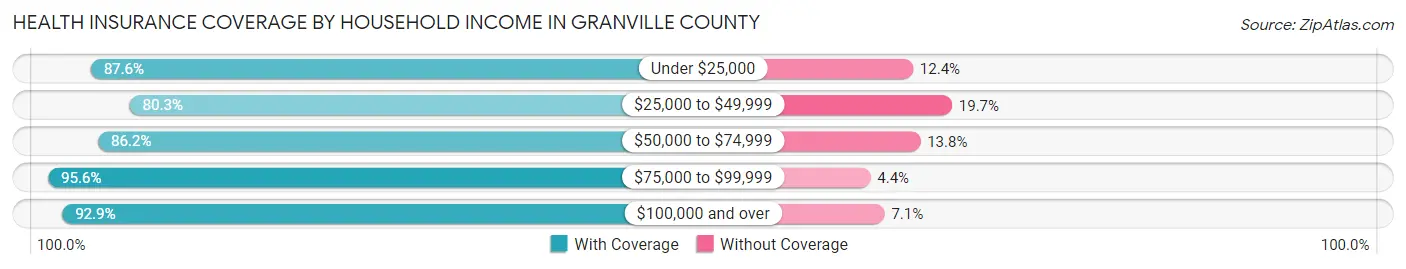
| Household Income | With Coverage | Without Coverage |
| Under $25,000 | 7,331 (87.6%) | 1,037 (12.4%) |
| $25,000 to $49,999 | 7,299 (80.3%) | 1,790 (19.7%) |
| $50,000 to $74,999 | 8,275 (86.2%) | 1,320 (13.8%) |
| $75,000 to $99,999 | 8,100 (95.6%) | 374 (4.4%) |
| $100,000 and over | 19,874 (92.9%) | 1,510 (7.1%) |
Public vs Private Health Insurance Coverage by Age in Granville County
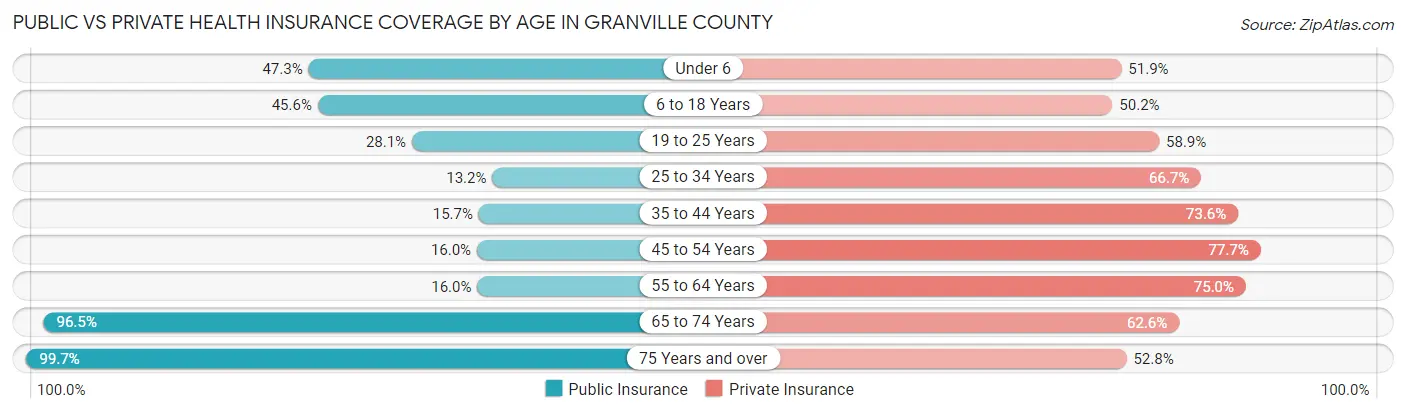
| Age Bracket | Public Insurance | Private Insurance |
| Under 6 | 1,744 (47.3%) | 1,913 (51.9%) |
| 6 to 18 Years | 4,337 (45.6%) | 4,778 (50.2%) |
| 19 to 25 Years | 1,290 (28.1%) | 2,704 (58.9%) |
| 25 to 34 Years | 800 (13.2%) | 4,046 (66.7%) |
| 35 to 44 Years | 1,017 (15.7%) | 4,768 (73.6%) |
| 45 to 54 Years | 1,338 (16.0%) | 6,486 (77.7%) |
| 55 to 64 Years | 1,408 (16.0%) | 6,610 (75.0%) |
| 65 to 74 Years | 5,950 (96.5%) | 3,860 (62.6%) |
| 75 Years and over | 3,827 (99.7%) | 2,029 (52.8%) |
| Total | 21,711 (37.8%) | 37,194 (64.7%) |
Disability Status by Sex by Age in Granville County
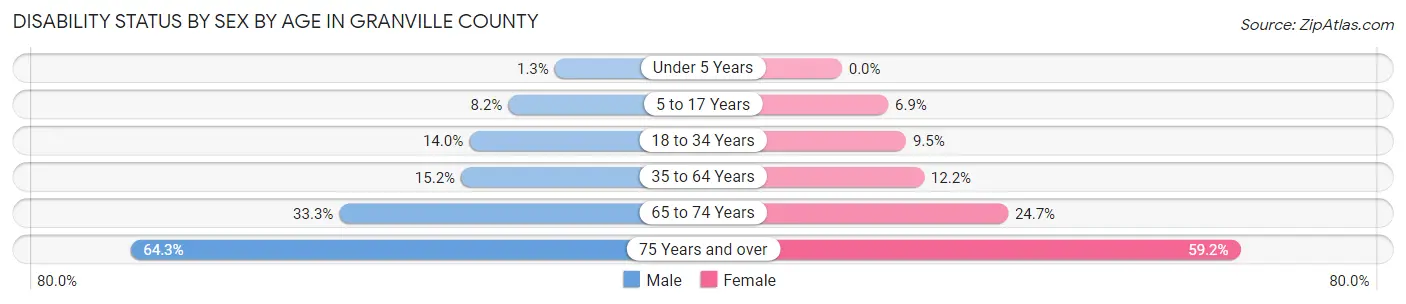
| Age Bracket | Male | Female |
| Under 5 Years | 20 (1.3%) | 0 (0.0%) |
| 5 to 17 Years | 395 (8.2%) | 307 (6.9%) |
| 18 to 34 Years | 840 (14.0%) | 529 (9.5%) |
| 35 to 64 Years | 1,752 (15.2%) | 1,478 (12.2%) |
| 65 to 74 Years | 968 (33.3%) | 804 (24.7%) |
| 75 Years and over | 974 (64.3%) | 1,376 (59.2%) |
Disability Class by Sex by Age in Granville County
Disability Class: Hearing Difficulty
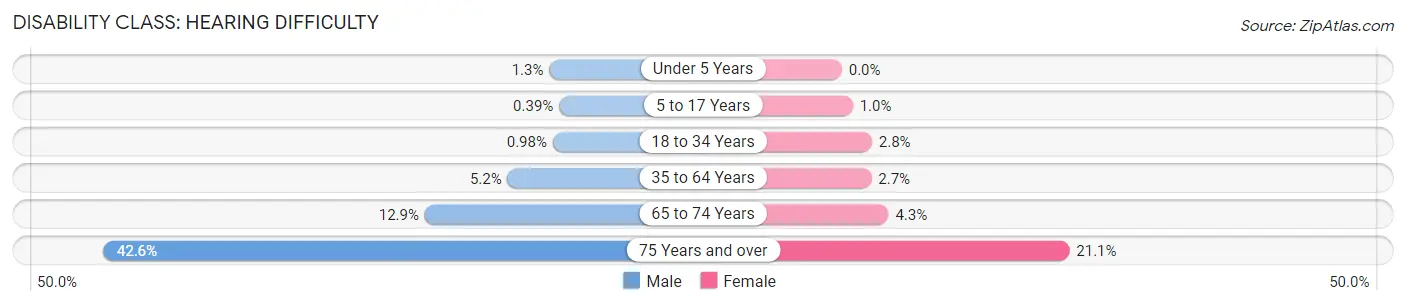
| Age Bracket | Male | Female |
| Under 5 Years | 20 (1.3%) | 0 (0.0%) |
| 5 to 17 Years | 19 (0.4%) | 45 (1.0%) |
| 18 to 34 Years | 59 (1.0%) | 155 (2.8%) |
| 35 to 64 Years | 597 (5.2%) | 332 (2.7%) |
| 65 to 74 Years | 374 (12.9%) | 141 (4.3%) |
| 75 Years and over | 646 (42.6%) | 491 (21.1%) |
Disability Class: Vision Difficulty
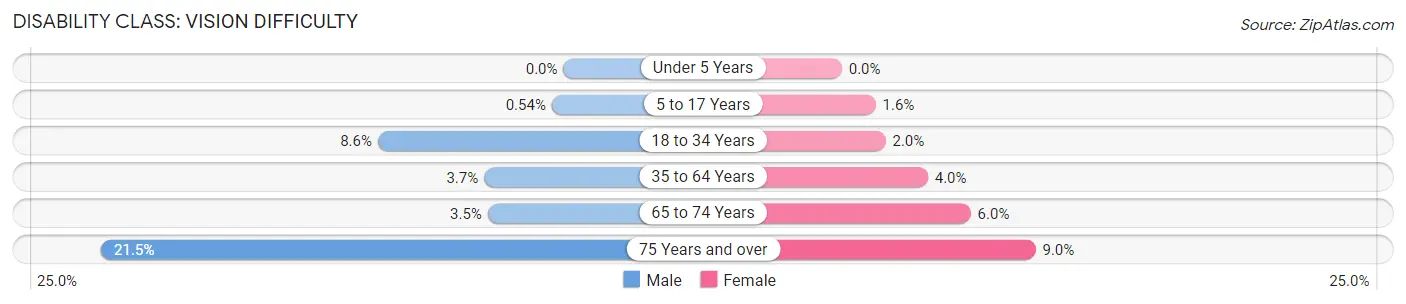
| Age Bracket | Male | Female |
| Under 5 Years | 0 (0.0%) | 0 (0.0%) |
| 5 to 17 Years | 26 (0.5%) | 70 (1.6%) |
| 18 to 34 Years | 516 (8.6%) | 113 (2.0%) |
| 35 to 64 Years | 424 (3.7%) | 484 (4.0%) |
| 65 to 74 Years | 102 (3.5%) | 195 (6.0%) |
| 75 Years and over | 325 (21.4%) | 209 (9.0%) |
Disability Class: Cognitive Difficulty
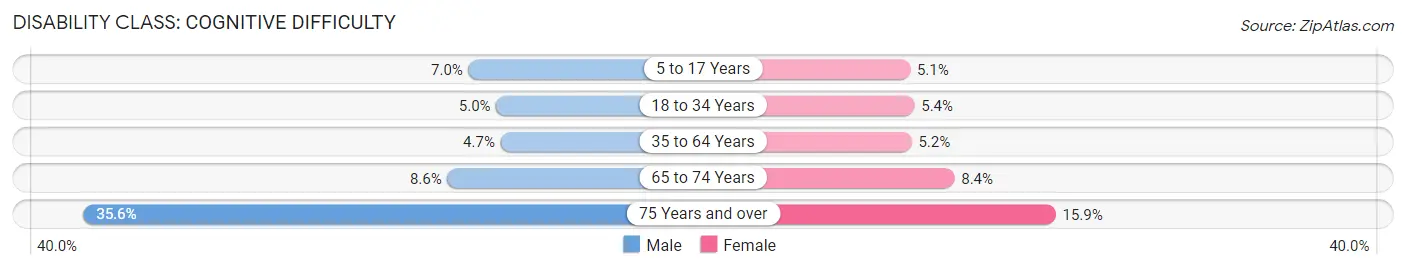
| Age Bracket | Male | Female |
| 5 to 17 Years | 339 (7.0%) | 226 (5.1%) |
| 18 to 34 Years | 298 (5.0%) | 299 (5.4%) |
| 35 to 64 Years | 536 (4.6%) | 627 (5.2%) |
| 65 to 74 Years | 250 (8.6%) | 272 (8.4%) |
| 75 Years and over | 540 (35.6%) | 369 (15.9%) |
Disability Class: Ambulatory Difficulty
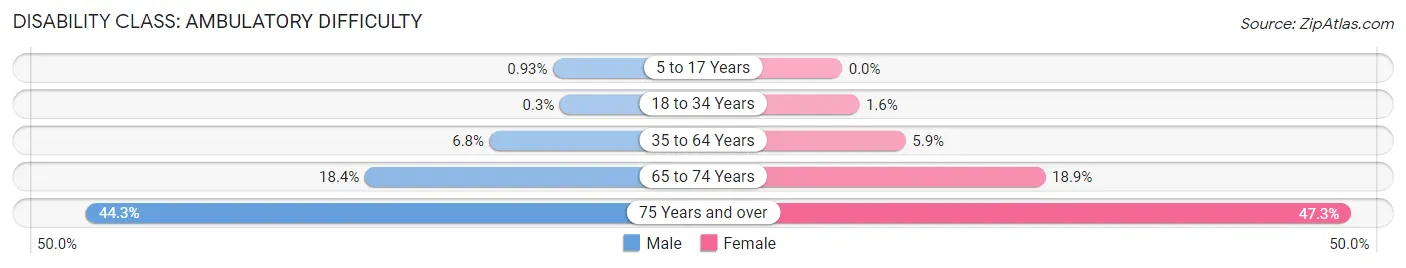
| Age Bracket | Male | Female |
| 5 to 17 Years | 45 (0.9%) | 0 (0.0%) |
| 18 to 34 Years | 18 (0.3%) | 89 (1.6%) |
| 35 to 64 Years | 785 (6.8%) | 715 (5.9%) |
| 65 to 74 Years | 535 (18.4%) | 615 (18.9%) |
| 75 Years and over | 671 (44.3%) | 1,099 (47.3%) |
Disability Class: Self-Care Difficulty
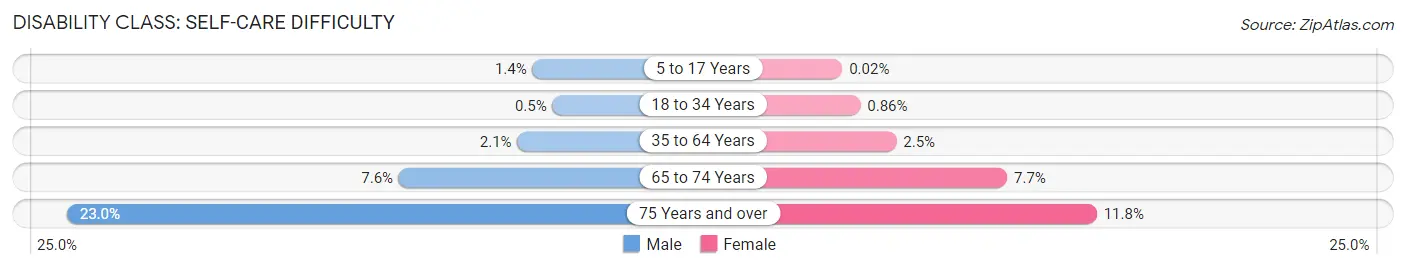
| Age Bracket | Male | Female |
| 5 to 17 Years | 69 (1.4%) | 1 (0.0%) |
| 18 to 34 Years | 30 (0.5%) | 48 (0.9%) |
| 35 to 64 Years | 245 (2.1%) | 307 (2.5%) |
| 65 to 74 Years | 222 (7.6%) | 250 (7.7%) |
| 75 Years and over | 349 (23.0%) | 275 (11.8%) |
Technology Access in Granville County
Computing Device Access in Granville County
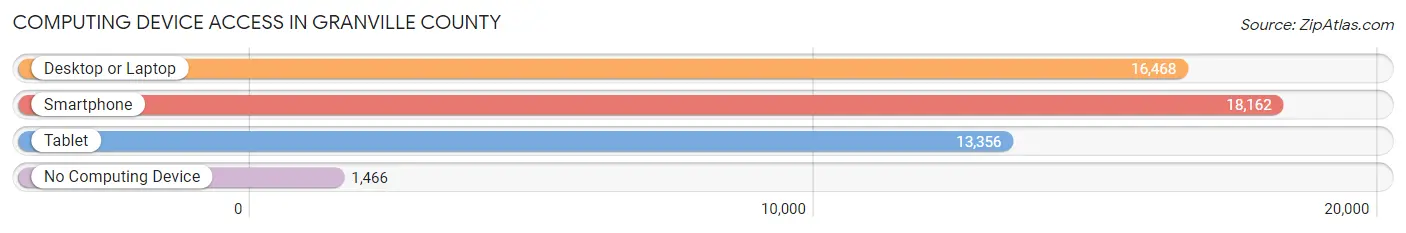
| Device Type | # Households | % Households |
| Desktop or Laptop | 16,468 | 76.6% |
| Smartphone | 18,162 | 84.5% |
| Tablet | 13,356 | 62.1% |
| No Computing Device | 1,466 | 6.8% |
| Total | 21,505 | 100.0% |
Internet Access in Granville County
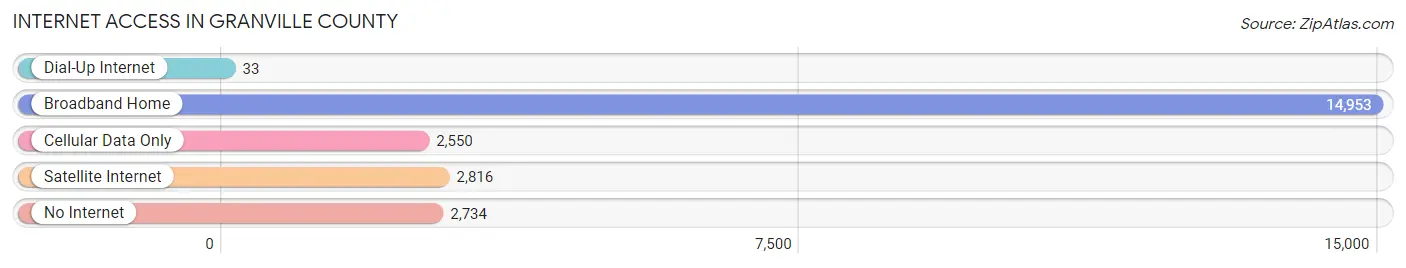
| Internet Type | # Households | % Households |
| Dial-Up Internet | 33 | 0.2% |
| Broadband Home | 14,953 | 69.5% |
| Cellular Data Only | 2,550 | 11.9% |
| Satellite Internet | 2,816 | 13.1% |
| No Internet | 2,734 | 12.7% |
| Total | 21,505 | 100.0% |
Granville County Summary
Granville County is located in the central part of North Carolina, and is part of the Research Triangle region. It is bordered by Vance County to the north, Person County to the east, Durham County to the south, and Wake County to the west. The county seat is Oxford, and the county is home to a population of 59,916 people, according to the 2010 census.
History
Granville County was formed in 1746 from Edgecombe County. It was named for John Carteret, 2nd Earl Granville, who was the Proprietary Governor of the Province of North Carolina from 1729 to 1752. The county was originally part of the Granville District, which included parts of present-day Vance, Warren, Franklin, and Granville counties.
The county was home to several prominent figures in North Carolina history, including Revolutionary War General Jethro Sumner, who was born in Granville County in 1733. The county was also home to the first public school in North Carolina, established in 1756.
Geography
Granville County is located in the Piedmont region of North Carolina, and is part of the Research Triangle region. The county is bordered by Vance County to the north, Person County to the east, Durham County to the south, and Wake County to the west. The county has a total area of 517 square miles, of which 514 square miles is land and 3 square miles is water.
The county is home to several rivers and streams, including the Tar River, which forms the northern border of the county, and the Eno River, which forms the eastern border. The county is also home to several lakes, including Falls Lake, B. Everett Jordan Lake, and Lake Gaston.
Economy
Granville County has a diverse economy, with a mix of manufacturing, agriculture, and services. The county is home to several major employers, including Duke Energy, Granville Health System, and Granville County Schools.
Agriculture is an important part of the county's economy, with the county being home to several large farms. The county is also home to several wineries, including the Chatham Hill Winery and the Granville County Winery.
The county is also home to several manufacturing companies, including the Oxford-based Oxford Industries, which produces apparel and home furnishings. The county is also home to several technology companies, including the Durham-based SAS Institute, which produces software for data analysis.
Demographics
As of the 2010 census, Granville County had a population of 59,916 people. The racial makeup of the county was 73.3% White, 19.2% African American, 0.5% Native American, 2.2% Asian, 0.1% Pacific Islander, 2.7% from other races, and 1.9% from two or more races. Hispanic or Latino of any race were 6.2% of the population.
The median income for a household in the county was $45,837, and the median income for a family was $54,945. The per capita income for the county was $22,945. About 11.2% of families and 14.7% of the population were below the poverty line, including 19.2% of those under age 18 and 11.2% of those age 65 or over.
Common Questions
What is the Total Population of Granville County?
Total Population of Granville County is 61,161.
What is the Total Male Population of Granville County?
Total Male Population of Granville County is 31,552.
What is the Total Female Population of Granville County?
Total Female Population of Granville County is 29,609.
What is the Ratio of Males per 100 Females in Granville County?
There are 106.56 Males per 100 Females in Granville County.
What is the Ratio of Females per 100 Males in Granville County?
There are 93.84 Females per 100 Males in Granville County.
What is the Median Population Age in Granville County?
Median Population Age in Granville County is 42.5 Years.
What is the Average Family Size in Granville County
Average Family Size in Granville County is 3.2 People.
What is the Average Household Size in Granville County
Average Household Size in Granville County is 2.6 People.
What is Per Capita Income in Granville County?
Per Capita income in Granville County is $31,604.
What is the Median Family Income in Granville County?
Median Family Income in Granville County is $81,516.
What is the Median Household income in Granville County?
Median Household Income in Granville County is $68,079.
What is Income or Wage Gap in Granville County?
Income or Wage Gap in Granville County is 12.9%.
Women in Granville County earn 87.1 cents for every dollar earned by a man.
What is Family Income Deficit in Granville County?
Family Income Deficit in Granville County is $10,712.
Families that are below poverty line in Granville County earn $10,712 less on average than the poverty threshold level.
What is Inequality or Gini Index in Granville County?
Inequality or Gini Index in Granville County is 0.44.
How Large is the Labor Force in Granville County?
There are 28,306 People in the Labor Forcein in Granville County.
What is the Percentage of People in the Labor Force in Granville County?
56.0% of People are in the Labor Force in Granville County.
What is the Unemployment Rate in Granville County?
Unemployment Rate in Granville County is 4.7%.