Gaston County, NC
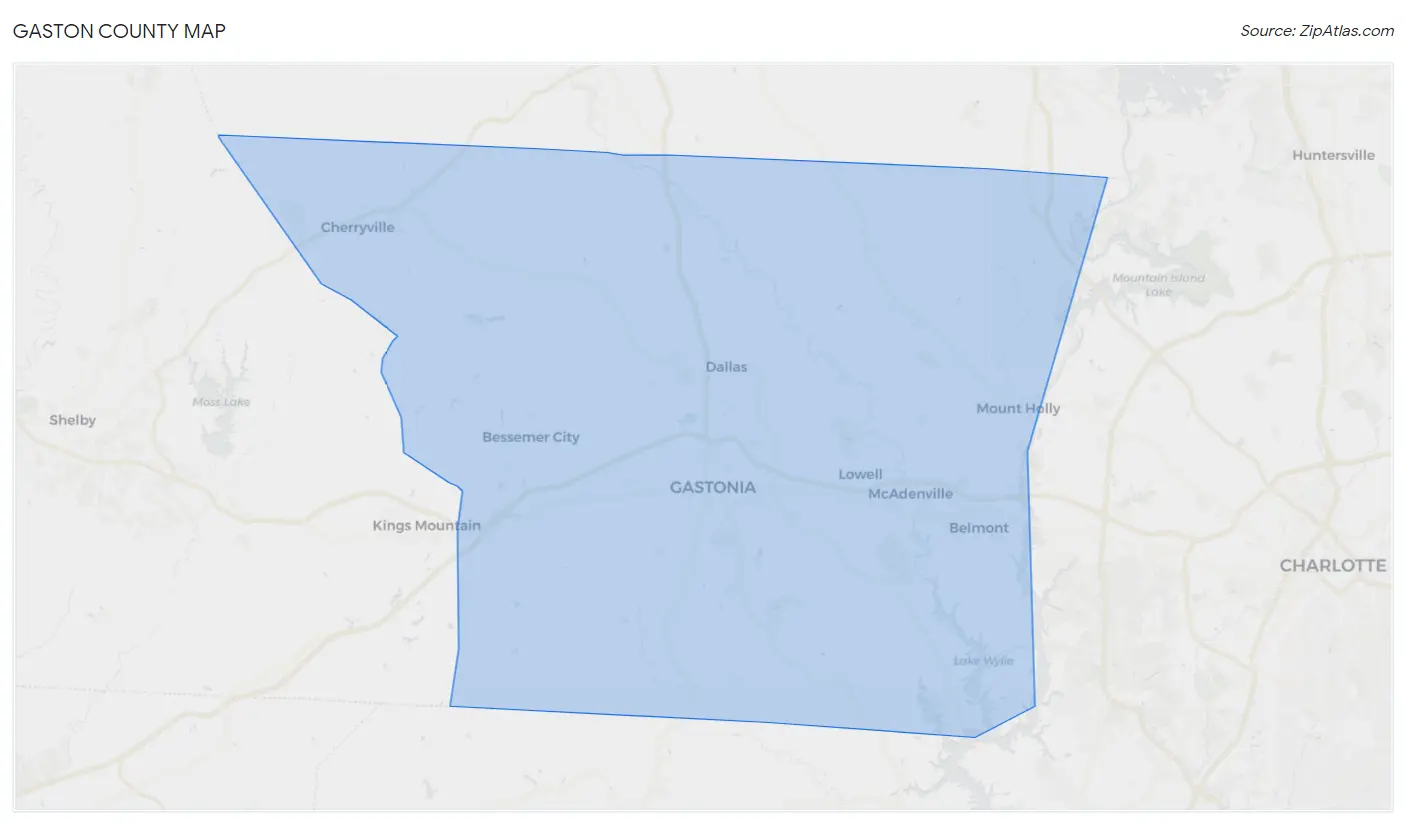
Gaston County Map
Gaston County Overview
228,972
TOTAL POPULATION
111,225
MALE POPULATION
117,747
FEMALE POPULATION
94.46
MALES / 100 FEMALES
105.86
FEMALES / 100 MALES
39.9
MEDIAN AGE
3.1
AVG FAMILY SIZE
2.5
AVG HOUSEHOLD SIZE
$33,806
PER CAPITA INCOME
$78,252
AVG FAMILY INCOME
$62,628
AVG HOUSEHOLD INCOME
25.2%
WAGE / INCOME GAP [ % ]
74.8¢/ $1
WAGE / INCOME GAP [ $ ]
$11,660
FAMILY INCOME DEFICIT
0.46
INEQUALITY / GINI INDEX
115,051
LABOR FORCE [ PEOPLE ]
62.5%
PERCENT IN LABOR FORCE
4.9%
UNEMPLOYMENT RATE
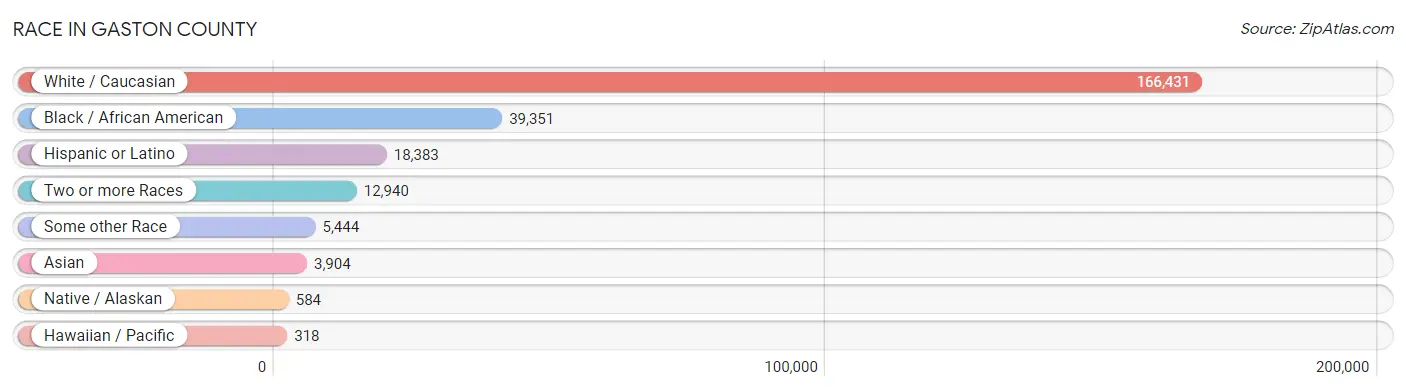
Race in Gaston County
The most populous races in Gaston County are White / Caucasian (166,431 | 72.7%), Black / African American (39,351 | 17.2%), and Hispanic or Latino (18,383 | 8.0%).
| Race | # Population | % Population |
| Asian | 3,904 | 1.7% |
| Black / African American | 39,351 | 17.2% |
| Hawaiian / Pacific | 318 | 0.1% |
| Hispanic or Latino | 18,383 | 8.0% |
| Native / Alaskan | 584 | 0.3% |
| White / Caucasian | 166,431 | 72.7% |
| Two or more Races | 12,940 | 5.7% |
| Some other Race | 5,444 | 2.4% |
| Total | 228,972 | 100.0% |
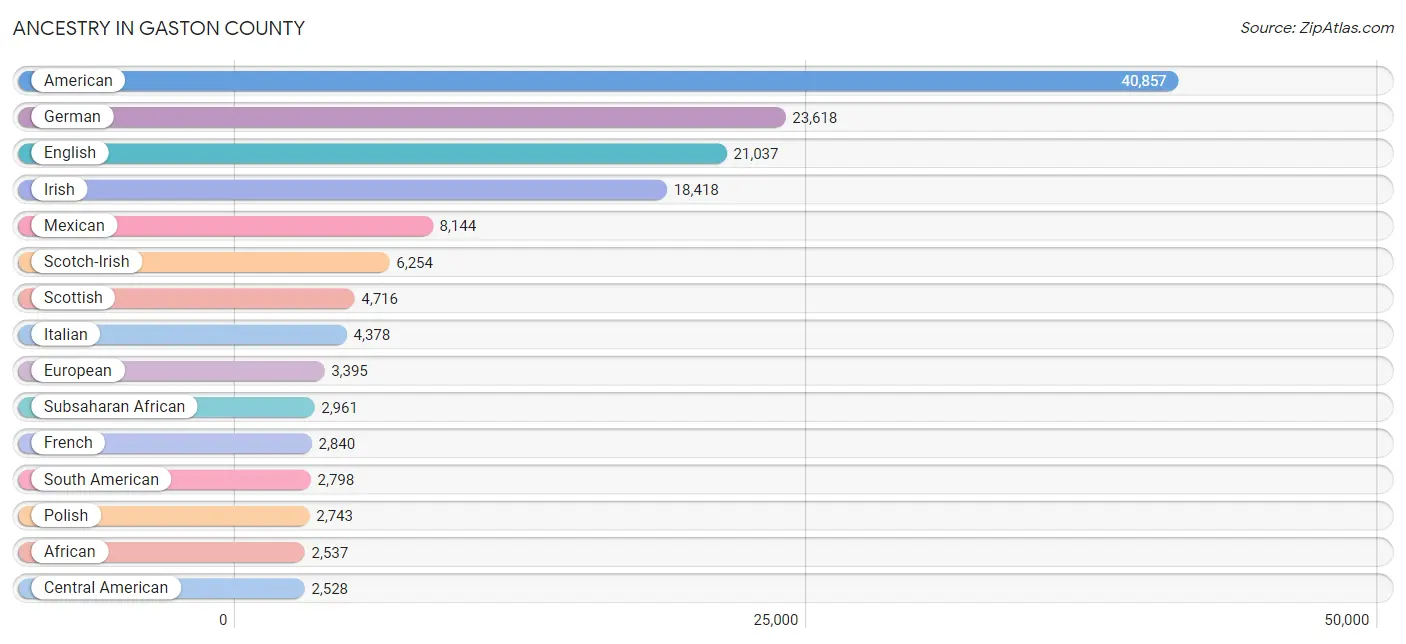
Ancestry in Gaston County
The most populous ancestries reported in Gaston County are American (40,857 | 17.8%), German (23,618 | 10.3%), English (21,037 | 9.2%), Irish (18,418 | 8.0%), and Mexican (8,144 | 3.6%), together accounting for 48.9% of all Gaston County residents.
| Ancestry | # Population | % Population |
| Afghan | 20 | 0.0% |
| African | 2,537 | 1.1% |
| American | 40,857 | 17.8% |
| Apache | 18 | 0.0% |
| Arab | 388 | 0.2% |
| Arapaho | 6 | 0.0% |
| Argentinean | 203 | 0.1% |
| Armenian | 193 | 0.1% |
| Australian | 17 | 0.0% |
| Austrian | 84 | 0.0% |
| Bahamian | 33 | 0.0% |
| Bangladeshi | 328 | 0.1% |
| Belgian | 25 | 0.0% |
| Belizean | 41 | 0.0% |
| Bhutanese | 230 | 0.1% |
| Blackfeet | 146 | 0.1% |
| Bolivian | 23 | 0.0% |
| Brazilian | 36 | 0.0% |
| British | 1,241 | 0.5% |
| Bulgarian | 46 | 0.0% |
| Burmese | 330 | 0.1% |
| Canadian | 122 | 0.1% |
| Carpatho Rusyn | 18 | 0.0% |
| Celtic | 5 | 0.0% |
| Central American | 2,528 | 1.1% |
| Central American Indian | 131 | 0.1% |
| Cherokee | 1,054 | 0.5% |
| Cheyenne | 7 | 0.0% |
| Chilean | 318 | 0.1% |
| Chippewa | 72 | 0.0% |
| Choctaw | 23 | 0.0% |
| Colombian | 1,773 | 0.8% |
| Costa Rican | 158 | 0.1% |
| Creek | 19 | 0.0% |
| Croatian | 35 | 0.0% |
| Cuban | 625 | 0.3% |
| Cypriot | 8 | 0.0% |
| Czech | 158 | 0.1% |
| Czechoslovakian | 37 | 0.0% |
| Danish | 126 | 0.1% |
| Delaware | 55 | 0.0% |
| Dominican | 743 | 0.3% |
| Dutch | 1,936 | 0.9% |
| Eastern European | 120 | 0.1% |
| Ecuadorian | 187 | 0.1% |
| Egyptian | 62 | 0.0% |
| English | 21,037 | 9.2% |
| Ethiopian | 16 | 0.0% |
| European | 3,395 | 1.5% |
| Finnish | 104 | 0.1% |
| French | 2,840 | 1.2% |
| French American Indian | 5 | 0.0% |
| French Canadian | 476 | 0.2% |
| German | 23,618 | 10.3% |
| German Russian | 17 | 0.0% |
| Ghanaian | 172 | 0.1% |
| Greek | 439 | 0.2% |
| Guamanian / Chamorro | 15 | 0.0% |
| Guatemalan | 562 | 0.3% |
| Guyanese | 95 | 0.0% |
| Haitian | 333 | 0.2% |
| Honduran | 582 | 0.3% |
| Hungarian | 408 | 0.2% |
| Indian (Asian) | 717 | 0.3% |
| Indonesian | 119 | 0.1% |
| Inupiat | 2 | 0.0% |
| Iranian | 15 | 0.0% |
| Iraqi | 70 | 0.0% |
| Irish | 18,418 | 8.0% |
| Iroquois | 24 | 0.0% |
| Israeli | 53 | 0.0% |
| Italian | 4,378 | 1.9% |
| Jamaican | 349 | 0.2% |
| Japanese | 181 | 0.1% |
| Jordanian | 48 | 0.0% |
| Kenyan | 48 | 0.0% |
| Korean | 817 | 0.4% |
| Laotian | 350 | 0.2% |
| Lebanese | 148 | 0.1% |
| Lithuanian | 74 | 0.0% |
| Lumbee | 242 | 0.1% |
| Macedonian | 30 | 0.0% |
| Malaysian | 266 | 0.1% |
| Mexican | 8,144 | 3.6% |
| Mexican American Indian | 91 | 0.0% |
| Mongolian | 9 | 0.0% |
| Moroccan | 5 | 0.0% |
| Native Hawaiian | 37 | 0.0% |
| Navajo | 124 | 0.1% |
| Nicaraguan | 512 | 0.2% |
| Nigerian | 33 | 0.0% |
| Northern European | 260 | 0.1% |
| Norwegian | 654 | 0.3% |
| Okinawan | 2 | 0.0% |
| Osage | 3 | 0.0% |
| Pakistani | 49 | 0.0% |
| Palestinian | 22 | 0.0% |
| Panamanian | 47 | 0.0% |
| Peruvian | 59 | 0.0% |
| Polish | 2,743 | 1.2% |
| Portuguese | 115 | 0.1% |
| Potawatomi | 5 | 0.0% |
| Puerto Rican | 2,413 | 1.1% |
| Romanian | 66 | 0.0% |
| Russian | 356 | 0.2% |
| Salvadoran | 667 | 0.3% |
| Samoan | 189 | 0.1% |
| Scandinavian | 654 | 0.3% |
| Scotch-Irish | 6,254 | 2.7% |
| Scottish | 4,716 | 2.1% |
| Seminole | 61 | 0.0% |
| Shoshone | 4 | 0.0% |
| Sioux | 6 | 0.0% |
| Slavic | 61 | 0.0% |
| Slovak | 301 | 0.1% |
| Slovene | 45 | 0.0% |
| South African | 86 | 0.0% |
| South American | 2,798 | 1.2% |
| Spaniard | 113 | 0.1% |
| Spanish | 166 | 0.1% |
| Sri Lankan | 957 | 0.4% |
| Subsaharan African | 2,961 | 1.3% |
| Sudanese | 15 | 0.0% |
| Swedish | 514 | 0.2% |
| Swiss | 372 | 0.2% |
| Syrian | 27 | 0.0% |
| Thai | 1,042 | 0.5% |
| Trinidadian and Tobagonian | 75 | 0.0% |
| Turkish | 141 | 0.1% |
| Ukrainian | 83 | 0.0% |
| Uruguayan | 11 | 0.0% |
| Venezuelan | 224 | 0.1% |
| Welsh | 861 | 0.4% |
| West Indian | 199 | 0.1% | View All 134 Rows |
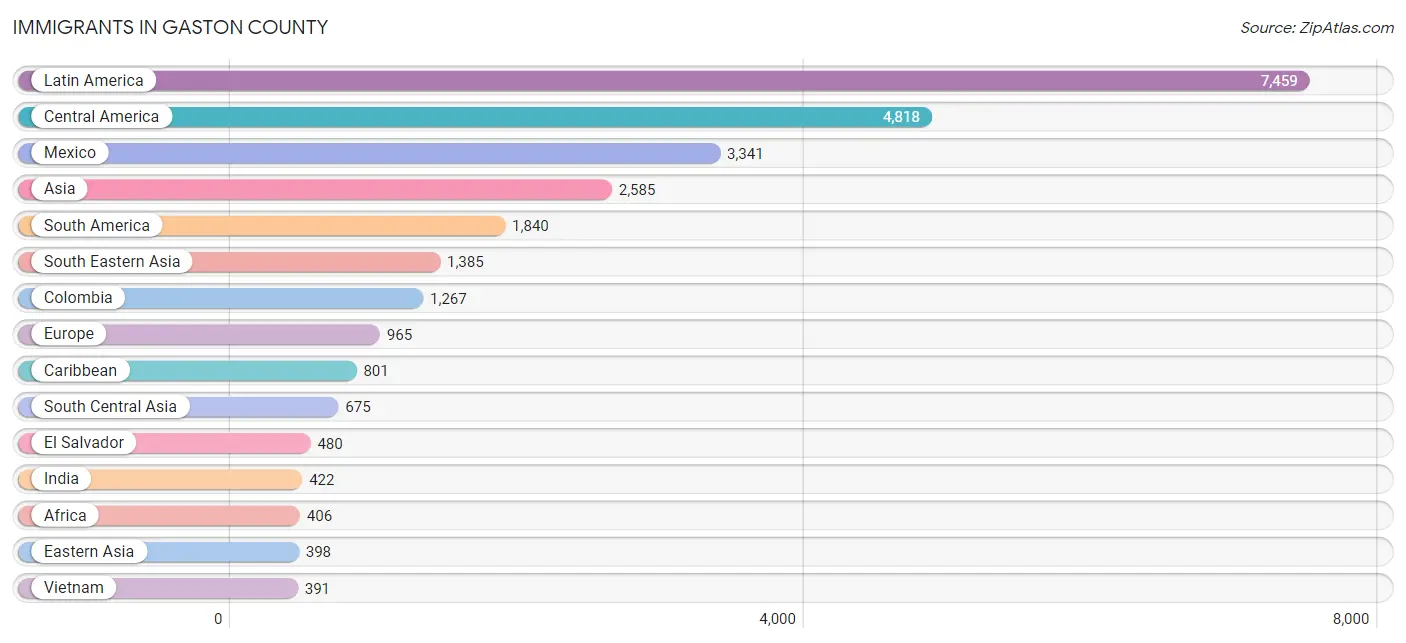
Immigrants in Gaston County
The most numerous immigrant groups reported in Gaston County came from Latin America (7,459 | 3.3%), Central America (4,818 | 2.1%), Mexico (3,341 | 1.5%), Asia (2,585 | 1.1%), and South America (1,840 | 0.8%), together accounting for 8.7% of all Gaston County residents.
| Immigration Origin | # Population | % Population |
| Afghanistan | 13 | 0.0% |
| Africa | 406 | 0.2% |
| Argentina | 144 | 0.1% |
| Armenia | 12 | 0.0% |
| Asia | 2,585 | 1.1% |
| Australia | 23 | 0.0% |
| Austria | 9 | 0.0% |
| Bahamas | 26 | 0.0% |
| Bangladesh | 25 | 0.0% |
| Belarus | 5 | 0.0% |
| Belgium | 7 | 0.0% |
| Bolivia | 23 | 0.0% |
| Brazil | 18 | 0.0% |
| Bulgaria | 46 | 0.0% |
| Canada | 326 | 0.1% |
| Caribbean | 801 | 0.4% |
| Central America | 4,818 | 2.1% |
| Chile | 118 | 0.1% |
| China | 221 | 0.1% |
| Colombia | 1,267 | 0.5% |
| Congo | 16 | 0.0% |
| Costa Rica | 76 | 0.0% |
| Cuba | 143 | 0.1% |
| Czechoslovakia | 26 | 0.0% |
| Dominican Republic | 141 | 0.1% |
| Eastern Africa | 174 | 0.1% |
| Eastern Asia | 398 | 0.2% |
| Eastern Europe | 289 | 0.1% |
| Ecuador | 125 | 0.1% |
| Egypt | 8 | 0.0% |
| El Salvador | 480 | 0.2% |
| England | 206 | 0.1% |
| Ethiopia | 29 | 0.0% |
| Europe | 965 | 0.4% |
| France | 11 | 0.0% |
| Germany | 278 | 0.1% |
| Ghana | 106 | 0.1% |
| Guatemala | 322 | 0.1% |
| Guyana | 22 | 0.0% |
| Haiti | 124 | 0.1% |
| Honduras | 374 | 0.2% |
| Hong Kong | 4 | 0.0% |
| India | 422 | 0.2% |
| Indonesia | 324 | 0.1% |
| Iraq | 70 | 0.0% |
| Ireland | 4 | 0.0% |
| Israel | 10 | 0.0% |
| Italy | 23 | 0.0% |
| Jamaica | 116 | 0.1% |
| Japan | 80 | 0.0% |
| Kenya | 48 | 0.0% |
| Korea | 97 | 0.0% |
| Laos | 142 | 0.1% |
| Latin America | 7,459 | 3.3% |
| Lebanon | 4 | 0.0% |
| Malaysia | 9 | 0.0% |
| Mexico | 3,341 | 1.5% |
| Middle Africa | 47 | 0.0% |
| Nepal | 13 | 0.0% |
| Netherlands | 4 | 0.0% |
| Nicaragua | 225 | 0.1% |
| Nigeria | 8 | 0.0% |
| North Macedonia | 30 | 0.0% |
| Northern Africa | 8 | 0.0% |
| Northern Europe | 336 | 0.2% |
| Oceania | 63 | 0.0% |
| Pakistan | 190 | 0.1% |
| Peru | 40 | 0.0% |
| Philippines | 373 | 0.2% |
| Poland | 108 | 0.1% |
| Portugal | 8 | 0.0% |
| Romania | 29 | 0.0% |
| Russia | 40 | 0.0% |
| Saudi Arabia | 12 | 0.0% |
| Singapore | 2 | 0.0% |
| South Africa | 47 | 0.0% |
| South America | 1,840 | 0.8% |
| South Central Asia | 675 | 0.3% |
| South Eastern Asia | 1,385 | 0.6% |
| Southern Europe | 31 | 0.0% |
| Sri Lanka | 12 | 0.0% |
| Taiwan | 13 | 0.0% |
| Thailand | 117 | 0.1% |
| Trinidad and Tobago | 173 | 0.1% |
| Ukraine | 5 | 0.0% |
| Venezuela | 80 | 0.0% |
| Vietnam | 391 | 0.2% |
| West Indies | 67 | 0.0% |
| Western Africa | 130 | 0.1% |
| Western Asia | 109 | 0.1% |
| Western Europe | 309 | 0.1% |
| Zaire | 31 | 0.0% |
| Zimbabwe | 66 | 0.0% | View All 93 Rows |
Sex and Age in Gaston County
Sex and Age in Gaston County
The most populous age groups in Gaston County are 50 to 54 Years (8,096 | 7.3%) for men and 55 to 59 Years (8,352 | 7.1%) for women.
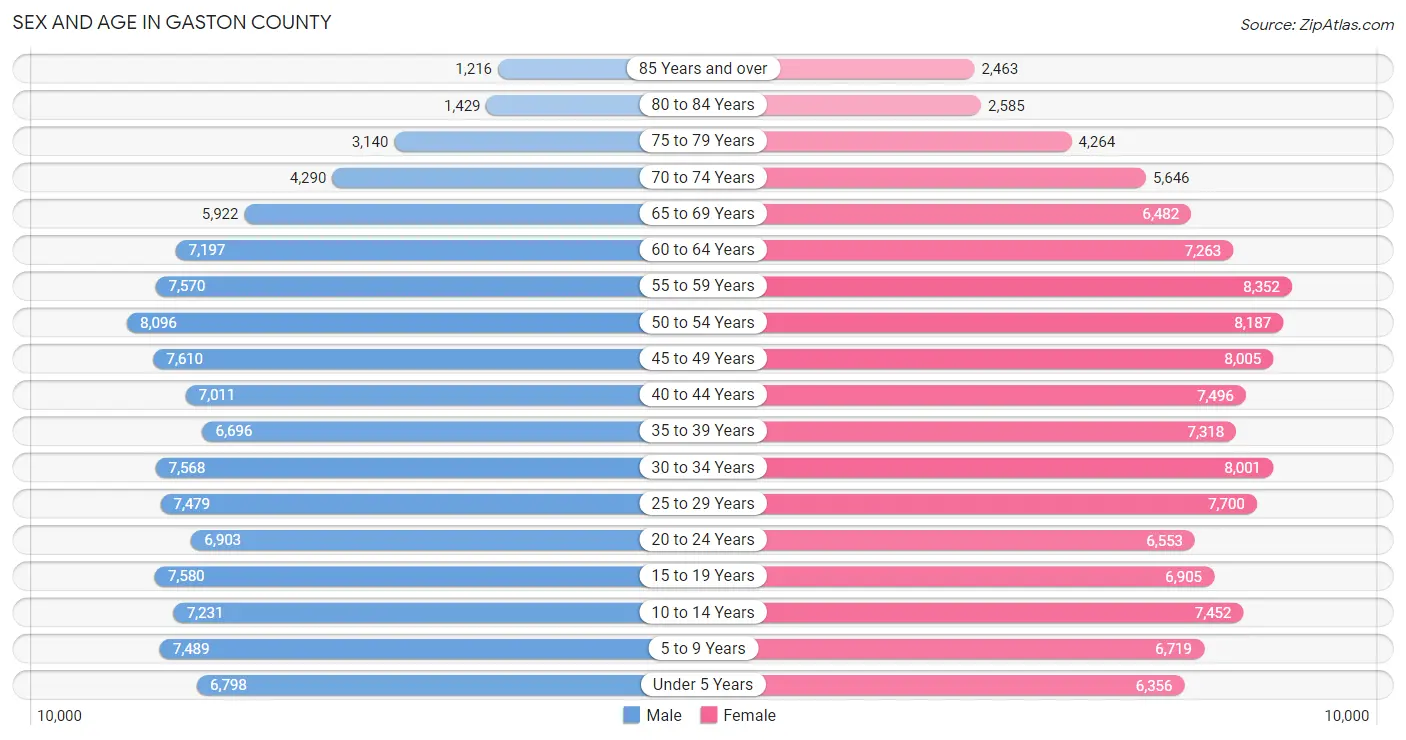
| Age Bracket | Male | Female |
| Under 5 Years | 6,798 (6.1%) | 6,356 (5.4%) |
| 5 to 9 Years | 7,489 (6.7%) | 6,719 (5.7%) |
| 10 to 14 Years | 7,231 (6.5%) | 7,452 (6.3%) |
| 15 to 19 Years | 7,580 (6.8%) | 6,905 (5.9%) |
| 20 to 24 Years | 6,903 (6.2%) | 6,553 (5.6%) |
| 25 to 29 Years | 7,479 (6.7%) | 7,700 (6.5%) |
| 30 to 34 Years | 7,568 (6.8%) | 8,001 (6.8%) |
| 35 to 39 Years | 6,696 (6.0%) | 7,318 (6.2%) |
| 40 to 44 Years | 7,011 (6.3%) | 7,496 (6.4%) |
| 45 to 49 Years | 7,610 (6.8%) | 8,005 (6.8%) |
| 50 to 54 Years | 8,096 (7.3%) | 8,187 (7.0%) |
| 55 to 59 Years | 7,570 (6.8%) | 8,352 (7.1%) |
| 60 to 64 Years | 7,197 (6.5%) | 7,263 (6.2%) |
| 65 to 69 Years | 5,922 (5.3%) | 6,482 (5.5%) |
| 70 to 74 Years | 4,290 (3.9%) | 5,646 (4.8%) |
| 75 to 79 Years | 3,140 (2.8%) | 4,264 (3.6%) |
| 80 to 84 Years | 1,429 (1.3%) | 2,585 (2.2%) |
| 85 Years and over | 1,216 (1.1%) | 2,463 (2.1%) |
| Total | 111,225 (100.0%) | 117,747 (100.0%) |
Families and Households in Gaston County
Median Family Size in Gaston County
The median family size in Gaston County is 3.06 persons per family, with single female/mother families (12,167 | 20.5%) accounting for the largest median family size of 3.09 persons per family. On the other hand, single male/father families (5,247 | 8.8%) represent the smallest median family size with 2.79 persons per family.
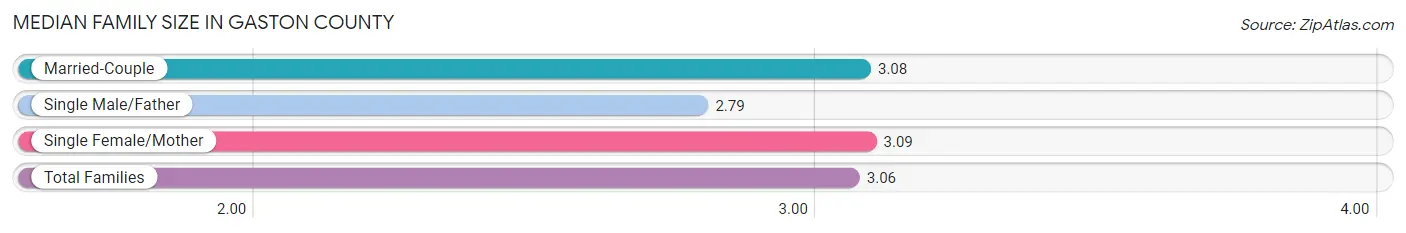
| Family Type | # Families | Family Size |
| Married-Couple | 41,998 (70.7%) | 3.08 |
| Single Male/Father | 5,247 (8.8%) | 2.79 |
| Single Female/Mother | 12,167 (20.5%) | 3.09 |
| Total Families | 59,412 (100.0%) | 3.06 |
Median Household Size in Gaston County
The median household size in Gaston County is 2.50 persons per household, with single female/mother households (12,167 | 13.5%) accounting for the largest median household size of 3.29 persons per household. non-family households (31,015 | 34.3%) represent the smallest median household size with 1.22 persons per household.
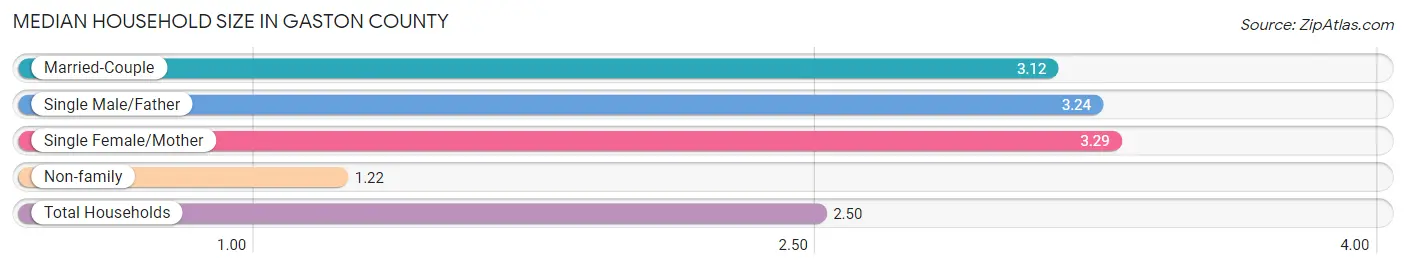
| Household Type | # Households | Household Size |
| Married-Couple | 41,998 (46.4%) | 3.12 |
| Single Male/Father | 5,247 (5.8%) | 3.24 |
| Single Female/Mother | 12,167 (13.5%) | 3.29 |
| Non-family | 31,015 (34.3%) | 1.22 |
| Total Households | 90,427 (100.0%) | 2.50 |
Household Size by Marriage Status in Gaston County
Out of a total of 90,427 households in Gaston County, 59,412 (65.7%) are family households, while 31,015 (34.3%) are nonfamily households. The most numerous type of family households are 2-person households, comprising 26,790, and the most common type of nonfamily households are 1-person households, comprising 25,554.
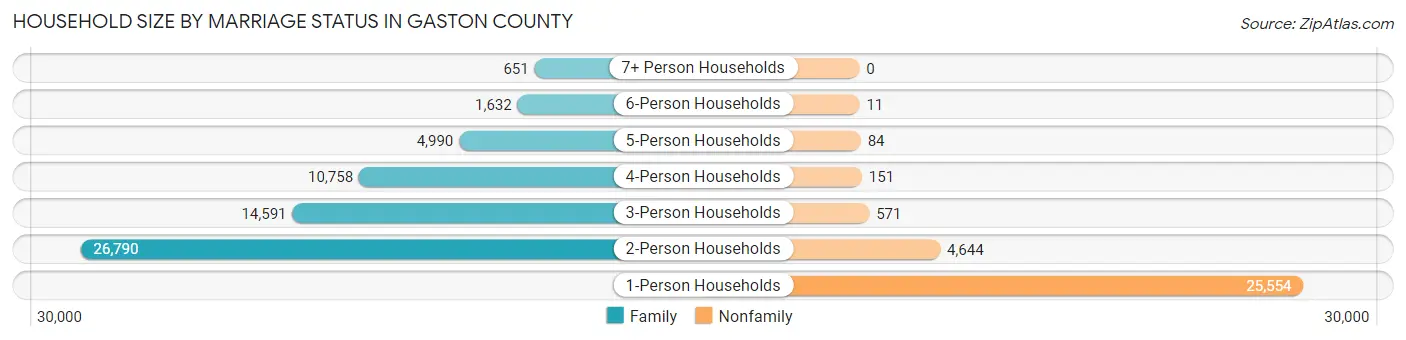
| Household Size | Family Households | Nonfamily Households |
| 1-Person Households | - | 25,554 (28.3%) |
| 2-Person Households | 26,790 (29.6%) | 4,644 (5.1%) |
| 3-Person Households | 14,591 (16.1%) | 571 (0.6%) |
| 4-Person Households | 10,758 (11.9%) | 151 (0.2%) |
| 5-Person Households | 4,990 (5.5%) | 84 (0.1%) |
| 6-Person Households | 1,632 (1.8%) | 11 (0.0%) |
| 7+ Person Households | 651 (0.7%) | 0 (0.0%) |
| Total | 59,412 (65.7%) | 31,015 (34.3%) |
Female Fertility in Gaston County
Fertility by Age in Gaston County
Average fertility rate in Gaston County is 50.0 births per 1,000 women. Women in the age bracket of 20 to 34 years have the highest fertility rate with 95.0 births per 1,000 women. Women in the age bracket of 20 to 34 years acount for 78.1% of all women with births.
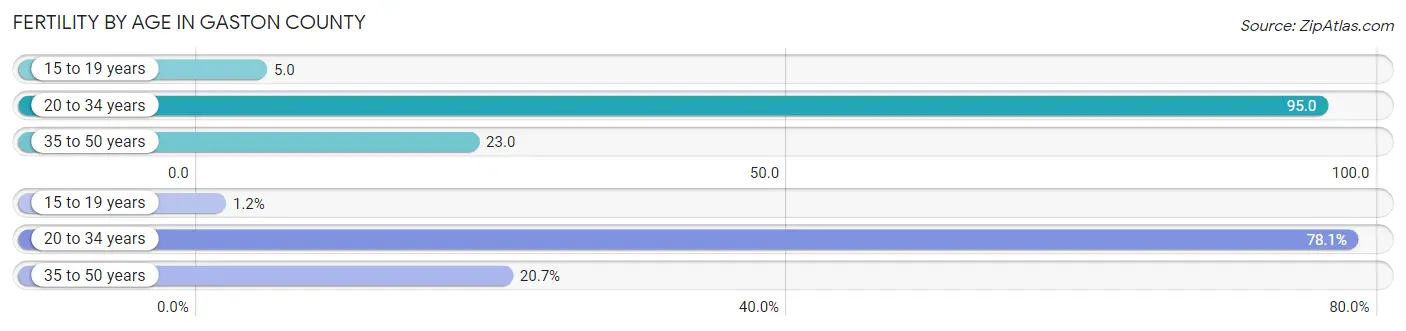
| Age Bracket | Women with Births | Births / 1,000 Women |
| 15 to 19 years | 33 (1.2%) | 5.0 |
| 20 to 34 years | 2,117 (78.1%) | 95.0 |
| 35 to 50 years | 561 (20.7%) | 23.0 |
| Total | 2,711 (100.0%) | 50.0 |
Fertility by Age by Marriage Status in Gaston County
58.5% of women with births (2,711) in Gaston County are married. The highest percentage of unmarried women with births falls into 15 to 19 years age bracket with 100.0% of them unmarried at the time of birth, while the lowest percentage of unmarried women with births belong to 20 to 34 years age bracket with 40.5% of them unmarried.
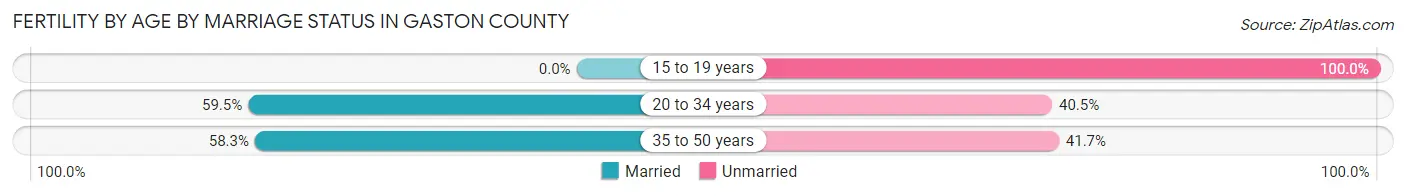
| Age Bracket | Married | Unmarried |
| 15 to 19 years | 0 (0.0%) | 33 (100.0%) |
| 20 to 34 years | 1,260 (59.5%) | 857 (40.5%) |
| 35 to 50 years | 327 (58.3%) | 234 (41.7%) |
| Total | 1,586 (58.5%) | 1,125 (41.5%) |
Fertility by Education in Gaston County
Average fertility rate in Gaston County is 50.0 births per 1,000 women. Women with the education attainment of bachelor's degree have the highest fertility rate of 72.0 births per 1,000 women, while women with the education attainment of less than high school have the lowest fertility at 26.0 births per 1,000 women. Women with the education attainment of college or associate's degree represent 30.8% of all women with births.
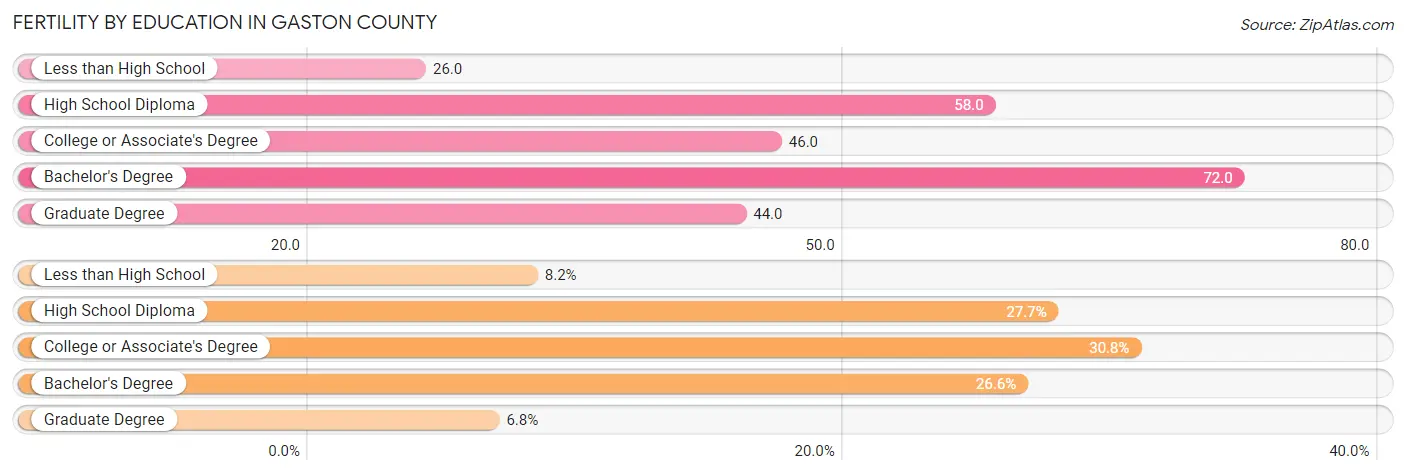
| Educational Attainment | Women with Births | Births / 1,000 Women |
| Less than High School | 222 (8.2%) | 26.0 |
| High School Diploma | 751 (27.7%) | 58.0 |
| College or Associate's Degree | 835 (30.8%) | 46.0 |
| Bachelor's Degree | 720 (26.6%) | 72.0 |
| Graduate Degree | 183 (6.8%) | 44.0 |
| Total | 2,711 (100.0%) | 50.0 |
Fertility by Education by Marriage Status in Gaston County
41.5% of women with births in Gaston County are unmarried. Women with the educational attainment of graduate degree are most likely to be married with 78.7% of them married at childbirth, while women with the educational attainment of high school diploma are least likely to be married with 63.2% of them unmarried at childbirth.
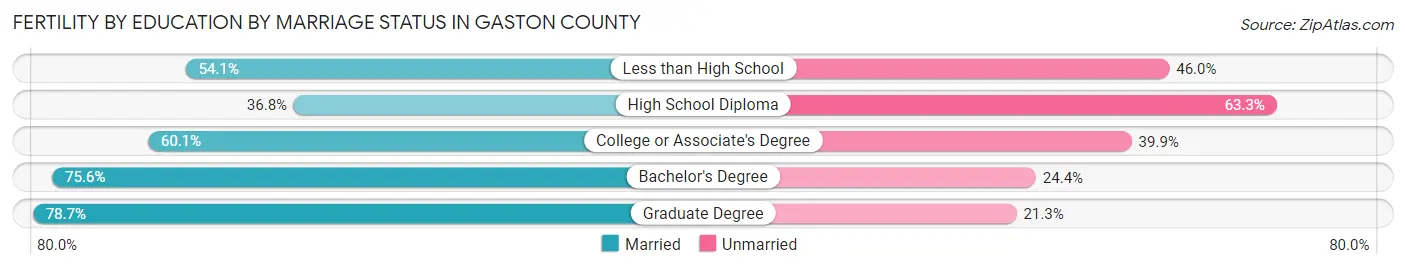
| Educational Attainment | Married | Unmarried |
| Less than High School | 120 (54.0%) | 102 (46.0%) |
| High School Diploma | 276 (36.7%) | 475 (63.2%) |
| College or Associate's Degree | 502 (60.1%) | 333 (39.9%) |
| Bachelor's Degree | 544 (75.6%) | 176 (24.4%) |
| Graduate Degree | 144 (78.7%) | 39 (21.3%) |
| Total | 1,586 (58.5%) | 1,125 (41.5%) |
Income in Gaston County
Income Overview in Gaston County
Per Capita Income in Gaston County is $33,806, while median incomes of families and households are $78,252 and $62,628 respectively.
| Characteristic | Number | Measure |
| Per Capita Income | 228,972 | $33,806 |
| Median Family Income | 59,412 | $78,252 |
| Mean Family Income | 59,412 | $98,209 |
| Median Household Income | 90,427 | $62,628 |
| Mean Household Income | 90,427 | $83,359 |
| Income Deficit | 59,412 | $11,660 |
| Wage / Income Gap (%) | 228,972 | 25.17% |
| Wage / Income Gap ($) | 228,972 | 74.83¢ per $1 |
| Gini / Inequality Index | 228,972 | 0.46 |
Earnings by Sex in Gaston County
Average Earnings in Gaston County are $39,948, $45,556 for men and $34,090 for women, a difference of 25.2%.
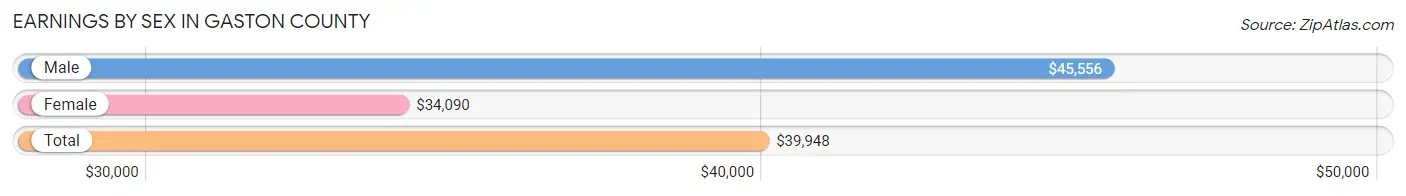
| Sex | Number | Average Earnings |
| Male | 61,719 (51.9%) | $45,556 |
| Female | 57,224 (48.1%) | $34,090 |
| Total | 118,943 (100.0%) | $39,948 |
Earnings by Sex by Income Bracket in Gaston County
The most common earnings brackets in Gaston County are $100,000+ for men (8,151 | 13.2%) and $55,000 to $64,999 for women (4,916 | 8.6%).
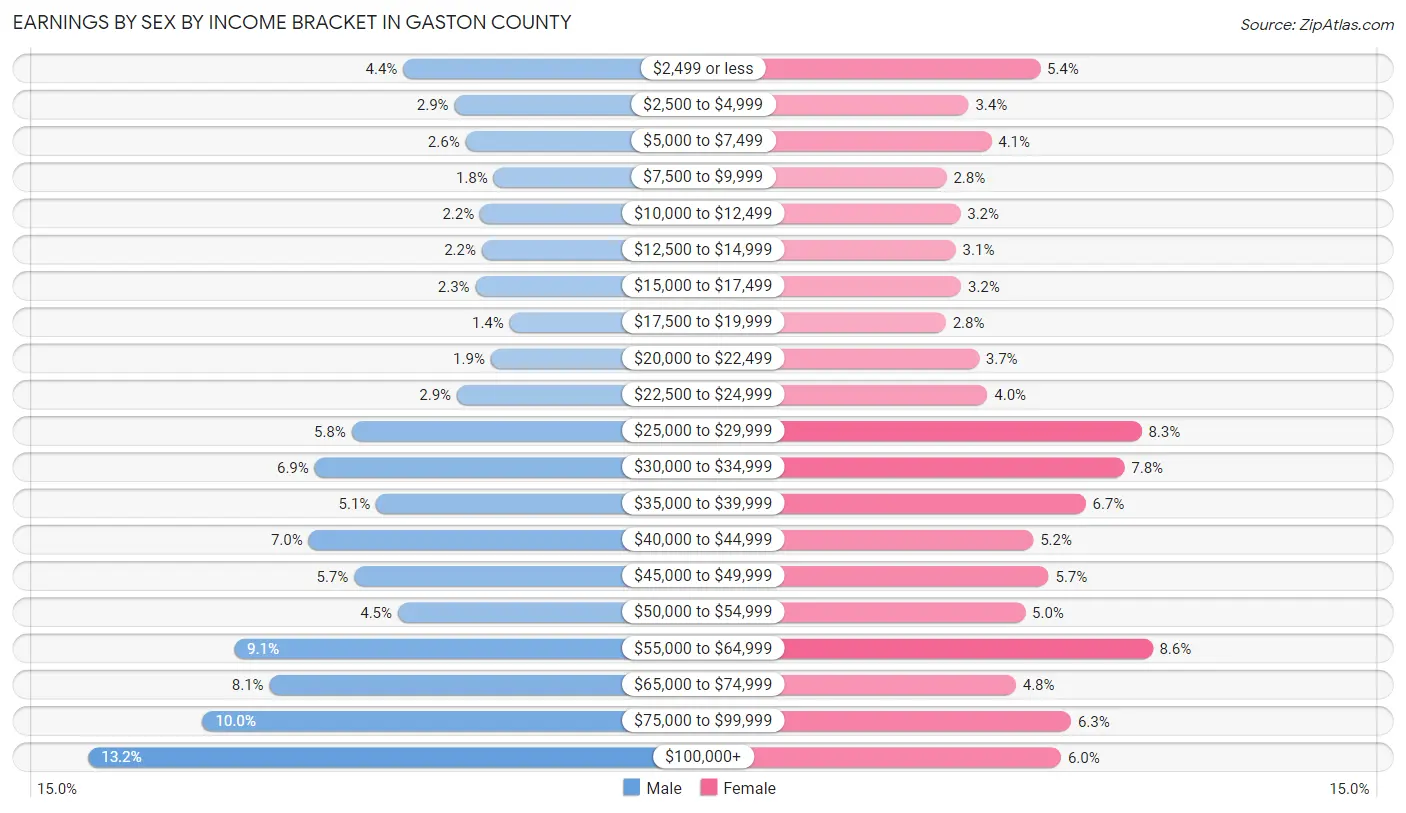
| Income | Male | Female |
| $2,499 or less | 2,694 (4.4%) | 3,110 (5.4%) |
| $2,500 to $4,999 | 1,800 (2.9%) | 1,956 (3.4%) |
| $5,000 to $7,499 | 1,612 (2.6%) | 2,325 (4.1%) |
| $7,500 to $9,999 | 1,125 (1.8%) | 1,601 (2.8%) |
| $10,000 to $12,499 | 1,359 (2.2%) | 1,825 (3.2%) |
| $12,500 to $14,999 | 1,325 (2.1%) | 1,753 (3.1%) |
| $15,000 to $17,499 | 1,435 (2.3%) | 1,837 (3.2%) |
| $17,500 to $19,999 | 846 (1.4%) | 1,592 (2.8%) |
| $20,000 to $22,499 | 1,173 (1.9%) | 2,123 (3.7%) |
| $22,500 to $24,999 | 1,760 (2.9%) | 2,261 (4.0%) |
| $25,000 to $29,999 | 3,585 (5.8%) | 4,740 (8.3%) |
| $30,000 to $34,999 | 4,229 (6.9%) | 4,466 (7.8%) |
| $35,000 to $39,999 | 3,163 (5.1%) | 3,841 (6.7%) |
| $40,000 to $44,999 | 4,332 (7.0%) | 3,000 (5.2%) |
| $45,000 to $49,999 | 3,540 (5.7%) | 3,243 (5.7%) |
| $50,000 to $54,999 | 2,783 (4.5%) | 2,866 (5.0%) |
| $55,000 to $64,999 | 5,620 (9.1%) | 4,916 (8.6%) |
| $65,000 to $74,999 | 5,014 (8.1%) | 2,720 (4.8%) |
| $75,000 to $99,999 | 6,173 (10.0%) | 3,604 (6.3%) |
| $100,000+ | 8,151 (13.2%) | 3,445 (6.0%) |
| Total | 61,719 (100.0%) | 57,224 (100.0%) |
Earnings by Sex by Educational Attainment in Gaston County
Average earnings in Gaston County are $50,728 for men and $37,918 for women, a difference of 25.3%. Men with an educational attainment of graduate degree enjoy the highest average annual earnings of $81,667, while those with less than high school education earn the least with $33,853. Women with an educational attainment of graduate degree earn the most with the average annual earnings of $63,527, while those with less than high school education have the smallest earnings of $21,333.
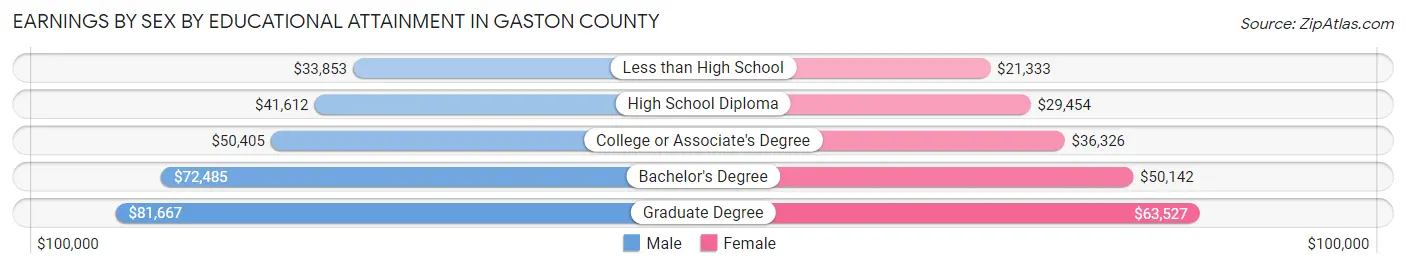
| Educational Attainment | Male Income | Female Income |
| Less than High School | $33,853 | $21,333 |
| High School Diploma | $41,612 | $29,454 |
| College or Associate's Degree | $50,405 | $36,326 |
| Bachelor's Degree | $72,485 | $50,142 |
| Graduate Degree | $81,667 | $63,527 |
| Total | $50,728 | $37,918 |
Family Income in Gaston County
Family Income Brackets in Gaston County
According to the Gaston County family income data, there are 11,882 families falling into the $100,000 to $149,999 income range, which is the most common income bracket and makes up 20.0% of all families. Conversely, the $10,000 to $14,999 income bracket is the least frequent group with only 772 families (1.3%) belonging to this category.
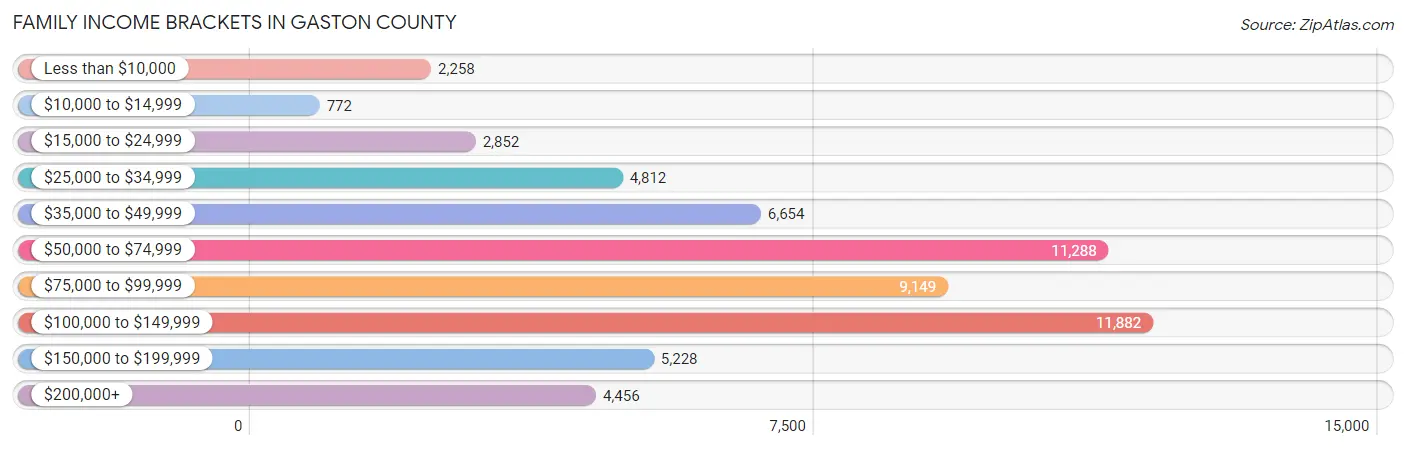
| Income Bracket | # Families | % Families |
| Less than $10,000 | 2,258 | 3.8% |
| $10,000 to $14,999 | 772 | 1.3% |
| $15,000 to $24,999 | 2,852 | 4.8% |
| $25,000 to $34,999 | 4,812 | 8.1% |
| $35,000 to $49,999 | 6,654 | 11.2% |
| $50,000 to $74,999 | 11,288 | 19.0% |
| $75,000 to $99,999 | 9,149 | 15.4% |
| $100,000 to $149,999 | 11,882 | 20.0% |
| $150,000 to $199,999 | 5,228 | 8.8% |
| $200,000+ | 4,456 | 7.5% |
Family Income by Famaliy Size in Gaston County
5-person families (4,216 | 7.1%) account for the highest median family income in Gaston County with $103,500 per family, while 2-person families (28,914 | 48.7%) have the highest median income of $34,066 per family member.
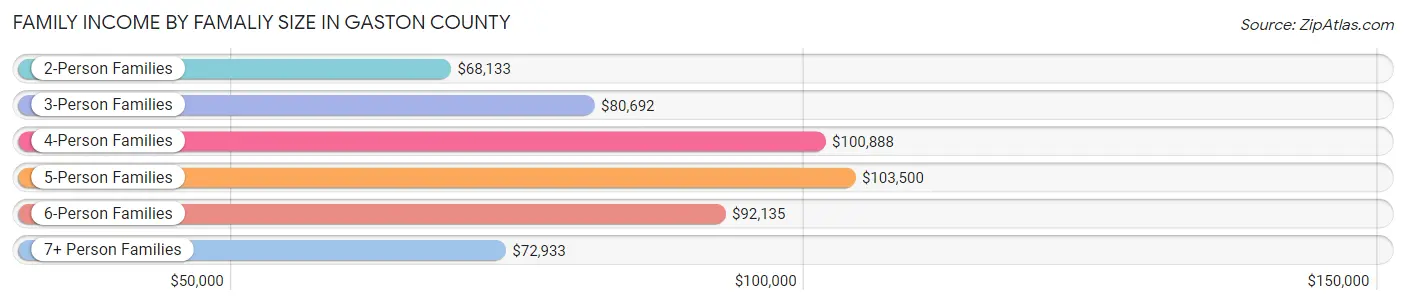
| Income Bracket | # Families | Median Income |
| 2-Person Families | 28,914 (48.7%) | $68,133 |
| 3-Person Families | 14,308 (24.1%) | $80,692 |
| 4-Person Families | 10,055 (16.9%) | $100,888 |
| 5-Person Families | 4,216 (7.1%) | $103,500 |
| 6-Person Families | 1,398 (2.4%) | $92,135 |
| 7+ Person Families | 521 (0.9%) | $72,933 |
| Total | 59,412 (100.0%) | $78,252 |
Family Income by Number of Earners in Gaston County
The median family income in Gaston County is $78,252, with families comprising 3+ earners (6,289) having the highest median family income of $127,626, while families with no earners (8,906) have the lowest median family income of $37,995, accounting for 10.6% and 15.0% of families, respectively.
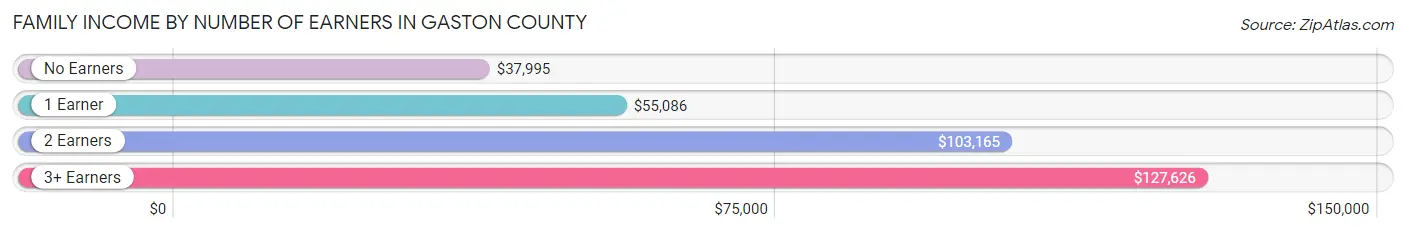
| Number of Earners | # Families | Median Income |
| No Earners | 8,906 (15.0%) | $37,995 |
| 1 Earner | 20,206 (34.0%) | $55,086 |
| 2 Earners | 24,011 (40.4%) | $103,165 |
| 3+ Earners | 6,289 (10.6%) | $127,626 |
| Total | 59,412 (100.0%) | $78,252 |
Household Income in Gaston County
Household Income Brackets in Gaston County
With 16,186 households falling in the category, the $50,000 to $74,999 income range is the most frequent in Gaston County, accounting for 17.9% of all households. In contrast, only 4,069 households (4.5%) fall into the $10,000 to $14,999 income bracket, making it the least populous group.
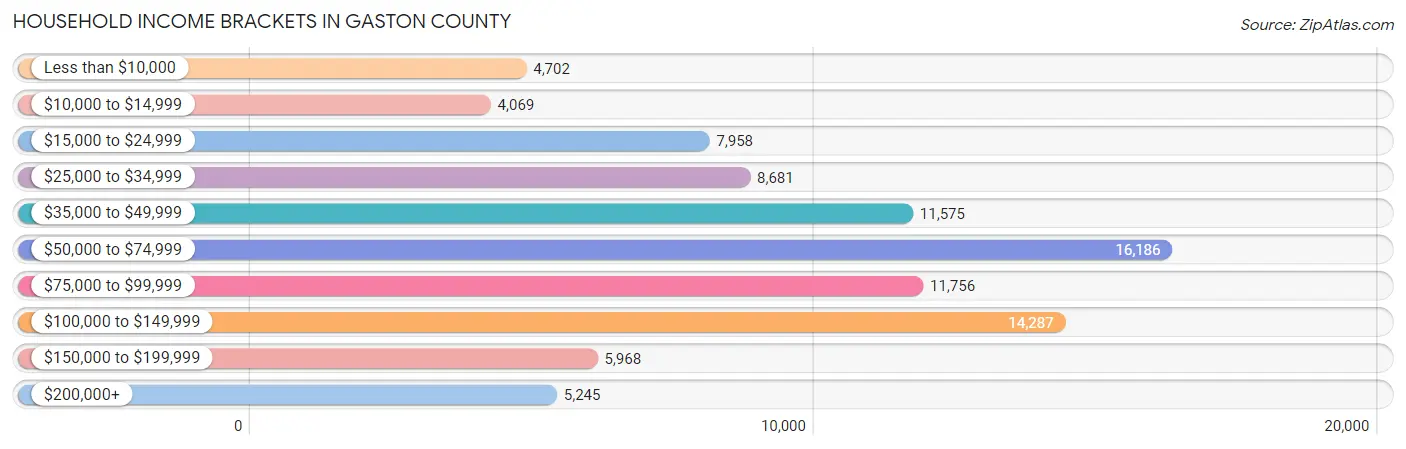
| Income Bracket | # Households | % Households |
| Less than $10,000 | 4,702 | 5.2% |
| $10,000 to $14,999 | 4,069 | 4.5% |
| $15,000 to $24,999 | 7,958 | 8.8% |
| $25,000 to $34,999 | 8,681 | 9.6% |
| $35,000 to $49,999 | 11,575 | 12.8% |
| $50,000 to $74,999 | 16,186 | 17.9% |
| $75,000 to $99,999 | 11,756 | 13.0% |
| $100,000 to $149,999 | 14,287 | 15.8% |
| $150,000 to $199,999 | 5,968 | 6.6% |
| $200,000+ | 5,245 | 5.8% |
Household Income by Householder Age in Gaston County
The median household income in Gaston County is $62,628, with the highest median household income of $73,806 found in the 45 to 64 years age bracket for the primary householder. A total of 34,916 households (38.6%) fall into this category. Meanwhile, the 65+ years age bracket for the primary householder has the lowest median household income of $40,125, with 24,200 households (26.8%) in this group.
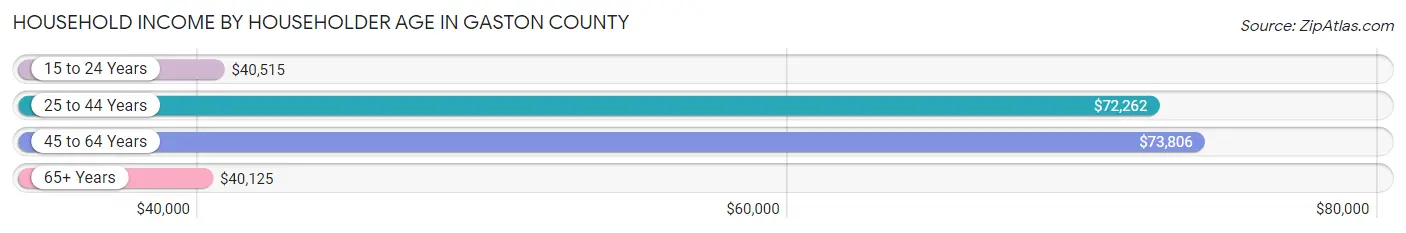
| Income Bracket | # Households | Median Income |
| 15 to 24 Years | 2,855 (3.2%) | $40,515 |
| 25 to 44 Years | 28,456 (31.5%) | $72,262 |
| 45 to 64 Years | 34,916 (38.6%) | $73,806 |
| 65+ Years | 24,200 (26.8%) | $40,125 |
| Total | 90,427 (100.0%) | $62,628 |
Poverty in Gaston County
Income Below Poverty by Sex and Age in Gaston County
With 10.8% poverty level for males and 14.0% for females among the residents of Gaston County, under 5 year old males and under 5 year old females are the most vulnerable to poverty, with 1,266 males (19.5%) and 1,462 females (23.6%) in their respective age groups living below the poverty level.
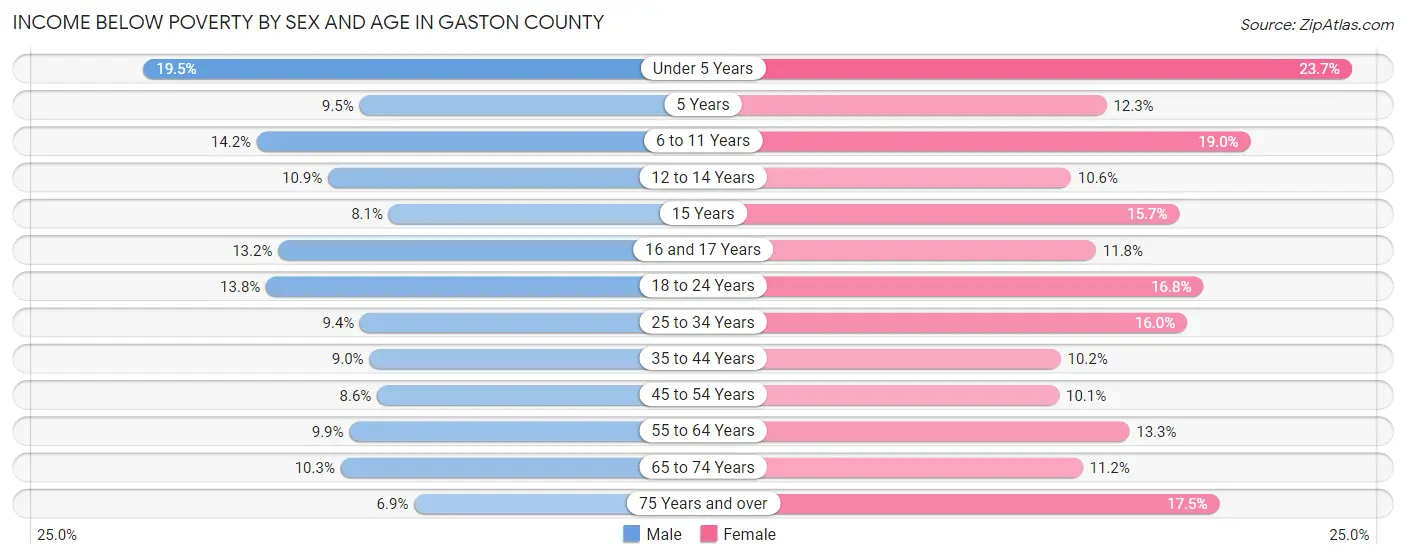
| Age Bracket | Male | Female |
| Under 5 Years | 1,266 (19.5%) | 1,462 (23.6%) |
| 5 Years | 138 (9.5%) | 178 (12.3%) |
| 6 to 11 Years | 1,198 (14.2%) | 1,399 (19.0%) |
| 12 to 14 Years | 478 (10.9%) | 520 (10.6%) |
| 15 Years | 107 (8.1%) | 238 (15.7%) |
| 16 and 17 Years | 444 (13.2%) | 338 (11.8%) |
| 18 to 24 Years | 1,303 (13.8%) | 1,465 (16.8%) |
| 25 to 34 Years | 1,400 (9.4%) | 2,513 (16.0%) |
| 35 to 44 Years | 1,212 (9.0%) | 1,501 (10.2%) |
| 45 to 54 Years | 1,340 (8.6%) | 1,629 (10.1%) |
| 55 to 64 Years | 1,462 (9.9%) | 2,070 (13.3%) |
| 65 to 74 Years | 1,043 (10.3%) | 1,340 (11.2%) |
| 75 Years and over | 385 (6.9%) | 1,536 (17.5%) |
| Total | 11,776 (10.8%) | 16,189 (14.0%) |
Income Above Poverty by Sex and Age in Gaston County
According to the poverty statistics in Gaston County, males aged 75 years and over and females aged 45 to 54 years are the age groups that are most secure financially, with 93.1% of males and 89.9% of females in these age groups living above the poverty line.
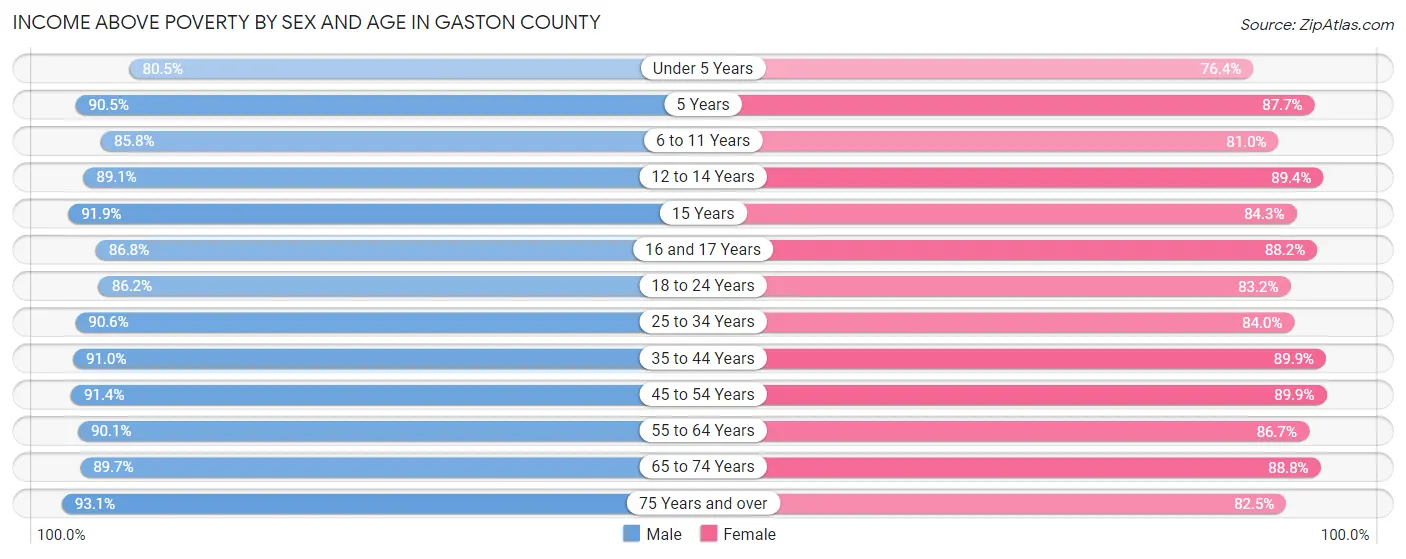
| Age Bracket | Male | Female |
| Under 5 Years | 5,231 (80.5%) | 4,719 (76.3%) |
| 5 Years | 1,321 (90.5%) | 1,271 (87.7%) |
| 6 to 11 Years | 7,229 (85.8%) | 5,980 (81.0%) |
| 12 to 14 Years | 3,901 (89.1%) | 4,374 (89.4%) |
| 15 Years | 1,214 (91.9%) | 1,282 (84.3%) |
| 16 and 17 Years | 2,913 (86.8%) | 2,529 (88.2%) |
| 18 to 24 Years | 8,149 (86.2%) | 7,272 (83.2%) |
| 25 to 34 Years | 13,448 (90.6%) | 13,171 (84.0%) |
| 35 to 44 Years | 12,261 (91.0%) | 13,280 (89.8%) |
| 45 to 54 Years | 14,176 (91.4%) | 14,539 (89.9%) |
| 55 to 64 Years | 13,263 (90.1%) | 13,447 (86.7%) |
| 65 to 74 Years | 9,051 (89.7%) | 10,659 (88.8%) |
| 75 Years and over | 5,175 (93.1%) | 7,230 (82.5%) |
| Total | 97,332 (89.2%) | 99,753 (86.0%) |
Income Below Poverty Among Married-Couple Families in Gaston County
The poverty statistics for married-couple families in Gaston County show that 4.5% or 1,896 of the total 41,998 families live below the poverty line. Families with 3 or 4 children have the highest poverty rate of 9.5%, comprising of 252 families. On the other hand, families with no children have the lowest poverty rate of 3.5%, which includes 899 families.
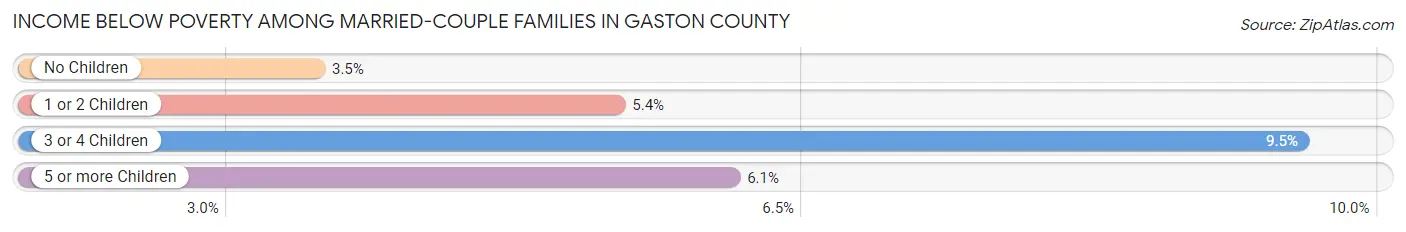
| Children | Above Poverty | Below Poverty |
| No Children | 24,580 (96.5%) | 899 (3.5%) |
| 1 or 2 Children | 13,006 (94.6%) | 737 (5.4%) |
| 3 or 4 Children | 2,392 (90.5%) | 252 (9.5%) |
| 5 or more Children | 124 (93.9%) | 8 (6.1%) |
| Total | 40,102 (95.5%) | 1,896 (4.5%) |
Income Below Poverty Among Single-Parent Households in Gaston County
According to the poverty data in Gaston County, 13.1% or 685 single-father households and 20.8% or 2,536 single-mother households are living below the poverty line. Among single-father households, those with 3 or 4 children have the highest poverty rate, with 113 households (30.0%) experiencing poverty. Likewise, among single-mother households, those with 5 or more children have the highest poverty rate, with 103 households (60.6%) falling below the poverty line.
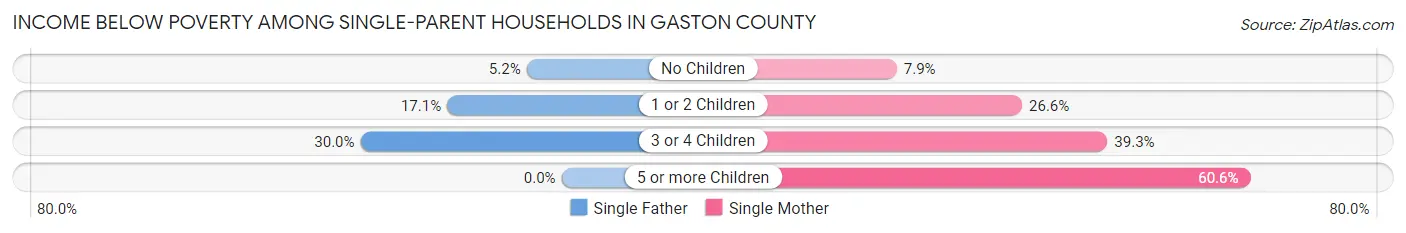
| Children | Single Father | Single Mother |
| No Children | 113 (5.2%) | 360 (7.9%) |
| 1 or 2 Children | 459 (17.1%) | 1,794 (26.6%) |
| 3 or 4 Children | 113 (30.0%) | 279 (39.3%) |
| 5 or more Children | 0 (0.0%) | 103 (60.6%) |
| Total | 685 (13.1%) | 2,536 (20.8%) |
Income Below Poverty Among Married-Couple vs Single-Parent Households in Gaston County
The poverty data for Gaston County shows that 1,896 of the married-couple family households (4.5%) and 3,221 of the single-parent households (18.5%) are living below the poverty level. Within the married-couple family households, those with 3 or 4 children have the highest poverty rate, with 252 households (9.5%) falling below the poverty line. Among the single-parent households, those with 5 or more children have the highest poverty rate, with 103 household (56.6%) living below poverty.
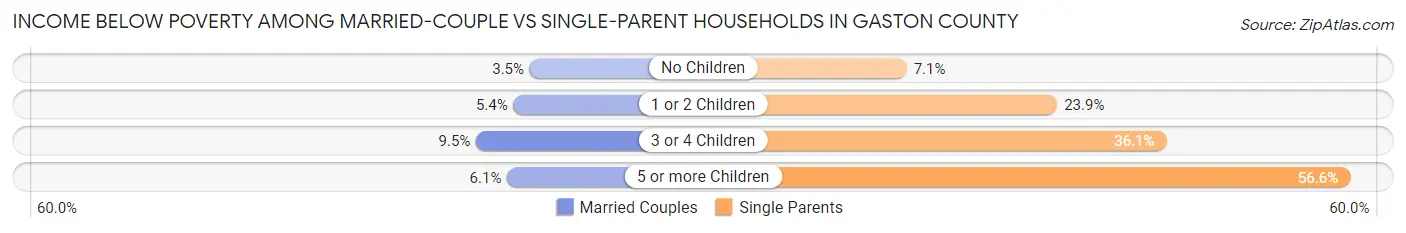
| Children | Married-Couple Families | Single-Parent Households |
| No Children | 899 (3.5%) | 473 (7.0%) |
| 1 or 2 Children | 737 (5.4%) | 2,253 (23.9%) |
| 3 or 4 Children | 252 (9.5%) | 392 (36.1%) |
| 5 or more Children | 8 (6.1%) | 103 (56.6%) |
| Total | 1,896 (4.5%) | 3,221 (18.5%) |
Employment Characteristics in Gaston County
Employment by Class of Employer in Gaston County
Among the 106,701 employed individuals in Gaston County, private company employees (79,652 | 74.7%), not-for-profit organizations (7,825 | 7.3%), and local government employees (6,861 | 6.4%) make up the most common classes of employment.
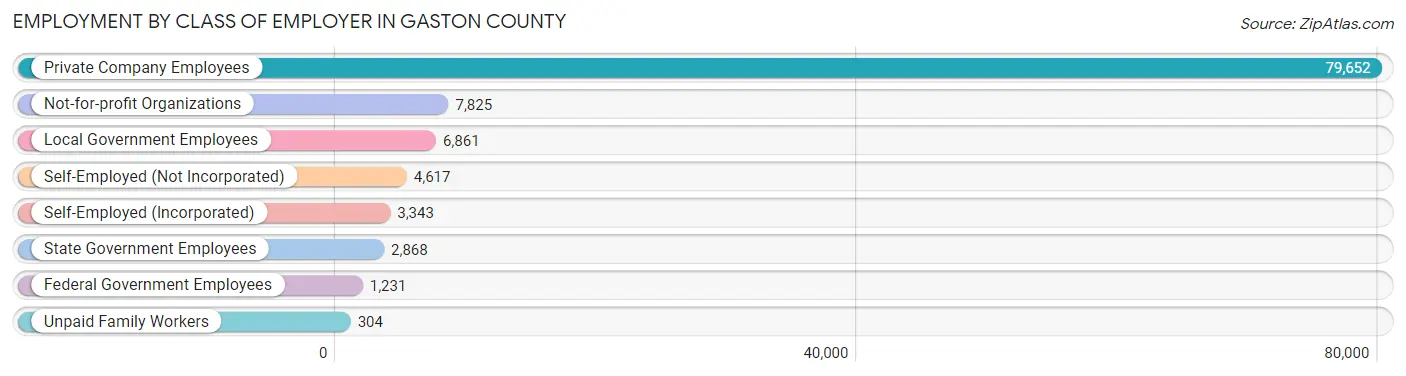
| Employer Class | # Employees | % Employees |
| Private Company Employees | 79,652 | 74.7% |
| Self-Employed (Incorporated) | 3,343 | 3.1% |
| Self-Employed (Not Incorporated) | 4,617 | 4.3% |
| Not-for-profit Organizations | 7,825 | 7.3% |
| Local Government Employees | 6,861 | 6.4% |
| State Government Employees | 2,868 | 2.7% |
| Federal Government Employees | 1,231 | 1.1% |
| Unpaid Family Workers | 304 | 0.3% |
| Total | 106,701 | 100.0% |
Employment Status by Age in Gaston County
According to the labor force statistics for Gaston County, out of the total population over 16 years of age (184,081), 62.5% or 115,051 individuals are in the labor force, with 4.9% or 5,637 of them unemployed. The age group with the highest labor force participation rate is 25 to 29 years, with 87.3% or 13,251 individuals in the labor force. Within the labor force, the 16 to 19 years age range has the highest percentage of unemployed individuals, with 12.7% or 563 of them being unemployed.
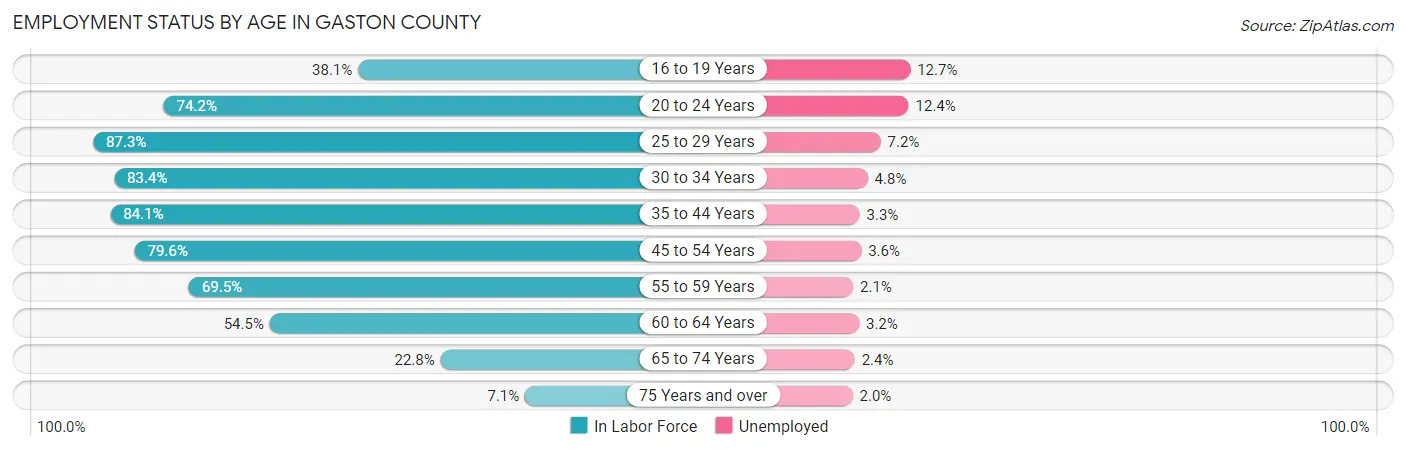
| Age Bracket | In Labor Force | Unemployed |
| 16 to 19 Years | 4,434 (38.1%) | 563 (12.7%) |
| 20 to 24 Years | 9,984 (74.2%) | 1,238 (12.4%) |
| 25 to 29 Years | 13,251 (87.3%) | 954 (7.2%) |
| 30 to 34 Years | 12,985 (83.4%) | 623 (4.8%) |
| 35 to 44 Years | 23,986 (84.1%) | 792 (3.3%) |
| 45 to 54 Years | 25,391 (79.6%) | 914 (3.6%) |
| 55 to 59 Years | 11,066 (69.5%) | 232 (2.1%) |
| 60 to 64 Years | 7,881 (54.5%) | 252 (3.2%) |
| 65 to 74 Years | 5,094 (22.8%) | 122 (2.4%) |
| 75 Years and over | 1,072 (7.1%) | 21 (2.0%) |
| Total | 115,051 (62.5%) | 5,637 (4.9%) |
Employment Status by Educational Attainment in Gaston County
According to labor force statistics for Gaston County, 77.8% of individuals (94,565) out of the total population between 25 and 64 years of age (121,549) are in the labor force, with 4.0% or 3,783 of them being unemployed. The group with the highest labor force participation rate are those with the educational attainment of bachelor's degree or higher, with 88.9% or 28,789 individuals in the labor force. Within the labor force, individuals with less than high school education have the highest percentage of unemployment, with 10.6% or 801 of them being unemployed.
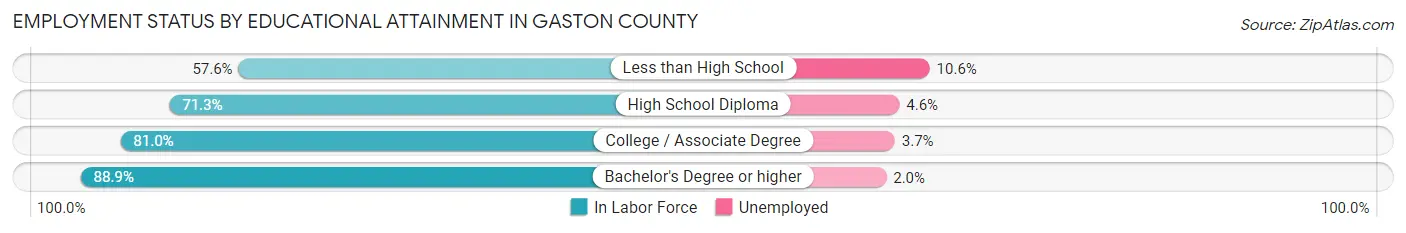
| Educational Attainment | In Labor Force | Unemployed |
| Less than High School | 7,555 (57.6%) | 1,390 (10.6%) |
| High School Diploma | 24,961 (71.3%) | 1,610 (4.6%) |
| College / Associate Degree | 33,242 (81.0%) | 1,518 (3.7%) |
| Bachelor's Degree or higher | 28,789 (88.9%) | 648 (2.0%) |
| Total | 94,565 (77.8%) | 4,862 (4.0%) |
Employment Occupations by Sex in Gaston County
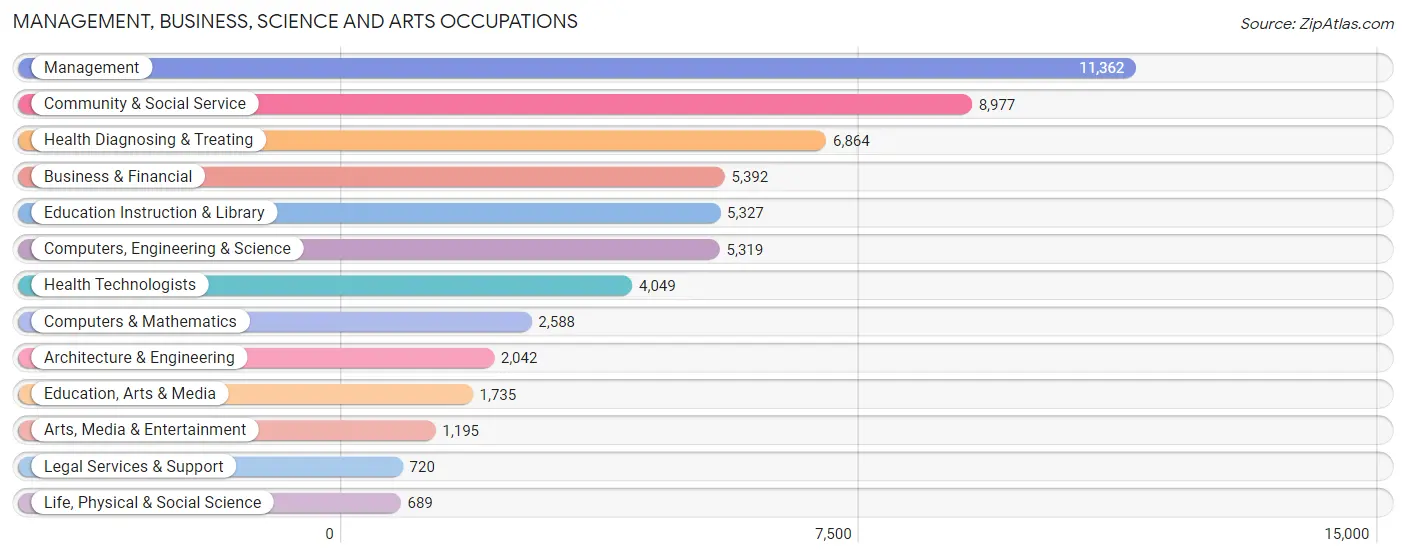
Management, Business, Science and Arts Occupations
The most common Management, Business, Science and Arts occupations in Gaston County are Management (11,362 | 10.4%), Community & Social Service (8,977 | 8.2%), Health Diagnosing & Treating (6,864 | 6.3%), Business & Financial (5,392 | 4.9%), and Education Instruction & Library (5,327 | 4.9%).
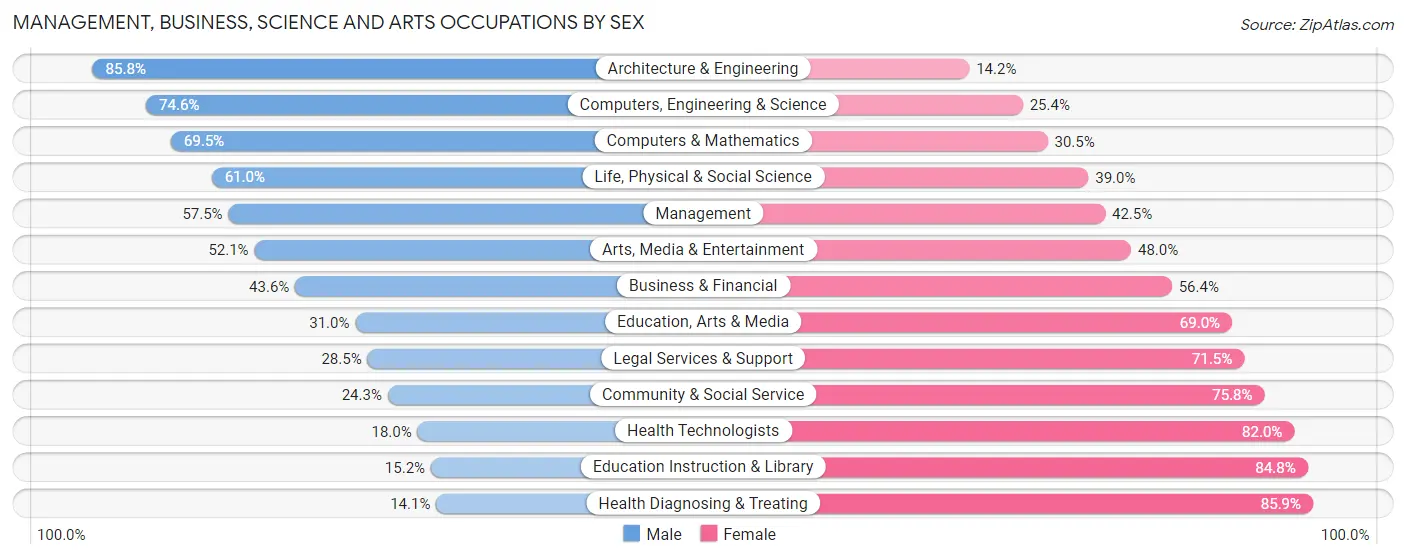
Management, Business, Science and Arts Occupations by Sex
Within the Management, Business, Science and Arts occupations in Gaston County, the most male-oriented occupations are Architecture & Engineering (85.8%), Computers, Engineering & Science (74.6%), and Computers & Mathematics (69.5%), while the most female-oriented occupations are Health Diagnosing & Treating (85.9%), Education Instruction & Library (84.8%), and Health Technologists (82.0%).
| Occupation | Male | Female |
| Management | 6,531 (57.5%) | 4,831 (42.5%) |
| Business & Financial | 2,349 (43.6%) | 3,043 (56.4%) |
| Computers, Engineering & Science | 3,970 (74.6%) | 1,349 (25.4%) |
| Computers & Mathematics | 1,798 (69.5%) | 790 (30.5%) |
| Architecture & Engineering | 1,752 (85.8%) | 290 (14.2%) |
| Life, Physical & Social Science | 420 (61.0%) | 269 (39.0%) |
| Community & Social Service | 2,177 (24.2%) | 6,800 (75.7%) |
| Education, Arts & Media | 538 (31.0%) | 1,197 (69.0%) |
| Legal Services & Support | 205 (28.5%) | 515 (71.5%) |
| Education Instruction & Library | 812 (15.2%) | 4,515 (84.8%) |
| Arts, Media & Entertainment | 622 (52.0%) | 573 (47.9%) |
| Health Diagnosing & Treating | 970 (14.1%) | 5,894 (85.9%) |
| Health Technologists | 730 (18.0%) | 3,319 (82.0%) |
| Total (Category) | 15,997 (42.2%) | 21,917 (57.8%) |
| Total (Overall) | 56,933 (52.2%) | 52,200 (47.8%) |
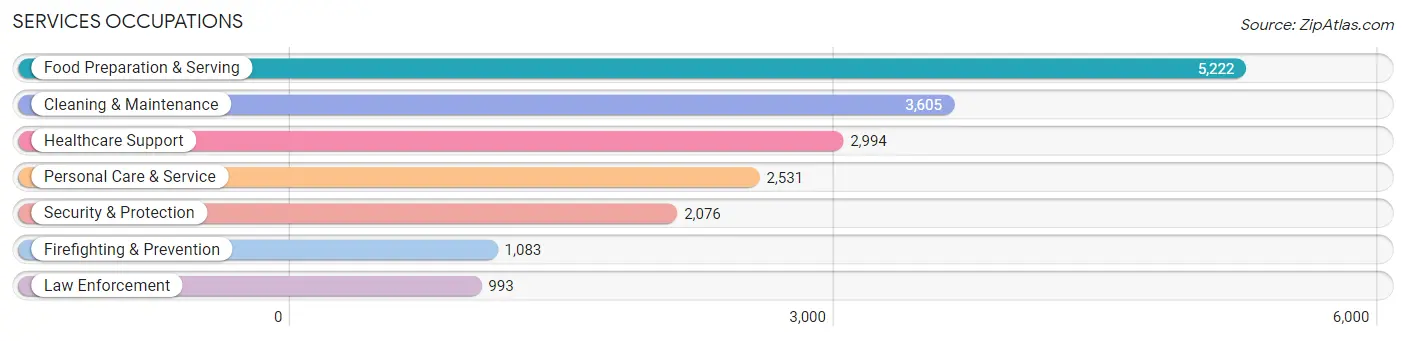
Services Occupations
The most common Services occupations in Gaston County are Food Preparation & Serving (5,222 | 4.8%), Cleaning & Maintenance (3,605 | 3.3%), Healthcare Support (2,994 | 2.7%), Personal Care & Service (2,531 | 2.3%), and Security & Protection (2,076 | 1.9%).
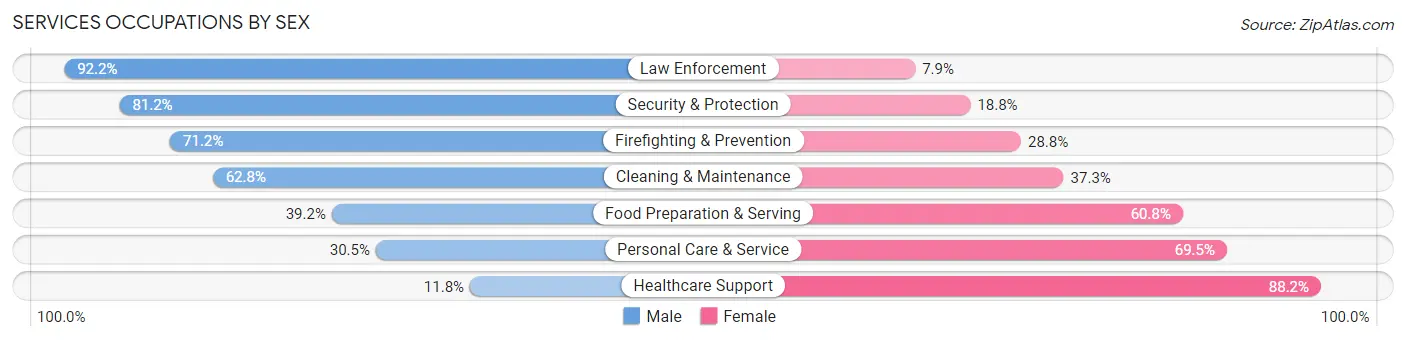
Services Occupations by Sex
Within the Services occupations in Gaston County, the most male-oriented occupations are Law Enforcement (92.1%), Security & Protection (81.2%), and Firefighting & Prevention (71.2%), while the most female-oriented occupations are Healthcare Support (88.2%), Personal Care & Service (69.5%), and Food Preparation & Serving (60.8%).
| Occupation | Male | Female |
| Healthcare Support | 354 (11.8%) | 2,640 (88.2%) |
| Security & Protection | 1,686 (81.2%) | 390 (18.8%) |
| Firefighting & Prevention | 771 (71.2%) | 312 (28.8%) |
| Law Enforcement | 915 (92.1%) | 78 (7.9%) |
| Food Preparation & Serving | 2,046 (39.2%) | 3,176 (60.8%) |
| Cleaning & Maintenance | 2,262 (62.7%) | 1,343 (37.2%) |
| Personal Care & Service | 771 (30.5%) | 1,760 (69.5%) |
| Total (Category) | 7,119 (43.3%) | 9,309 (56.7%) |
| Total (Overall) | 56,933 (52.2%) | 52,200 (47.8%) |
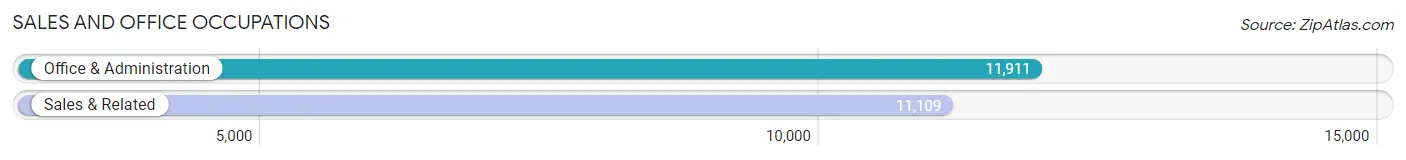
Sales and Office Occupations
The most common Sales and Office occupations in Gaston County are Office & Administration (11,911 | 10.9%), and Sales & Related (11,109 | 10.2%).
Sales and Office Occupations by Sex
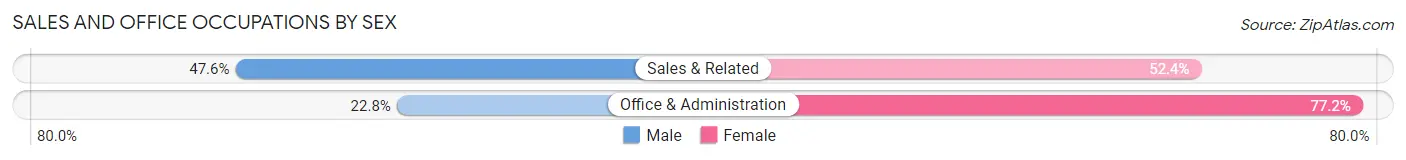
| Occupation | Male | Female |
| Sales & Related | 5,286 (47.6%) | 5,823 (52.4%) |
| Office & Administration | 2,711 (22.8%) | 9,200 (77.2%) |
| Total (Category) | 7,997 (34.7%) | 15,023 (65.3%) |
| Total (Overall) | 56,933 (52.2%) | 52,200 (47.8%) |
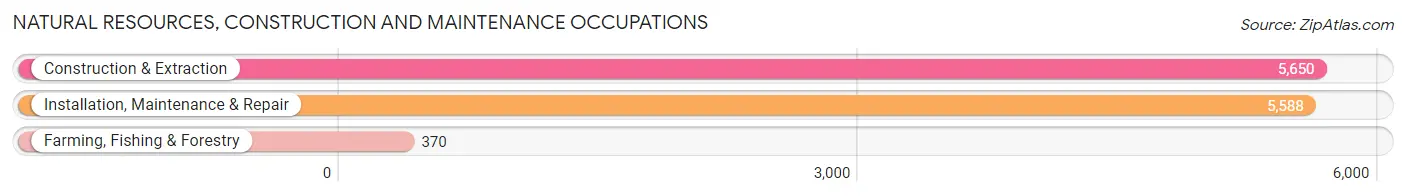
Natural Resources, Construction and Maintenance Occupations
The most common Natural Resources, Construction and Maintenance occupations in Gaston County are Construction & Extraction (5,650 | 5.2%), Installation, Maintenance & Repair (5,588 | 5.1%), and Farming, Fishing & Forestry (370 | 0.3%).
Natural Resources, Construction and Maintenance Occupations by Sex
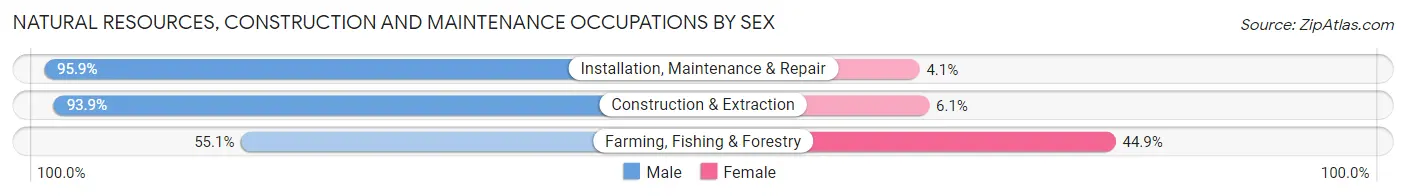
| Occupation | Male | Female |
| Farming, Fishing & Forestry | 204 (55.1%) | 166 (44.9%) |
| Construction & Extraction | 5,307 (93.9%) | 343 (6.1%) |
| Installation, Maintenance & Repair | 5,361 (95.9%) | 227 (4.1%) |
| Total (Category) | 10,872 (93.7%) | 736 (6.3%) |
| Total (Overall) | 56,933 (52.2%) | 52,200 (47.8%) |
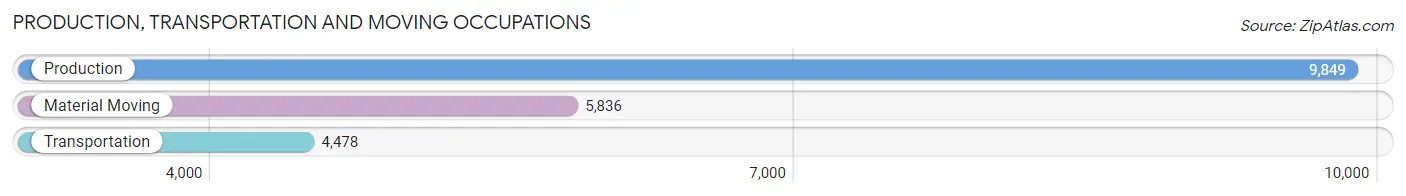
Production, Transportation and Moving Occupations
The most common Production, Transportation and Moving occupations in Gaston County are Production (9,849 | 9.0%), Material Moving (5,836 | 5.3%), and Transportation (4,478 | 4.1%).
Production, Transportation and Moving Occupations by Sex
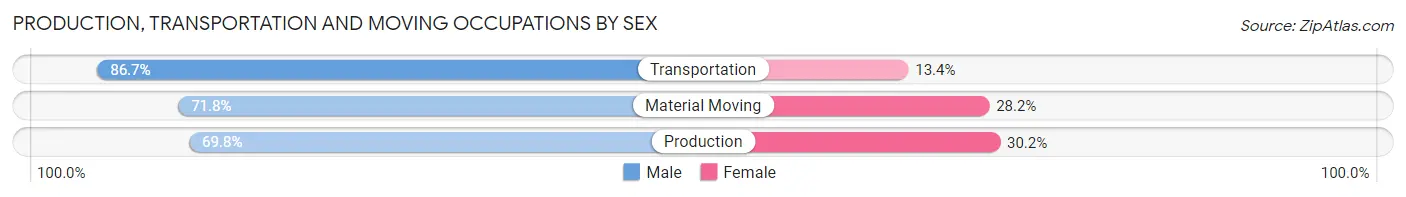
| Occupation | Male | Female |
| Production | 6,877 (69.8%) | 2,972 (30.2%) |
| Transportation | 3,880 (86.7%) | 598 (13.4%) |
| Material Moving | 4,191 (71.8%) | 1,645 (28.2%) |
| Total (Category) | 14,948 (74.1%) | 5,215 (25.9%) |
| Total (Overall) | 56,933 (52.2%) | 52,200 (47.8%) |
Employment Industries by Sex in Gaston County
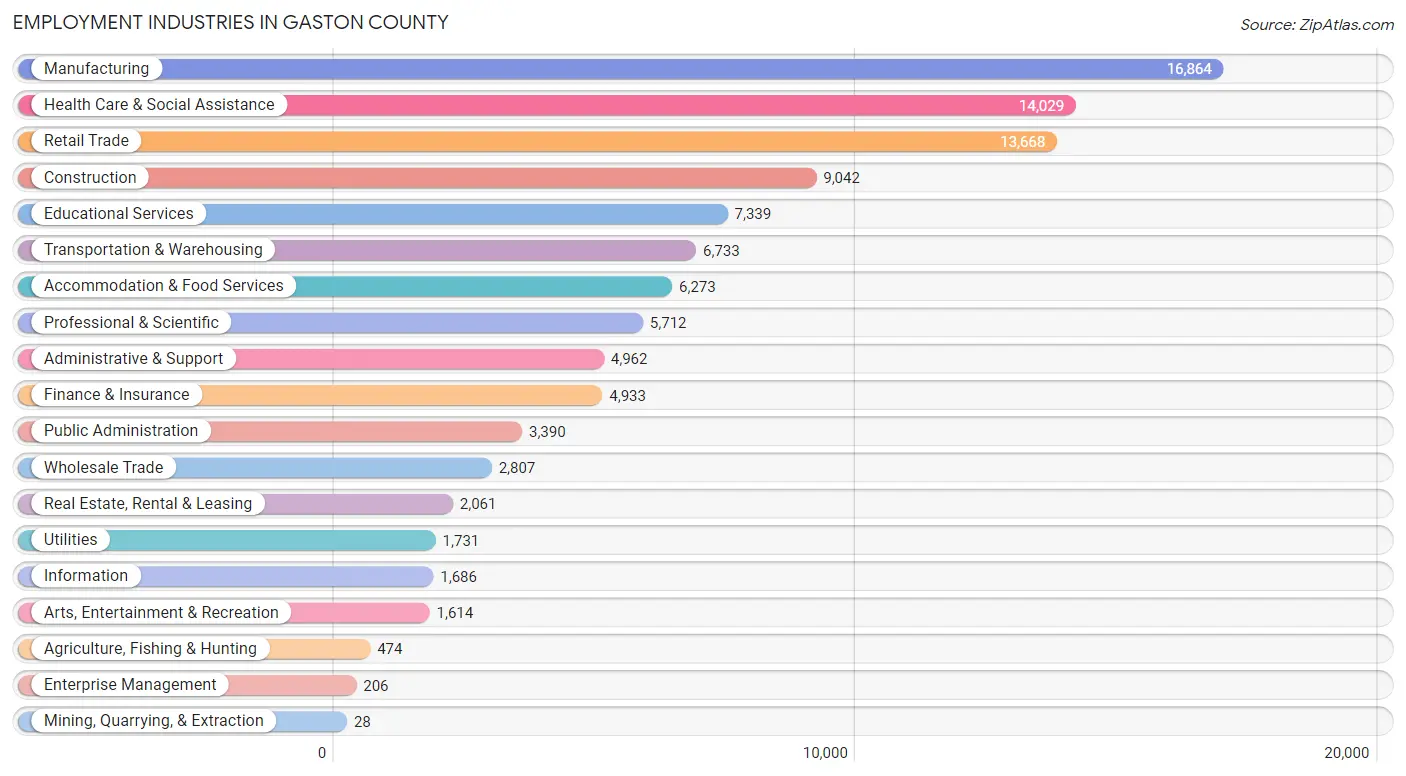
Employment Industries in Gaston County
The major employment industries in Gaston County include Manufacturing (16,864 | 15.4%), Health Care & Social Assistance (14,029 | 12.9%), Retail Trade (13,668 | 12.5%), Construction (9,042 | 8.3%), and Educational Services (7,339 | 6.7%).
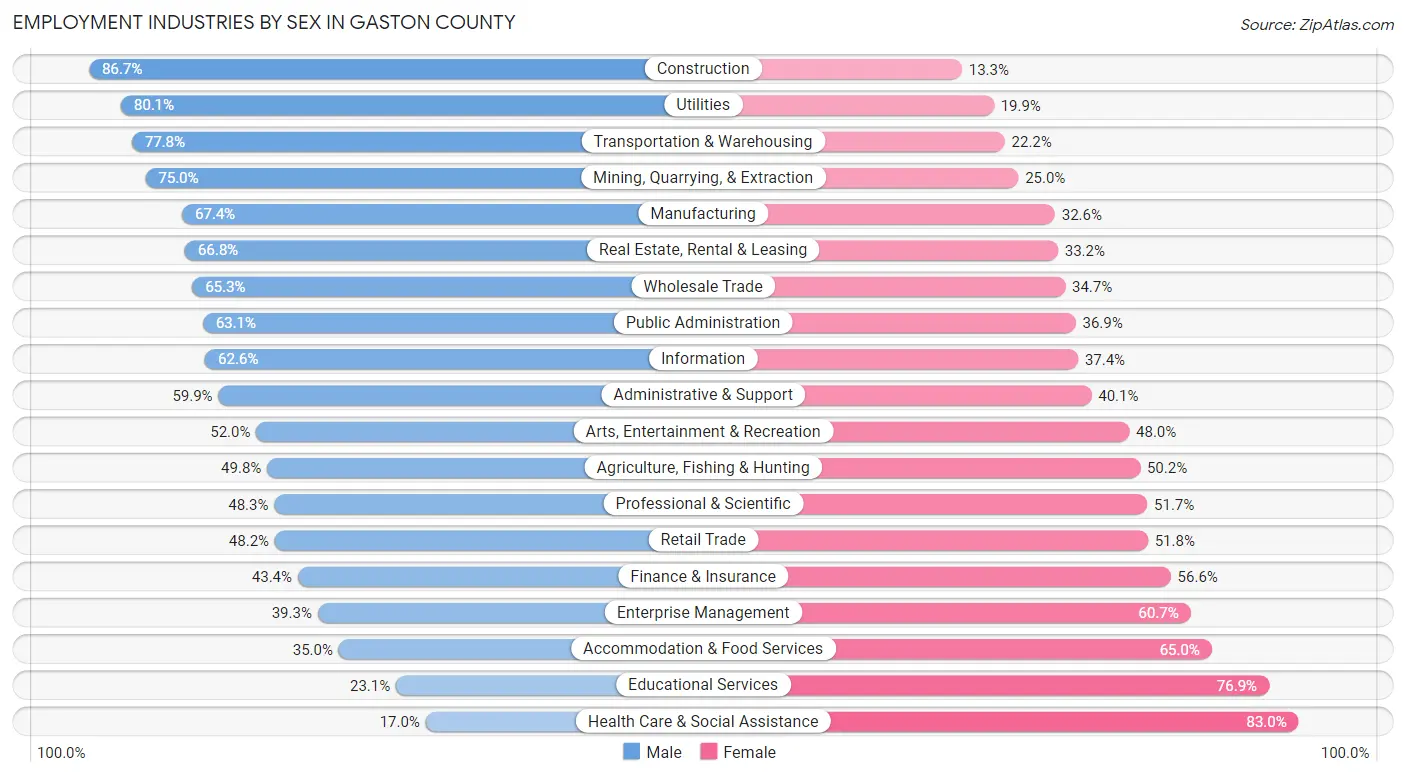
Employment Industries by Sex in Gaston County
The Gaston County industries that see more men than women are Construction (86.7%), Utilities (80.1%), and Transportation & Warehousing (77.8%), whereas the industries that tend to have a higher number of women are Health Care & Social Assistance (83.0%), Educational Services (76.9%), and Accommodation & Food Services (65.0%).
| Industry | Male | Female |
| Agriculture, Fishing & Hunting | 236 (49.8%) | 238 (50.2%) |
| Mining, Quarrying, & Extraction | 21 (75.0%) | 7 (25.0%) |
| Construction | 7,837 (86.7%) | 1,205 (13.3%) |
| Manufacturing | 11,370 (67.4%) | 5,494 (32.6%) |
| Wholesale Trade | 1,833 (65.3%) | 974 (34.7%) |
| Retail Trade | 6,587 (48.2%) | 7,081 (51.8%) |
| Transportation & Warehousing | 5,239 (77.8%) | 1,494 (22.2%) |
| Utilities | 1,386 (80.1%) | 345 (19.9%) |
| Information | 1,056 (62.6%) | 630 (37.4%) |
| Finance & Insurance | 2,143 (43.4%) | 2,790 (56.6%) |
| Real Estate, Rental & Leasing | 1,377 (66.8%) | 684 (33.2%) |
| Professional & Scientific | 2,760 (48.3%) | 2,952 (51.7%) |
| Enterprise Management | 81 (39.3%) | 125 (60.7%) |
| Administrative & Support | 2,971 (59.9%) | 1,991 (40.1%) |
| Educational Services | 1,697 (23.1%) | 5,642 (76.9%) |
| Health Care & Social Assistance | 2,382 (17.0%) | 11,647 (83.0%) |
| Arts, Entertainment & Recreation | 840 (52.0%) | 774 (48.0%) |
| Accommodation & Food Services | 2,193 (35.0%) | 4,080 (65.0%) |
| Public Administration | 2,140 (63.1%) | 1,250 (36.9%) |
| Total | 56,933 (52.2%) | 52,200 (47.8%) |
Education in Gaston County
School Enrollment in Gaston County
The most common levels of schooling among the 50,289 students in Gaston County are middle school (12,138 | 24.1%), high school (11,821 | 23.5%), and elementary school (10,881 | 21.6%).
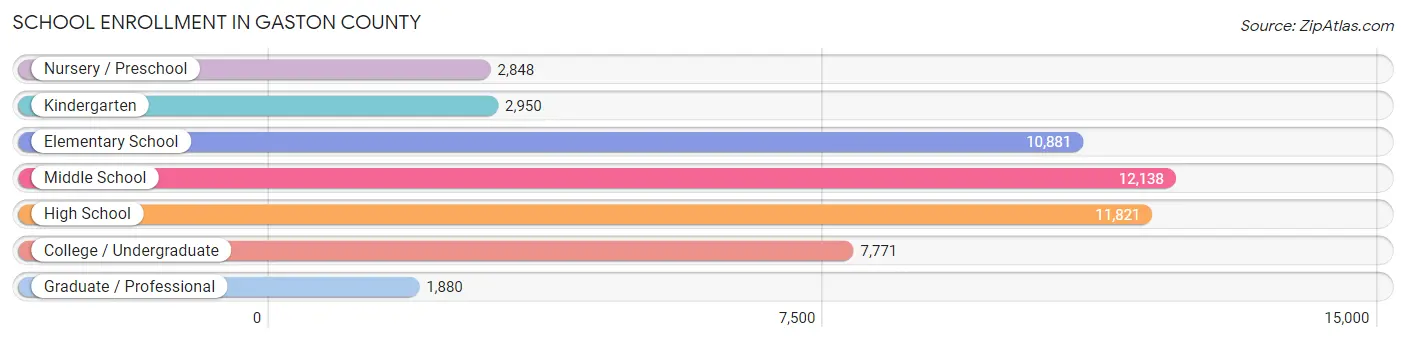
| School Level | # Students | % Students |
| Nursery / Preschool | 2,848 | 5.7% |
| Kindergarten | 2,950 | 5.9% |
| Elementary School | 10,881 | 21.6% |
| Middle School | 12,138 | 24.1% |
| High School | 11,821 | 23.5% |
| College / Undergraduate | 7,771 | 15.4% |
| Graduate / Professional | 1,880 | 3.7% |
| Total | 50,289 | 100.0% |
School Enrollment by Age by Funding Source in Gaston County
Out of a total of 50,289 students who are enrolled in schools in Gaston County, 8,650 (17.2%) attend a private institution, while the remaining 41,639 (82.8%) are enrolled in public schools. The age group of 3 to 4 year olds has the highest likelihood of being enrolled in private schools, with 879 (48.0% in the age bracket) enrolled. Conversely, the age group of 10 to 14 year olds has the lowest likelihood of being enrolled in a private school, with 12,371 (87.4% in the age bracket) attending a public institution.
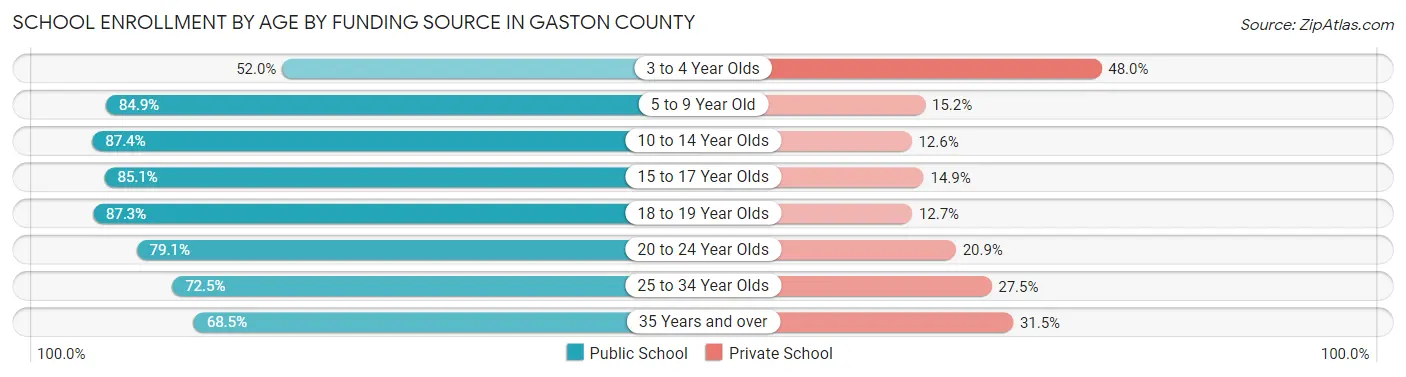
| Age Bracket | Public School | Private School |
| 3 to 4 Year Olds | 953 (52.0%) | 879 (48.0%) |
| 5 to 9 Year Old | 11,368 (84.9%) | 2,029 (15.1%) |
| 10 to 14 Year Olds | 12,371 (87.4%) | 1,789 (12.6%) |
| 15 to 17 Year Olds | 7,576 (85.1%) | 1,324 (14.9%) |
| 18 to 19 Year Olds | 3,163 (87.3%) | 461 (12.7%) |
| 20 to 24 Year Olds | 2,957 (79.1%) | 780 (20.9%) |
| 25 to 34 Year Olds | 1,540 (72.5%) | 584 (27.5%) |
| 35 Years and over | 1,722 (68.5%) | 793 (31.5%) |
| Total | 41,639 (82.8%) | 8,650 (17.2%) |
Educational Attainment by Field of Study in Gaston County
Business (9,622 | 22.2%), education (6,366 | 14.7%), arts & humanities (4,126 | 9.5%), science & technology (4,096 | 9.5%), and social sciences (2,456 | 5.7%) are the most common fields of study among 43,332 individuals in Gaston County who have obtained a bachelor's degree or higher.
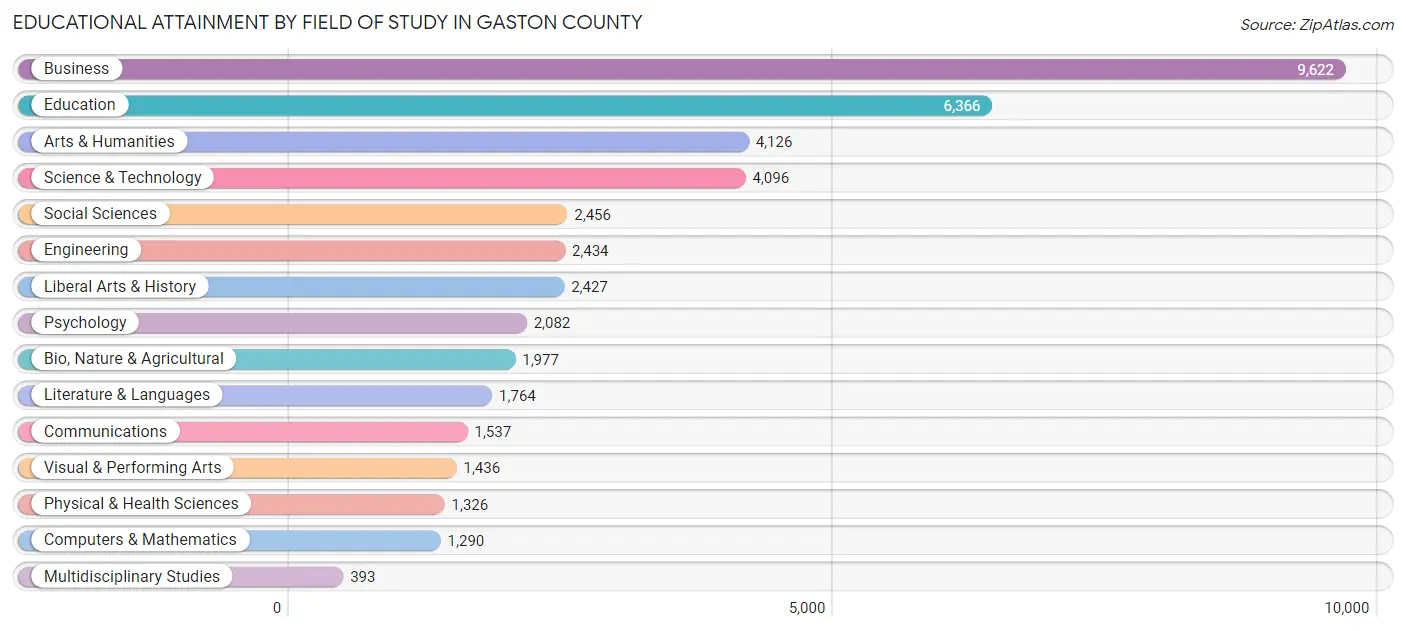
| Field of Study | # Graduates | % Graduates |
| Computers & Mathematics | 1,290 | 3.0% |
| Bio, Nature & Agricultural | 1,977 | 4.6% |
| Physical & Health Sciences | 1,326 | 3.1% |
| Psychology | 2,082 | 4.8% |
| Social Sciences | 2,456 | 5.7% |
| Engineering | 2,434 | 5.6% |
| Multidisciplinary Studies | 393 | 0.9% |
| Science & Technology | 4,096 | 9.5% |
| Business | 9,622 | 22.2% |
| Education | 6,366 | 14.7% |
| Literature & Languages | 1,764 | 4.1% |
| Liberal Arts & History | 2,427 | 5.6% |
| Visual & Performing Arts | 1,436 | 3.3% |
| Communications | 1,537 | 3.5% |
| Arts & Humanities | 4,126 | 9.5% |
| Total | 43,332 | 100.0% |
Transportation & Commute in Gaston County
Vehicle Availability by Sex in Gaston County
The most prevalent vehicle ownership categories in Gaston County are males with 2 vehicles (24,138, accounting for 43.2%) and females with 2 vehicles (20,769, making up 47.6%).
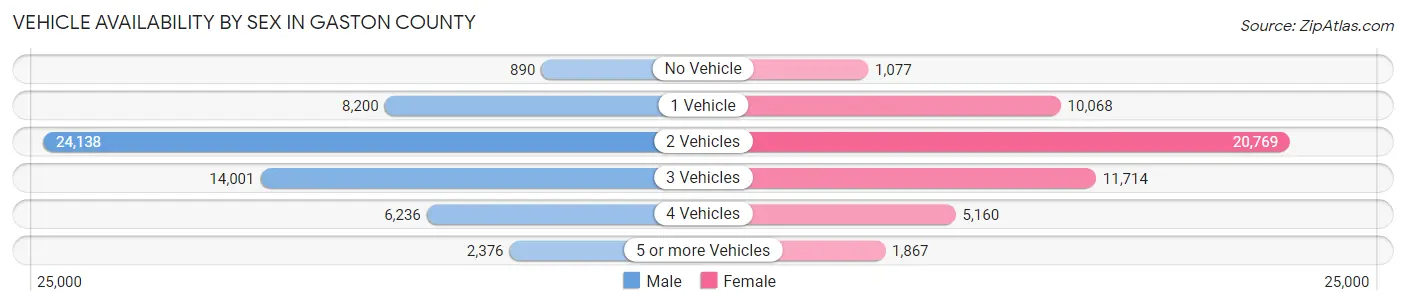
| Vehicles Available | Male | Female |
| No Vehicle | 890 (1.6%) | 1,077 (2.1%) |
| 1 Vehicle | 8,200 (14.7%) | 10,068 (19.9%) |
| 2 Vehicles | 24,138 (43.2%) | 20,769 (41.0%) |
| 3 Vehicles | 14,001 (25.1%) | 11,714 (23.1%) |
| 4 Vehicles | 6,236 (11.2%) | 5,160 (10.2%) |
| 5 or more Vehicles | 2,376 (4.3%) | 1,867 (3.7%) |
| Total | 55,841 (100.0%) | 50,655 (100.0%) |
Commute Time in Gaston County
The most frequently occuring commute durations in Gaston County are 15 to 19 minutes (15,319 commuters, 15.6%), 30 to 34 minutes (14,923 commuters, 15.2%), and 20 to 24 minutes (14,162 commuters, 14.5%).
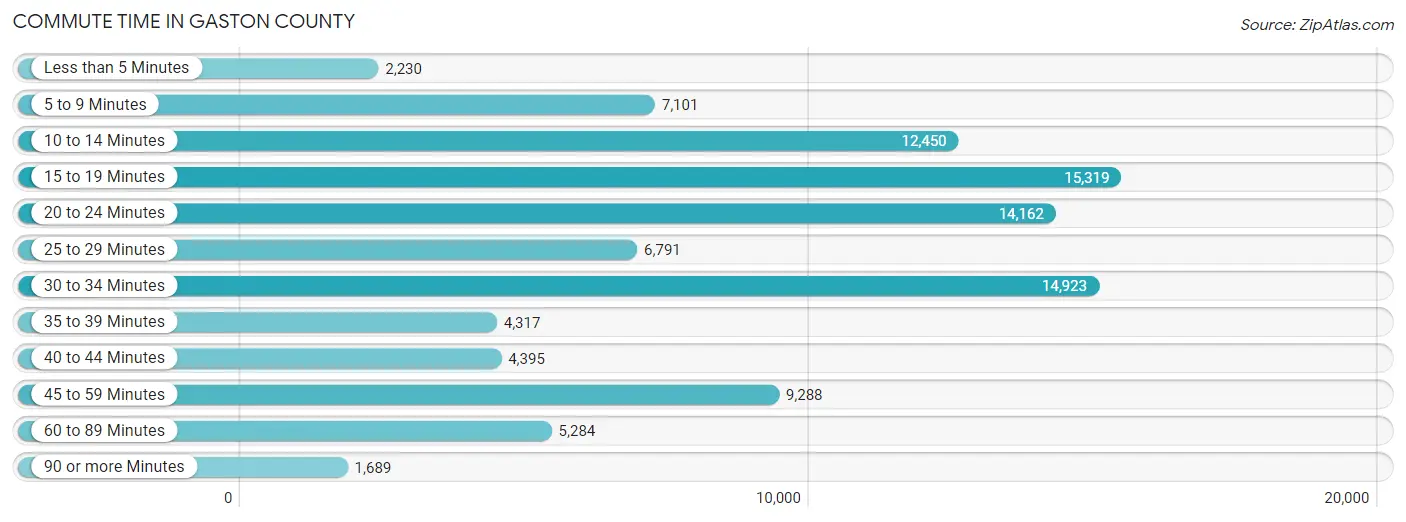
| Commute Time | # Commuters | % Commuters |
| Less than 5 Minutes | 2,230 | 2.3% |
| 5 to 9 Minutes | 7,101 | 7.2% |
| 10 to 14 Minutes | 12,450 | 12.7% |
| 15 to 19 Minutes | 15,319 | 15.6% |
| 20 to 24 Minutes | 14,162 | 14.5% |
| 25 to 29 Minutes | 6,791 | 6.9% |
| 30 to 34 Minutes | 14,923 | 15.2% |
| 35 to 39 Minutes | 4,317 | 4.4% |
| 40 to 44 Minutes | 4,395 | 4.5% |
| 45 to 59 Minutes | 9,288 | 9.5% |
| 60 to 89 Minutes | 5,284 | 5.4% |
| 90 or more Minutes | 1,689 | 1.7% |
Commute Time by Sex in Gaston County
The most common commute times in Gaston County are 30 to 34 minutes (8,768 commuters, 16.8%) for males and 15 to 19 minutes (7,730 commuters, 16.9%) for females.
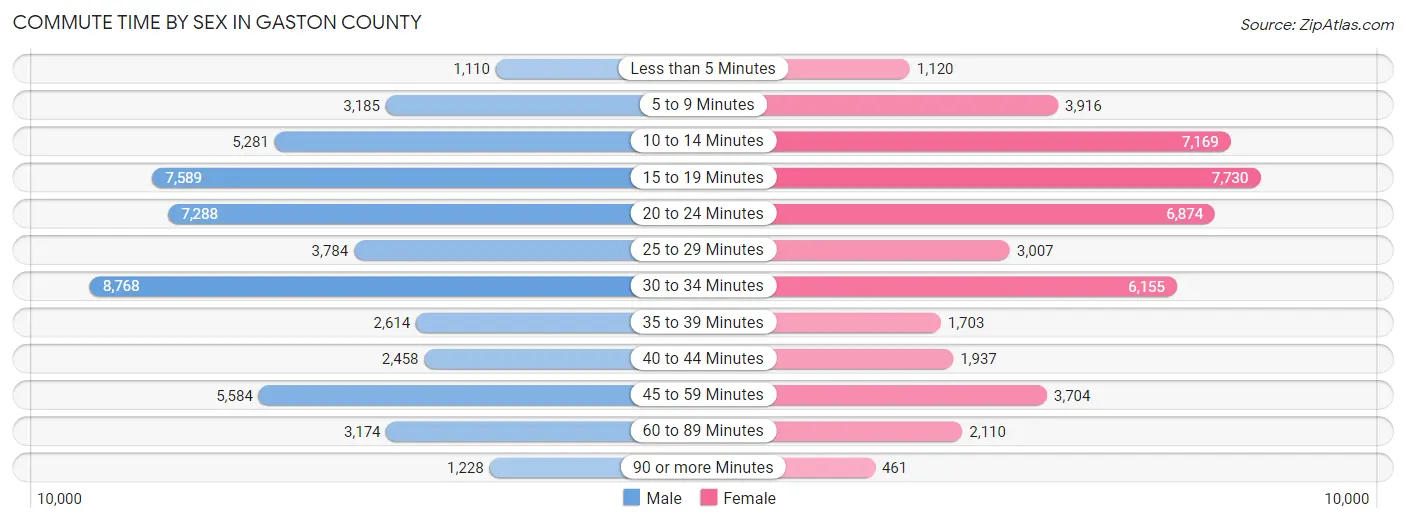
| Commute Time | Male | Female |
| Less than 5 Minutes | 1,110 (2.1%) | 1,120 (2.4%) |
| 5 to 9 Minutes | 3,185 (6.1%) | 3,916 (8.5%) |
| 10 to 14 Minutes | 5,281 (10.1%) | 7,169 (15.6%) |
| 15 to 19 Minutes | 7,589 (14.6%) | 7,730 (16.9%) |
| 20 to 24 Minutes | 7,288 (14.0%) | 6,874 (15.0%) |
| 25 to 29 Minutes | 3,784 (7.3%) | 3,007 (6.6%) |
| 30 to 34 Minutes | 8,768 (16.8%) | 6,155 (13.4%) |
| 35 to 39 Minutes | 2,614 (5.0%) | 1,703 (3.7%) |
| 40 to 44 Minutes | 2,458 (4.7%) | 1,937 (4.2%) |
| 45 to 59 Minutes | 5,584 (10.7%) | 3,704 (8.1%) |
| 60 to 89 Minutes | 3,174 (6.1%) | 2,110 (4.6%) |
| 90 or more Minutes | 1,228 (2.4%) | 461 (1.0%) |
Time of Departure to Work by Sex in Gaston County
The most frequent times of departure to work in Gaston County are 7:00 AM to 7:29 AM (7,794, 15.0%) for males and 7:00 AM to 7:29 AM (7,618, 16.6%) for females.
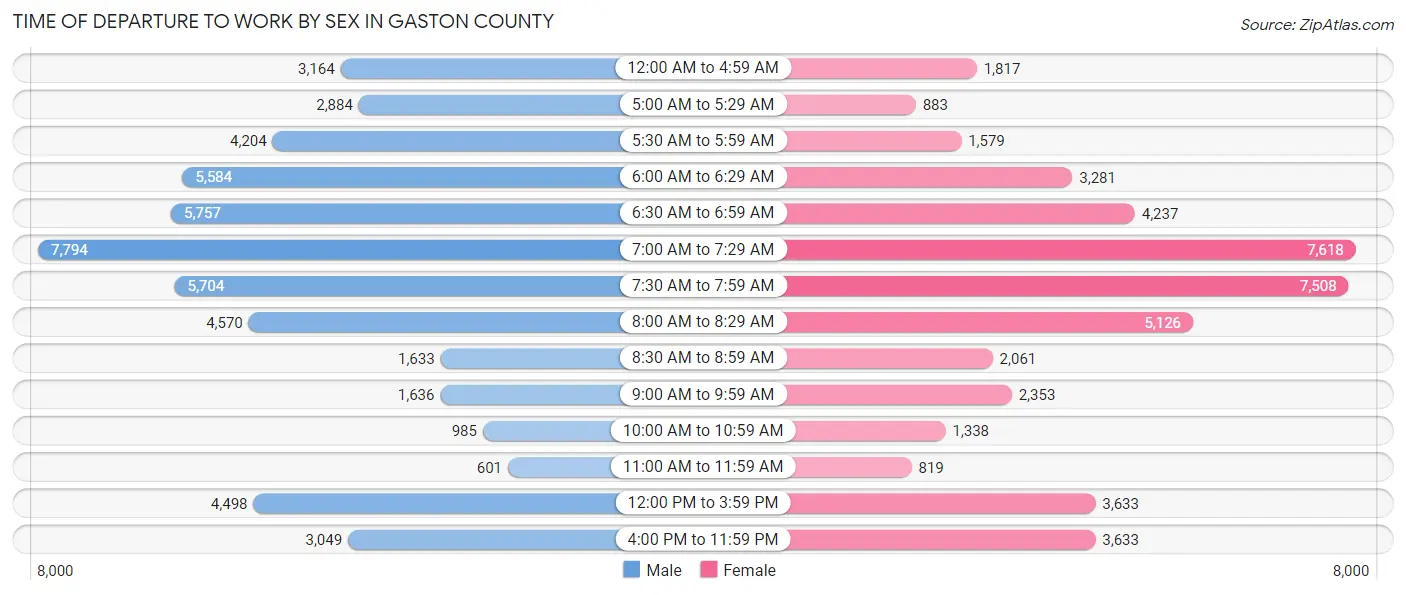
| Time of Departure | Male | Female |
| 12:00 AM to 4:59 AM | 3,164 (6.1%) | 1,817 (4.0%) |
| 5:00 AM to 5:29 AM | 2,884 (5.5%) | 883 (1.9%) |
| 5:30 AM to 5:59 AM | 4,204 (8.1%) | 1,579 (3.4%) |
| 6:00 AM to 6:29 AM | 5,584 (10.7%) | 3,281 (7.1%) |
| 6:30 AM to 6:59 AM | 5,757 (11.1%) | 4,237 (9.2%) |
| 7:00 AM to 7:29 AM | 7,794 (15.0%) | 7,618 (16.6%) |
| 7:30 AM to 7:59 AM | 5,704 (11.0%) | 7,508 (16.4%) |
| 8:00 AM to 8:29 AM | 4,570 (8.8%) | 5,126 (11.2%) |
| 8:30 AM to 8:59 AM | 1,633 (3.1%) | 2,061 (4.5%) |
| 9:00 AM to 9:59 AM | 1,636 (3.1%) | 2,353 (5.1%) |
| 10:00 AM to 10:59 AM | 985 (1.9%) | 1,338 (2.9%) |
| 11:00 AM to 11:59 AM | 601 (1.1%) | 819 (1.8%) |
| 12:00 PM to 3:59 PM | 4,498 (8.6%) | 3,633 (7.9%) |
| 4:00 PM to 11:59 PM | 3,049 (5.9%) | 3,633 (7.9%) |
| Total | 52,063 (100.0%) | 45,886 (100.0%) |
Housing Occupancy in Gaston County
Occupancy by Ownership in Gaston County
Of the total 90,427 dwellings in Gaston County, owner-occupied units account for 60,619 (67.0%), while renter-occupied units make up 29,808 (33.0%).
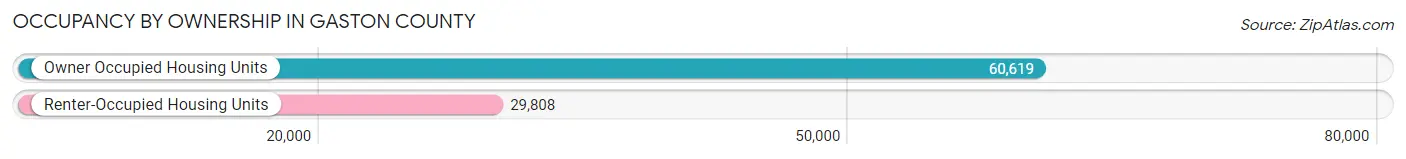
| Occupancy | # Housing Units | % Housing Units |
| Owner Occupied Housing Units | 60,619 | 67.0% |
| Renter-Occupied Housing Units | 29,808 | 33.0% |
| Total Occupied Housing Units | 90,427 | 100.0% |
Occupancy by Household Size in Gaston County
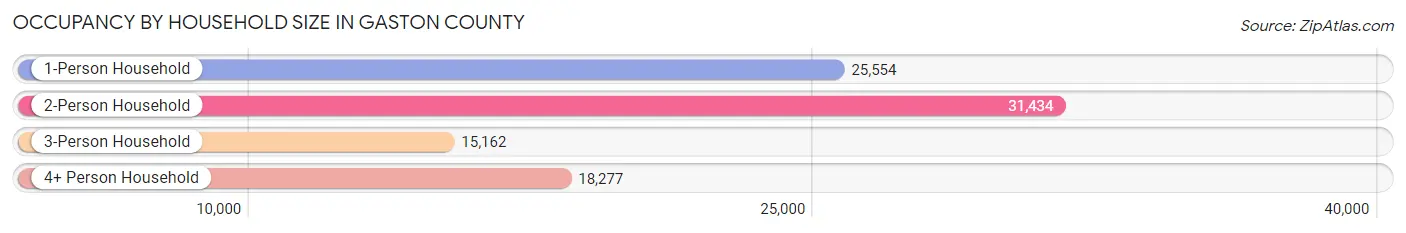
| Household Size | # Housing Units | % Housing Units |
| 1-Person Household | 25,554 | 28.3% |
| 2-Person Household | 31,434 | 34.8% |
| 3-Person Household | 15,162 | 16.8% |
| 4+ Person Household | 18,277 | 20.2% |
| Total Housing Units | 90,427 | 100.0% |
Occupancy by Ownership by Household Size in Gaston County
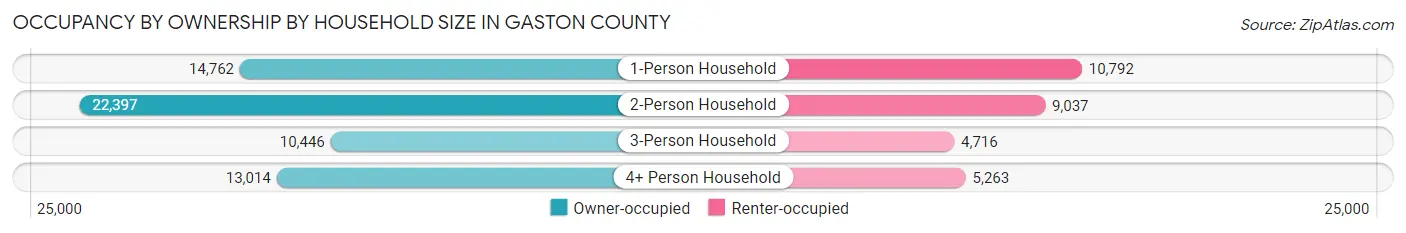
| Household Size | Owner-occupied | Renter-occupied |
| 1-Person Household | 14,762 (57.8%) | 10,792 (42.2%) |
| 2-Person Household | 22,397 (71.3%) | 9,037 (28.7%) |
| 3-Person Household | 10,446 (68.9%) | 4,716 (31.1%) |
| 4+ Person Household | 13,014 (71.2%) | 5,263 (28.8%) |
| Total Housing Units | 60,619 (67.0%) | 29,808 (33.0%) |
Occupancy by Educational Attainment in Gaston County
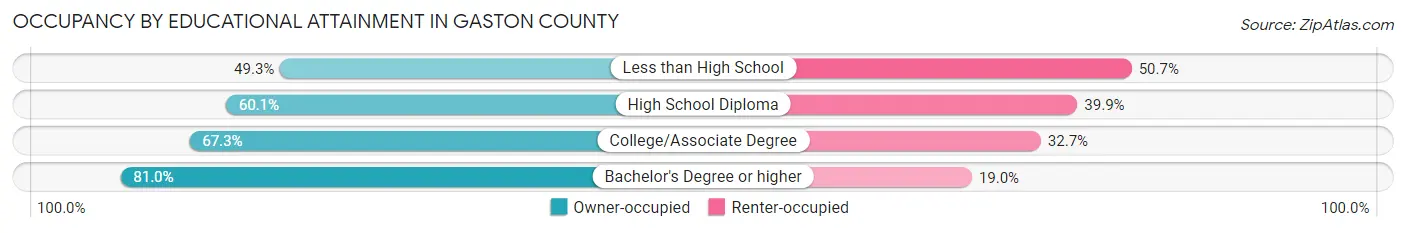
| Household Size | Owner-occupied | Renter-occupied |
| Less than High School | 5,115 (49.3%) | 5,253 (50.7%) |
| High School Diploma | 14,237 (60.1%) | 9,450 (39.9%) |
| College/Associate Degree | 21,677 (67.3%) | 10,514 (32.7%) |
| Bachelor's Degree or higher | 19,590 (81.0%) | 4,591 (19.0%) |
Occupancy by Age of Householder in Gaston County
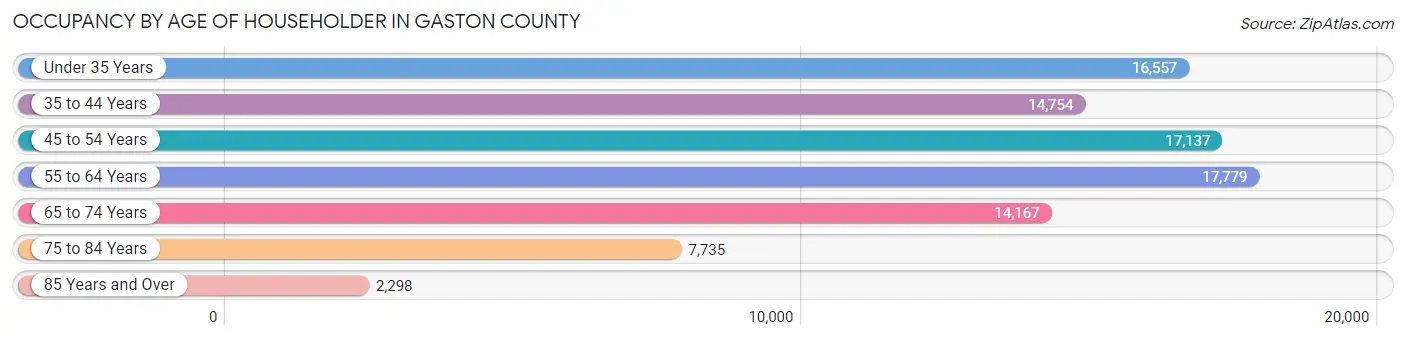
| Age Bracket | # Households | % Households |
| Under 35 Years | 16,557 | 18.3% |
| 35 to 44 Years | 14,754 | 16.3% |
| 45 to 54 Years | 17,137 | 19.0% |
| 55 to 64 Years | 17,779 | 19.7% |
| 65 to 74 Years | 14,167 | 15.7% |
| 75 to 84 Years | 7,735 | 8.6% |
| 85 Years and Over | 2,298 | 2.5% |
| Total | 90,427 | 100.0% |
Housing Finances in Gaston County
Median Income by Occupancy in Gaston County
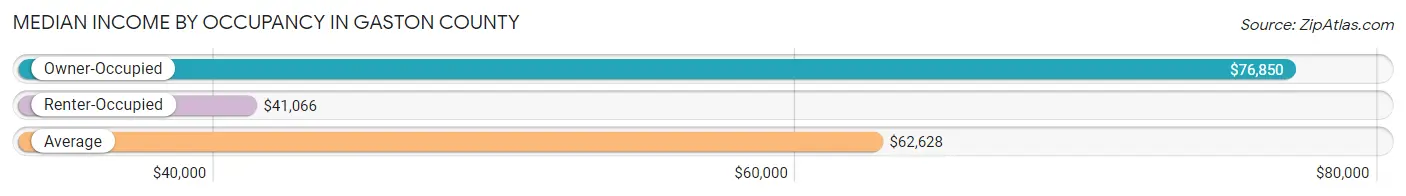
| Occupancy Type | # Households | Median Income |
| Owner-Occupied | 60,619 (67.0%) | $76,850 |
| Renter-Occupied | 29,808 (33.0%) | $41,066 |
| Average | 90,427 (100.0%) | $62,628 |
Occupancy by Householder Income Bracket in Gaston County
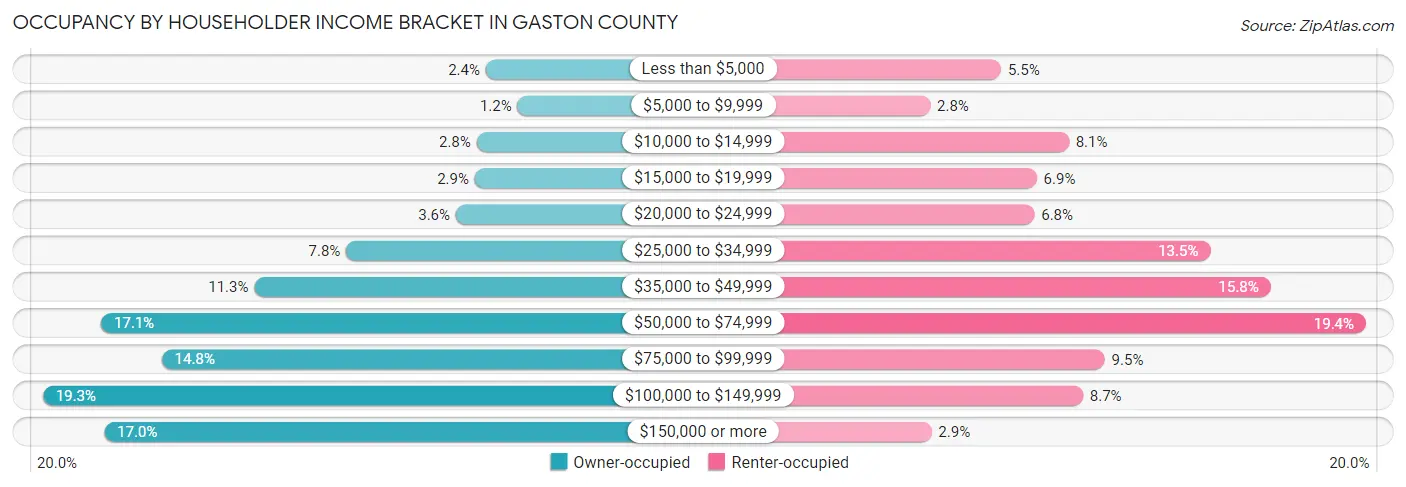
| Income Bracket | Owner-occupied | Renter-occupied |
| Less than $5,000 | 1,471 (2.4%) | 1,650 (5.5%) |
| $5,000 to $9,999 | 742 (1.2%) | 846 (2.8%) |
| $10,000 to $14,999 | 1,684 (2.8%) | 2,420 (8.1%) |
| $15,000 to $19,999 | 1,728 (2.9%) | 2,058 (6.9%) |
| $20,000 to $24,999 | 2,163 (3.6%) | 2,029 (6.8%) |
| $25,000 to $34,999 | 4,698 (7.7%) | 4,026 (13.5%) |
| $35,000 to $49,999 | 6,820 (11.3%) | 4,714 (15.8%) |
| $50,000 to $74,999 | 10,362 (17.1%) | 5,794 (19.4%) |
| $75,000 to $99,999 | 8,957 (14.8%) | 2,830 (9.5%) |
| $100,000 to $149,999 | 11,708 (19.3%) | 2,580 (8.7%) |
| $150,000 or more | 10,286 (17.0%) | 861 (2.9%) |
| Total | 60,619 (100.0%) | 29,808 (100.0%) |
Monthly Housing Cost Tiers in Gaston County
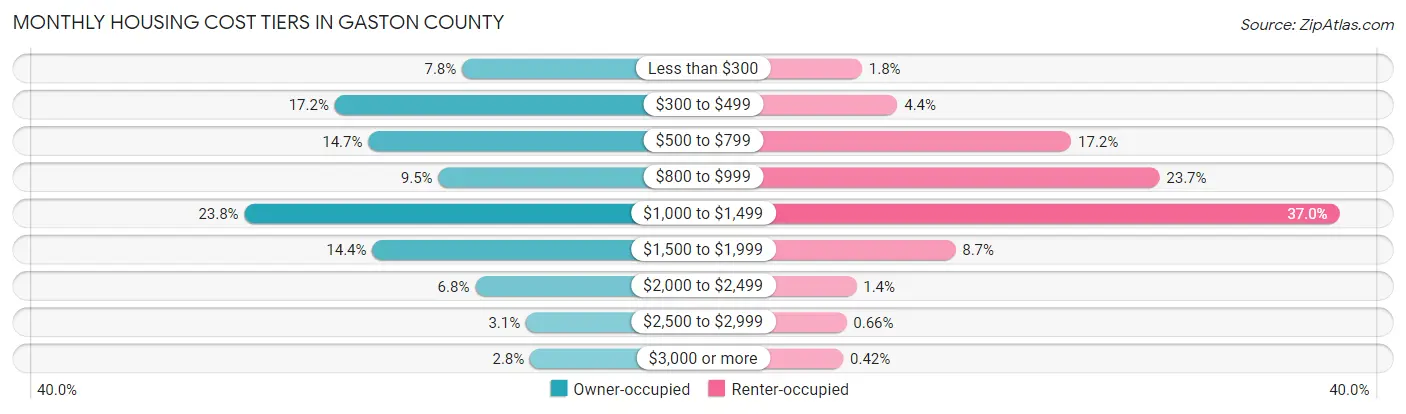
| Monthly Cost | Owner-occupied | Renter-occupied |
| Less than $300 | 4,717 (7.8%) | 536 (1.8%) |
| $300 to $499 | 10,404 (17.2%) | 1,316 (4.4%) |
| $500 to $799 | 8,903 (14.7%) | 5,129 (17.2%) |
| $800 to $999 | 5,771 (9.5%) | 7,067 (23.7%) |
| $1,000 to $1,499 | 14,432 (23.8%) | 11,019 (37.0%) |
| $1,500 to $1,999 | 8,722 (14.4%) | 2,588 (8.7%) |
| $2,000 to $2,499 | 4,128 (6.8%) | 415 (1.4%) |
| $2,500 to $2,999 | 1,863 (3.1%) | 196 (0.7%) |
| $3,000 or more | 1,679 (2.8%) | 125 (0.4%) |
| Total | 60,619 (100.0%) | 29,808 (100.0%) |
Physical Housing Characteristics in Gaston County
Housing Structures in Gaston County
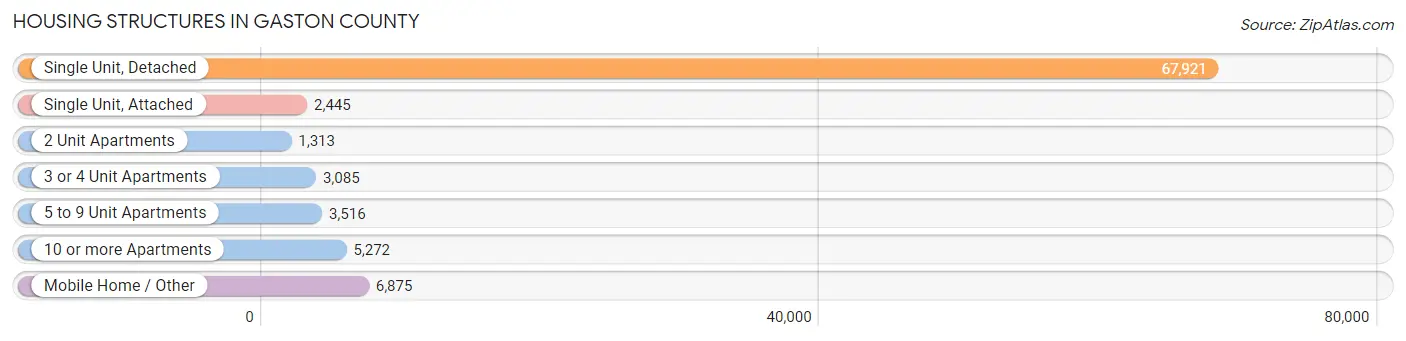
| Structure Type | # Housing Units | % Housing Units |
| Single Unit, Detached | 67,921 | 75.1% |
| Single Unit, Attached | 2,445 | 2.7% |
| 2 Unit Apartments | 1,313 | 1.5% |
| 3 or 4 Unit Apartments | 3,085 | 3.4% |
| 5 to 9 Unit Apartments | 3,516 | 3.9% |
| 10 or more Apartments | 5,272 | 5.8% |
| Mobile Home / Other | 6,875 | 7.6% |
| Total | 90,427 | 100.0% |
Housing Structures by Occupancy in Gaston County
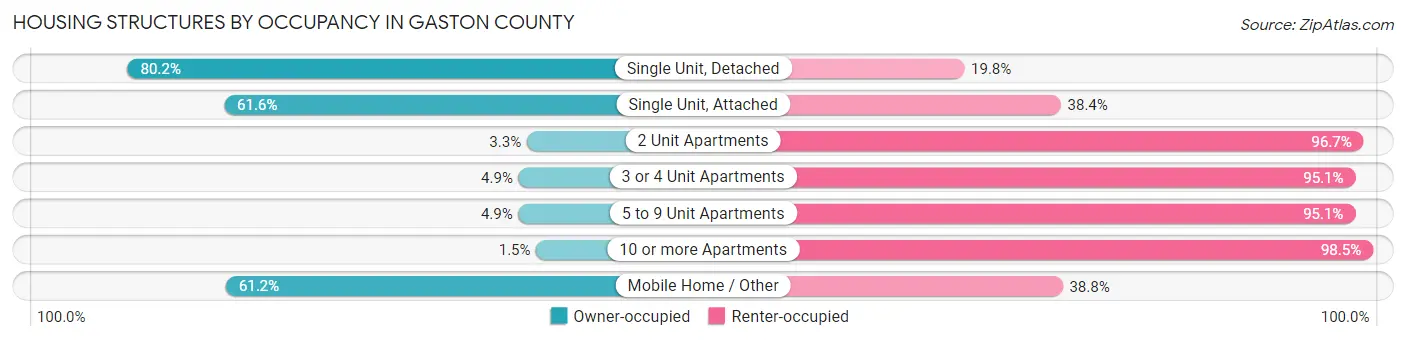
| Structure Type | Owner-occupied | Renter-occupied |
| Single Unit, Detached | 54,461 (80.2%) | 13,460 (19.8%) |
| Single Unit, Attached | 1,506 (61.6%) | 939 (38.4%) |
| 2 Unit Apartments | 43 (3.3%) | 1,270 (96.7%) |
| 3 or 4 Unit Apartments | 150 (4.9%) | 2,935 (95.1%) |
| 5 to 9 Unit Apartments | 172 (4.9%) | 3,344 (95.1%) |
| 10 or more Apartments | 77 (1.5%) | 5,195 (98.5%) |
| Mobile Home / Other | 4,210 (61.2%) | 2,665 (38.8%) |
| Total | 60,619 (67.0%) | 29,808 (33.0%) |
Housing Structures by Number of Rooms in Gaston County
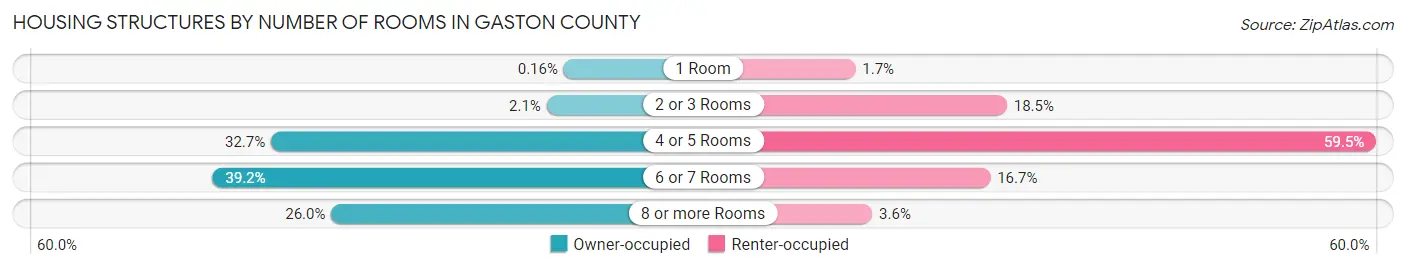
| Number of Rooms | Owner-occupied | Renter-occupied |
| 1 Room | 99 (0.2%) | 510 (1.7%) |
| 2 or 3 Rooms | 1,249 (2.1%) | 5,520 (18.5%) |
| 4 or 5 Rooms | 19,793 (32.7%) | 17,740 (59.5%) |
| 6 or 7 Rooms | 23,741 (39.2%) | 4,971 (16.7%) |
| 8 or more Rooms | 15,737 (26.0%) | 1,067 (3.6%) |
| Total | 60,619 (100.0%) | 29,808 (100.0%) |
Housing Structure by Heating Type in Gaston County
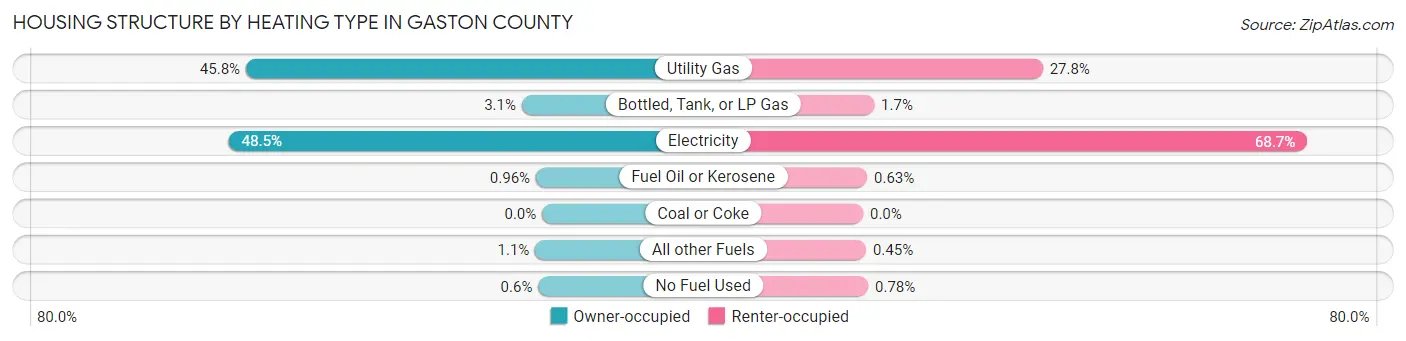
| Heating Type | Owner-occupied | Renter-occupied |
| Utility Gas | 27,756 (45.8%) | 8,277 (27.8%) |
| Bottled, Tank, or LP Gas | 1,901 (3.1%) | 514 (1.7%) |
| Electricity | 29,368 (48.4%) | 20,464 (68.6%) |
| Fuel Oil or Kerosene | 581 (1.0%) | 187 (0.6%) |
| Coal or Coke | 3 (0.0%) | 0 (0.0%) |
| All other Fuels | 649 (1.1%) | 134 (0.4%) |
| No Fuel Used | 361 (0.6%) | 232 (0.8%) |
| Total | 60,619 (100.0%) | 29,808 (100.0%) |
Household Vehicle Usage in Gaston County
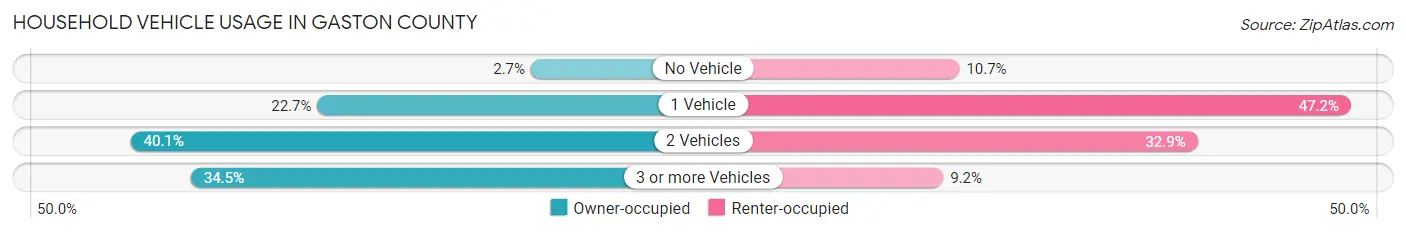
| Vehicles per Household | Owner-occupied | Renter-occupied |
| No Vehicle | 1,659 (2.7%) | 3,185 (10.7%) |
| 1 Vehicle | 13,749 (22.7%) | 14,076 (47.2%) |
| 2 Vehicles | 24,310 (40.1%) | 9,810 (32.9%) |
| 3 or more Vehicles | 20,901 (34.5%) | 2,737 (9.2%) |
| Total | 60,619 (100.0%) | 29,808 (100.0%) |
Real Estate & Mortgages in Gaston County
Real Estate and Mortgage Overview in Gaston County
| Characteristic | Without Mortgage | With Mortgage |
| Housing Units | 22,612 | 38,007 |
| Median Property Value | $166,800 | $229,900 |
| Median Household Income | $50,117 | $8,360 |
| Monthly Housing Costs | $429 | $1,662 |
| Real Estate Taxes | $1,440 | $574 |
Property Value by Mortgage Status in Gaston County
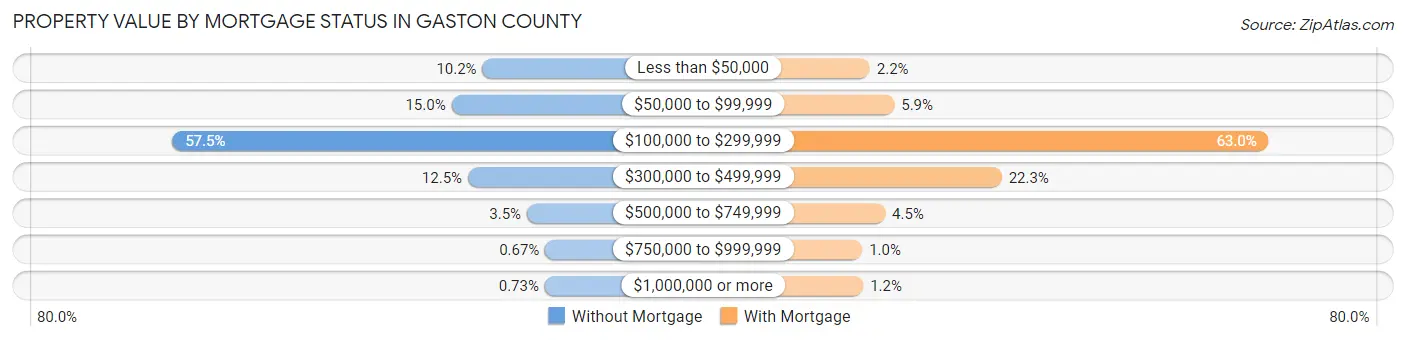
| Property Value | Without Mortgage | With Mortgage |
| Less than $50,000 | 2,314 (10.2%) | 828 (2.2%) |
| $50,000 to $99,999 | 3,380 (14.9%) | 2,243 (5.9%) |
| $100,000 to $299,999 | 13,002 (57.5%) | 23,926 (62.9%) |
| $300,000 to $499,999 | 2,816 (12.4%) | 8,465 (22.3%) |
| $500,000 to $749,999 | 783 (3.5%) | 1,712 (4.5%) |
| $750,000 to $999,999 | 151 (0.7%) | 387 (1.0%) |
| $1,000,000 or more | 166 (0.7%) | 446 (1.2%) |
| Total | 22,612 (100.0%) | 38,007 (100.0%) |
Household Income by Mortgage Status in Gaston County
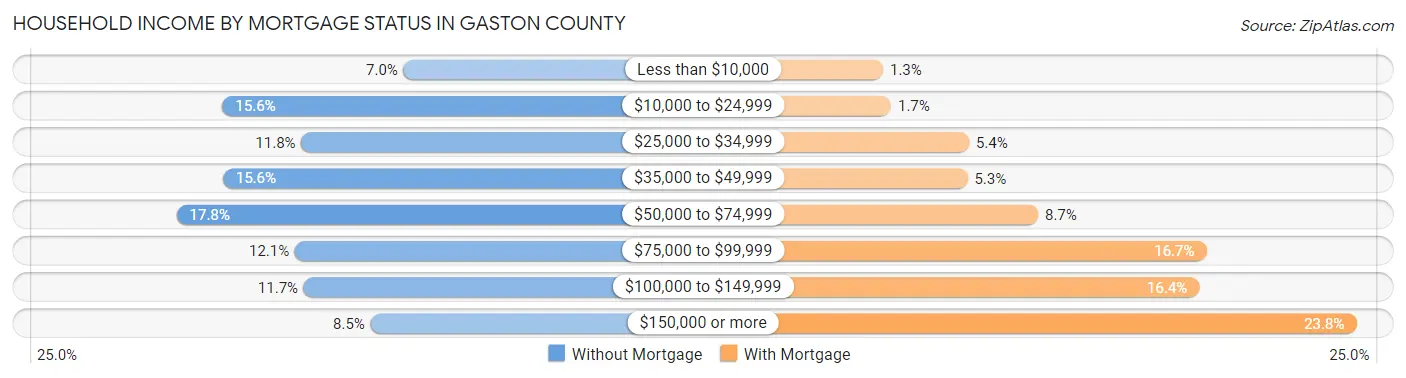
| Household Income | Without Mortgage | With Mortgage |
| Less than $10,000 | 1,572 (7.0%) | 498 (1.3%) |
| $10,000 to $24,999 | 3,522 (15.6%) | 641 (1.7%) |
| $25,000 to $34,999 | 2,673 (11.8%) | 2,053 (5.4%) |
| $35,000 to $49,999 | 3,518 (15.6%) | 2,025 (5.3%) |
| $50,000 to $74,999 | 4,015 (17.8%) | 3,302 (8.7%) |
| $75,000 to $99,999 | 2,740 (12.1%) | 6,347 (16.7%) |
| $100,000 to $149,999 | 2,646 (11.7%) | 6,217 (16.4%) |
| $150,000 or more | 1,926 (8.5%) | 9,062 (23.8%) |
| Total | 22,612 (100.0%) | 38,007 (100.0%) |
Property Value to Household Income Ratio in Gaston County
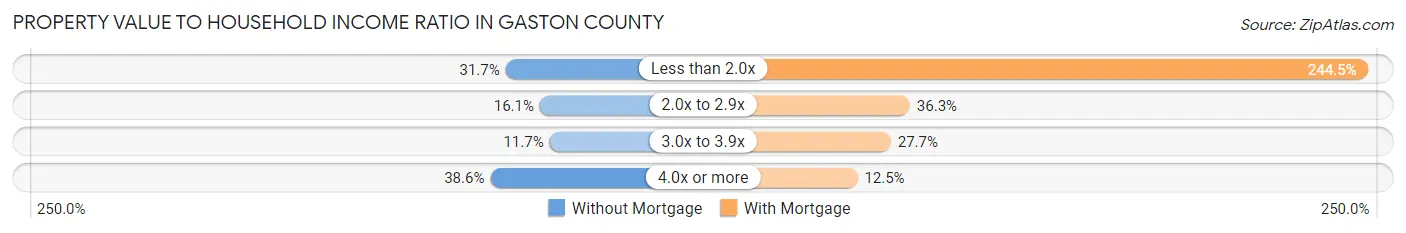
| Value-to-Income Ratio | Without Mortgage | With Mortgage |
| Less than 2.0x | 7,156 (31.7%) | 92,936 (244.5%) |
| 2.0x to 2.9x | 3,641 (16.1%) | 13,803 (36.3%) |
| 3.0x to 3.9x | 2,644 (11.7%) | 10,510 (27.7%) |
| 4.0x or more | 8,728 (38.6%) | 4,748 (12.5%) |
| Total | 22,612 (100.0%) | 38,007 (100.0%) |
Real Estate Taxes by Mortgage Status in Gaston County
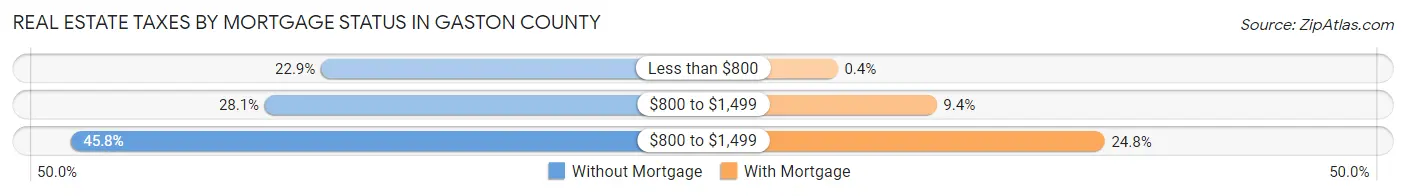
| Property Taxes | Without Mortgage | With Mortgage |
| Less than $800 | 5,183 (22.9%) | 152 (0.4%) |
| $800 to $1,499 | 6,342 (28.1%) | 3,586 (9.4%) |
| $800 to $1,499 | 10,360 (45.8%) | 9,423 (24.8%) |
| Total | 22,612 (100.0%) | 38,007 (100.0%) |
Health & Disability in Gaston County
Health Insurance Coverage by Age in Gaston County
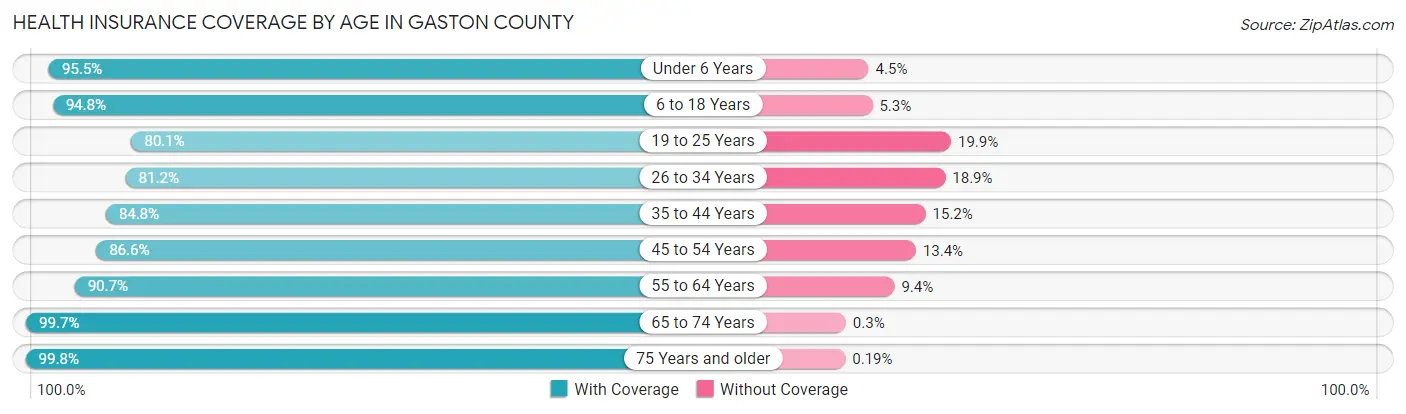
| Age Bracket | With Coverage | Without Coverage |
| Under 6 Years | 15,469 (95.5%) | 735 (4.5%) |
| 6 to 18 Years | 35,741 (94.8%) | 1,979 (5.2%) |
| 19 to 25 Years | 15,099 (80.1%) | 3,754 (19.9%) |
| 26 to 34 Years | 22,304 (81.1%) | 5,181 (18.9%) |
| 35 to 44 Years | 23,928 (84.8%) | 4,276 (15.2%) |
| 45 to 54 Years | 27,343 (86.6%) | 4,215 (13.4%) |
| 55 to 64 Years | 27,413 (90.6%) | 2,829 (9.3%) |
| 65 to 74 Years | 22,026 (99.7%) | 67 (0.3%) |
| 75 Years and older | 14,299 (99.8%) | 27 (0.2%) |
| Total | 203,622 (89.8%) | 23,063 (10.2%) |
Health Insurance Coverage by Citizenship Status in Gaston County
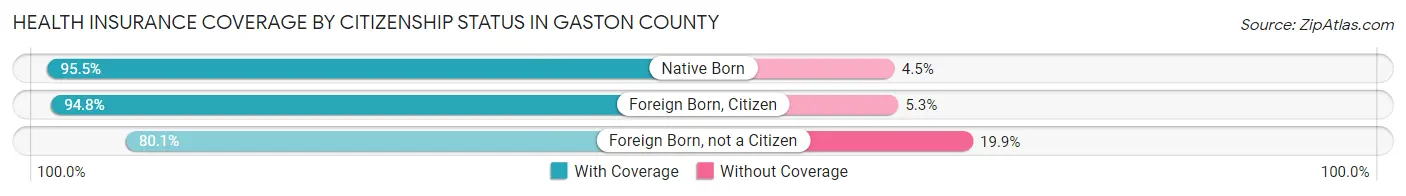
| Citizenship Status | With Coverage | Without Coverage |
| Native Born | 15,469 (95.5%) | 735 (4.5%) |
| Foreign Born, Citizen | 35,741 (94.8%) | 1,979 (5.2%) |
| Foreign Born, not a Citizen | 15,099 (80.1%) | 3,754 (19.9%) |
Health Insurance Coverage by Household Income in Gaston County
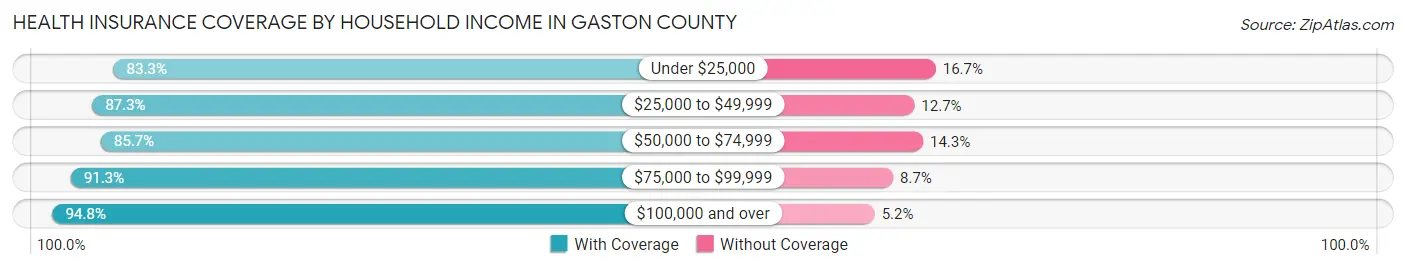
| Household Income | With Coverage | Without Coverage |
| Under $25,000 | 22,922 (83.3%) | 4,588 (16.7%) |
| $25,000 to $49,999 | 37,194 (87.3%) | 5,397 (12.7%) |
| $50,000 to $74,999 | 34,794 (85.7%) | 5,799 (14.3%) |
| $75,000 to $99,999 | 30,485 (91.3%) | 2,894 (8.7%) |
| $100,000 and over | 77,246 (94.8%) | 4,264 (5.2%) |
Public vs Private Health Insurance Coverage by Age in Gaston County
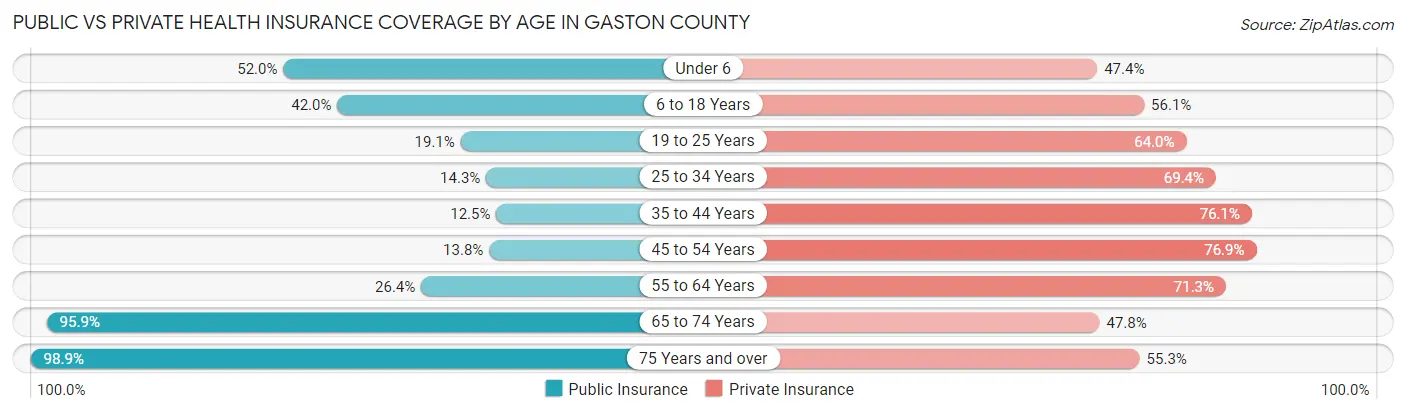
| Age Bracket | Public Insurance | Private Insurance |
| Under 6 | 8,423 (52.0%) | 7,682 (47.4%) |
| 6 to 18 Years | 15,829 (42.0%) | 21,168 (56.1%) |
| 19 to 25 Years | 3,595 (19.1%) | 12,056 (63.9%) |
| 25 to 34 Years | 3,939 (14.3%) | 19,083 (69.4%) |
| 35 to 44 Years | 3,510 (12.4%) | 21,463 (76.1%) |
| 45 to 54 Years | 4,346 (13.8%) | 24,279 (76.9%) |
| 55 to 64 Years | 7,984 (26.4%) | 21,555 (71.3%) |
| 65 to 74 Years | 21,188 (95.9%) | 10,570 (47.8%) |
| 75 Years and over | 14,164 (98.9%) | 7,921 (55.3%) |
| Total | 82,978 (36.6%) | 145,777 (64.3%) |
Disability Status by Sex by Age in Gaston County
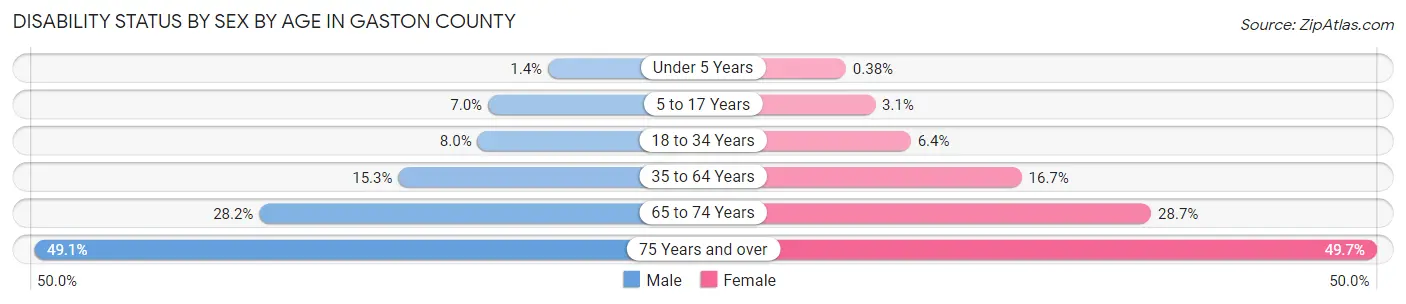
| Age Bracket | Male | Female |
| Under 5 Years | 97 (1.4%) | 24 (0.4%) |
| 5 to 17 Years | 1,357 (7.0%) | 574 (3.1%) |
| 18 to 34 Years | 1,948 (8.0%) | 1,583 (6.4%) |
| 35 to 64 Years | 6,672 (15.3%) | 7,753 (16.7%) |
| 65 to 74 Years | 2,850 (28.2%) | 3,445 (28.7%) |
| 75 Years and over | 2,731 (49.1%) | 4,352 (49.6%) |
Disability Class by Sex by Age in Gaston County
Disability Class: Hearing Difficulty
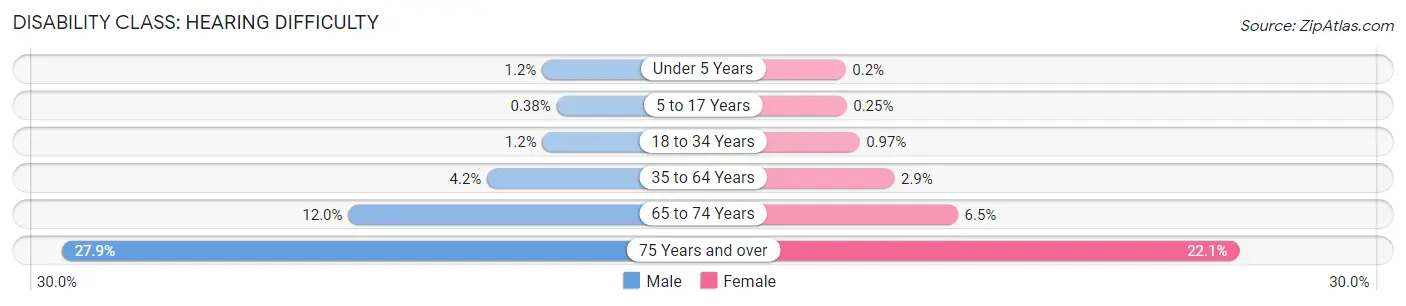
| Age Bracket | Male | Female |
| Under 5 Years | 80 (1.2%) | 13 (0.2%) |
| 5 to 17 Years | 73 (0.4%) | 46 (0.3%) |
| 18 to 34 Years | 283 (1.2%) | 240 (1.0%) |
| 35 to 64 Years | 1,846 (4.2%) | 1,354 (2.9%) |
| 65 to 74 Years | 1,208 (12.0%) | 774 (6.5%) |
| 75 Years and over | 1,553 (27.9%) | 1,940 (22.1%) |
Disability Class: Vision Difficulty
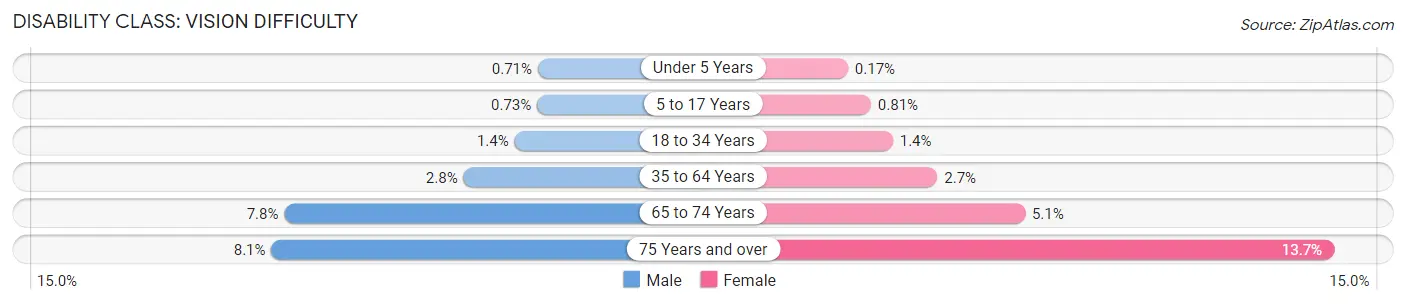
| Age Bracket | Male | Female |
| Under 5 Years | 48 (0.7%) | 11 (0.2%) |
| 5 to 17 Years | 141 (0.7%) | 150 (0.8%) |
| 18 to 34 Years | 332 (1.4%) | 350 (1.4%) |
| 35 to 64 Years | 1,210 (2.8%) | 1,237 (2.7%) |
| 65 to 74 Years | 784 (7.8%) | 612 (5.1%) |
| 75 Years and over | 452 (8.1%) | 1,201 (13.7%) |
Disability Class: Cognitive Difficulty
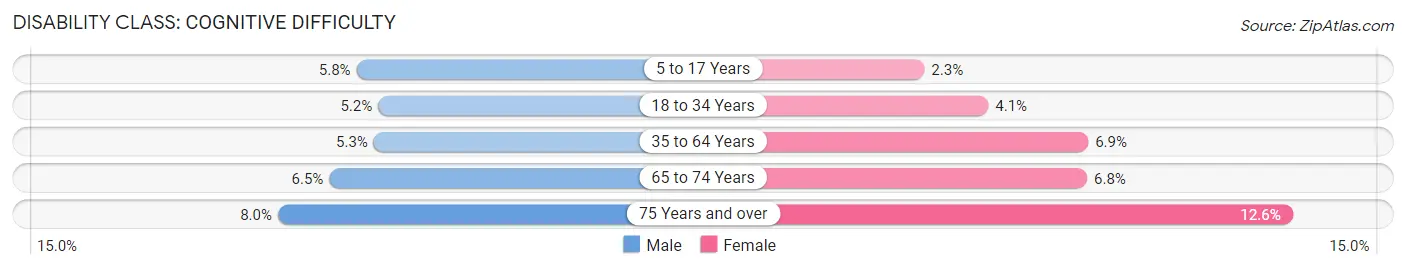
| Age Bracket | Male | Female |
| 5 to 17 Years | 1,117 (5.8%) | 426 (2.3%) |
| 18 to 34 Years | 1,260 (5.2%) | 1,010 (4.1%) |
| 35 to 64 Years | 2,297 (5.3%) | 3,187 (6.9%) |
| 65 to 74 Years | 658 (6.5%) | 819 (6.8%) |
| 75 Years and over | 442 (8.0%) | 1,100 (12.6%) |
Disability Class: Ambulatory Difficulty
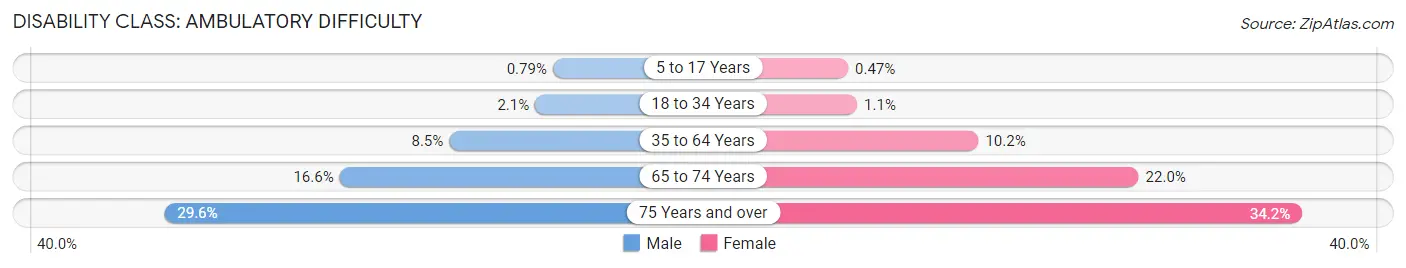
| Age Bracket | Male | Female |
| 5 to 17 Years | 154 (0.8%) | 87 (0.5%) |
| 18 to 34 Years | 513 (2.1%) | 281 (1.1%) |
| 35 to 64 Years | 3,690 (8.5%) | 4,716 (10.2%) |
| 65 to 74 Years | 1,678 (16.6%) | 2,644 (22.0%) |
| 75 Years and over | 1,647 (29.6%) | 2,995 (34.2%) |
Disability Class: Self-Care Difficulty
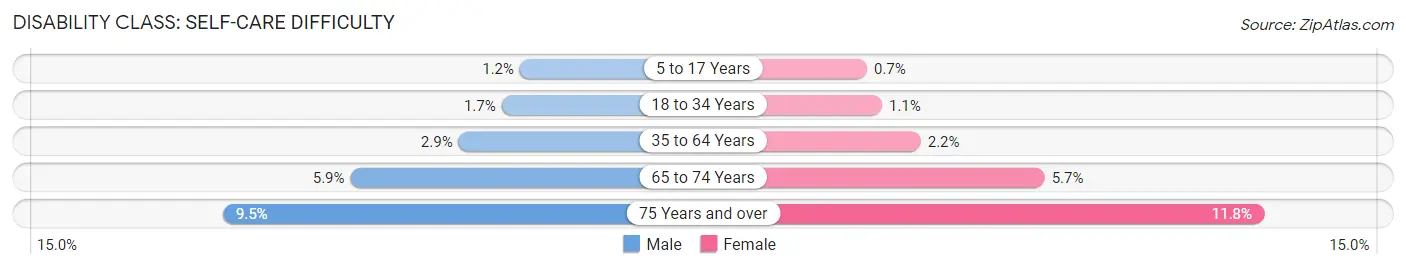
| Age Bracket | Male | Female |
| 5 to 17 Years | 234 (1.2%) | 130 (0.7%) |
| 18 to 34 Years | 419 (1.7%) | 277 (1.1%) |
| 35 to 64 Years | 1,272 (2.9%) | 1,022 (2.2%) |
| 65 to 74 Years | 599 (5.9%) | 678 (5.7%) |
| 75 Years and over | 527 (9.5%) | 1,030 (11.7%) |
Technology Access in Gaston County
Computing Device Access in Gaston County
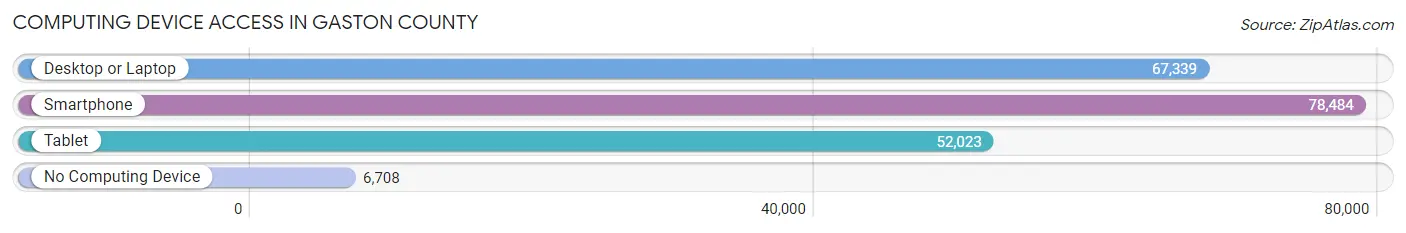
| Device Type | # Households | % Households |
| Desktop or Laptop | 67,339 | 74.5% |
| Smartphone | 78,484 | 86.8% |
| Tablet | 52,023 | 57.5% |
| No Computing Device | 6,708 | 7.4% |
| Total | 90,427 | 100.0% |
Internet Access in Gaston County
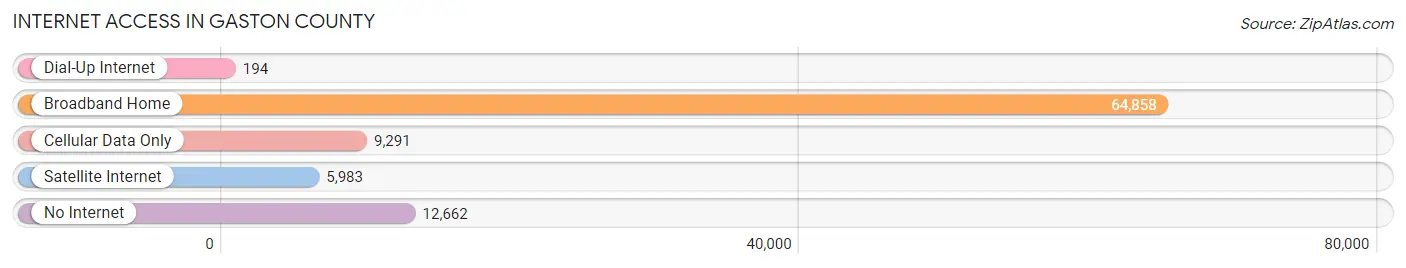
| Internet Type | # Households | % Households |
| Dial-Up Internet | 194 | 0.2% |
| Broadband Home | 64,858 | 71.7% |
| Cellular Data Only | 9,291 | 10.3% |
| Satellite Internet | 5,983 | 6.6% |
| No Internet | 12,662 | 14.0% |
| Total | 90,427 | 100.0% |
Gaston County Summary
Gaston County is located in the western part of North Carolina, and is part of the Charlotte metropolitan area. It is bordered by Cleveland County to the north, Lincoln County to the east, Mecklenburg County to the south, and Catawba County to the west. The county seat is Gastonia, and the county has a population of 206,086 as of the 2010 census.
History
Gaston County was formed in 1846 from parts of Lincoln and Mecklenburg counties. It was named for William Gaston, a member of the North Carolina Supreme Court and a prominent lawyer in the state. The county was originally home to the Catawba and Cherokee Native American tribes, and was the site of several Revolutionary War battles.
In the late 19th century, Gaston County became a major center of the textile industry, with several mills being built in the area. The county was also home to the Loray Mill, which was the site of a major labor strike in 1929. The strike was led by the National Textile Workers Union, and was one of the first major labor actions in the South.
Geography
Gaston County covers an area of 517 square miles, and is located in the foothills of the Blue Ridge Mountains. The county is mostly rural, with the majority of the population living in the cities of Gastonia and Belmont. The Catawba River runs through the county, and there are several lakes and reservoirs in the area.
Economy
Gaston County has a diverse economy, with a mix of manufacturing, agriculture, and services. The county is home to several major employers, including CaroMont Health, the Gaston County Schools, and the Gaston County government. The county is also home to several large manufacturing companies, including Parkdale Mills, the world’s largest producer of cotton yarn.
Agriculture is also an important part of the county’s economy, with the county being home to several large farms. The county is also home to several wineries, and is a popular destination for wine tours.
Demographics
As of the 2010 census, Gaston County had a population of 206,086. The population is predominantly white (83.3%), with African Americans making up 11.2% of the population. Hispanics make up 4.2% of the population, and Asians make up 1.3%.
The median household income in the county is $45,845, and the median home value is $142,400. The unemployment rate in the county is 5.2%, which is lower than the national average.
Gaston County is a diverse and vibrant community, with a rich history and a strong economy. The county is home to a variety of industries, and is a popular destination for tourists and wine enthusiasts. With its mix of rural and urban areas, Gaston County is a great place to live and work.
Common Questions
What is the Total Population of Gaston County?
Total Population of Gaston County is 228,972.
What is the Total Male Population of Gaston County?
Total Male Population of Gaston County is 111,225.
What is the Total Female Population of Gaston County?
Total Female Population of Gaston County is 117,747.
What is the Ratio of Males per 100 Females in Gaston County?
There are 94.46 Males per 100 Females in Gaston County.
What is the Ratio of Females per 100 Males in Gaston County?
There are 105.86 Females per 100 Males in Gaston County.
What is the Median Population Age in Gaston County?
Median Population Age in Gaston County is 39.9 Years.
What is the Average Family Size in Gaston County
Average Family Size in Gaston County is 3.1 People.
What is the Average Household Size in Gaston County
Average Household Size in Gaston County is 2.5 People.
What is Per Capita Income in Gaston County?
Per Capita income in Gaston County is $33,806.
What is the Median Family Income in Gaston County?
Median Family Income in Gaston County is $78,252.
What is the Median Household income in Gaston County?
Median Household Income in Gaston County is $62,628.
What is Income or Wage Gap in Gaston County?
Income or Wage Gap in Gaston County is 25.2%.
Women in Gaston County earn 74.8 cents for every dollar earned by a man.
What is Family Income Deficit in Gaston County?
Family Income Deficit in Gaston County is $11,660.
Families that are below poverty line in Gaston County earn $11,660 less on average than the poverty threshold level.
What is Inequality or Gini Index in Gaston County?
Inequality or Gini Index in Gaston County is 0.46.
How Large is the Labor Force in Gaston County?
There are 115,051 People in the Labor Forcein in Gaston County.
What is the Percentage of People in the Labor Force in Gaston County?
62.5% of People are in the Labor Force in Gaston County.
What is the Unemployment Rate in Gaston County?
Unemployment Rate in Gaston County is 4.9%.