Forsyth County, NC
Forsyth County Map

Forsyth County Overview
383,739
TOTAL POPULATION
182,947
MALE POPULATION
200,792
FEMALE POPULATION
91.11
MALES / 100 FEMALES
109.75
FEMALES / 100 MALES
38.4
MEDIAN AGE
3.1
AVG FAMILY SIZE
2.4
AVG HOUSEHOLD SIZE
$35,600
PER CAPITA INCOME
$79,040
AVG FAMILY INCOME
$61,229
AVG HOUSEHOLD INCOME
21.4%
WAGE / INCOME GAP [ % ]
78.6¢/ $1
WAGE / INCOME GAP [ $ ]
$11,601
FAMILY INCOME DEFICIT
0.48
INEQUALITY / GINI INDEX
189,555
LABOR FORCE [ PEOPLE ]
61.7%
PERCENT IN LABOR FORCE
5.6%
UNEMPLOYMENT RATE
Forsyth County Area Codes
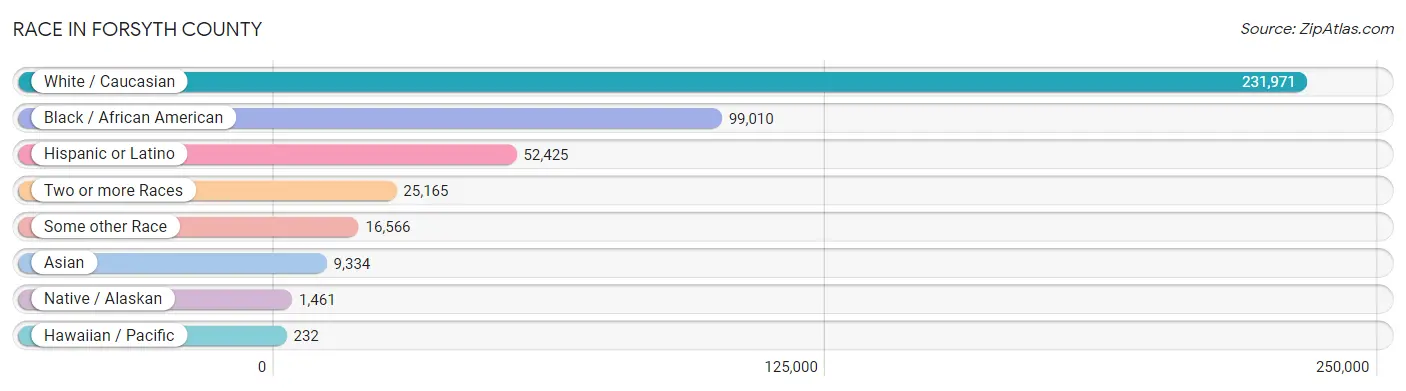
Race in Forsyth County
The most populous races in Forsyth County are White / Caucasian (231,971 | 60.5%), Black / African American (99,010 | 25.8%), and Hispanic or Latino (52,425 | 13.7%).
| Race | # Population | % Population |
| Asian | 9,334 | 2.4% |
| Black / African American | 99,010 | 25.8% |
| Hawaiian / Pacific | 232 | 0.1% |
| Hispanic or Latino | 52,425 | 13.7% |
| Native / Alaskan | 1,461 | 0.4% |
| White / Caucasian | 231,971 | 60.5% |
| Two or more Races | 25,165 | 6.6% |
| Some other Race | 16,566 | 4.3% |
| Total | 383,739 | 100.0% |
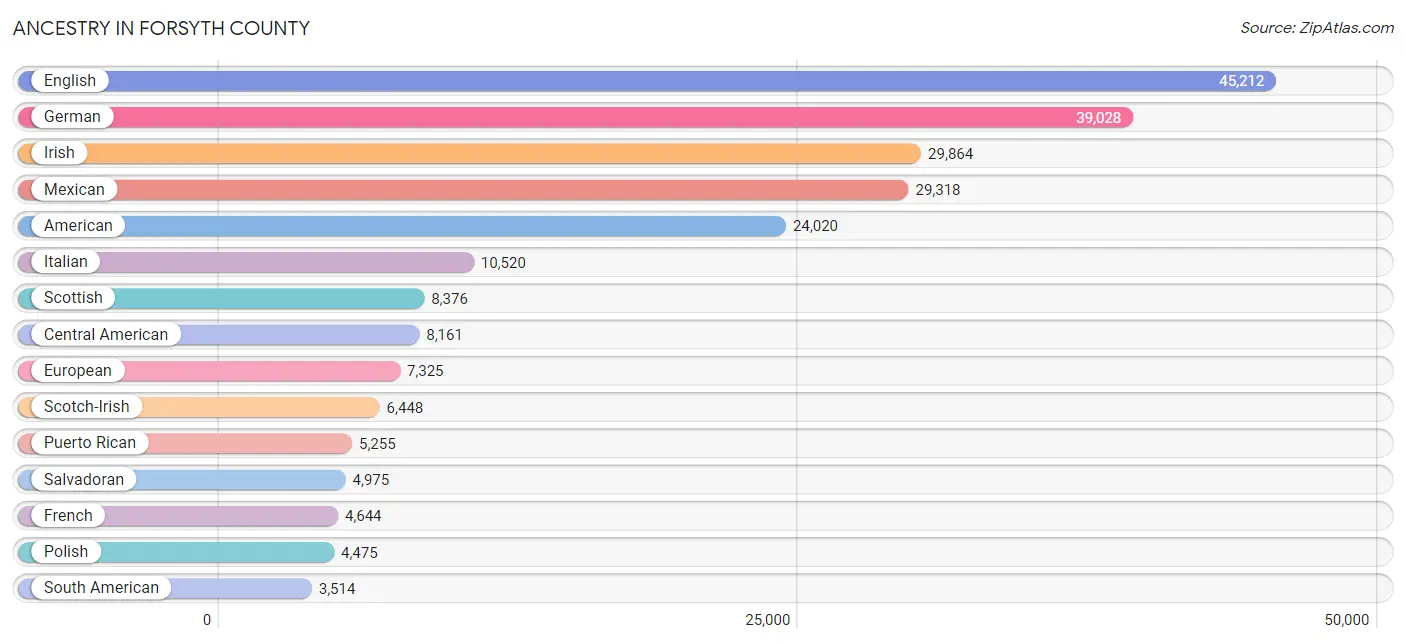
Ancestry in Forsyth County
The most populous ancestries reported in Forsyth County are English (45,212 | 11.8%), German (39,028 | 10.2%), Irish (29,864 | 7.8%), Mexican (29,318 | 7.6%), and American (24,020 | 6.3%), together accounting for 43.6% of all Forsyth County residents.
| Ancestry | # Population | % Population |
| African | 1,704 | 0.4% |
| Albanian | 33 | 0.0% |
| American | 24,020 | 6.3% |
| Apache | 19 | 0.0% |
| Arab | 1,383 | 0.4% |
| Argentinean | 199 | 0.1% |
| Armenian | 92 | 0.0% |
| Assyrian / Chaldean / Syriac | 34 | 0.0% |
| Australian | 134 | 0.0% |
| Austrian | 365 | 0.1% |
| Bahamian | 25 | 0.0% |
| Bangladeshi | 51 | 0.0% |
| Barbadian | 127 | 0.0% |
| Basque | 13 | 0.0% |
| Belgian | 223 | 0.1% |
| Belizean | 69 | 0.0% |
| Bhutanese | 570 | 0.2% |
| Blackfeet | 336 | 0.1% |
| Brazilian | 121 | 0.0% |
| British | 2,334 | 0.6% |
| British West Indian | 81 | 0.0% |
| Bulgarian | 28 | 0.0% |
| Burmese | 693 | 0.2% |
| Cajun | 9 | 0.0% |
| Canadian | 485 | 0.1% |
| Cape Verdean | 31 | 0.0% |
| Celtic | 32 | 0.0% |
| Central American | 8,161 | 2.1% |
| Central American Indian | 564 | 0.2% |
| Cherokee | 986 | 0.3% |
| Chickasaw | 14 | 0.0% |
| Chilean | 200 | 0.1% |
| Chippewa | 2 | 0.0% |
| Choctaw | 108 | 0.0% |
| Colombian | 1,535 | 0.4% |
| Comanche | 11 | 0.0% |
| Costa Rican | 95 | 0.0% |
| Creek | 21 | 0.0% |
| Croatian | 604 | 0.2% |
| Cuban | 1,273 | 0.3% |
| Czech | 533 | 0.1% |
| Czechoslovakian | 173 | 0.1% |
| Danish | 615 | 0.2% |
| Dominican | 1,649 | 0.4% |
| Dutch | 2,620 | 0.7% |
| Eastern European | 372 | 0.1% |
| Ecuadorian | 132 | 0.0% |
| Egyptian | 783 | 0.2% |
| English | 45,212 | 11.8% |
| Estonian | 46 | 0.0% |
| Ethiopian | 45 | 0.0% |
| European | 7,325 | 1.9% |
| Filipino | 374 | 0.1% |
| Finnish | 545 | 0.1% |
| French | 4,644 | 1.2% |
| French American Indian | 18 | 0.0% |
| French Canadian | 1,024 | 0.3% |
| German | 39,028 | 10.2% |
| German Russian | 33 | 0.0% |
| Ghanaian | 212 | 0.1% |
| Greek | 1,797 | 0.5% |
| Guamanian / Chamorro | 72 | 0.0% |
| Guatemalan | 1,298 | 0.3% |
| Guyanese | 228 | 0.1% |
| Haitian | 206 | 0.1% |
| Honduran | 1,264 | 0.3% |
| Hungarian | 598 | 0.2% |
| Indian (Asian) | 2,968 | 0.8% |
| Indonesian | 111 | 0.0% |
| Inupiat | 7 | 0.0% |
| Iranian | 245 | 0.1% |
| Iraqi | 5 | 0.0% |
| Irish | 29,864 | 7.8% |
| Iroquois | 113 | 0.0% |
| Israeli | 108 | 0.0% |
| Italian | 10,520 | 2.7% |
| Jamaican | 1,140 | 0.3% |
| Japanese | 158 | 0.0% |
| Kenyan | 39 | 0.0% |
| Korean | 1,779 | 0.5% |
| Laotian | 119 | 0.0% |
| Lebanese | 216 | 0.1% |
| Liberian | 29 | 0.0% |
| Lithuanian | 343 | 0.1% |
| Lumbee | 484 | 0.1% |
| Luxembourger | 19 | 0.0% |
| Macedonian | 69 | 0.0% |
| Malaysian | 12 | 0.0% |
| Mexican | 29,318 | 7.6% |
| Mexican American Indian | 383 | 0.1% |
| Mongolian | 114 | 0.0% |
| Moroccan | 99 | 0.0% |
| Native Hawaiian | 222 | 0.1% |
| Navajo | 50 | 0.0% |
| New Zealander | 50 | 0.0% |
| Nicaraguan | 299 | 0.1% |
| Nigerian | 427 | 0.1% |
| Northern European | 342 | 0.1% |
| Norwegian | 1,988 | 0.5% |
| Pakistani | 296 | 0.1% |
| Palestinian | 38 | 0.0% |
| Panamanian | 230 | 0.1% |
| Pennsylvania German | 40 | 0.0% |
| Peruvian | 635 | 0.2% |
| Polish | 4,475 | 1.2% |
| Portuguese | 516 | 0.1% |
| Potawatomi | 18 | 0.0% |
| Puerto Rican | 5,255 | 1.4% |
| Romanian | 186 | 0.1% |
| Russian | 912 | 0.2% |
| Salvadoran | 4,975 | 1.3% |
| Scandinavian | 1,168 | 0.3% |
| Scotch-Irish | 6,448 | 1.7% |
| Scottish | 8,376 | 2.2% |
| Senegalese | 311 | 0.1% |
| Serbian | 133 | 0.0% |
| Sioux | 91 | 0.0% |
| Slavic | 499 | 0.1% |
| Slovak | 403 | 0.1% |
| Slovene | 79 | 0.0% |
| South African | 13 | 0.0% |
| South American | 3,514 | 0.9% |
| South American Indian | 83 | 0.0% |
| Spaniard | 438 | 0.1% |
| Spanish | 471 | 0.1% |
| Spanish American | 25 | 0.0% |
| Sri Lankan | 886 | 0.2% |
| Subsaharan African | 3,235 | 0.8% |
| Sudanese | 161 | 0.0% |
| Swedish | 1,798 | 0.5% |
| Swiss | 945 | 0.3% |
| Syrian | 22 | 0.0% |
| Thai | 2,503 | 0.6% |
| Trinidadian and Tobagonian | 86 | 0.0% |
| Turkish | 220 | 0.1% |
| U.S. Virgin Islander | 10 | 0.0% |
| Ugandan | 136 | 0.0% |
| Ukrainian | 474 | 0.1% |
| Uruguayan | 227 | 0.1% |
| Venezuelan | 586 | 0.2% |
| Vietnamese | 25 | 0.0% |
| Welsh | 2,626 | 0.7% |
| West Indian | 342 | 0.1% |
| Yakama | 19 | 0.0% |
| Yugoslavian | 117 | 0.0% |
| Zimbabwean | 56 | 0.0% | View All 146 Rows |
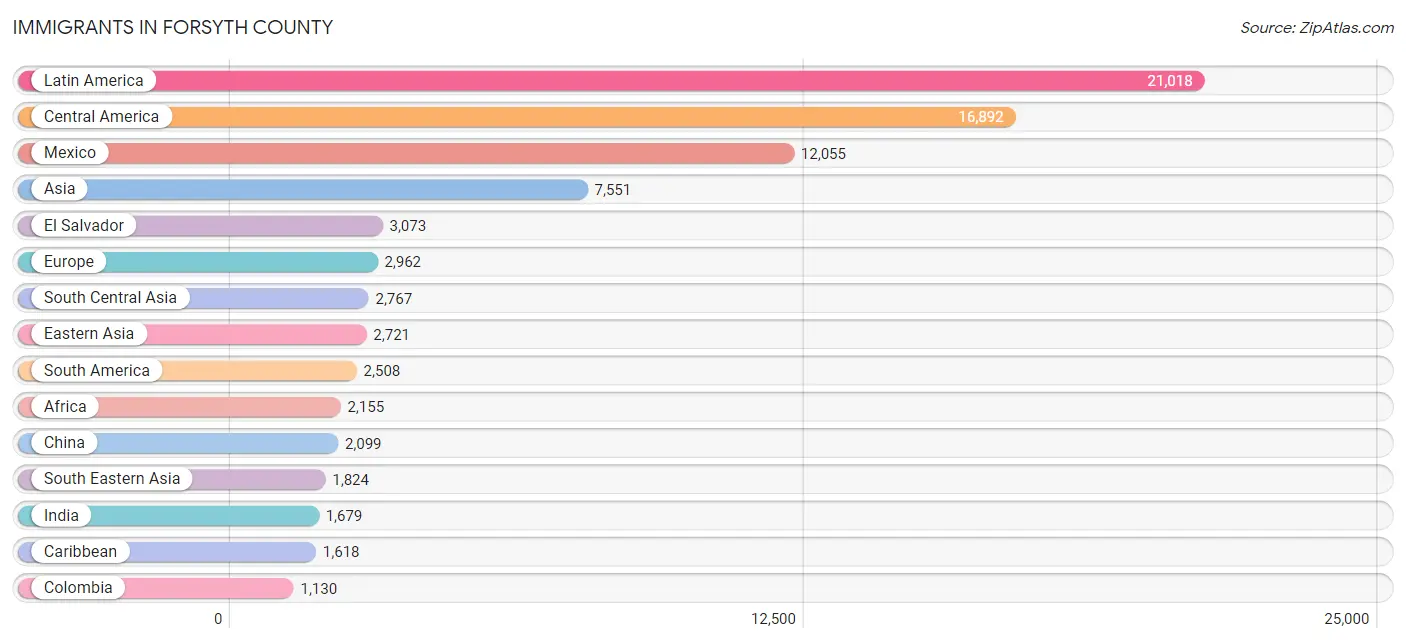
Immigrants in Forsyth County
The most numerous immigrant groups reported in Forsyth County came from Latin America (21,018 | 5.5%), Central America (16,892 | 4.4%), Mexico (12,055 | 3.1%), Asia (7,551 | 2.0%), and El Salvador (3,073 | 0.8%), together accounting for 15.8% of all Forsyth County residents.
| Immigration Origin | # Population | % Population |
| Africa | 2,155 | 0.6% |
| Albania | 27 | 0.0% |
| Argentina | 64 | 0.0% |
| Asia | 7,551 | 2.0% |
| Australia | 72 | 0.0% |
| Austria | 40 | 0.0% |
| Bangladesh | 27 | 0.0% |
| Barbados | 20 | 0.0% |
| Belarus | 21 | 0.0% |
| Belgium | 9 | 0.0% |
| Bosnia and Herzegovina | 108 | 0.0% |
| Brazil | 238 | 0.1% |
| Cambodia | 81 | 0.0% |
| Canada | 360 | 0.1% |
| Caribbean | 1,618 | 0.4% |
| Central America | 16,892 | 4.4% |
| Chile | 96 | 0.0% |
| China | 2,099 | 0.5% |
| Colombia | 1,130 | 0.3% |
| Costa Rica | 72 | 0.0% |
| Croatia | 1 | 0.0% |
| Cuba | 287 | 0.1% |
| Czechoslovakia | 28 | 0.0% |
| Denmark | 9 | 0.0% |
| Dominican Republic | 892 | 0.2% |
| Eastern Africa | 375 | 0.1% |
| Eastern Asia | 2,721 | 0.7% |
| Eastern Europe | 916 | 0.2% |
| Ecuador | 72 | 0.0% |
| Egypt | 654 | 0.2% |
| El Salvador | 3,073 | 0.8% |
| England | 355 | 0.1% |
| Eritrea | 7 | 0.0% |
| Ethiopia | 31 | 0.0% |
| Europe | 2,962 | 0.8% |
| France | 60 | 0.0% |
| Germany | 530 | 0.1% |
| Ghana | 215 | 0.1% |
| Greece | 183 | 0.1% |
| Guatemala | 920 | 0.2% |
| Guyana | 125 | 0.0% |
| Haiti | 56 | 0.0% |
| Honduras | 611 | 0.2% |
| Hong Kong | 111 | 0.0% |
| Hungary | 47 | 0.0% |
| India | 1,679 | 0.4% |
| Indonesia | 87 | 0.0% |
| Iran | 216 | 0.1% |
| Iraq | 16 | 0.0% |
| Ireland | 150 | 0.0% |
| Israel | 27 | 0.0% |
| Italy | 186 | 0.1% |
| Jamaica | 206 | 0.1% |
| Japan | 260 | 0.1% |
| Jordan | 34 | 0.0% |
| Kenya | 131 | 0.0% |
| Korea | 362 | 0.1% |
| Kuwait | 30 | 0.0% |
| Laos | 4 | 0.0% |
| Latin America | 21,018 | 5.5% |
| Lebanon | 62 | 0.0% |
| Liberia | 139 | 0.0% |
| Malaysia | 30 | 0.0% |
| Mexico | 12,055 | 3.1% |
| Middle Africa | 21 | 0.0% |
| Moldova | 64 | 0.0% |
| Morocco | 29 | 0.0% |
| Nepal | 362 | 0.1% |
| Netherlands | 14 | 0.0% |
| Nicaragua | 131 | 0.0% |
| Nigeria | 165 | 0.0% |
| Northern Africa | 711 | 0.2% |
| Northern Europe | 934 | 0.2% |
| Norway | 41 | 0.0% |
| Oceania | 89 | 0.0% |
| Pakistan | 362 | 0.1% |
| Panama | 30 | 0.0% |
| Peru | 322 | 0.1% |
| Philippines | 890 | 0.2% |
| Poland | 205 | 0.1% |
| Portugal | 20 | 0.0% |
| Romania | 72 | 0.0% |
| Russia | 246 | 0.1% |
| Saudi Arabia | 6 | 0.0% |
| Scotland | 57 | 0.0% |
| Senegal | 176 | 0.1% |
| Singapore | 48 | 0.0% |
| South Africa | 142 | 0.0% |
| South America | 2,508 | 0.6% |
| South Central Asia | 2,767 | 0.7% |
| South Eastern Asia | 1,824 | 0.5% |
| Southern Europe | 431 | 0.1% |
| Spain | 42 | 0.0% |
| Sudan | 28 | 0.0% |
| Sweden | 108 | 0.0% |
| Syria | 5 | 0.0% |
| Taiwan | 272 | 0.1% |
| Thailand | 222 | 0.1% |
| Trinidad and Tobago | 9 | 0.0% |
| Turkey | 34 | 0.0% |
| Uganda | 95 | 0.0% |
| Ukraine | 58 | 0.0% |
| Uruguay | 141 | 0.0% |
| Venezuela | 320 | 0.1% |
| Vietnam | 351 | 0.1% |
| West Indies | 34 | 0.0% |
| Western Africa | 791 | 0.2% |
| Western Asia | 239 | 0.1% |
| Western Europe | 681 | 0.2% |
| Yemen | 9 | 0.0% |
| Zaire | 21 | 0.0% |
| Zimbabwe | 56 | 0.0% | View All 112 Rows |
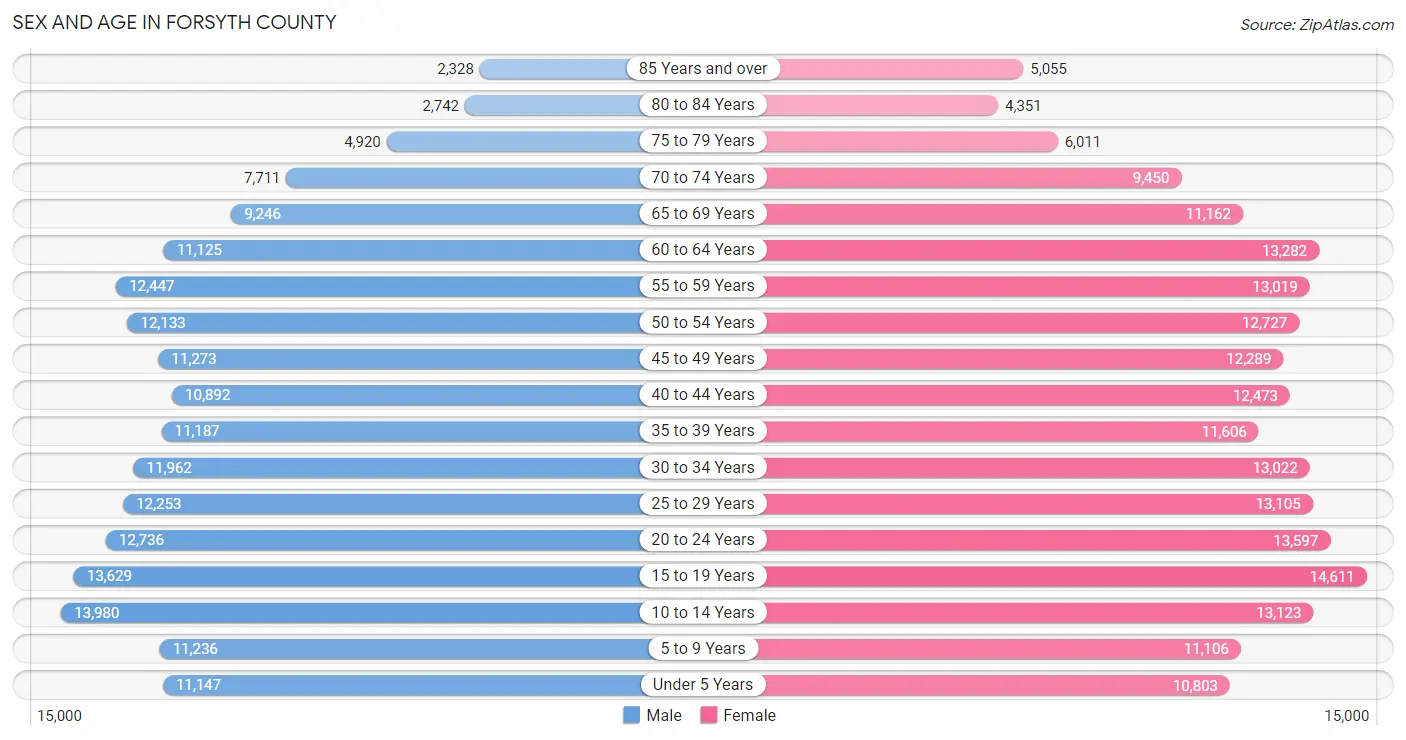
Sex and Age in Forsyth County
Sex and Age in Forsyth County
The most populous age groups in Forsyth County are 10 to 14 Years (13,980 | 7.6%) for men and 15 to 19 Years (14,611 | 7.3%) for women.
| Age Bracket | Male | Female |
| Under 5 Years | 11,147 (6.1%) | 10,803 (5.4%) |
| 5 to 9 Years | 11,236 (6.1%) | 11,106 (5.5%) |
| 10 to 14 Years | 13,980 (7.6%) | 13,123 (6.5%) |
| 15 to 19 Years | 13,629 (7.4%) | 14,611 (7.3%) |
| 20 to 24 Years | 12,736 (7.0%) | 13,597 (6.8%) |
| 25 to 29 Years | 12,253 (6.7%) | 13,105 (6.5%) |
| 30 to 34 Years | 11,962 (6.5%) | 13,022 (6.5%) |
| 35 to 39 Years | 11,187 (6.1%) | 11,606 (5.8%) |
| 40 to 44 Years | 10,892 (5.9%) | 12,473 (6.2%) |
| 45 to 49 Years | 11,273 (6.2%) | 12,289 (6.1%) |
| 50 to 54 Years | 12,133 (6.6%) | 12,727 (6.3%) |
| 55 to 59 Years | 12,447 (6.8%) | 13,019 (6.5%) |
| 60 to 64 Years | 11,125 (6.1%) | 13,282 (6.6%) |
| 65 to 69 Years | 9,246 (5.1%) | 11,162 (5.6%) |
| 70 to 74 Years | 7,711 (4.2%) | 9,450 (4.7%) |
| 75 to 79 Years | 4,920 (2.7%) | 6,011 (3.0%) |
| 80 to 84 Years | 2,742 (1.5%) | 4,351 (2.2%) |
| 85 Years and over | 2,328 (1.3%) | 5,055 (2.5%) |
| Total | 182,947 (100.0%) | 200,792 (100.0%) |
Families and Households in Forsyth County
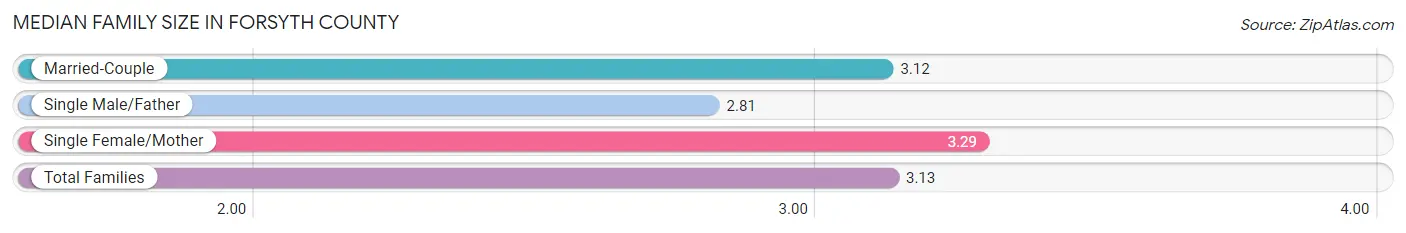
Median Family Size in Forsyth County
The median family size in Forsyth County is 3.13 persons per family, with single female/mother families (21,631 | 22.9%) accounting for the largest median family size of 3.29 persons per family. On the other hand, single male/father families (6,597 | 7.0%) represent the smallest median family size with 2.81 persons per family.
| Family Type | # Families | Family Size |
| Married-Couple | 66,265 (70.1%) | 3.12 |
| Single Male/Father | 6,597 (7.0%) | 2.81 |
| Single Female/Mother | 21,631 (22.9%) | 3.29 |
| Total Families | 94,493 (100.0%) | 3.13 |
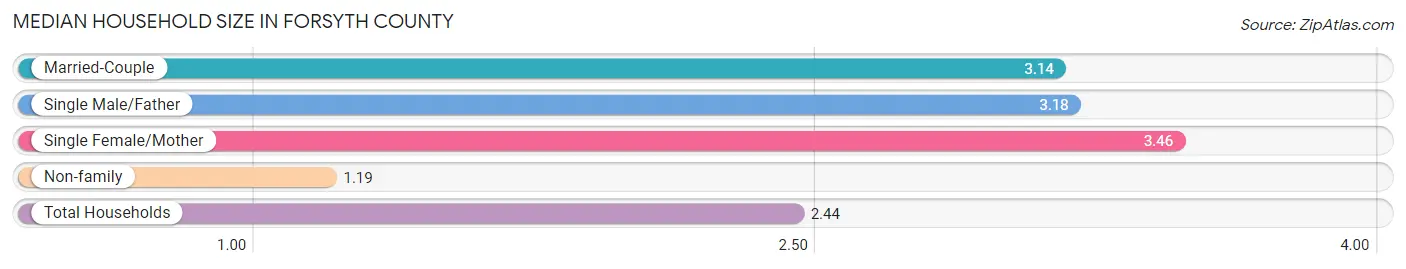
Median Household Size in Forsyth County
The median household size in Forsyth County is 2.44 persons per household, with single female/mother households (21,631 | 14.1%) accounting for the largest median household size of 3.46 persons per household. non-family households (58,603 | 38.3%) represent the smallest median household size with 1.19 persons per household.
| Household Type | # Households | Household Size |
| Married-Couple | 66,265 (43.3%) | 3.14 |
| Single Male/Father | 6,597 (4.3%) | 3.18 |
| Single Female/Mother | 21,631 (14.1%) | 3.46 |
| Non-family | 58,603 (38.3%) | 1.19 |
| Total Households | 153,096 (100.0%) | 2.44 |
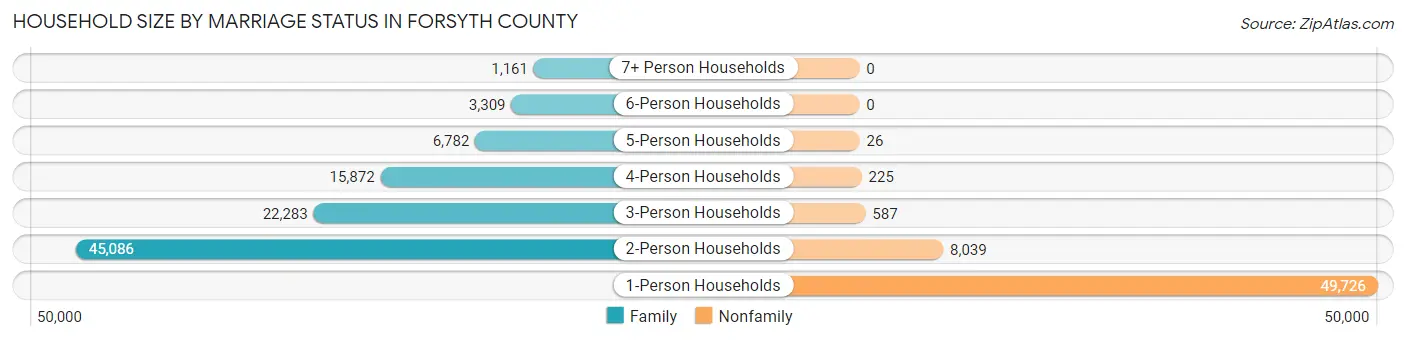
Household Size by Marriage Status in Forsyth County
Out of a total of 153,096 households in Forsyth County, 94,493 (61.7%) are family households, while 58,603 (38.3%) are nonfamily households. The most numerous type of family households are 2-person households, comprising 45,086, and the most common type of nonfamily households are 1-person households, comprising 49,726.
| Household Size | Family Households | Nonfamily Households |
| 1-Person Households | - | 49,726 (32.5%) |
| 2-Person Households | 45,086 (29.4%) | 8,039 (5.2%) |
| 3-Person Households | 22,283 (14.5%) | 587 (0.4%) |
| 4-Person Households | 15,872 (10.4%) | 225 (0.2%) |
| 5-Person Households | 6,782 (4.4%) | 26 (0.0%) |
| 6-Person Households | 3,309 (2.2%) | 0 (0.0%) |
| 7+ Person Households | 1,161 (0.8%) | 0 (0.0%) |
| Total | 94,493 (61.7%) | 58,603 (38.3%) |
Female Fertility in Forsyth County
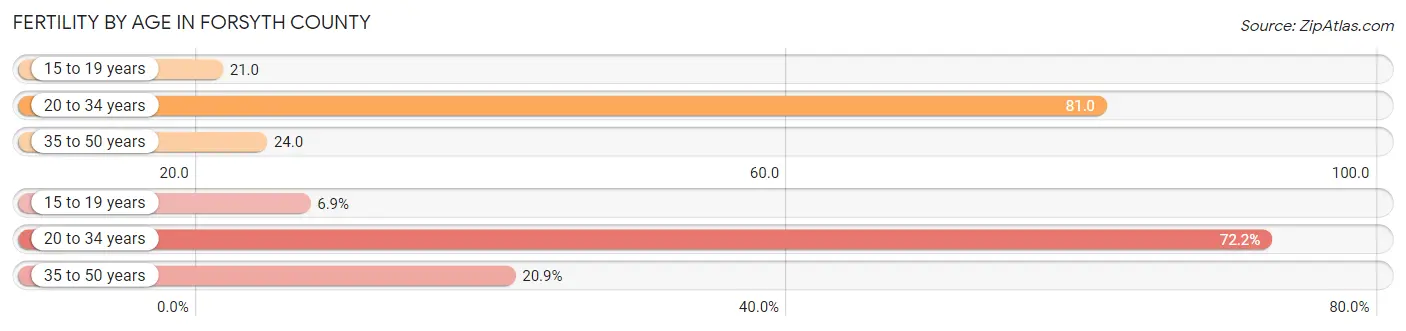
Fertility by Age in Forsyth County
Average fertility rate in Forsyth County is 48.0 births per 1,000 women. Women in the age bracket of 20 to 34 years have the highest fertility rate with 81.0 births per 1,000 women. Women in the age bracket of 20 to 34 years acount for 72.2% of all women with births.
| Age Bracket | Women with Births | Births / 1,000 Women |
| 15 to 19 years | 309 (6.9%) | 21.0 |
| 20 to 34 years | 3,214 (72.2%) | 81.0 |
| 35 to 50 years | 928 (20.8%) | 24.0 |
| Total | 4,451 (100.0%) | 48.0 |
Fertility by Age by Marriage Status in Forsyth County
59.6% of women with births (4,451) in Forsyth County are married. The highest percentage of unmarried women with births falls into 15 to 19 years age bracket with 98.1% of them unmarried at the time of birth, while the lowest percentage of unmarried women with births belong to 35 to 50 years age bracket with 12.8% of them unmarried.
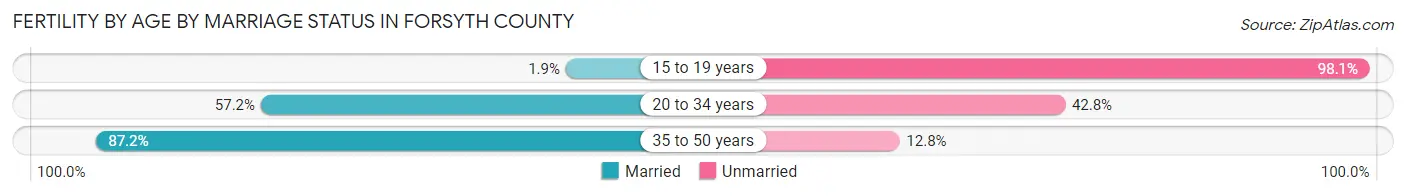
| Age Bracket | Married | Unmarried |
| 15 to 19 years | 6 (1.9%) | 303 (98.1%) |
| 20 to 34 years | 1,838 (57.2%) | 1,376 (42.8%) |
| 35 to 50 years | 809 (87.2%) | 119 (12.8%) |
| Total | 2,653 (59.6%) | 1,798 (40.4%) |
Fertility by Education in Forsyth County
Average fertility rate in Forsyth County is 48.0 births per 1,000 women. Women with the education attainment of bachelor's degree have the highest fertility rate of 64.0 births per 1,000 women, while women with the education attainment of less than high school have the lowest fertility at 22.0 births per 1,000 women. Women with the education attainment of high school diploma represent 27.7% of all women with births.
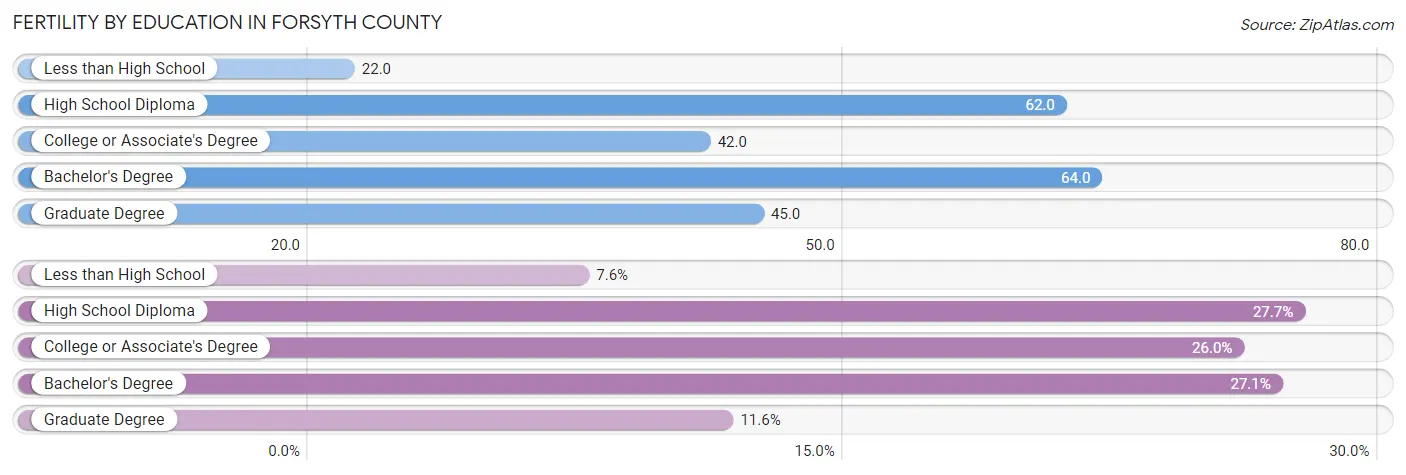
| Educational Attainment | Women with Births | Births / 1,000 Women |
| Less than High School | 338 (7.6%) | 22.0 |
| High School Diploma | 1,233 (27.7%) | 62.0 |
| College or Associate's Degree | 1,157 (26.0%) | 42.0 |
| Bachelor's Degree | 1,205 (27.1%) | 64.0 |
| Graduate Degree | 518 (11.6%) | 45.0 |
| Total | 4,451 (100.0%) | 48.0 |
Fertility by Education by Marriage Status in Forsyth County
40.4% of women with births in Forsyth County are unmarried. Women with the educational attainment of bachelor's degree are most likely to be married with 95.2% of them married at childbirth, while women with the educational attainment of less than high school are least likely to be married with 75.4% of them unmarried at childbirth.
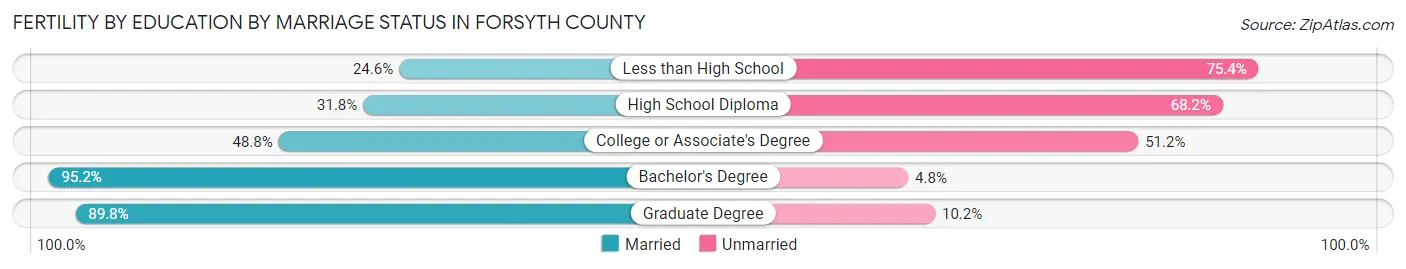
| Educational Attainment | Married | Unmarried |
| Less than High School | 83 (24.6%) | 255 (75.4%) |
| High School Diploma | 392 (31.8%) | 841 (68.2%) |
| College or Associate's Degree | 565 (48.8%) | 592 (51.2%) |
| Bachelor's Degree | 1,147 (95.2%) | 58 (4.8%) |
| Graduate Degree | 465 (89.8%) | 53 (10.2%) |
| Total | 2,653 (59.6%) | 1,798 (40.4%) |
Income in Forsyth County
Income Overview in Forsyth County
Per Capita Income in Forsyth County is $35,600, while median incomes of families and households are $79,040 and $61,229 respectively.
| Characteristic | Number | Measure |
| Per Capita Income | 383,739 | $35,600 |
| Median Family Income | 94,493 | $79,040 |
| Mean Family Income | 94,493 | $106,742 |
| Median Household Income | 153,096 | $61,229 |
| Mean Household Income | 153,096 | $86,880 |
| Income Deficit | 94,493 | $11,601 |
| Wage / Income Gap (%) | 383,739 | 21.35% |
| Wage / Income Gap ($) | 383,739 | 78.65¢ per $1 |
| Gini / Inequality Index | 383,739 | 0.48 |
Earnings by Sex in Forsyth County
Average Earnings in Forsyth County are $37,158, $42,094 for men and $33,105 for women, a difference of 21.3%.
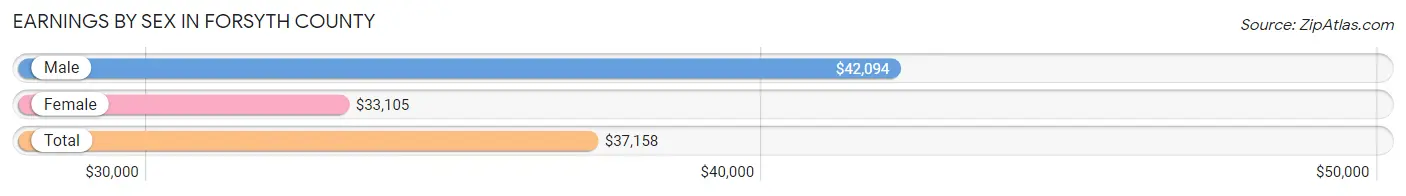
| Sex | Number | Average Earnings |
| Male | 99,280 (50.6%) | $42,094 |
| Female | 96,851 (49.4%) | $33,105 |
| Total | 196,131 (100.0%) | $37,158 |
Earnings by Sex by Income Bracket in Forsyth County
The most common earnings brackets in Forsyth County are $100,000+ for men (15,667 | 15.8%) and $100,000+ for women (7,239 | 7.5%).
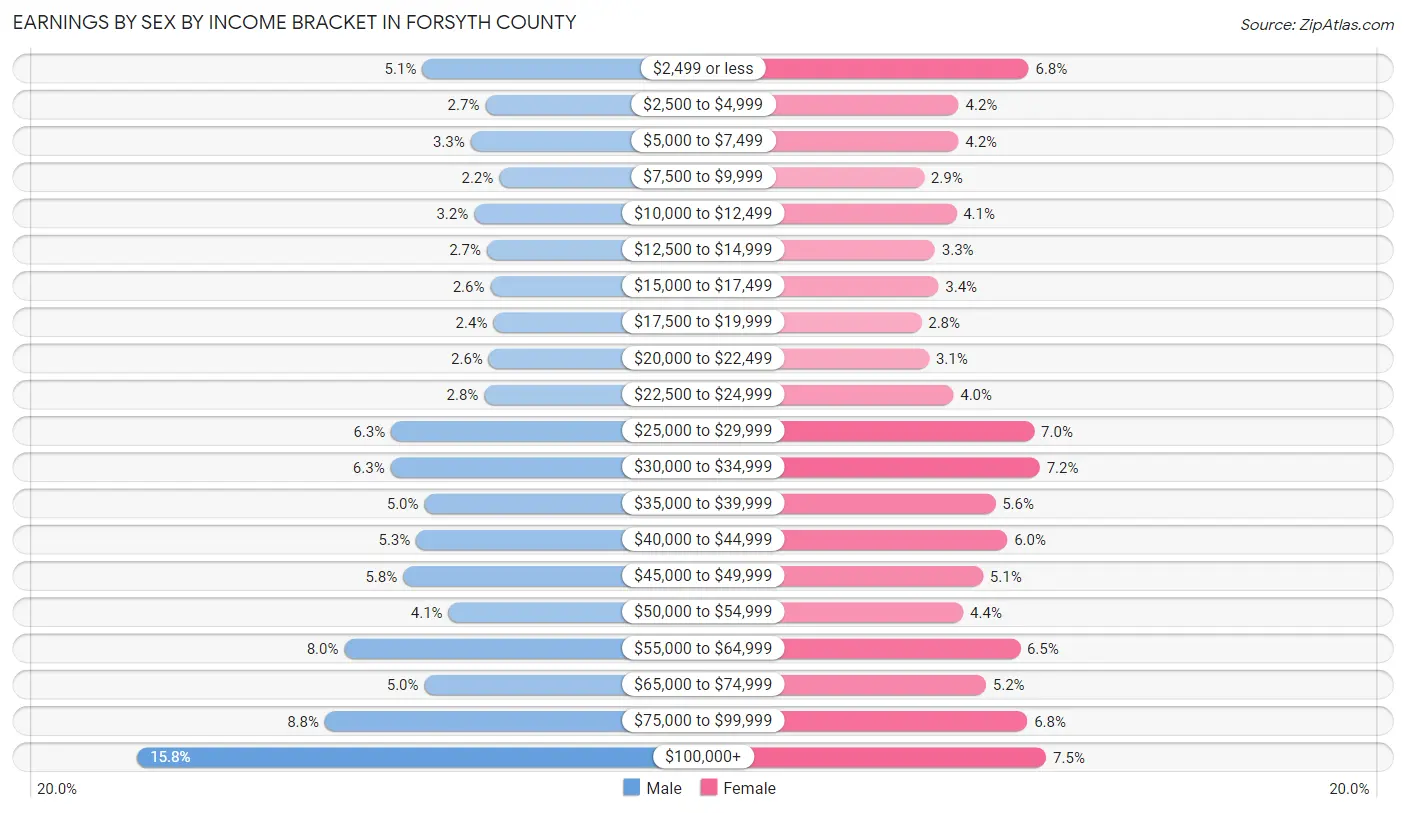
| Income | Male | Female |
| $2,499 or less | 5,059 (5.1%) | 6,598 (6.8%) |
| $2,500 to $4,999 | 2,722 (2.7%) | 4,060 (4.2%) |
| $5,000 to $7,499 | 3,269 (3.3%) | 4,053 (4.2%) |
| $7,500 to $9,999 | 2,207 (2.2%) | 2,803 (2.9%) |
| $10,000 to $12,499 | 3,142 (3.2%) | 3,968 (4.1%) |
| $12,500 to $14,999 | 2,664 (2.7%) | 3,198 (3.3%) |
| $15,000 to $17,499 | 2,534 (2.5%) | 3,325 (3.4%) |
| $17,500 to $19,999 | 2,427 (2.4%) | 2,700 (2.8%) |
| $20,000 to $22,499 | 2,588 (2.6%) | 2,983 (3.1%) |
| $22,500 to $24,999 | 2,760 (2.8%) | 3,861 (4.0%) |
| $25,000 to $29,999 | 6,220 (6.3%) | 6,802 (7.0%) |
| $30,000 to $34,999 | 6,240 (6.3%) | 7,004 (7.2%) |
| $35,000 to $39,999 | 4,980 (5.0%) | 5,389 (5.6%) |
| $40,000 to $44,999 | 5,293 (5.3%) | 5,822 (6.0%) |
| $45,000 to $49,999 | 5,782 (5.8%) | 4,939 (5.1%) |
| $50,000 to $54,999 | 4,086 (4.1%) | 4,226 (4.4%) |
| $55,000 to $64,999 | 7,967 (8.0%) | 6,288 (6.5%) |
| $65,000 to $74,999 | 4,988 (5.0%) | 5,042 (5.2%) |
| $75,000 to $99,999 | 8,685 (8.7%) | 6,551 (6.8%) |
| $100,000+ | 15,667 (15.8%) | 7,239 (7.5%) |
| Total | 99,280 (100.0%) | 96,851 (100.0%) |
Earnings by Sex by Educational Attainment in Forsyth County
Average earnings in Forsyth County are $47,592 for men and $37,945 for women, a difference of 20.3%. Men with an educational attainment of graduate degree enjoy the highest average annual earnings of $96,618, while those with less than high school education earn the least with $29,688. Women with an educational attainment of graduate degree earn the most with the average annual earnings of $64,039, while those with less than high school education have the smallest earnings of $22,881.
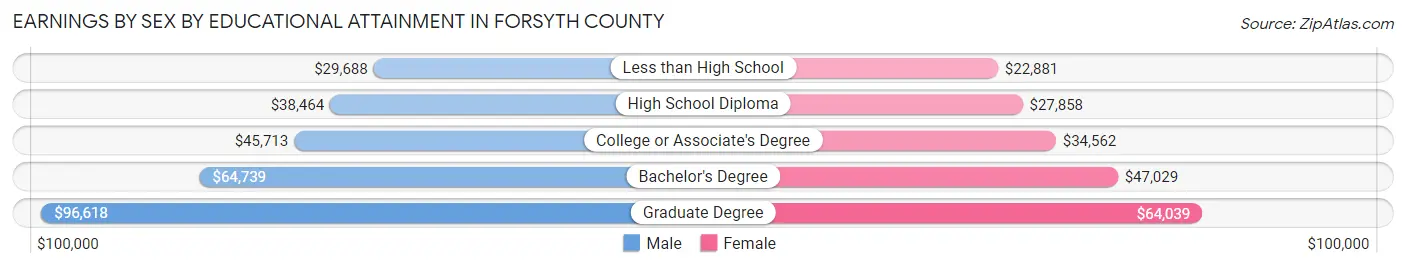
| Educational Attainment | Male Income | Female Income |
| Less than High School | $29,688 | $22,881 |
| High School Diploma | $38,464 | $27,858 |
| College or Associate's Degree | $45,713 | $34,562 |
| Bachelor's Degree | $64,739 | $47,029 |
| Graduate Degree | $96,618 | $64,039 |
| Total | $47,592 | $37,945 |
Family Income in Forsyth County
Family Income Brackets in Forsyth County
According to the Forsyth County family income data, there are 18,237 families falling into the $100,000 to $149,999 income range, which is the most common income bracket and makes up 19.3% of all families. Conversely, the $10,000 to $14,999 income bracket is the least frequent group with only 1,890 families (2.0%) belonging to this category.
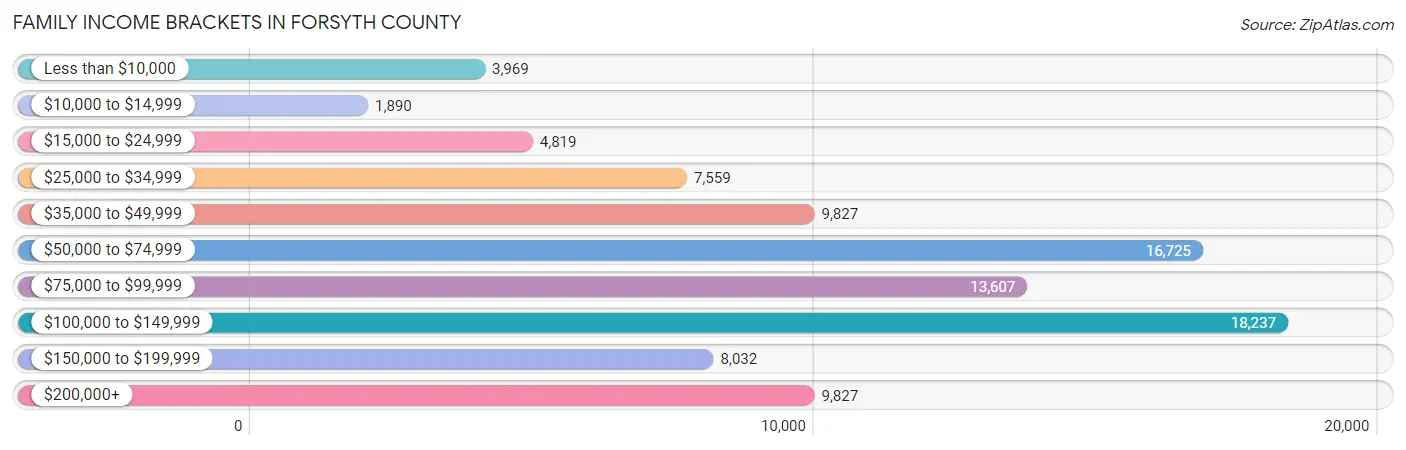
| Income Bracket | # Families | % Families |
| Less than $10,000 | 3,969 | 4.2% |
| $10,000 to $14,999 | 1,890 | 2.0% |
| $15,000 to $24,999 | 4,819 | 5.1% |
| $25,000 to $34,999 | 7,559 | 8.0% |
| $35,000 to $49,999 | 9,827 | 10.4% |
| $50,000 to $74,999 | 16,725 | 17.7% |
| $75,000 to $99,999 | 13,607 | 14.4% |
| $100,000 to $149,999 | 18,237 | 19.3% |
| $150,000 to $199,999 | 8,032 | 8.5% |
| $200,000+ | 9,827 | 10.4% |
Family Income by Famaliy Size in Forsyth County
4-person families (14,824 | 15.7%) account for the highest median family income in Forsyth County with $104,611 per family, while 2-person families (47,581 | 50.3%) have the highest median income of $36,168 per family member.

| Income Bracket | # Families | Median Income |
| 2-Person Families | 47,581 (50.3%) | $72,337 |
| 3-Person Families | 21,930 (23.2%) | $83,866 |
| 4-Person Families | 14,824 (15.7%) | $104,611 |
| 5-Person Families | 6,190 (6.6%) | $84,731 |
| 6-Person Families | 2,965 (3.1%) | $87,215 |
| 7+ Person Families | 1,003 (1.1%) | $76,370 |
| Total | 94,493 (100.0%) | $79,040 |
Family Income by Number of Earners in Forsyth County
The median family income in Forsyth County is $79,040, with families comprising 3+ earners (8,630) having the highest median family income of $133,937, while families with no earners (15,251) have the lowest median family income of $47,396, accounting for 9.1% and 16.1% of families, respectively.
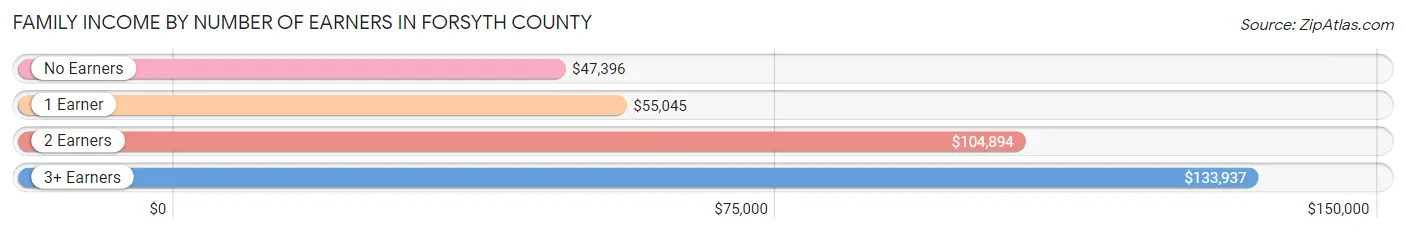
| Number of Earners | # Families | Median Income |
| No Earners | 15,251 (16.1%) | $47,396 |
| 1 Earner | 32,960 (34.9%) | $55,045 |
| 2 Earners | 37,652 (39.9%) | $104,894 |
| 3+ Earners | 8,630 (9.1%) | $133,937 |
| Total | 94,493 (100.0%) | $79,040 |
Household Income in Forsyth County
Household Income Brackets in Forsyth County
With 26,026 households falling in the category, the $50,000 to $74,999 income range is the most frequent in Forsyth County, accounting for 17.0% of all households. In contrast, only 7,042 households (4.6%) fall into the $10,000 to $14,999 income bracket, making it the least populous group.

| Income Bracket | # Households | % Households |
| Less than $10,000 | 9,339 | 6.1% |
| $10,000 to $14,999 | 7,042 | 4.6% |
| $15,000 to $24,999 | 13,472 | 8.8% |
| $25,000 to $34,999 | 15,310 | 10.0% |
| $35,000 to $49,999 | 18,678 | 12.2% |
| $50,000 to $74,999 | 26,026 | 17.0% |
| $75,000 to $99,999 | 19,596 | 12.8% |
| $100,000 to $149,999 | 22,811 | 14.9% |
| $150,000 to $199,999 | 9,798 | 6.4% |
| $200,000+ | 11,023 | 7.2% |
Household Income by Householder Age in Forsyth County
The median household income in Forsyth County is $61,229, with the highest median household income of $73,528 found in the 45 to 64 years age bracket for the primary householder. A total of 56,871 households (37.1%) fall into this category. Meanwhile, the 15 to 24 years age bracket for the primary householder has the lowest median household income of $29,434, with 5,542 households (3.6%) in this group.
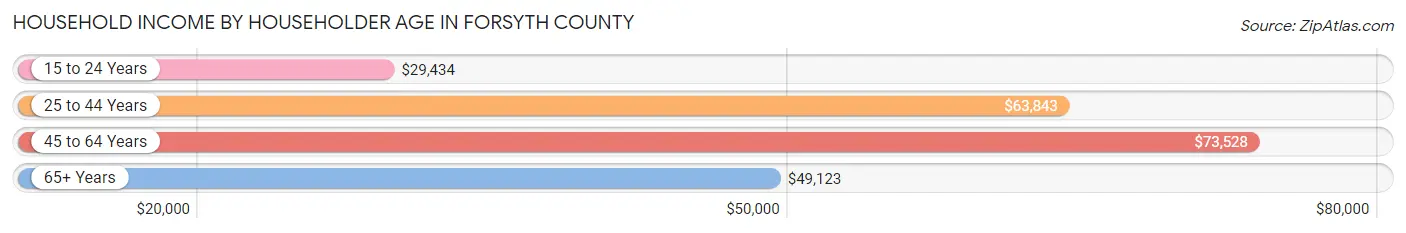
| Income Bracket | # Households | Median Income |
| 15 to 24 Years | 5,542 (3.6%) | $29,434 |
| 25 to 44 Years | 49,998 (32.7%) | $63,843 |
| 45 to 64 Years | 56,871 (37.1%) | $73,528 |
| 65+ Years | 40,685 (26.6%) | $49,123 |
| Total | 153,096 (100.0%) | $61,229 |
Poverty in Forsyth County
Income Below Poverty by Sex and Age in Forsyth County
With 13.9% poverty level for males and 16.4% for females among the residents of Forsyth County, 15 year old males and 12 to 14 year old females are the most vulnerable to poverty, with 924 males (33.6%) and 2,225 females (27.3%) in their respective age groups living below the poverty level.
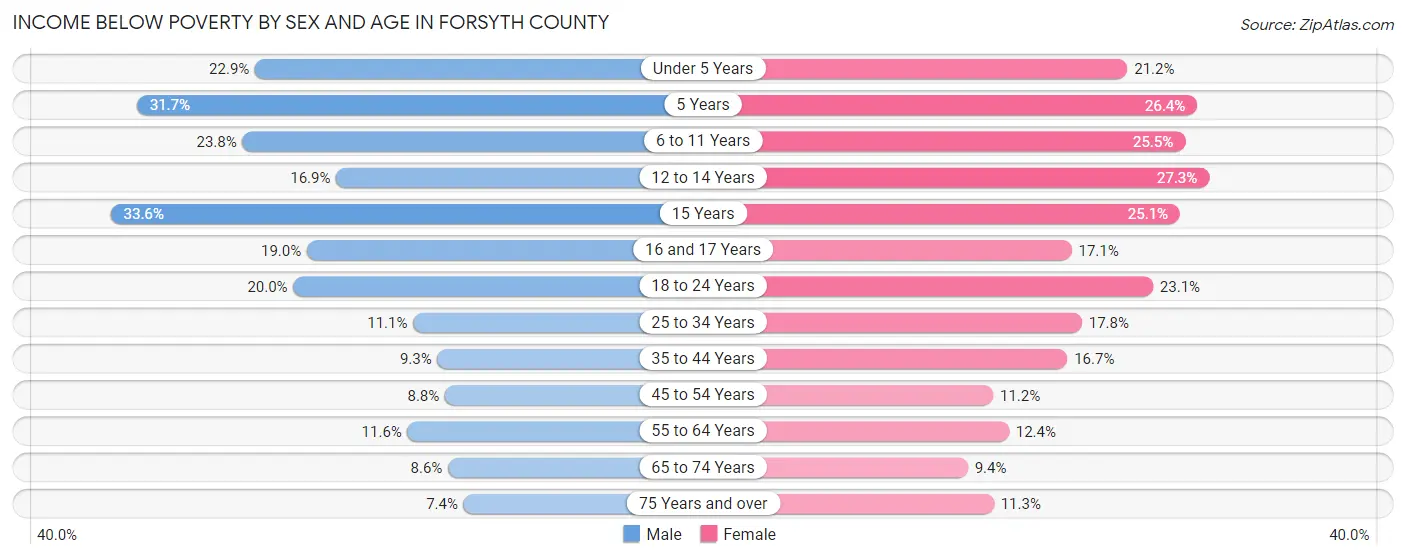
| Age Bracket | Male | Female |
| Under 5 Years | 2,516 (22.9%) | 2,264 (21.2%) |
| 5 Years | 635 (31.7%) | 534 (26.4%) |
| 6 to 11 Years | 3,707 (23.8%) | 3,542 (25.5%) |
| 12 to 14 Years | 1,244 (16.9%) | 2,225 (27.3%) |
| 15 Years | 924 (33.6%) | 593 (25.1%) |
| 16 and 17 Years | 952 (19.0%) | 923 (17.1%) |
| 18 to 24 Years | 3,115 (20.0%) | 3,673 (23.1%) |
| 25 to 34 Years | 2,671 (11.1%) | 4,633 (17.8%) |
| 35 to 44 Years | 2,043 (9.3%) | 4,012 (16.7%) |
| 45 to 54 Years | 2,045 (8.8%) | 2,804 (11.2%) |
| 55 to 64 Years | 2,701 (11.6%) | 3,246 (12.4%) |
| 65 to 74 Years | 1,438 (8.6%) | 1,920 (9.3%) |
| 75 Years and over | 724 (7.4%) | 1,676 (11.3%) |
| Total | 24,715 (13.9%) | 32,045 (16.4%) |
Income Above Poverty by Sex and Age in Forsyth County
According to the poverty statistics in Forsyth County, males aged 75 years and over and females aged 65 to 74 years are the age groups that are most secure financially, with 92.6% of males and 90.6% of females in these age groups living above the poverty line.
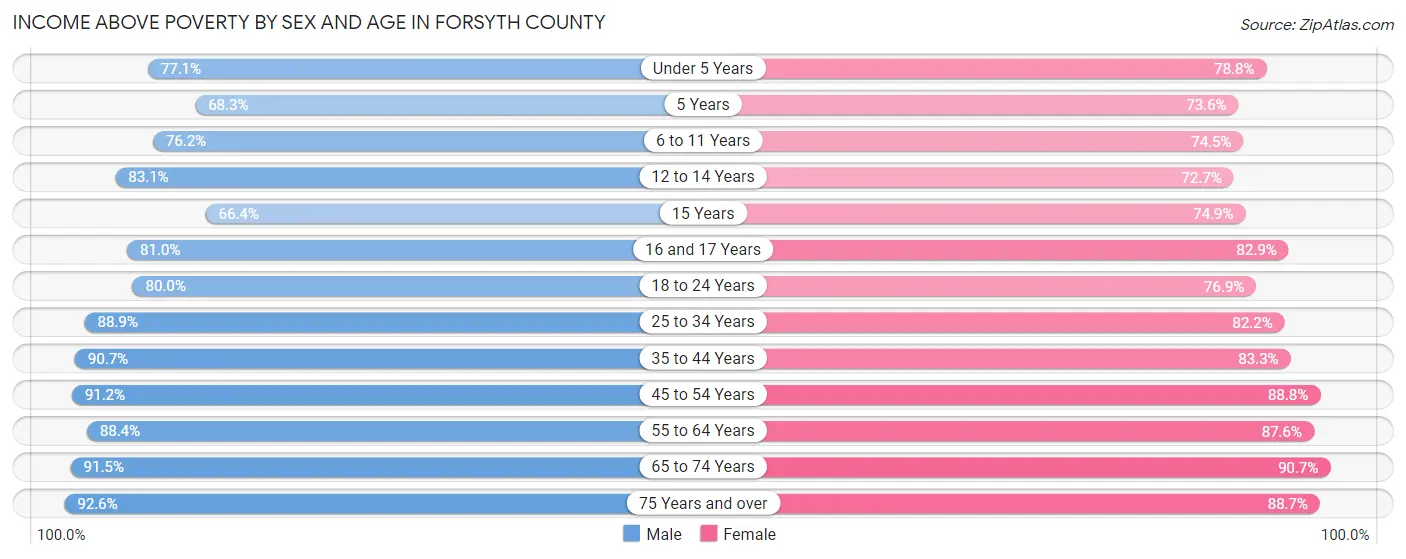
| Age Bracket | Male | Female |
| Under 5 Years | 8,481 (77.1%) | 8,415 (78.8%) |
| 5 Years | 1,370 (68.3%) | 1,490 (73.6%) |
| 6 to 11 Years | 11,855 (76.2%) | 10,360 (74.5%) |
| 12 to 14 Years | 6,133 (83.1%) | 5,935 (72.7%) |
| 15 Years | 1,825 (66.4%) | 1,770 (74.9%) |
| 16 and 17 Years | 4,050 (81.0%) | 4,488 (82.9%) |
| 18 to 24 Years | 12,426 (80.0%) | 12,230 (76.9%) |
| 25 to 34 Years | 21,316 (88.9%) | 21,367 (82.2%) |
| 35 to 44 Years | 19,833 (90.7%) | 19,961 (83.3%) |
| 45 to 54 Years | 21,253 (91.2%) | 22,161 (88.8%) |
| 55 to 64 Years | 20,660 (88.4%) | 22,932 (87.6%) |
| 65 to 74 Years | 15,381 (91.4%) | 18,608 (90.6%) |
| 75 Years and over | 9,070 (92.6%) | 13,178 (88.7%) |
| Total | 153,653 (86.1%) | 162,895 (83.6%) |
Income Below Poverty Among Married-Couple Families in Forsyth County
The poverty statistics for married-couple families in Forsyth County show that 4.3% or 2,851 of the total 66,265 families live below the poverty line. Families with 5 or more children have the highest poverty rate of 23.3%, comprising of 64 families. On the other hand, families with no children have the lowest poverty rate of 2.9%, which includes 1,183 families.
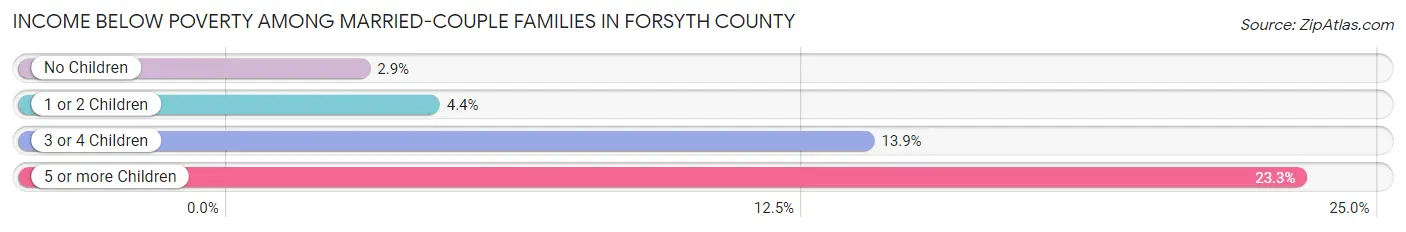
| Children | Above Poverty | Below Poverty |
| No Children | 39,955 (97.1%) | 1,183 (2.9%) |
| 1 or 2 Children | 18,577 (95.6%) | 853 (4.4%) |
| 3 or 4 Children | 4,671 (86.2%) | 751 (13.9%) |
| 5 or more Children | 211 (76.7%) | 64 (23.3%) |
| Total | 63,414 (95.7%) | 2,851 (4.3%) |
Income Below Poverty Among Single-Parent Households in Forsyth County
According to the poverty data in Forsyth County, 17.1% or 1,130 single-father households and 26.8% or 5,792 single-mother households are living below the poverty line. Among single-father households, those with 5 or more children have the highest poverty rate, with 59 households (100.0%) experiencing poverty. Likewise, among single-mother households, those with 5 or more children have the highest poverty rate, with 149 households (74.9%) falling below the poverty line.
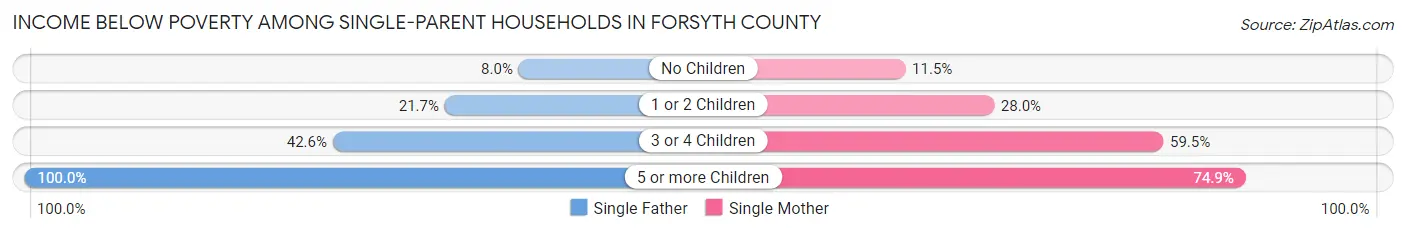
| Children | Single Father | Single Mother |
| No Children | 249 (8.0%) | 778 (11.5%) |
| 1 or 2 Children | 658 (21.7%) | 3,411 (28.0%) |
| 3 or 4 Children | 164 (42.6%) | 1,454 (59.5%) |
| 5 or more Children | 59 (100.0%) | 149 (74.9%) |
| Total | 1,130 (17.1%) | 5,792 (26.8%) |
Income Below Poverty Among Married-Couple vs Single-Parent Households in Forsyth County
The poverty data for Forsyth County shows that 2,851 of the married-couple family households (4.3%) and 6,922 of the single-parent households (24.5%) are living below the poverty level. Within the married-couple family households, those with 5 or more children have the highest poverty rate, with 64 households (23.3%) falling below the poverty line. Among the single-parent households, those with 5 or more children have the highest poverty rate, with 208 household (80.6%) living below poverty.
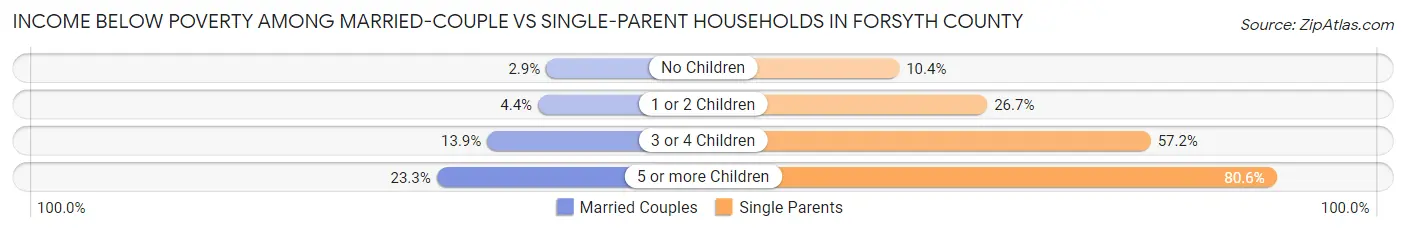
| Children | Married-Couple Families | Single-Parent Households |
| No Children | 1,183 (2.9%) | 1,027 (10.3%) |
| 1 or 2 Children | 853 (4.4%) | 4,069 (26.7%) |
| 3 or 4 Children | 751 (13.9%) | 1,618 (57.2%) |
| 5 or more Children | 64 (23.3%) | 208 (80.6%) |
| Total | 2,851 (4.3%) | 6,922 (24.5%) |
Employment Characteristics in Forsyth County
Employment by Class of Employer in Forsyth County
Among the 175,739 employed individuals in Forsyth County, private company employees (120,141 | 68.4%), not-for-profit organizations (20,718 | 11.8%), and local government employees (10,304 | 5.9%) make up the most common classes of employment.
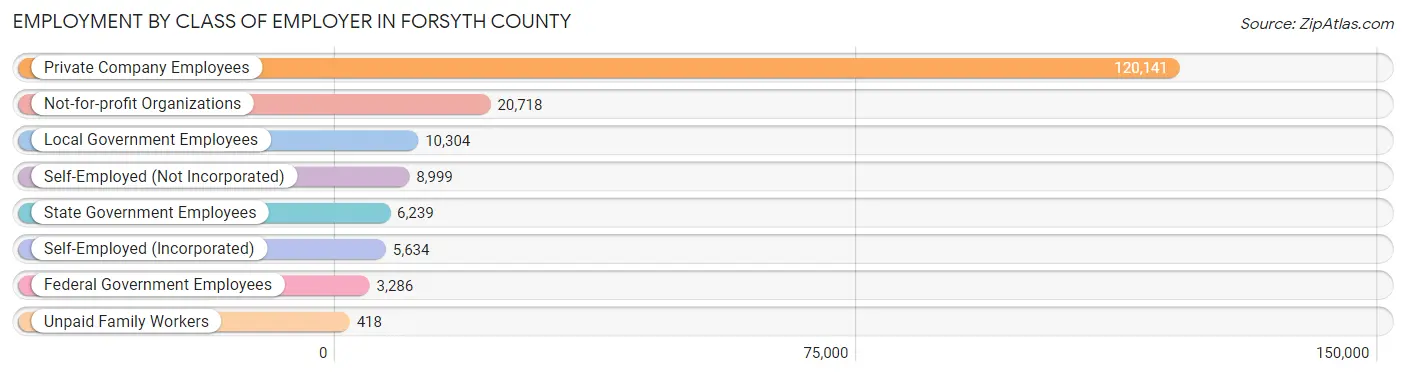
| Employer Class | # Employees | % Employees |
| Private Company Employees | 120,141 | 68.4% |
| Self-Employed (Incorporated) | 5,634 | 3.2% |
| Self-Employed (Not Incorporated) | 8,999 | 5.1% |
| Not-for-profit Organizations | 20,718 | 11.8% |
| Local Government Employees | 10,304 | 5.9% |
| State Government Employees | 6,239 | 3.5% |
| Federal Government Employees | 3,286 | 1.9% |
| Unpaid Family Workers | 418 | 0.2% |
| Total | 175,739 | 100.0% |
Employment Status by Age in Forsyth County
According to the labor force statistics for Forsyth County, out of the total population over 16 years of age (307,220), 61.7% or 189,555 individuals are in the labor force, with 5.6% or 10,615 of them unemployed. The age group with the highest labor force participation rate is 30 to 34 years, with 84.2% or 21,037 individuals in the labor force. Within the labor force, the 16 to 19 years age range has the highest percentage of unemployed individuals, with 13.9% or 1,089 of them being unemployed.
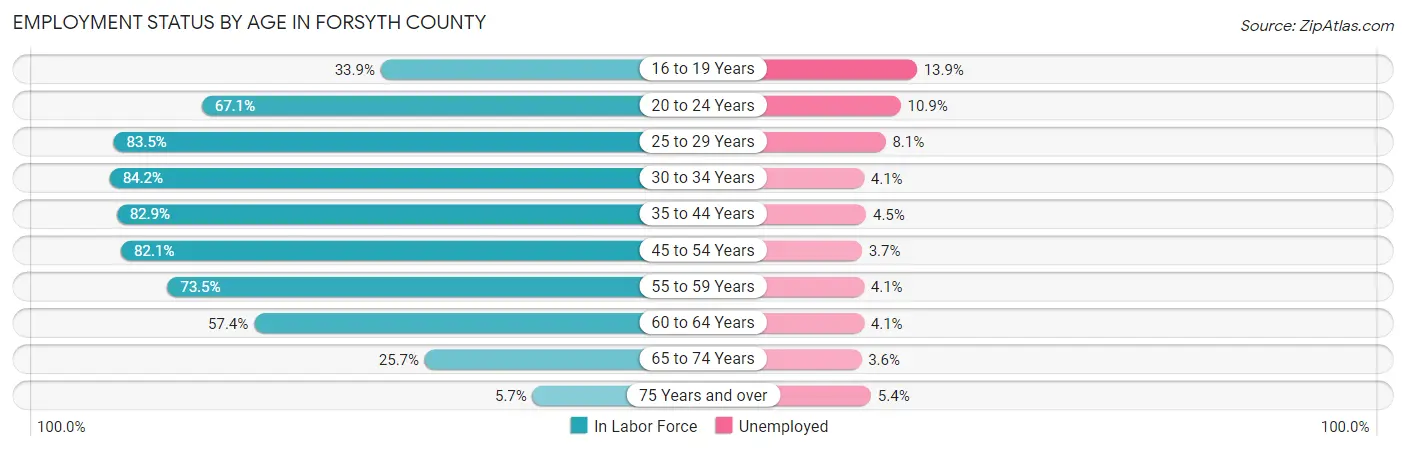
| Age Bracket | In Labor Force | Unemployed |
| 16 to 19 Years | 7,836 (33.9%) | 1,089 (13.9%) |
| 20 to 24 Years | 17,669 (67.1%) | 1,926 (10.9%) |
| 25 to 29 Years | 21,174 (83.5%) | 1,715 (8.1%) |
| 30 to 34 Years | 21,037 (84.2%) | 863 (4.1%) |
| 35 to 44 Years | 38,265 (82.9%) | 1,722 (4.5%) |
| 45 to 54 Years | 39,754 (82.1%) | 1,471 (3.7%) |
| 55 to 59 Years | 18,718 (73.5%) | 767 (4.1%) |
| 60 to 64 Years | 14,010 (57.4%) | 574 (4.1%) |
| 65 to 74 Years | 9,655 (25.7%) | 348 (3.6%) |
| 75 Years and over | 1,448 (5.7%) | 78 (5.4%) |
| Total | 189,555 (61.7%) | 10,615 (5.6%) |
Employment Status by Educational Attainment in Forsyth County
According to labor force statistics for Forsyth County, 78.5% of individuals (152,914) out of the total population between 25 and 64 years of age (194,795) are in the labor force, with 4.7% or 7,187 of them being unemployed. The group with the highest labor force participation rate are those with the educational attainment of bachelor's degree or higher, with 86.3% or 61,960 individuals in the labor force. Within the labor force, individuals with less than high school education have the highest percentage of unemployment, with 9.7% or 1,257 of them being unemployed.
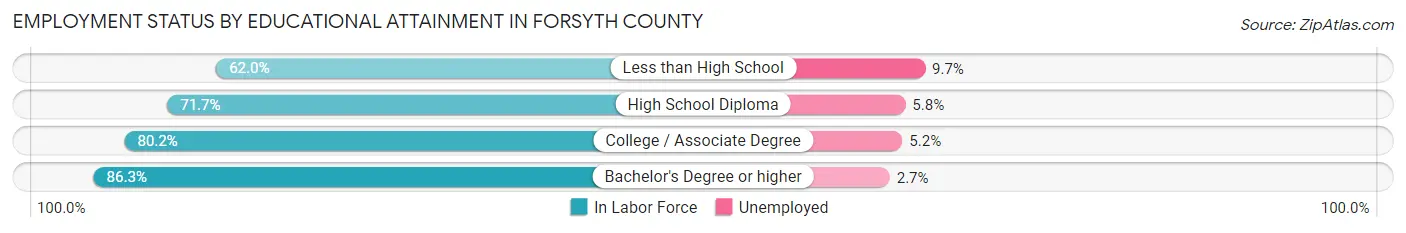
| Educational Attainment | In Labor Force | Unemployed |
| Less than High School | 12,957 (62.0%) | 2,027 (9.7%) |
| High School Diploma | 32,253 (71.7%) | 2,609 (5.8%) |
| College / Associate Degree | 45,808 (80.2%) | 2,970 (5.2%) |
| Bachelor's Degree or higher | 61,960 (86.3%) | 1,938 (2.7%) |
| Total | 152,914 (78.5%) | 9,155 (4.7%) |
Employment Occupations by Sex in Forsyth County
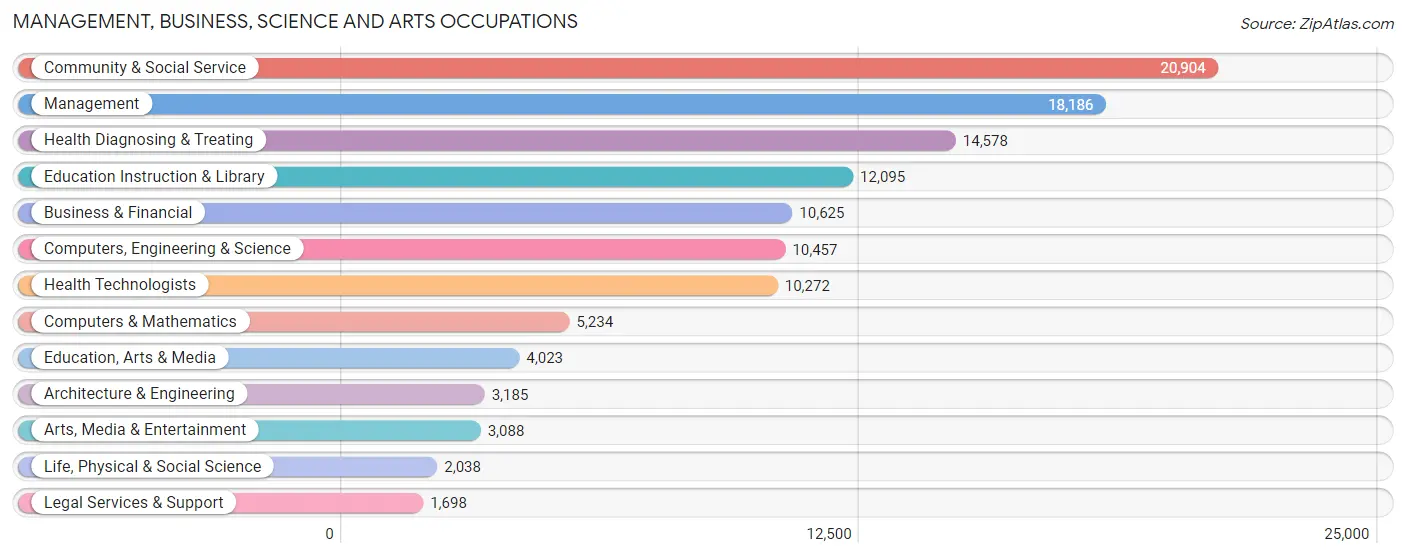
Management, Business, Science and Arts Occupations
The most common Management, Business, Science and Arts occupations in Forsyth County are Community & Social Service (20,904 | 11.7%), Management (18,186 | 10.2%), Health Diagnosing & Treating (14,578 | 8.2%), Education Instruction & Library (12,095 | 6.8%), and Business & Financial (10,625 | 6.0%).
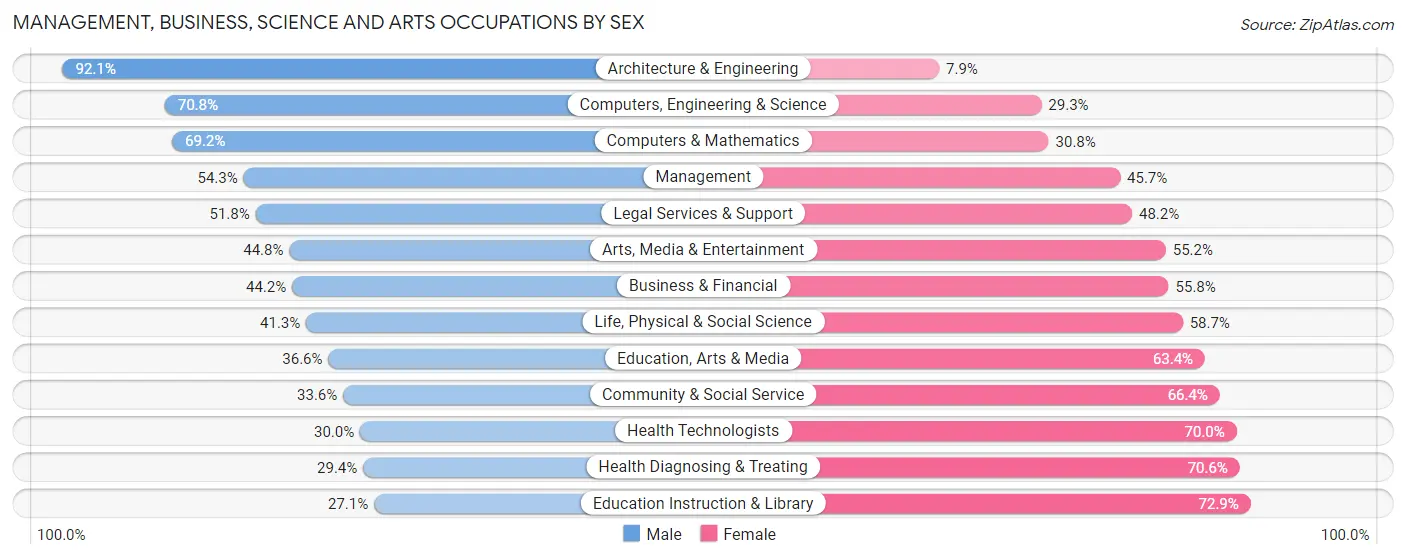
Management, Business, Science and Arts Occupations by Sex
Within the Management, Business, Science and Arts occupations in Forsyth County, the most male-oriented occupations are Architecture & Engineering (92.1%), Computers, Engineering & Science (70.8%), and Computers & Mathematics (69.2%), while the most female-oriented occupations are Education Instruction & Library (72.9%), Health Diagnosing & Treating (70.6%), and Health Technologists (70.0%).
| Occupation | Male | Female |
| Management | 9,881 (54.3%) | 8,305 (45.7%) |
| Business & Financial | 4,697 (44.2%) | 5,928 (55.8%) |
| Computers, Engineering & Science | 7,398 (70.8%) | 3,059 (29.2%) |
| Computers & Mathematics | 3,624 (69.2%) | 1,610 (30.8%) |
| Architecture & Engineering | 2,933 (92.1%) | 252 (7.9%) |
| Life, Physical & Social Science | 841 (41.3%) | 1,197 (58.7%) |
| Community & Social Service | 7,016 (33.6%) | 13,888 (66.4%) |
| Education, Arts & Media | 1,474 (36.6%) | 2,549 (63.4%) |
| Legal Services & Support | 880 (51.8%) | 818 (48.2%) |
| Education Instruction & Library | 3,279 (27.1%) | 8,816 (72.9%) |
| Arts, Media & Entertainment | 1,383 (44.8%) | 1,705 (55.2%) |
| Health Diagnosing & Treating | 4,285 (29.4%) | 10,293 (70.6%) |
| Health Technologists | 3,085 (30.0%) | 7,187 (70.0%) |
| Total (Category) | 33,277 (44.5%) | 41,473 (55.5%) |
| Total (Overall) | 90,460 (50.7%) | 87,800 (49.2%) |
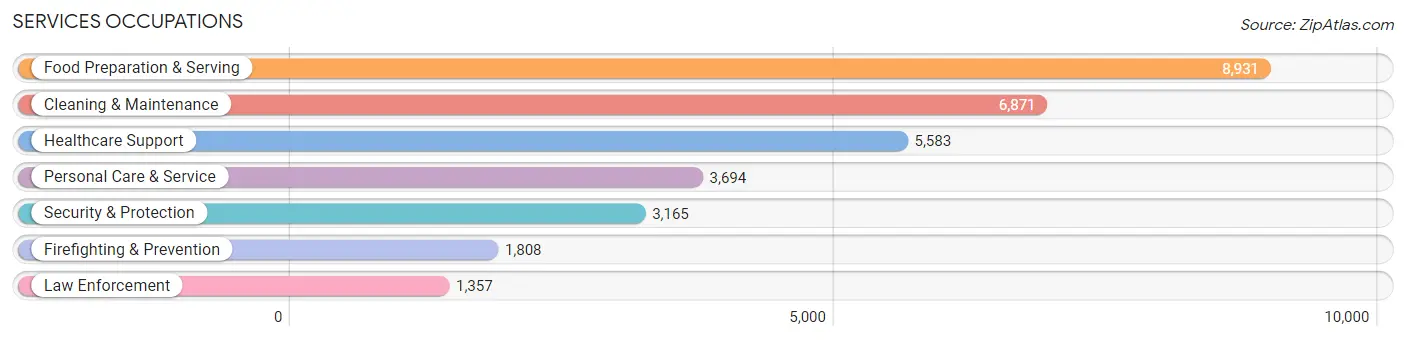
Services Occupations
The most common Services occupations in Forsyth County are Food Preparation & Serving (8,931 | 5.0%), Cleaning & Maintenance (6,871 | 3.8%), Healthcare Support (5,583 | 3.1%), Personal Care & Service (3,694 | 2.1%), and Security & Protection (3,165 | 1.8%).
Services Occupations by Sex
Within the Services occupations in Forsyth County, the most male-oriented occupations are Law Enforcement (80.5%), Security & Protection (73.9%), and Firefighting & Prevention (68.9%), while the most female-oriented occupations are Healthcare Support (88.7%), Personal Care & Service (74.0%), and Food Preparation & Serving (55.1%).
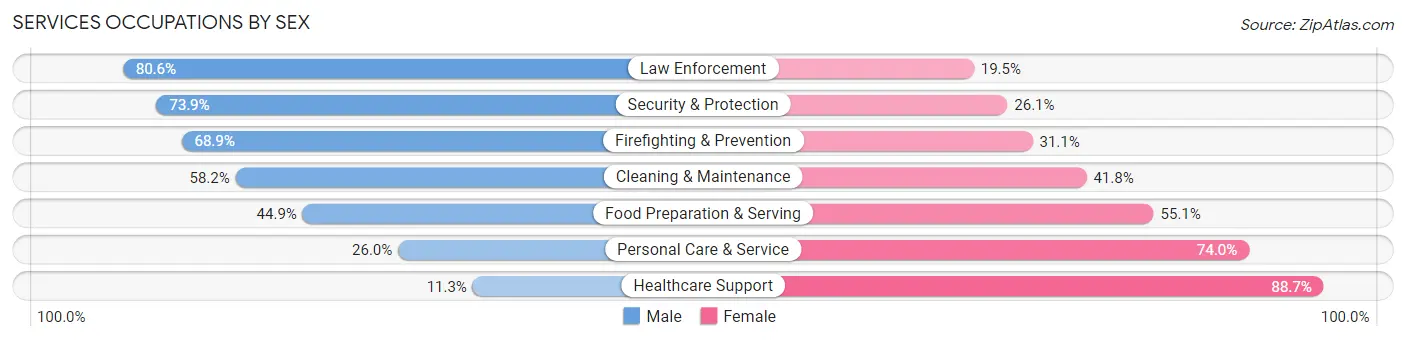
| Occupation | Male | Female |
| Healthcare Support | 629 (11.3%) | 4,954 (88.7%) |
| Security & Protection | 2,339 (73.9%) | 826 (26.1%) |
| Firefighting & Prevention | 1,246 (68.9%) | 562 (31.1%) |
| Law Enforcement | 1,093 (80.5%) | 264 (19.5%) |
| Food Preparation & Serving | 4,014 (44.9%) | 4,917 (55.1%) |
| Cleaning & Maintenance | 4,001 (58.2%) | 2,870 (41.8%) |
| Personal Care & Service | 962 (26.0%) | 2,732 (74.0%) |
| Total (Category) | 11,945 (42.3%) | 16,299 (57.7%) |
| Total (Overall) | 90,460 (50.7%) | 87,800 (49.2%) |
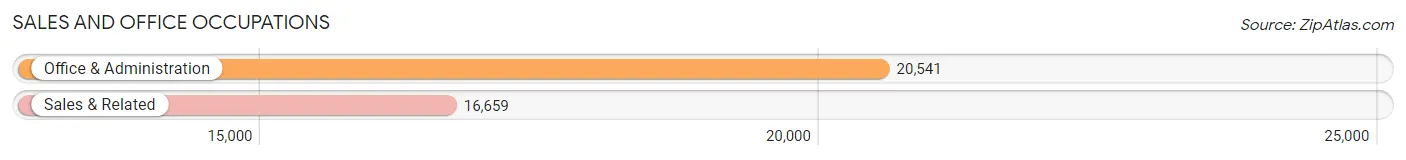
Sales and Office Occupations
The most common Sales and Office occupations in Forsyth County are Office & Administration (20,541 | 11.5%), and Sales & Related (16,659 | 9.3%).
Sales and Office Occupations by Sex
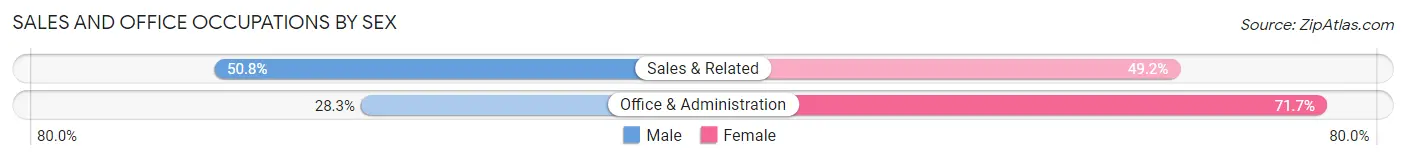
| Occupation | Male | Female |
| Sales & Related | 8,469 (50.8%) | 8,190 (49.2%) |
| Office & Administration | 5,808 (28.3%) | 14,733 (71.7%) |
| Total (Category) | 14,277 (38.4%) | 22,923 (61.6%) |
| Total (Overall) | 90,460 (50.7%) | 87,800 (49.2%) |
Natural Resources, Construction and Maintenance Occupations
The most common Natural Resources, Construction and Maintenance occupations in Forsyth County are Construction & Extraction (8,577 | 4.8%), Installation, Maintenance & Repair (5,001 | 2.8%), and Farming, Fishing & Forestry (425 | 0.2%).
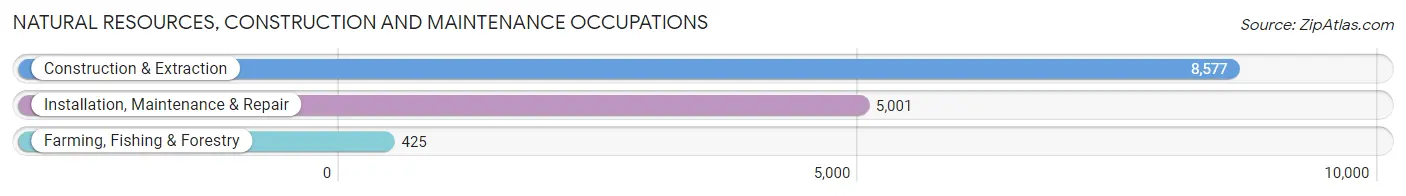
Natural Resources, Construction and Maintenance Occupations by Sex
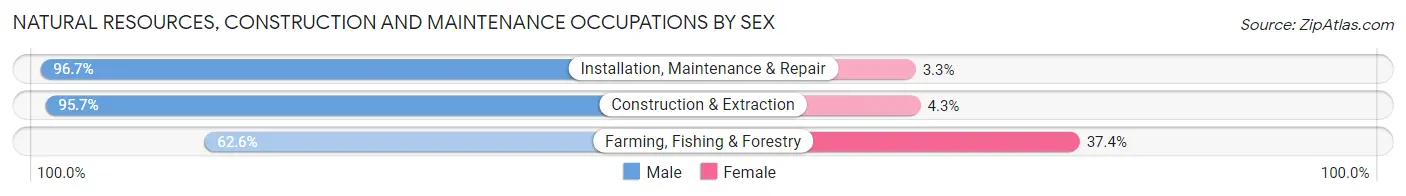
| Occupation | Male | Female |
| Farming, Fishing & Forestry | 266 (62.6%) | 159 (37.4%) |
| Construction & Extraction | 8,207 (95.7%) | 370 (4.3%) |
| Installation, Maintenance & Repair | 4,837 (96.7%) | 164 (3.3%) |
| Total (Category) | 13,310 (95.1%) | 693 (5.0%) |
| Total (Overall) | 90,460 (50.7%) | 87,800 (49.2%) |
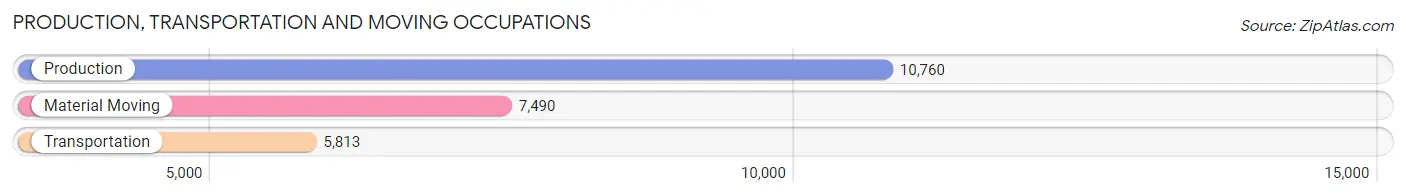
Production, Transportation and Moving Occupations
The most common Production, Transportation and Moving occupations in Forsyth County are Production (10,760 | 6.0%), Material Moving (7,490 | 4.2%), and Transportation (5,813 | 3.3%).
Production, Transportation and Moving Occupations by Sex
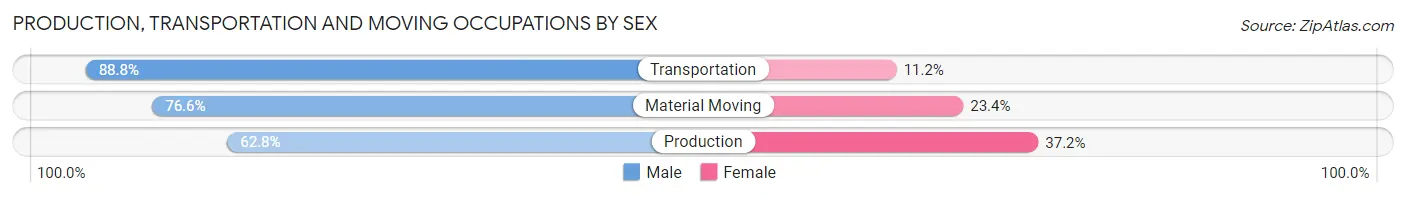
| Occupation | Male | Female |
| Production | 6,756 (62.8%) | 4,004 (37.2%) |
| Transportation | 5,161 (88.8%) | 652 (11.2%) |
| Material Moving | 5,734 (76.6%) | 1,756 (23.4%) |
| Total (Category) | 17,651 (73.4%) | 6,412 (26.7%) |
| Total (Overall) | 90,460 (50.7%) | 87,800 (49.2%) |
Employment Industries by Sex in Forsyth County
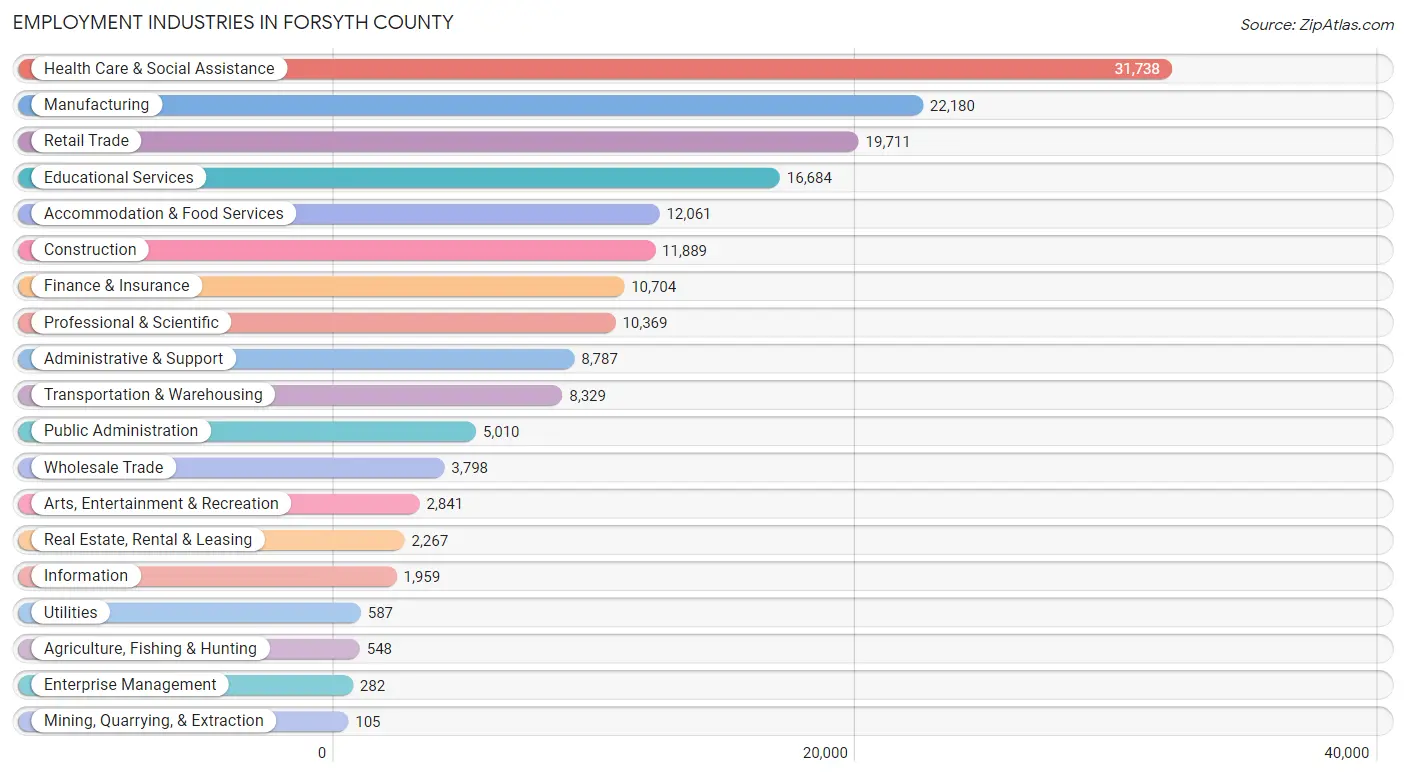
Employment Industries in Forsyth County
The major employment industries in Forsyth County include Health Care & Social Assistance (31,738 | 17.8%), Manufacturing (22,180 | 12.4%), Retail Trade (19,711 | 11.1%), Educational Services (16,684 | 9.4%), and Accommodation & Food Services (12,061 | 6.8%).
Employment Industries by Sex in Forsyth County
The Forsyth County industries that see more men than women are Construction (91.2%), Mining, Quarrying, & Extraction (85.7%), and Utilities (84.8%), whereas the industries that tend to have a higher number of women are Health Care & Social Assistance (76.4%), Educational Services (69.1%), and Real Estate, Rental & Leasing (60.0%).
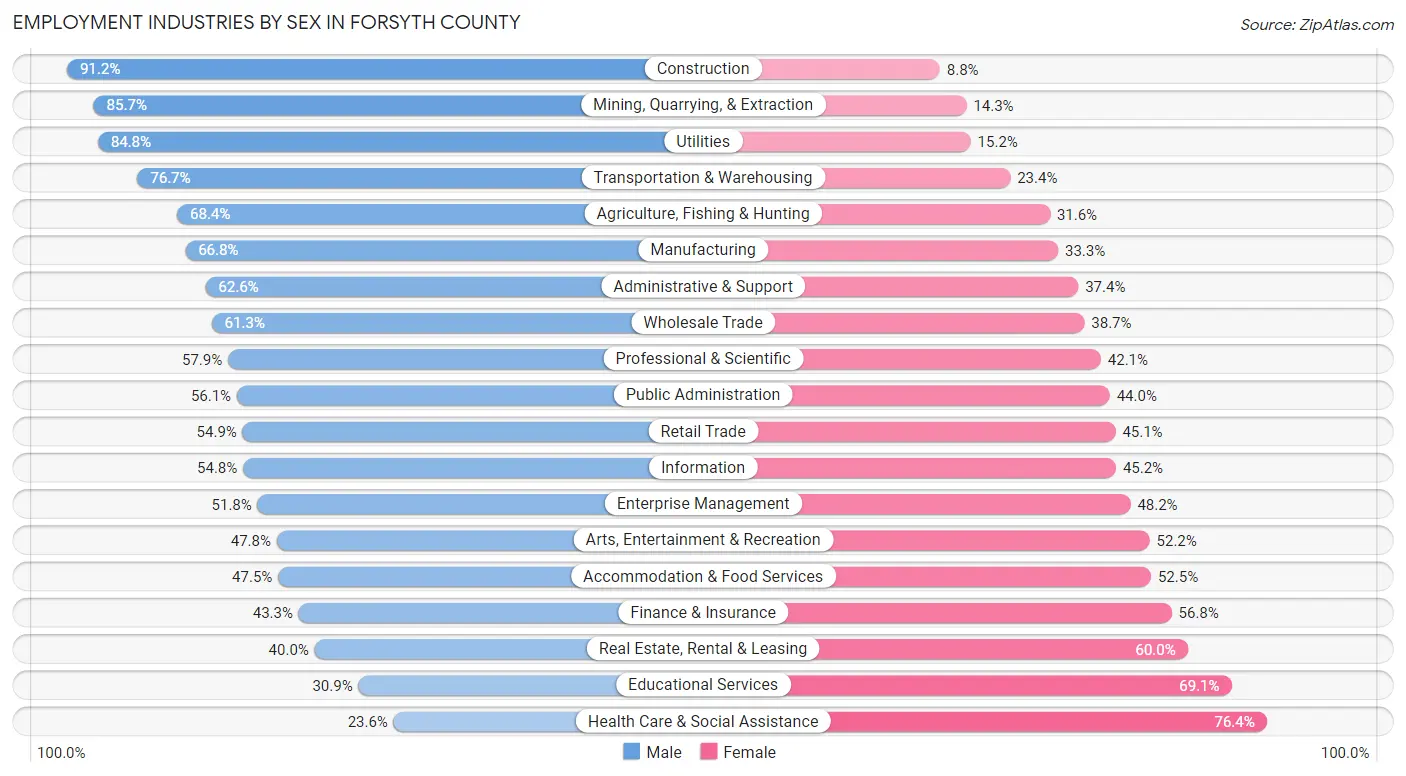
| Industry | Male | Female |
| Agriculture, Fishing & Hunting | 375 (68.4%) | 173 (31.6%) |
| Mining, Quarrying, & Extraction | 90 (85.7%) | 15 (14.3%) |
| Construction | 10,845 (91.2%) | 1,044 (8.8%) |
| Manufacturing | 14,805 (66.7%) | 7,375 (33.3%) |
| Wholesale Trade | 2,328 (61.3%) | 1,470 (38.7%) |
| Retail Trade | 10,815 (54.9%) | 8,896 (45.1%) |
| Transportation & Warehousing | 6,384 (76.6%) | 1,945 (23.4%) |
| Utilities | 498 (84.8%) | 89 (15.2%) |
| Information | 1,073 (54.8%) | 886 (45.2%) |
| Finance & Insurance | 4,630 (43.2%) | 6,074 (56.8%) |
| Real Estate, Rental & Leasing | 906 (40.0%) | 1,361 (60.0%) |
| Professional & Scientific | 6,003 (57.9%) | 4,366 (42.1%) |
| Enterprise Management | 146 (51.8%) | 136 (48.2%) |
| Administrative & Support | 5,498 (62.6%) | 3,289 (37.4%) |
| Educational Services | 5,153 (30.9%) | 11,531 (69.1%) |
| Health Care & Social Assistance | 7,491 (23.6%) | 24,247 (76.4%) |
| Arts, Entertainment & Recreation | 1,358 (47.8%) | 1,483 (52.2%) |
| Accommodation & Food Services | 5,731 (47.5%) | 6,330 (52.5%) |
| Public Administration | 2,808 (56.0%) | 2,202 (44.0%) |
| Total | 90,460 (50.7%) | 87,800 (49.2%) |
Education in Forsyth County
School Enrollment in Forsyth County
The most common levels of schooling among the 97,836 students in Forsyth County are college / undergraduate (21,564 | 22.0%), high school (21,425 | 21.9%), and middle school (20,333 | 20.8%).
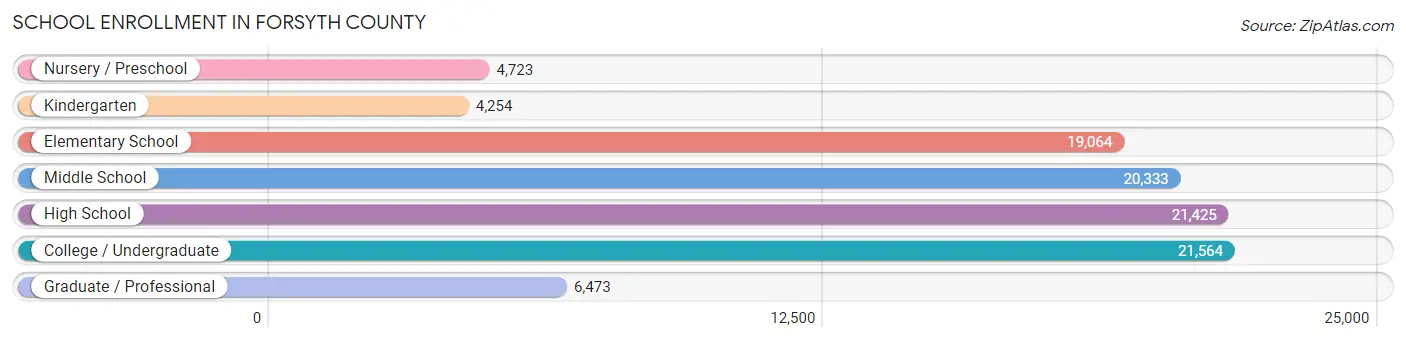
| School Level | # Students | % Students |
| Nursery / Preschool | 4,723 | 4.8% |
| Kindergarten | 4,254 | 4.3% |
| Elementary School | 19,064 | 19.5% |
| Middle School | 20,333 | 20.8% |
| High School | 21,425 | 21.9% |
| College / Undergraduate | 21,564 | 22.0% |
| Graduate / Professional | 6,473 | 6.6% |
| Total | 97,836 | 100.0% |
School Enrollment by Age by Funding Source in Forsyth County
Out of a total of 97,836 students who are enrolled in schools in Forsyth County, 19,959 (20.4%) attend a private institution, while the remaining 77,877 (79.6%) are enrolled in public schools. The age group of 3 to 4 year olds has the highest likelihood of being enrolled in private schools, with 1,872 (55.4% in the age bracket) enrolled. Conversely, the age group of 15 to 17 year olds has the lowest likelihood of being enrolled in a private school, with 13,772 (91.0% in the age bracket) attending a public institution.
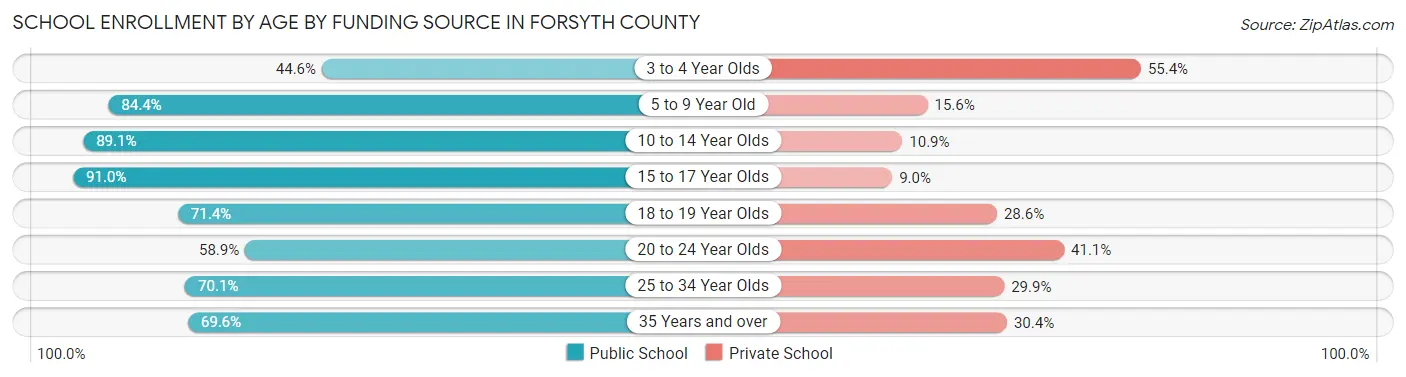
| Age Bracket | Public School | Private School |
| 3 to 4 Year Olds | 1,509 (44.6%) | 1,872 (55.4%) |
| 5 to 9 Year Old | 17,826 (84.4%) | 3,300 (15.6%) |
| 10 to 14 Year Olds | 23,743 (89.1%) | 2,913 (10.9%) |
| 15 to 17 Year Olds | 13,772 (91.0%) | 1,368 (9.0%) |
| 18 to 19 Year Olds | 6,737 (71.4%) | 2,693 (28.6%) |
| 20 to 24 Year Olds | 6,381 (58.9%) | 4,445 (41.1%) |
| 25 to 34 Year Olds | 4,045 (70.1%) | 1,726 (29.9%) |
| 35 Years and over | 3,831 (69.6%) | 1,675 (30.4%) |
| Total | 77,877 (79.6%) | 19,959 (20.4%) |
Educational Attainment by Field of Study in Forsyth County
Business (18,261 | 18.4%), education (10,622 | 10.7%), science & technology (10,453 | 10.6%), arts & humanities (7,541 | 7.6%), and social sciences (7,396 | 7.5%) are the most common fields of study among 99,015 individuals in Forsyth County who have obtained a bachelor's degree or higher.

| Field of Study | # Graduates | % Graduates |
| Computers & Mathematics | 4,049 | 4.1% |
| Bio, Nature & Agricultural | 6,720 | 6.8% |
| Physical & Health Sciences | 3,275 | 3.3% |
| Psychology | 5,709 | 5.8% |
| Social Sciences | 7,396 | 7.5% |
| Engineering | 4,755 | 4.8% |
| Multidisciplinary Studies | 886 | 0.9% |
| Science & Technology | 10,453 | 10.6% |
| Business | 18,261 | 18.4% |
| Education | 10,622 | 10.7% |
| Literature & Languages | 4,499 | 4.5% |
| Liberal Arts & History | 5,739 | 5.8% |
| Visual & Performing Arts | 4,639 | 4.7% |
| Communications | 4,471 | 4.5% |
| Arts & Humanities | 7,541 | 7.6% |
| Total | 99,015 | 100.0% |
Transportation & Commute in Forsyth County
Vehicle Availability by Sex in Forsyth County
The most prevalent vehicle ownership categories in Forsyth County are males with 2 vehicles (37,081, accounting for 41.5%) and females with 2 vehicles (33,248, making up 43.4%).
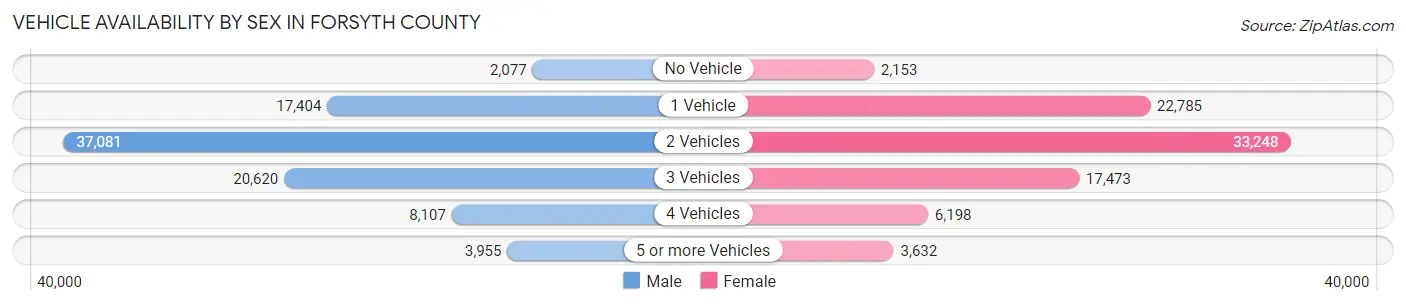
| Vehicles Available | Male | Female |
| No Vehicle | 2,077 (2.3%) | 2,153 (2.5%) |
| 1 Vehicle | 17,404 (19.5%) | 22,785 (26.7%) |
| 2 Vehicles | 37,081 (41.5%) | 33,248 (38.9%) |
| 3 Vehicles | 20,620 (23.1%) | 17,473 (20.4%) |
| 4 Vehicles | 8,107 (9.1%) | 6,198 (7.2%) |
| 5 or more Vehicles | 3,955 (4.4%) | 3,632 (4.3%) |
| Total | 89,244 (100.0%) | 85,489 (100.0%) |
Commute Time in Forsyth County
The most frequently occuring commute durations in Forsyth County are 15 to 19 minutes (33,027 commuters, 21.0%), 20 to 24 minutes (29,009 commuters, 18.5%), and 10 to 14 minutes (24,730 commuters, 15.7%).
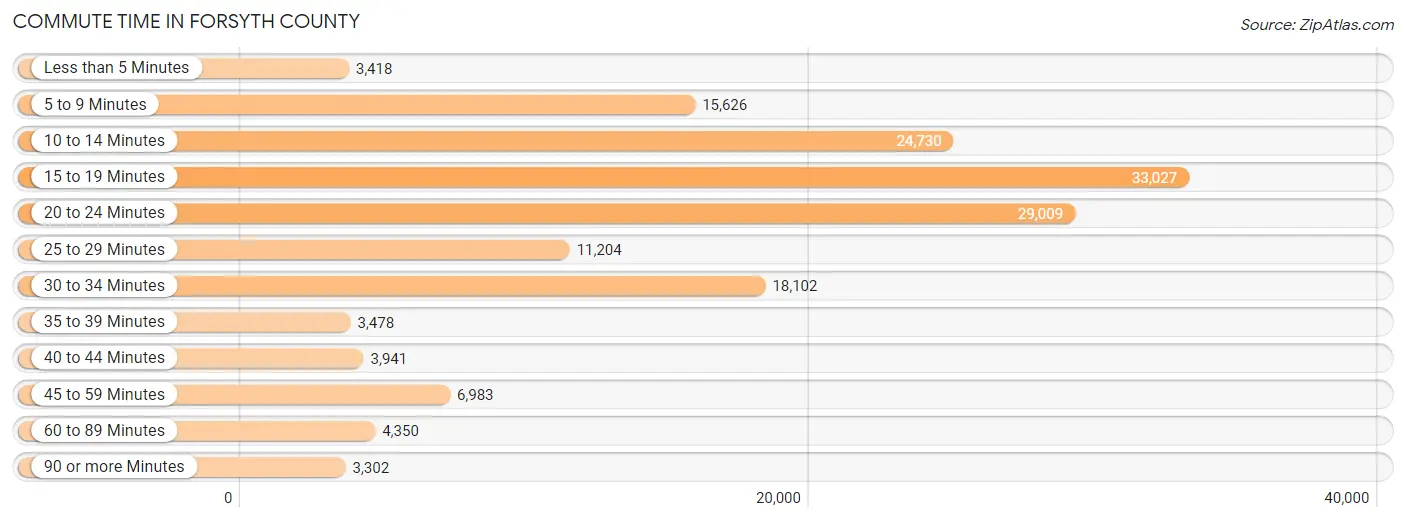
| Commute Time | # Commuters | % Commuters |
| Less than 5 Minutes | 3,418 | 2.2% |
| 5 to 9 Minutes | 15,626 | 9.9% |
| 10 to 14 Minutes | 24,730 | 15.7% |
| 15 to 19 Minutes | 33,027 | 21.0% |
| 20 to 24 Minutes | 29,009 | 18.5% |
| 25 to 29 Minutes | 11,204 | 7.1% |
| 30 to 34 Minutes | 18,102 | 11.5% |
| 35 to 39 Minutes | 3,478 | 2.2% |
| 40 to 44 Minutes | 3,941 | 2.5% |
| 45 to 59 Minutes | 6,983 | 4.4% |
| 60 to 89 Minutes | 4,350 | 2.8% |
| 90 or more Minutes | 3,302 | 2.1% |
Commute Time by Sex in Forsyth County
The most common commute times in Forsyth County are 15 to 19 minutes (16,360 commuters, 20.4%) for males and 15 to 19 minutes (16,667 commuters, 21.7%) for females.
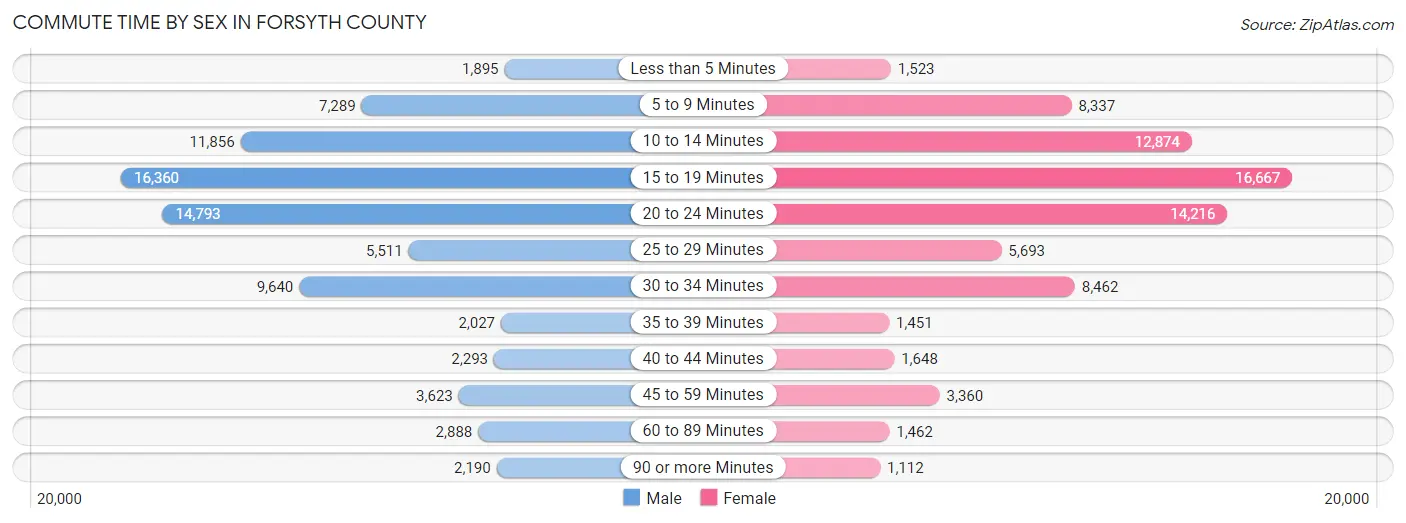
| Commute Time | Male | Female |
| Less than 5 Minutes | 1,895 (2.4%) | 1,523 (2.0%) |
| 5 to 9 Minutes | 7,289 (9.1%) | 8,337 (10.8%) |
| 10 to 14 Minutes | 11,856 (14.7%) | 12,874 (16.8%) |
| 15 to 19 Minutes | 16,360 (20.4%) | 16,667 (21.7%) |
| 20 to 24 Minutes | 14,793 (18.4%) | 14,216 (18.5%) |
| 25 to 29 Minutes | 5,511 (6.9%) | 5,693 (7.4%) |
| 30 to 34 Minutes | 9,640 (12.0%) | 8,462 (11.0%) |
| 35 to 39 Minutes | 2,027 (2.5%) | 1,451 (1.9%) |
| 40 to 44 Minutes | 2,293 (2.9%) | 1,648 (2.1%) |
| 45 to 59 Minutes | 3,623 (4.5%) | 3,360 (4.4%) |
| 60 to 89 Minutes | 2,888 (3.6%) | 1,462 (1.9%) |
| 90 or more Minutes | 2,190 (2.7%) | 1,112 (1.5%) |
Time of Departure to Work by Sex in Forsyth County
The most frequent times of departure to work in Forsyth County are 7:00 AM to 7:29 AM (11,552, 14.4%) for males and 7:30 AM to 7:59 AM (14,130, 18.4%) for females.
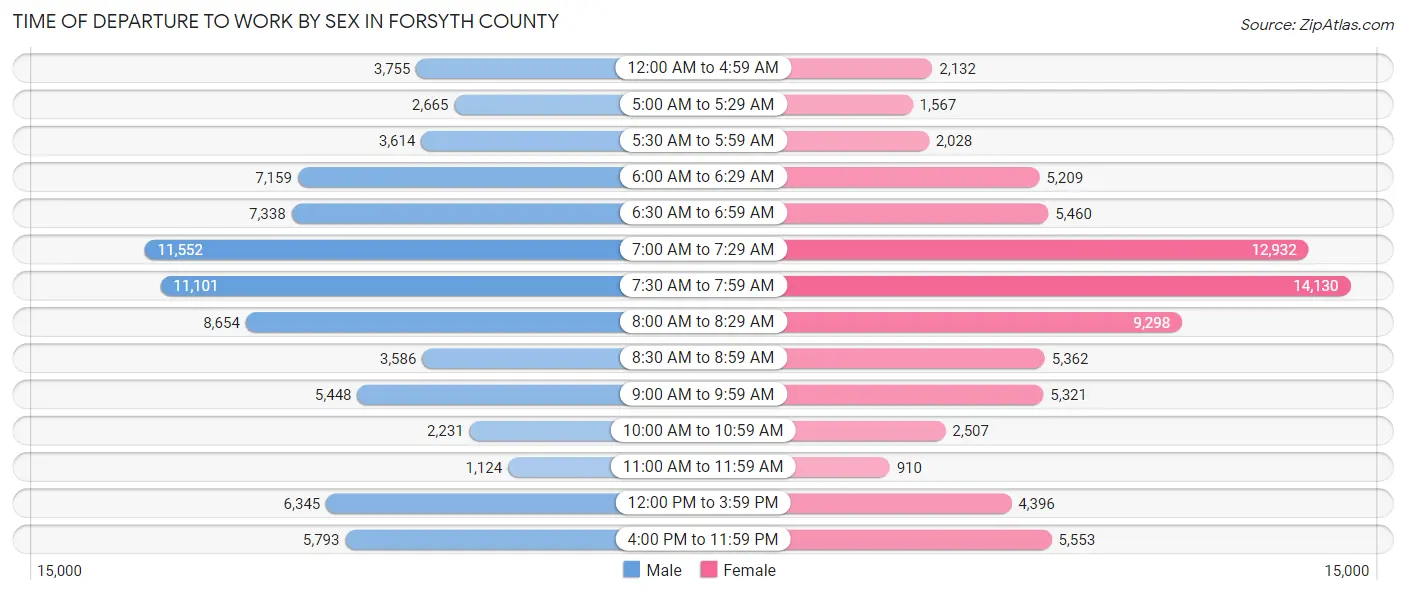
| Time of Departure | Male | Female |
| 12:00 AM to 4:59 AM | 3,755 (4.7%) | 2,132 (2.8%) |
| 5:00 AM to 5:29 AM | 2,665 (3.3%) | 1,567 (2.0%) |
| 5:30 AM to 5:59 AM | 3,614 (4.5%) | 2,028 (2.6%) |
| 6:00 AM to 6:29 AM | 7,159 (8.9%) | 5,209 (6.8%) |
| 6:30 AM to 6:59 AM | 7,338 (9.1%) | 5,460 (7.1%) |
| 7:00 AM to 7:29 AM | 11,552 (14.4%) | 12,932 (16.8%) |
| 7:30 AM to 7:59 AM | 11,101 (13.8%) | 14,130 (18.4%) |
| 8:00 AM to 8:29 AM | 8,654 (10.8%) | 9,298 (12.1%) |
| 8:30 AM to 8:59 AM | 3,586 (4.5%) | 5,362 (7.0%) |
| 9:00 AM to 9:59 AM | 5,448 (6.8%) | 5,321 (6.9%) |
| 10:00 AM to 10:59 AM | 2,231 (2.8%) | 2,507 (3.3%) |
| 11:00 AM to 11:59 AM | 1,124 (1.4%) | 910 (1.2%) |
| 12:00 PM to 3:59 PM | 6,345 (7.9%) | 4,396 (5.7%) |
| 4:00 PM to 11:59 PM | 5,793 (7.2%) | 5,553 (7.2%) |
| Total | 80,365 (100.0%) | 76,805 (100.0%) |
Housing Occupancy in Forsyth County
Occupancy by Ownership in Forsyth County
Of the total 153,096 dwellings in Forsyth County, owner-occupied units account for 94,800 (61.9%), while renter-occupied units make up 58,296 (38.1%).
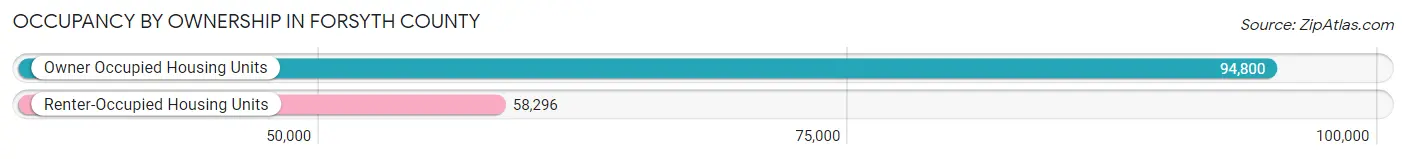
| Occupancy | # Housing Units | % Housing Units |
| Owner Occupied Housing Units | 94,800 | 61.9% |
| Renter-Occupied Housing Units | 58,296 | 38.1% |
| Total Occupied Housing Units | 153,096 | 100.0% |
Occupancy by Household Size in Forsyth County

| Household Size | # Housing Units | % Housing Units |
| 1-Person Household | 49,726 | 32.5% |
| 2-Person Household | 53,125 | 34.7% |
| 3-Person Household | 22,870 | 14.9% |
| 4+ Person Household | 27,375 | 17.9% |
| Total Housing Units | 153,096 | 100.0% |
Occupancy by Ownership by Household Size in Forsyth County
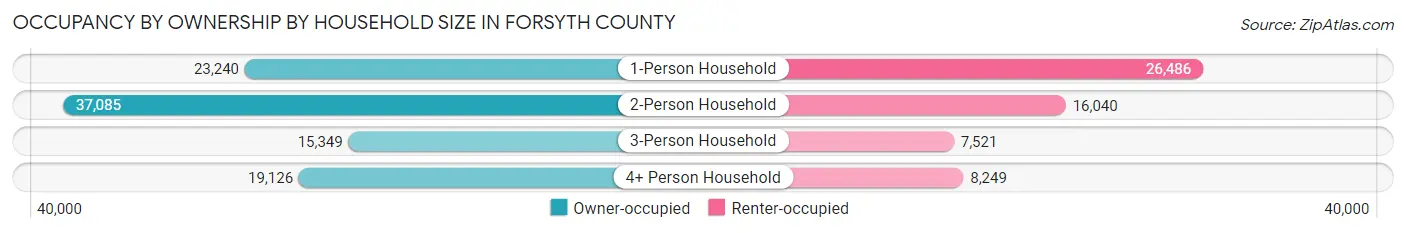
| Household Size | Owner-occupied | Renter-occupied |
| 1-Person Household | 23,240 (46.7%) | 26,486 (53.3%) |
| 2-Person Household | 37,085 (69.8%) | 16,040 (30.2%) |
| 3-Person Household | 15,349 (67.1%) | 7,521 (32.9%) |
| 4+ Person Household | 19,126 (69.9%) | 8,249 (30.1%) |
| Total Housing Units | 94,800 (61.9%) | 58,296 (38.1%) |
Occupancy by Educational Attainment in Forsyth County
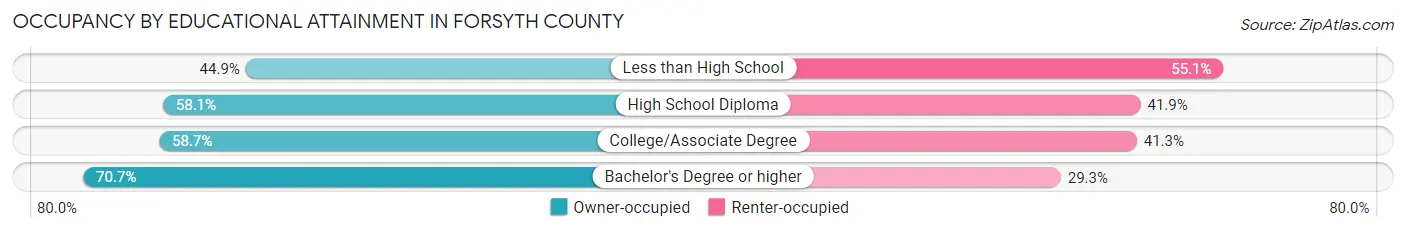
| Household Size | Owner-occupied | Renter-occupied |
| Less than High School | 5,974 (44.9%) | 7,320 (55.1%) |
| High School Diploma | 20,182 (58.1%) | 14,574 (41.9%) |
| College/Associate Degree | 27,455 (58.7%) | 19,347 (41.3%) |
| Bachelor's Degree or higher | 41,189 (70.7%) | 17,055 (29.3%) |
Occupancy by Age of Householder in Forsyth County
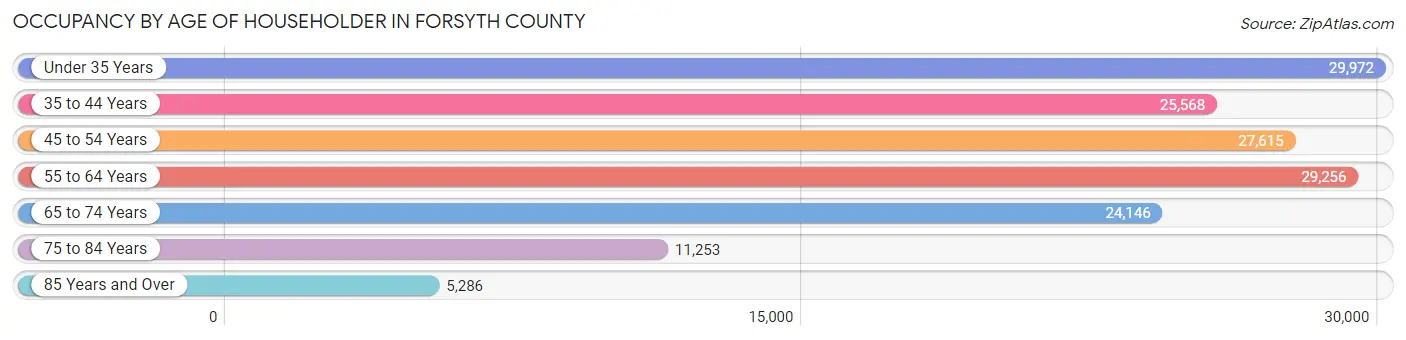
| Age Bracket | # Households | % Households |
| Under 35 Years | 29,972 | 19.6% |
| 35 to 44 Years | 25,568 | 16.7% |
| 45 to 54 Years | 27,615 | 18.0% |
| 55 to 64 Years | 29,256 | 19.1% |
| 65 to 74 Years | 24,146 | 15.8% |
| 75 to 84 Years | 11,253 | 7.3% |
| 85 Years and Over | 5,286 | 3.5% |
| Total | 153,096 | 100.0% |
Housing Finances in Forsyth County
Median Income by Occupancy in Forsyth County
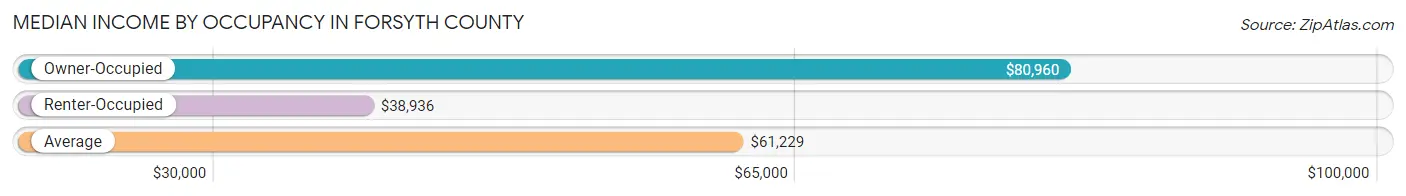
| Occupancy Type | # Households | Median Income |
| Owner-Occupied | 94,800 (61.9%) | $80,960 |
| Renter-Occupied | 58,296 (38.1%) | $38,936 |
| Average | 153,096 (100.0%) | $61,229 |
Occupancy by Householder Income Bracket in Forsyth County
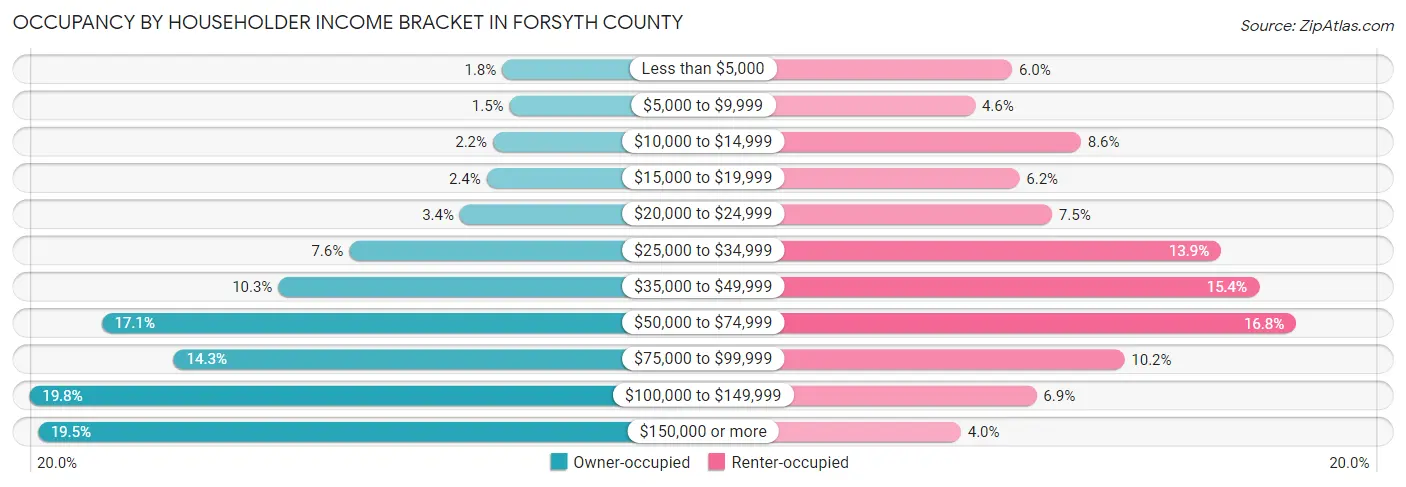
| Income Bracket | Owner-occupied | Renter-occupied |
| Less than $5,000 | 1,717 (1.8%) | 3,473 (6.0%) |
| $5,000 to $9,999 | 1,453 (1.5%) | 2,651 (4.5%) |
| $10,000 to $14,999 | 2,046 (2.2%) | 5,002 (8.6%) |
| $15,000 to $19,999 | 2,272 (2.4%) | 3,640 (6.2%) |
| $20,000 to $24,999 | 3,239 (3.4%) | 4,363 (7.5%) |
| $25,000 to $34,999 | 7,240 (7.6%) | 8,113 (13.9%) |
| $35,000 to $49,999 | 9,799 (10.3%) | 8,953 (15.4%) |
| $50,000 to $74,999 | 16,182 (17.1%) | 9,781 (16.8%) |
| $75,000 to $99,999 | 13,571 (14.3%) | 5,968 (10.2%) |
| $100,000 to $149,999 | 18,792 (19.8%) | 4,015 (6.9%) |
| $150,000 or more | 18,489 (19.5%) | 2,337 (4.0%) |
| Total | 94,800 (100.0%) | 58,296 (100.0%) |
Monthly Housing Cost Tiers in Forsyth County
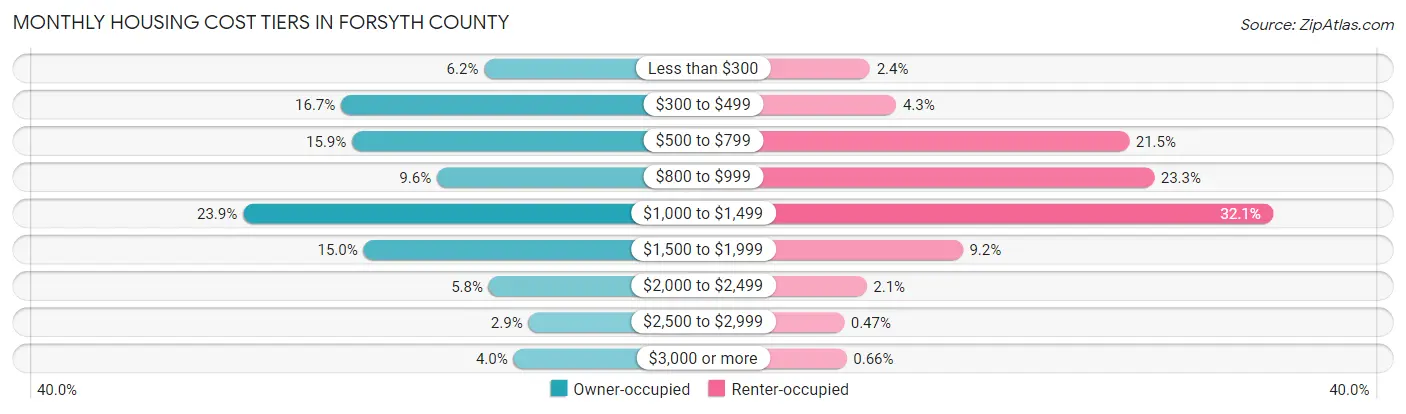
| Monthly Cost | Owner-occupied | Renter-occupied |
| Less than $300 | 5,830 (6.1%) | 1,388 (2.4%) |
| $300 to $499 | 15,821 (16.7%) | 2,514 (4.3%) |
| $500 to $799 | 15,057 (15.9%) | 12,512 (21.5%) |
| $800 to $999 | 9,125 (9.6%) | 13,584 (23.3%) |
| $1,000 to $1,499 | 22,666 (23.9%) | 18,683 (32.1%) |
| $1,500 to $1,999 | 14,262 (15.0%) | 5,367 (9.2%) |
| $2,000 to $2,499 | 5,512 (5.8%) | 1,244 (2.1%) |
| $2,500 to $2,999 | 2,742 (2.9%) | 276 (0.5%) |
| $3,000 or more | 3,785 (4.0%) | 387 (0.7%) |
| Total | 94,800 (100.0%) | 58,296 (100.0%) |
Physical Housing Characteristics in Forsyth County
Housing Structures in Forsyth County
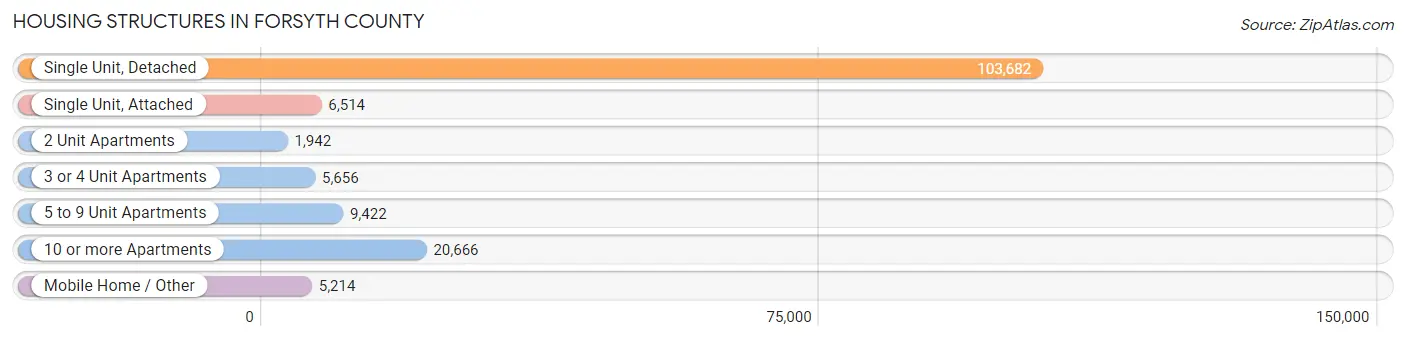
| Structure Type | # Housing Units | % Housing Units |
| Single Unit, Detached | 103,682 | 67.7% |
| Single Unit, Attached | 6,514 | 4.3% |
| 2 Unit Apartments | 1,942 | 1.3% |
| 3 or 4 Unit Apartments | 5,656 | 3.7% |
| 5 to 9 Unit Apartments | 9,422 | 6.1% |
| 10 or more Apartments | 20,666 | 13.5% |
| Mobile Home / Other | 5,214 | 3.4% |
| Total | 153,096 | 100.0% |
Housing Structures by Occupancy in Forsyth County
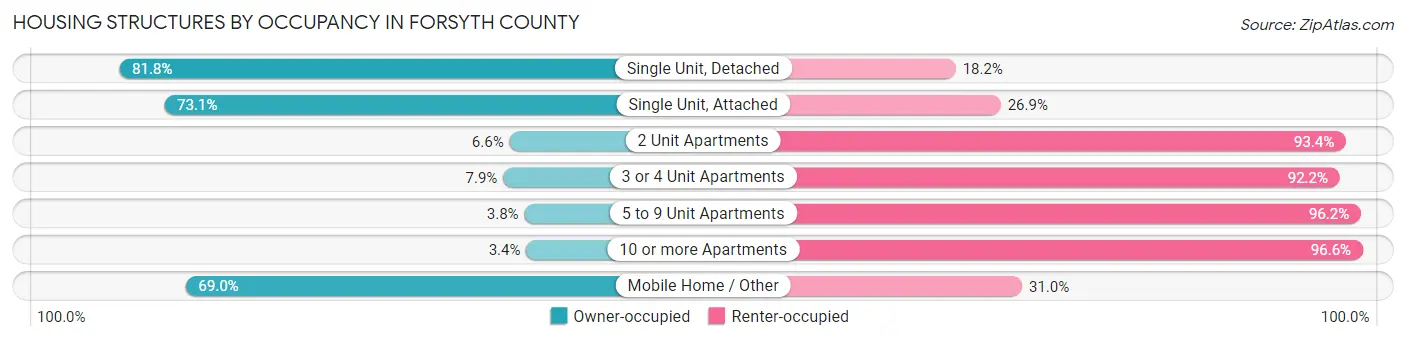
| Structure Type | Owner-occupied | Renter-occupied |
| Single Unit, Detached | 84,807 (81.8%) | 18,875 (18.2%) |
| Single Unit, Attached | 4,764 (73.1%) | 1,750 (26.9%) |
| 2 Unit Apartments | 129 (6.6%) | 1,813 (93.4%) |
| 3 or 4 Unit Apartments | 444 (7.9%) | 5,212 (92.1%) |
| 5 to 9 Unit Apartments | 354 (3.8%) | 9,068 (96.2%) |
| 10 or more Apartments | 703 (3.4%) | 19,963 (96.6%) |
| Mobile Home / Other | 3,599 (69.0%) | 1,615 (31.0%) |
| Total | 94,800 (61.9%) | 58,296 (38.1%) |
Housing Structures by Number of Rooms in Forsyth County
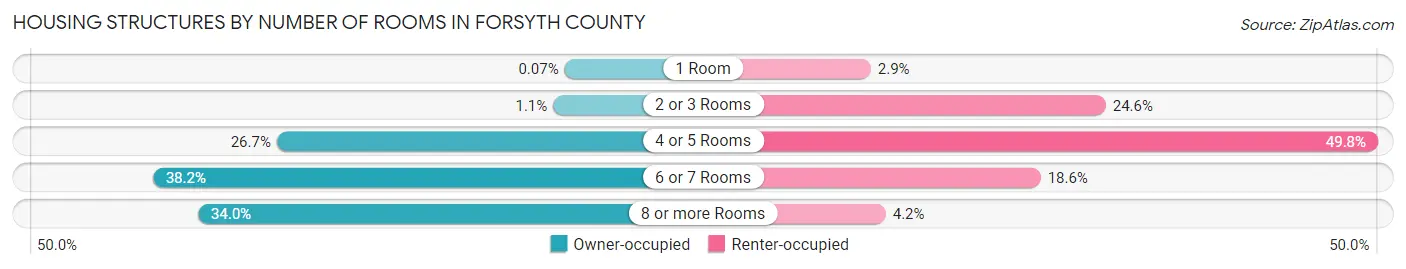
| Number of Rooms | Owner-occupied | Renter-occupied |
| 1 Room | 66 (0.1%) | 1,666 (2.9%) |
| 2 or 3 Rooms | 1,066 (1.1%) | 14,333 (24.6%) |
| 4 or 5 Rooms | 25,295 (26.7%) | 29,001 (49.7%) |
| 6 or 7 Rooms | 36,165 (38.2%) | 10,826 (18.6%) |
| 8 or more Rooms | 32,208 (34.0%) | 2,470 (4.2%) |
| Total | 94,800 (100.0%) | 58,296 (100.0%) |
Housing Structure by Heating Type in Forsyth County
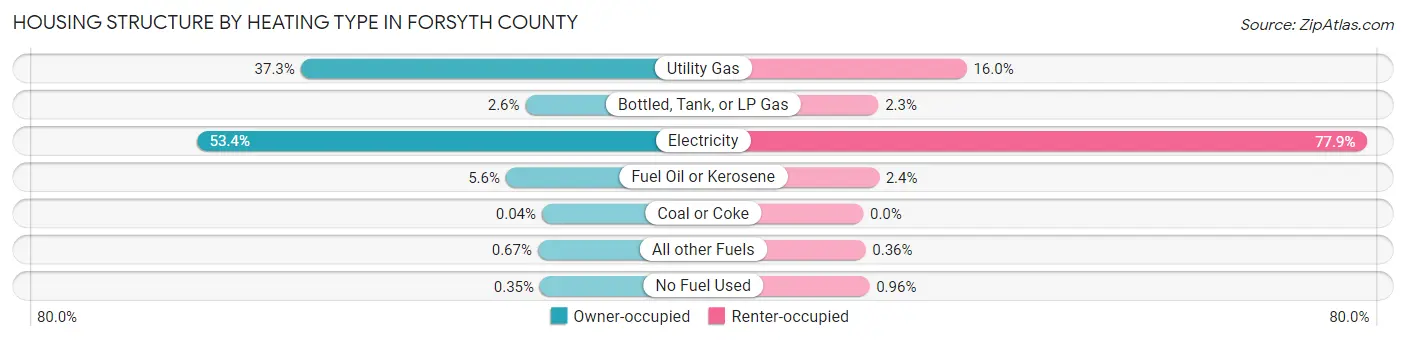
| Heating Type | Owner-occupied | Renter-occupied |
| Utility Gas | 35,390 (37.3%) | 9,322 (16.0%) |
| Bottled, Tank, or LP Gas | 2,459 (2.6%) | 1,364 (2.3%) |
| Electricity | 50,629 (53.4%) | 45,437 (77.9%) |
| Fuel Oil or Kerosene | 5,319 (5.6%) | 1,409 (2.4%) |
| Coal or Coke | 34 (0.0%) | 0 (0.0%) |
| All other Fuels | 637 (0.7%) | 207 (0.4%) |
| No Fuel Used | 332 (0.4%) | 557 (1.0%) |
| Total | 94,800 (100.0%) | 58,296 (100.0%) |
Household Vehicle Usage in Forsyth County
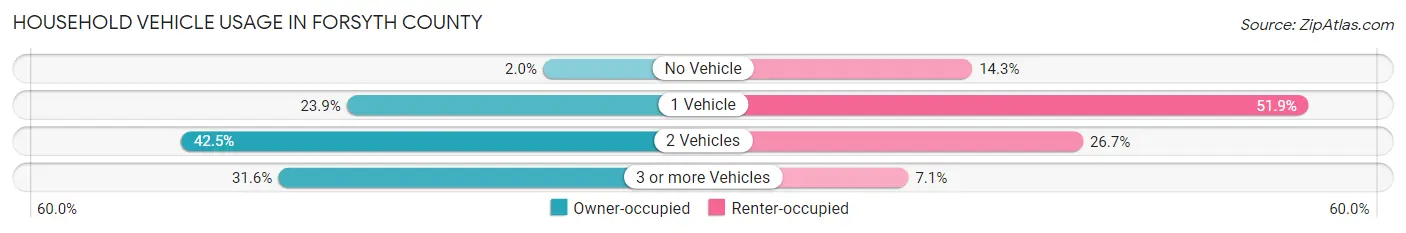
| Vehicles per Household | Owner-occupied | Renter-occupied |
| No Vehicle | 1,860 (2.0%) | 8,313 (14.3%) |
| 1 Vehicle | 22,697 (23.9%) | 30,280 (51.9%) |
| 2 Vehicles | 40,274 (42.5%) | 15,550 (26.7%) |
| 3 or more Vehicles | 29,969 (31.6%) | 4,153 (7.1%) |
| Total | 94,800 (100.0%) | 58,296 (100.0%) |
Real Estate & Mortgages in Forsyth County
Real Estate and Mortgage Overview in Forsyth County
| Characteristic | Without Mortgage | With Mortgage |
| Housing Units | 34,468 | 60,332 |
| Median Property Value | $188,800 | $214,800 |
| Median Household Income | $60,708 | $13,785 |
| Monthly Housing Costs | $454 | $3,752 |
| Real Estate Taxes | $1,699 | $808 |
Property Value by Mortgage Status in Forsyth County
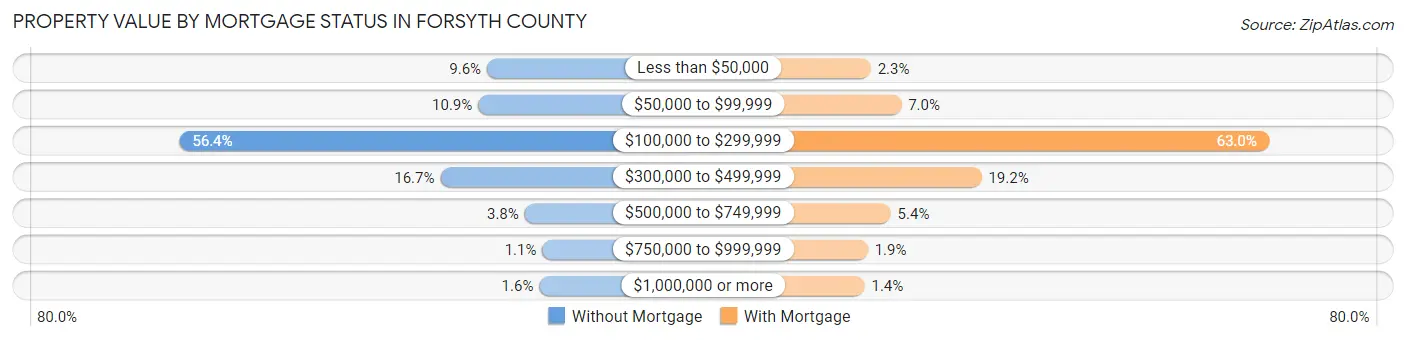
| Property Value | Without Mortgage | With Mortgage |
| Less than $50,000 | 3,290 (9.6%) | 1,396 (2.3%) |
| $50,000 to $99,999 | 3,754 (10.9%) | 4,197 (7.0%) |
| $100,000 to $299,999 | 19,443 (56.4%) | 37,993 (63.0%) |
| $300,000 to $499,999 | 5,740 (16.7%) | 11,578 (19.2%) |
| $500,000 to $749,999 | 1,313 (3.8%) | 3,225 (5.3%) |
| $750,000 to $999,999 | 382 (1.1%) | 1,118 (1.8%) |
| $1,000,000 or more | 546 (1.6%) | 825 (1.4%) |
| Total | 34,468 (100.0%) | 60,332 (100.0%) |
Household Income by Mortgage Status in Forsyth County
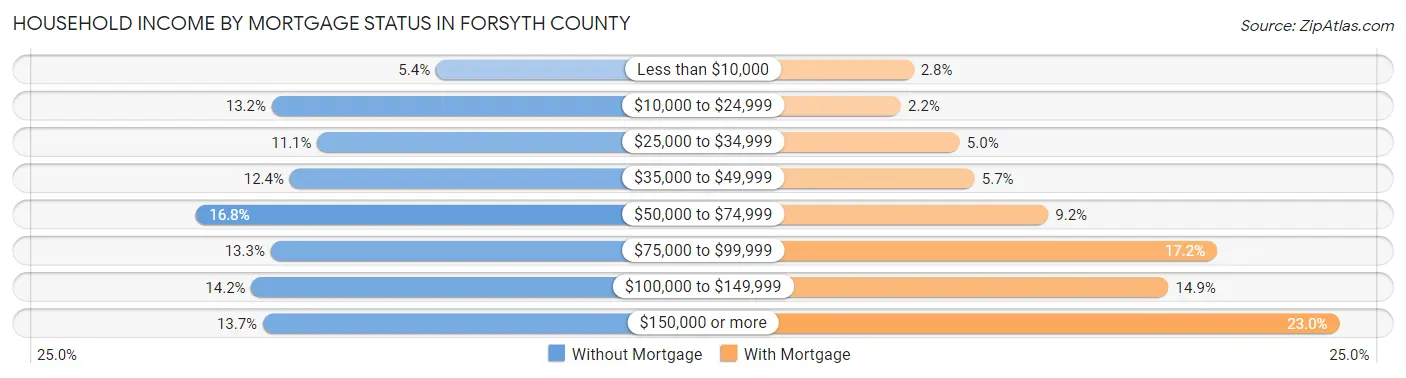
| Household Income | Without Mortgage | With Mortgage |
| Less than $10,000 | 1,863 (5.4%) | 1,672 (2.8%) |
| $10,000 to $24,999 | 4,559 (13.2%) | 1,307 (2.2%) |
| $25,000 to $34,999 | 3,811 (11.1%) | 2,998 (5.0%) |
| $35,000 to $49,999 | 4,262 (12.4%) | 3,429 (5.7%) |
| $50,000 to $74,999 | 5,797 (16.8%) | 5,537 (9.2%) |
| $75,000 to $99,999 | 4,578 (13.3%) | 10,385 (17.2%) |
| $100,000 to $149,999 | 4,894 (14.2%) | 8,993 (14.9%) |
| $150,000 or more | 4,704 (13.7%) | 13,898 (23.0%) |
| Total | 34,468 (100.0%) | 60,332 (100.0%) |
Property Value to Household Income Ratio in Forsyth County
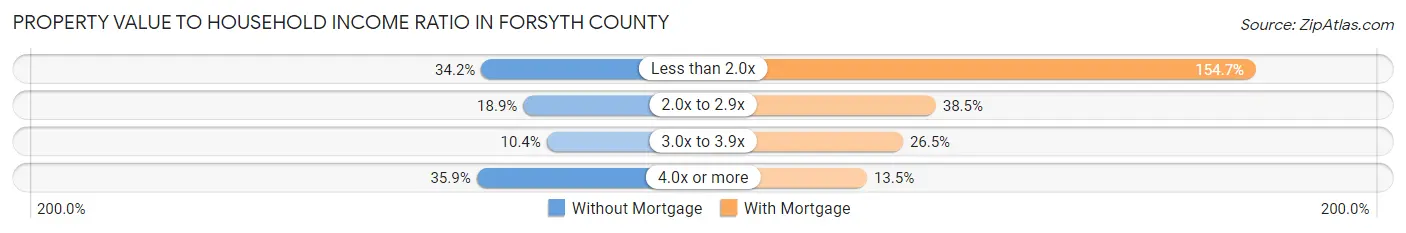
| Value-to-Income Ratio | Without Mortgage | With Mortgage |
| Less than 2.0x | 11,779 (34.2%) | 93,339 (154.7%) |
| 2.0x to 2.9x | 6,522 (18.9%) | 23,209 (38.5%) |
| 3.0x to 3.9x | 3,580 (10.4%) | 16,008 (26.5%) |
| 4.0x or more | 12,362 (35.9%) | 8,127 (13.5%) |
| Total | 34,468 (100.0%) | 60,332 (100.0%) |
Real Estate Taxes by Mortgage Status in Forsyth County
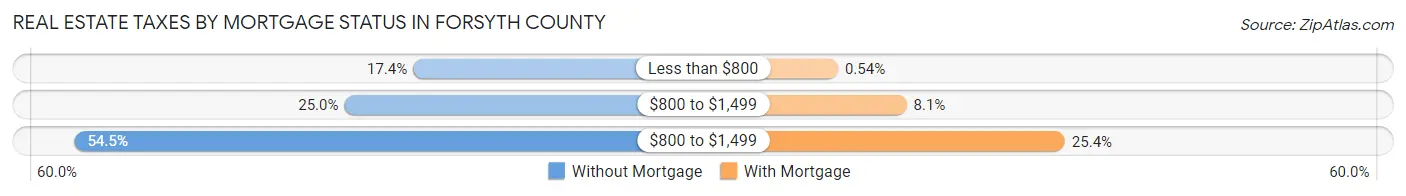
| Property Taxes | Without Mortgage | With Mortgage |
| Less than $800 | 6,009 (17.4%) | 324 (0.5%) |
| $800 to $1,499 | 8,605 (25.0%) | 4,864 (8.1%) |
| $800 to $1,499 | 18,797 (54.5%) | 15,331 (25.4%) |
| Total | 34,468 (100.0%) | 60,332 (100.0%) |
Health & Disability in Forsyth County
Health Insurance Coverage by Age in Forsyth County
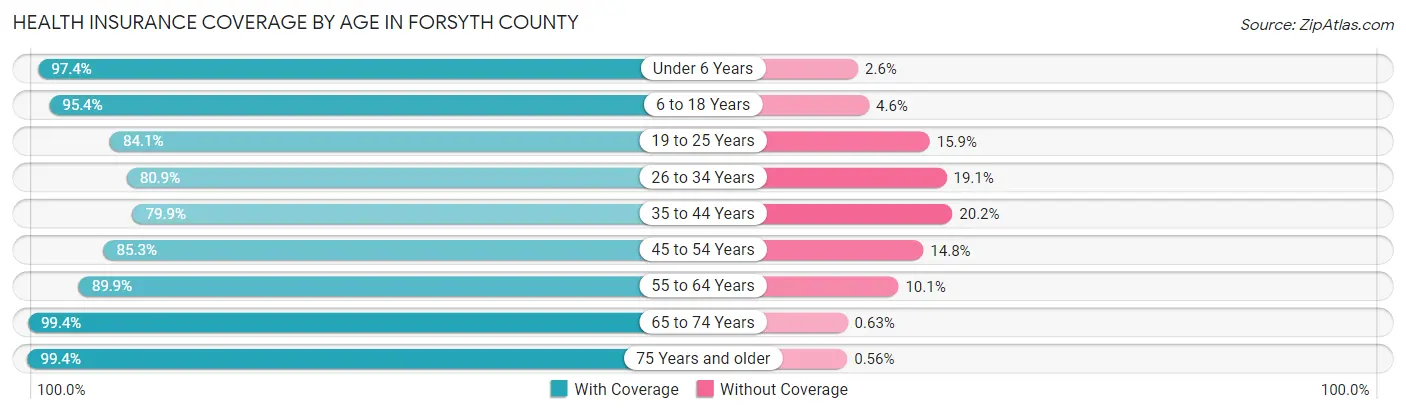
| Age Bracket | With Coverage | Without Coverage |
| Under 6 Years | 25,335 (97.4%) | 670 (2.6%) |
| 6 to 18 Years | 64,029 (95.4%) | 3,098 (4.6%) |
| 19 to 25 Years | 31,254 (84.1%) | 5,928 (15.9%) |
| 26 to 34 Years | 36,294 (80.9%) | 8,544 (19.1%) |
| 35 to 44 Years | 36,561 (79.8%) | 9,228 (20.2%) |
| 45 to 54 Years | 40,933 (85.3%) | 7,081 (14.7%) |
| 55 to 64 Years | 44,527 (89.9%) | 5,009 (10.1%) |
| 65 to 74 Years | 37,111 (99.4%) | 236 (0.6%) |
| 75 Years and older | 24,510 (99.4%) | 138 (0.6%) |
| Total | 340,554 (89.5%) | 39,932 (10.5%) |
Health Insurance Coverage by Citizenship Status in Forsyth County
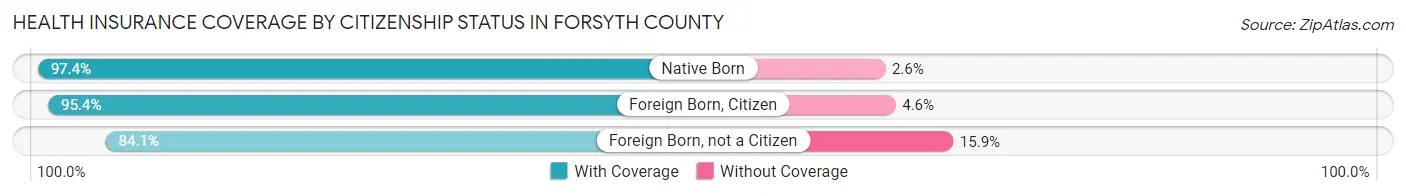
| Citizenship Status | With Coverage | Without Coverage |
| Native Born | 25,335 (97.4%) | 670 (2.6%) |
| Foreign Born, Citizen | 64,029 (95.4%) | 3,098 (4.6%) |
| Foreign Born, not a Citizen | 31,254 (84.1%) | 5,928 (15.9%) |
Health Insurance Coverage by Household Income in Forsyth County
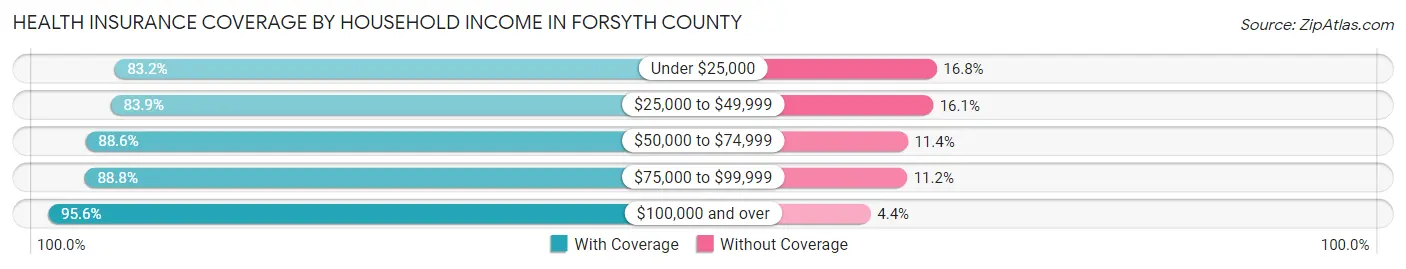
| Household Income | With Coverage | Without Coverage |
| Under $25,000 | 43,856 (83.2%) | 8,851 (16.8%) |
| $25,000 to $49,999 | 61,009 (83.9%) | 11,703 (16.1%) |
| $50,000 to $74,999 | 57,090 (88.6%) | 7,322 (11.4%) |
| $75,000 to $99,999 | 46,561 (88.8%) | 5,889 (11.2%) |
| $100,000 and over | 124,491 (95.6%) | 5,760 (4.4%) |
Public vs Private Health Insurance Coverage by Age in Forsyth County
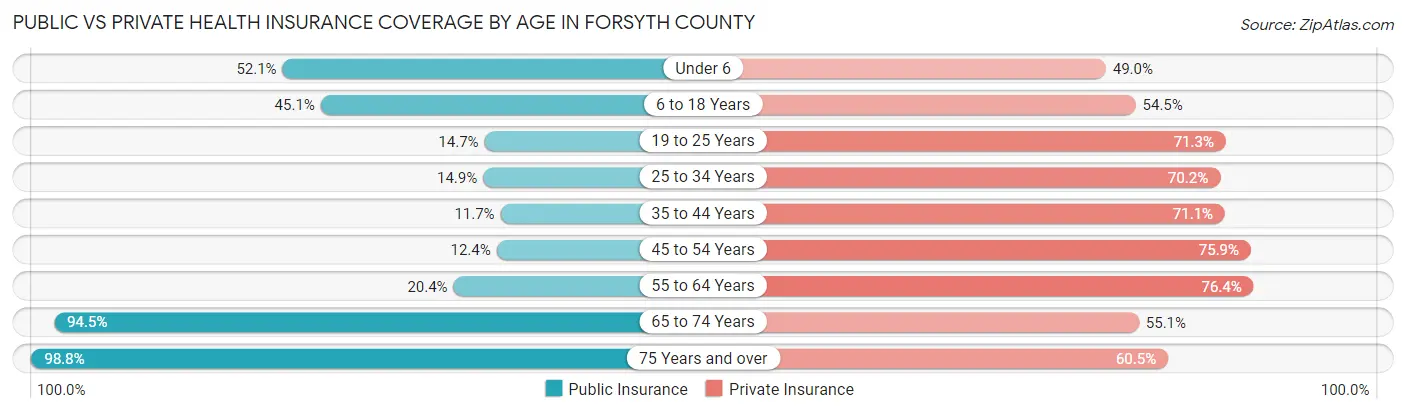
| Age Bracket | Public Insurance | Private Insurance |
| Under 6 | 13,560 (52.1%) | 12,746 (49.0%) |
| 6 to 18 Years | 30,242 (45.1%) | 36,610 (54.5%) |
| 19 to 25 Years | 5,448 (14.6%) | 26,495 (71.3%) |
| 25 to 34 Years | 6,683 (14.9%) | 31,479 (70.2%) |
| 35 to 44 Years | 5,349 (11.7%) | 32,558 (71.1%) |
| 45 to 54 Years | 5,953 (12.4%) | 36,454 (75.9%) |
| 55 to 64 Years | 10,106 (20.4%) | 37,866 (76.4%) |
| 65 to 74 Years | 35,306 (94.5%) | 20,594 (55.1%) |
| 75 Years and over | 24,339 (98.8%) | 14,922 (60.5%) |
| Total | 136,986 (36.0%) | 249,724 (65.6%) |
Disability Status by Sex by Age in Forsyth County
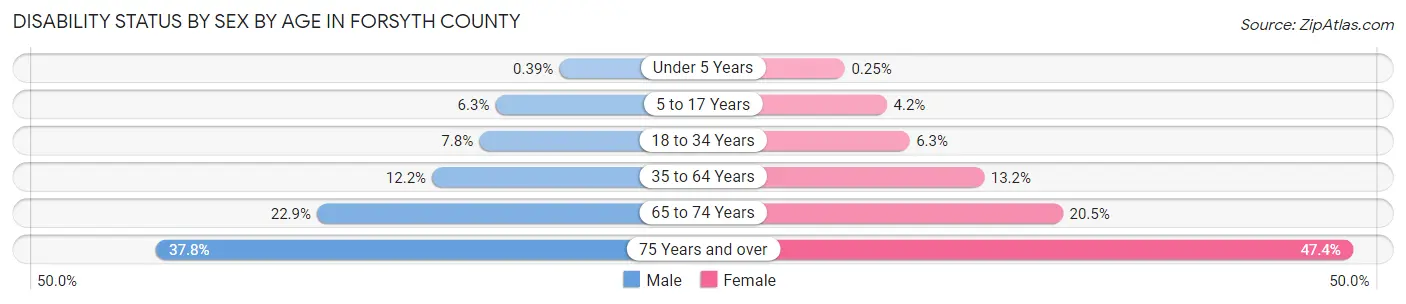
| Age Bracket | Male | Female |
| Under 5 Years | 44 (0.4%) | 27 (0.3%) |
| 5 to 17 Years | 2,081 (6.3%) | 1,331 (4.2%) |
| 18 to 34 Years | 3,286 (7.8%) | 2,901 (6.3%) |
| 35 to 64 Years | 8,325 (12.2%) | 9,898 (13.2%) |
| 65 to 74 Years | 3,849 (22.9%) | 4,206 (20.5%) |
| 75 Years and over | 3,701 (37.8%) | 7,042 (47.4%) |
Disability Class by Sex by Age in Forsyth County
Disability Class: Hearing Difficulty
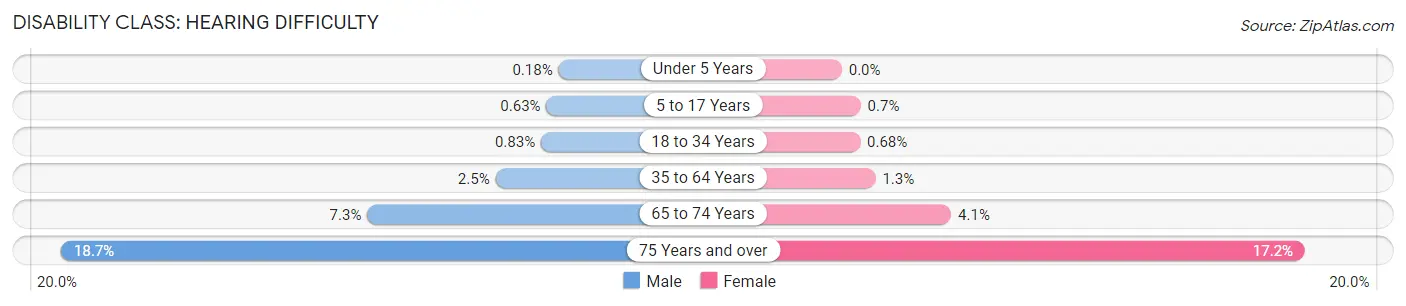
| Age Bracket | Male | Female |
| Under 5 Years | 20 (0.2%) | 0 (0.0%) |
| 5 to 17 Years | 209 (0.6%) | 225 (0.7%) |
| 18 to 34 Years | 348 (0.8%) | 316 (0.7%) |
| 35 to 64 Years | 1,719 (2.5%) | 942 (1.3%) |
| 65 to 74 Years | 1,225 (7.3%) | 834 (4.1%) |
| 75 Years and over | 1,827 (18.6%) | 2,554 (17.2%) |
Disability Class: Vision Difficulty
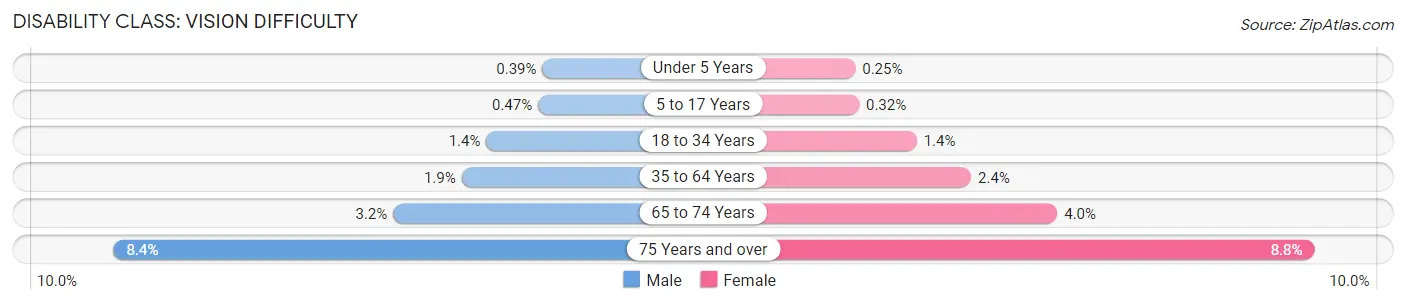
| Age Bracket | Male | Female |
| Under 5 Years | 44 (0.4%) | 27 (0.3%) |
| 5 to 17 Years | 155 (0.5%) | 102 (0.3%) |
| 18 to 34 Years | 598 (1.4%) | 644 (1.4%) |
| 35 to 64 Years | 1,287 (1.9%) | 1,800 (2.4%) |
| 65 to 74 Years | 531 (3.2%) | 821 (4.0%) |
| 75 Years and over | 818 (8.4%) | 1,302 (8.8%) |
Disability Class: Cognitive Difficulty
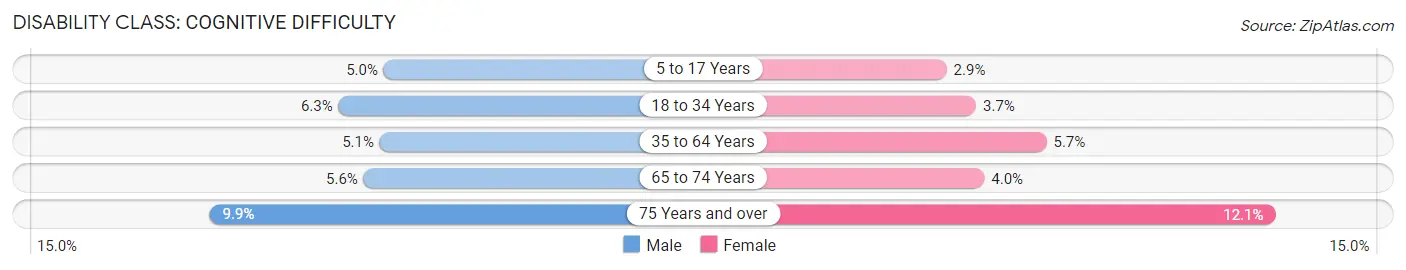
| Age Bracket | Male | Female |
| 5 to 17 Years | 1,646 (5.0%) | 935 (2.9%) |
| 18 to 34 Years | 2,627 (6.3%) | 1,731 (3.7%) |
| 35 to 64 Years | 3,486 (5.1%) | 4,280 (5.7%) |
| 65 to 74 Years | 935 (5.6%) | 814 (4.0%) |
| 75 Years and over | 965 (9.9%) | 1,793 (12.1%) |
Disability Class: Ambulatory Difficulty
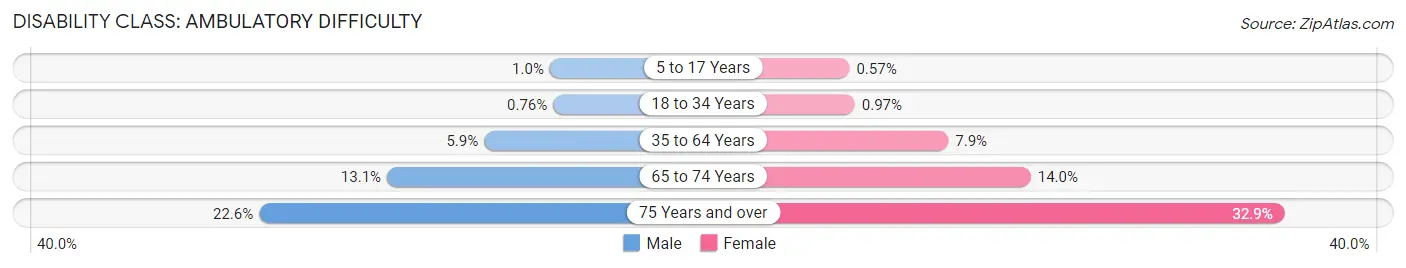
| Age Bracket | Male | Female |
| 5 to 17 Years | 332 (1.0%) | 183 (0.6%) |
| 18 to 34 Years | 319 (0.8%) | 450 (1.0%) |
| 35 to 64 Years | 4,018 (5.9%) | 5,940 (7.9%) |
| 65 to 74 Years | 2,203 (13.1%) | 2,881 (14.0%) |
| 75 Years and over | 2,212 (22.6%) | 4,882 (32.9%) |
Disability Class: Self-Care Difficulty
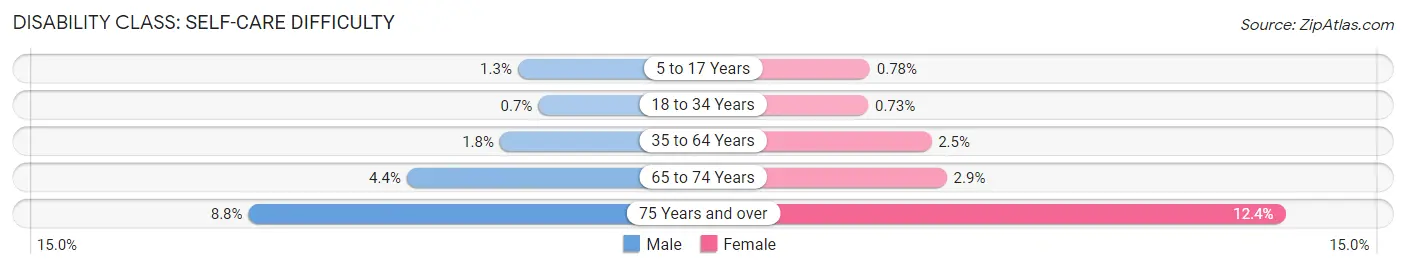
| Age Bracket | Male | Female |
| 5 to 17 Years | 419 (1.3%) | 249 (0.8%) |
| 18 to 34 Years | 295 (0.7%) | 336 (0.7%) |
| 35 to 64 Years | 1,206 (1.8%) | 1,867 (2.5%) |
| 65 to 74 Years | 733 (4.4%) | 599 (2.9%) |
| 75 Years and over | 859 (8.8%) | 1,835 (12.3%) |
Technology Access in Forsyth County
Computing Device Access in Forsyth County
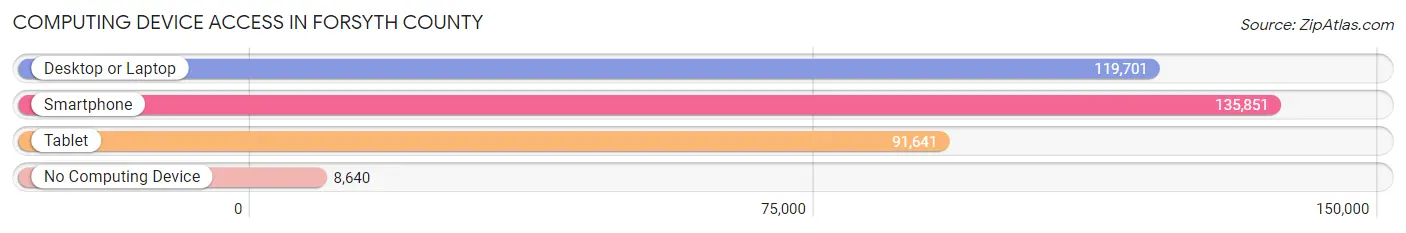
| Device Type | # Households | % Households |
| Desktop or Laptop | 119,701 | 78.2% |
| Smartphone | 135,851 | 88.7% |
| Tablet | 91,641 | 59.9% |
| No Computing Device | 8,640 | 5.6% |
| Total | 153,096 | 100.0% |
Internet Access in Forsyth County
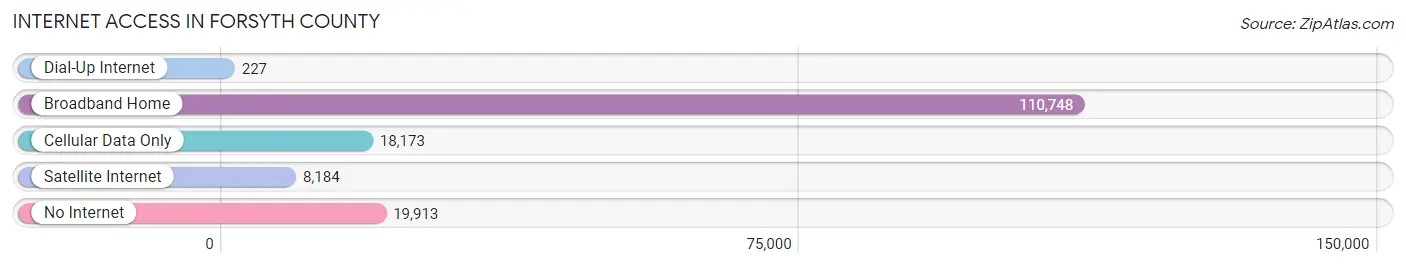
| Internet Type | # Households | % Households |
| Dial-Up Internet | 227 | 0.2% |
| Broadband Home | 110,748 | 72.3% |
| Cellular Data Only | 18,173 | 11.9% |
| Satellite Internet | 8,184 | 5.3% |
| No Internet | 19,913 | 13.0% |
| Total | 153,096 | 100.0% |
Forsyth County Summary
Forsyth County, North Carolina is located in the northwestern part of the state and is part of the Piedmont Triad region. It is bordered by Yadkin, Davie, Stokes, and Guilford counties. The county seat is Winston-Salem, which is also the largest city in the county. Forsyth County was established in 1849 and is named after Colonel Benjamin Forsyth, who served in the War of 1812.
Geography
Forsyth County covers an area of 545 square miles and is located in the Piedmont region of North Carolina. The terrain is mostly rolling hills and valleys, with the highest point being Pilot Mountain at 2,421 feet. The county is drained by the Yadkin River and its tributaries, including the Deep and Haw rivers. The county is home to several state parks, including Hanging Rock State Park, Pilot Mountain State Park, and Tanglewood Park.
Climate
Forsyth County has a humid subtropical climate, with hot, humid summers and mild winters. The average annual temperature is around 61°F, with the average high in July being around 89°F and the average low in January being around 33°F. The average annual precipitation is around 44 inches, with the wettest month being July and the driest month being October.
Demographics
As of the 2010 census, Forsyth County had a population of 350,670. The racial makeup of the county was 73.3% White, 19.2% African American, 0.4% Native American, 3.2% Asian, 0.1% Pacific Islander, 1.7% from other races, and 2.1% from two or more races. Hispanic or Latino of any race were 4.7% of the population.
The median household income in Forsyth County was $50,890, and the median family income was $62,845. The per capita income was $27,945. About 11.2% of the population was below the poverty line.
Economy
Forsyth County has a diverse economy, with major industries including healthcare, manufacturing, finance, and technology. The largest employers in the county are Wake Forest Baptist Medical Center, Novant Health Forsyth Medical Center, Hanesbrands, BB&T, and Inmar. The county is also home to several universities and colleges, including Wake Forest University, Winston-Salem State University, and Forsyth Technical Community College.
The county is served by the Winston-Salem/Forsyth County Schools, which is the largest school system in the state. The county is also home to several museums, including the Reynolda House Museum of American Art, the Old Salem Museums & Gardens, and the Southeastern Center for Contemporary Art.
Conclusion
Forsyth County, North Carolina is a vibrant and diverse county located in the northwestern part of the state. It is home to a variety of industries, universities, and museums, and has a population of 350,670. The county has a humid subtropical climate, with hot, humid summers and mild winters. The economy is diverse, with major industries including healthcare, manufacturing, finance, and technology. Forsyth County is a great place to live, work, and visit.
Common Questions
What is the Total Population of Forsyth County?
Total Population of Forsyth County is 383,739.
What is the Total Male Population of Forsyth County?
Total Male Population of Forsyth County is 182,947.
What is the Total Female Population of Forsyth County?
Total Female Population of Forsyth County is 200,792.
What is the Ratio of Males per 100 Females in Forsyth County?
There are 91.11 Males per 100 Females in Forsyth County.
What is the Ratio of Females per 100 Males in Forsyth County?
There are 109.75 Females per 100 Males in Forsyth County.
What is the Median Population Age in Forsyth County?
Median Population Age in Forsyth County is 38.4 Years.
What is the Average Family Size in Forsyth County
Average Family Size in Forsyth County is 3.1 People.
What is the Average Household Size in Forsyth County
Average Household Size in Forsyth County is 2.4 People.
What is Per Capita Income in Forsyth County?
Per Capita income in Forsyth County is $35,600.
What is the Median Family Income in Forsyth County?
Median Family Income in Forsyth County is $79,040.
What is the Median Household income in Forsyth County?
Median Household Income in Forsyth County is $61,229.
What is Income or Wage Gap in Forsyth County?
Income or Wage Gap in Forsyth County is 21.4%.
Women in Forsyth County earn 78.6 cents for every dollar earned by a man.
What is Family Income Deficit in Forsyth County?
Family Income Deficit in Forsyth County is $11,601.
Families that are below poverty line in Forsyth County earn $11,601 less on average than the poverty threshold level.
What is Inequality or Gini Index in Forsyth County?
Inequality or Gini Index in Forsyth County is 0.48.
How Large is the Labor Force in Forsyth County?
There are 189,555 People in the Labor Forcein in Forsyth County.
What is the Percentage of People in the Labor Force in Forsyth County?
61.7% of People are in the Labor Force in Forsyth County.
What is the Unemployment Rate in Forsyth County?
Unemployment Rate in Forsyth County is 5.6%.