Durham County, NC
Durham County Map
Durham County Overview
325,101
TOTAL POPULATION
156,231
MALE POPULATION
168,870
FEMALE POPULATION
92.52
MALES / 100 FEMALES
108.09
FEMALES / 100 MALES
35.8
MEDIAN AGE
3.0
AVG FAMILY SIZE
2.3
AVG HOUSEHOLD SIZE
$43,945
PER CAPITA INCOME
$95,715
AVG FAMILY INCOME
$74,927
AVG HOUSEHOLD INCOME
10.0%
WAGE / INCOME GAP [ % ]
90.0¢/ $1
WAGE / INCOME GAP [ $ ]
$10,661
FAMILY INCOME DEFICIT
0.46
INEQUALITY / GINI INDEX
179,781
LABOR FORCE [ PEOPLE ]
67.5%
PERCENT IN LABOR FORCE
4.3%
UNEMPLOYMENT RATE
Durham County Area Codes
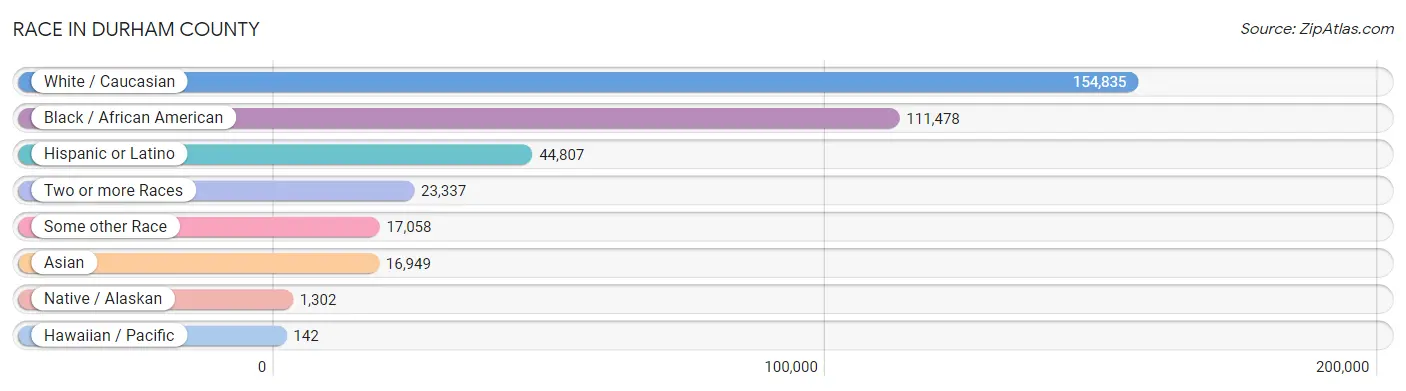
Race in Durham County
The most populous races in Durham County are White / Caucasian (154,835 | 47.6%), Black / African American (111,478 | 34.3%), and Hispanic or Latino (44,807 | 13.8%).
| Race | # Population | % Population |
| Asian | 16,949 | 5.2% |
| Black / African American | 111,478 | 34.3% |
| Hawaiian / Pacific | 142 | 0.0% |
| Hispanic or Latino | 44,807 | 13.8% |
| Native / Alaskan | 1,302 | 0.4% |
| White / Caucasian | 154,835 | 47.6% |
| Two or more Races | 23,337 | 7.2% |
| Some other Race | 17,058 | 5.2% |
| Total | 325,101 | 100.0% |
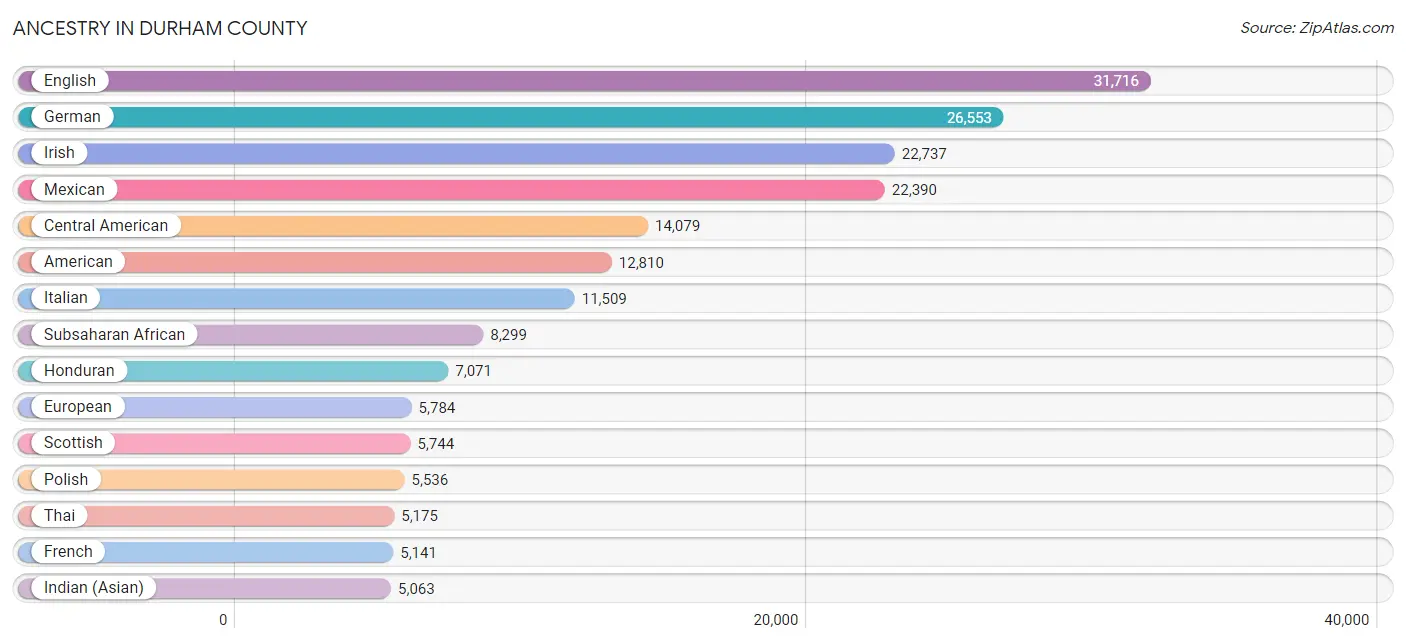
Ancestry in Durham County
The most populous ancestries reported in Durham County are English (31,716 | 9.8%), German (26,553 | 8.2%), Irish (22,737 | 7.0%), Mexican (22,390 | 6.9%), and Central American (14,079 | 4.3%), together accounting for 36.1% of all Durham County residents.
| Ancestry | # Population | % Population |
| Afghan | 105 | 0.0% |
| African | 3,350 | 1.0% |
| Alaskan Athabascan | 2 | 0.0% |
| Albanian | 20 | 0.0% |
| Alsatian | 11 | 0.0% |
| American | 12,810 | 3.9% |
| Apache | 3 | 0.0% |
| Arab | 1,898 | 0.6% |
| Argentinean | 341 | 0.1% |
| Armenian | 504 | 0.2% |
| Assyrian / Chaldean / Syriac | 17 | 0.0% |
| Australian | 51 | 0.0% |
| Austrian | 578 | 0.2% |
| Bahamian | 65 | 0.0% |
| Bangladeshi | 71 | 0.0% |
| Barbadian | 47 | 0.0% |
| Belgian | 246 | 0.1% |
| Belizean | 185 | 0.1% |
| Bhutanese | 1,129 | 0.4% |
| Blackfeet | 359 | 0.1% |
| Bolivian | 29 | 0.0% |
| Brazilian | 400 | 0.1% |
| British | 2,890 | 0.9% |
| British West Indian | 102 | 0.0% |
| Bulgarian | 17 | 0.0% |
| Burmese | 1,475 | 0.4% |
| Cajun | 33 | 0.0% |
| Cambodian | 24 | 0.0% |
| Canadian | 533 | 0.2% |
| Celtic | 113 | 0.0% |
| Central American | 14,079 | 4.3% |
| Central American Indian | 358 | 0.1% |
| Cherokee | 1,262 | 0.4% |
| Cheyenne | 13 | 0.0% |
| Chickasaw | 18 | 0.0% |
| Chilean | 116 | 0.0% |
| Chinese | 18 | 0.0% |
| Chippewa | 48 | 0.0% |
| Choctaw | 101 | 0.0% |
| Colombian | 1,249 | 0.4% |
| Colville | 16 | 0.0% |
| Comanche | 28 | 0.0% |
| Costa Rican | 380 | 0.1% |
| Cree | 13 | 0.0% |
| Creek | 167 | 0.1% |
| Croatian | 261 | 0.1% |
| Cuban | 1,226 | 0.4% |
| Cypriot | 13 | 0.0% |
| Czech | 990 | 0.3% |
| Czechoslovakian | 225 | 0.1% |
| Danish | 844 | 0.3% |
| Delaware | 13 | 0.0% |
| Dominican | 566 | 0.2% |
| Dutch | 1,852 | 0.6% |
| Eastern European | 1,454 | 0.4% |
| Ecuadorian | 214 | 0.1% |
| Egyptian | 221 | 0.1% |
| English | 31,716 | 9.8% |
| Estonian | 67 | 0.0% |
| Ethiopian | 507 | 0.2% |
| European | 5,784 | 1.8% |
| Filipino | 496 | 0.2% |
| Finnish | 338 | 0.1% |
| French | 5,141 | 1.6% |
| French American Indian | 14 | 0.0% |
| French Canadian | 1,113 | 0.3% |
| German | 26,553 | 8.2% |
| German Russian | 25 | 0.0% |
| Ghanaian | 808 | 0.3% |
| Greek | 1,188 | 0.4% |
| Guamanian / Chamorro | 39 | 0.0% |
| Guatemalan | 1,490 | 0.5% |
| Guyanese | 44 | 0.0% |
| Haitian | 311 | 0.1% |
| Honduran | 7,071 | 2.2% |
| Hungarian | 1,061 | 0.3% |
| Icelander | 55 | 0.0% |
| Indian (Asian) | 5,063 | 1.6% |
| Indonesian | 354 | 0.1% |
| Iranian | 228 | 0.1% |
| Iraqi | 22 | 0.0% |
| Irish | 22,737 | 7.0% |
| Iroquois | 52 | 0.0% |
| Israeli | 134 | 0.0% |
| Italian | 11,509 | 3.5% |
| Jamaican | 1,677 | 0.5% |
| Japanese | 48 | 0.0% |
| Jordanian | 4 | 0.0% |
| Kenyan | 443 | 0.1% |
| Kiowa | 5 | 0.0% |
| Korean | 2,489 | 0.8% |
| Laotian | 76 | 0.0% |
| Latvian | 184 | 0.1% |
| Lebanese | 333 | 0.1% |
| Liberian | 878 | 0.3% |
| Lithuanian | 1,455 | 0.4% |
| Lumbee | 537 | 0.2% |
| Luxembourger | 16 | 0.0% |
| Macedonian | 40 | 0.0% |
| Malaysian | 29 | 0.0% |
| Maltese | 250 | 0.1% |
| Mexican | 22,390 | 6.9% |
| Mexican American Indian | 259 | 0.1% |
| Moroccan | 250 | 0.1% |
| Native Hawaiian | 425 | 0.1% |
| Navajo | 12 | 0.0% |
| New Zealander | 91 | 0.0% |
| Nicaraguan | 310 | 0.1% |
| Nigerian | 1,577 | 0.5% |
| Northern European | 373 | 0.1% |
| Norwegian | 1,690 | 0.5% |
| Pakistani | 431 | 0.1% |
| Palestinian | 334 | 0.1% |
| Panamanian | 123 | 0.0% |
| Pennsylvania German | 17 | 0.0% |
| Peruvian | 240 | 0.1% |
| Polish | 5,536 | 1.7% |
| Portuguese | 780 | 0.2% |
| Pueblo | 19 | 0.0% |
| Puerto Rican | 2,129 | 0.6% |
| Romanian | 295 | 0.1% |
| Russian | 1,599 | 0.5% |
| Salvadoran | 4,675 | 1.4% |
| Scandinavian | 505 | 0.2% |
| Scotch-Irish | 4,586 | 1.4% |
| Scottish | 5,744 | 1.8% |
| Senegalese | 143 | 0.0% |
| Serbian | 136 | 0.0% |
| Sierra Leonean | 119 | 0.0% |
| Sioux | 92 | 0.0% |
| Slavic | 131 | 0.0% |
| Slovak | 374 | 0.1% |
| Slovene | 137 | 0.0% |
| South African | 163 | 0.1% |
| South American | 2,635 | 0.8% |
| South American Indian | 22 | 0.0% |
| Spaniard | 348 | 0.1% |
| Spanish | 200 | 0.1% |
| Sri Lankan | 2,038 | 0.6% |
| Subsaharan African | 8,299 | 2.5% |
| Sudanese | 79 | 0.0% |
| Swedish | 2,709 | 0.8% |
| Swiss | 552 | 0.2% |
| Syrian | 148 | 0.1% |
| Thai | 5,175 | 1.6% |
| Trinidadian and Tobagonian | 159 | 0.1% |
| Turkish | 181 | 0.1% |
| U.S. Virgin Islander | 21 | 0.0% |
| Ugandan | 38 | 0.0% |
| Ukrainian | 658 | 0.2% |
| Uruguayan | 42 | 0.0% |
| Venezuelan | 404 | 0.1% |
| Vietnamese | 69 | 0.0% |
| Welsh | 1,747 | 0.5% |
| West Indian | 435 | 0.1% |
| Yugoslavian | 13 | 0.0% |
| Zimbabwean | 14 | 0.0% | View All 157 Rows |
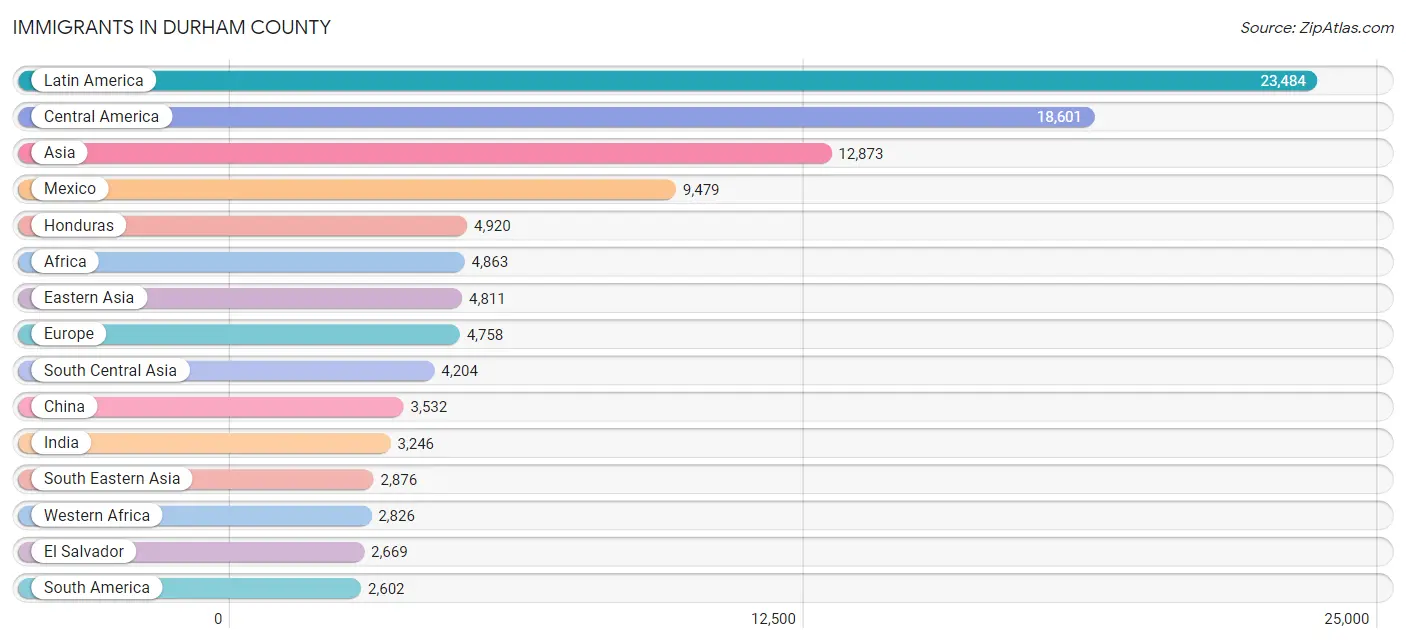
Immigrants in Durham County
The most numerous immigrant groups reported in Durham County came from Latin America (23,484 | 7.2%), Central America (18,601 | 5.7%), Asia (12,873 | 4.0%), Mexico (9,479 | 2.9%), and Honduras (4,920 | 1.5%), together accounting for 21.3% of all Durham County residents.
| Immigration Origin | # Population | % Population |
| Afghanistan | 174 | 0.1% |
| Africa | 4,863 | 1.5% |
| Argentina | 257 | 0.1% |
| Armenia | 11 | 0.0% |
| Asia | 12,873 | 4.0% |
| Australia | 105 | 0.0% |
| Bahamas | 71 | 0.0% |
| Bangladesh | 97 | 0.0% |
| Barbados | 61 | 0.0% |
| Belarus | 24 | 0.0% |
| Belgium | 46 | 0.0% |
| Belize | 26 | 0.0% |
| Bolivia | 17 | 0.0% |
| Brazil | 356 | 0.1% |
| Bulgaria | 17 | 0.0% |
| Cambodia | 79 | 0.0% |
| Cameroon | 47 | 0.0% |
| Canada | 800 | 0.3% |
| Caribbean | 2,281 | 0.7% |
| Central America | 18,601 | 5.7% |
| Chile | 48 | 0.0% |
| China | 3,532 | 1.1% |
| Colombia | 1,031 | 0.3% |
| Costa Rica | 222 | 0.1% |
| Cuba | 591 | 0.2% |
| Czechoslovakia | 92 | 0.0% |
| Denmark | 17 | 0.0% |
| Dominica | 28 | 0.0% |
| Dominican Republic | 237 | 0.1% |
| Eastern Africa | 1,019 | 0.3% |
| Eastern Asia | 4,811 | 1.5% |
| Eastern Europe | 1,009 | 0.3% |
| Ecuador | 250 | 0.1% |
| Egypt | 182 | 0.1% |
| El Salvador | 2,669 | 0.8% |
| England | 654 | 0.2% |
| Eritrea | 58 | 0.0% |
| Ethiopia | 332 | 0.1% |
| Europe | 4,758 | 1.5% |
| France | 193 | 0.1% |
| Germany | 797 | 0.3% |
| Ghana | 541 | 0.2% |
| Greece | 290 | 0.1% |
| Guatemala | 1,156 | 0.4% |
| Guyana | 19 | 0.0% |
| Haiti | 119 | 0.0% |
| Honduras | 4,920 | 1.5% |
| Hong Kong | 66 | 0.0% |
| Hungary | 136 | 0.0% |
| India | 3,246 | 1.0% |
| Indonesia | 32 | 0.0% |
| Iran | 180 | 0.1% |
| Iraq | 170 | 0.1% |
| Ireland | 189 | 0.1% |
| Israel | 151 | 0.1% |
| Italy | 259 | 0.1% |
| Jamaica | 795 | 0.2% |
| Japan | 286 | 0.1% |
| Jordan | 95 | 0.0% |
| Kenya | 267 | 0.1% |
| Korea | 983 | 0.3% |
| Kuwait | 82 | 0.0% |
| Laos | 21 | 0.0% |
| Latin America | 23,484 | 7.2% |
| Latvia | 3 | 0.0% |
| Lebanon | 35 | 0.0% |
| Liberia | 676 | 0.2% |
| Lithuania | 122 | 0.0% |
| Malaysia | 6 | 0.0% |
| Mexico | 9,479 | 2.9% |
| Micronesia | 20 | 0.0% |
| Middle Africa | 99 | 0.0% |
| Morocco | 202 | 0.1% |
| Nepal | 228 | 0.1% |
| Netherlands | 128 | 0.0% |
| Nicaragua | 124 | 0.0% |
| Nigeria | 1,068 | 0.3% |
| Northern Africa | 553 | 0.2% |
| Northern Europe | 1,728 | 0.5% |
| Oceania | 326 | 0.1% |
| Pakistan | 210 | 0.1% |
| Panama | 5 | 0.0% |
| Peru | 172 | 0.1% |
| Philippines | 1,194 | 0.4% |
| Poland | 136 | 0.0% |
| Portugal | 80 | 0.0% |
| Romania | 149 | 0.1% |
| Russia | 138 | 0.0% |
| Saudi Arabia | 122 | 0.0% |
| Scotland | 26 | 0.0% |
| Senegal | 143 | 0.0% |
| Serbia | 39 | 0.0% |
| Sierra Leone | 295 | 0.1% |
| Singapore | 53 | 0.0% |
| South Africa | 227 | 0.1% |
| South America | 2,602 | 0.8% |
| South Central Asia | 4,204 | 1.3% |
| South Eastern Asia | 2,876 | 0.9% |
| Southern Europe | 776 | 0.2% |
| Spain | 147 | 0.1% |
| Sri Lanka | 58 | 0.0% |
| St. Vincent and the Grenadines | 64 | 0.0% |
| Sudan | 48 | 0.0% |
| Sweden | 128 | 0.0% |
| Switzerland | 48 | 0.0% |
| Syria | 42 | 0.0% |
| Taiwan | 267 | 0.1% |
| Thailand | 392 | 0.1% |
| Trinidad and Tobago | 134 | 0.0% |
| Turkey | 116 | 0.0% |
| Uganda | 77 | 0.0% |
| Ukraine | 98 | 0.0% |
| Uruguay | 24 | 0.0% |
| Uzbekistan | 4 | 0.0% |
| Venezuela | 412 | 0.1% |
| Vietnam | 908 | 0.3% |
| West Indies | 24 | 0.0% |
| Western Africa | 2,826 | 0.9% |
| Western Asia | 982 | 0.3% |
| Western Europe | 1,212 | 0.4% |
| Yemen | 106 | 0.0% |
| Zaire | 52 | 0.0% |
| Zimbabwe | 85 | 0.0% | View All 123 Rows |
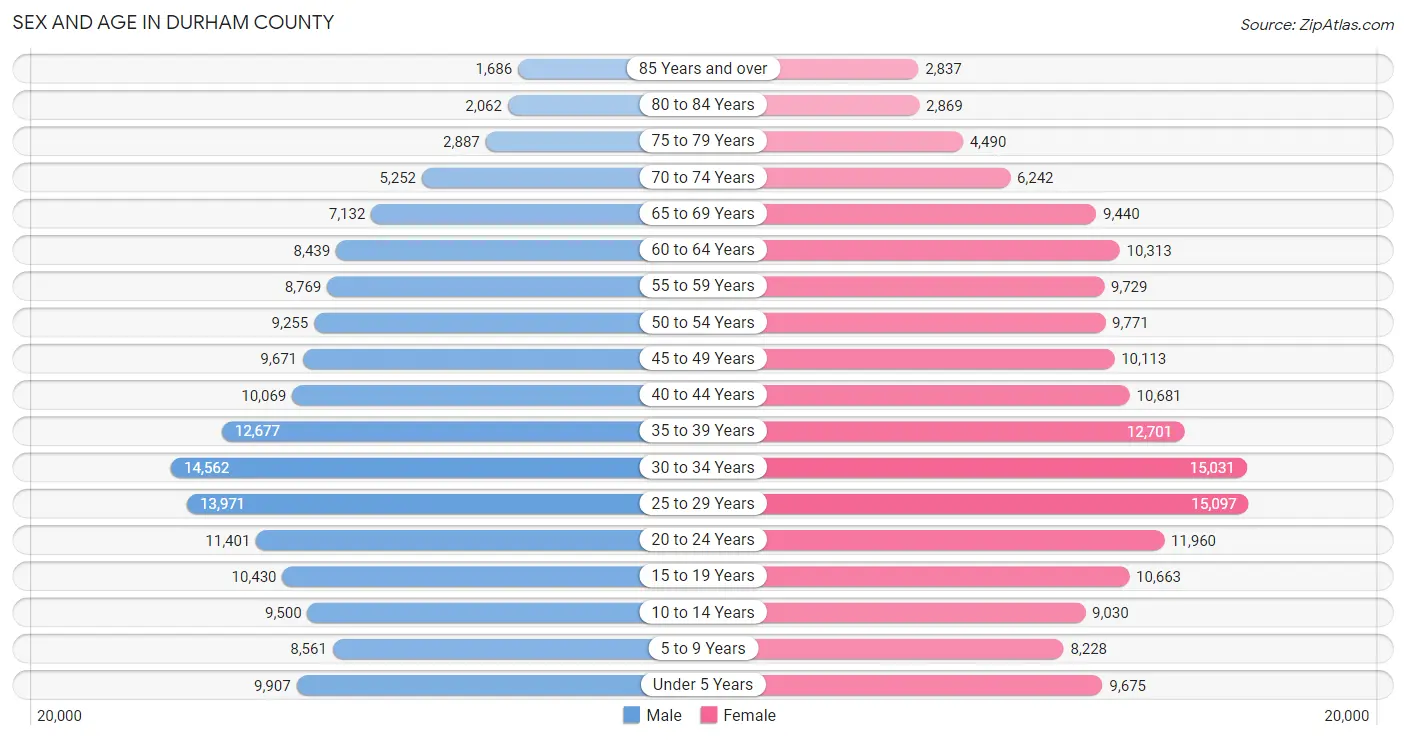
Sex and Age in Durham County
Sex and Age in Durham County
The most populous age groups in Durham County are 30 to 34 Years (14,562 | 9.3%) for men and 25 to 29 Years (15,097 | 8.9%) for women.
| Age Bracket | Male | Female |
| Under 5 Years | 9,907 (6.3%) | 9,675 (5.7%) |
| 5 to 9 Years | 8,561 (5.5%) | 8,228 (4.9%) |
| 10 to 14 Years | 9,500 (6.1%) | 9,030 (5.3%) |
| 15 to 19 Years | 10,430 (6.7%) | 10,663 (6.3%) |
| 20 to 24 Years | 11,401 (7.3%) | 11,960 (7.1%) |
| 25 to 29 Years | 13,971 (8.9%) | 15,097 (8.9%) |
| 30 to 34 Years | 14,562 (9.3%) | 15,031 (8.9%) |
| 35 to 39 Years | 12,677 (8.1%) | 12,701 (7.5%) |
| 40 to 44 Years | 10,069 (6.4%) | 10,681 (6.3%) |
| 45 to 49 Years | 9,671 (6.2%) | 10,113 (6.0%) |
| 50 to 54 Years | 9,255 (5.9%) | 9,771 (5.8%) |
| 55 to 59 Years | 8,769 (5.6%) | 9,729 (5.8%) |
| 60 to 64 Years | 8,439 (5.4%) | 10,313 (6.1%) |
| 65 to 69 Years | 7,132 (4.6%) | 9,440 (5.6%) |
| 70 to 74 Years | 5,252 (3.4%) | 6,242 (3.7%) |
| 75 to 79 Years | 2,887 (1.8%) | 4,490 (2.7%) |
| 80 to 84 Years | 2,062 (1.3%) | 2,869 (1.7%) |
| 85 Years and over | 1,686 (1.1%) | 2,837 (1.7%) |
| Total | 156,231 (100.0%) | 168,870 (100.0%) |
Families and Households in Durham County
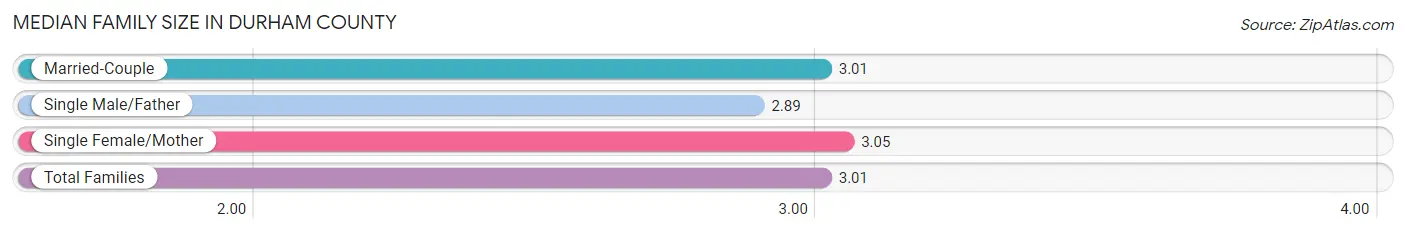
Median Family Size in Durham County
The median family size in Durham County is 3.01 persons per family, with single female/mother families (17,853 | 23.5%) accounting for the largest median family size of 3.05 persons per family. On the other hand, single male/father families (5,823 | 7.7%) represent the smallest median family size with 2.89 persons per family.
| Family Type | # Families | Family Size |
| Married-Couple | 52,157 (68.8%) | 3.01 |
| Single Male/Father | 5,823 (7.7%) | 2.89 |
| Single Female/Mother | 17,853 (23.5%) | 3.05 |
| Total Families | 75,833 (100.0%) | 3.01 |
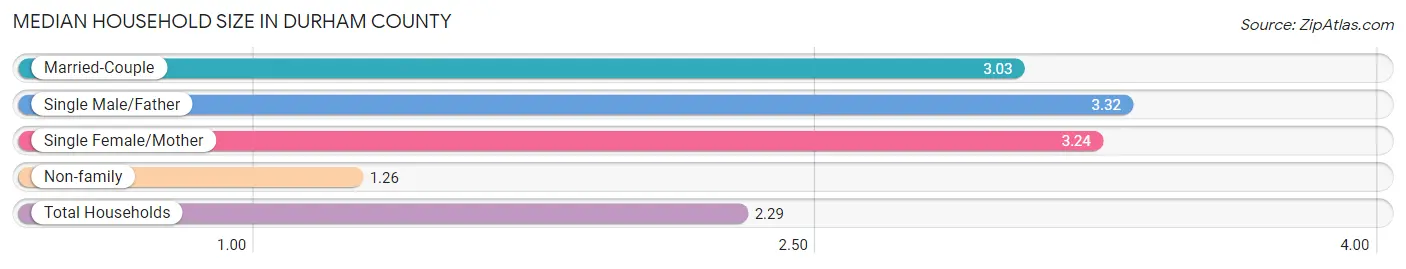
Median Household Size in Durham County
The median household size in Durham County is 2.29 persons per household, with single male/father households (5,823 | 4.3%) accounting for the largest median household size of 3.32 persons per household. non-family households (59,636 | 44.0%) represent the smallest median household size with 1.26 persons per household.
| Household Type | # Households | Household Size |
| Married-Couple | 52,157 (38.5%) | 3.03 |
| Single Male/Father | 5,823 (4.3%) | 3.32 |
| Single Female/Mother | 17,853 (13.2%) | 3.24 |
| Non-family | 59,636 (44.0%) | 1.26 |
| Total Households | 135,469 (100.0%) | 2.29 |
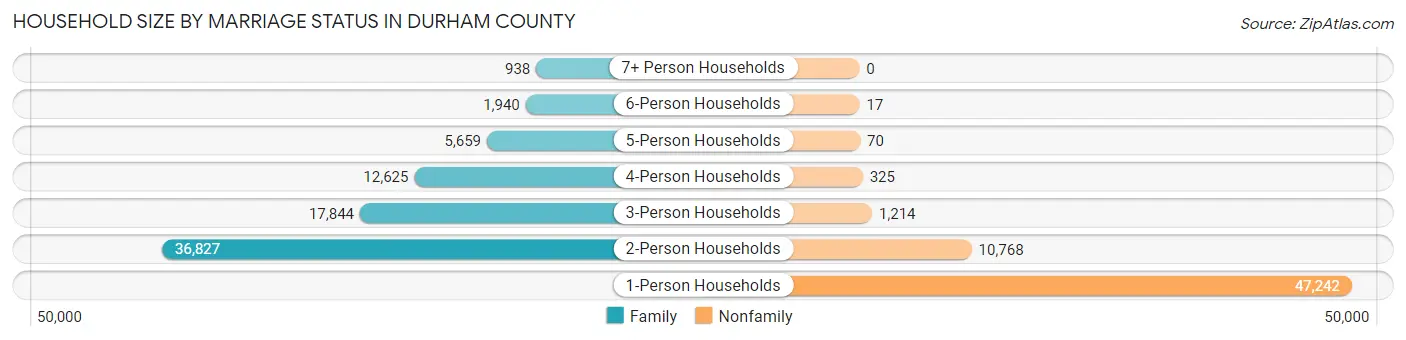
Household Size by Marriage Status in Durham County
Out of a total of 135,469 households in Durham County, 75,833 (56.0%) are family households, while 59,636 (44.0%) are nonfamily households. The most numerous type of family households are 2-person households, comprising 36,827, and the most common type of nonfamily households are 1-person households, comprising 47,242.
| Household Size | Family Households | Nonfamily Households |
| 1-Person Households | - | 47,242 (34.9%) |
| 2-Person Households | 36,827 (27.2%) | 10,768 (8.0%) |
| 3-Person Households | 17,844 (13.2%) | 1,214 (0.9%) |
| 4-Person Households | 12,625 (9.3%) | 325 (0.2%) |
| 5-Person Households | 5,659 (4.2%) | 70 (0.1%) |
| 6-Person Households | 1,940 (1.4%) | 17 (0.0%) |
| 7+ Person Households | 938 (0.7%) | 0 (0.0%) |
| Total | 75,833 (56.0%) | 59,636 (44.0%) |
Female Fertility in Durham County
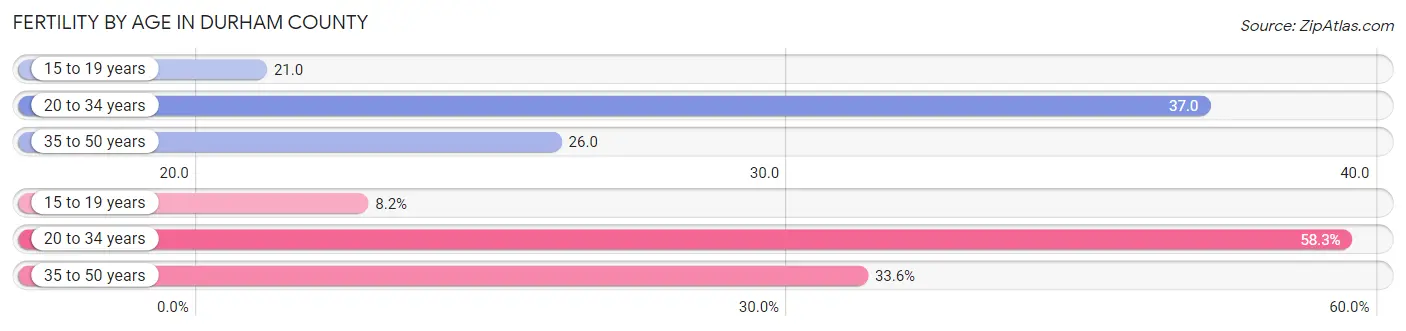
Fertility by Age in Durham County
Average fertility rate in Durham County is 31.0 births per 1,000 women. Women in the age bracket of 20 to 34 years have the highest fertility rate with 37.0 births per 1,000 women. Women in the age bracket of 20 to 34 years acount for 58.3% of all women with births.
| Age Bracket | Women with Births | Births / 1,000 Women |
| 15 to 19 years | 221 (8.2%) | 21.0 |
| 20 to 34 years | 1,578 (58.3%) | 37.0 |
| 35 to 50 years | 910 (33.6%) | 26.0 |
| Total | 2,709 (100.0%) | 31.0 |
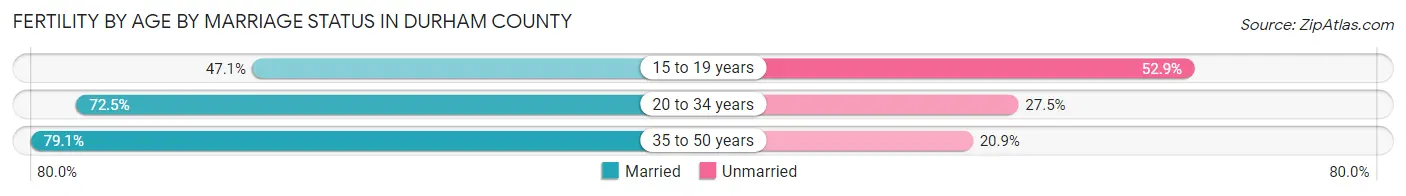
Fertility by Age by Marriage Status in Durham County
72.6% of women with births (2,709) in Durham County are married. The highest percentage of unmarried women with births falls into 15 to 19 years age bracket with 52.9% of them unmarried at the time of birth, while the lowest percentage of unmarried women with births belong to 35 to 50 years age bracket with 20.9% of them unmarried.
| Age Bracket | Married | Unmarried |
| 15 to 19 years | 104 (47.1%) | 117 (52.9%) |
| 20 to 34 years | 1,144 (72.5%) | 434 (27.5%) |
| 35 to 50 years | 720 (79.1%) | 190 (20.9%) |
| Total | 1,967 (72.6%) | 742 (27.4%) |
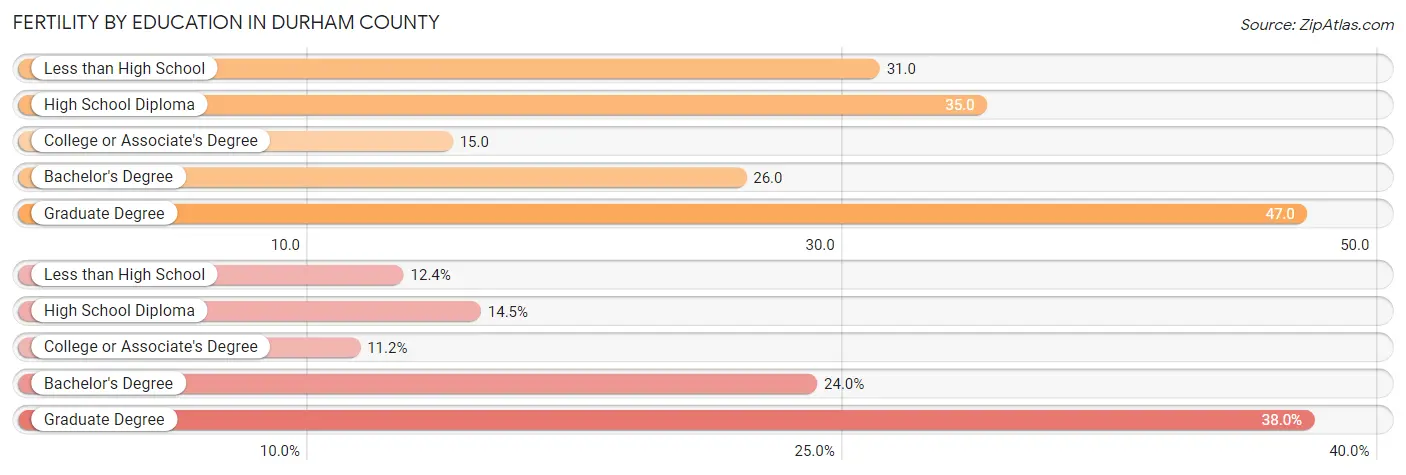
Fertility by Education in Durham County
Average fertility rate in Durham County is 31.0 births per 1,000 women. Women with the education attainment of graduate degree have the highest fertility rate of 47.0 births per 1,000 women, while women with the education attainment of college or associate's degree have the lowest fertility at 15.0 births per 1,000 women. Women with the education attainment of graduate degree represent 38.0% of all women with births.
| Educational Attainment | Women with Births | Births / 1,000 Women |
| Less than High School | 335 (12.4%) | 31.0 |
| High School Diploma | 394 (14.5%) | 35.0 |
| College or Associate's Degree | 302 (11.2%) | 15.0 |
| Bachelor's Degree | 650 (24.0%) | 26.0 |
| Graduate Degree | 1,028 (38.0%) | 47.0 |
| Total | 2,709 (100.0%) | 31.0 |
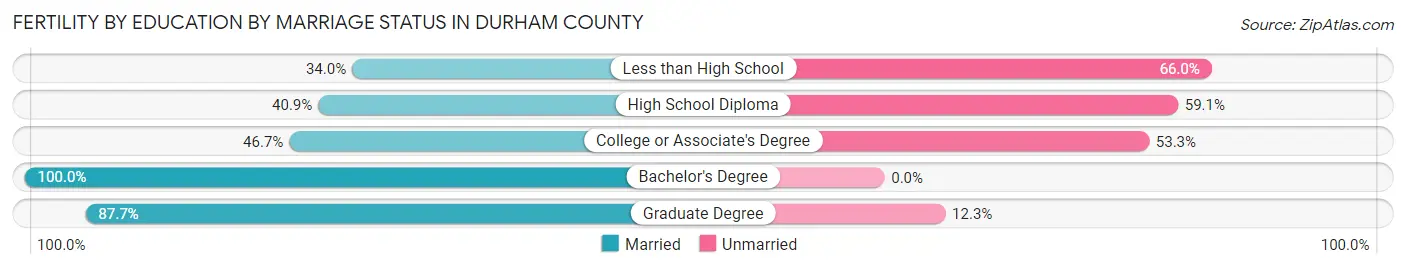
Fertility by Education by Marriage Status in Durham County
27.4% of women with births in Durham County are unmarried. Women with the educational attainment of bachelor's degree are most likely to be married with 100.0% of them married at childbirth, while women with the educational attainment of less than high school are least likely to be married with 66.0% of them unmarried at childbirth.
| Educational Attainment | Married | Unmarried |
| Less than High School | 114 (34.0%) | 221 (66.0%) |
| High School Diploma | 161 (40.9%) | 233 (59.1%) |
| College or Associate's Degree | 141 (46.7%) | 161 (53.3%) |
| Bachelor's Degree | 650 (100.0%) | 0 (0.0%) |
| Graduate Degree | 902 (87.7%) | 126 (12.3%) |
| Total | 1,967 (72.6%) | 742 (27.4%) |
Income in Durham County
Income Overview in Durham County
Per Capita Income in Durham County is $43,945, while median incomes of families and households are $95,715 and $74,927 respectively.
| Characteristic | Number | Measure |
| Per Capita Income | 325,101 | $43,945 |
| Median Family Income | 75,833 | $95,715 |
| Mean Family Income | 75,833 | $126,852 |
| Median Household Income | 135,469 | $74,927 |
| Mean Household Income | 135,469 | $103,151 |
| Income Deficit | 75,833 | $10,661 |
| Wage / Income Gap (%) | 325,101 | 9.99% |
| Wage / Income Gap ($) | 325,101 | 90.01¢ per $1 |
| Gini / Inequality Index | 325,101 | 0.46 |
Earnings by Sex in Durham County
Average Earnings in Durham County are $44,901, $46,790 for men and $42,117 for women, a difference of 10.0%.

| Sex | Number | Average Earnings |
| Male | 92,699 (49.1%) | $46,790 |
| Female | 96,077 (50.9%) | $42,117 |
| Total | 188,776 (100.0%) | $44,901 |
Earnings by Sex by Income Bracket in Durham County
The most common earnings brackets in Durham County are $100,000+ for men (19,389 | 20.9%) and $100,000+ for women (12,419 | 12.9%).
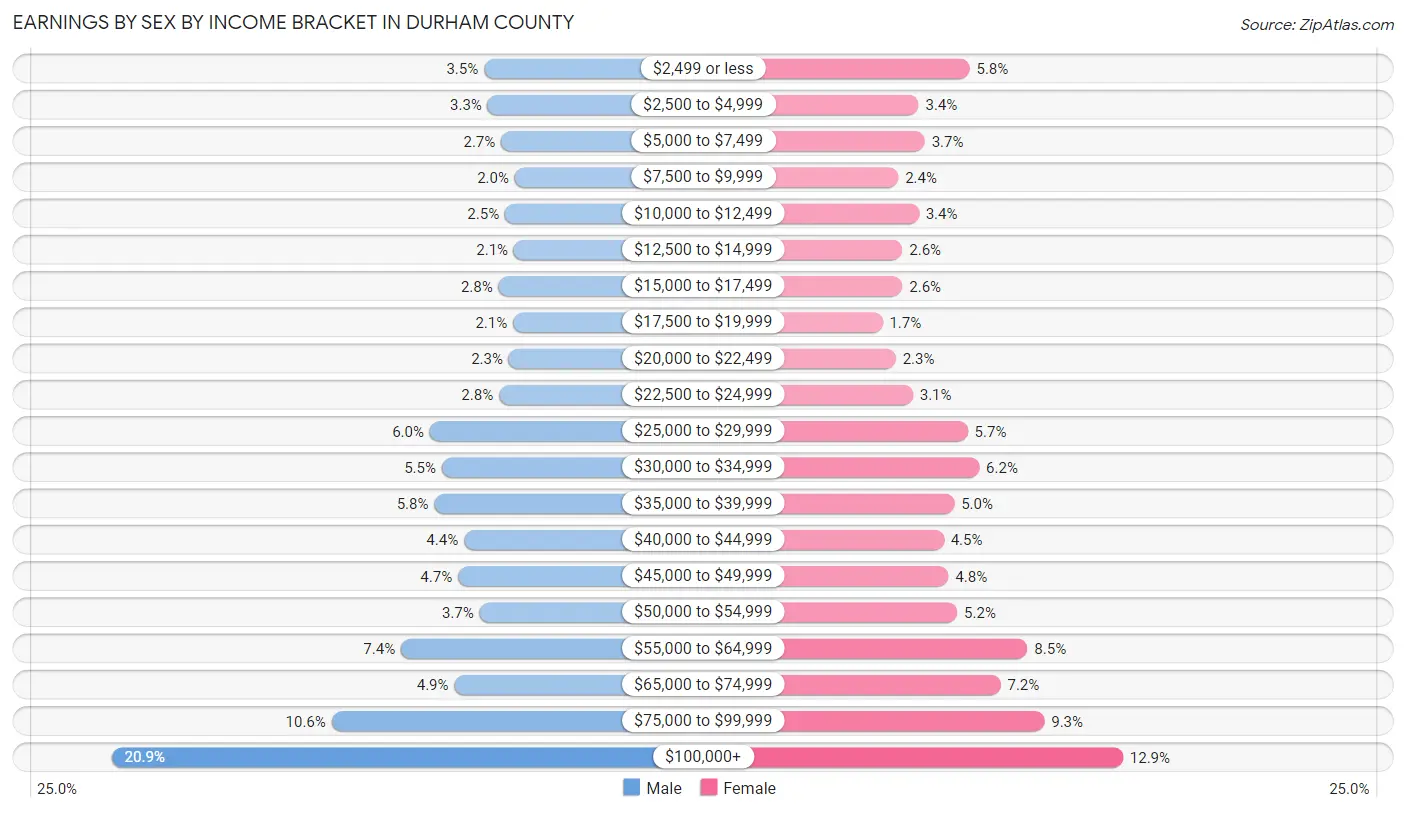
| Income | Male | Female |
| $2,499 or less | 3,229 (3.5%) | 5,524 (5.8%) |
| $2,500 to $4,999 | 3,071 (3.3%) | 3,232 (3.4%) |
| $5,000 to $7,499 | 2,484 (2.7%) | 3,508 (3.6%) |
| $7,500 to $9,999 | 1,891 (2.0%) | 2,314 (2.4%) |
| $10,000 to $12,499 | 2,317 (2.5%) | 3,240 (3.4%) |
| $12,500 to $14,999 | 1,926 (2.1%) | 2,498 (2.6%) |
| $15,000 to $17,499 | 2,600 (2.8%) | 2,498 (2.6%) |
| $17,500 to $19,999 | 1,964 (2.1%) | 1,604 (1.7%) |
| $20,000 to $22,499 | 2,147 (2.3%) | 2,202 (2.3%) |
| $22,500 to $24,999 | 2,580 (2.8%) | 2,965 (3.1%) |
| $25,000 to $29,999 | 5,581 (6.0%) | 5,441 (5.7%) |
| $30,000 to $34,999 | 5,062 (5.5%) | 5,952 (6.2%) |
| $35,000 to $39,999 | 5,386 (5.8%) | 4,834 (5.0%) |
| $40,000 to $44,999 | 4,100 (4.4%) | 4,364 (4.5%) |
| $45,000 to $49,999 | 4,360 (4.7%) | 4,571 (4.8%) |
| $50,000 to $54,999 | 3,423 (3.7%) | 4,969 (5.2%) |
| $55,000 to $64,999 | 6,828 (7.4%) | 8,132 (8.5%) |
| $65,000 to $74,999 | 4,519 (4.9%) | 6,921 (7.2%) |
| $75,000 to $99,999 | 9,842 (10.6%) | 8,889 (9.2%) |
| $100,000+ | 19,389 (20.9%) | 12,419 (12.9%) |
| Total | 92,699 (100.0%) | 96,077 (100.0%) |
Earnings by Sex by Educational Attainment in Durham County
Average earnings in Durham County are $53,896 for men and $48,608 for women, a difference of 9.8%. Men with an educational attainment of graduate degree enjoy the highest average annual earnings of $88,537, while those with less than high school education earn the least with $30,430. Women with an educational attainment of graduate degree earn the most with the average annual earnings of $69,261, while those with less than high school education have the smallest earnings of $21,844.
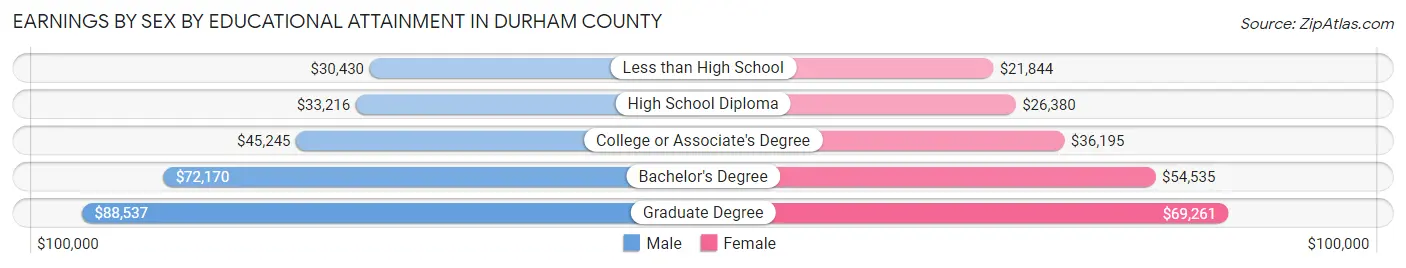
| Educational Attainment | Male Income | Female Income |
| Less than High School | $30,430 | $21,844 |
| High School Diploma | $33,216 | $26,380 |
| College or Associate's Degree | $45,245 | $36,195 |
| Bachelor's Degree | $72,170 | $54,535 |
| Graduate Degree | $88,537 | $69,261 |
| Total | $53,896 | $48,608 |
Family Income in Durham County
Family Income Brackets in Durham County
According to the Durham County family income data, there are 14,863 families falling into the $100,000 to $149,999 income range, which is the most common income bracket and makes up 19.6% of all families. Conversely, the $10,000 to $14,999 income bracket is the least frequent group with only 1,365 families (1.8%) belonging to this category.
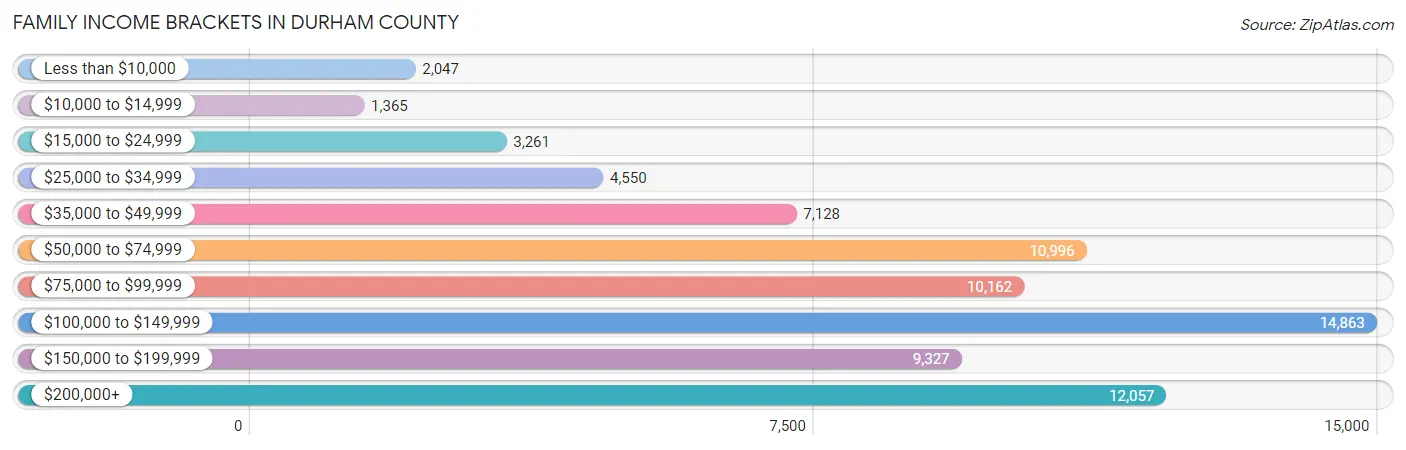
| Income Bracket | # Families | % Families |
| Less than $10,000 | 2,047 | 2.7% |
| $10,000 to $14,999 | 1,365 | 1.8% |
| $15,000 to $24,999 | 3,261 | 4.3% |
| $25,000 to $34,999 | 4,550 | 6.0% |
| $35,000 to $49,999 | 7,128 | 9.4% |
| $50,000 to $74,999 | 10,996 | 14.5% |
| $75,000 to $99,999 | 10,162 | 13.4% |
| $100,000 to $149,999 | 14,863 | 19.6% |
| $150,000 to $199,999 | 9,327 | 12.3% |
| $200,000+ | 12,057 | 15.9% |
Family Income by Famaliy Size in Durham County
4-person families (11,982 | 15.8%) account for the highest median family income in Durham County with $120,758 per family, while 2-person families (39,531 | 52.1%) have the highest median income of $45,452 per family member.
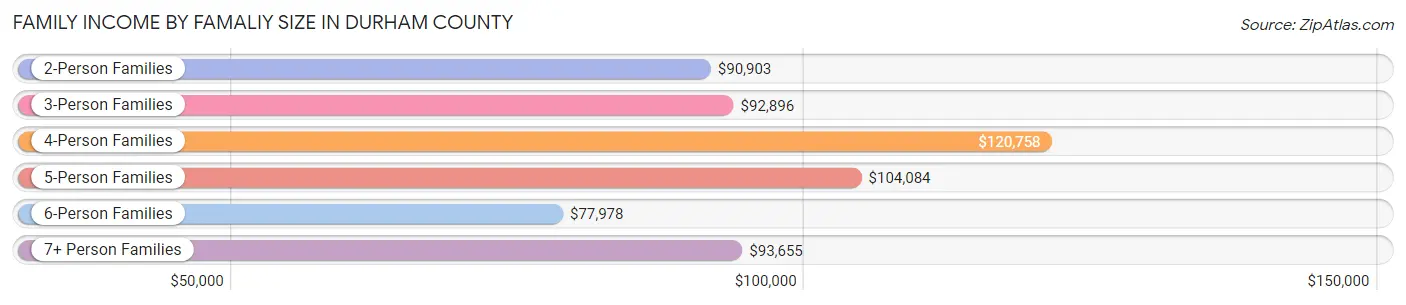
| Income Bracket | # Families | Median Income |
| 2-Person Families | 39,531 (52.1%) | $90,903 |
| 3-Person Families | 16,846 (22.2%) | $92,896 |
| 4-Person Families | 11,982 (15.8%) | $120,758 |
| 5-Person Families | 5,161 (6.8%) | $104,084 |
| 6-Person Families | 1,610 (2.1%) | $77,978 |
| 7+ Person Families | 703 (0.9%) | $93,655 |
| Total | 75,833 (100.0%) | $95,715 |
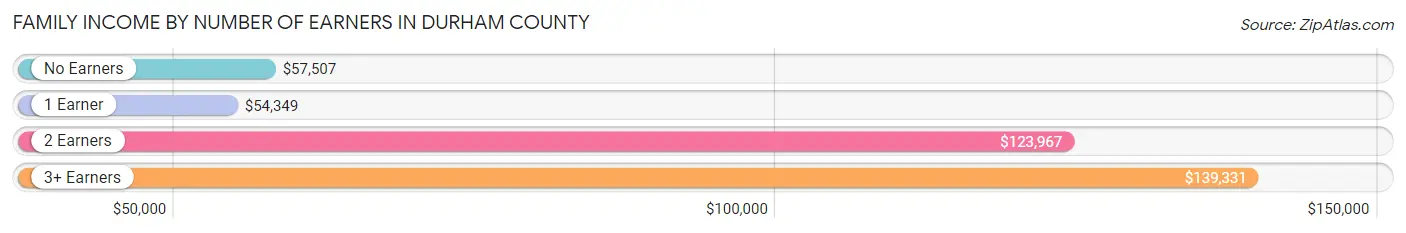
Family Income by Number of Earners in Durham County
The median family income in Durham County is $95,715, with families comprising 3+ earners (6,228) having the highest median family income of $139,331, while families with 1 earner (24,881) have the lowest median family income of $54,349, accounting for 8.2% and 32.8% of families, respectively.
| Number of Earners | # Families | Median Income |
| No Earners | 8,863 (11.7%) | $57,507 |
| 1 Earner | 24,881 (32.8%) | $54,349 |
| 2 Earners | 35,861 (47.3%) | $123,967 |
| 3+ Earners | 6,228 (8.2%) | $139,331 |
| Total | 75,833 (100.0%) | $95,715 |
Household Income in Durham County
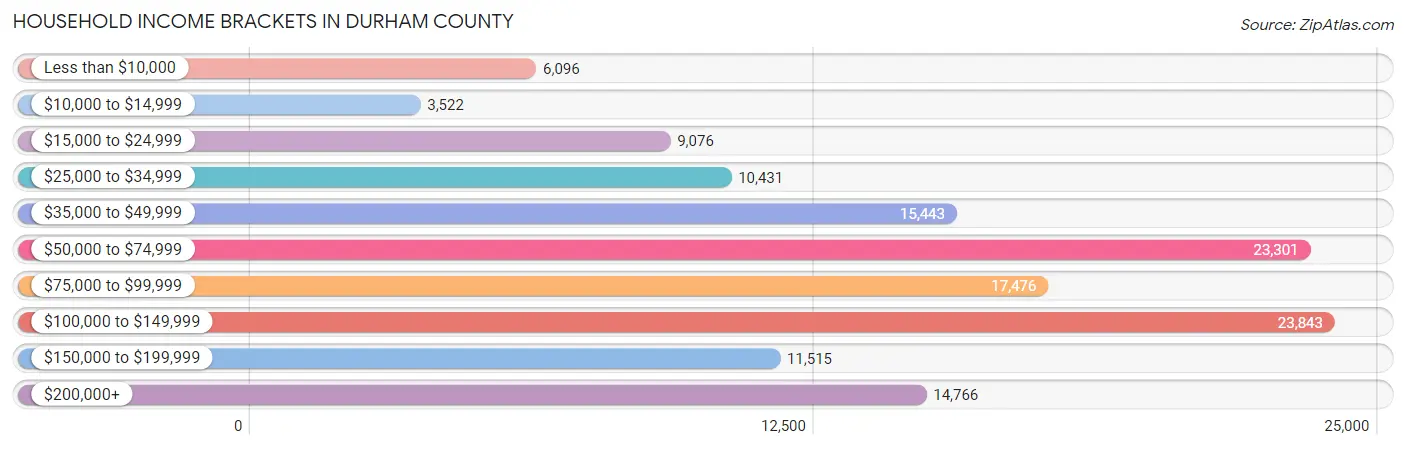
Household Income Brackets in Durham County
With 23,843 households falling in the category, the $100,000 to $149,999 income range is the most frequent in Durham County, accounting for 17.6% of all households. In contrast, only 3,522 households (2.6%) fall into the $10,000 to $14,999 income bracket, making it the least populous group.
| Income Bracket | # Households | % Households |
| Less than $10,000 | 6,096 | 4.5% |
| $10,000 to $14,999 | 3,522 | 2.6% |
| $15,000 to $24,999 | 9,076 | 6.7% |
| $25,000 to $34,999 | 10,431 | 7.7% |
| $35,000 to $49,999 | 15,443 | 11.4% |
| $50,000 to $74,999 | 23,301 | 17.2% |
| $75,000 to $99,999 | 17,476 | 12.9% |
| $100,000 to $149,999 | 23,843 | 17.6% |
| $150,000 to $199,999 | 11,515 | 8.5% |
| $200,000+ | 14,766 | 10.9% |
Household Income by Householder Age in Durham County
The median household income in Durham County is $74,927, with the highest median household income of $87,237 found in the 45 to 64 years age bracket for the primary householder. A total of 44,651 households (33.0%) fall into this category. Meanwhile, the 15 to 24 years age bracket for the primary householder has the lowest median household income of $37,757, with 6,701 households (5.0%) in this group.

| Income Bracket | # Households | Median Income |
| 15 to 24 Years | 6,701 (5.0%) | $37,757 |
| 25 to 44 Years | 55,658 (41.1%) | $80,591 |
| 45 to 64 Years | 44,651 (33.0%) | $87,237 |
| 65+ Years | 28,459 (21.0%) | $57,648 |
| Total | 135,469 (100.0%) | $74,927 |
Poverty in Durham County
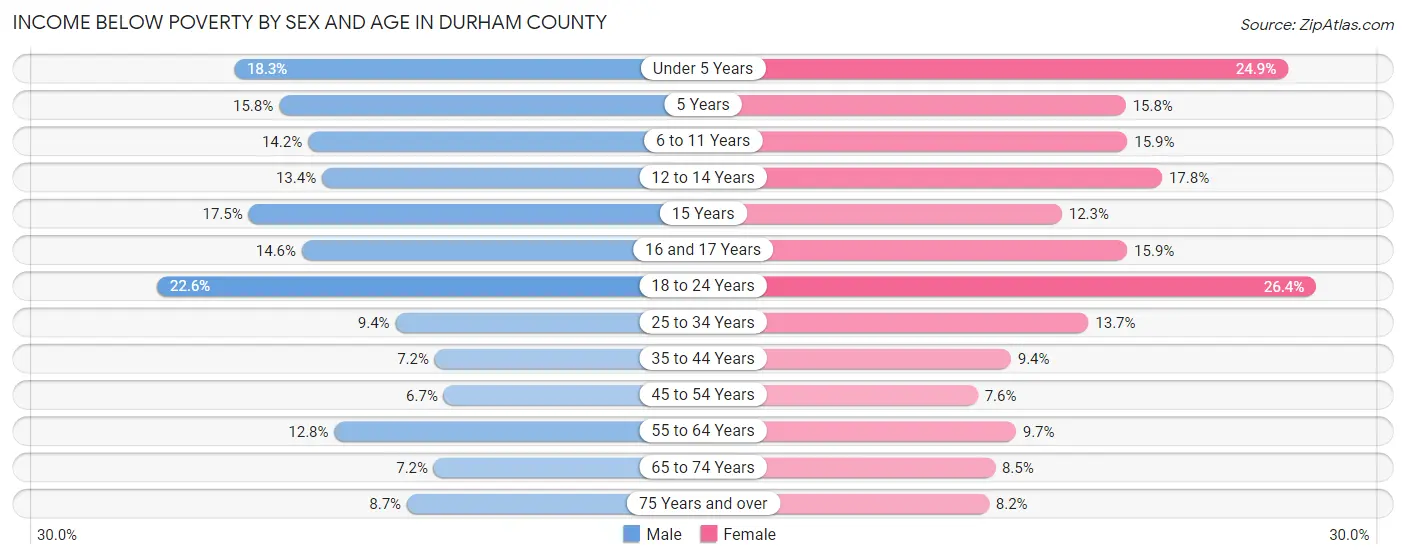
Income Below Poverty by Sex and Age in Durham County
With 11.4% poverty level for males and 13.1% for females among the residents of Durham County, 18 to 24 year old males and 18 to 24 year old females are the most vulnerable to poverty, with 2,885 males (22.6%) and 3,570 females (26.4%) in their respective age groups living below the poverty level.
| Age Bracket | Male | Female |
| Under 5 Years | 1,790 (18.3%) | 2,372 (24.8%) |
| 5 Years | 215 (15.8%) | 260 (15.8%) |
| 6 to 11 Years | 1,438 (14.2%) | 1,645 (15.9%) |
| 12 to 14 Years | 864 (13.4%) | 844 (17.8%) |
| 15 Years | 355 (17.5%) | 224 (12.2%) |
| 16 and 17 Years | 455 (14.6%) | 510 (15.9%) |
| 18 to 24 Years | 2,885 (22.6%) | 3,570 (26.4%) |
| 25 to 34 Years | 2,598 (9.3%) | 4,133 (13.7%) |
| 35 to 44 Years | 1,548 (7.2%) | 2,198 (9.4%) |
| 45 to 54 Years | 1,206 (6.7%) | 1,505 (7.6%) |
| 55 to 64 Years | 2,117 (12.8%) | 1,929 (9.7%) |
| 65 to 74 Years | 858 (7.2%) | 1,329 (8.5%) |
| 75 Years and over | 553 (8.7%) | 801 (8.2%) |
| Total | 16,882 (11.4%) | 21,320 (13.1%) |
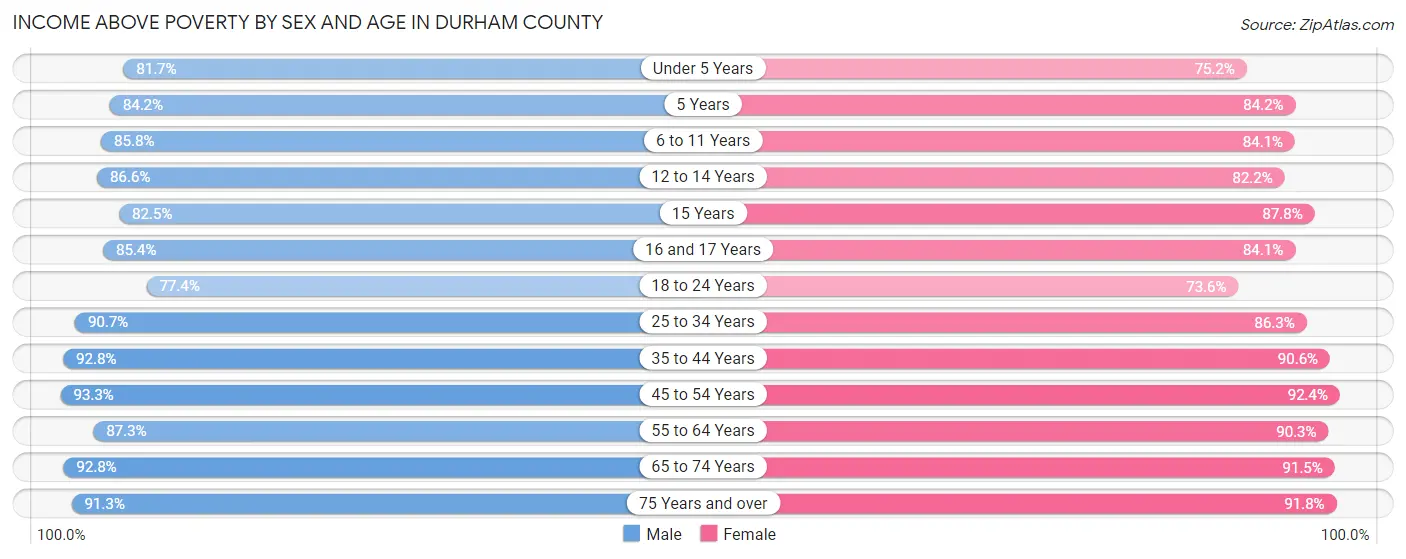
Income Above Poverty by Sex and Age in Durham County
According to the poverty statistics in Durham County, males aged 45 to 54 years and females aged 45 to 54 years are the age groups that are most secure financially, with 93.3% of males and 92.4% of females in these age groups living above the poverty line.
| Age Bracket | Male | Female |
| Under 5 Years | 7,971 (81.7%) | 7,174 (75.1%) |
| 5 Years | 1,143 (84.2%) | 1,385 (84.2%) |
| 6 to 11 Years | 8,675 (85.8%) | 8,702 (84.1%) |
| 12 to 14 Years | 5,565 (86.6%) | 3,889 (82.2%) |
| 15 Years | 1,670 (82.5%) | 1,604 (87.7%) |
| 16 and 17 Years | 2,671 (85.4%) | 2,700 (84.1%) |
| 18 to 24 Years | 9,865 (77.4%) | 9,947 (73.6%) |
| 25 to 34 Years | 25,183 (90.6%) | 25,960 (86.3%) |
| 35 to 44 Years | 20,085 (92.8%) | 21,160 (90.6%) |
| 45 to 54 Years | 16,894 (93.3%) | 18,367 (92.4%) |
| 55 to 64 Years | 14,482 (87.3%) | 17,975 (90.3%) |
| 65 to 74 Years | 11,046 (92.8%) | 14,244 (91.5%) |
| 75 Years and over | 5,796 (91.3%) | 8,976 (91.8%) |
| Total | 131,046 (88.6%) | 142,083 (87.0%) |
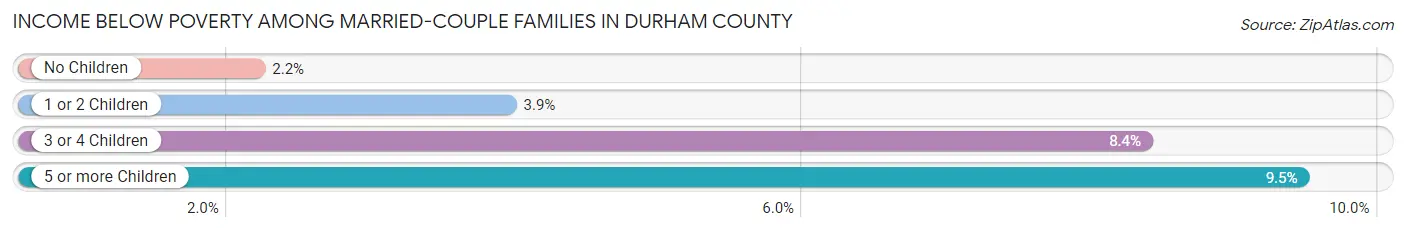
Income Below Poverty Among Married-Couple Families in Durham County
The poverty statistics for married-couple families in Durham County show that 3.2% or 1,678 of the total 52,157 families live below the poverty line. Families with 5 or more children have the highest poverty rate of 9.5%, comprising of 28 families. On the other hand, families with no children have the lowest poverty rate of 2.2%, which includes 700 families.
| Children | Above Poverty | Below Poverty |
| No Children | 31,288 (97.8%) | 700 (2.2%) |
| 1 or 2 Children | 15,452 (96.1%) | 633 (3.9%) |
| 3 or 4 Children | 3,471 (91.6%) | 317 (8.4%) |
| 5 or more Children | 268 (90.5%) | 28 (9.5%) |
| Total | 50,479 (96.8%) | 1,678 (3.2%) |
Income Below Poverty Among Single-Parent Households in Durham County
According to the poverty data in Durham County, 15.9% or 927 single-father households and 19.5% or 3,482 single-mother households are living below the poverty line. Among single-father households, those with 3 or 4 children have the highest poverty rate, with 89 households (33.2%) experiencing poverty. Likewise, among single-mother households, those with 5 or more children have the highest poverty rate, with 157 households (91.3%) falling below the poverty line.

| Children | Single Father | Single Mother |
| No Children | 244 (10.8%) | 519 (7.2%) |
| 1 or 2 Children | 575 (17.8%) | 2,216 (24.0%) |
| 3 or 4 Children | 89 (33.2%) | 590 (45.3%) |
| 5 or more Children | 19 (29.7%) | 157 (91.3%) |
| Total | 927 (15.9%) | 3,482 (19.5%) |
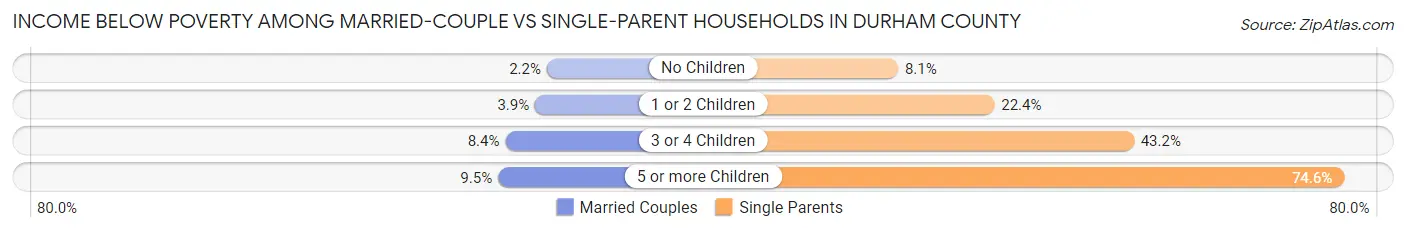
Income Below Poverty Among Married-Couple vs Single-Parent Households in Durham County
The poverty data for Durham County shows that 1,678 of the married-couple family households (3.2%) and 4,409 of the single-parent households (18.6%) are living below the poverty level. Within the married-couple family households, those with 5 or more children have the highest poverty rate, with 28 households (9.5%) falling below the poverty line. Among the single-parent households, those with 5 or more children have the highest poverty rate, with 176 household (74.6%) living below poverty.
| Children | Married-Couple Families | Single-Parent Households |
| No Children | 700 (2.2%) | 763 (8.1%) |
| 1 or 2 Children | 633 (3.9%) | 2,791 (22.4%) |
| 3 or 4 Children | 317 (8.4%) | 679 (43.2%) |
| 5 or more Children | 28 (9.5%) | 176 (74.6%) |
| Total | 1,678 (3.2%) | 4,409 (18.6%) |
Employment Characteristics in Durham County
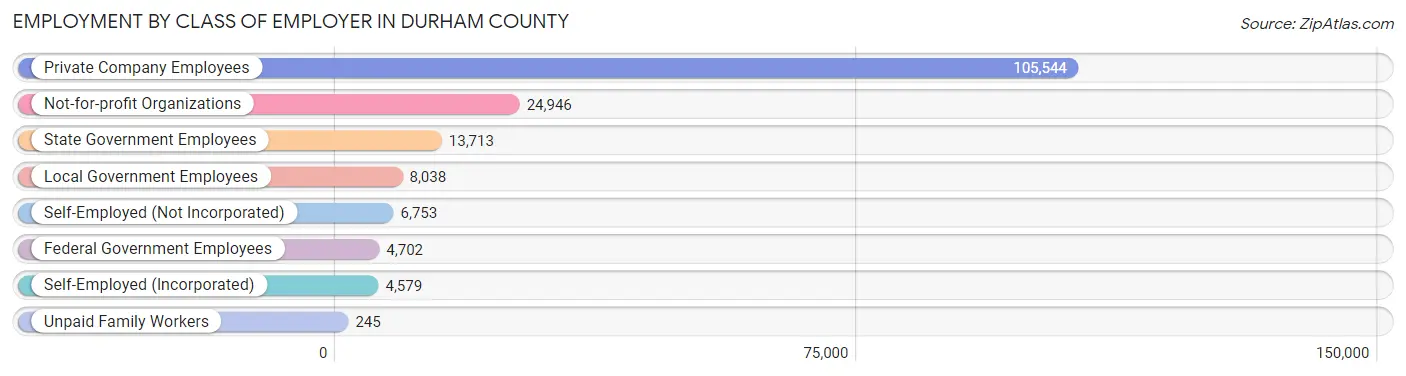
Employment by Class of Employer in Durham County
Among the 168,520 employed individuals in Durham County, private company employees (105,544 | 62.6%), not-for-profit organizations (24,946 | 14.8%), and state government employees (13,713 | 8.1%) make up the most common classes of employment.
| Employer Class | # Employees | % Employees |
| Private Company Employees | 105,544 | 62.6% |
| Self-Employed (Incorporated) | 4,579 | 2.7% |
| Self-Employed (Not Incorporated) | 6,753 | 4.0% |
| Not-for-profit Organizations | 24,946 | 14.8% |
| Local Government Employees | 8,038 | 4.8% |
| State Government Employees | 13,713 | 8.1% |
| Federal Government Employees | 4,702 | 2.8% |
| Unpaid Family Workers | 245 | 0.2% |
| Total | 168,520 | 100.0% |
Employment Status by Age in Durham County
According to the labor force statistics for Durham County, out of the total population over 16 years of age (266,342), 67.5% or 179,781 individuals are in the labor force, with 4.3% or 7,731 of them unemployed. The age group with the highest labor force participation rate is 30 to 34 years, with 87.5% or 25,894 individuals in the labor force. Within the labor force, the 16 to 19 years age range has the highest percentage of unemployed individuals, with 15.6% or 965 of them being unemployed.

| Age Bracket | In Labor Force | Unemployed |
| 16 to 19 Years | 6,187 (35.9%) | 965 (15.6%) |
| 20 to 24 Years | 15,722 (67.3%) | 818 (5.2%) |
| 25 to 29 Years | 24,359 (83.8%) | 999 (4.1%) |
| 30 to 34 Years | 25,894 (87.5%) | 492 (1.9%) |
| 35 to 44 Years | 40,316 (87.4%) | 1,451 (3.6%) |
| 45 to 54 Years | 32,329 (83.3%) | 1,584 (4.9%) |
| 55 to 59 Years | 14,262 (77.1%) | 699 (4.9%) |
| 60 to 64 Years | 11,776 (62.8%) | 365 (3.1%) |
| 65 to 74 Years | 7,718 (27.5%) | 286 (3.7%) |
| 75 Years and over | 1,161 (6.9%) | 35 (3.0%) |
| Total | 179,781 (67.5%) | 7,731 (4.3%) |
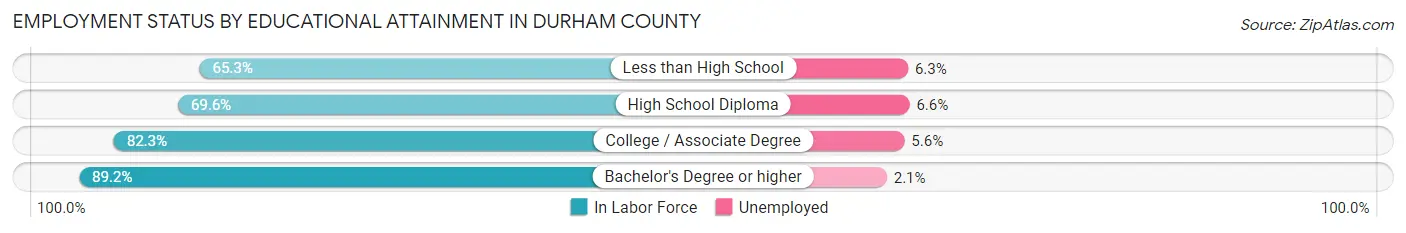
Employment Status by Educational Attainment in Durham County
According to labor force statistics for Durham County, 82.4% of individuals (149,020) out of the total population between 25 and 64 years of age (180,849) are in the labor force, with 3.7% or 5,514 of them being unemployed. The group with the highest labor force participation rate are those with the educational attainment of bachelor's degree or higher, with 89.2% or 86,844 individuals in the labor force. Within the labor force, individuals with high school diploma education have the highest percentage of unemployment, with 6.6% or 1,359 of them being unemployed.
| Educational Attainment | In Labor Force | Unemployed |
| Less than High School | 10,976 (65.3%) | 1,059 (6.3%) |
| High School Diploma | 20,596 (69.6%) | 1,953 (6.6%) |
| College / Associate Degree | 30,525 (82.3%) | 2,077 (5.6%) |
| Bachelor's Degree or higher | 86,844 (89.2%) | 2,045 (2.1%) |
| Total | 149,020 (82.4%) | 6,691 (3.7%) |
Employment Occupations by Sex in Durham County
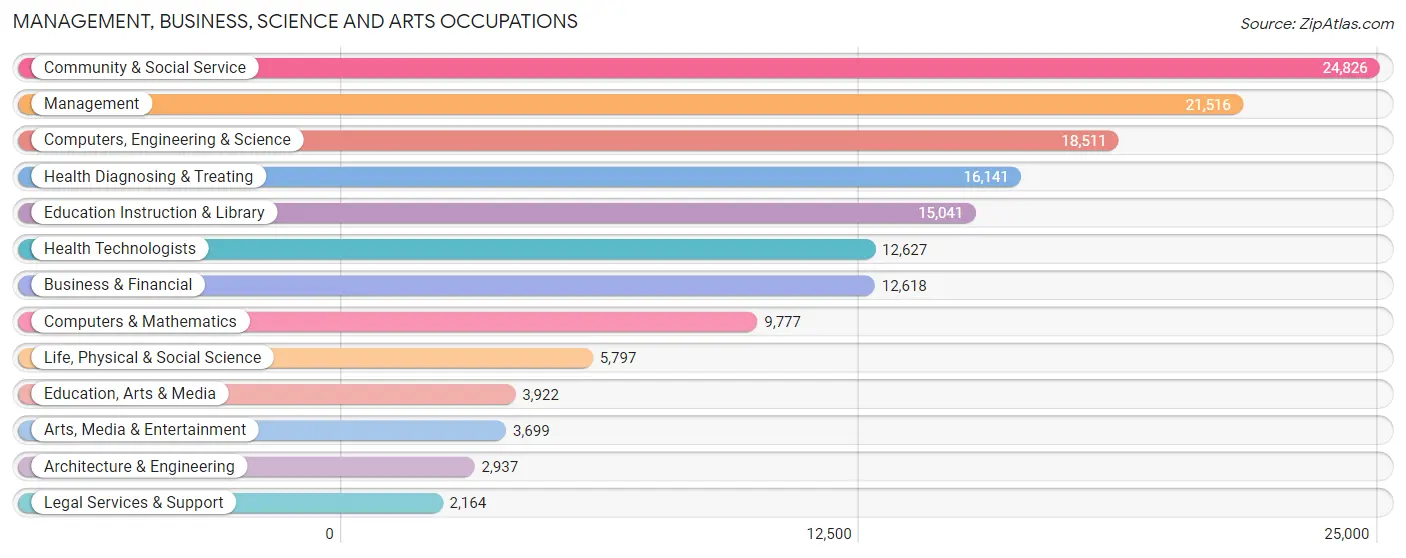
Management, Business, Science and Arts Occupations
The most common Management, Business, Science and Arts occupations in Durham County are Community & Social Service (24,826 | 14.5%), Management (21,516 | 12.5%), Computers, Engineering & Science (18,511 | 10.8%), Health Diagnosing & Treating (16,141 | 9.4%), and Education Instruction & Library (15,041 | 8.8%).
Management, Business, Science and Arts Occupations by Sex
Within the Management, Business, Science and Arts occupations in Durham County, the most male-oriented occupations are Computers & Mathematics (75.8%), Architecture & Engineering (74.4%), and Computers, Engineering & Science (63.1%), while the most female-oriented occupations are Health Diagnosing & Treating (73.6%), Education, Arts & Media (72.7%), and Health Technologists (71.6%).

| Occupation | Male | Female |
| Management | 11,586 (53.8%) | 9,930 (46.2%) |
| Business & Financial | 5,167 (40.9%) | 7,451 (59.1%) |
| Computers, Engineering & Science | 11,687 (63.1%) | 6,824 (36.9%) |
| Computers & Mathematics | 7,407 (75.8%) | 2,370 (24.2%) |
| Architecture & Engineering | 2,185 (74.4%) | 752 (25.6%) |
| Life, Physical & Social Science | 2,095 (36.1%) | 3,702 (63.9%) |
| Community & Social Service | 8,636 (34.8%) | 16,190 (65.2%) |
| Education, Arts & Media | 1,072 (27.3%) | 2,850 (72.7%) |
| Legal Services & Support | 951 (44.0%) | 1,213 (56.0%) |
| Education Instruction & Library | 4,810 (32.0%) | 10,231 (68.0%) |
| Arts, Media & Entertainment | 1,803 (48.7%) | 1,896 (51.3%) |
| Health Diagnosing & Treating | 4,265 (26.4%) | 11,876 (73.6%) |
| Health Technologists | 3,586 (28.4%) | 9,041 (71.6%) |
| Total (Category) | 41,341 (44.2%) | 52,271 (55.8%) |
| Total (Overall) | 83,332 (48.5%) | 88,327 (51.4%) |
Services Occupations
The most common Services occupations in Durham County are Food Preparation & Serving (8,452 | 4.9%), Cleaning & Maintenance (5,956 | 3.5%), Personal Care & Service (4,721 | 2.8%), Healthcare Support (4,375 | 2.5%), and Security & Protection (1,913 | 1.1%).

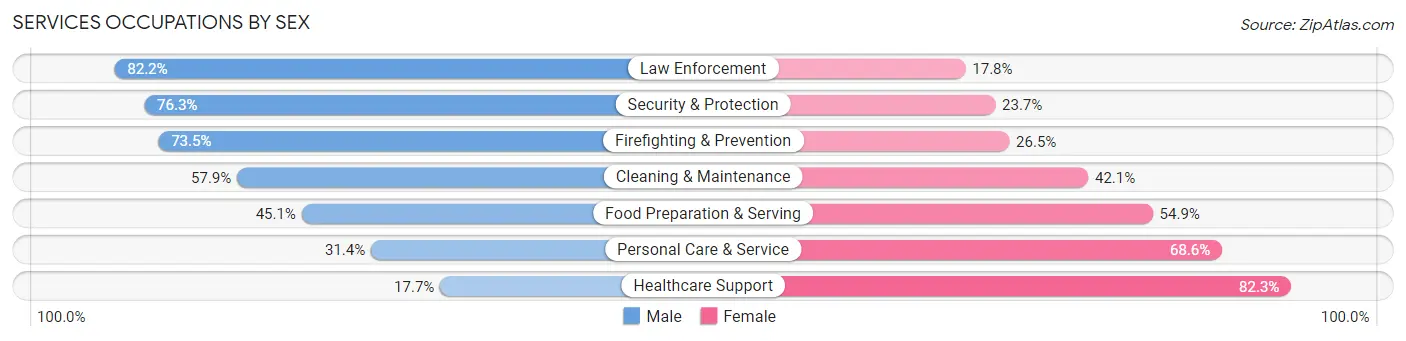
Services Occupations by Sex
Within the Services occupations in Durham County, the most male-oriented occupations are Law Enforcement (82.2%), Security & Protection (76.3%), and Firefighting & Prevention (73.5%), while the most female-oriented occupations are Healthcare Support (82.3%), Personal Care & Service (68.6%), and Food Preparation & Serving (54.9%).
| Occupation | Male | Female |
| Healthcare Support | 775 (17.7%) | 3,600 (82.3%) |
| Security & Protection | 1,460 (76.3%) | 453 (23.7%) |
| Firefighting & Prevention | 956 (73.5%) | 344 (26.5%) |
| Law Enforcement | 504 (82.2%) | 109 (17.8%) |
| Food Preparation & Serving | 3,814 (45.1%) | 4,638 (54.9%) |
| Cleaning & Maintenance | 3,450 (57.9%) | 2,506 (42.1%) |
| Personal Care & Service | 1,482 (31.4%) | 3,239 (68.6%) |
| Total (Category) | 10,981 (43.2%) | 14,436 (56.8%) |
| Total (Overall) | 83,332 (48.5%) | 88,327 (51.4%) |
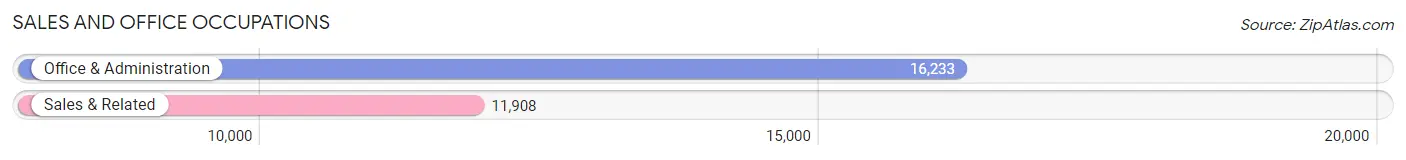
Sales and Office Occupations
The most common Sales and Office occupations in Durham County are Office & Administration (16,233 | 9.5%), and Sales & Related (11,908 | 6.9%).
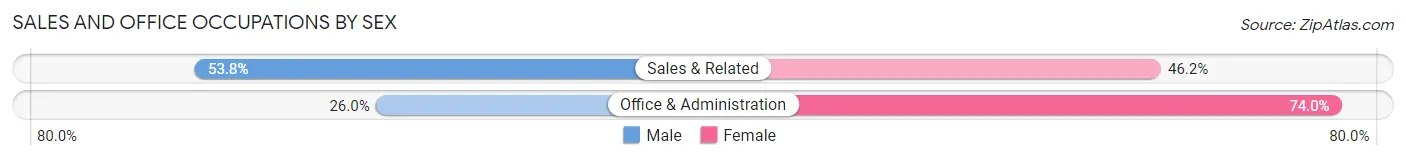
Sales and Office Occupations by Sex
| Occupation | Male | Female |
| Sales & Related | 6,403 (53.8%) | 5,505 (46.2%) |
| Office & Administration | 4,224 (26.0%) | 12,009 (74.0%) |
| Total (Category) | 10,627 (37.8%) | 17,514 (62.2%) |
| Total (Overall) | 83,332 (48.5%) | 88,327 (51.4%) |
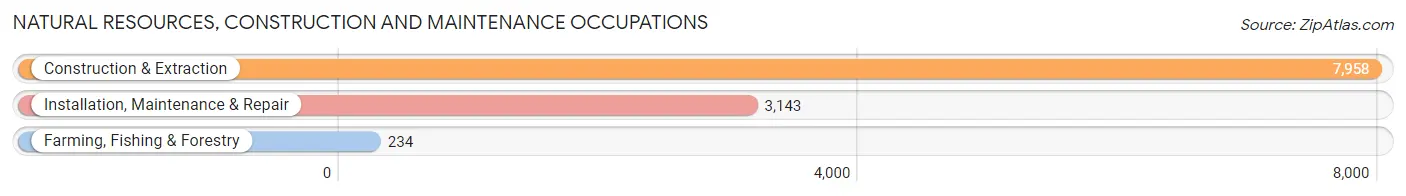
Natural Resources, Construction and Maintenance Occupations
The most common Natural Resources, Construction and Maintenance occupations in Durham County are Construction & Extraction (7,958 | 4.6%), Installation, Maintenance & Repair (3,143 | 1.8%), and Farming, Fishing & Forestry (234 | 0.1%).
Natural Resources, Construction and Maintenance Occupations by Sex
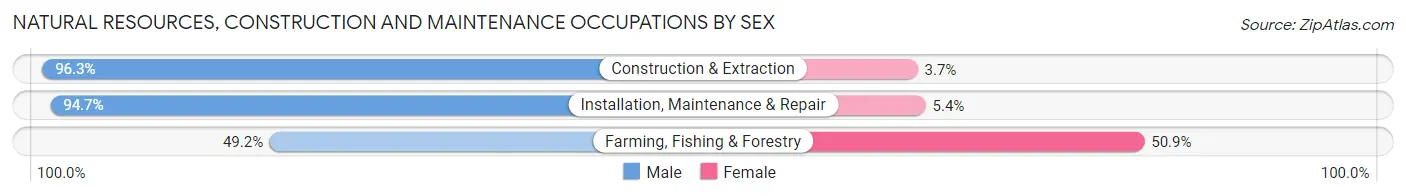
| Occupation | Male | Female |
| Farming, Fishing & Forestry | 115 (49.1%) | 119 (50.8%) |
| Construction & Extraction | 7,666 (96.3%) | 292 (3.7%) |
| Installation, Maintenance & Repair | 2,975 (94.7%) | 168 (5.3%) |
| Total (Category) | 10,756 (94.9%) | 579 (5.1%) |
| Total (Overall) | 83,332 (48.5%) | 88,327 (51.4%) |
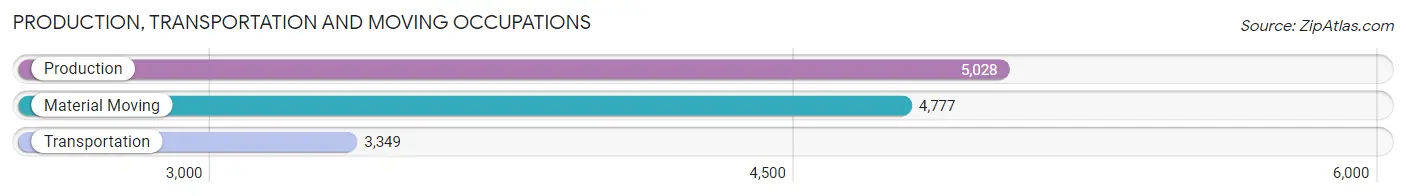
Production, Transportation and Moving Occupations
The most common Production, Transportation and Moving occupations in Durham County are Production (5,028 | 2.9%), Material Moving (4,777 | 2.8%), and Transportation (3,349 | 1.9%).
Production, Transportation and Moving Occupations by Sex
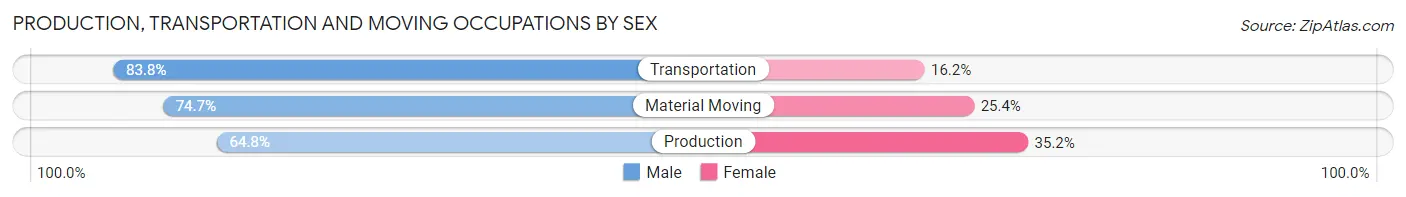
| Occupation | Male | Female |
| Production | 3,256 (64.8%) | 1,772 (35.2%) |
| Transportation | 2,805 (83.8%) | 544 (16.2%) |
| Material Moving | 3,566 (74.7%) | 1,211 (25.4%) |
| Total (Category) | 9,627 (73.2%) | 3,527 (26.8%) |
| Total (Overall) | 83,332 (48.5%) | 88,327 (51.4%) |
Employment Industries by Sex in Durham County
Employment Industries in Durham County
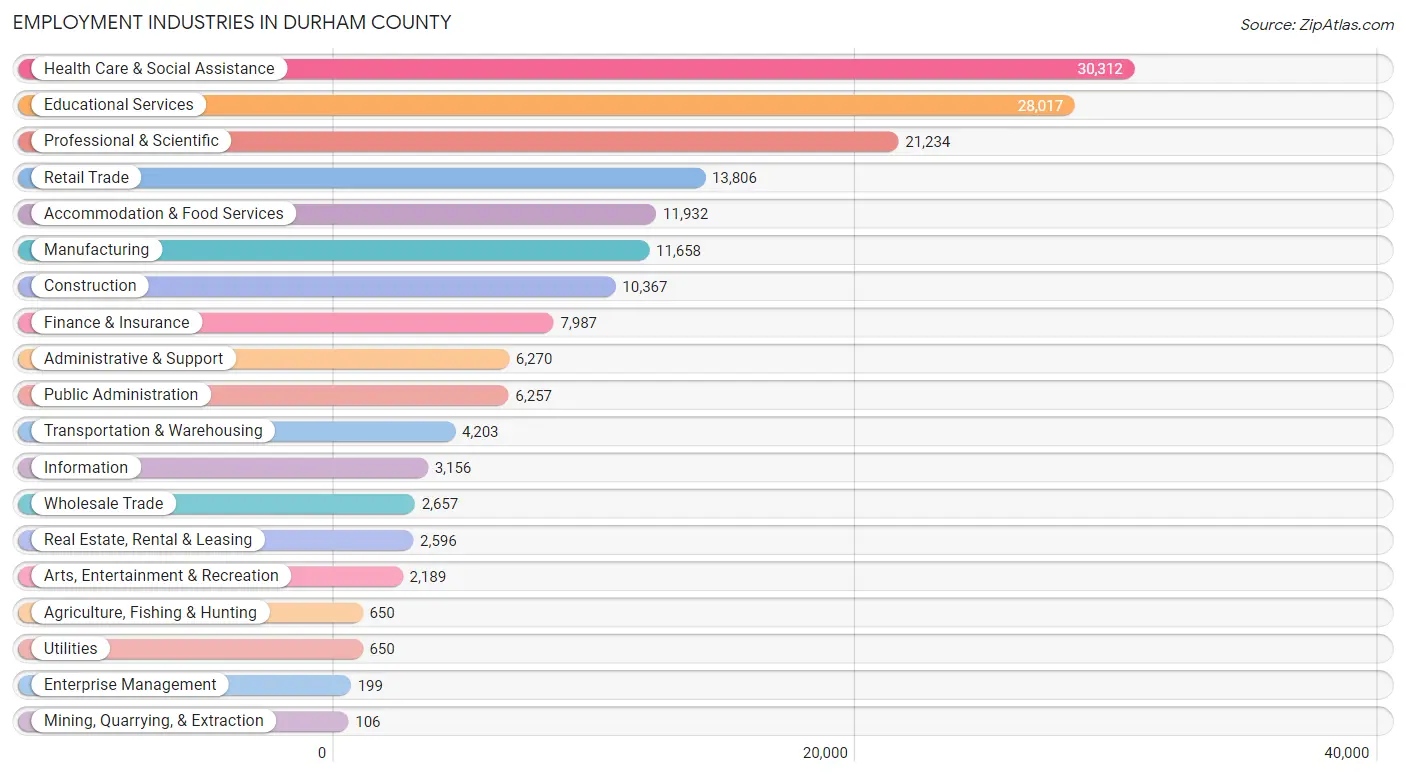
The major employment industries in Durham County include Health Care & Social Assistance (30,312 | 17.7%), Educational Services (28,017 | 16.3%), Professional & Scientific (21,234 | 12.4%), Retail Trade (13,806 | 8.0%), and Accommodation & Food Services (11,932 | 7.0%).
Employment Industries by Sex in Durham County
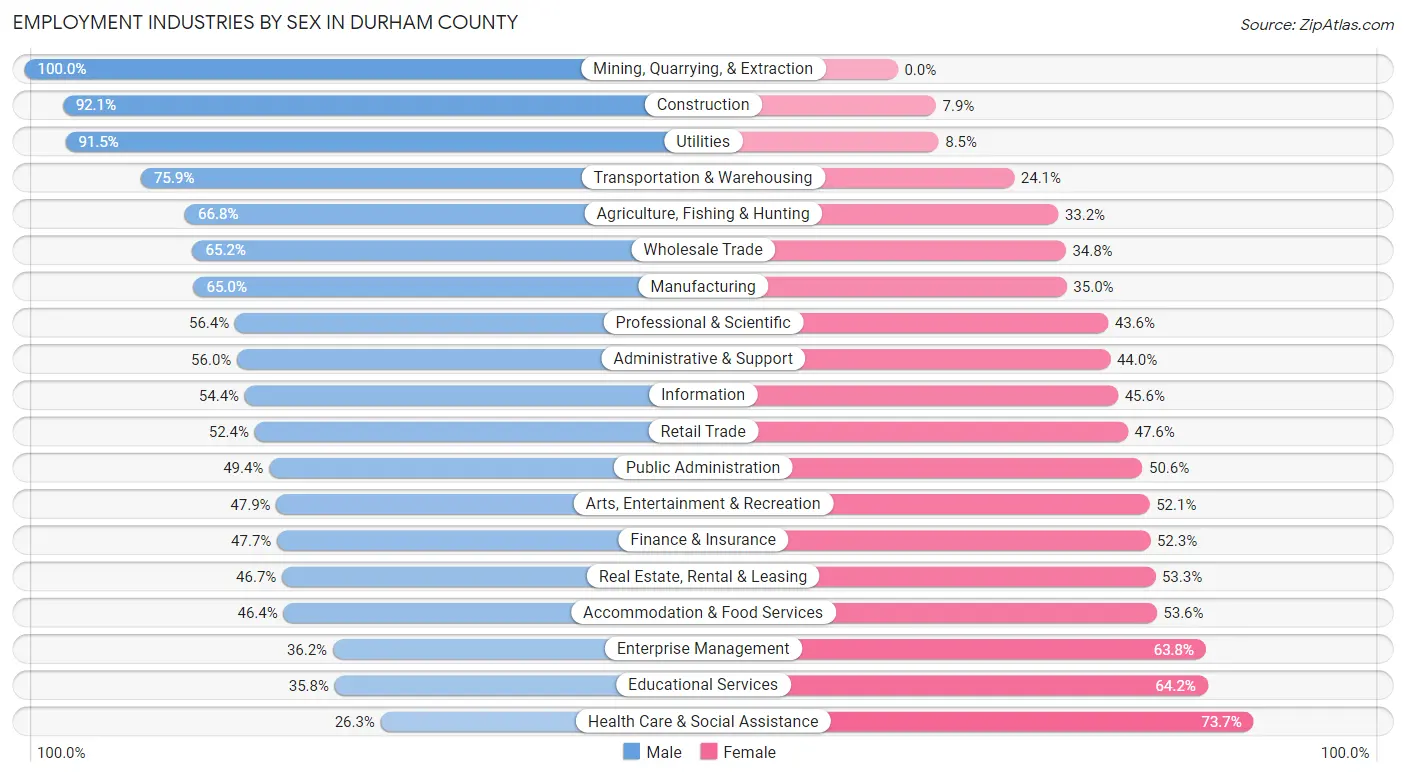
The Durham County industries that see more men than women are Mining, Quarrying, & Extraction (100.0%), Construction (92.1%), and Utilities (91.5%), whereas the industries that tend to have a higher number of women are Health Care & Social Assistance (73.7%), Educational Services (64.2%), and Enterprise Management (63.8%).
| Industry | Male | Female |
| Agriculture, Fishing & Hunting | 434 (66.8%) | 216 (33.2%) |
| Mining, Quarrying, & Extraction | 106 (100.0%) | 0 (0.0%) |
| Construction | 9,548 (92.1%) | 819 (7.9%) |
| Manufacturing | 7,580 (65.0%) | 4,078 (35.0%) |
| Wholesale Trade | 1,733 (65.2%) | 924 (34.8%) |
| Retail Trade | 7,229 (52.4%) | 6,577 (47.6%) |
| Transportation & Warehousing | 3,190 (75.9%) | 1,013 (24.1%) |
| Utilities | 595 (91.5%) | 55 (8.5%) |
| Information | 1,717 (54.4%) | 1,439 (45.6%) |
| Finance & Insurance | 3,811 (47.7%) | 4,176 (52.3%) |
| Real Estate, Rental & Leasing | 1,212 (46.7%) | 1,384 (53.3%) |
| Professional & Scientific | 11,985 (56.4%) | 9,249 (43.6%) |
| Enterprise Management | 72 (36.2%) | 127 (63.8%) |
| Administrative & Support | 3,511 (56.0%) | 2,759 (44.0%) |
| Educational Services | 10,027 (35.8%) | 17,990 (64.2%) |
| Health Care & Social Assistance | 7,969 (26.3%) | 22,343 (73.7%) |
| Arts, Entertainment & Recreation | 1,048 (47.9%) | 1,141 (52.1%) |
| Accommodation & Food Services | 5,537 (46.4%) | 6,395 (53.6%) |
| Public Administration | 3,089 (49.4%) | 3,168 (50.6%) |
| Total | 83,332 (48.5%) | 88,327 (51.4%) |
Education in Durham County
School Enrollment in Durham County
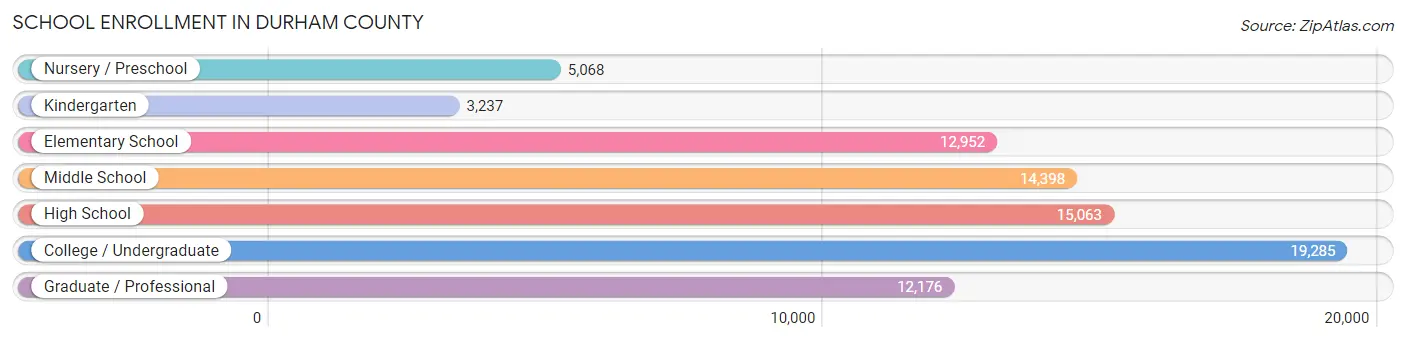
The most common levels of schooling among the 82,179 students in Durham County are college / undergraduate (19,285 | 23.5%), high school (15,063 | 18.3%), and middle school (14,398 | 17.5%).
| School Level | # Students | % Students |
| Nursery / Preschool | 5,068 | 6.2% |
| Kindergarten | 3,237 | 3.9% |
| Elementary School | 12,952 | 15.8% |
| Middle School | 14,398 | 17.5% |
| High School | 15,063 | 18.3% |
| College / Undergraduate | 19,285 | 23.5% |
| Graduate / Professional | 12,176 | 14.8% |
| Total | 82,179 | 100.0% |
School Enrollment by Age by Funding Source in Durham County
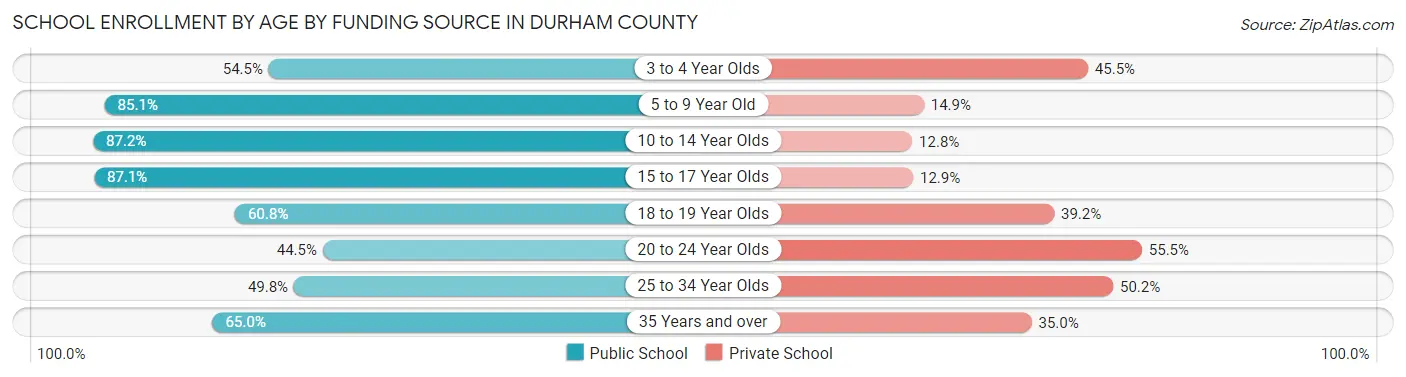
Out of a total of 82,179 students who are enrolled in schools in Durham County, 23,996 (29.2%) attend a private institution, while the remaining 58,183 (70.8%) are enrolled in public schools. The age group of 20 to 24 year olds has the highest likelihood of being enrolled in private schools, with 6,400 (55.5% in the age bracket) enrolled. Conversely, the age group of 10 to 14 year olds has the lowest likelihood of being enrolled in a private school, with 15,802 (87.2% in the age bracket) attending a public institution.
| Age Bracket | Public School | Private School |
| 3 to 4 Year Olds | 2,175 (54.5%) | 1,815 (45.5%) |
| 5 to 9 Year Old | 13,416 (85.1%) | 2,352 (14.9%) |
| 10 to 14 Year Olds | 15,802 (87.2%) | 2,311 (12.8%) |
| 15 to 17 Year Olds | 8,415 (87.1%) | 1,248 (12.9%) |
| 18 to 19 Year Olds | 5,247 (60.8%) | 3,381 (39.2%) |
| 20 to 24 Year Olds | 5,124 (44.5%) | 6,400 (55.5%) |
| 25 to 34 Year Olds | 4,706 (49.8%) | 4,739 (50.2%) |
| 35 Years and over | 3,281 (65.0%) | 1,767 (35.0%) |
| Total | 58,183 (70.8%) | 23,996 (29.2%) |
Educational Attainment by Field of Study in Durham County
Business (16,183 | 12.5%), bio, nature & agricultural (13,968 | 10.7%), social sciences (13,622 | 10.5%), science & technology (12,818 | 9.9%), and education (10,082 | 7.8%) are the most common fields of study among 129,885 individuals in Durham County who have obtained a bachelor's degree or higher.
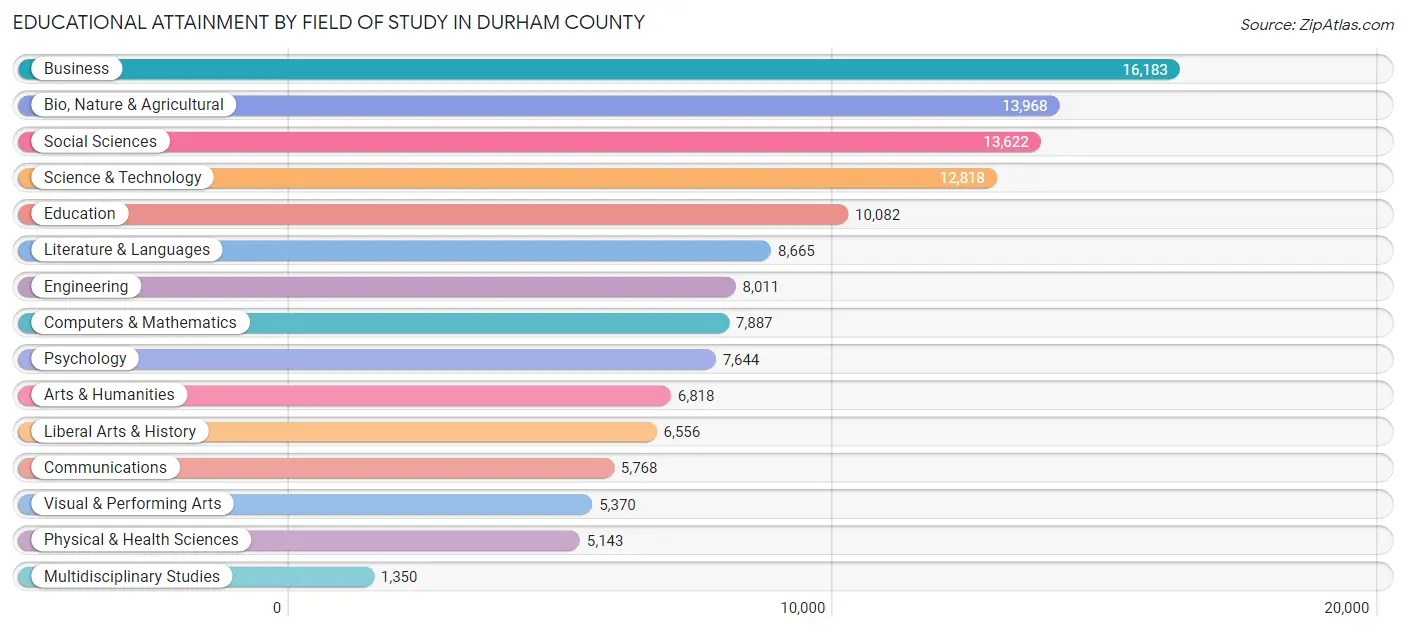
| Field of Study | # Graduates | % Graduates |
| Computers & Mathematics | 7,887 | 6.1% |
| Bio, Nature & Agricultural | 13,968 | 10.7% |
| Physical & Health Sciences | 5,143 | 4.0% |
| Psychology | 7,644 | 5.9% |
| Social Sciences | 13,622 | 10.5% |
| Engineering | 8,011 | 6.2% |
| Multidisciplinary Studies | 1,350 | 1.0% |
| Science & Technology | 12,818 | 9.9% |
| Business | 16,183 | 12.5% |
| Education | 10,082 | 7.8% |
| Literature & Languages | 8,665 | 6.7% |
| Liberal Arts & History | 6,556 | 5.1% |
| Visual & Performing Arts | 5,370 | 4.1% |
| Communications | 5,768 | 4.4% |
| Arts & Humanities | 6,818 | 5.2% |
| Total | 129,885 | 100.0% |
Transportation & Commute in Durham County
Vehicle Availability by Sex in Durham County
The most prevalent vehicle ownership categories in Durham County are males with 2 vehicles (39,092, accounting for 48.6%) and females with 2 vehicles (37,610, making up 46.0%).
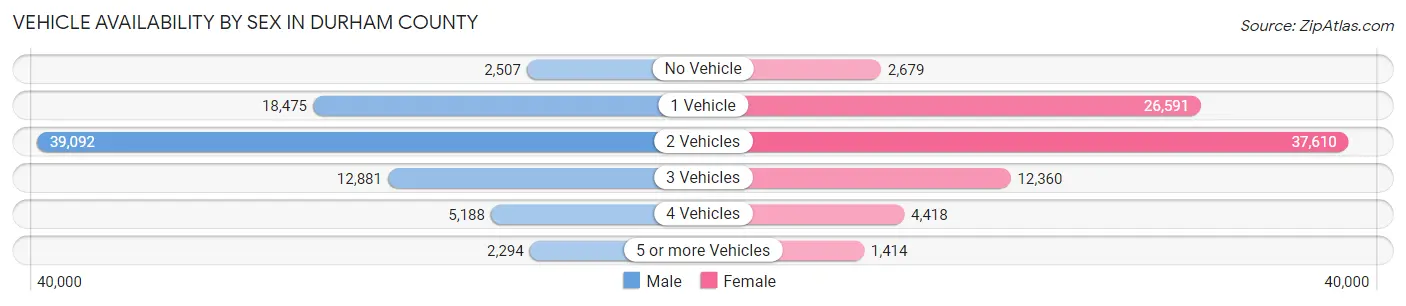
| Vehicles Available | Male | Female |
| No Vehicle | 2,507 (3.1%) | 2,679 (3.2%) |
| 1 Vehicle | 18,475 (23.0%) | 26,591 (31.3%) |
| 2 Vehicles | 39,092 (48.6%) | 37,610 (44.2%) |
| 3 Vehicles | 12,881 (16.0%) | 12,360 (14.5%) |
| 4 Vehicles | 5,188 (6.5%) | 4,418 (5.2%) |
| 5 or more Vehicles | 2,294 (2.9%) | 1,414 (1.7%) |
| Total | 80,437 (100.0%) | 85,072 (100.0%) |
Commute Time in Durham County
The most frequently occuring commute durations in Durham County are 15 to 19 minutes (29,643 commuters, 21.4%), 20 to 24 minutes (25,234 commuters, 18.2%), and 10 to 14 minutes (22,779 commuters, 16.4%).
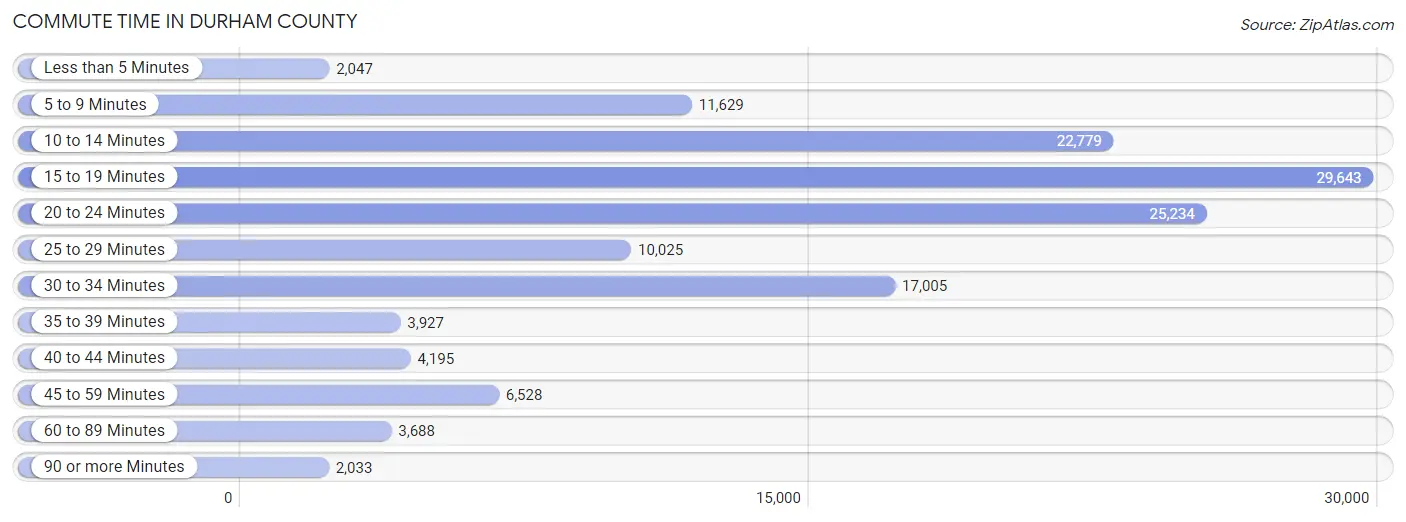
| Commute Time | # Commuters | % Commuters |
| Less than 5 Minutes | 2,047 | 1.5% |
| 5 to 9 Minutes | 11,629 | 8.4% |
| 10 to 14 Minutes | 22,779 | 16.4% |
| 15 to 19 Minutes | 29,643 | 21.4% |
| 20 to 24 Minutes | 25,234 | 18.2% |
| 25 to 29 Minutes | 10,025 | 7.2% |
| 30 to 34 Minutes | 17,005 | 12.3% |
| 35 to 39 Minutes | 3,927 | 2.8% |
| 40 to 44 Minutes | 4,195 | 3.0% |
| 45 to 59 Minutes | 6,528 | 4.7% |
| 60 to 89 Minutes | 3,688 | 2.7% |
| 90 or more Minutes | 2,033 | 1.5% |
Commute Time by Sex in Durham County
The most common commute times in Durham County are 15 to 19 minutes (14,079 commuters, 20.5%) for males and 15 to 19 minutes (15,564 commuters, 22.2%) for females.
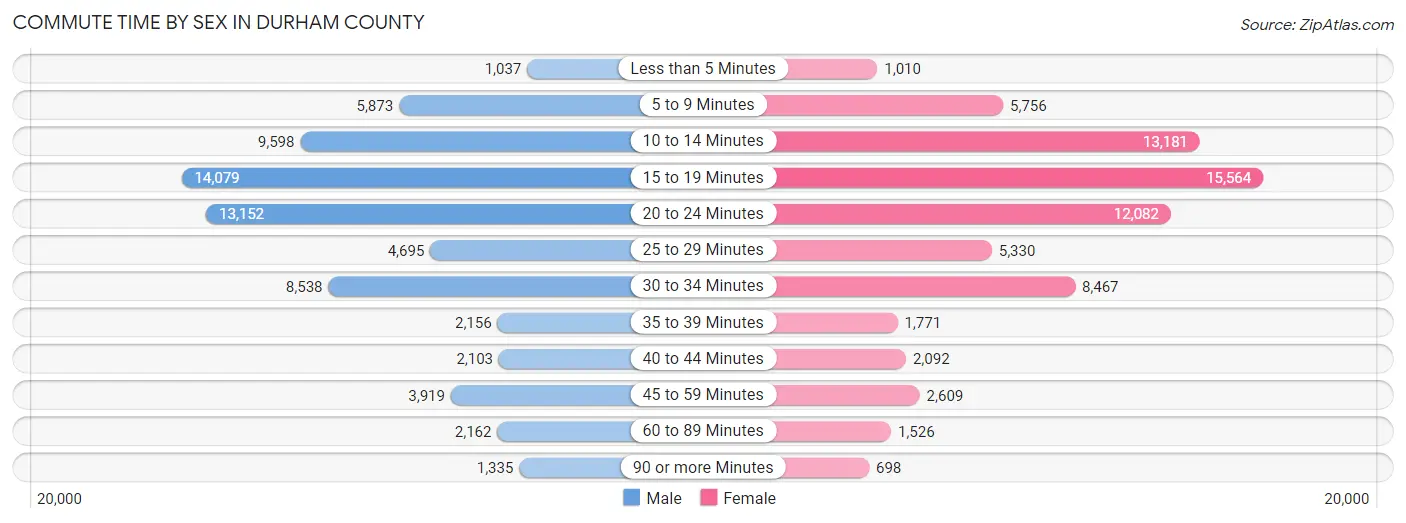
| Commute Time | Male | Female |
| Less than 5 Minutes | 1,037 (1.5%) | 1,010 (1.4%) |
| 5 to 9 Minutes | 5,873 (8.6%) | 5,756 (8.2%) |
| 10 to 14 Minutes | 9,598 (14.0%) | 13,181 (18.8%) |
| 15 to 19 Minutes | 14,079 (20.5%) | 15,564 (22.2%) |
| 20 to 24 Minutes | 13,152 (19.2%) | 12,082 (17.2%) |
| 25 to 29 Minutes | 4,695 (6.8%) | 5,330 (7.6%) |
| 30 to 34 Minutes | 8,538 (12.4%) | 8,467 (12.1%) |
| 35 to 39 Minutes | 2,156 (3.1%) | 1,771 (2.5%) |
| 40 to 44 Minutes | 2,103 (3.1%) | 2,092 (3.0%) |
| 45 to 59 Minutes | 3,919 (5.7%) | 2,609 (3.7%) |
| 60 to 89 Minutes | 2,162 (3.2%) | 1,526 (2.2%) |
| 90 or more Minutes | 1,335 (1.9%) | 698 (1.0%) |
Time of Departure to Work by Sex in Durham County
The most frequent times of departure to work in Durham County are 8:00 AM to 8:29 AM (9,274, 13.5%) for males and 8:00 AM to 8:29 AM (10,230, 14.6%) for females.
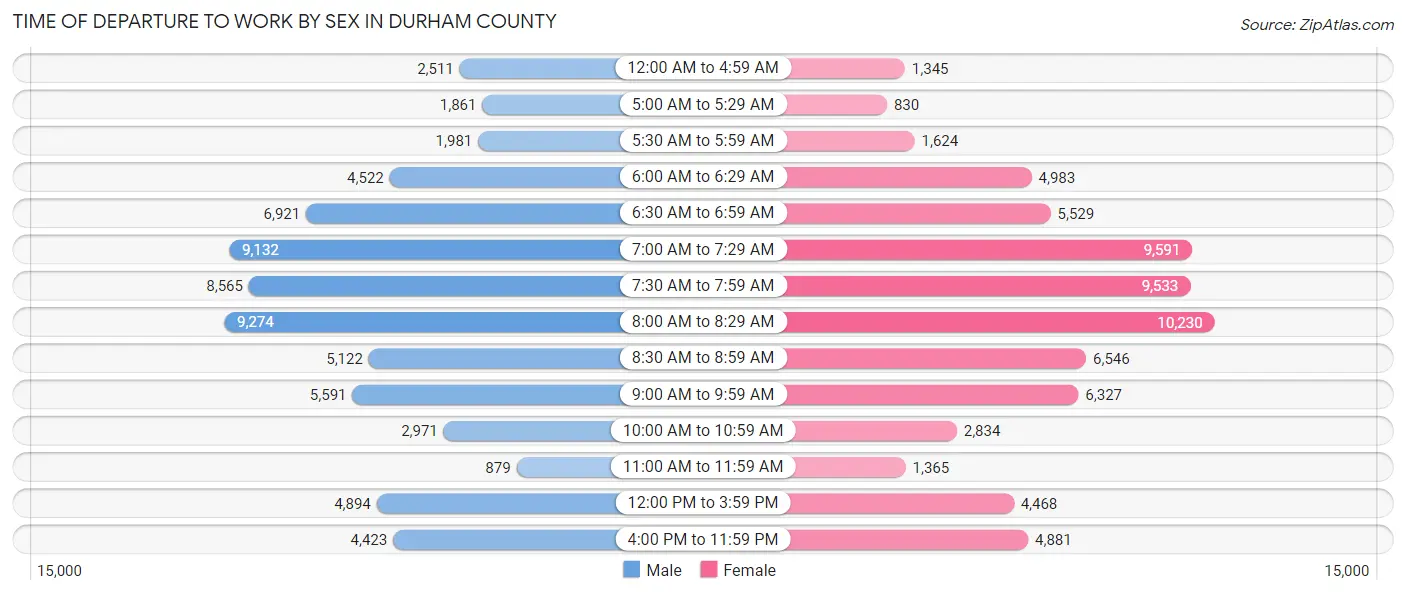
| Time of Departure | Male | Female |
| 12:00 AM to 4:59 AM | 2,511 (3.7%) | 1,345 (1.9%) |
| 5:00 AM to 5:29 AM | 1,861 (2.7%) | 830 (1.2%) |
| 5:30 AM to 5:59 AM | 1,981 (2.9%) | 1,624 (2.3%) |
| 6:00 AM to 6:29 AM | 4,522 (6.6%) | 4,983 (7.1%) |
| 6:30 AM to 6:59 AM | 6,921 (10.1%) | 5,529 (7.9%) |
| 7:00 AM to 7:29 AM | 9,132 (13.3%) | 9,591 (13.7%) |
| 7:30 AM to 7:59 AM | 8,565 (12.5%) | 9,533 (13.6%) |
| 8:00 AM to 8:29 AM | 9,274 (13.5%) | 10,230 (14.6%) |
| 8:30 AM to 8:59 AM | 5,122 (7.5%) | 6,546 (9.3%) |
| 9:00 AM to 9:59 AM | 5,591 (8.1%) | 6,327 (9.0%) |
| 10:00 AM to 10:59 AM | 2,971 (4.3%) | 2,834 (4.0%) |
| 11:00 AM to 11:59 AM | 879 (1.3%) | 1,365 (1.9%) |
| 12:00 PM to 3:59 PM | 4,894 (7.1%) | 4,468 (6.4%) |
| 4:00 PM to 11:59 PM | 4,423 (6.4%) | 4,881 (7.0%) |
| Total | 68,647 (100.0%) | 70,086 (100.0%) |
Housing Occupancy in Durham County
Occupancy by Ownership in Durham County
Of the total 135,469 dwellings in Durham County, owner-occupied units account for 75,033 (55.4%), while renter-occupied units make up 60,436 (44.6%).
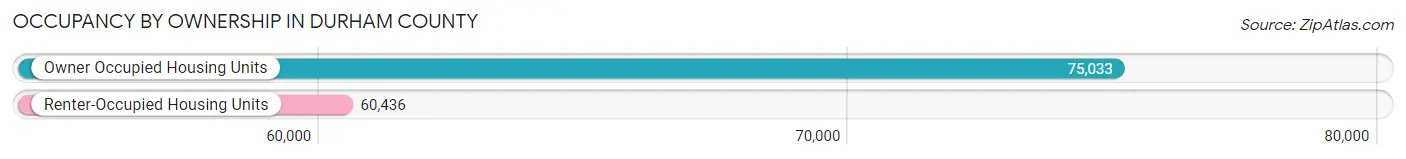
| Occupancy | # Housing Units | % Housing Units |
| Owner Occupied Housing Units | 75,033 | 55.4% |
| Renter-Occupied Housing Units | 60,436 | 44.6% |
| Total Occupied Housing Units | 135,469 | 100.0% |
Occupancy by Household Size in Durham County
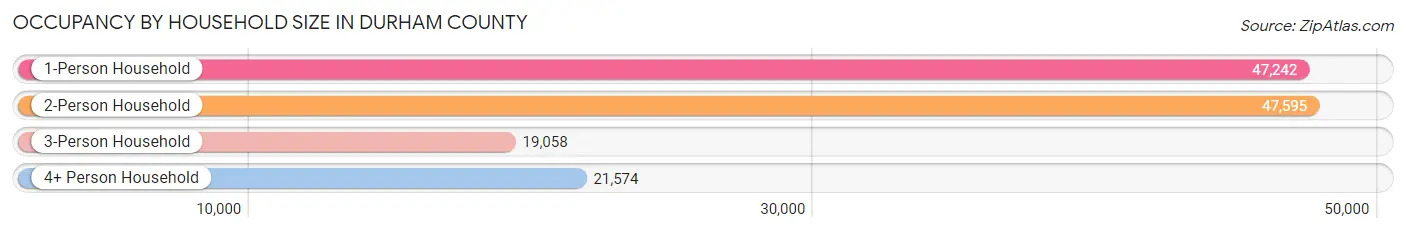
| Household Size | # Housing Units | % Housing Units |
| 1-Person Household | 47,242 | 34.9% |
| 2-Person Household | 47,595 | 35.1% |
| 3-Person Household | 19,058 | 14.1% |
| 4+ Person Household | 21,574 | 15.9% |
| Total Housing Units | 135,469 | 100.0% |
Occupancy by Ownership by Household Size in Durham County
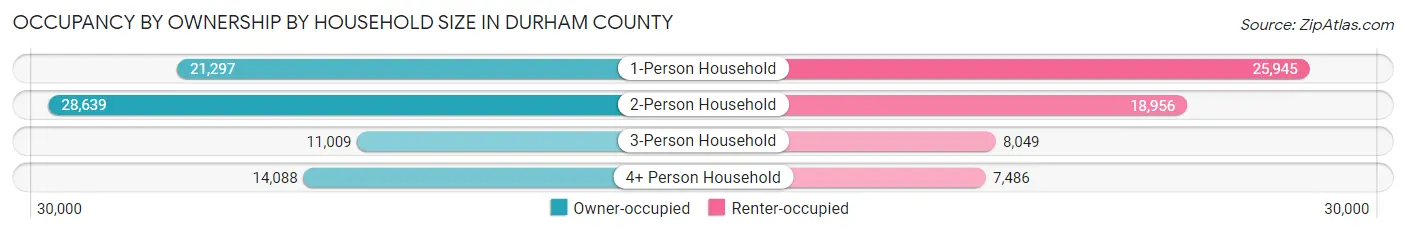
| Household Size | Owner-occupied | Renter-occupied |
| 1-Person Household | 21,297 (45.1%) | 25,945 (54.9%) |
| 2-Person Household | 28,639 (60.2%) | 18,956 (39.8%) |
| 3-Person Household | 11,009 (57.8%) | 8,049 (42.2%) |
| 4+ Person Household | 14,088 (65.3%) | 7,486 (34.7%) |
| Total Housing Units | 75,033 (55.4%) | 60,436 (44.6%) |
Occupancy by Educational Attainment in Durham County
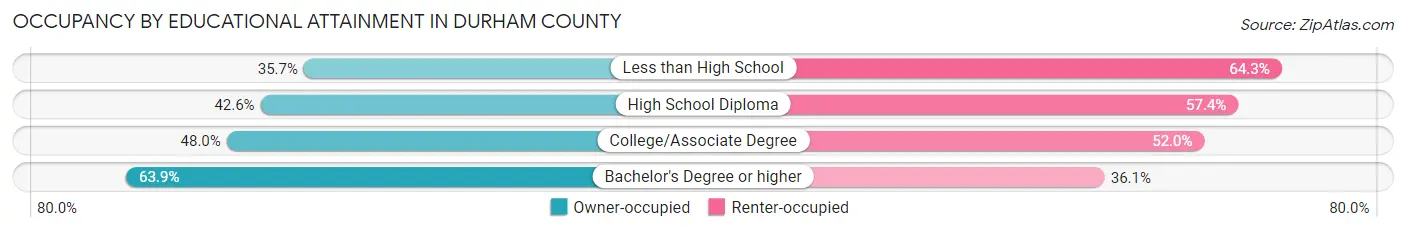
| Household Size | Owner-occupied | Renter-occupied |
| Less than High School | 3,379 (35.7%) | 6,084 (64.3%) |
| High School Diploma | 8,169 (42.6%) | 11,013 (57.4%) |
| College/Associate Degree | 14,363 (48.0%) | 15,586 (52.0%) |
| Bachelor's Degree or higher | 49,122 (63.9%) | 27,753 (36.1%) |
Occupancy by Age of Householder in Durham County
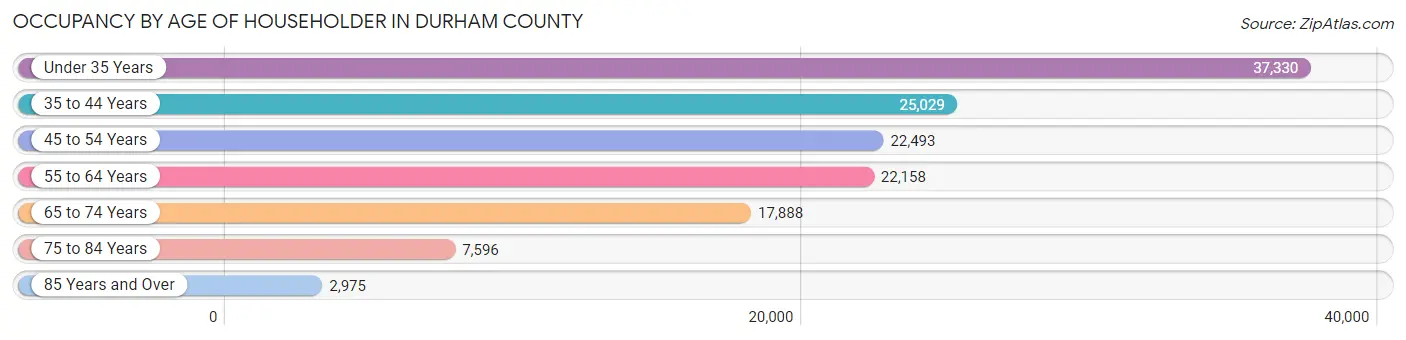
| Age Bracket | # Households | % Households |
| Under 35 Years | 37,330 | 27.6% |
| 35 to 44 Years | 25,029 | 18.5% |
| 45 to 54 Years | 22,493 | 16.6% |
| 55 to 64 Years | 22,158 | 16.4% |
| 65 to 74 Years | 17,888 | 13.2% |
| 75 to 84 Years | 7,596 | 5.6% |
| 85 Years and Over | 2,975 | 2.2% |
| Total | 135,469 | 100.0% |
Housing Finances in Durham County
Median Income by Occupancy in Durham County
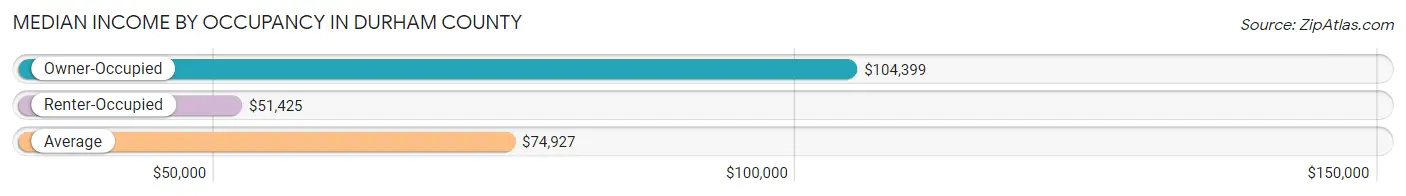
| Occupancy Type | # Households | Median Income |
| Owner-Occupied | 75,033 (55.4%) | $104,399 |
| Renter-Occupied | 60,436 (44.6%) | $51,425 |
| Average | 135,469 (100.0%) | $74,927 |
Occupancy by Householder Income Bracket in Durham County
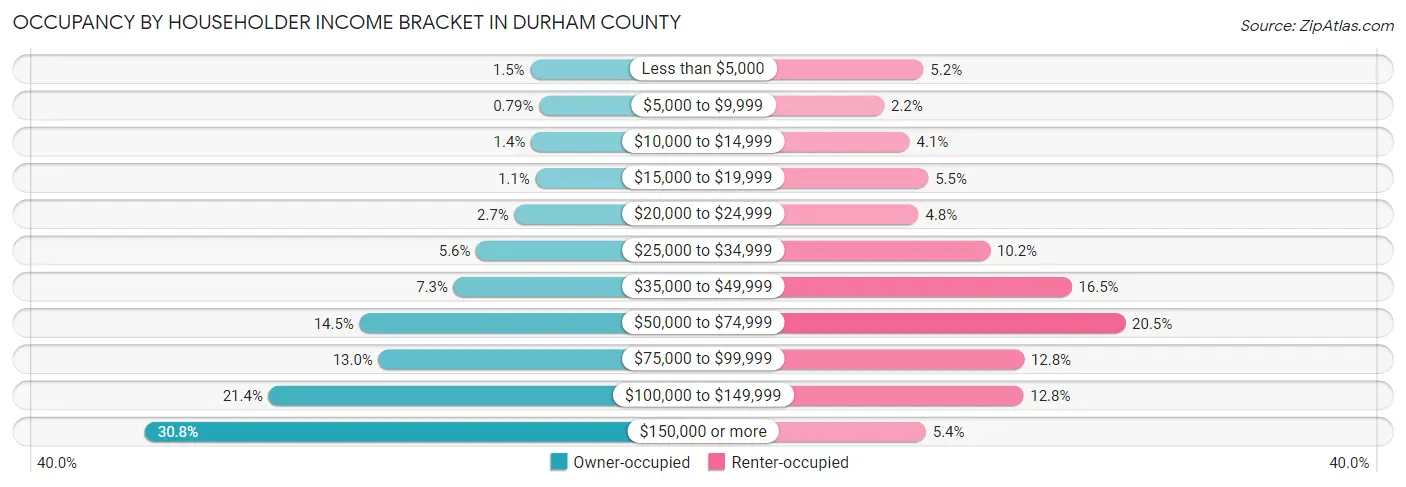
| Income Bracket | Owner-occupied | Renter-occupied |
| Less than $5,000 | 1,094 (1.5%) | 3,122 (5.2%) |
| $5,000 to $9,999 | 592 (0.8%) | 1,314 (2.2%) |
| $10,000 to $14,999 | 1,052 (1.4%) | 2,488 (4.1%) |
| $15,000 to $19,999 | 802 (1.1%) | 3,351 (5.5%) |
| $20,000 to $24,999 | 1,998 (2.7%) | 2,900 (4.8%) |
| $25,000 to $34,999 | 4,186 (5.6%) | 6,190 (10.2%) |
| $35,000 to $49,999 | 5,481 (7.3%) | 9,942 (16.5%) |
| $50,000 to $74,999 | 10,860 (14.5%) | 12,414 (20.5%) |
| $75,000 to $99,999 | 9,771 (13.0%) | 7,756 (12.8%) |
| $100,000 to $149,999 | 16,055 (21.4%) | 7,726 (12.8%) |
| $150,000 or more | 23,142 (30.8%) | 3,233 (5.3%) |
| Total | 75,033 (100.0%) | 60,436 (100.0%) |
Monthly Housing Cost Tiers in Durham County
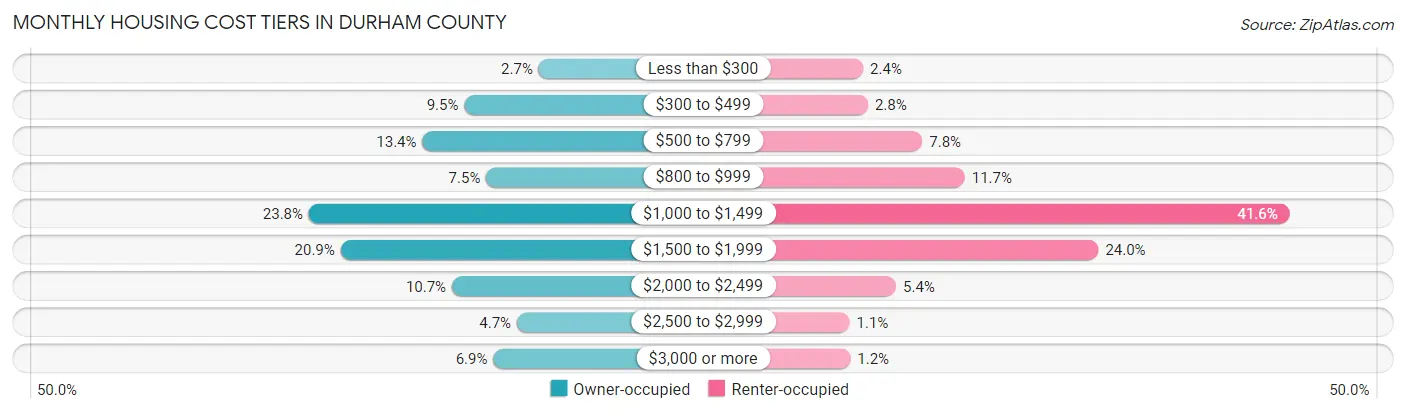
| Monthly Cost | Owner-occupied | Renter-occupied |
| Less than $300 | 2,004 (2.7%) | 1,434 (2.4%) |
| $300 to $499 | 7,141 (9.5%) | 1,697 (2.8%) |
| $500 to $799 | 10,037 (13.4%) | 4,727 (7.8%) |
| $800 to $999 | 5,625 (7.5%) | 7,092 (11.7%) |
| $1,000 to $1,499 | 17,883 (23.8%) | 25,151 (41.6%) |
| $1,500 to $1,999 | 15,690 (20.9%) | 14,522 (24.0%) |
| $2,000 to $2,499 | 7,996 (10.7%) | 3,265 (5.4%) |
| $2,500 to $2,999 | 3,515 (4.7%) | 674 (1.1%) |
| $3,000 or more | 5,142 (6.9%) | 721 (1.2%) |
| Total | 75,033 (100.0%) | 60,436 (100.0%) |
Physical Housing Characteristics in Durham County
Housing Structures in Durham County
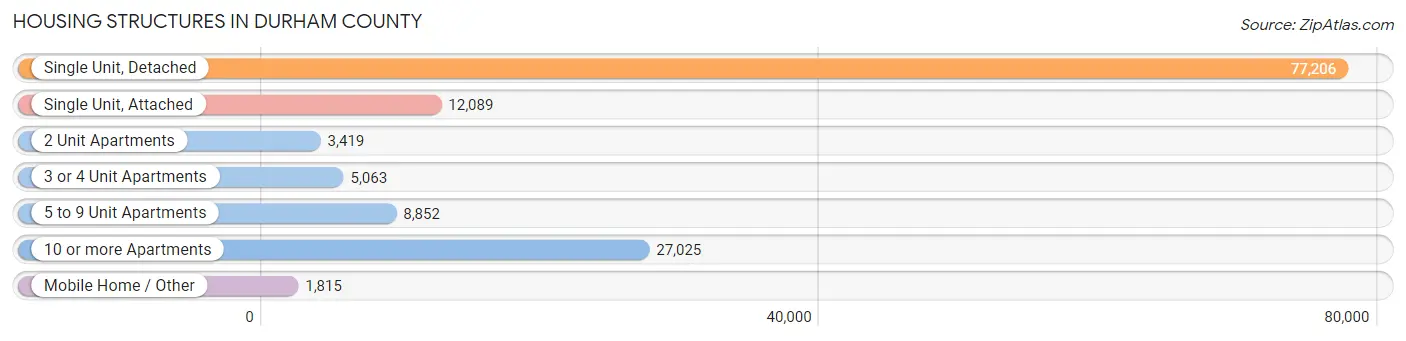
| Structure Type | # Housing Units | % Housing Units |
| Single Unit, Detached | 77,206 | 57.0% |
| Single Unit, Attached | 12,089 | 8.9% |
| 2 Unit Apartments | 3,419 | 2.5% |
| 3 or 4 Unit Apartments | 5,063 | 3.7% |
| 5 to 9 Unit Apartments | 8,852 | 6.5% |
| 10 or more Apartments | 27,025 | 20.0% |
| Mobile Home / Other | 1,815 | 1.3% |
| Total | 135,469 | 100.0% |
Housing Structures by Occupancy in Durham County
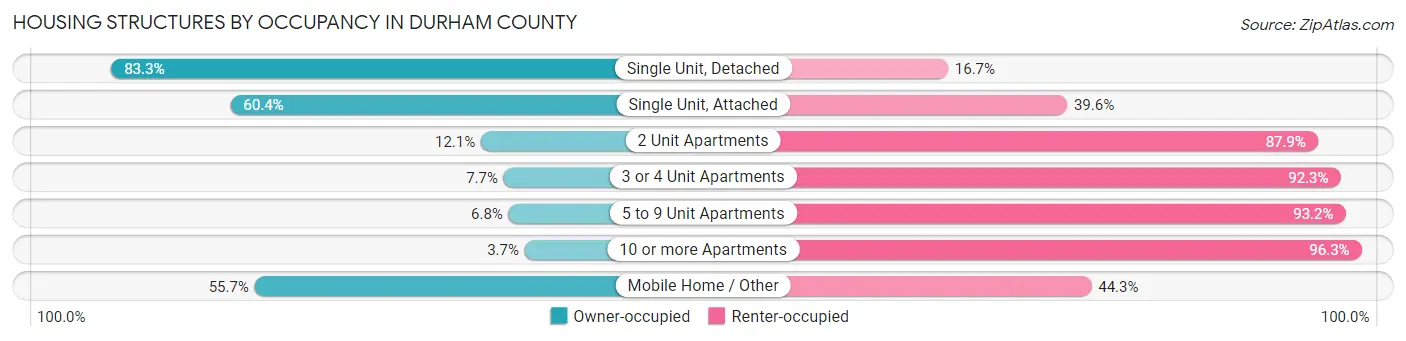
| Structure Type | Owner-occupied | Renter-occupied |
| Single Unit, Detached | 64,321 (83.3%) | 12,885 (16.7%) |
| Single Unit, Attached | 7,298 (60.4%) | 4,791 (39.6%) |
| 2 Unit Apartments | 414 (12.1%) | 3,005 (87.9%) |
| 3 or 4 Unit Apartments | 392 (7.7%) | 4,671 (92.3%) |
| 5 to 9 Unit Apartments | 601 (6.8%) | 8,251 (93.2%) |
| 10 or more Apartments | 996 (3.7%) | 26,029 (96.3%) |
| Mobile Home / Other | 1,011 (55.7%) | 804 (44.3%) |
| Total | 75,033 (55.4%) | 60,436 (44.6%) |
Housing Structures by Number of Rooms in Durham County
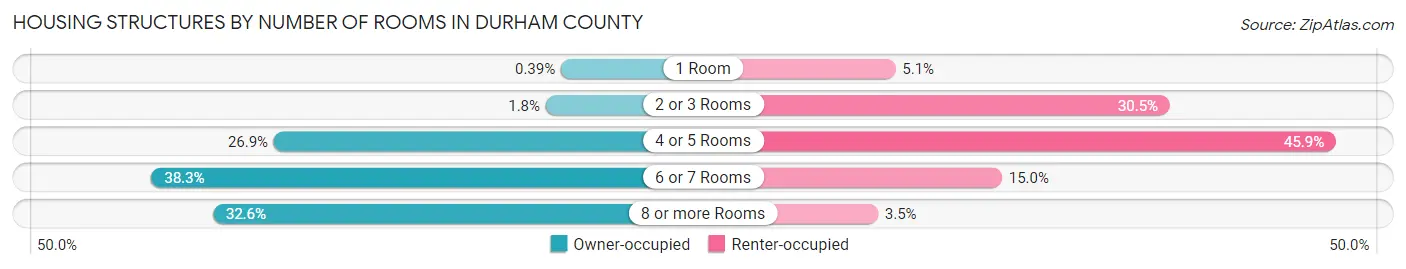
| Number of Rooms | Owner-occupied | Renter-occupied |
| 1 Room | 295 (0.4%) | 3,098 (5.1%) |
| 2 or 3 Rooms | 1,341 (1.8%) | 18,448 (30.5%) |
| 4 or 5 Rooms | 20,215 (26.9%) | 27,726 (45.9%) |
| 6 or 7 Rooms | 28,725 (38.3%) | 9,045 (15.0%) |
| 8 or more Rooms | 24,457 (32.6%) | 2,119 (3.5%) |
| Total | 75,033 (100.0%) | 60,436 (100.0%) |
Housing Structure by Heating Type in Durham County
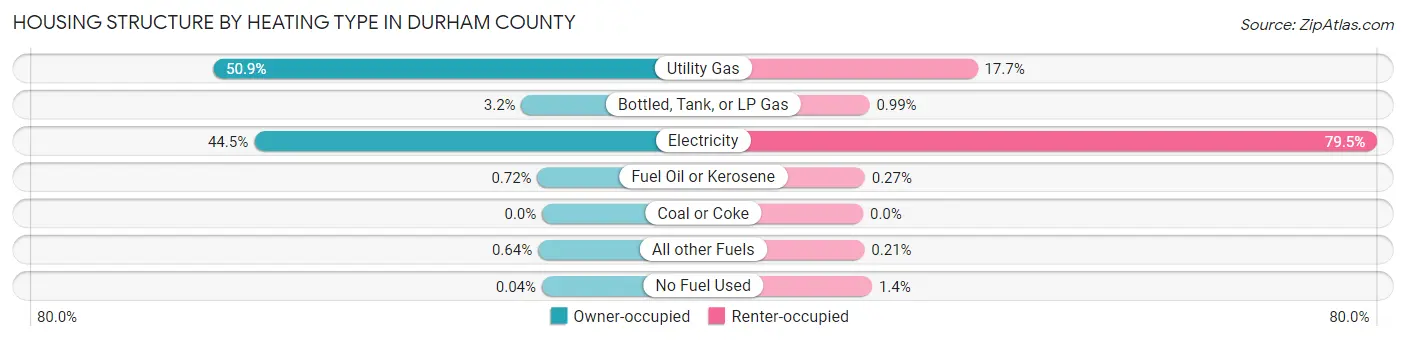
| Heating Type | Owner-occupied | Renter-occupied |
| Utility Gas | 38,156 (50.8%) | 10,691 (17.7%) |
| Bottled, Tank, or LP Gas | 2,404 (3.2%) | 597 (1.0%) |
| Electricity | 33,423 (44.5%) | 48,021 (79.5%) |
| Fuel Oil or Kerosene | 538 (0.7%) | 164 (0.3%) |
| Coal or Coke | 0 (0.0%) | 0 (0.0%) |
| All other Fuels | 481 (0.6%) | 129 (0.2%) |
| No Fuel Used | 31 (0.0%) | 834 (1.4%) |
| Total | 75,033 (100.0%) | 60,436 (100.0%) |
Household Vehicle Usage in Durham County
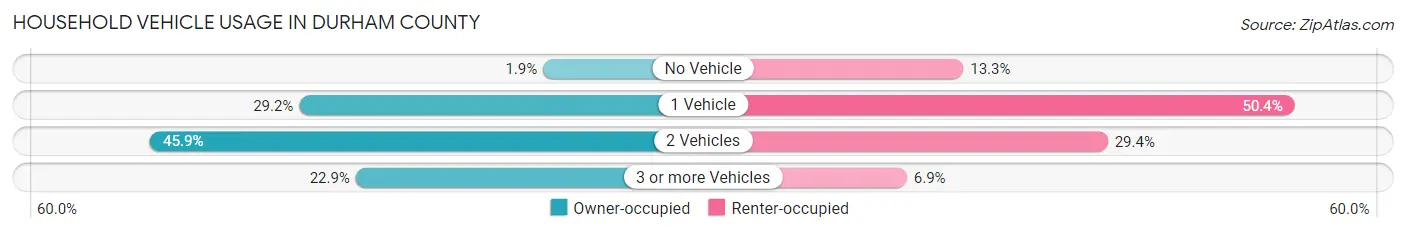
| Vehicles per Household | Owner-occupied | Renter-occupied |
| No Vehicle | 1,438 (1.9%) | 8,015 (13.3%) |
| 1 Vehicle | 21,943 (29.2%) | 30,433 (50.4%) |
| 2 Vehicles | 34,461 (45.9%) | 17,794 (29.4%) |
| 3 or more Vehicles | 17,191 (22.9%) | 4,194 (6.9%) |
| Total | 75,033 (100.0%) | 60,436 (100.0%) |
Real Estate & Mortgages in Durham County
Real Estate and Mortgage Overview in Durham County
| Characteristic | Without Mortgage | With Mortgage |
| Housing Units | 21,537 | 53,496 |
| Median Property Value | $298,500 | $315,300 |
| Median Household Income | $77,113 | $18,443 |
| Monthly Housing Costs | $561 | $5,029 |
| Real Estate Taxes | $2,850 | $588 |
Property Value by Mortgage Status in Durham County
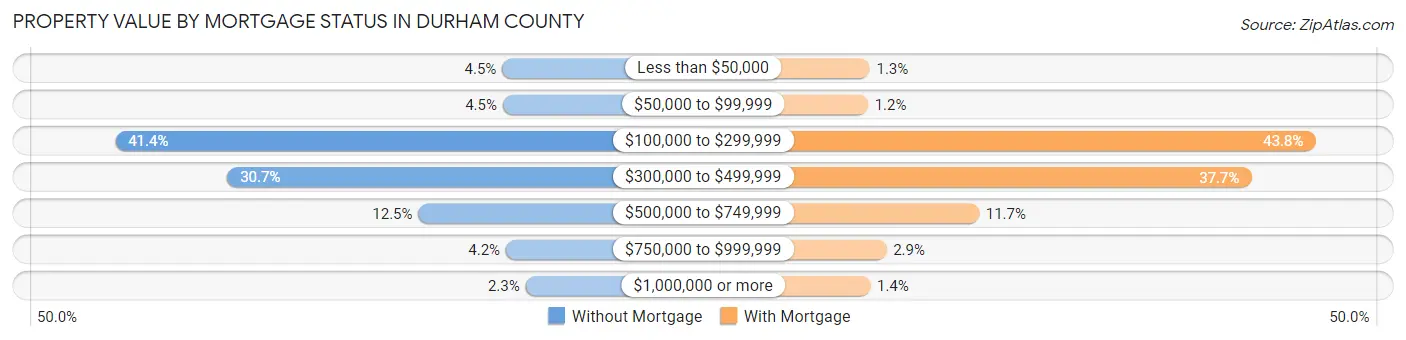
| Property Value | Without Mortgage | With Mortgage |
| Less than $50,000 | 974 (4.5%) | 709 (1.3%) |
| $50,000 to $99,999 | 960 (4.5%) | 622 (1.2%) |
| $100,000 to $299,999 | 8,910 (41.4%) | 23,422 (43.8%) |
| $300,000 to $499,999 | 6,611 (30.7%) | 20,161 (37.7%) |
| $500,000 to $749,999 | 2,692 (12.5%) | 6,279 (11.7%) |
| $750,000 to $999,999 | 896 (4.2%) | 1,563 (2.9%) |
| $1,000,000 or more | 494 (2.3%) | 740 (1.4%) |
| Total | 21,537 (100.0%) | 53,496 (100.0%) |
Household Income by Mortgage Status in Durham County
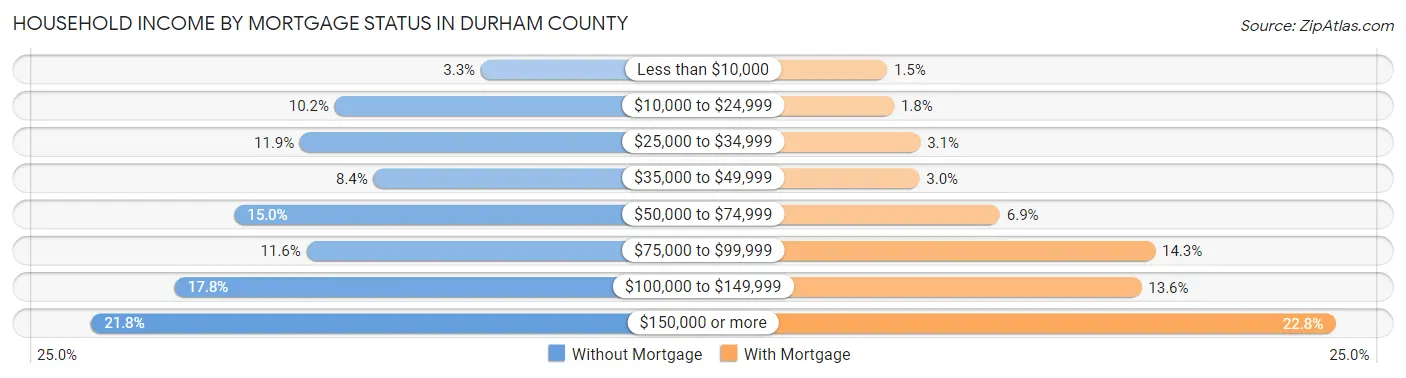
| Household Income | Without Mortgage | With Mortgage |
| Less than $10,000 | 705 (3.3%) | 802 (1.5%) |
| $10,000 to $24,999 | 2,204 (10.2%) | 981 (1.8%) |
| $25,000 to $34,999 | 2,559 (11.9%) | 1,648 (3.1%) |
| $35,000 to $49,999 | 1,804 (8.4%) | 1,627 (3.0%) |
| $50,000 to $74,999 | 3,232 (15.0%) | 3,677 (6.9%) |
| $75,000 to $99,999 | 2,491 (11.6%) | 7,628 (14.3%) |
| $100,000 to $149,999 | 3,843 (17.8%) | 7,280 (13.6%) |
| $150,000 or more | 4,699 (21.8%) | 12,212 (22.8%) |
| Total | 21,537 (100.0%) | 53,496 (100.0%) |
Property Value to Household Income Ratio in Durham County
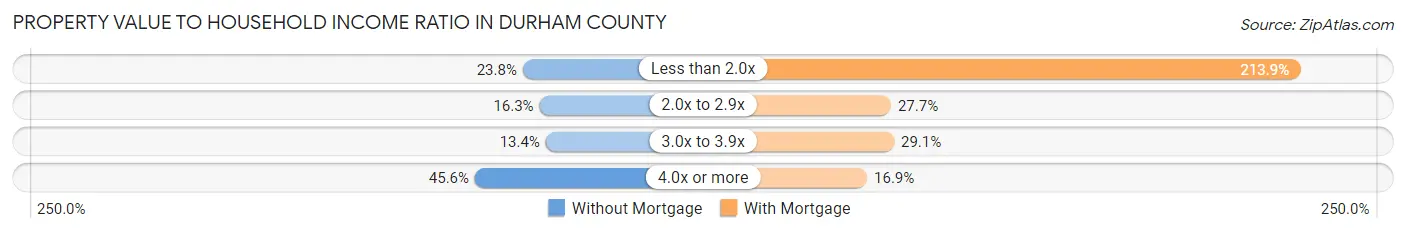
| Value-to-Income Ratio | Without Mortgage | With Mortgage |
| Less than 2.0x | 5,134 (23.8%) | 114,404 (213.9%) |
| 2.0x to 2.9x | 3,499 (16.3%) | 14,829 (27.7%) |
| 3.0x to 3.9x | 2,885 (13.4%) | 15,580 (29.1%) |
| 4.0x or more | 9,817 (45.6%) | 9,033 (16.9%) |
| Total | 21,537 (100.0%) | 53,496 (100.0%) |
Real Estate Taxes by Mortgage Status in Durham County
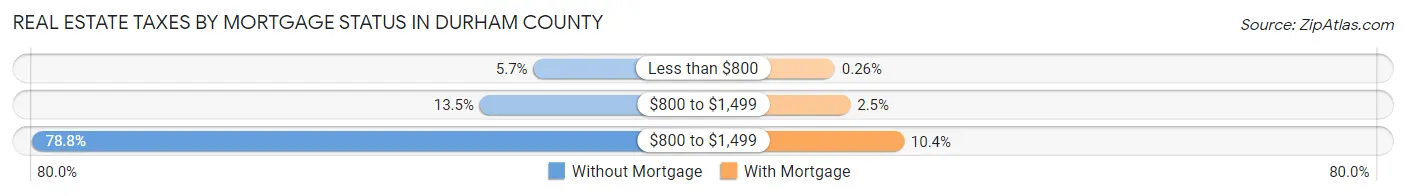
| Property Taxes | Without Mortgage | With Mortgage |
| Less than $800 | 1,216 (5.7%) | 141 (0.3%) |
| $800 to $1,499 | 2,906 (13.5%) | 1,347 (2.5%) |
| $800 to $1,499 | 16,978 (78.8%) | 5,536 (10.3%) |
| Total | 21,537 (100.0%) | 53,496 (100.0%) |
Health & Disability in Durham County
Health Insurance Coverage by Age in Durham County
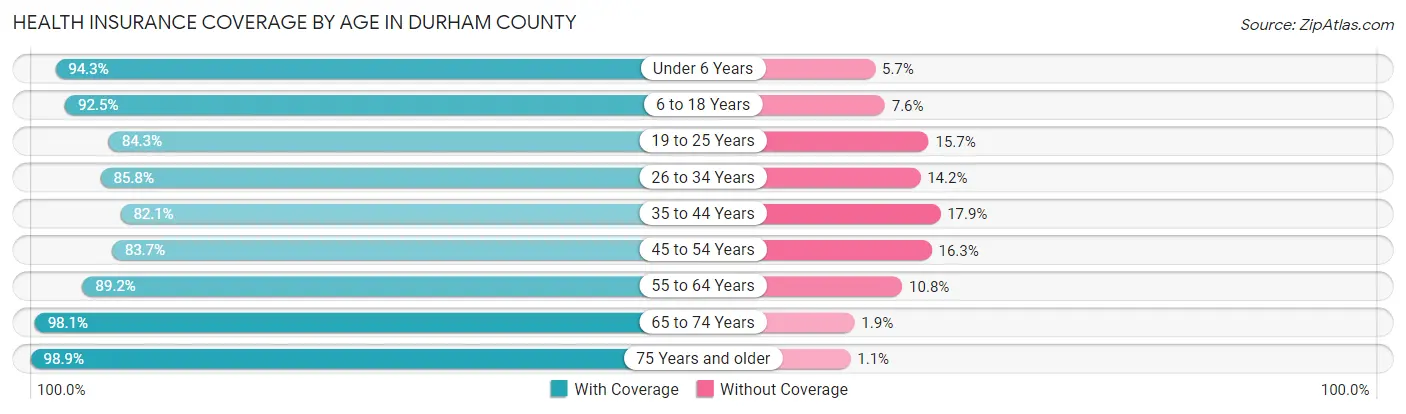
| Age Bracket | With Coverage | Without Coverage |
| Under 6 Years | 21,407 (94.3%) | 1,302 (5.7%) |
| 6 to 18 Years | 43,777 (92.4%) | 3,574 (7.5%) |
| 19 to 25 Years | 29,377 (84.3%) | 5,475 (15.7%) |
| 26 to 34 Years | 44,531 (85.8%) | 7,344 (14.2%) |
| 35 to 44 Years | 36,897 (82.1%) | 8,036 (17.9%) |
| 45 to 54 Years | 31,771 (83.7%) | 6,173 (16.3%) |
| 55 to 64 Years | 32,543 (89.2%) | 3,938 (10.8%) |
| 65 to 74 Years | 26,957 (98.1%) | 520 (1.9%) |
| 75 Years and older | 15,943 (98.9%) | 183 (1.1%) |
| Total | 283,203 (88.6%) | 36,545 (11.4%) |
Health Insurance Coverage by Citizenship Status in Durham County
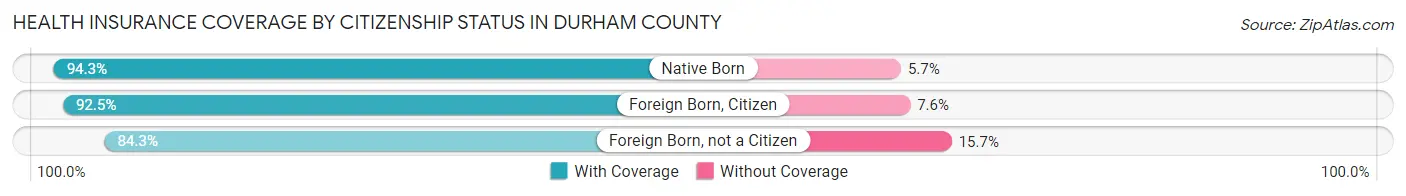
| Citizenship Status | With Coverage | Without Coverage |
| Native Born | 21,407 (94.3%) | 1,302 (5.7%) |
| Foreign Born, Citizen | 43,777 (92.4%) | 3,574 (7.5%) |
| Foreign Born, not a Citizen | 29,377 (84.3%) | 5,475 (15.7%) |
Health Insurance Coverage by Household Income in Durham County
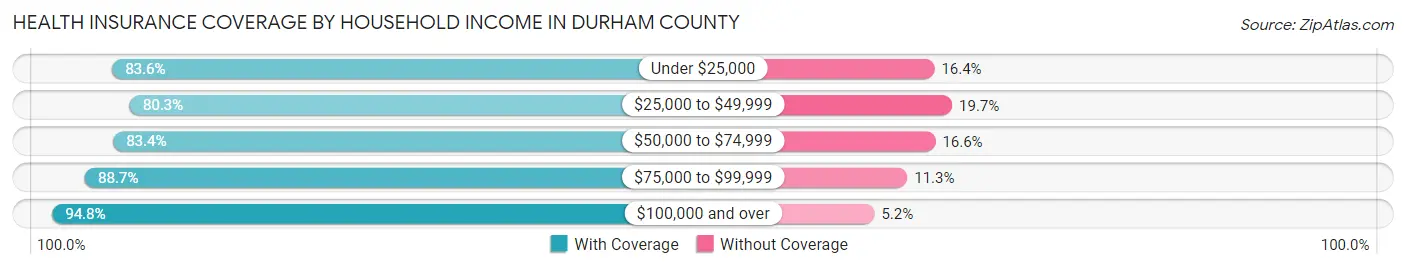
| Household Income | With Coverage | Without Coverage |
| Under $25,000 | 27,046 (83.6%) | 5,314 (16.4%) |
| $25,000 to $49,999 | 41,575 (80.3%) | 10,217 (19.7%) |
| $50,000 to $74,999 | 41,931 (83.4%) | 8,355 (16.6%) |
| $75,000 to $99,999 | 37,840 (88.7%) | 4,834 (11.3%) |
| $100,000 and over | 126,005 (94.8%) | 6,900 (5.2%) |
Public vs Private Health Insurance Coverage by Age in Durham County
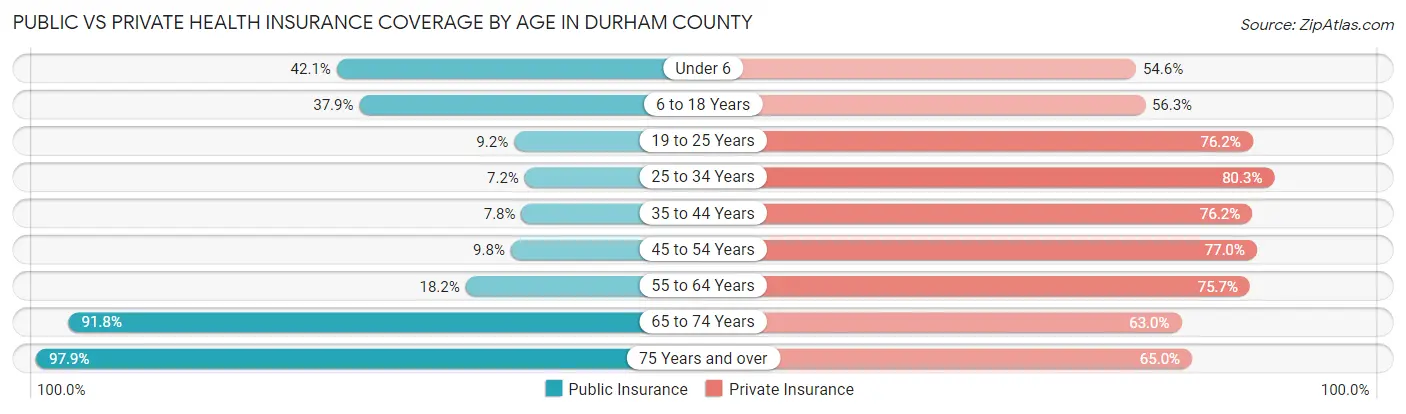
| Age Bracket | Public Insurance | Private Insurance |
| Under 6 | 9,557 (42.1%) | 12,402 (54.6%) |
| 6 to 18 Years | 17,935 (37.9%) | 26,646 (56.3%) |
| 19 to 25 Years | 3,193 (9.2%) | 26,568 (76.2%) |
| 25 to 34 Years | 3,726 (7.2%) | 41,634 (80.3%) |
| 35 to 44 Years | 3,502 (7.8%) | 34,223 (76.2%) |
| 45 to 54 Years | 3,707 (9.8%) | 29,232 (77.0%) |
| 55 to 64 Years | 6,620 (18.1%) | 27,626 (75.7%) |
| 65 to 74 Years | 25,232 (91.8%) | 17,314 (63.0%) |
| 75 Years and over | 15,781 (97.9%) | 10,478 (65.0%) |
| Total | 89,253 (27.9%) | 226,123 (70.7%) |
Disability Status by Sex by Age in Durham County
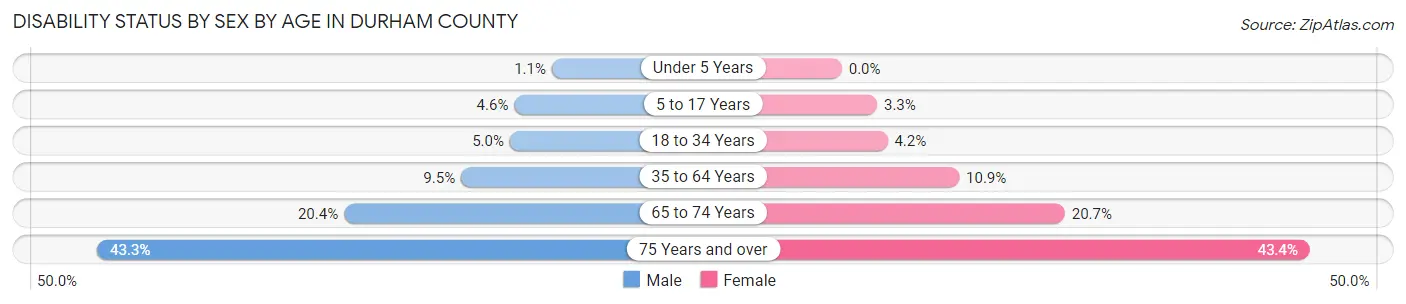
| Age Bracket | Male | Female |
| Under 5 Years | 106 (1.1%) | 0 (0.0%) |
| 5 to 17 Years | 1,058 (4.6%) | 730 (3.3%) |
| 18 to 34 Years | 2,199 (5.0%) | 2,013 (4.2%) |
| 35 to 64 Years | 5,351 (9.5%) | 6,869 (10.9%) |
| 65 to 74 Years | 2,424 (20.4%) | 3,223 (20.7%) |
| 75 Years and over | 2,747 (43.3%) | 4,246 (43.4%) |
Disability Class by Sex by Age in Durham County
Disability Class: Hearing Difficulty
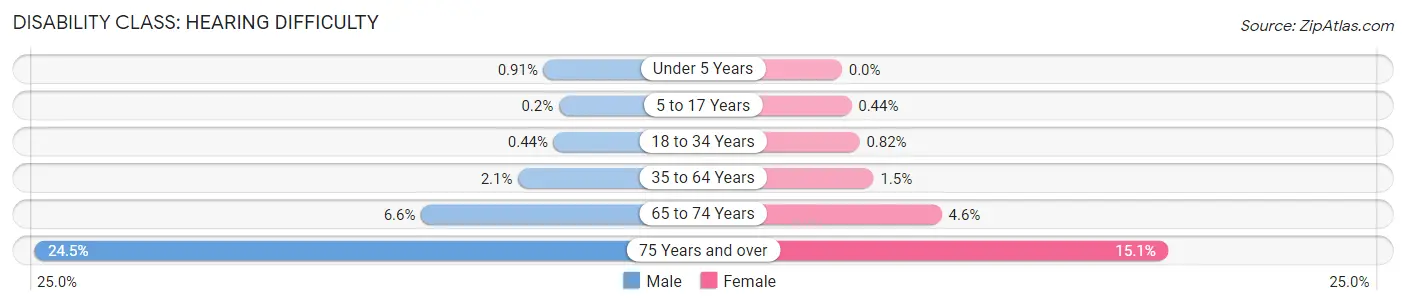
| Age Bracket | Male | Female |
| Under 5 Years | 90 (0.9%) | 0 (0.0%) |
| 5 to 17 Years | 46 (0.2%) | 98 (0.4%) |
| 18 to 34 Years | 194 (0.4%) | 388 (0.8%) |
| 35 to 64 Years | 1,179 (2.1%) | 928 (1.5%) |
| 65 to 74 Years | 784 (6.6%) | 721 (4.6%) |
| 75 Years and over | 1,556 (24.5%) | 1,478 (15.1%) |
Disability Class: Vision Difficulty
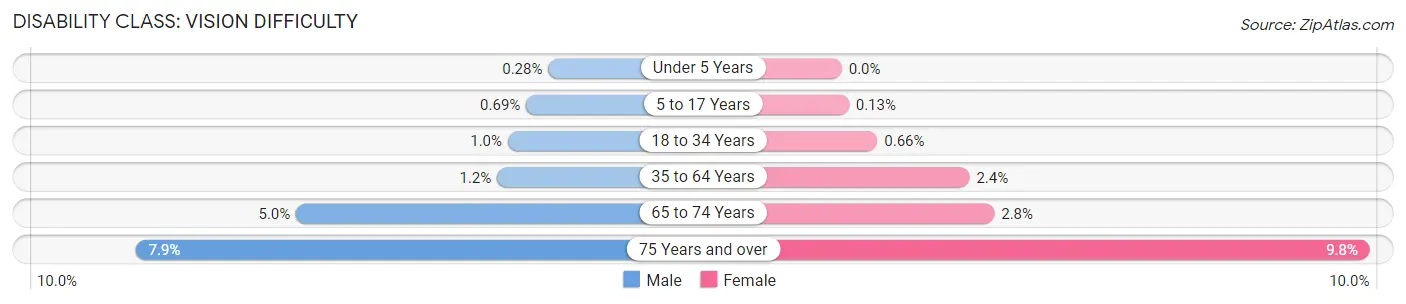
| Age Bracket | Male | Female |
| Under 5 Years | 28 (0.3%) | 0 (0.0%) |
| 5 to 17 Years | 160 (0.7%) | 30 (0.1%) |
| 18 to 34 Years | 455 (1.0%) | 311 (0.7%) |
| 35 to 64 Years | 695 (1.2%) | 1,494 (2.4%) |
| 65 to 74 Years | 591 (5.0%) | 441 (2.8%) |
| 75 Years and over | 504 (7.9%) | 958 (9.8%) |
Disability Class: Cognitive Difficulty
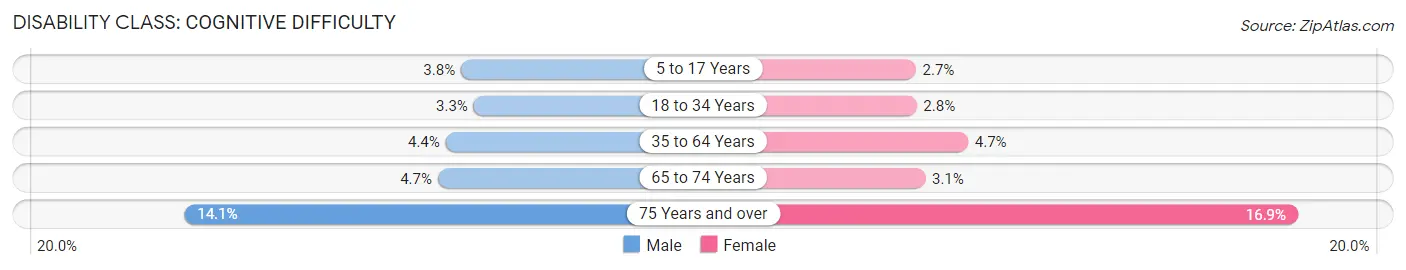
| Age Bracket | Male | Female |
| 5 to 17 Years | 883 (3.8%) | 610 (2.7%) |
| 18 to 34 Years | 1,472 (3.3%) | 1,315 (2.8%) |
| 35 to 64 Years | 2,458 (4.4%) | 2,954 (4.7%) |
| 65 to 74 Years | 555 (4.7%) | 481 (3.1%) |
| 75 Years and over | 893 (14.1%) | 1,655 (16.9%) |
Disability Class: Ambulatory Difficulty
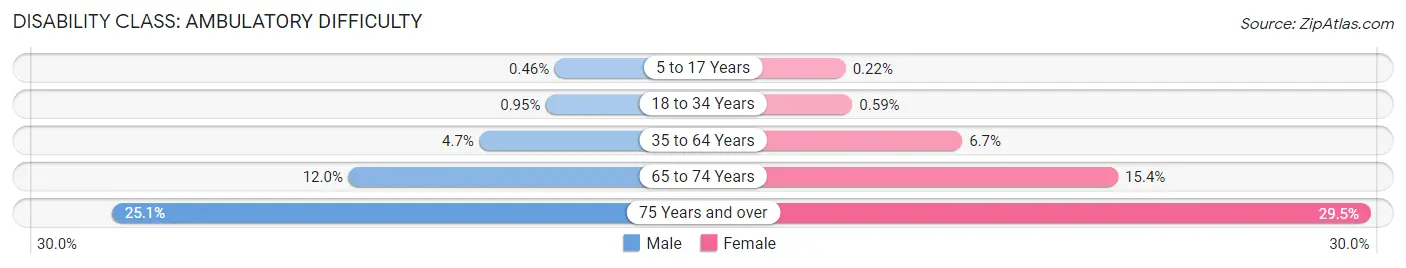
| Age Bracket | Male | Female |
| 5 to 17 Years | 106 (0.5%) | 48 (0.2%) |
| 18 to 34 Years | 422 (0.9%) | 279 (0.6%) |
| 35 to 64 Years | 2,621 (4.7%) | 4,232 (6.7%) |
| 65 to 74 Years | 1,422 (11.9%) | 2,397 (15.4%) |
| 75 Years and over | 1,596 (25.1%) | 2,880 (29.5%) |
Disability Class: Self-Care Difficulty

| Age Bracket | Male | Female |
| 5 to 17 Years | 69 (0.3%) | 110 (0.5%) |
| 18 to 34 Years | 255 (0.6%) | 173 (0.4%) |
| 35 to 64 Years | 1,152 (2.1%) | 1,676 (2.7%) |
| 65 to 74 Years | 326 (2.7%) | 394 (2.5%) |
| 75 Years and over | 736 (11.6%) | 906 (9.3%) |
Technology Access in Durham County
Computing Device Access in Durham County
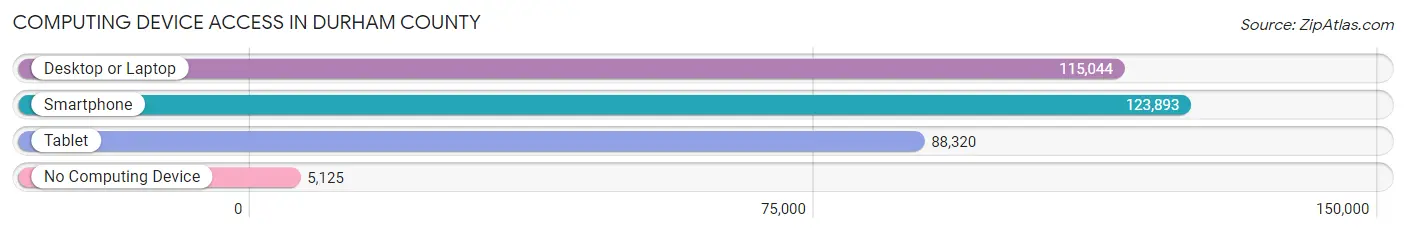
| Device Type | # Households | % Households |
| Desktop or Laptop | 115,044 | 84.9% |
| Smartphone | 123,893 | 91.4% |
| Tablet | 88,320 | 65.2% |
| No Computing Device | 5,125 | 3.8% |
| Total | 135,469 | 100.0% |
Internet Access in Durham County
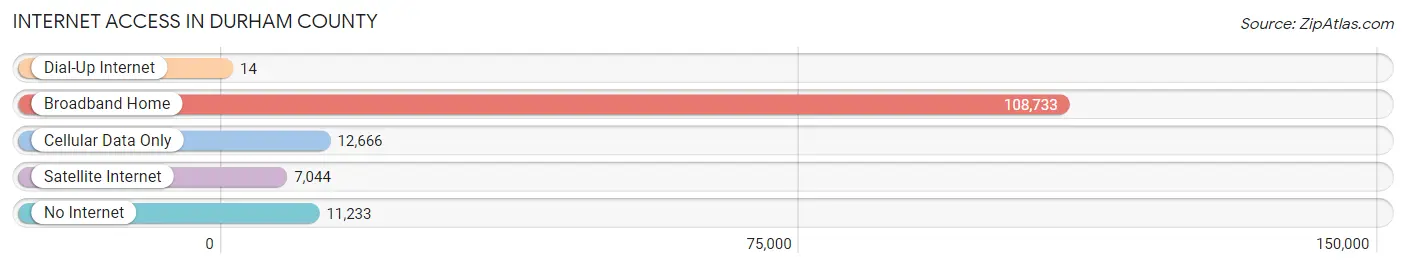
| Internet Type | # Households | % Households |
| Dial-Up Internet | 14 | 0.0% |
| Broadband Home | 108,733 | 80.3% |
| Cellular Data Only | 12,666 | 9.3% |
| Satellite Internet | 7,044 | 5.2% |
| No Internet | 11,233 | 8.3% |
| Total | 135,469 | 100.0% |
Durham County Summary
Durham County, North Carolina is located in the central part of the state and is part of the Research Triangle region. It is bordered by Orange County to the north, Wake County to the east, Chatham County to the south, and Alamance County to the west. The county seat is Durham, and the county is home to a population of approximately 300,000 people.
Geography
Durham County is located in the Piedmont region of North Carolina, and is characterized by rolling hills and valleys. The county is drained by the Eno, Flat, and Little Rivers, as well as several creeks. The highest point in the county is located in the northern part of the county, near the Orange County border, and is approximately 890 feet above sea level. The county is home to several state parks, including Eno River State Park, Falls Lake State Recreation Area, and Occoneechee Mountain State Natural Area.
History
Durham County was formed in 1881 from parts of Orange and Wake Counties. The county was named after the city of Durham, which was established in 1869. The city was named after Dr. Bartlett Durham, a local physician and landowner. The county was initially an agricultural area, with tobacco and cotton being the primary crops. In the early 20th century, the county began to experience rapid growth due to the establishment of several large industries, including tobacco, textiles, and furniture.
Economy
Durham County’s economy is largely driven by the Research Triangle Park, which is located in the county. The park is home to over 200 companies, including IBM, GlaxoSmithKline, and Cisco Systems. The county is also home to several universities, including Duke University, North Carolina Central University, and the University of North Carolina at Chapel Hill. The county’s largest employers are Duke University Health System, Duke University, and IBM.
Demographics
As of the 2010 census, Durham County had a population of 267,587 people. The racial makeup of the county was 57.2% White, 33.9% African American, 4.2% Asian, 0.3% Native American, 0.1% Pacific Islander, and 3.3% from other races. The median household income was $50,867, and the median family income was $62,937. The per capita income was $27,837.
Conclusion
Durham County, North Carolina is a vibrant and diverse county located in the central part of the state. It is home to a population of approximately 300,000 people, and is largely driven by the Research Triangle Park. The county is home to several universities, and its largest employers are Duke University Health System, Duke University, and IBM. The county’s population is largely composed of White, African American, and Asian residents, and the median household income is $50,867.
Common Questions
What is the Total Population of Durham County?
Total Population of Durham County is 325,101.
What is the Total Male Population of Durham County?
Total Male Population of Durham County is 156,231.
What is the Total Female Population of Durham County?
Total Female Population of Durham County is 168,870.
What is the Ratio of Males per 100 Females in Durham County?
There are 92.52 Males per 100 Females in Durham County.
What is the Ratio of Females per 100 Males in Durham County?
There are 108.09 Females per 100 Males in Durham County.
What is the Median Population Age in Durham County?
Median Population Age in Durham County is 35.8 Years.
What is the Average Family Size in Durham County
Average Family Size in Durham County is 3.0 People.
What is the Average Household Size in Durham County
Average Household Size in Durham County is 2.3 People.
What is Per Capita Income in Durham County?
Per Capita income in Durham County is $43,945.
What is the Median Family Income in Durham County?
Median Family Income in Durham County is $95,715.
What is the Median Household income in Durham County?
Median Household Income in Durham County is $74,927.
What is Income or Wage Gap in Durham County?
Income or Wage Gap in Durham County is 10.0%.
Women in Durham County earn 90.0 cents for every dollar earned by a man.
What is Family Income Deficit in Durham County?
Family Income Deficit in Durham County is $10,661.
Families that are below poverty line in Durham County earn $10,661 less on average than the poverty threshold level.
What is Inequality or Gini Index in Durham County?
Inequality or Gini Index in Durham County is 0.46.
How Large is the Labor Force in Durham County?
There are 179,781 People in the Labor Forcein in Durham County.
What is the Percentage of People in the Labor Force in Durham County?
67.5% of People are in the Labor Force in Durham County.
What is the Unemployment Rate in Durham County?
Unemployment Rate in Durham County is 4.3%.