Dare County, NC
Dare County Overview
37,160
TOTAL POPULATION
18,548
MALE POPULATION
18,612
FEMALE POPULATION
99.66
MALES / 100 FEMALES
100.35
FEMALES / 100 MALES
48.1
MEDIAN AGE
2.8
AVG FAMILY SIZE
2.3
AVG HOUSEHOLD SIZE
$45,669
PER CAPITA INCOME
$101,908
AVG FAMILY INCOME
$79,742
AVG HOUSEHOLD INCOME
16.2%
WAGE / INCOME GAP [ % ]
83.8¢/ $1
WAGE / INCOME GAP [ $ ]
0.42
INEQUALITY / GINI INDEX
20,217
LABOR FORCE [ PEOPLE ]
65.0%
PERCENT IN LABOR FORCE
5.1%
UNEMPLOYMENT RATE
Dare County Area Codes
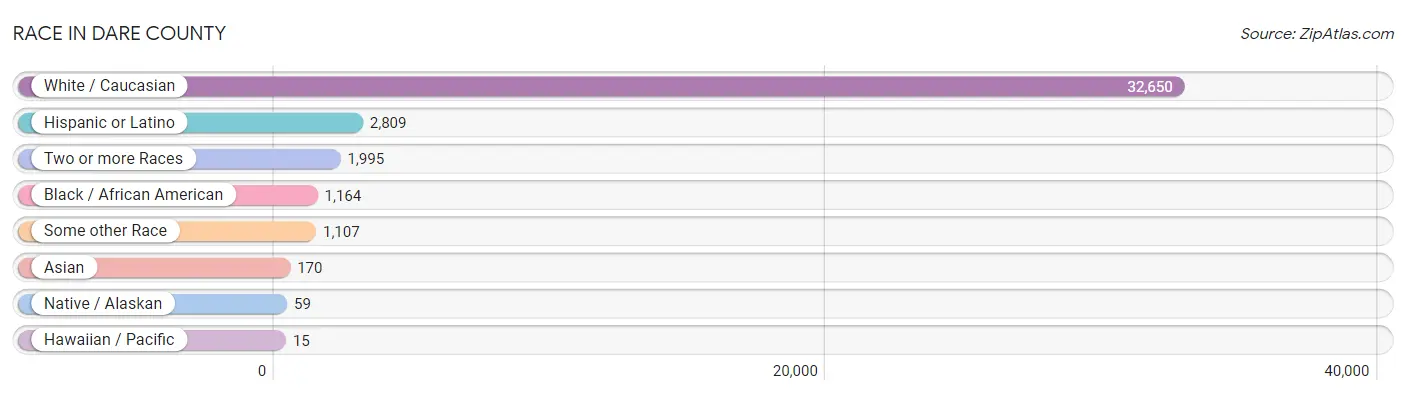
Race in Dare County
The most populous races in Dare County are White / Caucasian (32,650 | 87.9%), Hispanic or Latino (2,809 | 7.6%), and Two or more Races (1,995 | 5.4%).
| Race | # Population | % Population |
| Asian | 170 | 0.5% |
| Black / African American | 1,164 | 3.1% |
| Hawaiian / Pacific | 15 | 0.0% |
| Hispanic or Latino | 2,809 | 7.6% |
| Native / Alaskan | 59 | 0.2% |
| White / Caucasian | 32,650 | 87.9% |
| Two or more Races | 1,995 | 5.4% |
| Some other Race | 1,107 | 3.0% |
| Total | 37,160 | 100.0% |
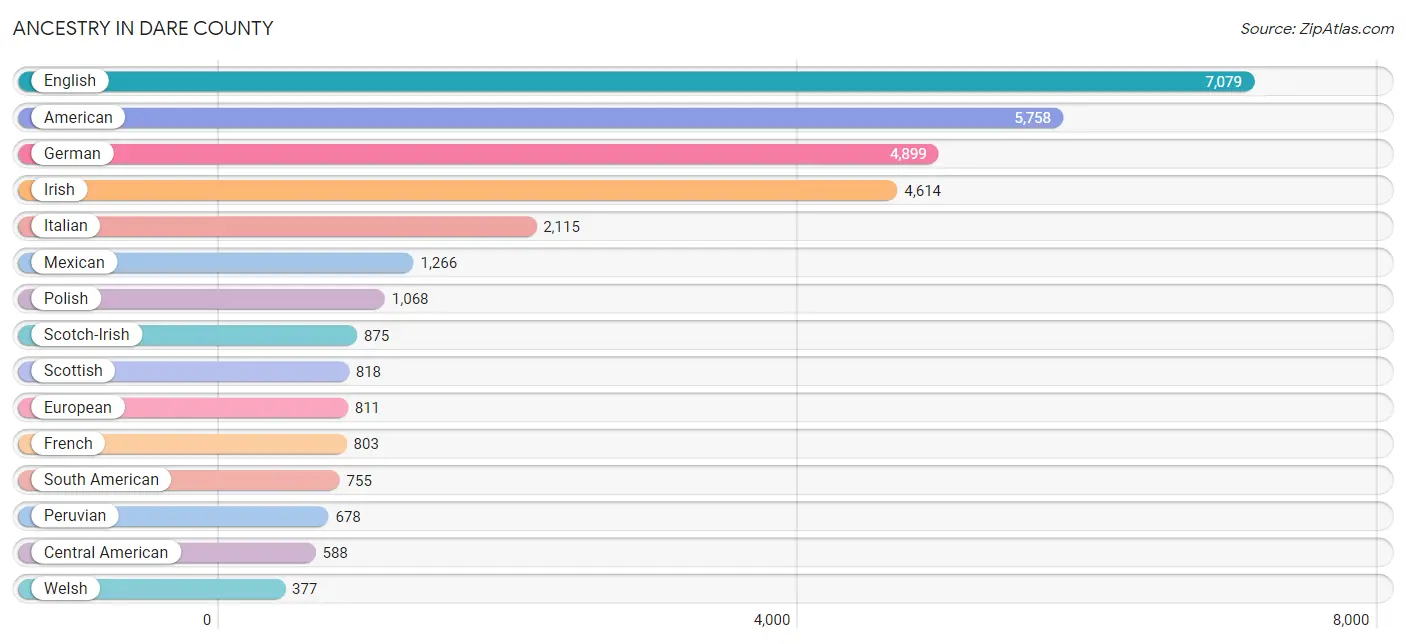
Ancestry in Dare County
The most populous ancestries reported in Dare County are English (7,079 | 19.1%), American (5,758 | 15.5%), German (4,899 | 13.2%), Irish (4,614 | 12.4%), and Italian (2,115 | 5.7%), together accounting for 65.8% of all Dare County residents.
| Ancestry | # Population | % Population |
| African | 26 | 0.1% |
| American | 5,758 | 15.5% |
| Arab | 200 | 0.5% |
| Argentinean | 9 | 0.0% |
| Australian | 9 | 0.0% |
| Austrian | 28 | 0.1% |
| Belgian | 17 | 0.1% |
| Bhutanese | 30 | 0.1% |
| Brazilian | 12 | 0.0% |
| British | 222 | 0.6% |
| Burmese | 3 | 0.0% |
| Canadian | 40 | 0.1% |
| Celtic | 19 | 0.1% |
| Central American | 588 | 1.6% |
| Central American Indian | 64 | 0.2% |
| Cherokee | 94 | 0.3% |
| Chinese | 2 | 0.0% |
| Colombian | 48 | 0.1% |
| Costa Rican | 10 | 0.0% |
| Croatian | 196 | 0.5% |
| Cuban | 28 | 0.1% |
| Czech | 51 | 0.1% |
| Czechoslovakian | 19 | 0.1% |
| Danish | 143 | 0.4% |
| Dominican | 4 | 0.0% |
| Dutch | 238 | 0.6% |
| Eastern European | 78 | 0.2% |
| Egyptian | 1 | 0.0% |
| English | 7,079 | 19.1% |
| European | 811 | 2.2% |
| Finnish | 22 | 0.1% |
| French | 803 | 2.2% |
| French Canadian | 236 | 0.6% |
| German | 4,899 | 13.2% |
| Greek | 57 | 0.2% |
| Guatemalan | 180 | 0.5% |
| Honduran | 250 | 0.7% |
| Hungarian | 91 | 0.2% |
| Indian (Asian) | 98 | 0.3% |
| Irish | 4,614 | 12.4% |
| Italian | 2,115 | 5.7% |
| Kenyan | 19 | 0.1% |
| Korean | 197 | 0.5% |
| Lebanese | 176 | 0.5% |
| Lithuanian | 58 | 0.2% |
| Mexican | 1,266 | 3.4% |
| Mongolian | 23 | 0.1% |
| Native Hawaiian | 35 | 0.1% |
| Navajo | 1 | 0.0% |
| Nicaraguan | 111 | 0.3% |
| Northern European | 10 | 0.0% |
| Norwegian | 134 | 0.4% |
| Panamanian | 37 | 0.1% |
| Pennsylvania German | 7 | 0.0% |
| Peruvian | 678 | 1.8% |
| Polish | 1,068 | 2.9% |
| Portuguese | 109 | 0.3% |
| Puerto Rican | 162 | 0.4% |
| Romanian | 5 | 0.0% |
| Russian | 58 | 0.2% |
| Scandinavian | 37 | 0.1% |
| Scotch-Irish | 875 | 2.4% |
| Scottish | 818 | 2.2% |
| Serbian | 8 | 0.0% |
| Sioux | 11 | 0.0% |
| Slovak | 69 | 0.2% |
| Slovene | 41 | 0.1% |
| South American | 755 | 2.0% |
| Spanish | 2 | 0.0% |
| Sri Lankan | 20 | 0.1% |
| Subsaharan African | 55 | 0.2% |
| Swedish | 290 | 0.8% |
| Swiss | 113 | 0.3% |
| Syrian | 16 | 0.0% |
| Thai | 7 | 0.0% |
| Ukrainian | 162 | 0.4% |
| Welsh | 377 | 1.0% | View All 77 Rows |
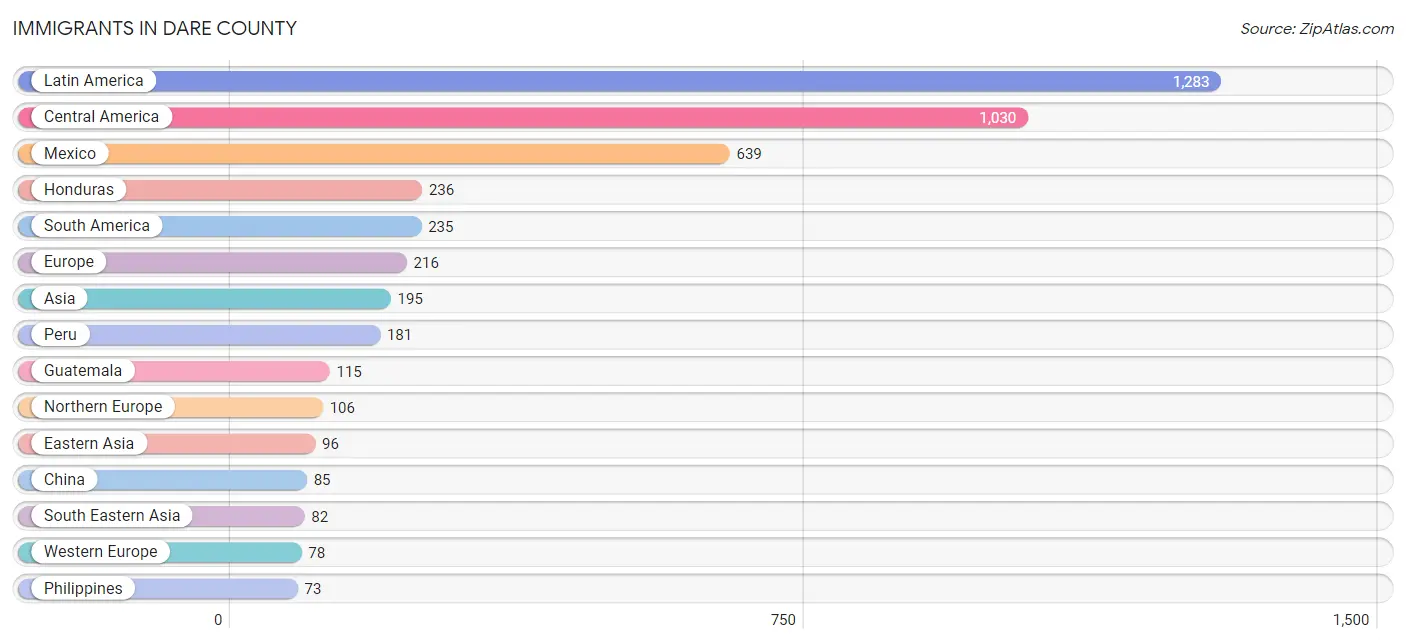
Immigrants in Dare County
The most numerous immigrant groups reported in Dare County came from Latin America (1,283 | 3.5%), Central America (1,030 | 2.8%), Mexico (639 | 1.7%), Honduras (236 | 0.6%), and South America (235 | 0.6%), together accounting for 9.2% of all Dare County residents.
| Immigration Origin | # Population | % Population |
| Africa | 1 | 0.0% |
| Asia | 195 | 0.5% |
| Australia | 2 | 0.0% |
| Azores | 15 | 0.0% |
| Belgium | 8 | 0.0% |
| Brazil | 24 | 0.1% |
| Canada | 42 | 0.1% |
| Caribbean | 18 | 0.1% |
| Central America | 1,030 | 2.8% |
| China | 85 | 0.2% |
| Colombia | 30 | 0.1% |
| Cuba | 15 | 0.0% |
| Czechoslovakia | 3 | 0.0% |
| Dominican Republic | 3 | 0.0% |
| Eastern Asia | 96 | 0.3% |
| Eastern Europe | 16 | 0.0% |
| Egypt | 1 | 0.0% |
| England | 72 | 0.2% |
| Europe | 216 | 0.6% |
| Germany | 67 | 0.2% |
| Guatemala | 115 | 0.3% |
| Honduras | 236 | 0.6% |
| Indonesia | 2 | 0.0% |
| Italy | 1 | 0.0% |
| Japan | 8 | 0.0% |
| Korea | 3 | 0.0% |
| Latin America | 1,283 | 3.5% |
| Mexico | 639 | 1.7% |
| Nicaragua | 40 | 0.1% |
| Northern Africa | 1 | 0.0% |
| Northern Europe | 106 | 0.3% |
| Oceania | 2 | 0.0% |
| Peru | 181 | 0.5% |
| Philippines | 73 | 0.2% |
| Portugal | 15 | 0.0% |
| Russia | 13 | 0.0% |
| Scotland | 3 | 0.0% |
| South America | 235 | 0.6% |
| South Eastern Asia | 82 | 0.2% |
| Southern Europe | 16 | 0.0% |
| Sweden | 9 | 0.0% |
| Switzerland | 3 | 0.0% |
| Vietnam | 7 | 0.0% |
| Western Asia | 17 | 0.1% |
| Western Europe | 78 | 0.2% | View All 45 Rows |
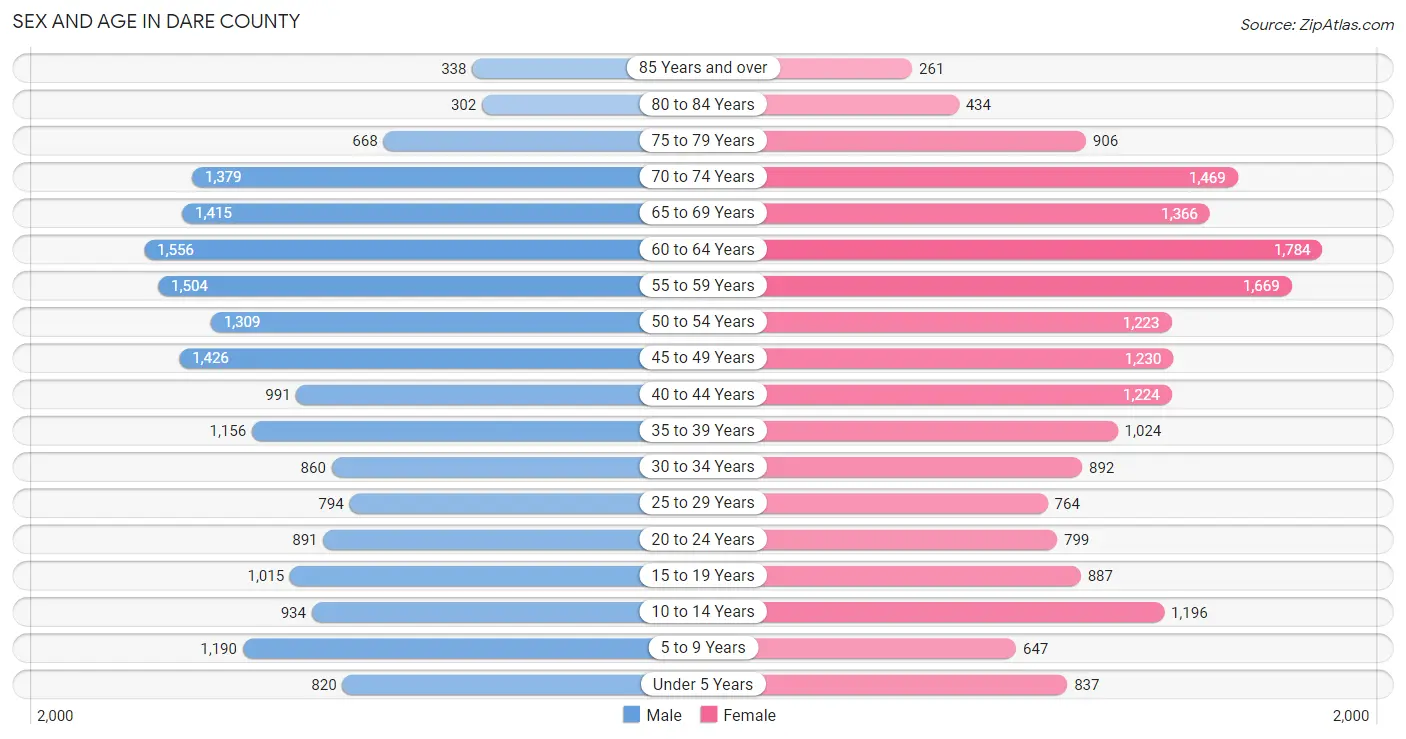
Sex and Age in Dare County
Sex and Age in Dare County
The most populous age groups in Dare County are 60 to 64 Years (1,556 | 8.4%) for men and 60 to 64 Years (1,784 | 9.6%) for women.
| Age Bracket | Male | Female |
| Under 5 Years | 820 (4.4%) | 837 (4.5%) |
| 5 to 9 Years | 1,190 (6.4%) | 647 (3.5%) |
| 10 to 14 Years | 934 (5.0%) | 1,196 (6.4%) |
| 15 to 19 Years | 1,015 (5.5%) | 887 (4.8%) |
| 20 to 24 Years | 891 (4.8%) | 799 (4.3%) |
| 25 to 29 Years | 794 (4.3%) | 764 (4.1%) |
| 30 to 34 Years | 860 (4.6%) | 892 (4.8%) |
| 35 to 39 Years | 1,156 (6.2%) | 1,024 (5.5%) |
| 40 to 44 Years | 991 (5.3%) | 1,224 (6.6%) |
| 45 to 49 Years | 1,426 (7.7%) | 1,230 (6.6%) |
| 50 to 54 Years | 1,309 (7.1%) | 1,223 (6.6%) |
| 55 to 59 Years | 1,504 (8.1%) | 1,669 (9.0%) |
| 60 to 64 Years | 1,556 (8.4%) | 1,784 (9.6%) |
| 65 to 69 Years | 1,415 (7.6%) | 1,366 (7.3%) |
| 70 to 74 Years | 1,379 (7.4%) | 1,469 (7.9%) |
| 75 to 79 Years | 668 (3.6%) | 906 (4.9%) |
| 80 to 84 Years | 302 (1.6%) | 434 (2.3%) |
| 85 Years and over | 338 (1.8%) | 261 (1.4%) |
| Total | 18,548 (100.0%) | 18,612 (100.0%) |
Families and Households in Dare County
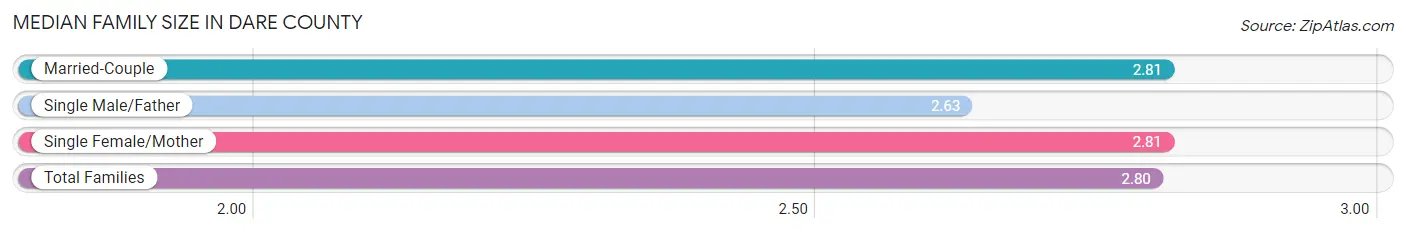
Median Family Size in Dare County
The median family size in Dare County is 2.80 persons per family, with married-couple families (8,250 | 80.1%) accounting for the largest median family size of 2.81 persons per family. On the other hand, single male/father families (454 | 4.4%) represent the smallest median family size with 2.63 persons per family.
| Family Type | # Families | Family Size |
| Married-Couple | 8,250 (80.1%) | 2.81 |
| Single Male/Father | 454 (4.4%) | 2.63 |
| Single Female/Mother | 1,592 (15.5%) | 2.81 |
| Total Families | 10,296 (100.0%) | 2.80 |
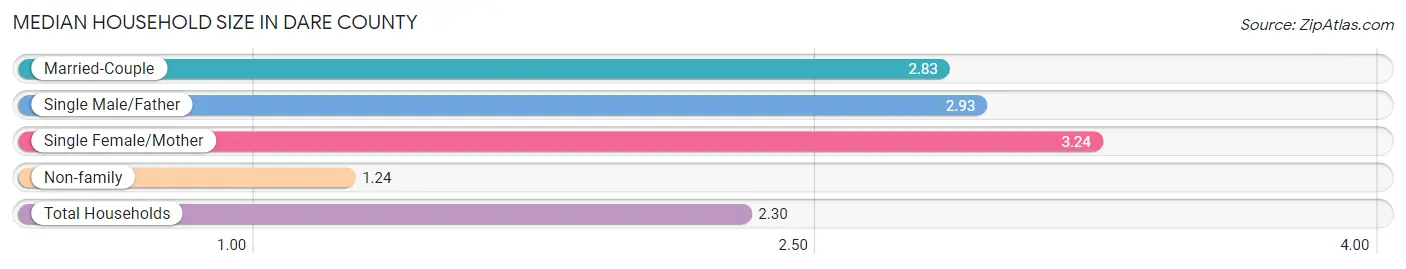
Median Household Size in Dare County
The median household size in Dare County is 2.30 persons per household, with single female/mother households (1,592 | 9.9%) accounting for the largest median household size of 3.24 persons per household. non-family households (5,785 | 36.0%) represent the smallest median household size with 1.24 persons per household.
| Household Type | # Households | Household Size |
| Married-Couple | 8,250 (51.3%) | 2.83 |
| Single Male/Father | 454 (2.8%) | 2.93 |
| Single Female/Mother | 1,592 (9.9%) | 3.24 |
| Non-family | 5,785 (36.0%) | 1.24 |
| Total Households | 16,081 (100.0%) | 2.30 |
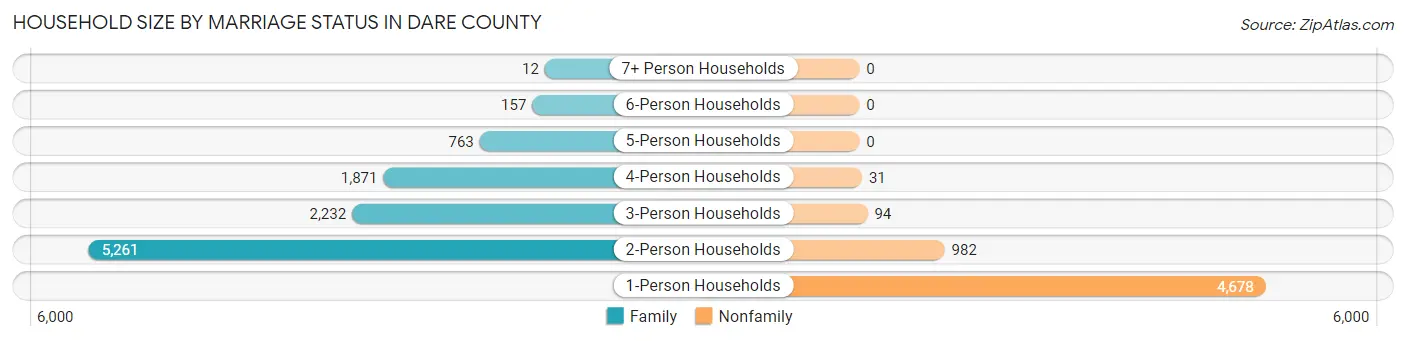
Household Size by Marriage Status in Dare County
Out of a total of 16,081 households in Dare County, 10,296 (64.0%) are family households, while 5,785 (36.0%) are nonfamily households. The most numerous type of family households are 2-person households, comprising 5,261, and the most common type of nonfamily households are 1-person households, comprising 4,678.
| Household Size | Family Households | Nonfamily Households |
| 1-Person Households | - | 4,678 (29.1%) |
| 2-Person Households | 5,261 (32.7%) | 982 (6.1%) |
| 3-Person Households | 2,232 (13.9%) | 94 (0.6%) |
| 4-Person Households | 1,871 (11.6%) | 31 (0.2%) |
| 5-Person Households | 763 (4.7%) | 0 (0.0%) |
| 6-Person Households | 157 (1.0%) | 0 (0.0%) |
| 7+ Person Households | 12 (0.1%) | 0 (0.0%) |
| Total | 10,296 (64.0%) | 5,785 (36.0%) |
Female Fertility in Dare County
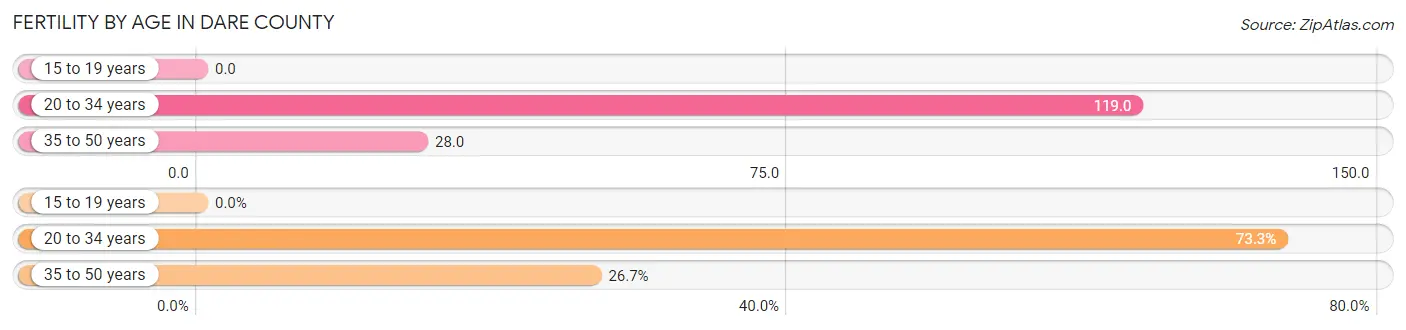
Fertility by Age in Dare County
Average fertility rate in Dare County is 56.0 births per 1,000 women. Women in the age bracket of 20 to 34 years have the highest fertility rate with 119.0 births per 1,000 women. Women in the age bracket of 20 to 34 years acount for 73.3% of all women with births.
| Age Bracket | Women with Births | Births / 1,000 Women |
| 15 to 19 years | 0 (0.0%) | 0.0 |
| 20 to 34 years | 291 (73.3%) | 119.0 |
| 35 to 50 years | 106 (26.7%) | 28.0 |
| Total | 397 (100.0%) | 56.0 |
Fertility by Age by Marriage Status in Dare County
75.6% of women with births (397) in Dare County are married. The highest percentage of unmarried women with births falls into 20 to 34 years age bracket with 25.8% of them unmarried at the time of birth, while the lowest percentage of unmarried women with births belong to 35 to 50 years age bracket with 20.8% of them unmarried.
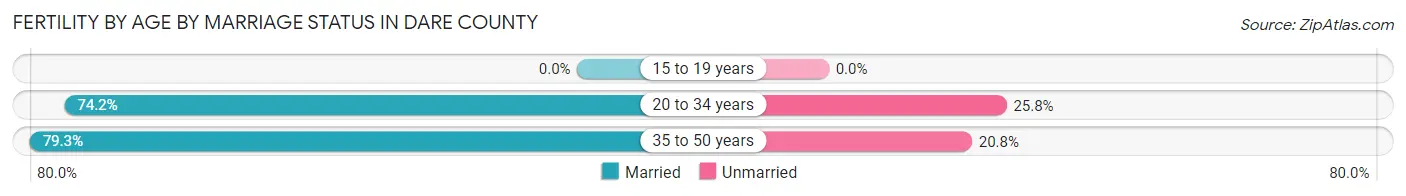
| Age Bracket | Married | Unmarried |
| 15 to 19 years | 0 (0.0%) | 0 (0.0%) |
| 20 to 34 years | 216 (74.2%) | 75 (25.8%) |
| 35 to 50 years | 84 (79.2%) | 22 (20.7%) |
| Total | 300 (75.6%) | 97 (24.4%) |
Fertility by Education in Dare County
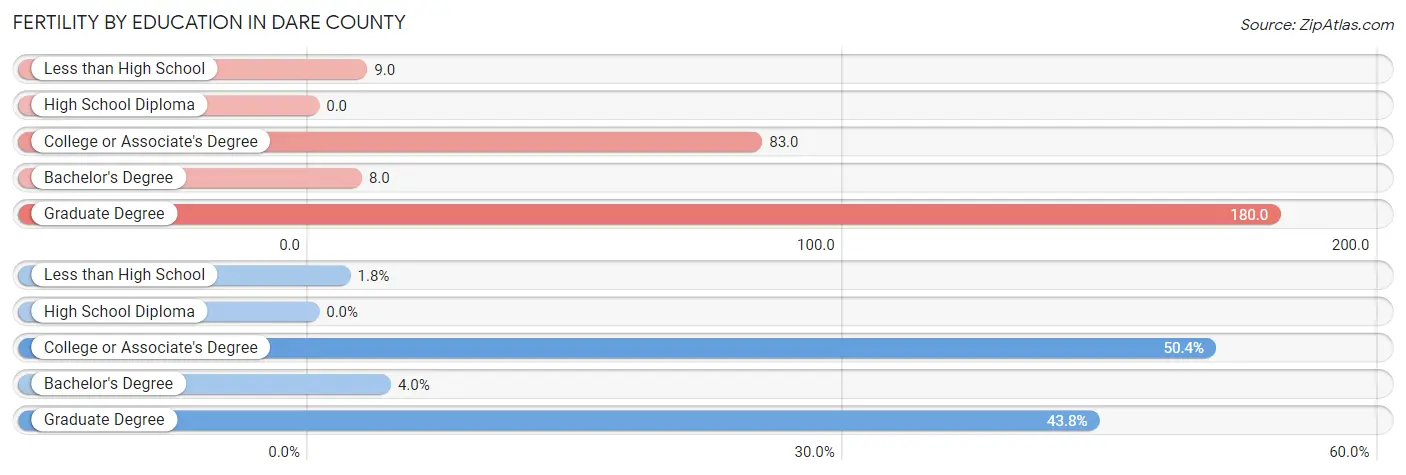
| Educational Attainment | Women with Births | Births / 1,000 Women |
| Less than High School | 7 (1.8%) | 9.0 |
| High School Diploma | 0 (0.0%) | 0.0 |
| College or Associate's Degree | 200 (50.4%) | 83.0 |
| Bachelor's Degree | 16 (4.0%) | 8.0 |
| Graduate Degree | 174 (43.8%) | 180.0 |
| Total | 397 (100.0%) | 56.0 |
Fertility by Education by Marriage Status in Dare County
24.4% of women with births in Dare County are unmarried. Women with the educational attainment of bachelor's degree are most likely to be married with 100.0% of them married at childbirth, while women with the educational attainment of less than high school are least likely to be married with 100.0% of them unmarried at childbirth.
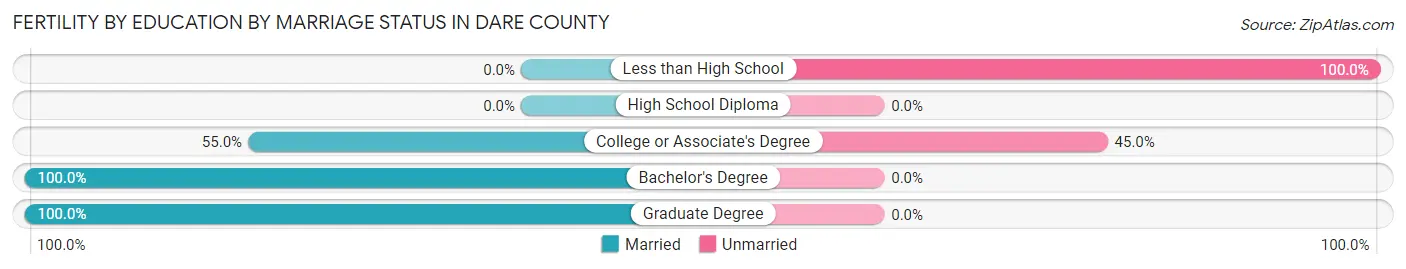
| Educational Attainment | Married | Unmarried |
| Less than High School | 0 (0.0%) | 7 (100.0%) |
| High School Diploma | 0 (0.0%) | 0 (0.0%) |
| College or Associate's Degree | 110 (55.0%) | 90 (45.0%) |
| Bachelor's Degree | 16 (100.0%) | 0 (0.0%) |
| Graduate Degree | 174 (100.0%) | 0 (0.0%) |
| Total | 300 (75.6%) | 97 (24.4%) |
Income in Dare County
Income Overview in Dare County
Per Capita Income in Dare County is $45,669, while median incomes of families and households are $101,908 and $79,742 respectively.
| Characteristic | Number | Measure |
| Per Capita Income | 37,160 | $45,669 |
| Median Family Income | 10,296 | $101,908 |
| Mean Family Income | 10,296 | $124,370 |
| Median Household Income | 16,081 | $79,742 |
| Mean Household Income | 16,081 | $104,954 |
| Income Deficit | 10,296 | $0 |
| Wage / Income Gap (%) | 37,160 | 16.19% |
| Wage / Income Gap ($) | 37,160 | 83.81¢ per $1 |
| Gini / Inequality Index | 37,160 | 0.42 |
Earnings by Sex in Dare County
Average Earnings in Dare County are $38,484, $41,631 for men and $34,891 for women, a difference of 16.2%.
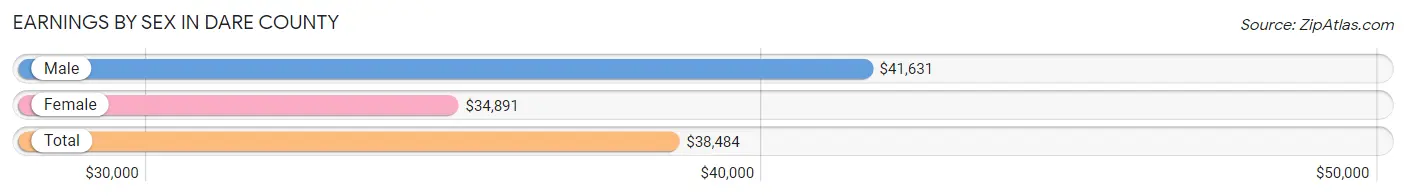
| Sex | Number | Average Earnings |
| Male | 11,025 (51.3%) | $41,631 |
| Female | 10,482 (48.7%) | $34,891 |
| Total | 21,507 (100.0%) | $38,484 |
Earnings by Sex by Income Bracket in Dare County
The most common earnings brackets in Dare County are $100,000+ for men (1,724 | 15.6%) and $25,000 to $29,999 for women (804 | 7.7%).
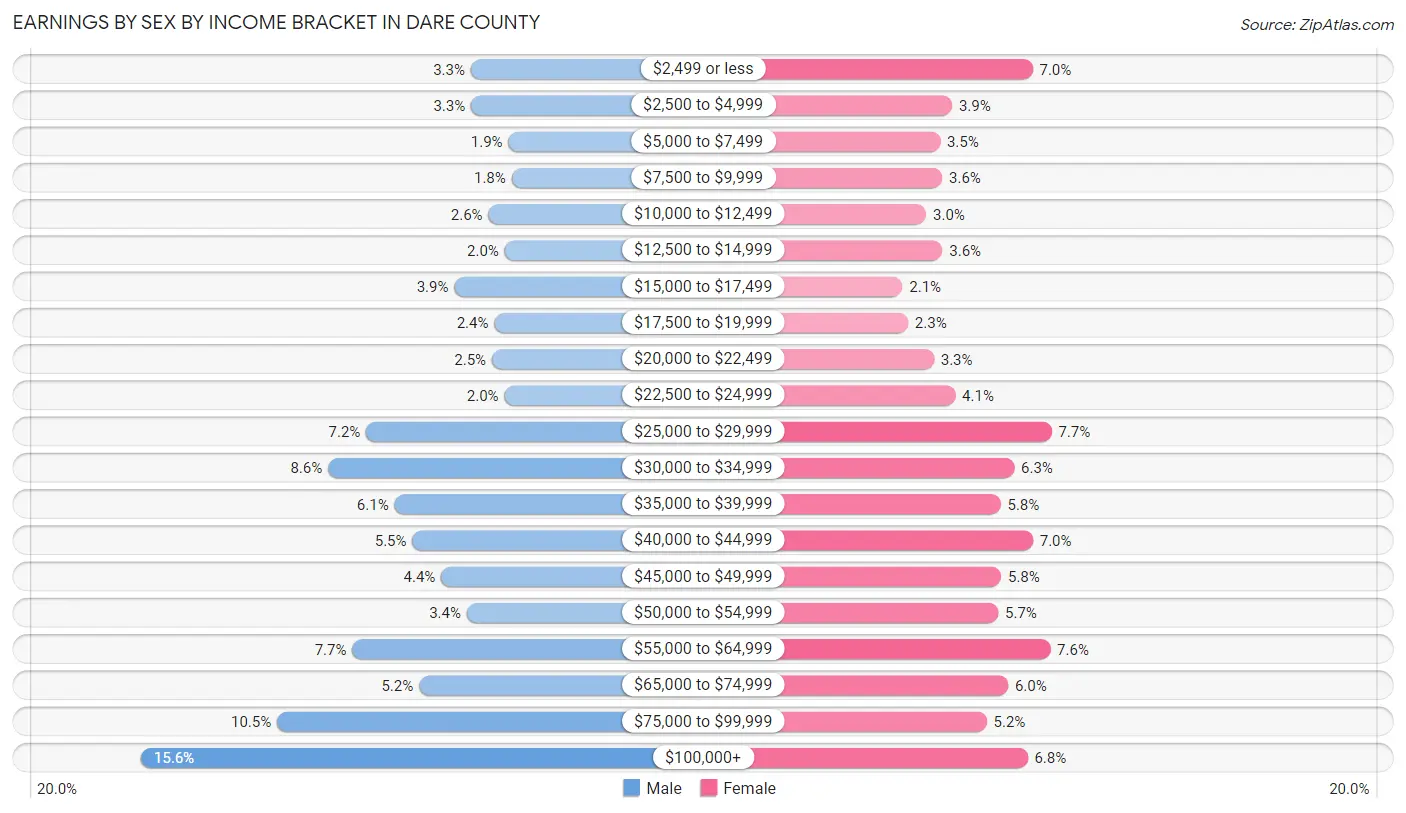
| Income | Male | Female |
| $2,499 or less | 362 (3.3%) | 730 (7.0%) |
| $2,500 to $4,999 | 360 (3.3%) | 413 (3.9%) |
| $5,000 to $7,499 | 206 (1.9%) | 366 (3.5%) |
| $7,500 to $9,999 | 193 (1.8%) | 374 (3.6%) |
| $10,000 to $12,499 | 289 (2.6%) | 311 (3.0%) |
| $12,500 to $14,999 | 222 (2.0%) | 375 (3.6%) |
| $15,000 to $17,499 | 430 (3.9%) | 218 (2.1%) |
| $17,500 to $19,999 | 265 (2.4%) | 240 (2.3%) |
| $20,000 to $22,499 | 275 (2.5%) | 342 (3.3%) |
| $22,500 to $24,999 | 223 (2.0%) | 426 (4.1%) |
| $25,000 to $29,999 | 794 (7.2%) | 804 (7.7%) |
| $30,000 to $34,999 | 951 (8.6%) | 657 (6.3%) |
| $35,000 to $39,999 | 677 (6.1%) | 604 (5.8%) |
| $40,000 to $44,999 | 603 (5.5%) | 731 (7.0%) |
| $45,000 to $49,999 | 484 (4.4%) | 606 (5.8%) |
| $50,000 to $54,999 | 378 (3.4%) | 594 (5.7%) |
| $55,000 to $64,999 | 851 (7.7%) | 799 (7.6%) |
| $65,000 to $74,999 | 576 (5.2%) | 633 (6.0%) |
| $75,000 to $99,999 | 1,162 (10.5%) | 549 (5.2%) |
| $100,000+ | 1,724 (15.6%) | 710 (6.8%) |
| Total | 11,025 (100.0%) | 10,482 (100.0%) |
Earnings by Sex by Educational Attainment in Dare County
Average earnings in Dare County are $47,040 for men and $39,520 for women, a difference of 16.0%. Men with an educational attainment of graduate degree enjoy the highest average annual earnings of $70,769, while those with less than high school education earn the least with $36,835. Women with an educational attainment of graduate degree earn the most with the average annual earnings of $53,466, while those with less than high school education have the smallest earnings of $26,059.
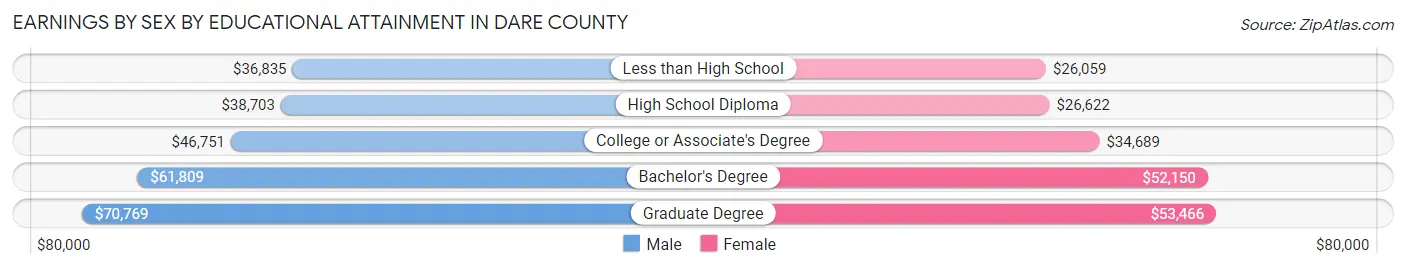
| Educational Attainment | Male Income | Female Income |
| Less than High School | $36,835 | $26,059 |
| High School Diploma | $38,703 | $26,622 |
| College or Associate's Degree | $46,751 | $34,689 |
| Bachelor's Degree | $61,809 | $52,150 |
| Graduate Degree | $70,769 | $53,466 |
| Total | $47,040 | $39,520 |
Family Income in Dare County
Family Income Brackets in Dare County
According to the Dare County family income data, there are 2,450 families falling into the $100,000 to $149,999 income range, which is the most common income bracket and makes up 23.8% of all families. Conversely, the less than $10,000 income bracket is the least frequent group with only 93 families (0.9%) belonging to this category.
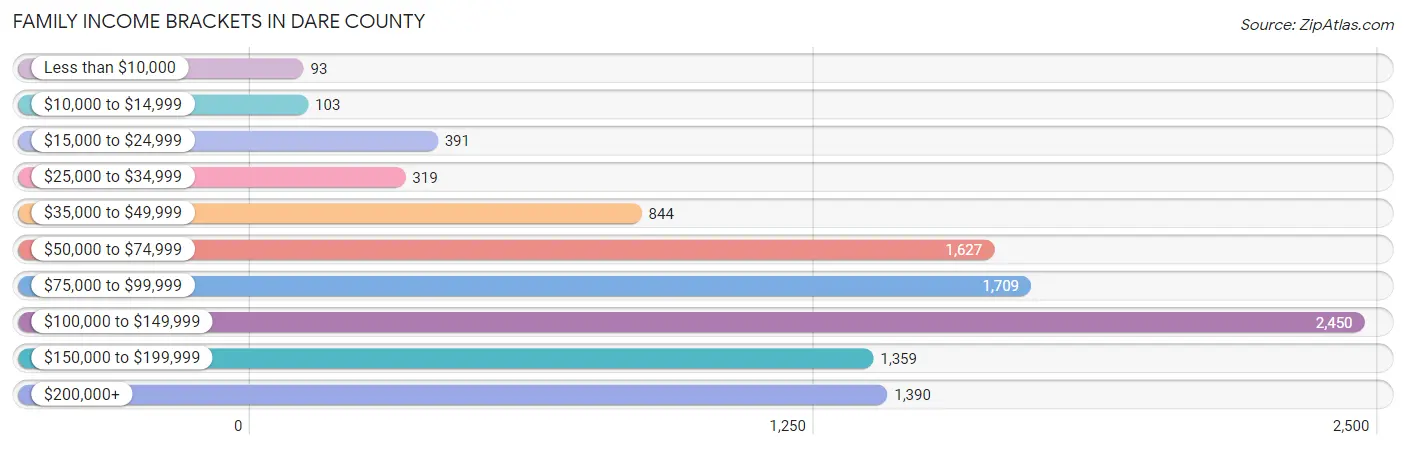
| Income Bracket | # Families | % Families |
| Less than $10,000 | 93 | 0.9% |
| $10,000 to $14,999 | 103 | 1.0% |
| $15,000 to $24,999 | 391 | 3.8% |
| $25,000 to $34,999 | 319 | 3.1% |
| $35,000 to $49,999 | 844 | 8.2% |
| $50,000 to $74,999 | 1,627 | 15.8% |
| $75,000 to $99,999 | 1,709 | 16.6% |
| $100,000 to $149,999 | 2,450 | 23.8% |
| $150,000 to $199,999 | 1,359 | 13.2% |
| $200,000+ | 1,390 | 13.5% |
Family Income by Famaliy Size in Dare County
6-person families (89 | 0.9%) account for the highest median family income in Dare County with $120,670 per family, while 2-person families (5,705 | 55.4%) have the highest median income of $48,852 per family member.
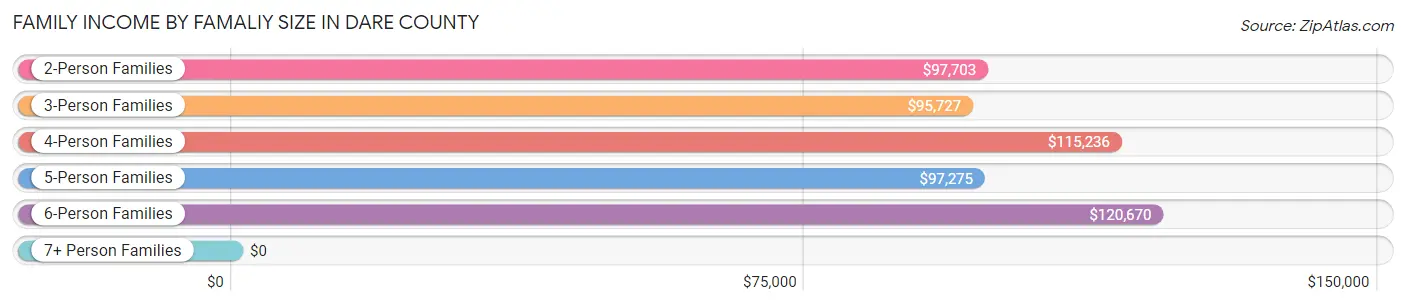
| Income Bracket | # Families | Median Income |
| 2-Person Families | 5,705 (55.4%) | $97,703 |
| 3-Person Families | 2,002 (19.4%) | $95,727 |
| 4-Person Families | 1,833 (17.8%) | $115,236 |
| 5-Person Families | 660 (6.4%) | $97,275 |
| 6-Person Families | 89 (0.9%) | $120,670 |
| 7+ Person Families | 7 (0.1%) | $0 |
| Total | 10,296 (100.0%) | $101,908 |
Family Income by Number of Earners in Dare County
The median family income in Dare County is $101,908, with families comprising 3+ earners (1,130) having the highest median family income of $137,500, while families with 1 earner (2,798) have the lowest median family income of $76,382, accounting for 11.0% and 27.2% of families, respectively.
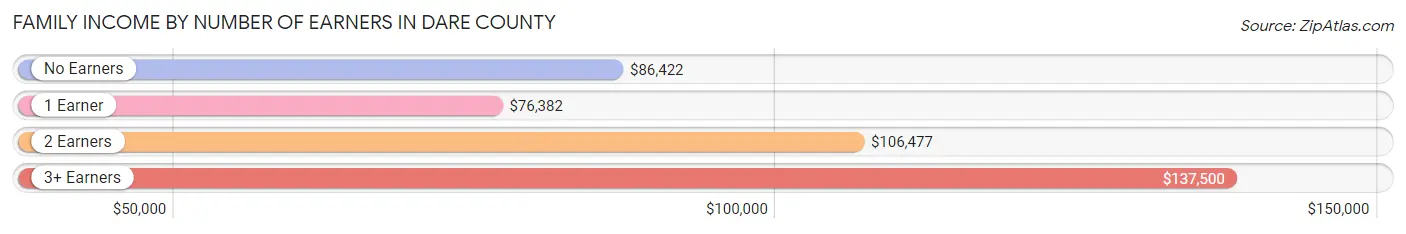
| Number of Earners | # Families | Median Income |
| No Earners | 1,820 (17.7%) | $86,422 |
| 1 Earner | 2,798 (27.2%) | $76,382 |
| 2 Earners | 4,548 (44.2%) | $106,477 |
| 3+ Earners | 1,130 (11.0%) | $137,500 |
| Total | 10,296 (100.0%) | $101,908 |
Household Income in Dare County
Household Income Brackets in Dare County
With 3,120 households falling in the category, the $50,000 to $74,999 income range is the most frequent in Dare County, accounting for 19.4% of all households. In contrast, only 306 households (1.9%) fall into the less than $10,000 income bracket, making it the least populous group.
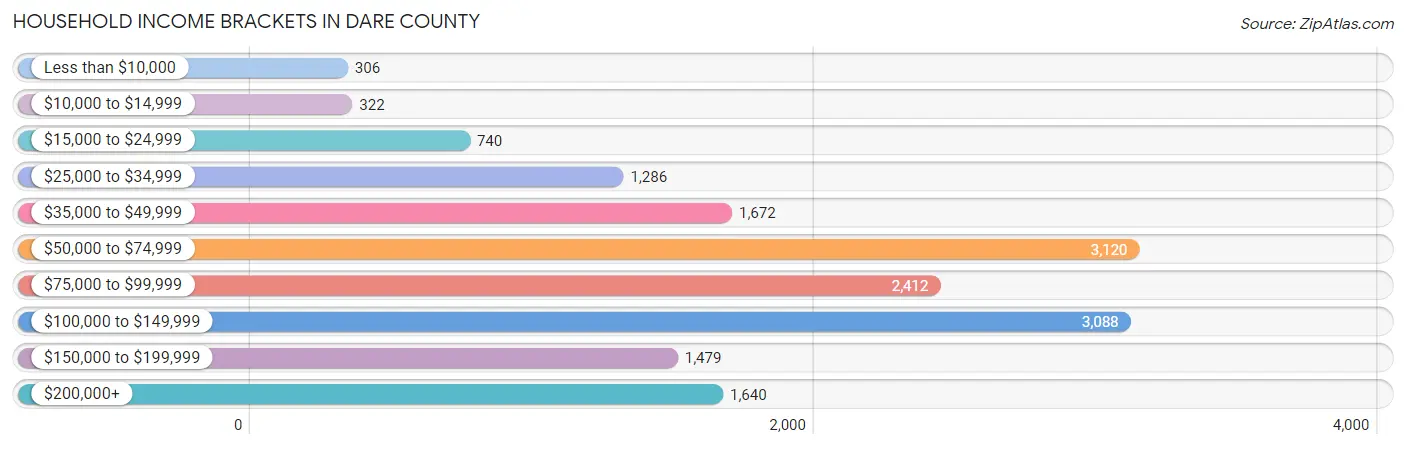
| Income Bracket | # Households | % Households |
| Less than $10,000 | 306 | 1.9% |
| $10,000 to $14,999 | 322 | 2.0% |
| $15,000 to $24,999 | 740 | 4.6% |
| $25,000 to $34,999 | 1,286 | 8.0% |
| $35,000 to $49,999 | 1,672 | 10.4% |
| $50,000 to $74,999 | 3,120 | 19.4% |
| $75,000 to $99,999 | 2,412 | 15.0% |
| $100,000 to $149,999 | 3,088 | 19.2% |
| $150,000 to $199,999 | 1,479 | 9.2% |
| $200,000+ | 1,640 | 10.2% |
Household Income by Householder Age in Dare County
The median household income in Dare County is $79,742, with the highest median household income of $96,027 found in the 45 to 64 years age bracket for the primary householder. A total of 6,629 households (41.2%) fall into this category. Meanwhile, the 15 to 24 years age bracket for the primary householder has the lowest median household income of $43,708, with 343 households (2.1%) in this group.
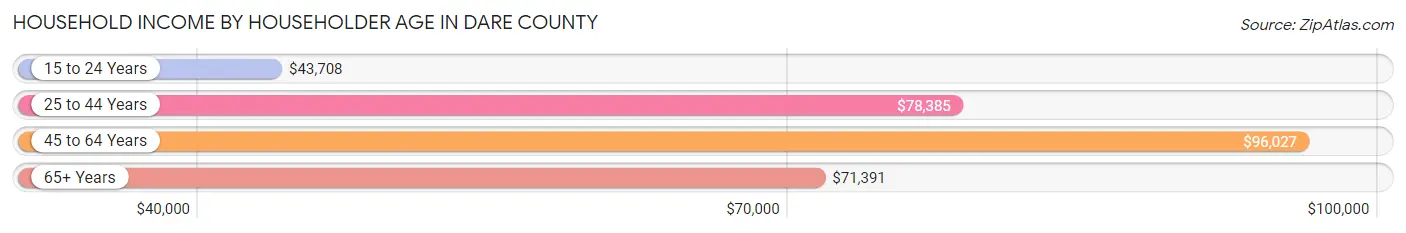
| Income Bracket | # Households | Median Income |
| 15 to 24 Years | 343 (2.1%) | $43,708 |
| 25 to 44 Years | 3,678 (22.9%) | $78,385 |
| 45 to 64 Years | 6,629 (41.2%) | $96,027 |
| 65+ Years | 5,431 (33.8%) | $71,391 |
| Total | 16,081 (100.0%) | $79,742 |
Poverty in Dare County
Income Below Poverty by Sex and Age in Dare County
With 7.5% poverty level for males and 5.5% for females among the residents of Dare County, 5 year old males and 18 to 24 year old females are the most vulnerable to poverty, with 41 males (18.9%) and 165 females (14.8%) in their respective age groups living below the poverty level.
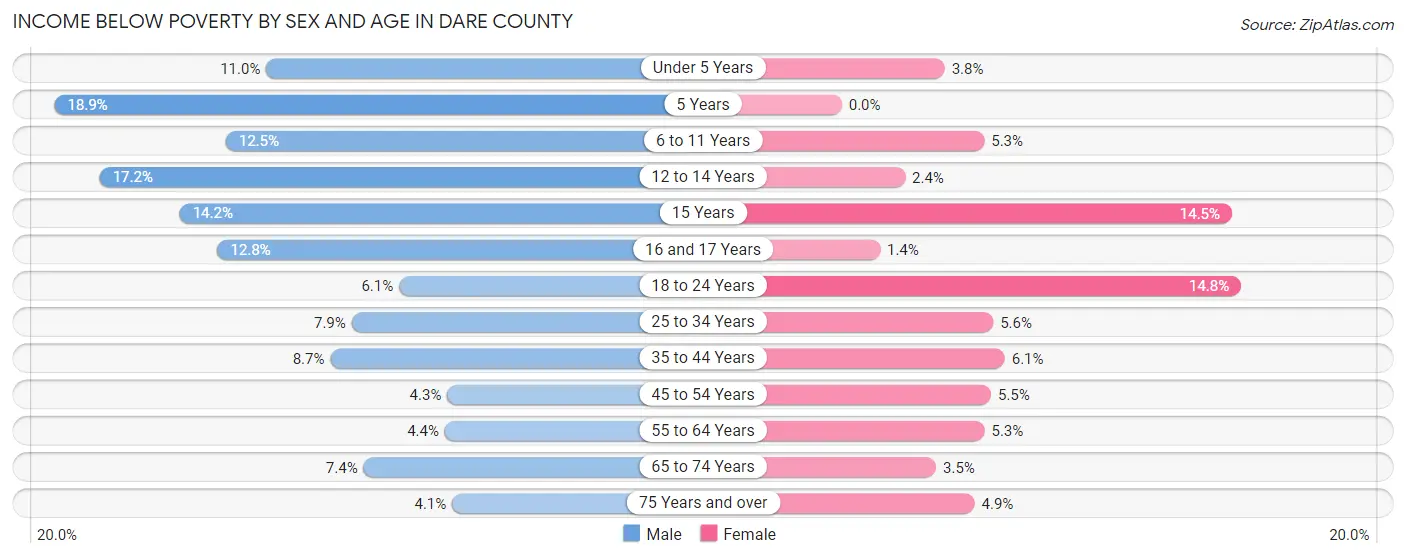
| Age Bracket | Male | Female |
| Under 5 Years | 90 (11.0%) | 32 (3.8%) |
| 5 Years | 41 (18.9%) | 0 (0.0%) |
| 6 to 11 Years | 162 (12.5%) | 46 (5.3%) |
| 12 to 14 Years | 105 (17.2%) | 19 (2.4%) |
| 15 Years | 41 (14.2%) | 21 (14.5%) |
| 16 and 17 Years | 47 (12.8%) | 6 (1.4%) |
| 18 to 24 Years | 74 (6.1%) | 165 (14.8%) |
| 25 to 34 Years | 129 (7.9%) | 93 (5.6%) |
| 35 to 44 Years | 185 (8.6%) | 136 (6.0%) |
| 45 to 54 Years | 118 (4.3%) | 136 (5.5%) |
| 55 to 64 Years | 134 (4.4%) | 183 (5.3%) |
| 65 to 74 Years | 204 (7.4%) | 99 (3.5%) |
| 75 Years and over | 54 (4.1%) | 78 (4.9%) |
| Total | 1,384 (7.5%) | 1,014 (5.5%) |
Income Above Poverty by Sex and Age in Dare County
According to the poverty statistics in Dare County, males aged 75 years and over and females aged 5 years are the age groups that are most secure financially, with 95.9% of males and 100.0% of females in these age groups living above the poverty line.
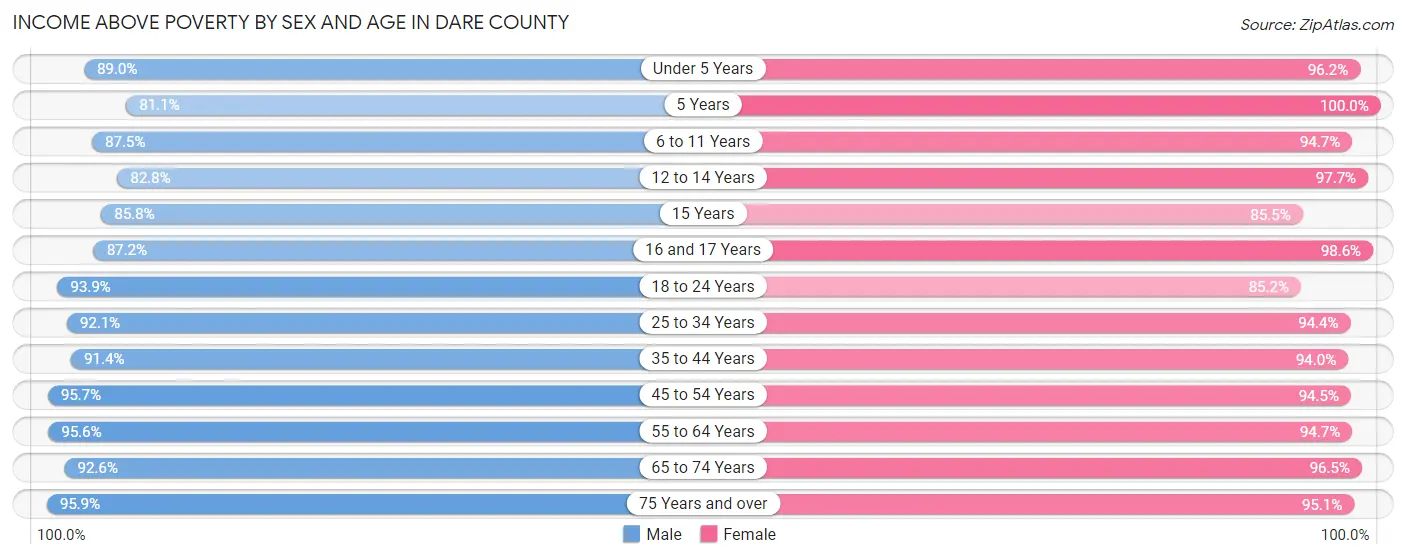
| Age Bracket | Male | Female |
| Under 5 Years | 726 (89.0%) | 805 (96.2%) |
| 5 Years | 176 (81.1%) | 156 (100.0%) |
| 6 to 11 Years | 1,131 (87.5%) | 823 (94.7%) |
| 12 to 14 Years | 505 (82.8%) | 788 (97.7%) |
| 15 Years | 247 (85.8%) | 124 (85.5%) |
| 16 and 17 Years | 319 (87.2%) | 418 (98.6%) |
| 18 to 24 Years | 1,140 (93.9%) | 948 (85.2%) |
| 25 to 34 Years | 1,512 (92.1%) | 1,563 (94.4%) |
| 35 to 44 Years | 1,954 (91.3%) | 2,112 (94.0%) |
| 45 to 54 Years | 2,617 (95.7%) | 2,317 (94.5%) |
| 55 to 64 Years | 2,908 (95.6%) | 3,270 (94.7%) |
| 65 to 74 Years | 2,546 (92.6%) | 2,726 (96.5%) |
| 75 Years and over | 1,254 (95.9%) | 1,503 (95.1%) |
| Total | 17,035 (92.5%) | 17,553 (94.5%) |
Income Below Poverty Among Married-Couple Families in Dare County
The poverty statistics for married-couple families in Dare County show that 1.5% or 122 of the total 8,250 families live below the poverty line. Families with 3 or 4 children have the highest poverty rate of 8.1%, comprising of 35 families. On the other hand, families with 5 or more children have the lowest poverty rate of 0.0%, which includes 0 families.
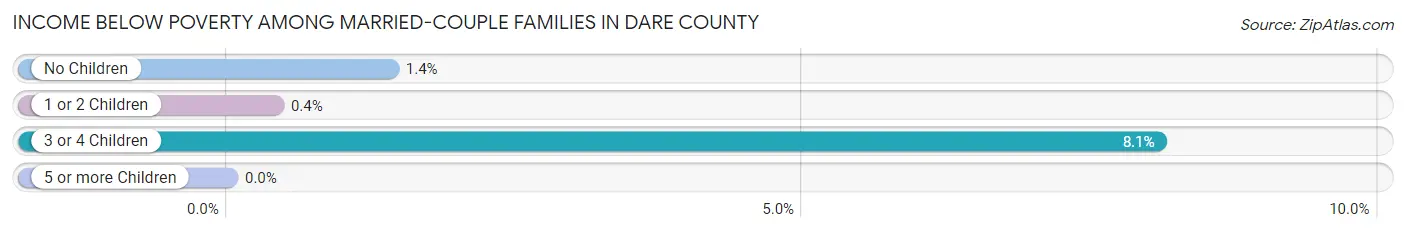
| Children | Above Poverty | Below Poverty |
| No Children | 5,482 (98.6%) | 78 (1.4%) |
| 1 or 2 Children | 2,241 (99.6%) | 9 (0.4%) |
| 3 or 4 Children | 398 (91.9%) | 35 (8.1%) |
| 5 or more Children | 7 (100.0%) | 0 (0.0%) |
| Total | 8,128 (98.5%) | 122 (1.5%) |
Income Below Poverty Among Single-Parent Households in Dare County
According to the poverty data in Dare County, 9.5% or 43 single-father households and 13.5% or 215 single-mother households are living below the poverty line. Among single-father households, those with 1 or 2 children have the highest poverty rate, with 43 households (19.6%) experiencing poverty. Likewise, among single-mother households, those with 3 or 4 children have the highest poverty rate, with 82 households (60.7%) falling below the poverty line.
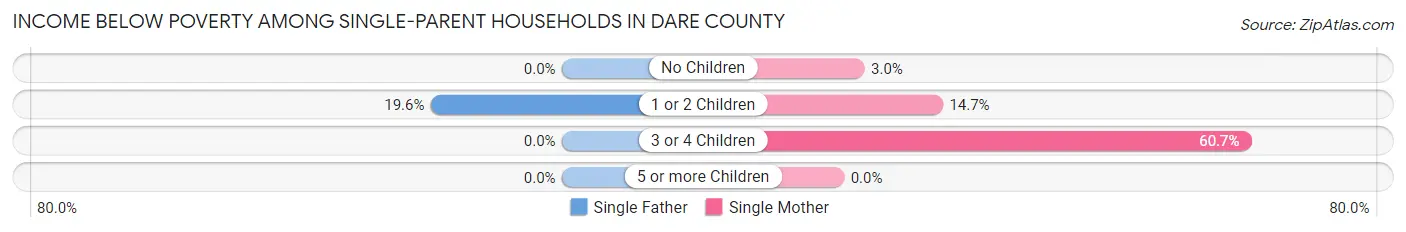
| Children | Single Father | Single Mother |
| No Children | 0 (0.0%) | 21 (3.0%) |
| 1 or 2 Children | 43 (19.6%) | 112 (14.7%) |
| 3 or 4 Children | 0 (0.0%) | 82 (60.7%) |
| 5 or more Children | 0 (0.0%) | 0 (0.0%) |
| Total | 43 (9.5%) | 215 (13.5%) |
Income Below Poverty Among Married-Couple vs Single-Parent Households in Dare County
The poverty data for Dare County shows that 122 of the married-couple family households (1.5%) and 258 of the single-parent households (12.6%) are living below the poverty level. Within the married-couple family households, those with 3 or 4 children have the highest poverty rate, with 35 households (8.1%) falling below the poverty line. Among the single-parent households, those with 3 or 4 children have the highest poverty rate, with 82 household (47.9%) living below poverty.
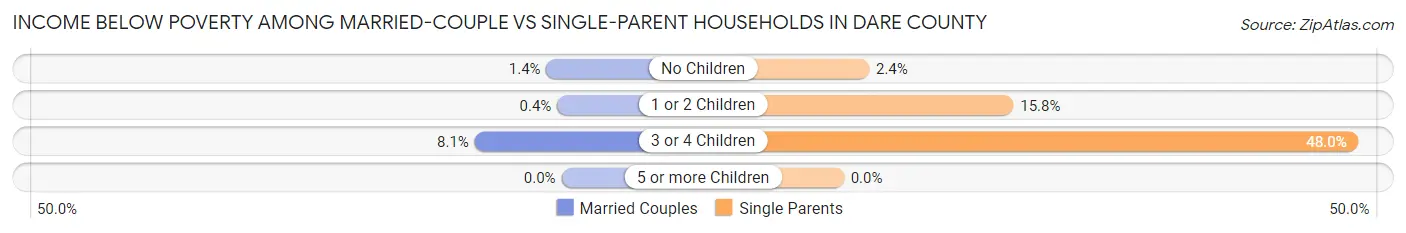
| Children | Married-Couple Families | Single-Parent Households |
| No Children | 78 (1.4%) | 21 (2.4%) |
| 1 or 2 Children | 9 (0.4%) | 155 (15.8%) |
| 3 or 4 Children | 35 (8.1%) | 82 (47.9%) |
| 5 or more Children | 0 (0.0%) | 0 (0.0%) |
| Total | 122 (1.5%) | 258 (12.6%) |
Employment Characteristics in Dare County
Employment by Class of Employer in Dare County
Among the 18,731 employed individuals in Dare County, private company employees (11,284 | 60.2%), self-employed (not incorporated) (1,984 | 10.6%), and self-employed (incorporated) (1,638 | 8.7%) make up the most common classes of employment.
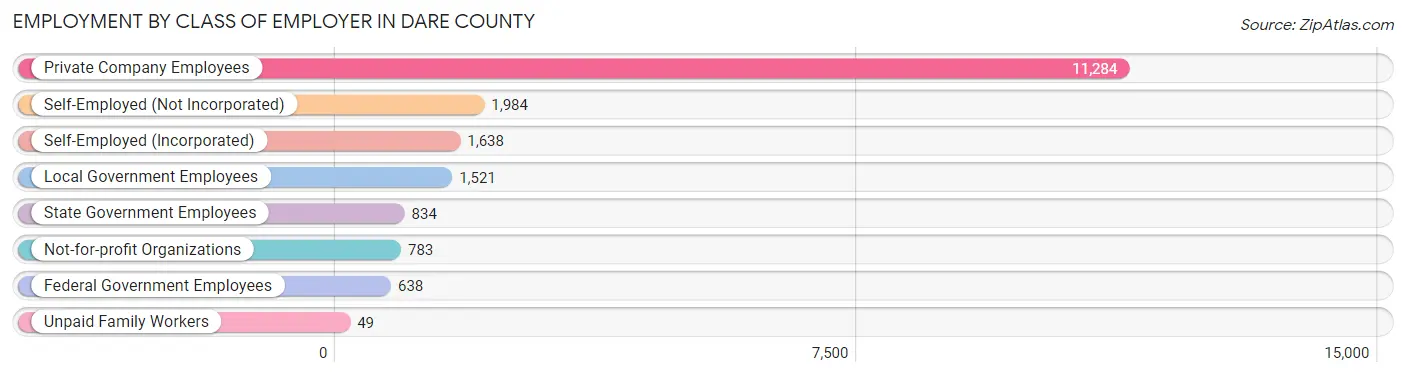
| Employer Class | # Employees | % Employees |
| Private Company Employees | 11,284 | 60.2% |
| Self-Employed (Incorporated) | 1,638 | 8.7% |
| Self-Employed (Not Incorporated) | 1,984 | 10.6% |
| Not-for-profit Organizations | 783 | 4.2% |
| Local Government Employees | 1,521 | 8.1% |
| State Government Employees | 834 | 4.4% |
| Federal Government Employees | 638 | 3.4% |
| Unpaid Family Workers | 49 | 0.3% |
| Total | 18,731 | 100.0% |
Employment Status by Age in Dare County
According to the labor force statistics for Dare County, out of the total population over 16 years of age (31,103), 65.0% or 20,217 individuals are in the labor force, with 5.1% or 1,031 of them unemployed. The age group with the highest labor force participation rate is 25 to 29 years, with 90.1% or 1,404 individuals in the labor force. Within the labor force, the 16 to 19 years age range has the highest percentage of unemployed individuals, with 21.9% or 182 of them being unemployed.
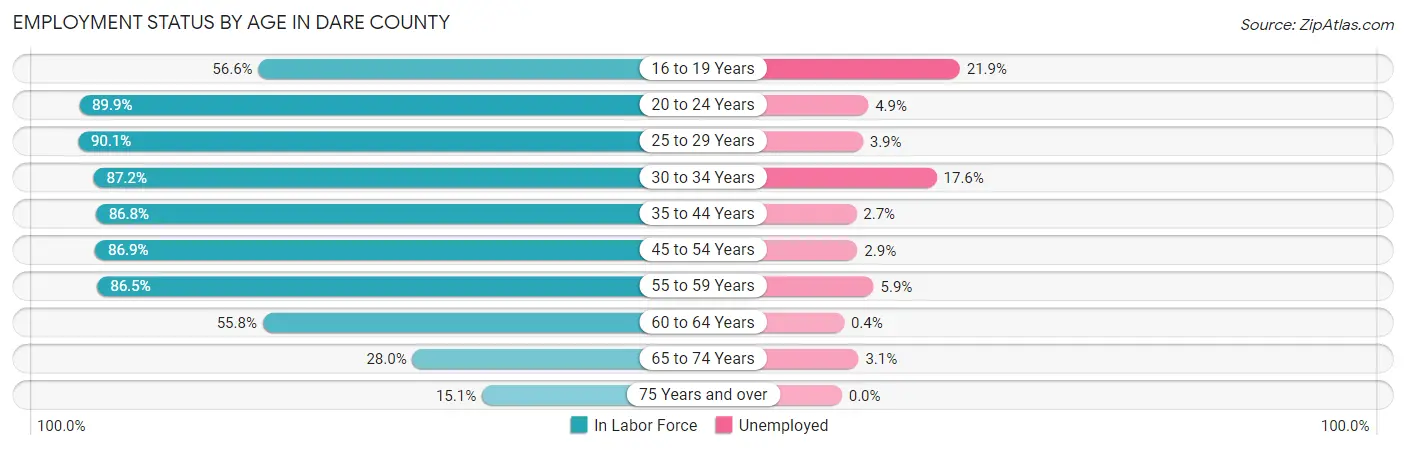
| Age Bracket | In Labor Force | Unemployed |
| 16 to 19 Years | 831 (56.6%) | 182 (21.9%) |
| 20 to 24 Years | 1,519 (89.9%) | 74 (4.9%) |
| 25 to 29 Years | 1,404 (90.1%) | 55 (3.9%) |
| 30 to 34 Years | 1,528 (87.2%) | 269 (17.6%) |
| 35 to 44 Years | 3,815 (86.8%) | 103 (2.7%) |
| 45 to 54 Years | 4,508 (86.9%) | 131 (2.9%) |
| 55 to 59 Years | 2,745 (86.5%) | 162 (5.9%) |
| 60 to 64 Years | 1,864 (55.8%) | 7 (0.4%) |
| 65 to 74 Years | 1,576 (28.0%) | 49 (3.1%) |
| 75 Years and over | 439 (15.1%) | 0 (0.0%) |
| Total | 20,217 (65.0%) | 1,031 (5.1%) |
Employment Status by Educational Attainment in Dare County
According to labor force statistics for Dare County, 81.7% of individuals (15,855) out of the total population between 25 and 64 years of age (19,406) are in the labor force, with 4.6% or 729 of them being unemployed. The group with the highest labor force participation rate are those with the educational attainment of bachelor's degree or higher, with 83.5% or 6,512 individuals in the labor force. Within the labor force, individuals with high school diploma education have the highest percentage of unemployment, with 5.7% or 206 of them being unemployed.

| Educational Attainment | In Labor Force | Unemployed |
| Less than High School | 505 (53.4%) | 25 (2.6%) |
| High School Diploma | 3,610 (83.2%) | 247 (5.7%) |
| College / Associate Degree | 5,235 (82.8%) | 322 (5.1%) |
| Bachelor's Degree or higher | 6,512 (83.5%) | 289 (3.7%) |
| Total | 15,855 (81.7%) | 893 (4.6%) |
Employment Occupations by Sex in Dare County
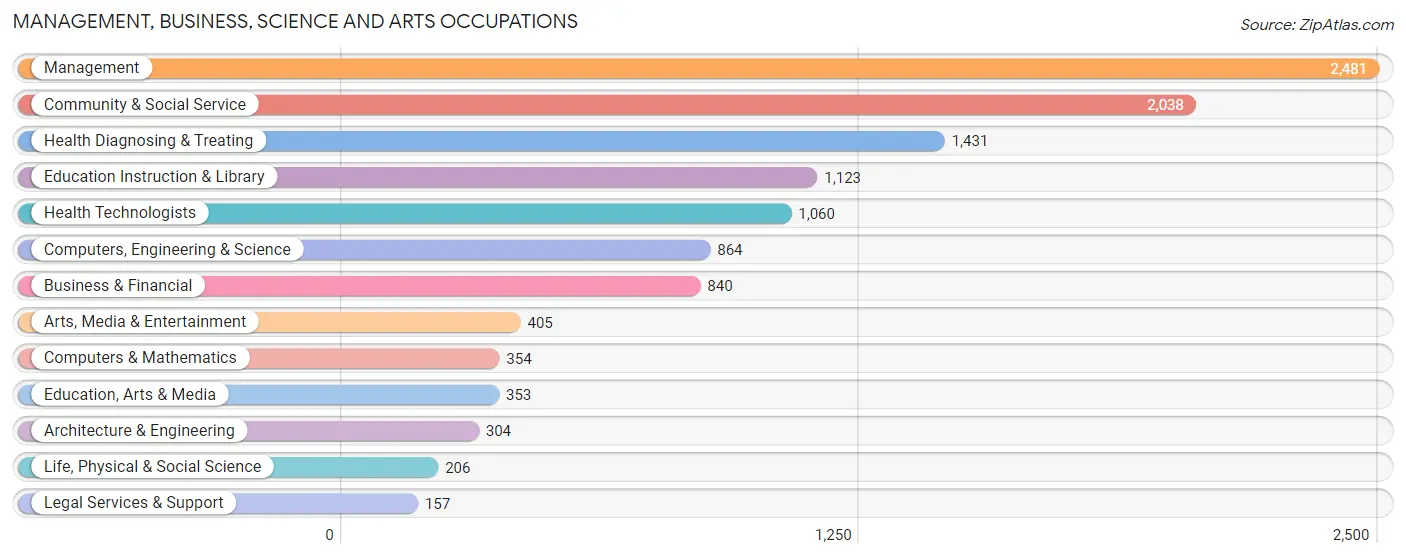
Management, Business, Science and Arts Occupations
The most common Management, Business, Science and Arts occupations in Dare County are Management (2,481 | 13.0%), Community & Social Service (2,038 | 10.7%), Health Diagnosing & Treating (1,431 | 7.5%), Education Instruction & Library (1,123 | 5.9%), and Health Technologists (1,060 | 5.6%).
Management, Business, Science and Arts Occupations by Sex
Within the Management, Business, Science and Arts occupations in Dare County, the most male-oriented occupations are Architecture & Engineering (96.7%), Computers, Engineering & Science (92.7%), and Computers & Mathematics (91.0%), while the most female-oriented occupations are Health Technologists (80.1%), Education Instruction & Library (77.9%), and Health Diagnosing & Treating (76.1%).
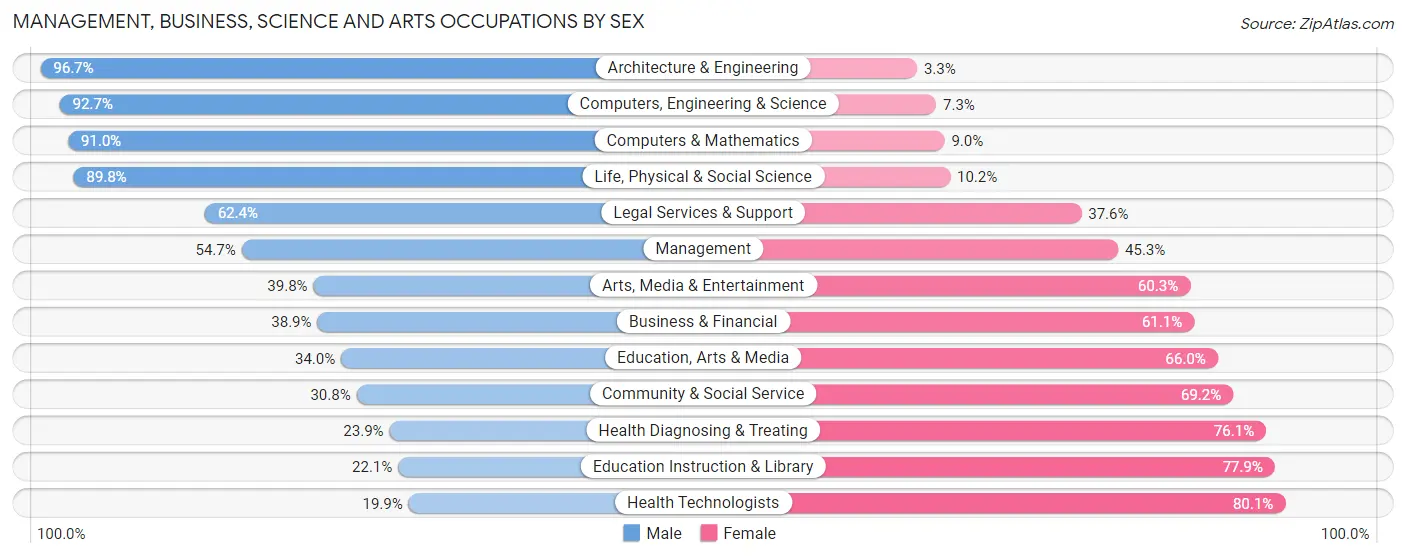
| Occupation | Male | Female |
| Management | 1,358 (54.7%) | 1,123 (45.3%) |
| Business & Financial | 327 (38.9%) | 513 (61.1%) |
| Computers, Engineering & Science | 801 (92.7%) | 63 (7.3%) |
| Computers & Mathematics | 322 (91.0%) | 32 (9.0%) |
| Architecture & Engineering | 294 (96.7%) | 10 (3.3%) |
| Life, Physical & Social Science | 185 (89.8%) | 21 (10.2%) |
| Community & Social Service | 627 (30.8%) | 1,411 (69.2%) |
| Education, Arts & Media | 120 (34.0%) | 233 (66.0%) |
| Legal Services & Support | 98 (62.4%) | 59 (37.6%) |
| Education Instruction & Library | 248 (22.1%) | 875 (77.9%) |
| Arts, Media & Entertainment | 161 (39.8%) | 244 (60.3%) |
| Health Diagnosing & Treating | 342 (23.9%) | 1,089 (76.1%) |
| Health Technologists | 211 (19.9%) | 849 (80.1%) |
| Total (Category) | 3,455 (45.1%) | 4,199 (54.9%) |
| Total (Overall) | 9,649 (50.7%) | 9,392 (49.3%) |
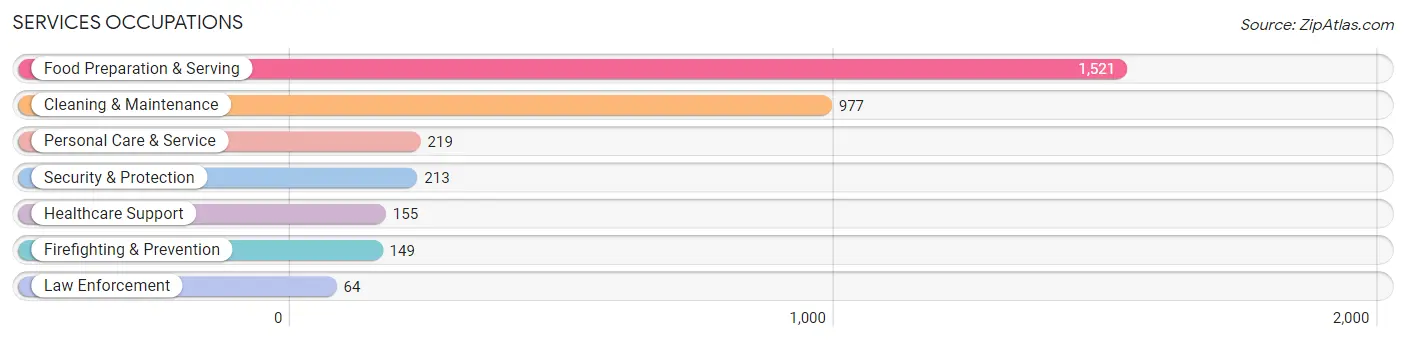
Services Occupations
The most common Services occupations in Dare County are Food Preparation & Serving (1,521 | 8.0%), Cleaning & Maintenance (977 | 5.1%), Personal Care & Service (219 | 1.1%), Security & Protection (213 | 1.1%), and Healthcare Support (155 | 0.8%).
Services Occupations by Sex
Within the Services occupations in Dare County, the most male-oriented occupations are Law Enforcement (100.0%), Security & Protection (63.8%), and Cleaning & Maintenance (62.8%), while the most female-oriented occupations are Healthcare Support (91.6%), Personal Care & Service (62.1%), and Food Preparation & Serving (58.5%).
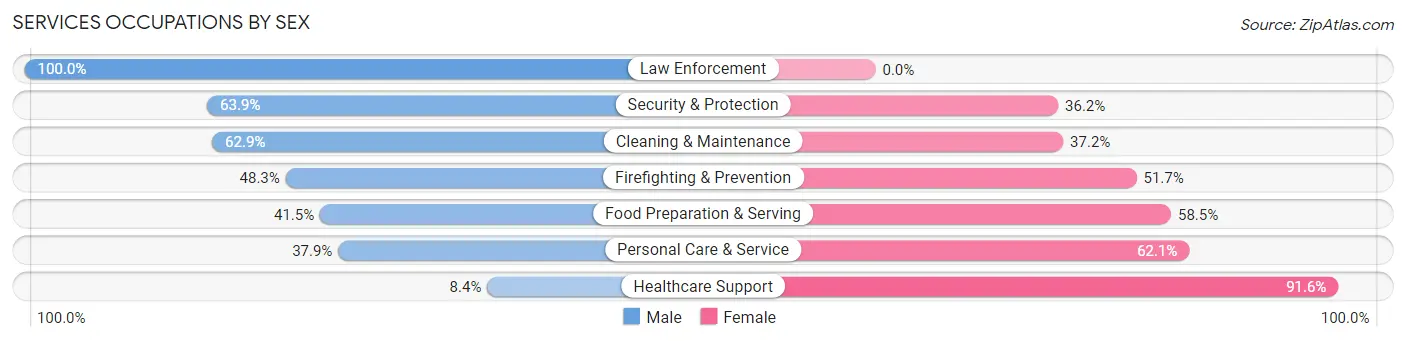
| Occupation | Male | Female |
| Healthcare Support | 13 (8.4%) | 142 (91.6%) |
| Security & Protection | 136 (63.8%) | 77 (36.1%) |
| Firefighting & Prevention | 72 (48.3%) | 77 (51.7%) |
| Law Enforcement | 64 (100.0%) | 0 (0.0%) |
| Food Preparation & Serving | 631 (41.5%) | 890 (58.5%) |
| Cleaning & Maintenance | 614 (62.8%) | 363 (37.1%) |
| Personal Care & Service | 83 (37.9%) | 136 (62.1%) |
| Total (Category) | 1,477 (47.9%) | 1,608 (52.1%) |
| Total (Overall) | 9,649 (50.7%) | 9,392 (49.3%) |
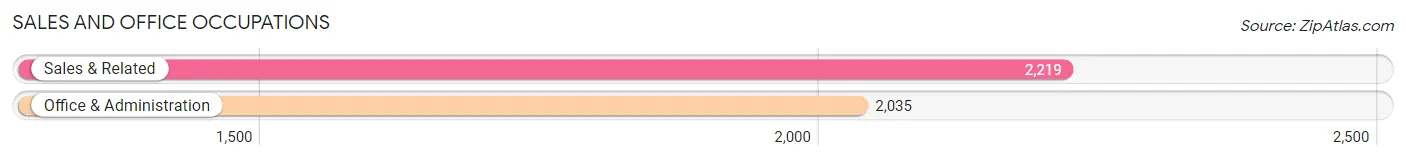
Sales and Office Occupations
The most common Sales and Office occupations in Dare County are Sales & Related (2,219 | 11.7%), and Office & Administration (2,035 | 10.7%).
Sales and Office Occupations by Sex
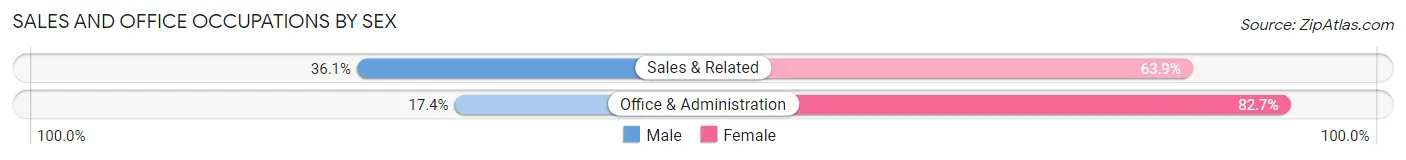
| Occupation | Male | Female |
| Sales & Related | 801 (36.1%) | 1,418 (63.9%) |
| Office & Administration | 353 (17.3%) | 1,682 (82.7%) |
| Total (Category) | 1,154 (27.1%) | 3,100 (72.9%) |
| Total (Overall) | 9,649 (50.7%) | 9,392 (49.3%) |
Natural Resources, Construction and Maintenance Occupations
The most common Natural Resources, Construction and Maintenance occupations in Dare County are Construction & Extraction (1,263 | 6.6%), Installation, Maintenance & Repair (786 | 4.1%), and Farming, Fishing & Forestry (473 | 2.5%).
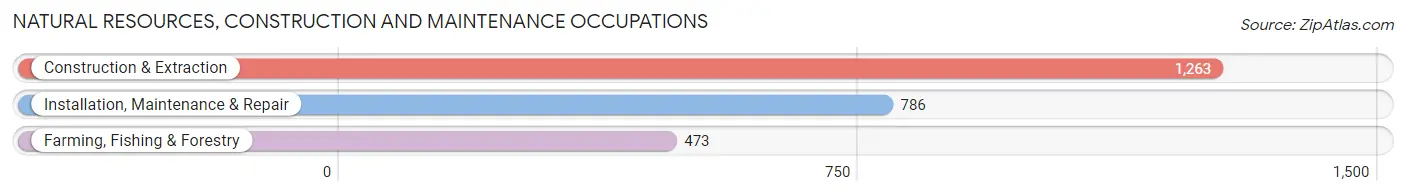
Natural Resources, Construction and Maintenance Occupations by Sex
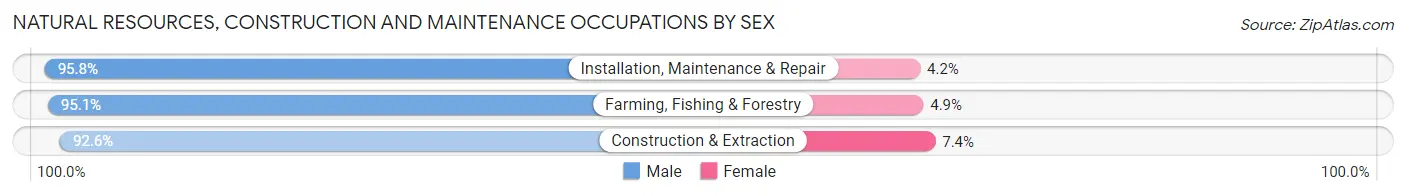
| Occupation | Male | Female |
| Farming, Fishing & Forestry | 450 (95.1%) | 23 (4.9%) |
| Construction & Extraction | 1,170 (92.6%) | 93 (7.4%) |
| Installation, Maintenance & Repair | 753 (95.8%) | 33 (4.2%) |
| Total (Category) | 2,373 (94.1%) | 149 (5.9%) |
| Total (Overall) | 9,649 (50.7%) | 9,392 (49.3%) |
Production, Transportation and Moving Occupations
The most common Production, Transportation and Moving occupations in Dare County are Production (690 | 3.6%), Transportation (513 | 2.7%), and Material Moving (323 | 1.7%).
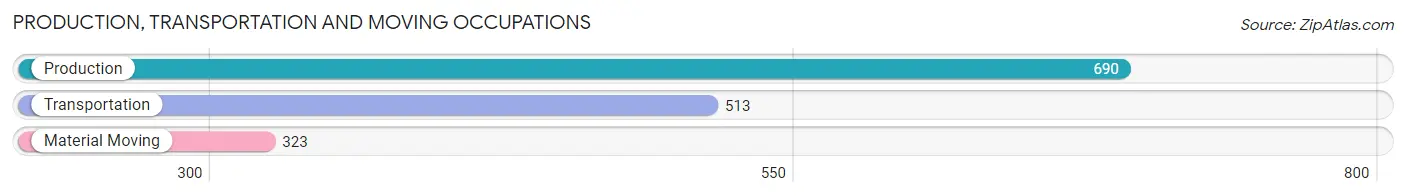
Production, Transportation and Moving Occupations by Sex
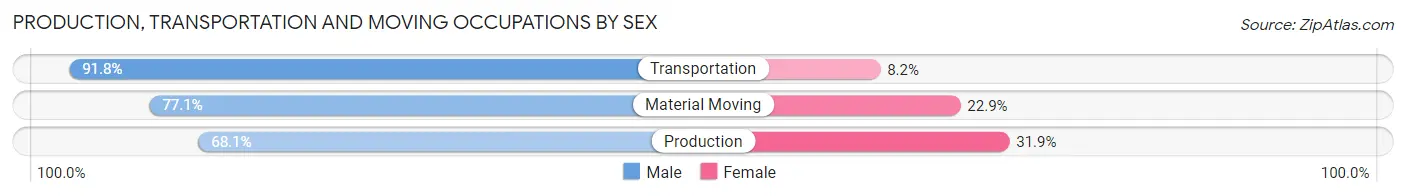
| Occupation | Male | Female |
| Production | 470 (68.1%) | 220 (31.9%) |
| Transportation | 471 (91.8%) | 42 (8.2%) |
| Material Moving | 249 (77.1%) | 74 (22.9%) |
| Total (Category) | 1,190 (78.0%) | 336 (22.0%) |
| Total (Overall) | 9,649 (50.7%) | 9,392 (49.3%) |
Employment Industries by Sex in Dare County
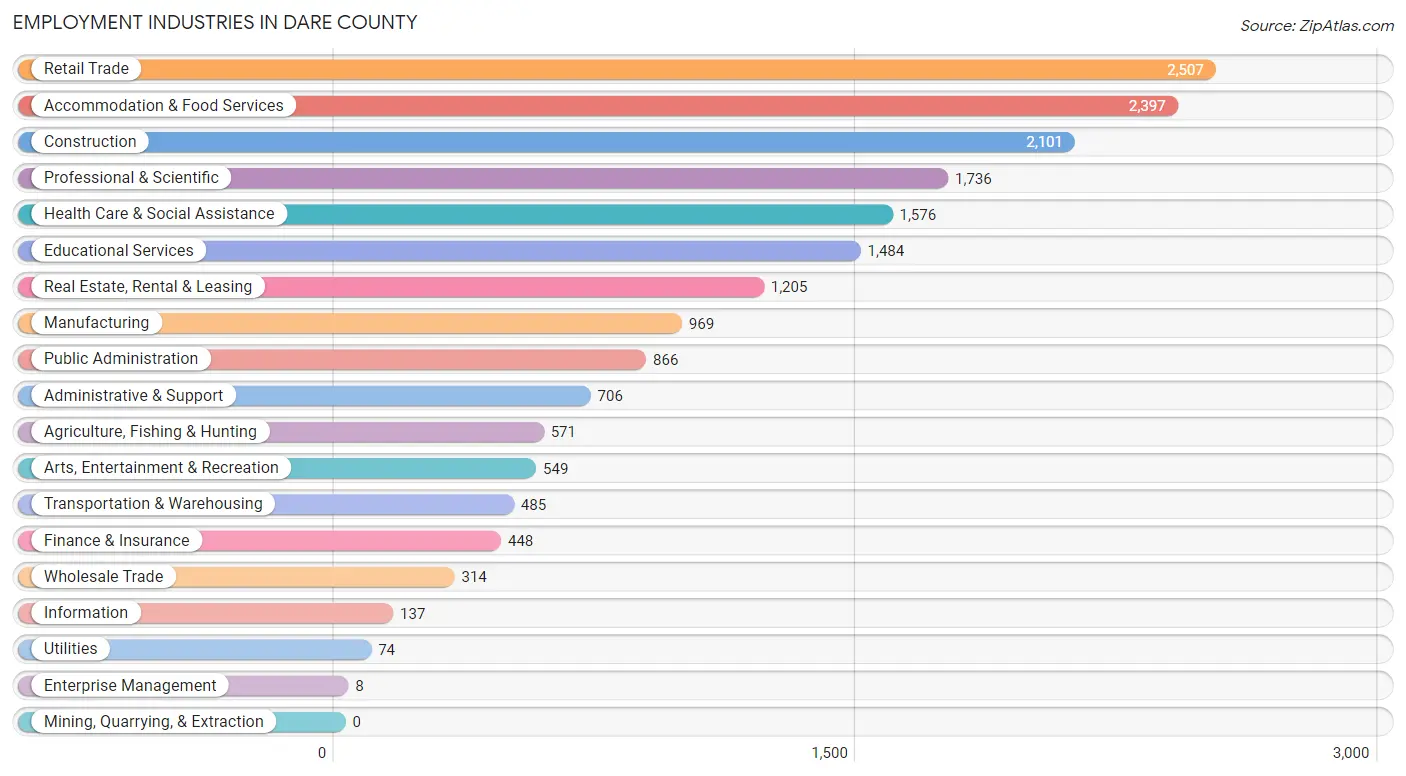
Employment Industries in Dare County
The major employment industries in Dare County include Retail Trade (2,507 | 13.2%), Accommodation & Food Services (2,397 | 12.6%), Construction (2,101 | 11.0%), Professional & Scientific (1,736 | 9.1%), and Health Care & Social Assistance (1,576 | 8.3%).
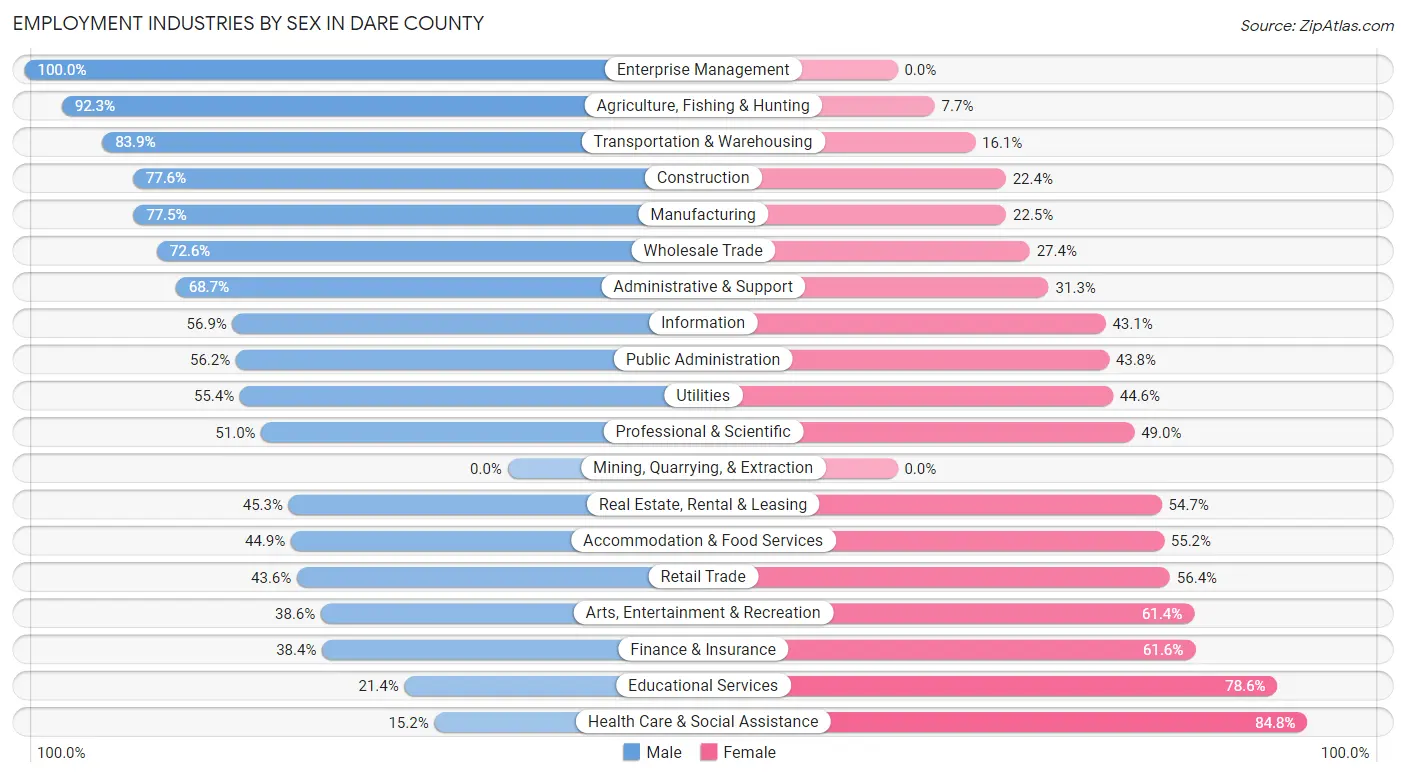
Employment Industries by Sex in Dare County
The Dare County industries that see more men than women are Enterprise Management (100.0%), Agriculture, Fishing & Hunting (92.3%), and Transportation & Warehousing (83.9%), whereas the industries that tend to have a higher number of women are Health Care & Social Assistance (84.8%), Educational Services (78.6%), and Finance & Insurance (61.6%).
| Industry | Male | Female |
| Agriculture, Fishing & Hunting | 527 (92.3%) | 44 (7.7%) |
| Mining, Quarrying, & Extraction | 0 (0.0%) | 0 (0.0%) |
| Construction | 1,630 (77.6%) | 471 (22.4%) |
| Manufacturing | 751 (77.5%) | 218 (22.5%) |
| Wholesale Trade | 228 (72.6%) | 86 (27.4%) |
| Retail Trade | 1,093 (43.6%) | 1,414 (56.4%) |
| Transportation & Warehousing | 407 (83.9%) | 78 (16.1%) |
| Utilities | 41 (55.4%) | 33 (44.6%) |
| Information | 78 (56.9%) | 59 (43.1%) |
| Finance & Insurance | 172 (38.4%) | 276 (61.6%) |
| Real Estate, Rental & Leasing | 546 (45.3%) | 659 (54.7%) |
| Professional & Scientific | 885 (51.0%) | 851 (49.0%) |
| Enterprise Management | 8 (100.0%) | 0 (0.0%) |
| Administrative & Support | 485 (68.7%) | 221 (31.3%) |
| Educational Services | 317 (21.4%) | 1,167 (78.6%) |
| Health Care & Social Assistance | 239 (15.2%) | 1,337 (84.8%) |
| Arts, Entertainment & Recreation | 212 (38.6%) | 337 (61.4%) |
| Accommodation & Food Services | 1,075 (44.9%) | 1,322 (55.1%) |
| Public Administration | 487 (56.2%) | 379 (43.8%) |
| Total | 9,649 (50.7%) | 9,392 (49.3%) |
Education in Dare County
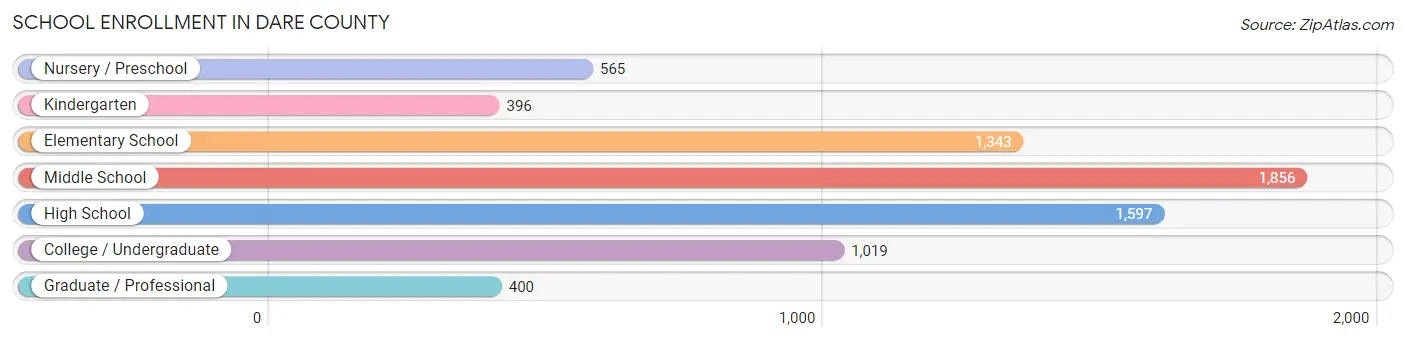
School Enrollment in Dare County
The most common levels of schooling among the 7,176 students in Dare County are middle school (1,856 | 25.9%), high school (1,597 | 22.3%), and elementary school (1,343 | 18.7%).
| School Level | # Students | % Students |
| Nursery / Preschool | 565 | 7.9% |
| Kindergarten | 396 | 5.5% |
| Elementary School | 1,343 | 18.7% |
| Middle School | 1,856 | 25.9% |
| High School | 1,597 | 22.3% |
| College / Undergraduate | 1,019 | 14.2% |
| Graduate / Professional | 400 | 5.6% |
| Total | 7,176 | 100.0% |
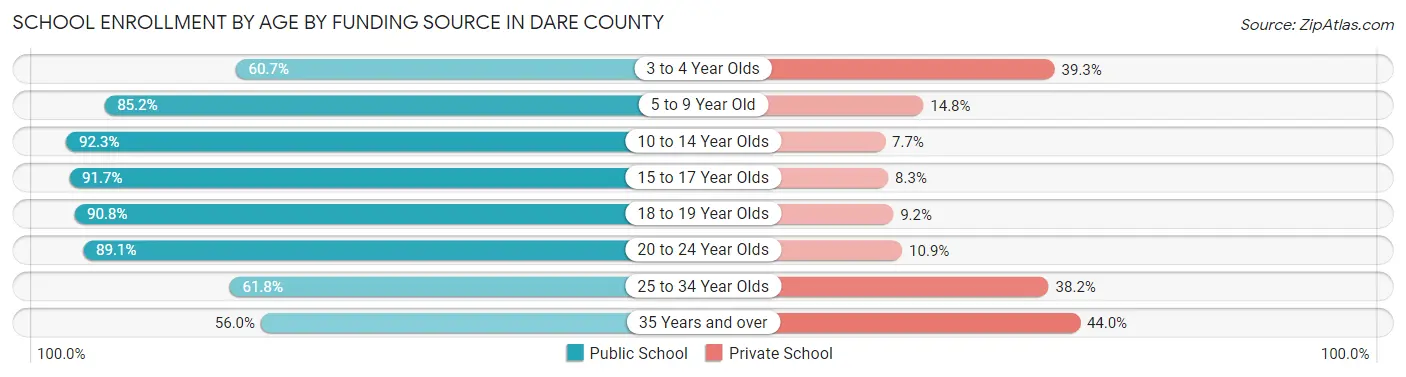
School Enrollment by Age by Funding Source in Dare County
Out of a total of 7,176 students who are enrolled in schools in Dare County, 1,163 (16.2%) attend a private institution, while the remaining 6,013 (83.8%) are enrolled in public schools. The age group of 35 years and over has the highest likelihood of being enrolled in private schools, with 224 (44.0% in the age bracket) enrolled. Conversely, the age group of 10 to 14 year olds has the lowest likelihood of being enrolled in a private school, with 1,925 (92.3% in the age bracket) attending a public institution.
| Age Bracket | Public School | Private School |
| 3 to 4 Year Olds | 275 (60.7%) | 178 (39.3%) |
| 5 to 9 Year Old | 1,538 (85.2%) | 268 (14.8%) |
| 10 to 14 Year Olds | 1,925 (92.3%) | 161 (7.7%) |
| 15 to 17 Year Olds | 1,073 (91.7%) | 97 (8.3%) |
| 18 to 19 Year Olds | 413 (90.8%) | 42 (9.2%) |
| 20 to 24 Year Olds | 229 (89.1%) | 28 (10.9%) |
| 25 to 34 Year Olds | 272 (61.8%) | 168 (38.2%) |
| 35 Years and over | 285 (56.0%) | 224 (44.0%) |
| Total | 6,013 (83.8%) | 1,163 (16.2%) |
Educational Attainment by Field of Study in Dare County
Education (2,364 | 17.7%), business (2,225 | 16.7%), science & technology (1,463 | 11.0%), arts & humanities (1,209 | 9.1%), and social sciences (1,065 | 8.0%) are the most common fields of study among 13,338 individuals in Dare County who have obtained a bachelor's degree or higher.

| Field of Study | # Graduates | % Graduates |
| Computers & Mathematics | 134 | 1.0% |
| Bio, Nature & Agricultural | 791 | 5.9% |
| Physical & Health Sciences | 399 | 3.0% |
| Psychology | 751 | 5.6% |
| Social Sciences | 1,065 | 8.0% |
| Engineering | 596 | 4.5% |
| Multidisciplinary Studies | 53 | 0.4% |
| Science & Technology | 1,463 | 11.0% |
| Business | 2,225 | 16.7% |
| Education | 2,364 | 17.7% |
| Literature & Languages | 576 | 4.3% |
| Liberal Arts & History | 466 | 3.5% |
| Visual & Performing Arts | 765 | 5.7% |
| Communications | 481 | 3.6% |
| Arts & Humanities | 1,209 | 9.1% |
| Total | 13,338 | 100.0% |
Transportation & Commute in Dare County
Vehicle Availability by Sex in Dare County
The most prevalent vehicle ownership categories in Dare County are males with 2 vehicles (3,951, accounting for 41.8%) and females with 2 vehicles (3,934, making up 42.7%).
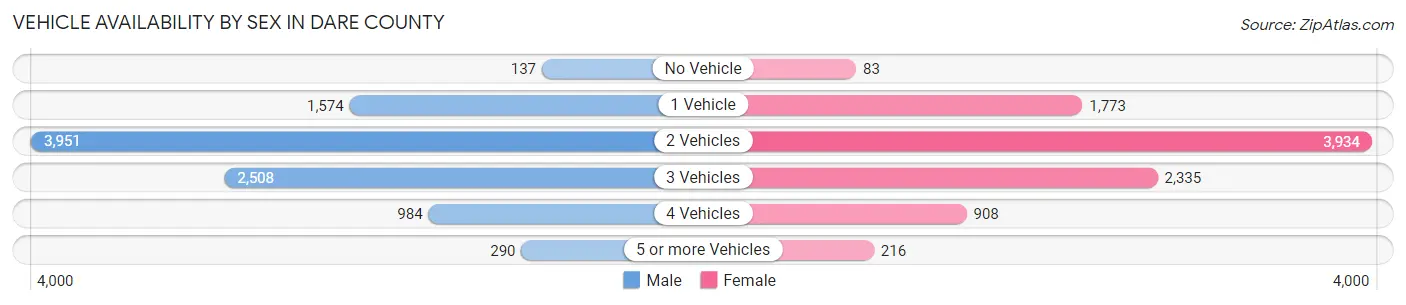
| Vehicles Available | Male | Female |
| No Vehicle | 137 (1.5%) | 83 (0.9%) |
| 1 Vehicle | 1,574 (16.7%) | 1,773 (19.2%) |
| 2 Vehicles | 3,951 (41.8%) | 3,934 (42.5%) |
| 3 Vehicles | 2,508 (26.6%) | 2,335 (25.3%) |
| 4 Vehicles | 984 (10.4%) | 908 (9.8%) |
| 5 or more Vehicles | 290 (3.1%) | 216 (2.3%) |
| Total | 9,444 (100.0%) | 9,249 (100.0%) |
Commute Time in Dare County
The most frequently occuring commute durations in Dare County are 5 to 9 minutes (2,836 commuters, 17.3%), 10 to 14 minutes (2,680 commuters, 16.3%), and 15 to 19 minutes (2,381 commuters, 14.5%).
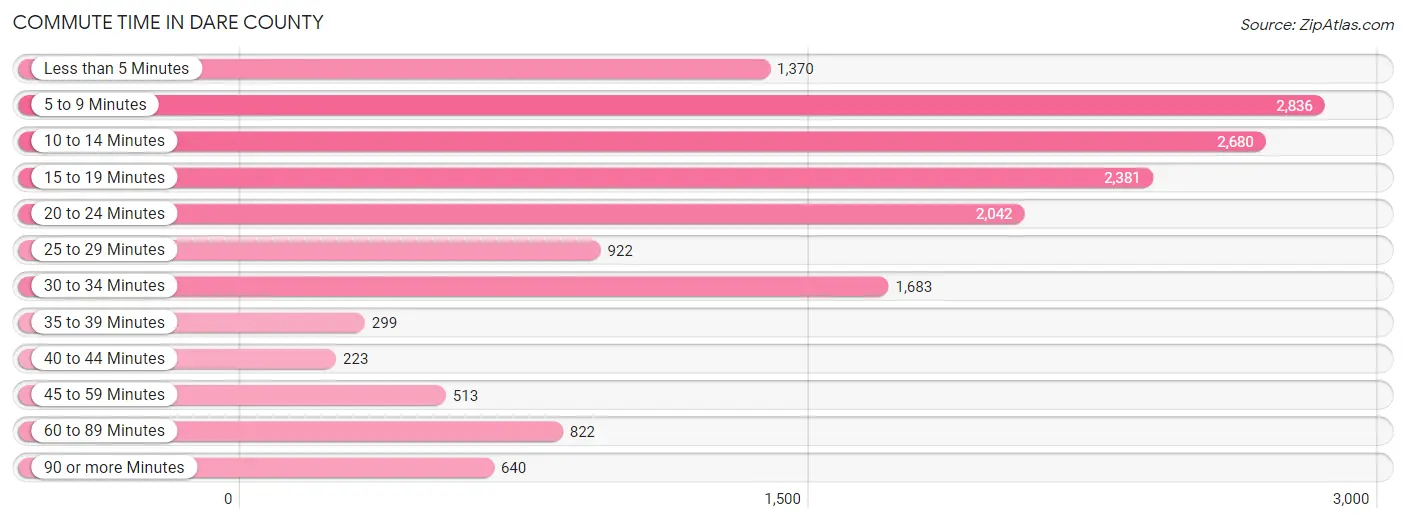
| Commute Time | # Commuters | % Commuters |
| Less than 5 Minutes | 1,370 | 8.4% |
| 5 to 9 Minutes | 2,836 | 17.3% |
| 10 to 14 Minutes | 2,680 | 16.3% |
| 15 to 19 Minutes | 2,381 | 14.5% |
| 20 to 24 Minutes | 2,042 | 12.4% |
| 25 to 29 Minutes | 922 | 5.6% |
| 30 to 34 Minutes | 1,683 | 10.3% |
| 35 to 39 Minutes | 299 | 1.8% |
| 40 to 44 Minutes | 223 | 1.4% |
| 45 to 59 Minutes | 513 | 3.1% |
| 60 to 89 Minutes | 822 | 5.0% |
| 90 or more Minutes | 640 | 3.9% |
Commute Time by Sex in Dare County
The most common commute times in Dare County are 5 to 9 minutes (1,373 commuters, 16.3%) for males and 5 to 9 minutes (1,463 commuters, 18.3%) for females.
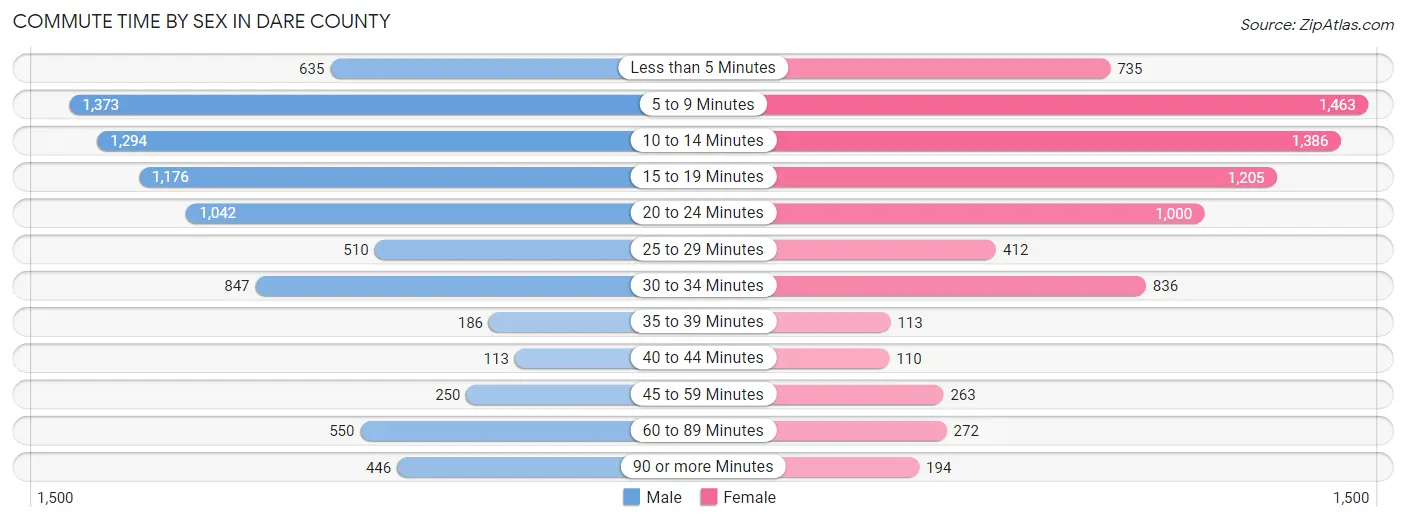
| Commute Time | Male | Female |
| Less than 5 Minutes | 635 (7.5%) | 735 (9.2%) |
| 5 to 9 Minutes | 1,373 (16.3%) | 1,463 (18.3%) |
| 10 to 14 Minutes | 1,294 (15.4%) | 1,386 (17.3%) |
| 15 to 19 Minutes | 1,176 (14.0%) | 1,205 (15.1%) |
| 20 to 24 Minutes | 1,042 (12.4%) | 1,000 (12.5%) |
| 25 to 29 Minutes | 510 (6.1%) | 412 (5.2%) |
| 30 to 34 Minutes | 847 (10.1%) | 836 (10.5%) |
| 35 to 39 Minutes | 186 (2.2%) | 113 (1.4%) |
| 40 to 44 Minutes | 113 (1.3%) | 110 (1.4%) |
| 45 to 59 Minutes | 250 (3.0%) | 263 (3.3%) |
| 60 to 89 Minutes | 550 (6.5%) | 272 (3.4%) |
| 90 or more Minutes | 446 (5.3%) | 194 (2.4%) |
Time of Departure to Work by Sex in Dare County
The most frequent times of departure to work in Dare County are 8:00 AM to 8:29 AM (1,200, 14.2%) for males and 8:00 AM to 8:29 AM (1,222, 15.3%) for females.
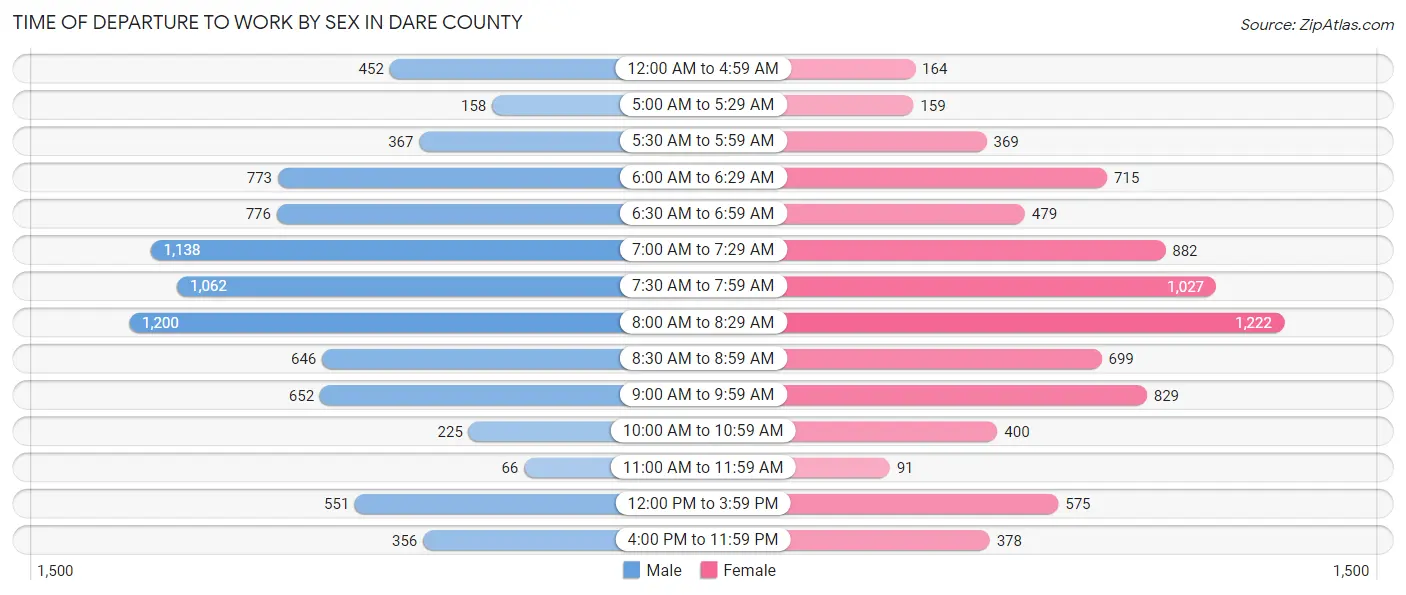
| Time of Departure | Male | Female |
| 12:00 AM to 4:59 AM | 452 (5.4%) | 164 (2.1%) |
| 5:00 AM to 5:29 AM | 158 (1.9%) | 159 (2.0%) |
| 5:30 AM to 5:59 AM | 367 (4.4%) | 369 (4.6%) |
| 6:00 AM to 6:29 AM | 773 (9.2%) | 715 (8.9%) |
| 6:30 AM to 6:59 AM | 776 (9.2%) | 479 (6.0%) |
| 7:00 AM to 7:29 AM | 1,138 (13.5%) | 882 (11.0%) |
| 7:30 AM to 7:59 AM | 1,062 (12.6%) | 1,027 (12.9%) |
| 8:00 AM to 8:29 AM | 1,200 (14.2%) | 1,222 (15.3%) |
| 8:30 AM to 8:59 AM | 646 (7.7%) | 699 (8.7%) |
| 9:00 AM to 9:59 AM | 652 (7.7%) | 829 (10.4%) |
| 10:00 AM to 10:59 AM | 225 (2.7%) | 400 (5.0%) |
| 11:00 AM to 11:59 AM | 66 (0.8%) | 91 (1.1%) |
| 12:00 PM to 3:59 PM | 551 (6.5%) | 575 (7.2%) |
| 4:00 PM to 11:59 PM | 356 (4.2%) | 378 (4.7%) |
| Total | 8,422 (100.0%) | 7,989 (100.0%) |
Housing Occupancy in Dare County
Occupancy by Ownership in Dare County
Of the total 16,081 dwellings in Dare County, owner-occupied units account for 12,513 (77.8%), while renter-occupied units make up 3,568 (22.2%).
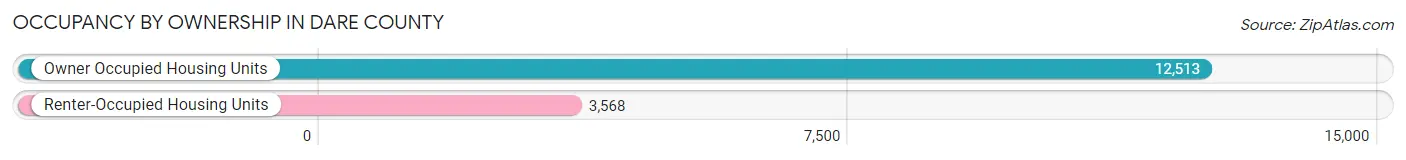
| Occupancy | # Housing Units | % Housing Units |
| Owner Occupied Housing Units | 12,513 | 77.8% |
| Renter-Occupied Housing Units | 3,568 | 22.2% |
| Total Occupied Housing Units | 16,081 | 100.0% |
Occupancy by Household Size in Dare County
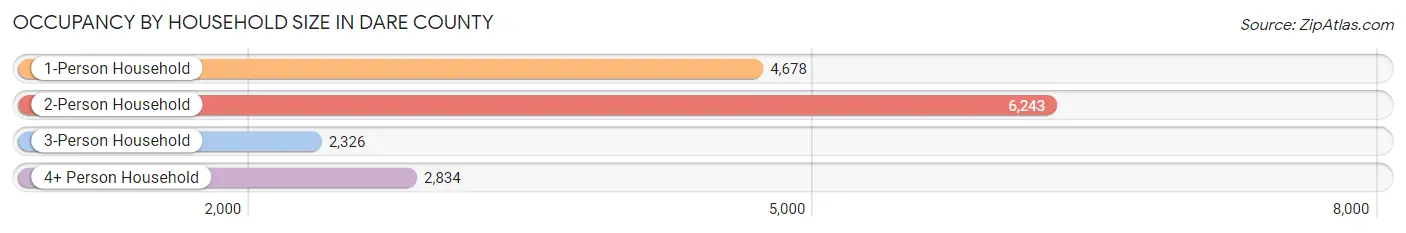
| Household Size | # Housing Units | % Housing Units |
| 1-Person Household | 4,678 | 29.1% |
| 2-Person Household | 6,243 | 38.8% |
| 3-Person Household | 2,326 | 14.5% |
| 4+ Person Household | 2,834 | 17.6% |
| Total Housing Units | 16,081 | 100.0% |
Occupancy by Ownership by Household Size in Dare County
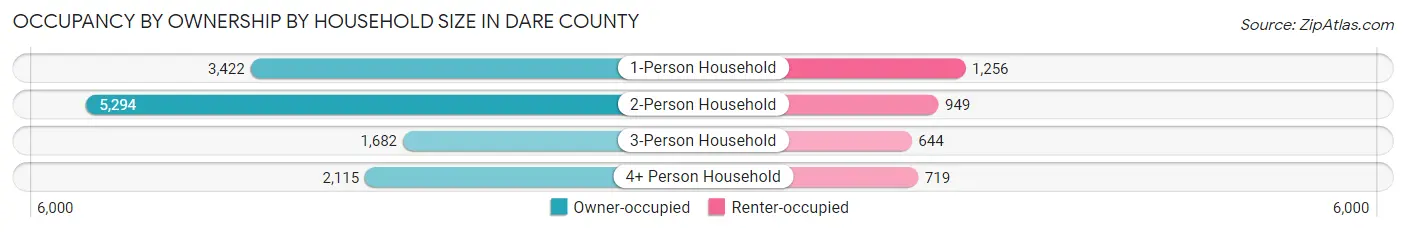
| Household Size | Owner-occupied | Renter-occupied |
| 1-Person Household | 3,422 (73.2%) | 1,256 (26.9%) |
| 2-Person Household | 5,294 (84.8%) | 949 (15.2%) |
| 3-Person Household | 1,682 (72.3%) | 644 (27.7%) |
| 4+ Person Household | 2,115 (74.6%) | 719 (25.4%) |
| Total Housing Units | 12,513 (77.8%) | 3,568 (22.2%) |
Occupancy by Educational Attainment in Dare County
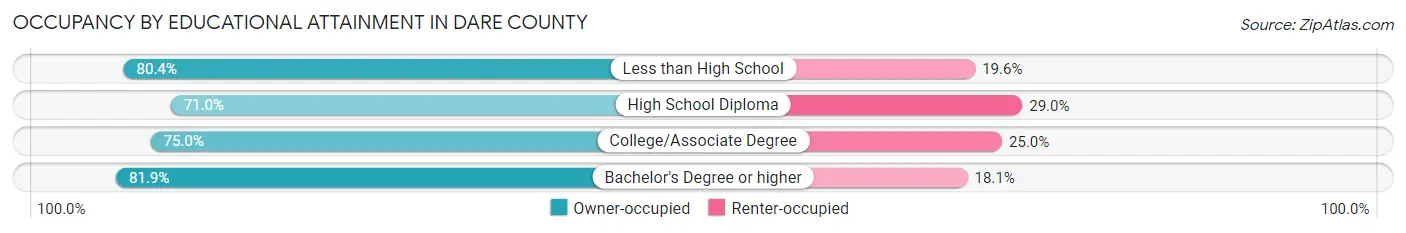
| Household Size | Owner-occupied | Renter-occupied |
| Less than High School | 540 (80.4%) | 132 (19.6%) |
| High School Diploma | 1,957 (71.0%) | 798 (29.0%) |
| College/Associate Degree | 3,763 (75.0%) | 1,252 (25.0%) |
| Bachelor's Degree or higher | 6,253 (81.9%) | 1,386 (18.1%) |
Occupancy by Age of Householder in Dare County
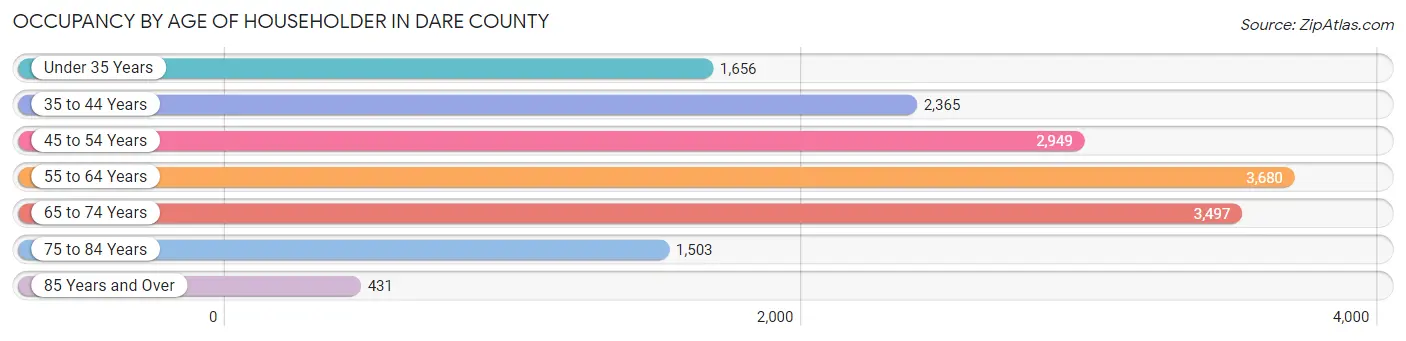
| Age Bracket | # Households | % Households |
| Under 35 Years | 1,656 | 10.3% |
| 35 to 44 Years | 2,365 | 14.7% |
| 45 to 54 Years | 2,949 | 18.3% |
| 55 to 64 Years | 3,680 | 22.9% |
| 65 to 74 Years | 3,497 | 21.7% |
| 75 to 84 Years | 1,503 | 9.3% |
| 85 Years and Over | 431 | 2.7% |
| Total | 16,081 | 100.0% |
Housing Finances in Dare County
Median Income by Occupancy in Dare County
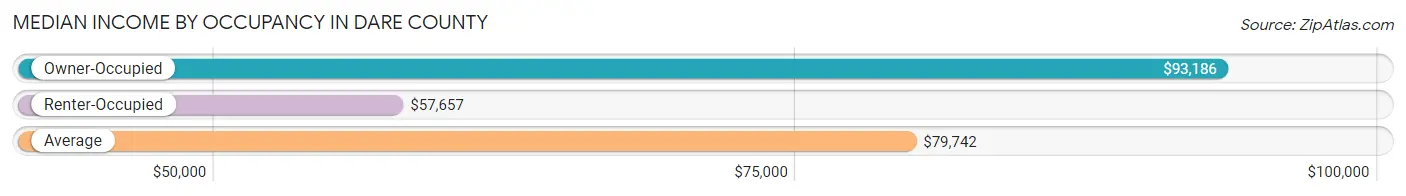
| Occupancy Type | # Households | Median Income |
| Owner-Occupied | 12,513 (77.8%) | $93,186 |
| Renter-Occupied | 3,568 (22.2%) | $57,657 |
| Average | 16,081 (100.0%) | $79,742 |
Occupancy by Householder Income Bracket in Dare County
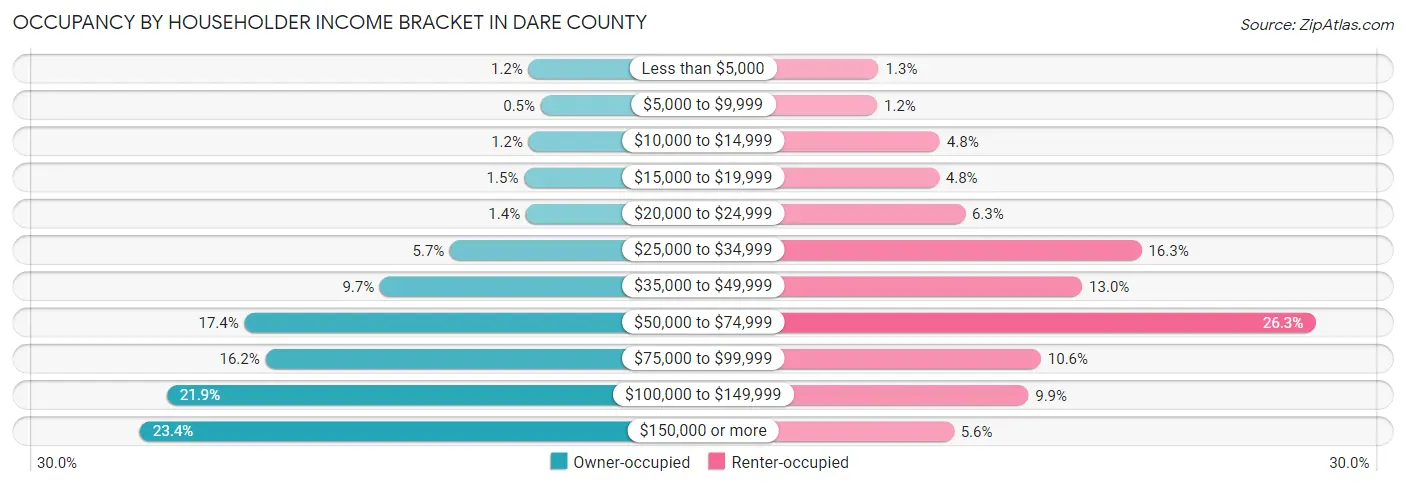
| Income Bracket | Owner-occupied | Renter-occupied |
| Less than $5,000 | 150 (1.2%) | 47 (1.3%) |
| $5,000 to $9,999 | 63 (0.5%) | 44 (1.2%) |
| $10,000 to $14,999 | 149 (1.2%) | 172 (4.8%) |
| $15,000 to $19,999 | 181 (1.5%) | 170 (4.8%) |
| $20,000 to $24,999 | 169 (1.3%) | 223 (6.2%) |
| $25,000 to $34,999 | 711 (5.7%) | 583 (16.3%) |
| $35,000 to $49,999 | 1,212 (9.7%) | 462 (13.0%) |
| $50,000 to $74,999 | 2,181 (17.4%) | 937 (26.3%) |
| $75,000 to $99,999 | 2,031 (16.2%) | 378 (10.6%) |
| $100,000 to $149,999 | 2,737 (21.9%) | 352 (9.9%) |
| $150,000 or more | 2,929 (23.4%) | 200 (5.6%) |
| Total | 12,513 (100.0%) | 3,568 (100.0%) |
Monthly Housing Cost Tiers in Dare County
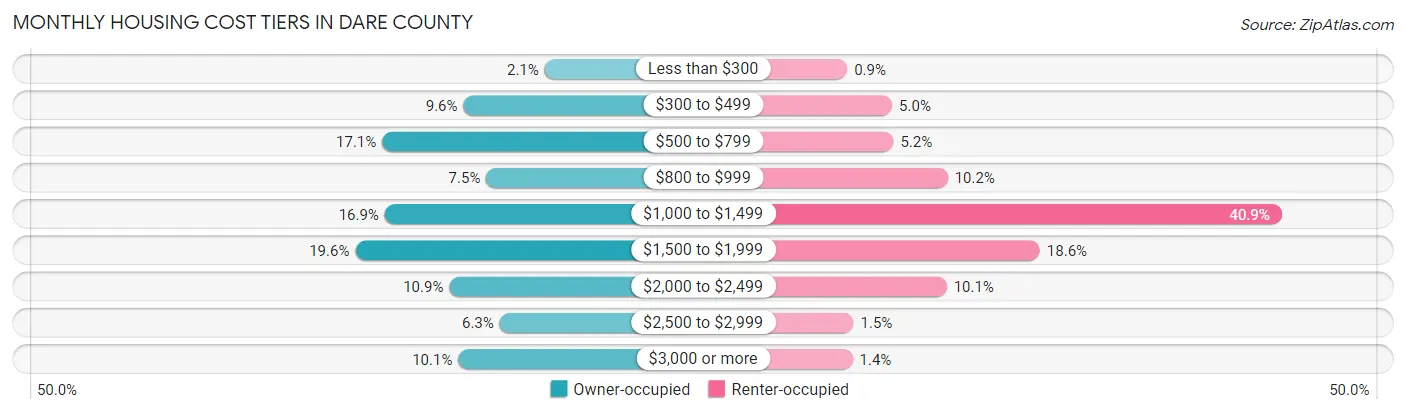
| Monthly Cost | Owner-occupied | Renter-occupied |
| Less than $300 | 267 (2.1%) | 32 (0.9%) |
| $300 to $499 | 1,202 (9.6%) | 180 (5.0%) |
| $500 to $799 | 2,138 (17.1%) | 184 (5.2%) |
| $800 to $999 | 938 (7.5%) | 362 (10.2%) |
| $1,000 to $1,499 | 2,109 (16.9%) | 1,459 (40.9%) |
| $1,500 to $1,999 | 2,448 (19.6%) | 665 (18.6%) |
| $2,000 to $2,499 | 1,365 (10.9%) | 359 (10.1%) |
| $2,500 to $2,999 | 785 (6.3%) | 53 (1.5%) |
| $3,000 or more | 1,261 (10.1%) | 50 (1.4%) |
| Total | 12,513 (100.0%) | 3,568 (100.0%) |
Physical Housing Characteristics in Dare County
Housing Structures in Dare County
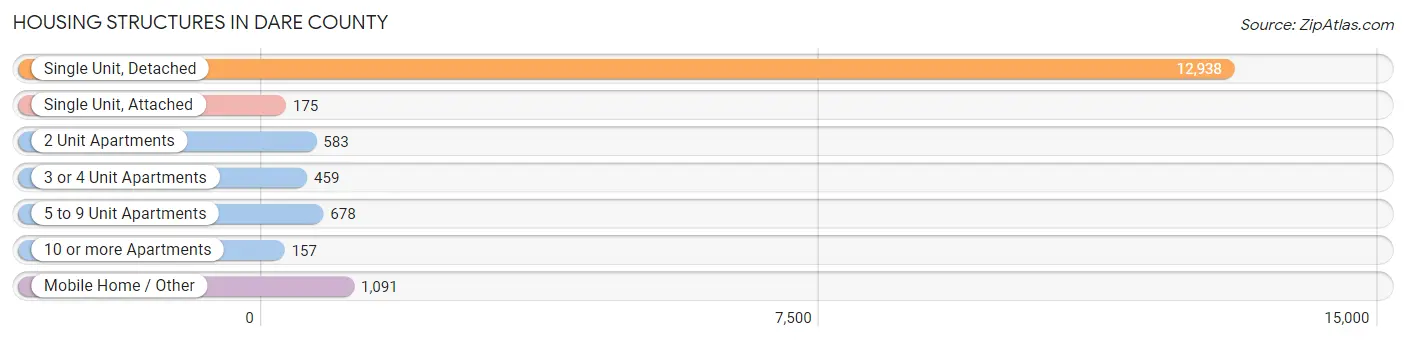
| Structure Type | # Housing Units | % Housing Units |
| Single Unit, Detached | 12,938 | 80.5% |
| Single Unit, Attached | 175 | 1.1% |
| 2 Unit Apartments | 583 | 3.6% |
| 3 or 4 Unit Apartments | 459 | 2.9% |
| 5 to 9 Unit Apartments | 678 | 4.2% |
| 10 or more Apartments | 157 | 1.0% |
| Mobile Home / Other | 1,091 | 6.8% |
| Total | 16,081 | 100.0% |
Housing Structures by Occupancy in Dare County
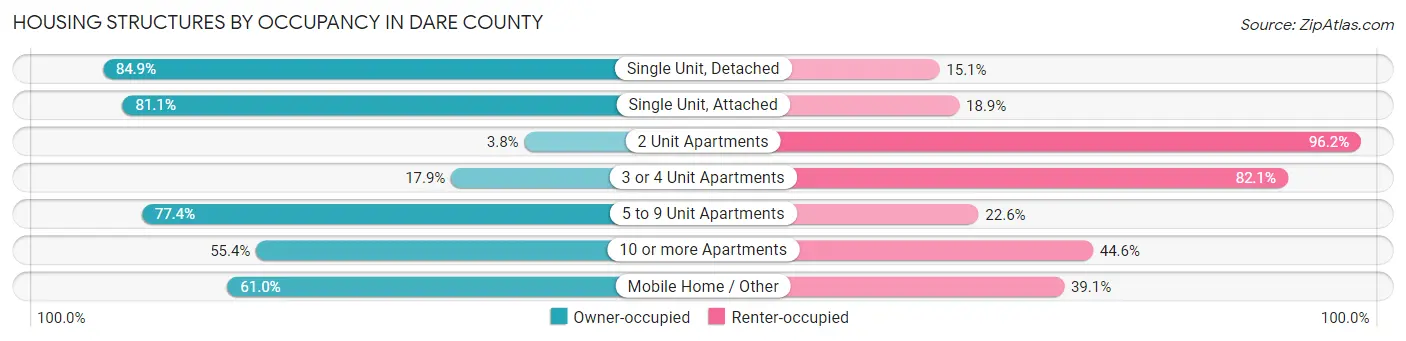
| Structure Type | Owner-occupied | Renter-occupied |
| Single Unit, Detached | 10,990 (84.9%) | 1,948 (15.1%) |
| Single Unit, Attached | 142 (81.1%) | 33 (18.9%) |
| 2 Unit Apartments | 22 (3.8%) | 561 (96.2%) |
| 3 or 4 Unit Apartments | 82 (17.9%) | 377 (82.1%) |
| 5 to 9 Unit Apartments | 525 (77.4%) | 153 (22.6%) |
| 10 or more Apartments | 87 (55.4%) | 70 (44.6%) |
| Mobile Home / Other | 665 (61.0%) | 426 (39.1%) |
| Total | 12,513 (77.8%) | 3,568 (22.2%) |
Housing Structures by Number of Rooms in Dare County
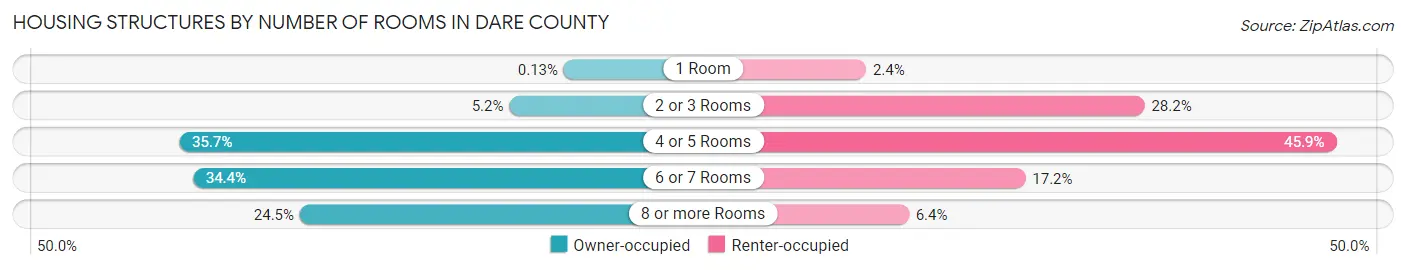
| Number of Rooms | Owner-occupied | Renter-occupied |
| 1 Room | 16 (0.1%) | 86 (2.4%) |
| 2 or 3 Rooms | 647 (5.2%) | 1,005 (28.2%) |
| 4 or 5 Rooms | 4,470 (35.7%) | 1,638 (45.9%) |
| 6 or 7 Rooms | 4,309 (34.4%) | 612 (17.2%) |
| 8 or more Rooms | 3,071 (24.5%) | 227 (6.4%) |
| Total | 12,513 (100.0%) | 3,568 (100.0%) |
Housing Structure by Heating Type in Dare County
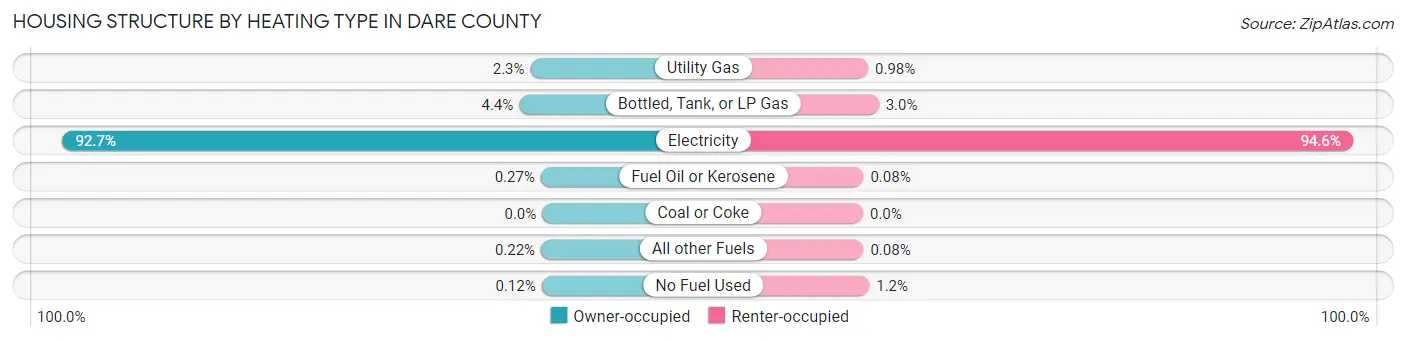
| Heating Type | Owner-occupied | Renter-occupied |
| Utility Gas | 284 (2.3%) | 35 (1.0%) |
| Bottled, Tank, or LP Gas | 556 (4.4%) | 108 (3.0%) |
| Electricity | 11,596 (92.7%) | 3,376 (94.6%) |
| Fuel Oil or Kerosene | 34 (0.3%) | 3 (0.1%) |
| Coal or Coke | 0 (0.0%) | 0 (0.0%) |
| All other Fuels | 28 (0.2%) | 3 (0.1%) |
| No Fuel Used | 15 (0.1%) | 43 (1.2%) |
| Total | 12,513 (100.0%) | 3,568 (100.0%) |
Household Vehicle Usage in Dare County
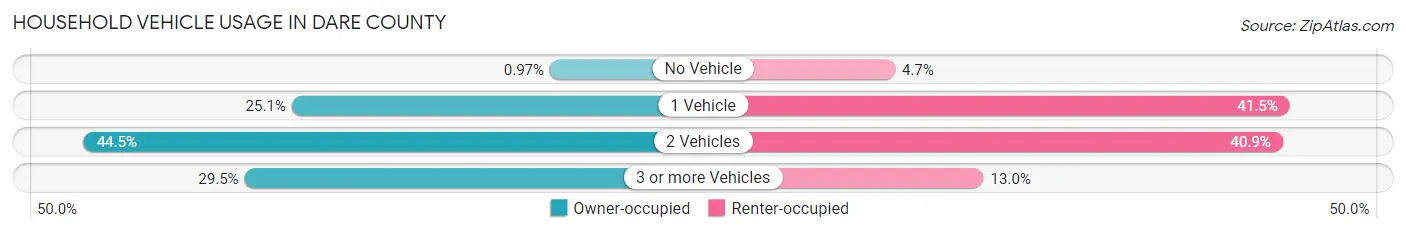
| Vehicles per Household | Owner-occupied | Renter-occupied |
| No Vehicle | 121 (1.0%) | 167 (4.7%) |
| 1 Vehicle | 3,137 (25.1%) | 1,481 (41.5%) |
| 2 Vehicles | 5,566 (44.5%) | 1,458 (40.9%) |
| 3 or more Vehicles | 3,689 (29.5%) | 462 (13.0%) |
| Total | 12,513 (100.0%) | 3,568 (100.0%) |
Real Estate & Mortgages in Dare County
Real Estate and Mortgage Overview in Dare County
| Characteristic | Without Mortgage | With Mortgage |
| Housing Units | 4,590 | 7,923 |
| Median Property Value | $390,000 | $384,900 |
| Median Household Income | $74,623 | $2,137 |
| Monthly Housing Costs | $630 | $1,261 |
| Real Estate Taxes | $2,130 | $58 |
Property Value by Mortgage Status in Dare County
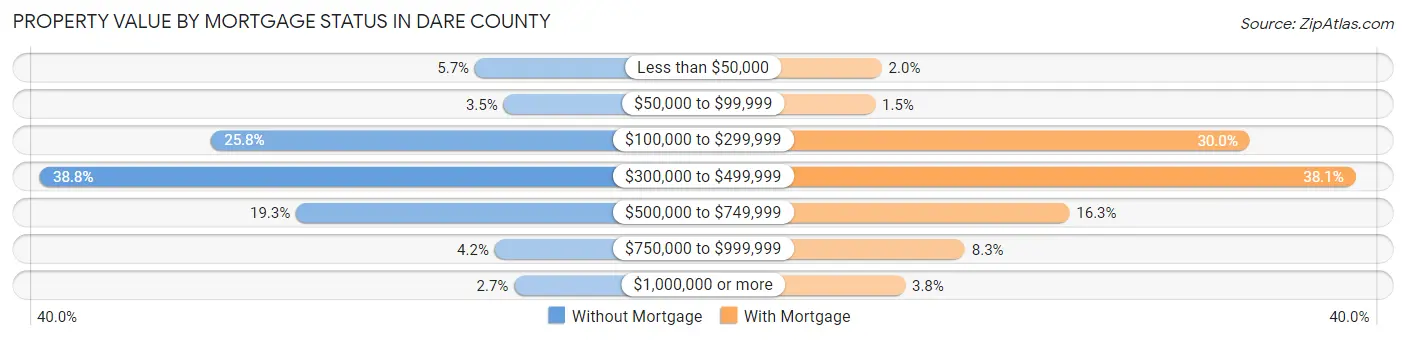
| Property Value | Without Mortgage | With Mortgage |
| Less than $50,000 | 261 (5.7%) | 158 (2.0%) |
| $50,000 to $99,999 | 161 (3.5%) | 118 (1.5%) |
| $100,000 to $299,999 | 1,183 (25.8%) | 2,379 (30.0%) |
| $300,000 to $499,999 | 1,782 (38.8%) | 3,018 (38.1%) |
| $500,000 to $749,999 | 887 (19.3%) | 1,291 (16.3%) |
| $750,000 to $999,999 | 192 (4.2%) | 660 (8.3%) |
| $1,000,000 or more | 124 (2.7%) | 299 (3.8%) |
| Total | 4,590 (100.0%) | 7,923 (100.0%) |
Household Income by Mortgage Status in Dare County
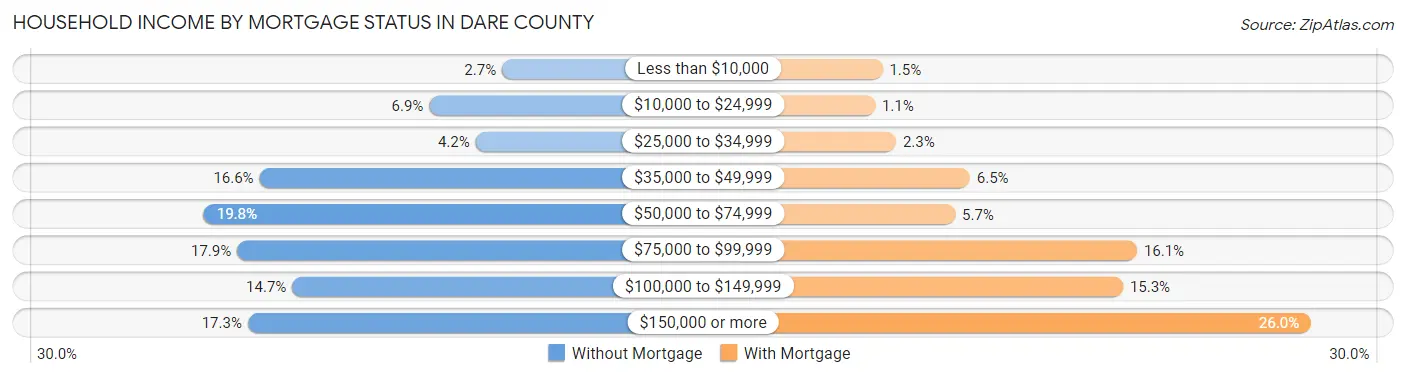
| Household Income | Without Mortgage | With Mortgage |
| Less than $10,000 | 125 (2.7%) | 122 (1.5%) |
| $10,000 to $24,999 | 316 (6.9%) | 88 (1.1%) |
| $25,000 to $34,999 | 194 (4.2%) | 183 (2.3%) |
| $35,000 to $49,999 | 761 (16.6%) | 517 (6.5%) |
| $50,000 to $74,999 | 907 (19.8%) | 451 (5.7%) |
| $75,000 to $99,999 | 820 (17.9%) | 1,274 (16.1%) |
| $100,000 to $149,999 | 675 (14.7%) | 1,211 (15.3%) |
| $150,000 or more | 792 (17.2%) | 2,062 (26.0%) |
| Total | 4,590 (100.0%) | 7,923 (100.0%) |
Property Value to Household Income Ratio in Dare County
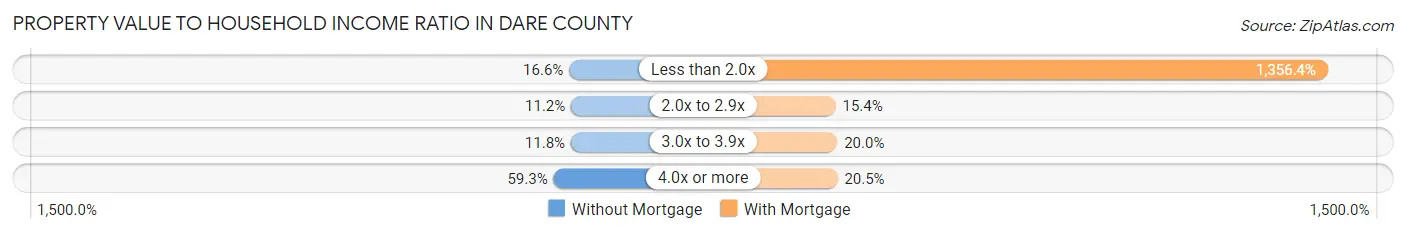
| Value-to-Income Ratio | Without Mortgage | With Mortgage |
| Less than 2.0x | 760 (16.6%) | 107,465 (1,356.4%) |
| 2.0x to 2.9x | 512 (11.2%) | 1,216 (15.3%) |
| 3.0x to 3.9x | 542 (11.8%) | 1,581 (20.0%) |
| 4.0x or more | 2,720 (59.3%) | 1,622 (20.5%) |
| Total | 4,590 (100.0%) | 7,923 (100.0%) |
Real Estate Taxes by Mortgage Status in Dare County
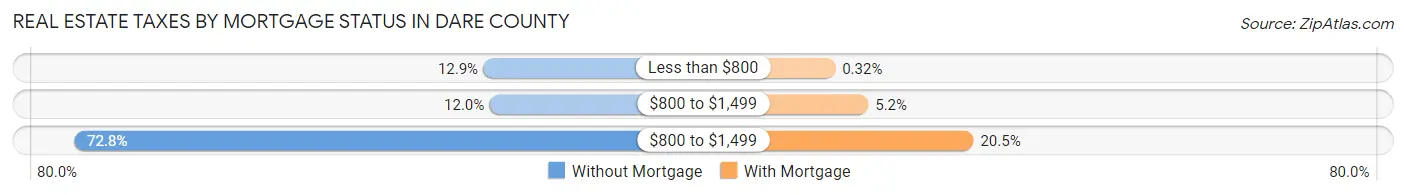
| Property Taxes | Without Mortgage | With Mortgage |
| Less than $800 | 591 (12.9%) | 25 (0.3%) |
| $800 to $1,499 | 550 (12.0%) | 408 (5.1%) |
| $800 to $1,499 | 3,340 (72.8%) | 1,626 (20.5%) |
| Total | 4,590 (100.0%) | 7,923 (100.0%) |
Health & Disability in Dare County
Health Insurance Coverage by Age in Dare County
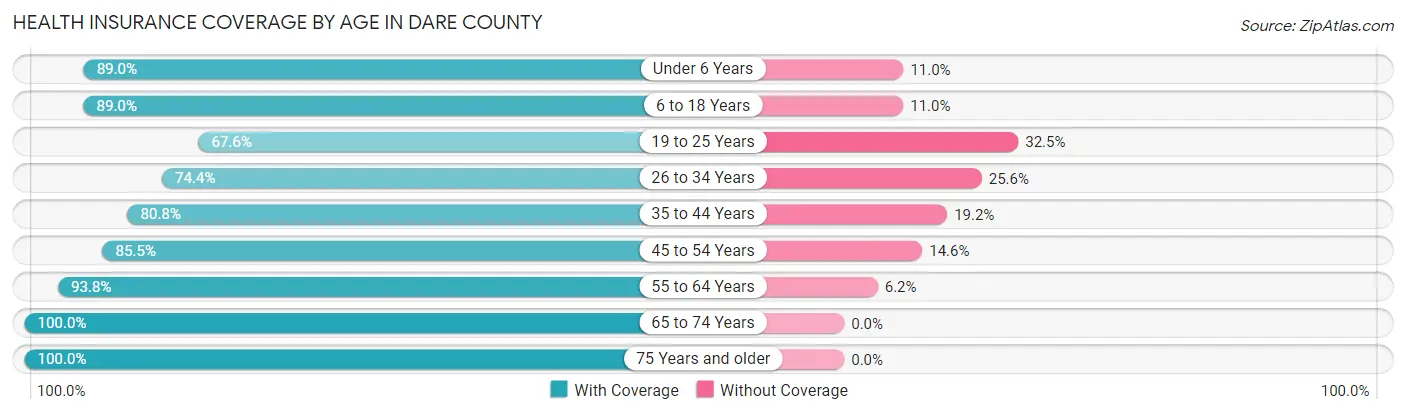
| Age Bracket | With Coverage | Without Coverage |
| Under 6 Years | 1,806 (89.0%) | 224 (11.0%) |
| 6 to 18 Years | 4,623 (89.0%) | 572 (11.0%) |
| 19 to 25 Years | 1,445 (67.5%) | 694 (32.5%) |
| 26 to 34 Years | 2,282 (74.4%) | 787 (25.6%) |
| 35 to 44 Years | 3,469 (80.8%) | 824 (19.2%) |
| 45 to 54 Years | 4,433 (85.5%) | 755 (14.5%) |
| 55 to 64 Years | 6,090 (93.8%) | 405 (6.2%) |
| 65 to 74 Years | 5,575 (100.0%) | 0 (0.0%) |
| 75 Years and older | 2,889 (100.0%) | 0 (0.0%) |
| Total | 32,612 (88.4%) | 4,261 (11.6%) |
Health Insurance Coverage by Citizenship Status in Dare County
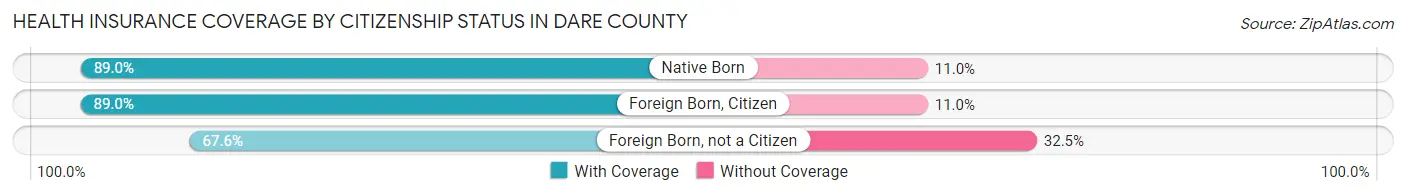
| Citizenship Status | With Coverage | Without Coverage |
| Native Born | 1,806 (89.0%) | 224 (11.0%) |
| Foreign Born, Citizen | 4,623 (89.0%) | 572 (11.0%) |
| Foreign Born, not a Citizen | 1,445 (67.5%) | 694 (32.5%) |
Health Insurance Coverage by Household Income in Dare County
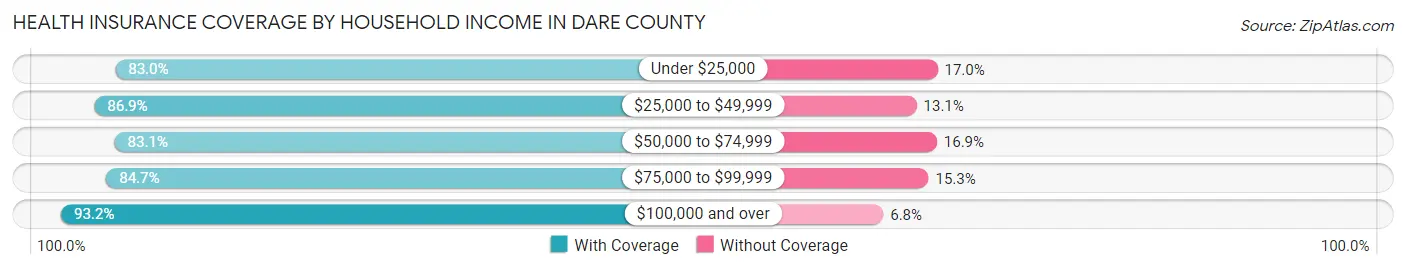
| Household Income | With Coverage | Without Coverage |
| Under $25,000 | 1,831 (83.0%) | 375 (17.0%) |
| $25,000 to $49,999 | 4,332 (86.9%) | 652 (13.1%) |
| $50,000 to $74,999 | 5,524 (83.1%) | 1,122 (16.9%) |
| $75,000 to $99,999 | 5,212 (84.7%) | 943 (15.3%) |
| $100,000 and over | 15,688 (93.2%) | 1,151 (6.8%) |
Public vs Private Health Insurance Coverage by Age in Dare County
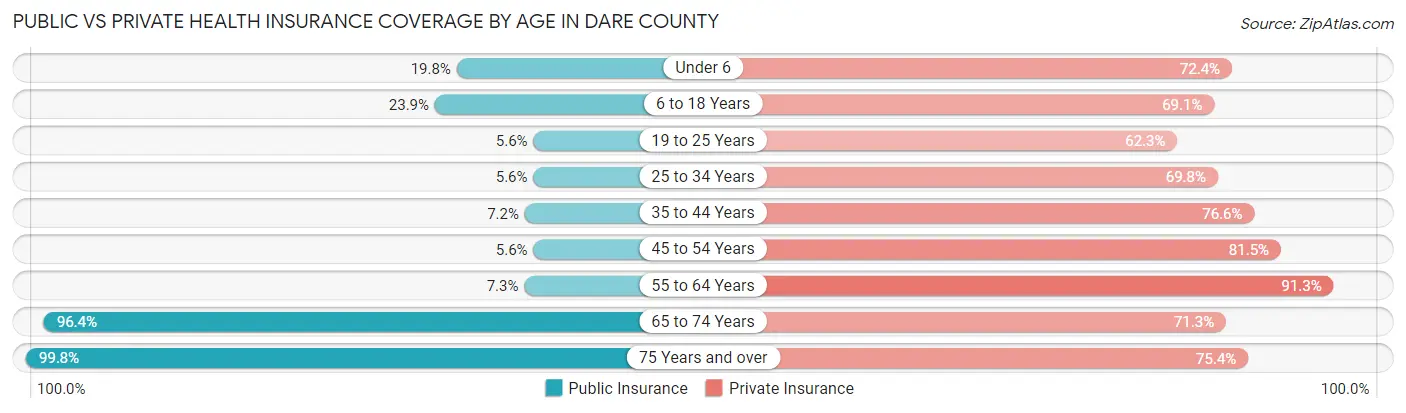
| Age Bracket | Public Insurance | Private Insurance |
| Under 6 | 402 (19.8%) | 1,470 (72.4%) |
| 6 to 18 Years | 1,239 (23.8%) | 3,591 (69.1%) |
| 19 to 25 Years | 119 (5.6%) | 1,332 (62.3%) |
| 25 to 34 Years | 171 (5.6%) | 2,142 (69.8%) |
| 35 to 44 Years | 307 (7.1%) | 3,287 (76.6%) |
| 45 to 54 Years | 288 (5.6%) | 4,228 (81.5%) |
| 55 to 64 Years | 471 (7.2%) | 5,928 (91.3%) |
| 65 to 74 Years | 5,376 (96.4%) | 3,976 (71.3%) |
| 75 Years and over | 2,882 (99.8%) | 2,179 (75.4%) |
| Total | 11,255 (30.5%) | 28,133 (76.3%) |
Disability Status by Sex by Age in Dare County
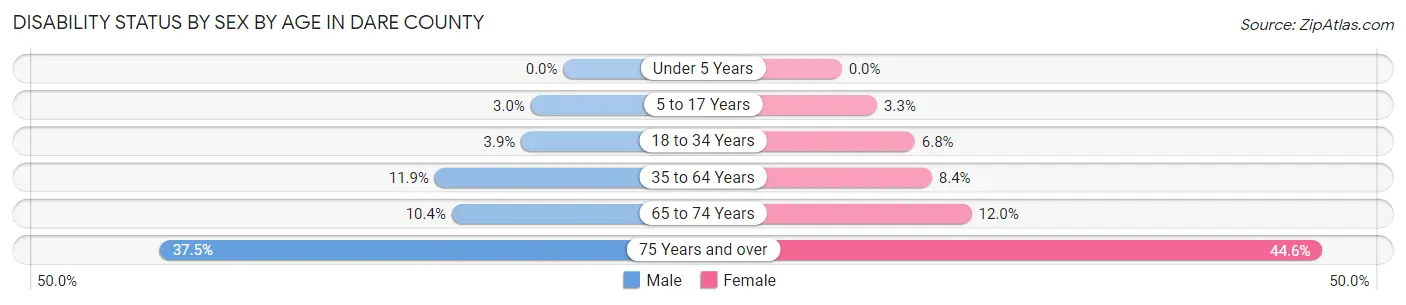
| Age Bracket | Male | Female |
| Under 5 Years | 0 (0.0%) | 0 (0.0%) |
| 5 to 17 Years | 84 (3.0%) | 79 (3.3%) |
| 18 to 34 Years | 110 (3.9%) | 188 (6.8%) |
| 35 to 64 Years | 933 (11.9%) | 682 (8.4%) |
| 65 to 74 Years | 285 (10.4%) | 340 (12.0%) |
| 75 Years and over | 490 (37.5%) | 705 (44.6%) |
Disability Class by Sex by Age in Dare County
Disability Class: Hearing Difficulty
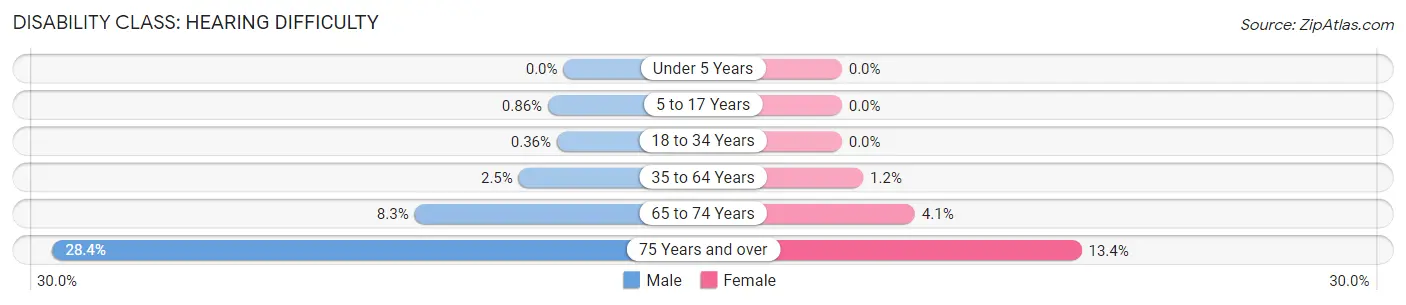
| Age Bracket | Male | Female |
| Under 5 Years | 0 (0.0%) | 0 (0.0%) |
| 5 to 17 Years | 24 (0.9%) | 0 (0.0%) |
| 18 to 34 Years | 10 (0.4%) | 0 (0.0%) |
| 35 to 64 Years | 195 (2.5%) | 97 (1.2%) |
| 65 to 74 Years | 228 (8.3%) | 115 (4.1%) |
| 75 Years and over | 372 (28.4%) | 211 (13.4%) |
Disability Class: Vision Difficulty
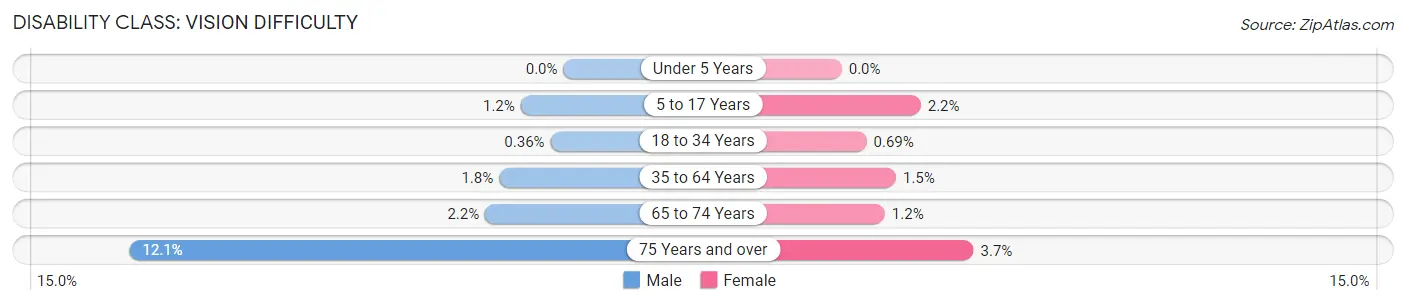
| Age Bracket | Male | Female |
| Under 5 Years | 0 (0.0%) | 0 (0.0%) |
| 5 to 17 Years | 33 (1.2%) | 53 (2.2%) |
| 18 to 34 Years | 10 (0.4%) | 19 (0.7%) |
| 35 to 64 Years | 140 (1.8%) | 123 (1.5%) |
| 65 to 74 Years | 60 (2.2%) | 34 (1.2%) |
| 75 Years and over | 158 (12.1%) | 58 (3.7%) |
Disability Class: Cognitive Difficulty

| Age Bracket | Male | Female |
| 5 to 17 Years | 84 (3.0%) | 26 (1.1%) |
| 18 to 34 Years | 84 (3.0%) | 157 (5.7%) |
| 35 to 64 Years | 310 (4.0%) | 252 (3.1%) |
| 65 to 74 Years | 0 (0.0%) | 62 (2.2%) |
| 75 Years and over | 151 (11.5%) | 263 (16.6%) |
Disability Class: Ambulatory Difficulty
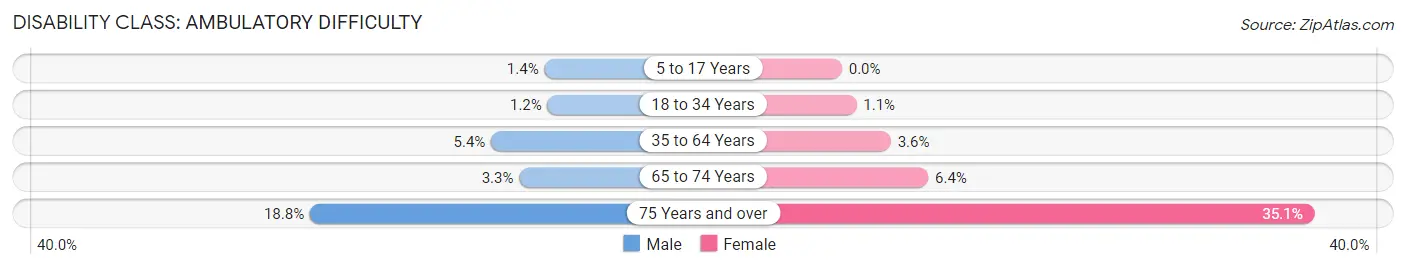
| Age Bracket | Male | Female |
| 5 to 17 Years | 39 (1.4%) | 0 (0.0%) |
| 18 to 34 Years | 33 (1.2%) | 30 (1.1%) |
| 35 to 64 Years | 419 (5.4%) | 296 (3.6%) |
| 65 to 74 Years | 90 (3.3%) | 181 (6.4%) |
| 75 Years and over | 246 (18.8%) | 555 (35.1%) |
Disability Class: Self-Care Difficulty
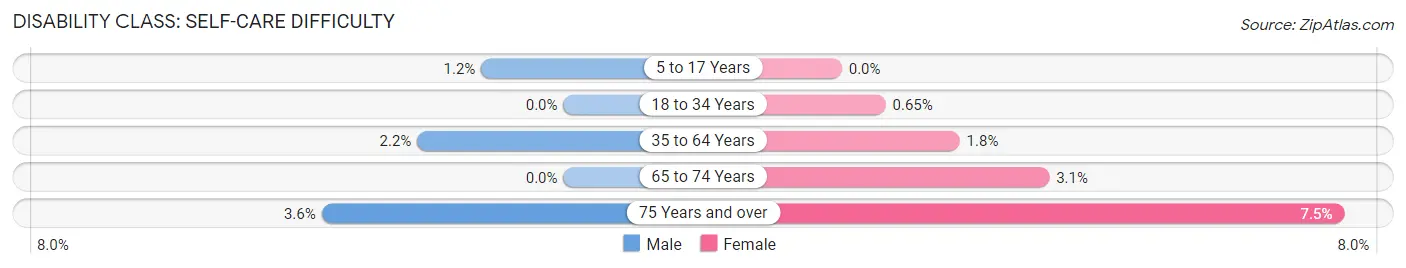
| Age Bracket | Male | Female |
| 5 to 17 Years | 34 (1.2%) | 0 (0.0%) |
| 18 to 34 Years | 0 (0.0%) | 18 (0.6%) |
| 35 to 64 Years | 170 (2.2%) | 143 (1.8%) |
| 65 to 74 Years | 0 (0.0%) | 87 (3.1%) |
| 75 Years and over | 47 (3.6%) | 118 (7.5%) |
Technology Access in Dare County
Computing Device Access in Dare County
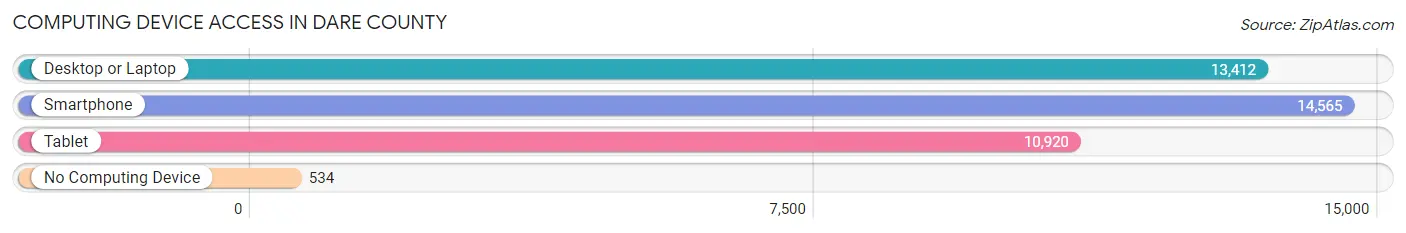
| Device Type | # Households | % Households |
| Desktop or Laptop | 13,412 | 83.4% |
| Smartphone | 14,565 | 90.6% |
| Tablet | 10,920 | 67.9% |
| No Computing Device | 534 | 3.3% |
| Total | 16,081 | 100.0% |
Internet Access in Dare County
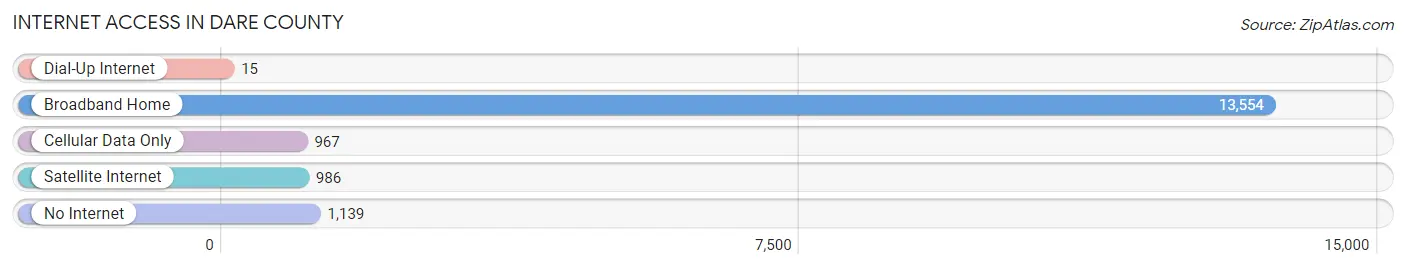
| Internet Type | # Households | % Households |
| Dial-Up Internet | 15 | 0.1% |
| Broadband Home | 13,554 | 84.3% |
| Cellular Data Only | 967 | 6.0% |
| Satellite Internet | 986 | 6.1% |
| No Internet | 1,139 | 7.1% |
| Total | 16,081 | 100.0% |
Dare County Summary
Dare County is a county located in the U.S. state of North Carolina. It is part of the Outer Banks region and is the easternmost county in the state. As of the 2010 census, the population was 33,920. Its county seat is Manteo.
History
Dare County was formed in 1870 from parts of Currituck and Hyde counties. It was named for Virginia Dare, the first English child born in the New World, in what is now Roanoke Island in the neighboring county of Dare.
Geography
Dare County is located in the northeastern corner of North Carolina, along the Atlantic Ocean. It is bordered by the counties of Currituck to the north, Hyde to the west, and Tyrrell to the south. The county is divided into two distinct geographic regions: the mainland and the Outer Banks. The mainland is a narrow strip of land that runs along the mainland coast of North Carolina, while the Outer Banks is a chain of barrier islands that stretches from the Virginia border to the southern tip of Ocracoke Island.
The county has a total area of 1,563 square miles, of which 1,037 square miles is land and 526 square miles (33.6%) is water.
Economy
Dare County is a popular tourist destination, with its beaches, lighthouses, and other attractions. Tourism is the county’s largest industry, accounting for more than half of the county’s total economic output. The county is also home to a number of military installations, including the Dare County Bombing Range and the Dare County Regional Airport.
Agriculture is also an important part of the county’s economy, with crops such as corn, soybeans, and wheat being grown in the area. Fishing is also a major industry, with the county’s waters being home to a variety of species, including bluefish, flounder, and shrimp.
Demographics
As of the 2010 census, there were 33,920 people, 14,845 households, and 9,945 families residing in the county. The population density was 32.7 people per square mile. There were 19,945 housing units at an average density of 19.2 per square mile. The racial makeup of the county was 92.2% White, 4.2% African American, 0.5% Native American, 0.7% Asian, 0.1% Pacific Islander, 1.2% from other races, and 1.2% from two or more races. Hispanic or Latino of any race were 3.2% of the population.
The median income for a household in the county was $45,845, and the median income for a family was $54,845. Males had a median income of $41,845 versus $30,845 for females. The per capita income for the county was $25,845. About 8.2% of families and 11.2% of the population were below the poverty line, including 15.2% of those under age 18 and 8.2% of those age 65 or over.
Common Questions
What is the Total Population of Dare County?
Total Population of Dare County is 37,160.
What is the Total Male Population of Dare County?
Total Male Population of Dare County is 18,548.
What is the Total Female Population of Dare County?
Total Female Population of Dare County is 18,612.
What is the Ratio of Males per 100 Females in Dare County?
There are 99.66 Males per 100 Females in Dare County.
What is the Ratio of Females per 100 Males in Dare County?
There are 100.35 Females per 100 Males in Dare County.
What is the Median Population Age in Dare County?
Median Population Age in Dare County is 48.1 Years.
What is the Average Family Size in Dare County
Average Family Size in Dare County is 2.8 People.
What is the Average Household Size in Dare County
Average Household Size in Dare County is 2.3 People.
What is Per Capita Income in Dare County?
Per Capita income in Dare County is $45,669.
What is the Median Family Income in Dare County?
Median Family Income in Dare County is $101,908.
What is the Median Household income in Dare County?
Median Household Income in Dare County is $79,742.
What is Income or Wage Gap in Dare County?
Income or Wage Gap in Dare County is 16.2%.
Women in Dare County earn 83.8 cents for every dollar earned by a man.
What is Inequality or Gini Index in Dare County?
Inequality or Gini Index in Dare County is 0.42.
How Large is the Labor Force in Dare County?
There are 20,217 People in the Labor Forcein in Dare County.
What is the Percentage of People in the Labor Force in Dare County?
65.0% of People are in the Labor Force in Dare County.
What is the Unemployment Rate in Dare County?
Unemployment Rate in Dare County is 5.1%.