Cumberland County, NC
Cumberland County Map
Cumberland County Overview
335,207
TOTAL POPULATION
166,798
MALE POPULATION
168,409
FEMALE POPULATION
99.04
MALES / 100 FEMALES
100.97
FEMALES / 100 MALES
31.7
MEDIAN AGE
3.2
AVG FAMILY SIZE
2.5
AVG HOUSEHOLD SIZE
$29,681
PER CAPITA INCOME
$66,288
AVG FAMILY INCOME
$55,551
AVG HOUSEHOLD INCOME
20.6%
WAGE / INCOME GAP [ % ]
79.4¢/ $1
WAGE / INCOME GAP [ $ ]
$11,157
FAMILY INCOME DEFICIT
0.45
INEQUALITY / GINI INDEX
167,544
LABOR FORCE [ PEOPLE ]
64.4%
PERCENT IN LABOR FORCE
7.9%
UNEMPLOYMENT RATE
Cumberland County Area Codes
Race in Cumberland County
The most populous races in Cumberland County are White / Caucasian (151,226 | 45.1%), Black / African American (124,680 | 37.2%), and Hispanic or Latino (41,992 | 12.5%).

| Race | # Population | % Population |
| Asian | 8,339 | 2.5% |
| Black / African American | 124,680 | 37.2% |
| Hawaiian / Pacific | 1,258 | 0.4% |
| Hispanic or Latino | 41,992 | 12.5% |
| Native / Alaskan | 4,085 | 1.2% |
| White / Caucasian | 151,226 | 45.1% |
| Two or more Races | 31,956 | 9.5% |
| Some other Race | 13,663 | 4.1% |
| Total | 335,207 | 100.0% |
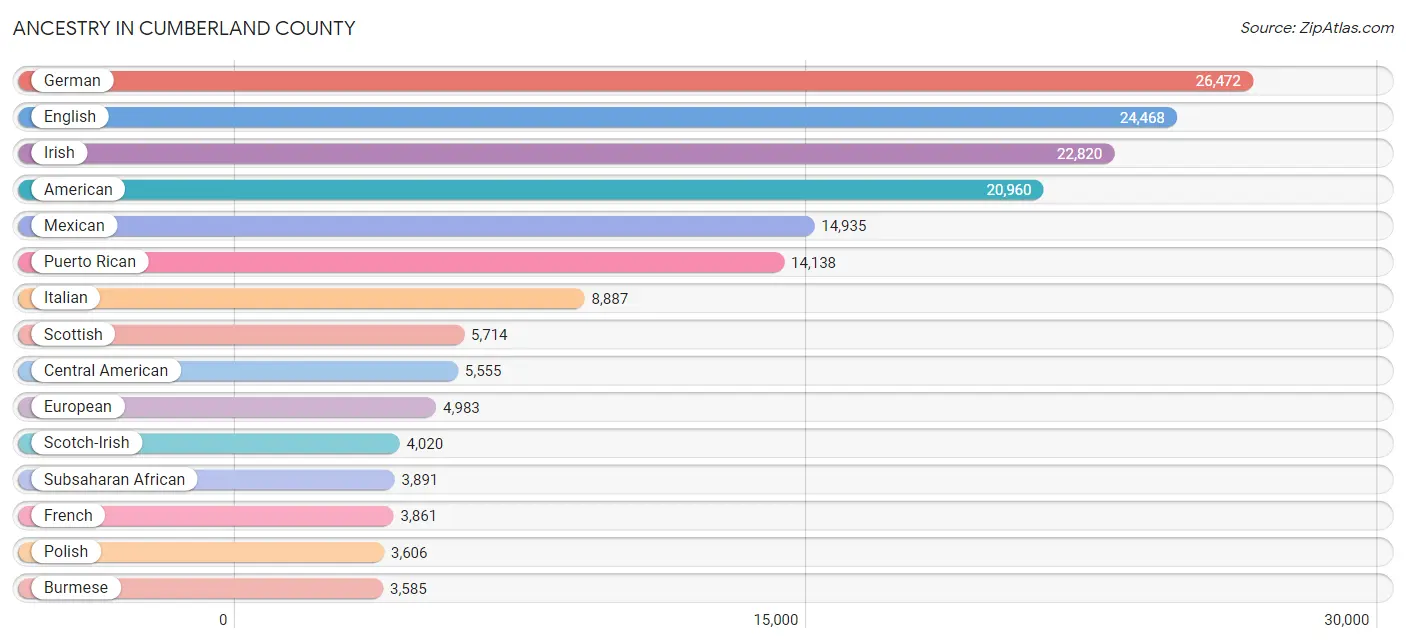
Ancestry in Cumberland County
The most populous ancestries reported in Cumberland County are German (26,472 | 7.9%), English (24,468 | 7.3%), Irish (22,820 | 6.8%), American (20,960 | 6.2%), and Mexican (14,935 | 4.5%), together accounting for 32.7% of all Cumberland County residents.
| Ancestry | # Population | % Population |
| Afghan | 122 | 0.0% |
| African | 2,065 | 0.6% |
| Albanian | 28 | 0.0% |
| Aleut | 2 | 0.0% |
| American | 20,960 | 6.2% |
| Apache | 199 | 0.1% |
| Arab | 1,562 | 0.5% |
| Arapaho | 76 | 0.0% |
| Argentinean | 81 | 0.0% |
| Armenian | 96 | 0.0% |
| Assyrian / Chaldean / Syriac | 8 | 0.0% |
| Australian | 37 | 0.0% |
| Austrian | 336 | 0.1% |
| Bahamian | 75 | 0.0% |
| Barbadian | 162 | 0.1% |
| Belgian | 68 | 0.0% |
| Bermudan | 7 | 0.0% |
| Bhutanese | 1,136 | 0.3% |
| Blackfeet | 539 | 0.2% |
| Bolivian | 71 | 0.0% |
| Brazilian | 240 | 0.1% |
| British | 1,276 | 0.4% |
| British West Indian | 208 | 0.1% |
| Bulgarian | 92 | 0.0% |
| Burmese | 3,585 | 1.1% |
| Cajun | 51 | 0.0% |
| Cambodian | 69 | 0.0% |
| Canadian | 243 | 0.1% |
| Cape Verdean | 19 | 0.0% |
| Celtic | 29 | 0.0% |
| Central American | 5,555 | 1.7% |
| Central American Indian | 540 | 0.2% |
| Cherokee | 2,802 | 0.8% |
| Cheyenne | 13 | 0.0% |
| Chickasaw | 119 | 0.0% |
| Chilean | 310 | 0.1% |
| Chippewa | 145 | 0.0% |
| Choctaw | 66 | 0.0% |
| Colombian | 1,095 | 0.3% |
| Comanche | 18 | 0.0% |
| Costa Rican | 200 | 0.1% |
| Creek | 38 | 0.0% |
| Croatian | 177 | 0.1% |
| Cuban | 1,181 | 0.4% |
| Czech | 324 | 0.1% |
| Czechoslovakian | 139 | 0.0% |
| Danish | 550 | 0.2% |
| Delaware | 24 | 0.0% |
| Dominican | 1,510 | 0.4% |
| Dutch | 1,416 | 0.4% |
| Dutch West Indian | 99 | 0.0% |
| Eastern European | 280 | 0.1% |
| Ecuadorian | 704 | 0.2% |
| Egyptian | 146 | 0.0% |
| English | 24,468 | 7.3% |
| Ethiopian | 188 | 0.1% |
| European | 4,983 | 1.5% |
| Filipino | 22 | 0.0% |
| Finnish | 322 | 0.1% |
| French | 3,861 | 1.1% |
| French American Indian | 23 | 0.0% |
| French Canadian | 868 | 0.3% |
| German | 26,472 | 7.9% |
| German Russian | 53 | 0.0% |
| Ghanaian | 414 | 0.1% |
| Greek | 717 | 0.2% |
| Guamanian / Chamorro | 723 | 0.2% |
| Guatemalan | 1,018 | 0.3% |
| Guyanese | 129 | 0.0% |
| Haitian | 991 | 0.3% |
| Honduran | 938 | 0.3% |
| Houma | 44 | 0.0% |
| Hungarian | 739 | 0.2% |
| Icelander | 10 | 0.0% |
| Indian (Asian) | 1,336 | 0.4% |
| Indonesian | 76 | 0.0% |
| Inupiat | 32 | 0.0% |
| Iranian | 119 | 0.0% |
| Iraqi | 218 | 0.1% |
| Irish | 22,820 | 6.8% |
| Iroquois | 151 | 0.1% |
| Israeli | 87 | 0.0% |
| Italian | 8,887 | 2.6% |
| Jamaican | 3,056 | 0.9% |
| Japanese | 64 | 0.0% |
| Jordanian | 13 | 0.0% |
| Kenyan | 73 | 0.0% |
| Korean | 3,473 | 1.0% |
| Laotian | 53 | 0.0% |
| Latvian | 15 | 0.0% |
| Lebanese | 229 | 0.1% |
| Liberian | 34 | 0.0% |
| Lithuanian | 94 | 0.0% |
| Lumbee | 3,021 | 0.9% |
| Macedonian | 17 | 0.0% |
| Malaysian | 125 | 0.0% |
| Marshallese | 5 | 0.0% |
| Menominee | 38 | 0.0% |
| Mexican | 14,935 | 4.5% |
| Mexican American Indian | 351 | 0.1% |
| Mongolian | 10 | 0.0% |
| Moroccan | 232 | 0.1% |
| Native Hawaiian | 760 | 0.2% |
| Navajo | 144 | 0.0% |
| Nepalese | 4 | 0.0% |
| New Zealander | 42 | 0.0% |
| Nicaraguan | 193 | 0.1% |
| Nigerian | 511 | 0.2% |
| Northern European | 328 | 0.1% |
| Norwegian | 1,071 | 0.3% |
| Pakistani | 570 | 0.2% |
| Palestinian | 51 | 0.0% |
| Panamanian | 2,104 | 0.6% |
| Paraguayan | 16 | 0.0% |
| Pennsylvania German | 89 | 0.0% |
| Peruvian | 388 | 0.1% |
| Polish | 3,606 | 1.1% |
| Portuguese | 832 | 0.3% |
| Puerto Rican | 14,138 | 4.2% |
| Romanian | 254 | 0.1% |
| Russian | 983 | 0.3% |
| Salvadoran | 980 | 0.3% |
| Samoan | 385 | 0.1% |
| Scandinavian | 655 | 0.2% |
| Scotch-Irish | 4,020 | 1.2% |
| Scottish | 5,714 | 1.7% |
| Seminole | 70 | 0.0% |
| Serbian | 37 | 0.0% |
| Shoshone | 4 | 0.0% |
| Sierra Leonean | 19 | 0.0% |
| Sioux | 140 | 0.0% |
| Slavic | 96 | 0.0% |
| Slovak | 192 | 0.1% |
| Slovene | 32 | 0.0% |
| Somali | 35 | 0.0% |
| South African | 46 | 0.0% |
| South American | 2,896 | 0.9% |
| South American Indian | 16 | 0.0% |
| Spaniard | 612 | 0.2% |
| Spanish | 356 | 0.1% |
| Sri Lankan | 1,291 | 0.4% |
| Subsaharan African | 3,891 | 1.2% |
| Sudanese | 139 | 0.0% |
| Swedish | 1,563 | 0.5% |
| Swiss | 323 | 0.1% |
| Syrian | 39 | 0.0% |
| Thai | 1,450 | 0.4% |
| Tohono O'Odham | 19 | 0.0% |
| Tongan | 26 | 0.0% |
| Trinidadian and Tobagonian | 354 | 0.1% |
| Turkish | 251 | 0.1% |
| U.S. Virgin Islander | 31 | 0.0% |
| Ugandan | 20 | 0.0% |
| Ukrainian | 264 | 0.1% |
| Uruguayan | 19 | 0.0% |
| Ute | 46 | 0.0% |
| Venezuelan | 203 | 0.1% |
| Vietnamese | 11 | 0.0% |
| Welsh | 1,177 | 0.4% |
| West Indian | 366 | 0.1% |
| Yaqui | 15 | 0.0% |
| Yugoslavian | 52 | 0.0% |
| Zimbabwean | 10 | 0.0% | View All 163 Rows |
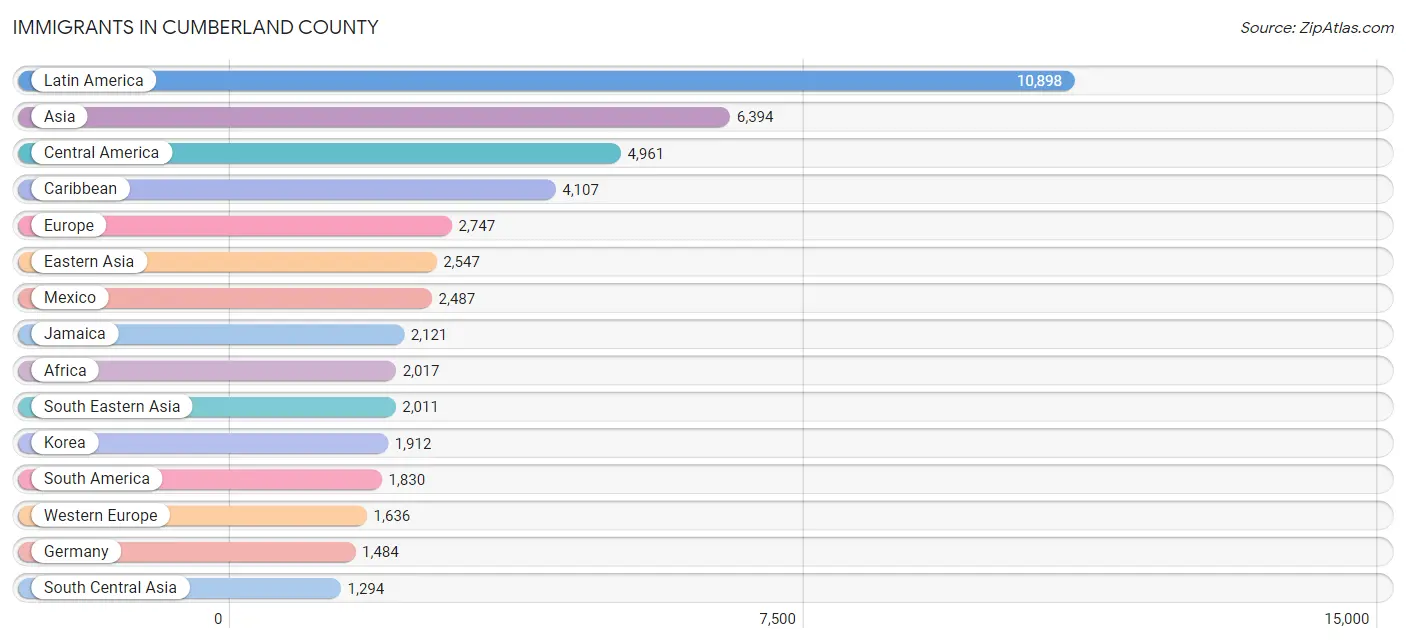
Immigrants in Cumberland County
The most numerous immigrant groups reported in Cumberland County came from Latin America (10,898 | 3.3%), Asia (6,394 | 1.9%), Central America (4,961 | 1.5%), Caribbean (4,107 | 1.2%), and Europe (2,747 | 0.8%), together accounting for 8.7% of all Cumberland County residents.
| Immigration Origin | # Population | % Population |
| Afghanistan | 136 | 0.0% |
| Africa | 2,017 | 0.6% |
| Albania | 11 | 0.0% |
| Argentina | 48 | 0.0% |
| Asia | 6,394 | 1.9% |
| Australia | 27 | 0.0% |
| Austria | 11 | 0.0% |
| Bahamas | 64 | 0.0% |
| Bangladesh | 78 | 0.0% |
| Barbados | 151 | 0.1% |
| Belgium | 15 | 0.0% |
| Bolivia | 38 | 0.0% |
| Brazil | 231 | 0.1% |
| Bulgaria | 40 | 0.0% |
| Cabo Verde | 7 | 0.0% |
| Cambodia | 33 | 0.0% |
| Cameroon | 109 | 0.0% |
| Canada | 216 | 0.1% |
| Caribbean | 4,107 | 1.2% |
| Central America | 4,961 | 1.5% |
| Chile | 112 | 0.0% |
| China | 308 | 0.1% |
| Colombia | 579 | 0.2% |
| Costa Rica | 133 | 0.0% |
| Cuba | 157 | 0.1% |
| Czechoslovakia | 42 | 0.0% |
| Dominica | 22 | 0.0% |
| Dominican Republic | 640 | 0.2% |
| Eastern Africa | 326 | 0.1% |
| Eastern Asia | 2,547 | 0.8% |
| Eastern Europe | 582 | 0.2% |
| Ecuador | 259 | 0.1% |
| Egypt | 77 | 0.0% |
| El Salvador | 468 | 0.1% |
| England | 169 | 0.1% |
| Eritrea | 20 | 0.0% |
| Ethiopia | 73 | 0.0% |
| Europe | 2,747 | 0.8% |
| Fiji | 14 | 0.0% |
| France | 101 | 0.0% |
| Germany | 1,484 | 0.4% |
| Ghana | 515 | 0.2% |
| Greece | 93 | 0.0% |
| Grenada | 85 | 0.0% |
| Guatemala | 490 | 0.2% |
| Guyana | 192 | 0.1% |
| Haiti | 482 | 0.1% |
| Honduras | 438 | 0.1% |
| Hong Kong | 15 | 0.0% |
| Hungary | 41 | 0.0% |
| India | 673 | 0.2% |
| Indonesia | 9 | 0.0% |
| Iran | 10 | 0.0% |
| Iraq | 215 | 0.1% |
| Ireland | 6 | 0.0% |
| Italy | 80 | 0.0% |
| Jamaica | 2,121 | 0.6% |
| Japan | 274 | 0.1% |
| Jordan | 13 | 0.0% |
| Kazakhstan | 46 | 0.0% |
| Kenya | 99 | 0.0% |
| Korea | 1,912 | 0.6% |
| Laos | 3 | 0.0% |
| Latin America | 10,898 | 3.3% |
| Lebanon | 45 | 0.0% |
| Liberia | 78 | 0.0% |
| Malaysia | 20 | 0.0% |
| Mexico | 2,487 | 0.7% |
| Micronesia | 89 | 0.0% |
| Middle Africa | 137 | 0.0% |
| Morocco | 47 | 0.0% |
| Nepal | 202 | 0.1% |
| Netherlands | 25 | 0.0% |
| Nicaragua | 76 | 0.0% |
| Nigeria | 301 | 0.1% |
| Northern Africa | 196 | 0.1% |
| Northern Europe | 334 | 0.1% |
| Norway | 16 | 0.0% |
| Oceania | 321 | 0.1% |
| Pakistan | 106 | 0.0% |
| Panama | 869 | 0.3% |
| Peru | 218 | 0.1% |
| Philippines | 1,124 | 0.3% |
| Poland | 76 | 0.0% |
| Romania | 37 | 0.0% |
| Russia | 185 | 0.1% |
| Saudi Arabia | 23 | 0.0% |
| Scotland | 23 | 0.0% |
| Senegal | 21 | 0.0% |
| Serbia | 8 | 0.0% |
| Sierra Leone | 19 | 0.0% |
| Singapore | 12 | 0.0% |
| Somalia | 27 | 0.0% |
| South Africa | 45 | 0.0% |
| South America | 1,830 | 0.5% |
| South Central Asia | 1,294 | 0.4% |
| South Eastern Asia | 2,011 | 0.6% |
| Southern Europe | 195 | 0.1% |
| Spain | 22 | 0.0% |
| Sudan | 20 | 0.0% |
| Taiwan | 9 | 0.0% |
| Thailand | 293 | 0.1% |
| Trinidad and Tobago | 276 | 0.1% |
| Turkey | 61 | 0.0% |
| Uganda | 20 | 0.0% |
| Ukraine | 78 | 0.0% |
| Uruguay | 8 | 0.0% |
| Uzbekistan | 19 | 0.0% |
| Venezuela | 145 | 0.0% |
| Vietnam | 495 | 0.2% |
| West Indies | 9 | 0.0% |
| Western Africa | 1,200 | 0.4% |
| Western Asia | 518 | 0.2% |
| Western Europe | 1,636 | 0.5% |
| Yemen | 142 | 0.0% |
| Zimbabwe | 60 | 0.0% | View All 116 Rows |
Sex and Age in Cumberland County
Sex and Age in Cumberland County
The most populous age groups in Cumberland County are 20 to 24 Years (19,853 | 11.9%) for men and 25 to 29 Years (14,033 | 8.3%) for women.

| Age Bracket | Male | Female |
| Under 5 Years | 12,550 (7.5%) | 12,268 (7.3%) |
| 5 to 9 Years | 12,031 (7.2%) | 11,521 (6.8%) |
| 10 to 14 Years | 11,332 (6.8%) | 11,028 (6.6%) |
| 15 to 19 Years | 12,422 (7.4%) | 10,484 (6.2%) |
| 20 to 24 Years | 19,853 (11.9%) | 13,451 (8.0%) |
| 25 to 29 Years | 16,639 (10.0%) | 14,033 (8.3%) |
| 30 to 34 Years | 12,730 (7.6%) | 12,679 (7.5%) |
| 35 to 39 Years | 10,204 (6.1%) | 11,019 (6.5%) |
| 40 to 44 Years | 9,336 (5.6%) | 10,197 (6.0%) |
| 45 to 49 Years | 8,011 (4.8%) | 9,208 (5.5%) |
| 50 to 54 Years | 7,984 (4.8%) | 9,276 (5.5%) |
| 55 to 59 Years | 8,615 (5.2%) | 9,808 (5.8%) |
| 60 to 64 Years | 7,448 (4.5%) | 9,297 (5.5%) |
| 65 to 69 Years | 6,039 (3.6%) | 7,643 (4.5%) |
| 70 to 74 Years | 5,294 (3.2%) | 6,037 (3.6%) |
| 75 to 79 Years | 3,131 (1.9%) | 4,636 (2.8%) |
| 80 to 84 Years | 1,762 (1.1%) | 2,706 (1.6%) |
| 85 Years and over | 1,417 (0.9%) | 3,118 (1.8%) |
| Total | 166,798 (100.0%) | 168,409 (100.0%) |
Families and Households in Cumberland County
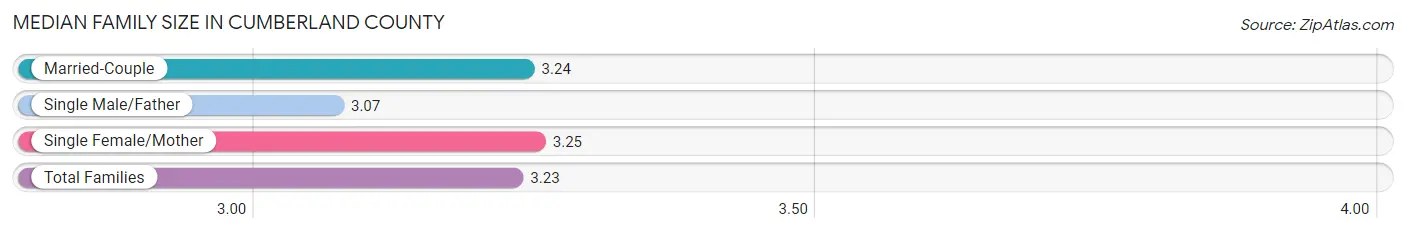
Median Family Size in Cumberland County
The median family size in Cumberland County is 3.23 persons per family, with single female/mother families (21,353 | 27.2%) accounting for the largest median family size of 3.25 persons per family. On the other hand, single male/father families (5,697 | 7.2%) represent the smallest median family size with 3.07 persons per family.
| Family Type | # Families | Family Size |
| Married-Couple | 51,574 (65.6%) | 3.24 |
| Single Male/Father | 5,697 (7.2%) | 3.07 |
| Single Female/Mother | 21,353 (27.2%) | 3.25 |
| Total Families | 78,624 (100.0%) | 3.23 |
Median Household Size in Cumberland County
The median household size in Cumberland County is 2.52 persons per household, with single male/father households (5,697 | 4.5%) accounting for the largest median household size of 3.5 persons per household. non-family households (48,121 | 38.0%) represent the smallest median household size with 1.18 persons per household.
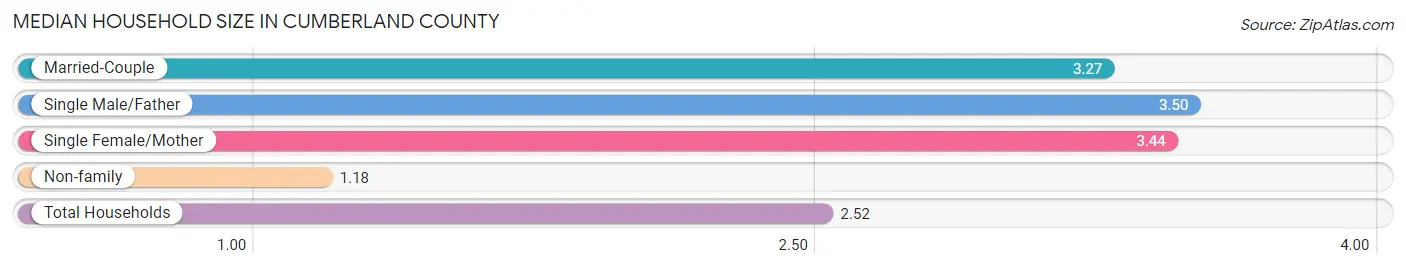
| Household Type | # Households | Household Size |
| Married-Couple | 51,574 (40.7%) | 3.27 |
| Single Male/Father | 5,697 (4.5%) | 3.50 |
| Single Female/Mother | 21,353 (16.9%) | 3.44 |
| Non-family | 48,121 (38.0%) | 1.18 |
| Total Households | 126,745 (100.0%) | 2.52 |
Household Size by Marriage Status in Cumberland County
Out of a total of 126,745 households in Cumberland County, 78,624 (62.0%) are family households, while 48,121 (38.0%) are nonfamily households. The most numerous type of family households are 2-person households, comprising 34,977, and the most common type of nonfamily households are 1-person households, comprising 41,528.
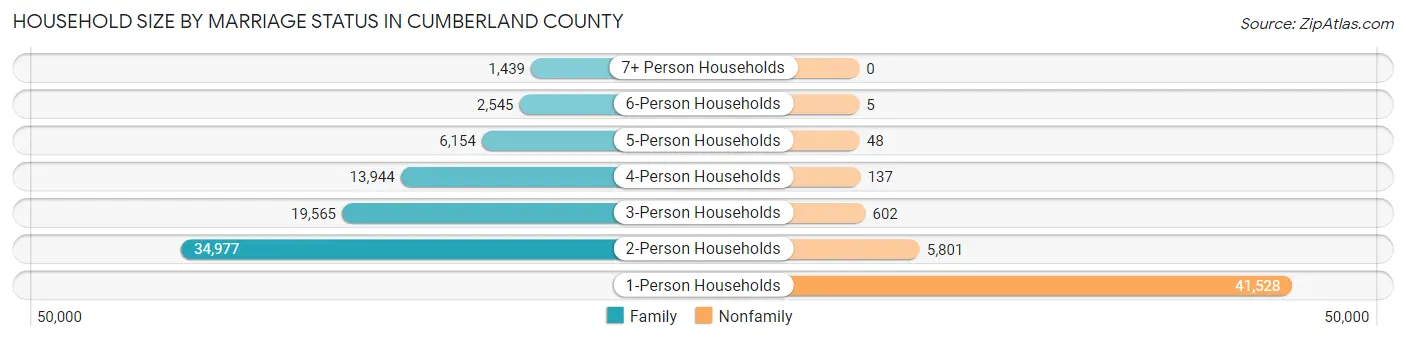
| Household Size | Family Households | Nonfamily Households |
| 1-Person Households | - | 41,528 (32.8%) |
| 2-Person Households | 34,977 (27.6%) | 5,801 (4.6%) |
| 3-Person Households | 19,565 (15.4%) | 602 (0.5%) |
| 4-Person Households | 13,944 (11.0%) | 137 (0.1%) |
| 5-Person Households | 6,154 (4.9%) | 48 (0.0%) |
| 6-Person Households | 2,545 (2.0%) | 5 (0.0%) |
| 7+ Person Households | 1,439 (1.1%) | 0 (0.0%) |
| Total | 78,624 (62.0%) | 48,121 (38.0%) |
Female Fertility in Cumberland County
Fertility by Age in Cumberland County
Average fertility rate in Cumberland County is 58.0 births per 1,000 women. Women in the age bracket of 20 to 34 years have the highest fertility rate with 99.0 births per 1,000 women. Women in the age bracket of 20 to 34 years acount for 82.8% of all women with births.
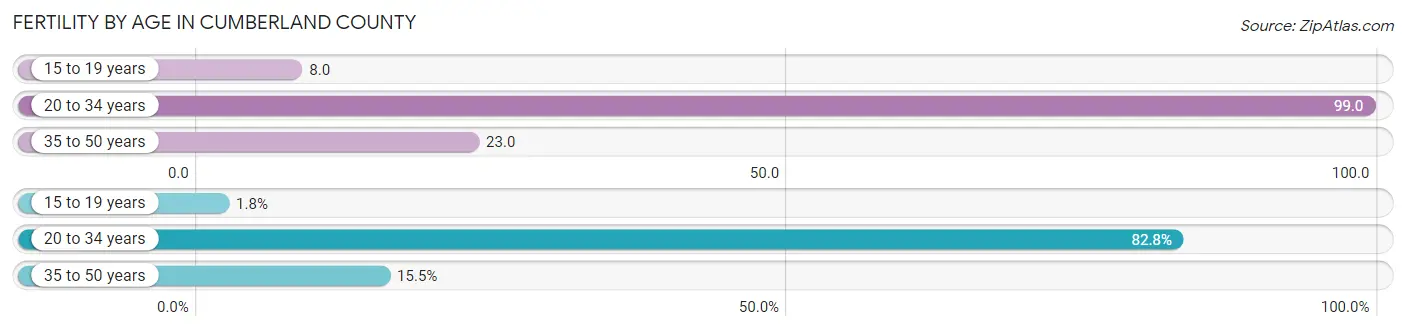
| Age Bracket | Women with Births | Births / 1,000 Women |
| 15 to 19 years | 86 (1.8%) | 8.0 |
| 20 to 34 years | 3,974 (82.8%) | 99.0 |
| 35 to 50 years | 742 (15.4%) | 23.0 |
| Total | 4,802 (100.0%) | 58.0 |
Fertility by Age by Marriage Status in Cumberland County
67.5% of women with births (4,802) in Cumberland County are married. The highest percentage of unmarried women with births falls into 15 to 19 years age bracket with 48.8% of them unmarried at the time of birth, while the lowest percentage of unmarried women with births belong to 35 to 50 years age bracket with 16.6% of them unmarried.
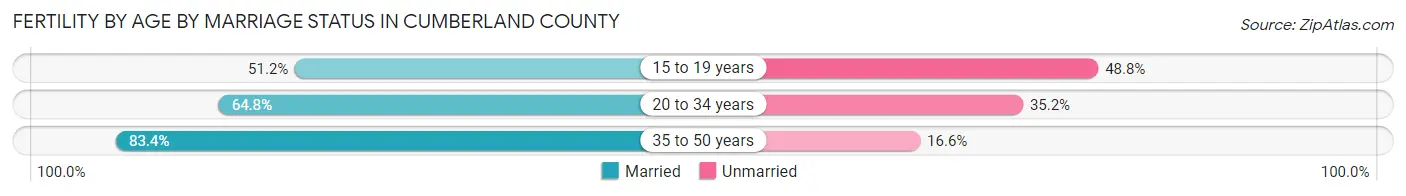
| Age Bracket | Married | Unmarried |
| 15 to 19 years | 44 (51.2%) | 42 (48.8%) |
| 20 to 34 years | 2,575 (64.8%) | 1,399 (35.2%) |
| 35 to 50 years | 619 (83.4%) | 123 (16.6%) |
| Total | 3,241 (67.5%) | 1,561 (32.5%) |
Fertility by Education in Cumberland County
Average fertility rate in Cumberland County is 58.0 births per 1,000 women. Women with the education attainment of college or associate's degree have the highest fertility rate of 68.0 births per 1,000 women, while women with the education attainment of less than high school have the lowest fertility at 25.0 births per 1,000 women. Women with the education attainment of college or associate's degree represent 47.7% of all women with births.
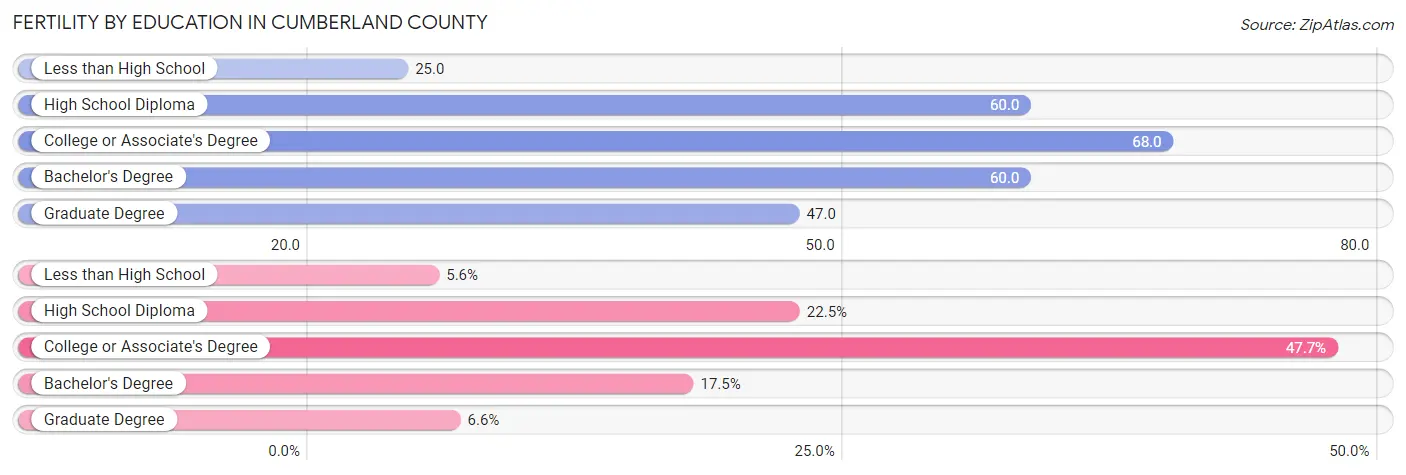
| Educational Attainment | Women with Births | Births / 1,000 Women |
| Less than High School | 270 (5.6%) | 25.0 |
| High School Diploma | 1,081 (22.5%) | 60.0 |
| College or Associate's Degree | 2,291 (47.7%) | 68.0 |
| Bachelor's Degree | 842 (17.5%) | 60.0 |
| Graduate Degree | 318 (6.6%) | 47.0 |
| Total | 4,802 (100.0%) | 58.0 |
Fertility by Education by Marriage Status in Cumberland County
32.5% of women with births in Cumberland County are unmarried. Women with the educational attainment of graduate degree are most likely to be married with 96.9% of them married at childbirth, while women with the educational attainment of high school diploma are least likely to be married with 50.9% of them unmarried at childbirth.
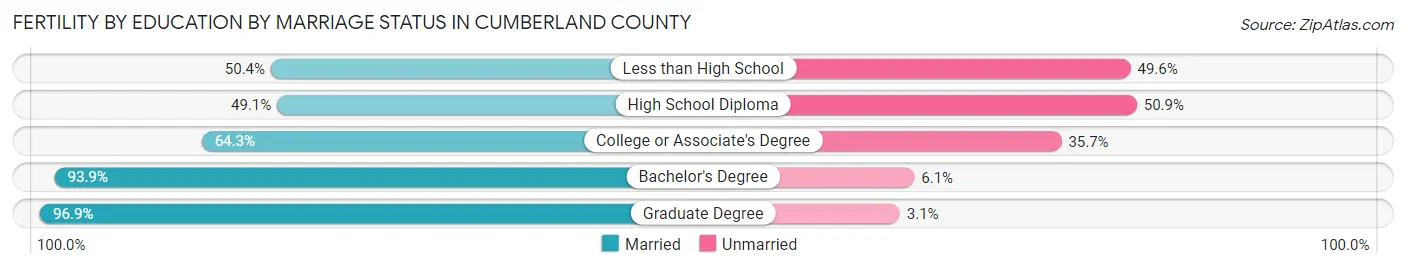
| Educational Attainment | Married | Unmarried |
| Less than High School | 136 (50.4%) | 134 (49.6%) |
| High School Diploma | 531 (49.1%) | 550 (50.9%) |
| College or Associate's Degree | 1,473 (64.3%) | 818 (35.7%) |
| Bachelor's Degree | 791 (93.9%) | 51 (6.1%) |
| Graduate Degree | 308 (96.9%) | 10 (3.1%) |
| Total | 3,241 (67.5%) | 1,561 (32.5%) |
Income in Cumberland County
Income Overview in Cumberland County
Per Capita Income in Cumberland County is $29,681, while median incomes of families and households are $66,288 and $55,551 respectively.
| Characteristic | Number | Measure |
| Per Capita Income | 335,207 | $29,681 |
| Median Family Income | 78,624 | $66,288 |
| Mean Family Income | 78,624 | $84,993 |
| Median Household Income | 126,745 | $55,551 |
| Mean Household Income | 126,745 | $72,768 |
| Income Deficit | 78,624 | $11,157 |
| Wage / Income Gap (%) | 335,207 | 20.65% |
| Wage / Income Gap ($) | 335,207 | 79.35¢ per $1 |
| Gini / Inequality Index | 335,207 | 0.45 |
Earnings by Sex in Cumberland County
Average Earnings in Cumberland County are $34,152, $37,619 for men and $29,851 for women, a difference of 20.6%.
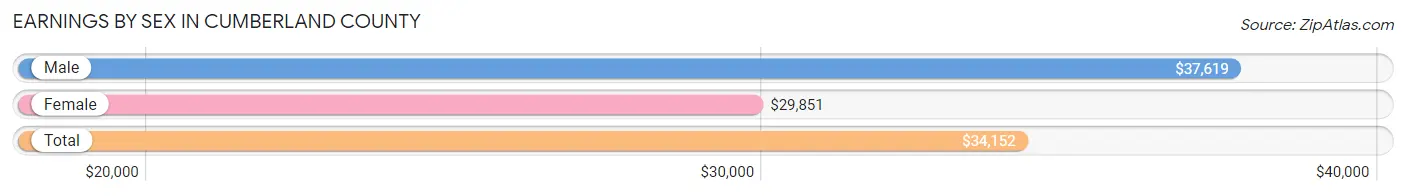
| Sex | Number | Average Earnings |
| Male | 92,145 (53.9%) | $37,619 |
| Female | 78,734 (46.1%) | $29,851 |
| Total | 170,879 (100.0%) | $34,152 |
Earnings by Sex by Income Bracket in Cumberland County
The most common earnings brackets in Cumberland County are $25,000 to $29,999 for men (9,351 | 10.2%) and $25,000 to $29,999 for women (6,879 | 8.7%).
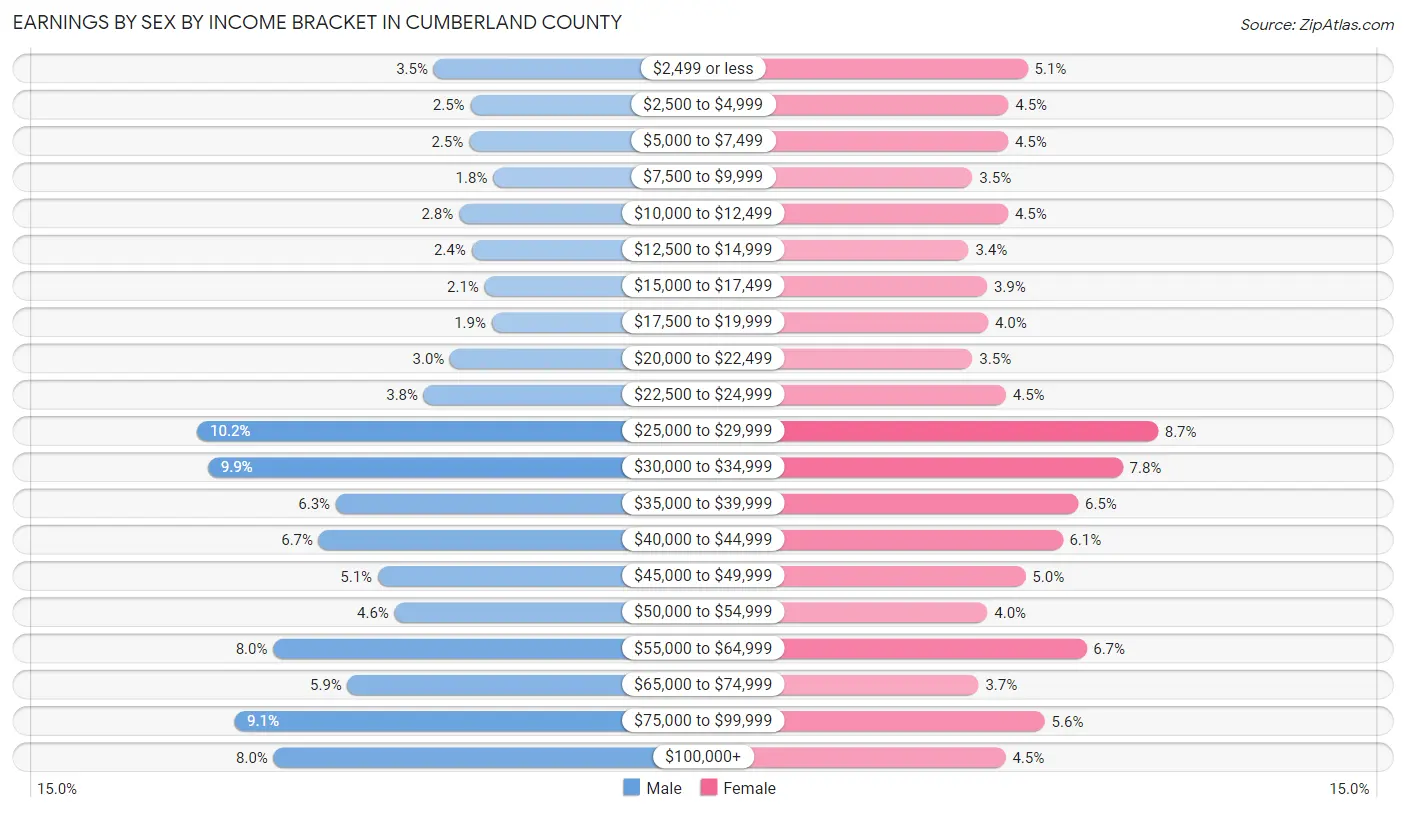
| Income | Male | Female |
| $2,499 or less | 3,228 (3.5%) | 4,001 (5.1%) |
| $2,500 to $4,999 | 2,273 (2.5%) | 3,574 (4.5%) |
| $5,000 to $7,499 | 2,310 (2.5%) | 3,565 (4.5%) |
| $7,500 to $9,999 | 1,690 (1.8%) | 2,780 (3.5%) |
| $10,000 to $12,499 | 2,575 (2.8%) | 3,567 (4.5%) |
| $12,500 to $14,999 | 2,247 (2.4%) | 2,695 (3.4%) |
| $15,000 to $17,499 | 1,905 (2.1%) | 3,102 (3.9%) |
| $17,500 to $19,999 | 1,726 (1.9%) | 3,124 (4.0%) |
| $20,000 to $22,499 | 2,800 (3.0%) | 2,777 (3.5%) |
| $22,500 to $24,999 | 3,487 (3.8%) | 3,521 (4.5%) |
| $25,000 to $29,999 | 9,351 (10.2%) | 6,879 (8.7%) |
| $30,000 to $34,999 | 9,074 (9.9%) | 6,102 (7.7%) |
| $35,000 to $39,999 | 5,763 (6.2%) | 5,120 (6.5%) |
| $40,000 to $44,999 | 6,200 (6.7%) | 4,768 (6.1%) |
| $45,000 to $49,999 | 4,671 (5.1%) | 3,951 (5.0%) |
| $50,000 to $54,999 | 4,240 (4.6%) | 3,108 (4.0%) |
| $55,000 to $64,999 | 7,384 (8.0%) | 5,297 (6.7%) |
| $65,000 to $74,999 | 5,456 (5.9%) | 2,914 (3.7%) |
| $75,000 to $99,999 | 8,395 (9.1%) | 4,375 (5.6%) |
| $100,000+ | 7,370 (8.0%) | 3,514 (4.5%) |
| Total | 92,145 (100.0%) | 78,734 (100.0%) |
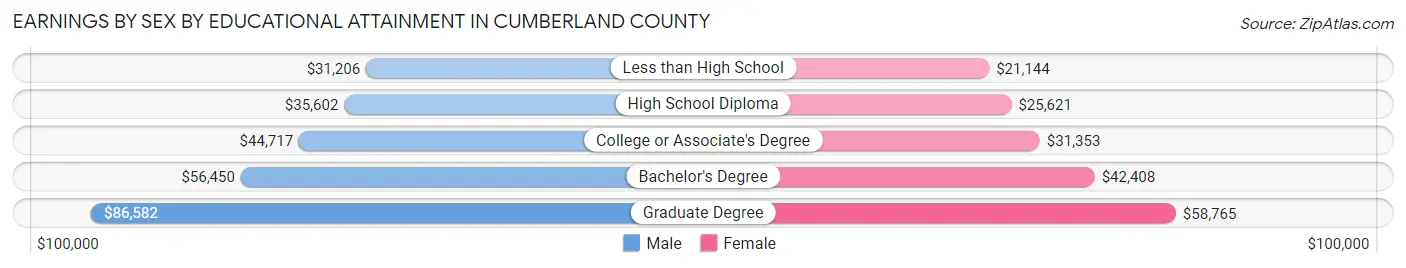
Earnings by Sex by Educational Attainment in Cumberland County
Average earnings in Cumberland County are $45,195 for men and $34,320 for women, a difference of 24.1%. Men with an educational attainment of graduate degree enjoy the highest average annual earnings of $86,582, while those with less than high school education earn the least with $31,206. Women with an educational attainment of graduate degree earn the most with the average annual earnings of $58,765, while those with less than high school education have the smallest earnings of $21,144.
| Educational Attainment | Male Income | Female Income |
| Less than High School | $31,206 | $21,144 |
| High School Diploma | $35,602 | $25,621 |
| College or Associate's Degree | $44,717 | $31,353 |
| Bachelor's Degree | $56,450 | $42,408 |
| Graduate Degree | $86,582 | $58,765 |
| Total | $45,195 | $34,320 |
Family Income in Cumberland County
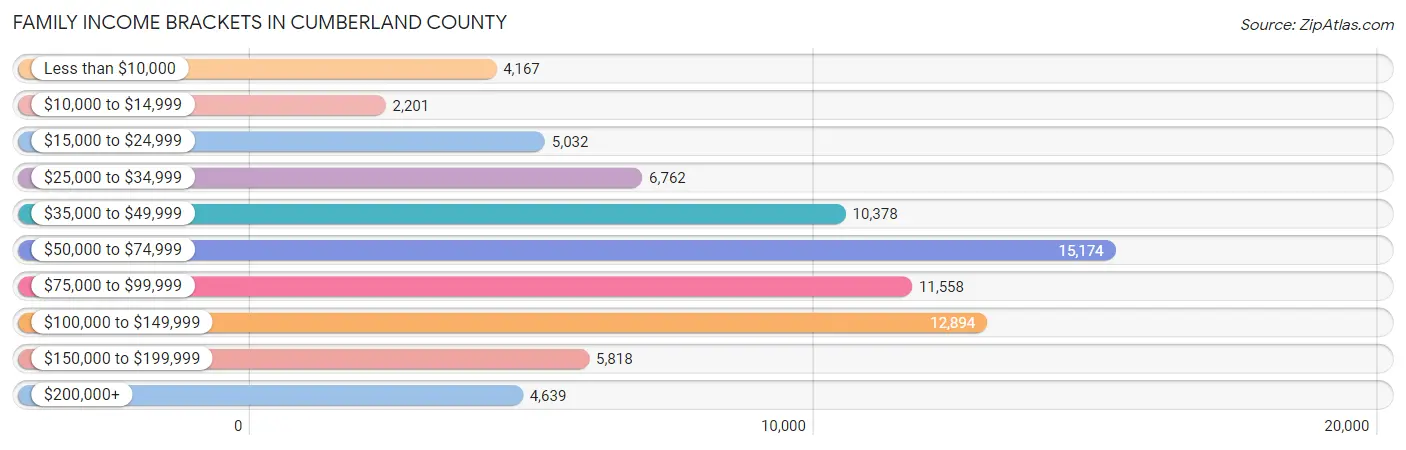
Family Income Brackets in Cumberland County
According to the Cumberland County family income data, there are 15,174 families falling into the $50,000 to $74,999 income range, which is the most common income bracket and makes up 19.3% of all families. Conversely, the $10,000 to $14,999 income bracket is the least frequent group with only 2,201 families (2.8%) belonging to this category.
| Income Bracket | # Families | % Families |
| Less than $10,000 | 4,167 | 5.3% |
| $10,000 to $14,999 | 2,201 | 2.8% |
| $15,000 to $24,999 | 5,032 | 6.4% |
| $25,000 to $34,999 | 6,762 | 8.6% |
| $35,000 to $49,999 | 10,378 | 13.2% |
| $50,000 to $74,999 | 15,174 | 19.3% |
| $75,000 to $99,999 | 11,558 | 14.7% |
| $100,000 to $149,999 | 12,894 | 16.4% |
| $150,000 to $199,999 | 5,818 | 7.4% |
| $200,000+ | 4,639 | 5.9% |
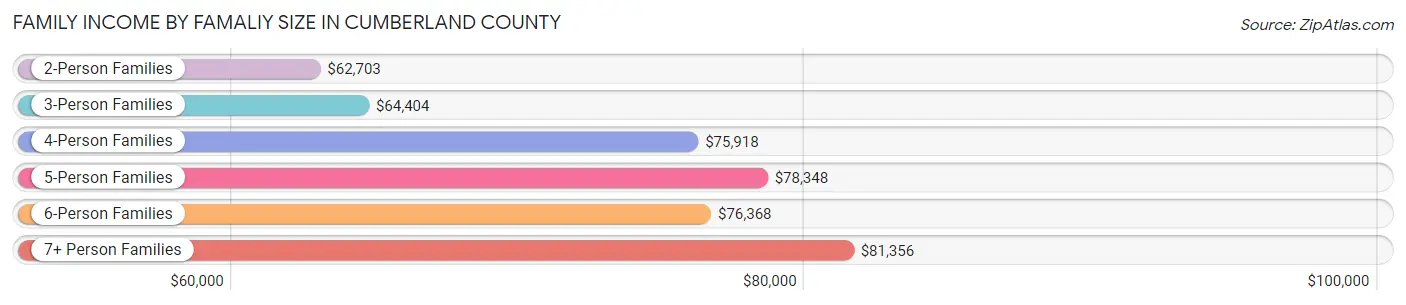
Family Income by Famaliy Size in Cumberland County
7+ person families (1,175 | 1.5%) account for the highest median family income in Cumberland County with $81,356 per family, while 2-person families (37,783 | 48.1%) have the highest median income of $31,352 per family member.
| Income Bracket | # Families | Median Income |
| 2-Person Families | 37,783 (48.1%) | $62,703 |
| 3-Person Families | 18,617 (23.7%) | $64,404 |
| 4-Person Families | 13,159 (16.7%) | $75,918 |
| 5-Person Families | 5,621 (7.1%) | $78,348 |
| 6-Person Families | 2,269 (2.9%) | $76,368 |
| 7+ Person Families | 1,175 (1.5%) | $81,356 |
| Total | 78,624 (100.0%) | $66,288 |
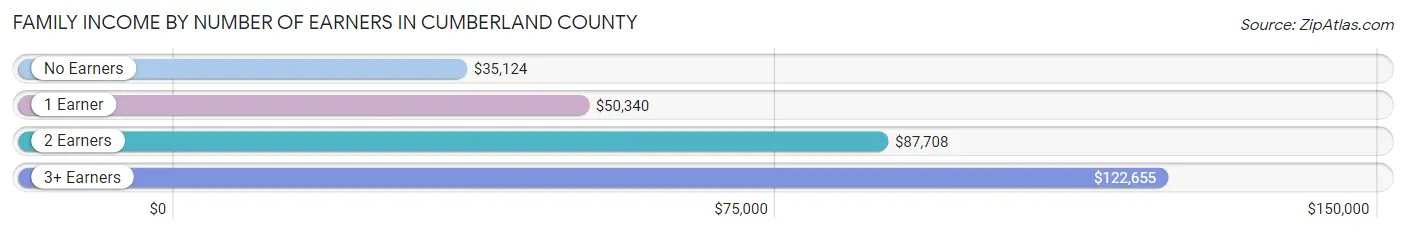
Family Income by Number of Earners in Cumberland County
The median family income in Cumberland County is $66,288, with families comprising 3+ earners (5,707) having the highest median family income of $122,655, while families with no earners (12,185) have the lowest median family income of $35,124, accounting for 7.3% and 15.5% of families, respectively.
| Number of Earners | # Families | Median Income |
| No Earners | 12,185 (15.5%) | $35,124 |
| 1 Earner | 30,746 (39.1%) | $50,340 |
| 2 Earners | 29,986 (38.1%) | $87,708 |
| 3+ Earners | 5,707 (7.3%) | $122,655 |
| Total | 78,624 (100.0%) | $66,288 |
Household Income in Cumberland County
Household Income Brackets in Cumberland County
With 24,335 households falling in the category, the $50,000 to $74,999 income range is the most frequent in Cumberland County, accounting for 19.2% of all households. In contrast, only 5,323 households (4.2%) fall into the $200,000+ income bracket, making it the least populous group.
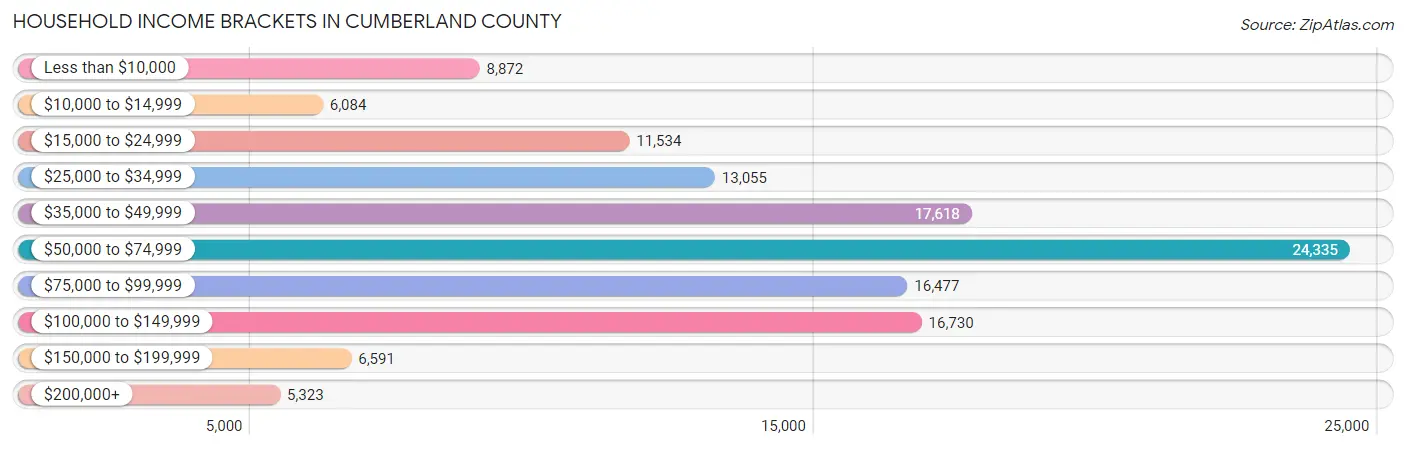
| Income Bracket | # Households | % Households |
| Less than $10,000 | 8,872 | 7.0% |
| $10,000 to $14,999 | 6,084 | 4.8% |
| $15,000 to $24,999 | 11,534 | 9.1% |
| $25,000 to $34,999 | 13,055 | 10.3% |
| $35,000 to $49,999 | 17,618 | 13.9% |
| $50,000 to $74,999 | 24,335 | 19.2% |
| $75,000 to $99,999 | 16,477 | 13.0% |
| $100,000 to $149,999 | 16,730 | 13.2% |
| $150,000 to $199,999 | 6,591 | 5.2% |
| $200,000+ | 5,323 | 4.2% |
Household Income by Householder Age in Cumberland County
The median household income in Cumberland County is $55,551, with the highest median household income of $64,307 found in the 45 to 64 years age bracket for the primary householder. A total of 41,043 households (32.4%) fall into this category. Meanwhile, the 15 to 24 years age bracket for the primary householder has the lowest median household income of $41,132, with 9,201 households (7.3%) in this group.
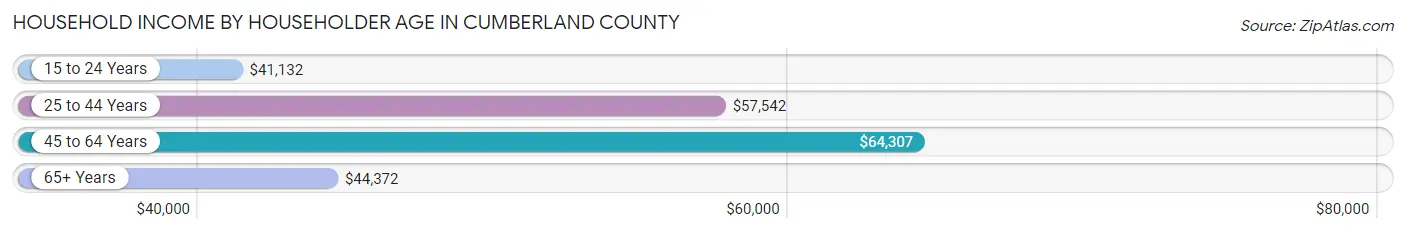
| Income Bracket | # Households | Median Income |
| 15 to 24 Years | 9,201 (7.3%) | $41,132 |
| 25 to 44 Years | 49,867 (39.3%) | $57,542 |
| 45 to 64 Years | 41,043 (32.4%) | $64,307 |
| 65+ Years | 26,634 (21.0%) | $44,372 |
| Total | 126,745 (100.0%) | $55,551 |
Poverty in Cumberland County
Income Below Poverty by Sex and Age in Cumberland County
With 15.5% poverty level for males and 19.4% for females among the residents of Cumberland County, 5 year old males and under 5 year old females are the most vulnerable to poverty, with 724 males (29.1%) and 3,212 females (26.7%) in their respective age groups living below the poverty level.
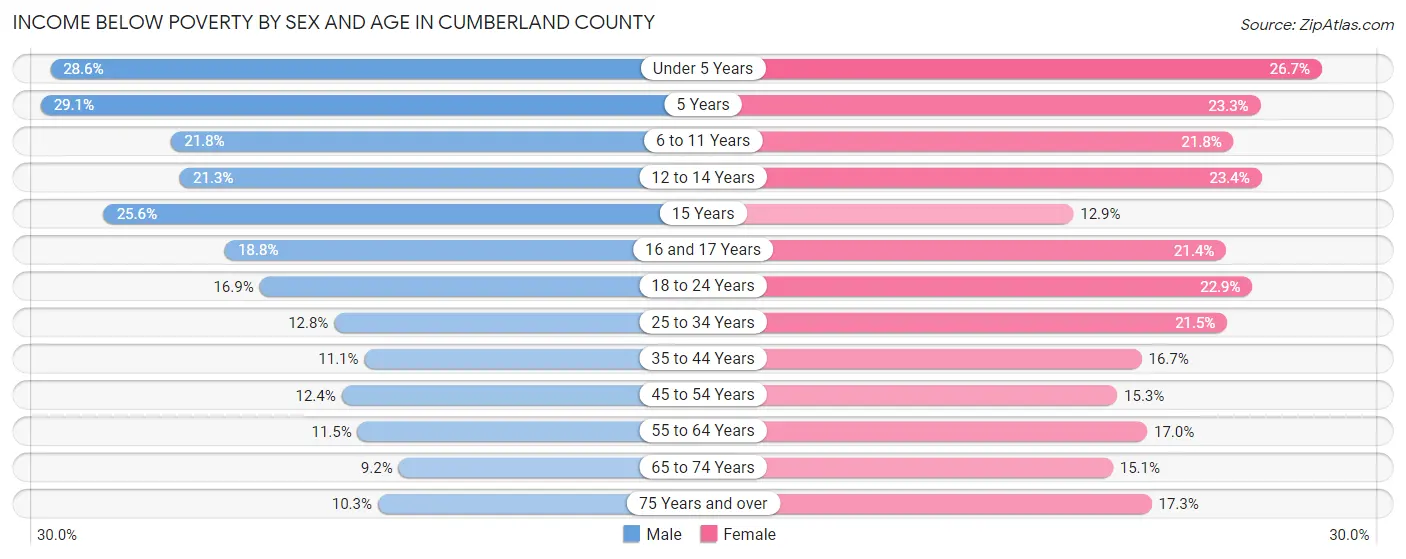
| Age Bracket | Male | Female |
| Under 5 Years | 3,530 (28.6%) | 3,212 (26.7%) |
| 5 Years | 724 (29.1%) | 494 (23.3%) |
| 6 to 11 Years | 3,014 (21.8%) | 3,000 (21.8%) |
| 12 to 14 Years | 1,374 (21.3%) | 1,449 (23.4%) |
| 15 Years | 588 (25.6%) | 258 (12.9%) |
| 16 and 17 Years | 794 (18.8%) | 915 (21.4%) |
| 18 to 24 Years | 2,838 (16.9%) | 3,652 (22.9%) |
| 25 to 34 Years | 3,351 (12.8%) | 5,706 (21.5%) |
| 35 to 44 Years | 2,137 (11.1%) | 3,536 (16.7%) |
| 45 to 54 Years | 1,953 (12.3%) | 2,832 (15.3%) |
| 55 to 64 Years | 1,831 (11.5%) | 3,239 (17.0%) |
| 65 to 74 Years | 1,030 (9.2%) | 2,047 (15.1%) |
| 75 Years and over | 618 (10.3%) | 1,750 (17.2%) |
| Total | 23,782 (15.5%) | 32,090 (19.4%) |
Income Above Poverty by Sex and Age in Cumberland County
According to the poverty statistics in Cumberland County, males aged 65 to 74 years and females aged 15 years are the age groups that are most secure financially, with 90.8% of males and 87.1% of females in these age groups living above the poverty line.
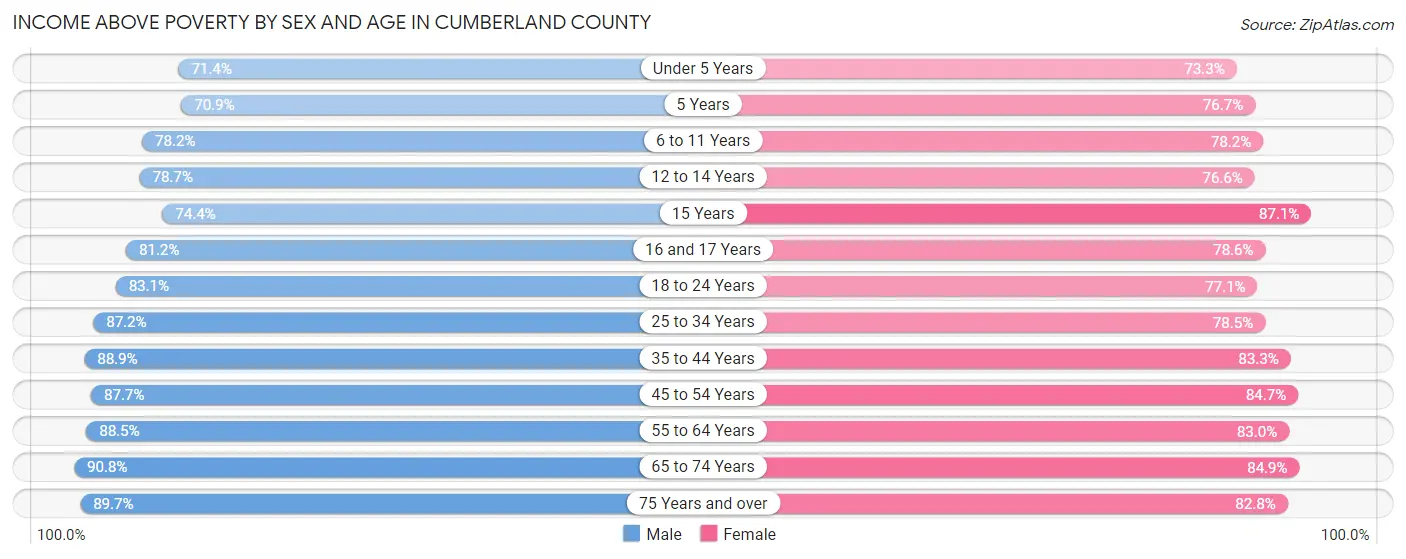
| Age Bracket | Male | Female |
| Under 5 Years | 8,825 (71.4%) | 8,805 (73.3%) |
| 5 Years | 1,764 (70.9%) | 1,625 (76.7%) |
| 6 to 11 Years | 10,793 (78.2%) | 10,746 (78.2%) |
| 12 to 14 Years | 5,066 (78.7%) | 4,750 (76.6%) |
| 15 Years | 1,710 (74.4%) | 1,744 (87.1%) |
| 16 and 17 Years | 3,420 (81.2%) | 3,361 (78.6%) |
| 18 to 24 Years | 13,940 (83.1%) | 12,325 (77.1%) |
| 25 to 34 Years | 22,911 (87.2%) | 20,888 (78.5%) |
| 35 to 44 Years | 17,151 (88.9%) | 17,647 (83.3%) |
| 45 to 54 Years | 13,862 (87.6%) | 15,638 (84.7%) |
| 55 to 64 Years | 14,146 (88.5%) | 15,818 (83.0%) |
| 65 to 74 Years | 10,187 (90.8%) | 11,517 (84.9%) |
| 75 Years and over | 5,366 (89.7%) | 8,393 (82.8%) |
| Total | 129,141 (84.5%) | 133,257 (80.6%) |
Income Below Poverty Among Married-Couple Families in Cumberland County
The poverty statistics for married-couple families in Cumberland County show that 6.7% or 3,428 of the total 51,574 families live below the poverty line. Families with 5 or more children have the highest poverty rate of 21.8%, comprising of 83 families. On the other hand, families with no children have the lowest poverty rate of 5.9%, which includes 1,751 families.
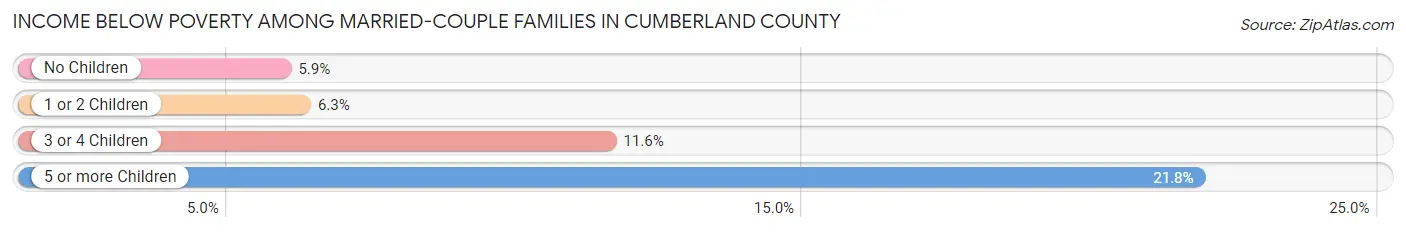
| Children | Above Poverty | Below Poverty |
| No Children | 27,772 (94.1%) | 1,751 (5.9%) |
| 1 or 2 Children | 16,162 (93.7%) | 1,081 (6.3%) |
| 3 or 4 Children | 3,915 (88.4%) | 513 (11.6%) |
| 5 or more Children | 297 (78.2%) | 83 (21.8%) |
| Total | 48,146 (93.3%) | 3,428 (6.7%) |
Income Below Poverty Among Single-Parent Households in Cumberland County
According to the poverty data in Cumberland County, 18.2% or 1,035 single-father households and 31.0% or 6,611 single-mother households are living below the poverty line. Among single-father households, those with 3 or 4 children have the highest poverty rate, with 142 households (27.1%) experiencing poverty. Likewise, among single-mother households, those with 5 or more children have the highest poverty rate, with 235 households (92.9%) falling below the poverty line.
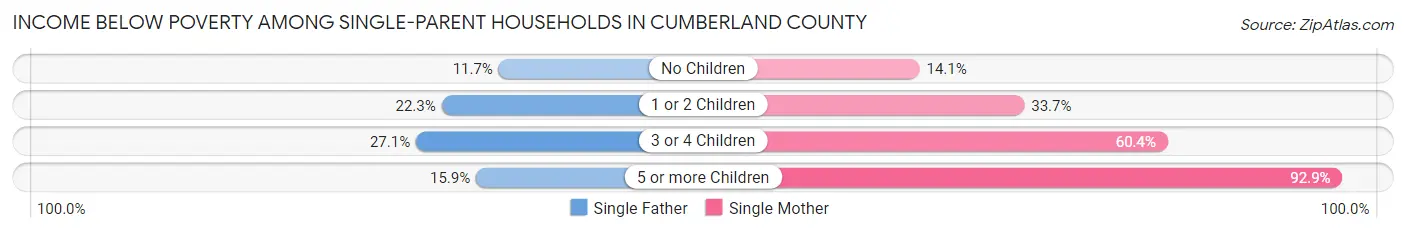
| Children | Single Father | Single Mother |
| No Children | 279 (11.7%) | 970 (14.1%) |
| 1 or 2 Children | 593 (22.3%) | 4,012 (33.7%) |
| 3 or 4 Children | 142 (27.1%) | 1,394 (60.4%) |
| 5 or more Children | 21 (15.9%) | 235 (92.9%) |
| Total | 1,035 (18.2%) | 6,611 (31.0%) |
Income Below Poverty Among Married-Couple vs Single-Parent Households in Cumberland County
The poverty data for Cumberland County shows that 3,428 of the married-couple family households (6.7%) and 7,646 of the single-parent households (28.3%) are living below the poverty level. Within the married-couple family households, those with 5 or more children have the highest poverty rate, with 83 households (21.8%) falling below the poverty line. Among the single-parent households, those with 5 or more children have the highest poverty rate, with 256 household (66.5%) living below poverty.
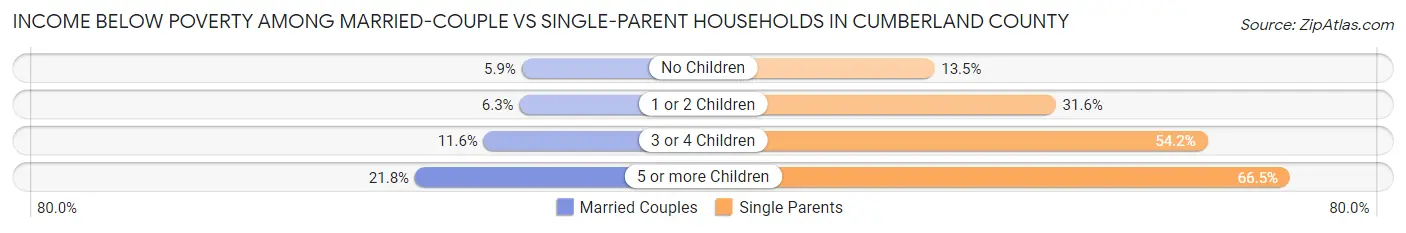
| Children | Married-Couple Families | Single-Parent Households |
| No Children | 1,751 (5.9%) | 1,249 (13.5%) |
| 1 or 2 Children | 1,081 (6.3%) | 4,605 (31.6%) |
| 3 or 4 Children | 513 (11.6%) | 1,536 (54.2%) |
| 5 or more Children | 83 (21.8%) | 256 (66.5%) |
| Total | 3,428 (6.7%) | 7,646 (28.3%) |
Employment Characteristics in Cumberland County
Employment by Class of Employer in Cumberland County
Among the 153,731 employed individuals in Cumberland County, private company employees (79,770 | 51.9%), federal government employees (42,104 | 27.4%), and local government employees (8,665 | 5.6%) make up the most common classes of employment.
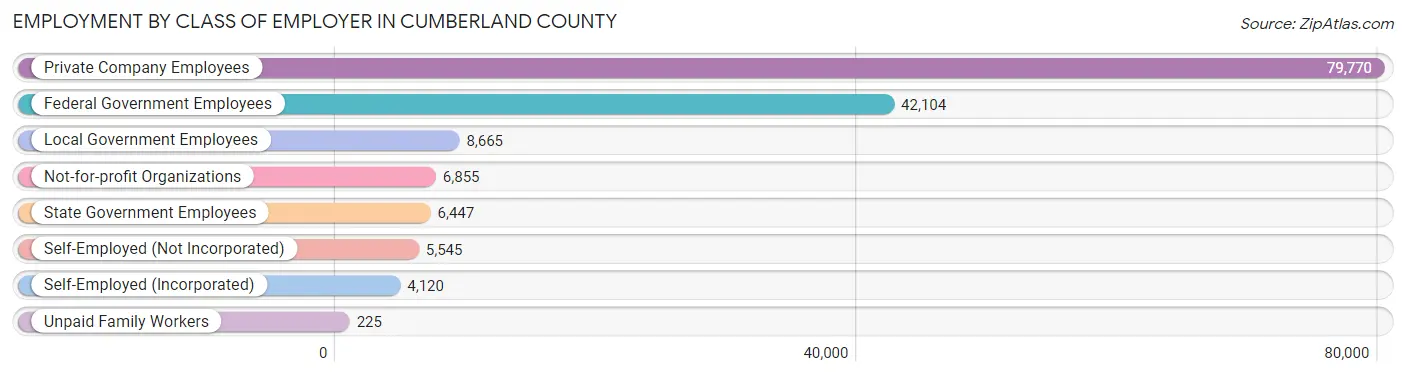
| Employer Class | # Employees | % Employees |
| Private Company Employees | 79,770 | 51.9% |
| Self-Employed (Incorporated) | 4,120 | 2.7% |
| Self-Employed (Not Incorporated) | 5,545 | 3.6% |
| Not-for-profit Organizations | 6,855 | 4.5% |
| Local Government Employees | 8,665 | 5.6% |
| State Government Employees | 6,447 | 4.2% |
| Federal Government Employees | 42,104 | 27.4% |
| Unpaid Family Workers | 225 | 0.2% |
| Total | 153,731 | 100.0% |
Employment Status by Age in Cumberland County
According to the labor force statistics for Cumberland County, out of the total population over 16 years of age (260,162), 64.4% or 167,544 individuals are in the labor force, with 7.9% or 13,236 of them unemployed. The age group with the highest labor force participation rate is 25 to 29 years, with 84.2% or 25,826 individuals in the labor force. Within the labor force, the 16 to 19 years age range has the highest percentage of unemployed individuals, with 18.0% or 1,352 of them being unemployed.
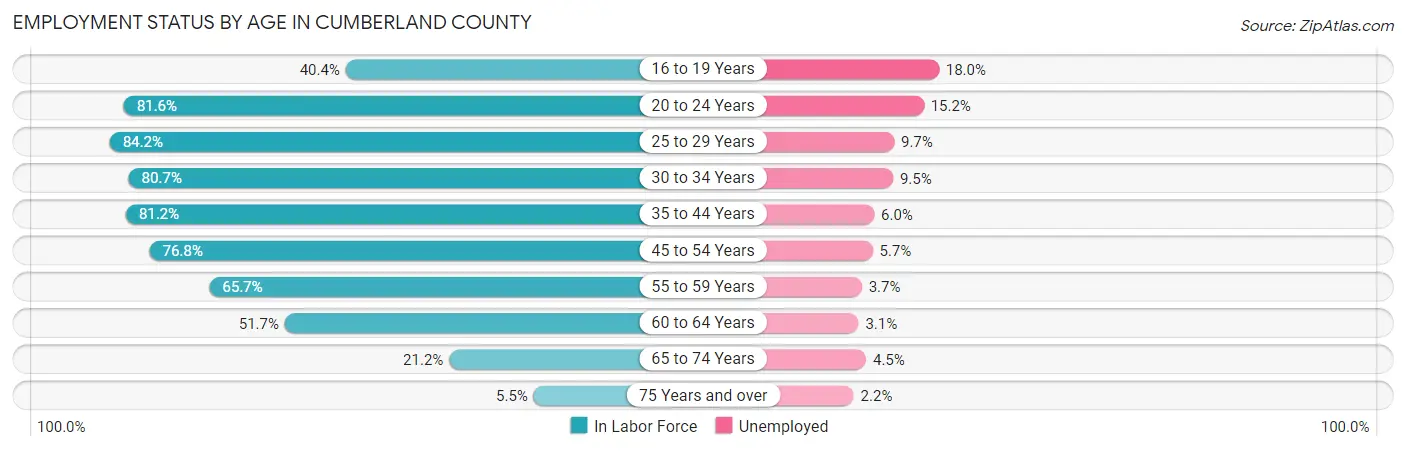
| Age Bracket | In Labor Force | Unemployed |
| 16 to 19 Years | 7,511 (40.4%) | 1,352 (18.0%) |
| 20 to 24 Years | 27,176 (81.6%) | 4,131 (15.2%) |
| 25 to 29 Years | 25,826 (84.2%) | 2,505 (9.7%) |
| 30 to 34 Years | 20,505 (80.7%) | 1,948 (9.5%) |
| 35 to 44 Years | 33,094 (81.2%) | 1,986 (6.0%) |
| 45 to 54 Years | 26,480 (76.8%) | 1,509 (5.7%) |
| 55 to 59 Years | 12,104 (65.7%) | 448 (3.7%) |
| 60 to 64 Years | 8,657 (51.7%) | 268 (3.1%) |
| 65 to 74 Years | 5,303 (21.2%) | 239 (4.5%) |
| 75 Years and over | 922 (5.5%) | 20 (2.2%) |
| Total | 167,544 (64.4%) | 13,236 (7.9%) |
Employment Status by Educational Attainment in Cumberland County
According to labor force statistics for Cumberland County, 76.1% of individuals (126,694) out of the total population between 25 and 64 years of age (166,484) are in the labor force, with 6.6% or 8,362 of them being unemployed. The group with the highest labor force participation rate are those with the educational attainment of bachelor's degree or higher, with 85.0% or 39,302 individuals in the labor force. Within the labor force, individuals with less than high school education have the highest percentage of unemployment, with 15.0% or 918 of them being unemployed.
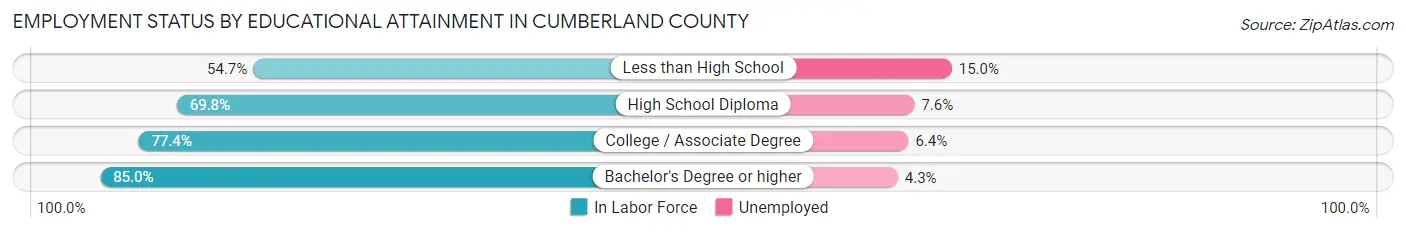
| Educational Attainment | In Labor Force | Unemployed |
| Less than High School | 6,119 (54.7%) | 1,678 (15.0%) |
| High School Diploma | 28,899 (69.8%) | 3,147 (7.6%) |
| College / Associate Degree | 52,367 (77.4%) | 4,330 (6.4%) |
| Bachelor's Degree or higher | 39,302 (85.0%) | 1,988 (4.3%) |
| Total | 126,694 (76.1%) | 10,988 (6.6%) |
Employment Occupations by Sex in Cumberland County
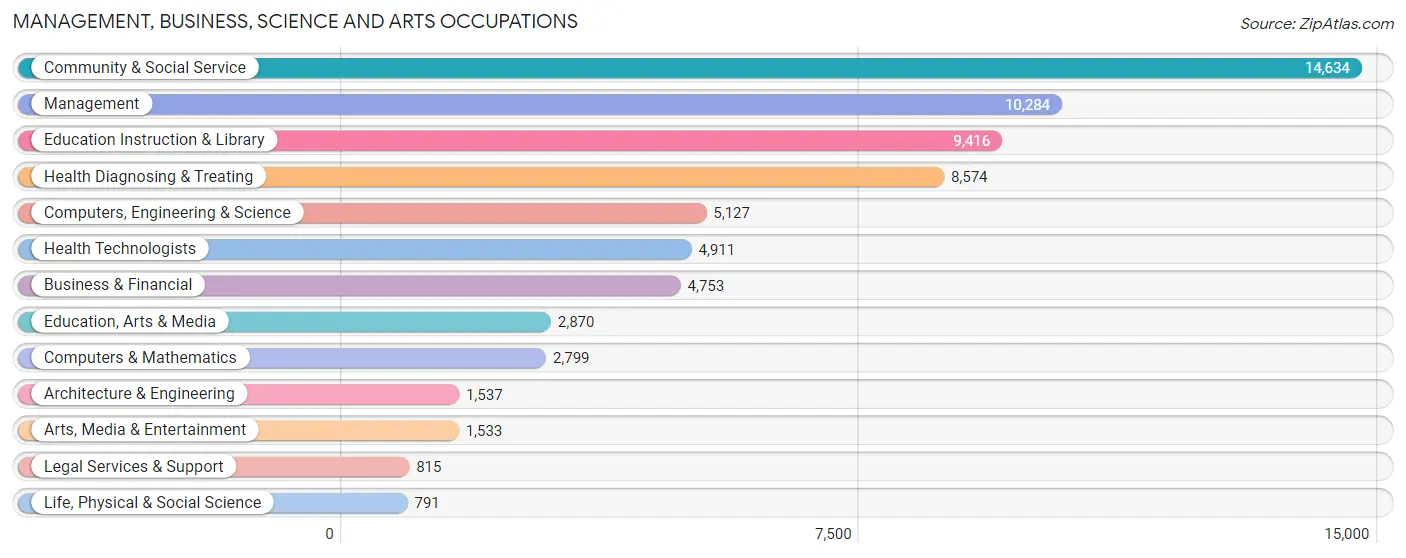
Management, Business, Science and Arts Occupations
The most common Management, Business, Science and Arts occupations in Cumberland County are Community & Social Service (14,634 | 11.7%), Management (10,284 | 8.2%), Education Instruction & Library (9,416 | 7.5%), Health Diagnosing & Treating (8,574 | 6.9%), and Computers, Engineering & Science (5,127 | 4.1%).
Management, Business, Science and Arts Occupations by Sex
Within the Management, Business, Science and Arts occupations in Cumberland County, the most male-oriented occupations are Architecture & Engineering (86.0%), Computers, Engineering & Science (73.1%), and Computers & Mathematics (72.1%), while the most female-oriented occupations are Health Diagnosing & Treating (79.5%), Health Technologists (79.3%), and Education, Arts & Media (75.0%).
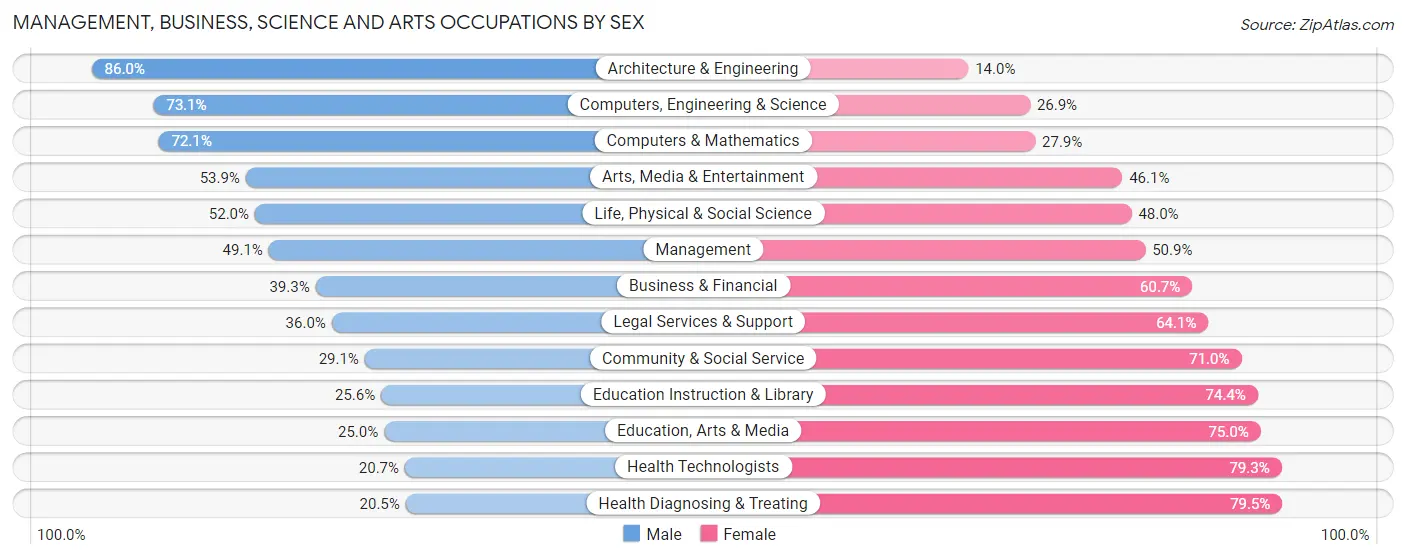
| Occupation | Male | Female |
| Management | 5,048 (49.1%) | 5,236 (50.9%) |
| Business & Financial | 1,869 (39.3%) | 2,884 (60.7%) |
| Computers, Engineering & Science | 3,750 (73.1%) | 1,377 (26.9%) |
| Computers & Mathematics | 2,017 (72.1%) | 782 (27.9%) |
| Architecture & Engineering | 1,322 (86.0%) | 215 (14.0%) |
| Life, Physical & Social Science | 411 (52.0%) | 380 (48.0%) |
| Community & Social Service | 4,251 (29.0%) | 10,383 (71.0%) |
| Education, Arts & Media | 718 (25.0%) | 2,152 (75.0%) |
| Legal Services & Support | 293 (35.9%) | 522 (64.0%) |
| Education Instruction & Library | 2,414 (25.6%) | 7,002 (74.4%) |
| Arts, Media & Entertainment | 826 (53.9%) | 707 (46.1%) |
| Health Diagnosing & Treating | 1,759 (20.5%) | 6,815 (79.5%) |
| Health Technologists | 1,015 (20.7%) | 3,896 (79.3%) |
| Total (Category) | 16,677 (38.5%) | 26,695 (61.6%) |
| Total (Overall) | 58,549 (46.8%) | 66,625 (53.2%) |
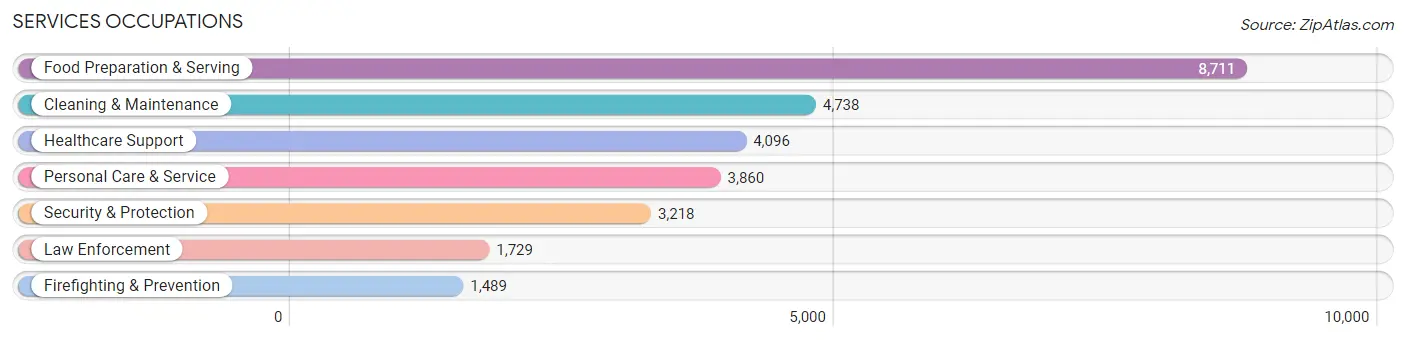
Services Occupations
The most common Services occupations in Cumberland County are Food Preparation & Serving (8,711 | 7.0%), Cleaning & Maintenance (4,738 | 3.8%), Healthcare Support (4,096 | 3.3%), Personal Care & Service (3,860 | 3.1%), and Security & Protection (3,218 | 2.6%).
Services Occupations by Sex
Within the Services occupations in Cumberland County, the most male-oriented occupations are Law Enforcement (74.5%), Security & Protection (70.5%), and Firefighting & Prevention (65.9%), while the most female-oriented occupations are Healthcare Support (91.4%), Personal Care & Service (70.0%), and Food Preparation & Serving (52.1%).
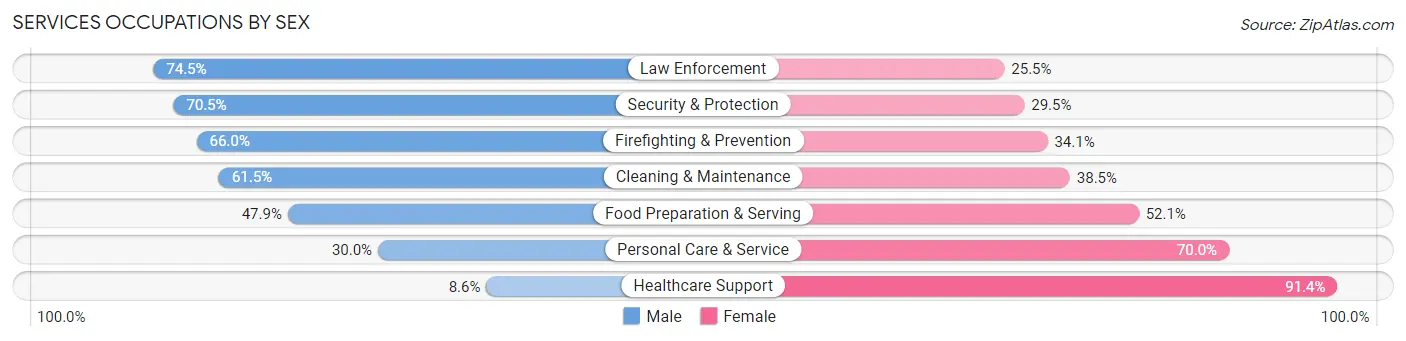
| Occupation | Male | Female |
| Healthcare Support | 351 (8.6%) | 3,745 (91.4%) |
| Security & Protection | 2,270 (70.5%) | 948 (29.5%) |
| Firefighting & Prevention | 982 (65.9%) | 507 (34.1%) |
| Law Enforcement | 1,288 (74.5%) | 441 (25.5%) |
| Food Preparation & Serving | 4,172 (47.9%) | 4,539 (52.1%) |
| Cleaning & Maintenance | 2,915 (61.5%) | 1,823 (38.5%) |
| Personal Care & Service | 1,159 (30.0%) | 2,701 (70.0%) |
| Total (Category) | 10,867 (44.1%) | 13,756 (55.9%) |
| Total (Overall) | 58,549 (46.8%) | 66,625 (53.2%) |
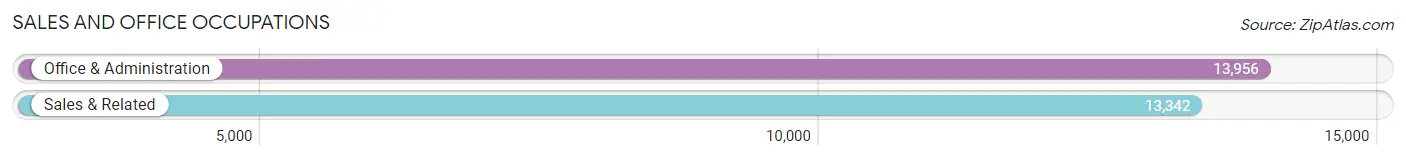
Sales and Office Occupations
The most common Sales and Office occupations in Cumberland County are Office & Administration (13,956 | 11.2%), and Sales & Related (13,342 | 10.7%).
Sales and Office Occupations by Sex
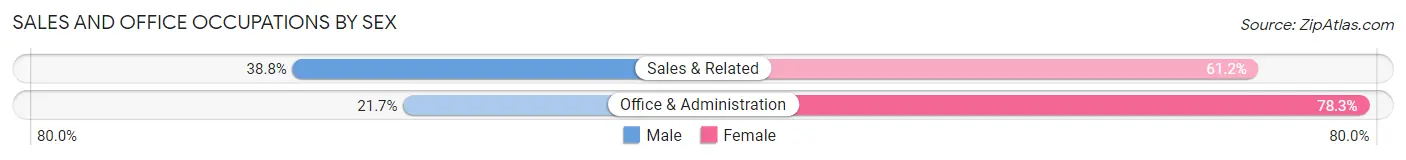
| Occupation | Male | Female |
| Sales & Related | 5,172 (38.8%) | 8,170 (61.2%) |
| Office & Administration | 3,032 (21.7%) | 10,924 (78.3%) |
| Total (Category) | 8,204 (30.0%) | 19,094 (70.0%) |
| Total (Overall) | 58,549 (46.8%) | 66,625 (53.2%) |
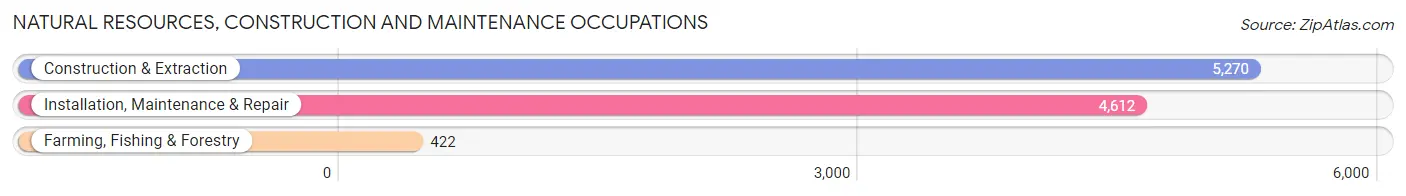
Natural Resources, Construction and Maintenance Occupations
The most common Natural Resources, Construction and Maintenance occupations in Cumberland County are Construction & Extraction (5,270 | 4.2%), Installation, Maintenance & Repair (4,612 | 3.7%), and Farming, Fishing & Forestry (422 | 0.3%).
Natural Resources, Construction and Maintenance Occupations by Sex
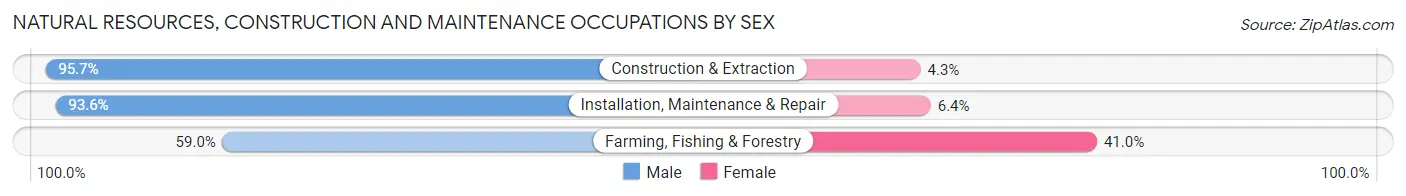
| Occupation | Male | Female |
| Farming, Fishing & Forestry | 249 (59.0%) | 173 (41.0%) |
| Construction & Extraction | 5,043 (95.7%) | 227 (4.3%) |
| Installation, Maintenance & Repair | 4,316 (93.6%) | 296 (6.4%) |
| Total (Category) | 9,608 (93.2%) | 696 (6.8%) |
| Total (Overall) | 58,549 (46.8%) | 66,625 (53.2%) |
Production, Transportation and Moving Occupations
The most common Production, Transportation and Moving occupations in Cumberland County are Production (8,035 | 6.4%), Material Moving (6,101 | 4.9%), and Transportation (5,441 | 4.3%).

Production, Transportation and Moving Occupations by Sex
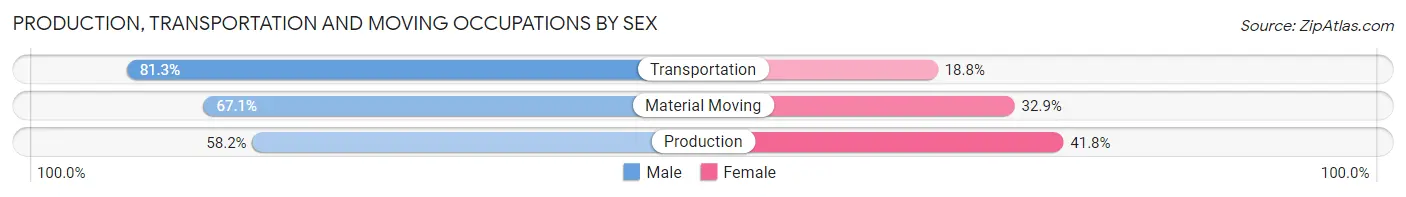
| Occupation | Male | Female |
| Production | 4,676 (58.2%) | 3,359 (41.8%) |
| Transportation | 4,421 (81.2%) | 1,020 (18.8%) |
| Material Moving | 4,096 (67.1%) | 2,005 (32.9%) |
| Total (Category) | 13,193 (67.4%) | 6,384 (32.6%) |
| Total (Overall) | 58,549 (46.8%) | 66,625 (53.2%) |
Employment Industries by Sex in Cumberland County
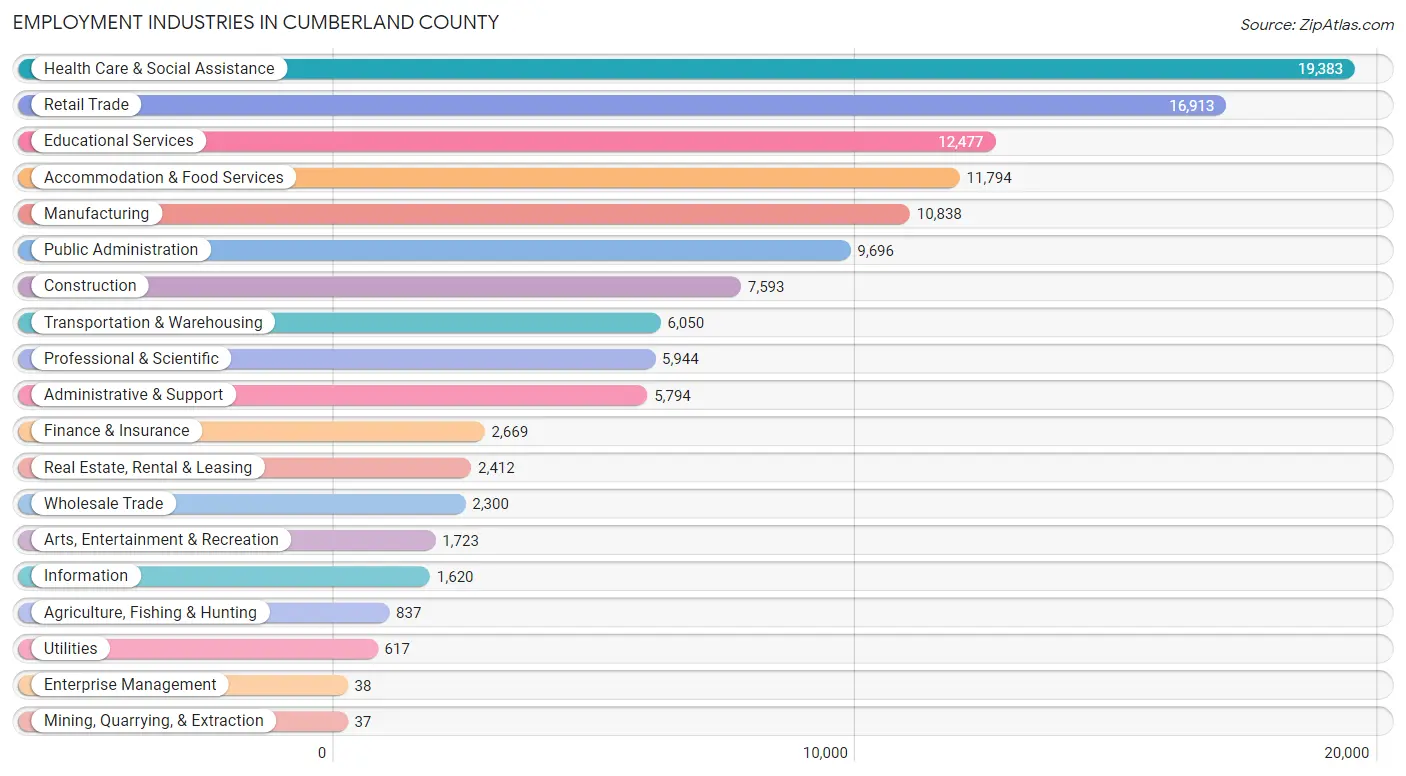
Employment Industries in Cumberland County
The major employment industries in Cumberland County include Health Care & Social Assistance (19,383 | 15.5%), Retail Trade (16,913 | 13.5%), Educational Services (12,477 | 10.0%), Accommodation & Food Services (11,794 | 9.4%), and Manufacturing (10,838 | 8.7%).
Employment Industries by Sex in Cumberland County
The Cumberland County industries that see more men than women are Mining, Quarrying, & Extraction (100.0%), Construction (86.2%), and Agriculture, Fishing & Hunting (77.3%), whereas the industries that tend to have a higher number of women are Health Care & Social Assistance (83.1%), Finance & Insurance (70.1%), and Educational Services (69.3%).
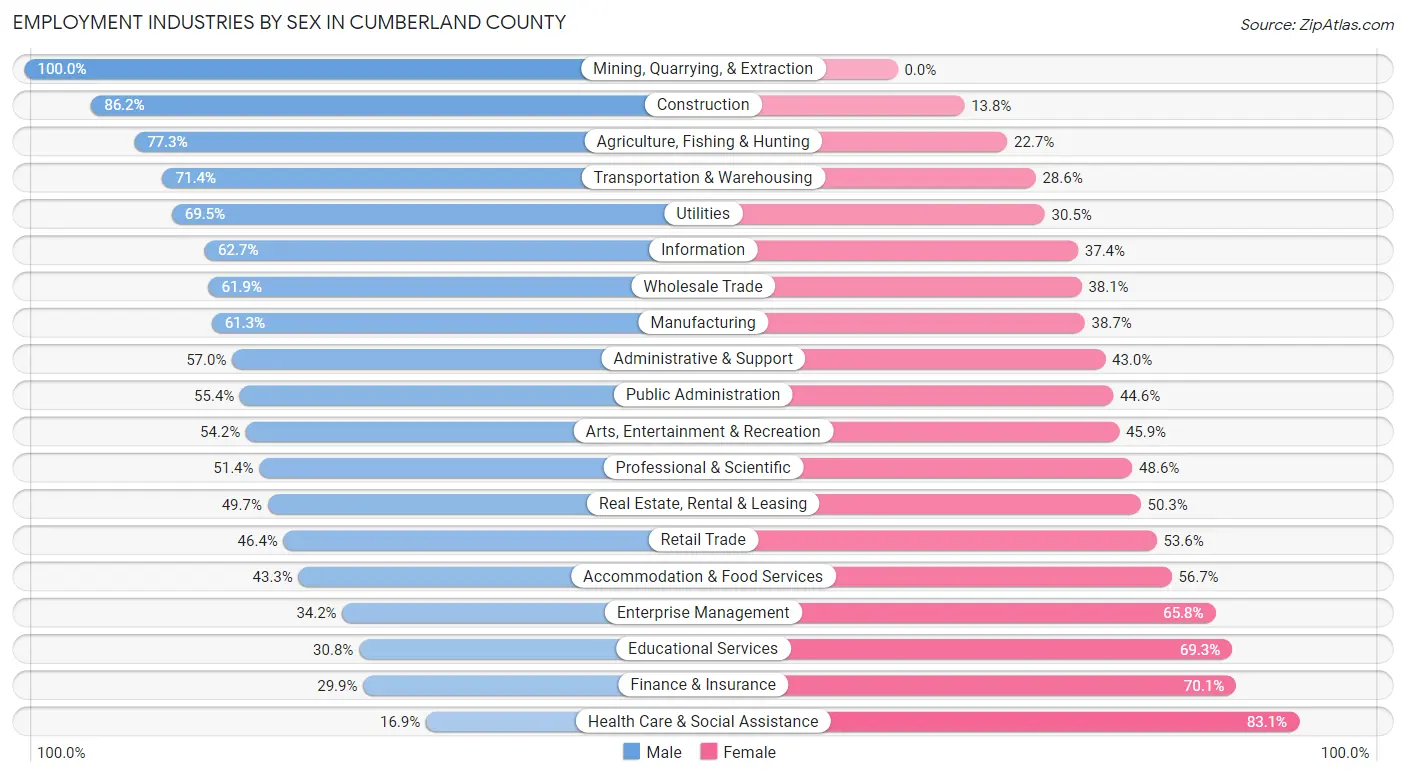
| Industry | Male | Female |
| Agriculture, Fishing & Hunting | 647 (77.3%) | 190 (22.7%) |
| Mining, Quarrying, & Extraction | 37 (100.0%) | 0 (0.0%) |
| Construction | 6,544 (86.2%) | 1,049 (13.8%) |
| Manufacturing | 6,639 (61.3%) | 4,199 (38.7%) |
| Wholesale Trade | 1,424 (61.9%) | 876 (38.1%) |
| Retail Trade | 7,844 (46.4%) | 9,069 (53.6%) |
| Transportation & Warehousing | 4,321 (71.4%) | 1,729 (28.6%) |
| Utilities | 429 (69.5%) | 188 (30.5%) |
| Information | 1,015 (62.6%) | 605 (37.3%) |
| Finance & Insurance | 798 (29.9%) | 1,871 (70.1%) |
| Real Estate, Rental & Leasing | 1,198 (49.7%) | 1,214 (50.3%) |
| Professional & Scientific | 3,056 (51.4%) | 2,888 (48.6%) |
| Enterprise Management | 13 (34.2%) | 25 (65.8%) |
| Administrative & Support | 3,304 (57.0%) | 2,490 (43.0%) |
| Educational Services | 3,837 (30.7%) | 8,640 (69.3%) |
| Health Care & Social Assistance | 3,276 (16.9%) | 16,107 (83.1%) |
| Arts, Entertainment & Recreation | 933 (54.1%) | 790 (45.9%) |
| Accommodation & Food Services | 5,104 (43.3%) | 6,690 (56.7%) |
| Public Administration | 5,370 (55.4%) | 4,326 (44.6%) |
| Total | 58,549 (46.8%) | 66,625 (53.2%) |
Education in Cumberland County
School Enrollment in Cumberland County
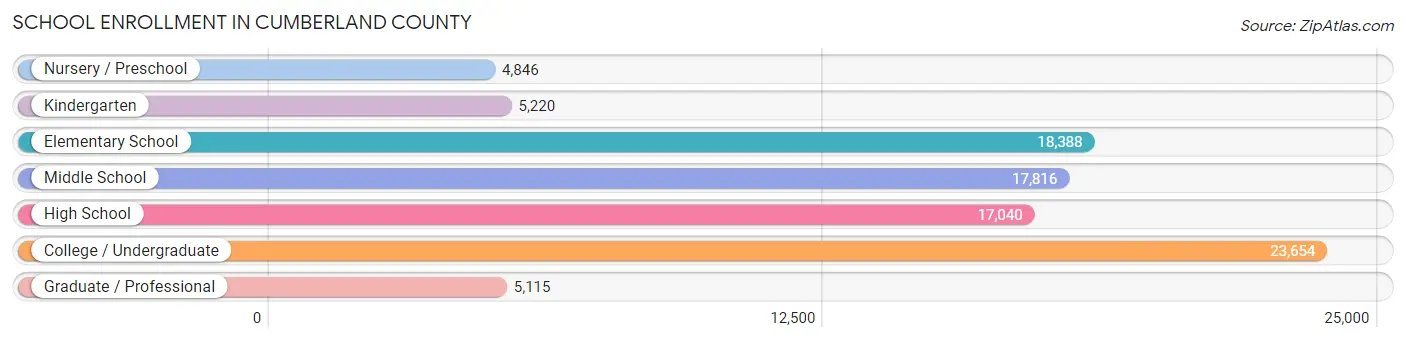
The most common levels of schooling among the 92,079 students in Cumberland County are college / undergraduate (23,654 | 25.7%), elementary school (18,388 | 20.0%), and middle school (17,816 | 19.4%).
| School Level | # Students | % Students |
| Nursery / Preschool | 4,846 | 5.3% |
| Kindergarten | 5,220 | 5.7% |
| Elementary School | 18,388 | 20.0% |
| Middle School | 17,816 | 19.4% |
| High School | 17,040 | 18.5% |
| College / Undergraduate | 23,654 | 25.7% |
| Graduate / Professional | 5,115 | 5.6% |
| Total | 92,079 | 100.0% |
School Enrollment by Age by Funding Source in Cumberland County
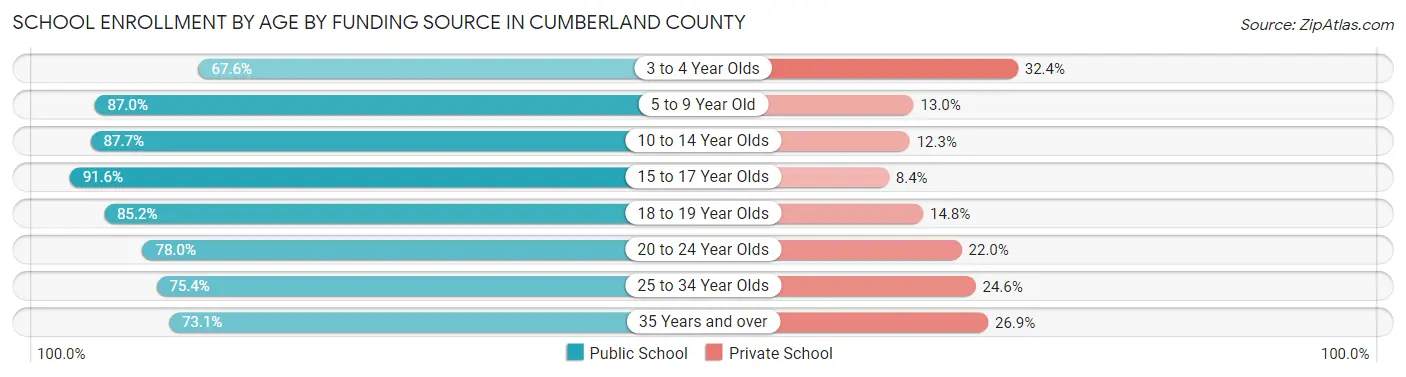
Out of a total of 92,079 students who are enrolled in schools in Cumberland County, 15,101 (16.4%) attend a private institution, while the remaining 76,978 (83.6%) are enrolled in public schools. The age group of 3 to 4 year olds has the highest likelihood of being enrolled in private schools, with 1,281 (32.4% in the age bracket) enrolled. Conversely, the age group of 15 to 17 year olds has the lowest likelihood of being enrolled in a private school, with 11,217 (91.6% in the age bracket) attending a public institution.
| Age Bracket | Public School | Private School |
| 3 to 4 Year Olds | 2,669 (67.6%) | 1,281 (32.4%) |
| 5 to 9 Year Old | 19,078 (87.0%) | 2,858 (13.0%) |
| 10 to 14 Year Olds | 19,104 (87.7%) | 2,682 (12.3%) |
| 15 to 17 Year Olds | 11,217 (91.6%) | 1,030 (8.4%) |
| 18 to 19 Year Olds | 4,978 (85.2%) | 864 (14.8%) |
| 20 to 24 Year Olds | 7,369 (78.0%) | 2,075 (22.0%) |
| 25 to 34 Year Olds | 6,981 (75.4%) | 2,273 (24.6%) |
| 35 Years and over | 5,571 (73.1%) | 2,049 (26.9%) |
| Total | 76,978 (83.6%) | 15,101 (16.4%) |
Educational Attainment by Field of Study in Cumberland County
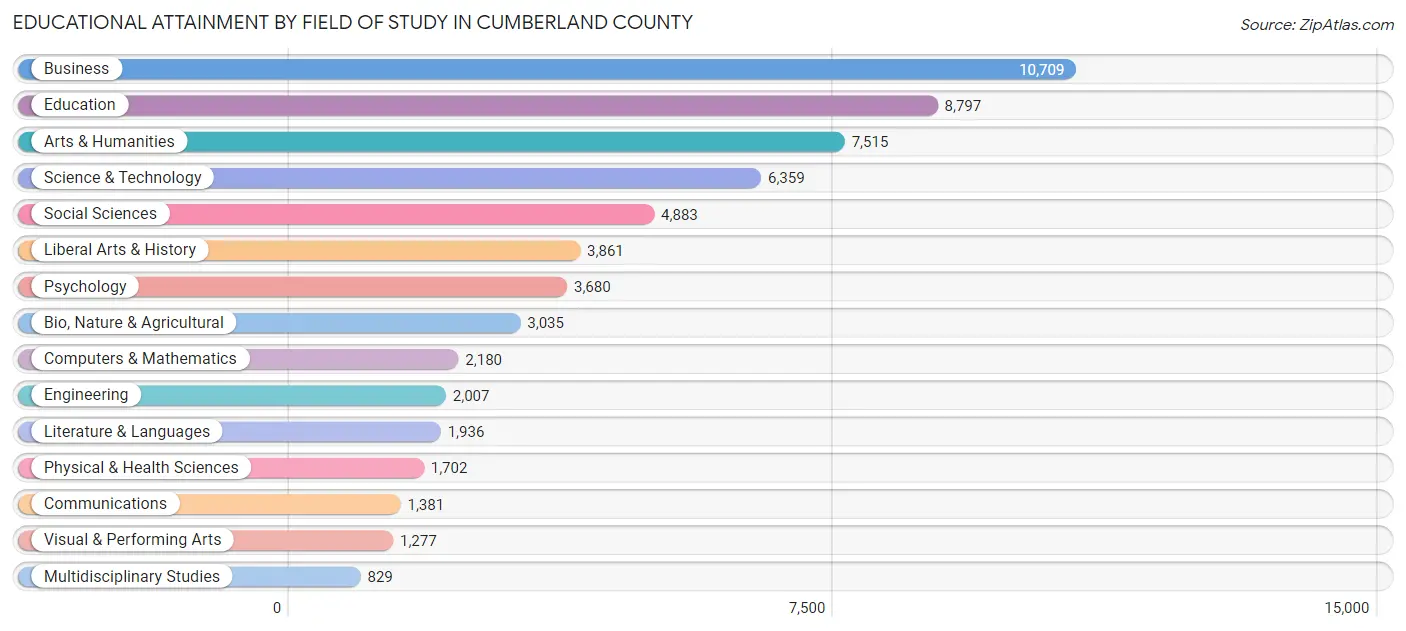
Business (10,709 | 17.8%), education (8,797 | 14.6%), arts & humanities (7,515 | 12.5%), science & technology (6,359 | 10.6%), and social sciences (4,883 | 8.1%) are the most common fields of study among 60,151 individuals in Cumberland County who have obtained a bachelor's degree or higher.
| Field of Study | # Graduates | % Graduates |
| Computers & Mathematics | 2,180 | 3.6% |
| Bio, Nature & Agricultural | 3,035 | 5.1% |
| Physical & Health Sciences | 1,702 | 2.8% |
| Psychology | 3,680 | 6.1% |
| Social Sciences | 4,883 | 8.1% |
| Engineering | 2,007 | 3.3% |
| Multidisciplinary Studies | 829 | 1.4% |
| Science & Technology | 6,359 | 10.6% |
| Business | 10,709 | 17.8% |
| Education | 8,797 | 14.6% |
| Literature & Languages | 1,936 | 3.2% |
| Liberal Arts & History | 3,861 | 6.4% |
| Visual & Performing Arts | 1,277 | 2.1% |
| Communications | 1,381 | 2.3% |
| Arts & Humanities | 7,515 | 12.5% |
| Total | 60,151 | 100.0% |
Transportation & Commute in Cumberland County
Vehicle Availability by Sex in Cumberland County
The most prevalent vehicle ownership categories in Cumberland County are males with 2 vehicles (32,145, accounting for 43.6%) and females with 2 vehicles (26,782, making up 47.8%).
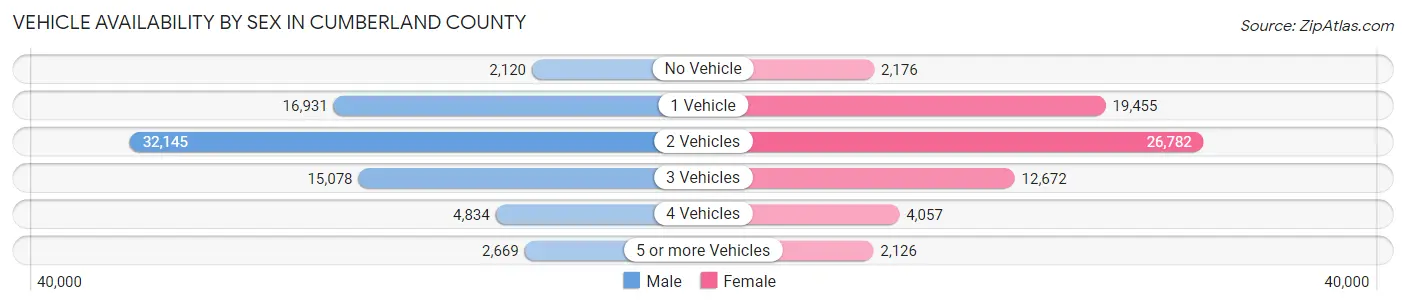
| Vehicles Available | Male | Female |
| No Vehicle | 2,120 (2.9%) | 2,176 (3.2%) |
| 1 Vehicle | 16,931 (23.0%) | 19,455 (28.9%) |
| 2 Vehicles | 32,145 (43.6%) | 26,782 (39.8%) |
| 3 Vehicles | 15,078 (20.4%) | 12,672 (18.8%) |
| 4 Vehicles | 4,834 (6.6%) | 4,057 (6.0%) |
| 5 or more Vehicles | 2,669 (3.6%) | 2,126 (3.2%) |
| Total | 73,777 (100.0%) | 67,268 (100.0%) |
Commute Time in Cumberland County
The most frequently occuring commute durations in Cumberland County are 15 to 19 minutes (29,677 commuters, 20.4%), 20 to 24 minutes (24,392 commuters, 16.8%), and 10 to 14 minutes (20,606 commuters, 14.2%).
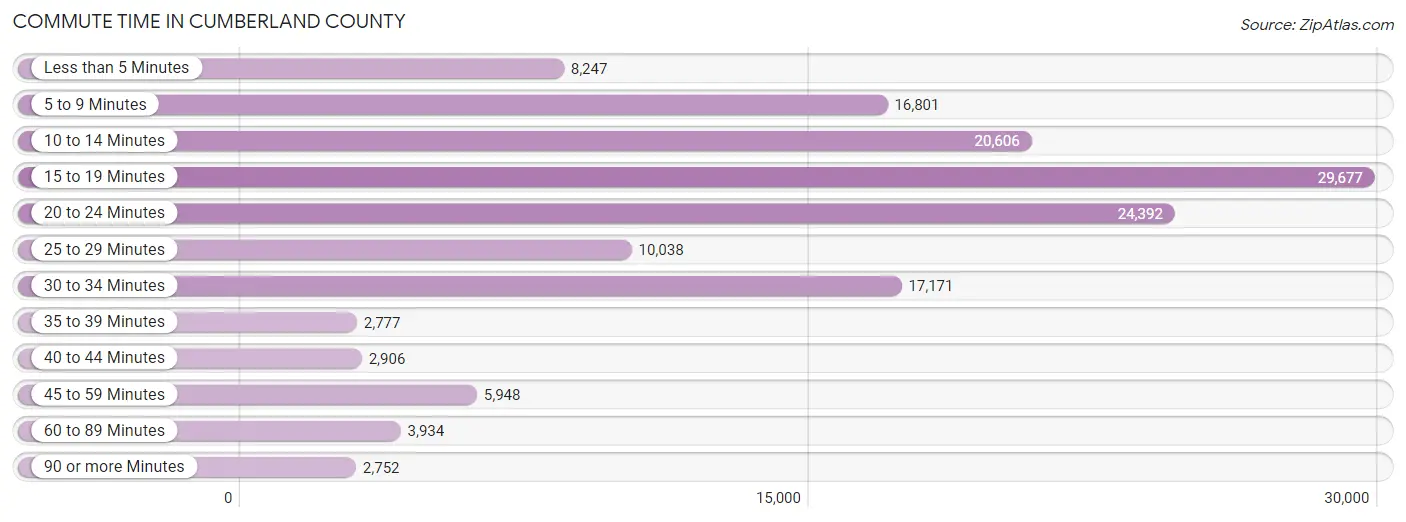
| Commute Time | # Commuters | % Commuters |
| Less than 5 Minutes | 8,247 | 5.7% |
| 5 to 9 Minutes | 16,801 | 11.6% |
| 10 to 14 Minutes | 20,606 | 14.2% |
| 15 to 19 Minutes | 29,677 | 20.4% |
| 20 to 24 Minutes | 24,392 | 16.8% |
| 25 to 29 Minutes | 10,038 | 6.9% |
| 30 to 34 Minutes | 17,171 | 11.8% |
| 35 to 39 Minutes | 2,777 | 1.9% |
| 40 to 44 Minutes | 2,906 | 2.0% |
| 45 to 59 Minutes | 5,948 | 4.1% |
| 60 to 89 Minutes | 3,934 | 2.7% |
| 90 or more Minutes | 2,752 | 1.9% |
Commute Time by Sex in Cumberland County
The most common commute times in Cumberland County are 15 to 19 minutes (15,415 commuters, 18.8%) for males and 15 to 19 minutes (14,262 commuters, 22.5%) for females.
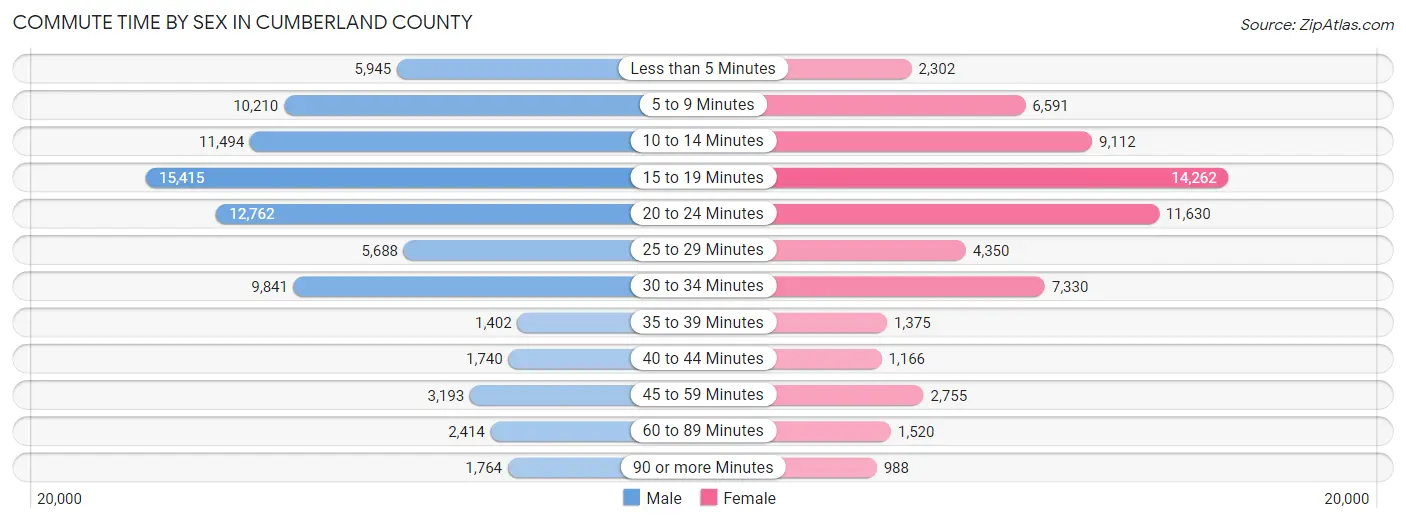
| Commute Time | Male | Female |
| Less than 5 Minutes | 5,945 (7.3%) | 2,302 (3.6%) |
| 5 to 9 Minutes | 10,210 (12.5%) | 6,591 (10.4%) |
| 10 to 14 Minutes | 11,494 (14.0%) | 9,112 (14.4%) |
| 15 to 19 Minutes | 15,415 (18.8%) | 14,262 (22.5%) |
| 20 to 24 Minutes | 12,762 (15.6%) | 11,630 (18.3%) |
| 25 to 29 Minutes | 5,688 (7.0%) | 4,350 (6.9%) |
| 30 to 34 Minutes | 9,841 (12.0%) | 7,330 (11.6%) |
| 35 to 39 Minutes | 1,402 (1.7%) | 1,375 (2.2%) |
| 40 to 44 Minutes | 1,740 (2.1%) | 1,166 (1.8%) |
| 45 to 59 Minutes | 3,193 (3.9%) | 2,755 (4.3%) |
| 60 to 89 Minutes | 2,414 (2.9%) | 1,520 (2.4%) |
| 90 or more Minutes | 1,764 (2.1%) | 988 (1.6%) |
Time of Departure to Work by Sex in Cumberland County
The most frequent times of departure to work in Cumberland County are 7:00 AM to 7:29 AM (12,018, 14.7%) for males and 7:00 AM to 7:29 AM (10,098, 15.9%) for females.
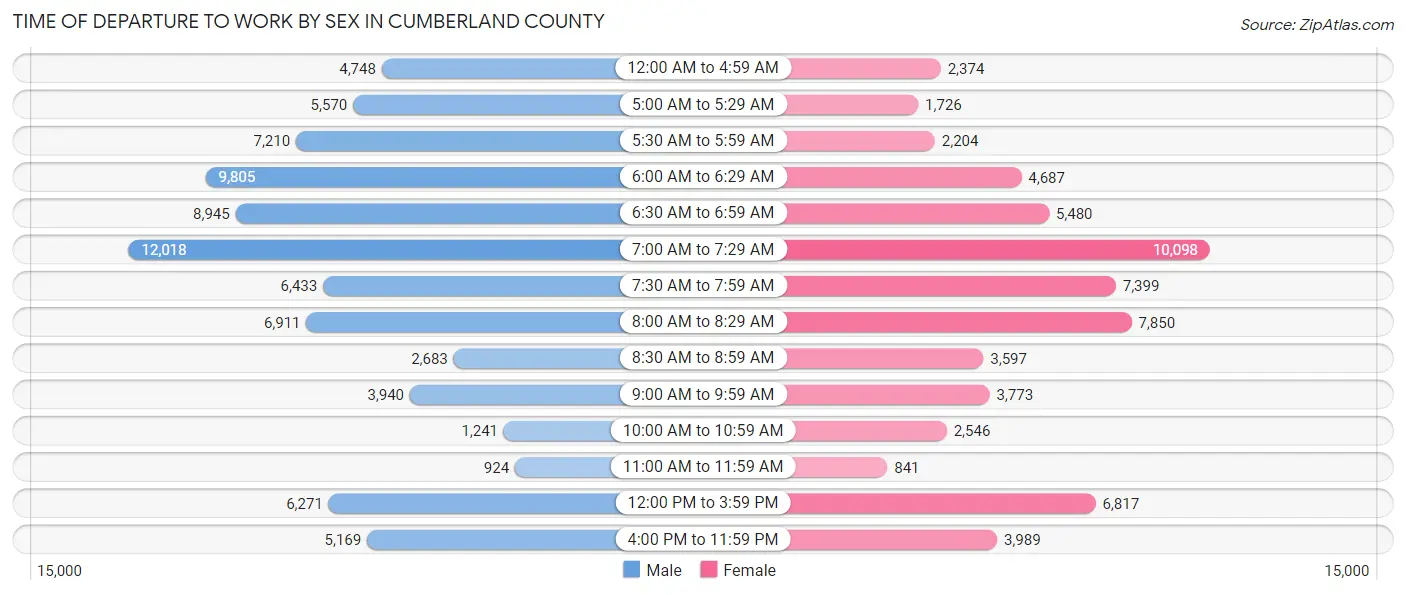
| Time of Departure | Male | Female |
| 12:00 AM to 4:59 AM | 4,748 (5.8%) | 2,374 (3.7%) |
| 5:00 AM to 5:29 AM | 5,570 (6.8%) | 1,726 (2.7%) |
| 5:30 AM to 5:59 AM | 7,210 (8.8%) | 2,204 (3.5%) |
| 6:00 AM to 6:29 AM | 9,805 (12.0%) | 4,687 (7.4%) |
| 6:30 AM to 6:59 AM | 8,945 (10.9%) | 5,480 (8.6%) |
| 7:00 AM to 7:29 AM | 12,018 (14.7%) | 10,098 (15.9%) |
| 7:30 AM to 7:59 AM | 6,433 (7.9%) | 7,399 (11.7%) |
| 8:00 AM to 8:29 AM | 6,911 (8.4%) | 7,850 (12.4%) |
| 8:30 AM to 8:59 AM | 2,683 (3.3%) | 3,597 (5.7%) |
| 9:00 AM to 9:59 AM | 3,940 (4.8%) | 3,773 (5.9%) |
| 10:00 AM to 10:59 AM | 1,241 (1.5%) | 2,546 (4.0%) |
| 11:00 AM to 11:59 AM | 924 (1.1%) | 841 (1.3%) |
| 12:00 PM to 3:59 PM | 6,271 (7.7%) | 6,817 (10.8%) |
| 4:00 PM to 11:59 PM | 5,169 (6.3%) | 3,989 (6.3%) |
| Total | 81,868 (100.0%) | 63,381 (100.0%) |
Housing Occupancy in Cumberland County
Occupancy by Ownership in Cumberland County
Of the total 126,745 dwellings in Cumberland County, owner-occupied units account for 66,720 (52.6%), while renter-occupied units make up 60,025 (47.4%).

| Occupancy | # Housing Units | % Housing Units |
| Owner Occupied Housing Units | 66,720 | 52.6% |
| Renter-Occupied Housing Units | 60,025 | 47.4% |
| Total Occupied Housing Units | 126,745 | 100.0% |
Occupancy by Household Size in Cumberland County
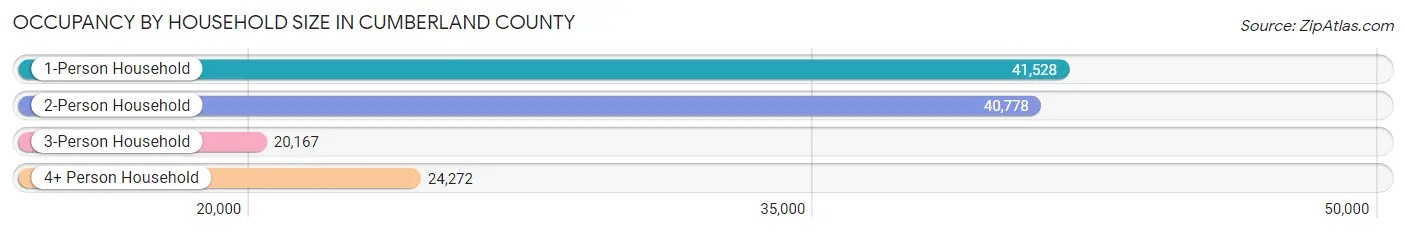
| Household Size | # Housing Units | % Housing Units |
| 1-Person Household | 41,528 | 32.8% |
| 2-Person Household | 40,778 | 32.2% |
| 3-Person Household | 20,167 | 15.9% |
| 4+ Person Household | 24,272 | 19.2% |
| Total Housing Units | 126,745 | 100.0% |
Occupancy by Ownership by Household Size in Cumberland County
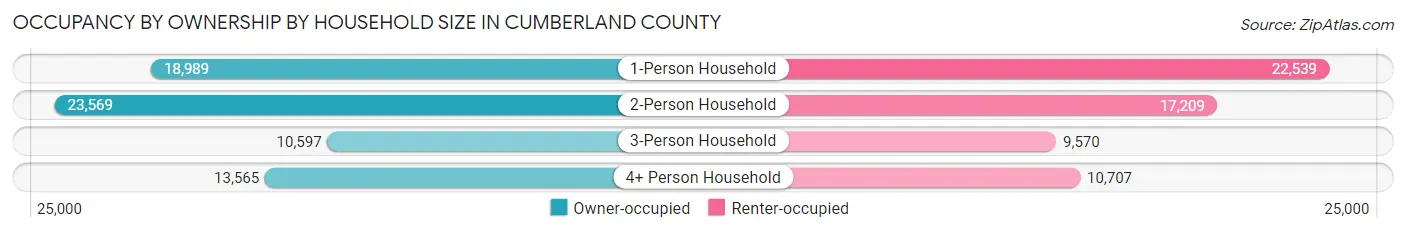
| Household Size | Owner-occupied | Renter-occupied |
| 1-Person Household | 18,989 (45.7%) | 22,539 (54.3%) |
| 2-Person Household | 23,569 (57.8%) | 17,209 (42.2%) |
| 3-Person Household | 10,597 (52.5%) | 9,570 (47.4%) |
| 4+ Person Household | 13,565 (55.9%) | 10,707 (44.1%) |
| Total Housing Units | 66,720 (52.6%) | 60,025 (47.4%) |
Occupancy by Educational Attainment in Cumberland County
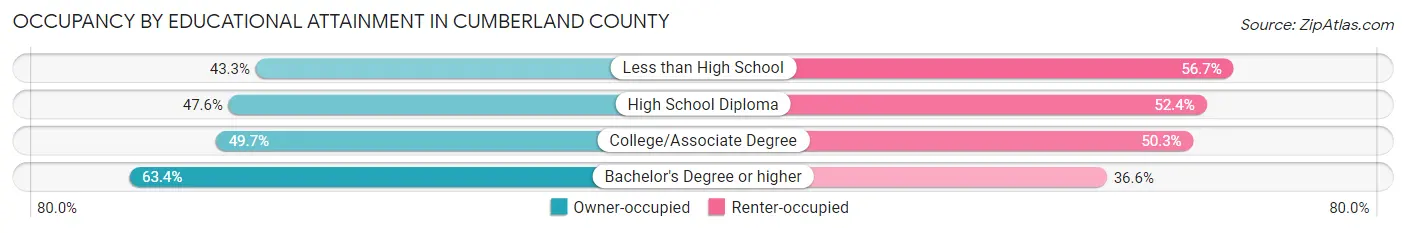
| Household Size | Owner-occupied | Renter-occupied |
| Less than High School | 3,615 (43.3%) | 4,727 (56.7%) |
| High School Diploma | 14,135 (47.6%) | 15,552 (52.4%) |
| College/Associate Degree | 26,382 (49.7%) | 26,722 (50.3%) |
| Bachelor's Degree or higher | 22,588 (63.4%) | 13,024 (36.6%) |
Occupancy by Age of Householder in Cumberland County
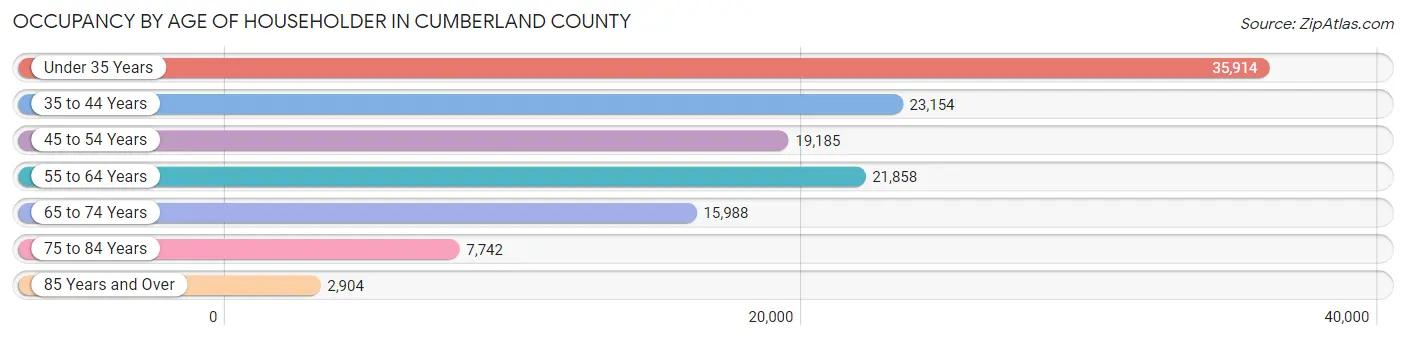
| Age Bracket | # Households | % Households |
| Under 35 Years | 35,914 | 28.3% |
| 35 to 44 Years | 23,154 | 18.3% |
| 45 to 54 Years | 19,185 | 15.1% |
| 55 to 64 Years | 21,858 | 17.2% |
| 65 to 74 Years | 15,988 | 12.6% |
| 75 to 84 Years | 7,742 | 6.1% |
| 85 Years and Over | 2,904 | 2.3% |
| Total | 126,745 | 100.0% |
Housing Finances in Cumberland County
Median Income by Occupancy in Cumberland County
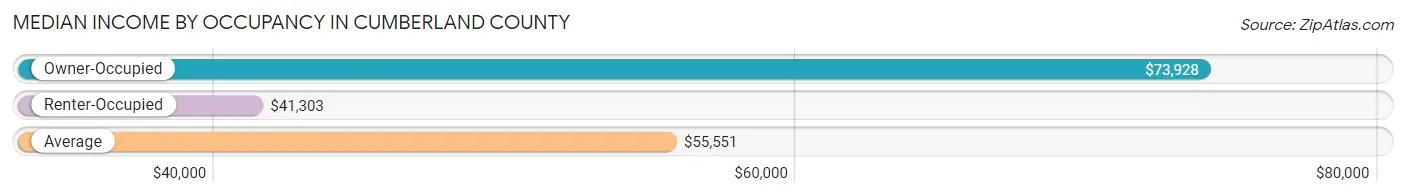
| Occupancy Type | # Households | Median Income |
| Owner-Occupied | 66,720 (52.6%) | $73,928 |
| Renter-Occupied | 60,025 (47.4%) | $41,303 |
| Average | 126,745 (100.0%) | $55,551 |
Occupancy by Householder Income Bracket in Cumberland County
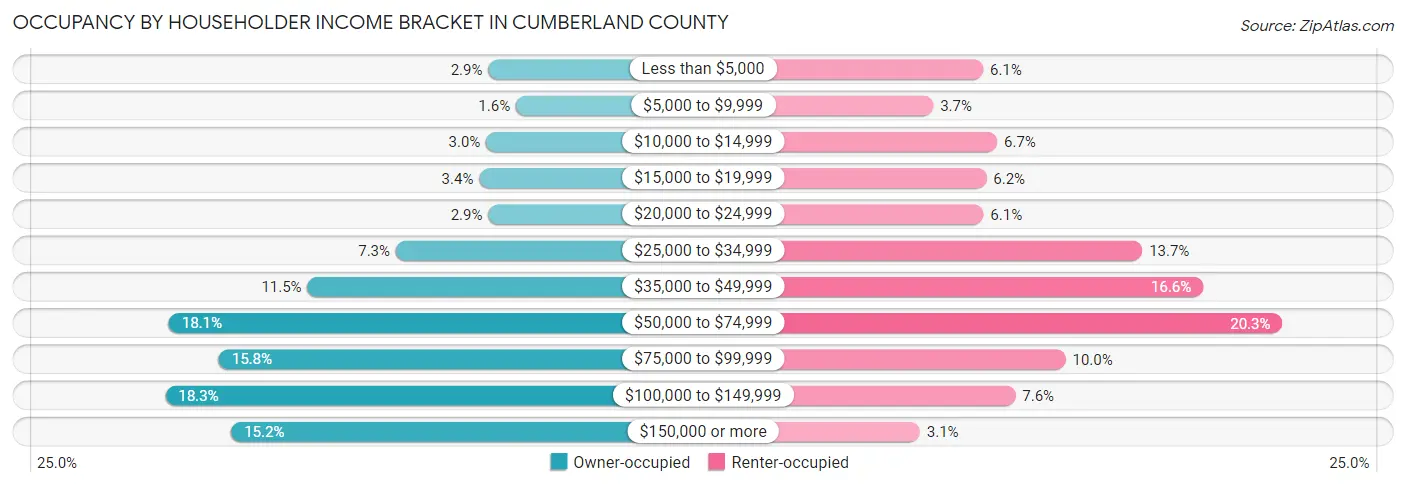
| Income Bracket | Owner-occupied | Renter-occupied |
| Less than $5,000 | 1,948 (2.9%) | 3,643 (6.1%) |
| $5,000 to $9,999 | 1,065 (1.6%) | 2,218 (3.7%) |
| $10,000 to $14,999 | 2,015 (3.0%) | 4,048 (6.7%) |
| $15,000 to $19,999 | 2,236 (3.4%) | 3,737 (6.2%) |
| $20,000 to $24,999 | 1,951 (2.9%) | 3,655 (6.1%) |
| $25,000 to $34,999 | 4,881 (7.3%) | 8,192 (13.7%) |
| $35,000 to $49,999 | 7,691 (11.5%) | 9,935 (16.6%) |
| $50,000 to $74,999 | 12,099 (18.1%) | 12,195 (20.3%) |
| $75,000 to $99,999 | 10,508 (15.8%) | 6,002 (10.0%) |
| $100,000 to $149,999 | 12,211 (18.3%) | 4,565 (7.6%) |
| $150,000 or more | 10,115 (15.2%) | 1,835 (3.1%) |
| Total | 66,720 (100.0%) | 60,025 (100.0%) |
Monthly Housing Cost Tiers in Cumberland County
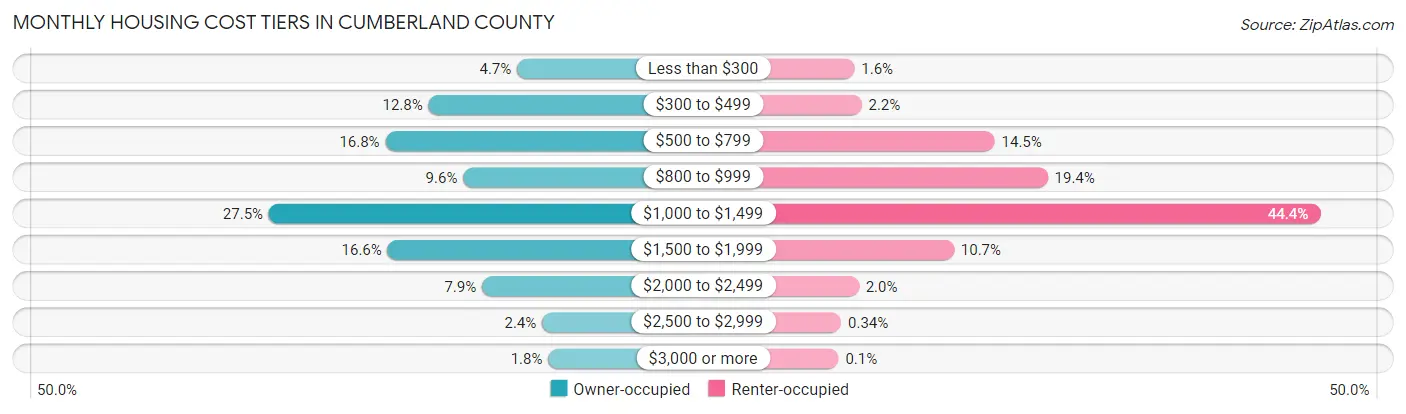
| Monthly Cost | Owner-occupied | Renter-occupied |
| Less than $300 | 3,107 (4.7%) | 936 (1.6%) |
| $300 to $499 | 8,546 (12.8%) | 1,332 (2.2%) |
| $500 to $799 | 11,196 (16.8%) | 8,684 (14.5%) |
| $800 to $999 | 6,419 (9.6%) | 11,615 (19.4%) |
| $1,000 to $1,499 | 18,358 (27.5%) | 26,667 (44.4%) |
| $1,500 to $1,999 | 11,064 (16.6%) | 6,435 (10.7%) |
| $2,000 to $2,499 | 5,261 (7.9%) | 1,177 (2.0%) |
| $2,500 to $2,999 | 1,573 (2.4%) | 205 (0.3%) |
| $3,000 or more | 1,196 (1.8%) | 59 (0.1%) |
| Total | 66,720 (100.0%) | 60,025 (100.0%) |
Physical Housing Characteristics in Cumberland County
Housing Structures in Cumberland County

| Structure Type | # Housing Units | % Housing Units |
| Single Unit, Detached | 82,820 | 65.3% |
| Single Unit, Attached | 3,449 | 2.7% |
| 2 Unit Apartments | 3,384 | 2.7% |
| 3 or 4 Unit Apartments | 4,583 | 3.6% |
| 5 to 9 Unit Apartments | 8,490 | 6.7% |
| 10 or more Apartments | 13,984 | 11.0% |
| Mobile Home / Other | 10,035 | 7.9% |
| Total | 126,745 | 100.0% |
Housing Structures by Occupancy in Cumberland County
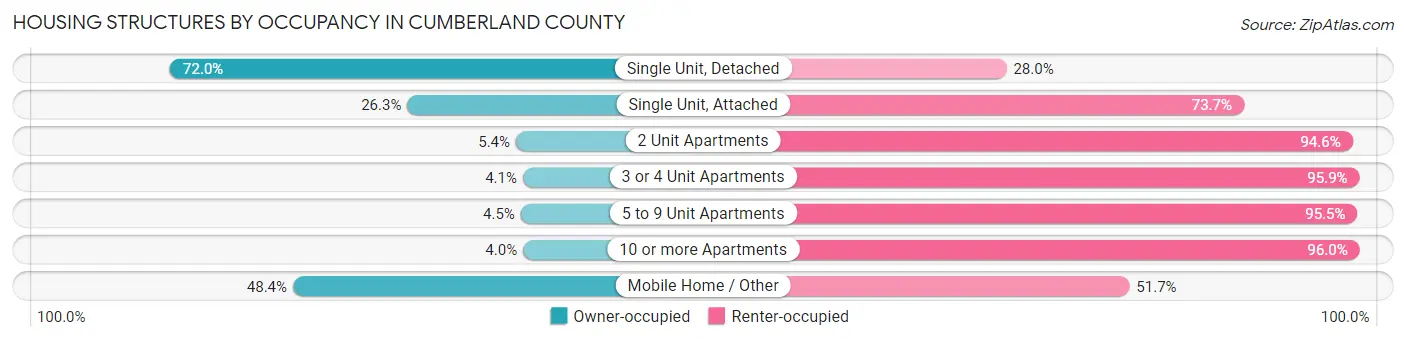
| Structure Type | Owner-occupied | Renter-occupied |
| Single Unit, Detached | 59,644 (72.0%) | 23,176 (28.0%) |
| Single Unit, Attached | 908 (26.3%) | 2,541 (73.7%) |
| 2 Unit Apartments | 183 (5.4%) | 3,201 (94.6%) |
| 3 or 4 Unit Apartments | 187 (4.1%) | 4,396 (95.9%) |
| 5 to 9 Unit Apartments | 381 (4.5%) | 8,109 (95.5%) |
| 10 or more Apartments | 565 (4.0%) | 13,419 (96.0%) |
| Mobile Home / Other | 4,852 (48.3%) | 5,183 (51.6%) |
| Total | 66,720 (52.6%) | 60,025 (47.4%) |
Housing Structures by Number of Rooms in Cumberland County
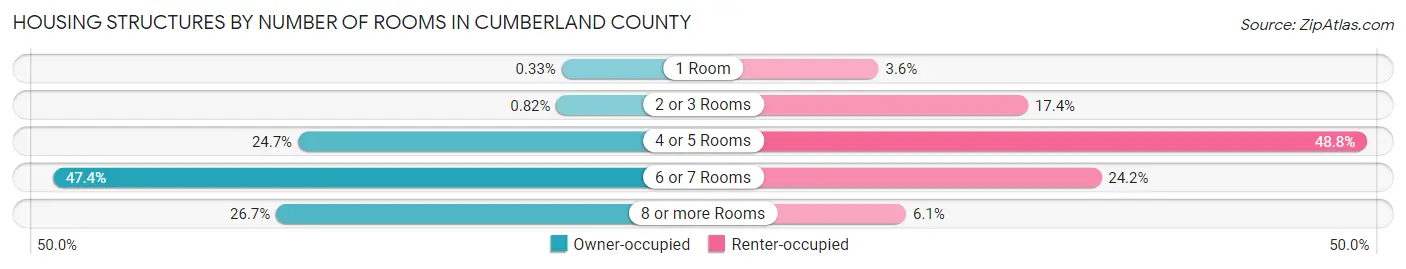
| Number of Rooms | Owner-occupied | Renter-occupied |
| 1 Room | 220 (0.3%) | 2,142 (3.6%) |
| 2 or 3 Rooms | 547 (0.8%) | 10,439 (17.4%) |
| 4 or 5 Rooms | 16,491 (24.7%) | 29,262 (48.7%) |
| 6 or 7 Rooms | 31,619 (47.4%) | 14,511 (24.2%) |
| 8 or more Rooms | 17,843 (26.7%) | 3,671 (6.1%) |
| Total | 66,720 (100.0%) | 60,025 (100.0%) |
Housing Structure by Heating Type in Cumberland County
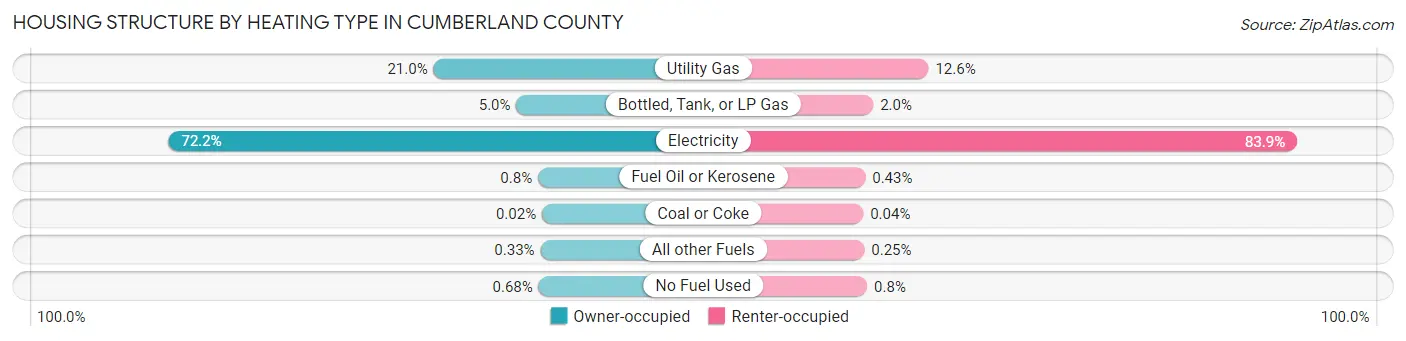
| Heating Type | Owner-occupied | Renter-occupied |
| Utility Gas | 14,002 (21.0%) | 7,589 (12.6%) |
| Bottled, Tank, or LP Gas | 3,317 (5.0%) | 1,184 (2.0%) |
| Electricity | 48,183 (72.2%) | 50,339 (83.9%) |
| Fuel Oil or Kerosene | 533 (0.8%) | 258 (0.4%) |
| Coal or Coke | 12 (0.0%) | 26 (0.0%) |
| All other Fuels | 217 (0.3%) | 149 (0.3%) |
| No Fuel Used | 456 (0.7%) | 480 (0.8%) |
| Total | 66,720 (100.0%) | 60,025 (100.0%) |
Household Vehicle Usage in Cumberland County
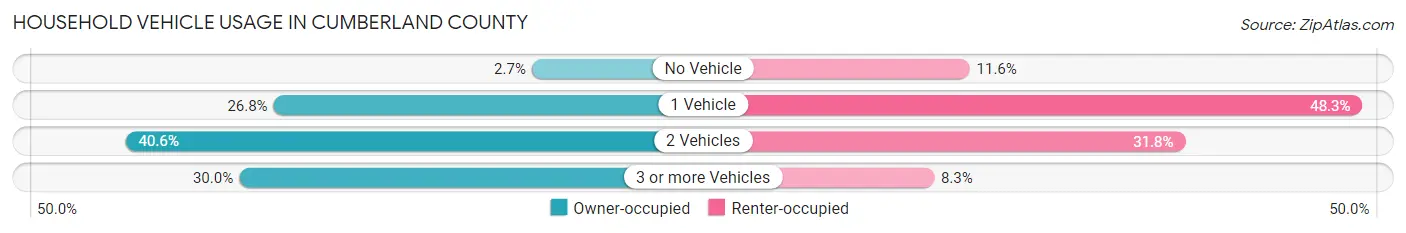
| Vehicles per Household | Owner-occupied | Renter-occupied |
| No Vehicle | 1,774 (2.7%) | 6,986 (11.6%) |
| 1 Vehicle | 17,861 (26.8%) | 28,984 (48.3%) |
| 2 Vehicles | 27,078 (40.6%) | 19,069 (31.8%) |
| 3 or more Vehicles | 20,007 (30.0%) | 4,986 (8.3%) |
| Total | 66,720 (100.0%) | 60,025 (100.0%) |
Real Estate & Mortgages in Cumberland County
Real Estate and Mortgage Overview in Cumberland County
| Characteristic | Without Mortgage | With Mortgage |
| Housing Units | 22,031 | 44,689 |
| Median Property Value | $124,500 | $185,000 |
| Median Household Income | $54,235 | $7,673 |
| Monthly Housing Costs | $492 | $1,183 |
| Real Estate Taxes | $1,506 | $1,317 |
Property Value by Mortgage Status in Cumberland County
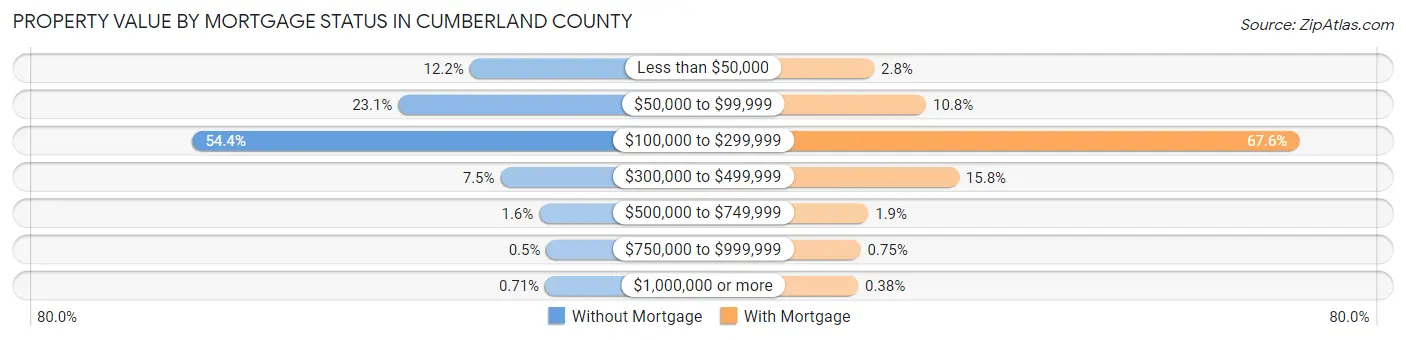
| Property Value | Without Mortgage | With Mortgage |
| Less than $50,000 | 2,687 (12.2%) | 1,266 (2.8%) |
| $50,000 to $99,999 | 5,083 (23.1%) | 4,806 (10.7%) |
| $100,000 to $299,999 | 11,988 (54.4%) | 30,210 (67.6%) |
| $300,000 to $499,999 | 1,653 (7.5%) | 7,037 (15.8%) |
| $500,000 to $749,999 | 352 (1.6%) | 866 (1.9%) |
| $750,000 to $999,999 | 111 (0.5%) | 334 (0.7%) |
| $1,000,000 or more | 157 (0.7%) | 170 (0.4%) |
| Total | 22,031 (100.0%) | 44,689 (100.0%) |
Household Income by Mortgage Status in Cumberland County
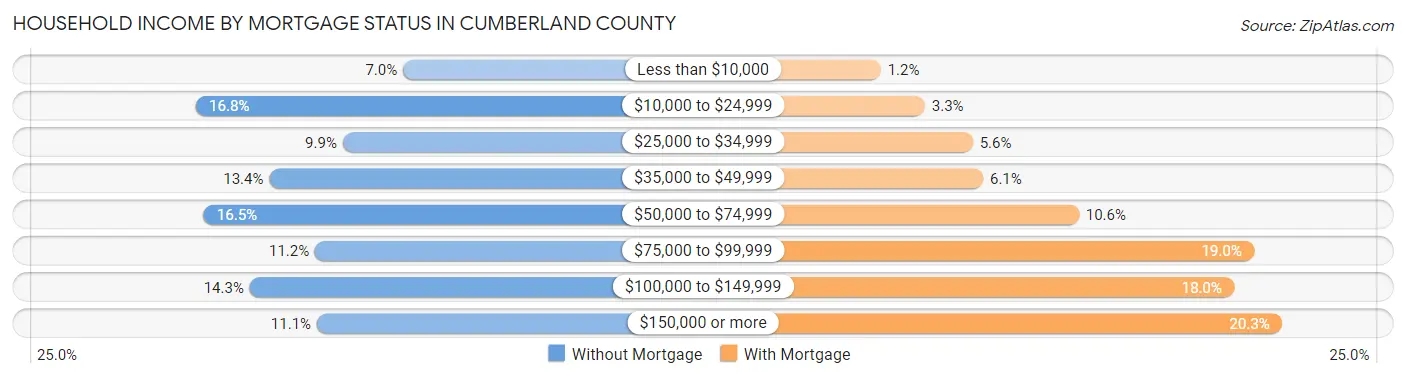
| Household Income | Without Mortgage | With Mortgage |
| Less than $10,000 | 1,538 (7.0%) | 536 (1.2%) |
| $10,000 to $24,999 | 3,707 (16.8%) | 1,475 (3.3%) |
| $25,000 to $34,999 | 2,170 (9.9%) | 2,495 (5.6%) |
| $35,000 to $49,999 | 2,941 (13.4%) | 2,711 (6.1%) |
| $50,000 to $74,999 | 3,627 (16.5%) | 4,750 (10.6%) |
| $75,000 to $99,999 | 2,461 (11.2%) | 8,472 (19.0%) |
| $100,000 to $149,999 | 3,145 (14.3%) | 8,047 (18.0%) |
| $150,000 or more | 2,442 (11.1%) | 9,066 (20.3%) |
| Total | 22,031 (100.0%) | 44,689 (100.0%) |
Property Value to Household Income Ratio in Cumberland County
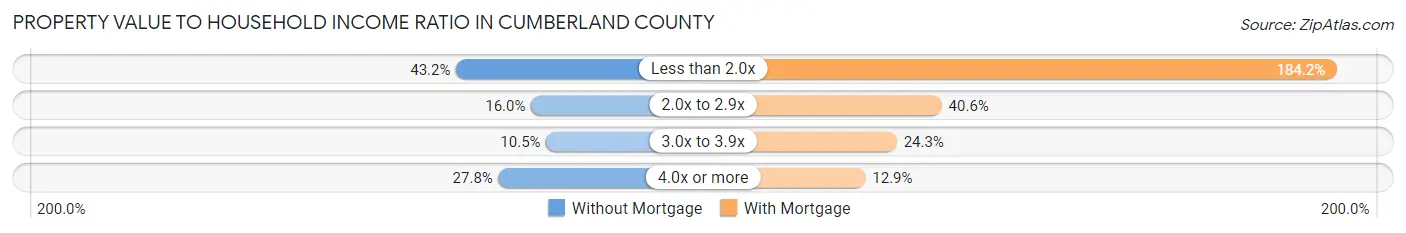
| Value-to-Income Ratio | Without Mortgage | With Mortgage |
| Less than 2.0x | 9,519 (43.2%) | 82,324 (184.2%) |
| 2.0x to 2.9x | 3,516 (16.0%) | 18,137 (40.6%) |
| 3.0x to 3.9x | 2,304 (10.5%) | 10,842 (24.3%) |
| 4.0x or more | 6,126 (27.8%) | 5,752 (12.9%) |
| Total | 22,031 (100.0%) | 44,689 (100.0%) |
Real Estate Taxes by Mortgage Status in Cumberland County
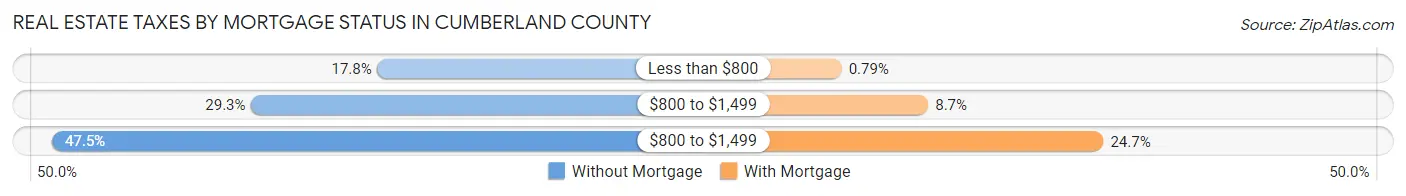
| Property Taxes | Without Mortgage | With Mortgage |
| Less than $800 | 3,914 (17.8%) | 353 (0.8%) |
| $800 to $1,499 | 6,453 (29.3%) | 3,890 (8.7%) |
| $800 to $1,499 | 10,464 (47.5%) | 11,036 (24.7%) |
| Total | 22,031 (100.0%) | 44,689 (100.0%) |
Health & Disability in Cumberland County
Health Insurance Coverage by Age in Cumberland County
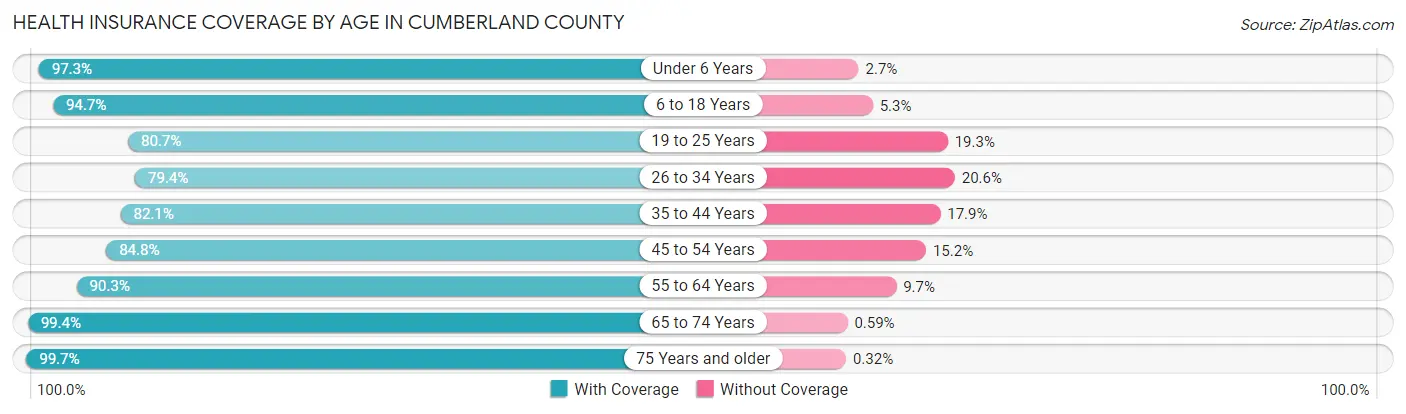
| Age Bracket | With Coverage | Without Coverage |
| Under 6 Years | 28,694 (97.3%) | 784 (2.7%) |
| 6 to 18 Years | 55,440 (94.7%) | 3,103 (5.3%) |
| 19 to 25 Years | 24,237 (80.7%) | 5,794 (19.3%) |
| 26 to 34 Years | 30,015 (79.4%) | 7,791 (20.6%) |
| 35 to 44 Years | 29,818 (82.1%) | 6,501 (17.9%) |
| 45 to 54 Years | 28,120 (84.8%) | 5,054 (15.2%) |
| 55 to 64 Years | 31,542 (90.3%) | 3,380 (9.7%) |
| 65 to 74 Years | 24,635 (99.4%) | 146 (0.6%) |
| 75 Years and older | 16,075 (99.7%) | 52 (0.3%) |
| Total | 268,576 (89.2%) | 32,605 (10.8%) |
Health Insurance Coverage by Citizenship Status in Cumberland County
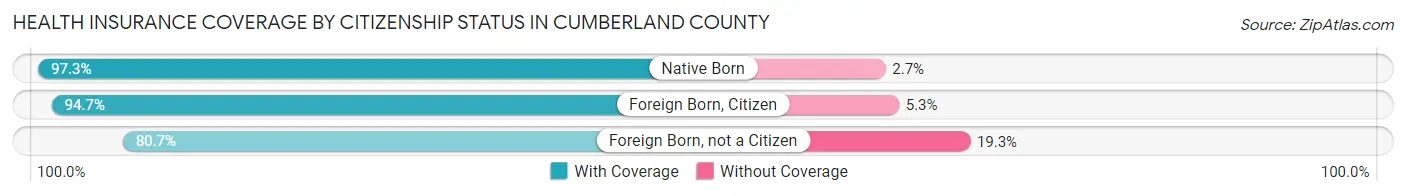
| Citizenship Status | With Coverage | Without Coverage |
| Native Born | 28,694 (97.3%) | 784 (2.7%) |
| Foreign Born, Citizen | 55,440 (94.7%) | 3,103 (5.3%) |
| Foreign Born, not a Citizen | 24,237 (80.7%) | 5,794 (19.3%) |
Health Insurance Coverage by Household Income in Cumberland County

| Household Income | With Coverage | Without Coverage |
| Under $25,000 | 41,026 (83.3%) | 8,208 (16.7%) |
| $25,000 to $49,999 | 56,592 (87.7%) | 7,952 (12.3%) |
| $50,000 to $74,999 | 49,544 (87.3%) | 7,190 (12.7%) |
| $75,000 to $99,999 | 39,254 (92.8%) | 3,045 (7.2%) |
| $100,000 and over | 80,389 (93.1%) | 5,962 (6.9%) |
Public vs Private Health Insurance Coverage by Age in Cumberland County
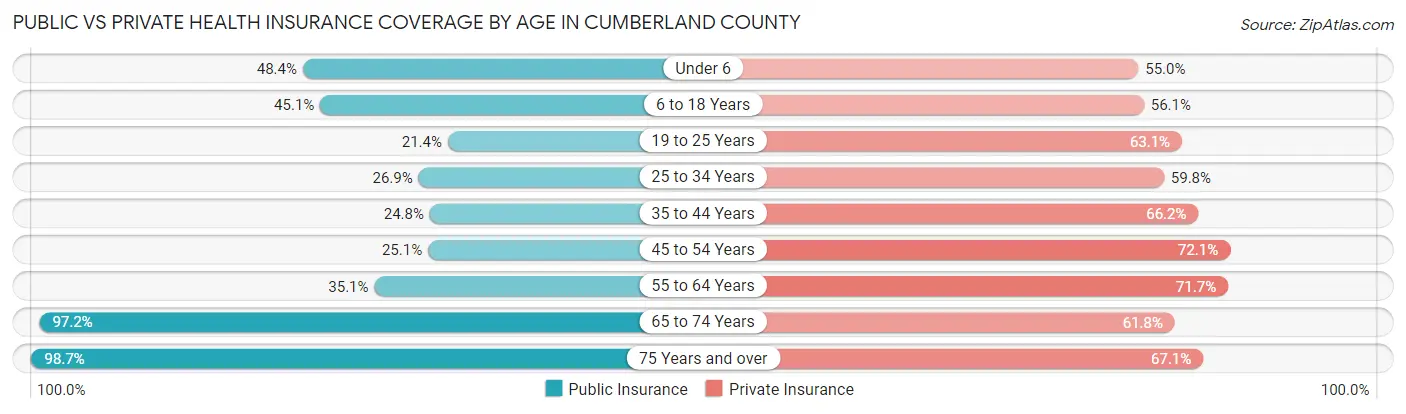
| Age Bracket | Public Insurance | Private Insurance |
| Under 6 | 14,255 (48.4%) | 16,223 (55.0%) |
| 6 to 18 Years | 26,427 (45.1%) | 32,814 (56.0%) |
| 19 to 25 Years | 6,439 (21.4%) | 18,959 (63.1%) |
| 25 to 34 Years | 10,162 (26.9%) | 22,601 (59.8%) |
| 35 to 44 Years | 9,005 (24.8%) | 24,029 (66.2%) |
| 45 to 54 Years | 8,336 (25.1%) | 23,904 (72.1%) |
| 55 to 64 Years | 12,250 (35.1%) | 25,034 (71.7%) |
| 65 to 74 Years | 24,098 (97.2%) | 15,316 (61.8%) |
| 75 Years and over | 15,922 (98.7%) | 10,815 (67.1%) |
| Total | 126,894 (42.1%) | 189,695 (63.0%) |
Disability Status by Sex by Age in Cumberland County
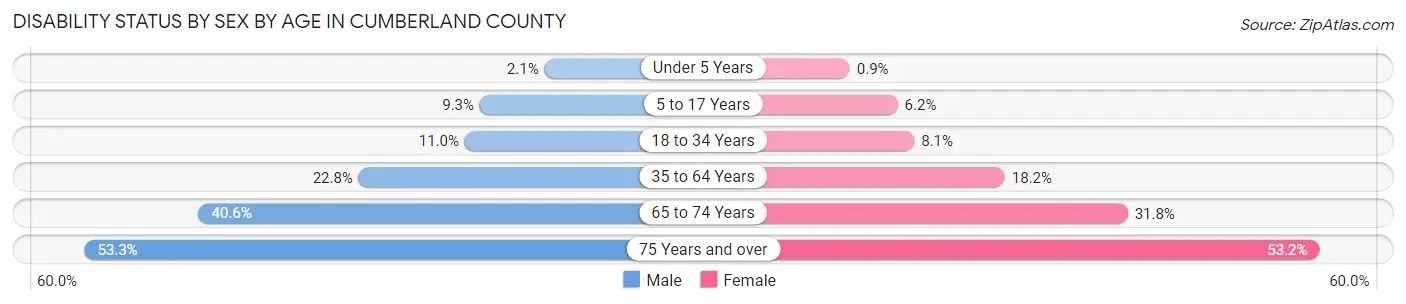
| Age Bracket | Male | Female |
| Under 5 Years | 263 (2.1%) | 110 (0.9%) |
| 5 to 17 Years | 2,774 (9.3%) | 1,792 (6.2%) |
| 18 to 34 Years | 3,445 (11.0%) | 3,307 (8.1%) |
| 35 to 64 Years | 10,531 (22.8%) | 10,570 (18.2%) |
| 65 to 74 Years | 4,557 (40.6%) | 4,319 (31.8%) |
| 75 Years and over | 3,191 (53.3%) | 5,394 (53.2%) |
Disability Class by Sex by Age in Cumberland County
Disability Class: Hearing Difficulty
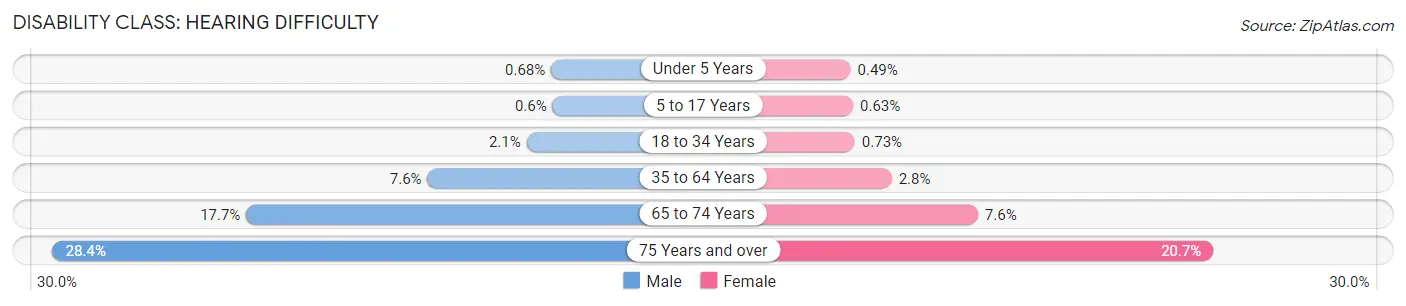
| Age Bracket | Male | Female |
| Under 5 Years | 85 (0.7%) | 60 (0.5%) |
| 5 to 17 Years | 180 (0.6%) | 182 (0.6%) |
| 18 to 34 Years | 645 (2.1%) | 301 (0.7%) |
| 35 to 64 Years | 3,498 (7.6%) | 1,618 (2.8%) |
| 65 to 74 Years | 1,981 (17.7%) | 1,028 (7.6%) |
| 75 Years and over | 1,702 (28.4%) | 2,098 (20.7%) |
Disability Class: Vision Difficulty
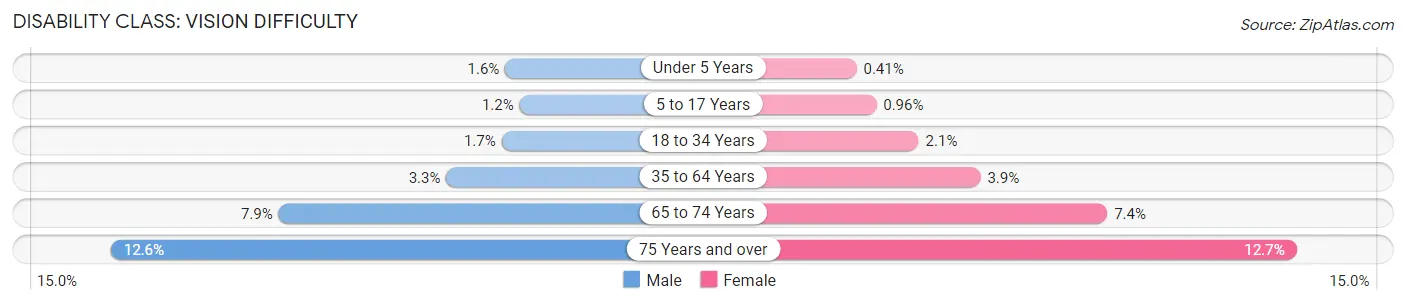
| Age Bracket | Male | Female |
| Under 5 Years | 203 (1.6%) | 50 (0.4%) |
| 5 to 17 Years | 363 (1.2%) | 276 (1.0%) |
| 18 to 34 Years | 541 (1.7%) | 876 (2.1%) |
| 35 to 64 Years | 1,506 (3.3%) | 2,247 (3.9%) |
| 65 to 74 Years | 889 (7.9%) | 1,002 (7.4%) |
| 75 Years and over | 754 (12.6%) | 1,284 (12.7%) |
Disability Class: Cognitive Difficulty
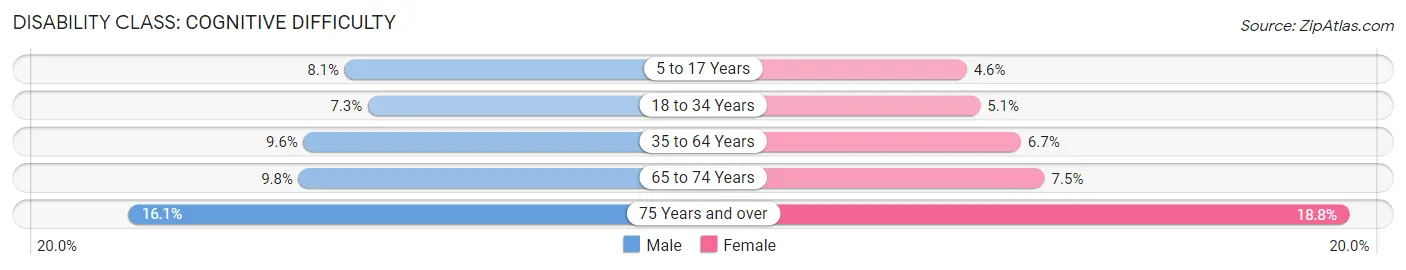
| Age Bracket | Male | Female |
| 5 to 17 Years | 2,419 (8.1%) | 1,337 (4.6%) |
| 18 to 34 Years | 2,278 (7.2%) | 2,106 (5.1%) |
| 35 to 64 Years | 4,455 (9.6%) | 3,871 (6.7%) |
| 65 to 74 Years | 1,102 (9.8%) | 1,022 (7.5%) |
| 75 Years and over | 965 (16.1%) | 1,909 (18.8%) |
Disability Class: Ambulatory Difficulty
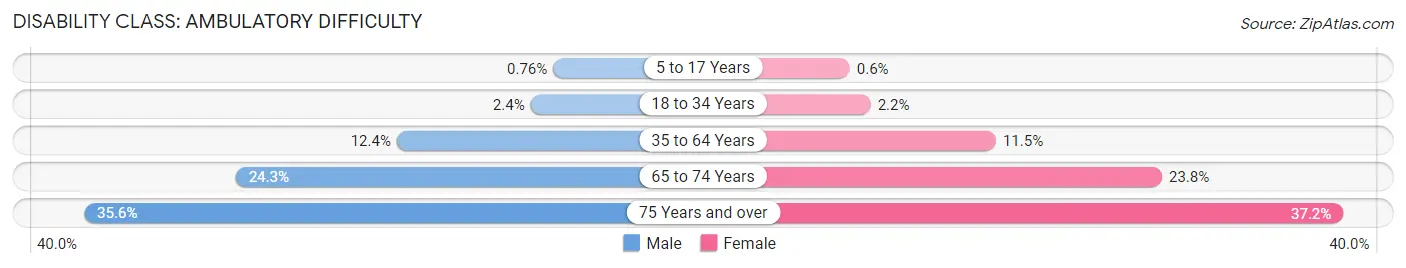
| Age Bracket | Male | Female |
| 5 to 17 Years | 226 (0.8%) | 172 (0.6%) |
| 18 to 34 Years | 766 (2.4%) | 882 (2.1%) |
| 35 to 64 Years | 5,717 (12.4%) | 6,663 (11.5%) |
| 65 to 74 Years | 2,728 (24.3%) | 3,226 (23.8%) |
| 75 Years and over | 2,129 (35.6%) | 3,775 (37.2%) |
Disability Class: Self-Care Difficulty
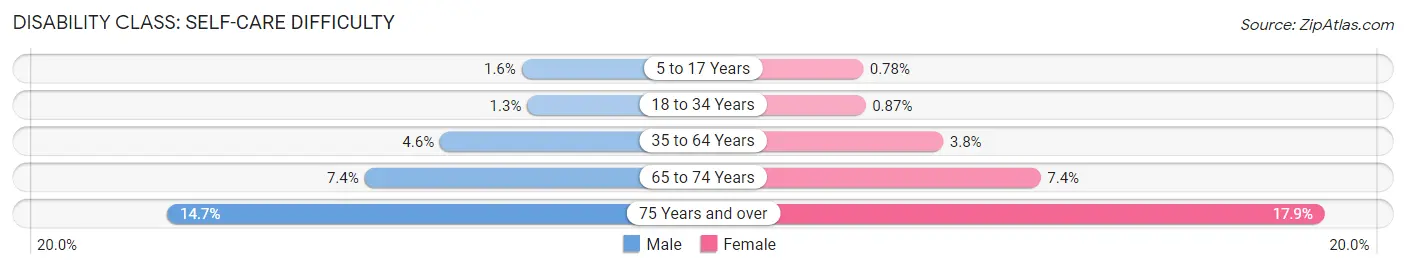
| Age Bracket | Male | Female |
| 5 to 17 Years | 462 (1.5%) | 226 (0.8%) |
| 18 to 34 Years | 420 (1.3%) | 357 (0.9%) |
| 35 to 64 Years | 2,116 (4.6%) | 2,185 (3.7%) |
| 65 to 74 Years | 828 (7.4%) | 1,000 (7.4%) |
| 75 Years and over | 880 (14.7%) | 1,819 (17.9%) |
Technology Access in Cumberland County
Computing Device Access in Cumberland County
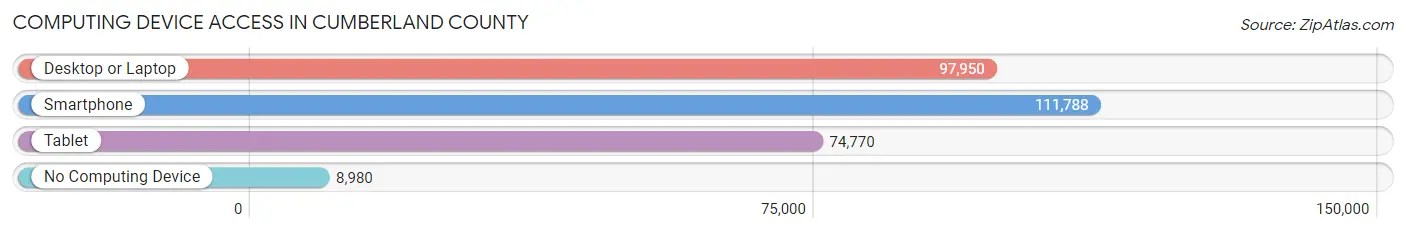
| Device Type | # Households | % Households |
| Desktop or Laptop | 97,950 | 77.3% |
| Smartphone | 111,788 | 88.2% |
| Tablet | 74,770 | 59.0% |
| No Computing Device | 8,980 | 7.1% |
| Total | 126,745 | 100.0% |
Internet Access in Cumberland County
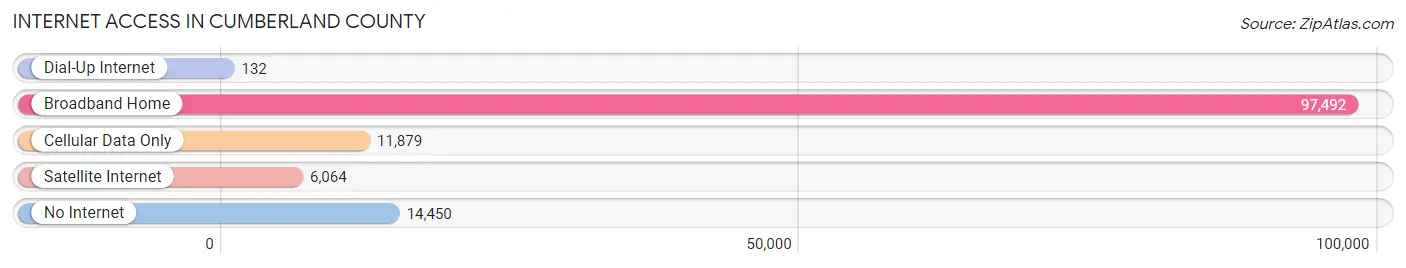
| Internet Type | # Households | % Households |
| Dial-Up Internet | 132 | 0.1% |
| Broadband Home | 97,492 | 76.9% |
| Cellular Data Only | 11,879 | 9.4% |
| Satellite Internet | 6,064 | 4.8% |
| No Internet | 14,450 | 11.4% |
| Total | 126,745 | 100.0% |
Cumberland County Summary
Cumberland County is located in the southern part of North Carolina, and is part of the Fayetteville Metropolitan Statistical Area. The county was formed in 1754 from Bladen County and was named for William Augustus, Duke of Cumberland. As of the 2010 census, the population was 319,431, making it the fifth-most populous county in North Carolina.
Geography
Cumberland County is located in the Coastal Plain region of North Carolina, and is bordered by Harnett County to the north, Hoke County to the east, Robeson County to the south, and Bladen County to the west. The county covers an area of 645 square miles, and is the second-largest county in the state. The terrain is mostly flat, with some rolling hills in the northern part of the county. The Cape Fear River forms the western border of the county, and the Little River forms the eastern border.
The county is home to several state parks, including Carvers Creek State Park, Raven Rock State Park, and Jordan Lake State Recreation Area. The county also contains the cities of Fayetteville, Hope Mills, Spring Lake, and Eastover.
Demographics
As of the 2010 census, there were 319,431 people, 118,845 households, and 81,945 families residing in the county. The population density was 495.3 people per square mile. The racial makeup of the county was 54.3% White, 33.3% African American, 0.5% Native American, 2.2% Asian, 0.1% Pacific Islander, 7.2% from other races, and 2.4% from two or more races. Hispanic or Latino of any race were 13.3% of the population.
The median income for a household in the county was $41,945, and the median income for a family was $50,945. The per capita income for the county was $20,945. About 17.2% of families and 21.3% of the population were below the poverty line, including 28.3% of those under age 18 and 11.2% of those age 65 or over.
Economy
Cumberland County is home to several major employers, including Fort Bragg, the largest military installation in the world. Other major employers include Fayetteville Technical Community College, Cape Fear Valley Medical Center, and the Fayetteville Regional Airport.
The county is also home to several large manufacturing companies, including Goodyear Tire and Rubber Company, General Electric, and Corning Incorporated. The county is also home to several large retail stores, including Walmart, Target, and Lowe's.
The county is home to several large agricultural operations, including poultry, beef, and dairy farms. The county is also home to several wineries and vineyards.
Conclusion
Cumberland County is a large and diverse county located in the southern part of North Carolina. The county is home to several major employers, including Fort Bragg, Fayetteville Technical Community College, and Cape Fear Valley Medical Center. The county is also home to several large manufacturing companies, retail stores, and agricultural operations. The population of the county is diverse, with a median income of $41,945 and a per capita income of $20,945.
Common Questions
What is the Total Population of Cumberland County?
Total Population of Cumberland County is 335,207.
What is the Total Male Population of Cumberland County?
Total Male Population of Cumberland County is 166,798.
What is the Total Female Population of Cumberland County?
Total Female Population of Cumberland County is 168,409.
What is the Ratio of Males per 100 Females in Cumberland County?
There are 99.04 Males per 100 Females in Cumberland County.
What is the Ratio of Females per 100 Males in Cumberland County?
There are 100.97 Females per 100 Males in Cumberland County.
What is the Median Population Age in Cumberland County?
Median Population Age in Cumberland County is 31.7 Years.
What is the Average Family Size in Cumberland County
Average Family Size in Cumberland County is 3.2 People.
What is the Average Household Size in Cumberland County
Average Household Size in Cumberland County is 2.5 People.
What is Per Capita Income in Cumberland County?
Per Capita income in Cumberland County is $29,681.
What is the Median Family Income in Cumberland County?
Median Family Income in Cumberland County is $66,288.
What is the Median Household income in Cumberland County?
Median Household Income in Cumberland County is $55,551.
What is Income or Wage Gap in Cumberland County?
Income or Wage Gap in Cumberland County is 20.6%.
Women in Cumberland County earn 79.4 cents for every dollar earned by a man.
What is Family Income Deficit in Cumberland County?
Family Income Deficit in Cumberland County is $11,157.
Families that are below poverty line in Cumberland County earn $11,157 less on average than the poverty threshold level.
What is Inequality or Gini Index in Cumberland County?
Inequality or Gini Index in Cumberland County is 0.45.
How Large is the Labor Force in Cumberland County?
There are 167,544 People in the Labor Forcein in Cumberland County.
What is the Percentage of People in the Labor Force in Cumberland County?
64.4% of People are in the Labor Force in Cumberland County.
What is the Unemployment Rate in Cumberland County?
Unemployment Rate in Cumberland County is 7.9%.