Craven County, NC
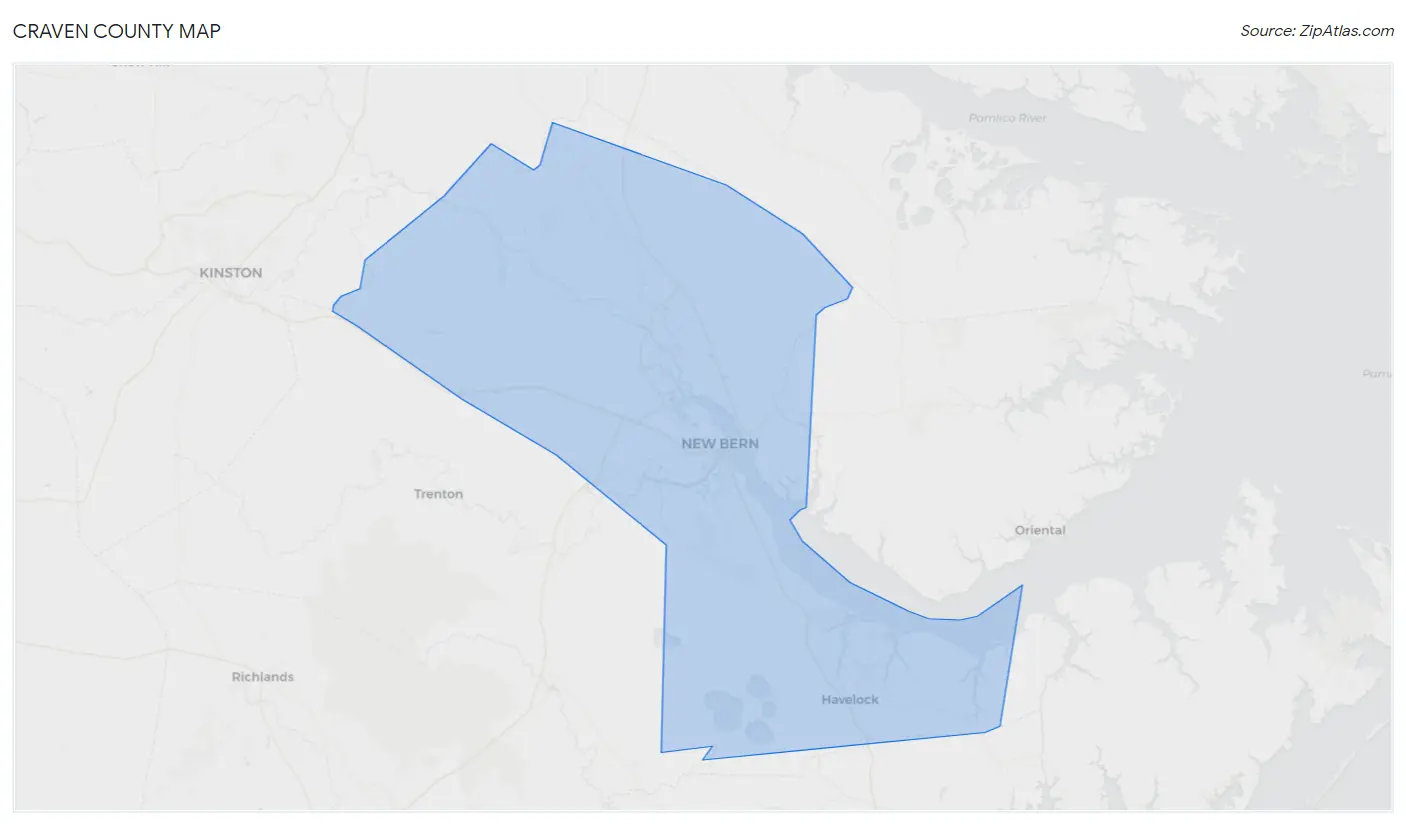
Craven County Map
Craven County Overview
101,098
TOTAL POPULATION
50,563
MALE POPULATION
50,535
FEMALE POPULATION
100.06
MALES / 100 FEMALES
99.94
FEMALES / 100 MALES
38.5
MEDIAN AGE
2.9
AVG FAMILY SIZE
2.4
AVG HOUSEHOLD SIZE
$33,963
PER CAPITA INCOME
$77,888
AVG FAMILY INCOME
$61,676
AVG HOUSEHOLD INCOME
26.4%
WAGE / INCOME GAP [ % ]
73.6¢/ $1
WAGE / INCOME GAP [ $ ]
$10,559
FAMILY INCOME DEFICIT
0.46
INEQUALITY / GINI INDEX
47,566
LABOR FORCE [ PEOPLE ]
58.5%
PERCENT IN LABOR FORCE
5.1%
UNEMPLOYMENT RATE
Craven County Area Codes
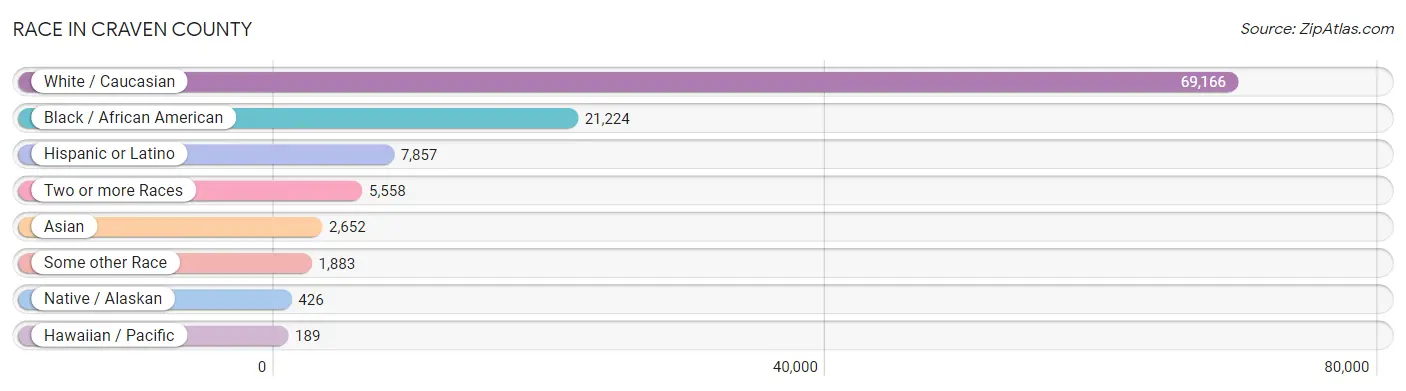
Race in Craven County
The most populous races in Craven County are White / Caucasian (69,166 | 68.4%), Black / African American (21,224 | 21.0%), and Hispanic or Latino (7,857 | 7.8%).
| Race | # Population | % Population |
| Asian | 2,652 | 2.6% |
| Black / African American | 21,224 | 21.0% |
| Hawaiian / Pacific | 189 | 0.2% |
| Hispanic or Latino | 7,857 | 7.8% |
| Native / Alaskan | 426 | 0.4% |
| White / Caucasian | 69,166 | 68.4% |
| Two or more Races | 5,558 | 5.5% |
| Some other Race | 1,883 | 1.9% |
| Total | 101,098 | 100.0% |
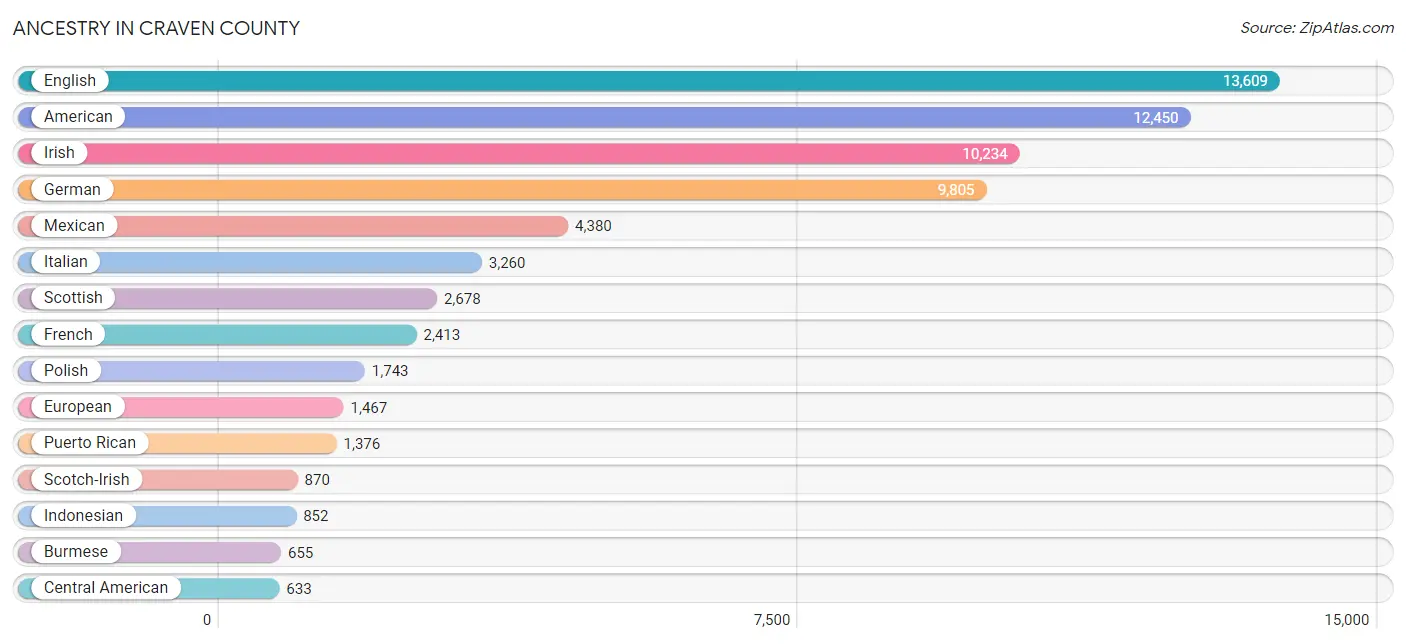
Ancestry in Craven County
The most populous ancestries reported in Craven County are English (13,609 | 13.5%), American (12,450 | 12.3%), Irish (10,234 | 10.1%), German (9,805 | 9.7%), and Mexican (4,380 | 4.3%), together accounting for 49.9% of all Craven County residents.
| Ancestry | # Population | % Population |
| African | 350 | 0.4% |
| American | 12,450 | 12.3% |
| Apache | 12 | 0.0% |
| Arab | 250 | 0.3% |
| Argentinean | 24 | 0.0% |
| Armenian | 39 | 0.0% |
| Australian | 13 | 0.0% |
| Austrian | 88 | 0.1% |
| Bangladeshi | 16 | 0.0% |
| Belgian | 32 | 0.0% |
| Bhutanese | 478 | 0.5% |
| Blackfeet | 98 | 0.1% |
| Brazilian | 88 | 0.1% |
| British | 425 | 0.4% |
| Burmese | 655 | 0.6% |
| Canadian | 239 | 0.2% |
| Celtic | 7 | 0.0% |
| Central American | 633 | 0.6% |
| Central American Indian | 24 | 0.0% |
| Cherokee | 231 | 0.2% |
| Chickasaw | 25 | 0.0% |
| Chilean | 52 | 0.1% |
| Chinese | 5 | 0.0% |
| Colombian | 253 | 0.3% |
| Costa Rican | 50 | 0.1% |
| Creek | 6 | 0.0% |
| Croatian | 64 | 0.1% |
| Cuban | 504 | 0.5% |
| Czech | 203 | 0.2% |
| Czechoslovakian | 53 | 0.1% |
| Danish | 124 | 0.1% |
| Dominican | 215 | 0.2% |
| Dutch | 557 | 0.5% |
| Eastern European | 170 | 0.2% |
| Ecuadorian | 134 | 0.1% |
| Egyptian | 37 | 0.0% |
| English | 13,609 | 13.5% |
| European | 1,467 | 1.5% |
| Fijian | 105 | 0.1% |
| Finnish | 80 | 0.1% |
| French | 2,413 | 2.4% |
| French American Indian | 18 | 0.0% |
| French Canadian | 576 | 0.6% |
| German | 9,805 | 9.7% |
| Greek | 151 | 0.2% |
| Guamanian / Chamorro | 152 | 0.2% |
| Guatemalan | 178 | 0.2% |
| Haitian | 275 | 0.3% |
| Honduran | 86 | 0.1% |
| Hungarian | 322 | 0.3% |
| Icelander | 6 | 0.0% |
| Indian (Asian) | 505 | 0.5% |
| Indonesian | 852 | 0.8% |
| Inupiat | 2 | 0.0% |
| Irish | 10,234 | 10.1% |
| Italian | 3,260 | 3.2% |
| Jamaican | 87 | 0.1% |
| Japanese | 199 | 0.2% |
| Kenyan | 25 | 0.0% |
| Korean | 583 | 0.6% |
| Laotian | 120 | 0.1% |
| Lebanese | 204 | 0.2% |
| Lithuanian | 90 | 0.1% |
| Lumbee | 101 | 0.1% |
| Malaysian | 26 | 0.0% |
| Mexican | 4,380 | 4.3% |
| Mexican American Indian | 41 | 0.0% |
| Native Hawaiian | 317 | 0.3% |
| Navajo | 90 | 0.1% |
| Nicaraguan | 36 | 0.0% |
| Nigerian | 4 | 0.0% |
| Northern European | 58 | 0.1% |
| Norwegian | 464 | 0.5% |
| Pakistani | 144 | 0.1% |
| Paraguayan | 86 | 0.1% |
| Pennsylvania German | 40 | 0.0% |
| Peruvian | 38 | 0.0% |
| Polish | 1,743 | 1.7% |
| Portuguese | 225 | 0.2% |
| Potawatomi | 35 | 0.0% |
| Puerto Rican | 1,376 | 1.4% |
| Romanian | 40 | 0.0% |
| Russian | 250 | 0.3% |
| Salvadoran | 283 | 0.3% |
| Samoan | 33 | 0.0% |
| Scandinavian | 117 | 0.1% |
| Scotch-Irish | 870 | 0.9% |
| Scottish | 2,678 | 2.6% |
| Serbian | 74 | 0.1% |
| Slavic | 50 | 0.1% |
| Slovak | 263 | 0.3% |
| Slovene | 47 | 0.1% |
| South African | 24 | 0.0% |
| South American | 587 | 0.6% |
| South American Indian | 38 | 0.0% |
| Spaniard | 32 | 0.0% |
| Spanish | 27 | 0.0% |
| Sri Lankan | 330 | 0.3% |
| Subsaharan African | 563 | 0.6% |
| Swedish | 503 | 0.5% |
| Swiss | 219 | 0.2% |
| Syrian | 5 | 0.0% |
| Thai | 78 | 0.1% |
| Trinidadian and Tobagonian | 7 | 0.0% |
| Turkish | 15 | 0.0% |
| Ukrainian | 161 | 0.2% |
| Ute | 10 | 0.0% |
| Welsh | 433 | 0.4% |
| West Indian | 9 | 0.0% |
| Yup'ik | 3 | 0.0% | View All 110 Rows |
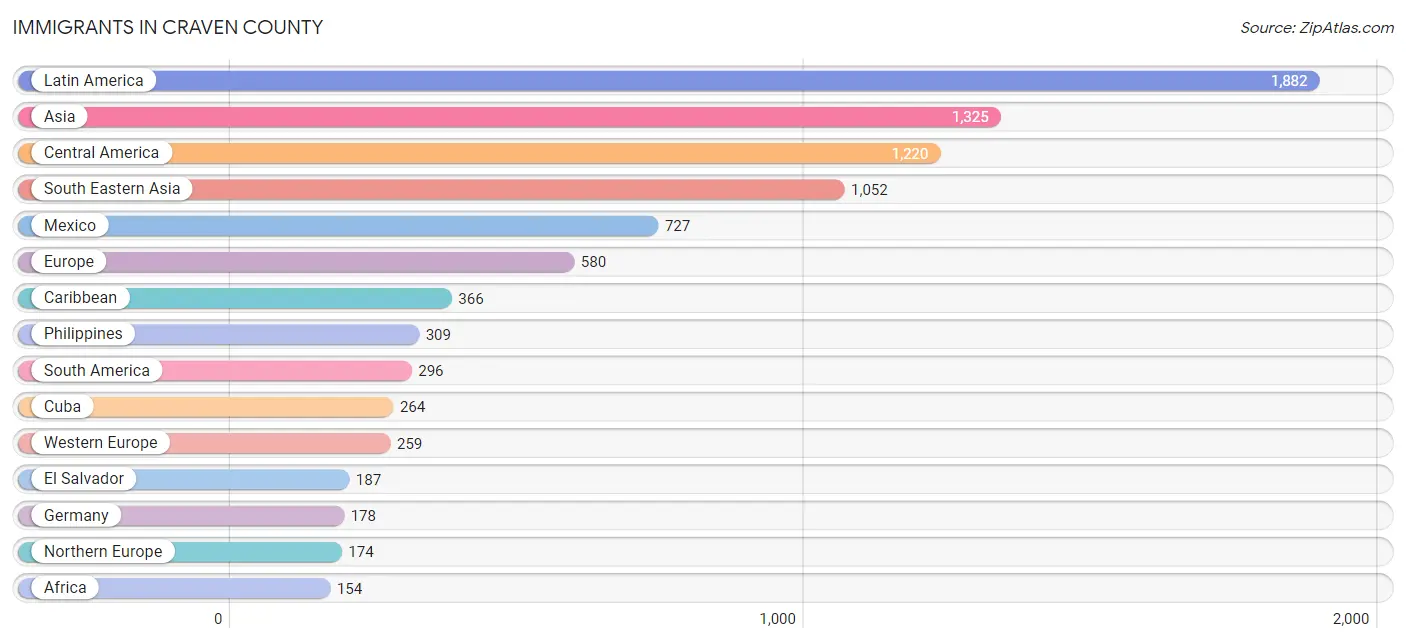
Immigrants in Craven County
The most numerous immigrant groups reported in Craven County came from Latin America (1,882 | 1.9%), Asia (1,325 | 1.3%), Central America (1,220 | 1.2%), South Eastern Asia (1,052 | 1.0%), and Mexico (727 | 0.7%), together accounting for 6.1% of all Craven County residents.
| Immigration Origin | # Population | % Population |
| Africa | 154 | 0.2% |
| Argentina | 108 | 0.1% |
| Asia | 1,325 | 1.3% |
| Australia | 20 | 0.0% |
| Austria | 4 | 0.0% |
| Bosnia and Herzegovina | 36 | 0.0% |
| Brazil | 33 | 0.0% |
| Cambodia | 9 | 0.0% |
| Canada | 91 | 0.1% |
| Caribbean | 366 | 0.4% |
| Central America | 1,220 | 1.2% |
| Chile | 8 | 0.0% |
| Colombia | 36 | 0.0% |
| Costa Rica | 50 | 0.1% |
| Cuba | 264 | 0.3% |
| Dominican Republic | 51 | 0.1% |
| Eastern Asia | 147 | 0.2% |
| Eastern Europe | 131 | 0.1% |
| Ecuador | 37 | 0.0% |
| Egypt | 20 | 0.0% |
| El Salvador | 187 | 0.2% |
| England | 40 | 0.0% |
| Europe | 580 | 0.6% |
| France | 58 | 0.1% |
| Germany | 178 | 0.2% |
| Ghana | 15 | 0.0% |
| Guatemala | 154 | 0.2% |
| Haiti | 11 | 0.0% |
| Honduras | 66 | 0.1% |
| Ireland | 7 | 0.0% |
| Italy | 13 | 0.0% |
| Jamaica | 40 | 0.0% |
| Japan | 94 | 0.1% |
| Korea | 53 | 0.1% |
| Laos | 35 | 0.0% |
| Latin America | 1,882 | 1.9% |
| Lebanon | 3 | 0.0% |
| Liberia | 3 | 0.0% |
| Malaysia | 42 | 0.0% |
| Mexico | 727 | 0.7% |
| Middle Africa | 76 | 0.1% |
| Netherlands | 7 | 0.0% |
| Nicaragua | 36 | 0.0% |
| Northern Africa | 20 | 0.0% |
| Northern Europe | 174 | 0.2% |
| Norway | 7 | 0.0% |
| Oceania | 61 | 0.1% |
| Pakistan | 119 | 0.1% |
| Peru | 12 | 0.0% |
| Philippines | 309 | 0.3% |
| Poland | 9 | 0.0% |
| Portugal | 3 | 0.0% |
| Romania | 31 | 0.0% |
| Russia | 29 | 0.0% |
| Scotland | 41 | 0.0% |
| South Africa | 40 | 0.0% |
| South America | 296 | 0.3% |
| South Central Asia | 119 | 0.1% |
| South Eastern Asia | 1,052 | 1.0% |
| Southern Europe | 16 | 0.0% |
| Switzerland | 12 | 0.0% |
| Thailand | 147 | 0.2% |
| Ukraine | 26 | 0.0% |
| Vietnam | 60 | 0.1% |
| Western Africa | 18 | 0.0% |
| Western Asia | 7 | 0.0% |
| Western Europe | 259 | 0.3% |
| Yemen | 4 | 0.0% |
| Zaire | 76 | 0.1% | View All 69 Rows |
Sex and Age in Craven County
Sex and Age in Craven County
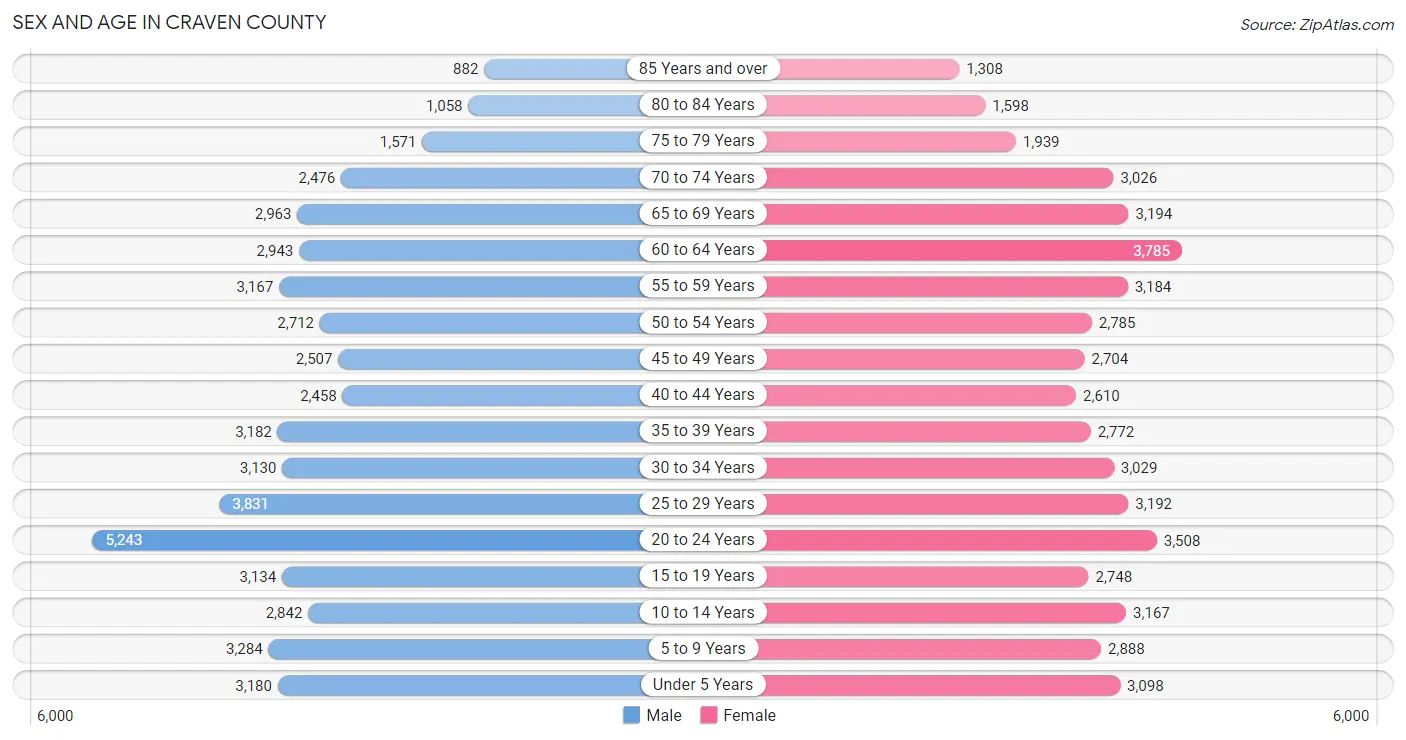
The most populous age groups in Craven County are 20 to 24 Years (5,243 | 10.4%) for men and 60 to 64 Years (3,785 | 7.5%) for women.
| Age Bracket | Male | Female |
| Under 5 Years | 3,180 (6.3%) | 3,098 (6.1%) |
| 5 to 9 Years | 3,284 (6.5%) | 2,888 (5.7%) |
| 10 to 14 Years | 2,842 (5.6%) | 3,167 (6.3%) |
| 15 to 19 Years | 3,134 (6.2%) | 2,748 (5.4%) |
| 20 to 24 Years | 5,243 (10.4%) | 3,508 (6.9%) |
| 25 to 29 Years | 3,831 (7.6%) | 3,192 (6.3%) |
| 30 to 34 Years | 3,130 (6.2%) | 3,029 (6.0%) |
| 35 to 39 Years | 3,182 (6.3%) | 2,772 (5.5%) |
| 40 to 44 Years | 2,458 (4.9%) | 2,610 (5.2%) |
| 45 to 49 Years | 2,507 (5.0%) | 2,704 (5.3%) |
| 50 to 54 Years | 2,712 (5.4%) | 2,785 (5.5%) |
| 55 to 59 Years | 3,167 (6.3%) | 3,184 (6.3%) |
| 60 to 64 Years | 2,943 (5.8%) | 3,785 (7.5%) |
| 65 to 69 Years | 2,963 (5.9%) | 3,194 (6.3%) |
| 70 to 74 Years | 2,476 (4.9%) | 3,026 (6.0%) |
| 75 to 79 Years | 1,571 (3.1%) | 1,939 (3.8%) |
| 80 to 84 Years | 1,058 (2.1%) | 1,598 (3.2%) |
| 85 Years and over | 882 (1.7%) | 1,308 (2.6%) |
| Total | 50,563 (100.0%) | 50,535 (100.0%) |
Families and Households in Craven County
Median Family Size in Craven County
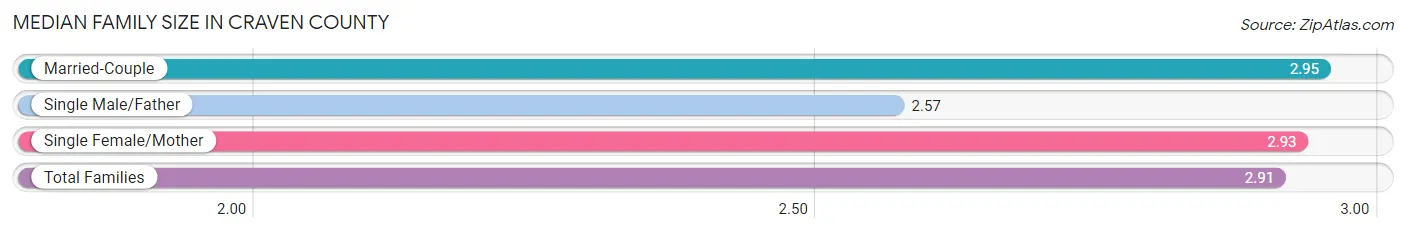
The median family size in Craven County is 2.91 persons per family, with married-couple families (20,477 | 76.3%) accounting for the largest median family size of 2.95 persons per family. On the other hand, single male/father families (2,284 | 8.5%) represent the smallest median family size with 2.57 persons per family.
| Family Type | # Families | Family Size |
| Married-Couple | 20,477 (76.3%) | 2.95 |
| Single Male/Father | 2,284 (8.5%) | 2.57 |
| Single Female/Mother | 4,076 (15.2%) | 2.93 |
| Total Families | 26,837 (100.0%) | 2.91 |
Median Household Size in Craven County
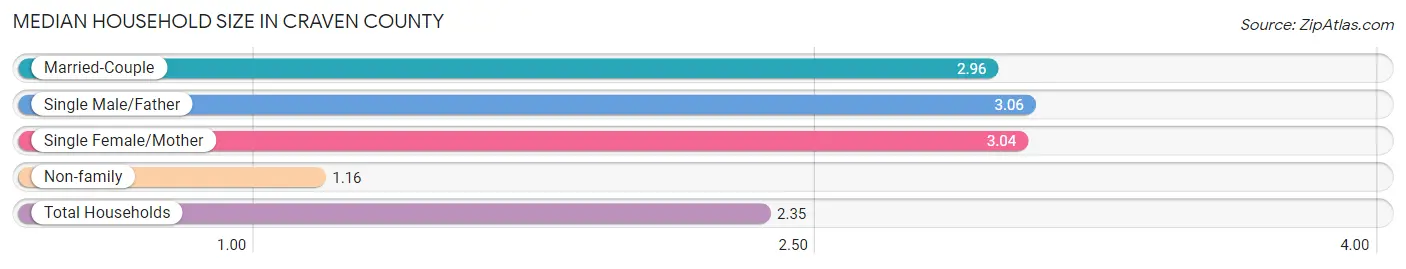
The median household size in Craven County is 2.35 persons per household, with single male/father households (2,284 | 5.6%) accounting for the largest median household size of 3.06 persons per household. non-family households (14,167 | 34.5%) represent the smallest median household size with 1.16 persons per household.
| Household Type | # Households | Household Size |
| Married-Couple | 20,477 (49.9%) | 2.96 |
| Single Male/Father | 2,284 (5.6%) | 3.06 |
| Single Female/Mother | 4,076 (9.9%) | 3.04 |
| Non-family | 14,167 (34.5%) | 1.16 |
| Total Households | 41,004 (100.0%) | 2.35 |
Household Size by Marriage Status in Craven County
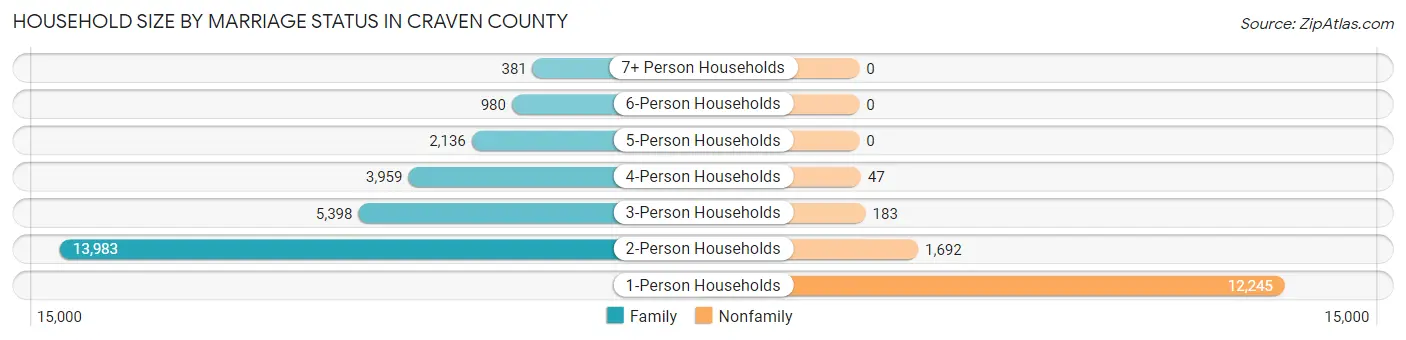
Out of a total of 41,004 households in Craven County, 26,837 (65.4%) are family households, while 14,167 (34.5%) are nonfamily households. The most numerous type of family households are 2-person households, comprising 13,983, and the most common type of nonfamily households are 1-person households, comprising 12,245.
| Household Size | Family Households | Nonfamily Households |
| 1-Person Households | - | 12,245 (29.9%) |
| 2-Person Households | 13,983 (34.1%) | 1,692 (4.1%) |
| 3-Person Households | 5,398 (13.2%) | 183 (0.4%) |
| 4-Person Households | 3,959 (9.7%) | 47 (0.1%) |
| 5-Person Households | 2,136 (5.2%) | 0 (0.0%) |
| 6-Person Households | 980 (2.4%) | 0 (0.0%) |
| 7+ Person Households | 381 (0.9%) | 0 (0.0%) |
| Total | 26,837 (65.4%) | 14,167 (34.5%) |
Female Fertility in Craven County
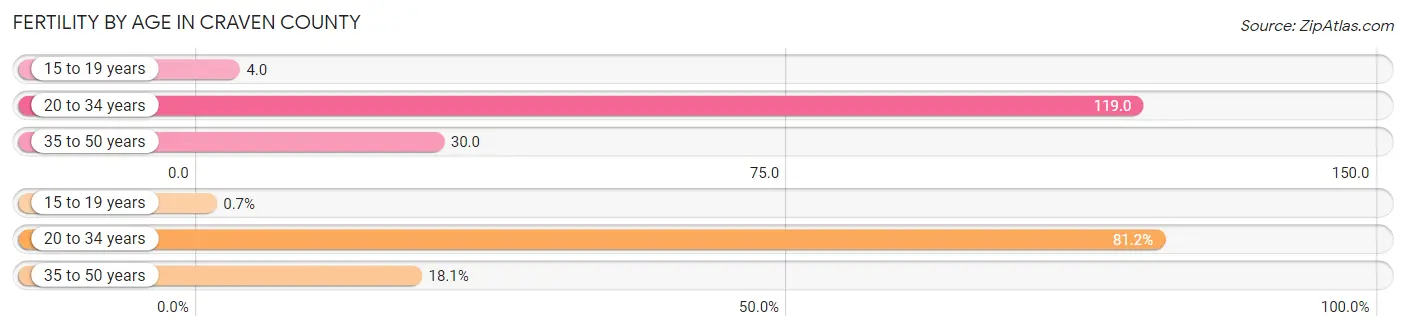
Fertility by Age in Craven County
Average fertility rate in Craven County is 67.0 births per 1,000 women. Women in the age bracket of 20 to 34 years have the highest fertility rate with 119.0 births per 1,000 women. Women in the age bracket of 20 to 34 years acount for 81.2% of all women with births.
| Age Bracket | Women with Births | Births / 1,000 Women |
| 15 to 19 years | 10 (0.7%) | 4.0 |
| 20 to 34 years | 1,156 (81.2%) | 119.0 |
| 35 to 50 years | 258 (18.1%) | 30.0 |
| Total | 1,424 (100.0%) | 67.0 |
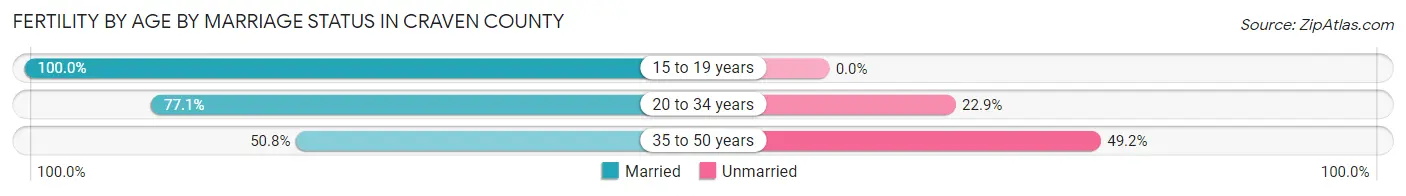
Fertility by Age by Marriage Status in Craven County
72.5% of women with births (1,424) in Craven County are married. The highest percentage of unmarried women with births falls into 35 to 50 years age bracket with 49.2% of them unmarried at the time of birth, while the lowest percentage of unmarried women with births belong to 15 to 19 years age bracket with 0.0% of them unmarried.
| Age Bracket | Married | Unmarried |
| 15 to 19 years | 10 (100.0%) | 0 (0.0%) |
| 20 to 34 years | 891 (77.1%) | 265 (22.9%) |
| 35 to 50 years | 131 (50.8%) | 127 (49.2%) |
| Total | 1,032 (72.5%) | 392 (27.5%) |
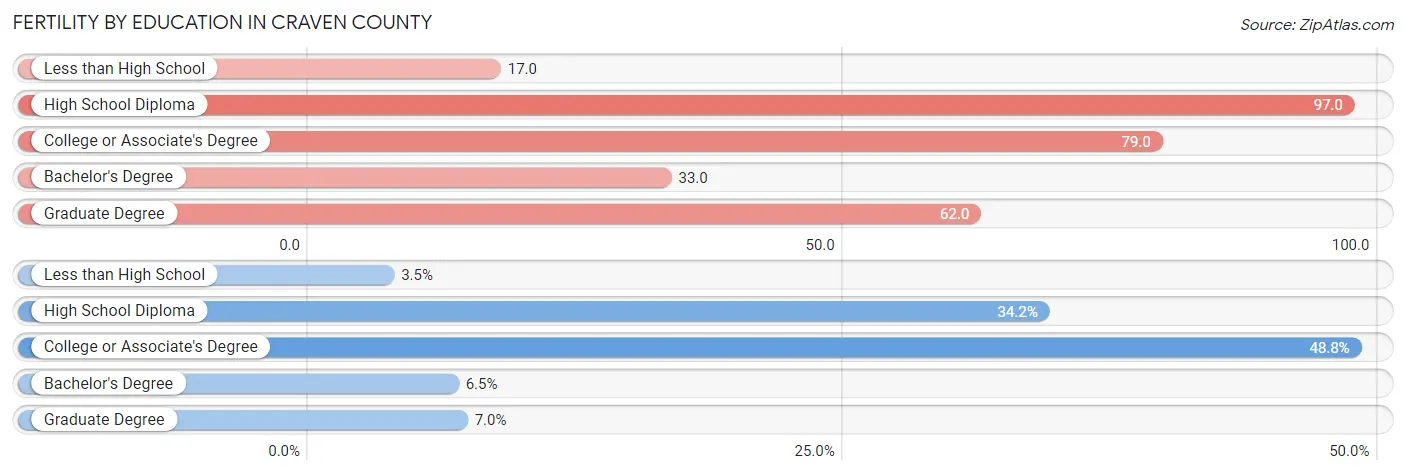
Fertility by Education in Craven County
Average fertility rate in Craven County is 67.0 births per 1,000 women. Women with the education attainment of high school diploma have the highest fertility rate of 97.0 births per 1,000 women, while women with the education attainment of less than high school have the lowest fertility at 17.0 births per 1,000 women. Women with the education attainment of college or associate's degree represent 48.8% of all women with births.
| Educational Attainment | Women with Births | Births / 1,000 Women |
| Less than High School | 50 (3.5%) | 17.0 |
| High School Diploma | 487 (34.2%) | 97.0 |
| College or Associate's Degree | 695 (48.8%) | 79.0 |
| Bachelor's Degree | 93 (6.5%) | 33.0 |
| Graduate Degree | 99 (7.0%) | 62.0 |
| Total | 1,424 (100.0%) | 67.0 |
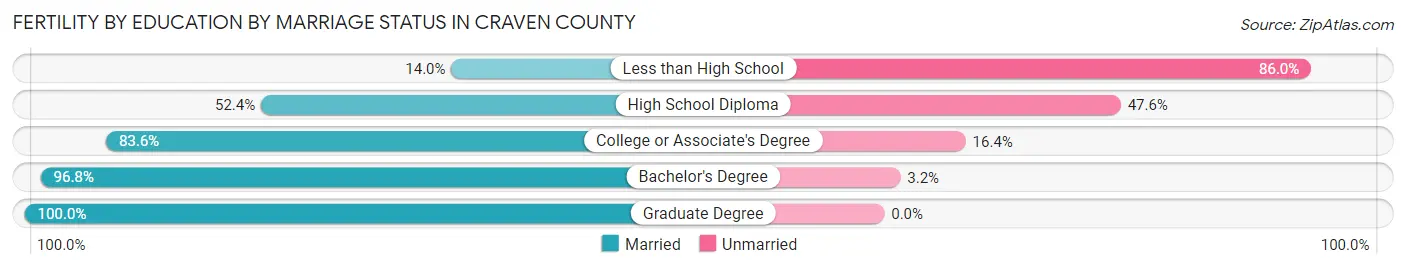
Fertility by Education by Marriage Status in Craven County
27.5% of women with births in Craven County are unmarried. Women with the educational attainment of graduate degree are most likely to be married with 100.0% of them married at childbirth, while women with the educational attainment of less than high school are least likely to be married with 86.0% of them unmarried at childbirth.
| Educational Attainment | Married | Unmarried |
| Less than High School | 7 (14.0%) | 43 (86.0%) |
| High School Diploma | 255 (52.4%) | 232 (47.6%) |
| College or Associate's Degree | 581 (83.6%) | 114 (16.4%) |
| Bachelor's Degree | 90 (96.8%) | 3 (3.2%) |
| Graduate Degree | 99 (100.0%) | 0 (0.0%) |
| Total | 1,032 (72.5%) | 392 (27.5%) |
Income in Craven County
Income Overview in Craven County
Per Capita Income in Craven County is $33,963, while median incomes of families and households are $77,888 and $61,676 respectively.
| Characteristic | Number | Measure |
| Per Capita Income | 101,098 | $33,963 |
| Median Family Income | 26,837 | $77,888 |
| Mean Family Income | 26,837 | $97,179 |
| Median Household Income | 41,004 | $61,676 |
| Mean Household Income | 41,004 | $80,975 |
| Income Deficit | 26,837 | $10,559 |
| Wage / Income Gap (%) | 101,098 | 26.41% |
| Wage / Income Gap ($) | 101,098 | 73.59¢ per $1 |
| Gini / Inequality Index | 101,098 | 0.46 |
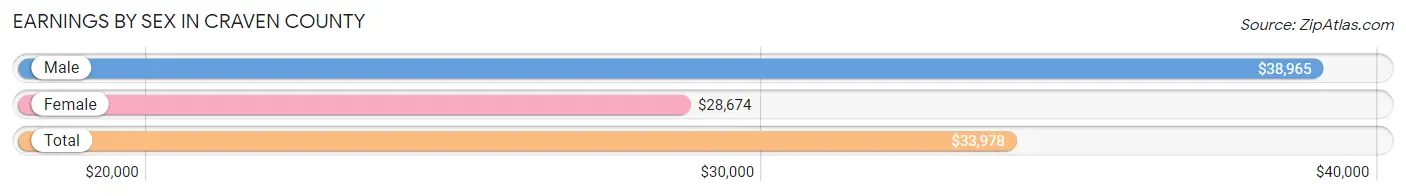
Earnings by Sex in Craven County
Average Earnings in Craven County are $33,978, $38,965 for men and $28,674 for women, a difference of 26.4%.
| Sex | Number | Average Earnings |
| Male | 27,221 (55.0%) | $38,965 |
| Female | 22,290 (45.0%) | $28,674 |
| Total | 49,511 (100.0%) | $33,978 |
Earnings by Sex by Income Bracket in Craven County
The most common earnings brackets in Craven County are $100,000+ for men (2,940 | 10.8%) and $25,000 to $29,999 for women (1,966 | 8.8%).

| Income | Male | Female |
| $2,499 or less | 837 (3.1%) | 1,457 (6.5%) |
| $2,500 to $4,999 | 746 (2.7%) | 1,028 (4.6%) |
| $5,000 to $7,499 | 759 (2.8%) | 1,112 (5.0%) |
| $7,500 to $9,999 | 597 (2.2%) | 894 (4.0%) |
| $10,000 to $12,499 | 891 (3.3%) | 1,157 (5.2%) |
| $12,500 to $14,999 | 617 (2.3%) | 787 (3.5%) |
| $15,000 to $17,499 | 571 (2.1%) | 1,224 (5.5%) |
| $17,500 to $19,999 | 538 (2.0%) | 469 (2.1%) |
| $20,000 to $22,499 | 624 (2.3%) | 717 (3.2%) |
| $22,500 to $24,999 | 969 (3.6%) | 829 (3.7%) |
| $25,000 to $29,999 | 2,899 (10.6%) | 1,966 (8.8%) |
| $30,000 to $34,999 | 2,252 (8.3%) | 1,848 (8.3%) |
| $35,000 to $39,999 | 1,515 (5.6%) | 1,391 (6.2%) |
| $40,000 to $44,999 | 1,437 (5.3%) | 1,107 (5.0%) |
| $45,000 to $49,999 | 1,379 (5.1%) | 1,013 (4.5%) |
| $50,000 to $54,999 | 939 (3.5%) | 671 (3.0%) |
| $55,000 to $64,999 | 2,122 (7.8%) | 1,403 (6.3%) |
| $65,000 to $74,999 | 1,708 (6.3%) | 955 (4.3%) |
| $75,000 to $99,999 | 2,881 (10.6%) | 1,219 (5.5%) |
| $100,000+ | 2,940 (10.8%) | 1,043 (4.7%) |
| Total | 27,221 (100.0%) | 22,290 (100.0%) |
Earnings by Sex by Educational Attainment in Craven County
Average earnings in Craven County are $47,391 for men and $33,450 for women, a difference of 29.4%. Men with an educational attainment of graduate degree enjoy the highest average annual earnings of $91,624, while those with less than high school education earn the least with $32,689. Women with an educational attainment of graduate degree earn the most with the average annual earnings of $56,362, while those with less than high school education have the smallest earnings of $21,875.

| Educational Attainment | Male Income | Female Income |
| Less than High School | $32,689 | $21,875 |
| High School Diploma | $37,299 | $22,595 |
| College or Associate's Degree | $46,773 | $33,514 |
| Bachelor's Degree | $71,047 | $46,453 |
| Graduate Degree | $91,624 | $56,362 |
| Total | $47,391 | $33,450 |
Family Income in Craven County
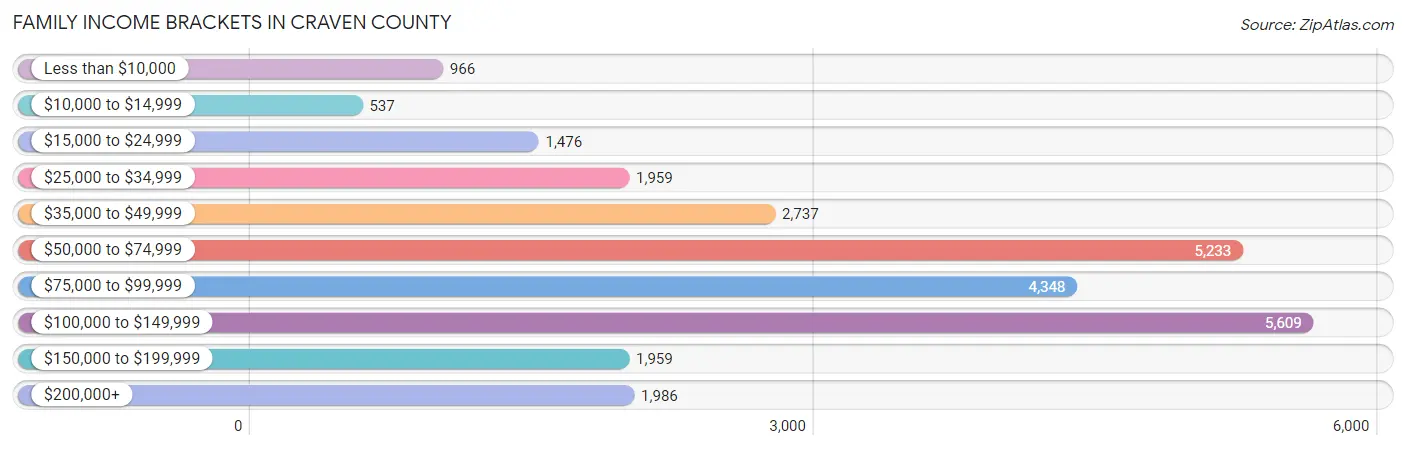
Family Income Brackets in Craven County
According to the Craven County family income data, there are 5,609 families falling into the $100,000 to $149,999 income range, which is the most common income bracket and makes up 20.9% of all families. Conversely, the $10,000 to $14,999 income bracket is the least frequent group with only 537 families (2.0%) belonging to this category.
| Income Bracket | # Families | % Families |
| Less than $10,000 | 966 | 3.6% |
| $10,000 to $14,999 | 537 | 2.0% |
| $15,000 to $24,999 | 1,476 | 5.5% |
| $25,000 to $34,999 | 1,959 | 7.3% |
| $35,000 to $49,999 | 2,737 | 10.2% |
| $50,000 to $74,999 | 5,233 | 19.5% |
| $75,000 to $99,999 | 4,348 | 16.2% |
| $100,000 to $149,999 | 5,609 | 20.9% |
| $150,000 to $199,999 | 1,959 | 7.3% |
| $200,000+ | 1,986 | 7.4% |
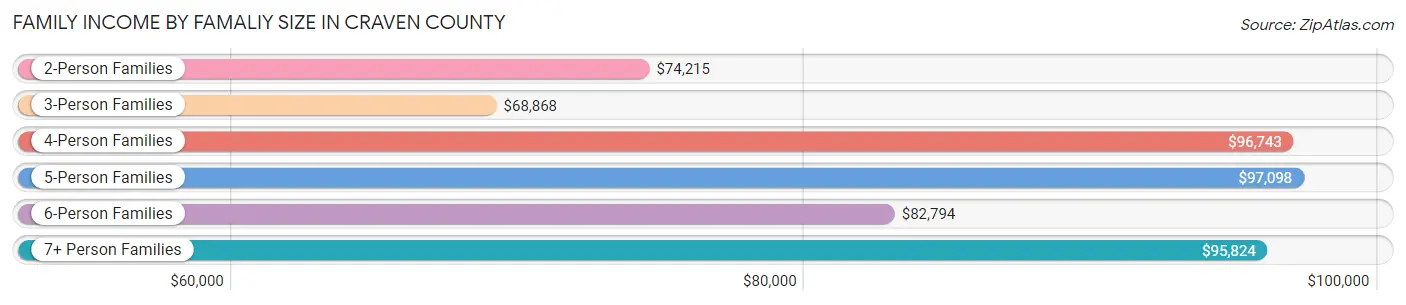
Family Income by Famaliy Size in Craven County
5-person families (2,020 | 7.5%) account for the highest median family income in Craven County with $97,098 per family, while 2-person families (14,803 | 55.2%) have the highest median income of $37,108 per family member.
| Income Bracket | # Families | Median Income |
| 2-Person Families | 14,803 (55.2%) | $74,215 |
| 3-Person Families | 5,127 (19.1%) | $68,868 |
| 4-Person Families | 3,702 (13.8%) | $96,743 |
| 5-Person Families | 2,020 (7.5%) | $97,098 |
| 6-Person Families | 834 (3.1%) | $82,794 |
| 7+ Person Families | 351 (1.3%) | $95,824 |
| Total | 26,837 (100.0%) | $77,888 |
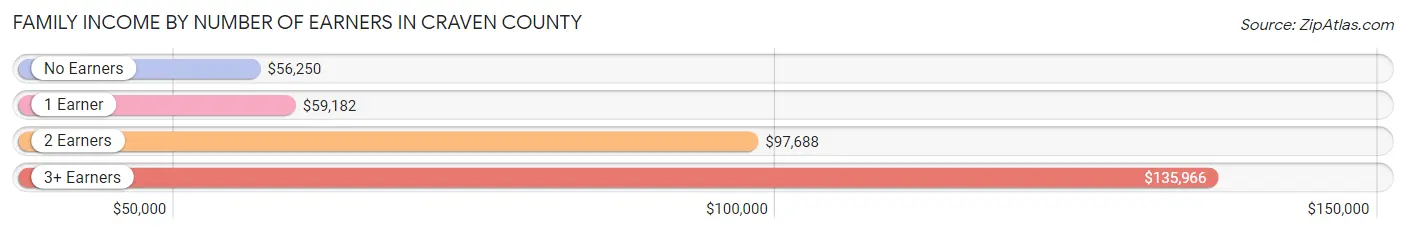
Family Income by Number of Earners in Craven County
The median family income in Craven County is $77,888, with families comprising 3+ earners (2,195) having the highest median family income of $135,966, while families with no earners (6,098) have the lowest median family income of $56,250, accounting for 8.2% and 22.7% of families, respectively.
| Number of Earners | # Families | Median Income |
| No Earners | 6,098 (22.7%) | $56,250 |
| 1 Earner | 8,522 (31.8%) | $59,182 |
| 2 Earners | 10,022 (37.3%) | $97,688 |
| 3+ Earners | 2,195 (8.2%) | $135,966 |
| Total | 26,837 (100.0%) | $77,888 |
Household Income in Craven County
Household Income Brackets in Craven County
With 7,422 households falling in the category, the $50,000 to $74,999 income range is the most frequent in Craven County, accounting for 18.1% of all households. In contrast, only 1,927 households (4.7%) fall into the $10,000 to $14,999 income bracket, making it the least populous group.
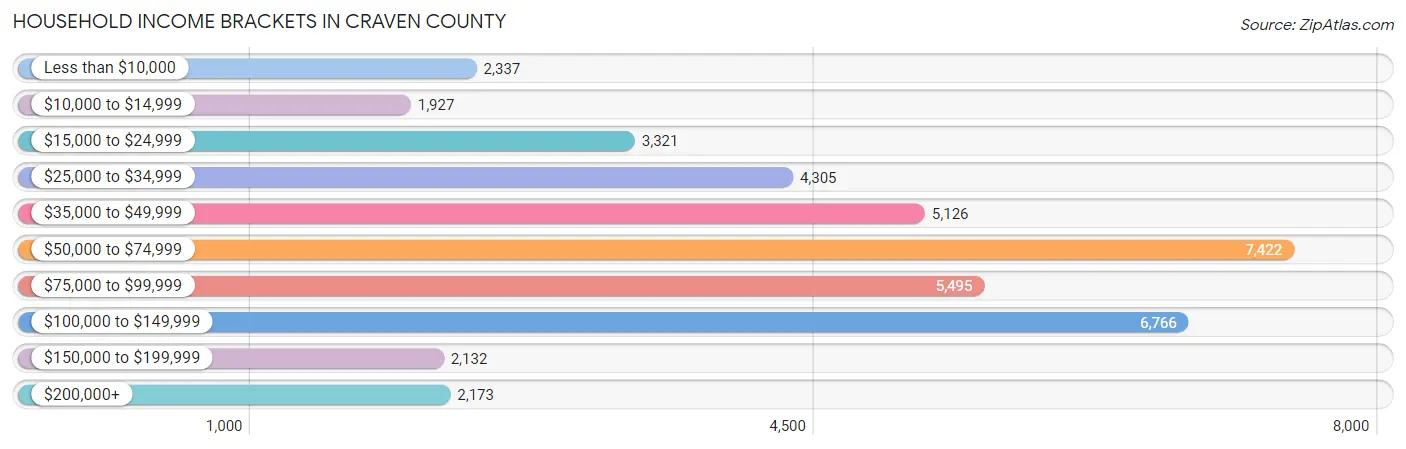
| Income Bracket | # Households | % Households |
| Less than $10,000 | 2,337 | 5.7% |
| $10,000 to $14,999 | 1,927 | 4.7% |
| $15,000 to $24,999 | 3,321 | 8.1% |
| $25,000 to $34,999 | 4,305 | 10.5% |
| $35,000 to $49,999 | 5,126 | 12.5% |
| $50,000 to $74,999 | 7,422 | 18.1% |
| $75,000 to $99,999 | 5,495 | 13.4% |
| $100,000 to $149,999 | 6,766 | 16.5% |
| $150,000 to $199,999 | 2,132 | 5.2% |
| $200,000+ | 2,173 | 5.3% |
Household Income by Householder Age in Craven County
The median household income in Craven County is $61,676, with the highest median household income of $69,823 found in the 45 to 64 years age bracket for the primary householder. A total of 13,776 households (33.6%) fall into this category. Meanwhile, the 15 to 24 years age bracket for the primary householder has the lowest median household income of $45,611, with 2,321 households (5.7%) in this group.
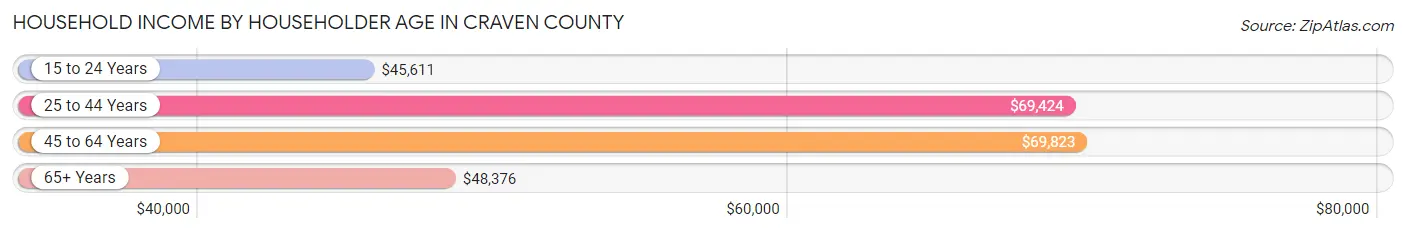
| Income Bracket | # Households | Median Income |
| 15 to 24 Years | 2,321 (5.7%) | $45,611 |
| 25 to 44 Years | 11,761 (28.7%) | $69,424 |
| 45 to 64 Years | 13,776 (33.6%) | $69,823 |
| 65+ Years | 13,146 (32.1%) | $48,376 |
| Total | 41,004 (100.0%) | $61,676 |
Poverty in Craven County
Income Below Poverty by Sex and Age in Craven County
With 12.8% poverty level for males and 15.2% for females among the residents of Craven County, 5 year old males and 15 year old females are the most vulnerable to poverty, with 159 males (30.3%) and 198 females (31.0%) in their respective age groups living below the poverty level.
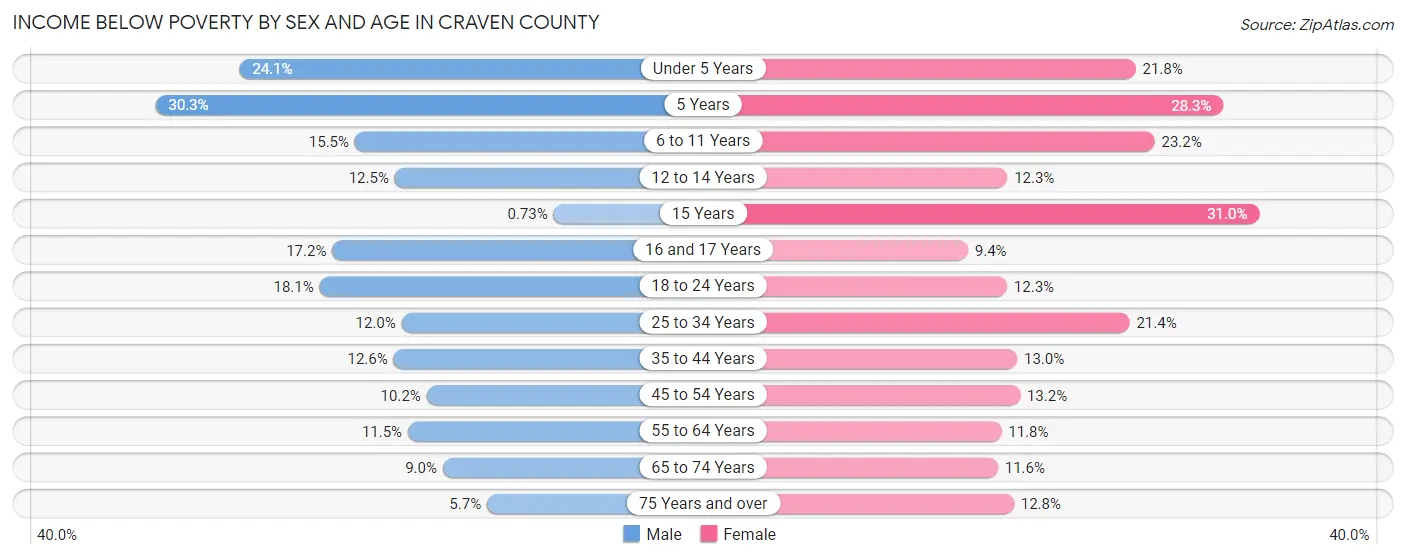
| Age Bracket | Male | Female |
| Under 5 Years | 758 (24.1%) | 673 (21.8%) |
| 5 Years | 159 (30.3%) | 147 (28.3%) |
| 6 to 11 Years | 600 (15.5%) | 857 (23.2%) |
| 12 to 14 Years | 183 (12.5%) | 198 (12.3%) |
| 15 Years | 5 (0.7%) | 198 (31.0%) |
| 16 and 17 Years | 173 (17.2%) | 106 (9.4%) |
| 18 to 24 Years | 705 (18.1%) | 530 (12.3%) |
| 25 to 34 Years | 776 (12.0%) | 1,324 (21.4%) |
| 35 to 44 Years | 678 (12.6%) | 698 (13.0%) |
| 45 to 54 Years | 517 (10.2%) | 725 (13.2%) |
| 55 to 64 Years | 698 (11.5%) | 824 (11.8%) |
| 65 to 74 Years | 483 (8.9%) | 713 (11.6%) |
| 75 Years and over | 195 (5.7%) | 584 (12.8%) |
| Total | 5,930 (12.8%) | 7,577 (15.2%) |
Income Above Poverty by Sex and Age in Craven County
According to the poverty statistics in Craven County, males aged 15 years and females aged 16 and 17 years are the age groups that are most secure financially, with 99.3% of males and 90.6% of females in these age groups living above the poverty line.
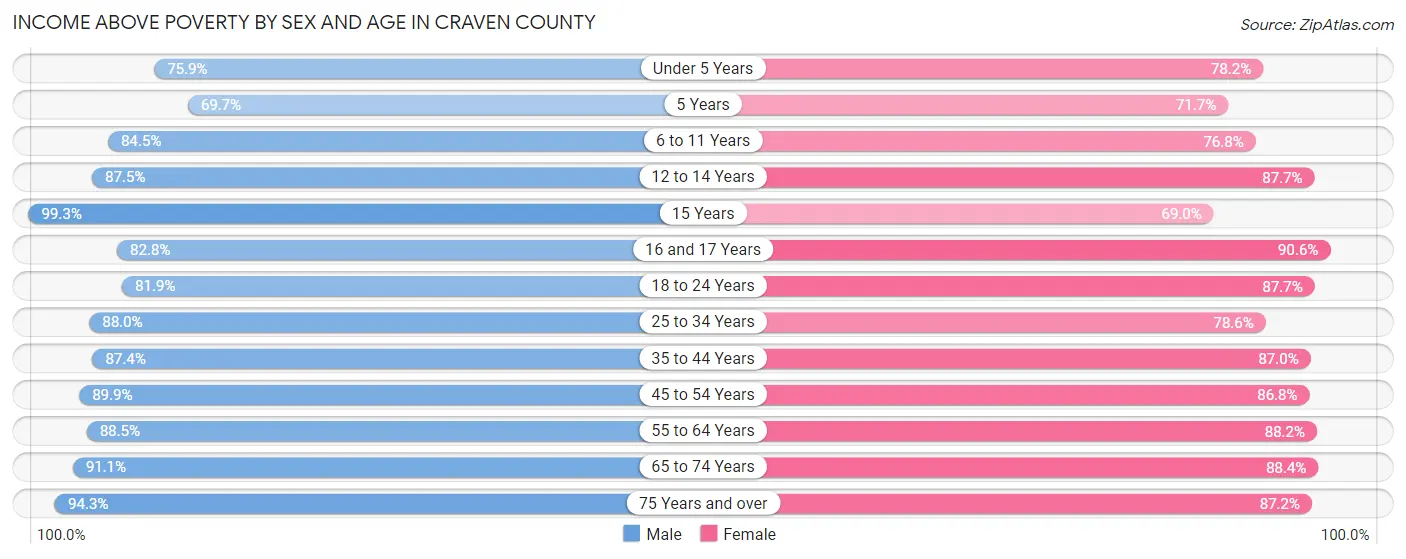
| Age Bracket | Male | Female |
| Under 5 Years | 2,393 (75.9%) | 2,413 (78.2%) |
| 5 Years | 366 (69.7%) | 372 (71.7%) |
| 6 to 11 Years | 3,275 (84.5%) | 2,834 (76.8%) |
| 12 to 14 Years | 1,279 (87.5%) | 1,414 (87.7%) |
| 15 Years | 683 (99.3%) | 441 (69.0%) |
| 16 and 17 Years | 835 (82.8%) | 1,027 (90.6%) |
| 18 to 24 Years | 3,190 (81.9%) | 3,793 (87.7%) |
| 25 to 34 Years | 5,687 (88.0%) | 4,875 (78.6%) |
| 35 to 44 Years | 4,700 (87.4%) | 4,668 (87.0%) |
| 45 to 54 Years | 4,579 (89.8%) | 4,753 (86.8%) |
| 55 to 64 Years | 5,352 (88.5%) | 6,136 (88.2%) |
| 65 to 74 Years | 4,914 (91.0%) | 5,445 (88.4%) |
| 75 Years and over | 3,243 (94.3%) | 3,991 (87.2%) |
| Total | 40,496 (87.2%) | 42,162 (84.8%) |
Income Below Poverty Among Married-Couple Families in Craven County
The poverty statistics for married-couple families in Craven County show that 5.6% or 1,141 of the total 20,477 families live below the poverty line. Families with 3 or 4 children have the highest poverty rate of 17.2%, comprising of 299 families. On the other hand, families with 1 or 2 children have the lowest poverty rate of 4.2%, which includes 223 families.
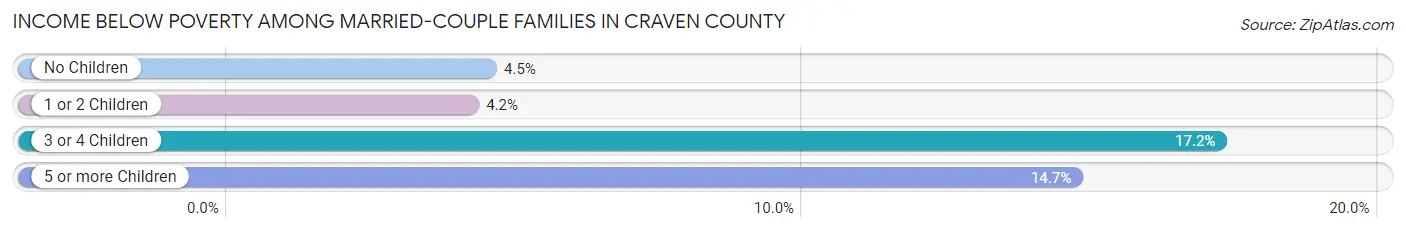
| Children | Above Poverty | Below Poverty |
| No Children | 12,694 (95.5%) | 599 (4.5%) |
| 1 or 2 Children | 5,089 (95.8%) | 223 (4.2%) |
| 3 or 4 Children | 1,437 (82.8%) | 299 (17.2%) |
| 5 or more Children | 116 (85.3%) | 20 (14.7%) |
| Total | 19,336 (94.4%) | 1,141 (5.6%) |
Income Below Poverty Among Single-Parent Households in Craven County
According to the poverty data in Craven County, 23.2% or 529 single-father households and 28.2% or 1,148 single-mother households are living below the poverty line. Among single-father households, those with 1 or 2 children have the highest poverty rate, with 453 households (36.4%) experiencing poverty. Likewise, among single-mother households, those with 5 or more children have the highest poverty rate, with 16 households (100.0%) falling below the poverty line.
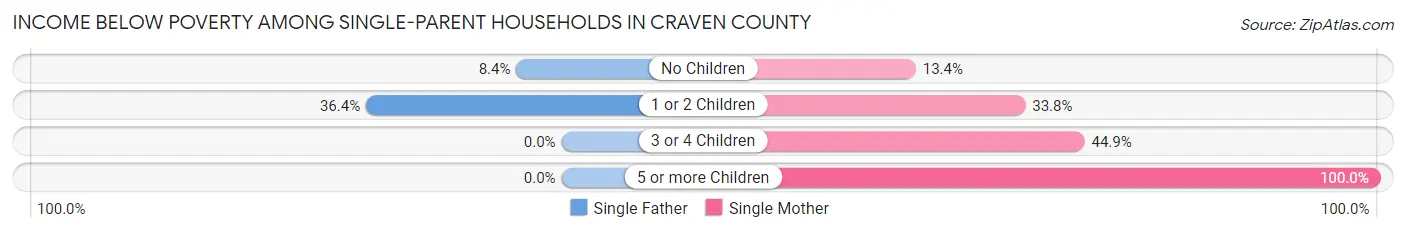
| Children | Single Father | Single Mother |
| No Children | 76 (8.4%) | 203 (13.4%) |
| 1 or 2 Children | 453 (36.4%) | 658 (33.8%) |
| 3 or 4 Children | 0 (0.0%) | 271 (44.9%) |
| 5 or more Children | 0 (0.0%) | 16 (100.0%) |
| Total | 529 (23.2%) | 1,148 (28.2%) |
Income Below Poverty Among Married-Couple vs Single-Parent Households in Craven County
The poverty data for Craven County shows that 1,141 of the married-couple family households (5.6%) and 1,677 of the single-parent households (26.4%) are living below the poverty level. Within the married-couple family households, those with 3 or 4 children have the highest poverty rate, with 299 households (17.2%) falling below the poverty line. Among the single-parent households, those with 5 or more children have the highest poverty rate, with 16 household (100.0%) living below poverty.
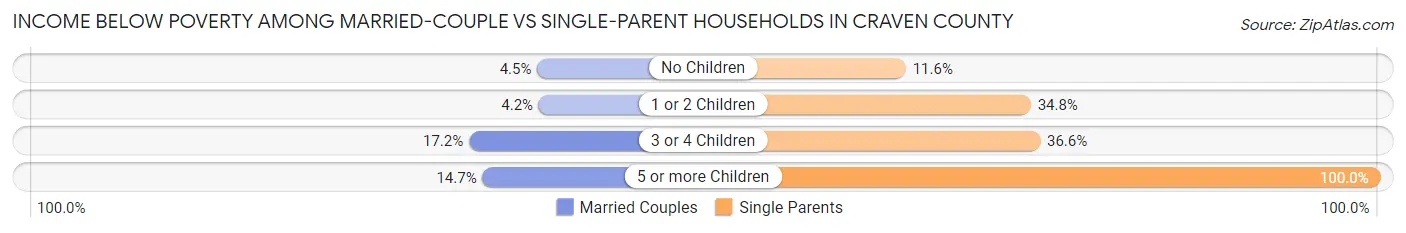
| Children | Married-Couple Families | Single-Parent Households |
| No Children | 599 (4.5%) | 279 (11.6%) |
| 1 or 2 Children | 223 (4.2%) | 1,111 (34.8%) |
| 3 or 4 Children | 299 (17.2%) | 271 (36.6%) |
| 5 or more Children | 20 (14.7%) | 16 (100.0%) |
| Total | 1,141 (5.6%) | 1,677 (26.4%) |
Employment Characteristics in Craven County
Employment by Class of Employer in Craven County
Among the 44,932 employed individuals in Craven County, private company employees (25,515 | 56.8%), federal government employees (8,327 | 18.5%), and local government employees (3,231 | 7.2%) make up the most common classes of employment.
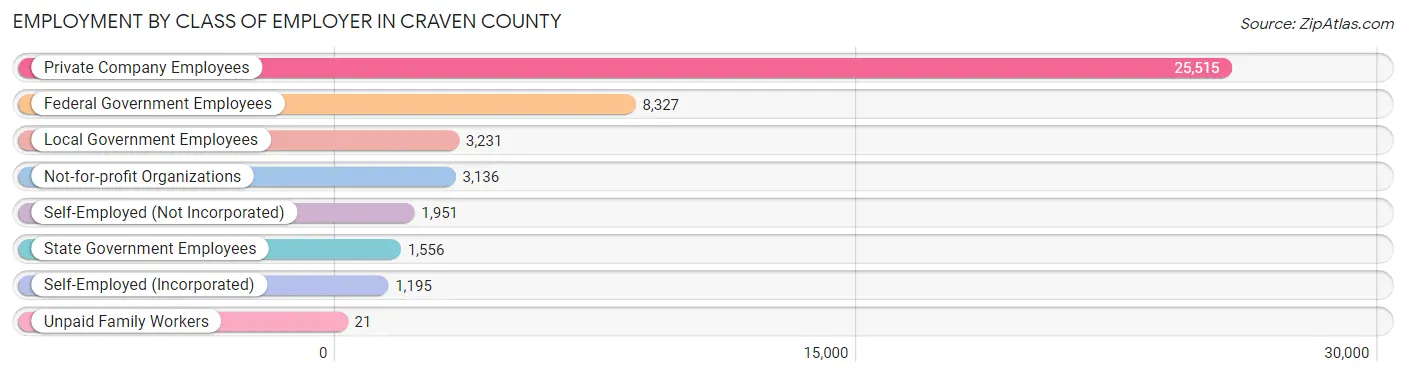
| Employer Class | # Employees | % Employees |
| Private Company Employees | 25,515 | 56.8% |
| Self-Employed (Incorporated) | 1,195 | 2.7% |
| Self-Employed (Not Incorporated) | 1,951 | 4.3% |
| Not-for-profit Organizations | 3,136 | 7.0% |
| Local Government Employees | 3,231 | 7.2% |
| State Government Employees | 1,556 | 3.5% |
| Federal Government Employees | 8,327 | 18.5% |
| Unpaid Family Workers | 21 | 0.1% |
| Total | 44,932 | 100.0% |
Employment Status by Age in Craven County
According to the labor force statistics for Craven County, out of the total population over 16 years of age (81,310), 58.5% or 47,566 individuals are in the labor force, with 5.1% or 2,426 of them unemployed. The age group with the highest labor force participation rate is 20 to 24 years, with 84.9% or 7,430 individuals in the labor force. Within the labor force, the 16 to 19 years age range has the highest percentage of unemployed individuals, with 14.9% or 383 of them being unemployed.
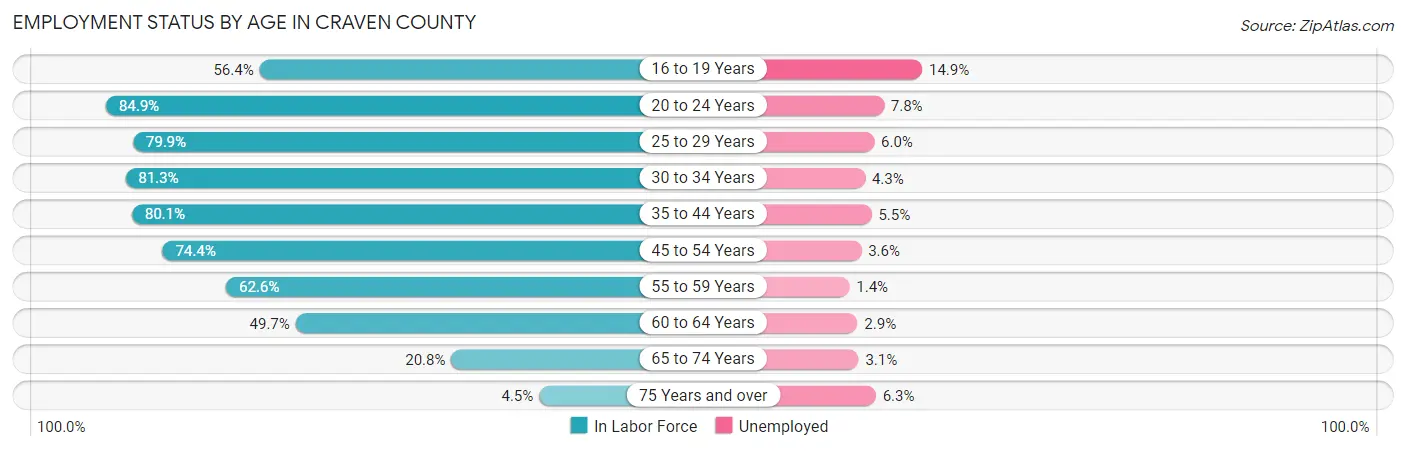
| Age Bracket | In Labor Force | Unemployed |
| 16 to 19 Years | 2,568 (56.4%) | 383 (14.9%) |
| 20 to 24 Years | 7,430 (84.9%) | 580 (7.8%) |
| 25 to 29 Years | 5,611 (79.9%) | 337 (6.0%) |
| 30 to 34 Years | 5,007 (81.3%) | 215 (4.3%) |
| 35 to 44 Years | 8,829 (80.1%) | 486 (5.5%) |
| 45 to 54 Years | 7,967 (74.4%) | 287 (3.6%) |
| 55 to 59 Years | 3,976 (62.6%) | 56 (1.4%) |
| 60 to 64 Years | 3,344 (49.7%) | 97 (2.9%) |
| 65 to 74 Years | 2,425 (20.8%) | 75 (3.1%) |
| 75 Years and over | 376 (4.5%) | 24 (6.3%) |
| Total | 47,566 (58.5%) | 2,426 (5.1%) |
Employment Status by Educational Attainment in Craven County
According to labor force statistics for Craven County, 72.4% of individuals (34,745) out of the total population between 25 and 64 years of age (47,991) are in the labor force, with 4.2% or 1,459 of them being unemployed. The group with the highest labor force participation rate are those with the educational attainment of bachelor's degree or higher, with 81.6% or 9,555 individuals in the labor force. Within the labor force, individuals with less than high school education have the highest percentage of unemployment, with 8.9% or 200 of them being unemployed.
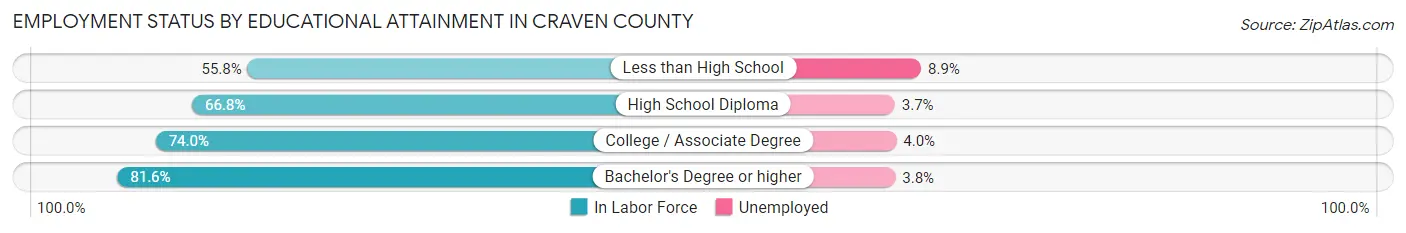
| Educational Attainment | In Labor Force | Unemployed |
| Less than High School | 2,248 (55.8%) | 358 (8.9%) |
| High School Diploma | 8,680 (66.8%) | 481 (3.7%) |
| College / Associate Degree | 14,252 (74.0%) | 770 (4.0%) |
| Bachelor's Degree or higher | 9,555 (81.6%) | 445 (3.8%) |
| Total | 34,745 (72.4%) | 2,016 (4.2%) |
Employment Occupations by Sex in Craven County
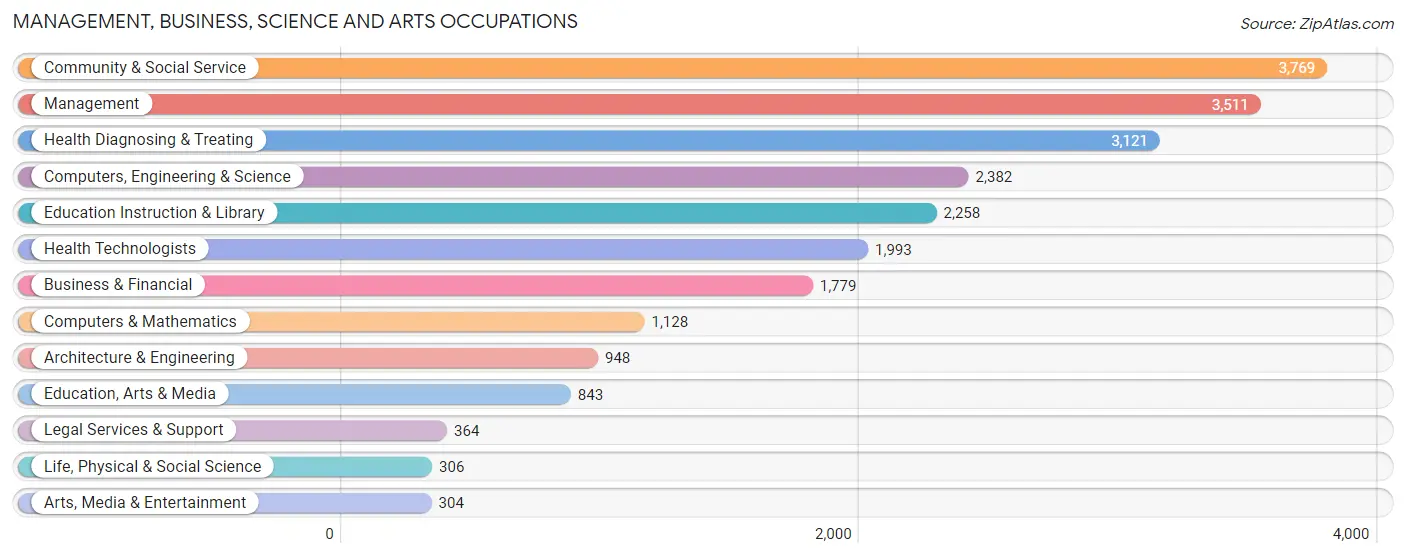
Management, Business, Science and Arts Occupations
The most common Management, Business, Science and Arts occupations in Craven County are Community & Social Service (3,769 | 9.4%), Management (3,511 | 8.7%), Health Diagnosing & Treating (3,121 | 7.8%), Computers, Engineering & Science (2,382 | 5.9%), and Education Instruction & Library (2,258 | 5.6%).
Management, Business, Science and Arts Occupations by Sex
Within the Management, Business, Science and Arts occupations in Craven County, the most male-oriented occupations are Architecture & Engineering (83.7%), Computers & Mathematics (79.3%), and Computers, Engineering & Science (75.2%), while the most female-oriented occupations are Education Instruction & Library (83.0%), Health Diagnosing & Treating (75.6%), and Arts, Media & Entertainment (75.0%).
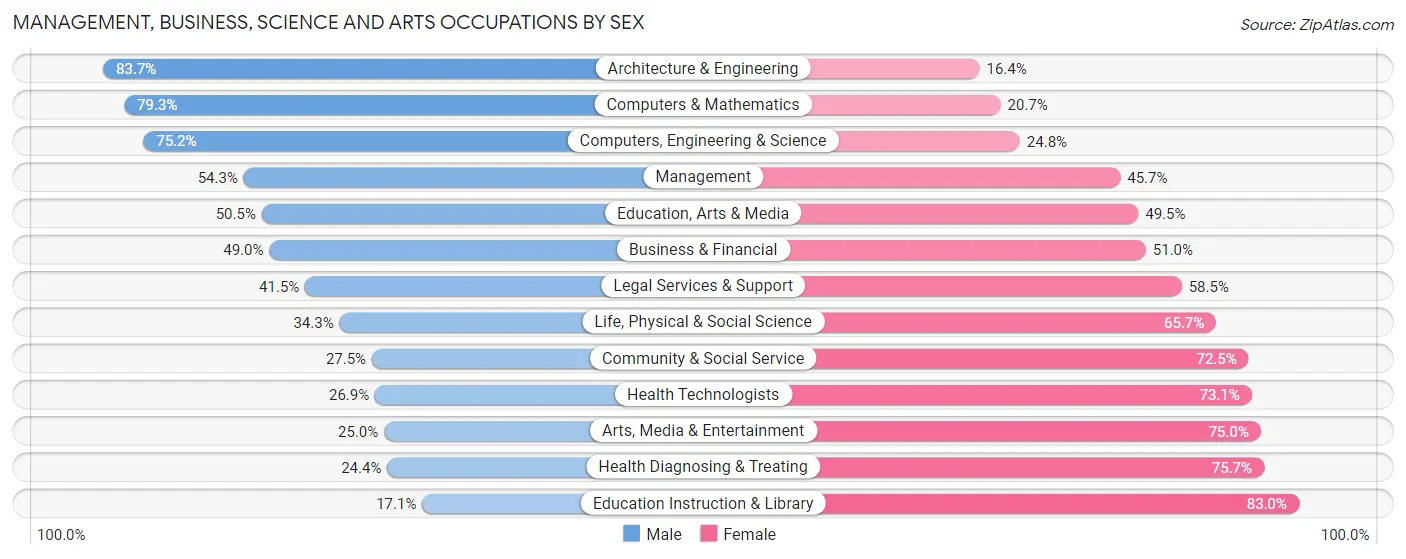
| Occupation | Male | Female |
| Management | 1,906 (54.3%) | 1,605 (45.7%) |
| Business & Financial | 871 (49.0%) | 908 (51.0%) |
| Computers, Engineering & Science | 1,792 (75.2%) | 590 (24.8%) |
| Computers & Mathematics | 894 (79.3%) | 234 (20.7%) |
| Architecture & Engineering | 793 (83.7%) | 155 (16.4%) |
| Life, Physical & Social Science | 105 (34.3%) | 201 (65.7%) |
| Community & Social Service | 1,038 (27.5%) | 2,731 (72.5%) |
| Education, Arts & Media | 426 (50.5%) | 417 (49.5%) |
| Legal Services & Support | 151 (41.5%) | 213 (58.5%) |
| Education Instruction & Library | 385 (17.1%) | 1,873 (83.0%) |
| Arts, Media & Entertainment | 76 (25.0%) | 228 (75.0%) |
| Health Diagnosing & Treating | 760 (24.3%) | 2,361 (75.6%) |
| Health Technologists | 536 (26.9%) | 1,457 (73.1%) |
| Total (Category) | 6,367 (43.7%) | 8,195 (56.3%) |
| Total (Overall) | 20,216 (50.3%) | 19,942 (49.7%) |
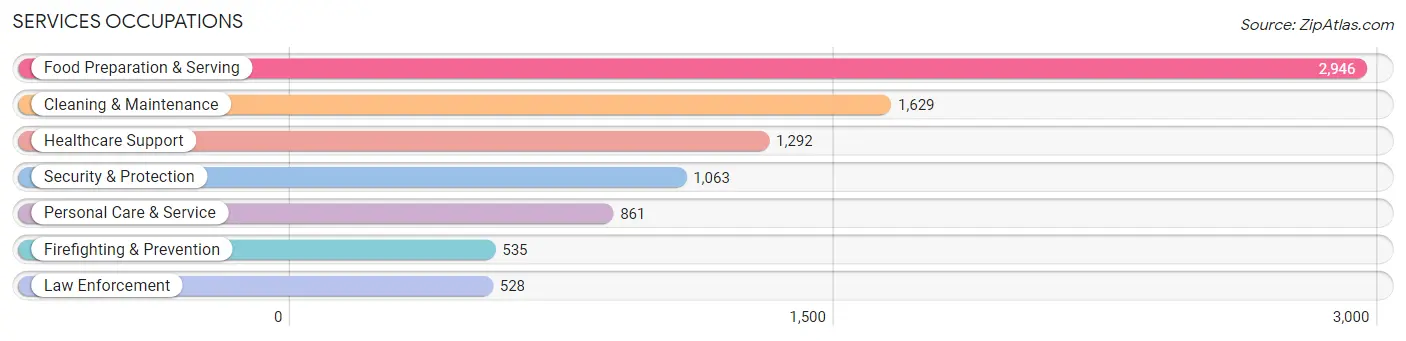
Services Occupations
The most common Services occupations in Craven County are Food Preparation & Serving (2,946 | 7.3%), Cleaning & Maintenance (1,629 | 4.1%), Healthcare Support (1,292 | 3.2%), Security & Protection (1,063 | 2.6%), and Personal Care & Service (861 | 2.1%).
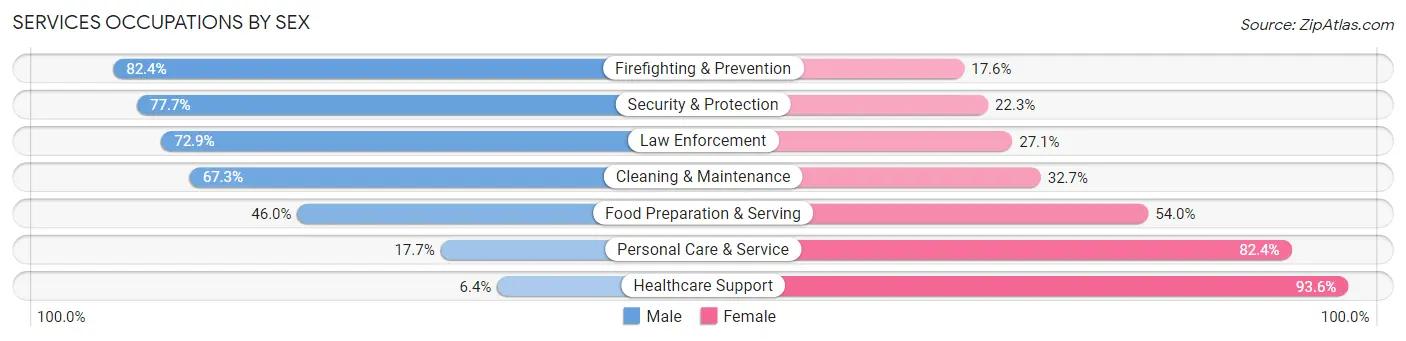
Services Occupations by Sex
Within the Services occupations in Craven County, the most male-oriented occupations are Firefighting & Prevention (82.4%), Security & Protection (77.7%), and Law Enforcement (72.9%), while the most female-oriented occupations are Healthcare Support (93.6%), Personal Care & Service (82.4%), and Food Preparation & Serving (54.0%).
| Occupation | Male | Female |
| Healthcare Support | 83 (6.4%) | 1,209 (93.6%) |
| Security & Protection | 826 (77.7%) | 237 (22.3%) |
| Firefighting & Prevention | 441 (82.4%) | 94 (17.6%) |
| Law Enforcement | 385 (72.9%) | 143 (27.1%) |
| Food Preparation & Serving | 1,355 (46.0%) | 1,591 (54.0%) |
| Cleaning & Maintenance | 1,096 (67.3%) | 533 (32.7%) |
| Personal Care & Service | 152 (17.6%) | 709 (82.4%) |
| Total (Category) | 3,512 (45.1%) | 4,279 (54.9%) |
| Total (Overall) | 20,216 (50.3%) | 19,942 (49.7%) |
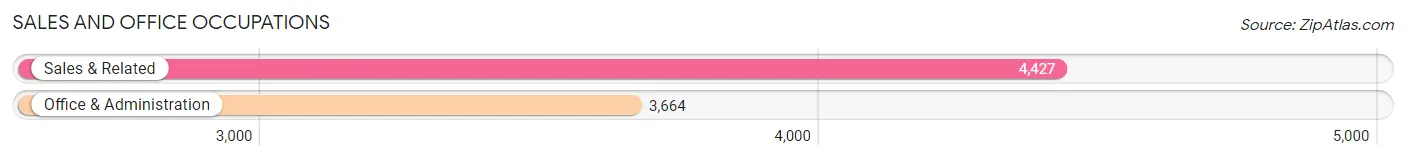
Sales and Office Occupations
The most common Sales and Office occupations in Craven County are Sales & Related (4,427 | 11.0%), and Office & Administration (3,664 | 9.1%).
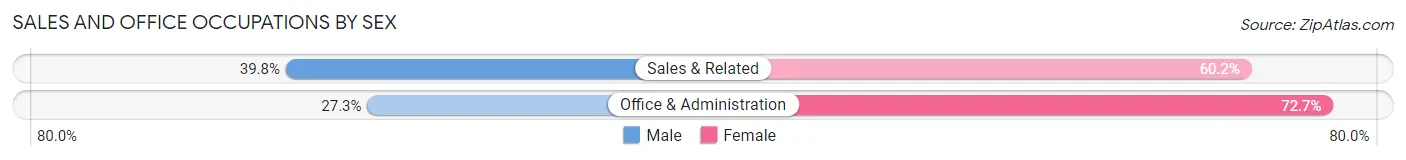
Sales and Office Occupations by Sex
| Occupation | Male | Female |
| Sales & Related | 1,763 (39.8%) | 2,664 (60.2%) |
| Office & Administration | 999 (27.3%) | 2,665 (72.7%) |
| Total (Category) | 2,762 (34.1%) | 5,329 (65.9%) |
| Total (Overall) | 20,216 (50.3%) | 19,942 (49.7%) |
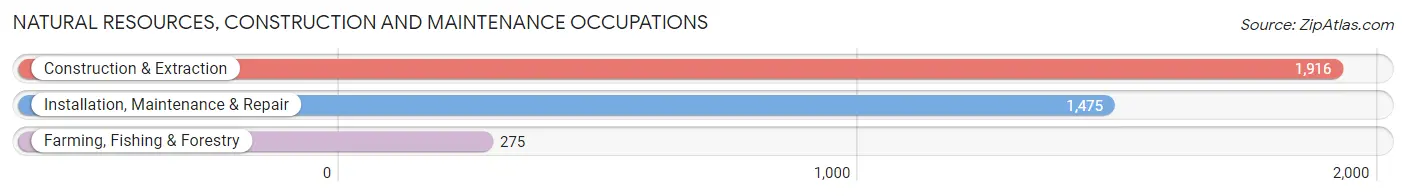
Natural Resources, Construction and Maintenance Occupations
The most common Natural Resources, Construction and Maintenance occupations in Craven County are Construction & Extraction (1,916 | 4.8%), Installation, Maintenance & Repair (1,475 | 3.7%), and Farming, Fishing & Forestry (275 | 0.7%).
Natural Resources, Construction and Maintenance Occupations by Sex
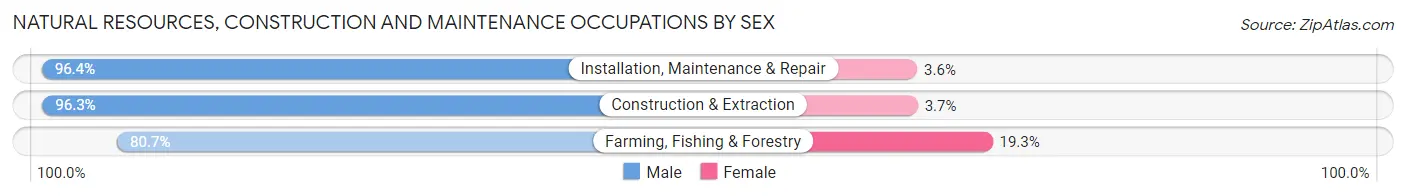
| Occupation | Male | Female |
| Farming, Fishing & Forestry | 222 (80.7%) | 53 (19.3%) |
| Construction & Extraction | 1,845 (96.3%) | 71 (3.7%) |
| Installation, Maintenance & Repair | 1,422 (96.4%) | 53 (3.6%) |
| Total (Category) | 3,489 (95.2%) | 177 (4.8%) |
| Total (Overall) | 20,216 (50.3%) | 19,942 (49.7%) |
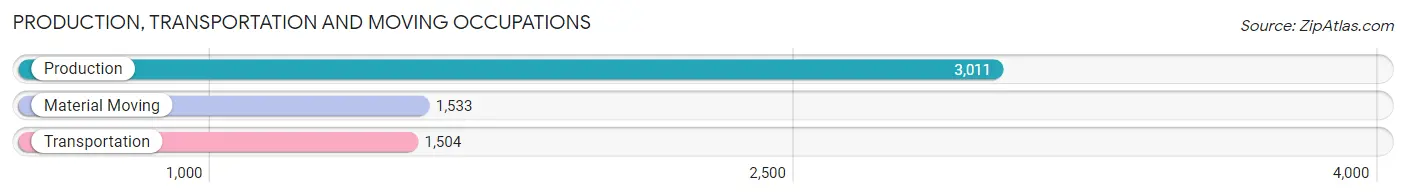
Production, Transportation and Moving Occupations
The most common Production, Transportation and Moving occupations in Craven County are Production (3,011 | 7.5%), Material Moving (1,533 | 3.8%), and Transportation (1,504 | 3.7%).
Production, Transportation and Moving Occupations by Sex
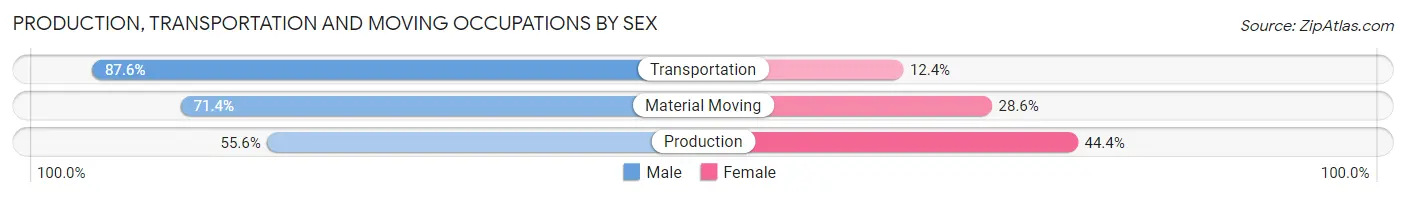
| Occupation | Male | Female |
| Production | 1,674 (55.6%) | 1,337 (44.4%) |
| Transportation | 1,318 (87.6%) | 186 (12.4%) |
| Material Moving | 1,094 (71.4%) | 439 (28.6%) |
| Total (Category) | 4,086 (67.6%) | 1,962 (32.4%) |
| Total (Overall) | 20,216 (50.3%) | 19,942 (49.7%) |
Employment Industries by Sex in Craven County
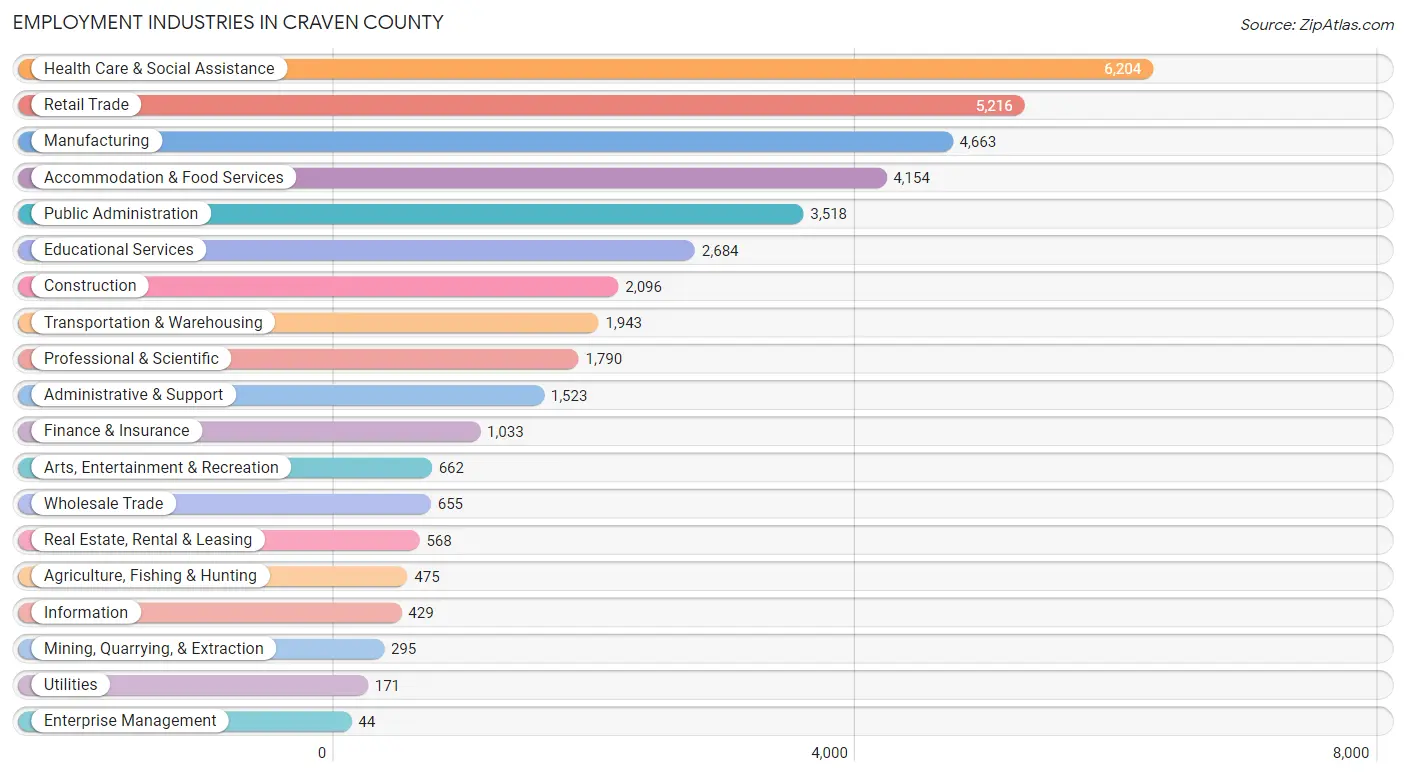
Employment Industries in Craven County
The major employment industries in Craven County include Health Care & Social Assistance (6,204 | 15.4%), Retail Trade (5,216 | 13.0%), Manufacturing (4,663 | 11.6%), Accommodation & Food Services (4,154 | 10.3%), and Public Administration (3,518 | 8.8%).
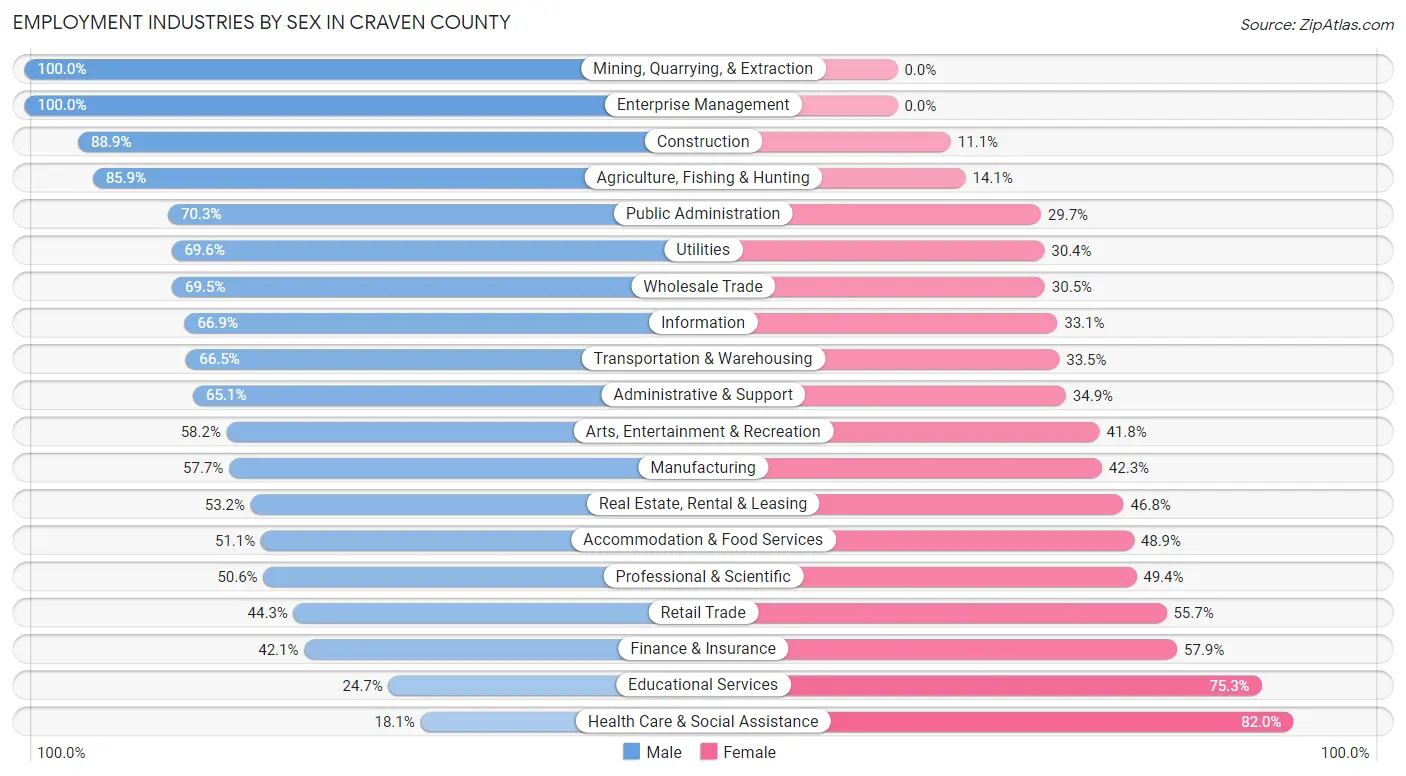
Employment Industries by Sex in Craven County
The Craven County industries that see more men than women are Mining, Quarrying, & Extraction (100.0%), Enterprise Management (100.0%), and Construction (88.9%), whereas the industries that tend to have a higher number of women are Health Care & Social Assistance (82.0%), Educational Services (75.3%), and Finance & Insurance (57.9%).
| Industry | Male | Female |
| Agriculture, Fishing & Hunting | 408 (85.9%) | 67 (14.1%) |
| Mining, Quarrying, & Extraction | 295 (100.0%) | 0 (0.0%) |
| Construction | 1,864 (88.9%) | 232 (11.1%) |
| Manufacturing | 2,689 (57.7%) | 1,974 (42.3%) |
| Wholesale Trade | 455 (69.5%) | 200 (30.5%) |
| Retail Trade | 2,311 (44.3%) | 2,905 (55.7%) |
| Transportation & Warehousing | 1,292 (66.5%) | 651 (33.5%) |
| Utilities | 119 (69.6%) | 52 (30.4%) |
| Information | 287 (66.9%) | 142 (33.1%) |
| Finance & Insurance | 435 (42.1%) | 598 (57.9%) |
| Real Estate, Rental & Leasing | 302 (53.2%) | 266 (46.8%) |
| Professional & Scientific | 905 (50.6%) | 885 (49.4%) |
| Enterprise Management | 44 (100.0%) | 0 (0.0%) |
| Administrative & Support | 992 (65.1%) | 531 (34.9%) |
| Educational Services | 662 (24.7%) | 2,022 (75.3%) |
| Health Care & Social Assistance | 1,120 (18.0%) | 5,084 (82.0%) |
| Arts, Entertainment & Recreation | 385 (58.2%) | 277 (41.8%) |
| Accommodation & Food Services | 2,121 (51.1%) | 2,033 (48.9%) |
| Public Administration | 2,473 (70.3%) | 1,045 (29.7%) |
| Total | 20,216 (50.3%) | 19,942 (49.7%) |
Education in Craven County
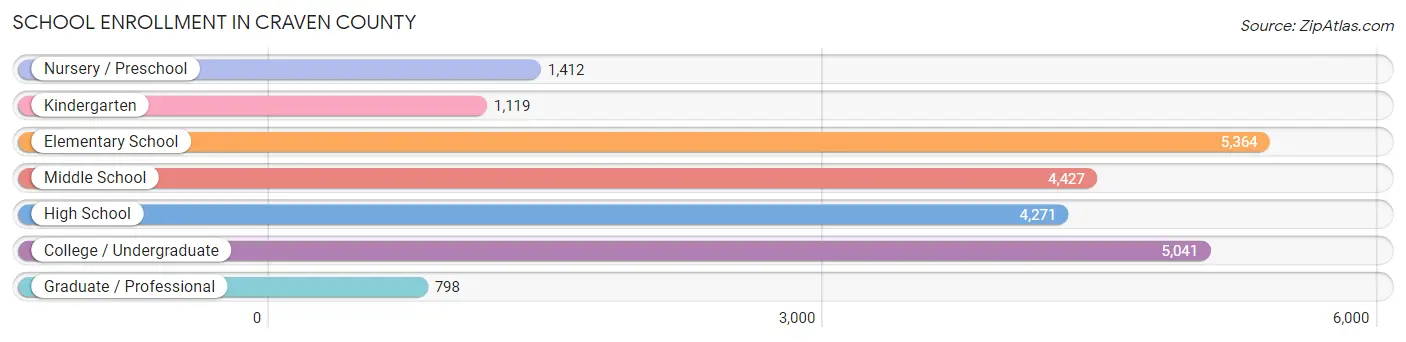
School Enrollment in Craven County
The most common levels of schooling among the 22,432 students in Craven County are elementary school (5,364 | 23.9%), college / undergraduate (5,041 | 22.5%), and middle school (4,427 | 19.7%).
| School Level | # Students | % Students |
| Nursery / Preschool | 1,412 | 6.3% |
| Kindergarten | 1,119 | 5.0% |
| Elementary School | 5,364 | 23.9% |
| Middle School | 4,427 | 19.7% |
| High School | 4,271 | 19.0% |
| College / Undergraduate | 5,041 | 22.5% |
| Graduate / Professional | 798 | 3.6% |
| Total | 22,432 | 100.0% |
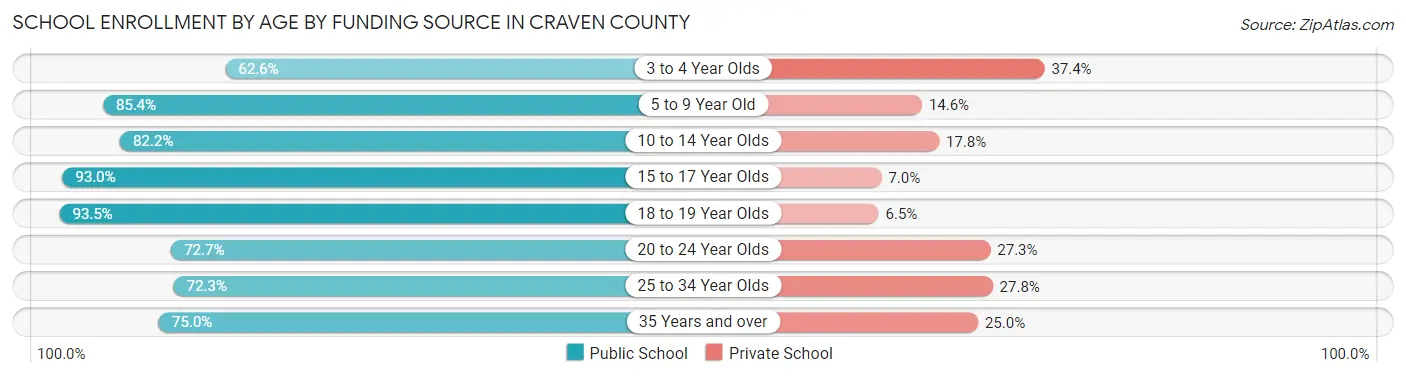
School Enrollment by Age by Funding Source in Craven County
Out of a total of 22,432 students who are enrolled in schools in Craven County, 4,015 (17.9%) attend a private institution, while the remaining 18,417 (82.1%) are enrolled in public schools. The age group of 3 to 4 year olds has the highest likelihood of being enrolled in private schools, with 420 (37.4% in the age bracket) enrolled. Conversely, the age group of 18 to 19 year olds has the lowest likelihood of being enrolled in a private school, with 1,036 (93.5% in the age bracket) attending a public institution.
| Age Bracket | Public School | Private School |
| 3 to 4 Year Olds | 703 (62.6%) | 420 (37.4%) |
| 5 to 9 Year Old | 4,998 (85.4%) | 853 (14.6%) |
| 10 to 14 Year Olds | 4,734 (82.2%) | 1,023 (17.8%) |
| 15 to 17 Year Olds | 3,036 (93.0%) | 230 (7.0%) |
| 18 to 19 Year Olds | 1,036 (93.5%) | 72 (6.5%) |
| 20 to 24 Year Olds | 1,306 (72.7%) | 491 (27.3%) |
| 25 to 34 Year Olds | 1,078 (72.3%) | 414 (27.8%) |
| 35 Years and over | 1,528 (75.0%) | 510 (25.0%) |
| Total | 18,417 (82.1%) | 4,015 (17.9%) |
Educational Attainment by Field of Study in Craven County
Education (3,058 | 16.5%), business (3,036 | 16.3%), science & technology (2,043 | 11.0%), social sciences (1,588 | 8.6%), and engineering (1,410 | 7.6%) are the most common fields of study among 18,579 individuals in Craven County who have obtained a bachelor's degree or higher.
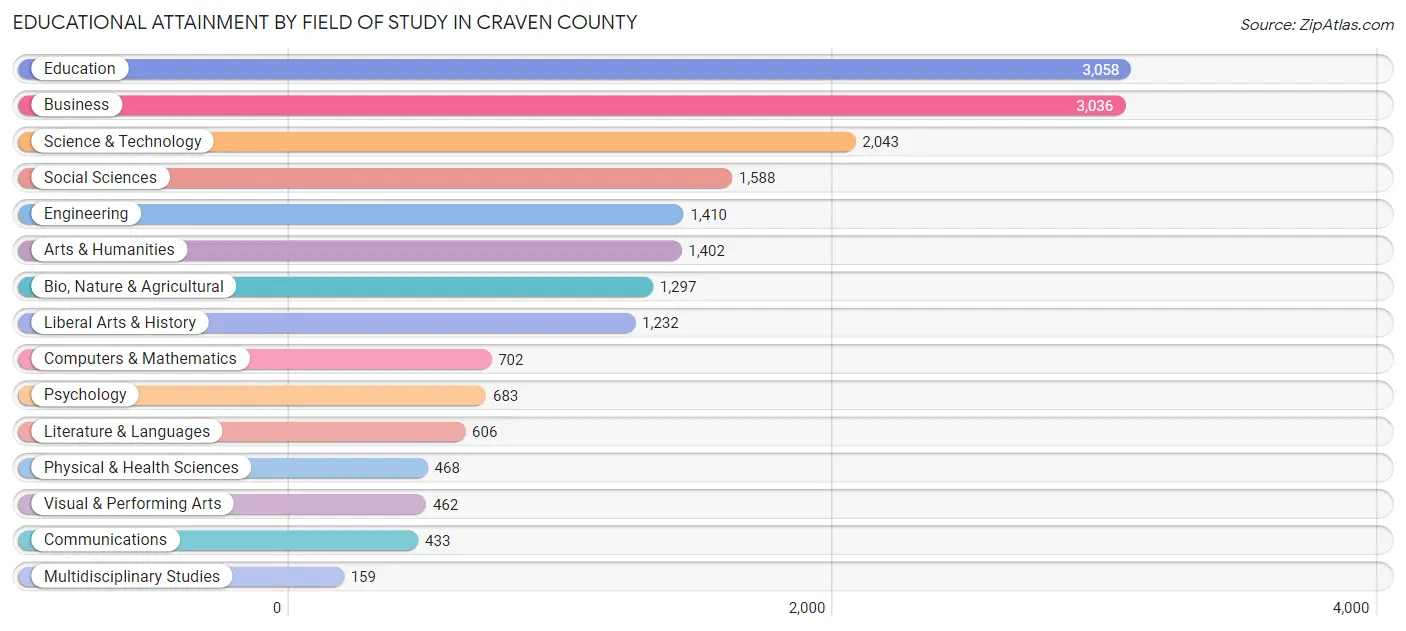
| Field of Study | # Graduates | % Graduates |
| Computers & Mathematics | 702 | 3.8% |
| Bio, Nature & Agricultural | 1,297 | 7.0% |
| Physical & Health Sciences | 468 | 2.5% |
| Psychology | 683 | 3.7% |
| Social Sciences | 1,588 | 8.6% |
| Engineering | 1,410 | 7.6% |
| Multidisciplinary Studies | 159 | 0.9% |
| Science & Technology | 2,043 | 11.0% |
| Business | 3,036 | 16.3% |
| Education | 3,058 | 16.5% |
| Literature & Languages | 606 | 3.3% |
| Liberal Arts & History | 1,232 | 6.6% |
| Visual & Performing Arts | 462 | 2.5% |
| Communications | 433 | 2.3% |
| Arts & Humanities | 1,402 | 7.5% |
| Total | 18,579 | 100.0% |
Transportation & Commute in Craven County
Vehicle Availability by Sex in Craven County
The most prevalent vehicle ownership categories in Craven County are males with 2 vehicles (9,871, accounting for 44.7%) and females with 2 vehicles (8,050, making up 49.8%).

| Vehicles Available | Male | Female |
| No Vehicle | 533 (2.4%) | 833 (4.2%) |
| 1 Vehicle | 3,554 (16.1%) | 4,088 (20.6%) |
| 2 Vehicles | 9,871 (44.7%) | 8,050 (40.6%) |
| 3 Vehicles | 4,928 (22.3%) | 4,235 (21.4%) |
| 4 Vehicles | 2,409 (10.9%) | 1,834 (9.3%) |
| 5 or more Vehicles | 805 (3.6%) | 768 (3.9%) |
| Total | 22,100 (100.0%) | 19,808 (100.0%) |
Commute Time in Craven County
The most frequently occuring commute durations in Craven County are 10 to 14 minutes (9,039 commuters, 21.5%), 15 to 19 minutes (7,132 commuters, 17.0%), and 20 to 24 minutes (5,902 commuters, 14.0%).
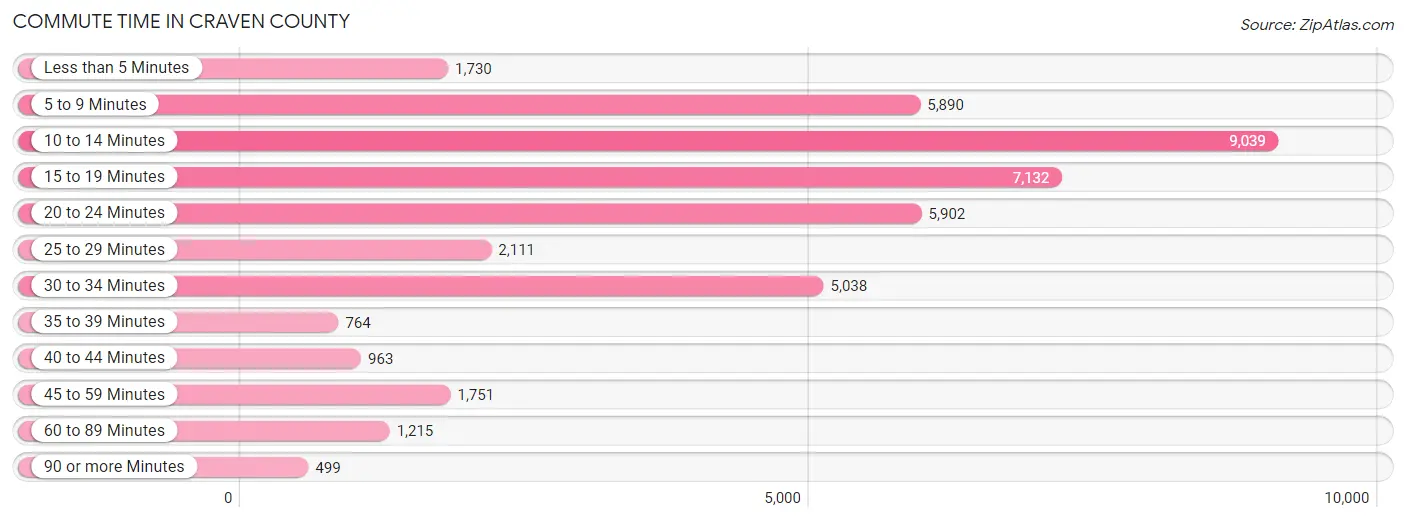
| Commute Time | # Commuters | % Commuters |
| Less than 5 Minutes | 1,730 | 4.1% |
| 5 to 9 Minutes | 5,890 | 14.0% |
| 10 to 14 Minutes | 9,039 | 21.5% |
| 15 to 19 Minutes | 7,132 | 17.0% |
| 20 to 24 Minutes | 5,902 | 14.0% |
| 25 to 29 Minutes | 2,111 | 5.0% |
| 30 to 34 Minutes | 5,038 | 12.0% |
| 35 to 39 Minutes | 764 | 1.8% |
| 40 to 44 Minutes | 963 | 2.3% |
| 45 to 59 Minutes | 1,751 | 4.2% |
| 60 to 89 Minutes | 1,215 | 2.9% |
| 90 or more Minutes | 499 | 1.2% |
Commute Time by Sex in Craven County
The most common commute times in Craven County are 10 to 14 minutes (4,829 commuters, 20.7%) for males and 10 to 14 minutes (4,210 commuters, 22.5%) for females.
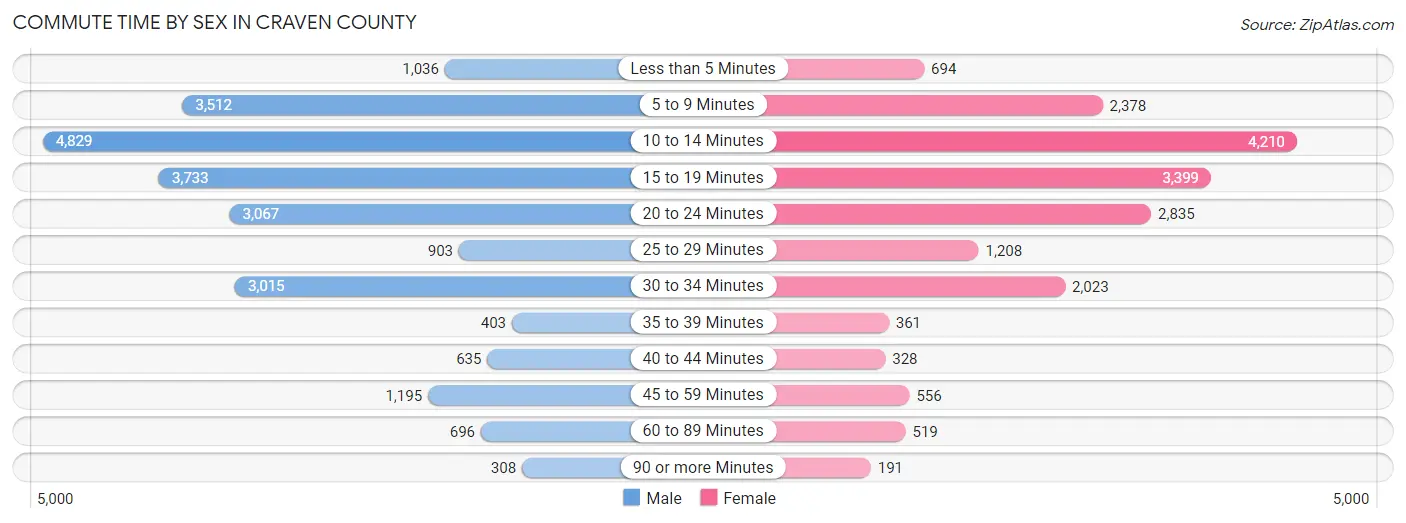
| Commute Time | Male | Female |
| Less than 5 Minutes | 1,036 (4.4%) | 694 (3.7%) |
| 5 to 9 Minutes | 3,512 (15.0%) | 2,378 (12.7%) |
| 10 to 14 Minutes | 4,829 (20.7%) | 4,210 (22.5%) |
| 15 to 19 Minutes | 3,733 (16.0%) | 3,399 (18.2%) |
| 20 to 24 Minutes | 3,067 (13.2%) | 2,835 (15.2%) |
| 25 to 29 Minutes | 903 (3.9%) | 1,208 (6.5%) |
| 30 to 34 Minutes | 3,015 (12.9%) | 2,023 (10.8%) |
| 35 to 39 Minutes | 403 (1.7%) | 361 (1.9%) |
| 40 to 44 Minutes | 635 (2.7%) | 328 (1.8%) |
| 45 to 59 Minutes | 1,195 (5.1%) | 556 (3.0%) |
| 60 to 89 Minutes | 696 (3.0%) | 519 (2.8%) |
| 90 or more Minutes | 308 (1.3%) | 191 (1.0%) |
Time of Departure to Work by Sex in Craven County
The most frequent times of departure to work in Craven County are 6:00 AM to 6:29 AM (3,855, 16.5%) for males and 7:00 AM to 7:29 AM (2,899, 15.5%) for females.
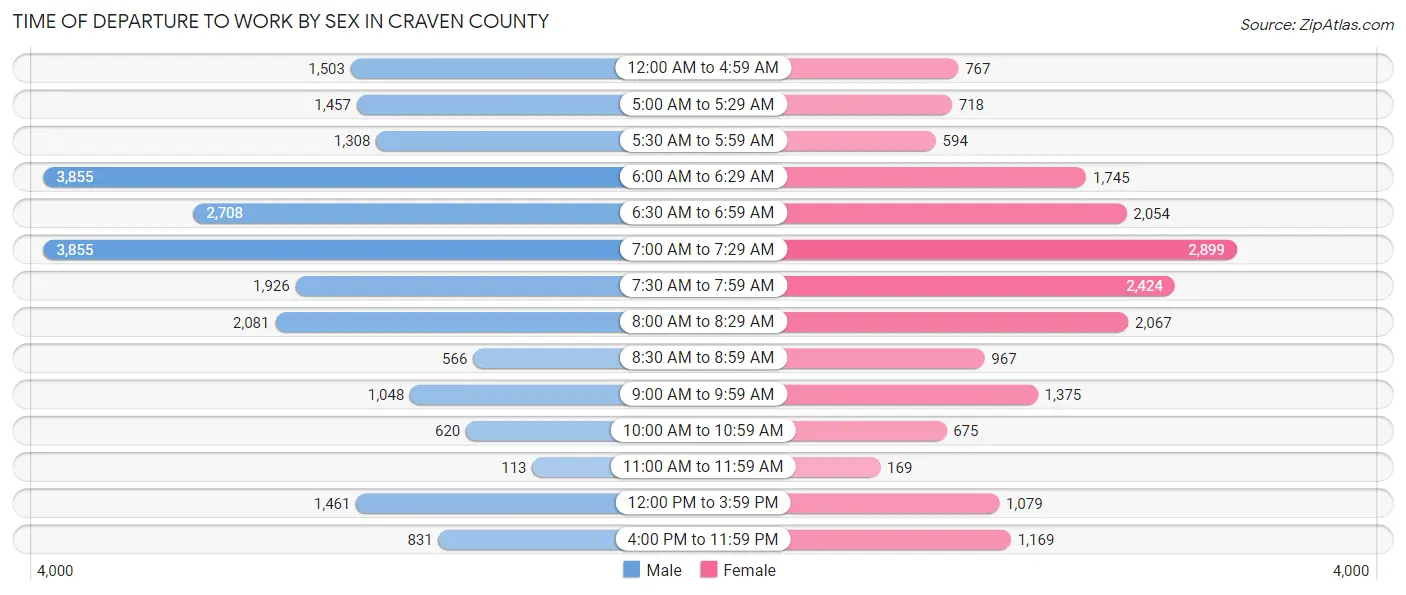
| Time of Departure | Male | Female |
| 12:00 AM to 4:59 AM | 1,503 (6.4%) | 767 (4.1%) |
| 5:00 AM to 5:29 AM | 1,457 (6.2%) | 718 (3.8%) |
| 5:30 AM to 5:59 AM | 1,308 (5.6%) | 594 (3.2%) |
| 6:00 AM to 6:29 AM | 3,855 (16.5%) | 1,745 (9.3%) |
| 6:30 AM to 6:59 AM | 2,708 (11.6%) | 2,054 (11.0%) |
| 7:00 AM to 7:29 AM | 3,855 (16.5%) | 2,899 (15.5%) |
| 7:30 AM to 7:59 AM | 1,926 (8.3%) | 2,424 (13.0%) |
| 8:00 AM to 8:29 AM | 2,081 (8.9%) | 2,067 (11.1%) |
| 8:30 AM to 8:59 AM | 566 (2.4%) | 967 (5.2%) |
| 9:00 AM to 9:59 AM | 1,048 (4.5%) | 1,375 (7.3%) |
| 10:00 AM to 10:59 AM | 620 (2.7%) | 675 (3.6%) |
| 11:00 AM to 11:59 AM | 113 (0.5%) | 169 (0.9%) |
| 12:00 PM to 3:59 PM | 1,461 (6.3%) | 1,079 (5.8%) |
| 4:00 PM to 11:59 PM | 831 (3.6%) | 1,169 (6.2%) |
| Total | 23,332 (100.0%) | 18,702 (100.0%) |
Housing Occupancy in Craven County
Occupancy by Ownership in Craven County
Of the total 41,004 dwellings in Craven County, owner-occupied units account for 27,848 (67.9%), while renter-occupied units make up 13,156 (32.1%).
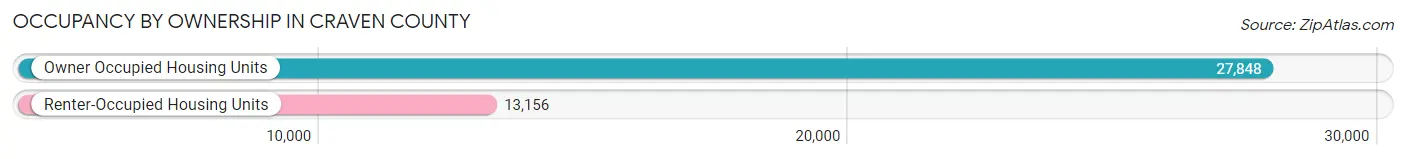
| Occupancy | # Housing Units | % Housing Units |
| Owner Occupied Housing Units | 27,848 | 67.9% |
| Renter-Occupied Housing Units | 13,156 | 32.1% |
| Total Occupied Housing Units | 41,004 | 100.0% |
Occupancy by Household Size in Craven County
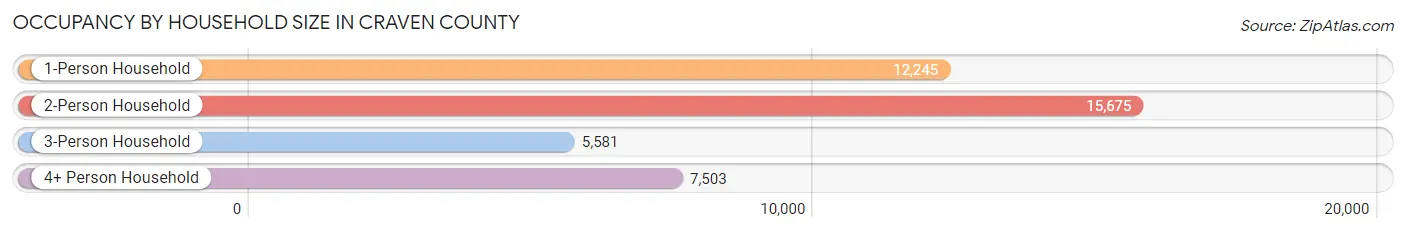
| Household Size | # Housing Units | % Housing Units |
| 1-Person Household | 12,245 | 29.9% |
| 2-Person Household | 15,675 | 38.2% |
| 3-Person Household | 5,581 | 13.6% |
| 4+ Person Household | 7,503 | 18.3% |
| Total Housing Units | 41,004 | 100.0% |
Occupancy by Ownership by Household Size in Craven County
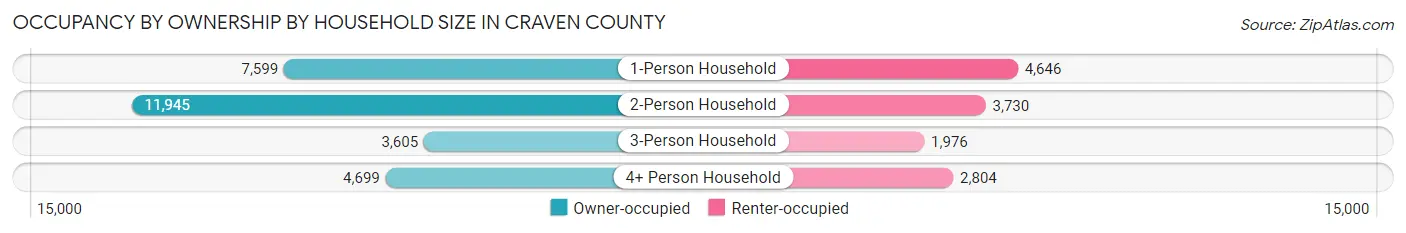
| Household Size | Owner-occupied | Renter-occupied |
| 1-Person Household | 7,599 (62.1%) | 4,646 (37.9%) |
| 2-Person Household | 11,945 (76.2%) | 3,730 (23.8%) |
| 3-Person Household | 3,605 (64.6%) | 1,976 (35.4%) |
| 4+ Person Household | 4,699 (62.6%) | 2,804 (37.4%) |
| Total Housing Units | 27,848 (67.9%) | 13,156 (32.1%) |
Occupancy by Educational Attainment in Craven County
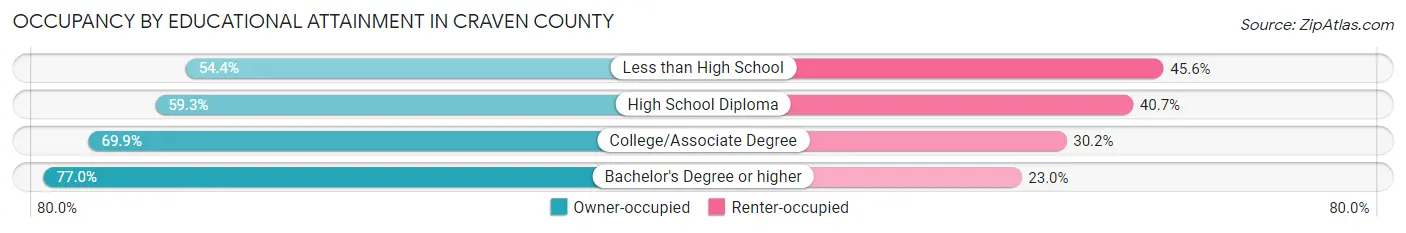
| Household Size | Owner-occupied | Renter-occupied |
| Less than High School | 1,705 (54.4%) | 1,427 (45.6%) |
| High School Diploma | 6,185 (59.3%) | 4,249 (40.7%) |
| College/Associate Degree | 11,386 (69.9%) | 4,915 (30.1%) |
| Bachelor's Degree or higher | 8,572 (77.0%) | 2,565 (23.0%) |
Occupancy by Age of Householder in Craven County
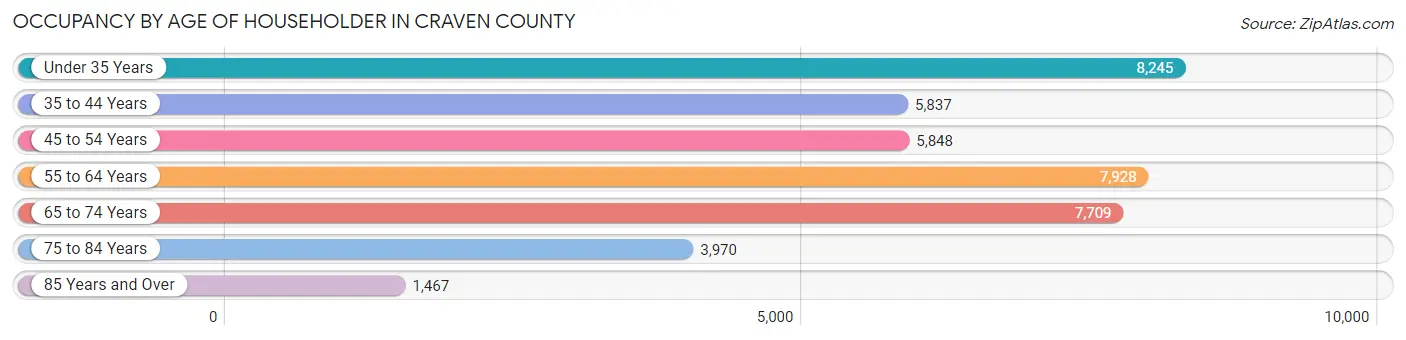
| Age Bracket | # Households | % Households |
| Under 35 Years | 8,245 | 20.1% |
| 35 to 44 Years | 5,837 | 14.2% |
| 45 to 54 Years | 5,848 | 14.3% |
| 55 to 64 Years | 7,928 | 19.3% |
| 65 to 74 Years | 7,709 | 18.8% |
| 75 to 84 Years | 3,970 | 9.7% |
| 85 Years and Over | 1,467 | 3.6% |
| Total | 41,004 | 100.0% |
Housing Finances in Craven County
Median Income by Occupancy in Craven County

| Occupancy Type | # Households | Median Income |
| Owner-Occupied | 27,848 (67.9%) | $74,809 |
| Renter-Occupied | 13,156 (32.1%) | $38,606 |
| Average | 41,004 (100.0%) | $61,676 |
Occupancy by Householder Income Bracket in Craven County
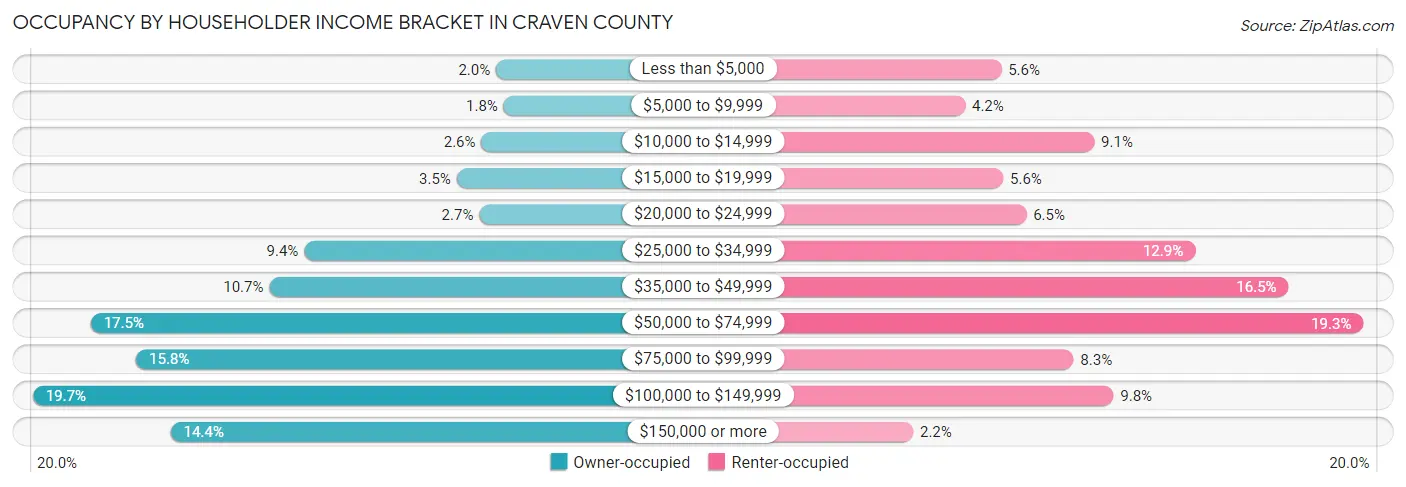
| Income Bracket | Owner-occupied | Renter-occupied |
| Less than $5,000 | 568 (2.0%) | 730 (5.6%) |
| $5,000 to $9,999 | 487 (1.8%) | 549 (4.2%) |
| $10,000 to $14,999 | 725 (2.6%) | 1,196 (9.1%) |
| $15,000 to $19,999 | 985 (3.5%) | 739 (5.6%) |
| $20,000 to $24,999 | 747 (2.7%) | 855 (6.5%) |
| $25,000 to $34,999 | 2,604 (9.3%) | 1,701 (12.9%) |
| $35,000 to $49,999 | 2,973 (10.7%) | 2,170 (16.5%) |
| $50,000 to $74,999 | 4,869 (17.5%) | 2,544 (19.3%) |
| $75,000 to $99,999 | 4,385 (15.8%) | 1,092 (8.3%) |
| $100,000 to $149,999 | 5,484 (19.7%) | 1,292 (9.8%) |
| $150,000 or more | 4,021 (14.4%) | 288 (2.2%) |
| Total | 27,848 (100.0%) | 13,156 (100.0%) |
Monthly Housing Cost Tiers in Craven County
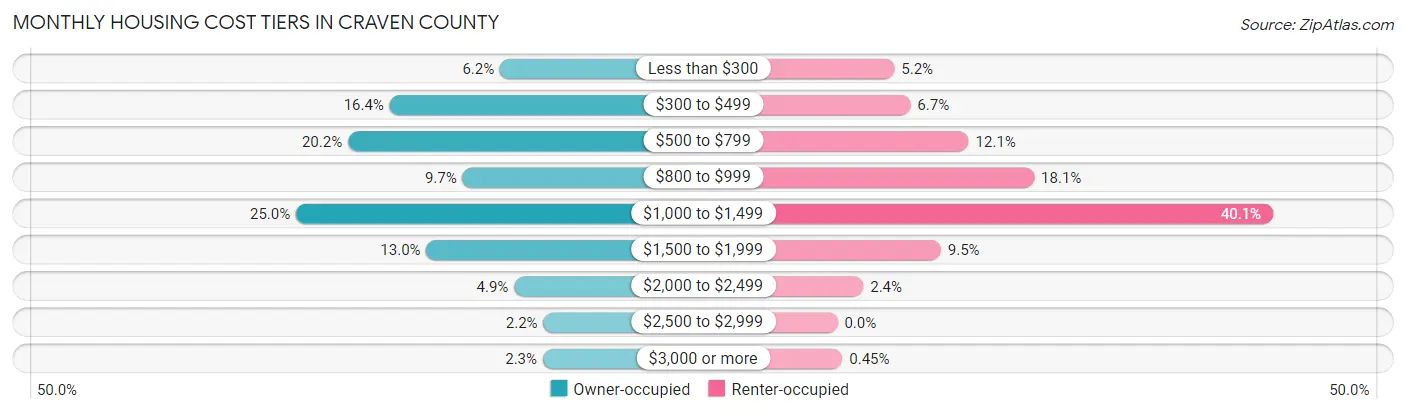
| Monthly Cost | Owner-occupied | Renter-occupied |
| Less than $300 | 1,735 (6.2%) | 689 (5.2%) |
| $300 to $499 | 4,563 (16.4%) | 884 (6.7%) |
| $500 to $799 | 5,633 (20.2%) | 1,589 (12.1%) |
| $800 to $999 | 2,696 (9.7%) | 2,382 (18.1%) |
| $1,000 to $1,499 | 6,966 (25.0%) | 5,274 (40.1%) |
| $1,500 to $1,999 | 3,622 (13.0%) | 1,252 (9.5%) |
| $2,000 to $2,499 | 1,373 (4.9%) | 313 (2.4%) |
| $2,500 to $2,999 | 623 (2.2%) | 0 (0.0%) |
| $3,000 or more | 637 (2.3%) | 59 (0.4%) |
| Total | 27,848 (100.0%) | 13,156 (100.0%) |
Physical Housing Characteristics in Craven County
Housing Structures in Craven County
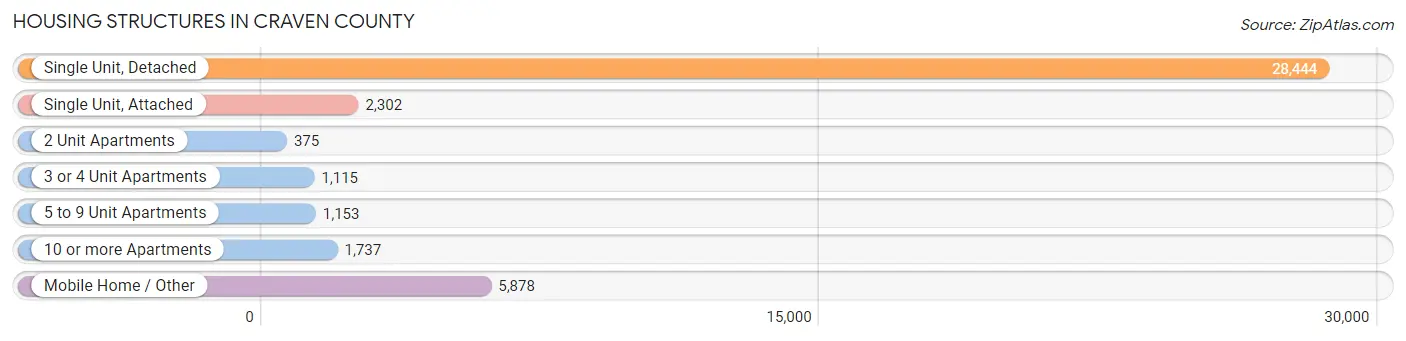
| Structure Type | # Housing Units | % Housing Units |
| Single Unit, Detached | 28,444 | 69.4% |
| Single Unit, Attached | 2,302 | 5.6% |
| 2 Unit Apartments | 375 | 0.9% |
| 3 or 4 Unit Apartments | 1,115 | 2.7% |
| 5 to 9 Unit Apartments | 1,153 | 2.8% |
| 10 or more Apartments | 1,737 | 4.2% |
| Mobile Home / Other | 5,878 | 14.3% |
| Total | 41,004 | 100.0% |
Housing Structures by Occupancy in Craven County
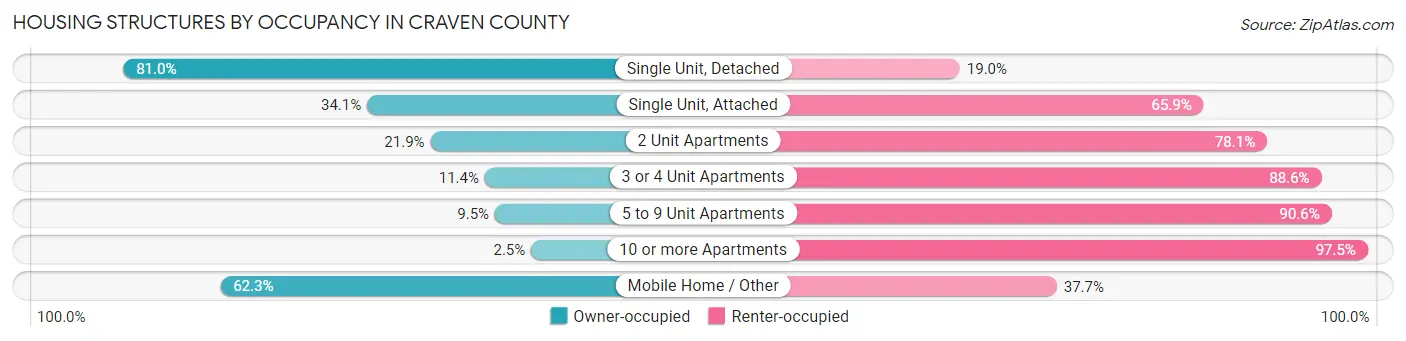
| Structure Type | Owner-occupied | Renter-occupied |
| Single Unit, Detached | 23,039 (81.0%) | 5,405 (19.0%) |
| Single Unit, Attached | 784 (34.1%) | 1,518 (65.9%) |
| 2 Unit Apartments | 82 (21.9%) | 293 (78.1%) |
| 3 or 4 Unit Apartments | 127 (11.4%) | 988 (88.6%) |
| 5 to 9 Unit Apartments | 109 (9.5%) | 1,044 (90.5%) |
| 10 or more Apartments | 43 (2.5%) | 1,694 (97.5%) |
| Mobile Home / Other | 3,664 (62.3%) | 2,214 (37.7%) |
| Total | 27,848 (67.9%) | 13,156 (32.1%) |
Housing Structures by Number of Rooms in Craven County
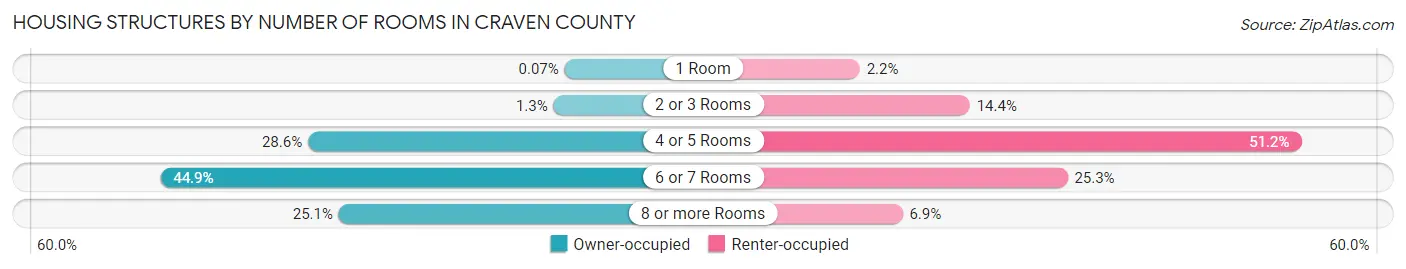
| Number of Rooms | Owner-occupied | Renter-occupied |
| 1 Room | 20 (0.1%) | 289 (2.2%) |
| 2 or 3 Rooms | 363 (1.3%) | 1,896 (14.4%) |
| 4 or 5 Rooms | 7,951 (28.5%) | 6,736 (51.2%) |
| 6 or 7 Rooms | 12,515 (44.9%) | 3,322 (25.3%) |
| 8 or more Rooms | 6,999 (25.1%) | 913 (6.9%) |
| Total | 27,848 (100.0%) | 13,156 (100.0%) |
Housing Structure by Heating Type in Craven County
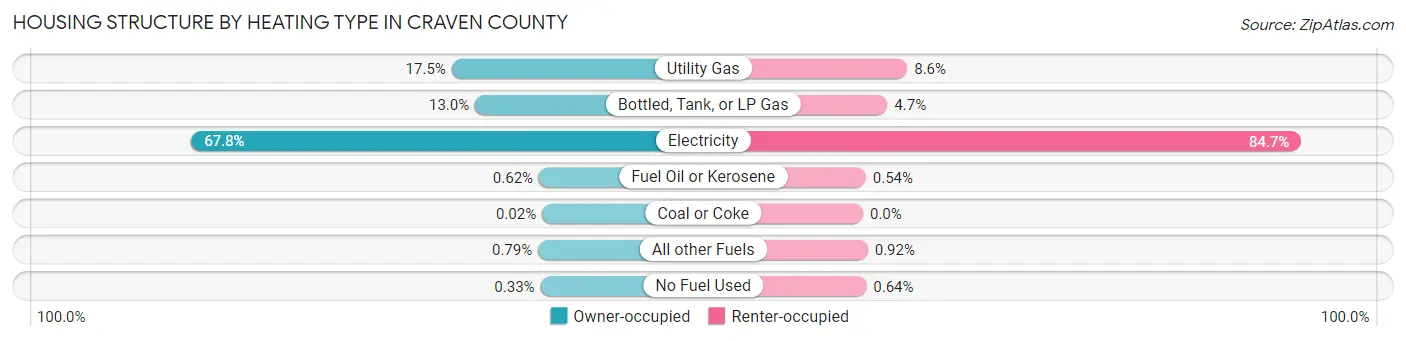
| Heating Type | Owner-occupied | Renter-occupied |
| Utility Gas | 4,868 (17.5%) | 1,125 (8.6%) |
| Bottled, Tank, or LP Gas | 3,607 (13.0%) | 619 (4.7%) |
| Electricity | 18,882 (67.8%) | 11,136 (84.7%) |
| Fuel Oil or Kerosene | 173 (0.6%) | 71 (0.5%) |
| Coal or Coke | 6 (0.0%) | 0 (0.0%) |
| All other Fuels | 221 (0.8%) | 121 (0.9%) |
| No Fuel Used | 91 (0.3%) | 84 (0.6%) |
| Total | 27,848 (100.0%) | 13,156 (100.0%) |
Household Vehicle Usage in Craven County
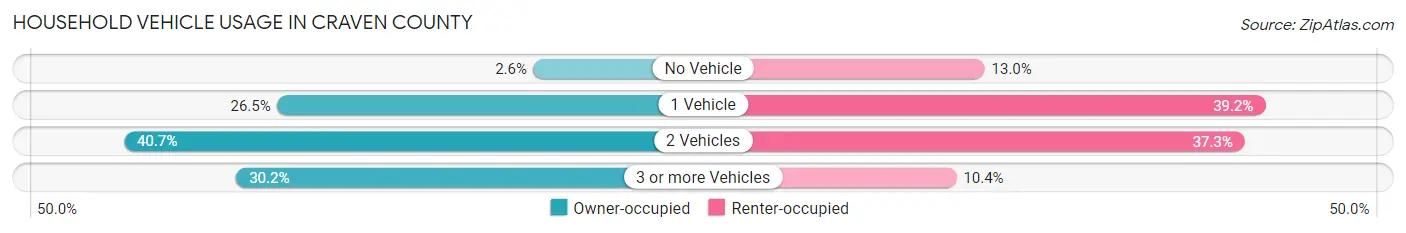
| Vehicles per Household | Owner-occupied | Renter-occupied |
| No Vehicle | 713 (2.6%) | 1,715 (13.0%) |
| 1 Vehicle | 7,374 (26.5%) | 5,161 (39.2%) |
| 2 Vehicles | 11,341 (40.7%) | 4,910 (37.3%) |
| 3 or more Vehicles | 8,420 (30.2%) | 1,370 (10.4%) |
| Total | 27,848 (100.0%) | 13,156 (100.0%) |
Real Estate & Mortgages in Craven County
Real Estate and Mortgage Overview in Craven County
| Characteristic | Without Mortgage | With Mortgage |
| Housing Units | 11,889 | 15,959 |
| Median Property Value | $172,400 | $206,900 |
| Median Household Income | $59,080 | $2,758 |
| Monthly Housing Costs | $492 | $628 |
| Real Estate Taxes | $1,228 | $472 |
Property Value by Mortgage Status in Craven County
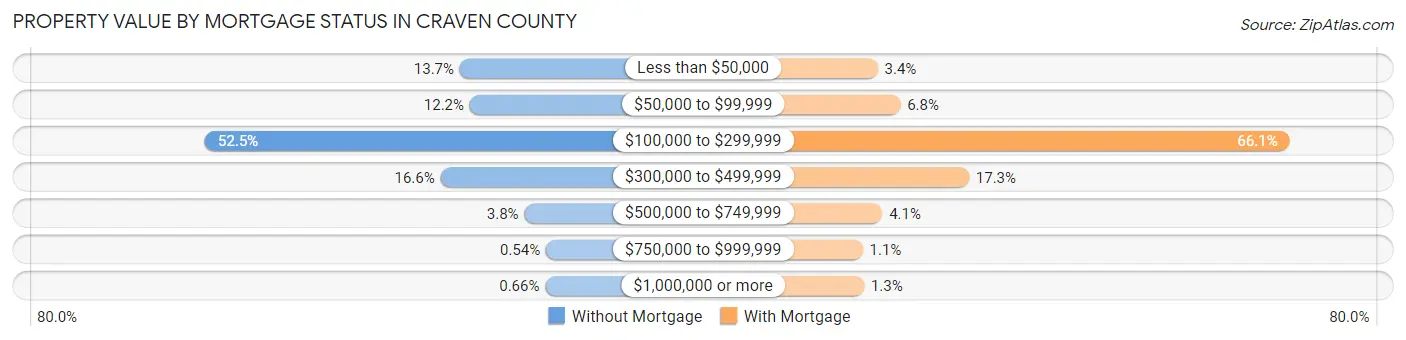
| Property Value | Without Mortgage | With Mortgage |
| Less than $50,000 | 1,625 (13.7%) | 536 (3.4%) |
| $50,000 to $99,999 | 1,444 (12.1%) | 1,087 (6.8%) |
| $100,000 to $299,999 | 6,244 (52.5%) | 10,553 (66.1%) |
| $300,000 to $499,999 | 1,976 (16.6%) | 2,756 (17.3%) |
| $500,000 to $749,999 | 457 (3.8%) | 649 (4.1%) |
| $750,000 to $999,999 | 64 (0.5%) | 173 (1.1%) |
| $1,000,000 or more | 79 (0.7%) | 205 (1.3%) |
| Total | 11,889 (100.0%) | 15,959 (100.0%) |
Household Income by Mortgage Status in Craven County
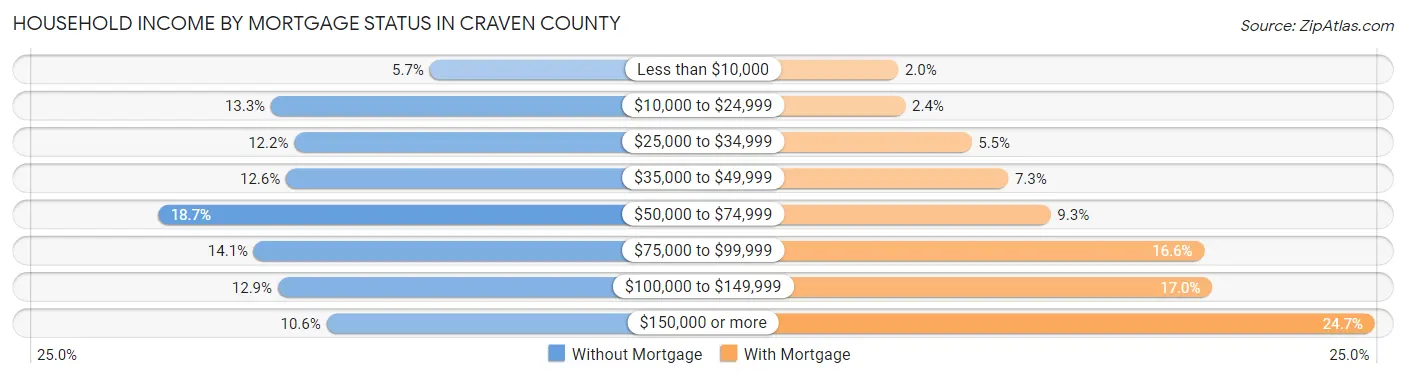
| Household Income | Without Mortgage | With Mortgage |
| Less than $10,000 | 679 (5.7%) | 323 (2.0%) |
| $10,000 to $24,999 | 1,578 (13.3%) | 376 (2.4%) |
| $25,000 to $34,999 | 1,446 (12.2%) | 879 (5.5%) |
| $35,000 to $49,999 | 1,492 (12.6%) | 1,158 (7.3%) |
| $50,000 to $74,999 | 2,219 (18.7%) | 1,481 (9.3%) |
| $75,000 to $99,999 | 1,674 (14.1%) | 2,650 (16.6%) |
| $100,000 to $149,999 | 1,538 (12.9%) | 2,711 (17.0%) |
| $150,000 or more | 1,263 (10.6%) | 3,946 (24.7%) |
| Total | 11,889 (100.0%) | 15,959 (100.0%) |
Property Value to Household Income Ratio in Craven County
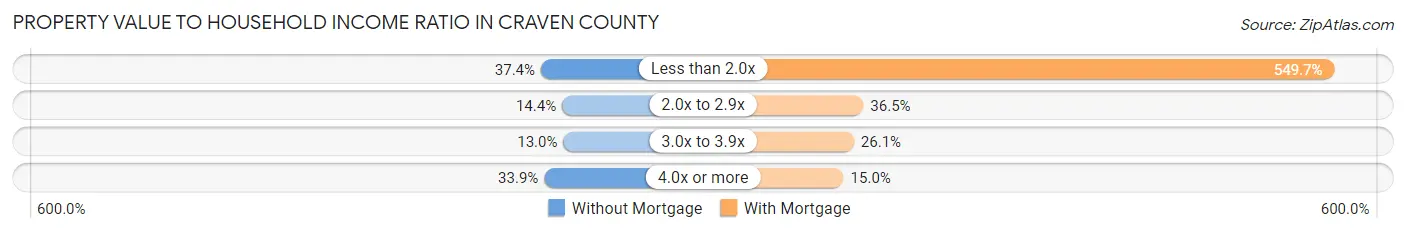
| Value-to-Income Ratio | Without Mortgage | With Mortgage |
| Less than 2.0x | 4,449 (37.4%) | 87,731 (549.7%) |
| 2.0x to 2.9x | 1,714 (14.4%) | 5,824 (36.5%) |
| 3.0x to 3.9x | 1,547 (13.0%) | 4,169 (26.1%) |
| 4.0x or more | 4,024 (33.9%) | 2,391 (15.0%) |
| Total | 11,889 (100.0%) | 15,959 (100.0%) |
Real Estate Taxes by Mortgage Status in Craven County
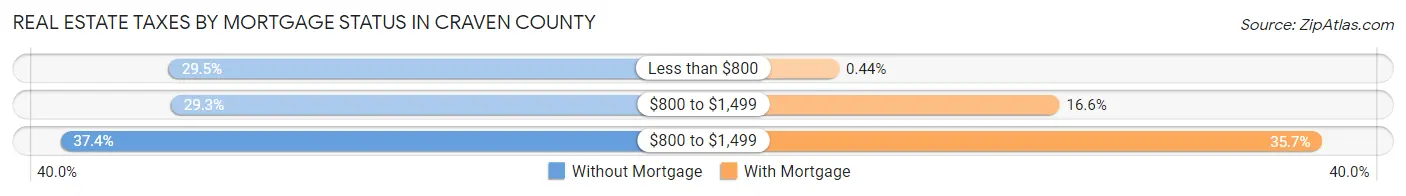
| Property Taxes | Without Mortgage | With Mortgage |
| Less than $800 | 3,503 (29.5%) | 70 (0.4%) |
| $800 to $1,499 | 3,485 (29.3%) | 2,642 (16.6%) |
| $800 to $1,499 | 4,445 (37.4%) | 5,703 (35.7%) |
| Total | 11,889 (100.0%) | 15,959 (100.0%) |
Health & Disability in Craven County
Health Insurance Coverage by Age in Craven County
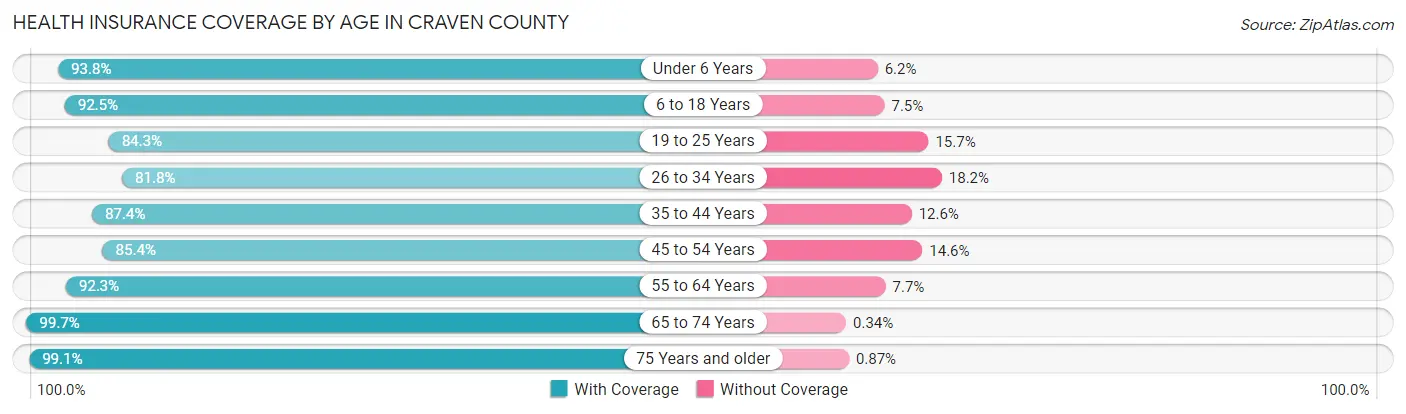
| Age Bracket | With Coverage | Without Coverage |
| Under 6 Years | 6,866 (93.8%) | 456 (6.2%) |
| 6 to 18 Years | 14,253 (92.5%) | 1,155 (7.5%) |
| 19 to 25 Years | 6,774 (84.3%) | 1,262 (15.7%) |
| 26 to 34 Years | 8,672 (81.8%) | 1,929 (18.2%) |
| 35 to 44 Years | 8,916 (87.4%) | 1,282 (12.6%) |
| 45 to 54 Years | 8,826 (85.4%) | 1,504 (14.6%) |
| 55 to 64 Years | 11,985 (92.3%) | 1,000 (7.7%) |
| 65 to 74 Years | 11,516 (99.7%) | 39 (0.3%) |
| 75 Years and older | 7,943 (99.1%) | 70 (0.9%) |
| Total | 85,751 (90.8%) | 8,697 (9.2%) |
Health Insurance Coverage by Citizenship Status in Craven County
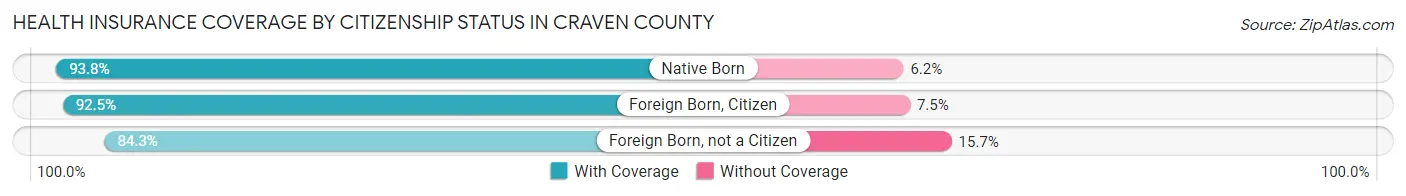
| Citizenship Status | With Coverage | Without Coverage |
| Native Born | 6,866 (93.8%) | 456 (6.2%) |
| Foreign Born, Citizen | 14,253 (92.5%) | 1,155 (7.5%) |
| Foreign Born, not a Citizen | 6,774 (84.3%) | 1,262 (15.7%) |
Health Insurance Coverage by Household Income in Craven County
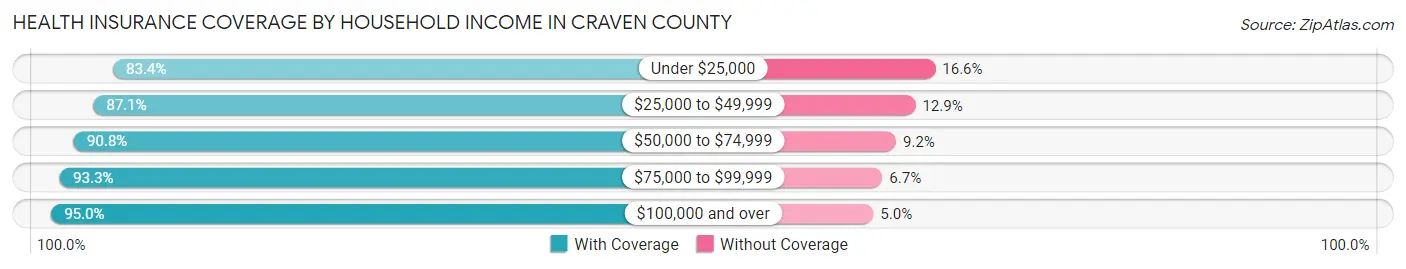
| Household Income | With Coverage | Without Coverage |
| Under $25,000 | 10,811 (83.4%) | 2,150 (16.6%) |
| $25,000 to $49,999 | 16,550 (87.1%) | 2,444 (12.9%) |
| $50,000 to $74,999 | 14,955 (90.8%) | 1,522 (9.2%) |
| $75,000 to $99,999 | 13,144 (93.3%) | 939 (6.7%) |
| $100,000 and over | 30,018 (95.0%) | 1,577 (5.0%) |
Public vs Private Health Insurance Coverage by Age in Craven County
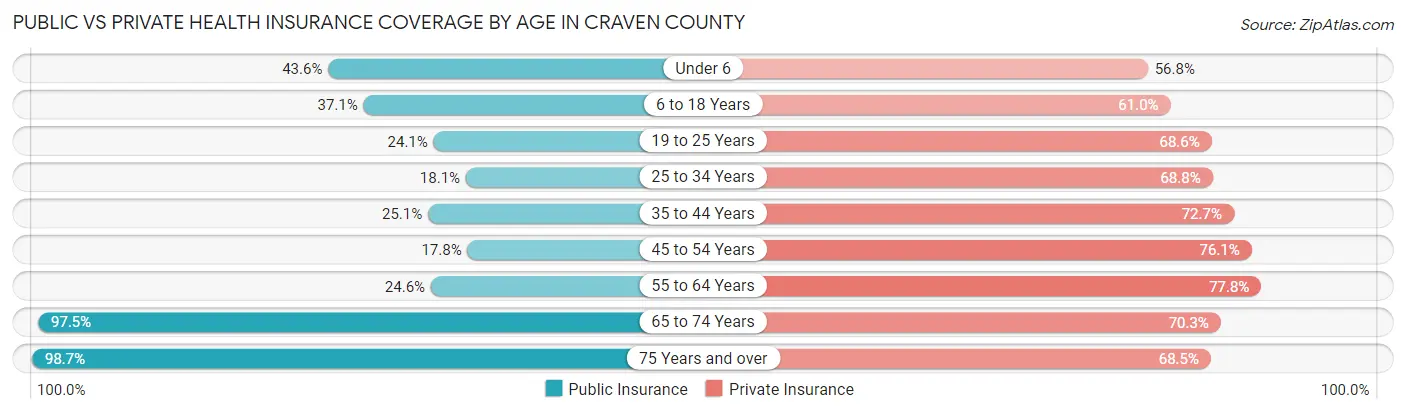
| Age Bracket | Public Insurance | Private Insurance |
| Under 6 | 3,195 (43.6%) | 4,158 (56.8%) |
| 6 to 18 Years | 5,714 (37.1%) | 9,397 (61.0%) |
| 19 to 25 Years | 1,935 (24.1%) | 5,514 (68.6%) |
| 25 to 34 Years | 1,918 (18.1%) | 7,294 (68.8%) |
| 35 to 44 Years | 2,561 (25.1%) | 7,418 (72.7%) |
| 45 to 54 Years | 1,838 (17.8%) | 7,858 (76.1%) |
| 55 to 64 Years | 3,192 (24.6%) | 10,108 (77.8%) |
| 65 to 74 Years | 11,270 (97.5%) | 8,126 (70.3%) |
| 75 Years and over | 7,906 (98.7%) | 5,488 (68.5%) |
| Total | 39,529 (41.8%) | 65,361 (69.2%) |
Disability Status by Sex by Age in Craven County
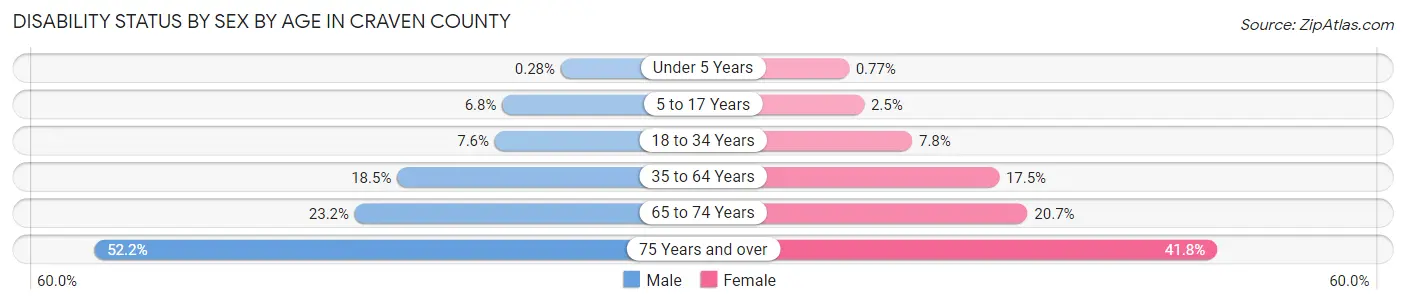
| Age Bracket | Male | Female |
| Under 5 Years | 9 (0.3%) | 24 (0.8%) |
| 5 to 17 Years | 532 (6.8%) | 193 (2.5%) |
| 18 to 34 Years | 688 (7.6%) | 815 (7.8%) |
| 35 to 64 Years | 2,908 (18.5%) | 3,113 (17.5%) |
| 65 to 74 Years | 1,253 (23.2%) | 1,273 (20.7%) |
| 75 Years and over | 1,796 (52.2%) | 1,912 (41.8%) |
Disability Class by Sex by Age in Craven County
Disability Class: Hearing Difficulty
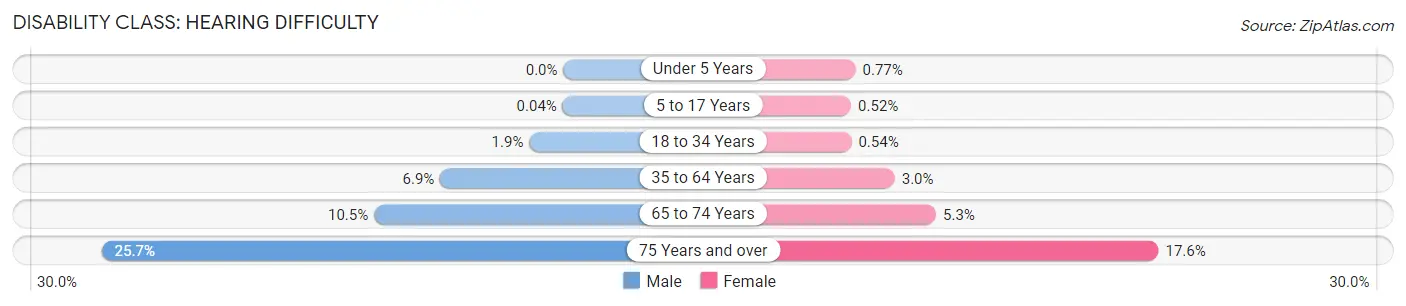
| Age Bracket | Male | Female |
| Under 5 Years | 0 (0.0%) | 24 (0.8%) |
| 5 to 17 Years | 3 (0.0%) | 41 (0.5%) |
| 18 to 34 Years | 171 (1.9%) | 56 (0.5%) |
| 35 to 64 Years | 1,079 (6.9%) | 524 (2.9%) |
| 65 to 74 Years | 569 (10.5%) | 323 (5.2%) |
| 75 Years and over | 884 (25.7%) | 807 (17.6%) |
Disability Class: Vision Difficulty
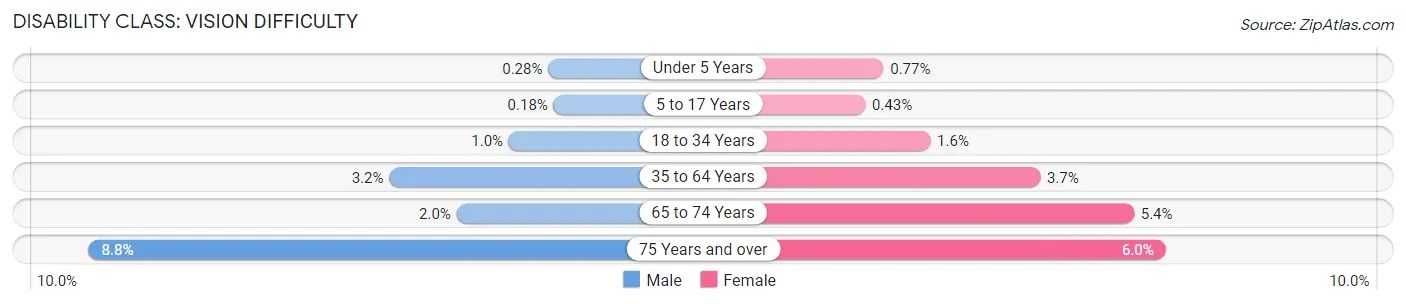
| Age Bracket | Male | Female |
| Under 5 Years | 9 (0.3%) | 24 (0.8%) |
| 5 to 17 Years | 14 (0.2%) | 34 (0.4%) |
| 18 to 34 Years | 91 (1.0%) | 171 (1.6%) |
| 35 to 64 Years | 508 (3.2%) | 654 (3.7%) |
| 65 to 74 Years | 107 (2.0%) | 334 (5.4%) |
| 75 Years and over | 303 (8.8%) | 275 (6.0%) |
Disability Class: Cognitive Difficulty
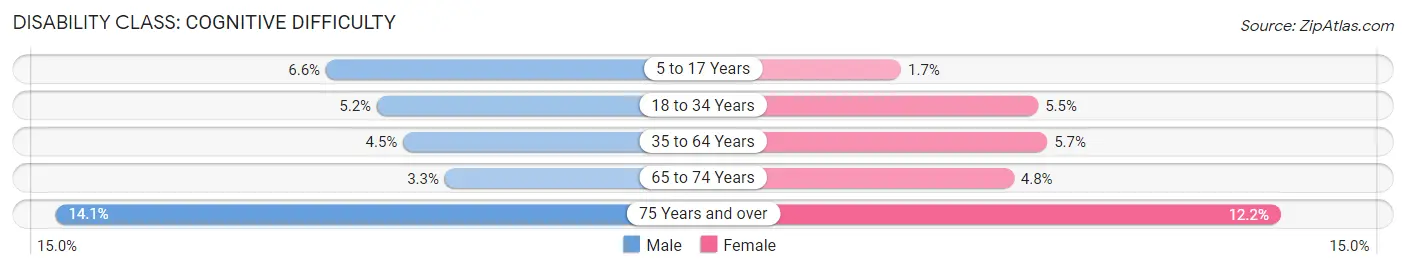
| Age Bracket | Male | Female |
| 5 to 17 Years | 517 (6.6%) | 129 (1.7%) |
| 18 to 34 Years | 468 (5.2%) | 570 (5.5%) |
| 35 to 64 Years | 701 (4.5%) | 1,018 (5.7%) |
| 65 to 74 Years | 178 (3.3%) | 295 (4.8%) |
| 75 Years and over | 486 (14.1%) | 559 (12.2%) |
Disability Class: Ambulatory Difficulty

| Age Bracket | Male | Female |
| 5 to 17 Years | 27 (0.4%) | 0 (0.0%) |
| 18 to 34 Years | 283 (3.1%) | 227 (2.2%) |
| 35 to 64 Years | 1,531 (9.7%) | 1,912 (10.7%) |
| 65 to 74 Years | 764 (14.2%) | 743 (12.1%) |
| 75 Years and over | 949 (27.6%) | 1,438 (31.4%) |
Disability Class: Self-Care Difficulty
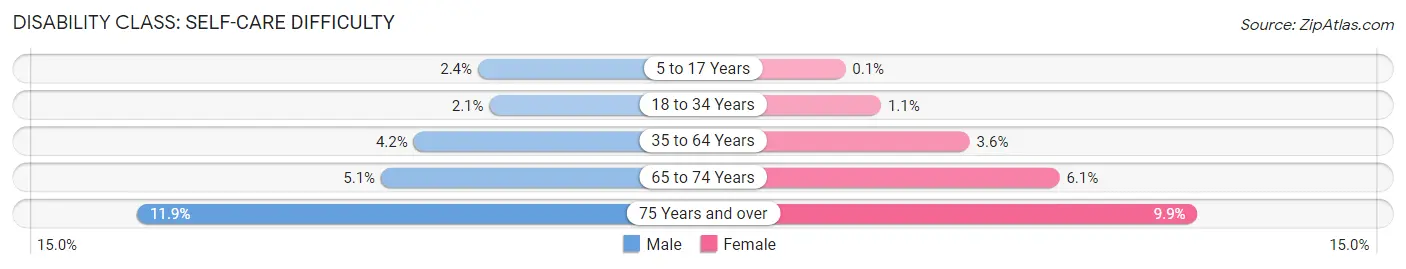
| Age Bracket | Male | Female |
| 5 to 17 Years | 186 (2.4%) | 8 (0.1%) |
| 18 to 34 Years | 186 (2.1%) | 114 (1.1%) |
| 35 to 64 Years | 655 (4.2%) | 634 (3.6%) |
| 65 to 74 Years | 274 (5.1%) | 373 (6.1%) |
| 75 Years and over | 408 (11.9%) | 453 (9.9%) |
Technology Access in Craven County
Computing Device Access in Craven County
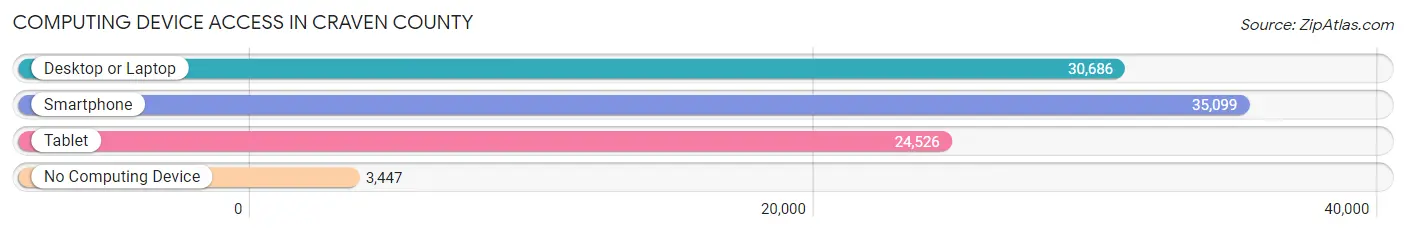
| Device Type | # Households | % Households |
| Desktop or Laptop | 30,686 | 74.8% |
| Smartphone | 35,099 | 85.6% |
| Tablet | 24,526 | 59.8% |
| No Computing Device | 3,447 | 8.4% |
| Total | 41,004 | 100.0% |
Internet Access in Craven County
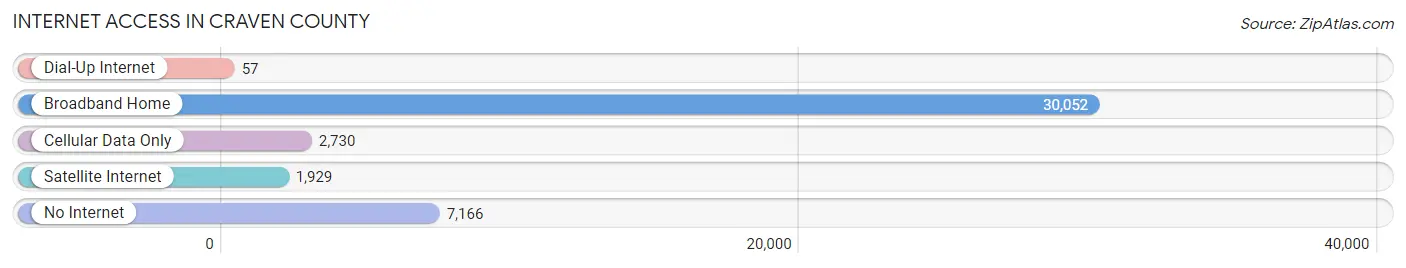
| Internet Type | # Households | % Households |
| Dial-Up Internet | 57 | 0.1% |
| Broadband Home | 30,052 | 73.3% |
| Cellular Data Only | 2,730 | 6.7% |
| Satellite Internet | 1,929 | 4.7% |
| No Internet | 7,166 | 17.5% |
| Total | 41,004 | 100.0% |
Craven County Summary
Craven County, North Carolina is located in the eastern part of the state, along the coast of the Atlantic Ocean. It is bordered by Pamlico County to the north, Carteret County to the east, Jones County to the south, and Lenoir County to the west. The county seat is New Bern, which is also the second oldest city in North Carolina. The county was established in 1705 and named after William Craven, a member of the British Parliament.
Geography
Craven County is located in the Coastal Plain region of North Carolina, and is characterized by flat terrain and sandy soils. The county is divided into two distinct regions: the Inner Banks and the Outer Banks. The Inner Banks region is located in the western part of the county and is characterized by low-lying terrain and numerous rivers and streams. The Outer Banks region is located in the eastern part of the county and is characterized by sandy beaches and barrier islands. The county is also home to Croatan National Forest, which is the only national forest in the state.
The county has a total area of 845 square miles, of which 817 square miles is land and 28 square miles is water. The county is home to numerous rivers and streams, including the Neuse River, Trent River, and Bay River.
Demographics
As of the 2010 census, Craven County had a population of 103,505. The racial makeup of the county was 73.2% White, 19.3% African American, 0.5% Native American, 2.2% Asian, 0.1% Pacific Islander, 2.7% from other races, and 1.9% from two or more races. Hispanic or Latino of any race were 5.3% of the population.
The median income for a household in the county was $41,945, and the median income for a family was $50,945. The per capita income for the county was $21,845. About 11.2% of families and 14.7% of the population were below the poverty line, including 19.2% of those under age 18 and 11.2% of those age 65 or over.
Economy
The economy of Craven County is largely based on agriculture, manufacturing, and tourism. The county is home to numerous farms, which produce a variety of crops, including corn, soybeans, wheat, and cotton. The county is also home to several manufacturing companies, including a paper mill, a furniture factory, and a plastics plant.
Tourism is also an important part of the county’s economy. The county is home to numerous beaches, parks, and historic sites, which attract visitors from all over the world. The county is also home to the Marine Corps Air Station Cherry Point, which is a major employer in the area.
Conclusion
Craven County, North Carolina is a coastal county located in the eastern part of the state. The county is characterized by flat terrain and sandy soils, and is divided into two distinct regions: the Inner Banks and the Outer Banks. As of the 2010 census, the county had a population of 103,505. The economy of the county is largely based on agriculture, manufacturing, and tourism. The county is home to numerous farms, manufacturing companies, and tourist attractions, which make it an important part of the state’s economy.
Common Questions
What is the Total Population of Craven County?
Total Population of Craven County is 101,098.
What is the Total Male Population of Craven County?
Total Male Population of Craven County is 50,563.
What is the Total Female Population of Craven County?
Total Female Population of Craven County is 50,535.
What is the Ratio of Males per 100 Females in Craven County?
There are 100.06 Males per 100 Females in Craven County.
What is the Ratio of Females per 100 Males in Craven County?
There are 99.94 Females per 100 Males in Craven County.
What is the Median Population Age in Craven County?
Median Population Age in Craven County is 38.5 Years.
What is the Average Family Size in Craven County
Average Family Size in Craven County is 2.9 People.
What is the Average Household Size in Craven County
Average Household Size in Craven County is 2.4 People.
What is Per Capita Income in Craven County?
Per Capita income in Craven County is $33,963.
What is the Median Family Income in Craven County?
Median Family Income in Craven County is $77,888.
What is the Median Household income in Craven County?
Median Household Income in Craven County is $61,676.
What is Income or Wage Gap in Craven County?
Income or Wage Gap in Craven County is 26.4%.
Women in Craven County earn 73.6 cents for every dollar earned by a man.
What is Family Income Deficit in Craven County?
Family Income Deficit in Craven County is $10,559.
Families that are below poverty line in Craven County earn $10,559 less on average than the poverty threshold level.
What is Inequality or Gini Index in Craven County?
Inequality or Gini Index in Craven County is 0.46.
How Large is the Labor Force in Craven County?
There are 47,566 People in the Labor Forcein in Craven County.
What is the Percentage of People in the Labor Force in Craven County?
58.5% of People are in the Labor Force in Craven County.
What is the Unemployment Rate in Craven County?
Unemployment Rate in Craven County is 5.1%.