Columbus County, NC
Columbus County Overview
50,827
TOTAL POPULATION
25,276
MALE POPULATION
25,551
FEMALE POPULATION
98.92
MALES / 100 FEMALES
101.09
FEMALES / 100 MALES
41.8
MEDIAN AGE
3.2
AVG FAMILY SIZE
2.5
AVG HOUSEHOLD SIZE
$24,236
PER CAPITA INCOME
$55,941
AVG FAMILY INCOME
$43,206
AVG HOUSEHOLD INCOME
7.2%
WAGE / INCOME GAP [ % ]
92.8¢/ $1
WAGE / INCOME GAP [ $ ]
$10,586
FAMILY INCOME DEFICIT
0.47
INEQUALITY / GINI INDEX
20,071
LABOR FORCE [ PEOPLE ]
48.1%
PERCENT IN LABOR FORCE
5.8%
UNEMPLOYMENT RATE
Columbus County Area Codes
Race in Columbus County
The most populous races in Columbus County are White / Caucasian (30,854 | 60.7%), Black / African American (14,552 | 28.6%), and Hispanic or Latino (2,996 | 5.9%).

| Race | # Population | % Population |
| Asian | 249 | 0.5% |
| Black / African American | 14,552 | 28.6% |
| Hawaiian / Pacific | 38 | 0.1% |
| Hispanic or Latino | 2,996 | 5.9% |
| Native / Alaskan | 1,645 | 3.2% |
| White / Caucasian | 30,854 | 60.7% |
| Two or more Races | 1,899 | 3.7% |
| Some other Race | 1,590 | 3.1% |
| Total | 50,827 | 100.0% |
Ancestry in Columbus County
The most populous ancestries reported in Columbus County are American (11,008 | 21.7%), English (3,643 | 7.2%), Mexican (2,706 | 5.3%), Irish (1,819 | 3.6%), and German (1,618 | 3.2%), together accounting for 40.9% of all Columbus County residents.

| Ancestry | # Population | % Population |
| African | 151 | 0.3% |
| American | 11,008 | 21.7% |
| Arab | 59 | 0.1% |
| Austrian | 3 | 0.0% |
| Bhutanese | 36 | 0.1% |
| Blackfeet | 28 | 0.1% |
| Brazilian | 16 | 0.0% |
| British | 104 | 0.2% |
| Burmese | 91 | 0.2% |
| Canadian | 15 | 0.0% |
| Central American | 55 | 0.1% |
| Cherokee | 420 | 0.8% |
| Chippewa | 6 | 0.0% |
| Crow | 1 | 0.0% |
| Cuban | 59 | 0.1% |
| Czech | 10 | 0.0% |
| Czechoslovakian | 7 | 0.0% |
| Danish | 3 | 0.0% |
| Dominican | 10 | 0.0% |
| Dutch | 69 | 0.1% |
| Eastern European | 43 | 0.1% |
| Egyptian | 18 | 0.0% |
| English | 3,643 | 7.2% |
| Ethiopian | 11 | 0.0% |
| European | 391 | 0.8% |
| French | 365 | 0.7% |
| French Canadian | 65 | 0.1% |
| German | 1,618 | 3.2% |
| Greek | 22 | 0.0% |
| Guyanese | 7 | 0.0% |
| Haitian | 1 | 0.0% |
| Honduran | 38 | 0.1% |
| Indian (Asian) | 15 | 0.0% |
| Irish | 1,819 | 3.6% |
| Iroquois | 7 | 0.0% |
| Israeli | 14 | 0.0% |
| Italian | 353 | 0.7% |
| Jamaican | 46 | 0.1% |
| Korean | 46 | 0.1% |
| Liberian | 9 | 0.0% |
| Lithuanian | 1 | 0.0% |
| Lumbee | 415 | 0.8% |
| Macedonian | 7 | 0.0% |
| Mexican | 2,706 | 5.3% |
| Mexican American Indian | 30 | 0.1% |
| Moroccan | 25 | 0.1% |
| Native Hawaiian | 4 | 0.0% |
| Nigerian | 26 | 0.1% |
| Northern European | 12 | 0.0% |
| Norwegian | 144 | 0.3% |
| Palestinian | 10 | 0.0% |
| Polish | 226 | 0.4% |
| Portuguese | 47 | 0.1% |
| Puerto Rican | 72 | 0.1% |
| Russian | 9 | 0.0% |
| Salvadoran | 17 | 0.0% |
| Samoan | 33 | 0.1% |
| Scandinavian | 37 | 0.1% |
| Scotch-Irish | 750 | 1.5% |
| Scottish | 536 | 1.1% |
| Sioux | 45 | 0.1% |
| Spaniard | 30 | 0.1% |
| Spanish | 34 | 0.1% |
| Subsaharan African | 201 | 0.4% |
| Swedish | 73 | 0.1% |
| Swiss | 6 | 0.0% |
| Syrian | 6 | 0.0% |
| Thai | 103 | 0.2% |
| Trinidadian and Tobagonian | 9 | 0.0% |
| U.S. Virgin Islander | 10 | 0.0% |
| Ukrainian | 13 | 0.0% |
| Welsh | 266 | 0.5% | View All 72 Rows |
Immigrants in Columbus County
The most numerous immigrant groups reported in Columbus County came from Latin America (1,014 | 2.0%), Central America (959 | 1.9%), Mexico (926 | 1.8%), Asia (129 | 0.3%), and India (84 | 0.2%), together accounting for 6.1% of all Columbus County residents.

| Immigration Origin | # Population | % Population |
| Africa | 37 | 0.1% |
| Asia | 129 | 0.3% |
| Canada | 15 | 0.0% |
| Caribbean | 48 | 0.1% |
| Central America | 959 | 1.9% |
| Cuba | 25 | 0.1% |
| Dominican Republic | 10 | 0.0% |
| Eastern Europe | 6 | 0.0% |
| Egypt | 18 | 0.0% |
| El Salvador | 8 | 0.0% |
| Europe | 39 | 0.1% |
| Germany | 33 | 0.1% |
| Guyana | 7 | 0.0% |
| Honduras | 25 | 0.1% |
| India | 84 | 0.2% |
| Jamaica | 13 | 0.0% |
| Latin America | 1,014 | 2.0% |
| Liberia | 9 | 0.0% |
| Mexico | 926 | 1.8% |
| Nigeria | 10 | 0.0% |
| Northern Africa | 18 | 0.0% |
| Philippines | 20 | 0.0% |
| Russia | 6 | 0.0% |
| South America | 7 | 0.0% |
| South Central Asia | 84 | 0.2% |
| South Eastern Asia | 35 | 0.1% |
| Thailand | 15 | 0.0% |
| Western Africa | 19 | 0.0% |
| Western Europe | 33 | 0.1% | View All 29 Rows |
Sex and Age in Columbus County
Sex and Age in Columbus County
The most populous age groups in Columbus County are 60 to 64 Years (1,893 | 7.5%) for men and 60 to 64 Years (1,985 | 7.8%) for women.

| Age Bracket | Male | Female |
| Under 5 Years | 1,072 (4.2%) | 1,516 (5.9%) |
| 5 to 9 Years | 1,392 (5.5%) | 1,492 (5.8%) |
| 10 to 14 Years | 1,622 (6.4%) | 1,365 (5.3%) |
| 15 to 19 Years | 1,600 (6.3%) | 1,625 (6.4%) |
| 20 to 24 Years | 1,740 (6.9%) | 1,513 (5.9%) |
| 25 to 29 Years | 1,842 (7.3%) | 1,374 (5.4%) |
| 30 to 34 Years | 1,695 (6.7%) | 1,319 (5.2%) |
| 35 to 39 Years | 1,505 (5.9%) | 1,289 (5.0%) |
| 40 to 44 Years | 1,625 (6.4%) | 1,453 (5.7%) |
| 45 to 49 Years | 1,565 (6.2%) | 1,466 (5.7%) |
| 50 to 54 Years | 1,693 (6.7%) | 1,806 (7.1%) |
| 55 to 59 Years | 1,554 (6.1%) | 1,631 (6.4%) |
| 60 to 64 Years | 1,893 (7.5%) | 1,985 (7.8%) |
| 65 to 69 Years | 1,420 (5.6%) | 1,497 (5.9%) |
| 70 to 74 Years | 1,386 (5.5%) | 1,645 (6.4%) |
| 75 to 79 Years | 805 (3.2%) | 907 (3.5%) |
| 80 to 84 Years | 595 (2.4%) | 911 (3.6%) |
| 85 Years and over | 272 (1.1%) | 757 (3.0%) |
| Total | 25,276 (100.0%) | 25,551 (100.0%) |
Families and Households in Columbus County
Median Family Size in Columbus County
The median family size in Columbus County is 3.21 persons per family, with single female/mother families (3,055 | 25.1%) accounting for the largest median family size of 3.42 persons per family. On the other hand, married-couple families (8,210 | 67.5%) represent the smallest median family size with 3.12 persons per family.

| Family Type | # Families | Family Size |
| Married-Couple | 8,210 (67.5%) | 3.12 |
| Single Male/Father | 906 (7.4%) | 3.37 |
| Single Female/Mother | 3,055 (25.1%) | 3.42 |
| Total Families | 12,171 (100.0%) | 3.21 |
Median Household Size in Columbus County
The median household size in Columbus County is 2.51 persons per household, with single female/mother households (3,055 | 15.9%) accounting for the largest median household size of 3.62 persons per household. non-family households (7,014 | 36.6%) represent the smallest median household size with 1.17 persons per household.

| Household Type | # Households | Household Size |
| Married-Couple | 8,210 (42.8%) | 3.13 |
| Single Male/Father | 906 (4.7%) | 3.50 |
| Single Female/Mother | 3,055 (15.9%) | 3.62 |
| Non-family | 7,014 (36.6%) | 1.17 |
| Total Households | 19,185 (100.0%) | 2.51 |
Household Size by Marriage Status in Columbus County
Out of a total of 19,185 households in Columbus County, 12,171 (63.4%) are family households, while 7,014 (36.6%) are nonfamily households. The most numerous type of family households are 2-person households, comprising 6,111, and the most common type of nonfamily households are 1-person households, comprising 6,245.

| Household Size | Family Households | Nonfamily Households |
| 1-Person Households | - | 6,245 (32.6%) |
| 2-Person Households | 6,111 (31.9%) | 643 (3.4%) |
| 3-Person Households | 3,065 (16.0%) | 64 (0.3%) |
| 4-Person Households | 1,701 (8.9%) | 29 (0.2%) |
| 5-Person Households | 892 (4.6%) | 0 (0.0%) |
| 6-Person Households | 330 (1.7%) | 0 (0.0%) |
| 7+ Person Households | 72 (0.4%) | 33 (0.2%) |
| Total | 12,171 (63.4%) | 7,014 (36.6%) |
Female Fertility in Columbus County
Fertility by Age in Columbus County
Average fertility rate in Columbus County is 48.0 births per 1,000 women. Women in the age bracket of 20 to 34 years have the highest fertility rate with 91.0 births per 1,000 women. Women in the age bracket of 20 to 34 years acount for 76.7% of all women with births.

| Age Bracket | Women with Births | Births / 1,000 Women |
| 15 to 19 years | 27 (5.4%) | 17.0 |
| 20 to 34 years | 381 (76.7%) | 91.0 |
| 35 to 50 years | 89 (17.9%) | 20.0 |
| Total | 497 (100.0%) | 48.0 |
Fertility by Age by Marriage Status in Columbus County
55.7% of women with births (497) in Columbus County are married. The highest percentage of unmarried women with births falls into 15 to 19 years age bracket with 100.0% of them unmarried at the time of birth, while the lowest percentage of unmarried women with births belong to 35 to 50 years age bracket with 23.6% of them unmarried.

| Age Bracket | Married | Unmarried |
| 15 to 19 years | 0 (0.0%) | 27 (100.0%) |
| 20 to 34 years | 209 (54.9%) | 172 (45.1%) |
| 35 to 50 years | 68 (76.4%) | 21 (23.6%) |
| Total | 277 (55.7%) | 220 (44.3%) |
Fertility by Education in Columbus County
Average fertility rate in Columbus County is 48.0 births per 1,000 women. Women with the education attainment of college or associate's degree have the highest fertility rate of 73.0 births per 1,000 women, while women with the education attainment of graduate degree have the lowest fertility at 18.0 births per 1,000 women. Women with the education attainment of college or associate's degree represent 57.8% of all women with births.

| Educational Attainment | Women with Births | Births / 1,000 Women |
| Less than High School | 53 (10.7%) | 25.0 |
| High School Diploma | 114 (22.9%) | 39.0 |
| College or Associate's Degree | 287 (57.8%) | 73.0 |
| Bachelor's Degree | 37 (7.4%) | 35.0 |
| Graduate Degree | 6 (1.2%) | 18.0 |
| Total | 497 (100.0%) | 48.0 |
Fertility by Education by Marriage Status in Columbus County
44.3% of women with births in Columbus County are unmarried. Women with the educational attainment of bachelor's degree are most likely to be married with 100.0% of them married at childbirth, while women with the educational attainment of high school diploma are least likely to be married with 100.0% of them unmarried at childbirth.

| Educational Attainment | Married | Unmarried |
| Less than High School | 18 (34.0%) | 35 (66.0%) |
| High School Diploma | 0 (0.0%) | 114 (100.0%) |
| College or Associate's Degree | 216 (75.3%) | 71 (24.7%) |
| Bachelor's Degree | 37 (100.0%) | 0 (0.0%) |
| Graduate Degree | 6 (100.0%) | 0 (0.0%) |
| Total | 277 (55.7%) | 220 (44.3%) |
Income in Columbus County
Income Overview in Columbus County
Per Capita Income in Columbus County is $24,236, while median incomes of families and households are $55,941 and $43,206 respectively.
| Characteristic | Number | Measure |
| Per Capita Income | 50,827 | $24,236 |
| Median Family Income | 12,171 | $55,941 |
| Mean Family Income | 12,171 | $72,393 |
| Median Household Income | 19,185 | $43,206 |
| Mean Household Income | 19,185 | $60,288 |
| Income Deficit | 12,171 | $10,586 |
| Wage / Income Gap (%) | 50,827 | 7.16% |
| Wage / Income Gap ($) | 50,827 | 92.84¢ per $1 |
| Gini / Inequality Index | 50,827 | 0.47 |
Earnings by Sex in Columbus County
Average Earnings in Columbus County are $32,363, $33,598 for men and $31,193 for women, a difference of 7.2%.

| Sex | Number | Average Earnings |
| Male | 11,249 (52.3%) | $33,598 |
| Female | 10,270 (47.7%) | $31,193 |
| Total | 21,519 (100.0%) | $32,363 |
Earnings by Sex by Income Bracket in Columbus County
The most common earnings brackets in Columbus County are $25,000 to $29,999 for men (1,118 | 9.9%) and $25,000 to $29,999 for women (1,063 | 10.3%).

| Income | Male | Female |
| $2,499 or less | 620 (5.5%) | 468 (4.6%) |
| $2,500 to $4,999 | 228 (2.0%) | 399 (3.9%) |
| $5,000 to $7,499 | 467 (4.2%) | 515 (5.0%) |
| $7,500 to $9,999 | 219 (1.9%) | 160 (1.6%) |
| $10,000 to $12,499 | 432 (3.8%) | 330 (3.2%) |
| $12,500 to $14,999 | 419 (3.7%) | 493 (4.8%) |
| $15,000 to $17,499 | 430 (3.8%) | 504 (4.9%) |
| $17,500 to $19,999 | 334 (3.0%) | 249 (2.4%) |
| $20,000 to $22,499 | 239 (2.1%) | 264 (2.6%) |
| $22,500 to $24,999 | 668 (5.9%) | 512 (5.0%) |
| $25,000 to $29,999 | 1,118 (9.9%) | 1,063 (10.3%) |
| $30,000 to $34,999 | 653 (5.8%) | 1,059 (10.3%) |
| $35,000 to $39,999 | 734 (6.5%) | 650 (6.3%) |
| $40,000 to $44,999 | 679 (6.0%) | 606 (5.9%) |
| $45,000 to $49,999 | 697 (6.2%) | 478 (4.6%) |
| $50,000 to $54,999 | 519 (4.6%) | 578 (5.6%) |
| $55,000 to $64,999 | 549 (4.9%) | 725 (7.1%) |
| $65,000 to $74,999 | 484 (4.3%) | 280 (2.7%) |
| $75,000 to $99,999 | 1,014 (9.0%) | 634 (6.2%) |
| $100,000+ | 746 (6.6%) | 303 (2.9%) |
| Total | 11,249 (100.0%) | 10,270 (100.0%) |
Earnings by Sex by Educational Attainment in Columbus County
Average earnings in Columbus County are $36,982 for men and $33,363 for women, a difference of 9.8%. Men with an educational attainment of graduate degree enjoy the highest average annual earnings of $65,497, while those with less than high school education earn the least with $25,812. Women with an educational attainment of graduate degree earn the most with the average annual earnings of $59,500, while those with less than high school education have the smallest earnings of $24,492.

| Educational Attainment | Male Income | Female Income |
| Less than High School | $25,812 | $24,492 |
| High School Diploma | $38,001 | $27,613 |
| College or Associate's Degree | $40,350 | $32,893 |
| Bachelor's Degree | $51,656 | $40,760 |
| Graduate Degree | $65,497 | $59,500 |
| Total | $36,982 | $33,363 |
Family Income in Columbus County
Family Income Brackets in Columbus County
According to the Columbus County family income data, there are 2,410 families falling into the $50,000 to $74,999 income range, which is the most common income bracket and makes up 19.8% of all families. Conversely, the $200,000+ income bracket is the least frequent group with only 450 families (3.7%) belonging to this category.

| Income Bracket | # Families | % Families |
| Less than $10,000 | 767 | 6.3% |
| $10,000 to $14,999 | 511 | 4.2% |
| $15,000 to $24,999 | 1,035 | 8.5% |
| $25,000 to $34,999 | 1,521 | 12.5% |
| $35,000 to $49,999 | 1,607 | 13.2% |
| $50,000 to $74,999 | 2,410 | 19.8% |
| $75,000 to $99,999 | 1,594 | 13.1% |
| $100,000 to $149,999 | 1,485 | 12.2% |
| $150,000 to $199,999 | 779 | 6.4% |
| $200,000+ | 450 | 3.7% |
Family Income by Famaliy Size in Columbus County
4-person families (1,614 | 13.3%) account for the highest median family income in Columbus County with $67,778 per family, while 2-person families (6,424 | 52.8%) have the highest median income of $25,731 per family member.

| Income Bracket | # Families | Median Income |
| 2-Person Families | 6,424 (52.8%) | $51,462 |
| 3-Person Families | 2,927 (24.0%) | $59,266 |
| 4-Person Families | 1,614 (13.3%) | $67,778 |
| 5-Person Families | 851 (7.0%) | $56,418 |
| 6-Person Families | 300 (2.5%) | $58,214 |
| 7+ Person Families | 55 (0.4%) | $64,205 |
| Total | 12,171 (100.0%) | $55,941 |
Family Income by Number of Earners in Columbus County
The median family income in Columbus County is $55,941, with families comprising 3+ earners (670) having the highest median family income of $149,500, while families with no earners (3,202) have the lowest median family income of $29,295, accounting for 5.5% and 26.3% of families, respectively.

| Number of Earners | # Families | Median Income |
| No Earners | 3,202 (26.3%) | $29,295 |
| 1 Earner | 4,262 (35.0%) | $43,609 |
| 2 Earners | 4,037 (33.2%) | $82,798 |
| 3+ Earners | 670 (5.5%) | $149,500 |
| Total | 12,171 (100.0%) | $55,941 |
Household Income in Columbus County
Household Income Brackets in Columbus County
With 3,166 households falling in the category, the $50,000 to $74,999 income range is the most frequent in Columbus County, accounting for 16.5% of all households. In contrast, only 518 households (2.7%) fall into the $200,000+ income bracket, making it the least populous group.

| Income Bracket | # Households | % Households |
| Less than $10,000 | 1,707 | 8.9% |
| $10,000 to $14,999 | 1,458 | 7.6% |
| $15,000 to $24,999 | 2,590 | 13.5% |
| $25,000 to $34,999 | 2,532 | 13.2% |
| $35,000 to $49,999 | 2,283 | 11.9% |
| $50,000 to $74,999 | 3,166 | 16.5% |
| $75,000 to $99,999 | 2,341 | 12.2% |
| $100,000 to $149,999 | 1,707 | 8.9% |
| $150,000 to $199,999 | 863 | 4.5% |
| $200,000+ | 518 | 2.7% |
Household Income by Householder Age in Columbus County
The median household income in Columbus County is $43,206, with the highest median household income of $54,085 found in the 25 to 44 years age bracket for the primary householder. A total of 4,552 households (23.7%) fall into this category. Meanwhile, the 15 to 24 years age bracket for the primary householder has the lowest median household income of $31,117, with 704 households (3.7%) in this group.

| Income Bracket | # Households | Median Income |
| 15 to 24 Years | 704 (3.7%) | $31,117 |
| 25 to 44 Years | 4,552 (23.7%) | $54,085 |
| 45 to 64 Years | 7,081 (36.9%) | $50,232 |
| 65+ Years | 6,848 (35.7%) | $32,802 |
| Total | 19,185 (100.0%) | $43,206 |
Poverty in Columbus County
Income Below Poverty by Sex and Age in Columbus County
With 19.8% poverty level for males and 22.3% for females among the residents of Columbus County, 5 year old males and under 5 year old females are the most vulnerable to poverty, with 95 males (50.3%) and 646 females (42.6%) in their respective age groups living below the poverty level.

| Age Bracket | Male | Female |
| Under 5 Years | 260 (25.0%) | 646 (42.6%) |
| 5 Years | 95 (50.3%) | 19 (5.0%) |
| 6 to 11 Years | 387 (20.7%) | 398 (23.3%) |
| 12 to 14 Years | 293 (33.4%) | 243 (34.3%) |
| 15 Years | 60 (25.9%) | 77 (19.4%) |
| 16 and 17 Years | 209 (31.2%) | 115 (16.7%) |
| 18 to 24 Years | 522 (23.4%) | 651 (32.1%) |
| 25 to 34 Years | 422 (15.1%) | 650 (24.2%) |
| 35 to 44 Years | 507 (19.4%) | 717 (26.2%) |
| 45 to 54 Years | 575 (20.3%) | 573 (17.6%) |
| 55 to 64 Years | 679 (21.4%) | 639 (17.7%) |
| 65 to 74 Years | 311 (11.5%) | 410 (13.2%) |
| 75 Years and over | 204 (12.6%) | 487 (20.0%) |
| Total | 4,524 (19.8%) | 5,625 (22.3%) |
Income Above Poverty by Sex and Age in Columbus County
According to the poverty statistics in Columbus County, males aged 65 to 74 years and females aged 5 years are the age groups that are most secure financially, with 88.5% of males and 95.0% of females in these age groups living above the poverty line.

| Age Bracket | Male | Female |
| Under 5 Years | 781 (75.0%) | 870 (57.4%) |
| 5 Years | 94 (49.7%) | 358 (95.0%) |
| 6 to 11 Years | 1,484 (79.3%) | 1,308 (76.7%) |
| 12 to 14 Years | 585 (66.6%) | 466 (65.7%) |
| 15 Years | 172 (74.1%) | 320 (80.6%) |
| 16 and 17 Years | 461 (68.8%) | 575 (83.3%) |
| 18 to 24 Years | 1,709 (76.6%) | 1,375 (67.9%) |
| 25 to 34 Years | 2,380 (84.9%) | 2,037 (75.8%) |
| 35 to 44 Years | 2,102 (80.6%) | 2,025 (73.9%) |
| 45 to 54 Years | 2,254 (79.7%) | 2,687 (82.4%) |
| 55 to 64 Years | 2,493 (78.6%) | 2,971 (82.3%) |
| 65 to 74 Years | 2,385 (88.5%) | 2,705 (86.8%) |
| 75 Years and over | 1,422 (87.5%) | 1,951 (80.0%) |
| Total | 18,322 (80.2%) | 19,648 (77.7%) |
Income Below Poverty Among Married-Couple Families in Columbus County
The poverty statistics for married-couple families in Columbus County show that 9.8% or 803 of the total 8,210 families live below the poverty line. Families with 3 or 4 children have the highest poverty rate of 25.5%, comprising of 166 families. On the other hand, families with 5 or more children have the lowest poverty rate of 0.0%, which includes 0 families.

| Children | Above Poverty | Below Poverty |
| No Children | 4,879 (95.7%) | 220 (4.3%) |
| 1 or 2 Children | 2,033 (83.0%) | 417 (17.0%) |
| 3 or 4 Children | 485 (74.5%) | 166 (25.5%) |
| 5 or more Children | 10 (100.0%) | 0 (0.0%) |
| Total | 7,407 (90.2%) | 803 (9.8%) |
Income Below Poverty Among Single-Parent Households in Columbus County
According to the poverty data in Columbus County, 23.6% or 214 single-father households and 38.8% or 1,186 single-mother households are living below the poverty line. Among single-father households, those with no children have the highest poverty rate, with 171 households (31.9%) experiencing poverty. Likewise, among single-mother households, those with 3 or 4 children have the highest poverty rate, with 196 households (65.3%) falling below the poverty line.

| Children | Single Father | Single Mother |
| No Children | 171 (31.9%) | 321 (25.3%) |
| 1 or 2 Children | 43 (13.4%) | 669 (45.0%) |
| 3 or 4 Children | 0 (0.0%) | 196 (65.3%) |
| 5 or more Children | 0 (0.0%) | 0 (0.0%) |
| Total | 214 (23.6%) | 1,186 (38.8%) |
Income Below Poverty Among Married-Couple vs Single-Parent Households in Columbus County
The poverty data for Columbus County shows that 803 of the married-couple family households (9.8%) and 1,400 of the single-parent households (35.3%) are living below the poverty level. Within the married-couple family households, those with 3 or 4 children have the highest poverty rate, with 166 households (25.5%) falling below the poverty line. Among the single-parent households, those with 3 or 4 children have the highest poverty rate, with 196 household (64.5%) living below poverty.

| Children | Married-Couple Families | Single-Parent Households |
| No Children | 220 (4.3%) | 492 (27.3%) |
| 1 or 2 Children | 417 (17.0%) | 712 (39.4%) |
| 3 or 4 Children | 166 (25.5%) | 196 (64.5%) |
| 5 or more Children | 0 (0.0%) | 0 (0.0%) |
| Total | 803 (9.8%) | 1,400 (35.3%) |
Employment Characteristics in Columbus County
Employment by Class of Employer in Columbus County
Among the 18,489 employed individuals in Columbus County, private company employees (13,180 | 71.3%), state government employees (1,348 | 7.3%), and local government employees (1,140 | 6.2%) make up the most common classes of employment.

| Employer Class | # Employees | % Employees |
| Private Company Employees | 13,180 | 71.3% |
| Self-Employed (Incorporated) | 595 | 3.2% |
| Self-Employed (Not Incorporated) | 917 | 5.0% |
| Not-for-profit Organizations | 1,056 | 5.7% |
| Local Government Employees | 1,140 | 6.2% |
| State Government Employees | 1,348 | 7.3% |
| Federal Government Employees | 212 | 1.1% |
| Unpaid Family Workers | 41 | 0.2% |
| Total | 18,489 | 100.0% |
Employment Status by Age in Columbus County
According to the labor force statistics for Columbus County, out of the total population over 16 years of age (41,727), 48.1% or 20,071 individuals are in the labor force, with 5.8% or 1,164 of them unemployed. The age group with the highest labor force participation rate is 45 to 54 years, with 69.7% or 4,551 individuals in the labor force. Within the labor force, the 16 to 19 years age range has the highest percentage of unemployed individuals, with 16.5% or 102 of them being unemployed.

| Age Bracket | In Labor Force | Unemployed |
| 16 to 19 Years | 620 (24.0%) | 102 (16.5%) |
| 20 to 24 Years | 2,027 (62.3%) | 253 (12.5%) |
| 25 to 29 Years | 2,190 (68.1%) | 136 (6.2%) |
| 30 to 34 Years | 1,905 (63.2%) | 120 (6.3%) |
| 35 to 44 Years | 3,969 (67.6%) | 258 (6.5%) |
| 45 to 54 Years | 4,551 (69.7%) | 141 (3.1%) |
| 55 to 59 Years | 1,656 (52.0%) | 25 (1.5%) |
| 60 to 64 Years | 1,737 (44.8%) | 43 (2.5%) |
| 65 to 74 Years | 1,213 (20.4%) | 82 (6.8%) |
| 75 Years and over | 200 (4.7%) | 0 (0.0%) |
| Total | 20,071 (48.1%) | 1,164 (5.8%) |
Employment Status by Educational Attainment in Columbus County
According to labor force statistics for Columbus County, 62.3% of individuals (16,008) out of the total population between 25 and 64 years of age (25,695) are in the labor force, with 4.5% or 720 of them being unemployed. The group with the highest labor force participation rate are those with the educational attainment of bachelor's degree or higher, with 80.2% or 2,947 individuals in the labor force. Within the labor force, individuals with less than high school education have the highest percentage of unemployment, with 9.2% or 152 of them being unemployed.

| Educational Attainment | In Labor Force | Unemployed |
| Less than High School | 1,657 (46.5%) | 328 (9.2%) |
| High School Diploma | 4,965 (53.5%) | 427 (4.6%) |
| College / Associate Degree | 6,442 (70.2%) | 413 (4.5%) |
| Bachelor's Degree or higher | 2,947 (80.2%) | 66 (1.8%) |
| Total | 16,008 (62.3%) | 1,156 (4.5%) |
Employment Occupations by Sex in Columbus County
Management, Business, Science and Arts Occupations
The most common Management, Business, Science and Arts occupations in Columbus County are Community & Social Service (2,248 | 11.9%), Management (1,592 | 8.4%), Education Instruction & Library (1,237 | 6.6%), Health Diagnosing & Treating (1,099 | 5.8%), and Health Technologists (684 | 3.6%).

Management, Business, Science and Arts Occupations by Sex
Within the Management, Business, Science and Arts occupations in Columbus County, the most male-oriented occupations are Architecture & Engineering (81.8%), Computers, Engineering & Science (75.1%), and Life, Physical & Social Science (75.0%), while the most female-oriented occupations are Legal Services & Support (89.3%), Health Diagnosing & Treating (85.9%), and Health Technologists (85.1%).

| Occupation | Male | Female |
| Management | 818 (51.4%) | 774 (48.6%) |
| Business & Financial | 119 (28.9%) | 292 (71.1%) |
| Computers, Engineering & Science | 369 (75.1%) | 122 (24.8%) |
| Computers & Mathematics | 147 (69.7%) | 64 (30.3%) |
| Architecture & Engineering | 144 (81.8%) | 32 (18.2%) |
| Life, Physical & Social Science | 78 (75.0%) | 26 (25.0%) |
| Community & Social Service | 536 (23.8%) | 1,712 (76.2%) |
| Education, Arts & Media | 114 (23.6%) | 368 (76.3%) |
| Legal Services & Support | 44 (10.6%) | 369 (89.3%) |
| Education Instruction & Library | 332 (26.8%) | 905 (73.2%) |
| Arts, Media & Entertainment | 46 (39.7%) | 70 (60.3%) |
| Health Diagnosing & Treating | 155 (14.1%) | 944 (85.9%) |
| Health Technologists | 102 (14.9%) | 582 (85.1%) |
| Total (Category) | 1,997 (34.2%) | 3,844 (65.8%) |
| Total (Overall) | 9,417 (49.9%) | 9,455 (50.1%) |
Services Occupations
The most common Services occupations in Columbus County are Food Preparation & Serving (1,319 | 7.0%), Cleaning & Maintenance (1,170 | 6.2%), Healthcare Support (819 | 4.3%), Security & Protection (483 | 2.6%), and Law Enforcement (323 | 1.7%).

Services Occupations by Sex
Within the Services occupations in Columbus County, the most male-oriented occupations are Law Enforcement (77.1%), Cleaning & Maintenance (68.4%), and Security & Protection (65.2%), while the most female-oriented occupations are Personal Care & Service (84.6%), Healthcare Support (78.5%), and Firefighting & Prevention (58.8%).

| Occupation | Male | Female |
| Healthcare Support | 176 (21.5%) | 643 (78.5%) |
| Security & Protection | 315 (65.2%) | 168 (34.8%) |
| Firefighting & Prevention | 66 (41.2%) | 94 (58.8%) |
| Law Enforcement | 249 (77.1%) | 74 (22.9%) |
| Food Preparation & Serving | 587 (44.5%) | 732 (55.5%) |
| Cleaning & Maintenance | 800 (68.4%) | 370 (31.6%) |
| Personal Care & Service | 48 (15.4%) | 264 (84.6%) |
| Total (Category) | 1,926 (46.9%) | 2,177 (53.1%) |
| Total (Overall) | 9,417 (49.9%) | 9,455 (50.1%) |
Sales and Office Occupations
The most common Sales and Office occupations in Columbus County are Sales & Related (1,948 | 10.3%), and Office & Administration (1,255 | 6.7%).

Sales and Office Occupations by Sex

| Occupation | Male | Female |
| Sales & Related | 884 (45.4%) | 1,064 (54.6%) |
| Office & Administration | 220 (17.5%) | 1,035 (82.5%) |
| Total (Category) | 1,104 (34.5%) | 2,099 (65.5%) |
| Total (Overall) | 9,417 (49.9%) | 9,455 (50.1%) |
Natural Resources, Construction and Maintenance Occupations
The most common Natural Resources, Construction and Maintenance occupations in Columbus County are Construction & Extraction (1,068 | 5.7%), Installation, Maintenance & Repair (856 | 4.5%), and Farming, Fishing & Forestry (391 | 2.1%).

Natural Resources, Construction and Maintenance Occupations by Sex

| Occupation | Male | Female |
| Farming, Fishing & Forestry | 210 (53.7%) | 181 (46.3%) |
| Construction & Extraction | 1,061 (99.3%) | 7 (0.7%) |
| Installation, Maintenance & Repair | 771 (90.1%) | 85 (9.9%) |
| Total (Category) | 2,042 (88.2%) | 273 (11.8%) |
| Total (Overall) | 9,417 (49.9%) | 9,455 (50.1%) |
Production, Transportation and Moving Occupations
The most common Production, Transportation and Moving occupations in Columbus County are Production (1,436 | 7.6%), Transportation (1,007 | 5.3%), and Material Moving (967 | 5.1%).

Production, Transportation and Moving Occupations by Sex

| Occupation | Male | Female |
| Production | 779 (54.2%) | 657 (45.8%) |
| Transportation | 857 (85.1%) | 150 (14.9%) |
| Material Moving | 712 (73.6%) | 255 (26.4%) |
| Total (Category) | 2,348 (68.9%) | 1,062 (31.1%) |
| Total (Overall) | 9,417 (49.9%) | 9,455 (50.1%) |
Employment Industries by Sex in Columbus County
Employment Industries in Columbus County
The major employment industries in Columbus County include Retail Trade (2,741 | 14.5%), Health Care & Social Assistance (2,337 | 12.4%), Manufacturing (2,175 | 11.5%), Accommodation & Food Services (1,828 | 9.7%), and Educational Services (1,692 | 9.0%).

Employment Industries by Sex in Columbus County
The Columbus County industries that see more men than women are Mining, Quarrying, & Extraction (100.0%), Construction (91.7%), and Arts, Entertainment & Recreation (86.8%), whereas the industries that tend to have a higher number of women are Finance & Insurance (85.2%), Health Care & Social Assistance (82.2%), and Educational Services (72.3%).

| Industry | Male | Female |
| Agriculture, Fishing & Hunting | 446 (62.5%) | 268 (37.5%) |
| Mining, Quarrying, & Extraction | 11 (100.0%) | 0 (0.0%) |
| Construction | 1,130 (91.7%) | 102 (8.3%) |
| Manufacturing | 1,398 (64.3%) | 777 (35.7%) |
| Wholesale Trade | 225 (79.8%) | 57 (20.2%) |
| Retail Trade | 1,320 (48.2%) | 1,421 (51.8%) |
| Transportation & Warehousing | 721 (86.5%) | 113 (13.6%) |
| Utilities | 205 (77.6%) | 59 (22.4%) |
| Information | 157 (43.5%) | 204 (56.5%) |
| Finance & Insurance | 110 (14.8%) | 631 (85.2%) |
| Real Estate, Rental & Leasing | 118 (31.2%) | 260 (68.8%) |
| Professional & Scientific | 167 (31.6%) | 362 (68.4%) |
| Enterprise Management | 0 (0.0%) | 0 (0.0%) |
| Administrative & Support | 691 (69.2%) | 307 (30.8%) |
| Educational Services | 468 (27.7%) | 1,224 (72.3%) |
| Health Care & Social Assistance | 415 (17.8%) | 1,922 (82.2%) |
| Arts, Entertainment & Recreation | 296 (86.8%) | 45 (13.2%) |
| Accommodation & Food Services | 899 (49.2%) | 929 (50.8%) |
| Public Administration | 320 (43.7%) | 412 (56.3%) |
| Total | 9,417 (49.9%) | 9,455 (50.1%) |
Education in Columbus County
School Enrollment in Columbus County
The most common levels of schooling among the 10,558 students in Columbus County are high school (2,660 | 25.2%), middle school (2,546 | 24.1%), and elementary school (2,273 | 21.5%).

| School Level | # Students | % Students |
| Nursery / Preschool | 393 | 3.7% |
| Kindergarten | 619 | 5.9% |
| Elementary School | 2,273 | 21.5% |
| Middle School | 2,546 | 24.1% |
| High School | 2,660 | 25.2% |
| College / Undergraduate | 1,755 | 16.6% |
| Graduate / Professional | 312 | 3.0% |
| Total | 10,558 | 100.0% |
School Enrollment by Age by Funding Source in Columbus County
Out of a total of 10,558 students who are enrolled in schools in Columbus County, 887 (8.4%) attend a private institution, while the remaining 9,671 (91.6%) are enrolled in public schools. The age group of 35 years and over has the highest likelihood of being enrolled in private schools, with 227 (34.7% in the age bracket) enrolled. Conversely, the age group of 18 to 19 year olds has the lowest likelihood of being enrolled in a private school, with 816 (100.0% in the age bracket) attending a public institution.

| Age Bracket | Public School | Private School |
| 3 to 4 Year Olds | 257 (78.1%) | 72 (21.9%) |
| 5 to 9 Year Old | 2,517 (93.5%) | 176 (6.5%) |
| 10 to 14 Year Olds | 2,628 (92.3%) | 219 (7.7%) |
| 15 to 17 Year Olds | 1,863 (95.2%) | 95 (4.9%) |
| 18 to 19 Year Olds | 816 (100.0%) | 0 (0.0%) |
| 20 to 24 Year Olds | 800 (92.2%) | 68 (7.8%) |
| 25 to 34 Year Olds | 367 (93.4%) | 26 (6.6%) |
| 35 Years and over | 427 (65.3%) | 227 (34.7%) |
| Total | 9,671 (91.6%) | 887 (8.4%) |
Educational Attainment by Field of Study in Columbus County
Education (1,244 | 23.0%), business (962 | 17.8%), science & technology (779 | 14.4%), arts & humanities (535 | 9.9%), and liberal arts & history (371 | 6.9%) are the most common fields of study among 5,410 individuals in Columbus County who have obtained a bachelor's degree or higher.

| Field of Study | # Graduates | % Graduates |
| Computers & Mathematics | 106 | 2.0% |
| Bio, Nature & Agricultural | 318 | 5.9% |
| Physical & Health Sciences | 147 | 2.7% |
| Psychology | 157 | 2.9% |
| Social Sciences | 234 | 4.3% |
| Engineering | 72 | 1.3% |
| Multidisciplinary Studies | 33 | 0.6% |
| Science & Technology | 779 | 14.4% |
| Business | 962 | 17.8% |
| Education | 1,244 | 23.0% |
| Literature & Languages | 204 | 3.8% |
| Liberal Arts & History | 371 | 6.9% |
| Visual & Performing Arts | 109 | 2.0% |
| Communications | 139 | 2.6% |
| Arts & Humanities | 535 | 9.9% |
| Total | 5,410 | 100.0% |
Transportation & Commute in Columbus County
Vehicle Availability by Sex in Columbus County
The most prevalent vehicle ownership categories in Columbus County are males with 2 vehicles (3,317, accounting for 36.1%) and females with 2 vehicles (3,183, making up 35.8%).

| Vehicles Available | Male | Female |
| No Vehicle | 183 (2.0%) | 116 (1.3%) |
| 1 Vehicle | 1,339 (14.6%) | 1,650 (17.8%) |
| 2 Vehicles | 3,317 (36.1%) | 3,183 (34.3%) |
| 3 Vehicles | 1,938 (21.1%) | 2,217 (23.9%) |
| 4 Vehicles | 1,525 (16.6%) | 1,499 (16.2%) |
| 5 or more Vehicles | 890 (9.7%) | 611 (6.6%) |
| Total | 9,192 (100.0%) | 9,276 (100.0%) |
Commute Time in Columbus County
The most frequently occuring commute durations in Columbus County are 30 to 34 minutes (2,624 commuters, 14.8%), 15 to 19 minutes (2,437 commuters, 13.8%), and 10 to 14 minutes (2,056 commuters, 11.6%).

| Commute Time | # Commuters | % Commuters |
| Less than 5 Minutes | 732 | 4.1% |
| 5 to 9 Minutes | 1,636 | 9.2% |
| 10 to 14 Minutes | 2,056 | 11.6% |
| 15 to 19 Minutes | 2,437 | 13.8% |
| 20 to 24 Minutes | 1,925 | 10.9% |
| 25 to 29 Minutes | 1,233 | 7.0% |
| 30 to 34 Minutes | 2,624 | 14.8% |
| 35 to 39 Minutes | 572 | 3.2% |
| 40 to 44 Minutes | 1,071 | 6.1% |
| 45 to 59 Minutes | 1,592 | 9.0% |
| 60 to 89 Minutes | 1,283 | 7.3% |
| 90 or more Minutes | 520 | 2.9% |
Commute Time by Sex in Columbus County
The most common commute times in Columbus County are 30 to 34 minutes (1,098 commuters, 12.4%) for males and 30 to 34 minutes (1,526 commuters, 17.2%) for females.

| Commute Time | Male | Female |
| Less than 5 Minutes | 353 (4.0%) | 379 (4.3%) |
| 5 to 9 Minutes | 735 (8.3%) | 901 (10.2%) |
| 10 to 14 Minutes | 966 (11.0%) | 1,090 (12.3%) |
| 15 to 19 Minutes | 1,042 (11.8%) | 1,395 (15.7%) |
| 20 to 24 Minutes | 707 (8.0%) | 1,218 (13.8%) |
| 25 to 29 Minutes | 806 (9.1%) | 427 (4.8%) |
| 30 to 34 Minutes | 1,098 (12.4%) | 1,526 (17.2%) |
| 35 to 39 Minutes | 306 (3.5%) | 266 (3.0%) |
| 40 to 44 Minutes | 816 (9.2%) | 255 (2.9%) |
| 45 to 59 Minutes | 690 (7.8%) | 902 (10.2%) |
| 60 to 89 Minutes | 894 (10.1%) | 389 (4.4%) |
| 90 or more Minutes | 407 (4.6%) | 113 (1.3%) |
Time of Departure to Work by Sex in Columbus County
The most frequent times of departure to work in Columbus County are 6:00 AM to 6:29 AM (1,242, 14.1%) for males and 8:00 AM to 8:29 AM (1,555, 17.5%) for females.

| Time of Departure | Male | Female |
| 12:00 AM to 4:59 AM | 701 (8.0%) | 559 (6.3%) |
| 5:00 AM to 5:29 AM | 742 (8.4%) | 146 (1.7%) |
| 5:30 AM to 5:59 AM | 635 (7.2%) | 305 (3.4%) |
| 6:00 AM to 6:29 AM | 1,242 (14.1%) | 320 (3.6%) |
| 6:30 AM to 6:59 AM | 846 (9.6%) | 644 (7.3%) |
| 7:00 AM to 7:29 AM | 1,064 (12.1%) | 1,390 (15.7%) |
| 7:30 AM to 7:59 AM | 935 (10.6%) | 1,473 (16.6%) |
| 8:00 AM to 8:29 AM | 782 (8.9%) | 1,555 (17.5%) |
| 8:30 AM to 8:59 AM | 459 (5.2%) | 379 (4.3%) |
| 9:00 AM to 9:59 AM | 262 (3.0%) | 407 (4.6%) |
| 10:00 AM to 10:59 AM | 171 (1.9%) | 132 (1.5%) |
| 11:00 AM to 11:59 AM | 77 (0.9%) | 78 (0.9%) |
| 12:00 PM to 3:59 PM | 390 (4.4%) | 932 (10.5%) |
| 4:00 PM to 11:59 PM | 514 (5.8%) | 541 (6.1%) |
| Total | 8,820 (100.0%) | 8,861 (100.0%) |
Housing Occupancy in Columbus County
Occupancy by Ownership in Columbus County
Of the total 19,185 dwellings in Columbus County, owner-occupied units account for 13,577 (70.8%), while renter-occupied units make up 5,608 (29.2%).

| Occupancy | # Housing Units | % Housing Units |
| Owner Occupied Housing Units | 13,577 | 70.8% |
| Renter-Occupied Housing Units | 5,608 | 29.2% |
| Total Occupied Housing Units | 19,185 | 100.0% |
Occupancy by Household Size in Columbus County

| Household Size | # Housing Units | % Housing Units |
| 1-Person Household | 6,245 | 32.6% |
| 2-Person Household | 6,754 | 35.2% |
| 3-Person Household | 3,129 | 16.3% |
| 4+ Person Household | 3,057 | 15.9% |
| Total Housing Units | 19,185 | 100.0% |
Occupancy by Ownership by Household Size in Columbus County

| Household Size | Owner-occupied | Renter-occupied |
| 1-Person Household | 4,081 (65.3%) | 2,164 (34.6%) |
| 2-Person Household | 5,168 (76.5%) | 1,586 (23.5%) |
| 3-Person Household | 2,234 (71.4%) | 895 (28.6%) |
| 4+ Person Household | 2,094 (68.5%) | 963 (31.5%) |
| Total Housing Units | 13,577 (70.8%) | 5,608 (29.2%) |
Occupancy by Educational Attainment in Columbus County

| Household Size | Owner-occupied | Renter-occupied |
| Less than High School | 1,447 (55.0%) | 1,182 (45.0%) |
| High School Diploma | 4,585 (71.5%) | 1,825 (28.5%) |
| College/Associate Degree | 5,014 (69.3%) | 2,221 (30.7%) |
| Bachelor's Degree or higher | 2,531 (87.0%) | 380 (13.1%) |
Occupancy by Age of Householder in Columbus County

| Age Bracket | # Households | % Households |
| Under 35 Years | 2,743 | 14.3% |
| 35 to 44 Years | 2,513 | 13.1% |
| 45 to 54 Years | 3,155 | 16.5% |
| 55 to 64 Years | 3,926 | 20.5% |
| 65 to 74 Years | 3,960 | 20.6% |
| 75 to 84 Years | 2,091 | 10.9% |
| 85 Years and Over | 797 | 4.2% |
| Total | 19,185 | 100.0% |
Housing Finances in Columbus County
Median Income by Occupancy in Columbus County

| Occupancy Type | # Households | Median Income |
| Owner-Occupied | 13,577 (70.8%) | $53,368 |
| Renter-Occupied | 5,608 (29.2%) | $27,350 |
| Average | 19,185 (100.0%) | $43,206 |
Occupancy by Householder Income Bracket in Columbus County

| Income Bracket | Owner-occupied | Renter-occupied |
| Less than $5,000 | 509 (3.7%) | 729 (13.0%) |
| $5,000 to $9,999 | 311 (2.3%) | 167 (3.0%) |
| $10,000 to $14,999 | 793 (5.8%) | 667 (11.9%) |
| $15,000 to $19,999 | 599 (4.4%) | 427 (7.6%) |
| $20,000 to $24,999 | 975 (7.2%) | 594 (10.6%) |
| $25,000 to $34,999 | 1,605 (11.8%) | 922 (16.4%) |
| $35,000 to $49,999 | 1,575 (11.6%) | 707 (12.6%) |
| $50,000 to $74,999 | 2,492 (18.3%) | 674 (12.0%) |
| $75,000 to $99,999 | 1,929 (14.2%) | 415 (7.4%) |
| $100,000 to $149,999 | 1,534 (11.3%) | 176 (3.1%) |
| $150,000 or more | 1,255 (9.2%) | 130 (2.3%) |
| Total | 13,577 (100.0%) | 5,608 (100.0%) |
Monthly Housing Cost Tiers in Columbus County

| Monthly Cost | Owner-occupied | Renter-occupied |
| Less than $300 | 1,287 (9.5%) | 147 (2.6%) |
| $300 to $499 | 3,745 (27.6%) | 351 (6.3%) |
| $500 to $799 | 2,889 (21.3%) | 2,141 (38.2%) |
| $800 to $999 | 1,545 (11.4%) | 1,067 (19.0%) |
| $1,000 to $1,499 | 2,685 (19.8%) | 616 (11.0%) |
| $1,500 to $1,999 | 803 (5.9%) | 37 (0.7%) |
| $2,000 to $2,499 | 290 (2.1%) | 0 (0.0%) |
| $2,500 to $2,999 | 169 (1.2%) | 0 (0.0%) |
| $3,000 or more | 164 (1.2%) | 0 (0.0%) |
| Total | 13,577 (100.0%) | 5,608 (100.0%) |
Physical Housing Characteristics in Columbus County
Housing Structures in Columbus County

| Structure Type | # Housing Units | % Housing Units |
| Single Unit, Detached | 11,679 | 60.9% |
| Single Unit, Attached | 111 | 0.6% |
| 2 Unit Apartments | 201 | 1.1% |
| 3 or 4 Unit Apartments | 483 | 2.5% |
| 5 to 9 Unit Apartments | 438 | 2.3% |
| 10 or more Apartments | 289 | 1.5% |
| Mobile Home / Other | 5,984 | 31.2% |
| Total | 19,185 | 100.0% |
Housing Structures by Occupancy in Columbus County

| Structure Type | Owner-occupied | Renter-occupied |
| Single Unit, Detached | 9,143 (78.3%) | 2,536 (21.7%) |
| Single Unit, Attached | 33 (29.7%) | 78 (70.3%) |
| 2 Unit Apartments | 7 (3.5%) | 194 (96.5%) |
| 3 or 4 Unit Apartments | 14 (2.9%) | 469 (97.1%) |
| 5 to 9 Unit Apartments | 0 (0.0%) | 438 (100.0%) |
| 10 or more Apartments | 0 (0.0%) | 289 (100.0%) |
| Mobile Home / Other | 4,380 (73.2%) | 1,604 (26.8%) |
| Total | 13,577 (70.8%) | 5,608 (29.2%) |
Housing Structures by Number of Rooms in Columbus County

| Number of Rooms | Owner-occupied | Renter-occupied |
| 1 Room | 54 (0.4%) | 26 (0.5%) |
| 2 or 3 Rooms | 593 (4.4%) | 805 (14.3%) |
| 4 or 5 Rooms | 4,732 (34.8%) | 2,978 (53.1%) |
| 6 or 7 Rooms | 5,361 (39.5%) | 1,317 (23.5%) |
| 8 or more Rooms | 2,837 (20.9%) | 482 (8.6%) |
| Total | 13,577 (100.0%) | 5,608 (100.0%) |
Housing Structure by Heating Type in Columbus County

| Heating Type | Owner-occupied | Renter-occupied |
| Utility Gas | 294 (2.2%) | 206 (3.7%) |
| Bottled, Tank, or LP Gas | 3,066 (22.6%) | 699 (12.5%) |
| Electricity | 9,615 (70.8%) | 4,555 (81.2%) |
| Fuel Oil or Kerosene | 345 (2.5%) | 88 (1.6%) |
| Coal or Coke | 0 (0.0%) | 0 (0.0%) |
| All other Fuels | 213 (1.6%) | 46 (0.8%) |
| No Fuel Used | 44 (0.3%) | 14 (0.3%) |
| Total | 13,577 (100.0%) | 5,608 (100.0%) |
Household Vehicle Usage in Columbus County

| Vehicles per Household | Owner-occupied | Renter-occupied |
| No Vehicle | 497 (3.7%) | 688 (12.3%) |
| 1 Vehicle | 3,553 (26.2%) | 2,475 (44.1%) |
| 2 Vehicles | 4,461 (32.9%) | 1,813 (32.3%) |
| 3 or more Vehicles | 5,066 (37.3%) | 632 (11.3%) |
| Total | 13,577 (100.0%) | 5,608 (100.0%) |
Real Estate & Mortgages in Columbus County
Real Estate and Mortgage Overview in Columbus County
| Characteristic | Without Mortgage | With Mortgage |
| Housing Units | 8,016 | 5,561 |
| Median Property Value | $103,000 | $139,400 |
| Median Household Income | $41,450 | $821 |
| Monthly Housing Costs | $447 | $149 |
| Real Estate Taxes | $951 | $60 |
Property Value by Mortgage Status in Columbus County

| Property Value | Without Mortgage | With Mortgage |
| Less than $50,000 | 2,070 (25.8%) | 229 (4.1%) |
| $50,000 to $99,999 | 1,854 (23.1%) | 1,464 (26.3%) |
| $100,000 to $299,999 | 3,508 (43.8%) | 3,233 (58.1%) |
| $300,000 to $499,999 | 422 (5.3%) | 463 (8.3%) |
| $500,000 to $749,999 | 136 (1.7%) | 125 (2.2%) |
| $750,000 to $999,999 | 17 (0.2%) | 29 (0.5%) |
| $1,000,000 or more | 9 (0.1%) | 18 (0.3%) |
| Total | 8,016 (100.0%) | 5,561 (100.0%) |
Household Income by Mortgage Status in Columbus County

| Household Income | Without Mortgage | With Mortgage |
| Less than $10,000 | 673 (8.4%) | 103 (1.8%) |
| $10,000 to $24,999 | 1,762 (22.0%) | 147 (2.6%) |
| $25,000 to $34,999 | 1,059 (13.2%) | 605 (10.9%) |
| $35,000 to $49,999 | 1,046 (13.1%) | 546 (9.8%) |
| $50,000 to $74,999 | 1,134 (14.1%) | 529 (9.5%) |
| $75,000 to $99,999 | 1,186 (14.8%) | 1,358 (24.4%) |
| $100,000 to $149,999 | 722 (9.0%) | 743 (13.4%) |
| $150,000 or more | 434 (5.4%) | 812 (14.6%) |
| Total | 8,016 (100.0%) | 5,561 (100.0%) |
Property Value to Household Income Ratio in Columbus County

| Value-to-Income Ratio | Without Mortgage | With Mortgage |
| Less than 2.0x | 3,359 (41.9%) | 65,730 (1,182.0%) |
| 2.0x to 2.9x | 1,253 (15.6%) | 2,548 (45.8%) |
| 3.0x to 3.9x | 664 (8.3%) | 1,064 (19.1%) |
| 4.0x or more | 2,548 (31.8%) | 611 (11.0%) |
| Total | 8,016 (100.0%) | 5,561 (100.0%) |
Real Estate Taxes by Mortgage Status in Columbus County

| Property Taxes | Without Mortgage | With Mortgage |
| Less than $800 | 3,185 (39.7%) | 13 (0.2%) |
| $800 to $1,499 | 2,400 (29.9%) | 1,209 (21.7%) |
| $800 to $1,499 | 1,959 (24.4%) | 2,117 (38.1%) |
| Total | 8,016 (100.0%) | 5,561 (100.0%) |
Health & Disability in Columbus County
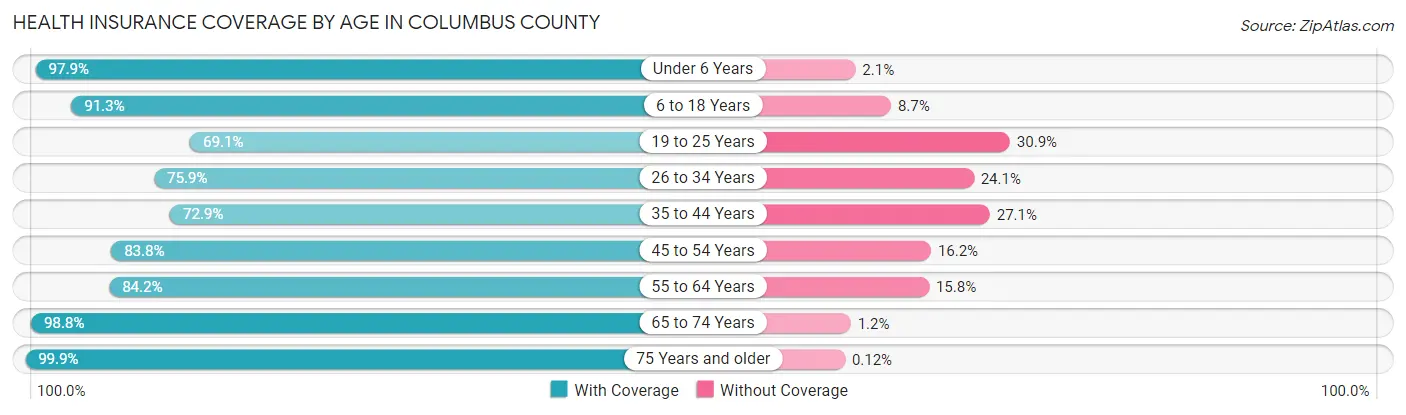
Health Insurance Coverage by Age in Columbus County
| Age Bracket | With Coverage | Without Coverage |
| Under 6 Years | 3,115 (97.9%) | 66 (2.1%) |
| 6 to 18 Years | 7,084 (91.3%) | 676 (8.7%) |
| 19 to 25 Years | 2,979 (69.1%) | 1,331 (30.9%) |
| 26 to 34 Years | 3,702 (75.9%) | 1,178 (24.1%) |
| 35 to 44 Years | 3,899 (72.9%) | 1,452 (27.1%) |
| 45 to 54 Years | 5,105 (83.8%) | 984 (16.2%) |
| 55 to 64 Years | 5,711 (84.2%) | 1,071 (15.8%) |
| 65 to 74 Years | 5,741 (98.8%) | 70 (1.2%) |
| 75 Years and older | 4,059 (99.9%) | 5 (0.1%) |
| Total | 41,395 (85.8%) | 6,833 (14.2%) |
Health Insurance Coverage by Citizenship Status in Columbus County

| Citizenship Status | With Coverage | Without Coverage |
| Native Born | 3,115 (97.9%) | 66 (2.1%) |
| Foreign Born, Citizen | 7,084 (91.3%) | 676 (8.7%) |
| Foreign Born, not a Citizen | 2,979 (69.1%) | 1,331 (30.9%) |
Health Insurance Coverage by Household Income in Columbus County

| Household Income | With Coverage | Without Coverage |
| Under $25,000 | 8,984 (85.8%) | 1,489 (14.2%) |
| $25,000 to $49,999 | 9,589 (83.6%) | 1,882 (16.4%) |
| $50,000 to $74,999 | 7,918 (83.0%) | 1,624 (17.0%) |
| $75,000 to $99,999 | 5,609 (89.6%) | 653 (10.4%) |
| $100,000 and over | 9,207 (88.8%) | 1,158 (11.2%) |
Public vs Private Health Insurance Coverage by Age in Columbus County

| Age Bracket | Public Insurance | Private Insurance |
| Under 6 | 2,193 (68.9%) | 1,056 (33.2%) |
| 6 to 18 Years | 4,370 (56.3%) | 3,053 (39.3%) |
| 19 to 25 Years | 1,293 (30.0%) | 1,844 (42.8%) |
| 25 to 34 Years | 1,250 (25.6%) | 2,683 (55.0%) |
| 35 to 44 Years | 1,232 (23.0%) | 2,857 (53.4%) |
| 45 to 54 Years | 1,016 (16.7%) | 4,366 (71.7%) |
| 55 to 64 Years | 2,259 (33.3%) | 3,937 (58.1%) |
| 65 to 74 Years | 5,613 (96.6%) | 2,986 (51.4%) |
| 75 Years and over | 4,032 (99.2%) | 2,266 (55.8%) |
| Total | 23,258 (48.2%) | 25,048 (51.9%) |
Disability Status by Sex by Age in Columbus County

| Age Bracket | Male | Female |
| Under 5 Years | 0 (0.0%) | 0 (0.0%) |
| 5 to 17 Years | 318 (8.1%) | 154 (3.9%) |
| 18 to 34 Years | 449 (9.0%) | 337 (7.2%) |
| 35 to 64 Years | 1,822 (21.2%) | 1,568 (16.3%) |
| 65 to 74 Years | 879 (32.6%) | 981 (31.5%) |
| 75 Years and over | 818 (50.3%) | 1,093 (44.8%) |
Disability Class by Sex by Age in Columbus County
Disability Class: Hearing Difficulty

| Age Bracket | Male | Female |
| Under 5 Years | 0 (0.0%) | 0 (0.0%) |
| 5 to 17 Years | 0 (0.0%) | 20 (0.5%) |
| 18 to 34 Years | 5 (0.1%) | 63 (1.3%) |
| 35 to 64 Years | 444 (5.2%) | 149 (1.5%) |
| 65 to 74 Years | 336 (12.5%) | 139 (4.5%) |
| 75 Years and over | 323 (19.9%) | 358 (14.7%) |
Disability Class: Vision Difficulty

| Age Bracket | Male | Female |
| Under 5 Years | 0 (0.0%) | 0 (0.0%) |
| 5 to 17 Years | 110 (2.8%) | 66 (1.7%) |
| 18 to 34 Years | 140 (2.8%) | 100 (2.1%) |
| 35 to 64 Years | 308 (3.6%) | 143 (1.5%) |
| 65 to 74 Years | 165 (6.1%) | 210 (6.7%) |
| 75 Years and over | 59 (3.6%) | 175 (7.2%) |
Disability Class: Cognitive Difficulty

| Age Bracket | Male | Female |
| 5 to 17 Years | 276 (7.0%) | 137 (3.5%) |
| 18 to 34 Years | 291 (5.8%) | 194 (4.1%) |
| 35 to 64 Years | 764 (8.9%) | 644 (6.7%) |
| 65 to 74 Years | 111 (4.1%) | 147 (4.7%) |
| 75 Years and over | 102 (6.3%) | 216 (8.9%) |
Disability Class: Ambulatory Difficulty

| Age Bracket | Male | Female |
| 5 to 17 Years | 0 (0.0%) | 20 (0.5%) |
| 18 to 34 Years | 89 (1.8%) | 45 (1.0%) |
| 35 to 64 Years | 1,029 (11.9%) | 1,069 (11.1%) |
| 65 to 74 Years | 621 (23.0%) | 743 (23.8%) |
| 75 Years and over | 558 (34.3%) | 733 (30.1%) |
Disability Class: Self-Care Difficulty

| Age Bracket | Male | Female |
| 5 to 17 Years | 14 (0.4%) | 77 (2.0%) |
| 18 to 34 Years | 119 (2.4%) | 36 (0.8%) |
| 35 to 64 Years | 495 (5.8%) | 256 (2.7%) |
| 65 to 74 Years | 191 (7.1%) | 130 (4.2%) |
| 75 Years and over | 230 (14.1%) | 136 (5.6%) |
Technology Access in Columbus County
Computing Device Access in Columbus County

| Device Type | # Households | % Households |
| Desktop or Laptop | 11,335 | 59.1% |
| Smartphone | 15,231 | 79.4% |
| Tablet | 8,901 | 46.4% |
| No Computing Device | 2,419 | 12.6% |
| Total | 19,185 | 100.0% |
Internet Access in Columbus County

| Internet Type | # Households | % Households |
| Dial-Up Internet | 78 | 0.4% |
| Broadband Home | 10,090 | 52.6% |
| Cellular Data Only | 3,885 | 20.3% |
| Satellite Internet | 1,177 | 6.1% |
| No Internet | 4,359 | 22.7% |
| Total | 19,185 | 100.0% |
Columbus County Summary
Columbus County is located in the southeastern corner of North Carolina, and is bordered by Bladen County to the north, Robeson County to the west, and Brunswick and Horry Counties in South Carolina to the south. The county seat is Whiteville, and the county is home to a population of 58,098 people, according to the 2020 U.S. Census.
History
The area that is now Columbus County was originally inhabited by the Tuscarora and Lumbee Native American tribes. The first European settlers arrived in the area in the late 1700s, and the county was officially established in 1808. The county was named for Christopher Columbus, the Italian explorer who is credited with discovering the New World.
During the Civil War, Columbus County was a major producer of cotton and other agricultural products. After the war, the county experienced a period of economic growth, with the development of the railroad and the lumber industry. The county also became a major center for the production of turpentine and naval stores.
Geography
Columbus County is located in the Coastal Plain region of North Carolina, and is characterized by flat terrain and sandy soils. The county is drained by the Lumber River, which flows through the county from north to south. The county is also home to several lakes, including Lake Waccamaw, which is the largest natural lake in the state.
The county is located within the humid subtropical climate zone, and experiences hot, humid summers and mild winters. The average annual temperature is around 70 degrees Fahrenheit, and the average annual precipitation is around 50 inches.
Economy
The economy of Columbus County is largely based on agriculture and manufacturing. The county is home to several large farms, which produce a variety of crops, including cotton, soybeans, corn, and tobacco. The county is also home to several manufacturing companies, which produce a variety of products, including furniture, textiles, and paper products.
The county is also home to several tourist attractions, including the Lake Waccamaw State Park, the Whiteville Historic District, and the North Carolina Museum of Natural Sciences.
Demographics
According to the 2020 U.S. Census, the population of Columbus County is 58,098, with a population density of 79.3 people per square mile. The median household income is $41,945, and the median age is 38.7 years.
The racial makeup of the county is 63.3% White, 28.2% Black or African American, 0.4% Native American, 0.7% Asian, 0.1% Pacific Islander, 5.2% from other races, and 2.1% from two or more races. The largest ancestry groups in the county are English (25.3%), African American (20.2%), and German (14.2%).
The population of Columbus County is predominantly Christian, with the largest denominations being Baptist (37.2%), Methodist (14.2%), and Presbyterian (7.2%). The county is also home to a small Jewish population (0.2%).
Conclusion
Columbus County is a rural county located in the southeastern corner of North Carolina. The county is home to a population of 58,098 people, and is largely based on agriculture and manufacturing. The county is also home to several tourist attractions, and is predominantly Christian.
Common Questions
What is the Total Population of Columbus County?
Total Population of Columbus County is 50,827.
What is the Total Male Population of Columbus County?
Total Male Population of Columbus County is 25,276.
What is the Total Female Population of Columbus County?
Total Female Population of Columbus County is 25,551.
What is the Ratio of Males per 100 Females in Columbus County?
There are 98.92 Males per 100 Females in Columbus County.
What is the Ratio of Females per 100 Males in Columbus County?
There are 101.09 Females per 100 Males in Columbus County.
What is the Median Population Age in Columbus County?
Median Population Age in Columbus County is 41.8 Years.
What is the Average Family Size in Columbus County
Average Family Size in Columbus County is 3.2 People.
What is the Average Household Size in Columbus County
Average Household Size in Columbus County is 2.5 People.
What is Per Capita Income in Columbus County?
Per Capita income in Columbus County is $24,236.
What is the Median Family Income in Columbus County?
Median Family Income in Columbus County is $55,941.
What is the Median Household income in Columbus County?
Median Household Income in Columbus County is $43,206.
What is Income or Wage Gap in Columbus County?
Income or Wage Gap in Columbus County is 7.2%.
Women in Columbus County earn 92.8 cents for every dollar earned by a man.
What is Family Income Deficit in Columbus County?
Family Income Deficit in Columbus County is $10,586.
Families that are below poverty line in Columbus County earn $10,586 less on average than the poverty threshold level.
What is Inequality or Gini Index in Columbus County?
Inequality or Gini Index in Columbus County is 0.47.
How Large is the Labor Force in Columbus County?
There are 20,071 People in the Labor Forcein in Columbus County.
What is the Percentage of People in the Labor Force in Columbus County?
48.1% of People are in the Labor Force in Columbus County.
What is the Unemployment Rate in Columbus County?
Unemployment Rate in Columbus County is 5.8%.