Cleveland County, NC
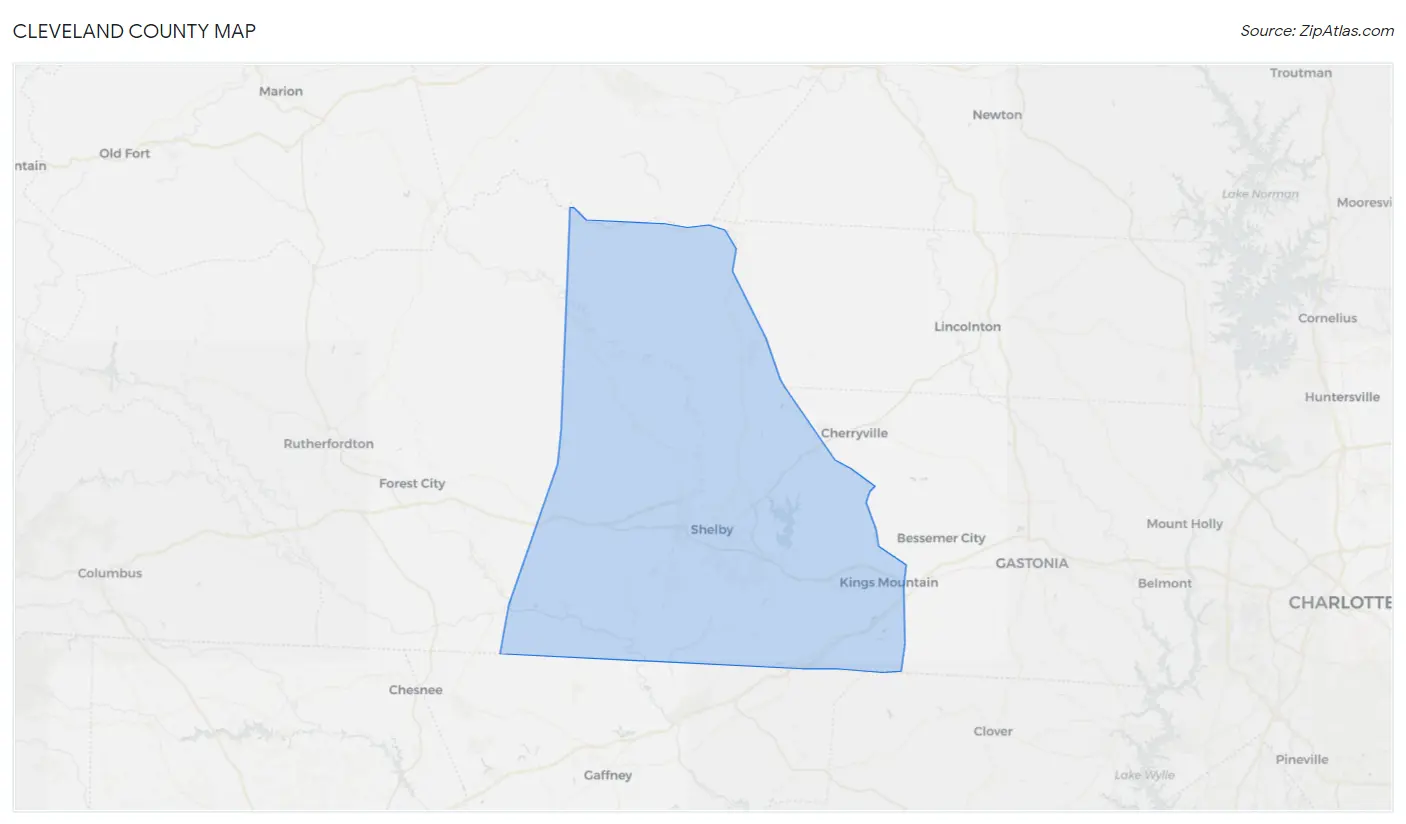
Cleveland County Map
Cleveland County Overview
99,527
TOTAL POPULATION
48,106
MALE POPULATION
51,421
FEMALE POPULATION
93.55
MALES / 100 FEMALES
106.89
FEMALES / 100 MALES
41.4
MEDIAN AGE
3.3
AVG FAMILY SIZE
2.7
AVG HOUSEHOLD SIZE
$27,522
PER CAPITA INCOME
$64,112
AVG FAMILY INCOME
$50,723
AVG HOUSEHOLD INCOME
23.8%
WAGE / INCOME GAP [ % ]
76.2¢/ $1
WAGE / INCOME GAP [ $ ]
$11,646
FAMILY INCOME DEFICIT
0.46
INEQUALITY / GINI INDEX
46,387
LABOR FORCE [ PEOPLE ]
57.9%
PERCENT IN LABOR FORCE
6.4%
UNEMPLOYMENT RATE
Race in Cleveland County
The most populous races in Cleveland County are White / Caucasian (72,559 | 72.9%), Black / African American (20,110 | 20.2%), and Hispanic or Latino (4,113 | 4.1%).
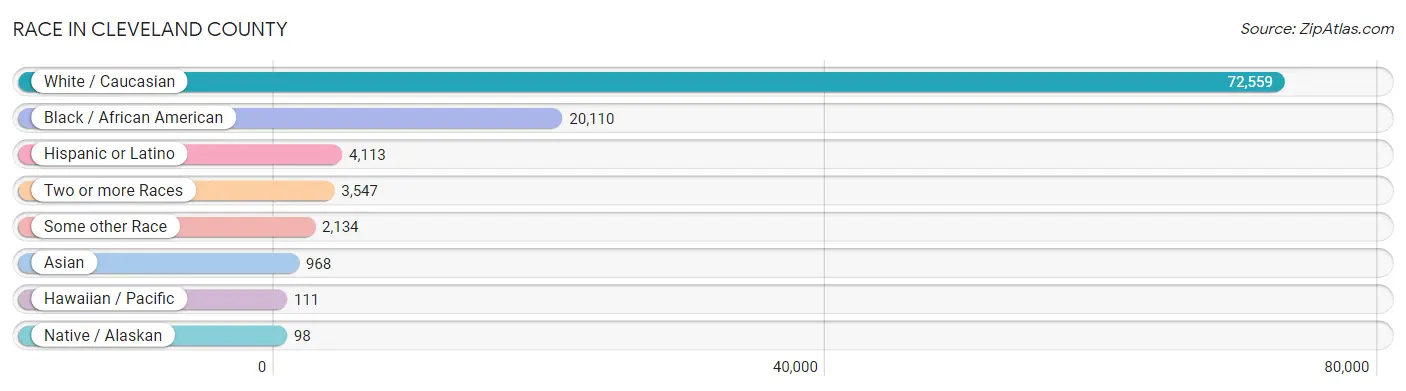
| Race | # Population | % Population |
| Asian | 968 | 1.0% |
| Black / African American | 20,110 | 20.2% |
| Hawaiian / Pacific | 111 | 0.1% |
| Hispanic or Latino | 4,113 | 4.1% |
| Native / Alaskan | 98 | 0.1% |
| White / Caucasian | 72,559 | 72.9% |
| Two or more Races | 3,547 | 3.6% |
| Some other Race | 2,134 | 2.1% |
| Total | 99,527 | 100.0% |
Ancestry in Cleveland County
The most populous ancestries reported in Cleveland County are American (26,464 | 26.6%), English (9,061 | 9.1%), German (7,715 | 7.7%), Irish (6,389 | 6.4%), and Mexican (3,019 | 3.0%), together accounting for 52.9% of all Cleveland County residents.
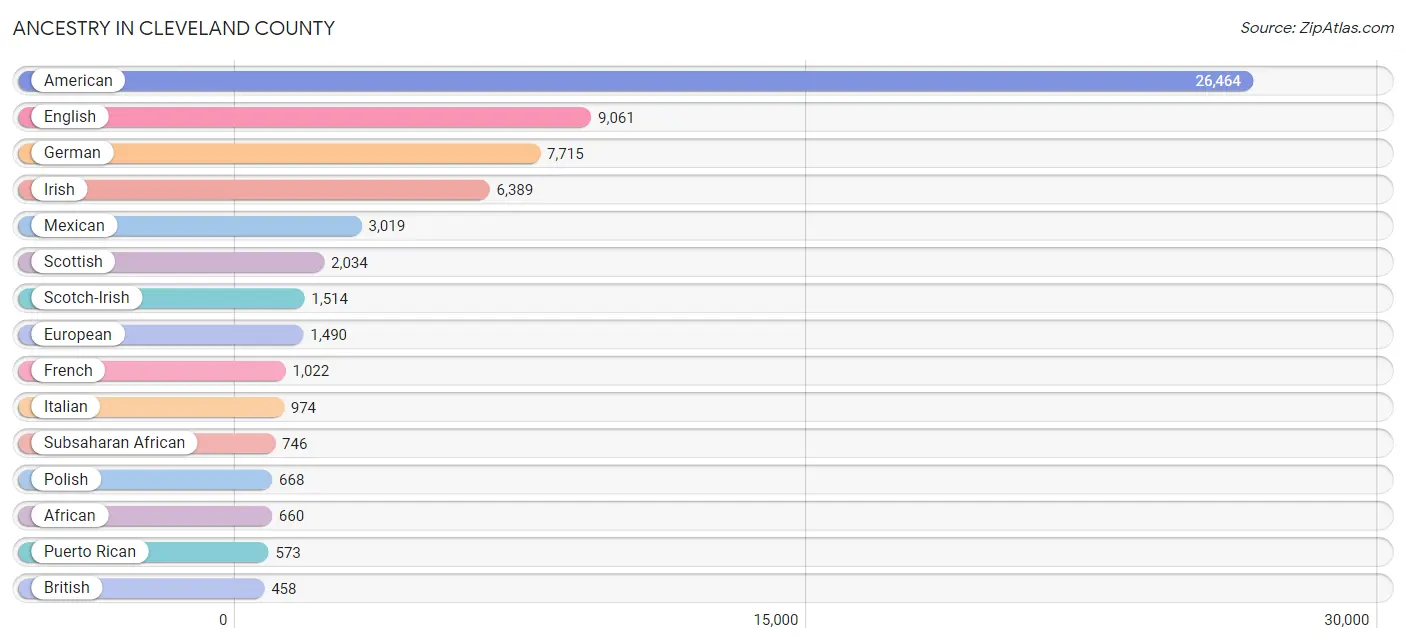
| Ancestry | # Population | % Population |
| African | 660 | 0.7% |
| Albanian | 57 | 0.1% |
| American | 26,464 | 26.6% |
| Apache | 10 | 0.0% |
| Australian | 42 | 0.0% |
| Austrian | 100 | 0.1% |
| Belgian | 83 | 0.1% |
| Bhutanese | 98 | 0.1% |
| Blackfeet | 15 | 0.0% |
| British | 458 | 0.5% |
| Burmese | 74 | 0.1% |
| Canadian | 29 | 0.0% |
| Central American | 118 | 0.1% |
| Cherokee | 306 | 0.3% |
| Chickasaw | 7 | 0.0% |
| Colombian | 67 | 0.1% |
| Comanche | 9 | 0.0% |
| Creek | 23 | 0.0% |
| Croatian | 11 | 0.0% |
| Cuban | 180 | 0.2% |
| Czech | 37 | 0.0% |
| Czechoslovakian | 22 | 0.0% |
| Danish | 23 | 0.0% |
| Dutch | 286 | 0.3% |
| Eastern European | 14 | 0.0% |
| Ecuadorian | 21 | 0.0% |
| English | 9,061 | 9.1% |
| European | 1,490 | 1.5% |
| French | 1,022 | 1.0% |
| French American Indian | 74 | 0.1% |
| French Canadian | 218 | 0.2% |
| German | 7,715 | 7.7% |
| Greek | 120 | 0.1% |
| Honduran | 17 | 0.0% |
| Hungarian | 110 | 0.1% |
| Indian (Asian) | 164 | 0.2% |
| Indonesian | 5 | 0.0% |
| Irish | 6,389 | 6.4% |
| Italian | 974 | 1.0% |
| Jamaican | 20 | 0.0% |
| Korean | 90 | 0.1% |
| Laotian | 48 | 0.1% |
| Lithuanian | 48 | 0.1% |
| Lumbee | 1 | 0.0% |
| Malaysian | 370 | 0.4% |
| Mexican | 3,019 | 3.0% |
| Mexican American Indian | 25 | 0.0% |
| Native Hawaiian | 77 | 0.1% |
| Nigerian | 86 | 0.1% |
| Northern European | 7 | 0.0% |
| Norwegian | 28 | 0.0% |
| Pakistani | 30 | 0.0% |
| Panamanian | 12 | 0.0% |
| Pennsylvania German | 9 | 0.0% |
| Polish | 668 | 0.7% |
| Portuguese | 150 | 0.2% |
| Puerto Rican | 573 | 0.6% |
| Romanian | 46 | 0.1% |
| Russian | 106 | 0.1% |
| Salvadoran | 89 | 0.1% |
| Samoan | 4 | 0.0% |
| Scandinavian | 323 | 0.3% |
| Scotch-Irish | 1,514 | 1.5% |
| Scottish | 2,034 | 2.0% |
| Seminole | 2 | 0.0% |
| Slavic | 10 | 0.0% |
| Slovak | 7 | 0.0% |
| South American | 123 | 0.1% |
| Spaniard | 8 | 0.0% |
| Spanish | 11 | 0.0% |
| Sri Lankan | 24 | 0.0% |
| Subsaharan African | 746 | 0.7% |
| Swedish | 367 | 0.4% |
| Swiss | 111 | 0.1% |
| Thai | 113 | 0.1% |
| Trinidadian and Tobagonian | 14 | 0.0% |
| Ukrainian | 39 | 0.0% |
| Venezuelan | 35 | 0.0% |
| Welsh | 335 | 0.3% |
| West Indian | 14 | 0.0% | View All 80 Rows |
Immigrants in Cleveland County
The most numerous immigrant groups reported in Cleveland County came from Latin America (1,394 | 1.4%), Central America (1,118 | 1.1%), Mexico (1,098 | 1.1%), Asia (746 | 0.7%), and South Eastern Asia (431 | 0.4%), together accounting for 4.8% of all Cleveland County residents.

| Immigration Origin | # Population | % Population |
| Africa | 21 | 0.0% |
| Asia | 746 | 0.7% |
| Belarus | 44 | 0.0% |
| Belgium | 5 | 0.0% |
| Brazil | 54 | 0.1% |
| Cameroon | 5 | 0.0% |
| Canada | 84 | 0.1% |
| Caribbean | 182 | 0.2% |
| Central America | 1,118 | 1.1% |
| China | 57 | 0.1% |
| Colombia | 21 | 0.0% |
| Cuba | 168 | 0.2% |
| Denmark | 10 | 0.0% |
| Eastern Asia | 88 | 0.1% |
| Eastern Europe | 130 | 0.1% |
| Ecuador | 10 | 0.0% |
| El Salvador | 7 | 0.0% |
| England | 34 | 0.0% |
| Europe | 256 | 0.3% |
| France | 17 | 0.0% |
| Germany | 37 | 0.0% |
| Honduras | 1 | 0.0% |
| Hong Kong | 14 | 0.0% |
| India | 151 | 0.2% |
| Indonesia | 40 | 0.0% |
| Japan | 31 | 0.0% |
| Laos | 243 | 0.2% |
| Latin America | 1,394 | 1.4% |
| Malaysia | 34 | 0.0% |
| Mexico | 1,098 | 1.1% |
| Middle Africa | 5 | 0.0% |
| Northern Europe | 52 | 0.1% |
| Pakistan | 76 | 0.1% |
| Panama | 12 | 0.0% |
| Philippines | 72 | 0.1% |
| Poland | 34 | 0.0% |
| Romania | 4 | 0.0% |
| Russia | 39 | 0.0% |
| Senegal | 16 | 0.0% |
| South America | 94 | 0.1% |
| South Central Asia | 227 | 0.2% |
| South Eastern Asia | 431 | 0.4% |
| Southern Europe | 7 | 0.0% |
| Spain | 7 | 0.0% |
| Switzerland | 8 | 0.0% |
| Thailand | 31 | 0.0% |
| Trinidad and Tobago | 14 | 0.0% |
| Ukraine | 9 | 0.0% |
| Vietnam | 11 | 0.0% |
| Western Africa | 16 | 0.0% |
| Western Europe | 67 | 0.1% | View All 51 Rows |
Sex and Age in Cleveland County
Sex and Age in Cleveland County
The most populous age groups in Cleveland County are 55 to 59 Years (3,663 | 7.6%) for men and 60 to 64 Years (3,701 | 7.2%) for women.
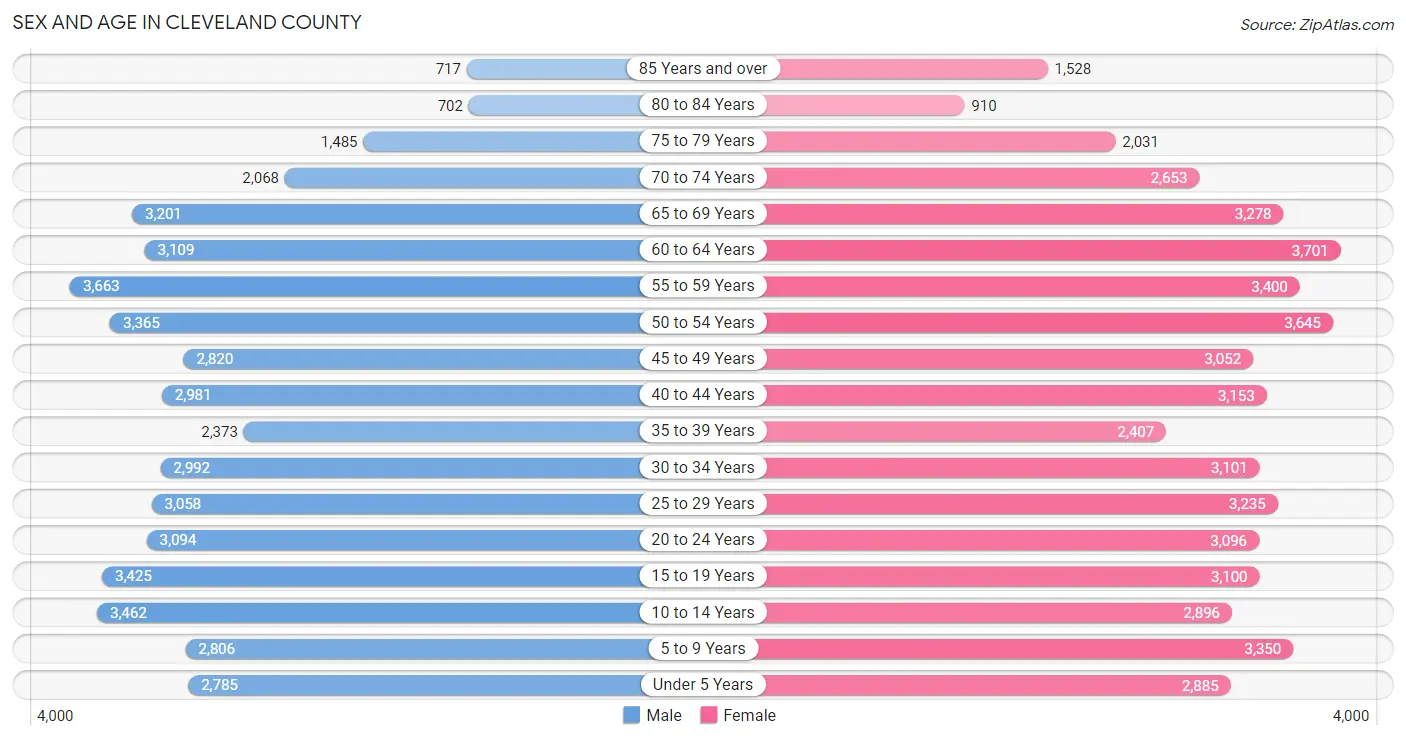
| Age Bracket | Male | Female |
| Under 5 Years | 2,785 (5.8%) | 2,885 (5.6%) |
| 5 to 9 Years | 2,806 (5.8%) | 3,350 (6.5%) |
| 10 to 14 Years | 3,462 (7.2%) | 2,896 (5.6%) |
| 15 to 19 Years | 3,425 (7.1%) | 3,100 (6.0%) |
| 20 to 24 Years | 3,094 (6.4%) | 3,096 (6.0%) |
| 25 to 29 Years | 3,058 (6.4%) | 3,235 (6.3%) |
| 30 to 34 Years | 2,992 (6.2%) | 3,101 (6.0%) |
| 35 to 39 Years | 2,373 (4.9%) | 2,407 (4.7%) |
| 40 to 44 Years | 2,981 (6.2%) | 3,153 (6.1%) |
| 45 to 49 Years | 2,820 (5.9%) | 3,052 (5.9%) |
| 50 to 54 Years | 3,365 (7.0%) | 3,645 (7.1%) |
| 55 to 59 Years | 3,663 (7.6%) | 3,400 (6.6%) |
| 60 to 64 Years | 3,109 (6.5%) | 3,701 (7.2%) |
| 65 to 69 Years | 3,201 (6.7%) | 3,278 (6.4%) |
| 70 to 74 Years | 2,068 (4.3%) | 2,653 (5.2%) |
| 75 to 79 Years | 1,485 (3.1%) | 2,031 (4.0%) |
| 80 to 84 Years | 702 (1.5%) | 910 (1.8%) |
| 85 Years and over | 717 (1.5%) | 1,528 (3.0%) |
| Total | 48,106 (100.0%) | 51,421 (100.0%) |
Families and Households in Cleveland County
Median Family Size in Cleveland County
The median family size in Cleveland County is 3.26 persons per family, with single female/mother families (5,599 | 22.5%) accounting for the largest median family size of 3.61 persons per family. On the other hand, married-couple families (17,055 | 68.4%) represent the smallest median family size with 3.13 persons per family.
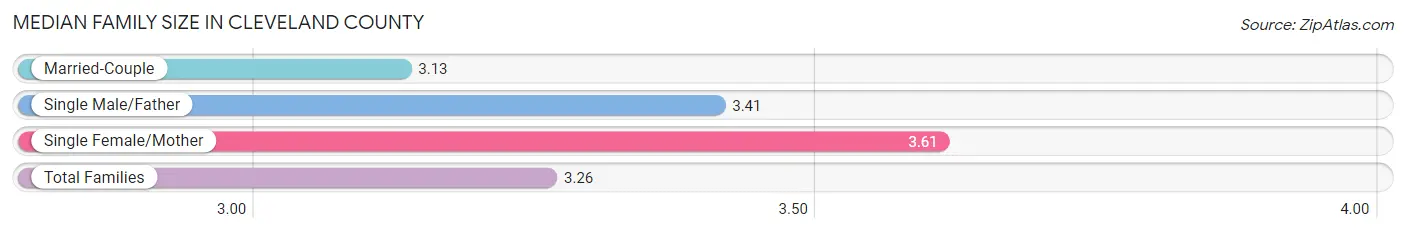
| Family Type | # Families | Family Size |
| Married-Couple | 17,055 (68.4%) | 3.13 |
| Single Male/Father | 2,285 (9.2%) | 3.41 |
| Single Female/Mother | 5,599 (22.5%) | 3.61 |
| Total Families | 24,939 (100.0%) | 3.26 |
Median Household Size in Cleveland County
The median household size in Cleveland County is 2.67 persons per household, with single male/father households (2,285 | 6.2%) accounting for the largest median household size of 3.87 persons per household. non-family households (11,628 | 31.8%) represent the smallest median household size with 1.16 persons per household.
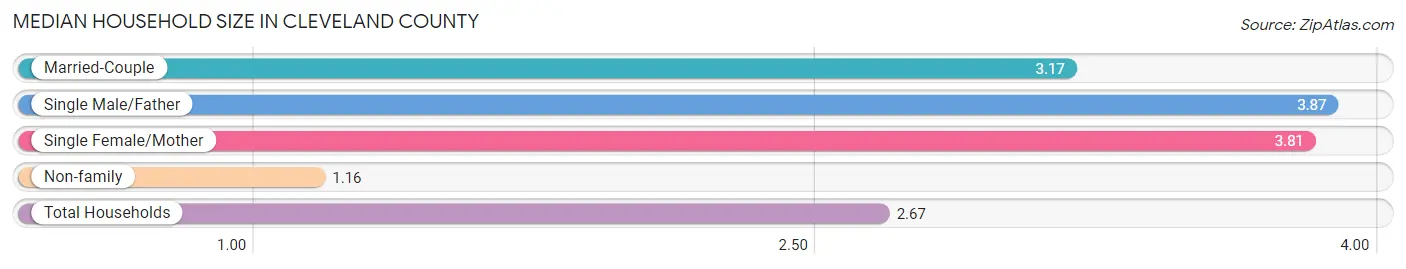
| Household Type | # Households | Household Size |
| Married-Couple | 17,055 (46.6%) | 3.17 |
| Single Male/Father | 2,285 (6.2%) | 3.87 |
| Single Female/Mother | 5,599 (15.3%) | 3.81 |
| Non-family | 11,628 (31.8%) | 1.16 |
| Total Households | 36,567 (100.0%) | 2.67 |
Household Size by Marriage Status in Cleveland County
Out of a total of 36,567 households in Cleveland County, 24,939 (68.2%) are family households, while 11,628 (31.8%) are nonfamily households. The most numerous type of family households are 2-person households, comprising 12,083, and the most common type of nonfamily households are 1-person households, comprising 10,331.
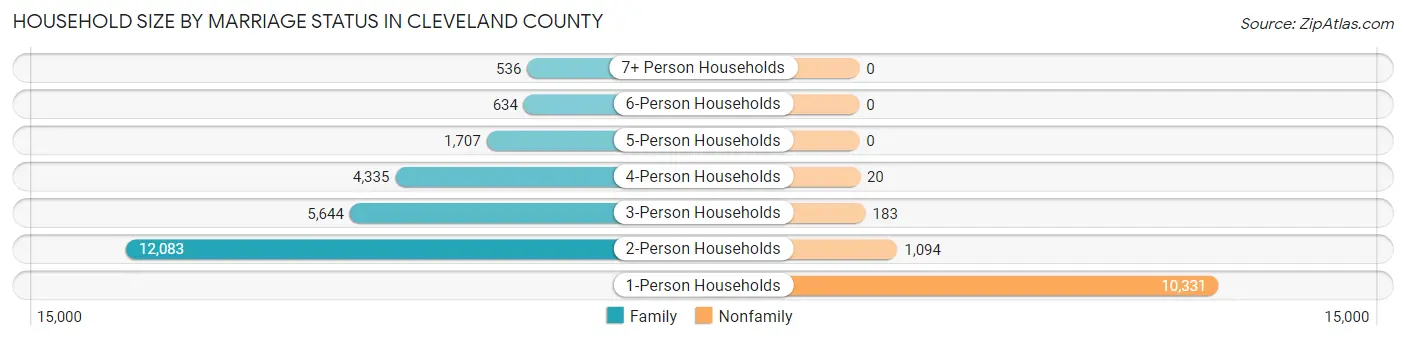
| Household Size | Family Households | Nonfamily Households |
| 1-Person Households | - | 10,331 (28.2%) |
| 2-Person Households | 12,083 (33.0%) | 1,094 (3.0%) |
| 3-Person Households | 5,644 (15.4%) | 183 (0.5%) |
| 4-Person Households | 4,335 (11.8%) | 20 (0.1%) |
| 5-Person Households | 1,707 (4.7%) | 0 (0.0%) |
| 6-Person Households | 634 (1.7%) | 0 (0.0%) |
| 7+ Person Households | 536 (1.5%) | 0 (0.0%) |
| Total | 24,939 (68.2%) | 11,628 (31.8%) |
Female Fertility in Cleveland County
Fertility by Age in Cleveland County
Average fertility rate in Cleveland County is 70.0 births per 1,000 women. Women in the age bracket of 20 to 34 years have the highest fertility rate with 124.0 births per 1,000 women. Women in the age bracket of 20 to 34 years acount for 76.3% of all women with births.
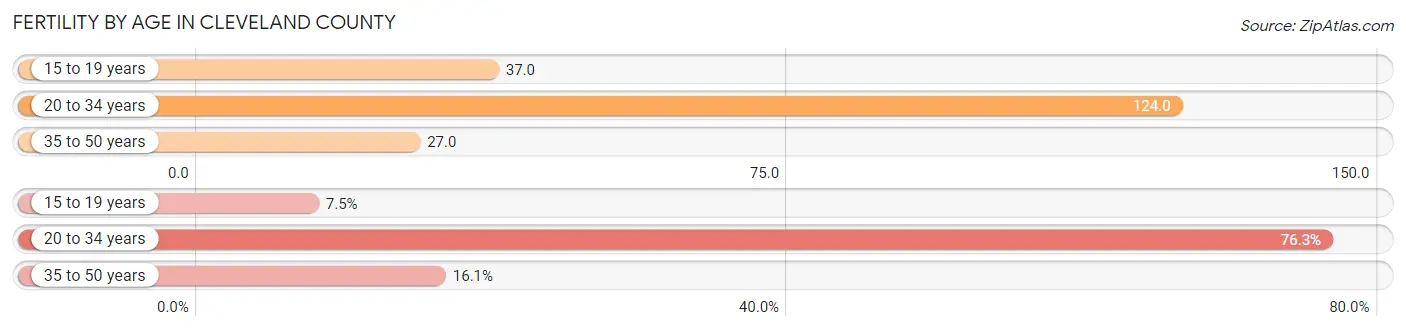
| Age Bracket | Women with Births | Births / 1,000 Women |
| 15 to 19 years | 115 (7.5%) | 37.0 |
| 20 to 34 years | 1,168 (76.3%) | 124.0 |
| 35 to 50 years | 247 (16.1%) | 27.0 |
| Total | 1,530 (100.0%) | 70.0 |
Fertility by Age by Marriage Status in Cleveland County
35.0% of women with births (1,530) in Cleveland County are married. The highest percentage of unmarried women with births falls into 15 to 19 years age bracket with 75.6% of them unmarried at the time of birth, while the lowest percentage of unmarried women with births belong to 35 to 50 years age bracket with 55.9% of them unmarried.

| Age Bracket | Married | Unmarried |
| 15 to 19 years | 28 (24.3%) | 87 (75.6%) |
| 20 to 34 years | 399 (34.2%) | 769 (65.8%) |
| 35 to 50 years | 109 (44.1%) | 138 (55.9%) |
| Total | 536 (35.0%) | 994 (65.0%) |
Fertility by Education in Cleveland County
Average fertility rate in Cleveland County is 70.0 births per 1,000 women. Women with the education attainment of graduate degree have the highest fertility rate of 112.0 births per 1,000 women, while women with the education attainment of college or associate's degree have the lowest fertility at 43.0 births per 1,000 women. Women with the education attainment of high school diploma represent 40.7% of all women with births.
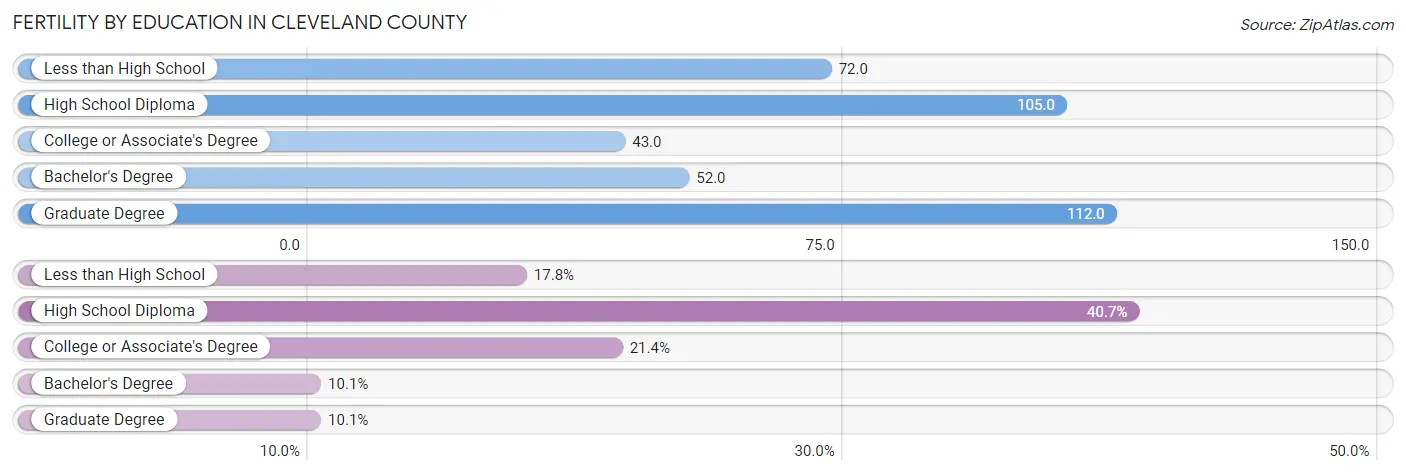
| Educational Attainment | Women with Births | Births / 1,000 Women |
| Less than High School | 272 (17.8%) | 72.0 |
| High School Diploma | 623 (40.7%) | 105.0 |
| College or Associate's Degree | 327 (21.4%) | 43.0 |
| Bachelor's Degree | 154 (10.1%) | 52.0 |
| Graduate Degree | 154 (10.1%) | 112.0 |
| Total | 1,530 (100.0%) | 70.0 |
Fertility by Education by Marriage Status in Cleveland County
65.0% of women with births in Cleveland County are unmarried. Women with the educational attainment of graduate degree are most likely to be married with 100.0% of them married at childbirth, while women with the educational attainment of less than high school are least likely to be married with 86.4% of them unmarried at childbirth.
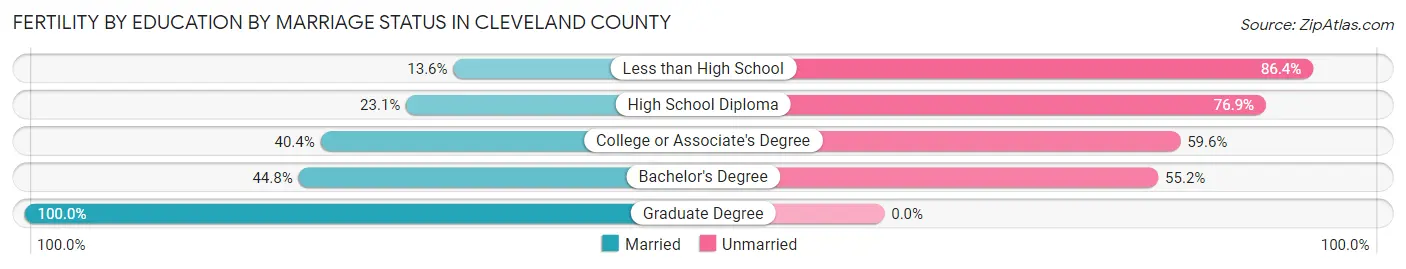
| Educational Attainment | Married | Unmarried |
| Less than High School | 37 (13.6%) | 235 (86.4%) |
| High School Diploma | 144 (23.1%) | 479 (76.9%) |
| College or Associate's Degree | 132 (40.4%) | 195 (59.6%) |
| Bachelor's Degree | 69 (44.8%) | 85 (55.2%) |
| Graduate Degree | 154 (100.0%) | 0 (0.0%) |
| Total | 536 (35.0%) | 994 (65.0%) |
Income in Cleveland County
Income Overview in Cleveland County
Per Capita Income in Cleveland County is $27,522, while median incomes of families and households are $64,112 and $50,723 respectively.
| Characteristic | Number | Measure |
| Per Capita Income | 99,527 | $27,522 |
| Median Family Income | 24,939 | $64,112 |
| Mean Family Income | 24,939 | $82,242 |
| Median Household Income | 36,567 | $50,723 |
| Mean Household Income | 36,567 | $70,141 |
| Income Deficit | 24,939 | $11,646 |
| Wage / Income Gap (%) | 99,527 | 23.82% |
| Wage / Income Gap ($) | 99,527 | 76.18¢ per $1 |
| Gini / Inequality Index | 99,527 | 0.46 |
Earnings by Sex in Cleveland County
Average Earnings in Cleveland County are $33,340, $37,877 for men and $28,853 for women, a difference of 23.8%.
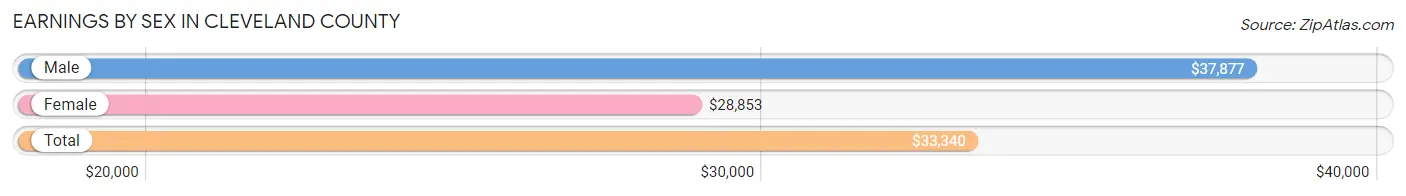
| Sex | Number | Average Earnings |
| Male | 24,502 (51.7%) | $37,877 |
| Female | 22,907 (48.3%) | $28,853 |
| Total | 47,409 (100.0%) | $33,340 |
Earnings by Sex by Income Bracket in Cleveland County
The most common earnings brackets in Cleveland County are $100,000+ for men (2,422 | 9.9%) and $30,000 to $34,999 for women (2,003 | 8.7%).
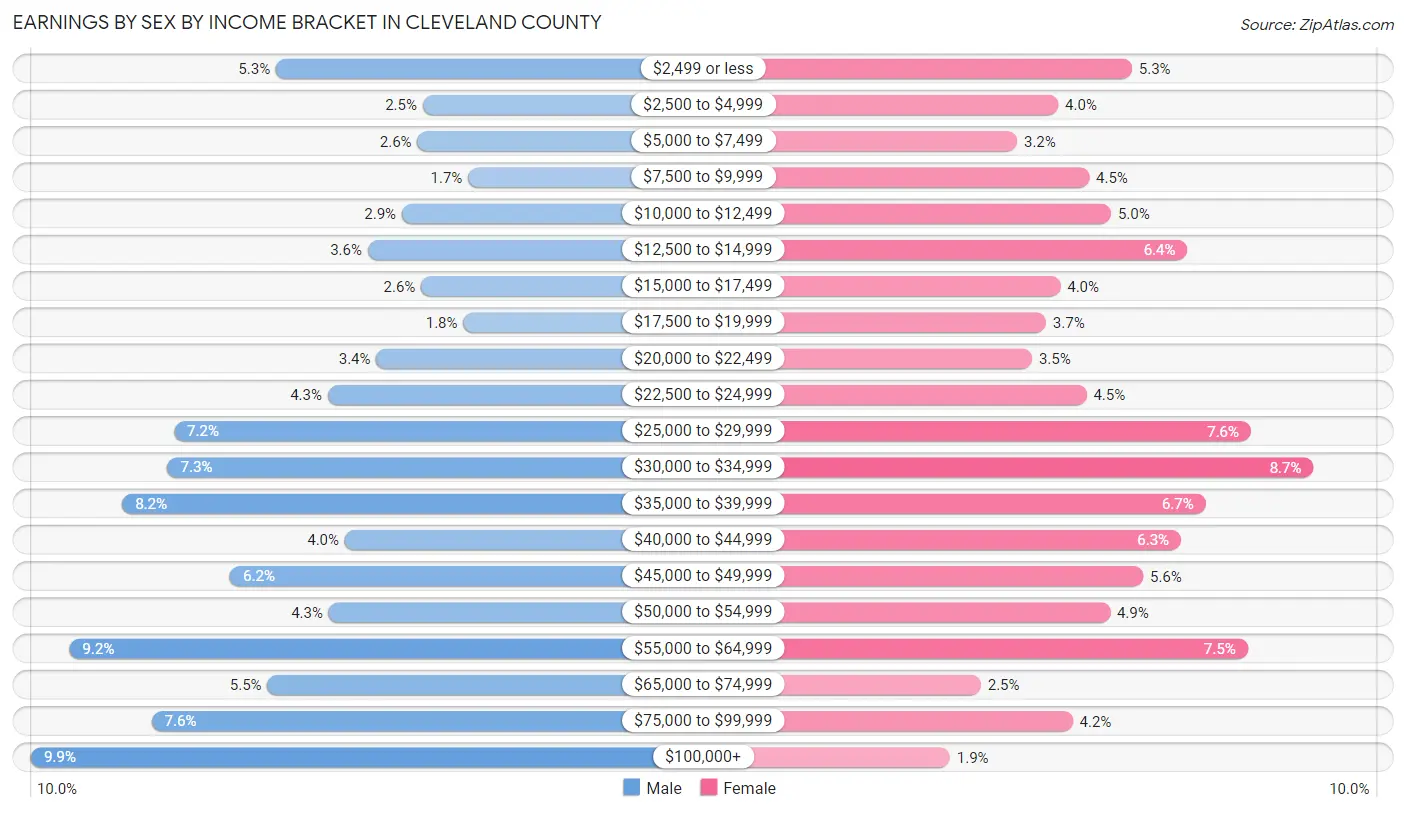
| Income | Male | Female |
| $2,499 or less | 1,297 (5.3%) | 1,223 (5.3%) |
| $2,500 to $4,999 | 622 (2.5%) | 906 (4.0%) |
| $5,000 to $7,499 | 647 (2.6%) | 730 (3.2%) |
| $7,500 to $9,999 | 413 (1.7%) | 1,040 (4.5%) |
| $10,000 to $12,499 | 718 (2.9%) | 1,135 (5.0%) |
| $12,500 to $14,999 | 875 (3.6%) | 1,462 (6.4%) |
| $15,000 to $17,499 | 630 (2.6%) | 917 (4.0%) |
| $17,500 to $19,999 | 436 (1.8%) | 855 (3.7%) |
| $20,000 to $22,499 | 835 (3.4%) | 794 (3.5%) |
| $22,500 to $24,999 | 1,059 (4.3%) | 1,029 (4.5%) |
| $25,000 to $29,999 | 1,764 (7.2%) | 1,735 (7.6%) |
| $30,000 to $34,999 | 1,794 (7.3%) | 2,003 (8.7%) |
| $35,000 to $39,999 | 2,001 (8.2%) | 1,539 (6.7%) |
| $40,000 to $44,999 | 981 (4.0%) | 1,433 (6.3%) |
| $45,000 to $49,999 | 1,507 (6.1%) | 1,272 (5.6%) |
| $50,000 to $54,999 | 1,053 (4.3%) | 1,129 (4.9%) |
| $55,000 to $64,999 | 2,245 (9.2%) | 1,721 (7.5%) |
| $65,000 to $74,999 | 1,336 (5.4%) | 574 (2.5%) |
| $75,000 to $99,999 | 1,867 (7.6%) | 968 (4.2%) |
| $100,000+ | 2,422 (9.9%) | 442 (1.9%) |
| Total | 24,502 (100.0%) | 22,907 (100.0%) |
Earnings by Sex by Educational Attainment in Cleveland County
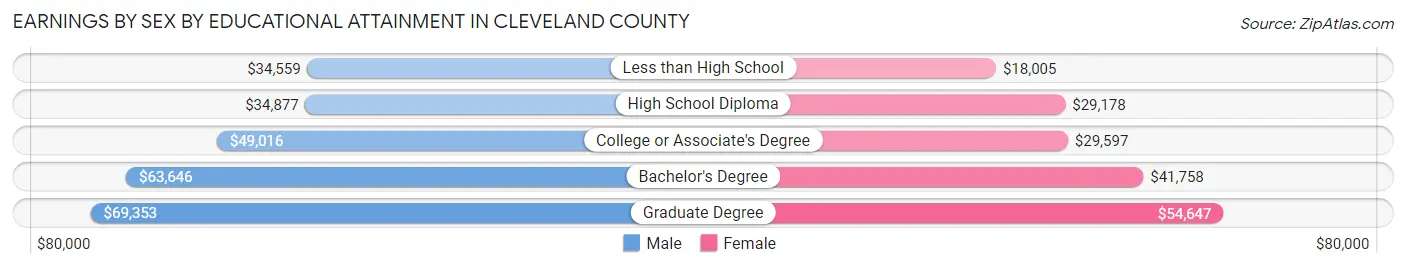
Average earnings in Cleveland County are $42,465 for men and $32,628 for women, a difference of 23.2%. Men with an educational attainment of graduate degree enjoy the highest average annual earnings of $69,353, while those with less than high school education earn the least with $34,559. Women with an educational attainment of graduate degree earn the most with the average annual earnings of $54,647, while those with less than high school education have the smallest earnings of $18,005.
| Educational Attainment | Male Income | Female Income |
| Less than High School | $34,559 | $18,005 |
| High School Diploma | $34,877 | $29,178 |
| College or Associate's Degree | $49,016 | $29,597 |
| Bachelor's Degree | $63,646 | $41,758 |
| Graduate Degree | $69,353 | $54,647 |
| Total | $42,465 | $32,628 |
Family Income in Cleveland County
Family Income Brackets in Cleveland County
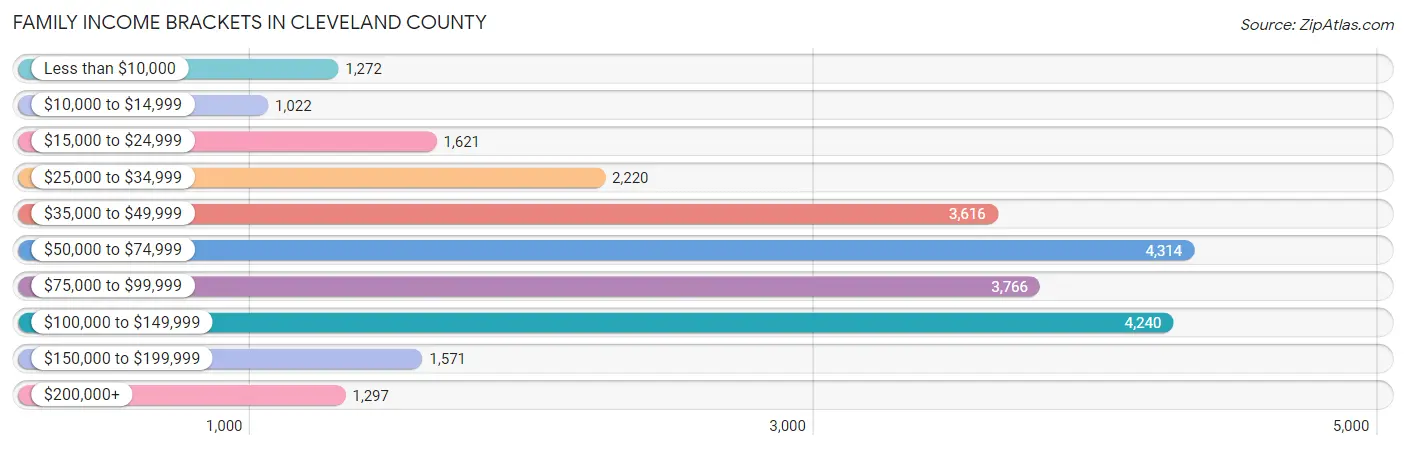
According to the Cleveland County family income data, there are 4,314 families falling into the $50,000 to $74,999 income range, which is the most common income bracket and makes up 17.3% of all families. Conversely, the $10,000 to $14,999 income bracket is the least frequent group with only 1,022 families (4.1%) belonging to this category.
| Income Bracket | # Families | % Families |
| Less than $10,000 | 1,272 | 5.1% |
| $10,000 to $14,999 | 1,022 | 4.1% |
| $15,000 to $24,999 | 1,621 | 6.5% |
| $25,000 to $34,999 | 2,220 | 8.9% |
| $35,000 to $49,999 | 3,616 | 14.5% |
| $50,000 to $74,999 | 4,314 | 17.3% |
| $75,000 to $99,999 | 3,766 | 15.1% |
| $100,000 to $149,999 | 4,240 | 17.0% |
| $150,000 to $199,999 | 1,571 | 6.3% |
| $200,000+ | 1,297 | 5.2% |
Family Income by Famaliy Size in Cleveland County
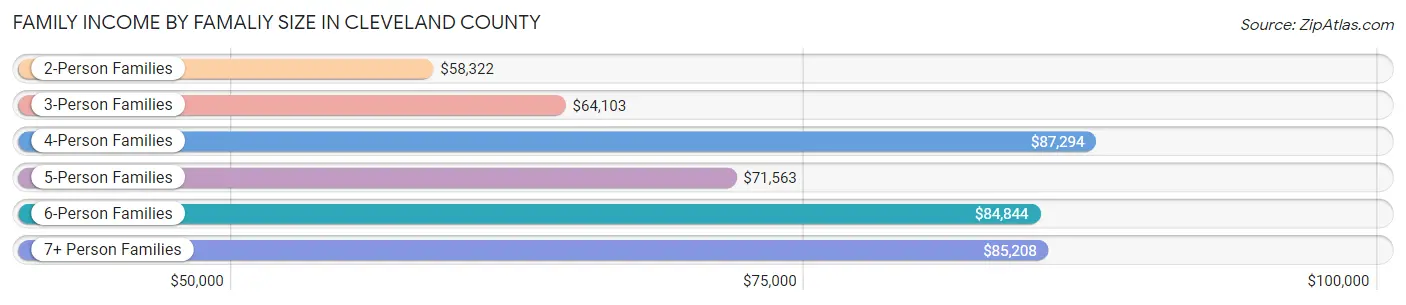
4-person families (3,789 | 15.2%) account for the highest median family income in Cleveland County with $87,294 per family, while 2-person families (12,736 | 51.1%) have the highest median income of $29,161 per family member.
| Income Bracket | # Families | Median Income |
| 2-Person Families | 12,736 (51.1%) | $58,322 |
| 3-Person Families | 6,042 (24.2%) | $64,103 |
| 4-Person Families | 3,789 (15.2%) | $87,294 |
| 5-Person Families | 1,386 (5.6%) | $71,563 |
| 6-Person Families | 519 (2.1%) | $84,844 |
| 7+ Person Families | 467 (1.9%) | $85,208 |
| Total | 24,939 (100.0%) | $64,112 |
Family Income by Number of Earners in Cleveland County
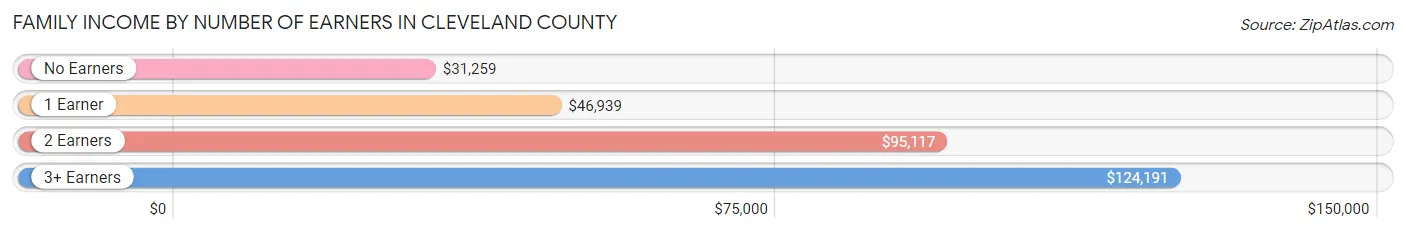
The median family income in Cleveland County is $64,112, with families comprising 3+ earners (2,294) having the highest median family income of $124,191, while families with no earners (4,663) have the lowest median family income of $31,259, accounting for 9.2% and 18.7% of families, respectively.
| Number of Earners | # Families | Median Income |
| No Earners | 4,663 (18.7%) | $31,259 |
| 1 Earner | 8,681 (34.8%) | $46,939 |
| 2 Earners | 9,301 (37.3%) | $95,117 |
| 3+ Earners | 2,294 (9.2%) | $124,191 |
| Total | 24,939 (100.0%) | $64,112 |
Household Income in Cleveland County
Household Income Brackets in Cleveland County
With 5,960 households falling in the category, the $50,000 to $74,999 income range is the most frequent in Cleveland County, accounting for 16.3% of all households. In contrast, only 1,463 households (4.0%) fall into the $200,000+ income bracket, making it the least populous group.

| Income Bracket | # Households | % Households |
| Less than $10,000 | 2,633 | 7.2% |
| $10,000 to $14,999 | 2,194 | 6.0% |
| $15,000 to $24,999 | 3,876 | 10.6% |
| $25,000 to $34,999 | 4,022 | 11.0% |
| $35,000 to $49,999 | 5,412 | 14.8% |
| $50,000 to $74,999 | 5,960 | 16.3% |
| $75,000 to $99,999 | 4,498 | 12.3% |
| $100,000 to $149,999 | 4,790 | 13.1% |
| $150,000 to $199,999 | 1,719 | 4.7% |
| $200,000+ | 1,463 | 4.0% |
Household Income by Householder Age in Cleveland County
The median household income in Cleveland County is $50,723, with the highest median household income of $62,237 found in the 45 to 64 years age bracket for the primary householder. A total of 14,660 households (40.1%) fall into this category. Meanwhile, the 15 to 24 years age bracket for the primary householder has the lowest median household income of $37,917, with 687 households (1.9%) in this group.
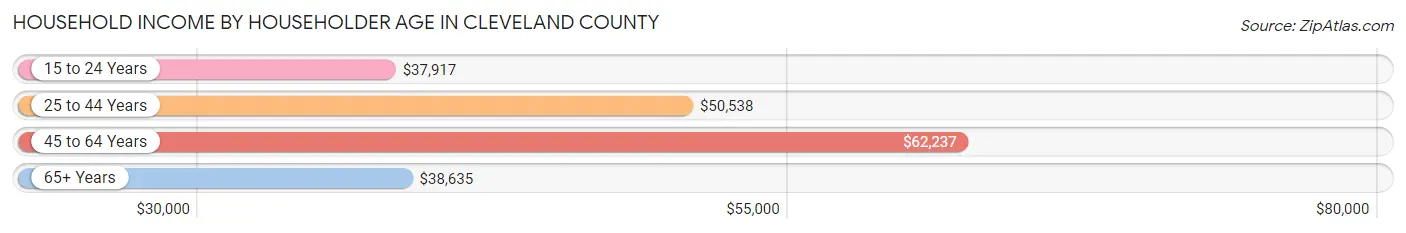
| Income Bracket | # Households | Median Income |
| 15 to 24 Years | 687 (1.9%) | $37,917 |
| 25 to 44 Years | 9,554 (26.1%) | $50,538 |
| 45 to 64 Years | 14,660 (40.1%) | $62,237 |
| 65+ Years | 11,666 (31.9%) | $38,635 |
| Total | 36,567 (100.0%) | $50,723 |
Poverty in Cleveland County
Income Below Poverty by Sex and Age in Cleveland County
With 15.8% poverty level for males and 20.8% for females among the residents of Cleveland County, 5 year old males and under 5 year old females are the most vulnerable to poverty, with 197 males (34.5%) and 1,026 females (35.6%) in their respective age groups living below the poverty level.
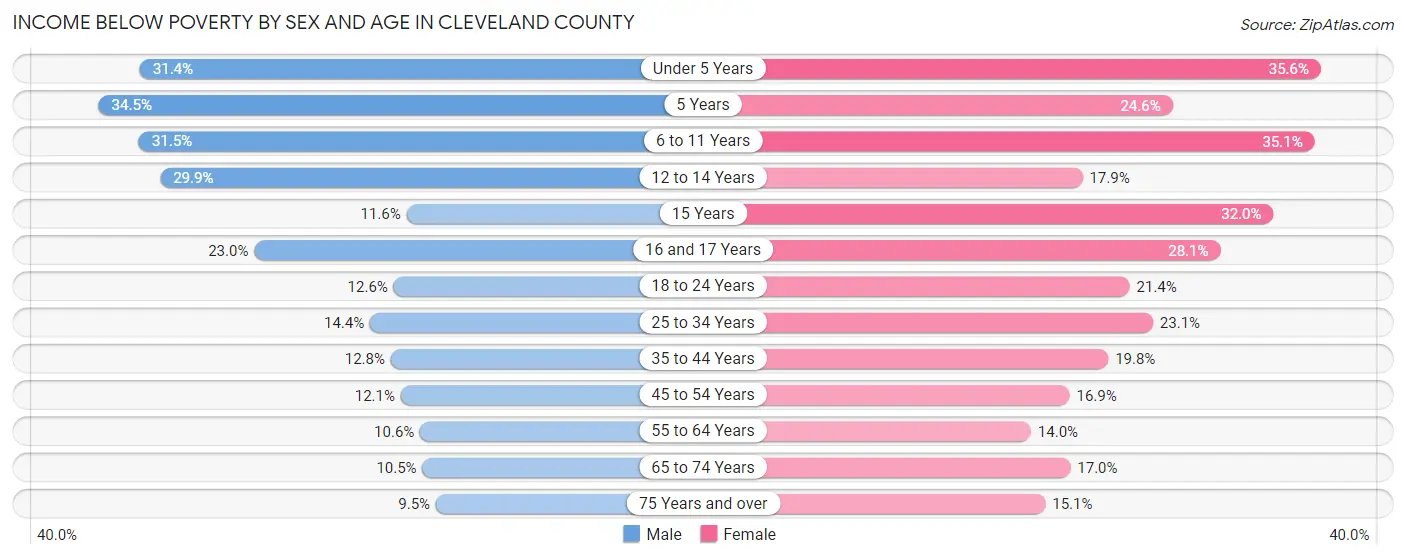
| Age Bracket | Male | Female |
| Under 5 Years | 854 (31.4%) | 1,026 (35.6%) |
| 5 Years | 197 (34.5%) | 108 (24.5%) |
| 6 to 11 Years | 1,197 (31.5%) | 1,388 (35.1%) |
| 12 to 14 Years | 481 (29.9%) | 298 (17.9%) |
| 15 Years | 95 (11.6%) | 132 (32.0%) |
| 16 and 17 Years | 280 (23.0%) | 390 (28.1%) |
| 18 to 24 Years | 500 (12.6%) | 804 (21.4%) |
| 25 to 34 Years | 861 (14.3%) | 1,462 (23.1%) |
| 35 to 44 Years | 683 (12.8%) | 1,100 (19.8%) |
| 45 to 54 Years | 746 (12.1%) | 1,132 (16.9%) |
| 55 to 64 Years | 720 (10.6%) | 996 (14.0%) |
| 65 to 74 Years | 550 (10.5%) | 1,005 (17.0%) |
| 75 Years and over | 271 (9.5%) | 650 (15.1%) |
| Total | 7,435 (15.8%) | 10,491 (20.8%) |
Income Above Poverty by Sex and Age in Cleveland County
According to the poverty statistics in Cleveland County, males aged 75 years and over and females aged 55 to 64 years are the age groups that are most secure financially, with 90.5% of males and 86.0% of females in these age groups living above the poverty line.
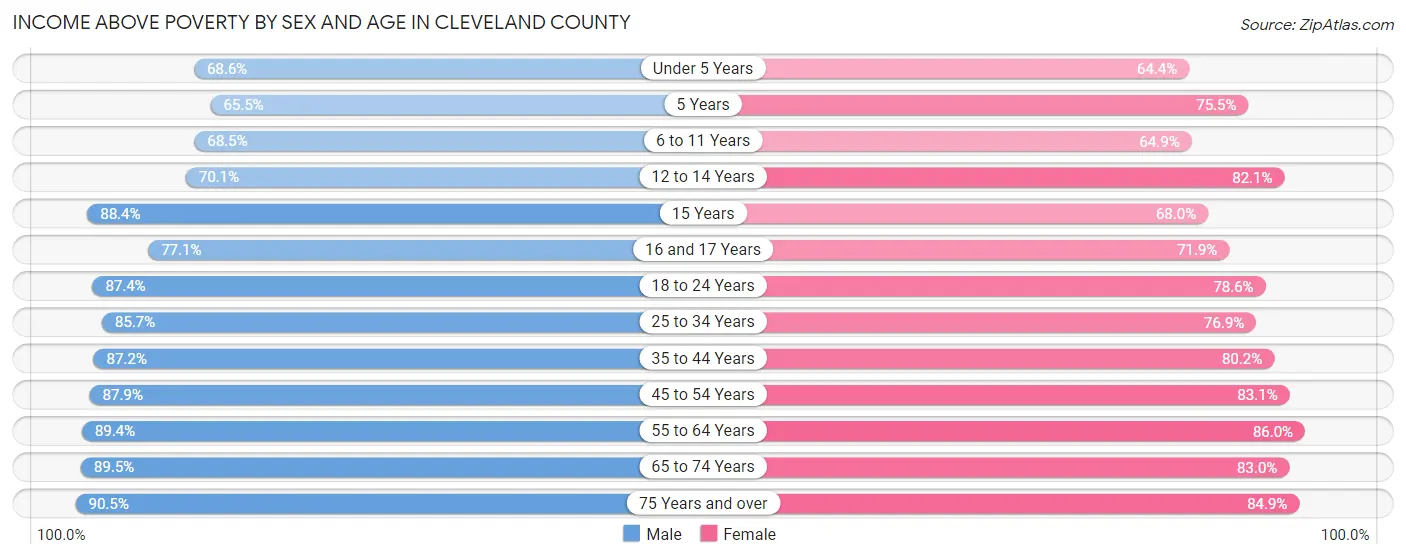
| Age Bracket | Male | Female |
| Under 5 Years | 1,862 (68.6%) | 1,859 (64.4%) |
| 5 Years | 374 (65.5%) | 332 (75.4%) |
| 6 to 11 Years | 2,602 (68.5%) | 2,566 (64.9%) |
| 12 to 14 Years | 1,126 (70.1%) | 1,370 (82.1%) |
| 15 Years | 721 (88.4%) | 280 (68.0%) |
| 16 and 17 Years | 940 (77.0%) | 998 (71.9%) |
| 18 to 24 Years | 3,469 (87.4%) | 2,959 (78.6%) |
| 25 to 34 Years | 5,137 (85.7%) | 4,868 (76.9%) |
| 35 to 44 Years | 4,650 (87.2%) | 4,460 (80.2%) |
| 45 to 54 Years | 5,436 (87.9%) | 5,561 (83.1%) |
| 55 to 64 Years | 6,051 (89.4%) | 6,100 (86.0%) |
| 65 to 74 Years | 4,710 (89.5%) | 4,918 (83.0%) |
| 75 Years and over | 2,595 (90.5%) | 3,651 (84.9%) |
| Total | 39,673 (84.2%) | 39,922 (79.2%) |
Income Below Poverty Among Married-Couple Families in Cleveland County
The poverty statistics for married-couple families in Cleveland County show that 5.6% or 960 of the total 17,055 families live below the poverty line. Families with 5 or more children have the highest poverty rate of 87.5%, comprising of 35 families. On the other hand, families with no children have the lowest poverty rate of 4.4%, which includes 504 families.
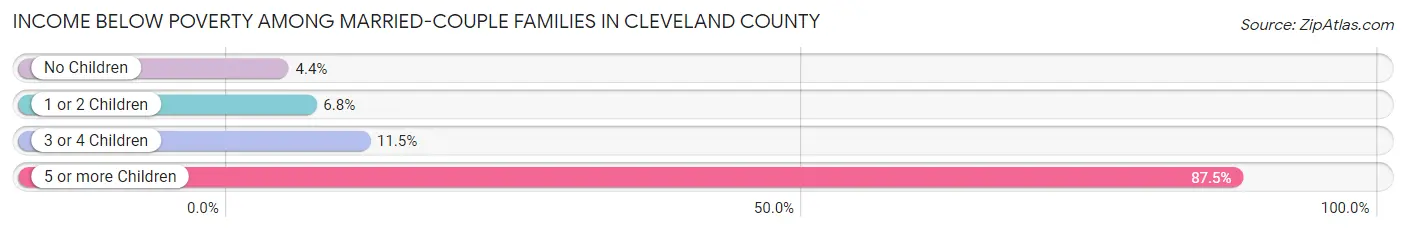
| Children | Above Poverty | Below Poverty |
| No Children | 10,944 (95.6%) | 504 (4.4%) |
| 1 or 2 Children | 4,360 (93.2%) | 319 (6.8%) |
| 3 or 4 Children | 786 (88.5%) | 102 (11.5%) |
| 5 or more Children | 5 (12.5%) | 35 (87.5%) |
| Total | 16,095 (94.4%) | 960 (5.6%) |
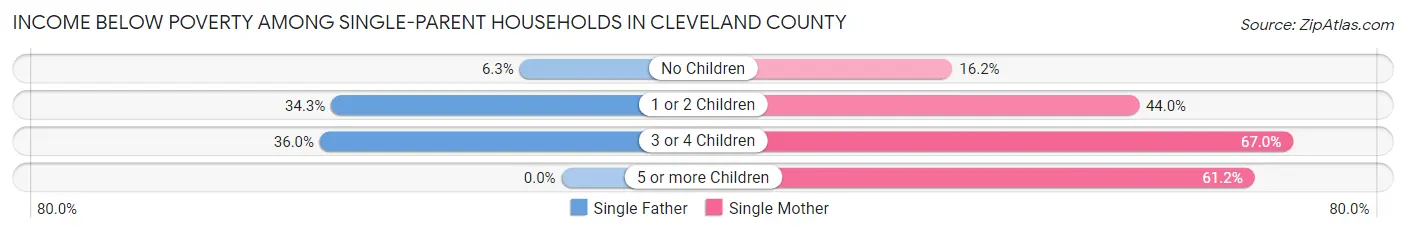
Income Below Poverty Among Single-Parent Households in Cleveland County
According to the poverty data in Cleveland County, 24.9% or 568 single-father households and 36.0% or 2,017 single-mother households are living below the poverty line. Among single-father households, those with 3 or 4 children have the highest poverty rate, with 81 households (36.0%) experiencing poverty. Likewise, among single-mother households, those with 3 or 4 children have the highest poverty rate, with 452 households (67.0%) falling below the poverty line.
| Children | Single Father | Single Mother |
| No Children | 49 (6.2%) | 367 (16.2%) |
| 1 or 2 Children | 438 (34.3%) | 1,097 (44.0%) |
| 3 or 4 Children | 81 (36.0%) | 452 (67.0%) |
| 5 or more Children | 0 (0.0%) | 101 (61.2%) |
| Total | 568 (24.9%) | 2,017 (36.0%) |
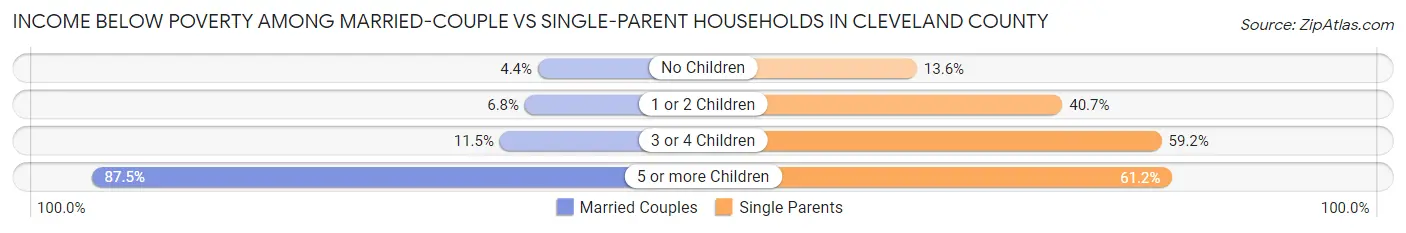
Income Below Poverty Among Married-Couple vs Single-Parent Households in Cleveland County
The poverty data for Cleveland County shows that 960 of the married-couple family households (5.6%) and 2,585 of the single-parent households (32.8%) are living below the poverty level. Within the married-couple family households, those with 5 or more children have the highest poverty rate, with 35 households (87.5%) falling below the poverty line. Among the single-parent households, those with 5 or more children have the highest poverty rate, with 101 household (61.2%) living below poverty.
| Children | Married-Couple Families | Single-Parent Households |
| No Children | 504 (4.4%) | 416 (13.6%) |
| 1 or 2 Children | 319 (6.8%) | 1,535 (40.7%) |
| 3 or 4 Children | 102 (11.5%) | 533 (59.2%) |
| 5 or more Children | 35 (87.5%) | 101 (61.2%) |
| Total | 960 (5.6%) | 2,585 (32.8%) |
Employment Characteristics in Cleveland County
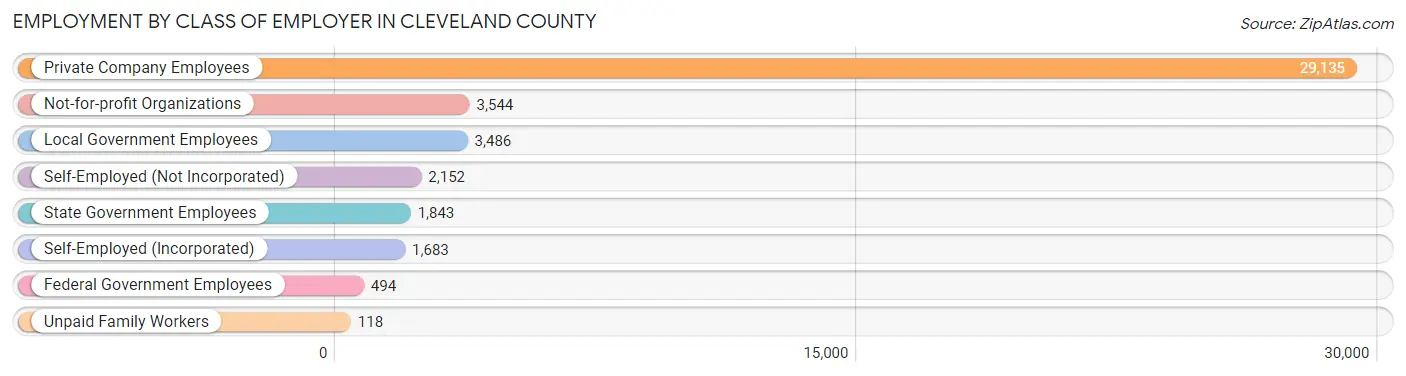
Employment by Class of Employer in Cleveland County
Among the 42,455 employed individuals in Cleveland County, private company employees (29,135 | 68.6%), not-for-profit organizations (3,544 | 8.4%), and local government employees (3,486 | 8.2%) make up the most common classes of employment.
| Employer Class | # Employees | % Employees |
| Private Company Employees | 29,135 | 68.6% |
| Self-Employed (Incorporated) | 1,683 | 4.0% |
| Self-Employed (Not Incorporated) | 2,152 | 5.1% |
| Not-for-profit Organizations | 3,544 | 8.4% |
| Local Government Employees | 3,486 | 8.2% |
| State Government Employees | 1,843 | 4.3% |
| Federal Government Employees | 494 | 1.2% |
| Unpaid Family Workers | 118 | 0.3% |
| Total | 42,455 | 100.0% |
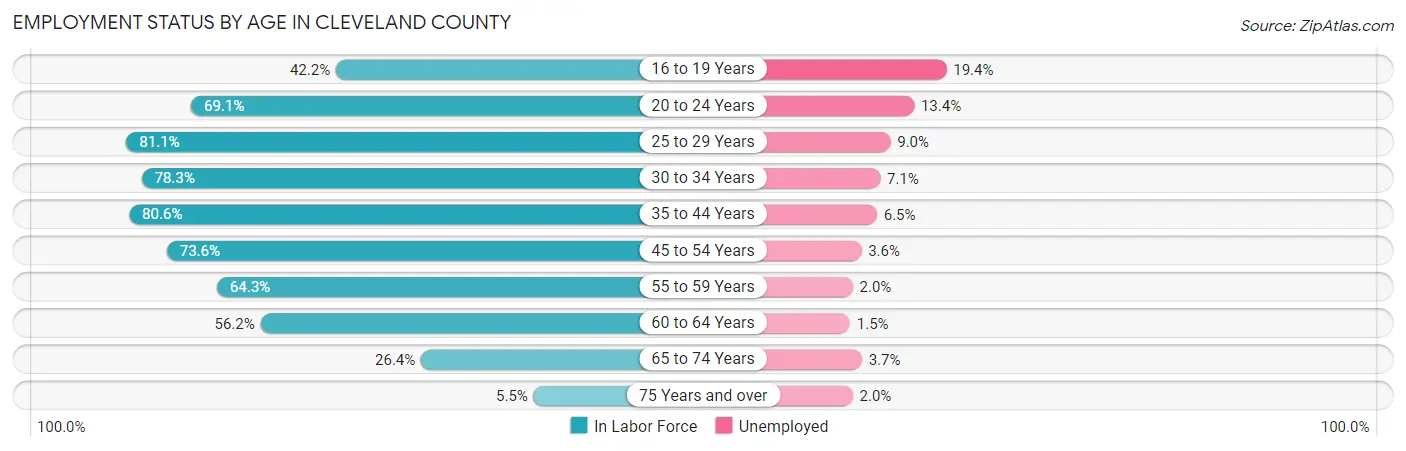
Employment Status by Age in Cleveland County
According to the labor force statistics for Cleveland County, out of the total population over 16 years of age (80,115), 57.9% or 46,387 individuals are in the labor force, with 6.4% or 2,969 of them unemployed. The age group with the highest labor force participation rate is 25 to 29 years, with 81.1% or 5,104 individuals in the labor force. Within the labor force, the 16 to 19 years age range has the highest percentage of unemployed individuals, with 19.4% or 434 of them being unemployed.
| Age Bracket | In Labor Force | Unemployed |
| 16 to 19 Years | 2,235 (42.2%) | 434 (19.4%) |
| 20 to 24 Years | 4,277 (69.1%) | 573 (13.4%) |
| 25 to 29 Years | 5,104 (81.1%) | 459 (9.0%) |
| 30 to 34 Years | 4,771 (78.3%) | 339 (7.1%) |
| 35 to 44 Years | 8,797 (80.6%) | 572 (6.5%) |
| 45 to 54 Years | 9,481 (73.6%) | 341 (3.6%) |
| 55 to 59 Years | 4,542 (64.3%) | 91 (2.0%) |
| 60 to 64 Years | 3,827 (56.2%) | 57 (1.5%) |
| 65 to 74 Years | 2,957 (26.4%) | 109 (3.7%) |
| 75 Years and over | 406 (5.5%) | 8 (2.0%) |
| Total | 46,387 (57.9%) | 2,969 (6.4%) |
Employment Status by Educational Attainment in Cleveland County
According to labor force statistics for Cleveland County, 73.0% of individuals (36,540) out of the total population between 25 and 64 years of age (50,055) are in the labor force, with 5.1% or 1,864 of them being unemployed. The group with the highest labor force participation rate are those with the educational attainment of bachelor's degree or higher, with 87.0% or 8,746 individuals in the labor force. Within the labor force, individuals with less than high school education have the highest percentage of unemployment, with 11.6% or 342 of them being unemployed.
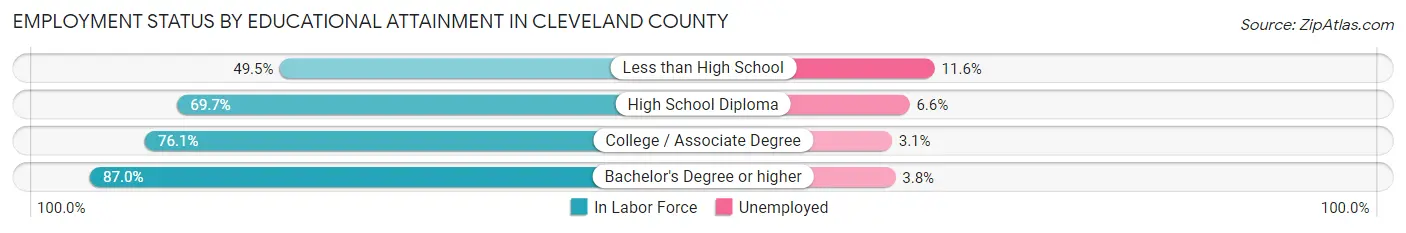
| Educational Attainment | In Labor Force | Unemployed |
| Less than High School | 2,945 (49.5%) | 690 (11.6%) |
| High School Diploma | 11,735 (69.7%) | 1,111 (6.6%) |
| College / Associate Degree | 13,102 (76.1%) | 534 (3.1%) |
| Bachelor's Degree or higher | 8,746 (87.0%) | 382 (3.8%) |
| Total | 36,540 (73.0%) | 2,553 (5.1%) |
Employment Occupations by Sex in Cleveland County
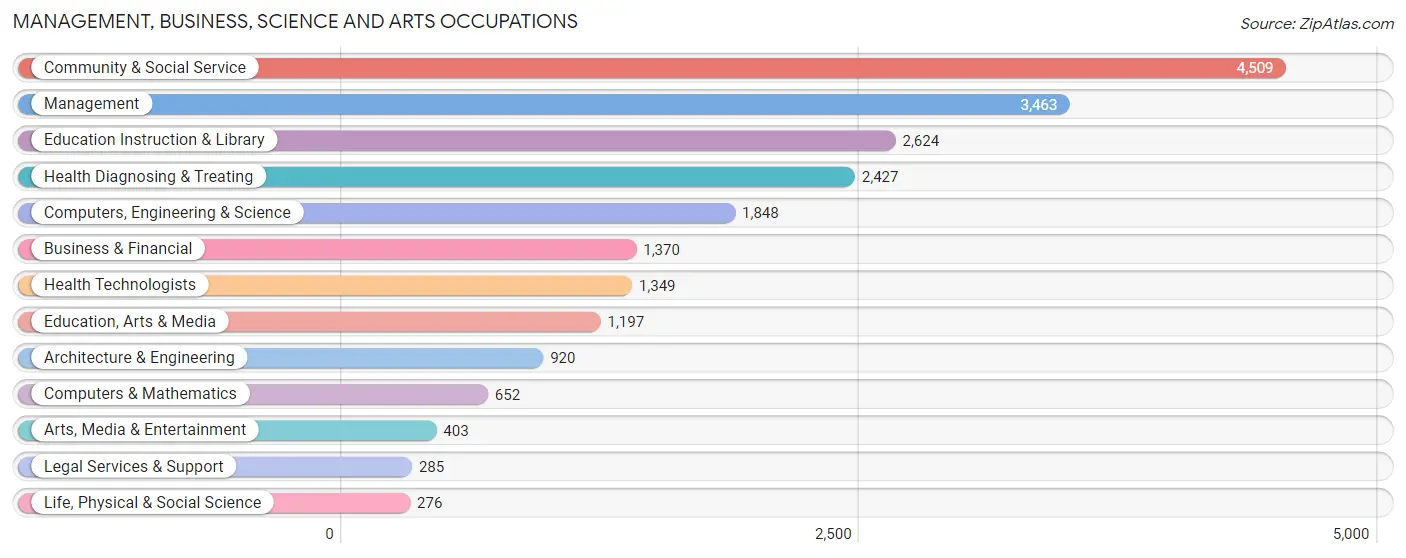
Management, Business, Science and Arts Occupations
The most common Management, Business, Science and Arts occupations in Cleveland County are Community & Social Service (4,509 | 10.4%), Management (3,463 | 8.0%), Education Instruction & Library (2,624 | 6.1%), Health Diagnosing & Treating (2,427 | 5.6%), and Computers, Engineering & Science (1,848 | 4.3%).
Management, Business, Science and Arts Occupations by Sex
Within the Management, Business, Science and Arts occupations in Cleveland County, the most male-oriented occupations are Architecture & Engineering (92.5%), Computers, Engineering & Science (85.6%), and Life, Physical & Social Science (79.7%), while the most female-oriented occupations are Health Diagnosing & Treating (87.1%), Health Technologists (85.0%), and Education Instruction & Library (81.8%).
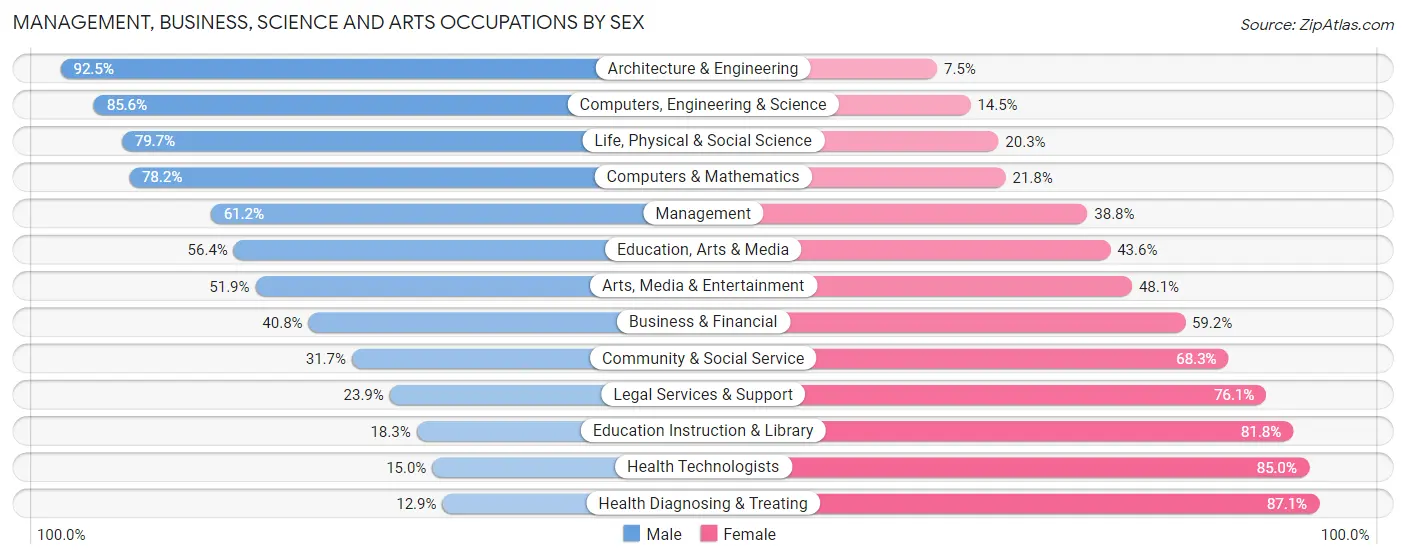
| Occupation | Male | Female |
| Management | 2,118 (61.2%) | 1,345 (38.8%) |
| Business & Financial | 559 (40.8%) | 811 (59.2%) |
| Computers, Engineering & Science | 1,581 (85.6%) | 267 (14.4%) |
| Computers & Mathematics | 510 (78.2%) | 142 (21.8%) |
| Architecture & Engineering | 851 (92.5%) | 69 (7.5%) |
| Life, Physical & Social Science | 220 (79.7%) | 56 (20.3%) |
| Community & Social Service | 1,431 (31.7%) | 3,078 (68.3%) |
| Education, Arts & Media | 675 (56.4%) | 522 (43.6%) |
| Legal Services & Support | 68 (23.9%) | 217 (76.1%) |
| Education Instruction & Library | 479 (18.2%) | 2,145 (81.8%) |
| Arts, Media & Entertainment | 209 (51.9%) | 194 (48.1%) |
| Health Diagnosing & Treating | 312 (12.9%) | 2,115 (87.1%) |
| Health Technologists | 202 (15.0%) | 1,147 (85.0%) |
| Total (Category) | 6,001 (44.1%) | 7,616 (55.9%) |
| Total (Overall) | 22,406 (51.7%) | 20,888 (48.2%) |
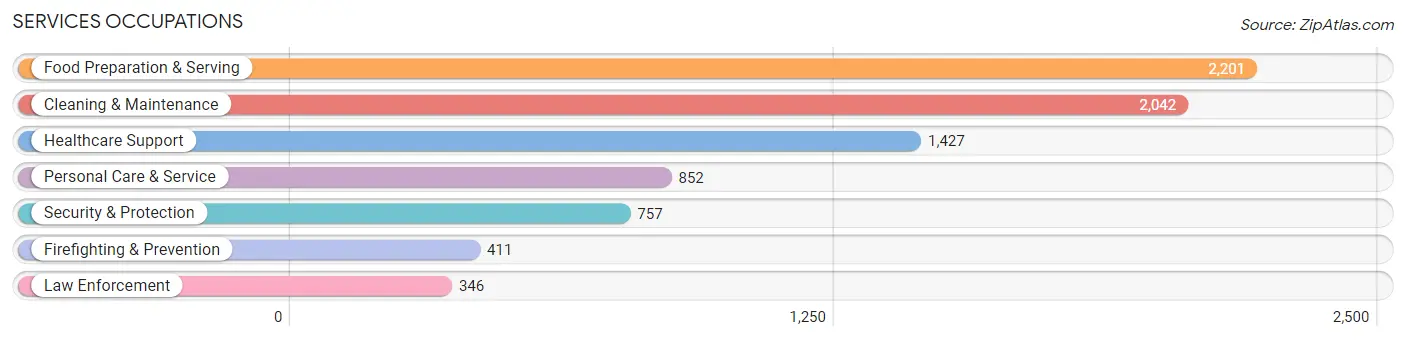
Services Occupations
The most common Services occupations in Cleveland County are Food Preparation & Serving (2,201 | 5.1%), Cleaning & Maintenance (2,042 | 4.7%), Healthcare Support (1,427 | 3.3%), Personal Care & Service (852 | 2.0%), and Security & Protection (757 | 1.8%).
Services Occupations by Sex
Within the Services occupations in Cleveland County, the most male-oriented occupations are Law Enforcement (92.5%), Security & Protection (87.6%), and Firefighting & Prevention (83.5%), while the most female-oriented occupations are Healthcare Support (90.7%), Personal Care & Service (83.9%), and Food Preparation & Serving (54.8%).
| Occupation | Male | Female |
| Healthcare Support | 132 (9.2%) | 1,295 (90.7%) |
| Security & Protection | 663 (87.6%) | 94 (12.4%) |
| Firefighting & Prevention | 343 (83.5%) | 68 (16.6%) |
| Law Enforcement | 320 (92.5%) | 26 (7.5%) |
| Food Preparation & Serving | 994 (45.2%) | 1,207 (54.8%) |
| Cleaning & Maintenance | 1,472 (72.1%) | 570 (27.9%) |
| Personal Care & Service | 137 (16.1%) | 715 (83.9%) |
| Total (Category) | 3,398 (46.7%) | 3,881 (53.3%) |
| Total (Overall) | 22,406 (51.7%) | 20,888 (48.2%) |
Sales and Office Occupations
The most common Sales and Office occupations in Cleveland County are Sales & Related (4,606 | 10.6%), and Office & Administration (3,938 | 9.1%).
Sales and Office Occupations by Sex
| Occupation | Male | Female |
| Sales & Related | 2,000 (43.4%) | 2,606 (56.6%) |
| Office & Administration | 697 (17.7%) | 3,241 (82.3%) |
| Total (Category) | 2,697 (31.6%) | 5,847 (68.4%) |
| Total (Overall) | 22,406 (51.7%) | 20,888 (48.2%) |
Natural Resources, Construction and Maintenance Occupations
The most common Natural Resources, Construction and Maintenance occupations in Cleveland County are Construction & Extraction (2,172 | 5.0%), Installation, Maintenance & Repair (1,896 | 4.4%), and Farming, Fishing & Forestry (128 | 0.3%).
Natural Resources, Construction and Maintenance Occupations by Sex
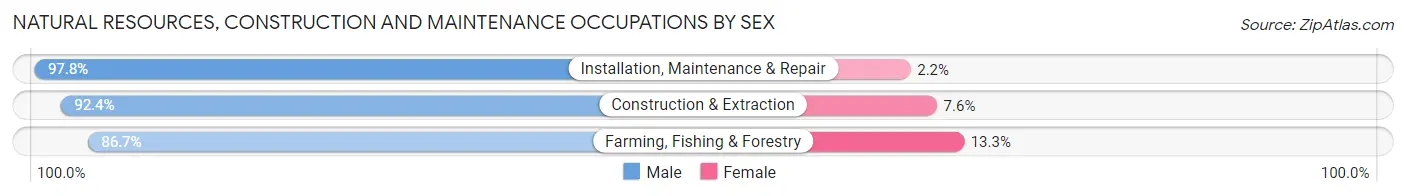
| Occupation | Male | Female |
| Farming, Fishing & Forestry | 111 (86.7%) | 17 (13.3%) |
| Construction & Extraction | 2,006 (92.4%) | 166 (7.6%) |
| Installation, Maintenance & Repair | 1,855 (97.8%) | 41 (2.2%) |
| Total (Category) | 3,972 (94.7%) | 224 (5.3%) |
| Total (Overall) | 22,406 (51.7%) | 20,888 (48.2%) |
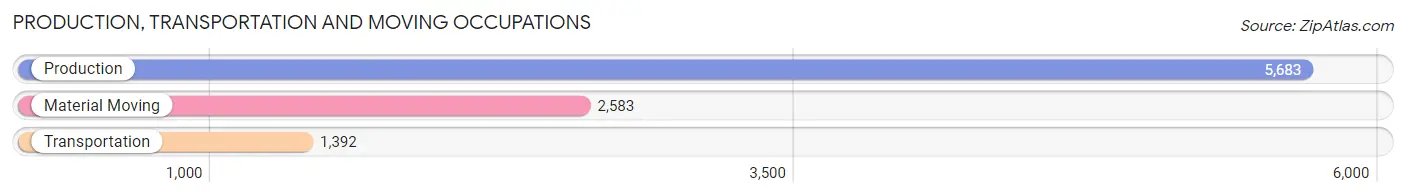
Production, Transportation and Moving Occupations
The most common Production, Transportation and Moving occupations in Cleveland County are Production (5,683 | 13.1%), Material Moving (2,583 | 6.0%), and Transportation (1,392 | 3.2%).
Production, Transportation and Moving Occupations by Sex
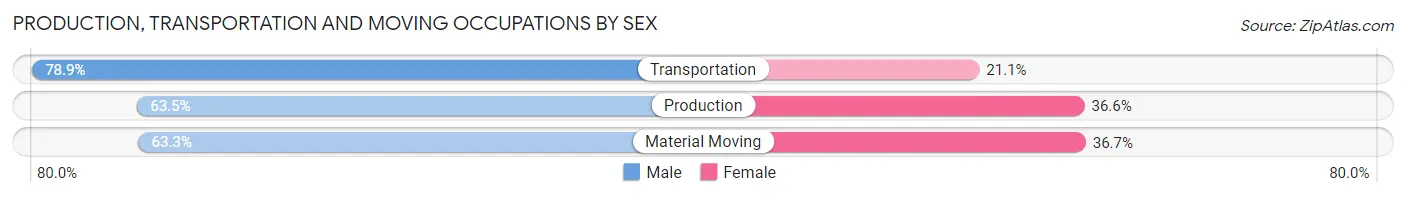
| Occupation | Male | Female |
| Production | 3,606 (63.4%) | 2,077 (36.5%) |
| Transportation | 1,098 (78.9%) | 294 (21.1%) |
| Material Moving | 1,634 (63.3%) | 949 (36.7%) |
| Total (Category) | 6,338 (65.6%) | 3,320 (34.4%) |
| Total (Overall) | 22,406 (51.7%) | 20,888 (48.2%) |
Employment Industries by Sex in Cleveland County
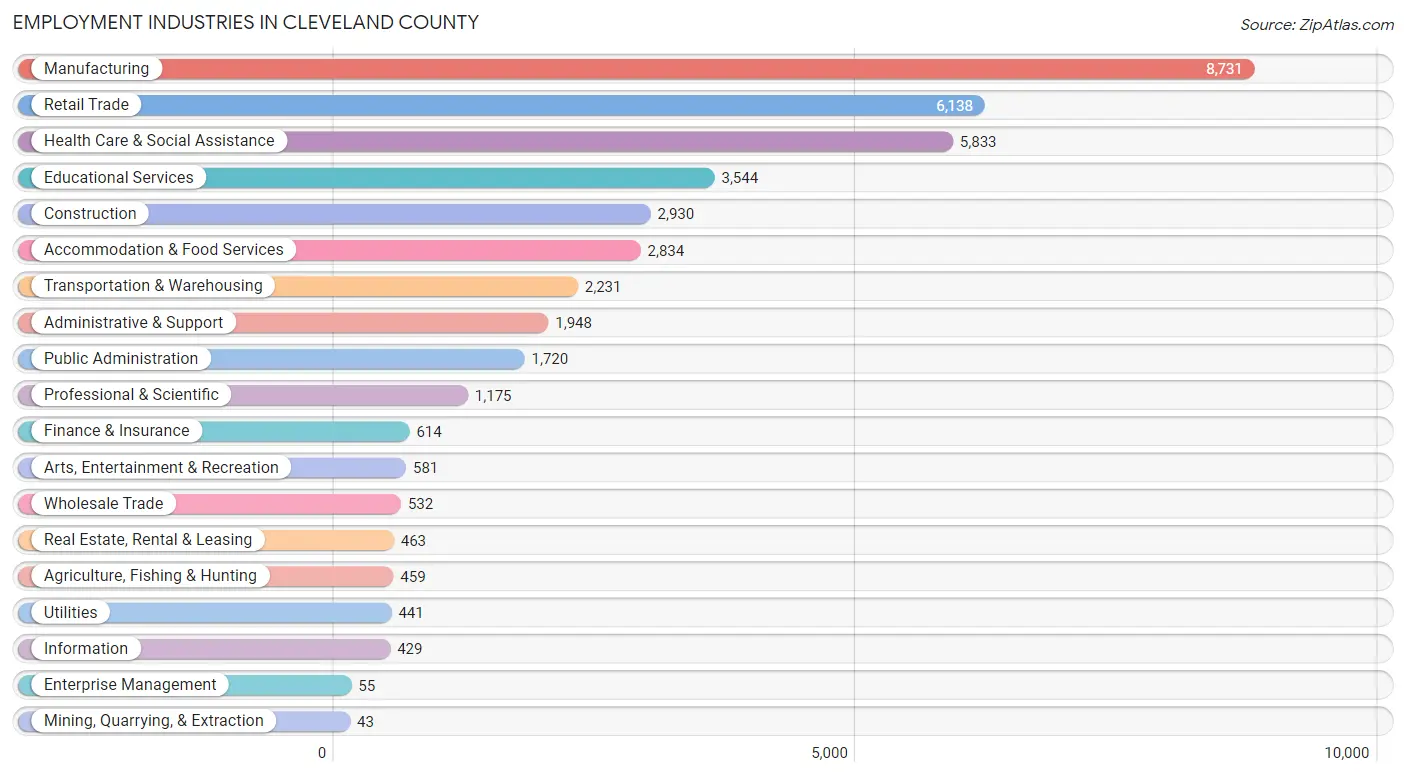
Employment Industries in Cleveland County
The major employment industries in Cleveland County include Manufacturing (8,731 | 20.2%), Retail Trade (6,138 | 14.2%), Health Care & Social Assistance (5,833 | 13.5%), Educational Services (3,544 | 8.2%), and Construction (2,930 | 6.8%).
Employment Industries by Sex in Cleveland County
The Cleveland County industries that see more men than women are Mining, Quarrying, & Extraction (100.0%), Construction (86.7%), and Utilities (86.6%), whereas the industries that tend to have a higher number of women are Health Care & Social Assistance (84.3%), Educational Services (76.6%), and Enterprise Management (70.9%).
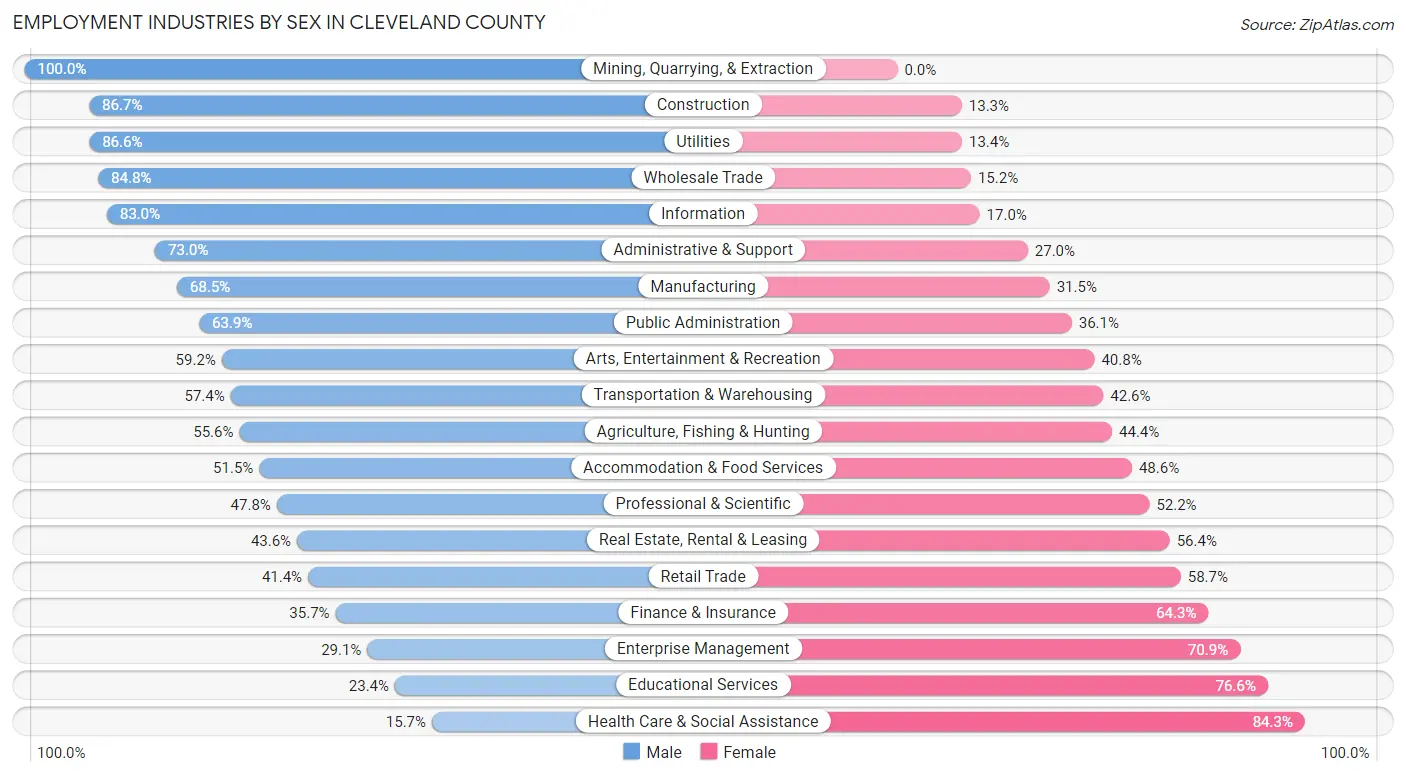
| Industry | Male | Female |
| Agriculture, Fishing & Hunting | 255 (55.6%) | 204 (44.4%) |
| Mining, Quarrying, & Extraction | 43 (100.0%) | 0 (0.0%) |
| Construction | 2,539 (86.7%) | 391 (13.3%) |
| Manufacturing | 5,978 (68.5%) | 2,753 (31.5%) |
| Wholesale Trade | 451 (84.8%) | 81 (15.2%) |
| Retail Trade | 2,538 (41.3%) | 3,600 (58.7%) |
| Transportation & Warehousing | 1,280 (57.4%) | 951 (42.6%) |
| Utilities | 382 (86.6%) | 59 (13.4%) |
| Information | 356 (83.0%) | 73 (17.0%) |
| Finance & Insurance | 219 (35.7%) | 395 (64.3%) |
| Real Estate, Rental & Leasing | 202 (43.6%) | 261 (56.4%) |
| Professional & Scientific | 562 (47.8%) | 613 (52.2%) |
| Enterprise Management | 16 (29.1%) | 39 (70.9%) |
| Administrative & Support | 1,422 (73.0%) | 526 (27.0%) |
| Educational Services | 828 (23.4%) | 2,716 (76.6%) |
| Health Care & Social Assistance | 916 (15.7%) | 4,917 (84.3%) |
| Arts, Entertainment & Recreation | 344 (59.2%) | 237 (40.8%) |
| Accommodation & Food Services | 1,458 (51.4%) | 1,376 (48.5%) |
| Public Administration | 1,099 (63.9%) | 621 (36.1%) |
| Total | 22,406 (51.7%) | 20,888 (48.2%) |
Education in Cleveland County
School Enrollment in Cleveland County
The most common levels of schooling among the 22,317 students in Cleveland County are elementary school (5,083 | 22.8%), high school (4,973 | 22.3%), and middle school (4,879 | 21.9%).
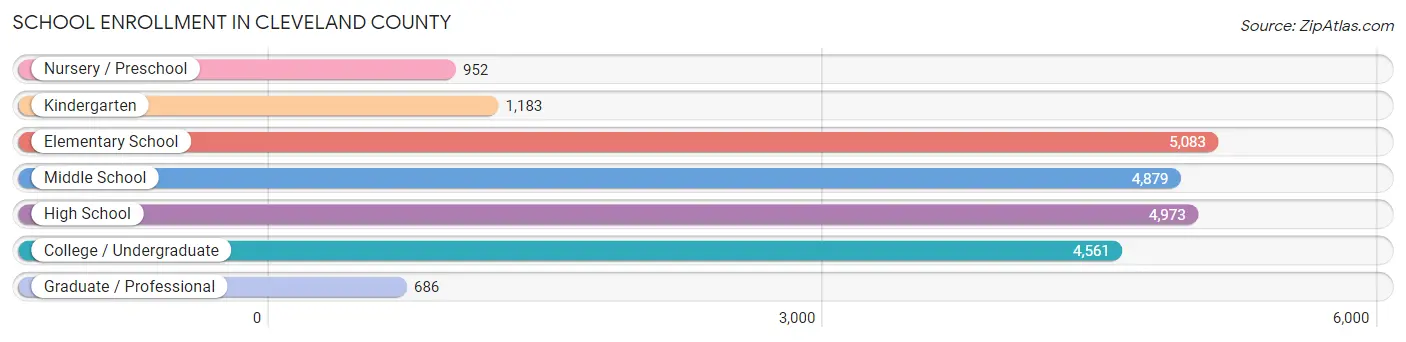
| School Level | # Students | % Students |
| Nursery / Preschool | 952 | 4.3% |
| Kindergarten | 1,183 | 5.3% |
| Elementary School | 5,083 | 22.8% |
| Middle School | 4,879 | 21.9% |
| High School | 4,973 | 22.3% |
| College / Undergraduate | 4,561 | 20.4% |
| Graduate / Professional | 686 | 3.1% |
| Total | 22,317 | 100.0% |
School Enrollment by Age by Funding Source in Cleveland County
Out of a total of 22,317 students who are enrolled in schools in Cleveland County, 3,191 (14.3%) attend a private institution, while the remaining 19,126 (85.7%) are enrolled in public schools. The age group of 20 to 24 year olds has the highest likelihood of being enrolled in private schools, with 846 (41.9% in the age bracket) enrolled. Conversely, the age group of 5 to 9 year old has the lowest likelihood of being enrolled in a private school, with 5,541 (93.7% in the age bracket) attending a public institution.
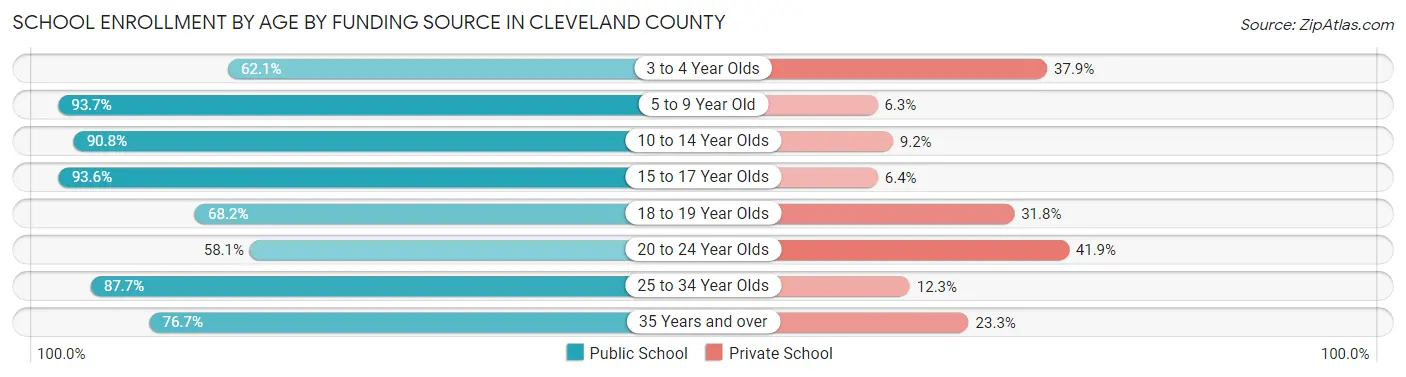
| Age Bracket | Public School | Private School |
| 3 to 4 Year Olds | 436 (62.1%) | 266 (37.9%) |
| 5 to 9 Year Old | 5,541 (93.7%) | 372 (6.3%) |
| 10 to 14 Year Olds | 5,614 (90.8%) | 566 (9.2%) |
| 15 to 17 Year Olds | 3,444 (93.6%) | 234 (6.4%) |
| 18 to 19 Year Olds | 1,151 (68.2%) | 536 (31.8%) |
| 20 to 24 Year Olds | 1,171 (58.1%) | 846 (41.9%) |
| 25 to 34 Year Olds | 1,074 (87.7%) | 151 (12.3%) |
| 35 Years and over | 702 (76.7%) | 213 (23.3%) |
| Total | 19,126 (85.7%) | 3,191 (14.3%) |
Educational Attainment by Field of Study in Cleveland County
Education (2,719 | 19.1%), business (2,714 | 19.1%), science & technology (2,229 | 15.7%), arts & humanities (1,133 | 8.0%), and liberal arts & history (927 | 6.5%) are the most common fields of study among 14,207 individuals in Cleveland County who have obtained a bachelor's degree or higher.
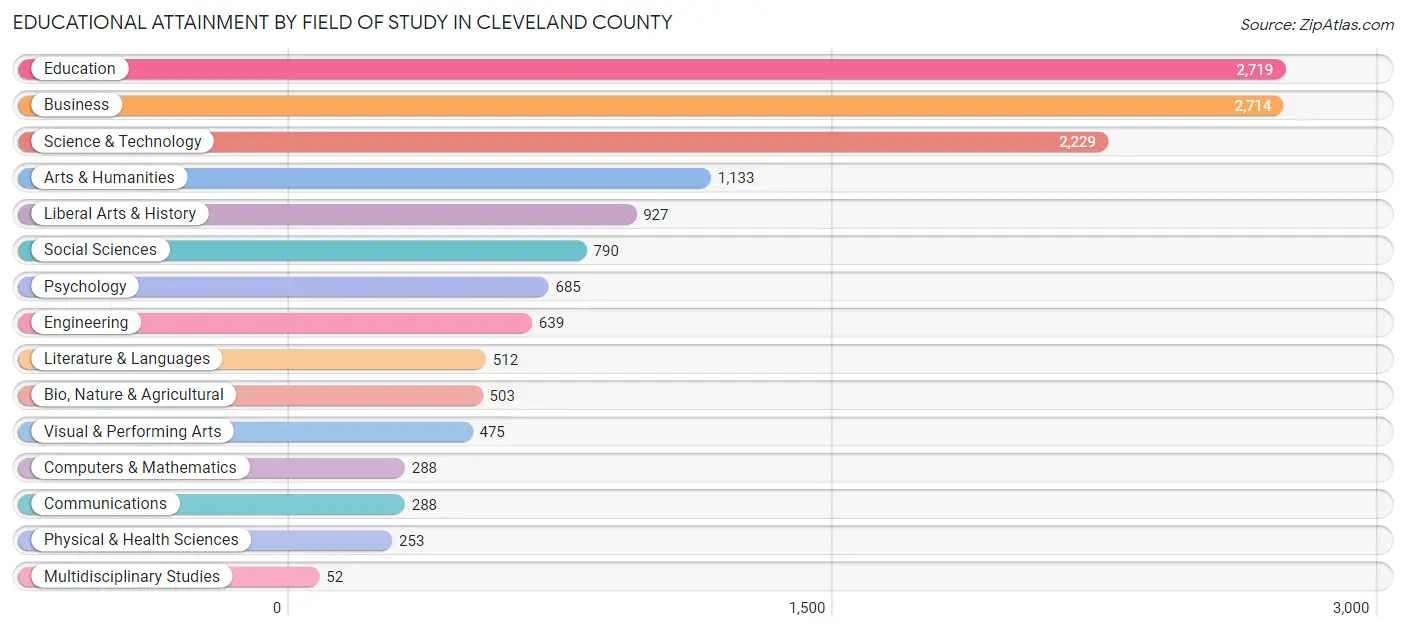
| Field of Study | # Graduates | % Graduates |
| Computers & Mathematics | 288 | 2.0% |
| Bio, Nature & Agricultural | 503 | 3.5% |
| Physical & Health Sciences | 253 | 1.8% |
| Psychology | 685 | 4.8% |
| Social Sciences | 790 | 5.6% |
| Engineering | 639 | 4.5% |
| Multidisciplinary Studies | 52 | 0.4% |
| Science & Technology | 2,229 | 15.7% |
| Business | 2,714 | 19.1% |
| Education | 2,719 | 19.1% |
| Literature & Languages | 512 | 3.6% |
| Liberal Arts & History | 927 | 6.5% |
| Visual & Performing Arts | 475 | 3.3% |
| Communications | 288 | 2.0% |
| Arts & Humanities | 1,133 | 8.0% |
| Total | 14,207 | 100.0% |
Transportation & Commute in Cleveland County
Vehicle Availability by Sex in Cleveland County
The most prevalent vehicle ownership categories in Cleveland County are males with 2 vehicles (8,196, accounting for 37.3%) and females with 2 vehicles (6,635, making up 40.5%).
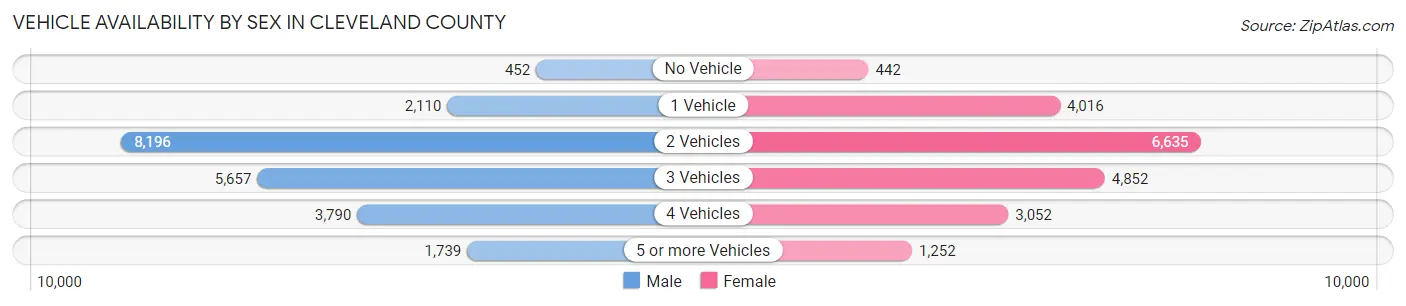
| Vehicles Available | Male | Female |
| No Vehicle | 452 (2.1%) | 442 (2.2%) |
| 1 Vehicle | 2,110 (9.6%) | 4,016 (19.8%) |
| 2 Vehicles | 8,196 (37.3%) | 6,635 (32.8%) |
| 3 Vehicles | 5,657 (25.8%) | 4,852 (24.0%) |
| 4 Vehicles | 3,790 (17.3%) | 3,052 (15.1%) |
| 5 or more Vehicles | 1,739 (7.9%) | 1,252 (6.2%) |
| Total | 21,944 (100.0%) | 20,249 (100.0%) |
Commute Time in Cleveland County
The most frequently occuring commute durations in Cleveland County are 20 to 24 minutes (6,741 commuters, 16.8%), 10 to 14 minutes (5,965 commuters, 14.9%), and 15 to 19 minutes (5,825 commuters, 14.5%).
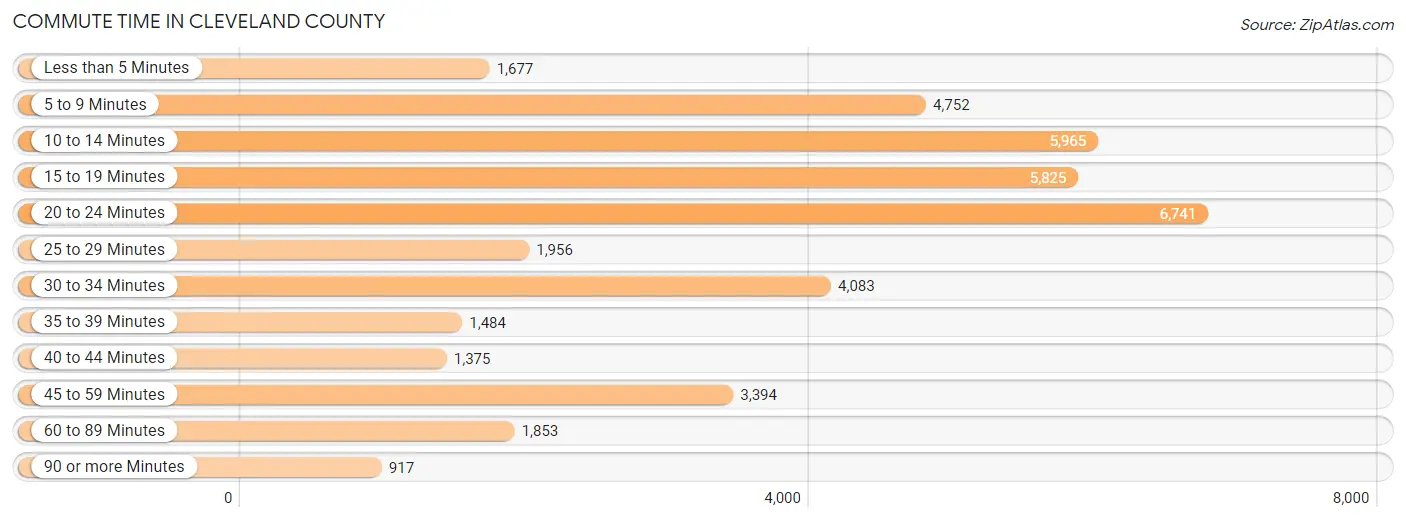
| Commute Time | # Commuters | % Commuters |
| Less than 5 Minutes | 1,677 | 4.2% |
| 5 to 9 Minutes | 4,752 | 11.9% |
| 10 to 14 Minutes | 5,965 | 14.9% |
| 15 to 19 Minutes | 5,825 | 14.5% |
| 20 to 24 Minutes | 6,741 | 16.8% |
| 25 to 29 Minutes | 1,956 | 4.9% |
| 30 to 34 Minutes | 4,083 | 10.2% |
| 35 to 39 Minutes | 1,484 | 3.7% |
| 40 to 44 Minutes | 1,375 | 3.4% |
| 45 to 59 Minutes | 3,394 | 8.5% |
| 60 to 89 Minutes | 1,853 | 4.6% |
| 90 or more Minutes | 917 | 2.3% |
Commute Time by Sex in Cleveland County
The most common commute times in Cleveland County are 20 to 24 minutes (3,116 commuters, 15.1%) for males and 20 to 24 minutes (3,625 commuters, 18.7%) for females.
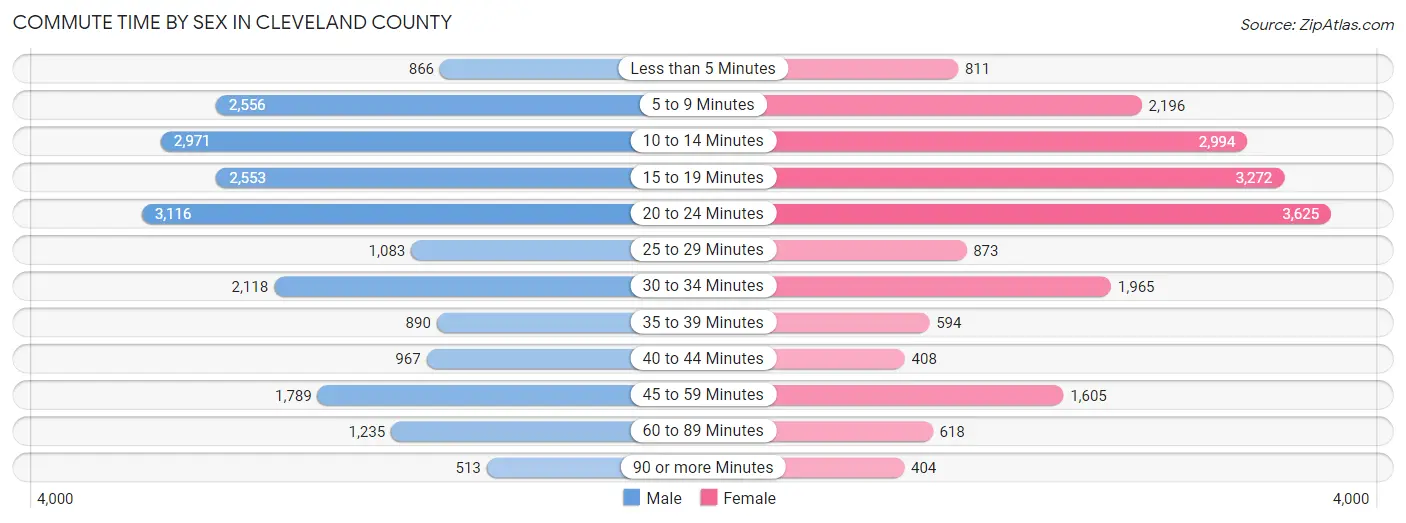
| Commute Time | Male | Female |
| Less than 5 Minutes | 866 (4.2%) | 811 (4.2%) |
| 5 to 9 Minutes | 2,556 (12.4%) | 2,196 (11.3%) |
| 10 to 14 Minutes | 2,971 (14.4%) | 2,994 (15.5%) |
| 15 to 19 Minutes | 2,553 (12.4%) | 3,272 (16.9%) |
| 20 to 24 Minutes | 3,116 (15.1%) | 3,625 (18.7%) |
| 25 to 29 Minutes | 1,083 (5.2%) | 873 (4.5%) |
| 30 to 34 Minutes | 2,118 (10.2%) | 1,965 (10.2%) |
| 35 to 39 Minutes | 890 (4.3%) | 594 (3.1%) |
| 40 to 44 Minutes | 967 (4.7%) | 408 (2.1%) |
| 45 to 59 Minutes | 1,789 (8.7%) | 1,605 (8.3%) |
| 60 to 89 Minutes | 1,235 (6.0%) | 618 (3.2%) |
| 90 or more Minutes | 513 (2.5%) | 404 (2.1%) |
Time of Departure to Work by Sex in Cleveland County
The most frequent times of departure to work in Cleveland County are 7:30 AM to 7:59 AM (3,619, 17.5%) for males and 7:30 AM to 7:59 AM (4,467, 23.1%) for females.

| Time of Departure | Male | Female |
| 12:00 AM to 4:59 AM | 1,398 (6.8%) | 528 (2.7%) |
| 5:00 AM to 5:29 AM | 1,201 (5.8%) | 587 (3.0%) |
| 5:30 AM to 5:59 AM | 1,488 (7.2%) | 882 (4.5%) |
| 6:00 AM to 6:29 AM | 1,482 (7.2%) | 1,212 (6.3%) |
| 6:30 AM to 6:59 AM | 1,874 (9.1%) | 1,390 (7.2%) |
| 7:00 AM to 7:29 AM | 2,438 (11.8%) | 2,695 (13.9%) |
| 7:30 AM to 7:59 AM | 3,619 (17.5%) | 4,467 (23.1%) |
| 8:00 AM to 8:29 AM | 1,563 (7.6%) | 1,601 (8.3%) |
| 8:30 AM to 8:59 AM | 826 (4.0%) | 1,075 (5.6%) |
| 9:00 AM to 9:59 AM | 626 (3.0%) | 1,444 (7.5%) |
| 10:00 AM to 10:59 AM | 514 (2.5%) | 383 (2.0%) |
| 11:00 AM to 11:59 AM | 251 (1.2%) | 128 (0.7%) |
| 12:00 PM to 3:59 PM | 1,805 (8.7%) | 1,294 (6.7%) |
| 4:00 PM to 11:59 PM | 1,572 (7.6%) | 1,679 (8.7%) |
| Total | 20,657 (100.0%) | 19,365 (100.0%) |
Housing Occupancy in Cleveland County
Occupancy by Ownership in Cleveland County
Of the total 36,567 dwellings in Cleveland County, owner-occupied units account for 25,481 (69.7%), while renter-occupied units make up 11,086 (30.3%).
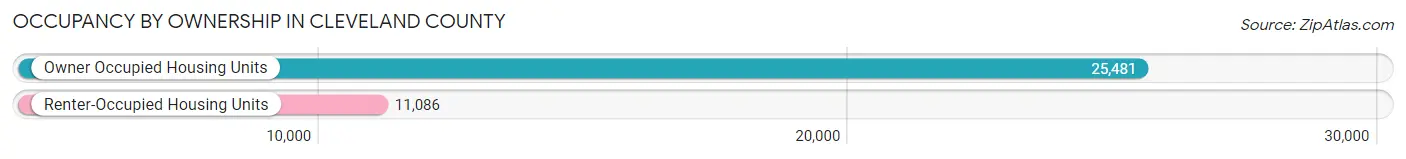
| Occupancy | # Housing Units | % Housing Units |
| Owner Occupied Housing Units | 25,481 | 69.7% |
| Renter-Occupied Housing Units | 11,086 | 30.3% |
| Total Occupied Housing Units | 36,567 | 100.0% |
Occupancy by Household Size in Cleveland County
| Household Size | # Housing Units | % Housing Units |
| 1-Person Household | 10,331 | 28.2% |
| 2-Person Household | 13,177 | 36.0% |
| 3-Person Household | 5,827 | 15.9% |
| 4+ Person Household | 7,232 | 19.8% |
| Total Housing Units | 36,567 | 100.0% |
Occupancy by Ownership by Household Size in Cleveland County
| Household Size | Owner-occupied | Renter-occupied |
| 1-Person Household | 6,358 (61.5%) | 3,973 (38.5%) |
| 2-Person Household | 10,087 (76.5%) | 3,090 (23.4%) |
| 3-Person Household | 4,276 (73.4%) | 1,551 (26.6%) |
| 4+ Person Household | 4,760 (65.8%) | 2,472 (34.2%) |
| Total Housing Units | 25,481 (69.7%) | 11,086 (30.3%) |
Occupancy by Educational Attainment in Cleveland County
| Household Size | Owner-occupied | Renter-occupied |
| Less than High School | 2,781 (62.3%) | 1,686 (37.7%) |
| High School Diploma | 7,175 (62.8%) | 4,256 (37.2%) |
| College/Associate Degree | 8,962 (69.6%) | 3,907 (30.4%) |
| Bachelor's Degree or higher | 6,563 (84.1%) | 1,237 (15.9%) |
Occupancy by Age of Householder in Cleveland County
| Age Bracket | # Households | % Households |
| Under 35 Years | 5,336 | 14.6% |
| 35 to 44 Years | 4,905 | 13.4% |
| 45 to 54 Years | 6,745 | 18.4% |
| 55 to 64 Years | 7,915 | 21.6% |
| 65 to 74 Years | 6,922 | 18.9% |
| 75 to 84 Years | 3,123 | 8.5% |
| 85 Years and Over | 1,621 | 4.4% |
| Total | 36,567 | 100.0% |
Housing Finances in Cleveland County
Median Income by Occupancy in Cleveland County
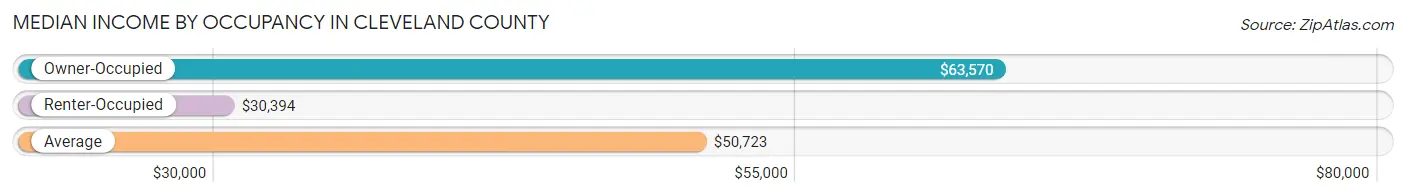
| Occupancy Type | # Households | Median Income |
| Owner-Occupied | 25,481 (69.7%) | $63,570 |
| Renter-Occupied | 11,086 (30.3%) | $30,394 |
| Average | 36,567 (100.0%) | $50,723 |
Occupancy by Householder Income Bracket in Cleveland County
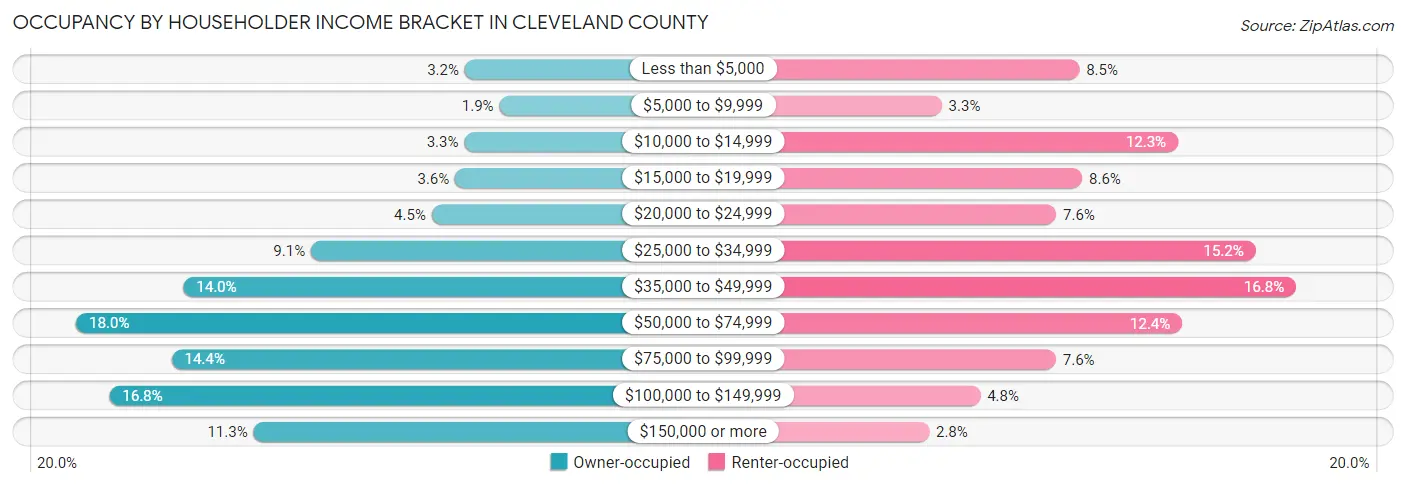
| Income Bracket | Owner-occupied | Renter-occupied |
| Less than $5,000 | 822 (3.2%) | 945 (8.5%) |
| $5,000 to $9,999 | 486 (1.9%) | 364 (3.3%) |
| $10,000 to $14,999 | 829 (3.3%) | 1,361 (12.3%) |
| $15,000 to $19,999 | 918 (3.6%) | 957 (8.6%) |
| $20,000 to $24,999 | 1,144 (4.5%) | 847 (7.6%) |
| $25,000 to $34,999 | 2,315 (9.1%) | 1,690 (15.2%) |
| $35,000 to $49,999 | 3,554 (14.0%) | 1,860 (16.8%) |
| $50,000 to $74,999 | 4,598 (18.0%) | 1,379 (12.4%) |
| $75,000 to $99,999 | 3,670 (14.4%) | 846 (7.6%) |
| $100,000 to $149,999 | 4,272 (16.8%) | 527 (4.8%) |
| $150,000 or more | 2,873 (11.3%) | 310 (2.8%) |
| Total | 25,481 (100.0%) | 11,086 (100.0%) |
Monthly Housing Cost Tiers in Cleveland County
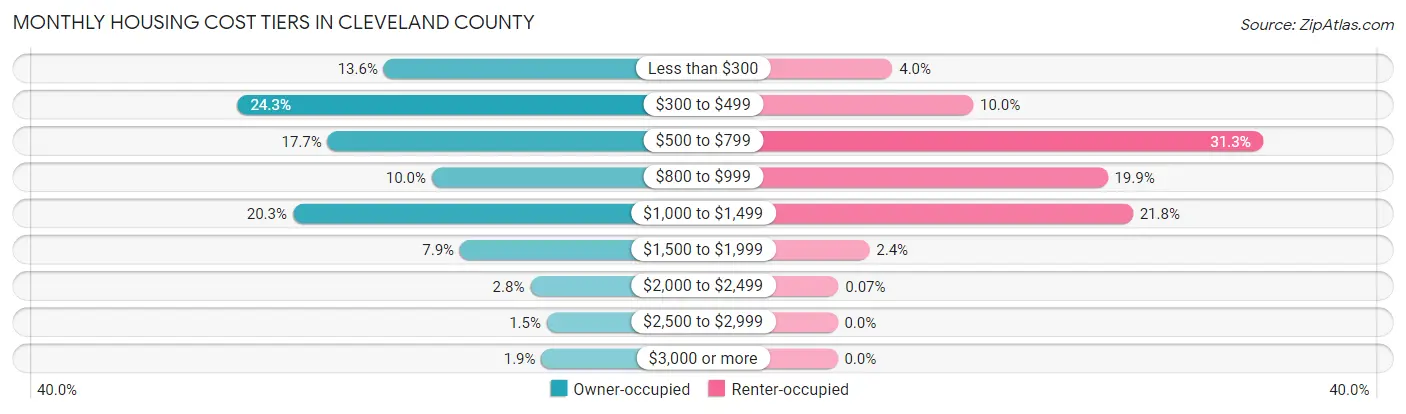
| Monthly Cost | Owner-occupied | Renter-occupied |
| Less than $300 | 3,452 (13.6%) | 448 (4.0%) |
| $300 to $499 | 6,196 (24.3%) | 1,108 (10.0%) |
| $500 to $799 | 4,508 (17.7%) | 3,471 (31.3%) |
| $800 to $999 | 2,550 (10.0%) | 2,205 (19.9%) |
| $1,000 to $1,499 | 5,160 (20.3%) | 2,411 (21.7%) |
| $1,500 to $1,999 | 2,024 (7.9%) | 261 (2.4%) |
| $2,000 to $2,499 | 704 (2.8%) | 8 (0.1%) |
| $2,500 to $2,999 | 392 (1.5%) | 0 (0.0%) |
| $3,000 or more | 495 (1.9%) | 0 (0.0%) |
| Total | 25,481 (100.0%) | 11,086 (100.0%) |
Physical Housing Characteristics in Cleveland County
Housing Structures in Cleveland County
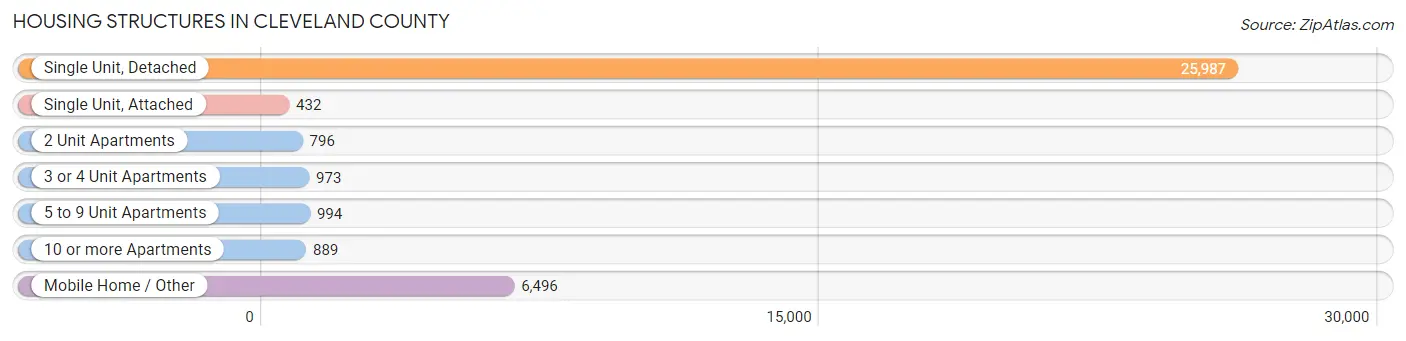
| Structure Type | # Housing Units | % Housing Units |
| Single Unit, Detached | 25,987 | 71.1% |
| Single Unit, Attached | 432 | 1.2% |
| 2 Unit Apartments | 796 | 2.2% |
| 3 or 4 Unit Apartments | 973 | 2.7% |
| 5 to 9 Unit Apartments | 994 | 2.7% |
| 10 or more Apartments | 889 | 2.4% |
| Mobile Home / Other | 6,496 | 17.8% |
| Total | 36,567 | 100.0% |
Housing Structures by Occupancy in Cleveland County
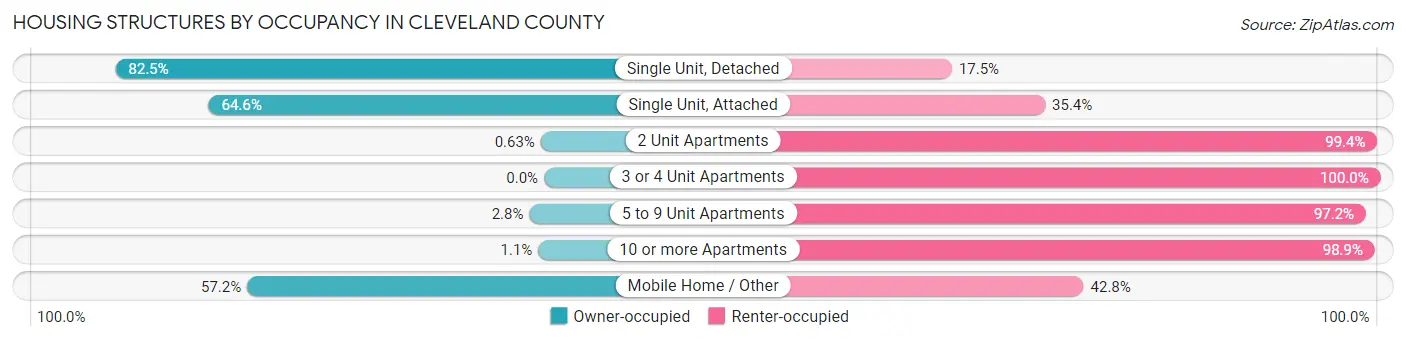
| Structure Type | Owner-occupied | Renter-occupied |
| Single Unit, Detached | 21,445 (82.5%) | 4,542 (17.5%) |
| Single Unit, Attached | 279 (64.6%) | 153 (35.4%) |
| 2 Unit Apartments | 5 (0.6%) | 791 (99.4%) |
| 3 or 4 Unit Apartments | 0 (0.0%) | 973 (100.0%) |
| 5 to 9 Unit Apartments | 28 (2.8%) | 966 (97.2%) |
| 10 or more Apartments | 10 (1.1%) | 879 (98.9%) |
| Mobile Home / Other | 3,714 (57.2%) | 2,782 (42.8%) |
| Total | 25,481 (69.7%) | 11,086 (30.3%) |
Housing Structures by Number of Rooms in Cleveland County
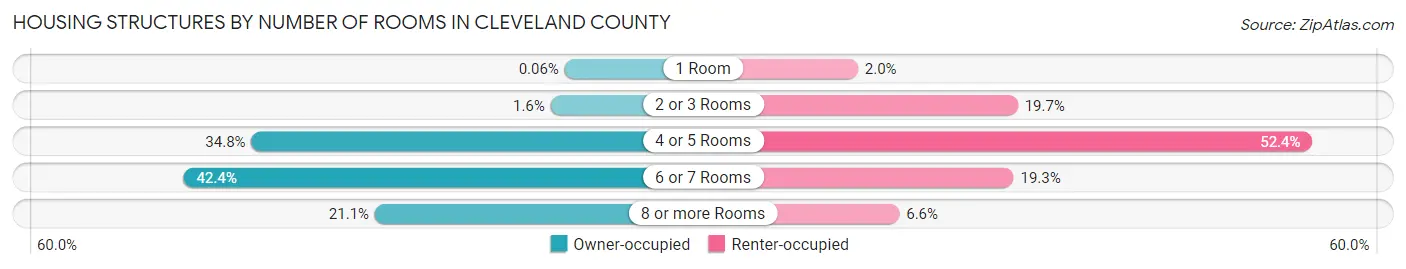
| Number of Rooms | Owner-occupied | Renter-occupied |
| 1 Room | 15 (0.1%) | 221 (2.0%) |
| 2 or 3 Rooms | 414 (1.6%) | 2,187 (19.7%) |
| 4 or 5 Rooms | 8,875 (34.8%) | 5,811 (52.4%) |
| 6 or 7 Rooms | 10,795 (42.4%) | 2,136 (19.3%) |
| 8 or more Rooms | 5,382 (21.1%) | 731 (6.6%) |
| Total | 25,481 (100.0%) | 11,086 (100.0%) |
Housing Structure by Heating Type in Cleveland County
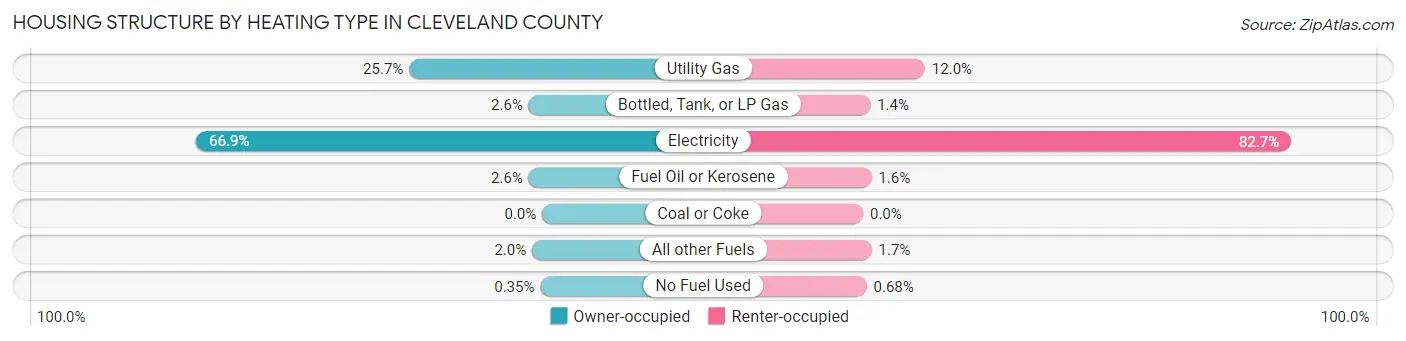
| Heating Type | Owner-occupied | Renter-occupied |
| Utility Gas | 6,546 (25.7%) | 1,325 (11.9%) |
| Bottled, Tank, or LP Gas | 658 (2.6%) | 153 (1.4%) |
| Electricity | 17,036 (66.9%) | 9,169 (82.7%) |
| Fuel Oil or Kerosene | 657 (2.6%) | 181 (1.6%) |
| Coal or Coke | 0 (0.0%) | 0 (0.0%) |
| All other Fuels | 496 (1.9%) | 183 (1.7%) |
| No Fuel Used | 88 (0.4%) | 75 (0.7%) |
| Total | 25,481 (100.0%) | 11,086 (100.0%) |
Household Vehicle Usage in Cleveland County

| Vehicles per Household | Owner-occupied | Renter-occupied |
| No Vehicle | 1,065 (4.2%) | 1,315 (11.9%) |
| 1 Vehicle | 5,353 (21.0%) | 5,344 (48.2%) |
| 2 Vehicles | 9,284 (36.4%) | 3,085 (27.8%) |
| 3 or more Vehicles | 9,779 (38.4%) | 1,342 (12.1%) |
| Total | 25,481 (100.0%) | 11,086 (100.0%) |
Real Estate & Mortgages in Cleveland County
Real Estate and Mortgage Overview in Cleveland County
| Characteristic | Without Mortgage | With Mortgage |
| Housing Units | 12,642 | 12,839 |
| Median Property Value | $130,600 | $171,700 |
| Median Household Income | $50,170 | $1,885 |
| Monthly Housing Costs | $385 | $466 |
| Real Estate Taxes | $976 | $322 |
Property Value by Mortgage Status in Cleveland County
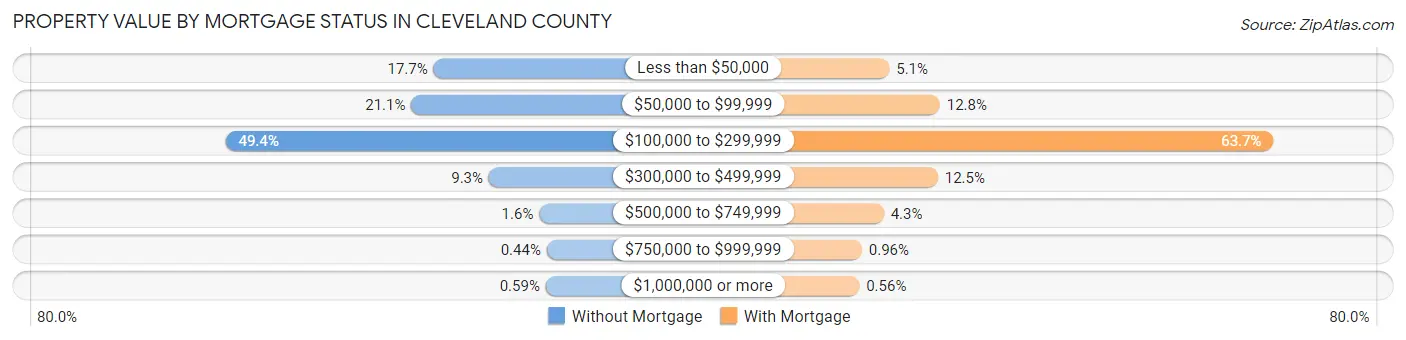
| Property Value | Without Mortgage | With Mortgage |
| Less than $50,000 | 2,235 (17.7%) | 660 (5.1%) |
| $50,000 to $99,999 | 2,665 (21.1%) | 1,649 (12.8%) |
| $100,000 to $299,999 | 6,242 (49.4%) | 8,175 (63.7%) |
| $300,000 to $499,999 | 1,169 (9.2%) | 1,609 (12.5%) |
| $500,000 to $749,999 | 200 (1.6%) | 551 (4.3%) |
| $750,000 to $999,999 | 56 (0.4%) | 123 (1.0%) |
| $1,000,000 or more | 75 (0.6%) | 72 (0.6%) |
| Total | 12,642 (100.0%) | 12,839 (100.0%) |
Household Income by Mortgage Status in Cleveland County
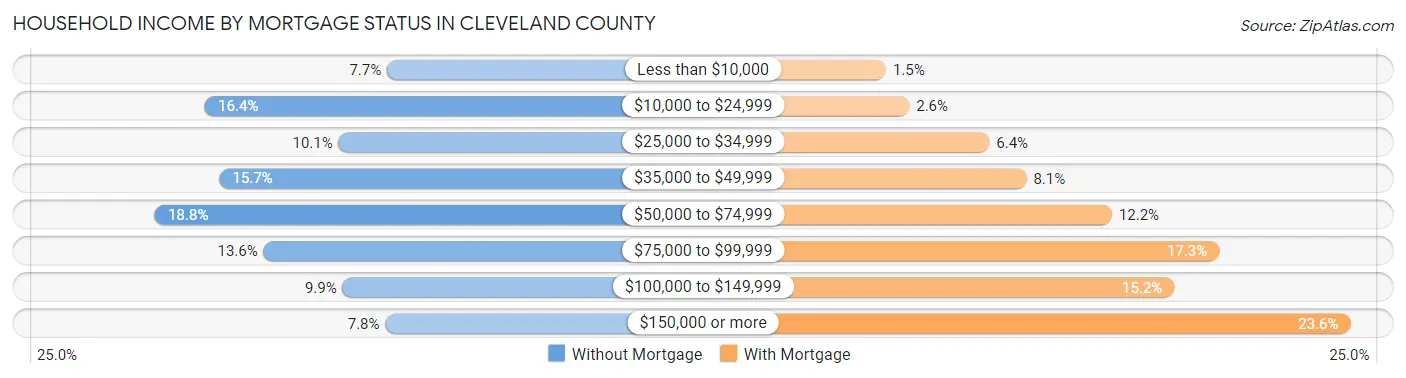
| Household Income | Without Mortgage | With Mortgage |
| Less than $10,000 | 979 (7.7%) | 186 (1.5%) |
| $10,000 to $24,999 | 2,073 (16.4%) | 329 (2.6%) |
| $25,000 to $34,999 | 1,270 (10.1%) | 818 (6.4%) |
| $35,000 to $49,999 | 1,987 (15.7%) | 1,045 (8.1%) |
| $50,000 to $74,999 | 2,376 (18.8%) | 1,567 (12.2%) |
| $75,000 to $99,999 | 1,722 (13.6%) | 2,222 (17.3%) |
| $100,000 to $149,999 | 1,247 (9.9%) | 1,948 (15.2%) |
| $150,000 or more | 988 (7.8%) | 3,025 (23.6%) |
| Total | 12,642 (100.0%) | 12,839 (100.0%) |
Property Value to Household Income Ratio in Cleveland County
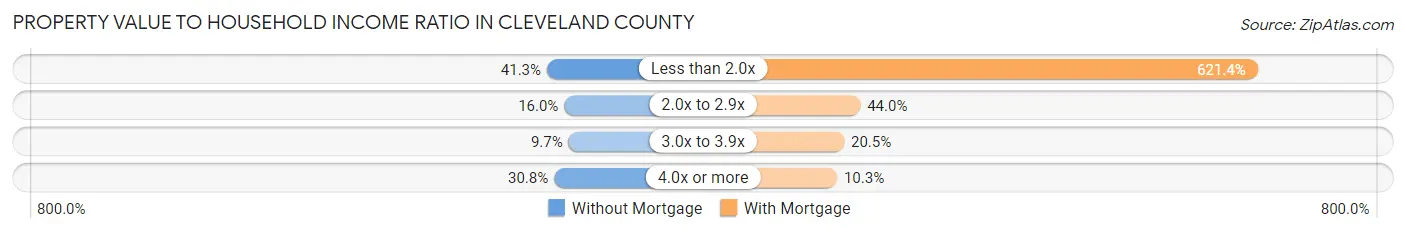
| Value-to-Income Ratio | Without Mortgage | With Mortgage |
| Less than 2.0x | 5,215 (41.2%) | 79,784 (621.4%) |
| 2.0x to 2.9x | 2,028 (16.0%) | 5,653 (44.0%) |
| 3.0x to 3.9x | 1,223 (9.7%) | 2,631 (20.5%) |
| 4.0x or more | 3,887 (30.7%) | 1,317 (10.3%) |
| Total | 12,642 (100.0%) | 12,839 (100.0%) |
Real Estate Taxes by Mortgage Status in Cleveland County
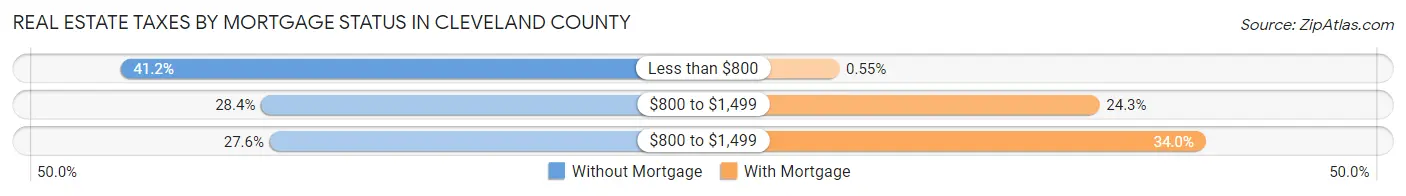
| Property Taxes | Without Mortgage | With Mortgage |
| Less than $800 | 5,214 (41.2%) | 71 (0.5%) |
| $800 to $1,499 | 3,589 (28.4%) | 3,123 (24.3%) |
| $800 to $1,499 | 3,491 (27.6%) | 4,370 (34.0%) |
| Total | 12,642 (100.0%) | 12,839 (100.0%) |
Health & Disability in Cleveland County
Health Insurance Coverage by Age in Cleveland County
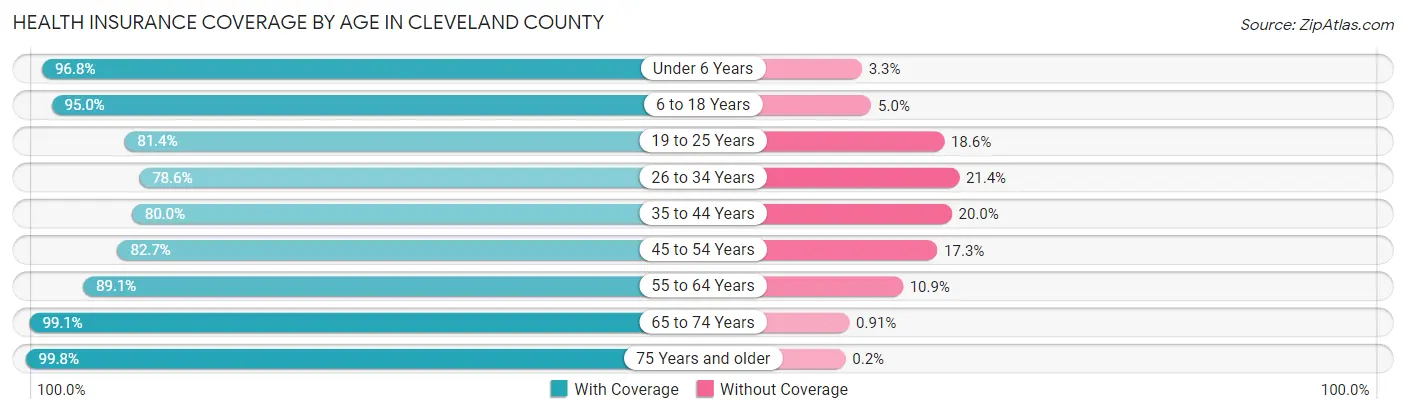
| Age Bracket | With Coverage | Without Coverage |
| Under 6 Years | 6,608 (96.8%) | 222 (3.3%) |
| 6 to 18 Years | 15,638 (95.0%) | 825 (5.0%) |
| 19 to 25 Years | 7,279 (81.4%) | 1,662 (18.6%) |
| 26 to 34 Years | 8,553 (78.6%) | 2,326 (21.4%) |
| 35 to 44 Years | 8,714 (80.0%) | 2,179 (20.0%) |
| 45 to 54 Years | 10,612 (82.7%) | 2,223 (17.3%) |
| 55 to 64 Years | 12,357 (89.1%) | 1,510 (10.9%) |
| 65 to 74 Years | 11,081 (99.1%) | 102 (0.9%) |
| 75 Years and older | 7,153 (99.8%) | 14 (0.2%) |
| Total | 87,995 (88.8%) | 11,063 (11.2%) |
Health Insurance Coverage by Citizenship Status in Cleveland County
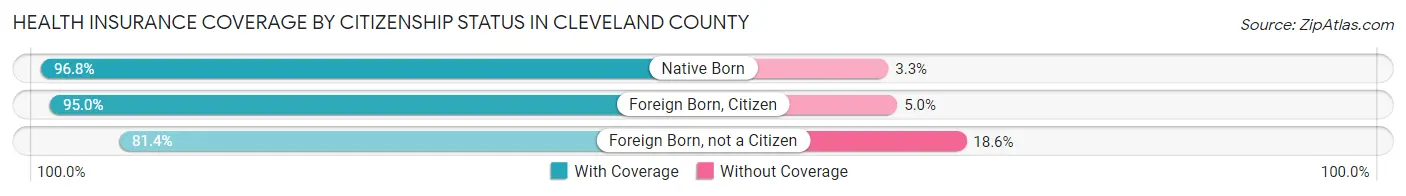
| Citizenship Status | With Coverage | Without Coverage |
| Native Born | 6,608 (96.8%) | 222 (3.3%) |
| Foreign Born, Citizen | 15,638 (95.0%) | 825 (5.0%) |
| Foreign Born, not a Citizen | 7,279 (81.4%) | 1,662 (18.6%) |
Health Insurance Coverage by Household Income in Cleveland County
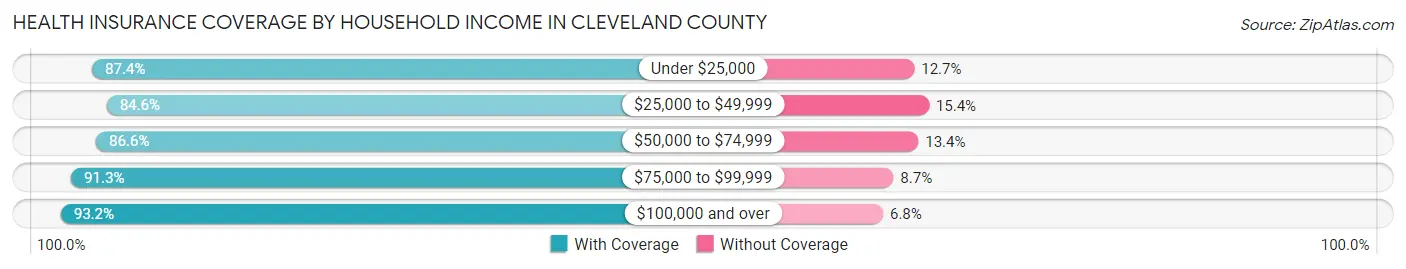
| Household Income | With Coverage | Without Coverage |
| Under $25,000 | 14,267 (87.4%) | 2,067 (12.7%) |
| $25,000 to $49,999 | 20,441 (84.6%) | 3,718 (15.4%) |
| $50,000 to $74,999 | 14,495 (86.6%) | 2,240 (13.4%) |
| $75,000 to $99,999 | 12,734 (91.3%) | 1,218 (8.7%) |
| $100,000 and over | 24,705 (93.2%) | 1,801 (6.8%) |
Public vs Private Health Insurance Coverage by Age in Cleveland County
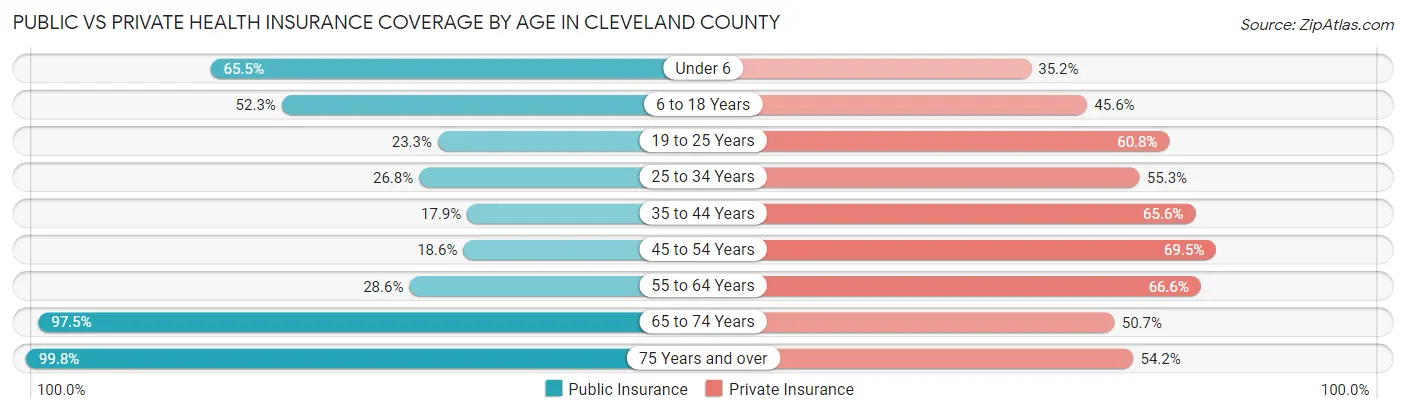
| Age Bracket | Public Insurance | Private Insurance |
| Under 6 | 4,472 (65.5%) | 2,402 (35.2%) |
| 6 to 18 Years | 8,608 (52.3%) | 7,506 (45.6%) |
| 19 to 25 Years | 2,084 (23.3%) | 5,434 (60.8%) |
| 25 to 34 Years | 2,913 (26.8%) | 6,019 (55.3%) |
| 35 to 44 Years | 1,945 (17.9%) | 7,144 (65.6%) |
| 45 to 54 Years | 2,385 (18.6%) | 8,918 (69.5%) |
| 55 to 64 Years | 3,967 (28.6%) | 9,238 (66.6%) |
| 65 to 74 Years | 10,898 (97.5%) | 5,667 (50.7%) |
| 75 Years and over | 7,149 (99.8%) | 3,882 (54.2%) |
| Total | 44,421 (44.8%) | 56,210 (56.7%) |
Disability Status by Sex by Age in Cleveland County

| Age Bracket | Male | Female |
| Under 5 Years | 45 (1.6%) | 19 (0.7%) |
| 5 to 17 Years | 670 (8.1%) | 368 (4.6%) |
| 18 to 34 Years | 1,094 (10.5%) | 688 (6.4%) |
| 35 to 64 Years | 2,970 (16.3%) | 3,259 (16.8%) |
| 65 to 74 Years | 1,602 (30.5%) | 1,762 (29.7%) |
| 75 Years and over | 1,246 (43.5%) | 2,305 (53.6%) |
Disability Class by Sex by Age in Cleveland County
Disability Class: Hearing Difficulty
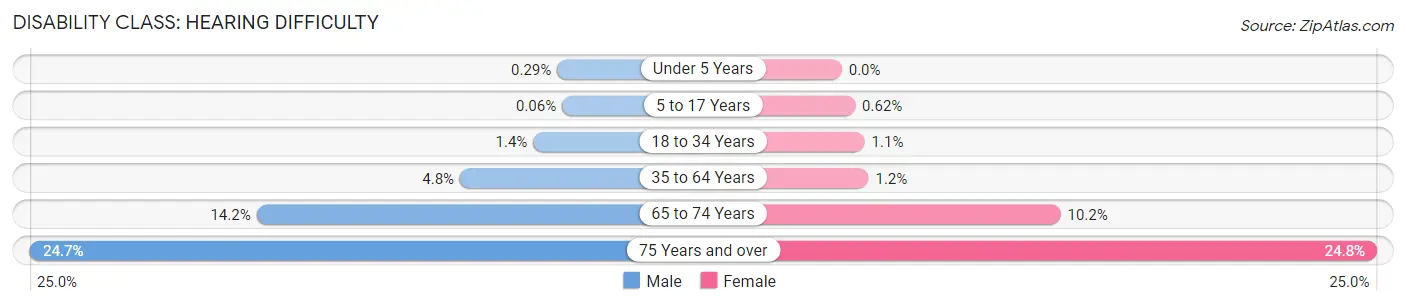
| Age Bracket | Male | Female |
| Under 5 Years | 8 (0.3%) | 0 (0.0%) |
| 5 to 17 Years | 5 (0.1%) | 50 (0.6%) |
| 18 to 34 Years | 145 (1.4%) | 113 (1.1%) |
| 35 to 64 Years | 876 (4.8%) | 239 (1.2%) |
| 65 to 74 Years | 749 (14.2%) | 601 (10.2%) |
| 75 Years and over | 709 (24.7%) | 1,068 (24.8%) |
Disability Class: Vision Difficulty
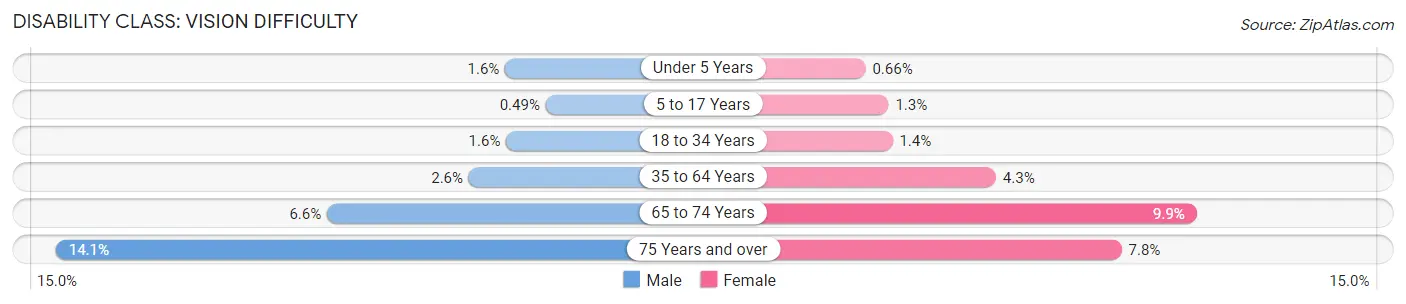
| Age Bracket | Male | Female |
| Under 5 Years | 45 (1.6%) | 19 (0.7%) |
| 5 to 17 Years | 41 (0.5%) | 105 (1.3%) |
| 18 to 34 Years | 165 (1.6%) | 151 (1.4%) |
| 35 to 64 Years | 480 (2.6%) | 831 (4.3%) |
| 65 to 74 Years | 346 (6.6%) | 585 (9.9%) |
| 75 Years and over | 405 (14.1%) | 335 (7.8%) |
Disability Class: Cognitive Difficulty
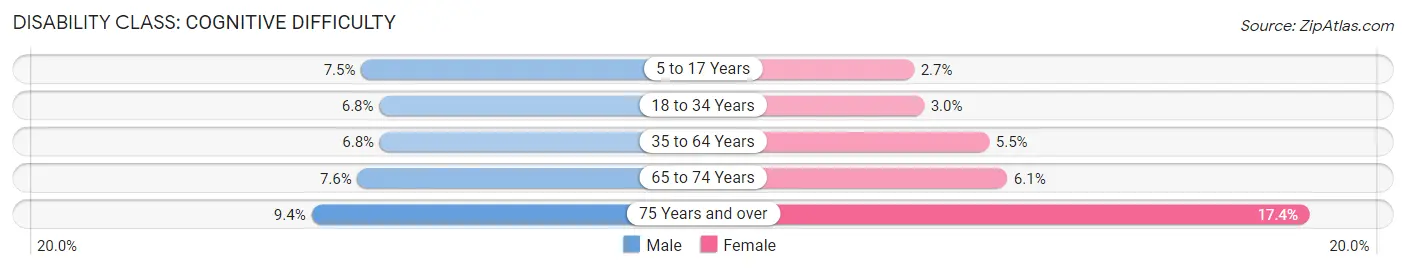
| Age Bracket | Male | Female |
| 5 to 17 Years | 623 (7.5%) | 215 (2.7%) |
| 18 to 34 Years | 709 (6.8%) | 325 (3.0%) |
| 35 to 64 Years | 1,242 (6.8%) | 1,056 (5.5%) |
| 65 to 74 Years | 402 (7.6%) | 363 (6.1%) |
| 75 Years and over | 268 (9.3%) | 747 (17.4%) |
Disability Class: Ambulatory Difficulty
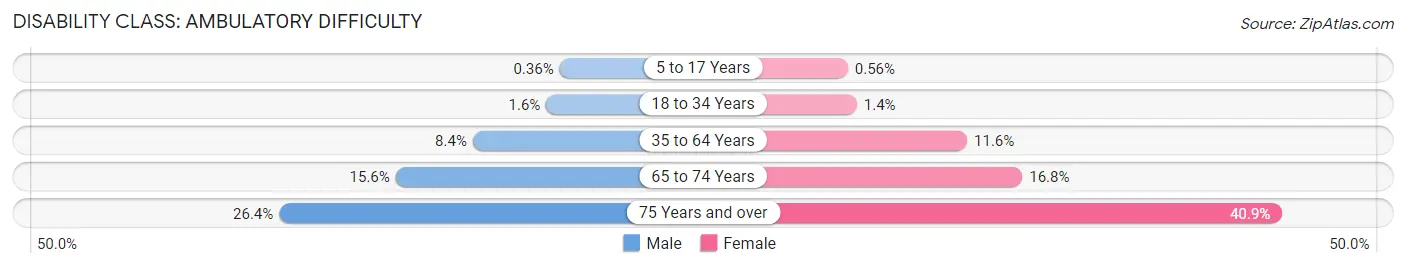
| Age Bracket | Male | Female |
| 5 to 17 Years | 30 (0.4%) | 45 (0.6%) |
| 18 to 34 Years | 165 (1.6%) | 150 (1.4%) |
| 35 to 64 Years | 1,534 (8.4%) | 2,251 (11.6%) |
| 65 to 74 Years | 819 (15.6%) | 992 (16.8%) |
| 75 Years and over | 756 (26.4%) | 1,758 (40.9%) |
Disability Class: Self-Care Difficulty

| Age Bracket | Male | Female |
| 5 to 17 Years | 166 (2.0%) | 63 (0.8%) |
| 18 to 34 Years | 163 (1.6%) | 87 (0.8%) |
| 35 to 64 Years | 415 (2.3%) | 805 (4.2%) |
| 65 to 74 Years | 309 (5.9%) | 309 (5.2%) |
| 75 Years and over | 165 (5.8%) | 859 (20.0%) |
Technology Access in Cleveland County
Computing Device Access in Cleveland County
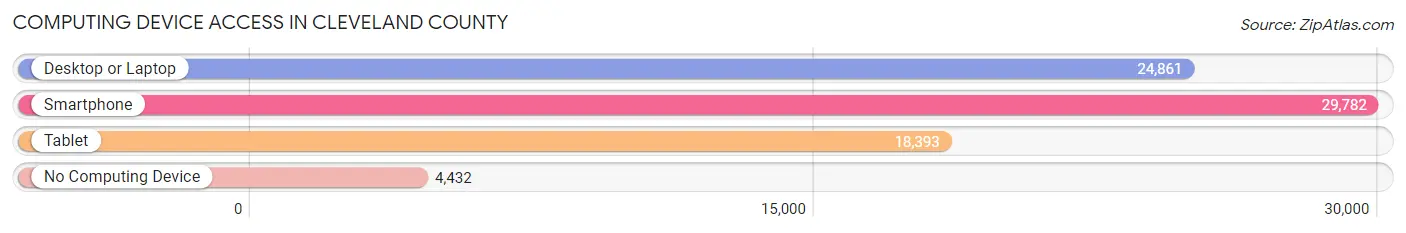
| Device Type | # Households | % Households |
| Desktop or Laptop | 24,861 | 68.0% |
| Smartphone | 29,782 | 81.5% |
| Tablet | 18,393 | 50.3% |
| No Computing Device | 4,432 | 12.1% |
| Total | 36,567 | 100.0% |
Internet Access in Cleveland County
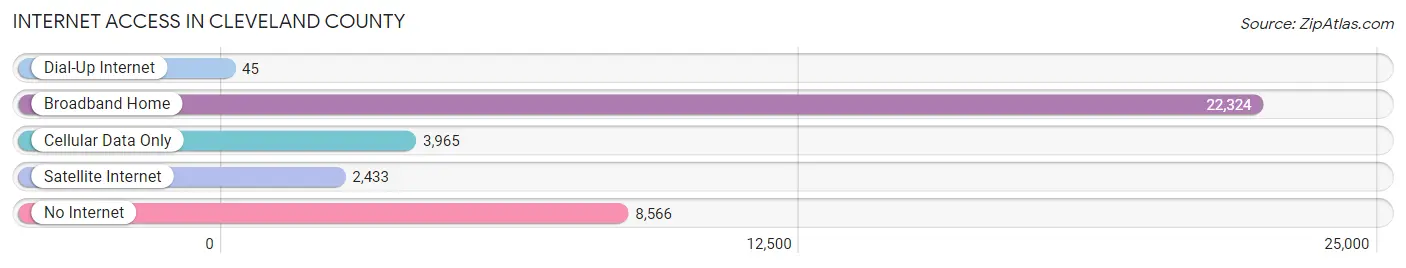
| Internet Type | # Households | % Households |
| Dial-Up Internet | 45 | 0.1% |
| Broadband Home | 22,324 | 61.1% |
| Cellular Data Only | 3,965 | 10.8% |
| Satellite Internet | 2,433 | 6.7% |
| No Internet | 8,566 | 23.4% |
| Total | 36,567 | 100.0% |
Cleveland County Summary
Cleveland County is a county located in the U.S. state of North Carolina. As of the 2010 census, the population was 98,078, making it the 15th most populous county in North Carolina. The county seat is Shelby. Cleveland County is part of the Charlotte-Concord-Gastonia, NC-SC Metropolitan Statistical Area.
History
Cleveland County was formed in 1841 from parts of Rutherford and Lincoln counties. It was named for Benjamin Cleveland, a colonel in the American Revolutionary War, who took part in the Battle of Kings Mountain.
Geography
Cleveland County is located in the western part of North Carolina, in the foothills of the Blue Ridge Mountains. It is bordered by Gaston County to the north, Lincoln County to the east, Rutherford County to the south, and Cherokee County, South Carolina to the west. The county covers an area of 437 square miles, with a population density of 224 people per square mile.
The county is home to several rivers and streams, including the Broad River, First Broad River, Second Broad River, and the South Fork Catawba River. The highest point in the county is Kings Mountain, which has an elevation of 1,890 feet.
Economy
Cleveland County is home to a diverse economy, with a mix of manufacturing, agriculture, and service industries. The county is home to several large employers, including the Cleveland County Hospital, Cleveland County Schools, and the Cleveland County Sheriff's Office.
The county is also home to several large manufacturing companies, including the Cleveland County Furniture Company, which produces furniture for the home and office, and the Cleveland County Textile Company, which produces textiles for the apparel industry.
Agriculture is also an important part of the county's economy, with the county producing a variety of crops, including corn, soybeans, wheat, and hay.
Demographics
As of the 2010 census, there were 98,078 people, 37,945 households, and 26,845 families living in the county. The population density was 224 people per square mile. The racial makeup of the county was 79.2% White, 15.7% African American, 0.5% Native American, 1.2% Asian, 0.1% Pacific Islander, 1.7% from other races, and 1.7% from two or more races. Hispanic or Latino of any race were 4.2% of the population.
The median income for a household in the county was $41,945, and the median income for a family was $50,945. The per capita income for the county was $20,945. About 11.2% of families and 14.2% of the population were below the poverty line, including 19.2% of those under age 18 and 11.2% of those age 65 or over.
Conclusion
Cleveland County is a diverse county located in the western part of North Carolina. It is home to a mix of manufacturing, agriculture, and service industries, and has a population of 98,078 people. The county is home to several large employers, and has a median household income of $41,945. The county is also home to several rivers and streams, and is bordered by Gaston County to the north, Lincoln County to the east, Rutherford County to the south, and Cherokee County, South Carolina to the west.
Common Questions
What is the Total Population of Cleveland County?
Total Population of Cleveland County is 99,527.
What is the Total Male Population of Cleveland County?
Total Male Population of Cleveland County is 48,106.
What is the Total Female Population of Cleveland County?
Total Female Population of Cleveland County is 51,421.
What is the Ratio of Males per 100 Females in Cleveland County?
There are 93.55 Males per 100 Females in Cleveland County.
What is the Ratio of Females per 100 Males in Cleveland County?
There are 106.89 Females per 100 Males in Cleveland County.
What is the Median Population Age in Cleveland County?
Median Population Age in Cleveland County is 41.4 Years.
What is the Average Family Size in Cleveland County
Average Family Size in Cleveland County is 3.3 People.
What is the Average Household Size in Cleveland County
Average Household Size in Cleveland County is 2.7 People.
What is Per Capita Income in Cleveland County?
Per Capita income in Cleveland County is $27,522.
What is the Median Family Income in Cleveland County?
Median Family Income in Cleveland County is $64,112.
What is the Median Household income in Cleveland County?
Median Household Income in Cleveland County is $50,723.
What is Income or Wage Gap in Cleveland County?
Income or Wage Gap in Cleveland County is 23.8%.
Women in Cleveland County earn 76.2 cents for every dollar earned by a man.
What is Family Income Deficit in Cleveland County?
Family Income Deficit in Cleveland County is $11,646.
Families that are below poverty line in Cleveland County earn $11,646 less on average than the poverty threshold level.
What is Inequality or Gini Index in Cleveland County?
Inequality or Gini Index in Cleveland County is 0.46.
How Large is the Labor Force in Cleveland County?
There are 46,387 People in the Labor Forcein in Cleveland County.
What is the Percentage of People in the Labor Force in Cleveland County?
57.9% of People are in the Labor Force in Cleveland County.
What is the Unemployment Rate in Cleveland County?
Unemployment Rate in Cleveland County is 6.4%.