Clay County, NC
Clay County Overview
11,186
TOTAL POPULATION
5,347
MALE POPULATION
5,839
FEMALE POPULATION
91.57
MALES / 100 FEMALES
109.20
FEMALES / 100 MALES
54.1
MEDIAN AGE
2.9
AVG FAMILY SIZE
2.3
AVG HOUSEHOLD SIZE
$34,382
PER CAPITA INCOME
$74,795
AVG FAMILY INCOME
$57,065
AVG HOUSEHOLD INCOME
4.7%
WAGE / INCOME GAP [ % ]
95.3¢/ $1
WAGE / INCOME GAP [ $ ]
$5,083
FAMILY INCOME DEFICIT
0.47
INEQUALITY / GINI INDEX
4,566
LABOR FORCE [ PEOPLE ]
46.9%
PERCENT IN LABOR FORCE
4.0%
UNEMPLOYMENT RATE
Clay County Area Codes
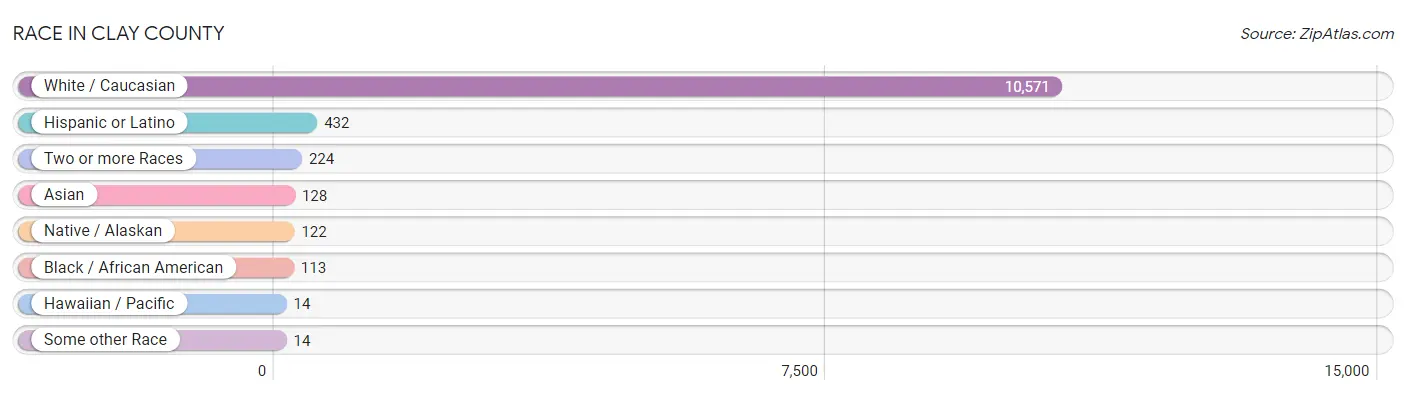
Race in Clay County
The most populous races in Clay County are White / Caucasian (10,571 | 94.5%), Hispanic or Latino (432 | 3.9%), and Two or more Races (224 | 2.0%).
| Race | # Population | % Population |
| Asian | 128 | 1.1% |
| Black / African American | 113 | 1.0% |
| Hawaiian / Pacific | 14 | 0.1% |
| Hispanic or Latino | 432 | 3.9% |
| Native / Alaskan | 122 | 1.1% |
| White / Caucasian | 10,571 | 94.5% |
| Two or more Races | 224 | 2.0% |
| Some other Race | 14 | 0.1% |
| Total | 11,186 | 100.0% |
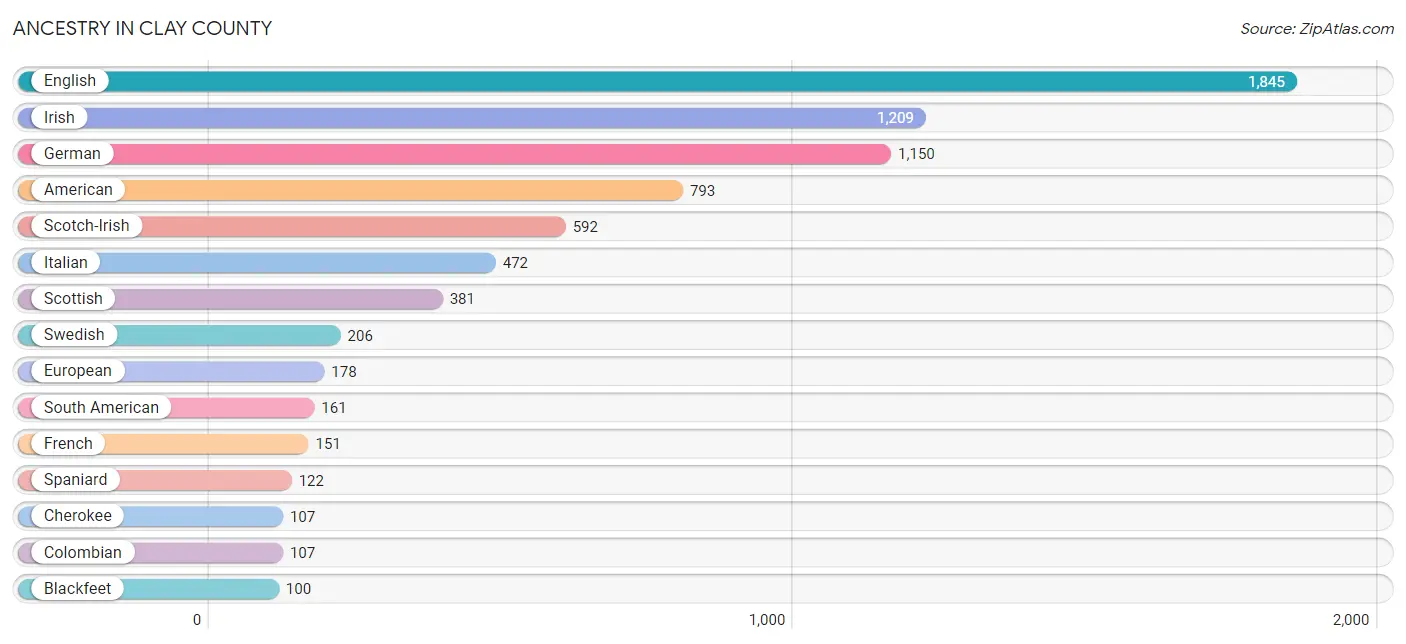
Ancestry in Clay County
The most populous ancestries reported in Clay County are English (1,845 | 16.5%), Irish (1,209 | 10.8%), German (1,150 | 10.3%), American (793 | 7.1%), and Scotch-Irish (592 | 5.3%), together accounting for 50.0% of all Clay County residents.
| Ancestry | # Population | % Population |
| American | 793 | 7.1% |
| Armenian | 56 | 0.5% |
| Austrian | 18 | 0.2% |
| Blackfeet | 100 | 0.9% |
| British | 27 | 0.2% |
| Burmese | 11 | 0.1% |
| Canadian | 18 | 0.2% |
| Central American | 14 | 0.1% |
| Cherokee | 107 | 1.0% |
| Colombian | 107 | 1.0% |
| Cuban | 40 | 0.4% |
| Czech | 22 | 0.2% |
| Dominican | 36 | 0.3% |
| Dutch | 22 | 0.2% |
| English | 1,845 | 16.5% |
| European | 178 | 1.6% |
| Finnish | 7 | 0.1% |
| French | 151 | 1.3% |
| French Canadian | 30 | 0.3% |
| German | 1,150 | 10.3% |
| Guamanian / Chamorro | 14 | 0.1% |
| Guatemalan | 14 | 0.1% |
| Hungarian | 2 | 0.0% |
| Indian (Asian) | 10 | 0.1% |
| Indonesian | 93 | 0.8% |
| Iranian | 75 | 0.7% |
| Irish | 1,209 | 10.8% |
| Italian | 472 | 4.2% |
| Mexican | 35 | 0.3% |
| Nigerian | 2 | 0.0% |
| Norwegian | 49 | 0.4% |
| Polish | 88 | 0.8% |
| Puerto Rican | 24 | 0.2% |
| Romanian | 88 | 0.8% |
| Scotch-Irish | 592 | 5.3% |
| Scottish | 381 | 3.4% |
| South American | 161 | 1.4% |
| Spaniard | 122 | 1.1% |
| Sri Lankan | 13 | 0.1% |
| Subsaharan African | 2 | 0.0% |
| Swedish | 206 | 1.8% |
| Swiss | 14 | 0.1% |
| Thai | 1 | 0.0% |
| Ukrainian | 24 | 0.2% |
| Venezuelan | 3 | 0.0% |
| Welsh | 69 | 0.6% | View All 46 Rows |
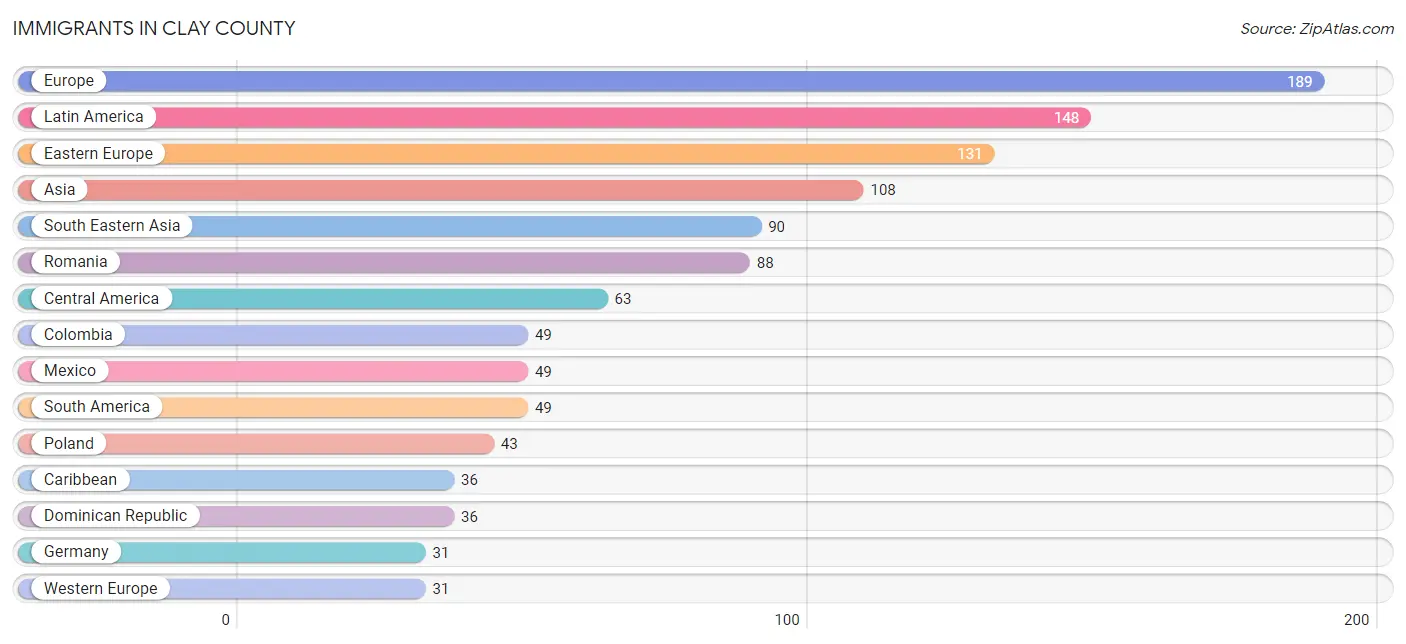
Immigrants in Clay County
The most numerous immigrant groups reported in Clay County came from Europe (189 | 1.7%), Latin America (148 | 1.3%), Eastern Europe (131 | 1.2%), Asia (108 | 1.0%), and South Eastern Asia (90 | 0.8%), together accounting for 5.9% of all Clay County residents.
| Immigration Origin | # Population | % Population |
| Asia | 108 | 1.0% |
| Canada | 5 | 0.0% |
| Caribbean | 36 | 0.3% |
| Central America | 63 | 0.6% |
| Colombia | 49 | 0.4% |
| Dominican Republic | 36 | 0.3% |
| Eastern Europe | 131 | 1.2% |
| England | 7 | 0.1% |
| Europe | 189 | 1.7% |
| Germany | 31 | 0.3% |
| Guatemala | 14 | 0.1% |
| India | 1 | 0.0% |
| Iran | 17 | 0.2% |
| Latin America | 148 | 1.3% |
| Mexico | 49 | 0.4% |
| Northern Europe | 27 | 0.2% |
| Poland | 43 | 0.4% |
| Romania | 88 | 0.8% |
| South America | 49 | 0.4% |
| South Central Asia | 18 | 0.2% |
| South Eastern Asia | 90 | 0.8% |
| Vietnam | 13 | 0.1% |
| Western Europe | 31 | 0.3% | View All 23 Rows |
Sex and Age in Clay County
Sex and Age in Clay County
The most populous age groups in Clay County are 60 to 64 Years (708 | 13.2%) for men and 60 to 64 Years (782 | 13.4%) for women.

| Age Bracket | Male | Female |
| Under 5 Years | 106 (2.0%) | 365 (6.2%) |
| 5 to 9 Years | 173 (3.2%) | 289 (5.0%) |
| 10 to 14 Years | 321 (6.0%) | 192 (3.3%) |
| 15 to 19 Years | 550 (10.3%) | 270 (4.6%) |
| 20 to 24 Years | 146 (2.7%) | 223 (3.8%) |
| 25 to 29 Years | 210 (3.9%) | 111 (1.9%) |
| 30 to 34 Years | 209 (3.9%) | 141 (2.4%) |
| 35 to 39 Years | 185 (3.5%) | 360 (6.2%) |
| 40 to 44 Years | 322 (6.0%) | 287 (4.9%) |
| 45 to 49 Years | 275 (5.1%) | 321 (5.5%) |
| 50 to 54 Years | 318 (5.9%) | 331 (5.7%) |
| 55 to 59 Years | 182 (3.4%) | 246 (4.2%) |
| 60 to 64 Years | 708 (13.2%) | 782 (13.4%) |
| 65 to 69 Years | 451 (8.4%) | 683 (11.7%) |
| 70 to 74 Years | 538 (10.1%) | 434 (7.4%) |
| 75 to 79 Years | 524 (9.8%) | 540 (9.2%) |
| 80 to 84 Years | 78 (1.5%) | 159 (2.7%) |
| 85 Years and over | 51 (0.9%) | 105 (1.8%) |
| Total | 5,347 (100.0%) | 5,839 (100.0%) |
Families and Households in Clay County
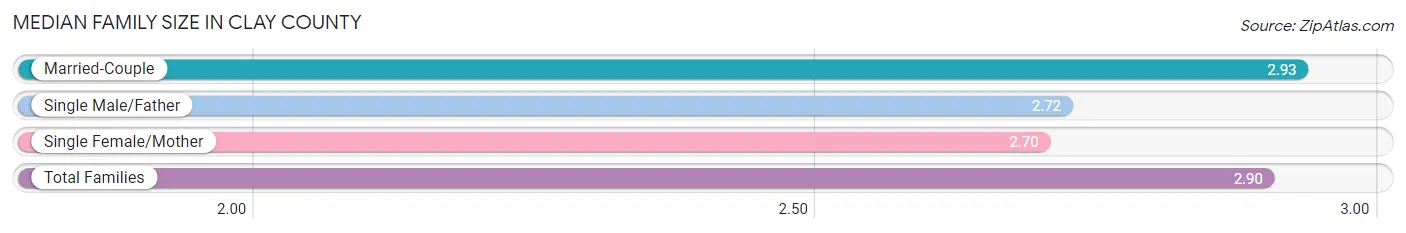
Median Family Size in Clay County
The median family size in Clay County is 2.90 persons per family, with married-couple families (2,588 | 86.4%) accounting for the largest median family size of 2.93 persons per family. On the other hand, single female/mother families (197 | 6.6%) represent the smallest median family size with 2.70 persons per family.
| Family Type | # Families | Family Size |
| Married-Couple | 2,588 (86.4%) | 2.93 |
| Single Male/Father | 211 (7.0%) | 2.72 |
| Single Female/Mother | 197 (6.6%) | 2.70 |
| Total Families | 2,996 (100.0%) | 2.90 |
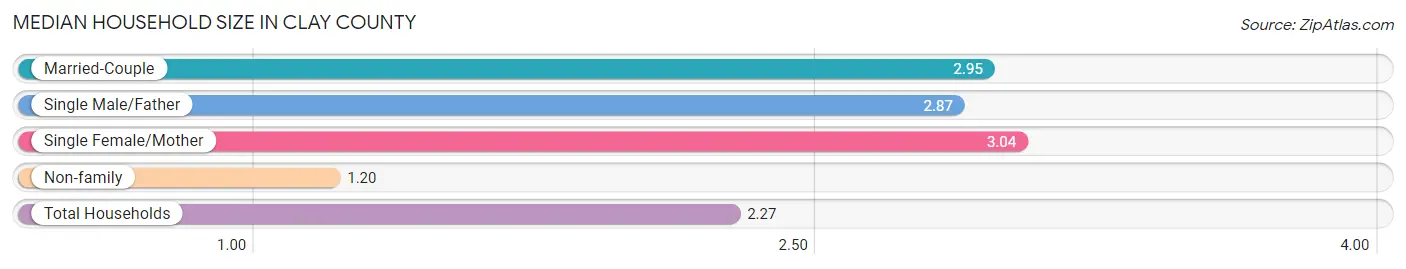
Median Household Size in Clay County
The median household size in Clay County is 2.27 persons per household, with single female/mother households (197 | 4.0%) accounting for the largest median household size of 3.04 persons per household. non-family households (1,896 | 38.8%) represent the smallest median household size with 1.20 persons per household.
| Household Type | # Households | Household Size |
| Married-Couple | 2,588 (52.9%) | 2.95 |
| Single Male/Father | 211 (4.3%) | 2.87 |
| Single Female/Mother | 197 (4.0%) | 3.04 |
| Non-family | 1,896 (38.8%) | 1.20 |
| Total Households | 4,892 (100.0%) | 2.27 |
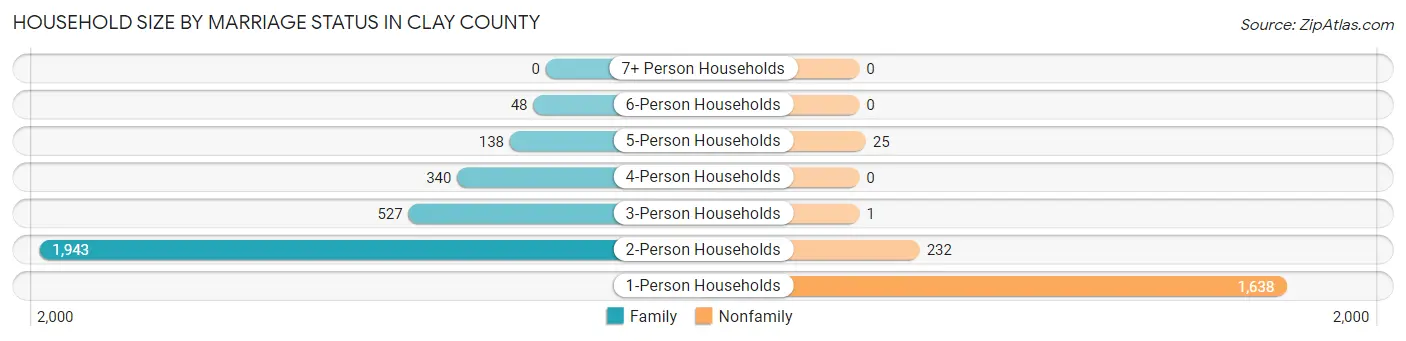
Household Size by Marriage Status in Clay County
Out of a total of 4,892 households in Clay County, 2,996 (61.2%) are family households, while 1,896 (38.8%) are nonfamily households. The most numerous type of family households are 2-person households, comprising 1,943, and the most common type of nonfamily households are 1-person households, comprising 1,638.
| Household Size | Family Households | Nonfamily Households |
| 1-Person Households | - | 1,638 (33.5%) |
| 2-Person Households | 1,943 (39.7%) | 232 (4.7%) |
| 3-Person Households | 527 (10.8%) | 1 (0.0%) |
| 4-Person Households | 340 (7.0%) | 0 (0.0%) |
| 5-Person Households | 138 (2.8%) | 25 (0.5%) |
| 6-Person Households | 48 (1.0%) | 0 (0.0%) |
| 7+ Person Households | 0 (0.0%) | 0 (0.0%) |
| Total | 2,996 (61.2%) | 1,896 (38.8%) |
Female Fertility in Clay County
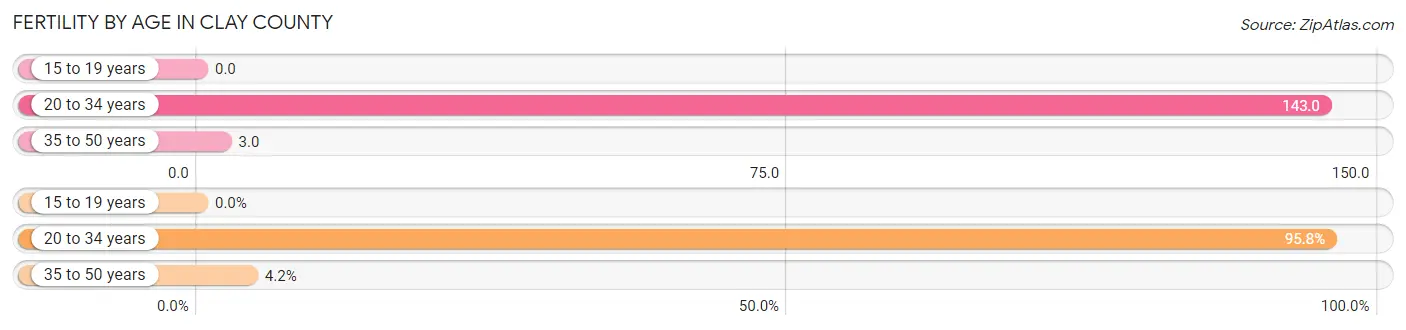
Fertility by Age in Clay County
Average fertility rate in Clay County is 40.0 births per 1,000 women. Women in the age bracket of 20 to 34 years have the highest fertility rate with 143.0 births per 1,000 women. Women in the age bracket of 20 to 34 years acount for 95.8% of all women with births.
| Age Bracket | Women with Births | Births / 1,000 Women |
| 15 to 19 years | 0 (0.0%) | 0.0 |
| 20 to 34 years | 68 (95.8%) | 143.0 |
| 35 to 50 years | 3 (4.2%) | 3.0 |
| Total | 71 (100.0%) | 40.0 |
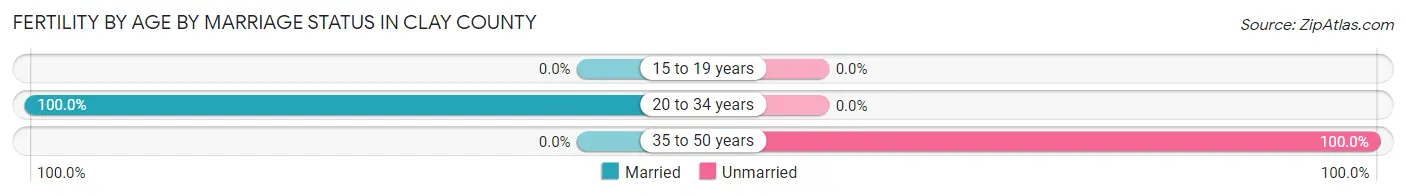
Fertility by Age by Marriage Status in Clay County
95.8% of women with births (71) in Clay County are married. The highest percentage of unmarried women with births falls into 35 to 50 years age bracket with 100.0% of them unmarried at the time of birth, while the lowest percentage of unmarried women with births belong to 20 to 34 years age bracket with 0.0% of them unmarried.
| Age Bracket | Married | Unmarried |
| 15 to 19 years | 0 (0.0%) | 0 (0.0%) |
| 20 to 34 years | 68 (100.0%) | 0 (0.0%) |
| 35 to 50 years | 0 (0.0%) | 3 (100.0%) |
| Total | 68 (95.8%) | 3 (4.2%) |
Fertility by Education in Clay County
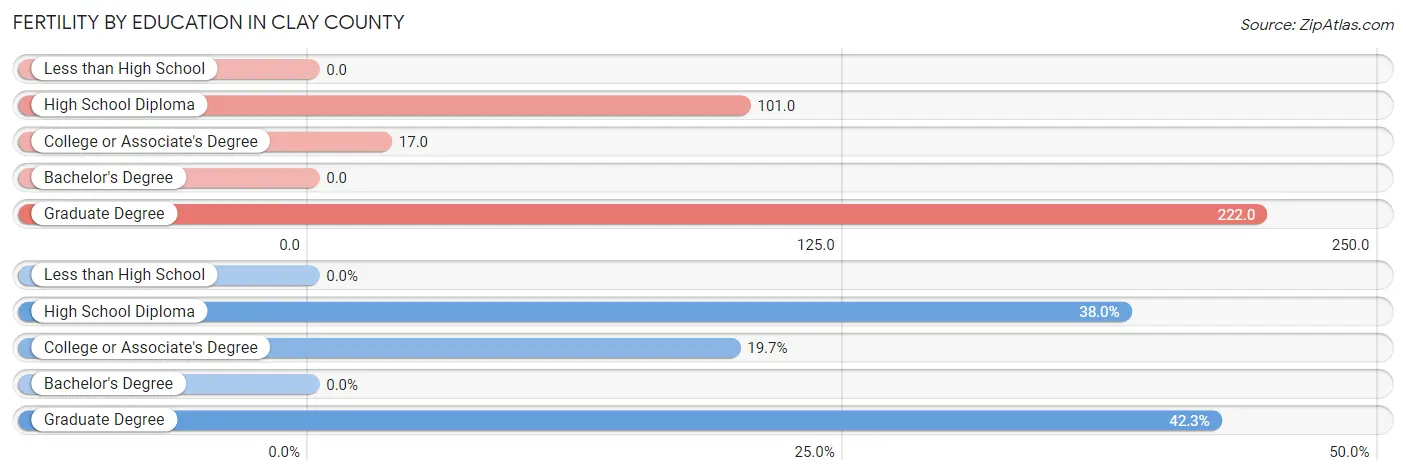
| Educational Attainment | Women with Births | Births / 1,000 Women |
| Less than High School | 0 (0.0%) | 0.0 |
| High School Diploma | 27 (38.0%) | 101.0 |
| College or Associate's Degree | 14 (19.7%) | 17.0 |
| Bachelor's Degree | 0 (0.0%) | 0.0 |
| Graduate Degree | 30 (42.2%) | 222.0 |
| Total | 71 (100.0%) | 40.0 |
Fertility by Education by Marriage Status in Clay County
4.2% of women with births in Clay County are unmarried. Women with the educational attainment of college or associate's degree are most likely to be married with 100.0% of them married at childbirth, while women with the educational attainment of high school diploma are least likely to be married with 11.1% of them unmarried at childbirth.
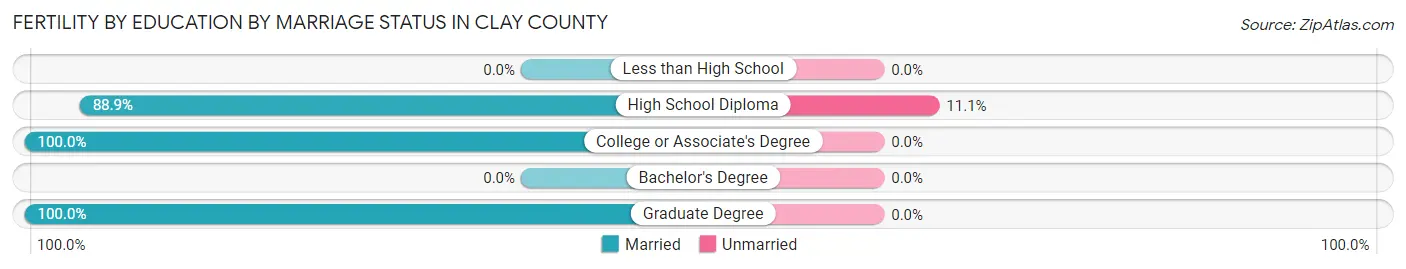
| Educational Attainment | Married | Unmarried |
| Less than High School | 0 (0.0%) | 0 (0.0%) |
| High School Diploma | 24 (88.9%) | 3 (11.1%) |
| College or Associate's Degree | 14 (100.0%) | 0 (0.0%) |
| Bachelor's Degree | 0 (0.0%) | 0 (0.0%) |
| Graduate Degree | 30 (100.0%) | 0 (0.0%) |
| Total | 68 (95.8%) | 3 (4.2%) |
Income in Clay County
Income Overview in Clay County
Per Capita Income in Clay County is $34,382, while median incomes of families and households are $74,795 and $57,065 respectively.
| Characteristic | Number | Measure |
| Per Capita Income | 11,186 | $34,382 |
| Median Family Income | 2,996 | $74,795 |
| Mean Family Income | 2,996 | $97,749 |
| Median Household Income | 4,892 | $57,065 |
| Mean Household Income | 4,892 | $77,381 |
| Income Deficit | 2,996 | $5,083 |
| Wage / Income Gap (%) | 11,186 | 4.74% |
| Wage / Income Gap ($) | 11,186 | 95.26¢ per $1 |
| Gini / Inequality Index | 11,186 | 0.47 |
Earnings by Sex in Clay County
Average Earnings in Clay County are $36,157, $36,525 for men and $34,795 for women, a difference of 4.7%.
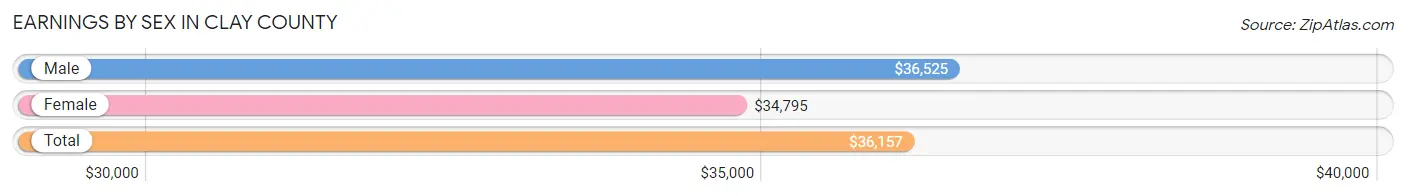
| Sex | Number | Average Earnings |
| Male | 2,738 (55.3%) | $36,525 |
| Female | 2,210 (44.7%) | $34,795 |
| Total | 4,948 (100.0%) | $36,157 |
Earnings by Sex by Income Bracket in Clay County
The most common earnings brackets in Clay County are $10,000 to $12,499 for men (257 | 9.4%) and $2,499 or less for women (280 | 12.7%).
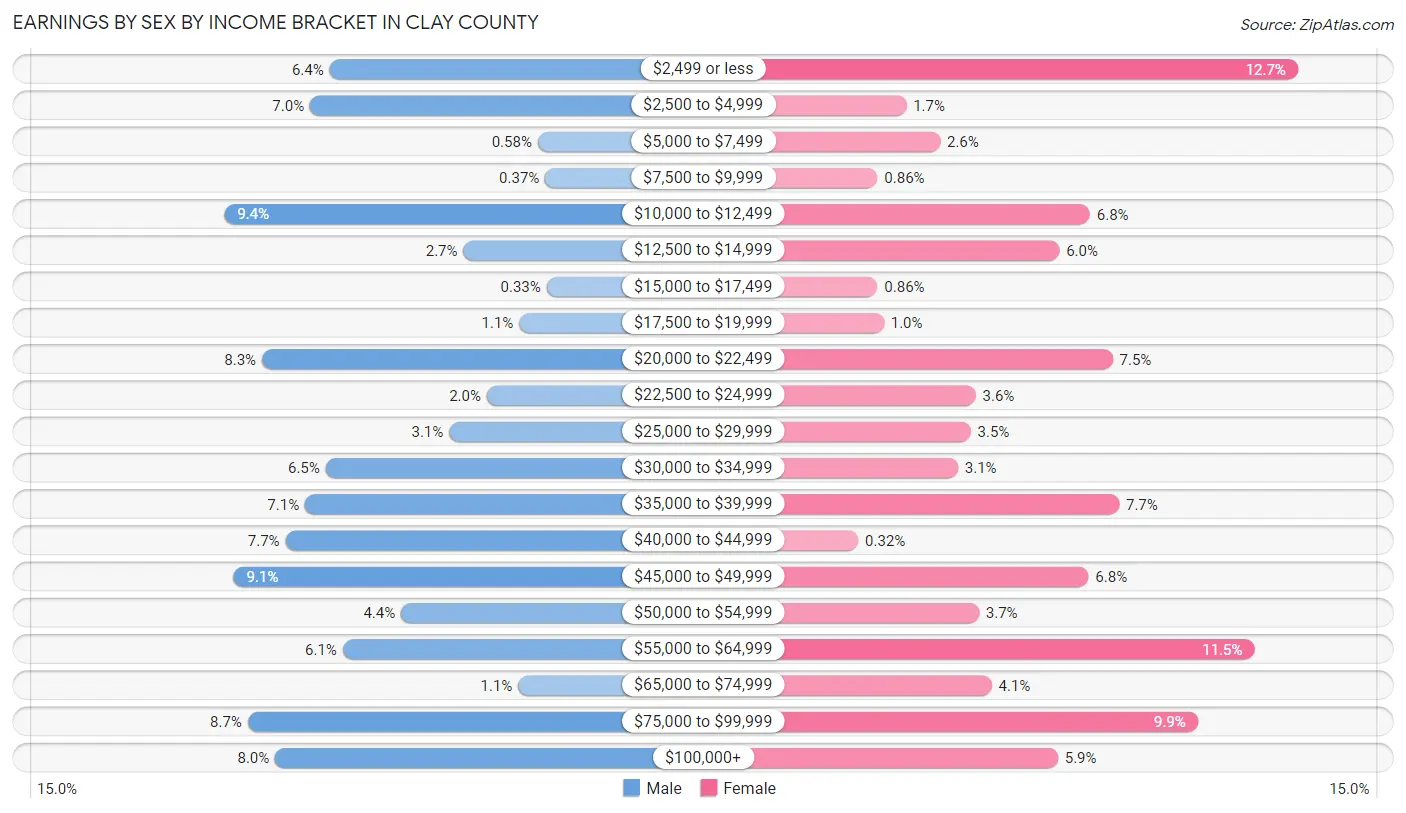
| Income | Male | Female |
| $2,499 or less | 176 (6.4%) | 280 (12.7%) |
| $2,500 to $4,999 | 191 (7.0%) | 37 (1.7%) |
| $5,000 to $7,499 | 16 (0.6%) | 58 (2.6%) |
| $7,500 to $9,999 | 10 (0.4%) | 19 (0.9%) |
| $10,000 to $12,499 | 257 (9.4%) | 151 (6.8%) |
| $12,500 to $14,999 | 73 (2.7%) | 132 (6.0%) |
| $15,000 to $17,499 | 9 (0.3%) | 19 (0.9%) |
| $17,500 to $19,999 | 30 (1.1%) | 23 (1.0%) |
| $20,000 to $22,499 | 228 (8.3%) | 165 (7.5%) |
| $22,500 to $24,999 | 55 (2.0%) | 80 (3.6%) |
| $25,000 to $29,999 | 84 (3.1%) | 77 (3.5%) |
| $30,000 to $34,999 | 179 (6.5%) | 69 (3.1%) |
| $35,000 to $39,999 | 195 (7.1%) | 169 (7.6%) |
| $40,000 to $44,999 | 210 (7.7%) | 7 (0.3%) |
| $45,000 to $49,999 | 250 (9.1%) | 150 (6.8%) |
| $50,000 to $54,999 | 121 (4.4%) | 82 (3.7%) |
| $55,000 to $64,999 | 166 (6.1%) | 253 (11.5%) |
| $65,000 to $74,999 | 31 (1.1%) | 90 (4.1%) |
| $75,000 to $99,999 | 239 (8.7%) | 218 (9.9%) |
| $100,000+ | 218 (8.0%) | 131 (5.9%) |
| Total | 2,738 (100.0%) | 2,210 (100.0%) |
Earnings by Sex by Educational Attainment in Clay County
Average earnings in Clay County are $41,536 for men and $39,231 for women, a difference of 5.6%. Men with an educational attainment of graduate degree enjoy the highest average annual earnings of $84,432, while those with college or associate's degree education earn the least with $38,894. Women with an educational attainment of bachelor's degree earn the most with the average annual earnings of $68,598, while those with high school diploma education have the smallest earnings of $26,719.
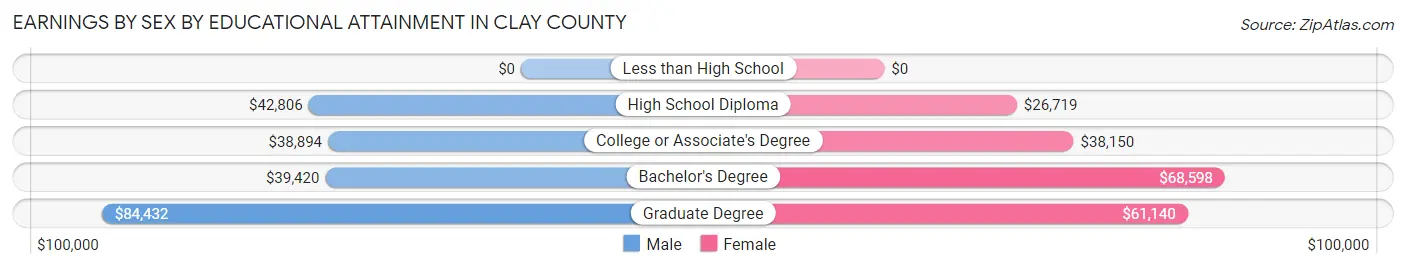
| Educational Attainment | Male Income | Female Income |
| Less than High School | - | - |
| High School Diploma | $42,806 | $26,719 |
| College or Associate's Degree | $38,894 | $38,150 |
| Bachelor's Degree | $39,420 | $68,598 |
| Graduate Degree | $84,432 | $61,140 |
| Total | $41,536 | $39,231 |
Family Income in Clay County
Family Income Brackets in Clay County
According to the Clay County family income data, there are 752 families falling into the $100,000 to $149,999 income range, which is the most common income bracket and makes up 25.1% of all families. Conversely, the $10,000 to $14,999 income bracket is the least frequent group with only 33 families (1.1%) belonging to this category.
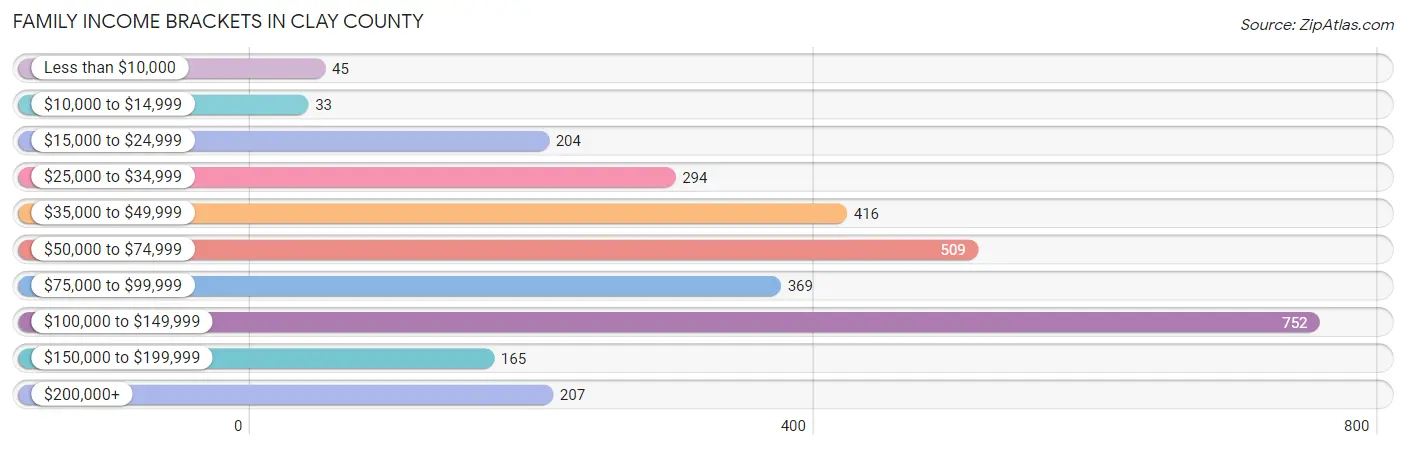
| Income Bracket | # Families | % Families |
| Less than $10,000 | 45 | 1.5% |
| $10,000 to $14,999 | 33 | 1.1% |
| $15,000 to $24,999 | 204 | 6.8% |
| $25,000 to $34,999 | 294 | 9.8% |
| $35,000 to $49,999 | 416 | 13.9% |
| $50,000 to $74,999 | 509 | 17.0% |
| $75,000 to $99,999 | 369 | 12.3% |
| $100,000 to $149,999 | 752 | 25.1% |
| $150,000 to $199,999 | 165 | 5.5% |
| $200,000+ | 207 | 6.9% |
Family Income by Famaliy Size in Clay County
4-person families (330 | 11.0%) account for the highest median family income in Clay County with $115,227 per family, while 2-person families (1,998 | 66.7%) have the highest median income of $33,058 per family member.
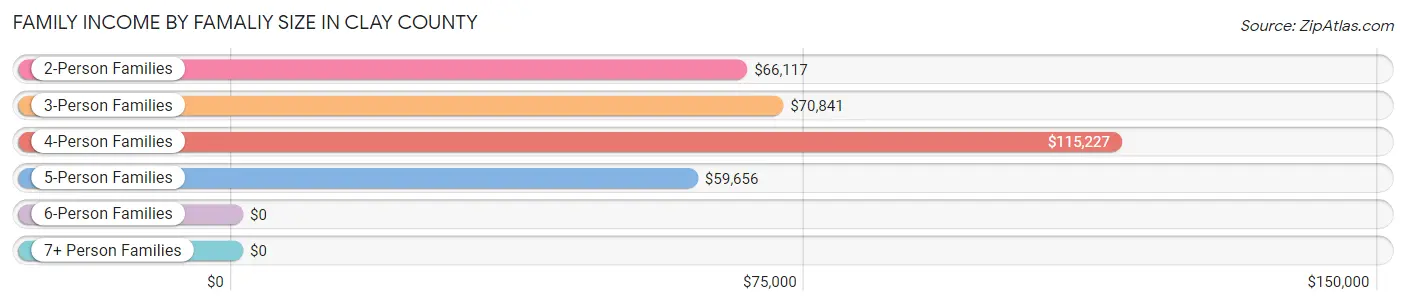
| Income Bracket | # Families | Median Income |
| 2-Person Families | 1,998 (66.7%) | $66,117 |
| 3-Person Families | 491 (16.4%) | $70,841 |
| 4-Person Families | 330 (11.0%) | $115,227 |
| 5-Person Families | 131 (4.4%) | $59,656 |
| 6-Person Families | 46 (1.5%) | $0 |
| 7+ Person Families | 0 (0.0%) | $0 |
| Total | 2,996 (100.0%) | $74,795 |
Family Income by Number of Earners in Clay County
The median family income in Clay County is $74,795, with families comprising 3+ earners (92) having the highest median family income of $118,071, while families with 1 earner (745) have the lowest median family income of $57,844, accounting for 3.1% and 24.9% of families, respectively.
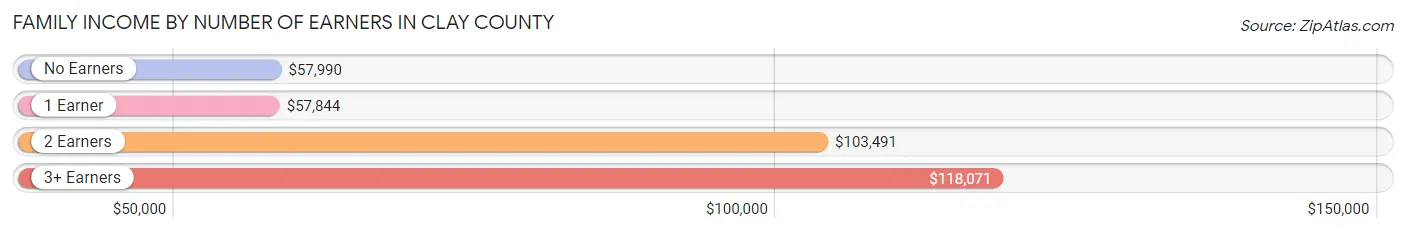
| Number of Earners | # Families | Median Income |
| No Earners | 848 (28.3%) | $57,990 |
| 1 Earner | 745 (24.9%) | $57,844 |
| 2 Earners | 1,311 (43.8%) | $103,491 |
| 3+ Earners | 92 (3.1%) | $118,071 |
| Total | 2,996 (100.0%) | $74,795 |
Household Income in Clay County
Household Income Brackets in Clay County
With 954 households falling in the category, the $100,000 to $149,999 income range is the most frequent in Clay County, accounting for 19.5% of all households. In contrast, only 157 households (3.2%) fall into the less than $10,000 income bracket, making it the least populous group.
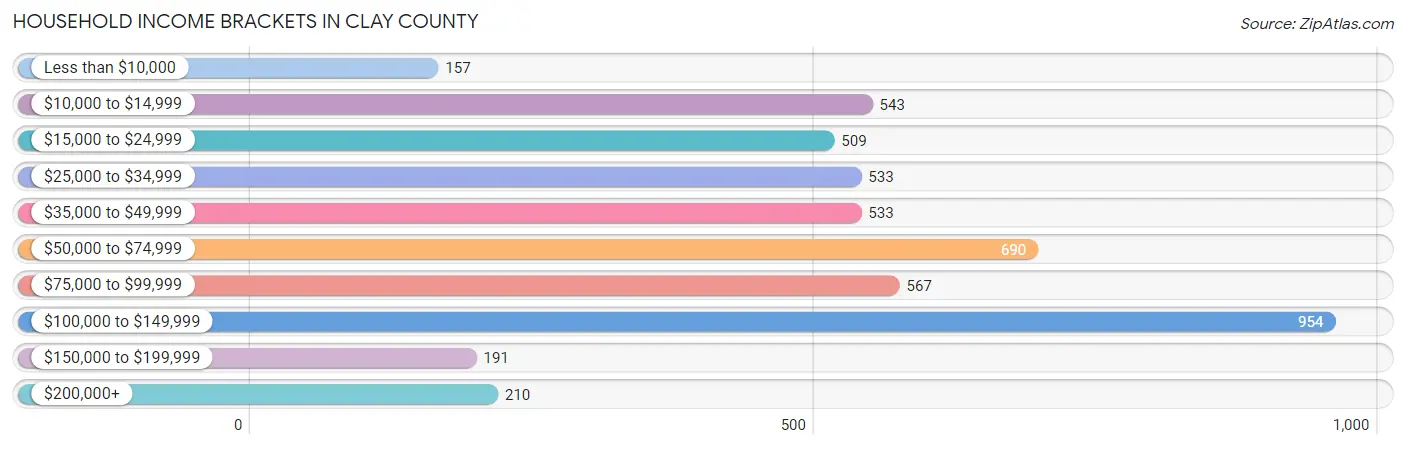
| Income Bracket | # Households | % Households |
| Less than $10,000 | 157 | 3.2% |
| $10,000 to $14,999 | 543 | 11.1% |
| $15,000 to $24,999 | 509 | 10.4% |
| $25,000 to $34,999 | 533 | 10.9% |
| $35,000 to $49,999 | 533 | 10.9% |
| $50,000 to $74,999 | 690 | 14.1% |
| $75,000 to $99,999 | 567 | 11.6% |
| $100,000 to $149,999 | 954 | 19.5% |
| $150,000 to $199,999 | 191 | 3.9% |
| $200,000+ | 210 | 4.3% |
Household Income by Householder Age in Clay County
The median household income in Clay County is $57,065, with the highest median household income of $76,875 found in the 25 to 44 years age bracket for the primary householder. A total of 734 households (15.0%) fall into this category. Meanwhile, the 15 to 24 years age bracket for the primary householder has the lowest median household income of $38,272, with 97 households (2.0%) in this group.
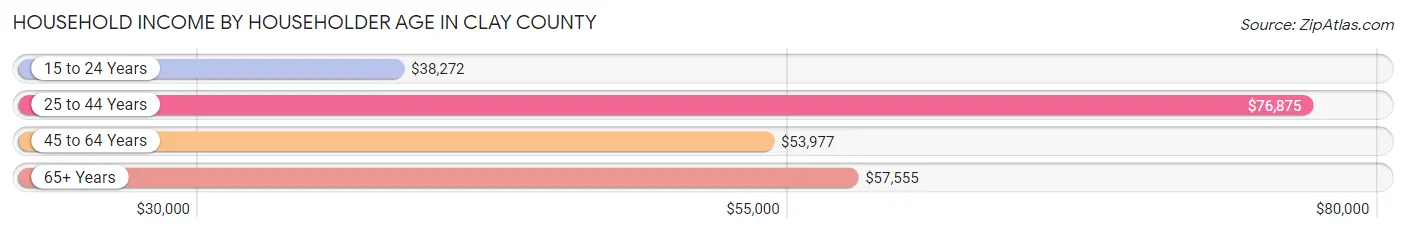
| Income Bracket | # Households | Median Income |
| 15 to 24 Years | 97 (2.0%) | $38,272 |
| 25 to 44 Years | 734 (15.0%) | $76,875 |
| 45 to 64 Years | 1,717 (35.1%) | $53,977 |
| 65+ Years | 2,344 (47.9%) | $57,555 |
| Total | 4,892 (100.0%) | $57,065 |
Poverty in Clay County
Income Below Poverty by Sex and Age in Clay County
With 12.5% poverty level for males and 14.3% for females among the residents of Clay County, under 5 year old males and 75 year old and over females are the most vulnerable to poverty, with 73 males (98.7%) and 265 females (34.6%) in their respective age groups living below the poverty level.
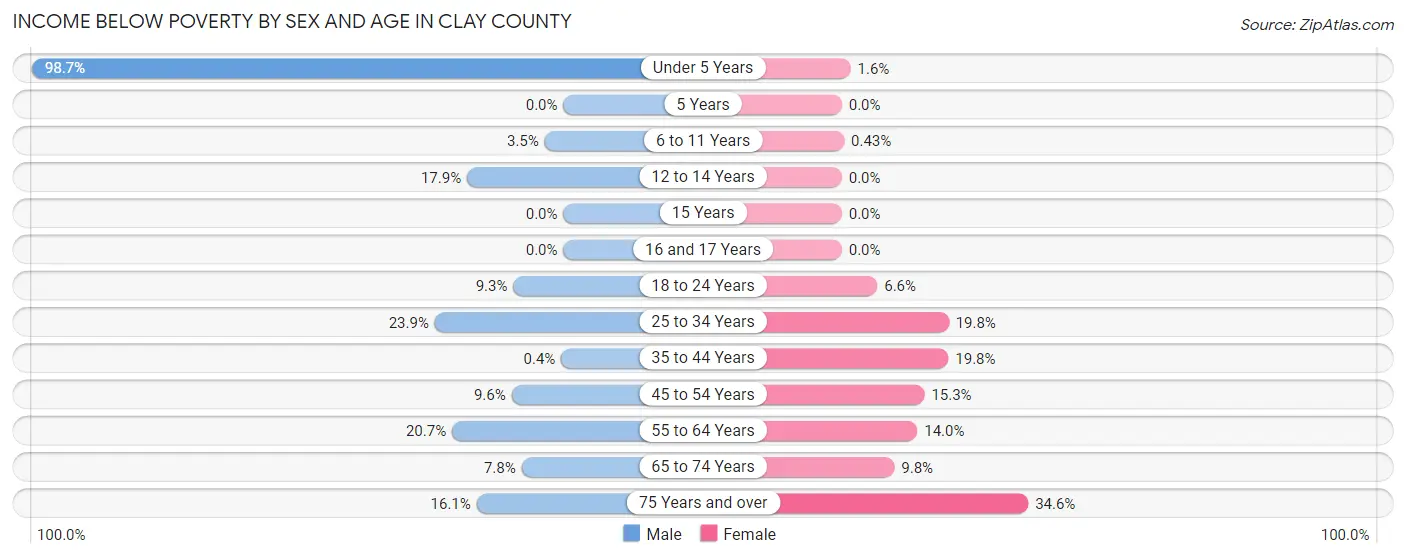
| Age Bracket | Male | Female |
| Under 5 Years | 73 (98.7%) | 6 (1.6%) |
| 5 Years | 0 (0.0%) | 0 (0.0%) |
| 6 to 11 Years | 11 (3.5%) | 1 (0.4%) |
| 12 to 14 Years | 22 (17.9%) | 0 (0.0%) |
| 15 Years | 0 (0.0%) | 0 (0.0%) |
| 16 and 17 Years | 0 (0.0%) | 0 (0.0%) |
| 18 to 24 Years | 34 (9.3%) | 28 (6.6%) |
| 25 to 34 Years | 100 (23.9%) | 50 (19.8%) |
| 35 to 44 Years | 2 (0.4%) | 128 (19.8%) |
| 45 to 54 Years | 57 (9.6%) | 100 (15.3%) |
| 55 to 64 Years | 184 (20.7%) | 144 (14.0%) |
| 65 to 74 Years | 76 (7.8%) | 108 (9.8%) |
| 75 Years and over | 104 (16.1%) | 265 (34.6%) |
| Total | 663 (12.5%) | 830 (14.3%) |
Income Above Poverty by Sex and Age in Clay County
According to the poverty statistics in Clay County, males aged 5 years and females aged 5 years are the age groups that are most secure financially, with 100.0% of males and 100.0% of females in these age groups living above the poverty line.
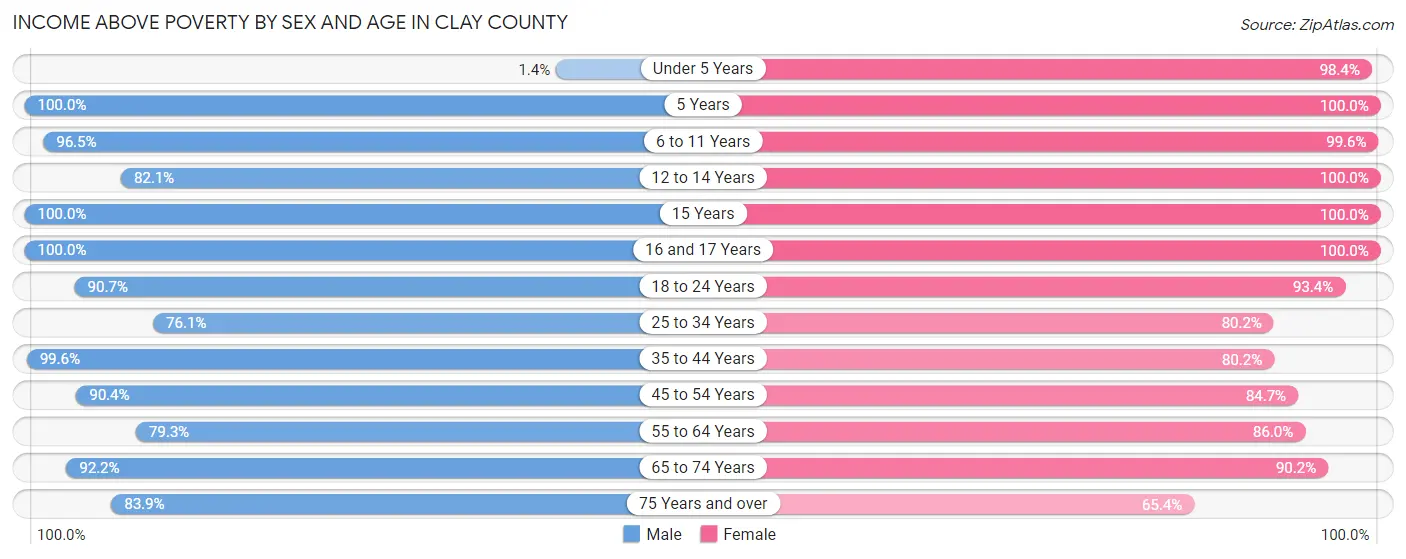
| Age Bracket | Male | Female |
| Under 5 Years | 1 (1.3%) | 359 (98.4%) |
| 5 Years | 50 (100.0%) | 105 (100.0%) |
| 6 to 11 Years | 305 (96.5%) | 230 (99.6%) |
| 12 to 14 Years | 101 (82.1%) | 139 (100.0%) |
| 15 Years | 4 (100.0%) | 1 (100.0%) |
| 16 and 17 Years | 324 (100.0%) | 66 (100.0%) |
| 18 to 24 Years | 332 (90.7%) | 397 (93.4%) |
| 25 to 34 Years | 319 (76.1%) | 202 (80.2%) |
| 35 to 44 Years | 504 (99.6%) | 519 (80.2%) |
| 45 to 54 Years | 536 (90.4%) | 552 (84.7%) |
| 55 to 64 Years | 706 (79.3%) | 884 (86.0%) |
| 65 to 74 Years | 903 (92.2%) | 998 (90.2%) |
| 75 Years and over | 542 (83.9%) | 501 (65.4%) |
| Total | 4,627 (87.5%) | 4,953 (85.7%) |
Income Below Poverty Among Married-Couple Families in Clay County
The poverty statistics for married-couple families in Clay County show that 7.9% or 204 of the total 2,588 families live below the poverty line. Families with 1 or 2 children have the highest poverty rate of 10.4%, comprising of 56 families. On the other hand, families with 3 or 4 children have the lowest poverty rate of 2.0%, which includes 2 families.
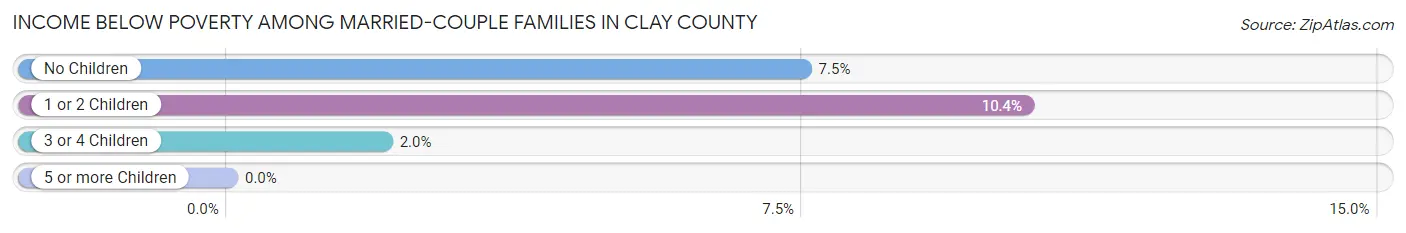
| Children | Above Poverty | Below Poverty |
| No Children | 1,804 (92.5%) | 146 (7.5%) |
| 1 or 2 Children | 483 (89.6%) | 56 (10.4%) |
| 3 or 4 Children | 97 (98.0%) | 2 (2.0%) |
| 5 or more Children | 0 (0.0%) | 0 (0.0%) |
| Total | 2,384 (92.1%) | 204 (7.9%) |
Income Below Poverty Among Single-Parent Households in Clay County
According to the poverty data in Clay County, 5.2% or 11 single-father households and 8.1% or 16 single-mother households are living below the poverty line. Among single-father households, those with 1 or 2 children have the highest poverty rate, with 11 households (18.3%) experiencing poverty. Likewise, among single-mother households, those with no children have the highest poverty rate, with 13 households (8.9%) falling below the poverty line.
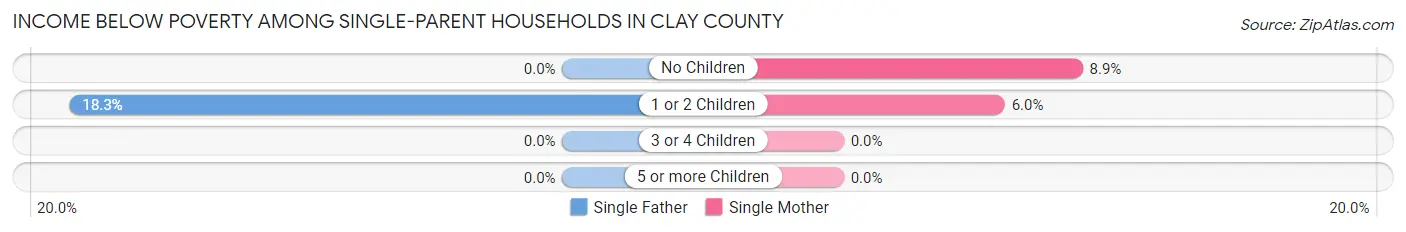
| Children | Single Father | Single Mother |
| No Children | 0 (0.0%) | 13 (8.9%) |
| 1 or 2 Children | 11 (18.3%) | 3 (6.0%) |
| 3 or 4 Children | 0 (0.0%) | 0 (0.0%) |
| 5 or more Children | 0 (0.0%) | 0 (0.0%) |
| Total | 11 (5.2%) | 16 (8.1%) |
Income Below Poverty Among Married-Couple vs Single-Parent Households in Clay County
The poverty data for Clay County shows that 204 of the married-couple family households (7.9%) and 27 of the single-parent households (6.6%) are living below the poverty level. Within the married-couple family households, those with 1 or 2 children have the highest poverty rate, with 56 households (10.4%) falling below the poverty line. Among the single-parent households, those with 1 or 2 children have the highest poverty rate, with 14 household (12.7%) living below poverty.
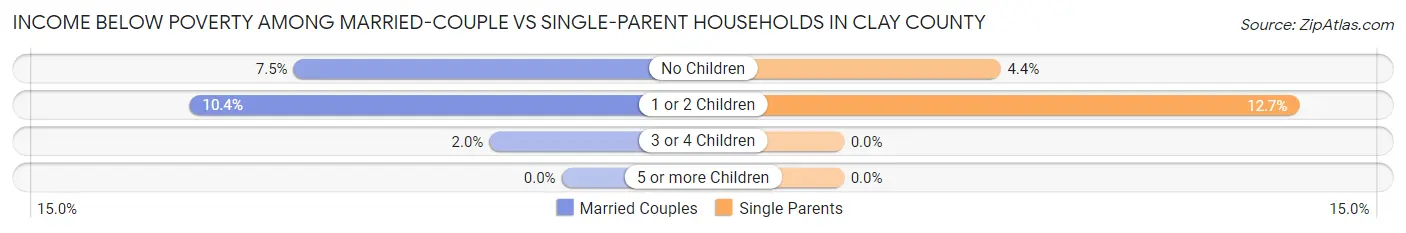
| Children | Married-Couple Families | Single-Parent Households |
| No Children | 146 (7.5%) | 13 (4.4%) |
| 1 or 2 Children | 56 (10.4%) | 14 (12.7%) |
| 3 or 4 Children | 2 (2.0%) | 0 (0.0%) |
| 5 or more Children | 0 (0.0%) | 0 (0.0%) |
| Total | 204 (7.9%) | 27 (6.6%) |
Employment Characteristics in Clay County
Employment by Class of Employer in Clay County
Among the 4,364 employed individuals in Clay County, private company employees (2,649 | 60.7%), self-employed (incorporated) (440 | 10.1%), and self-employed (not incorporated) (407 | 9.3%) make up the most common classes of employment.
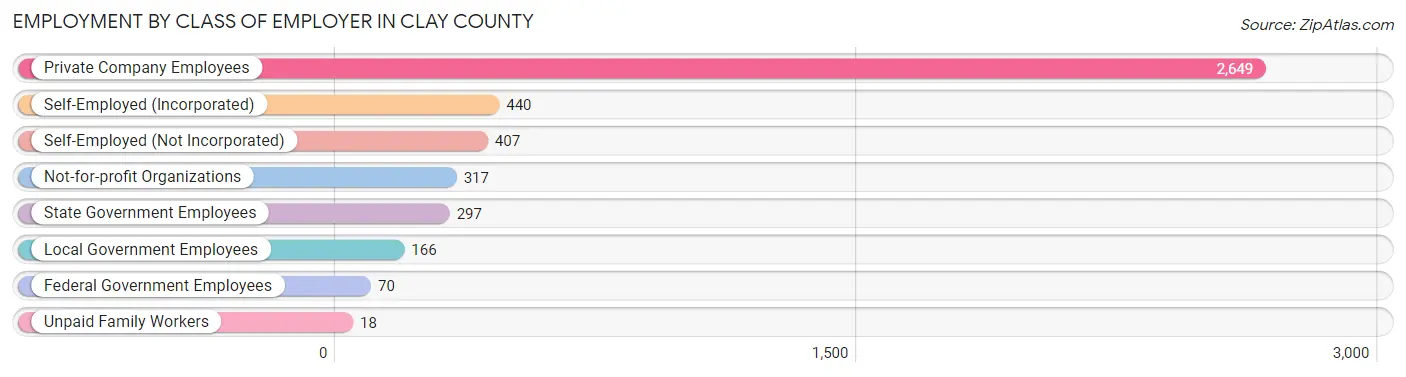
| Employer Class | # Employees | % Employees |
| Private Company Employees | 2,649 | 60.7% |
| Self-Employed (Incorporated) | 440 | 10.1% |
| Self-Employed (Not Incorporated) | 407 | 9.3% |
| Not-for-profit Organizations | 317 | 7.3% |
| Local Government Employees | 166 | 3.8% |
| State Government Employees | 297 | 6.8% |
| Federal Government Employees | 70 | 1.6% |
| Unpaid Family Workers | 18 | 0.4% |
| Total | 4,364 | 100.0% |
Employment Status by Age in Clay County
According to the labor force statistics for Clay County, out of the total population over 16 years of age (9,735), 46.9% or 4,566 individuals are in the labor force, with 4.0% or 183 of them unemployed. The age group with the highest labor force participation rate is 35 to 44 years, with 85.4% or 986 individuals in the labor force. Within the labor force, the 20 to 24 years age range has the highest percentage of unemployed individuals, with 9.2% or 12 of them being unemployed.
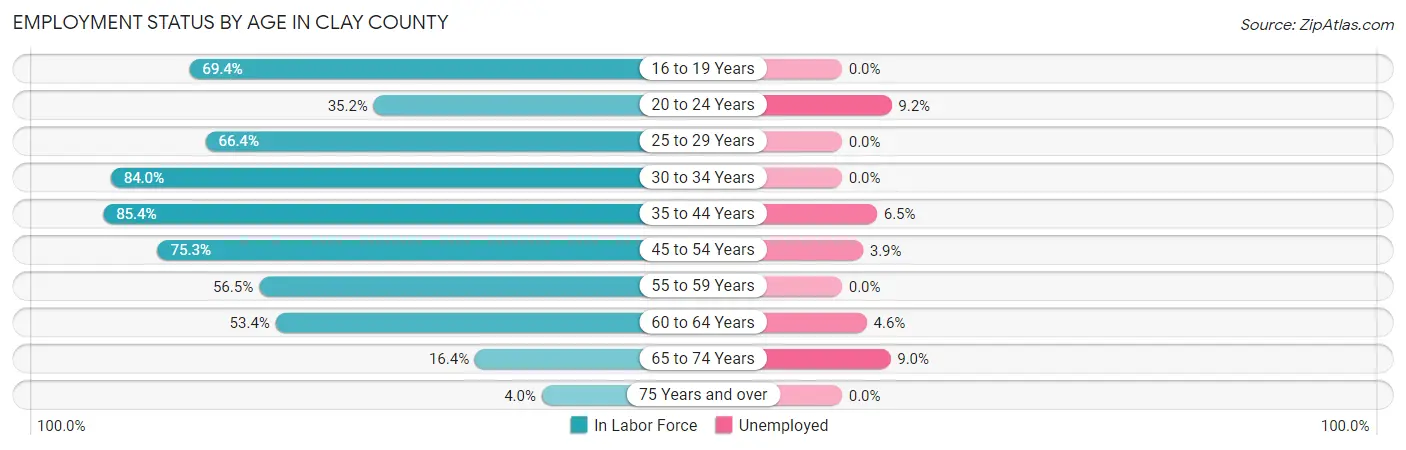
| Age Bracket | In Labor Force | Unemployed |
| 16 to 19 Years | 566 (69.4%) | 0 (0.0%) |
| 20 to 24 Years | 130 (35.2%) | 12 (9.2%) |
| 25 to 29 Years | 213 (66.4%) | 0 (0.0%) |
| 30 to 34 Years | 294 (84.0%) | 0 (0.0%) |
| 35 to 44 Years | 986 (85.4%) | 64 (6.5%) |
| 45 to 54 Years | 937 (75.3%) | 37 (3.9%) |
| 55 to 59 Years | 242 (56.5%) | 0 (0.0%) |
| 60 to 64 Years | 796 (53.4%) | 37 (4.6%) |
| 65 to 74 Years | 345 (16.4%) | 31 (9.0%) |
| 75 Years and over | 58 (4.0%) | 0 (0.0%) |
| Total | 4,566 (46.9%) | 183 (4.0%) |
Employment Status by Educational Attainment in Clay County
According to labor force statistics for Clay County, 69.5% of individuals (3,467) out of the total population between 25 and 64 years of age (4,988) are in the labor force, with 4.0% or 139 of them being unemployed. The group with the highest labor force participation rate are those with the educational attainment of bachelor's degree or higher, with 77.4% or 910 individuals in the labor force. Within the labor force, individuals with high school diploma education have the highest percentage of unemployment, with 9.9% or 76 of them being unemployed.
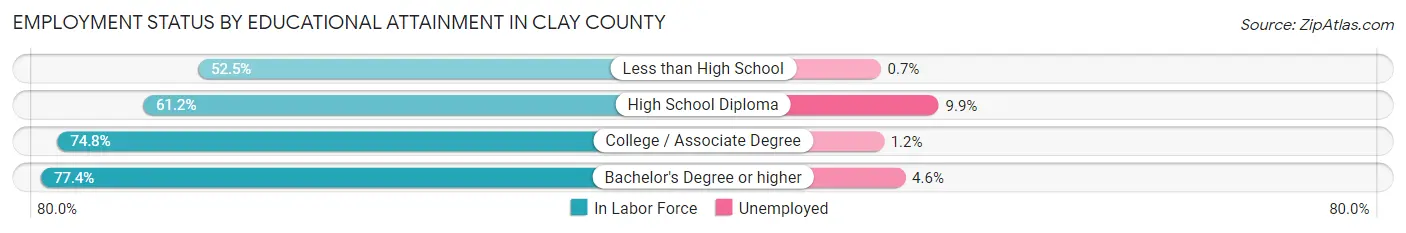
| Educational Attainment | In Labor Force | Unemployed |
| Less than High School | 289 (52.5%) | 4 (0.7%) |
| High School Diploma | 766 (61.2%) | 124 (9.9%) |
| College / Associate Degree | 1,503 (74.8%) | 24 (1.2%) |
| Bachelor's Degree or higher | 910 (77.4%) | 54 (4.6%) |
| Total | 3,467 (69.5%) | 200 (4.0%) |
Employment Occupations by Sex in Clay County
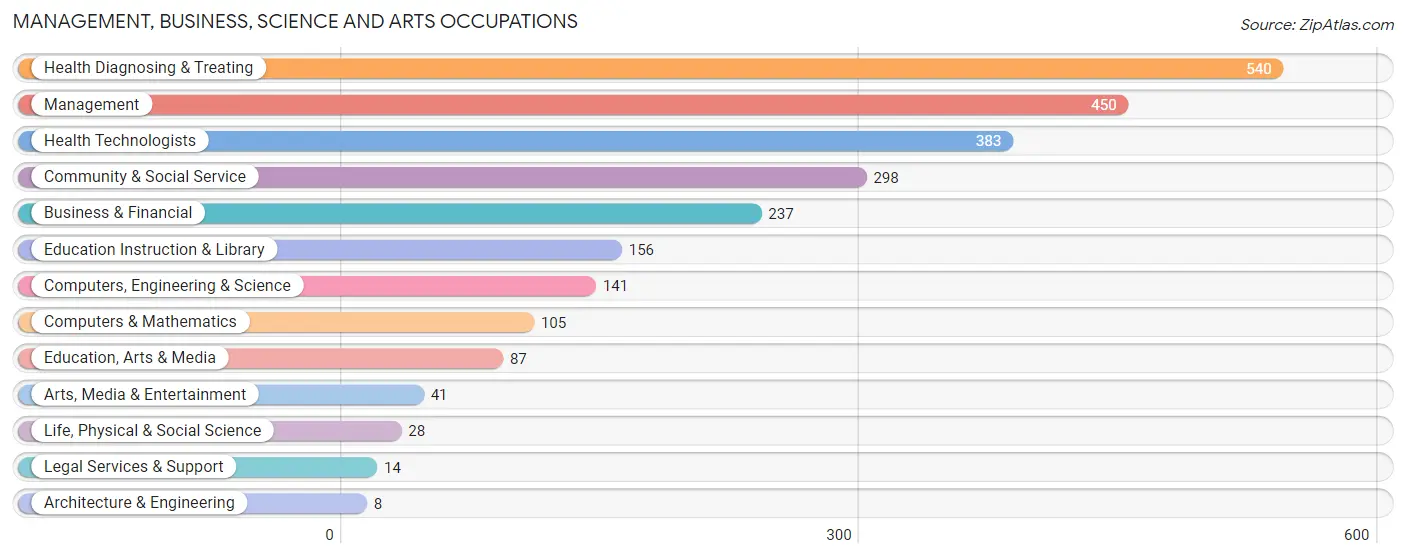
Management, Business, Science and Arts Occupations
The most common Management, Business, Science and Arts occupations in Clay County are Health Diagnosing & Treating (540 | 12.3%), Management (450 | 10.3%), Health Technologists (383 | 8.7%), Community & Social Service (298 | 6.8%), and Business & Financial (237 | 5.4%).
Management, Business, Science and Arts Occupations by Sex
Within the Management, Business, Science and Arts occupations in Clay County, the most male-oriented occupations are Architecture & Engineering (100.0%), Computers & Mathematics (87.6%), and Computers, Engineering & Science (81.6%), while the most female-oriented occupations are Health Diagnosing & Treating (100.0%), Health Technologists (100.0%), and Arts, Media & Entertainment (73.2%).
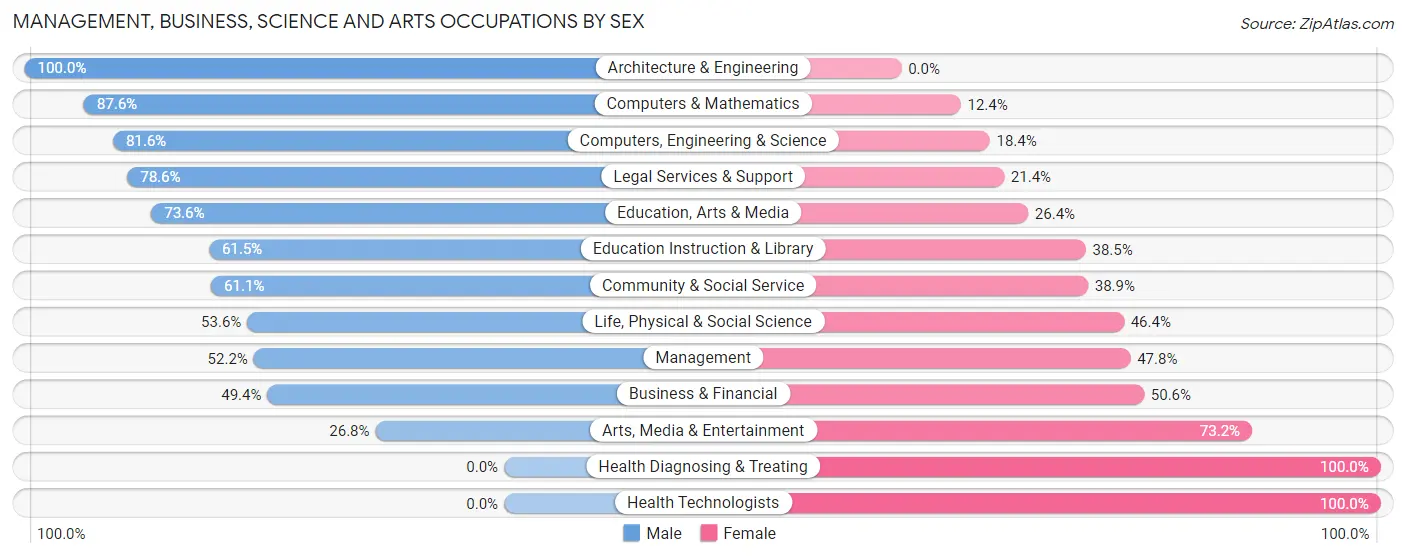
| Occupation | Male | Female |
| Management | 235 (52.2%) | 215 (47.8%) |
| Business & Financial | 117 (49.4%) | 120 (50.6%) |
| Computers, Engineering & Science | 115 (81.6%) | 26 (18.4%) |
| Computers & Mathematics | 92 (87.6%) | 13 (12.4%) |
| Architecture & Engineering | 8 (100.0%) | 0 (0.0%) |
| Life, Physical & Social Science | 15 (53.6%) | 13 (46.4%) |
| Community & Social Service | 182 (61.1%) | 116 (38.9%) |
| Education, Arts & Media | 64 (73.6%) | 23 (26.4%) |
| Legal Services & Support | 11 (78.6%) | 3 (21.4%) |
| Education Instruction & Library | 96 (61.5%) | 60 (38.5%) |
| Arts, Media & Entertainment | 11 (26.8%) | 30 (73.2%) |
| Health Diagnosing & Treating | 0 (0.0%) | 540 (100.0%) |
| Health Technologists | 0 (0.0%) | 383 (100.0%) |
| Total (Category) | 649 (39.0%) | 1,017 (61.0%) |
| Total (Overall) | 2,329 (53.1%) | 2,057 (46.9%) |
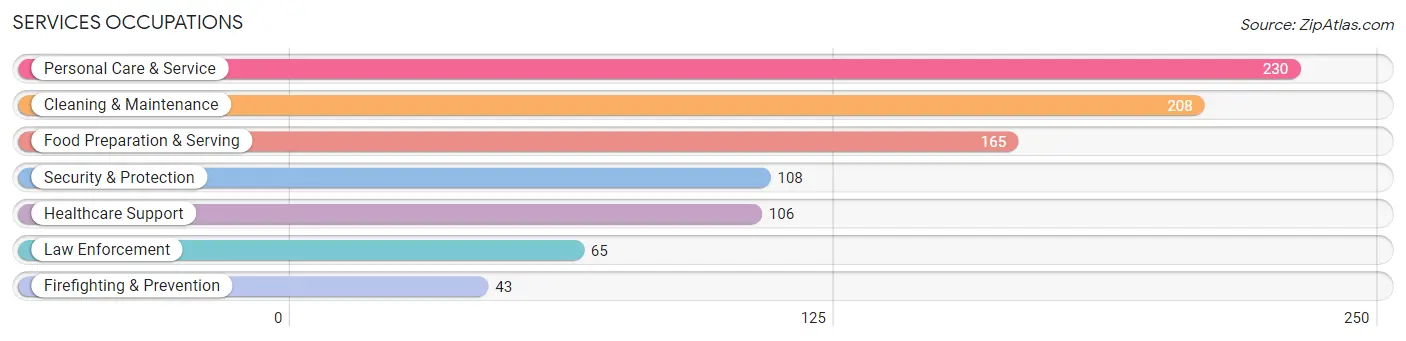
Services Occupations
The most common Services occupations in Clay County are Personal Care & Service (230 | 5.2%), Cleaning & Maintenance (208 | 4.7%), Food Preparation & Serving (165 | 3.8%), Security & Protection (108 | 2.5%), and Healthcare Support (106 | 2.4%).
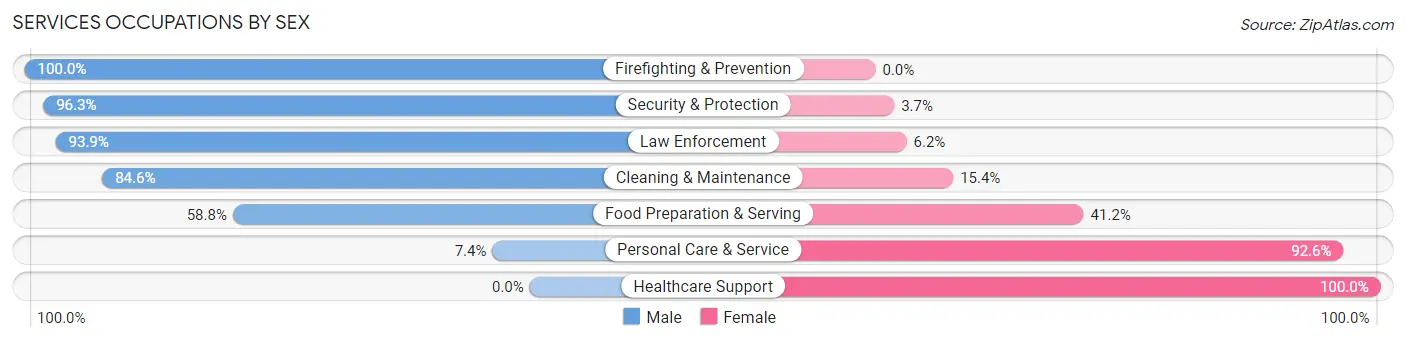
Services Occupations by Sex
Within the Services occupations in Clay County, the most male-oriented occupations are Firefighting & Prevention (100.0%), Security & Protection (96.3%), and Law Enforcement (93.9%), while the most female-oriented occupations are Healthcare Support (100.0%), Personal Care & Service (92.6%), and Food Preparation & Serving (41.2%).
| Occupation | Male | Female |
| Healthcare Support | 0 (0.0%) | 106 (100.0%) |
| Security & Protection | 104 (96.3%) | 4 (3.7%) |
| Firefighting & Prevention | 43 (100.0%) | 0 (0.0%) |
| Law Enforcement | 61 (93.9%) | 4 (6.1%) |
| Food Preparation & Serving | 97 (58.8%) | 68 (41.2%) |
| Cleaning & Maintenance | 176 (84.6%) | 32 (15.4%) |
| Personal Care & Service | 17 (7.4%) | 213 (92.6%) |
| Total (Category) | 394 (48.2%) | 423 (51.8%) |
| Total (Overall) | 2,329 (53.1%) | 2,057 (46.9%) |
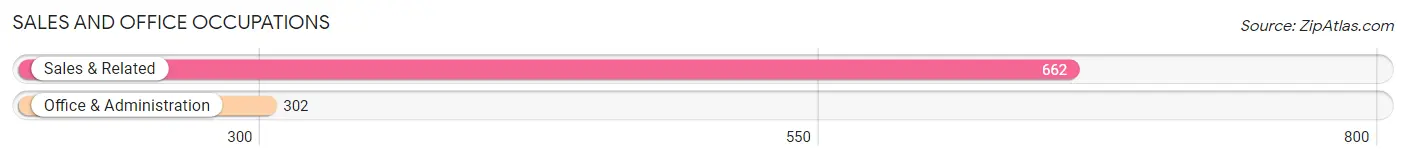
Sales and Office Occupations
The most common Sales and Office occupations in Clay County are Sales & Related (662 | 15.1%), and Office & Administration (302 | 6.9%).
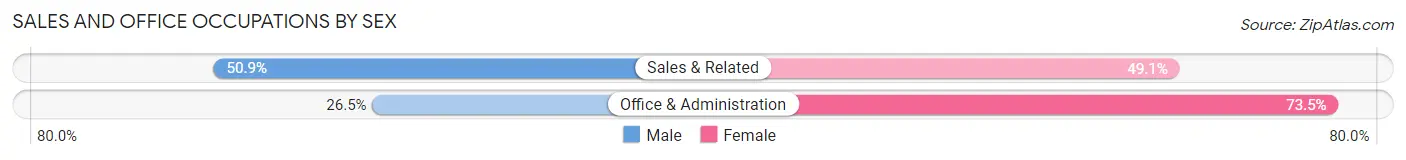
Sales and Office Occupations by Sex
| Occupation | Male | Female |
| Sales & Related | 337 (50.9%) | 325 (49.1%) |
| Office & Administration | 80 (26.5%) | 222 (73.5%) |
| Total (Category) | 417 (43.3%) | 547 (56.7%) |
| Total (Overall) | 2,329 (53.1%) | 2,057 (46.9%) |
Natural Resources, Construction and Maintenance Occupations
The most common Natural Resources, Construction and Maintenance occupations in Clay County are Construction & Extraction (337 | 7.7%), and Installation, Maintenance & Repair (99 | 2.3%).
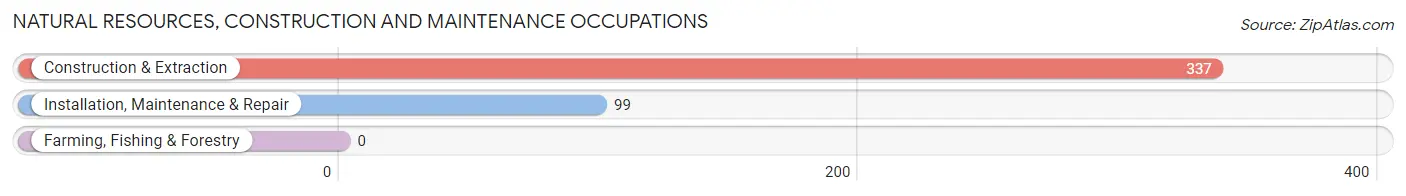
Natural Resources, Construction and Maintenance Occupations by Sex
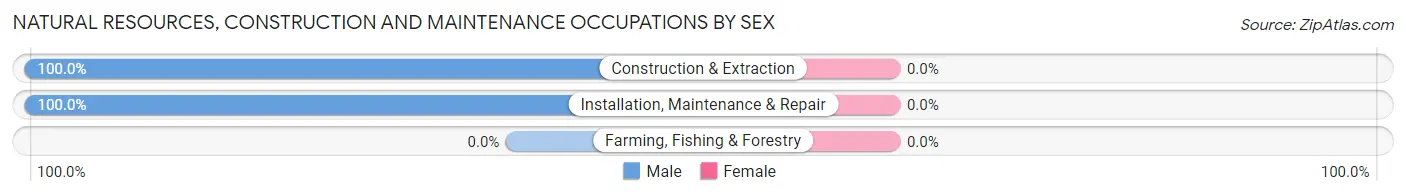
| Occupation | Male | Female |
| Farming, Fishing & Forestry | 0 (0.0%) | 0 (0.0%) |
| Construction & Extraction | 337 (100.0%) | 0 (0.0%) |
| Installation, Maintenance & Repair | 99 (100.0%) | 0 (0.0%) |
| Total (Category) | 436 (100.0%) | 0 (0.0%) |
| Total (Overall) | 2,329 (53.1%) | 2,057 (46.9%) |
Production, Transportation and Moving Occupations
The most common Production, Transportation and Moving occupations in Clay County are Transportation (239 | 5.4%), Material Moving (137 | 3.1%), and Production (127 | 2.9%).
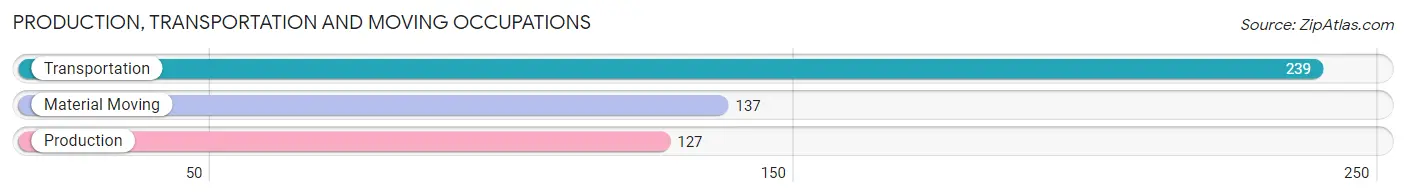
Production, Transportation and Moving Occupations by Sex
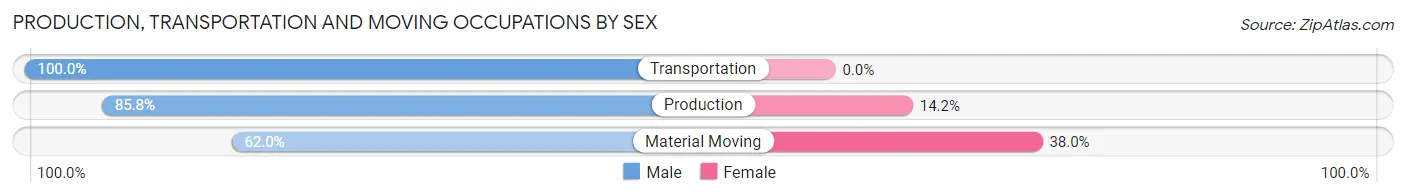
| Occupation | Male | Female |
| Production | 109 (85.8%) | 18 (14.2%) |
| Transportation | 239 (100.0%) | 0 (0.0%) |
| Material Moving | 85 (62.0%) | 52 (38.0%) |
| Total (Category) | 433 (86.1%) | 70 (13.9%) |
| Total (Overall) | 2,329 (53.1%) | 2,057 (46.9%) |
Employment Industries by Sex in Clay County
Employment Industries in Clay County
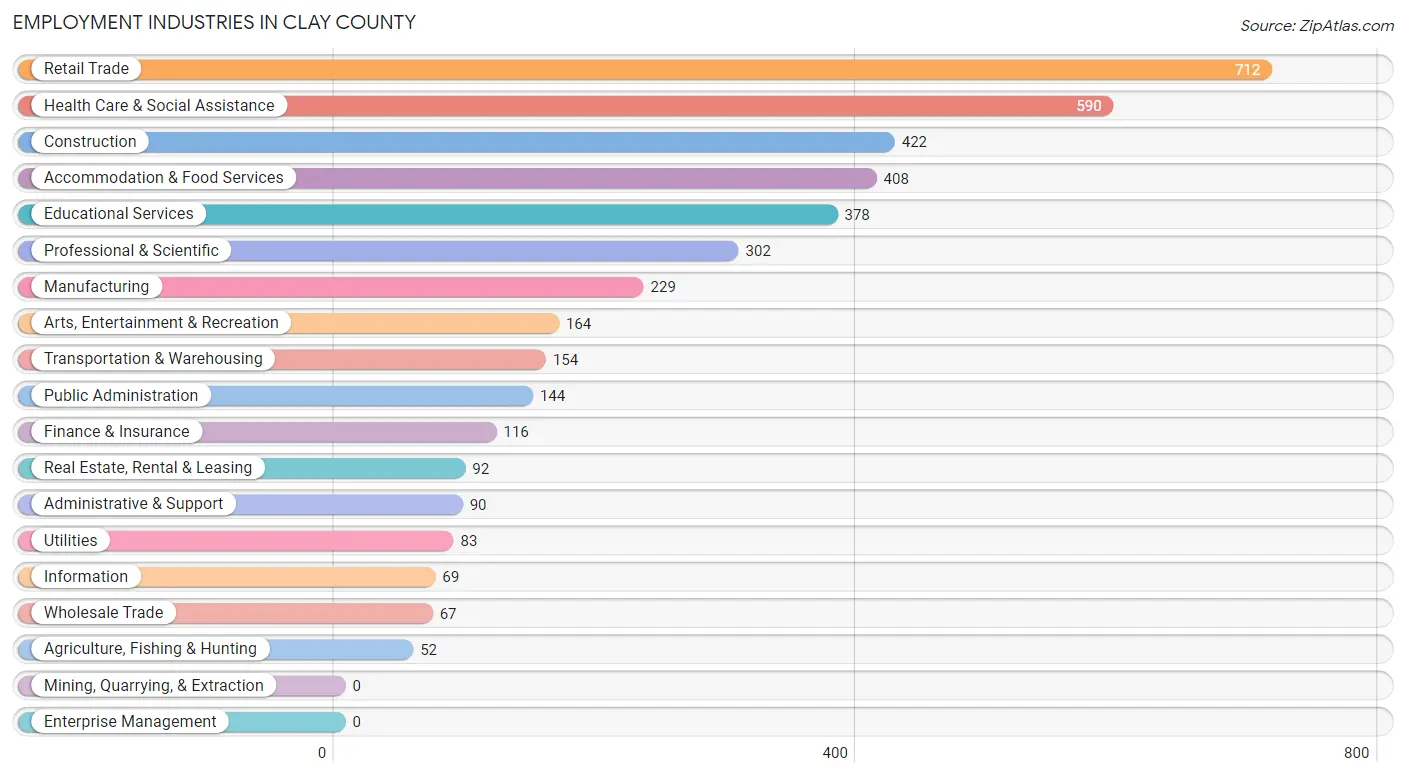
The major employment industries in Clay County include Retail Trade (712 | 16.2%), Health Care & Social Assistance (590 | 13.5%), Construction (422 | 9.6%), Accommodation & Food Services (408 | 9.3%), and Educational Services (378 | 8.6%).
Employment Industries by Sex in Clay County
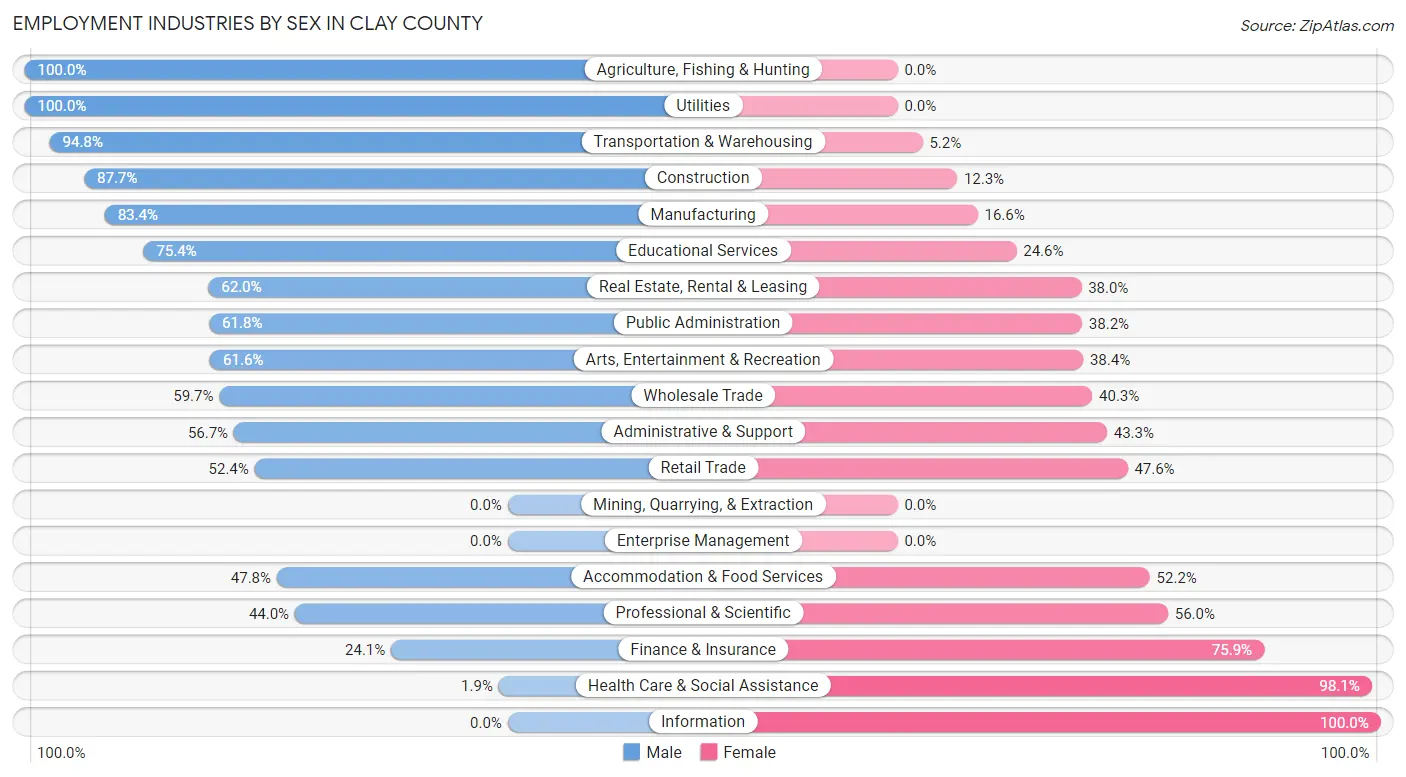
The Clay County industries that see more men than women are Agriculture, Fishing & Hunting (100.0%), Utilities (100.0%), and Transportation & Warehousing (94.8%), whereas the industries that tend to have a higher number of women are Information (100.0%), Health Care & Social Assistance (98.1%), and Finance & Insurance (75.9%).
| Industry | Male | Female |
| Agriculture, Fishing & Hunting | 52 (100.0%) | 0 (0.0%) |
| Mining, Quarrying, & Extraction | 0 (0.0%) | 0 (0.0%) |
| Construction | 370 (87.7%) | 52 (12.3%) |
| Manufacturing | 191 (83.4%) | 38 (16.6%) |
| Wholesale Trade | 40 (59.7%) | 27 (40.3%) |
| Retail Trade | 373 (52.4%) | 339 (47.6%) |
| Transportation & Warehousing | 146 (94.8%) | 8 (5.2%) |
| Utilities | 83 (100.0%) | 0 (0.0%) |
| Information | 0 (0.0%) | 69 (100.0%) |
| Finance & Insurance | 28 (24.1%) | 88 (75.9%) |
| Real Estate, Rental & Leasing | 57 (62.0%) | 35 (38.0%) |
| Professional & Scientific | 133 (44.0%) | 169 (56.0%) |
| Enterprise Management | 0 (0.0%) | 0 (0.0%) |
| Administrative & Support | 51 (56.7%) | 39 (43.3%) |
| Educational Services | 285 (75.4%) | 93 (24.6%) |
| Health Care & Social Assistance | 11 (1.9%) | 579 (98.1%) |
| Arts, Entertainment & Recreation | 101 (61.6%) | 63 (38.4%) |
| Accommodation & Food Services | 195 (47.8%) | 213 (52.2%) |
| Public Administration | 89 (61.8%) | 55 (38.2%) |
| Total | 2,329 (53.1%) | 2,057 (46.9%) |
Education in Clay County
School Enrollment in Clay County
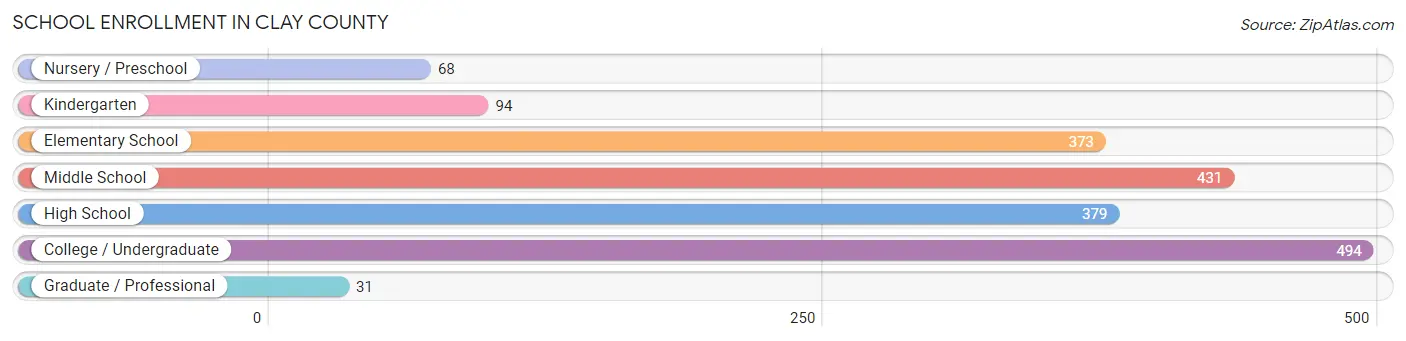
The most common levels of schooling among the 1,870 students in Clay County are college / undergraduate (494 | 26.4%), middle school (431 | 23.1%), and high school (379 | 20.3%).
| School Level | # Students | % Students |
| Nursery / Preschool | 68 | 3.6% |
| Kindergarten | 94 | 5.0% |
| Elementary School | 373 | 20.0% |
| Middle School | 431 | 23.1% |
| High School | 379 | 20.3% |
| College / Undergraduate | 494 | 26.4% |
| Graduate / Professional | 31 | 1.7% |
| Total | 1,870 | 100.0% |
School Enrollment by Age by Funding Source in Clay County
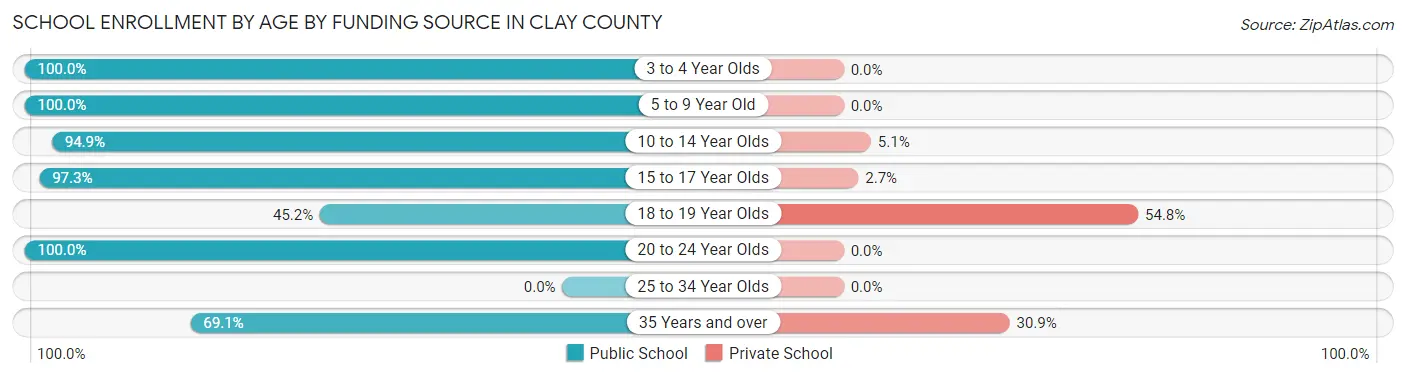
Out of a total of 1,870 students who are enrolled in schools in Clay County, 163 (8.7%) attend a private institution, while the remaining 1,707 (91.3%) are enrolled in public schools. The age group of 18 to 19 year olds has the highest likelihood of being enrolled in private schools, with 68 (54.8% in the age bracket) enrolled. Conversely, the age group of 3 to 4 year olds has the lowest likelihood of being enrolled in a private school, with 41 (100.0% in the age bracket) attending a public institution.
| Age Bracket | Public School | Private School |
| 3 to 4 Year Olds | 41 (100.0%) | 0 (0.0%) |
| 5 to 9 Year Old | 412 (100.0%) | 0 (0.0%) |
| 10 to 14 Year Olds | 487 (94.9%) | 26 (5.1%) |
| 15 to 17 Year Olds | 356 (97.3%) | 10 (2.7%) |
| 18 to 19 Year Olds | 56 (45.2%) | 68 (54.8%) |
| 20 to 24 Year Olds | 223 (100.0%) | 0 (0.0%) |
| 25 to 34 Year Olds | 0 (0.0%) | 0 (0.0%) |
| 35 Years and over | 132 (69.1%) | 59 (30.9%) |
| Total | 1,707 (91.3%) | 163 (8.7%) |
Educational Attainment by Field of Study in Clay County
Education (655 | 25.8%), science & technology (525 | 20.6%), business (382 | 15.0%), liberal arts & history (220 | 8.6%), and bio, nature & agricultural (168 | 6.6%) are the most common fields of study among 2,543 individuals in Clay County who have obtained a bachelor's degree or higher.
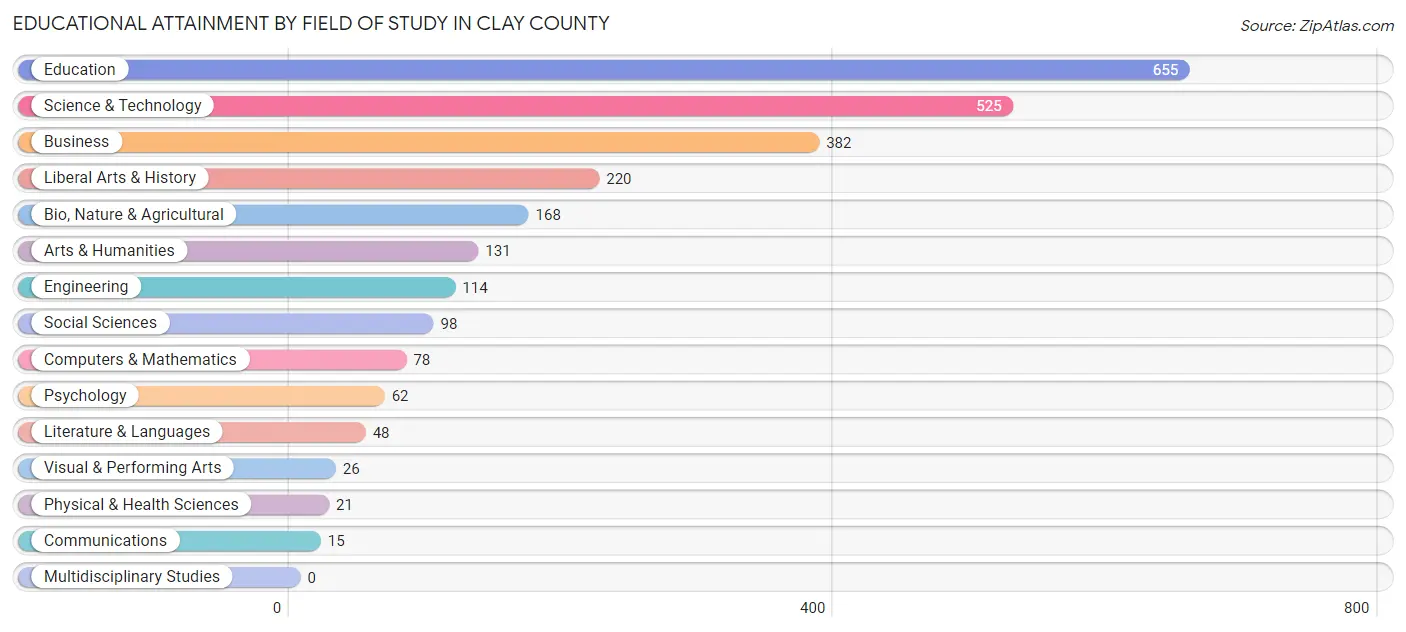
| Field of Study | # Graduates | % Graduates |
| Computers & Mathematics | 78 | 3.1% |
| Bio, Nature & Agricultural | 168 | 6.6% |
| Physical & Health Sciences | 21 | 0.8% |
| Psychology | 62 | 2.4% |
| Social Sciences | 98 | 3.8% |
| Engineering | 114 | 4.5% |
| Multidisciplinary Studies | 0 | 0.0% |
| Science & Technology | 525 | 20.6% |
| Business | 382 | 15.0% |
| Education | 655 | 25.8% |
| Literature & Languages | 48 | 1.9% |
| Liberal Arts & History | 220 | 8.6% |
| Visual & Performing Arts | 26 | 1.0% |
| Communications | 15 | 0.6% |
| Arts & Humanities | 131 | 5.1% |
| Total | 2,543 | 100.0% |
Transportation & Commute in Clay County
Vehicle Availability by Sex in Clay County
The most prevalent vehicle ownership categories in Clay County are males with 2 vehicles (880, accounting for 37.8%) and females with 2 vehicles (857, making up 43.3%).
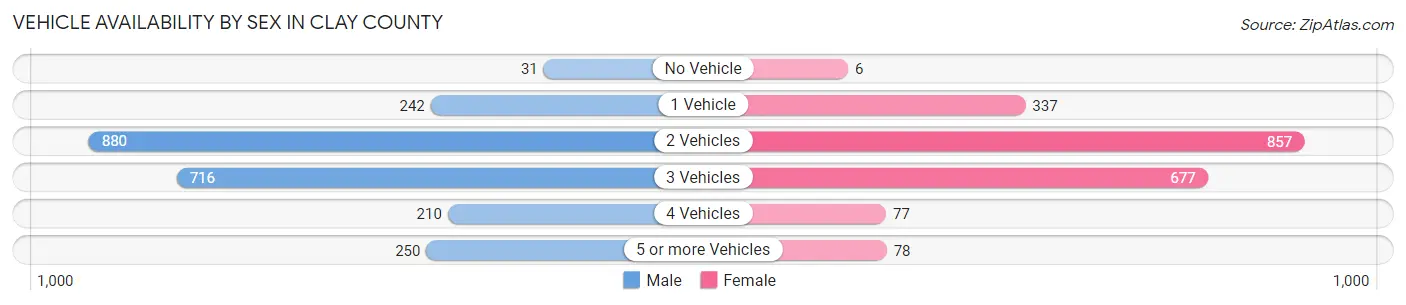
| Vehicles Available | Male | Female |
| No Vehicle | 31 (1.3%) | 6 (0.3%) |
| 1 Vehicle | 242 (10.4%) | 337 (16.6%) |
| 2 Vehicles | 880 (37.8%) | 857 (42.2%) |
| 3 Vehicles | 716 (30.7%) | 677 (33.3%) |
| 4 Vehicles | 210 (9.0%) | 77 (3.8%) |
| 5 or more Vehicles | 250 (10.7%) | 78 (3.8%) |
| Total | 2,329 (100.0%) | 2,032 (100.0%) |
Commute Time in Clay County
The most frequently occuring commute durations in Clay County are 10 to 14 minutes (824 commuters, 20.3%), 5 to 9 minutes (793 commuters, 19.6%), and 20 to 24 minutes (552 commuters, 13.6%).
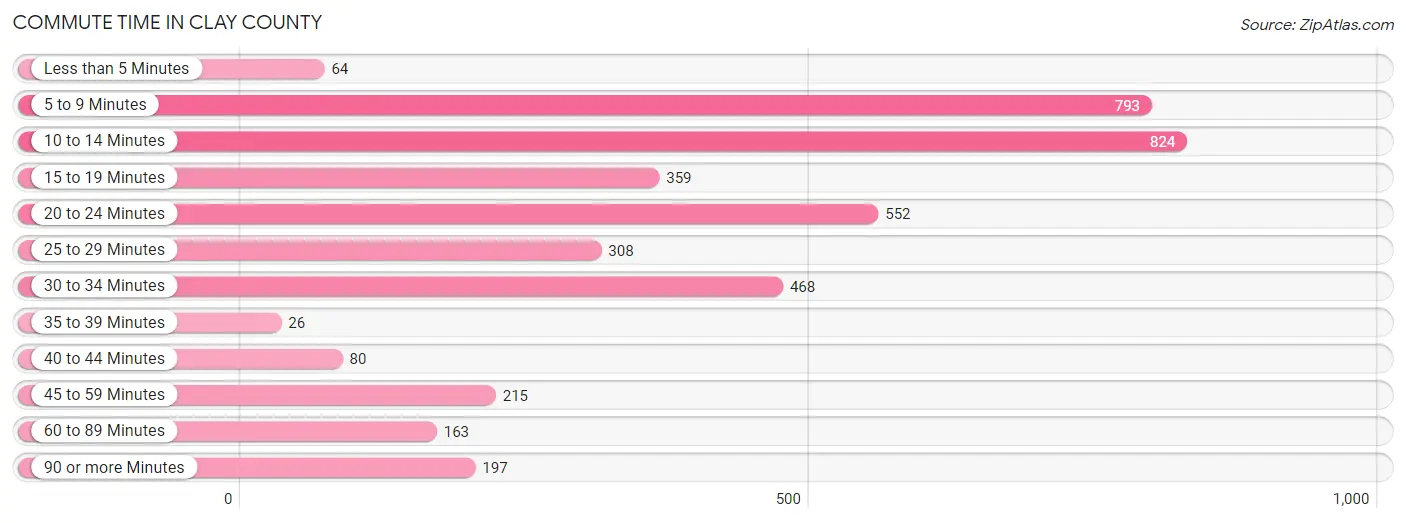
| Commute Time | # Commuters | % Commuters |
| Less than 5 Minutes | 64 | 1.6% |
| 5 to 9 Minutes | 793 | 19.6% |
| 10 to 14 Minutes | 824 | 20.3% |
| 15 to 19 Minutes | 359 | 8.9% |
| 20 to 24 Minutes | 552 | 13.6% |
| 25 to 29 Minutes | 308 | 7.6% |
| 30 to 34 Minutes | 468 | 11.6% |
| 35 to 39 Minutes | 26 | 0.6% |
| 40 to 44 Minutes | 80 | 2.0% |
| 45 to 59 Minutes | 215 | 5.3% |
| 60 to 89 Minutes | 163 | 4.0% |
| 90 or more Minutes | 197 | 4.9% |
Commute Time by Sex in Clay County
The most common commute times in Clay County are 5 to 9 minutes (508 commuters, 23.1%) for males and 10 to 14 minutes (446 commuters, 24.1%) for females.
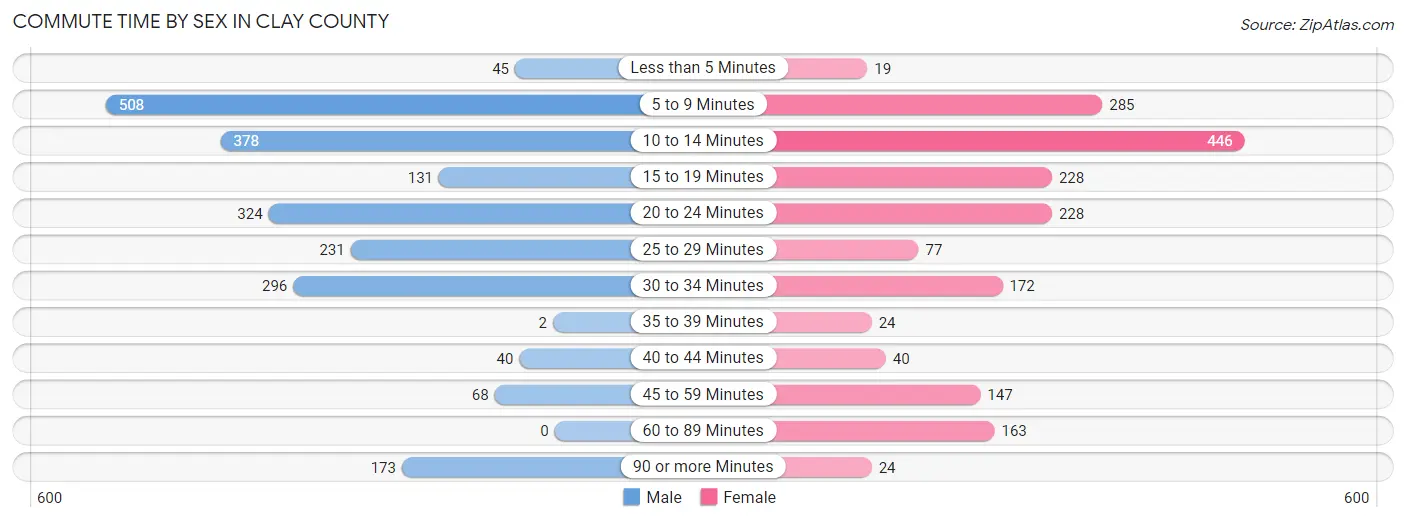
| Commute Time | Male | Female |
| Less than 5 Minutes | 45 (2.1%) | 19 (1.0%) |
| 5 to 9 Minutes | 508 (23.1%) | 285 (15.4%) |
| 10 to 14 Minutes | 378 (17.2%) | 446 (24.1%) |
| 15 to 19 Minutes | 131 (6.0%) | 228 (12.3%) |
| 20 to 24 Minutes | 324 (14.7%) | 228 (12.3%) |
| 25 to 29 Minutes | 231 (10.5%) | 77 (4.2%) |
| 30 to 34 Minutes | 296 (13.5%) | 172 (9.3%) |
| 35 to 39 Minutes | 2 (0.1%) | 24 (1.3%) |
| 40 to 44 Minutes | 40 (1.8%) | 40 (2.2%) |
| 45 to 59 Minutes | 68 (3.1%) | 147 (7.9%) |
| 60 to 89 Minutes | 0 (0.0%) | 163 (8.8%) |
| 90 or more Minutes | 173 (7.9%) | 24 (1.3%) |
Time of Departure to Work by Sex in Clay County
The most frequent times of departure to work in Clay County are 7:30 AM to 7:59 AM (385, 17.5%) for males and 6:30 AM to 6:59 AM (494, 26.7%) for females.
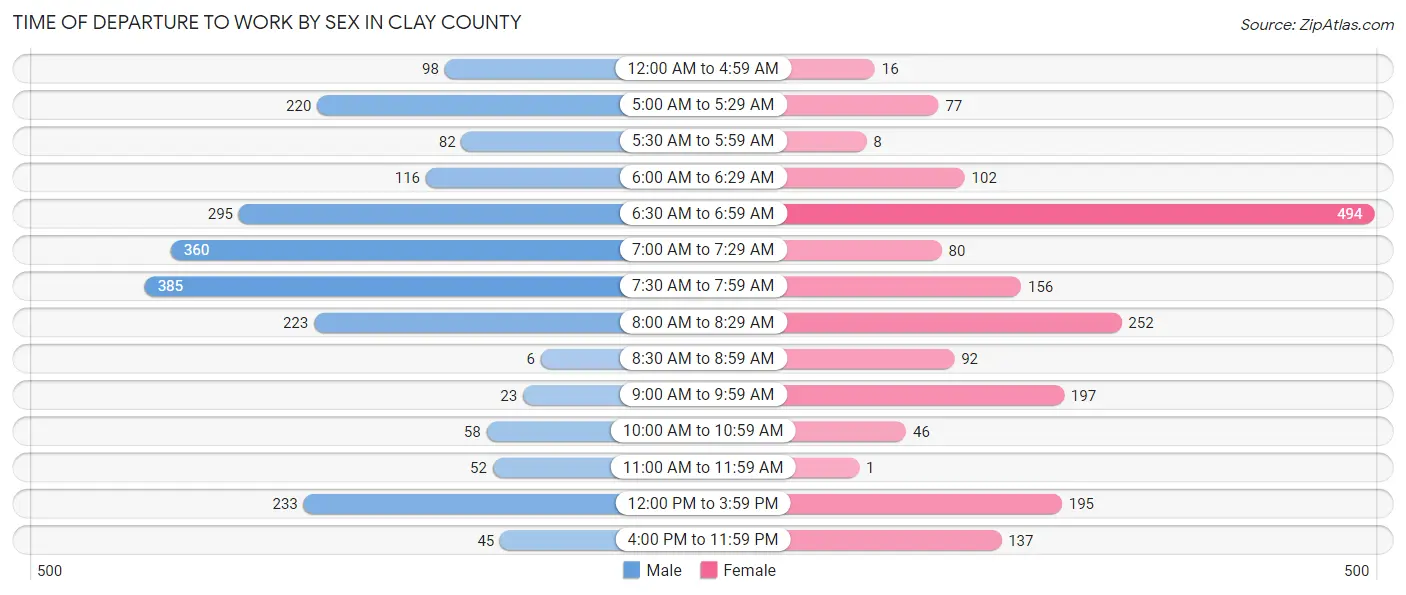
| Time of Departure | Male | Female |
| 12:00 AM to 4:59 AM | 98 (4.5%) | 16 (0.9%) |
| 5:00 AM to 5:29 AM | 220 (10.0%) | 77 (4.2%) |
| 5:30 AM to 5:59 AM | 82 (3.7%) | 8 (0.4%) |
| 6:00 AM to 6:29 AM | 116 (5.3%) | 102 (5.5%) |
| 6:30 AM to 6:59 AM | 295 (13.4%) | 494 (26.7%) |
| 7:00 AM to 7:29 AM | 360 (16.4%) | 80 (4.3%) |
| 7:30 AM to 7:59 AM | 385 (17.5%) | 156 (8.4%) |
| 8:00 AM to 8:29 AM | 223 (10.2%) | 252 (13.6%) |
| 8:30 AM to 8:59 AM | 6 (0.3%) | 92 (5.0%) |
| 9:00 AM to 9:59 AM | 23 (1.1%) | 197 (10.6%) |
| 10:00 AM to 10:59 AM | 58 (2.6%) | 46 (2.5%) |
| 11:00 AM to 11:59 AM | 52 (2.4%) | 1 (0.1%) |
| 12:00 PM to 3:59 PM | 233 (10.6%) | 195 (10.5%) |
| 4:00 PM to 11:59 PM | 45 (2.1%) | 137 (7.4%) |
| Total | 2,196 (100.0%) | 1,853 (100.0%) |
Housing Occupancy in Clay County
Occupancy by Ownership in Clay County
Of the total 4,892 dwellings in Clay County, owner-occupied units account for 3,900 (79.7%), while renter-occupied units make up 992 (20.3%).
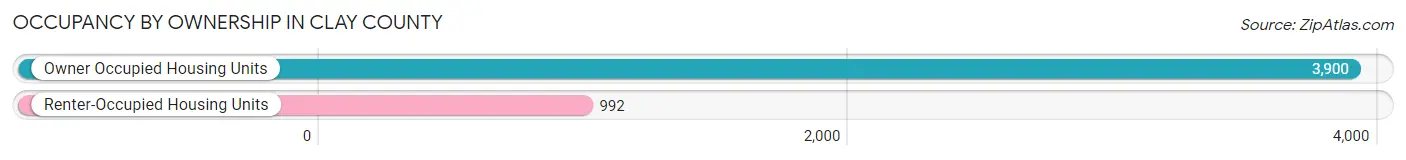
| Occupancy | # Housing Units | % Housing Units |
| Owner Occupied Housing Units | 3,900 | 79.7% |
| Renter-Occupied Housing Units | 992 | 20.3% |
| Total Occupied Housing Units | 4,892 | 100.0% |
Occupancy by Household Size in Clay County
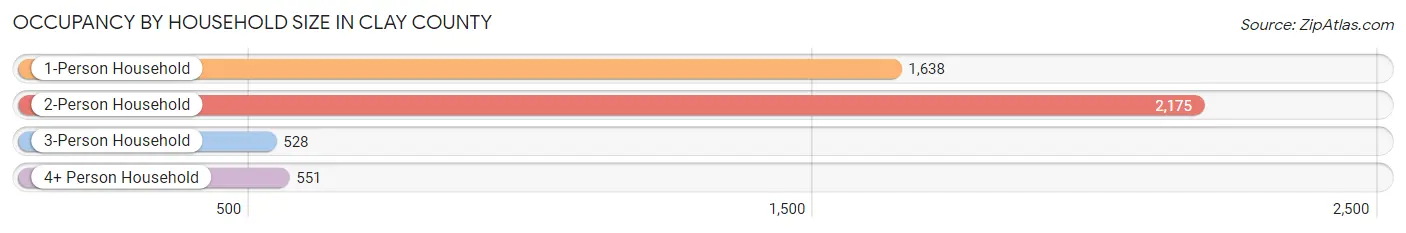
| Household Size | # Housing Units | % Housing Units |
| 1-Person Household | 1,638 | 33.5% |
| 2-Person Household | 2,175 | 44.5% |
| 3-Person Household | 528 | 10.8% |
| 4+ Person Household | 551 | 11.3% |
| Total Housing Units | 4,892 | 100.0% |
Occupancy by Ownership by Household Size in Clay County
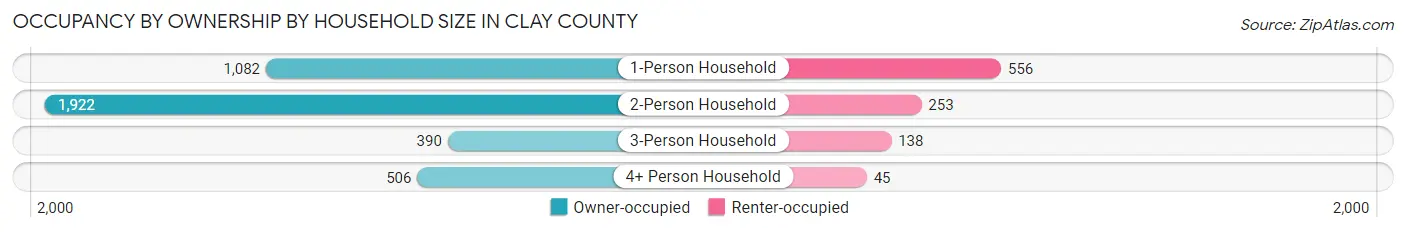
| Household Size | Owner-occupied | Renter-occupied |
| 1-Person Household | 1,082 (66.1%) | 556 (33.9%) |
| 2-Person Household | 1,922 (88.4%) | 253 (11.6%) |
| 3-Person Household | 390 (73.9%) | 138 (26.1%) |
| 4+ Person Household | 506 (91.8%) | 45 (8.2%) |
| Total Housing Units | 3,900 (79.7%) | 992 (20.3%) |
Occupancy by Educational Attainment in Clay County
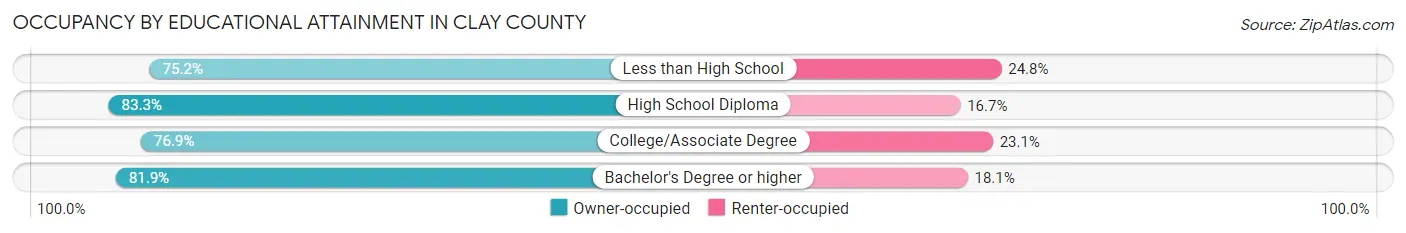
| Household Size | Owner-occupied | Renter-occupied |
| Less than High School | 367 (75.2%) | 121 (24.8%) |
| High School Diploma | 930 (83.3%) | 186 (16.7%) |
| College/Associate Degree | 1,378 (76.9%) | 414 (23.1%) |
| Bachelor's Degree or higher | 1,225 (81.9%) | 271 (18.1%) |
Occupancy by Age of Householder in Clay County
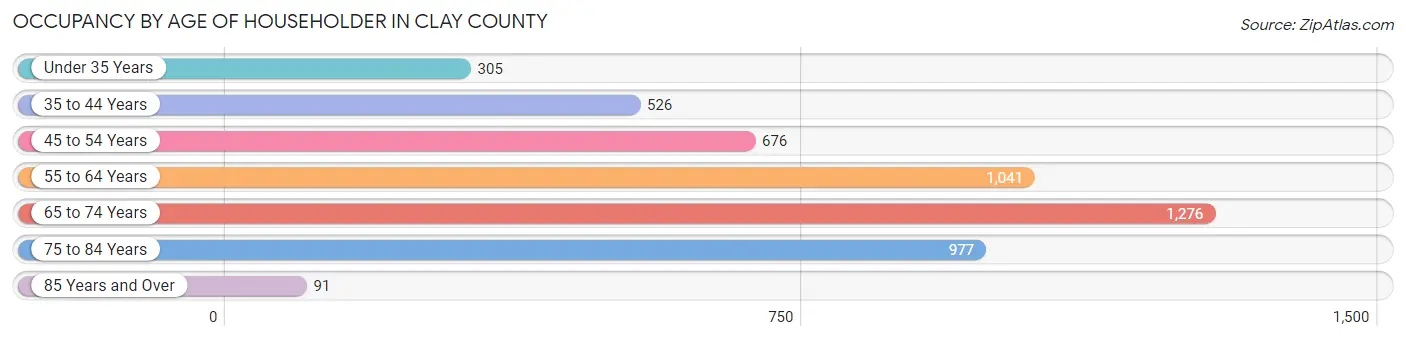
| Age Bracket | # Households | % Households |
| Under 35 Years | 305 | 6.2% |
| 35 to 44 Years | 526 | 10.7% |
| 45 to 54 Years | 676 | 13.8% |
| 55 to 64 Years | 1,041 | 21.3% |
| 65 to 74 Years | 1,276 | 26.1% |
| 75 to 84 Years | 977 | 20.0% |
| 85 Years and Over | 91 | 1.9% |
| Total | 4,892 | 100.0% |
Housing Finances in Clay County
Median Income by Occupancy in Clay County
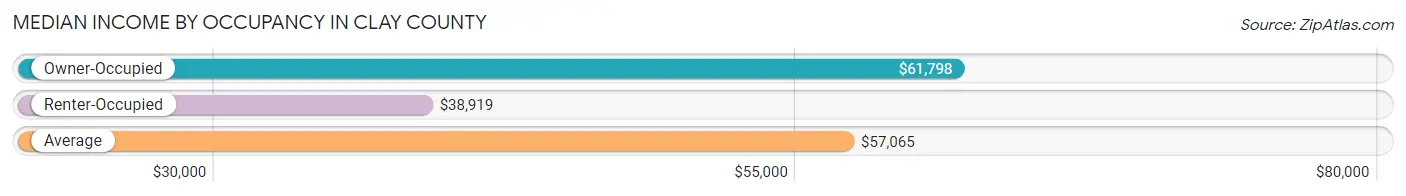
| Occupancy Type | # Households | Median Income |
| Owner-Occupied | 3,900 (79.7%) | $61,798 |
| Renter-Occupied | 992 (20.3%) | $38,919 |
| Average | 4,892 (100.0%) | $57,065 |
Occupancy by Householder Income Bracket in Clay County
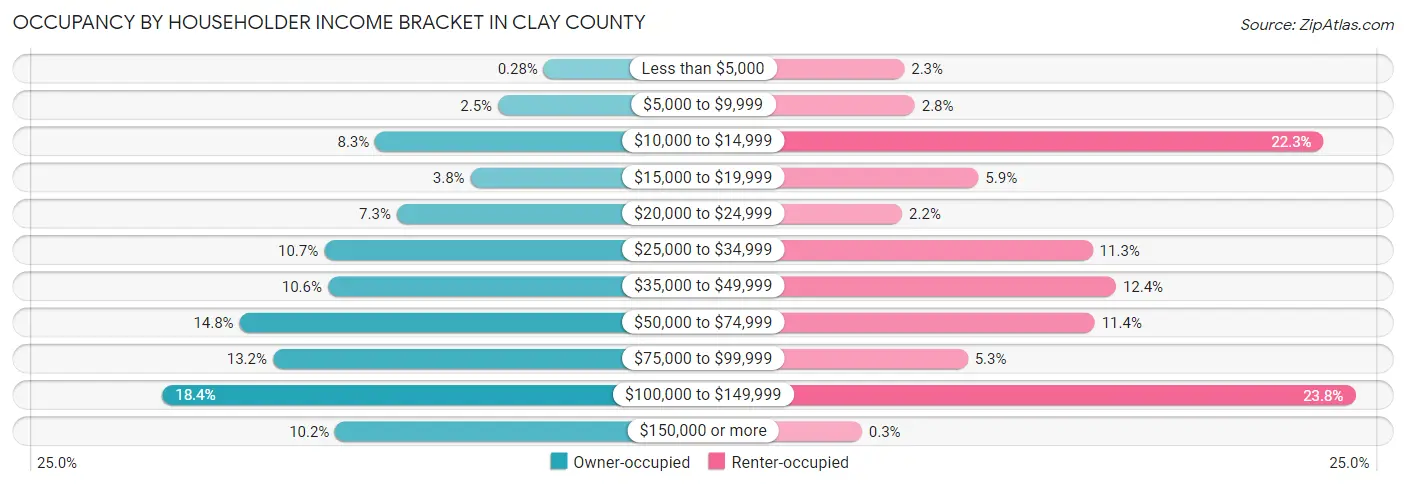
| Income Bracket | Owner-occupied | Renter-occupied |
| Less than $5,000 | 11 (0.3%) | 23 (2.3%) |
| $5,000 to $9,999 | 96 (2.5%) | 28 (2.8%) |
| $10,000 to $14,999 | 324 (8.3%) | 221 (22.3%) |
| $15,000 to $19,999 | 147 (3.8%) | 58 (5.9%) |
| $20,000 to $24,999 | 284 (7.3%) | 22 (2.2%) |
| $25,000 to $34,999 | 419 (10.7%) | 112 (11.3%) |
| $35,000 to $49,999 | 412 (10.6%) | 123 (12.4%) |
| $50,000 to $74,999 | 576 (14.8%) | 113 (11.4%) |
| $75,000 to $99,999 | 514 (13.2%) | 53 (5.3%) |
| $100,000 to $149,999 | 719 (18.4%) | 236 (23.8%) |
| $150,000 or more | 398 (10.2%) | 3 (0.3%) |
| Total | 3,900 (100.0%) | 992 (100.0%) |
Monthly Housing Cost Tiers in Clay County
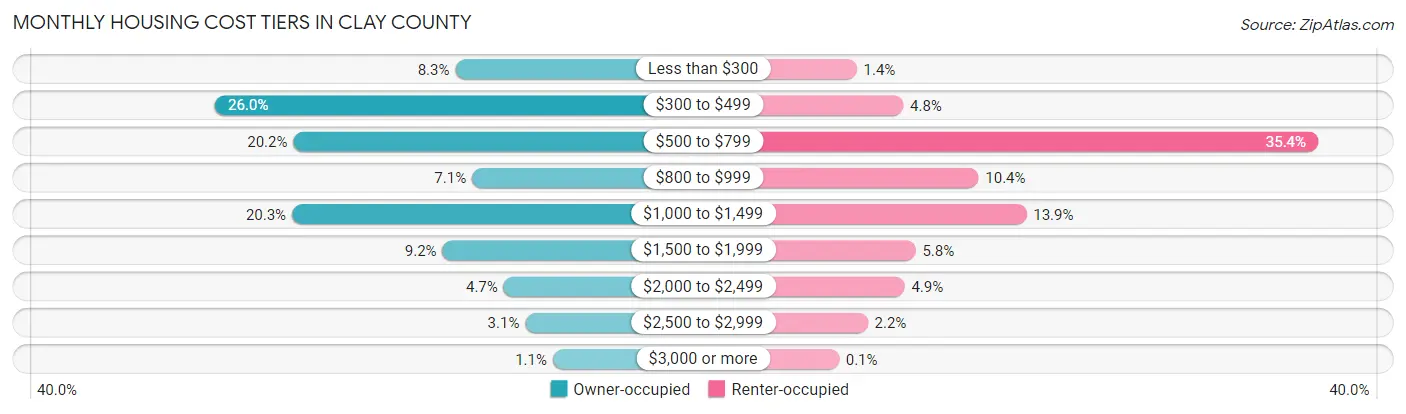
| Monthly Cost | Owner-occupied | Renter-occupied |
| Less than $300 | 323 (8.3%) | 14 (1.4%) |
| $300 to $499 | 1,013 (26.0%) | 48 (4.8%) |
| $500 to $799 | 788 (20.2%) | 351 (35.4%) |
| $800 to $999 | 275 (7.0%) | 103 (10.4%) |
| $1,000 to $1,499 | 792 (20.3%) | 138 (13.9%) |
| $1,500 to $1,999 | 360 (9.2%) | 57 (5.8%) |
| $2,000 to $2,499 | 184 (4.7%) | 49 (4.9%) |
| $2,500 to $2,999 | 122 (3.1%) | 22 (2.2%) |
| $3,000 or more | 43 (1.1%) | 1 (0.1%) |
| Total | 3,900 (100.0%) | 992 (100.0%) |
Physical Housing Characteristics in Clay County
Housing Structures in Clay County
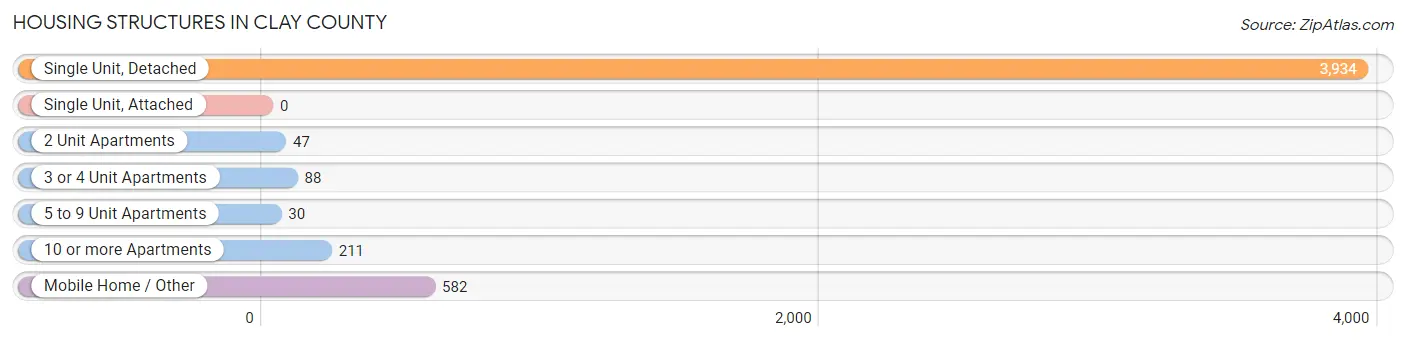
| Structure Type | # Housing Units | % Housing Units |
| Single Unit, Detached | 3,934 | 80.4% |
| Single Unit, Attached | 0 | 0.0% |
| 2 Unit Apartments | 47 | 1.0% |
| 3 or 4 Unit Apartments | 88 | 1.8% |
| 5 to 9 Unit Apartments | 30 | 0.6% |
| 10 or more Apartments | 211 | 4.3% |
| Mobile Home / Other | 582 | 11.9% |
| Total | 4,892 | 100.0% |
Housing Structures by Occupancy in Clay County
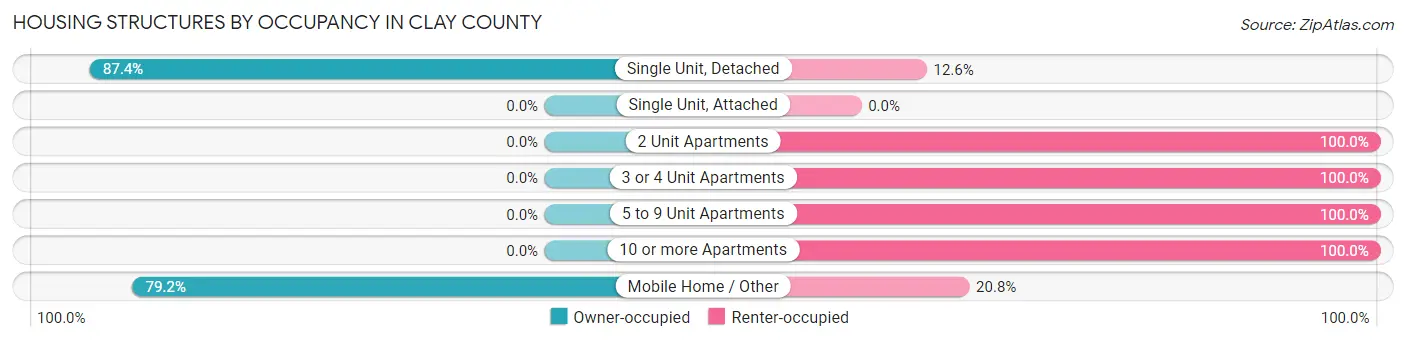
| Structure Type | Owner-occupied | Renter-occupied |
| Single Unit, Detached | 3,439 (87.4%) | 495 (12.6%) |
| Single Unit, Attached | 0 (0.0%) | 0 (0.0%) |
| 2 Unit Apartments | 0 (0.0%) | 47 (100.0%) |
| 3 or 4 Unit Apartments | 0 (0.0%) | 88 (100.0%) |
| 5 to 9 Unit Apartments | 0 (0.0%) | 30 (100.0%) |
| 10 or more Apartments | 0 (0.0%) | 211 (100.0%) |
| Mobile Home / Other | 461 (79.2%) | 121 (20.8%) |
| Total | 3,900 (79.7%) | 992 (20.3%) |
Housing Structures by Number of Rooms in Clay County
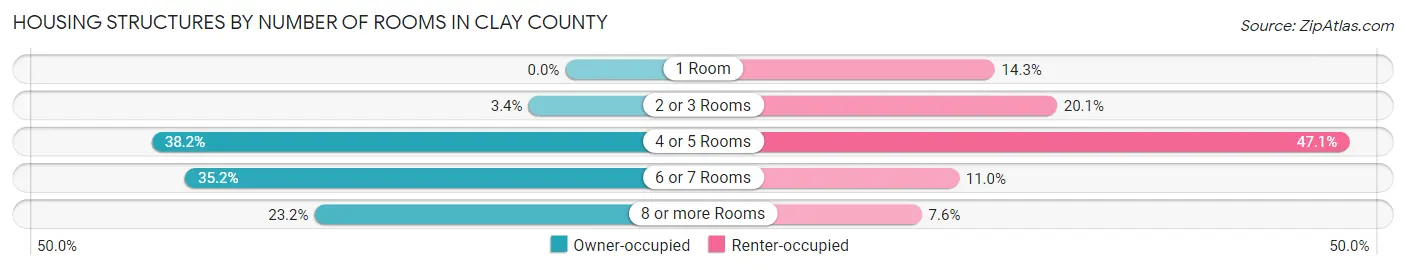
| Number of Rooms | Owner-occupied | Renter-occupied |
| 1 Room | 0 (0.0%) | 142 (14.3%) |
| 2 or 3 Rooms | 133 (3.4%) | 199 (20.1%) |
| 4 or 5 Rooms | 1,491 (38.2%) | 467 (47.1%) |
| 6 or 7 Rooms | 1,371 (35.1%) | 109 (11.0%) |
| 8 or more Rooms | 905 (23.2%) | 75 (7.6%) |
| Total | 3,900 (100.0%) | 992 (100.0%) |
Housing Structure by Heating Type in Clay County
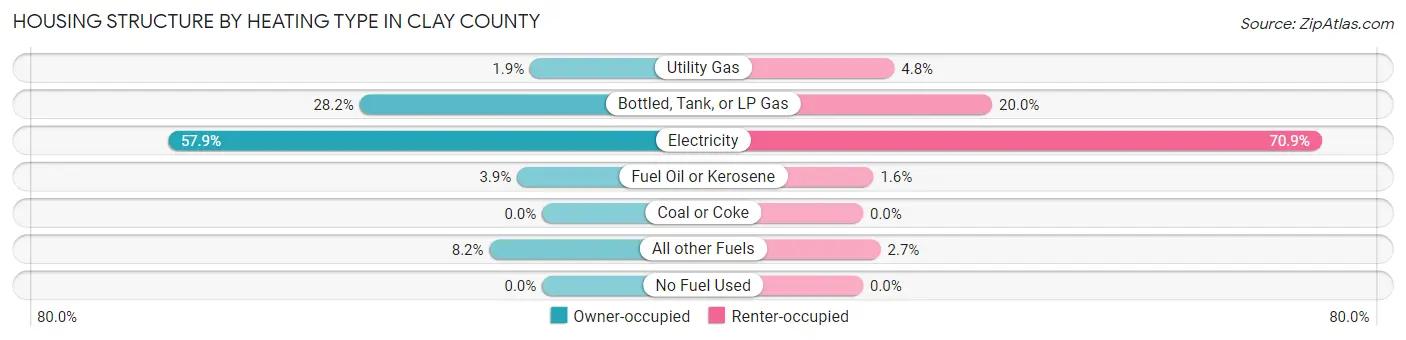
| Heating Type | Owner-occupied | Renter-occupied |
| Utility Gas | 73 (1.9%) | 48 (4.8%) |
| Bottled, Tank, or LP Gas | 1,101 (28.2%) | 198 (20.0%) |
| Electricity | 2,257 (57.9%) | 703 (70.9%) |
| Fuel Oil or Kerosene | 151 (3.9%) | 16 (1.6%) |
| Coal or Coke | 0 (0.0%) | 0 (0.0%) |
| All other Fuels | 318 (8.2%) | 27 (2.7%) |
| No Fuel Used | 0 (0.0%) | 0 (0.0%) |
| Total | 3,900 (100.0%) | 992 (100.0%) |
Household Vehicle Usage in Clay County
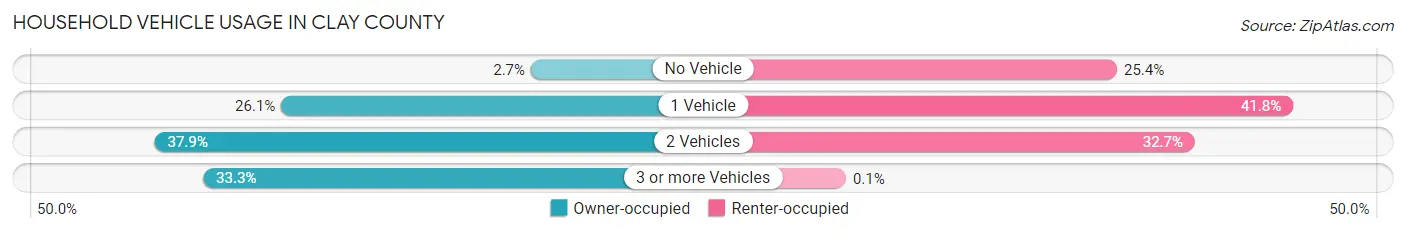
| Vehicles per Household | Owner-occupied | Renter-occupied |
| No Vehicle | 107 (2.7%) | 252 (25.4%) |
| 1 Vehicle | 1,016 (26.1%) | 415 (41.8%) |
| 2 Vehicles | 1,477 (37.9%) | 324 (32.7%) |
| 3 or more Vehicles | 1,300 (33.3%) | 1 (0.1%) |
| Total | 3,900 (100.0%) | 992 (100.0%) |
Real Estate & Mortgages in Clay County
Real Estate and Mortgage Overview in Clay County
| Characteristic | Without Mortgage | With Mortgage |
| Housing Units | 2,048 | 1,852 |
| Median Property Value | $253,800 | $249,700 |
| Median Household Income | $45,563 | $192 |
| Monthly Housing Costs | $439 | $43 |
| Real Estate Taxes | $1,074 | $0 |
Property Value by Mortgage Status in Clay County
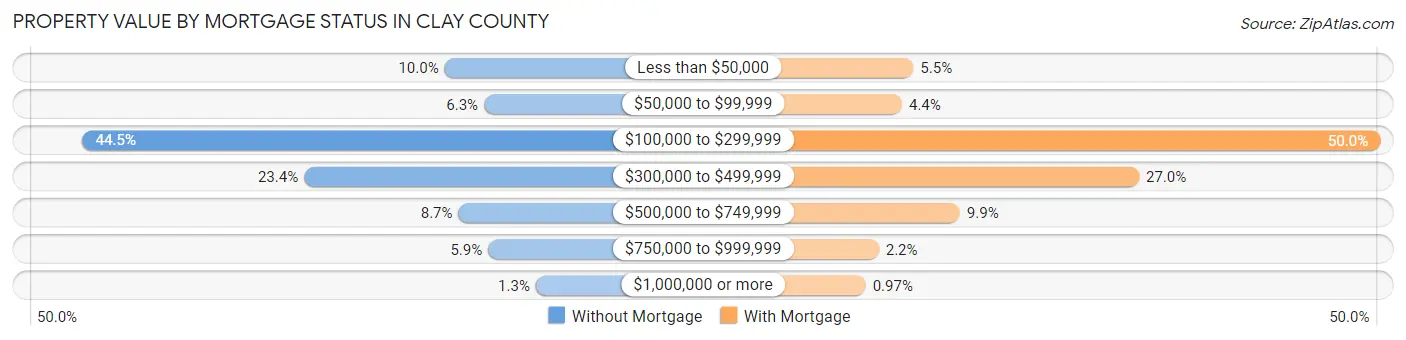
| Property Value | Without Mortgage | With Mortgage |
| Less than $50,000 | 205 (10.0%) | 102 (5.5%) |
| $50,000 to $99,999 | 128 (6.2%) | 82 (4.4%) |
| $100,000 to $299,999 | 911 (44.5%) | 925 (49.9%) |
| $300,000 to $499,999 | 479 (23.4%) | 500 (27.0%) |
| $500,000 to $749,999 | 178 (8.7%) | 184 (9.9%) |
| $750,000 to $999,999 | 120 (5.9%) | 41 (2.2%) |
| $1,000,000 or more | 27 (1.3%) | 18 (1.0%) |
| Total | 2,048 (100.0%) | 1,852 (100.0%) |
Household Income by Mortgage Status in Clay County
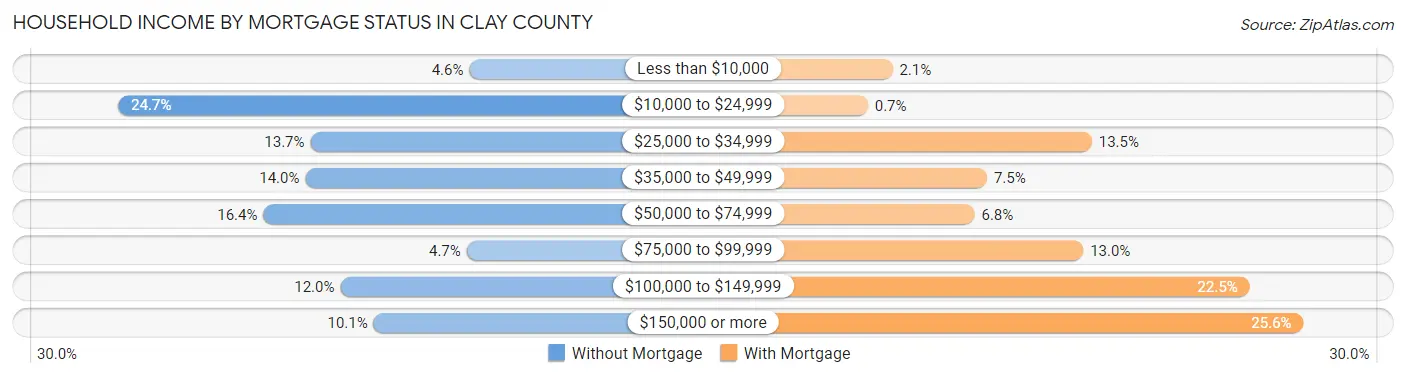
| Household Income | Without Mortgage | With Mortgage |
| Less than $10,000 | 94 (4.6%) | 39 (2.1%) |
| $10,000 to $24,999 | 505 (24.7%) | 13 (0.7%) |
| $25,000 to $34,999 | 280 (13.7%) | 250 (13.5%) |
| $35,000 to $49,999 | 286 (14.0%) | 139 (7.5%) |
| $50,000 to $74,999 | 335 (16.4%) | 126 (6.8%) |
| $75,000 to $99,999 | 97 (4.7%) | 241 (13.0%) |
| $100,000 to $149,999 | 245 (12.0%) | 417 (22.5%) |
| $150,000 or more | 206 (10.1%) | 474 (25.6%) |
| Total | 2,048 (100.0%) | 1,852 (100.0%) |
Property Value to Household Income Ratio in Clay County

| Value-to-Income Ratio | Without Mortgage | With Mortgage |
| Less than 2.0x | 375 (18.3%) | 82,885 (4,475.4%) |
| 2.0x to 2.9x | 238 (11.6%) | 680 (36.7%) |
| 3.0x to 3.9x | 236 (11.5%) | 176 (9.5%) |
| 4.0x or more | 1,199 (58.5%) | 269 (14.5%) |
| Total | 2,048 (100.0%) | 1,852 (100.0%) |
Real Estate Taxes by Mortgage Status in Clay County
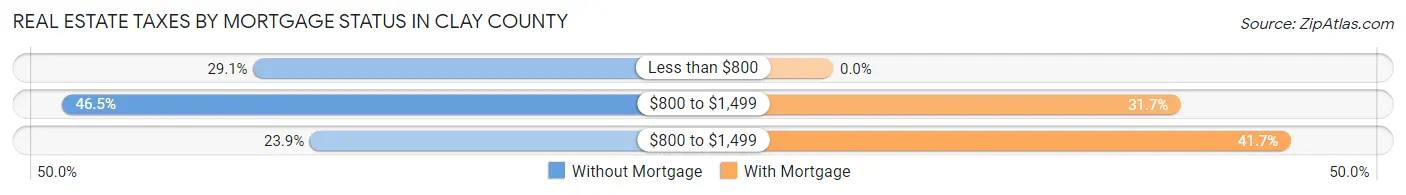
| Property Taxes | Without Mortgage | With Mortgage |
| Less than $800 | 596 (29.1%) | 0 (0.0%) |
| $800 to $1,499 | 953 (46.5%) | 587 (31.7%) |
| $800 to $1,499 | 490 (23.9%) | 773 (41.7%) |
| Total | 2,048 (100.0%) | 1,852 (100.0%) |
Health & Disability in Clay County
Health Insurance Coverage by Age in Clay County
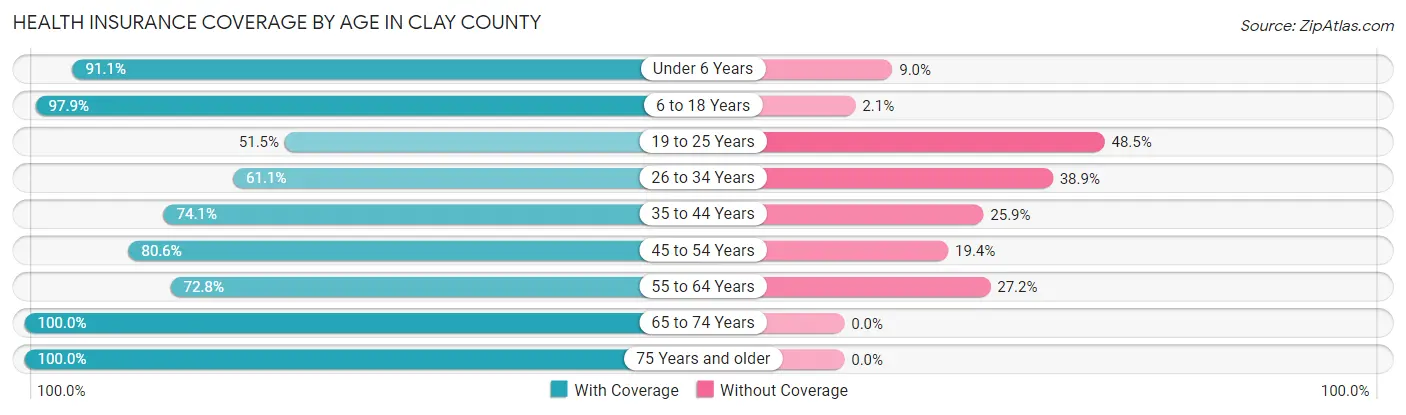
| Age Bracket | With Coverage | Without Coverage |
| Under 6 Years | 570 (91.0%) | 56 (8.9%) |
| 6 to 18 Years | 1,419 (97.9%) | 30 (2.1%) |
| 19 to 25 Years | 386 (51.5%) | 364 (48.5%) |
| 26 to 34 Years | 291 (61.1%) | 185 (38.9%) |
| 35 to 44 Years | 854 (74.1%) | 299 (25.9%) |
| 45 to 54 Years | 1,004 (80.6%) | 241 (19.4%) |
| 55 to 64 Years | 1,396 (72.8%) | 522 (27.2%) |
| 65 to 74 Years | 2,085 (100.0%) | 0 (0.0%) |
| 75 Years and older | 1,412 (100.0%) | 0 (0.0%) |
| Total | 9,417 (84.7%) | 1,697 (15.3%) |
Health Insurance Coverage by Citizenship Status in Clay County
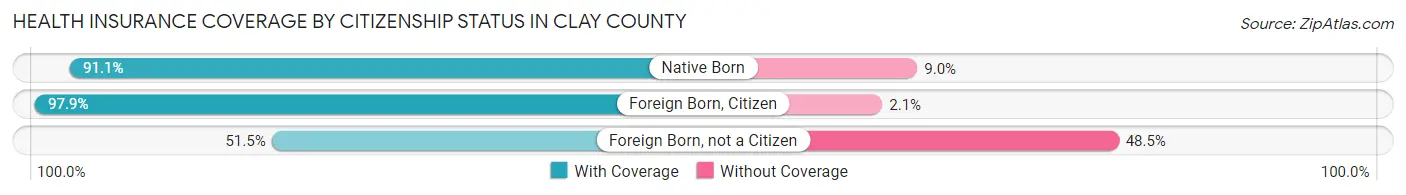
| Citizenship Status | With Coverage | Without Coverage |
| Native Born | 570 (91.0%) | 56 (8.9%) |
| Foreign Born, Citizen | 1,419 (97.9%) | 30 (2.1%) |
| Foreign Born, not a Citizen | 386 (51.5%) | 364 (48.5%) |
Health Insurance Coverage by Household Income in Clay County
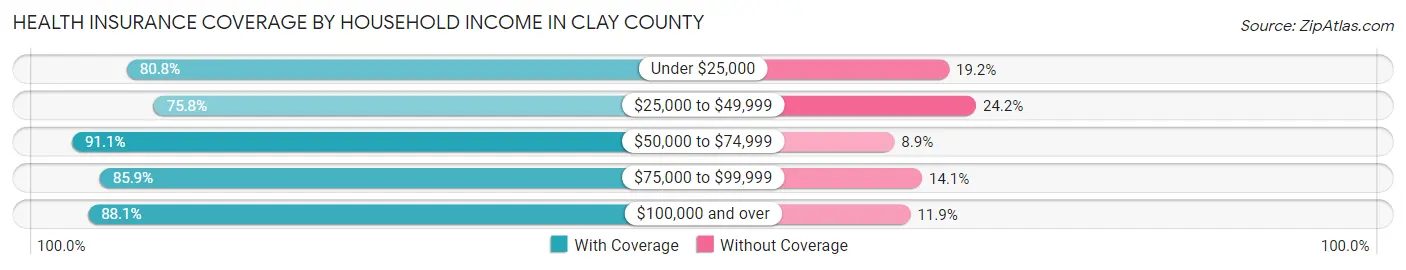
| Household Income | With Coverage | Without Coverage |
| Under $25,000 | 1,350 (80.8%) | 320 (19.2%) |
| $25,000 to $49,999 | 1,712 (75.8%) | 547 (24.2%) |
| $50,000 to $74,999 | 1,664 (91.1%) | 163 (8.9%) |
| $75,000 to $99,999 | 1,144 (85.9%) | 188 (14.1%) |
| $100,000 and over | 3,535 (88.1%) | 479 (11.9%) |
Public vs Private Health Insurance Coverage by Age in Clay County
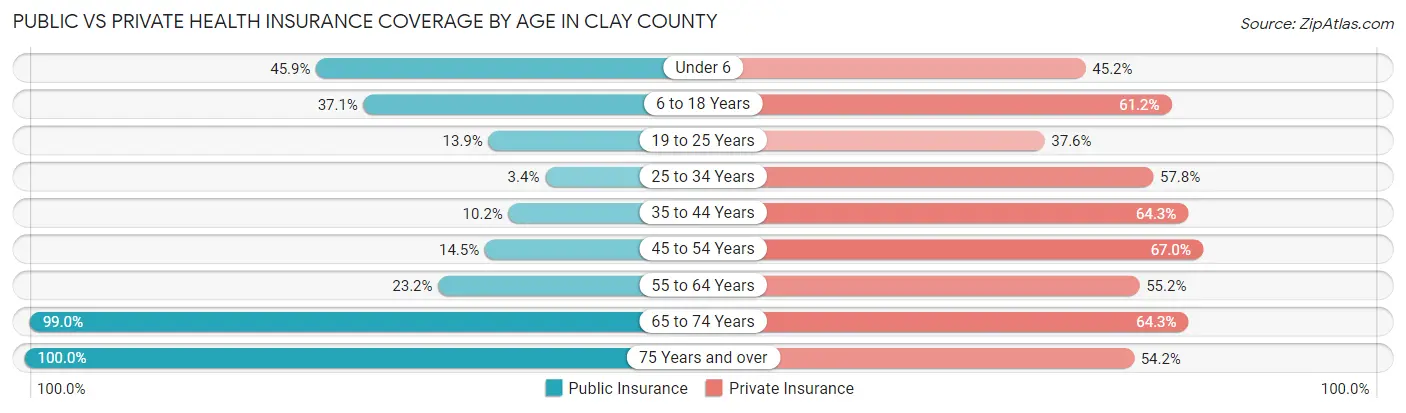
| Age Bracket | Public Insurance | Private Insurance |
| Under 6 | 287 (45.9%) | 283 (45.2%) |
| 6 to 18 Years | 537 (37.1%) | 886 (61.2%) |
| 19 to 25 Years | 104 (13.9%) | 282 (37.6%) |
| 25 to 34 Years | 16 (3.4%) | 275 (57.8%) |
| 35 to 44 Years | 117 (10.2%) | 741 (64.3%) |
| 45 to 54 Years | 181 (14.5%) | 834 (67.0%) |
| 55 to 64 Years | 445 (23.2%) | 1,059 (55.2%) |
| 65 to 74 Years | 2,065 (99.0%) | 1,341 (64.3%) |
| 75 Years and over | 1,412 (100.0%) | 765 (54.2%) |
| Total | 5,164 (46.5%) | 6,466 (58.2%) |
Disability Status by Sex by Age in Clay County
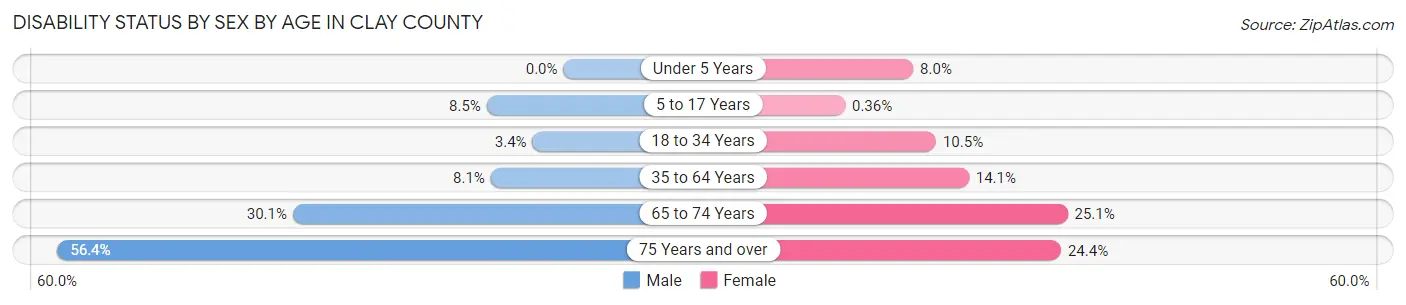
| Age Bracket | Male | Female |
| Under 5 Years | 0 (0.0%) | 29 (8.0%) |
| 5 to 17 Years | 70 (8.5%) | 2 (0.4%) |
| 18 to 34 Years | 27 (3.4%) | 71 (10.5%) |
| 35 to 64 Years | 161 (8.1%) | 329 (14.1%) |
| 65 to 74 Years | 295 (30.1%) | 278 (25.1%) |
| 75 Years and over | 364 (56.4%) | 187 (24.4%) |
Disability Class by Sex by Age in Clay County
Disability Class: Hearing Difficulty
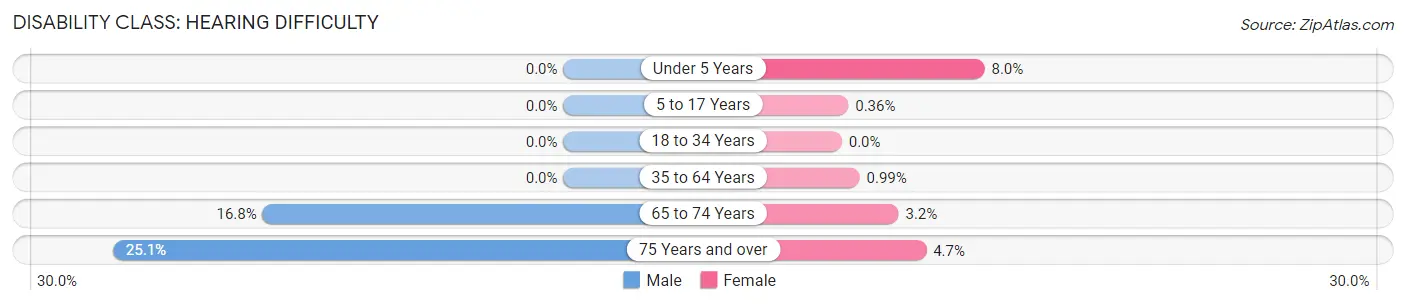
| Age Bracket | Male | Female |
| Under 5 Years | 0 (0.0%) | 29 (8.0%) |
| 5 to 17 Years | 0 (0.0%) | 2 (0.4%) |
| 18 to 34 Years | 0 (0.0%) | 0 (0.0%) |
| 35 to 64 Years | 0 (0.0%) | 23 (1.0%) |
| 65 to 74 Years | 164 (16.8%) | 35 (3.2%) |
| 75 Years and over | 162 (25.1%) | 36 (4.7%) |
Disability Class: Vision Difficulty
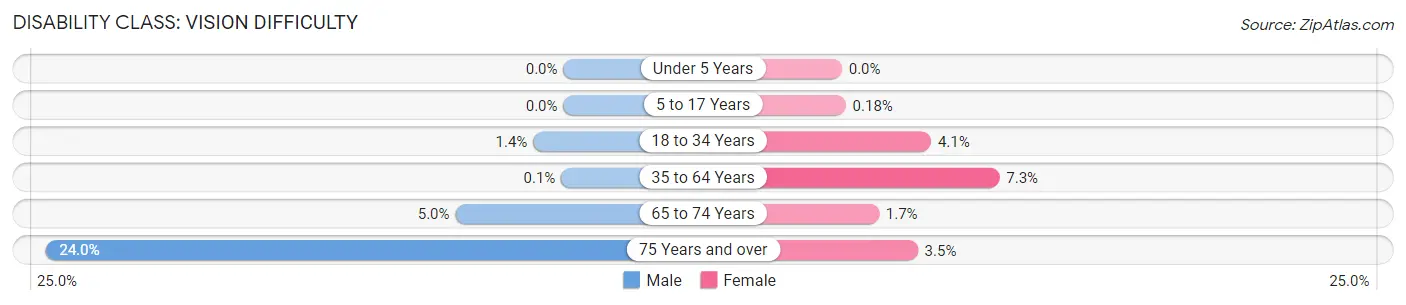
| Age Bracket | Male | Female |
| Under 5 Years | 0 (0.0%) | 0 (0.0%) |
| 5 to 17 Years | 0 (0.0%) | 1 (0.2%) |
| 18 to 34 Years | 11 (1.4%) | 28 (4.1%) |
| 35 to 64 Years | 2 (0.1%) | 170 (7.3%) |
| 65 to 74 Years | 49 (5.0%) | 19 (1.7%) |
| 75 Years and over | 155 (24.0%) | 27 (3.5%) |
Disability Class: Cognitive Difficulty
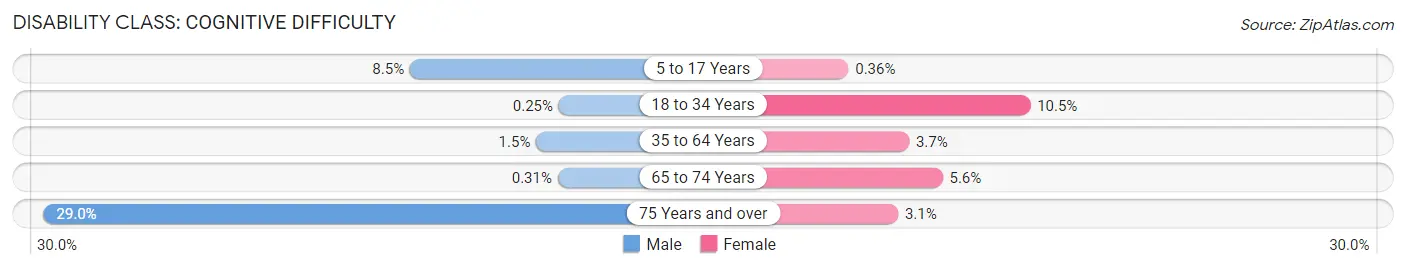
| Age Bracket | Male | Female |
| 5 to 17 Years | 70 (8.5%) | 2 (0.4%) |
| 18 to 34 Years | 2 (0.3%) | 71 (10.5%) |
| 35 to 64 Years | 30 (1.5%) | 87 (3.7%) |
| 65 to 74 Years | 3 (0.3%) | 62 (5.6%) |
| 75 Years and over | 187 (28.9%) | 24 (3.1%) |
Disability Class: Ambulatory Difficulty
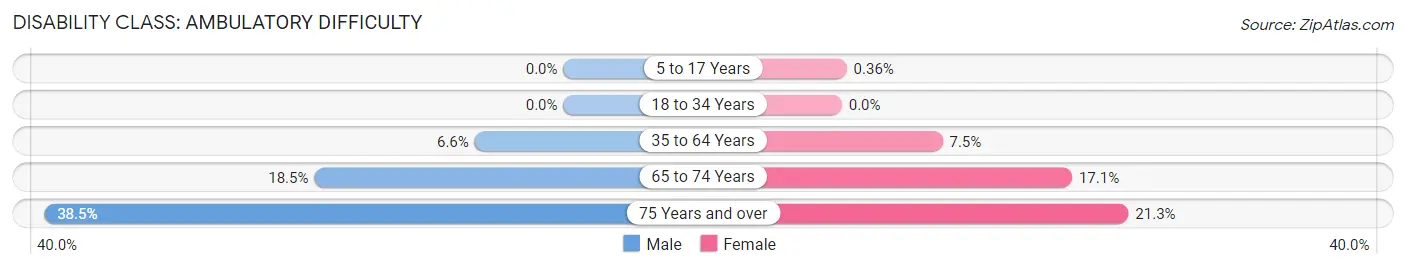
| Age Bracket | Male | Female |
| 5 to 17 Years | 0 (0.0%) | 2 (0.4%) |
| 18 to 34 Years | 0 (0.0%) | 0 (0.0%) |
| 35 to 64 Years | 131 (6.6%) | 174 (7.5%) |
| 65 to 74 Years | 181 (18.5%) | 189 (17.1%) |
| 75 Years and over | 249 (38.5%) | 163 (21.3%) |
Disability Class: Self-Care Difficulty
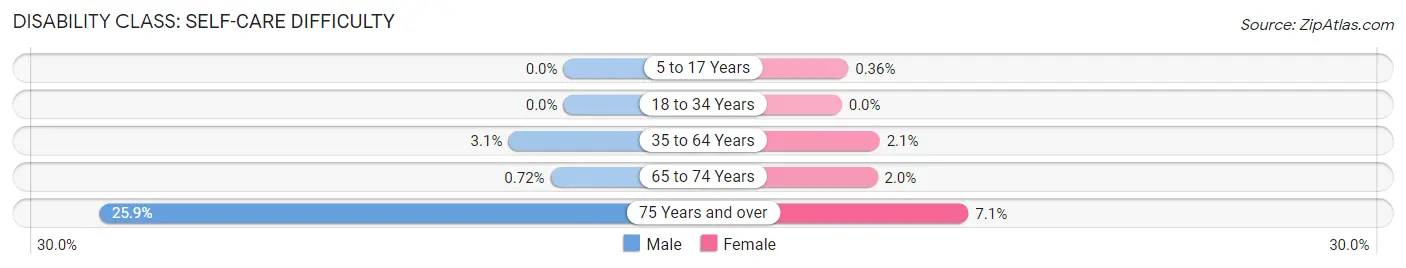
| Age Bracket | Male | Female |
| 5 to 17 Years | 0 (0.0%) | 2 (0.4%) |
| 18 to 34 Years | 0 (0.0%) | 0 (0.0%) |
| 35 to 64 Years | 61 (3.1%) | 49 (2.1%) |
| 65 to 74 Years | 7 (0.7%) | 22 (2.0%) |
| 75 Years and over | 167 (25.9%) | 54 (7.0%) |
Technology Access in Clay County
Computing Device Access in Clay County
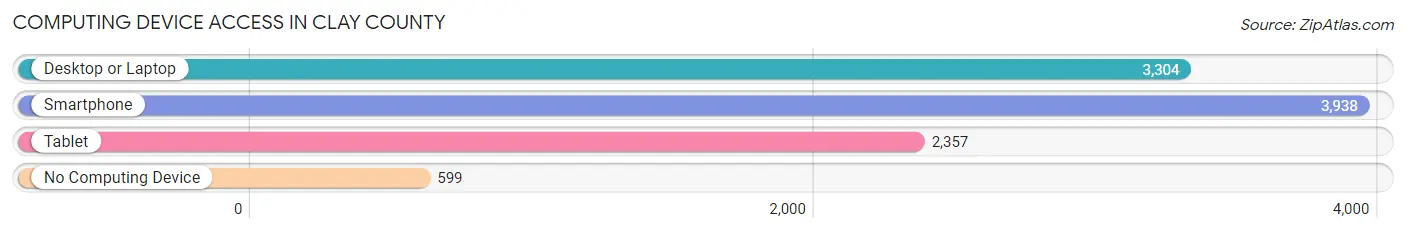
| Device Type | # Households | % Households |
| Desktop or Laptop | 3,304 | 67.5% |
| Smartphone | 3,938 | 80.5% |
| Tablet | 2,357 | 48.2% |
| No Computing Device | 599 | 12.2% |
| Total | 4,892 | 100.0% |
Internet Access in Clay County
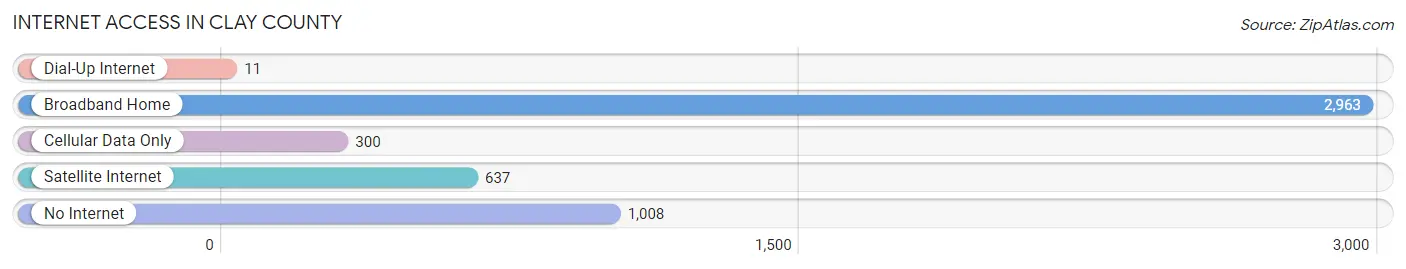
| Internet Type | # Households | % Households |
| Dial-Up Internet | 11 | 0.2% |
| Broadband Home | 2,963 | 60.6% |
| Cellular Data Only | 300 | 6.1% |
| Satellite Internet | 637 | 13.0% |
| No Internet | 1,008 | 20.6% |
| Total | 4,892 | 100.0% |
Clay County Summary
Clay County is located in the western part of North Carolina, in the Appalachian Mountains. It is bordered by Cherokee County to the north, Macon County to the east, Graham County to the south, and Clay County, Tennessee to the west. The county seat is Hayesville, and the county was formed in 1861 from parts of Cherokee and Macon counties.
Geography
Clay County is located in the Appalachian Mountains of western North Carolina. The county is mostly mountainous, with elevations ranging from 1,000 to 4,000 feet. The highest point in the county is 4,000-foot Standing Indian Mountain, located in the Nantahala National Forest. The county is drained by the Hiwassee River, which forms the western border of the county. Other major streams include the Valley River, Fires Creek, and Shooting Creek.
The county is mostly forested, with the majority of the land being part of the Nantahala National Forest. The forest is home to a variety of wildlife, including black bear, deer, wild turkey, and a variety of songbirds.
Economy
Clay County’s economy is largely based on tourism and agriculture. The county is home to several tourist attractions, including the Nantahala National Forest, the John C. Campbell Folk School, and the Fires Creek Wildlife Management Area. The county is also home to several wineries and vineyards, as well as a number of small farms.
Agriculture is the mainstay of the county’s economy. The county is home to a variety of crops, including corn, soybeans, hay, and tobacco. Livestock production is also important, with beef cattle, dairy cows, and hogs being the main types of livestock raised in the county.
Demographics
As of the 2010 census, Clay County had a population of 10,587. The population was spread out, with 48.3% male and 51.7% female. The median age was 44.7 years. The racial makeup of the county was 95.2% White, 1.7% African American, 0.4% Native American, 0.3% Asian, 0.1% Pacific Islander, 1.2% from other races, and 1.1% from two or more races. Hispanic or Latino of any race were 2.7% of the population.
The median household income in Clay County was $35,945, and the median family income was $41,945. The per capita income was $19,945. About 16.2% of the population was below the poverty line.
History
Clay County was formed in 1861 from parts of Cherokee and Macon counties. The county was named for Henry Clay, a prominent statesman from Kentucky. The county seat is Hayesville, which was established in 1872.
The county was largely rural until the late 19th century, when the railroad was built through the area. This brought an influx of settlers and businesses, and the county began to develop. The county was also home to several coal mines, which provided employment for many of the county’s residents.
In the early 20th century, the county was home to several resorts, which attracted tourists from all over the country. The county was also home to several logging operations, which provided timber for the growing lumber industry.
Today, Clay County is a popular tourist destination, with many visitors coming to enjoy the natural beauty of the area. The county is also home to several wineries and vineyards, as well as a number of small farms. The county is also home to the John C. Campbell Folk School, which offers classes in traditional Appalachian crafts and music.
Common Questions
What is the Total Population of Clay County?
Total Population of Clay County is 11,186.
What is the Total Male Population of Clay County?
Total Male Population of Clay County is 5,347.
What is the Total Female Population of Clay County?
Total Female Population of Clay County is 5,839.
What is the Ratio of Males per 100 Females in Clay County?
There are 91.57 Males per 100 Females in Clay County.
What is the Ratio of Females per 100 Males in Clay County?
There are 109.20 Females per 100 Males in Clay County.
What is the Median Population Age in Clay County?
Median Population Age in Clay County is 54.1 Years.
What is the Average Family Size in Clay County
Average Family Size in Clay County is 2.9 People.
What is the Average Household Size in Clay County
Average Household Size in Clay County is 2.3 People.
What is Per Capita Income in Clay County?
Per Capita income in Clay County is $34,382.
What is the Median Family Income in Clay County?
Median Family Income in Clay County is $74,795.
What is the Median Household income in Clay County?
Median Household Income in Clay County is $57,065.
What is Income or Wage Gap in Clay County?
Income or Wage Gap in Clay County is 4.7%.
Women in Clay County earn 95.3 cents for every dollar earned by a man.
What is Family Income Deficit in Clay County?
Family Income Deficit in Clay County is $5,083.
Families that are below poverty line in Clay County earn $5,083 less on average than the poverty threshold level.
What is Inequality or Gini Index in Clay County?
Inequality or Gini Index in Clay County is 0.47.
How Large is the Labor Force in Clay County?
There are 4,566 People in the Labor Forcein in Clay County.
What is the Percentage of People in the Labor Force in Clay County?
46.9% of People are in the Labor Force in Clay County.
What is the Unemployment Rate in Clay County?
Unemployment Rate in Clay County is 4.0%.