Catawba County, NC
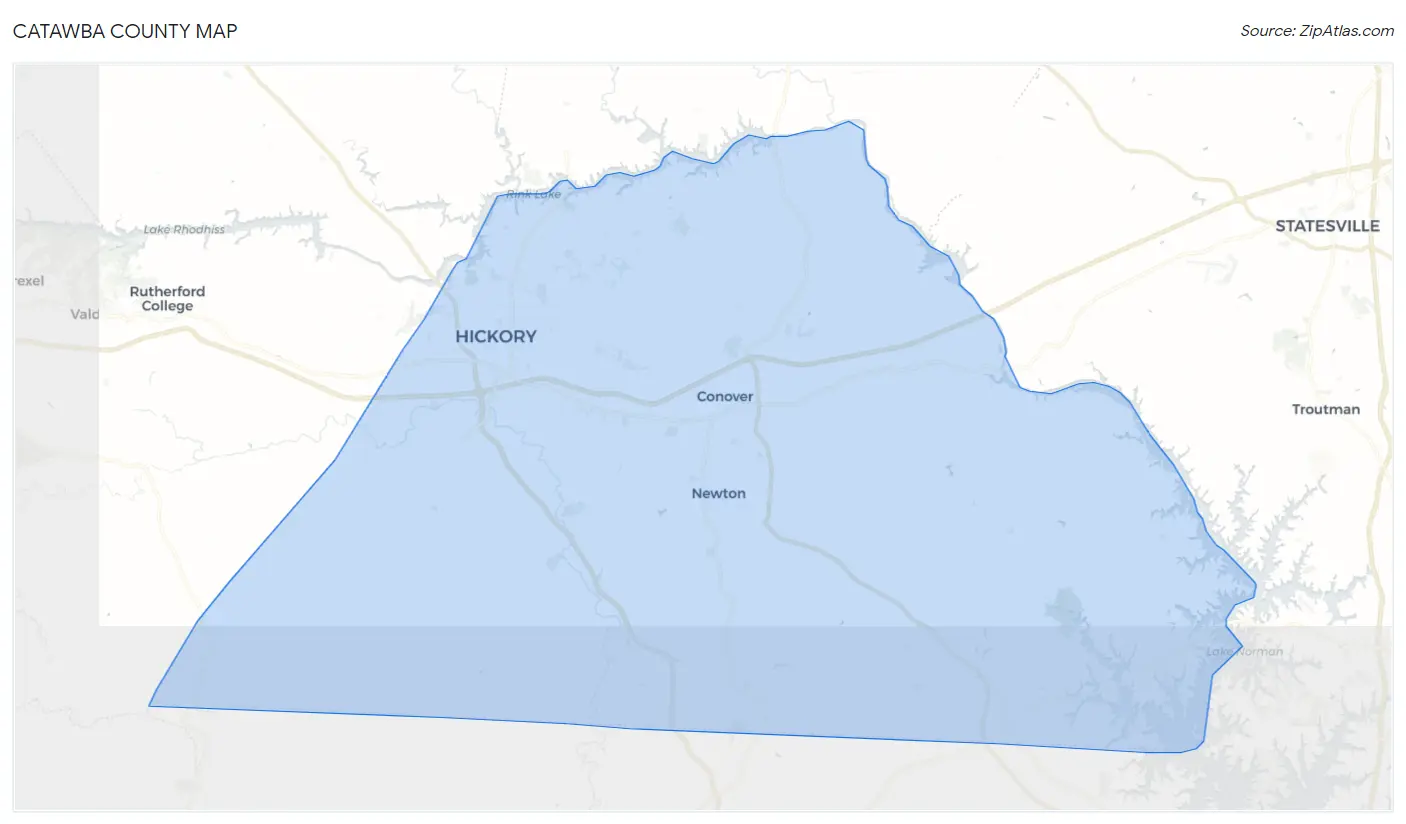
Catawba County Map
Catawba County Overview
161,011
TOTAL POPULATION
79,315
MALE POPULATION
81,696
FEMALE POPULATION
97.09
MALES / 100 FEMALES
103.00
FEMALES / 100 MALES
41.5
MEDIAN AGE
3.0
AVG FAMILY SIZE
2.5
AVG HOUSEHOLD SIZE
$34,369
PER CAPITA INCOME
$73,996
AVG FAMILY INCOME
$62,070
AVG HOUSEHOLD INCOME
25.7%
WAGE / INCOME GAP [ % ]
74.3¢/ $1
WAGE / INCOME GAP [ $ ]
$11,180
FAMILY INCOME DEFICIT
0.47
INEQUALITY / GINI INDEX
80,033
LABOR FORCE [ PEOPLE ]
61.3%
PERCENT IN LABOR FORCE
5.1%
UNEMPLOYMENT RATE
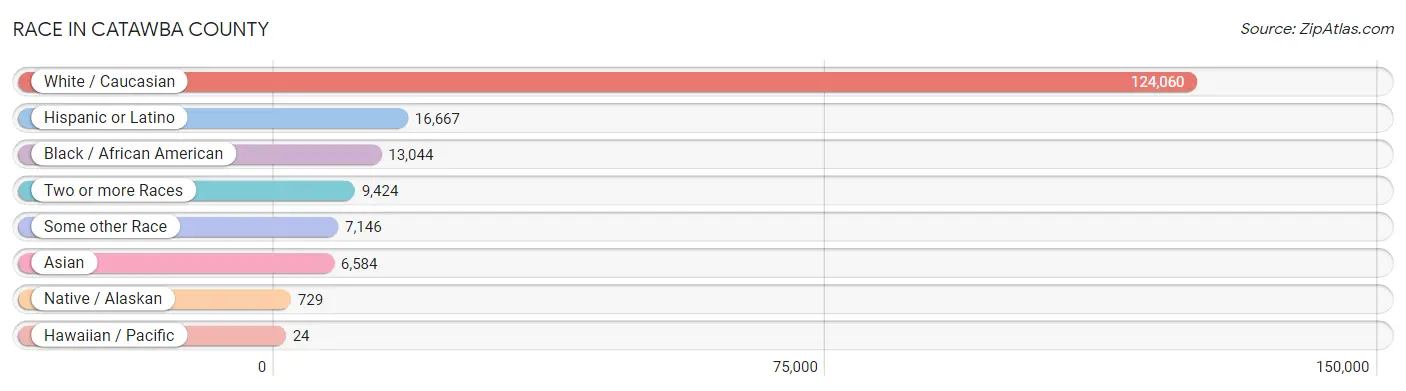
Race in Catawba County
The most populous races in Catawba County are White / Caucasian (124,060 | 77.0%), Hispanic or Latino (16,667 | 10.3%), and Black / African American (13,044 | 8.1%).
| Race | # Population | % Population |
| Asian | 6,584 | 4.1% |
| Black / African American | 13,044 | 8.1% |
| Hawaiian / Pacific | 24 | 0.0% |
| Hispanic or Latino | 16,667 | 10.3% |
| Native / Alaskan | 729 | 0.4% |
| White / Caucasian | 124,060 | 77.0% |
| Two or more Races | 9,424 | 5.9% |
| Some other Race | 7,146 | 4.4% |
| Total | 161,011 | 100.0% |
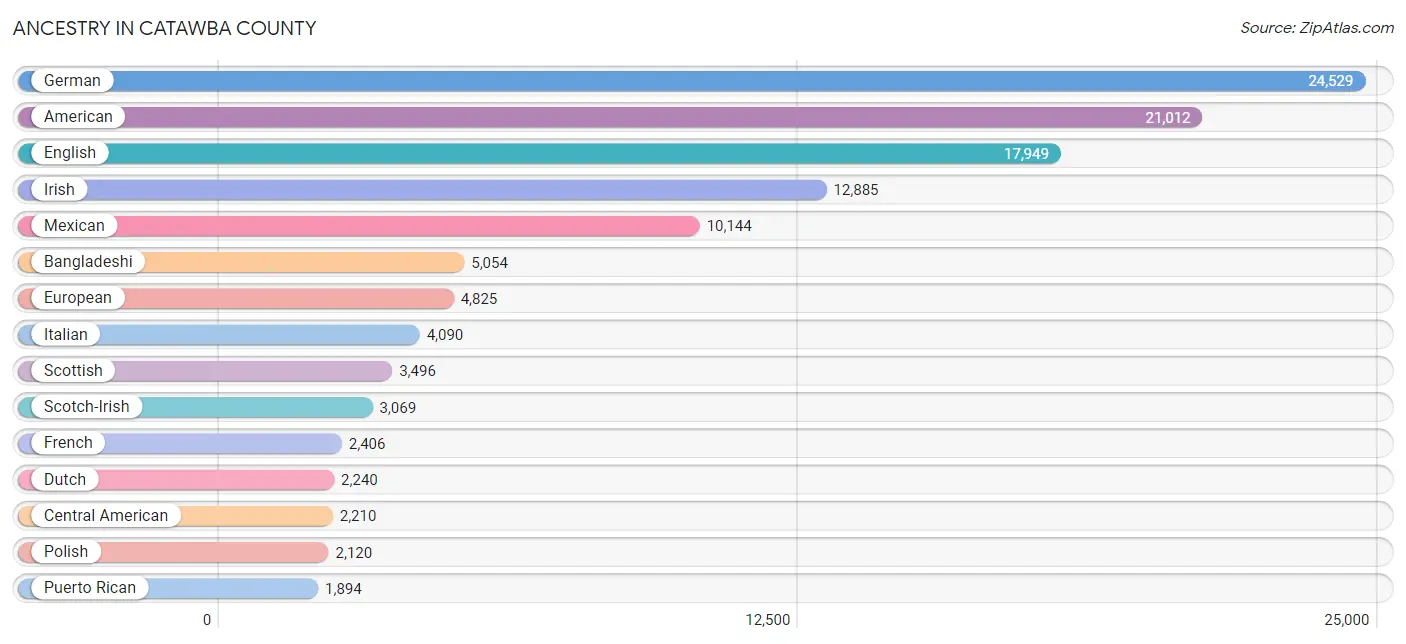
Ancestry in Catawba County
The most populous ancestries reported in Catawba County are German (24,529 | 15.2%), American (21,012 | 13.1%), English (17,949 | 11.2%), Irish (12,885 | 8.0%), and Mexican (10,144 | 6.3%), together accounting for 53.7% of all Catawba County residents.
| Ancestry | # Population | % Population |
| African | 748 | 0.5% |
| Albanian | 83 | 0.1% |
| American | 21,012 | 13.1% |
| Apache | 20 | 0.0% |
| Arab | 74 | 0.1% |
| Argentinean | 190 | 0.1% |
| Armenian | 25 | 0.0% |
| Austrian | 168 | 0.1% |
| Bahamian | 9 | 0.0% |
| Bangladeshi | 5,054 | 3.1% |
| Basque | 14 | 0.0% |
| Belgian | 34 | 0.0% |
| Bhutanese | 164 | 0.1% |
| Blackfeet | 16 | 0.0% |
| Bolivian | 42 | 0.0% |
| Brazilian | 90 | 0.1% |
| British | 1,247 | 0.8% |
| British West Indian | 16 | 0.0% |
| Burmese | 194 | 0.1% |
| Cajun | 16 | 0.0% |
| Canadian | 51 | 0.0% |
| Cape Verdean | 15 | 0.0% |
| Celtic | 9 | 0.0% |
| Central American | 2,210 | 1.4% |
| Central American Indian | 100 | 0.1% |
| Cherokee | 597 | 0.4% |
| Chilean | 235 | 0.2% |
| Chippewa | 19 | 0.0% |
| Colombian | 227 | 0.1% |
| Costa Rican | 331 | 0.2% |
| Creek | 2 | 0.0% |
| Croatian | 31 | 0.0% |
| Cuban | 155 | 0.1% |
| Czech | 93 | 0.1% |
| Czechoslovakian | 99 | 0.1% |
| Danish | 196 | 0.1% |
| Dominican | 69 | 0.0% |
| Dutch | 2,240 | 1.4% |
| Eastern European | 251 | 0.2% |
| Ecuadorian | 237 | 0.2% |
| Egyptian | 9 | 0.0% |
| English | 17,949 | 11.2% |
| Estonian | 5 | 0.0% |
| Ethiopian | 31 | 0.0% |
| European | 4,825 | 3.0% |
| Filipino | 15 | 0.0% |
| Finnish | 174 | 0.1% |
| French | 2,406 | 1.5% |
| French American Indian | 4 | 0.0% |
| French Canadian | 324 | 0.2% |
| German | 24,529 | 15.2% |
| Greek | 274 | 0.2% |
| Guamanian / Chamorro | 27 | 0.0% |
| Guatemalan | 783 | 0.5% |
| Haitian | 80 | 0.1% |
| Honduran | 278 | 0.2% |
| Hungarian | 236 | 0.2% |
| Icelander | 8 | 0.0% |
| Indian (Asian) | 257 | 0.2% |
| Iranian | 472 | 0.3% |
| Irish | 12,885 | 8.0% |
| Iroquois | 130 | 0.1% |
| Italian | 4,090 | 2.5% |
| Jamaican | 69 | 0.0% |
| Korean | 262 | 0.2% |
| Latvian | 21 | 0.0% |
| Lebanese | 65 | 0.0% |
| Lithuanian | 32 | 0.0% |
| Lumbee | 225 | 0.1% |
| Malaysian | 266 | 0.2% |
| Maltese | 58 | 0.0% |
| Mexican | 10,144 | 6.3% |
| Mexican American Indian | 353 | 0.2% |
| Native Hawaiian | 47 | 0.0% |
| Nepalese | 188 | 0.1% |
| Nicaraguan | 213 | 0.1% |
| Northern European | 220 | 0.1% |
| Norwegian | 579 | 0.4% |
| Ottawa | 19 | 0.0% |
| Pakistani | 208 | 0.1% |
| Panamanian | 30 | 0.0% |
| Pennsylvania German | 43 | 0.0% |
| Peruvian | 88 | 0.1% |
| Polish | 2,120 | 1.3% |
| Portuguese | 69 | 0.0% |
| Puerto Rican | 1,894 | 1.2% |
| Romanian | 165 | 0.1% |
| Russian | 1,008 | 0.6% |
| Salvadoran | 575 | 0.4% |
| Samoan | 20 | 0.0% |
| Scandinavian | 336 | 0.2% |
| Scotch-Irish | 3,069 | 1.9% |
| Scottish | 3,496 | 2.2% |
| Seminole | 60 | 0.0% |
| Slovak | 47 | 0.0% |
| Slovene | 8 | 0.0% |
| South African | 81 | 0.1% |
| South American | 1,168 | 0.7% |
| Spaniard | 254 | 0.2% |
| Spanish | 348 | 0.2% |
| Sri Lankan | 475 | 0.3% |
| Subsaharan African | 1,200 | 0.7% |
| Swedish | 760 | 0.5% |
| Swiss | 245 | 0.2% |
| Thai | 171 | 0.1% |
| Ukrainian | 318 | 0.2% |
| Venezuelan | 145 | 0.1% |
| Welsh | 1,171 | 0.7% |
| West Indian | 9 | 0.0% | View All 109 Rows |
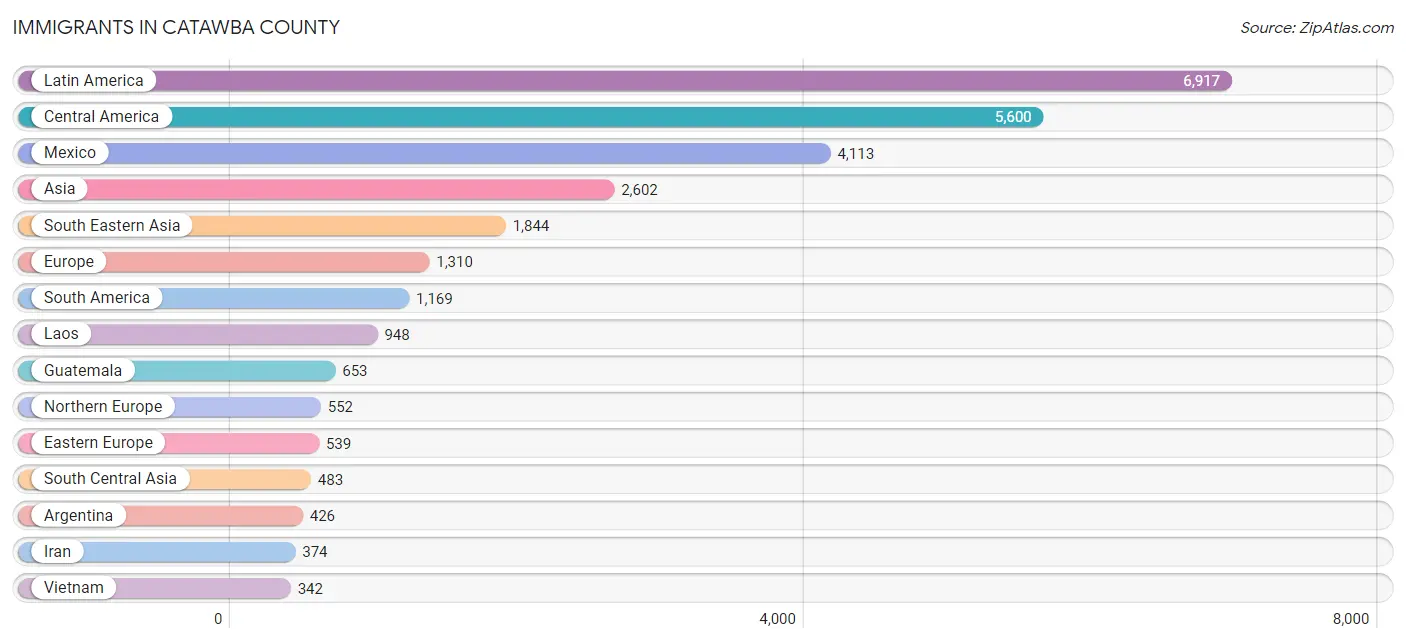
Immigrants in Catawba County
The most numerous immigrant groups reported in Catawba County came from Latin America (6,917 | 4.3%), Central America (5,600 | 3.5%), Mexico (4,113 | 2.5%), Asia (2,602 | 1.6%), and South Eastern Asia (1,844 | 1.1%), together accounting for 13.1% of all Catawba County residents.
| Immigration Origin | # Population | % Population |
| Africa | 167 | 0.1% |
| Albania | 17 | 0.0% |
| Argentina | 426 | 0.3% |
| Asia | 2,602 | 1.6% |
| Austria | 37 | 0.0% |
| Bahamas | 48 | 0.0% |
| Belarus | 15 | 0.0% |
| Belgium | 9 | 0.0% |
| Brazil | 116 | 0.1% |
| Cambodia | 1 | 0.0% |
| Canada | 59 | 0.0% |
| Caribbean | 148 | 0.1% |
| Central America | 5,600 | 3.5% |
| Chile | 151 | 0.1% |
| China | 155 | 0.1% |
| Colombia | 155 | 0.1% |
| Congo | 35 | 0.0% |
| Costa Rica | 272 | 0.2% |
| Cuba | 32 | 0.0% |
| Dominican Republic | 24 | 0.0% |
| Eastern Africa | 106 | 0.1% |
| Eastern Asia | 243 | 0.2% |
| Eastern Europe | 539 | 0.3% |
| Ecuador | 41 | 0.0% |
| Egypt | 9 | 0.0% |
| El Salvador | 276 | 0.2% |
| England | 126 | 0.1% |
| Europe | 1,310 | 0.8% |
| France | 12 | 0.0% |
| Germany | 90 | 0.1% |
| Greece | 10 | 0.0% |
| Guatemala | 653 | 0.4% |
| Guyana | 25 | 0.0% |
| Haiti | 18 | 0.0% |
| Honduras | 185 | 0.1% |
| Hong Kong | 33 | 0.0% |
| Hungary | 4 | 0.0% |
| India | 104 | 0.1% |
| Iran | 374 | 0.2% |
| Italy | 38 | 0.0% |
| Japan | 16 | 0.0% |
| Korea | 72 | 0.0% |
| Laos | 948 | 0.6% |
| Latin America | 6,917 | 4.3% |
| Latvia | 52 | 0.0% |
| Lebanon | 32 | 0.0% |
| Mexico | 4,113 | 2.5% |
| Middle Africa | 35 | 0.0% |
| Moldova | 9 | 0.0% |
| Nicaragua | 101 | 0.1% |
| Northern Africa | 9 | 0.0% |
| Northern Europe | 552 | 0.3% |
| Oceania | 8 | 0.0% |
| Peru | 110 | 0.1% |
| Philippines | 254 | 0.2% |
| Poland | 29 | 0.0% |
| Portugal | 10 | 0.0% |
| Romania | 113 | 0.1% |
| Russia | 178 | 0.1% |
| Scotland | 34 | 0.0% |
| Senegal | 7 | 0.0% |
| South Africa | 10 | 0.0% |
| South America | 1,169 | 0.7% |
| South Central Asia | 483 | 0.3% |
| South Eastern Asia | 1,844 | 1.1% |
| Southern Europe | 71 | 0.0% |
| Spain | 13 | 0.0% |
| Sri Lanka | 5 | 0.0% |
| Sweden | 44 | 0.0% |
| Taiwan | 12 | 0.0% |
| Thailand | 299 | 0.2% |
| Trinidad and Tobago | 26 | 0.0% |
| Ukraine | 79 | 0.1% |
| Venezuela | 145 | 0.1% |
| Vietnam | 342 | 0.2% |
| Western Africa | 7 | 0.0% |
| Western Asia | 32 | 0.0% |
| Western Europe | 148 | 0.1% | View All 78 Rows |
Sex and Age in Catawba County
Sex and Age in Catawba County
The most populous age groups in Catawba County are 55 to 59 Years (6,229 | 7.9%) for men and 55 to 59 Years (5,874 | 7.2%) for women.
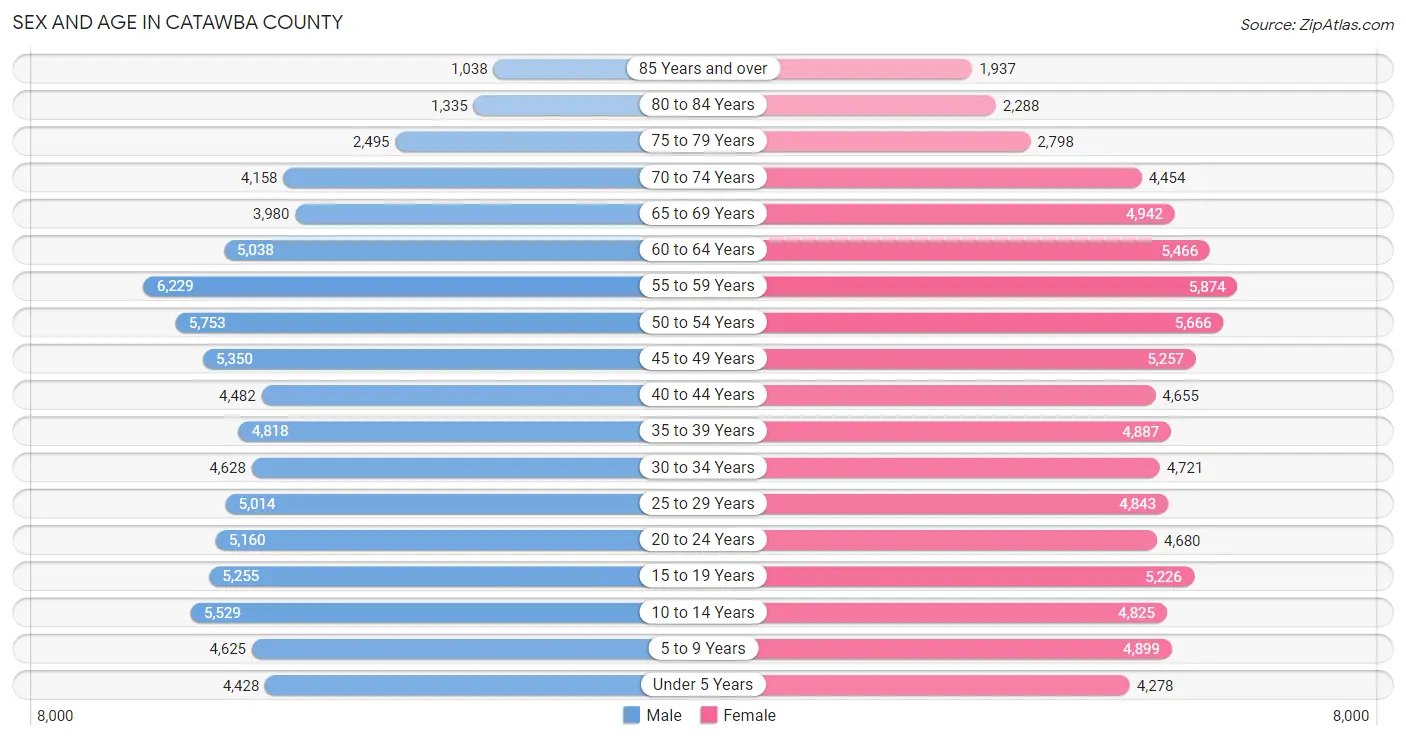
| Age Bracket | Male | Female |
| Under 5 Years | 4,428 (5.6%) | 4,278 (5.2%) |
| 5 to 9 Years | 4,625 (5.8%) | 4,899 (6.0%) |
| 10 to 14 Years | 5,529 (7.0%) | 4,825 (5.9%) |
| 15 to 19 Years | 5,255 (6.6%) | 5,226 (6.4%) |
| 20 to 24 Years | 5,160 (6.5%) | 4,680 (5.7%) |
| 25 to 29 Years | 5,014 (6.3%) | 4,843 (5.9%) |
| 30 to 34 Years | 4,628 (5.8%) | 4,721 (5.8%) |
| 35 to 39 Years | 4,818 (6.1%) | 4,887 (6.0%) |
| 40 to 44 Years | 4,482 (5.7%) | 4,655 (5.7%) |
| 45 to 49 Years | 5,350 (6.8%) | 5,257 (6.4%) |
| 50 to 54 Years | 5,753 (7.2%) | 5,666 (6.9%) |
| 55 to 59 Years | 6,229 (7.9%) | 5,874 (7.2%) |
| 60 to 64 Years | 5,038 (6.4%) | 5,466 (6.7%) |
| 65 to 69 Years | 3,980 (5.0%) | 4,942 (6.0%) |
| 70 to 74 Years | 4,158 (5.2%) | 4,454 (5.4%) |
| 75 to 79 Years | 2,495 (3.2%) | 2,798 (3.4%) |
| 80 to 84 Years | 1,335 (1.7%) | 2,288 (2.8%) |
| 85 Years and over | 1,038 (1.3%) | 1,937 (2.4%) |
| Total | 79,315 (100.0%) | 81,696 (100.0%) |
Families and Households in Catawba County
Median Family Size in Catawba County
The median family size in Catawba County is 2.95 persons per family, with married-couple families (31,704 | 72.6%) accounting for the largest median family size of 2.96 persons per family. On the other hand, single male/father families (3,829 | 8.8%) represent the smallest median family size with 2.85 persons per family.
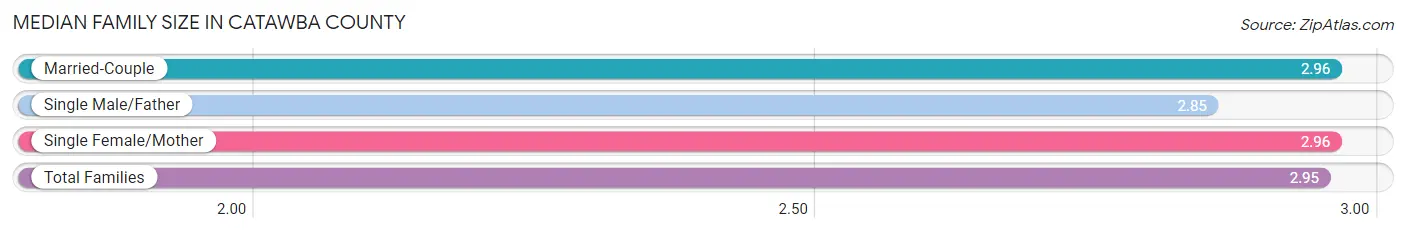
| Family Type | # Families | Family Size |
| Married-Couple | 31,704 (72.6%) | 2.96 |
| Single Male/Father | 3,829 (8.8%) | 2.85 |
| Single Female/Mother | 8,128 (18.6%) | 2.96 |
| Total Families | 43,661 (100.0%) | 2.95 |
Median Household Size in Catawba County
The median household size in Catawba County is 2.46 persons per household, with single male/father households (3,829 | 5.9%) accounting for the largest median household size of 3.28 persons per household. non-family households (20,781 | 32.3%) represent the smallest median household size with 1.20 persons per household.
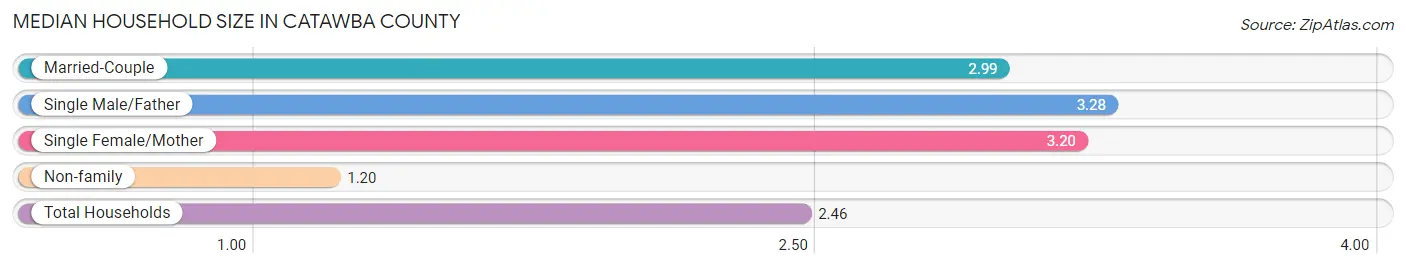
| Household Type | # Households | Household Size |
| Married-Couple | 31,704 (49.2%) | 2.99 |
| Single Male/Father | 3,829 (5.9%) | 3.28 |
| Single Female/Mother | 8,128 (12.6%) | 3.20 |
| Non-family | 20,781 (32.3%) | 1.20 |
| Total Households | 64,442 (100.0%) | 2.46 |
Household Size by Marriage Status in Catawba County
Out of a total of 64,442 households in Catawba County, 43,661 (67.7%) are family households, while 20,781 (32.3%) are nonfamily households. The most numerous type of family households are 2-person households, comprising 20,960, and the most common type of nonfamily households are 1-person households, comprising 17,299.
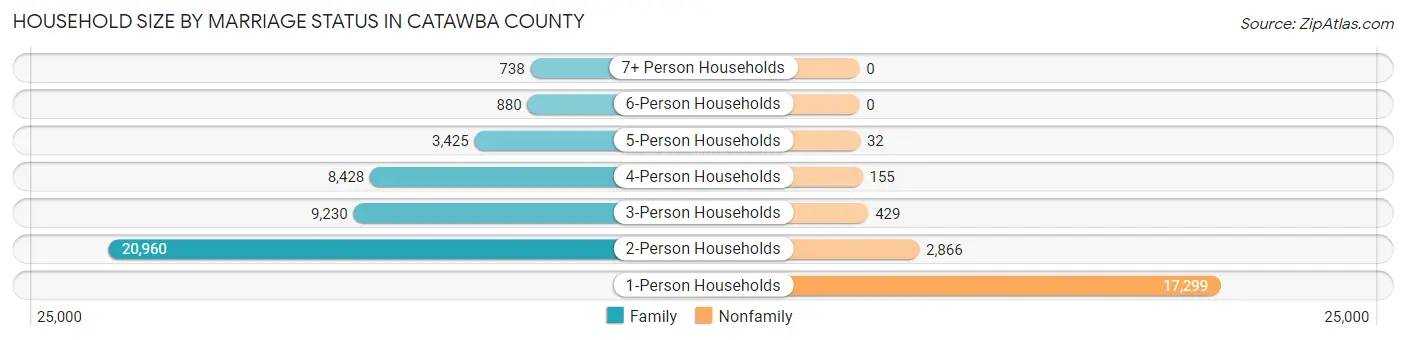
| Household Size | Family Households | Nonfamily Households |
| 1-Person Households | - | 17,299 (26.8%) |
| 2-Person Households | 20,960 (32.5%) | 2,866 (4.4%) |
| 3-Person Households | 9,230 (14.3%) | 429 (0.7%) |
| 4-Person Households | 8,428 (13.1%) | 155 (0.2%) |
| 5-Person Households | 3,425 (5.3%) | 32 (0.1%) |
| 6-Person Households | 880 (1.4%) | 0 (0.0%) |
| 7+ Person Households | 738 (1.1%) | 0 (0.0%) |
| Total | 43,661 (67.7%) | 20,781 (32.3%) |
Female Fertility in Catawba County
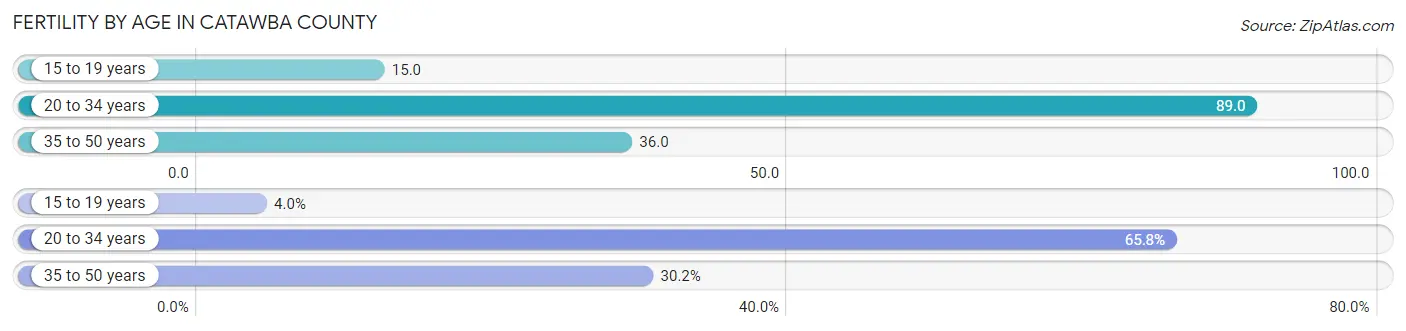
Fertility by Age in Catawba County
Average fertility rate in Catawba County is 54.0 births per 1,000 women. Women in the age bracket of 20 to 34 years have the highest fertility rate with 89.0 births per 1,000 women. Women in the age bracket of 20 to 34 years acount for 65.7% of all women with births.
| Age Bracket | Women with Births | Births / 1,000 Women |
| 15 to 19 years | 77 (4.0%) | 15.0 |
| 20 to 34 years | 1,261 (65.7%) | 89.0 |
| 35 to 50 years | 580 (30.2%) | 36.0 |
| Total | 1,918 (100.0%) | 54.0 |
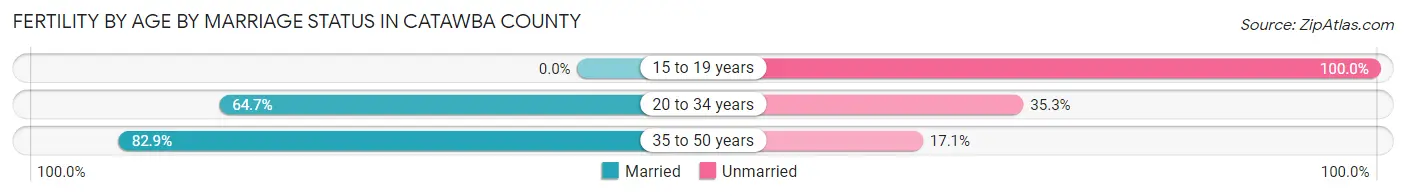
Fertility by Age by Marriage Status in Catawba County
67.6% of women with births (1,918) in Catawba County are married. The highest percentage of unmarried women with births falls into 15 to 19 years age bracket with 100.0% of them unmarried at the time of birth, while the lowest percentage of unmarried women with births belong to 35 to 50 years age bracket with 17.1% of them unmarried.
| Age Bracket | Married | Unmarried |
| 15 to 19 years | 0 (0.0%) | 77 (100.0%) |
| 20 to 34 years | 816 (64.7%) | 445 (35.3%) |
| 35 to 50 years | 481 (82.9%) | 99 (17.1%) |
| Total | 1,297 (67.6%) | 621 (32.4%) |
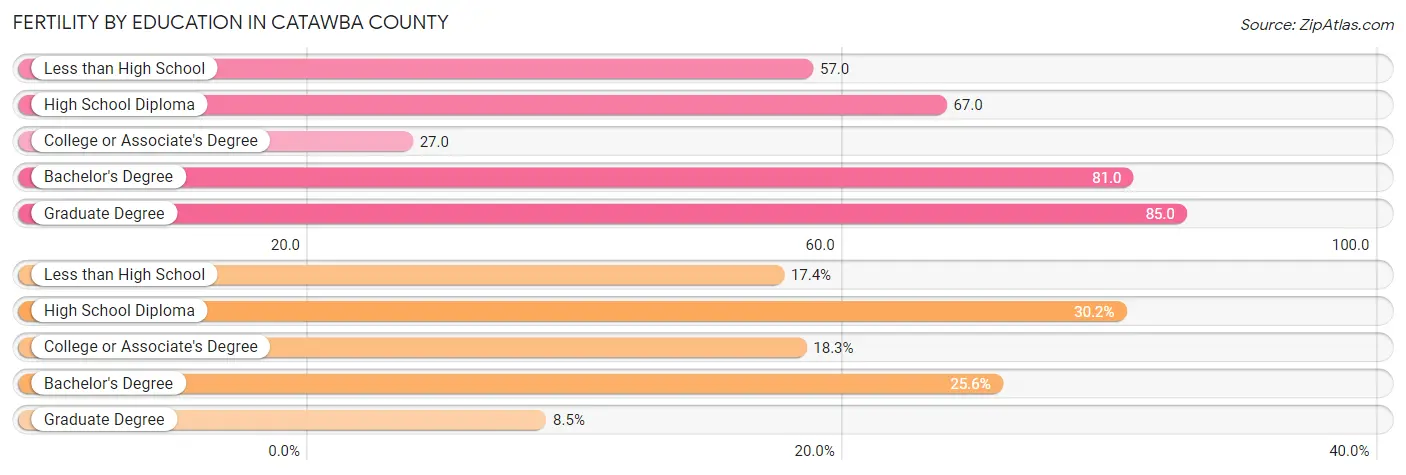
Fertility by Education in Catawba County
Average fertility rate in Catawba County is 54.0 births per 1,000 women. Women with the education attainment of graduate degree have the highest fertility rate of 85.0 births per 1,000 women, while women with the education attainment of college or associate's degree have the lowest fertility at 27.0 births per 1,000 women. Women with the education attainment of high school diploma represent 30.2% of all women with births.
| Educational Attainment | Women with Births | Births / 1,000 Women |
| Less than High School | 334 (17.4%) | 57.0 |
| High School Diploma | 580 (30.2%) | 67.0 |
| College or Associate's Degree | 350 (18.2%) | 27.0 |
| Bachelor's Degree | 491 (25.6%) | 81.0 |
| Graduate Degree | 163 (8.5%) | 85.0 |
| Total | 1,918 (100.0%) | 54.0 |
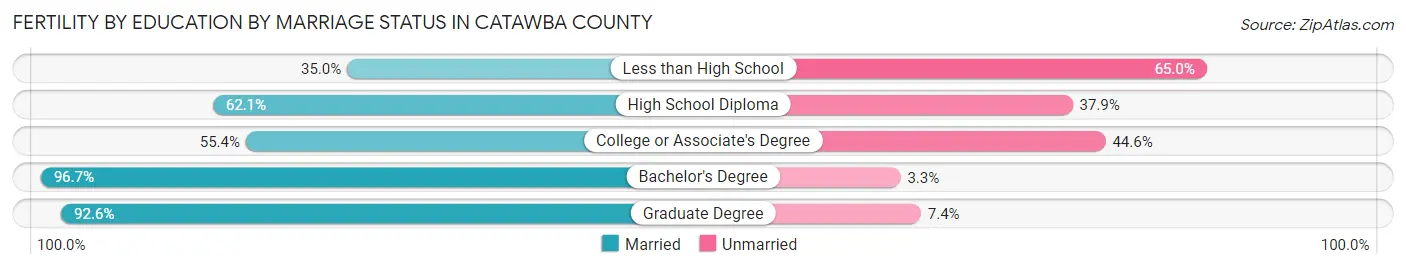
Fertility by Education by Marriage Status in Catawba County
32.4% of women with births in Catawba County are unmarried. Women with the educational attainment of bachelor's degree are most likely to be married with 96.7% of them married at childbirth, while women with the educational attainment of less than high school are least likely to be married with 65.0% of them unmarried at childbirth.
| Educational Attainment | Married | Unmarried |
| Less than High School | 117 (35.0%) | 217 (65.0%) |
| High School Diploma | 360 (62.1%) | 220 (37.9%) |
| College or Associate's Degree | 194 (55.4%) | 156 (44.6%) |
| Bachelor's Degree | 475 (96.7%) | 16 (3.3%) |
| Graduate Degree | 151 (92.6%) | 12 (7.4%) |
| Total | 1,297 (67.6%) | 621 (32.4%) |
Income in Catawba County
Income Overview in Catawba County
Per Capita Income in Catawba County is $34,369, while median incomes of families and households are $73,996 and $62,070 respectively.
| Characteristic | Number | Measure |
| Per Capita Income | 161,011 | $34,369 |
| Median Family Income | 43,661 | $73,996 |
| Mean Family Income | 43,661 | $98,791 |
| Median Household Income | 64,442 | $62,070 |
| Mean Household Income | 64,442 | $84,380 |
| Income Deficit | 43,661 | $11,180 |
| Wage / Income Gap (%) | 161,011 | 25.66% |
| Wage / Income Gap ($) | 161,011 | 74.34¢ per $1 |
| Gini / Inequality Index | 161,011 | 0.47 |
Earnings by Sex in Catawba County
Average Earnings in Catawba County are $37,754, $43,018 for men and $31,981 for women, a difference of 25.7%.
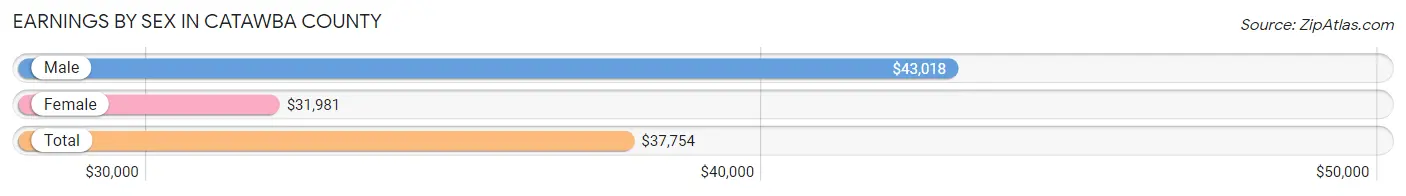
| Sex | Number | Average Earnings |
| Male | 44,501 (53.7%) | $43,018 |
| Female | 38,348 (46.3%) | $31,981 |
| Total | 82,849 (100.0%) | $37,754 |
Earnings by Sex by Income Bracket in Catawba County
The most common earnings brackets in Catawba County are $100,000+ for men (5,401 | 12.1%) and $25,000 to $29,999 for women (3,171 | 8.3%).
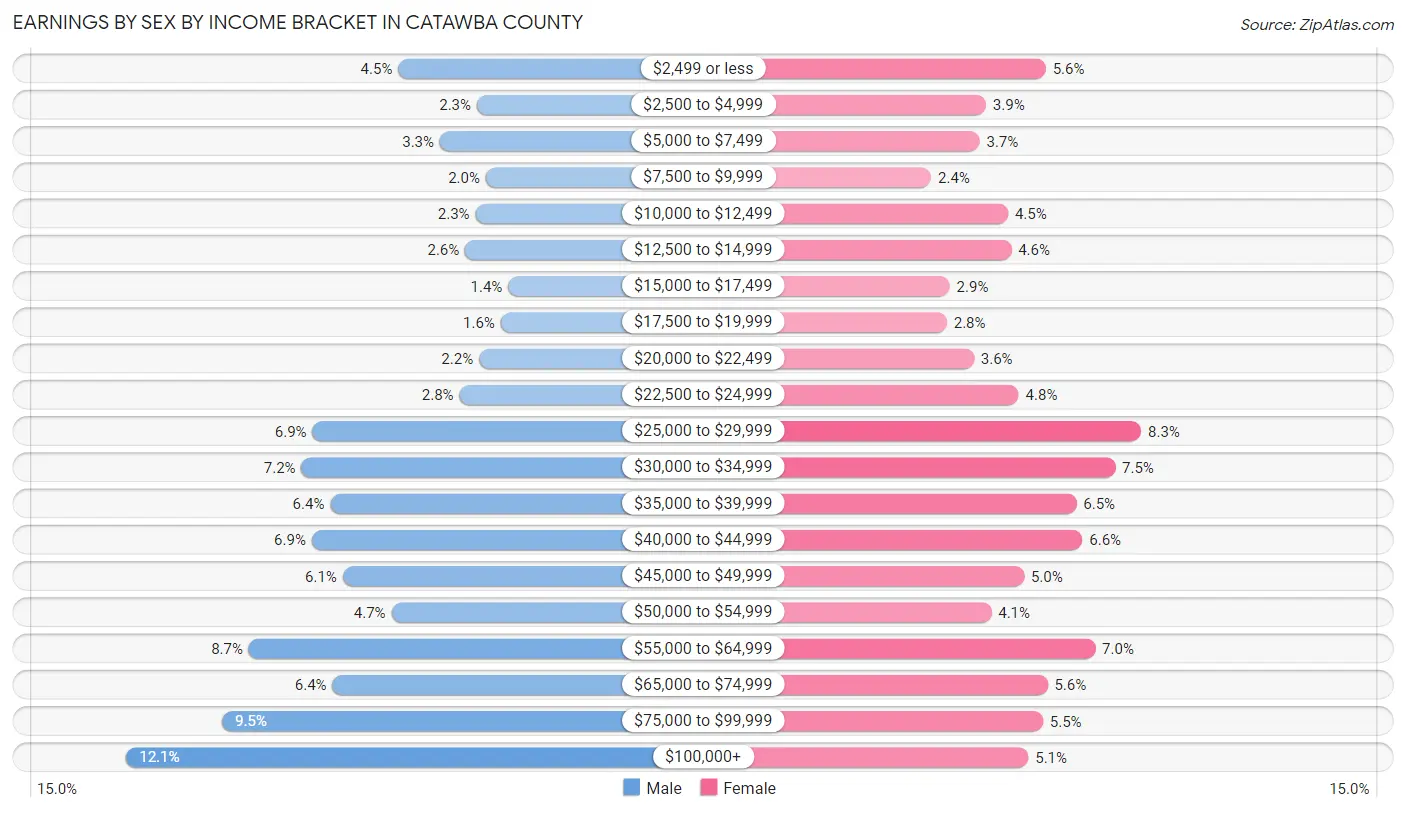
| Income | Male | Female |
| $2,499 or less | 2,001 (4.5%) | 2,145 (5.6%) |
| $2,500 to $4,999 | 1,017 (2.3%) | 1,500 (3.9%) |
| $5,000 to $7,499 | 1,484 (3.3%) | 1,430 (3.7%) |
| $7,500 to $9,999 | 906 (2.0%) | 910 (2.4%) |
| $10,000 to $12,499 | 1,036 (2.3%) | 1,738 (4.5%) |
| $12,500 to $14,999 | 1,166 (2.6%) | 1,771 (4.6%) |
| $15,000 to $17,499 | 627 (1.4%) | 1,109 (2.9%) |
| $17,500 to $19,999 | 722 (1.6%) | 1,076 (2.8%) |
| $20,000 to $22,499 | 994 (2.2%) | 1,370 (3.6%) |
| $22,500 to $24,999 | 1,238 (2.8%) | 1,852 (4.8%) |
| $25,000 to $29,999 | 3,075 (6.9%) | 3,171 (8.3%) |
| $30,000 to $34,999 | 3,212 (7.2%) | 2,892 (7.5%) |
| $35,000 to $39,999 | 2,851 (6.4%) | 2,475 (6.5%) |
| $40,000 to $44,999 | 3,082 (6.9%) | 2,539 (6.6%) |
| $45,000 to $49,999 | 2,698 (6.1%) | 1,910 (5.0%) |
| $50,000 to $54,999 | 2,087 (4.7%) | 1,556 (4.1%) |
| $55,000 to $64,999 | 3,870 (8.7%) | 2,675 (7.0%) |
| $65,000 to $74,999 | 2,828 (6.4%) | 2,161 (5.6%) |
| $75,000 to $99,999 | 4,206 (9.5%) | 2,112 (5.5%) |
| $100,000+ | 5,401 (12.1%) | 1,956 (5.1%) |
| Total | 44,501 (100.0%) | 38,348 (100.0%) |
Earnings by Sex by Educational Attainment in Catawba County
Average earnings in Catawba County are $46,888 for men and $36,079 for women, a difference of 23.1%. Men with an educational attainment of graduate degree enjoy the highest average annual earnings of $94,760, while those with less than high school education earn the least with $32,523. Women with an educational attainment of graduate degree earn the most with the average annual earnings of $57,340, while those with less than high school education have the smallest earnings of $24,403.
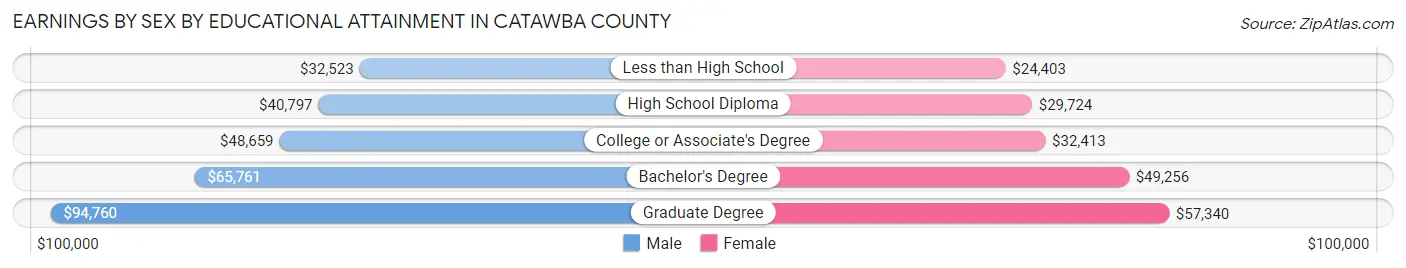
| Educational Attainment | Male Income | Female Income |
| Less than High School | $32,523 | $24,403 |
| High School Diploma | $40,797 | $29,724 |
| College or Associate's Degree | $48,659 | $32,413 |
| Bachelor's Degree | $65,761 | $49,256 |
| Graduate Degree | $94,760 | $57,340 |
| Total | $46,888 | $36,079 |
Family Income in Catawba County
Family Income Brackets in Catawba County
According to the Catawba County family income data, there are 8,994 families falling into the $50,000 to $74,999 income range, which is the most common income bracket and makes up 20.6% of all families. Conversely, the $10,000 to $14,999 income bracket is the least frequent group with only 873 families (2.0%) belonging to this category.
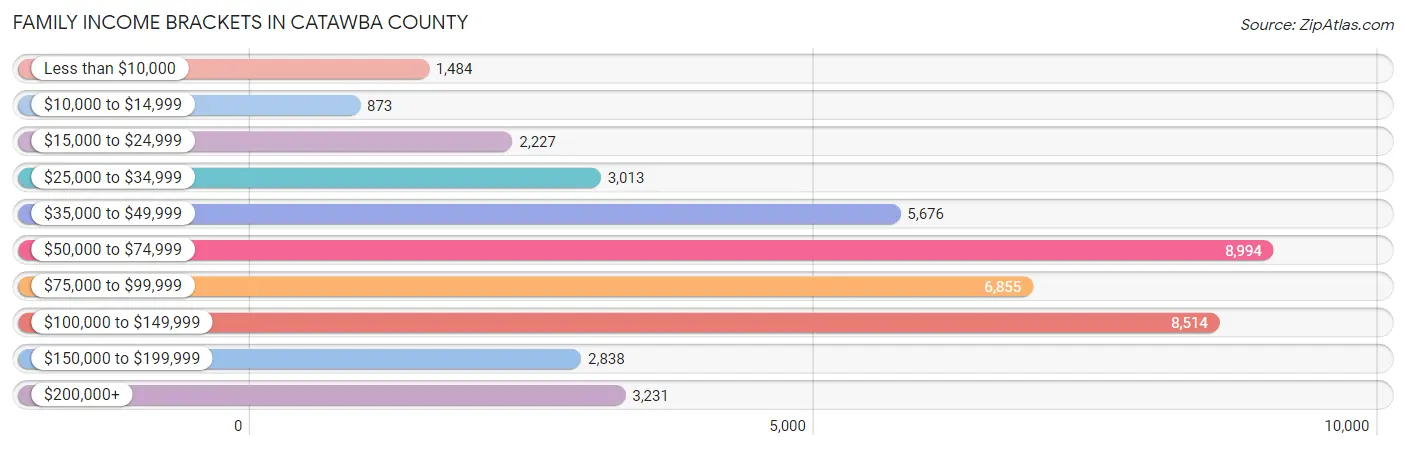
| Income Bracket | # Families | % Families |
| Less than $10,000 | 1,484 | 3.4% |
| $10,000 to $14,999 | 873 | 2.0% |
| $15,000 to $24,999 | 2,227 | 5.1% |
| $25,000 to $34,999 | 3,013 | 6.9% |
| $35,000 to $49,999 | 5,676 | 13.0% |
| $50,000 to $74,999 | 8,994 | 20.6% |
| $75,000 to $99,999 | 6,855 | 15.7% |
| $100,000 to $149,999 | 8,514 | 19.5% |
| $150,000 to $199,999 | 2,838 | 6.5% |
| $200,000+ | 3,231 | 7.4% |
Family Income by Famaliy Size in Catawba County
5-person families (2,792 | 6.4%) account for the highest median family income in Catawba County with $95,086 per family, while 2-person families (22,259 | 51.0%) have the highest median income of $33,668 per family member.
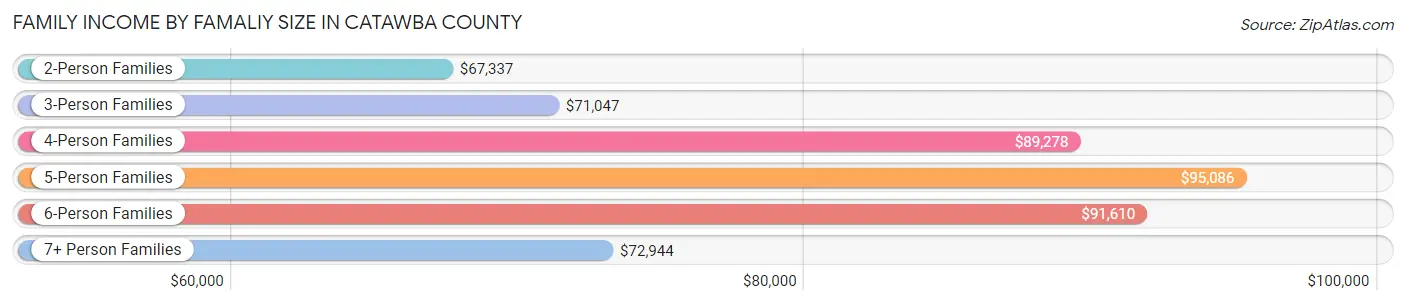
| Income Bracket | # Families | Median Income |
| 2-Person Families | 22,259 (51.0%) | $67,337 |
| 3-Person Families | 9,481 (21.7%) | $71,047 |
| 4-Person Families | 7,698 (17.6%) | $89,278 |
| 5-Person Families | 2,792 (6.4%) | $95,086 |
| 6-Person Families | 738 (1.7%) | $91,610 |
| 7+ Person Families | 693 (1.6%) | $72,944 |
| Total | 43,661 (100.0%) | $73,996 |
Family Income by Number of Earners in Catawba County
The median family income in Catawba County is $73,996, with families comprising 3+ earners (4,568) having the highest median family income of $120,574, while families with no earners (7,545) have the lowest median family income of $45,993, accounting for 10.5% and 17.3% of families, respectively.
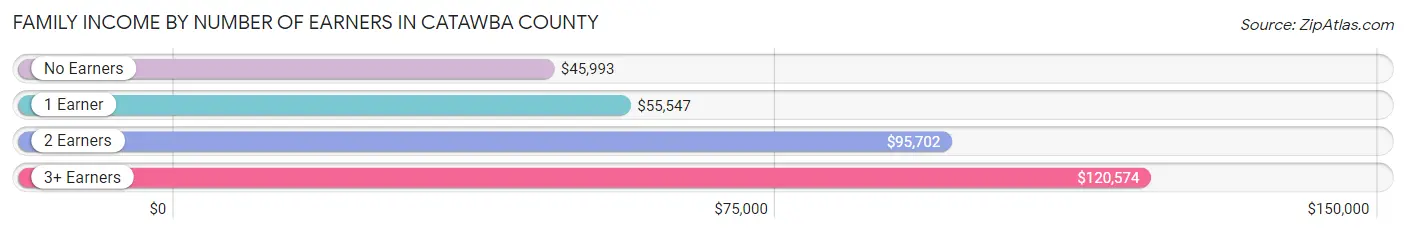
| Number of Earners | # Families | Median Income |
| No Earners | 7,545 (17.3%) | $45,993 |
| 1 Earner | 14,105 (32.3%) | $55,547 |
| 2 Earners | 17,443 (40.0%) | $95,702 |
| 3+ Earners | 4,568 (10.5%) | $120,574 |
| Total | 43,661 (100.0%) | $73,996 |
Household Income in Catawba County
Household Income Brackets in Catawba County
With 12,308 households falling in the category, the $50,000 to $74,999 income range is the most frequent in Catawba County, accounting for 19.1% of all households. In contrast, only 2,642 households (4.1%) fall into the $10,000 to $14,999 income bracket, making it the least populous group.
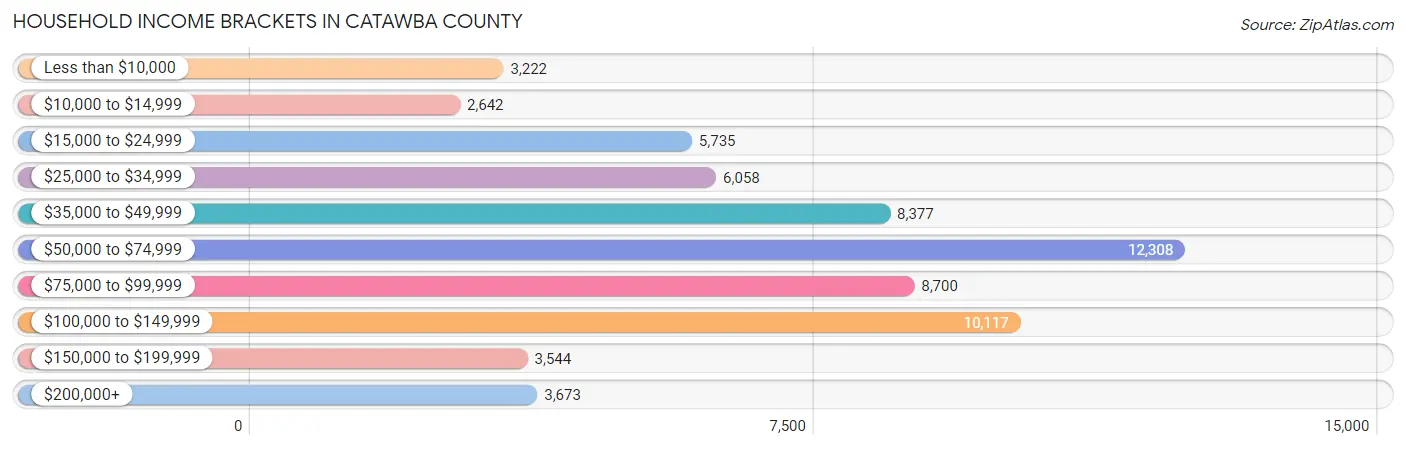
| Income Bracket | # Households | % Households |
| Less than $10,000 | 3,222 | 5.0% |
| $10,000 to $14,999 | 2,642 | 4.1% |
| $15,000 to $24,999 | 5,735 | 8.9% |
| $25,000 to $34,999 | 6,058 | 9.4% |
| $35,000 to $49,999 | 8,377 | 13.0% |
| $50,000 to $74,999 | 12,308 | 19.1% |
| $75,000 to $99,999 | 8,700 | 13.5% |
| $100,000 to $149,999 | 10,117 | 15.7% |
| $150,000 to $199,999 | 3,544 | 5.5% |
| $200,000+ | 3,673 | 5.7% |
Household Income by Householder Age in Catawba County
The median household income in Catawba County is $62,070, with the highest median household income of $74,619 found in the 45 to 64 years age bracket for the primary householder. A total of 24,705 households (38.3%) fall into this category. Meanwhile, the 15 to 24 years age bracket for the primary householder has the lowest median household income of $44,176, with 2,421 households (3.8%) in this group.
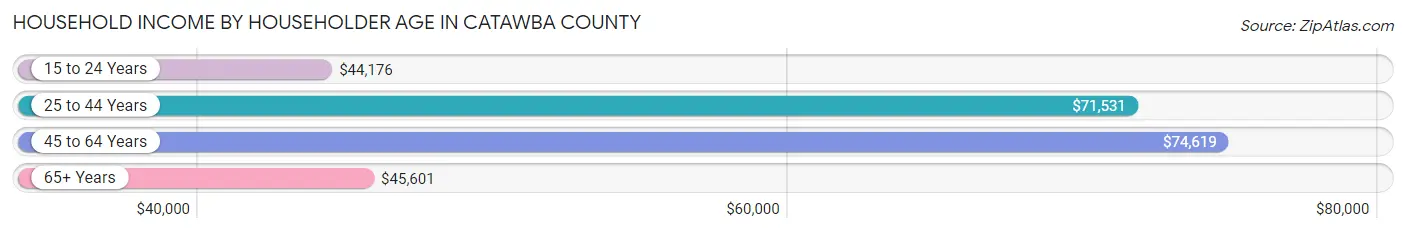
| Income Bracket | # Households | Median Income |
| 15 to 24 Years | 2,421 (3.8%) | $44,176 |
| 25 to 44 Years | 18,189 (28.2%) | $71,531 |
| 45 to 64 Years | 24,705 (38.3%) | $74,619 |
| 65+ Years | 19,127 (29.7%) | $45,601 |
| Total | 64,442 (100.0%) | $62,070 |
Poverty in Catawba County
Income Below Poverty by Sex and Age in Catawba County
With 12.5% poverty level for males and 13.6% for females among the residents of Catawba County, under 5 year old males and 15 year old females are the most vulnerable to poverty, with 1,109 males (25.2%) and 304 females (36.4%) in their respective age groups living below the poverty level.
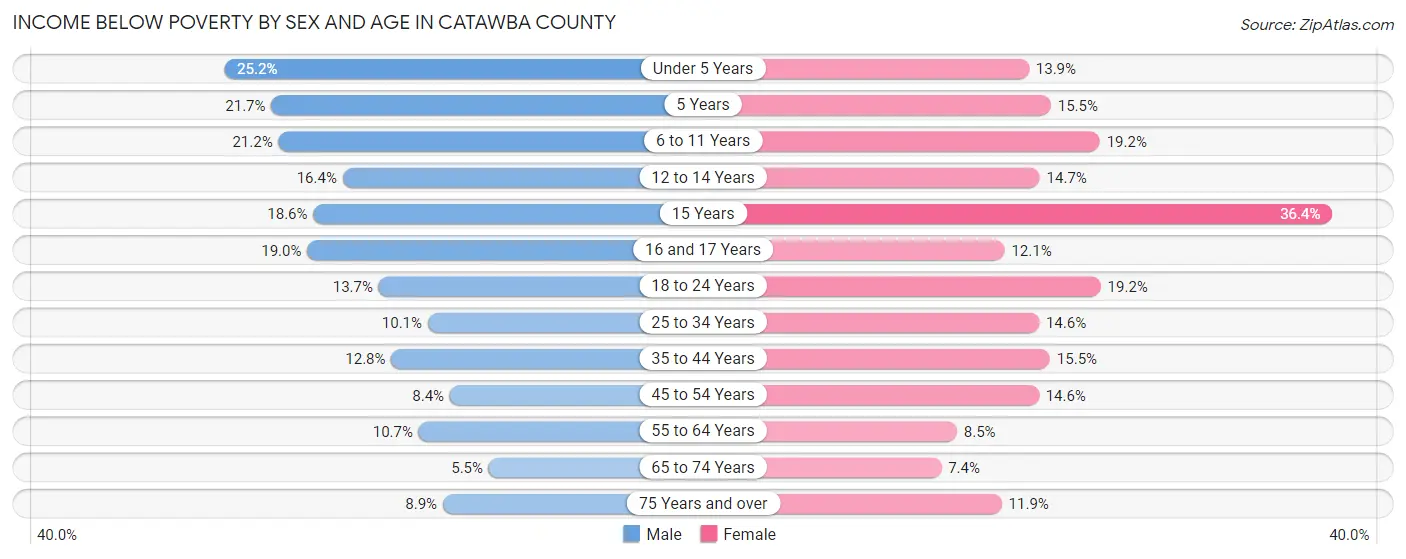
| Age Bracket | Male | Female |
| Under 5 Years | 1,109 (25.2%) | 579 (13.9%) |
| 5 Years | 214 (21.7%) | 153 (15.5%) |
| 6 to 11 Years | 1,143 (21.1%) | 1,087 (19.2%) |
| 12 to 14 Years | 582 (16.4%) | 407 (14.7%) |
| 15 Years | 191 (18.6%) | 304 (36.4%) |
| 16 and 17 Years | 436 (19.0%) | 276 (12.1%) |
| 18 to 24 Years | 917 (13.7%) | 1,215 (19.2%) |
| 25 to 34 Years | 951 (10.1%) | 1,397 (14.6%) |
| 35 to 44 Years | 1,170 (12.8%) | 1,465 (15.4%) |
| 45 to 54 Years | 916 (8.4%) | 1,587 (14.6%) |
| 55 to 64 Years | 1,202 (10.7%) | 957 (8.5%) |
| 65 to 74 Years | 445 (5.5%) | 690 (7.4%) |
| 75 Years and over | 419 (8.9%) | 793 (11.9%) |
| Total | 9,695 (12.5%) | 10,910 (13.6%) |
Income Above Poverty by Sex and Age in Catawba County
According to the poverty statistics in Catawba County, males aged 65 to 74 years and females aged 65 to 74 years are the age groups that are most secure financially, with 94.5% of males and 92.6% of females in these age groups living above the poverty line.
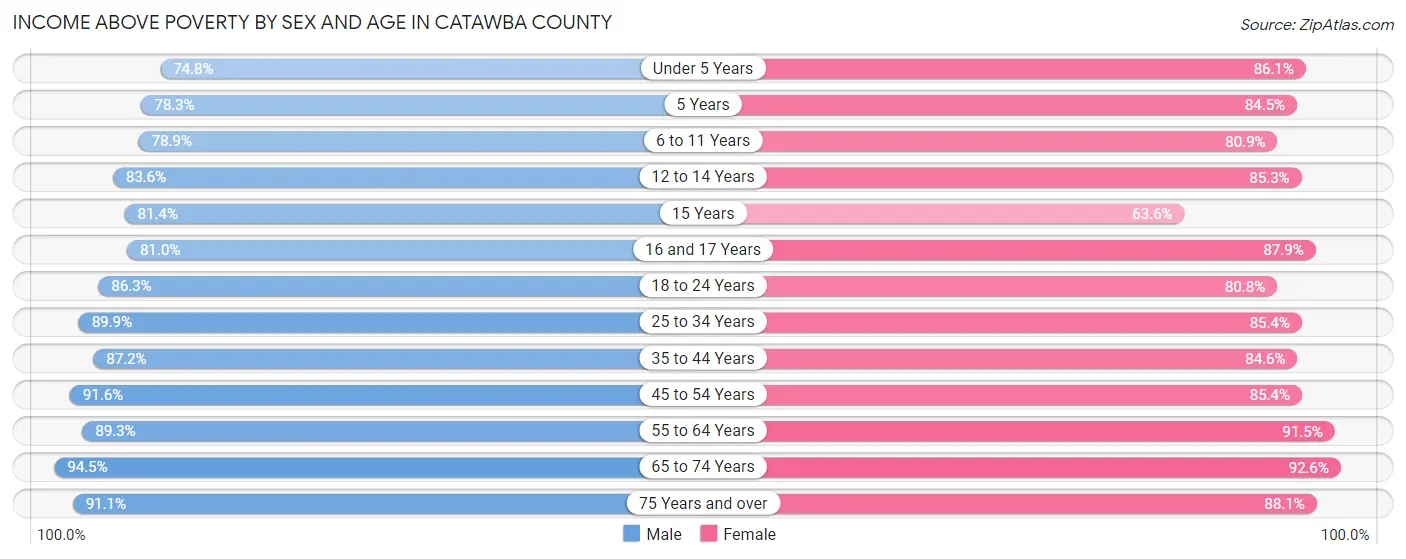
| Age Bracket | Male | Female |
| Under 5 Years | 3,296 (74.8%) | 3,588 (86.1%) |
| 5 Years | 773 (78.3%) | 833 (84.5%) |
| 6 to 11 Years | 4,262 (78.8%) | 4,588 (80.8%) |
| 12 to 14 Years | 2,972 (83.6%) | 2,363 (85.3%) |
| 15 Years | 838 (81.4%) | 531 (63.6%) |
| 16 and 17 Years | 1,858 (81.0%) | 2,008 (87.9%) |
| 18 to 24 Years | 5,776 (86.3%) | 5,106 (80.8%) |
| 25 to 34 Years | 8,498 (89.9%) | 8,146 (85.4%) |
| 35 to 44 Years | 7,995 (87.2%) | 8,017 (84.6%) |
| 45 to 54 Years | 9,967 (91.6%) | 9,265 (85.4%) |
| 55 to 64 Years | 10,003 (89.3%) | 10,254 (91.5%) |
| 65 to 74 Years | 7,605 (94.5%) | 8,656 (92.6%) |
| 75 Years and over | 4,266 (91.1%) | 5,890 (88.1%) |
| Total | 68,109 (87.5%) | 69,245 (86.4%) |
Income Below Poverty Among Married-Couple Families in Catawba County
The poverty statistics for married-couple families in Catawba County show that 5.1% or 1,629 of the total 31,704 families live below the poverty line. Families with 5 or more children have the highest poverty rate of 17.1%, comprising of 53 families. On the other hand, families with no children have the lowest poverty rate of 3.3%, which includes 669 families.
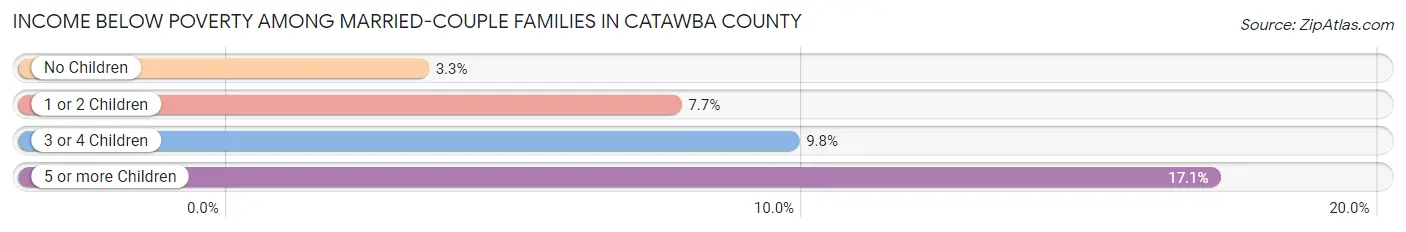
| Children | Above Poverty | Below Poverty |
| No Children | 19,473 (96.7%) | 669 (3.3%) |
| 1 or 2 Children | 8,673 (92.3%) | 726 (7.7%) |
| 3 or 4 Children | 1,672 (90.2%) | 181 (9.8%) |
| 5 or more Children | 257 (82.9%) | 53 (17.1%) |
| Total | 30,075 (94.9%) | 1,629 (5.1%) |
Income Below Poverty Among Single-Parent Households in Catawba County
According to the poverty data in Catawba County, 13.0% or 496 single-father households and 23.6% or 1,917 single-mother households are living below the poverty line. Among single-father households, those with 3 or 4 children have the highest poverty rate, with 93 households (26.7%) experiencing poverty. Likewise, among single-mother households, those with 3 or 4 children have the highest poverty rate, with 356 households (65.8%) falling below the poverty line.
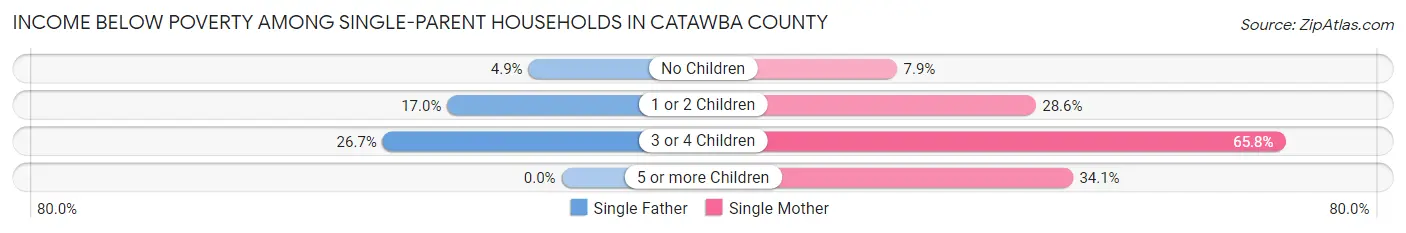
| Children | Single Father | Single Mother |
| No Children | 72 (4.9%) | 232 (7.9%) |
| 1 or 2 Children | 331 (17.0%) | 1,314 (28.5%) |
| 3 or 4 Children | 93 (26.7%) | 356 (65.8%) |
| 5 or more Children | 0 (0.0%) | 15 (34.1%) |
| Total | 496 (13.0%) | 1,917 (23.6%) |
Income Below Poverty Among Married-Couple vs Single-Parent Households in Catawba County
The poverty data for Catawba County shows that 1,629 of the married-couple family households (5.1%) and 2,413 of the single-parent households (20.2%) are living below the poverty level. Within the married-couple family households, those with 5 or more children have the highest poverty rate, with 53 households (17.1%) falling below the poverty line. Among the single-parent households, those with 3 or 4 children have the highest poverty rate, with 449 household (50.4%) living below poverty.
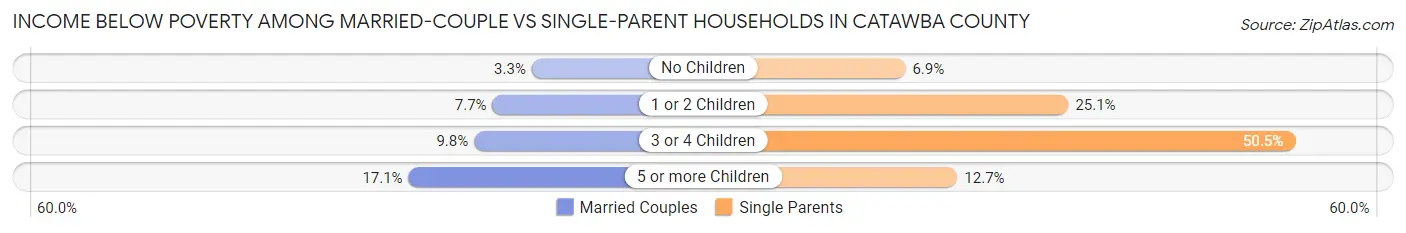
| Children | Married-Couple Families | Single-Parent Households |
| No Children | 669 (3.3%) | 304 (6.9%) |
| 1 or 2 Children | 726 (7.7%) | 1,645 (25.1%) |
| 3 or 4 Children | 181 (9.8%) | 449 (50.4%) |
| 5 or more Children | 53 (17.1%) | 15 (12.7%) |
| Total | 1,629 (5.1%) | 2,413 (20.2%) |
Employment Characteristics in Catawba County
Employment by Class of Employer in Catawba County
Among the 74,280 employed individuals in Catawba County, private company employees (55,650 | 74.9%), not-for-profit organizations (4,680 | 6.3%), and self-employed (not incorporated) (3,820 | 5.1%) make up the most common classes of employment.
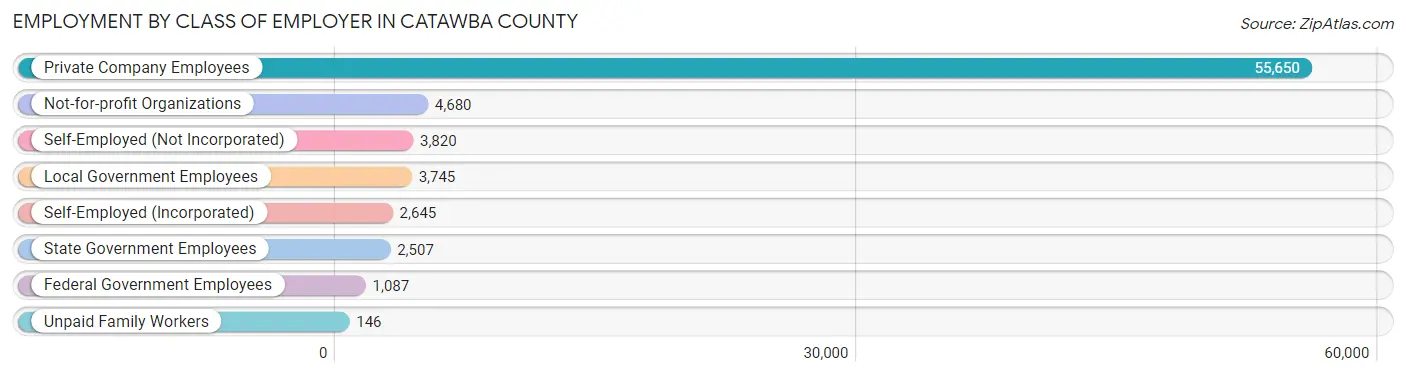
| Employer Class | # Employees | % Employees |
| Private Company Employees | 55,650 | 74.9% |
| Self-Employed (Incorporated) | 2,645 | 3.6% |
| Self-Employed (Not Incorporated) | 3,820 | 5.1% |
| Not-for-profit Organizations | 4,680 | 6.3% |
| Local Government Employees | 3,745 | 5.0% |
| State Government Employees | 2,507 | 3.4% |
| Federal Government Employees | 1,087 | 1.5% |
| Unpaid Family Workers | 146 | 0.2% |
| Total | 74,280 | 100.0% |
Employment Status by Age in Catawba County
According to the labor force statistics for Catawba County, out of the total population over 16 years of age (130,560), 61.3% or 80,033 individuals are in the labor force, with 5.1% or 4,082 of them unemployed. The age group with the highest labor force participation rate is 25 to 29 years, with 85.1% or 8,388 individuals in the labor force. Within the labor force, the 16 to 19 years age range has the highest percentage of unemployed individuals, with 19.3% or 708 of them being unemployed.
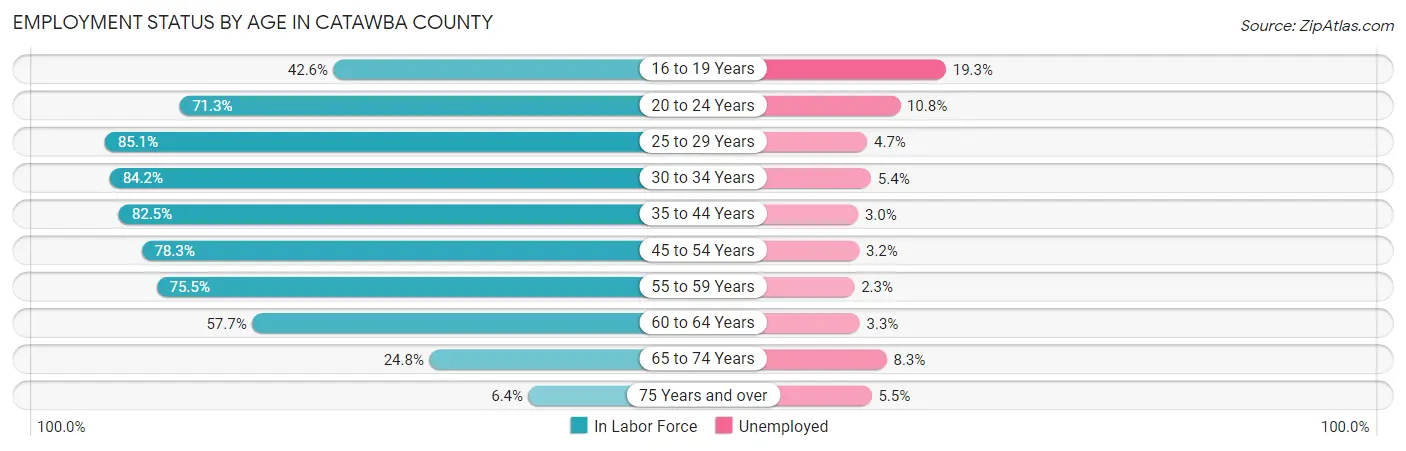
| Age Bracket | In Labor Force | Unemployed |
| 16 to 19 Years | 3,670 (42.6%) | 708 (19.3%) |
| 20 to 24 Years | 7,016 (71.3%) | 758 (10.8%) |
| 25 to 29 Years | 8,388 (85.1%) | 394 (4.7%) |
| 30 to 34 Years | 7,872 (84.2%) | 425 (5.4%) |
| 35 to 44 Years | 15,545 (82.5%) | 466 (3.0%) |
| 45 to 54 Years | 17,246 (78.3%) | 552 (3.2%) |
| 55 to 59 Years | 9,138 (75.5%) | 210 (2.3%) |
| 60 to 64 Years | 6,061 (57.7%) | 200 (3.3%) |
| 65 to 74 Years | 4,348 (24.8%) | 361 (8.3%) |
| 75 Years and over | 761 (6.4%) | 42 (5.5%) |
| Total | 80,033 (61.3%) | 4,082 (5.1%) |
Employment Status by Educational Attainment in Catawba County
According to labor force statistics for Catawba County, 77.7% of individuals (64,243) out of the total population between 25 and 64 years of age (82,681) are in the labor force, with 3.5% or 2,249 of them being unemployed. The group with the highest labor force participation rate are those with the educational attainment of bachelor's degree or higher, with 86.7% or 17,985 individuals in the labor force. Within the labor force, individuals with less than high school education have the highest percentage of unemployment, with 8.1% or 485 of them being unemployed.
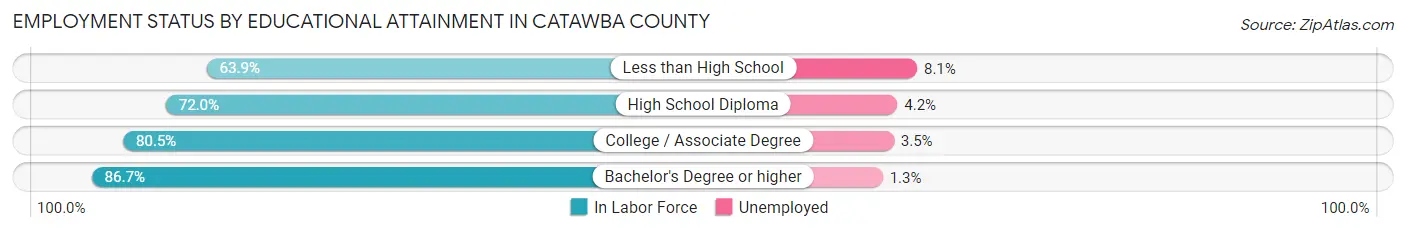
| Educational Attainment | In Labor Force | Unemployed |
| Less than High School | 5,989 (63.9%) | 759 (8.1%) |
| High School Diploma | 17,235 (72.0%) | 1,005 (4.2%) |
| College / Associate Degree | 23,046 (80.5%) | 1,002 (3.5%) |
| Bachelor's Degree or higher | 17,985 (86.7%) | 270 (1.3%) |
| Total | 64,243 (77.7%) | 2,894 (3.5%) |
Employment Occupations by Sex in Catawba County
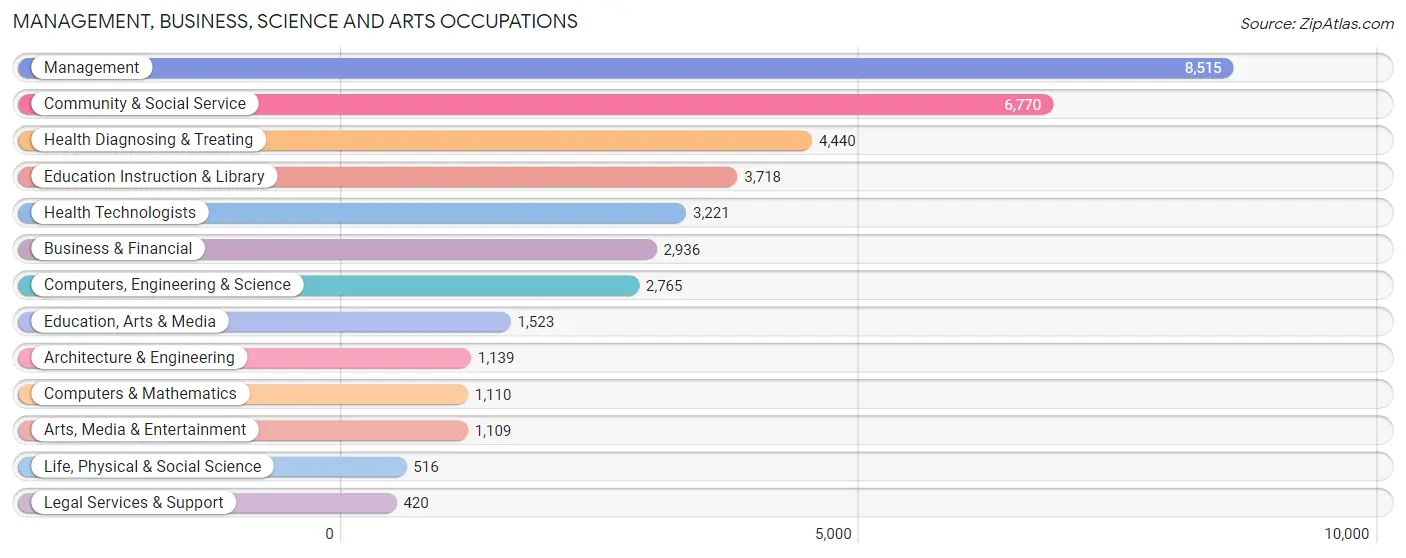
Management, Business, Science and Arts Occupations
The most common Management, Business, Science and Arts occupations in Catawba County are Management (8,515 | 11.2%), Community & Social Service (6,770 | 8.9%), Health Diagnosing & Treating (4,440 | 5.9%), Education Instruction & Library (3,718 | 4.9%), and Health Technologists (3,221 | 4.2%).
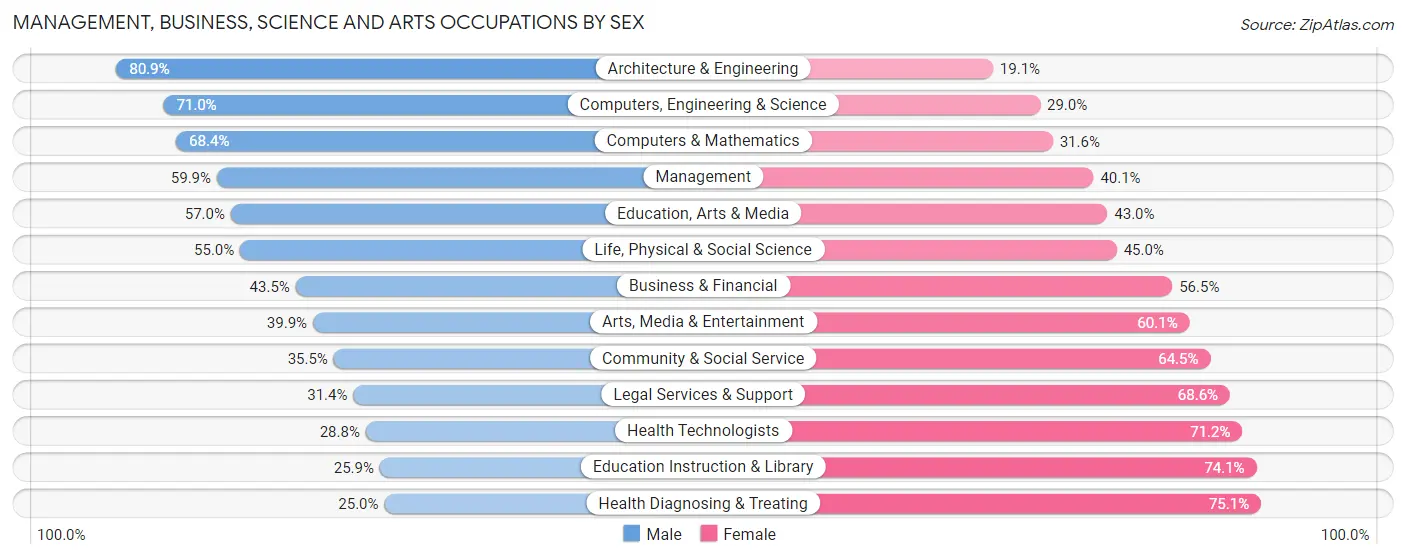
Management, Business, Science and Arts Occupations by Sex
Within the Management, Business, Science and Arts occupations in Catawba County, the most male-oriented occupations are Architecture & Engineering (80.9%), Computers, Engineering & Science (71.0%), and Computers & Mathematics (68.4%), while the most female-oriented occupations are Health Diagnosing & Treating (75.0%), Education Instruction & Library (74.1%), and Health Technologists (71.2%).
| Occupation | Male | Female |
| Management | 5,100 (59.9%) | 3,415 (40.1%) |
| Business & Financial | 1,276 (43.5%) | 1,660 (56.5%) |
| Computers, Engineering & Science | 1,964 (71.0%) | 801 (29.0%) |
| Computers & Mathematics | 759 (68.4%) | 351 (31.6%) |
| Architecture & Engineering | 921 (80.9%) | 218 (19.1%) |
| Life, Physical & Social Science | 284 (55.0%) | 232 (45.0%) |
| Community & Social Service | 2,405 (35.5%) | 4,365 (64.5%) |
| Education, Arts & Media | 868 (57.0%) | 655 (43.0%) |
| Legal Services & Support | 132 (31.4%) | 288 (68.6%) |
| Education Instruction & Library | 963 (25.9%) | 2,755 (74.1%) |
| Arts, Media & Entertainment | 442 (39.9%) | 667 (60.1%) |
| Health Diagnosing & Treating | 1,108 (24.9%) | 3,332 (75.0%) |
| Health Technologists | 929 (28.8%) | 2,292 (71.2%) |
| Total (Category) | 11,853 (46.6%) | 13,573 (53.4%) |
| Total (Overall) | 41,313 (54.4%) | 34,582 (45.6%) |
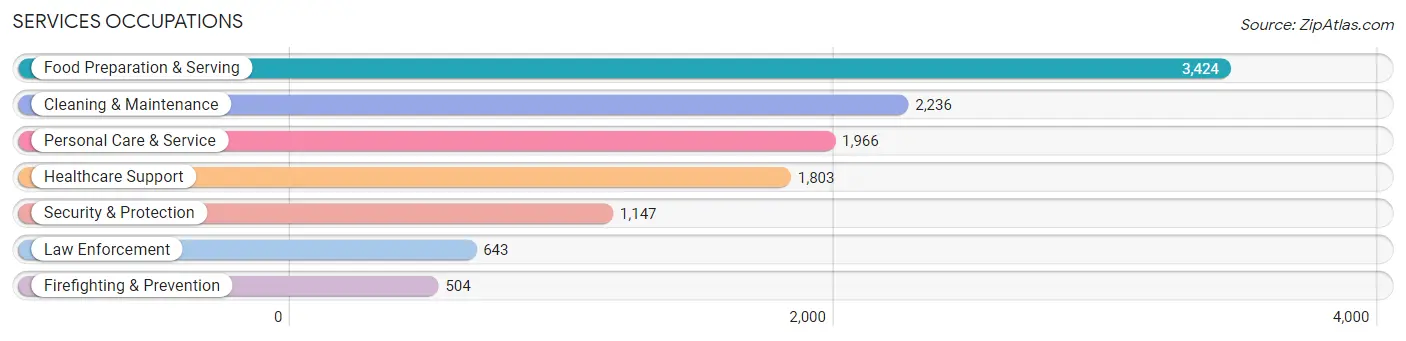
Services Occupations
The most common Services occupations in Catawba County are Food Preparation & Serving (3,424 | 4.5%), Cleaning & Maintenance (2,236 | 2.9%), Personal Care & Service (1,966 | 2.6%), Healthcare Support (1,803 | 2.4%), and Security & Protection (1,147 | 1.5%).
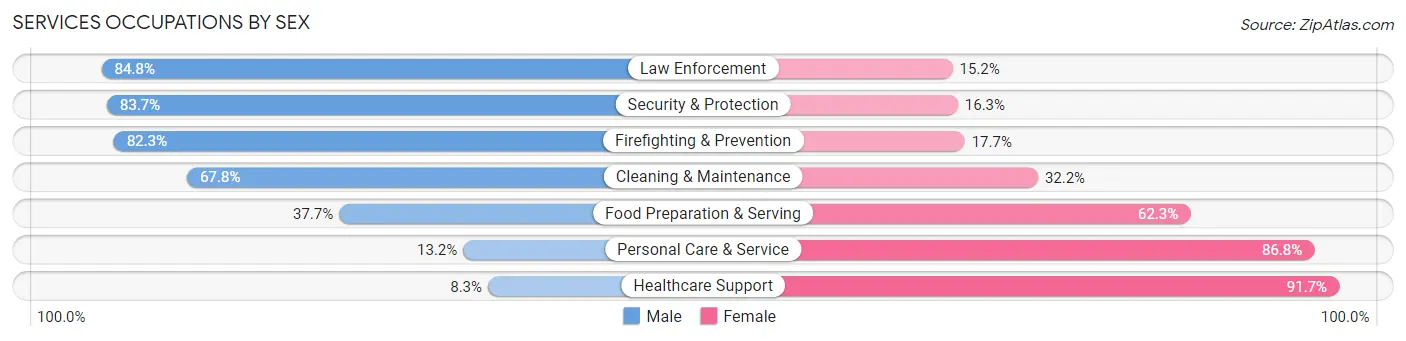
Services Occupations by Sex
Within the Services occupations in Catawba County, the most male-oriented occupations are Law Enforcement (84.8%), Security & Protection (83.7%), and Firefighting & Prevention (82.3%), while the most female-oriented occupations are Healthcare Support (91.7%), Personal Care & Service (86.8%), and Food Preparation & Serving (62.3%).
| Occupation | Male | Female |
| Healthcare Support | 149 (8.3%) | 1,654 (91.7%) |
| Security & Protection | 960 (83.7%) | 187 (16.3%) |
| Firefighting & Prevention | 415 (82.3%) | 89 (17.7%) |
| Law Enforcement | 545 (84.8%) | 98 (15.2%) |
| Food Preparation & Serving | 1,292 (37.7%) | 2,132 (62.3%) |
| Cleaning & Maintenance | 1,517 (67.8%) | 719 (32.2%) |
| Personal Care & Service | 259 (13.2%) | 1,707 (86.8%) |
| Total (Category) | 4,177 (39.5%) | 6,399 (60.5%) |
| Total (Overall) | 41,313 (54.4%) | 34,582 (45.6%) |
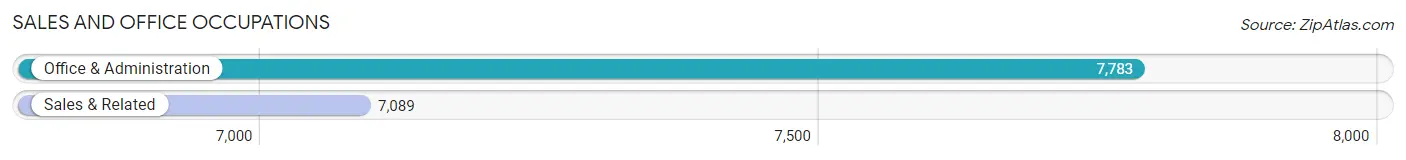
Sales and Office Occupations
The most common Sales and Office occupations in Catawba County are Office & Administration (7,783 | 10.2%), and Sales & Related (7,089 | 9.3%).
Sales and Office Occupations by Sex
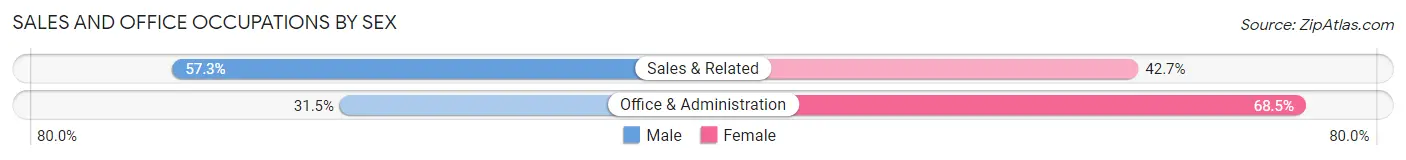
| Occupation | Male | Female |
| Sales & Related | 4,059 (57.3%) | 3,030 (42.7%) |
| Office & Administration | 2,452 (31.5%) | 5,331 (68.5%) |
| Total (Category) | 6,511 (43.8%) | 8,361 (56.2%) |
| Total (Overall) | 41,313 (54.4%) | 34,582 (45.6%) |
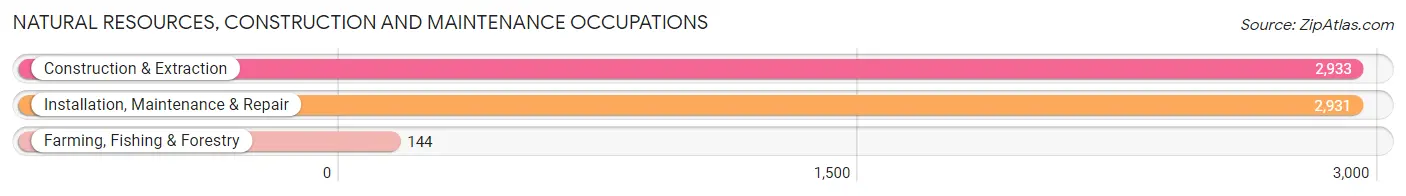
Natural Resources, Construction and Maintenance Occupations
The most common Natural Resources, Construction and Maintenance occupations in Catawba County are Construction & Extraction (2,933 | 3.9%), Installation, Maintenance & Repair (2,931 | 3.9%), and Farming, Fishing & Forestry (144 | 0.2%).
Natural Resources, Construction and Maintenance Occupations by Sex
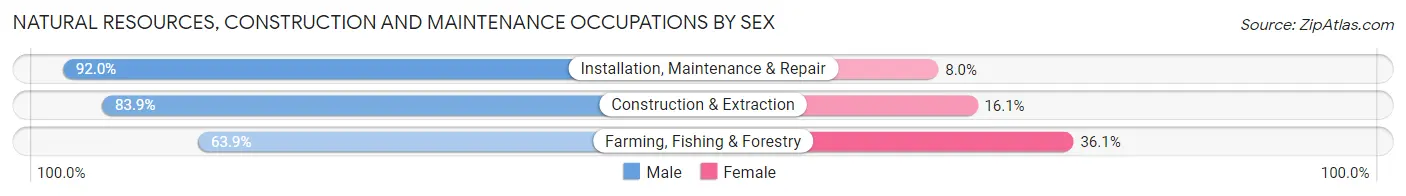
| Occupation | Male | Female |
| Farming, Fishing & Forestry | 92 (63.9%) | 52 (36.1%) |
| Construction & Extraction | 2,460 (83.9%) | 473 (16.1%) |
| Installation, Maintenance & Repair | 2,697 (92.0%) | 234 (8.0%) |
| Total (Category) | 5,249 (87.4%) | 759 (12.6%) |
| Total (Overall) | 41,313 (54.4%) | 34,582 (45.6%) |
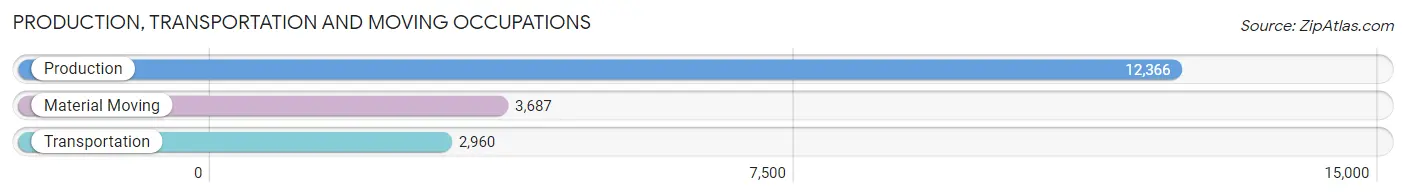
Production, Transportation and Moving Occupations
The most common Production, Transportation and Moving occupations in Catawba County are Production (12,366 | 16.3%), Material Moving (3,687 | 4.9%), and Transportation (2,960 | 3.9%).
Production, Transportation and Moving Occupations by Sex
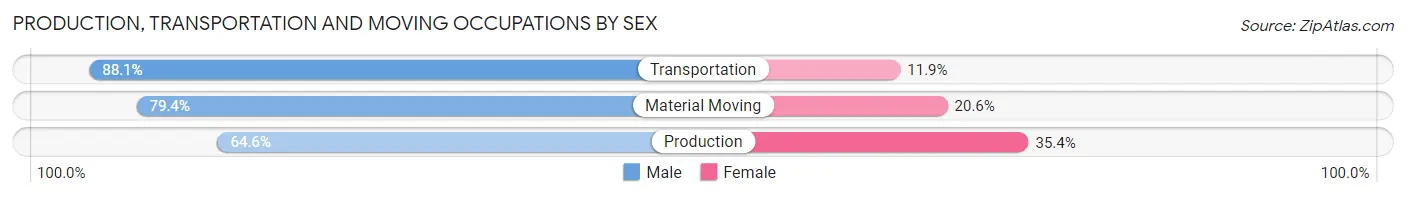
| Occupation | Male | Female |
| Production | 7,986 (64.6%) | 4,380 (35.4%) |
| Transportation | 2,608 (88.1%) | 352 (11.9%) |
| Material Moving | 2,929 (79.4%) | 758 (20.6%) |
| Total (Category) | 13,523 (71.1%) | 5,490 (28.9%) |
| Total (Overall) | 41,313 (54.4%) | 34,582 (45.6%) |
Employment Industries by Sex in Catawba County
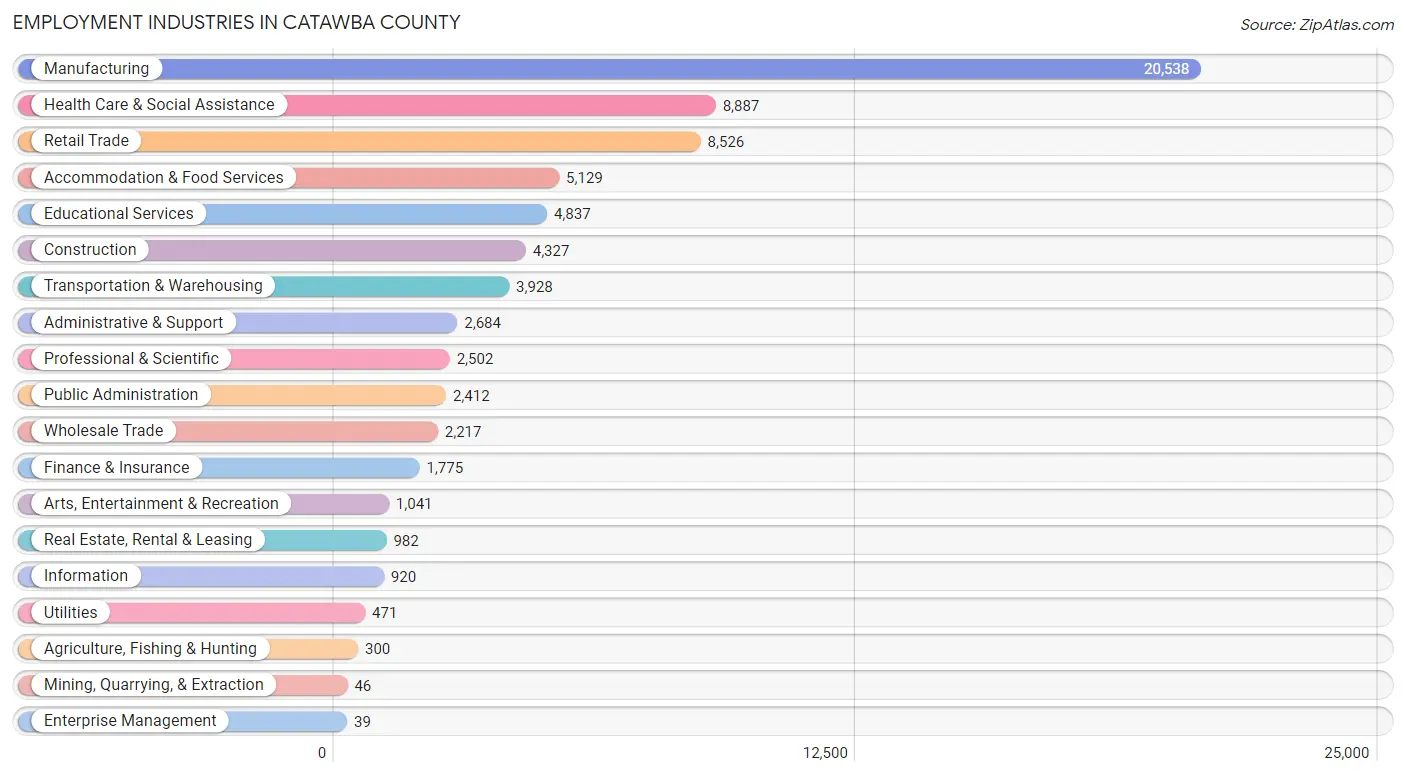
Employment Industries in Catawba County
The major employment industries in Catawba County include Manufacturing (20,538 | 27.1%), Health Care & Social Assistance (8,887 | 11.7%), Retail Trade (8,526 | 11.2%), Accommodation & Food Services (5,129 | 6.8%), and Educational Services (4,837 | 6.4%).
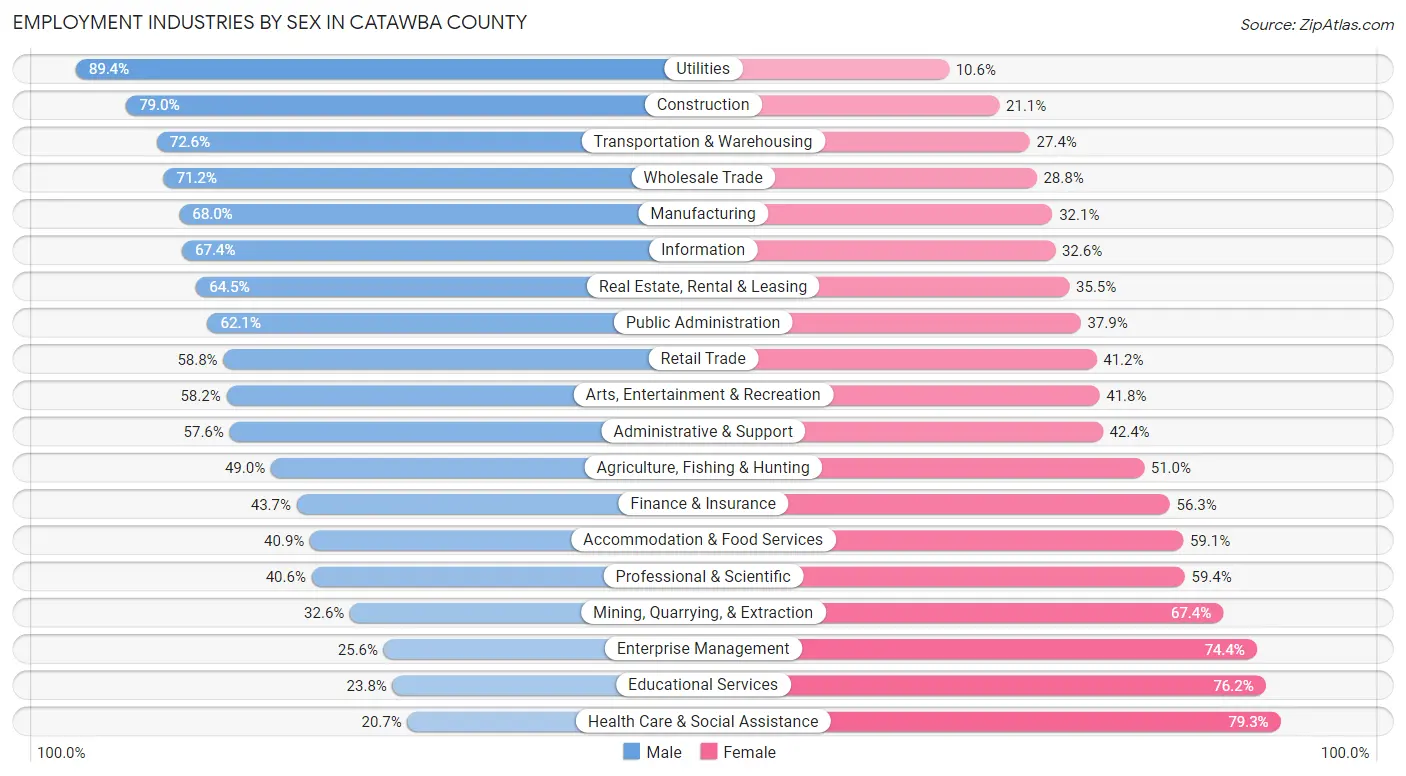
Employment Industries by Sex in Catawba County
The Catawba County industries that see more men than women are Utilities (89.4%), Construction (78.9%), and Transportation & Warehousing (72.6%), whereas the industries that tend to have a higher number of women are Health Care & Social Assistance (79.3%), Educational Services (76.2%), and Enterprise Management (74.4%).
| Industry | Male | Female |
| Agriculture, Fishing & Hunting | 147 (49.0%) | 153 (51.0%) |
| Mining, Quarrying, & Extraction | 15 (32.6%) | 31 (67.4%) |
| Construction | 3,416 (78.9%) | 911 (21.0%) |
| Manufacturing | 13,956 (67.9%) | 6,582 (32.1%) |
| Wholesale Trade | 1,579 (71.2%) | 638 (28.8%) |
| Retail Trade | 5,017 (58.8%) | 3,509 (41.2%) |
| Transportation & Warehousing | 2,853 (72.6%) | 1,075 (27.4%) |
| Utilities | 421 (89.4%) | 50 (10.6%) |
| Information | 620 (67.4%) | 300 (32.6%) |
| Finance & Insurance | 775 (43.7%) | 1,000 (56.3%) |
| Real Estate, Rental & Leasing | 633 (64.5%) | 349 (35.5%) |
| Professional & Scientific | 1,015 (40.6%) | 1,487 (59.4%) |
| Enterprise Management | 10 (25.6%) | 29 (74.4%) |
| Administrative & Support | 1,545 (57.6%) | 1,139 (42.4%) |
| Educational Services | 1,152 (23.8%) | 3,685 (76.2%) |
| Health Care & Social Assistance | 1,842 (20.7%) | 7,045 (79.3%) |
| Arts, Entertainment & Recreation | 606 (58.2%) | 435 (41.8%) |
| Accommodation & Food Services | 2,097 (40.9%) | 3,032 (59.1%) |
| Public Administration | 1,498 (62.1%) | 914 (37.9%) |
| Total | 41,313 (54.4%) | 34,582 (45.6%) |
Education in Catawba County
School Enrollment in Catawba County
The most common levels of schooling among the 35,061 students in Catawba County are high school (8,321 | 23.7%), middle school (8,032 | 22.9%), and elementary school (7,255 | 20.7%).
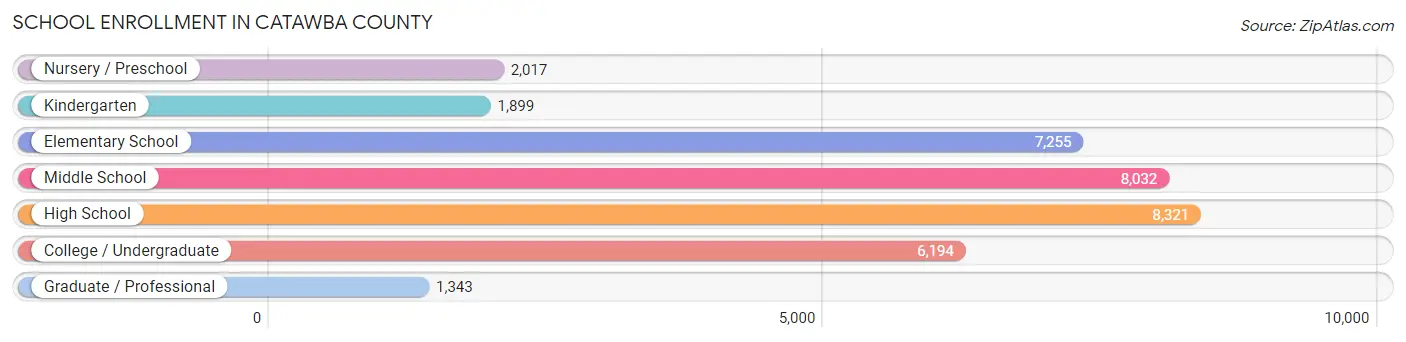
| School Level | # Students | % Students |
| Nursery / Preschool | 2,017 | 5.8% |
| Kindergarten | 1,899 | 5.4% |
| Elementary School | 7,255 | 20.7% |
| Middle School | 8,032 | 22.9% |
| High School | 8,321 | 23.7% |
| College / Undergraduate | 6,194 | 17.7% |
| Graduate / Professional | 1,343 | 3.8% |
| Total | 35,061 | 100.0% |
School Enrollment by Age by Funding Source in Catawba County
Out of a total of 35,061 students who are enrolled in schools in Catawba County, 6,591 (18.8%) attend a private institution, while the remaining 28,470 (81.2%) are enrolled in public schools. The age group of 3 to 4 year olds has the highest likelihood of being enrolled in private schools, with 956 (63.8% in the age bracket) enrolled. Conversely, the age group of 10 to 14 year olds has the lowest likelihood of being enrolled in a private school, with 9,046 (90.9% in the age bracket) attending a public institution.
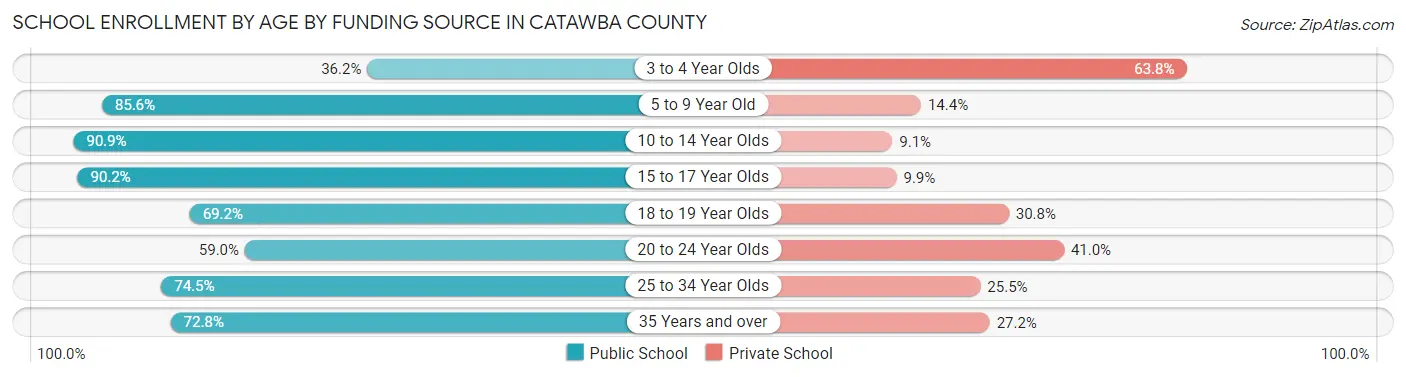
| Age Bracket | Public School | Private School |
| 3 to 4 Year Olds | 542 (36.2%) | 956 (63.8%) |
| 5 to 9 Year Old | 7,498 (85.6%) | 1,261 (14.4%) |
| 10 to 14 Year Olds | 9,046 (90.9%) | 902 (9.1%) |
| 15 to 17 Year Olds | 5,575 (90.1%) | 609 (9.9%) |
| 18 to 19 Year Olds | 1,875 (69.2%) | 833 (30.8%) |
| 20 to 24 Year Olds | 1,844 (59.0%) | 1,283 (41.0%) |
| 25 to 34 Year Olds | 1,235 (74.5%) | 422 (25.5%) |
| 35 Years and over | 859 (72.8%) | 321 (27.2%) |
| Total | 28,470 (81.2%) | 6,591 (18.8%) |
Educational Attainment by Field of Study in Catawba County
Business (6,352 | 21.1%), education (4,759 | 15.8%), science & technology (3,684 | 12.2%), arts & humanities (2,696 | 9.0%), and engineering (1,896 | 6.3%) are the most common fields of study among 30,088 individuals in Catawba County who have obtained a bachelor's degree or higher.
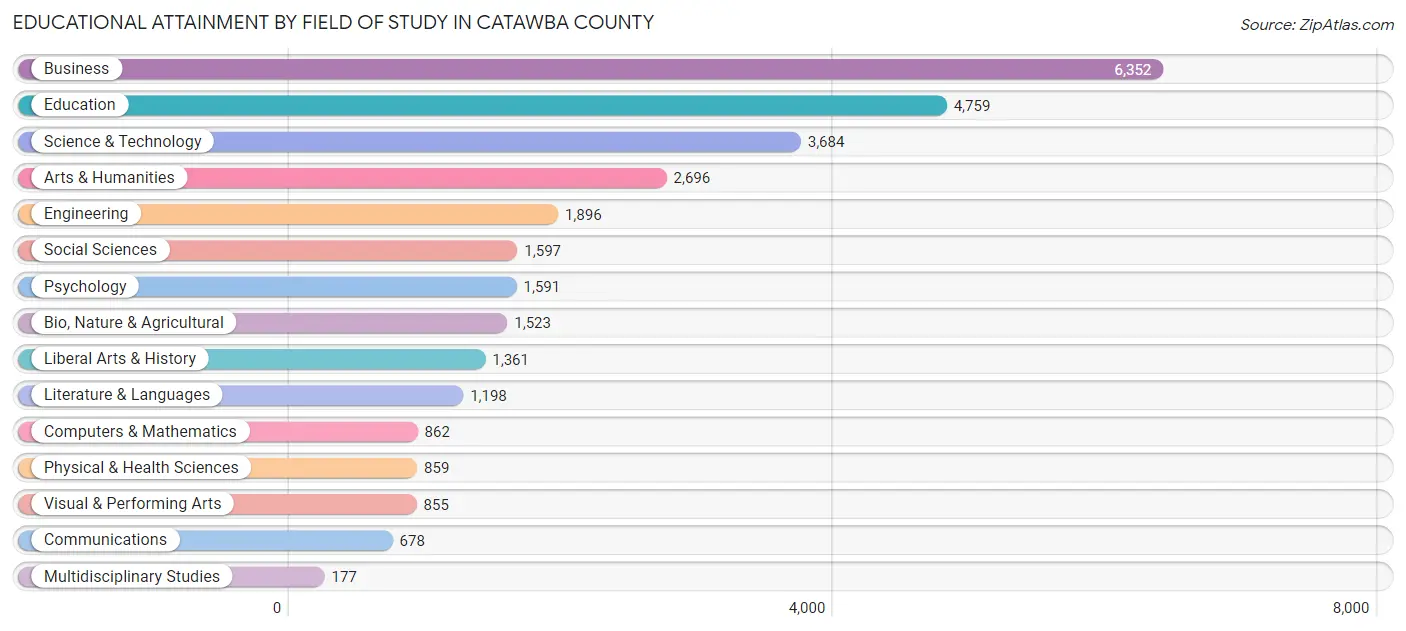
| Field of Study | # Graduates | % Graduates |
| Computers & Mathematics | 862 | 2.9% |
| Bio, Nature & Agricultural | 1,523 | 5.1% |
| Physical & Health Sciences | 859 | 2.9% |
| Psychology | 1,591 | 5.3% |
| Social Sciences | 1,597 | 5.3% |
| Engineering | 1,896 | 6.3% |
| Multidisciplinary Studies | 177 | 0.6% |
| Science & Technology | 3,684 | 12.2% |
| Business | 6,352 | 21.1% |
| Education | 4,759 | 15.8% |
| Literature & Languages | 1,198 | 4.0% |
| Liberal Arts & History | 1,361 | 4.5% |
| Visual & Performing Arts | 855 | 2.8% |
| Communications | 678 | 2.2% |
| Arts & Humanities | 2,696 | 9.0% |
| Total | 30,088 | 100.0% |
Transportation & Commute in Catawba County
Vehicle Availability by Sex in Catawba County
The most prevalent vehicle ownership categories in Catawba County are males with 2 vehicles (15,434, accounting for 38.1%) and females with 2 vehicles (12,378, making up 45.9%).
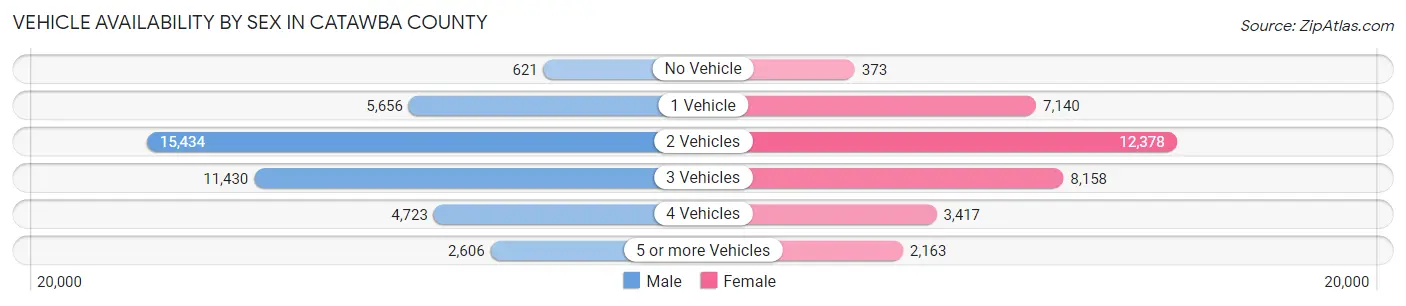
| Vehicles Available | Male | Female |
| No Vehicle | 621 (1.5%) | 373 (1.1%) |
| 1 Vehicle | 5,656 (14.0%) | 7,140 (21.2%) |
| 2 Vehicles | 15,434 (38.1%) | 12,378 (36.8%) |
| 3 Vehicles | 11,430 (28.2%) | 8,158 (24.3%) |
| 4 Vehicles | 4,723 (11.7%) | 3,417 (10.2%) |
| 5 or more Vehicles | 2,606 (6.4%) | 2,163 (6.4%) |
| Total | 40,470 (100.0%) | 33,629 (100.0%) |
Commute Time in Catawba County
The most frequently occuring commute durations in Catawba County are 15 to 19 minutes (14,593 commuters, 21.0%), 10 to 14 minutes (12,428 commuters, 17.9%), and 20 to 24 minutes (11,369 commuters, 16.4%).
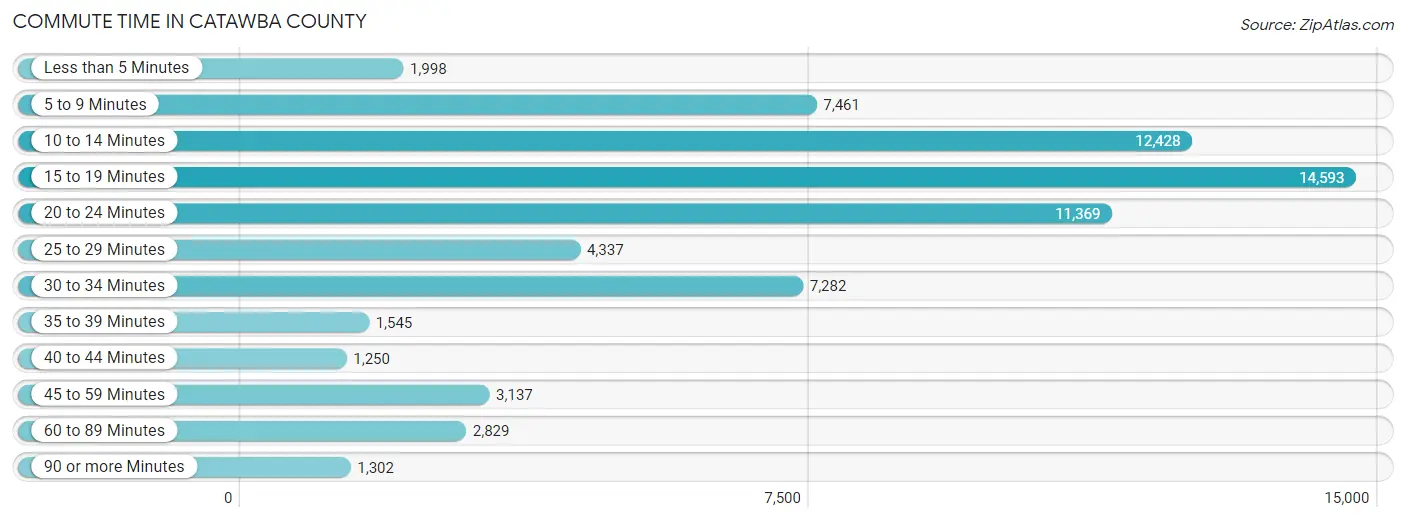
| Commute Time | # Commuters | % Commuters |
| Less than 5 Minutes | 1,998 | 2.9% |
| 5 to 9 Minutes | 7,461 | 10.7% |
| 10 to 14 Minutes | 12,428 | 17.9% |
| 15 to 19 Minutes | 14,593 | 21.0% |
| 20 to 24 Minutes | 11,369 | 16.4% |
| 25 to 29 Minutes | 4,337 | 6.2% |
| 30 to 34 Minutes | 7,282 | 10.5% |
| 35 to 39 Minutes | 1,545 | 2.2% |
| 40 to 44 Minutes | 1,250 | 1.8% |
| 45 to 59 Minutes | 3,137 | 4.5% |
| 60 to 89 Minutes | 2,829 | 4.1% |
| 90 or more Minutes | 1,302 | 1.9% |
Commute Time by Sex in Catawba County
The most common commute times in Catawba County are 15 to 19 minutes (7,305 commuters, 19.1%) for males and 15 to 19 minutes (7,288 commuters, 23.4%) for females.
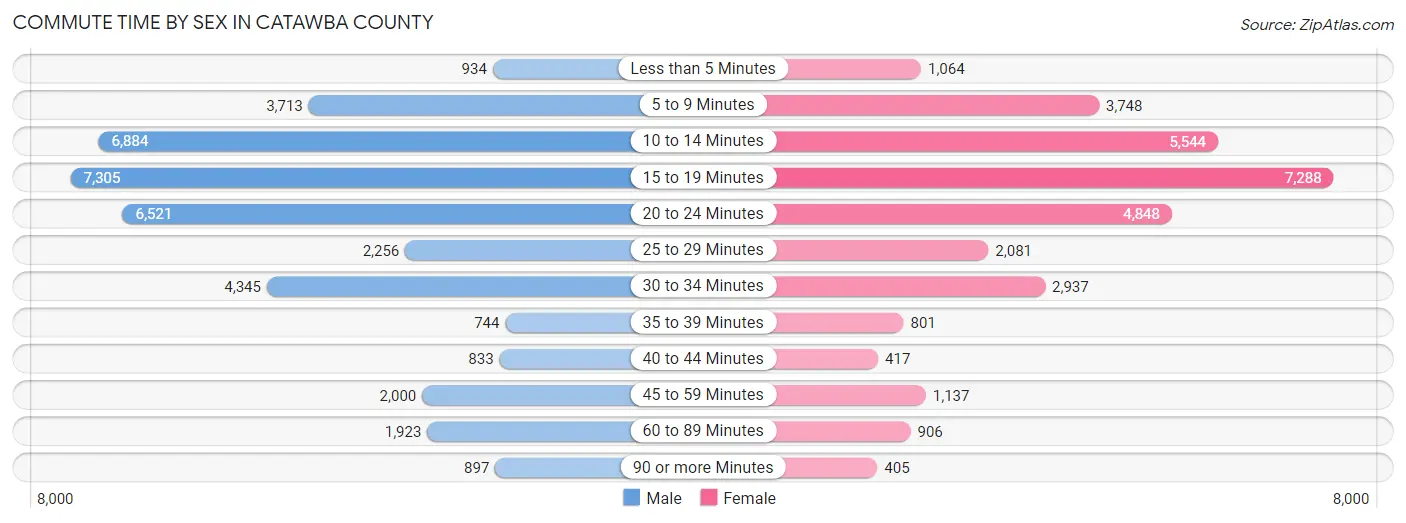
| Commute Time | Male | Female |
| Less than 5 Minutes | 934 (2.4%) | 1,064 (3.4%) |
| 5 to 9 Minutes | 3,713 (9.7%) | 3,748 (12.0%) |
| 10 to 14 Minutes | 6,884 (17.9%) | 5,544 (17.8%) |
| 15 to 19 Minutes | 7,305 (19.1%) | 7,288 (23.4%) |
| 20 to 24 Minutes | 6,521 (17.0%) | 4,848 (15.5%) |
| 25 to 29 Minutes | 2,256 (5.9%) | 2,081 (6.7%) |
| 30 to 34 Minutes | 4,345 (11.3%) | 2,937 (9.4%) |
| 35 to 39 Minutes | 744 (1.9%) | 801 (2.6%) |
| 40 to 44 Minutes | 833 (2.2%) | 417 (1.3%) |
| 45 to 59 Minutes | 2,000 (5.2%) | 1,137 (3.6%) |
| 60 to 89 Minutes | 1,923 (5.0%) | 906 (2.9%) |
| 90 or more Minutes | 897 (2.3%) | 405 (1.3%) |
Time of Departure to Work by Sex in Catawba County
The most frequent times of departure to work in Catawba County are 7:00 AM to 7:29 AM (5,533, 14.4%) for males and 7:30 AM to 7:59 AM (4,951, 15.9%) for females.
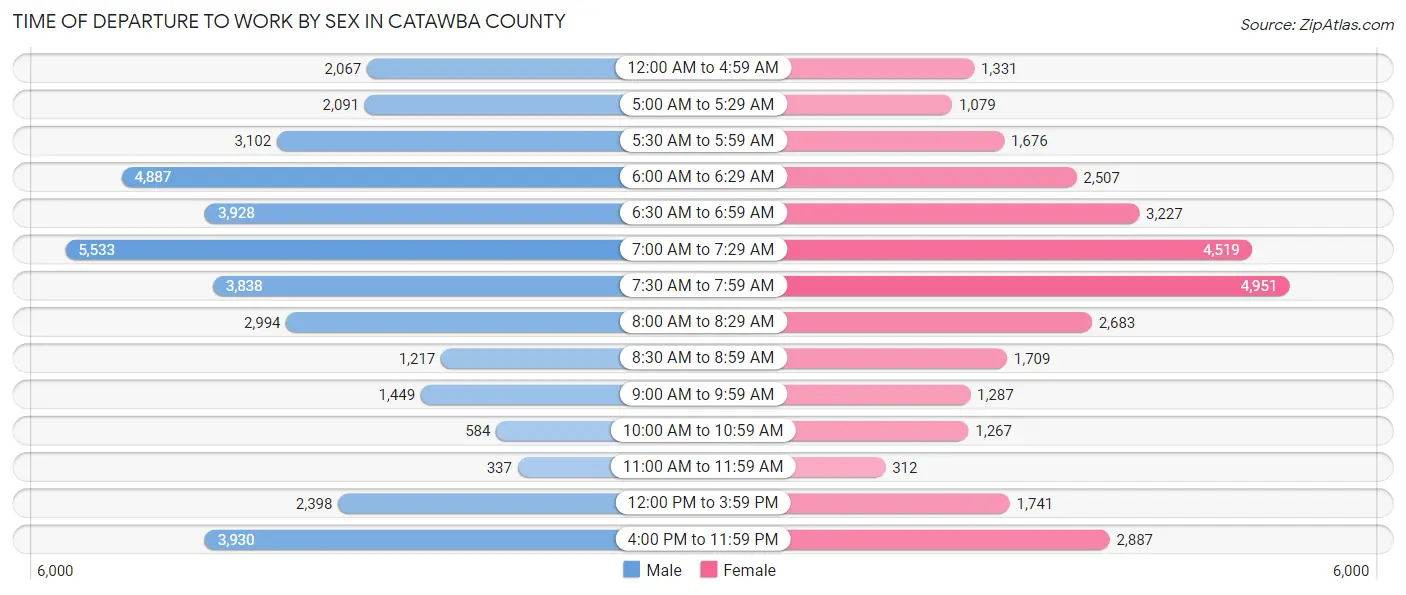
| Time of Departure | Male | Female |
| 12:00 AM to 4:59 AM | 2,067 (5.4%) | 1,331 (4.3%) |
| 5:00 AM to 5:29 AM | 2,091 (5.4%) | 1,079 (3.5%) |
| 5:30 AM to 5:59 AM | 3,102 (8.1%) | 1,676 (5.4%) |
| 6:00 AM to 6:29 AM | 4,887 (12.7%) | 2,507 (8.0%) |
| 6:30 AM to 6:59 AM | 3,928 (10.2%) | 3,227 (10.3%) |
| 7:00 AM to 7:29 AM | 5,533 (14.4%) | 4,519 (14.5%) |
| 7:30 AM to 7:59 AM | 3,838 (10.0%) | 4,951 (15.9%) |
| 8:00 AM to 8:29 AM | 2,994 (7.8%) | 2,683 (8.6%) |
| 8:30 AM to 8:59 AM | 1,217 (3.2%) | 1,709 (5.5%) |
| 9:00 AM to 9:59 AM | 1,449 (3.8%) | 1,287 (4.1%) |
| 10:00 AM to 10:59 AM | 584 (1.5%) | 1,267 (4.1%) |
| 11:00 AM to 11:59 AM | 337 (0.9%) | 312 (1.0%) |
| 12:00 PM to 3:59 PM | 2,398 (6.2%) | 1,741 (5.6%) |
| 4:00 PM to 11:59 PM | 3,930 (10.2%) | 2,887 (9.3%) |
| Total | 38,355 (100.0%) | 31,176 (100.0%) |
Housing Occupancy in Catawba County
Occupancy by Ownership in Catawba County
Of the total 64,442 dwellings in Catawba County, owner-occupied units account for 45,783 (71.1%), while renter-occupied units make up 18,659 (28.9%).
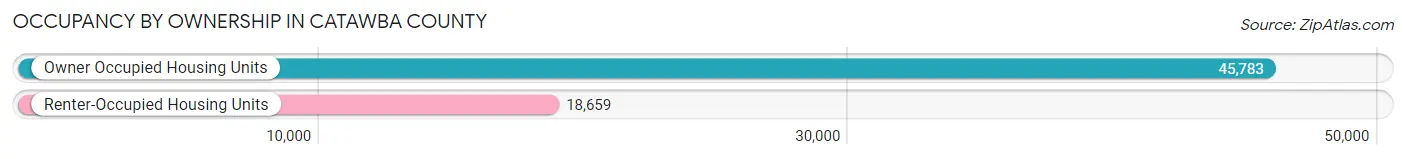
| Occupancy | # Housing Units | % Housing Units |
| Owner Occupied Housing Units | 45,783 | 71.1% |
| Renter-Occupied Housing Units | 18,659 | 28.9% |
| Total Occupied Housing Units | 64,442 | 100.0% |
Occupancy by Household Size in Catawba County
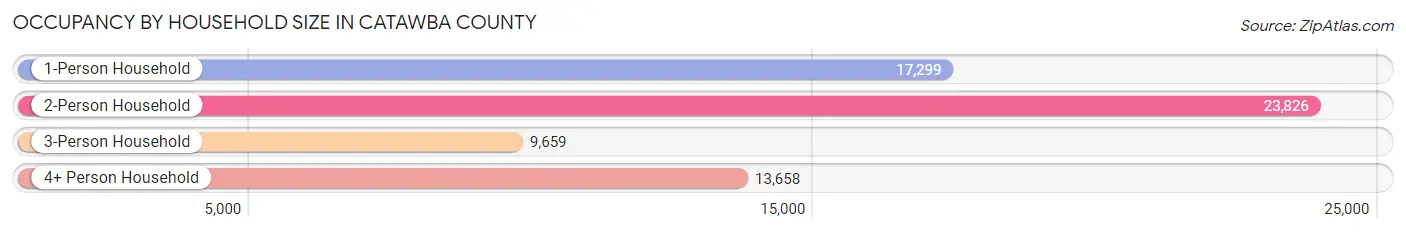
| Household Size | # Housing Units | % Housing Units |
| 1-Person Household | 17,299 | 26.8% |
| 2-Person Household | 23,826 | 37.0% |
| 3-Person Household | 9,659 | 15.0% |
| 4+ Person Household | 13,658 | 21.2% |
| Total Housing Units | 64,442 | 100.0% |
Occupancy by Ownership by Household Size in Catawba County
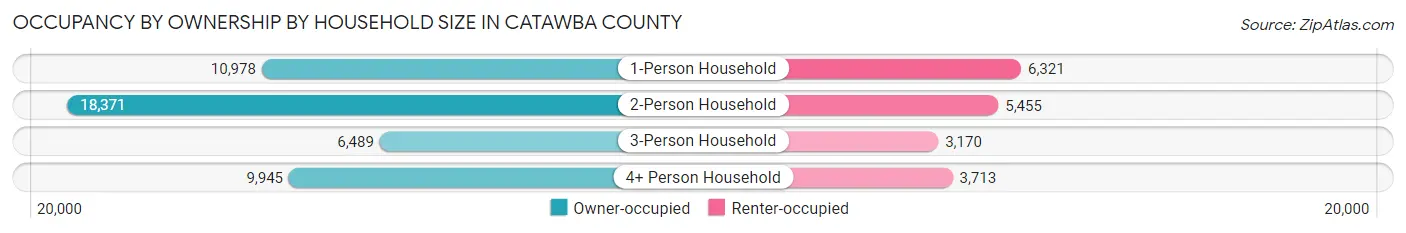
| Household Size | Owner-occupied | Renter-occupied |
| 1-Person Household | 10,978 (63.5%) | 6,321 (36.5%) |
| 2-Person Household | 18,371 (77.1%) | 5,455 (22.9%) |
| 3-Person Household | 6,489 (67.2%) | 3,170 (32.8%) |
| 4+ Person Household | 9,945 (72.8%) | 3,713 (27.2%) |
| Total Housing Units | 45,783 (71.1%) | 18,659 (28.9%) |
Occupancy by Educational Attainment in Catawba County
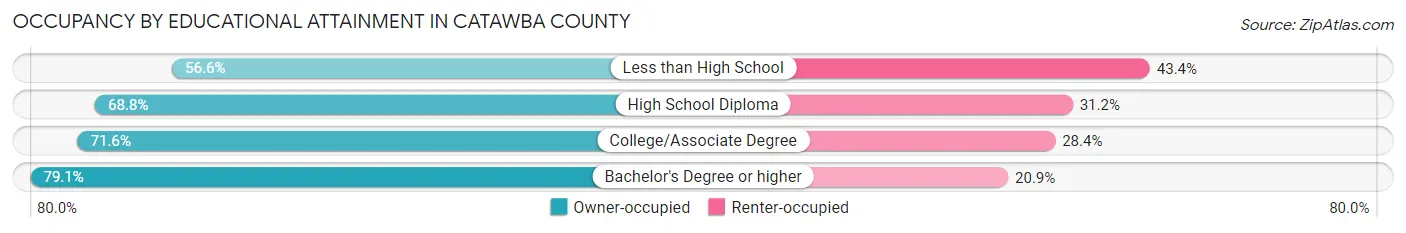
| Household Size | Owner-occupied | Renter-occupied |
| Less than High School | 4,317 (56.6%) | 3,311 (43.4%) |
| High School Diploma | 12,527 (68.8%) | 5,675 (31.2%) |
| College/Associate Degree | 15,248 (71.6%) | 6,049 (28.4%) |
| Bachelor's Degree or higher | 13,691 (79.1%) | 3,624 (20.9%) |
Occupancy by Age of Householder in Catawba County
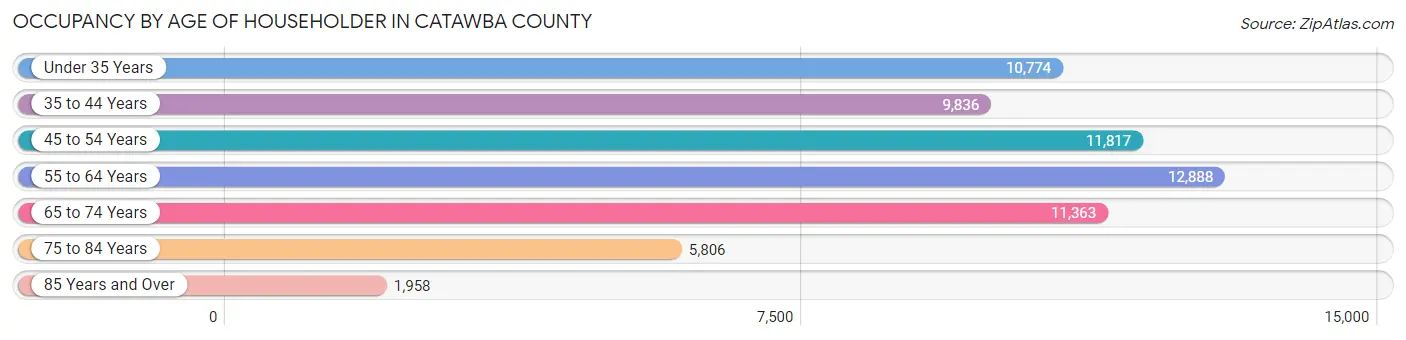
| Age Bracket | # Households | % Households |
| Under 35 Years | 10,774 | 16.7% |
| 35 to 44 Years | 9,836 | 15.3% |
| 45 to 54 Years | 11,817 | 18.3% |
| 55 to 64 Years | 12,888 | 20.0% |
| 65 to 74 Years | 11,363 | 17.6% |
| 75 to 84 Years | 5,806 | 9.0% |
| 85 Years and Over | 1,958 | 3.0% |
| Total | 64,442 | 100.0% |
Housing Finances in Catawba County
Median Income by Occupancy in Catawba County
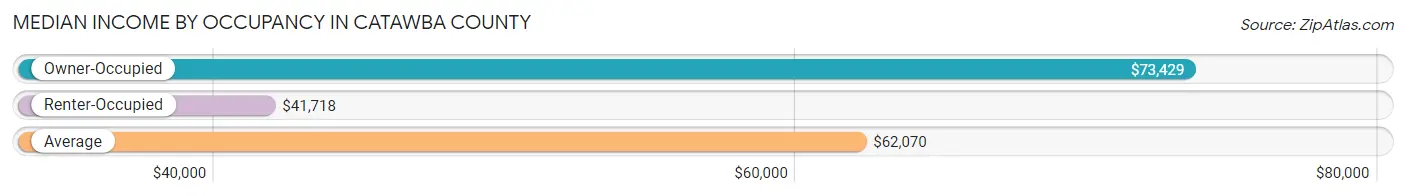
| Occupancy Type | # Households | Median Income |
| Owner-Occupied | 45,783 (71.1%) | $73,429 |
| Renter-Occupied | 18,659 (28.9%) | $41,718 |
| Average | 64,442 (100.0%) | $62,070 |
Occupancy by Householder Income Bracket in Catawba County
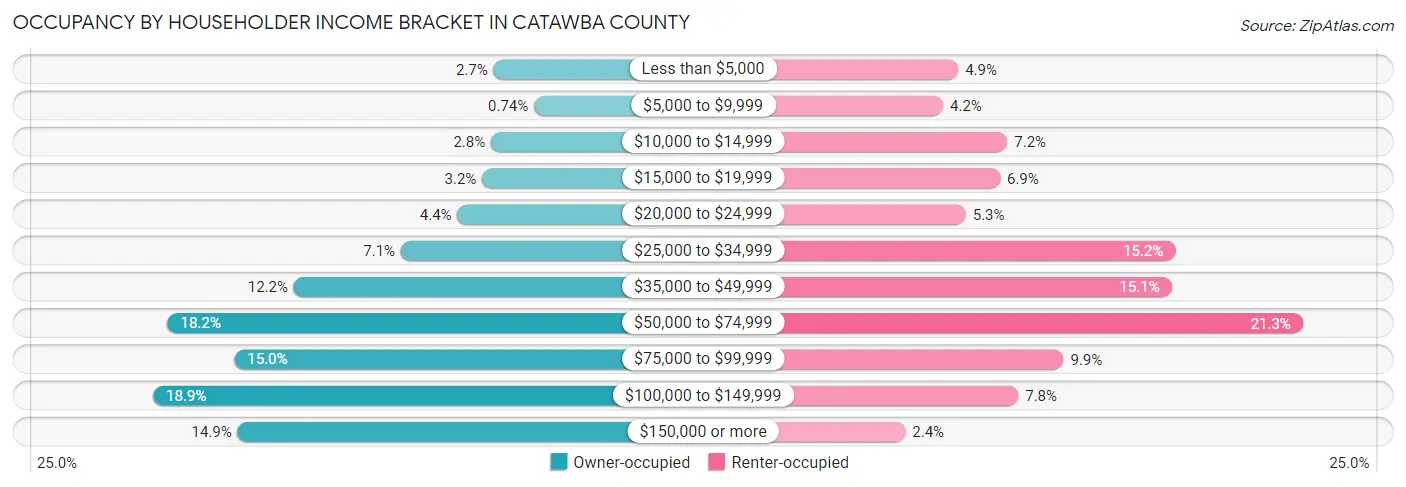
| Income Bracket | Owner-occupied | Renter-occupied |
| Less than $5,000 | 1,221 (2.7%) | 912 (4.9%) |
| $5,000 to $9,999 | 341 (0.7%) | 778 (4.2%) |
| $10,000 to $14,999 | 1,277 (2.8%) | 1,349 (7.2%) |
| $15,000 to $19,999 | 1,471 (3.2%) | 1,284 (6.9%) |
| $20,000 to $24,999 | 2,010 (4.4%) | 980 (5.2%) |
| $25,000 to $34,999 | 3,240 (7.1%) | 2,839 (15.2%) |
| $35,000 to $49,999 | 5,576 (12.2%) | 2,808 (15.0%) |
| $50,000 to $74,999 | 8,326 (18.2%) | 3,973 (21.3%) |
| $75,000 to $99,999 | 6,872 (15.0%) | 1,847 (9.9%) |
| $100,000 to $149,999 | 8,644 (18.9%) | 1,447 (7.7%) |
| $150,000 or more | 6,805 (14.9%) | 442 (2.4%) |
| Total | 45,783 (100.0%) | 18,659 (100.0%) |
Monthly Housing Cost Tiers in Catawba County
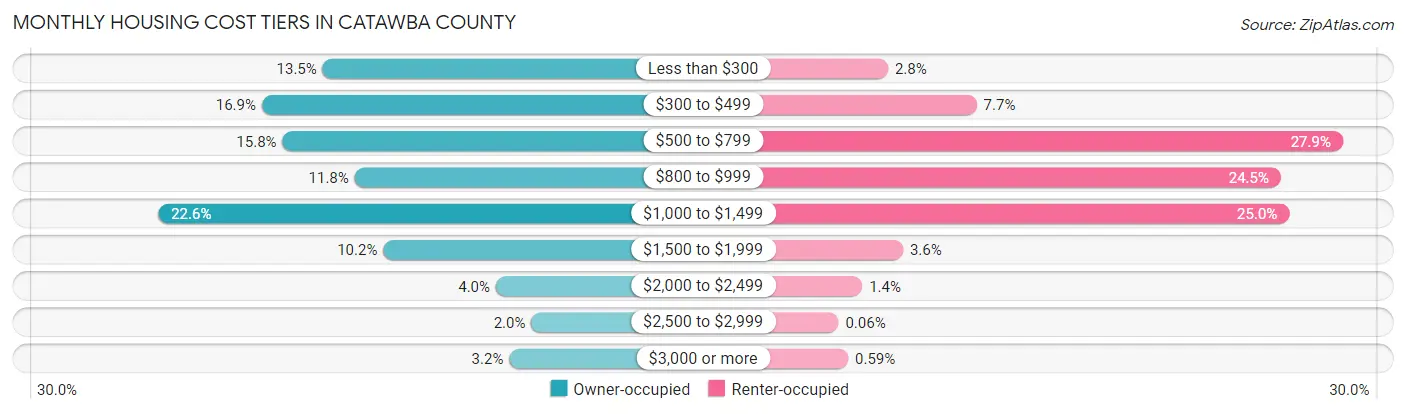
| Monthly Cost | Owner-occupied | Renter-occupied |
| Less than $300 | 6,199 (13.5%) | 520 (2.8%) |
| $300 to $499 | 7,738 (16.9%) | 1,435 (7.7%) |
| $500 to $799 | 7,214 (15.8%) | 5,208 (27.9%) |
| $800 to $999 | 5,388 (11.8%) | 4,569 (24.5%) |
| $1,000 to $1,499 | 10,362 (22.6%) | 4,655 (24.9%) |
| $1,500 to $1,999 | 4,664 (10.2%) | 675 (3.6%) |
| $2,000 to $2,499 | 1,818 (4.0%) | 256 (1.4%) |
| $2,500 to $2,999 | 919 (2.0%) | 11 (0.1%) |
| $3,000 or more | 1,481 (3.2%) | 110 (0.6%) |
| Total | 45,783 (100.0%) | 18,659 (100.0%) |
Physical Housing Characteristics in Catawba County
Housing Structures in Catawba County
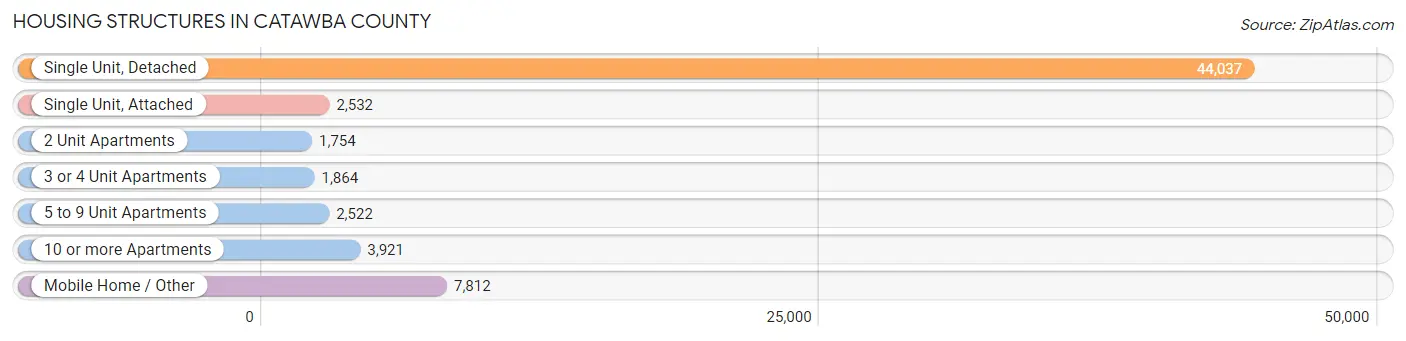
| Structure Type | # Housing Units | % Housing Units |
| Single Unit, Detached | 44,037 | 68.3% |
| Single Unit, Attached | 2,532 | 3.9% |
| 2 Unit Apartments | 1,754 | 2.7% |
| 3 or 4 Unit Apartments | 1,864 | 2.9% |
| 5 to 9 Unit Apartments | 2,522 | 3.9% |
| 10 or more Apartments | 3,921 | 6.1% |
| Mobile Home / Other | 7,812 | 12.1% |
| Total | 64,442 | 100.0% |
Housing Structures by Occupancy in Catawba County
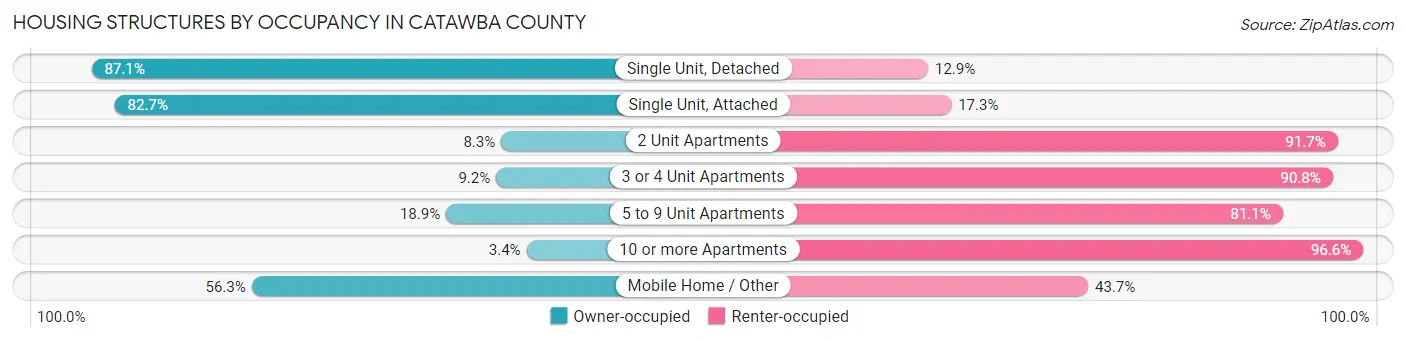
| Structure Type | Owner-occupied | Renter-occupied |
| Single Unit, Detached | 38,367 (87.1%) | 5,670 (12.9%) |
| Single Unit, Attached | 2,093 (82.7%) | 439 (17.3%) |
| 2 Unit Apartments | 145 (8.3%) | 1,609 (91.7%) |
| 3 or 4 Unit Apartments | 172 (9.2%) | 1,692 (90.8%) |
| 5 to 9 Unit Apartments | 476 (18.9%) | 2,046 (81.1%) |
| 10 or more Apartments | 132 (3.4%) | 3,789 (96.6%) |
| Mobile Home / Other | 4,398 (56.3%) | 3,414 (43.7%) |
| Total | 45,783 (71.1%) | 18,659 (28.9%) |
Housing Structures by Number of Rooms in Catawba County
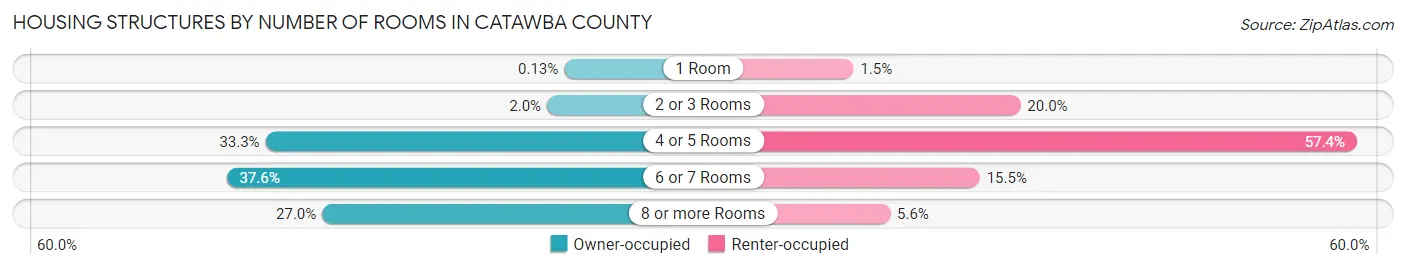
| Number of Rooms | Owner-occupied | Renter-occupied |
| 1 Room | 59 (0.1%) | 282 (1.5%) |
| 2 or 3 Rooms | 929 (2.0%) | 3,737 (20.0%) |
| 4 or 5 Rooms | 15,234 (33.3%) | 10,704 (57.4%) |
| 6 or 7 Rooms | 17,210 (37.6%) | 2,896 (15.5%) |
| 8 or more Rooms | 12,351 (27.0%) | 1,040 (5.6%) |
| Total | 45,783 (100.0%) | 18,659 (100.0%) |
Housing Structure by Heating Type in Catawba County
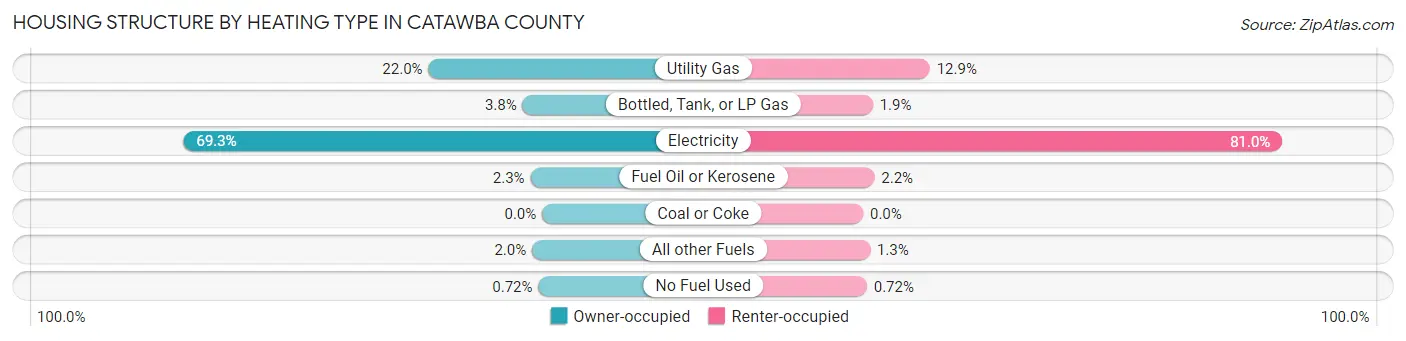
| Heating Type | Owner-occupied | Renter-occupied |
| Utility Gas | 10,058 (22.0%) | 2,405 (12.9%) |
| Bottled, Tank, or LP Gas | 1,730 (3.8%) | 349 (1.9%) |
| Electricity | 31,739 (69.3%) | 15,112 (81.0%) |
| Fuel Oil or Kerosene | 1,033 (2.3%) | 409 (2.2%) |
| Coal or Coke | 0 (0.0%) | 0 (0.0%) |
| All other Fuels | 895 (1.9%) | 250 (1.3%) |
| No Fuel Used | 328 (0.7%) | 134 (0.7%) |
| Total | 45,783 (100.0%) | 18,659 (100.0%) |
Household Vehicle Usage in Catawba County
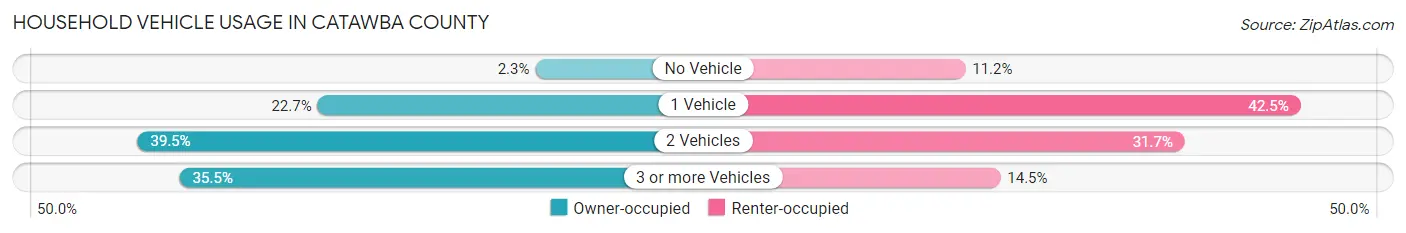
| Vehicles per Household | Owner-occupied | Renter-occupied |
| No Vehicle | 1,069 (2.3%) | 2,098 (11.2%) |
| 1 Vehicle | 10,374 (22.7%) | 7,936 (42.5%) |
| 2 Vehicles | 18,069 (39.5%) | 5,918 (31.7%) |
| 3 or more Vehicles | 16,271 (35.5%) | 2,707 (14.5%) |
| Total | 45,783 (100.0%) | 18,659 (100.0%) |
Real Estate & Mortgages in Catawba County
Real Estate and Mortgage Overview in Catawba County
| Characteristic | Without Mortgage | With Mortgage |
| Housing Units | 18,560 | 27,223 |
| Median Property Value | $175,700 | $205,300 |
| Median Household Income | $55,537 | $4,845 |
| Monthly Housing Costs | $370 | $1,481 |
| Real Estate Taxes | $1,160 | $279 |
Property Value by Mortgage Status in Catawba County
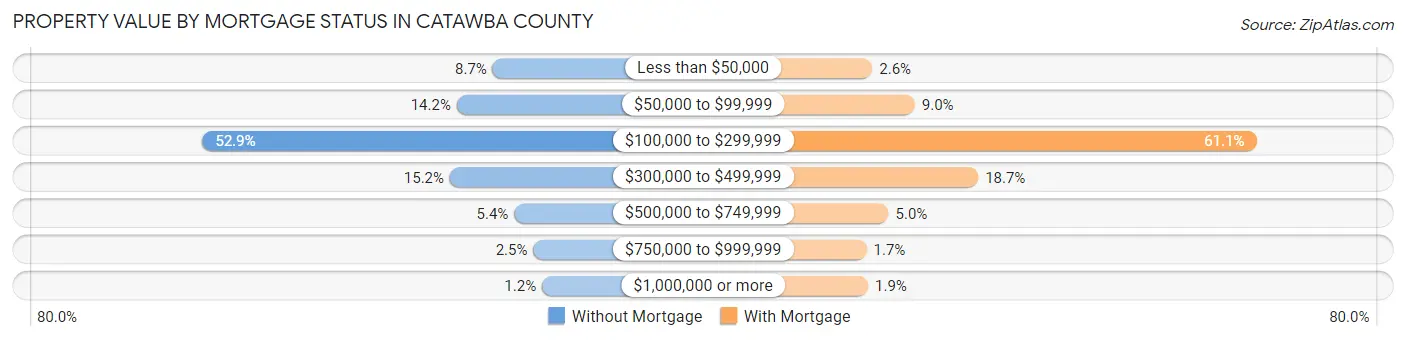
| Property Value | Without Mortgage | With Mortgage |
| Less than $50,000 | 1,610 (8.7%) | 697 (2.6%) |
| $50,000 to $99,999 | 2,627 (14.1%) | 2,462 (9.0%) |
| $100,000 to $299,999 | 9,822 (52.9%) | 16,628 (61.1%) |
| $300,000 to $499,999 | 2,821 (15.2%) | 5,087 (18.7%) |
| $500,000 to $749,999 | 1,003 (5.4%) | 1,372 (5.0%) |
| $750,000 to $999,999 | 462 (2.5%) | 456 (1.7%) |
| $1,000,000 or more | 215 (1.2%) | 521 (1.9%) |
| Total | 18,560 (100.0%) | 27,223 (100.0%) |
Household Income by Mortgage Status in Catawba County
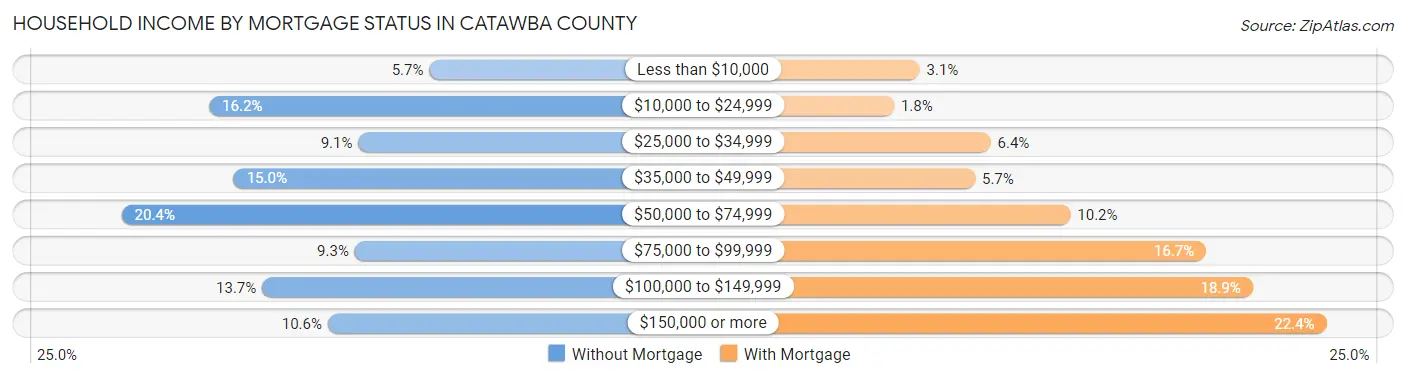
| Household Income | Without Mortgage | With Mortgage |
| Less than $10,000 | 1,063 (5.7%) | 831 (3.0%) |
| $10,000 to $24,999 | 3,008 (16.2%) | 499 (1.8%) |
| $25,000 to $34,999 | 1,690 (9.1%) | 1,750 (6.4%) |
| $35,000 to $49,999 | 2,792 (15.0%) | 1,550 (5.7%) |
| $50,000 to $74,999 | 3,783 (20.4%) | 2,784 (10.2%) |
| $75,000 to $99,999 | 1,723 (9.3%) | 4,543 (16.7%) |
| $100,000 to $149,999 | 2,541 (13.7%) | 5,149 (18.9%) |
| $150,000 or more | 1,960 (10.6%) | 6,103 (22.4%) |
| Total | 18,560 (100.0%) | 27,223 (100.0%) |
Property Value to Household Income Ratio in Catawba County
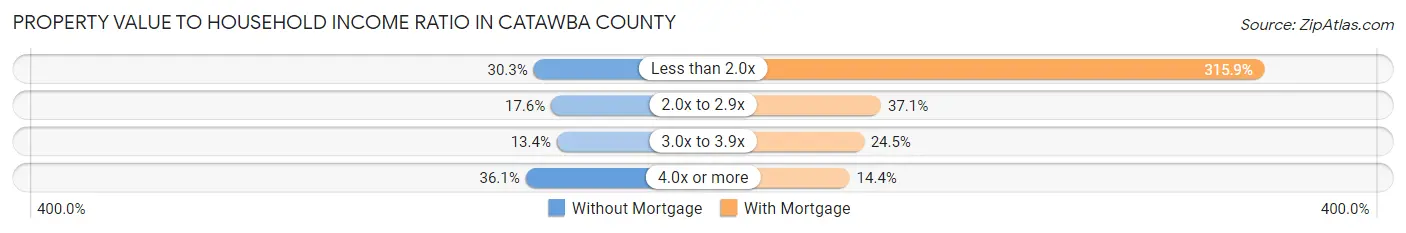
| Value-to-Income Ratio | Without Mortgage | With Mortgage |
| Less than 2.0x | 5,623 (30.3%) | 86,005 (315.9%) |
| 2.0x to 2.9x | 3,261 (17.6%) | 10,107 (37.1%) |
| 3.0x to 3.9x | 2,493 (13.4%) | 6,677 (24.5%) |
| 4.0x or more | 6,701 (36.1%) | 3,907 (14.3%) |
| Total | 18,560 (100.0%) | 27,223 (100.0%) |
Real Estate Taxes by Mortgage Status in Catawba County
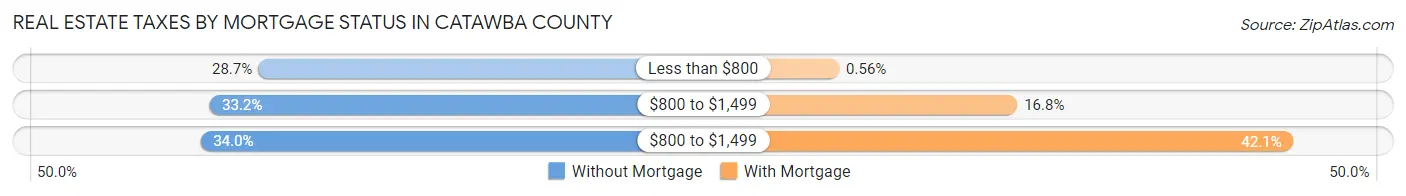
| Property Taxes | Without Mortgage | With Mortgage |
| Less than $800 | 5,323 (28.7%) | 153 (0.6%) |
| $800 to $1,499 | 6,152 (33.2%) | 4,580 (16.8%) |
| $800 to $1,499 | 6,303 (34.0%) | 11,449 (42.1%) |
| Total | 18,560 (100.0%) | 27,223 (100.0%) |
Health & Disability in Catawba County
Health Insurance Coverage by Age in Catawba County
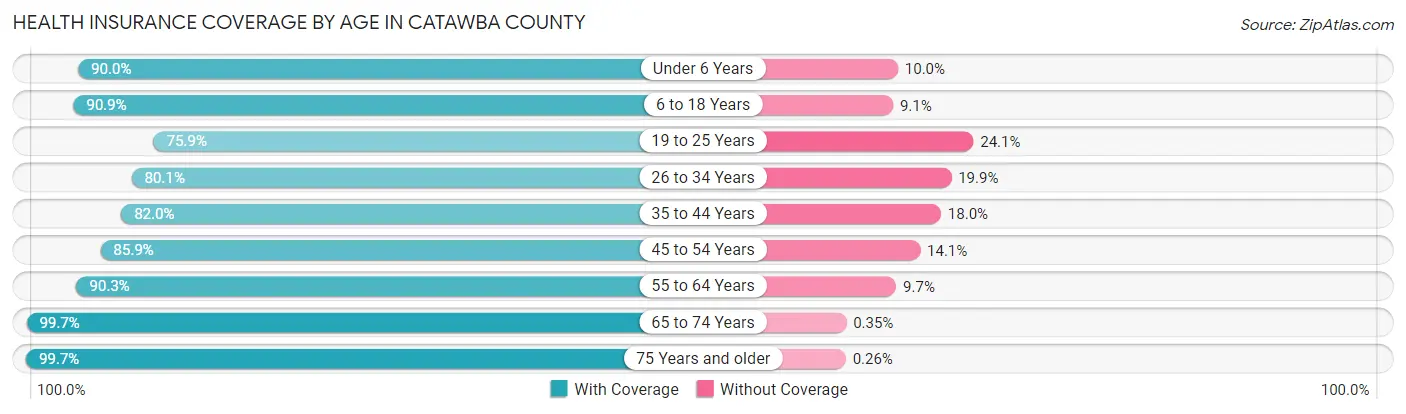
| Age Bracket | With Coverage | Without Coverage |
| Under 6 Years | 9,612 (90.0%) | 1,067 (10.0%) |
| 6 to 18 Years | 23,932 (90.9%) | 2,389 (9.1%) |
| 19 to 25 Years | 10,539 (75.9%) | 3,339 (24.1%) |
| 26 to 34 Years | 13,563 (80.1%) | 3,379 (19.9%) |
| 35 to 44 Years | 15,286 (82.0%) | 3,361 (18.0%) |
| 45 to 54 Years | 18,662 (85.9%) | 3,073 (14.1%) |
| 55 to 64 Years | 20,249 (90.3%) | 2,167 (9.7%) |
| 65 to 74 Years | 17,335 (99.7%) | 61 (0.4%) |
| 75 Years and older | 11,338 (99.7%) | 30 (0.3%) |
| Total | 140,516 (88.2%) | 18,866 (11.8%) |
Health Insurance Coverage by Citizenship Status in Catawba County
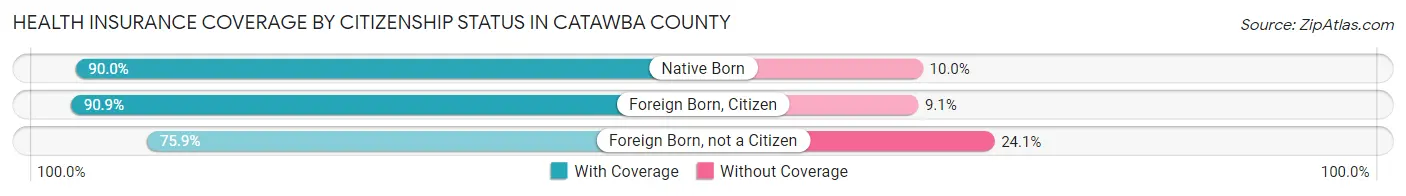
| Citizenship Status | With Coverage | Without Coverage |
| Native Born | 9,612 (90.0%) | 1,067 (10.0%) |
| Foreign Born, Citizen | 23,932 (90.9%) | 2,389 (9.1%) |
| Foreign Born, not a Citizen | 10,539 (75.9%) | 3,339 (24.1%) |
Health Insurance Coverage by Household Income in Catawba County
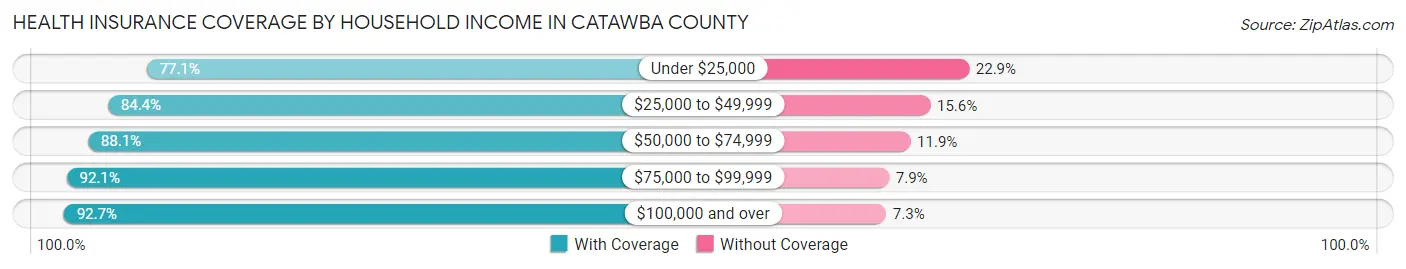
| Household Income | With Coverage | Without Coverage |
| Under $25,000 | 15,682 (77.1%) | 4,651 (22.9%) |
| $25,000 to $49,999 | 24,614 (84.4%) | 4,549 (15.6%) |
| $50,000 to $74,999 | 28,003 (88.1%) | 3,771 (11.9%) |
| $75,000 to $99,999 | 22,446 (92.1%) | 1,920 (7.9%) |
| $100,000 and over | 48,801 (92.7%) | 3,862 (7.3%) |
Public vs Private Health Insurance Coverage by Age in Catawba County
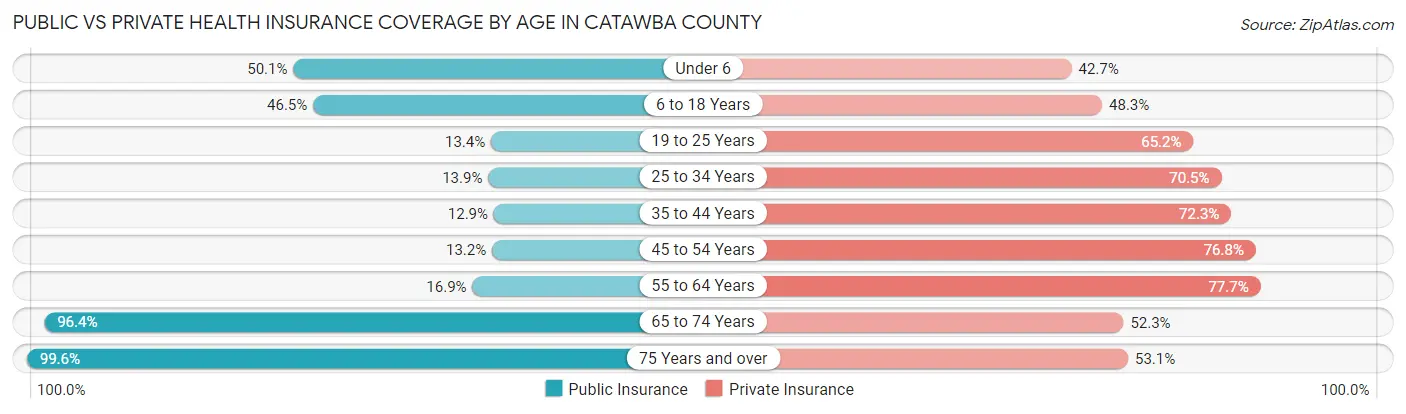
| Age Bracket | Public Insurance | Private Insurance |
| Under 6 | 5,352 (50.1%) | 4,555 (42.6%) |
| 6 to 18 Years | 12,227 (46.5%) | 12,719 (48.3%) |
| 19 to 25 Years | 1,863 (13.4%) | 9,054 (65.2%) |
| 25 to 34 Years | 2,361 (13.9%) | 11,935 (70.5%) |
| 35 to 44 Years | 2,405 (12.9%) | 13,476 (72.3%) |
| 45 to 54 Years | 2,877 (13.2%) | 16,700 (76.8%) |
| 55 to 64 Years | 3,783 (16.9%) | 17,419 (77.7%) |
| 65 to 74 Years | 16,761 (96.4%) | 9,095 (52.3%) |
| 75 Years and over | 11,321 (99.6%) | 6,040 (53.1%) |
| Total | 58,950 (37.0%) | 100,993 (63.4%) |
Disability Status by Sex by Age in Catawba County
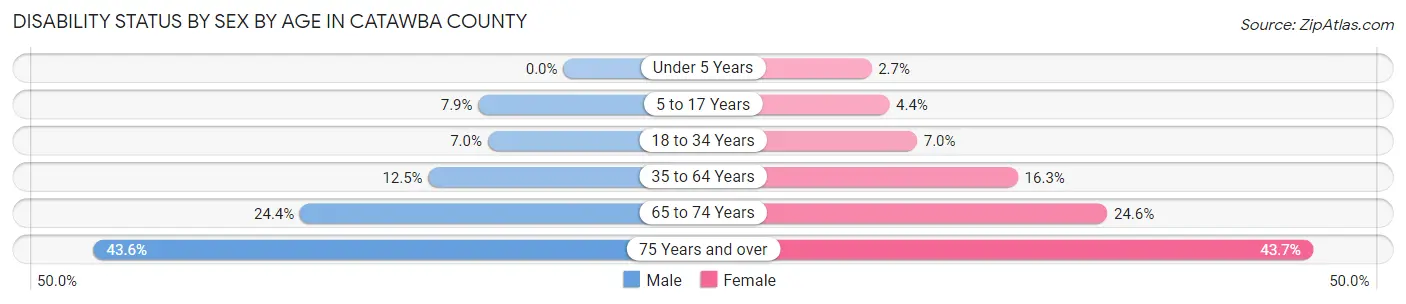
| Age Bracket | Male | Female |
| Under 5 Years | 0 (0.0%) | 117 (2.7%) |
| 5 to 17 Years | 1,063 (7.9%) | 563 (4.4%) |
| 18 to 34 Years | 1,155 (7.0%) | 1,135 (7.0%) |
| 35 to 64 Years | 3,912 (12.5%) | 5,149 (16.3%) |
| 65 to 74 Years | 1,967 (24.4%) | 2,301 (24.6%) |
| 75 Years and over | 2,042 (43.6%) | 2,920 (43.7%) |
Disability Class by Sex by Age in Catawba County
Disability Class: Hearing Difficulty
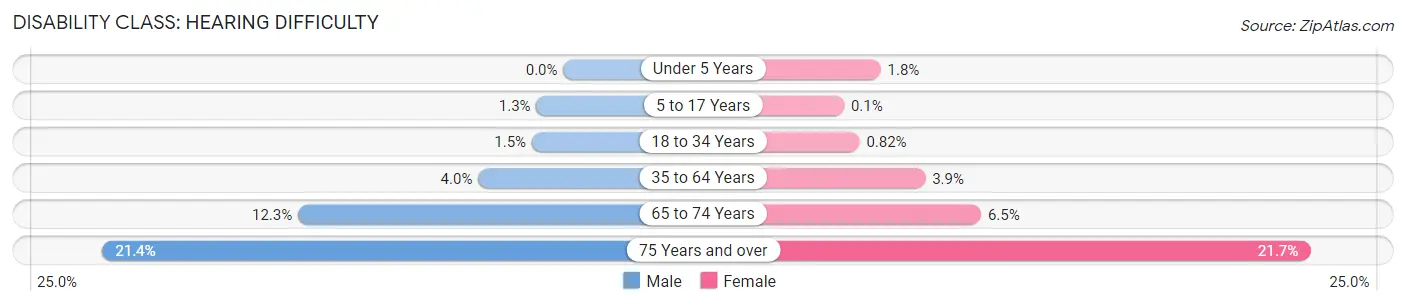
| Age Bracket | Male | Female |
| Under 5 Years | 0 (0.0%) | 77 (1.8%) |
| 5 to 17 Years | 168 (1.3%) | 13 (0.1%) |
| 18 to 34 Years | 241 (1.5%) | 134 (0.8%) |
| 35 to 64 Years | 1,233 (4.0%) | 1,220 (3.9%) |
| 65 to 74 Years | 991 (12.3%) | 604 (6.5%) |
| 75 Years and over | 1,002 (21.4%) | 1,452 (21.7%) |
Disability Class: Vision Difficulty
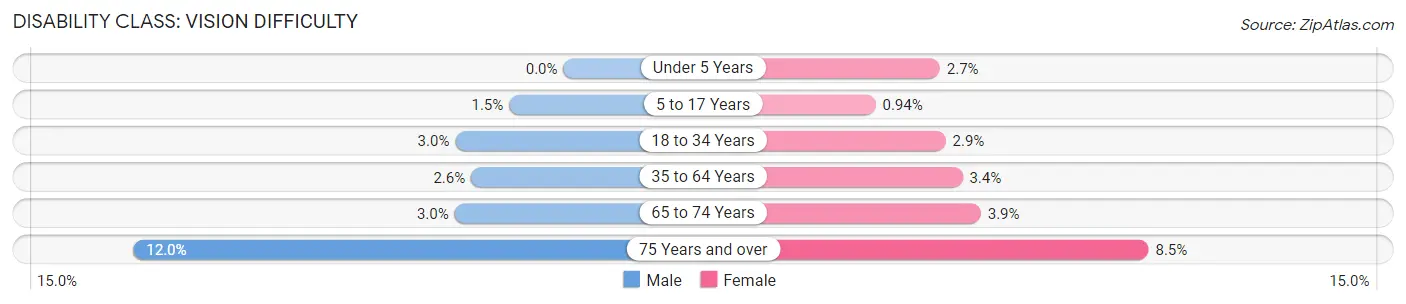
| Age Bracket | Male | Female |
| Under 5 Years | 0 (0.0%) | 117 (2.7%) |
| 5 to 17 Years | 204 (1.5%) | 121 (0.9%) |
| 18 to 34 Years | 497 (3.0%) | 471 (2.9%) |
| 35 to 64 Years | 803 (2.6%) | 1,061 (3.4%) |
| 65 to 74 Years | 244 (3.0%) | 362 (3.9%) |
| 75 Years and over | 561 (12.0%) | 571 (8.5%) |
Disability Class: Cognitive Difficulty
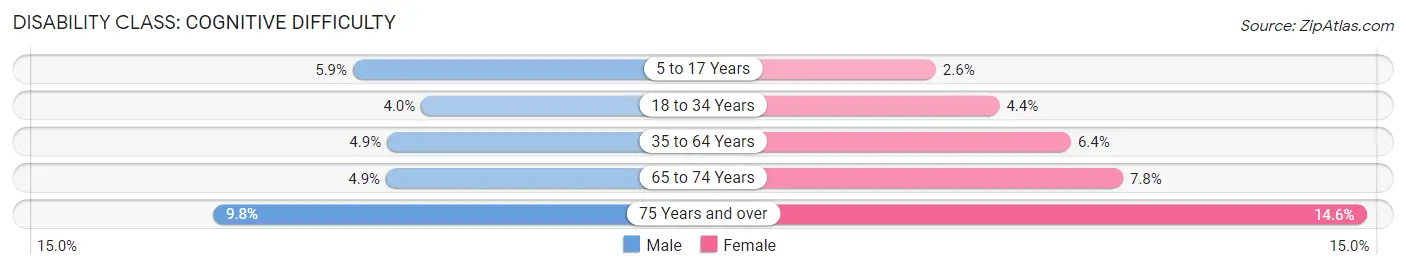
| Age Bracket | Male | Female |
| 5 to 17 Years | 789 (5.9%) | 336 (2.6%) |
| 18 to 34 Years | 653 (4.0%) | 716 (4.4%) |
| 35 to 64 Years | 1,536 (4.9%) | 2,014 (6.4%) |
| 65 to 74 Years | 398 (4.9%) | 732 (7.8%) |
| 75 Years and over | 457 (9.8%) | 976 (14.6%) |
Disability Class: Ambulatory Difficulty
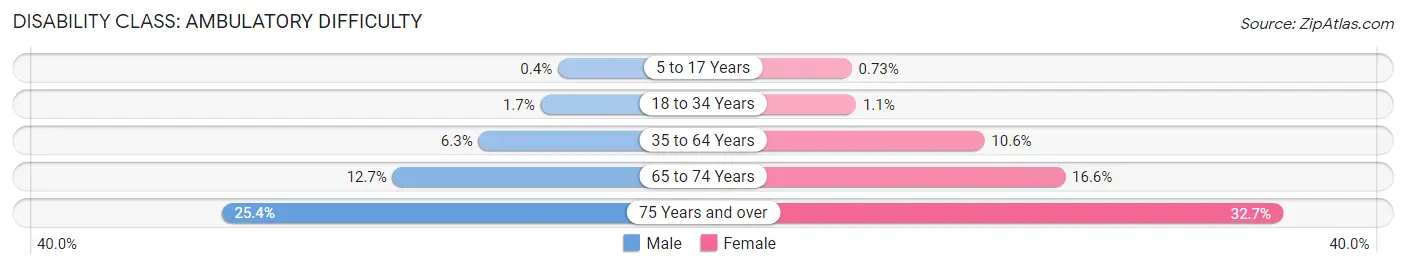
| Age Bracket | Male | Female |
| 5 to 17 Years | 54 (0.4%) | 94 (0.7%) |
| 18 to 34 Years | 279 (1.7%) | 172 (1.1%) |
| 35 to 64 Years | 1,970 (6.3%) | 3,340 (10.6%) |
| 65 to 74 Years | 1,020 (12.7%) | 1,550 (16.6%) |
| 75 Years and over | 1,189 (25.4%) | 2,188 (32.7%) |
Disability Class: Self-Care Difficulty
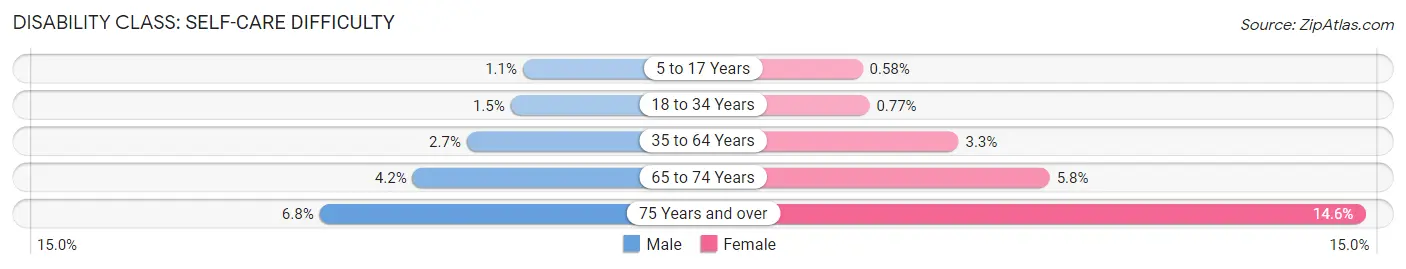
| Age Bracket | Male | Female |
| 5 to 17 Years | 152 (1.1%) | 75 (0.6%) |
| 18 to 34 Years | 242 (1.5%) | 126 (0.8%) |
| 35 to 64 Years | 840 (2.7%) | 1,024 (3.3%) |
| 65 to 74 Years | 338 (4.2%) | 541 (5.8%) |
| 75 Years and over | 318 (6.8%) | 974 (14.6%) |
Technology Access in Catawba County
Computing Device Access in Catawba County
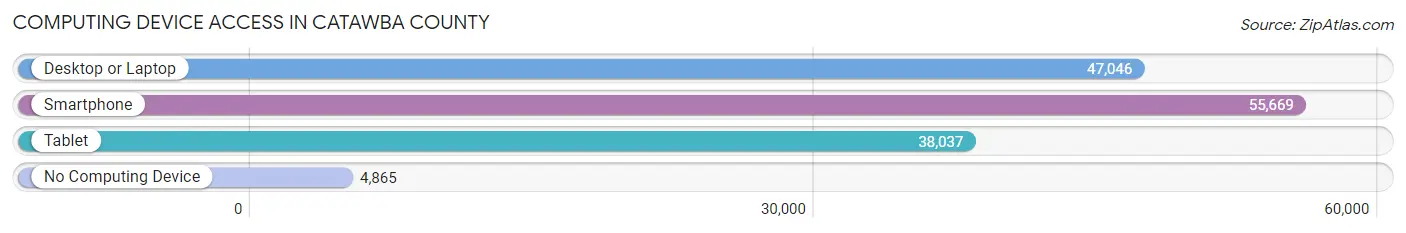
| Device Type | # Households | % Households |
| Desktop or Laptop | 47,046 | 73.0% |
| Smartphone | 55,669 | 86.4% |
| Tablet | 38,037 | 59.0% |
| No Computing Device | 4,865 | 7.5% |
| Total | 64,442 | 100.0% |
Internet Access in Catawba County
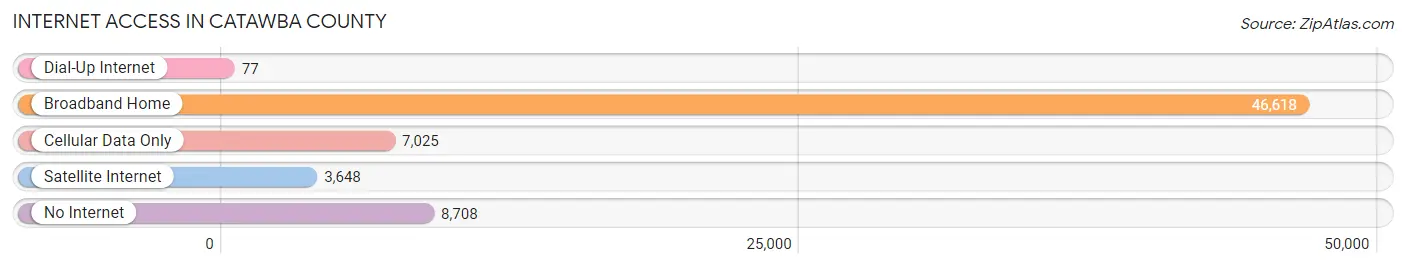
| Internet Type | # Households | % Households |
| Dial-Up Internet | 77 | 0.1% |
| Broadband Home | 46,618 | 72.3% |
| Cellular Data Only | 7,025 | 10.9% |
| Satellite Internet | 3,648 | 5.7% |
| No Internet | 8,708 | 13.5% |
| Total | 64,442 | 100.0% |
Catawba County Summary
Catawba County is located in the western part of North Carolina, in the foothills of the Blue Ridge Mountains. It is bordered by Burke, Caldwell, Alexander, Iredell, and Lincoln counties. The county seat is Newton, and the largest city is Hickory. The county was formed in 1842 from parts of Lincoln and Burke counties and was named for the Catawba River, which flows through the county.
History
The Catawba County area was originally inhabited by the Catawba Indians, who were part of the Siouan-speaking tribes. The Catawba were known for their pottery and were skilled farmers. The Catawba were forced to cede their land to the United States in the Treaty of Fort Jackson in 1817.
The first European settlers in the area were German and Scots-Irish immigrants who arrived in the late 1700s. The first county seat was established in 1842 in Newton, and the county was officially organized in 1843.
The county experienced rapid growth in the late 1800s and early 1900s due to the development of the textile industry. The Hickory Manufacturing Company was established in 1891 and was the first large-scale textile mill in the county. The company was later renamed the Hickory Hosiery Mills and was the largest employer in the county for many years.
Geography
Catawba County covers an area of 517 square miles and is located in the foothills of the Blue Ridge Mountains. The Catawba River flows through the county, and Lake Hickory is located in the northern part of the county. The terrain is mostly hilly, with some flat areas in the northern and eastern parts of the county.
The county is home to several state parks, including Lake Norman State Park, Lake James State Park, and South Mountains State Park. The county also has several recreational areas, including the Catawba River Greenway and the Catawba River Trail.
Economy
Catawba County’s economy is largely based on manufacturing, with the textile industry being the largest employer. Other major industries include furniture manufacturing, food processing, and plastics manufacturing. The county is also home to several large companies, including Corning, Inc., which has a large manufacturing facility in Hickory.
The county’s unemployment rate was 4.2% in 2019, which is lower than the state average of 4.5%. The median household income in the county was $50,845 in 2019, which is slightly higher than the state average of $50,584.
Demographics
As of 2019, Catawba County had a population of 159,945, making it the 15th most populous county in North Carolina. The population is mostly white (87.3%), with small percentages of African American (7.2%), Hispanic (3.2%), and Asian (1.3%) residents.
The median age in the county is 41.3, which is slightly higher than the state average of 38.7. The largest age group is 45-54 (20.2%), followed by 35-44 (19.2%) and 25-34 (17.2%).
The county’s poverty rate is 13.2%, which is slightly higher than the state average of 11.7%. The largest industries in the county are manufacturing (17.2%), health care and social assistance (13.2%), and retail trade (11.2%).
Common Questions
What is the Total Population of Catawba County?
Total Population of Catawba County is 161,011.
What is the Total Male Population of Catawba County?
Total Male Population of Catawba County is 79,315.
What is the Total Female Population of Catawba County?
Total Female Population of Catawba County is 81,696.
What is the Ratio of Males per 100 Females in Catawba County?
There are 97.09 Males per 100 Females in Catawba County.
What is the Ratio of Females per 100 Males in Catawba County?
There are 103.00 Females per 100 Males in Catawba County.
What is the Median Population Age in Catawba County?
Median Population Age in Catawba County is 41.5 Years.
What is the Average Family Size in Catawba County
Average Family Size in Catawba County is 3.0 People.
What is the Average Household Size in Catawba County
Average Household Size in Catawba County is 2.5 People.
What is Per Capita Income in Catawba County?
Per Capita income in Catawba County is $34,369.
What is the Median Family Income in Catawba County?
Median Family Income in Catawba County is $73,996.
What is the Median Household income in Catawba County?
Median Household Income in Catawba County is $62,070.
What is Income or Wage Gap in Catawba County?
Income or Wage Gap in Catawba County is 25.7%.
Women in Catawba County earn 74.3 cents for every dollar earned by a man.
What is Family Income Deficit in Catawba County?
Family Income Deficit in Catawba County is $11,180.
Families that are below poverty line in Catawba County earn $11,180 less on average than the poverty threshold level.
What is Inequality or Gini Index in Catawba County?
Inequality or Gini Index in Catawba County is 0.47.
How Large is the Labor Force in Catawba County?
There are 80,033 People in the Labor Forcein in Catawba County.
What is the Percentage of People in the Labor Force in Catawba County?
61.3% of People are in the Labor Force in Catawba County.
What is the Unemployment Rate in Catawba County?
Unemployment Rate in Catawba County is 5.1%.