Carteret County, NC
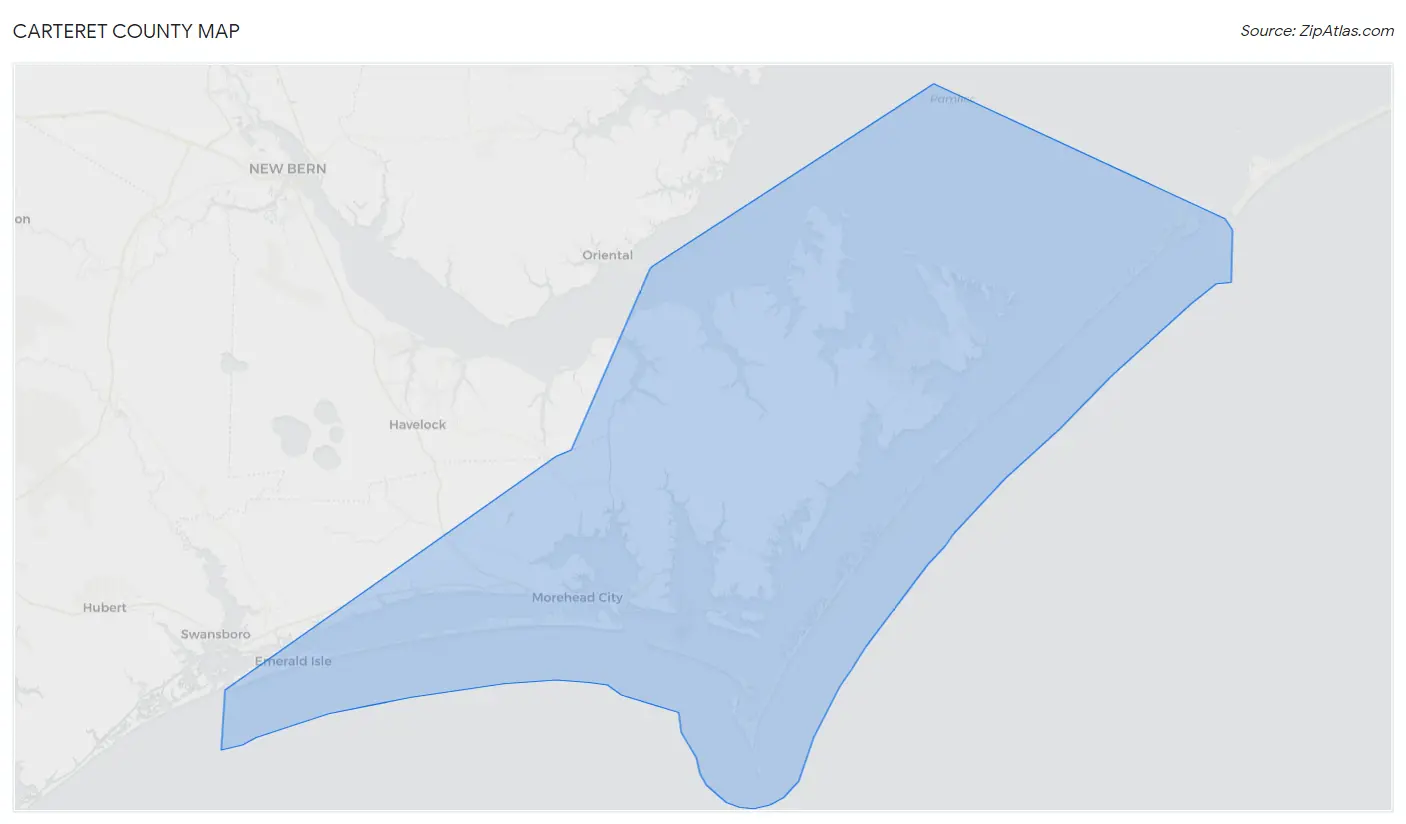
Carteret County Map
Carteret County Overview
68,353
TOTAL POPULATION
33,661
MALE POPULATION
34,692
FEMALE POPULATION
97.03
MALES / 100 FEMALES
103.06
FEMALES / 100 MALES
49.9
MEDIAN AGE
2.7
AVG FAMILY SIZE
2.2
AVG HOUSEHOLD SIZE
$39,817
PER CAPITA INCOME
$86,312
AVG FAMILY INCOME
$66,965
AVG HOUSEHOLD INCOME
29.5%
WAGE / INCOME GAP [ % ]
70.5¢/ $1
WAGE / INCOME GAP [ $ ]
$8,857
FAMILY INCOME DEFICIT
0.45
INEQUALITY / GINI INDEX
32,266
LABOR FORCE [ PEOPLE ]
55.4%
PERCENT IN LABOR FORCE
4.9%
UNEMPLOYMENT RATE
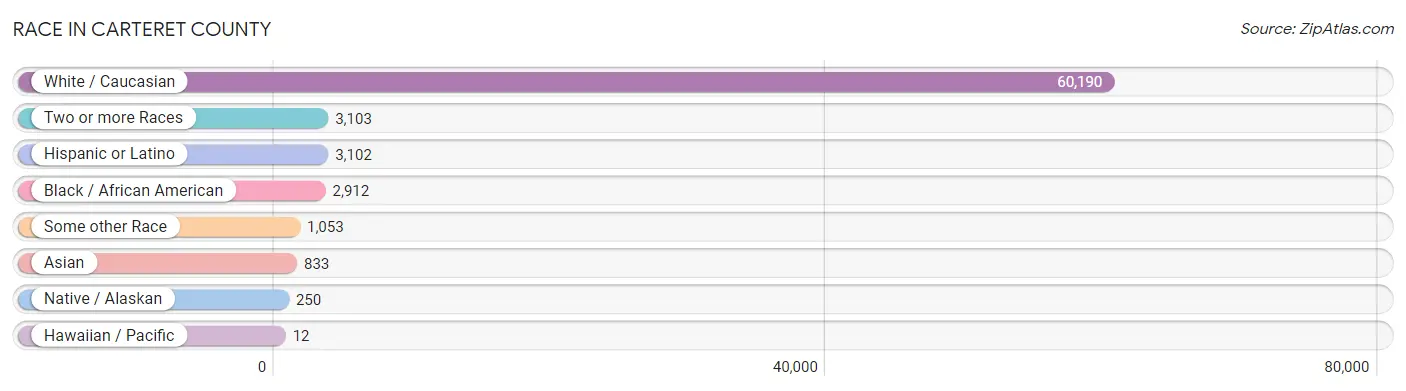
Race in Carteret County
The most populous races in Carteret County are White / Caucasian (60,190 | 88.1%), Two or more Races (3,103 | 4.5%), and Hispanic or Latino (3,102 | 4.5%).
| Race | # Population | % Population |
| Asian | 833 | 1.2% |
| Black / African American | 2,912 | 4.3% |
| Hawaiian / Pacific | 12 | 0.0% |
| Hispanic or Latino | 3,102 | 4.5% |
| Native / Alaskan | 250 | 0.4% |
| White / Caucasian | 60,190 | 88.1% |
| Two or more Races | 3,103 | 4.5% |
| Some other Race | 1,053 | 1.5% |
| Total | 68,353 | 100.0% |
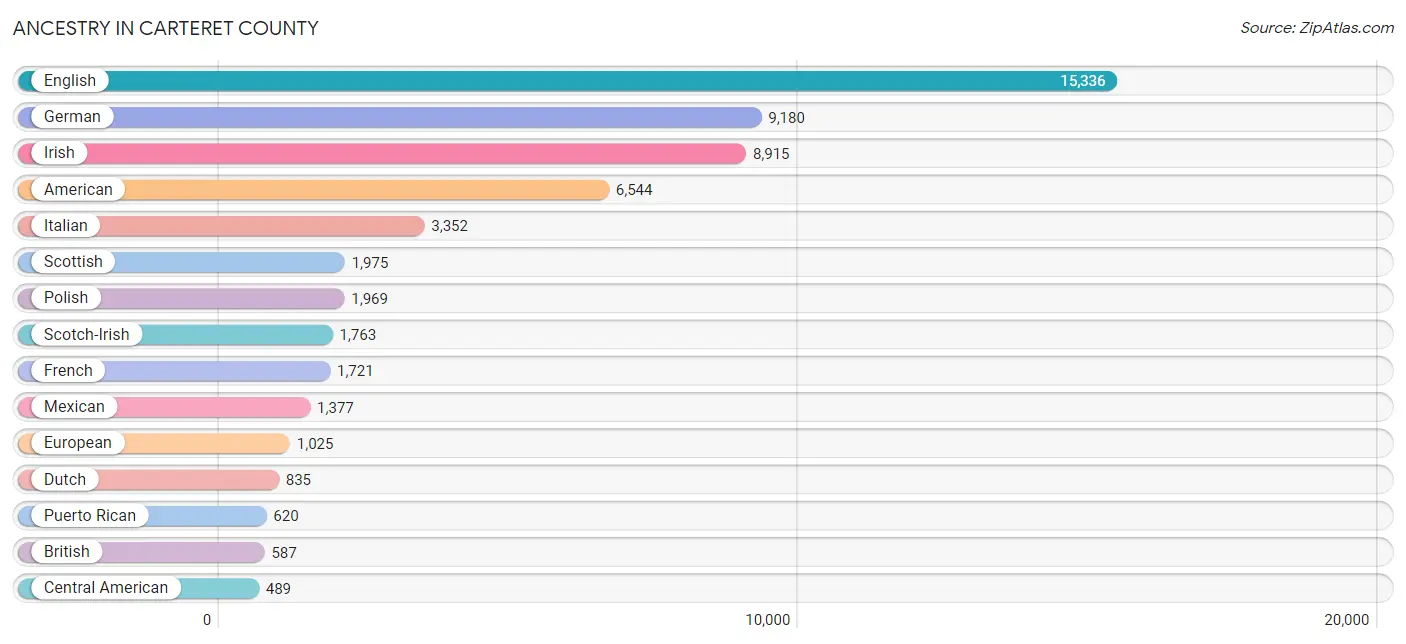
Ancestry in Carteret County
The most populous ancestries reported in Carteret County are English (15,336 | 22.4%), German (9,180 | 13.4%), Irish (8,915 | 13.0%), American (6,544 | 9.6%), and Italian (3,352 | 4.9%), together accounting for 63.4% of all Carteret County residents.
| Ancestry | # Population | % Population |
| African | 165 | 0.2% |
| Albanian | 2 | 0.0% |
| American | 6,544 | 9.6% |
| Apache | 29 | 0.0% |
| Arab | 106 | 0.2% |
| Argentinean | 162 | 0.2% |
| Armenian | 36 | 0.1% |
| Australian | 49 | 0.1% |
| Austrian | 115 | 0.2% |
| Basque | 6 | 0.0% |
| Belgian | 28 | 0.0% |
| Belizean | 6 | 0.0% |
| Bhutanese | 136 | 0.2% |
| Blackfeet | 25 | 0.0% |
| Brazilian | 45 | 0.1% |
| British | 587 | 0.9% |
| Burmese | 17 | 0.0% |
| Cajun | 13 | 0.0% |
| Canadian | 109 | 0.2% |
| Celtic | 35 | 0.1% |
| Central American | 489 | 0.7% |
| Central American Indian | 6 | 0.0% |
| Cherokee | 392 | 0.6% |
| Chilean | 5 | 0.0% |
| Chippewa | 6 | 0.0% |
| Choctaw | 15 | 0.0% |
| Colombian | 41 | 0.1% |
| Costa Rican | 33 | 0.1% |
| Croatian | 33 | 0.1% |
| Cuban | 132 | 0.2% |
| Czech | 182 | 0.3% |
| Czechoslovakian | 9 | 0.0% |
| Danish | 101 | 0.2% |
| Delaware | 4 | 0.0% |
| Dutch | 835 | 1.2% |
| Eastern European | 237 | 0.4% |
| Ecuadorian | 10 | 0.0% |
| Egyptian | 8 | 0.0% |
| English | 15,336 | 22.4% |
| European | 1,025 | 1.5% |
| Filipino | 9 | 0.0% |
| Finnish | 77 | 0.1% |
| French | 1,721 | 2.5% |
| French Canadian | 299 | 0.4% |
| German | 9,180 | 13.4% |
| Greek | 143 | 0.2% |
| Guamanian / Chamorro | 97 | 0.1% |
| Guatemalan | 128 | 0.2% |
| Guyanese | 10 | 0.0% |
| Haitian | 35 | 0.1% |
| Honduran | 182 | 0.3% |
| Hungarian | 207 | 0.3% |
| Icelander | 5 | 0.0% |
| Indian (Asian) | 131 | 0.2% |
| Indonesian | 54 | 0.1% |
| Iranian | 16 | 0.0% |
| Irish | 8,915 | 13.0% |
| Italian | 3,352 | 4.9% |
| Jamaican | 28 | 0.0% |
| Korean | 322 | 0.5% |
| Latvian | 10 | 0.0% |
| Lebanese | 62 | 0.1% |
| Lithuanian | 95 | 0.1% |
| Lumbee | 254 | 0.4% |
| Luxembourger | 74 | 0.1% |
| Maltese | 7 | 0.0% |
| Mexican | 1,377 | 2.0% |
| Mexican American Indian | 12 | 0.0% |
| Moroccan | 7 | 0.0% |
| Native Hawaiian | 24 | 0.0% |
| Navajo | 22 | 0.0% |
| Nicaraguan | 4 | 0.0% |
| Northern European | 148 | 0.2% |
| Norwegian | 488 | 0.7% |
| Pakistani | 44 | 0.1% |
| Palestinian | 6 | 0.0% |
| Panamanian | 1 | 0.0% |
| Pennsylvania German | 12 | 0.0% |
| Peruvian | 13 | 0.0% |
| Polish | 1,969 | 2.9% |
| Portuguese | 252 | 0.4% |
| Potawatomi | 6 | 0.0% |
| Puerto Rican | 620 | 0.9% |
| Romanian | 50 | 0.1% |
| Russian | 409 | 0.6% |
| Salvadoran | 141 | 0.2% |
| Samoan | 24 | 0.0% |
| Scandinavian | 231 | 0.3% |
| Scotch-Irish | 1,763 | 2.6% |
| Scottish | 1,975 | 2.9% |
| Serbian | 13 | 0.0% |
| Sioux | 6 | 0.0% |
| Slavic | 46 | 0.1% |
| Slovak | 124 | 0.2% |
| Slovene | 18 | 0.0% |
| South American | 245 | 0.4% |
| South American Indian | 10 | 0.0% |
| Spaniard | 89 | 0.1% |
| Spanish | 112 | 0.2% |
| Sri Lankan | 351 | 0.5% |
| Subsaharan African | 189 | 0.3% |
| Swedish | 379 | 0.5% |
| Swiss | 54 | 0.1% |
| Thai | 181 | 0.3% |
| Trinidadian and Tobagonian | 18 | 0.0% |
| Tsimshian | 22 | 0.0% |
| Ugandan | 14 | 0.0% |
| Ukrainian | 179 | 0.3% |
| Uruguayan | 5 | 0.0% |
| Venezuelan | 9 | 0.0% |
| Welsh | 445 | 0.6% |
| West Indian | 8 | 0.0% |
| Yugoslavian | 12 | 0.0% | View All 113 Rows |
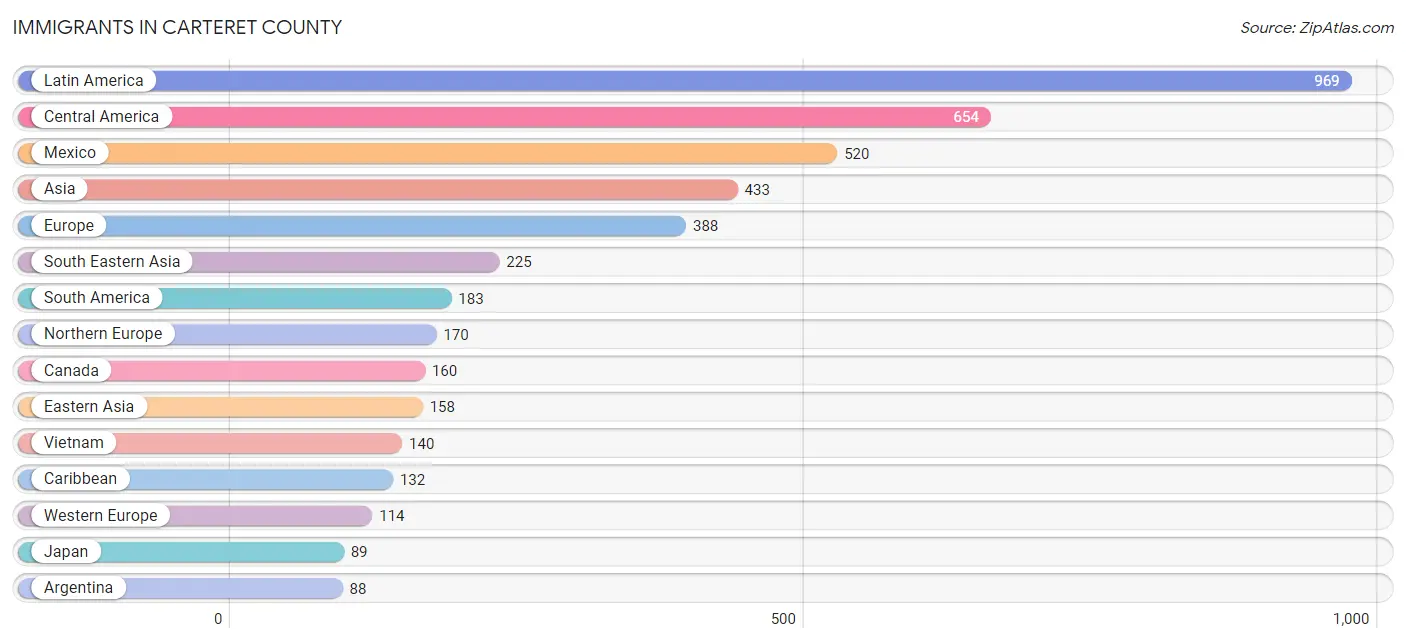
Immigrants in Carteret County
The most numerous immigrant groups reported in Carteret County came from Latin America (969 | 1.4%), Central America (654 | 1.0%), Mexico (520 | 0.8%), Asia (433 | 0.6%), and Europe (388 | 0.6%), together accounting for 4.3% of all Carteret County residents.
| Immigration Origin | # Population | % Population |
| Africa | 49 | 0.1% |
| Argentina | 88 | 0.1% |
| Asia | 433 | 0.6% |
| Australia | 44 | 0.1% |
| Azores | 5 | 0.0% |
| Bahamas | 8 | 0.0% |
| Belize | 1 | 0.0% |
| Bosnia and Herzegovina | 10 | 0.0% |
| Brazil | 26 | 0.0% |
| Canada | 160 | 0.2% |
| Caribbean | 132 | 0.2% |
| Central America | 654 | 1.0% |
| China | 66 | 0.1% |
| Cuba | 58 | 0.1% |
| Eastern Africa | 28 | 0.0% |
| Eastern Asia | 158 | 0.2% |
| Eastern Europe | 59 | 0.1% |
| Egypt | 4 | 0.0% |
| El Salvador | 42 | 0.1% |
| England | 77 | 0.1% |
| Ethiopia | 7 | 0.0% |
| Europe | 388 | 0.6% |
| Germany | 84 | 0.1% |
| Greece | 9 | 0.0% |
| Guatemala | 24 | 0.0% |
| Honduras | 36 | 0.1% |
| Hong Kong | 10 | 0.0% |
| India | 29 | 0.0% |
| Iran | 8 | 0.0% |
| Ireland | 3 | 0.0% |
| Israel | 5 | 0.0% |
| Italy | 7 | 0.0% |
| Jamaica | 27 | 0.0% |
| Japan | 89 | 0.1% |
| Korea | 3 | 0.0% |
| Laos | 8 | 0.0% |
| Latin America | 969 | 1.4% |
| Latvia | 16 | 0.0% |
| Lebanon | 8 | 0.0% |
| Mexico | 520 | 0.8% |
| Morocco | 3 | 0.0% |
| Nicaragua | 8 | 0.0% |
| Nigeria | 14 | 0.0% |
| Northern Africa | 7 | 0.0% |
| Northern Europe | 170 | 0.3% |
| Norway | 11 | 0.0% |
| Oceania | 48 | 0.1% |
| Panama | 23 | 0.0% |
| Peru | 22 | 0.0% |
| Philippines | 45 | 0.1% |
| Poland | 3 | 0.0% |
| Portugal | 13 | 0.0% |
| Romania | 4 | 0.0% |
| Russia | 24 | 0.0% |
| Scotland | 23 | 0.0% |
| South America | 183 | 0.3% |
| South Central Asia | 37 | 0.1% |
| South Eastern Asia | 225 | 0.3% |
| Southern Europe | 45 | 0.1% |
| Spain | 16 | 0.0% |
| Sweden | 2 | 0.0% |
| Thailand | 18 | 0.0% |
| Trinidad and Tobago | 39 | 0.1% |
| Uganda | 14 | 0.0% |
| Ukraine | 2 | 0.0% |
| Uruguay | 5 | 0.0% |
| Venezuela | 18 | 0.0% |
| Vietnam | 140 | 0.2% |
| Western Africa | 14 | 0.0% |
| Western Asia | 13 | 0.0% |
| Western Europe | 114 | 0.2% |
| Zimbabwe | 7 | 0.0% | View All 72 Rows |
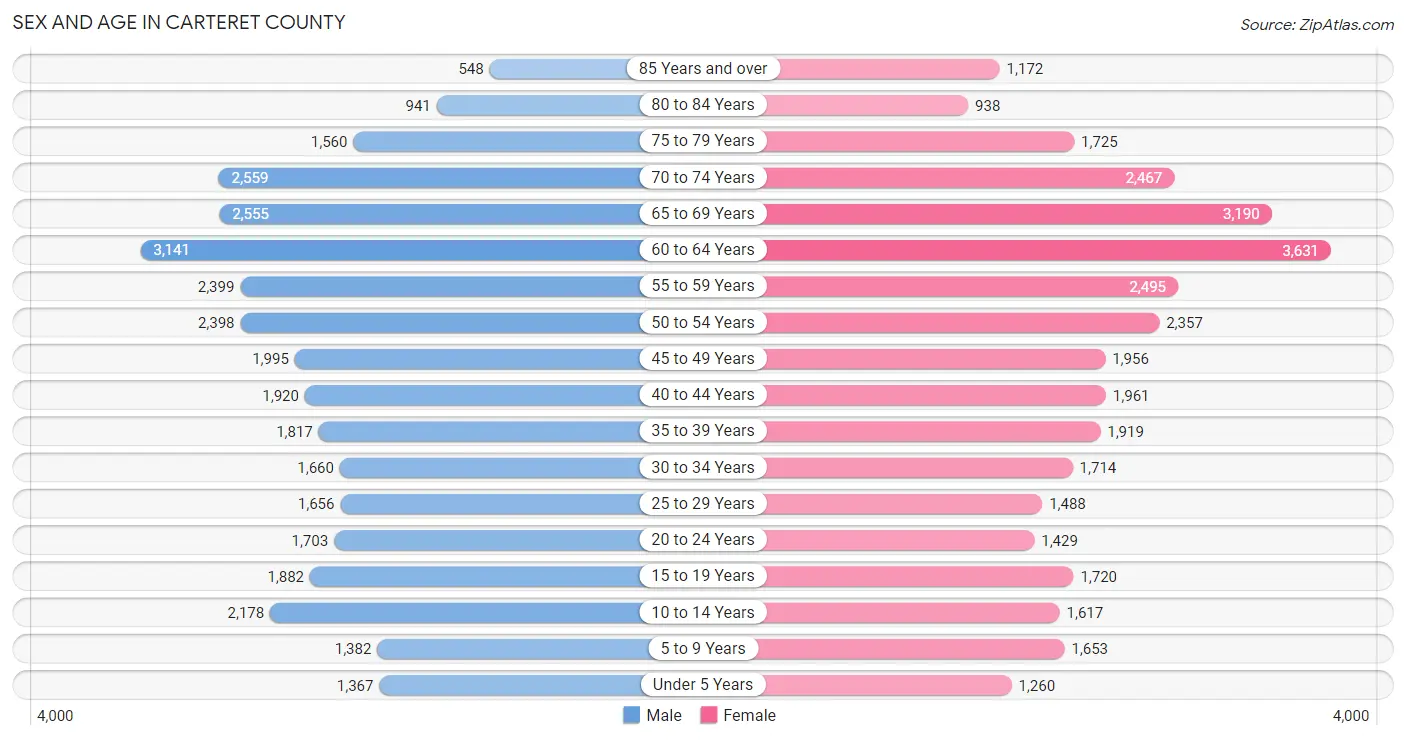
Sex and Age in Carteret County
Sex and Age in Carteret County
The most populous age groups in Carteret County are 60 to 64 Years (3,141 | 9.3%) for men and 60 to 64 Years (3,631 | 10.5%) for women.
| Age Bracket | Male | Female |
| Under 5 Years | 1,367 (4.1%) | 1,260 (3.6%) |
| 5 to 9 Years | 1,382 (4.1%) | 1,653 (4.8%) |
| 10 to 14 Years | 2,178 (6.5%) | 1,617 (4.7%) |
| 15 to 19 Years | 1,882 (5.6%) | 1,720 (5.0%) |
| 20 to 24 Years | 1,703 (5.1%) | 1,429 (4.1%) |
| 25 to 29 Years | 1,656 (4.9%) | 1,488 (4.3%) |
| 30 to 34 Years | 1,660 (4.9%) | 1,714 (4.9%) |
| 35 to 39 Years | 1,817 (5.4%) | 1,919 (5.5%) |
| 40 to 44 Years | 1,920 (5.7%) | 1,961 (5.7%) |
| 45 to 49 Years | 1,995 (5.9%) | 1,956 (5.6%) |
| 50 to 54 Years | 2,398 (7.1%) | 2,357 (6.8%) |
| 55 to 59 Years | 2,399 (7.1%) | 2,495 (7.2%) |
| 60 to 64 Years | 3,141 (9.3%) | 3,631 (10.5%) |
| 65 to 69 Years | 2,555 (7.6%) | 3,190 (9.2%) |
| 70 to 74 Years | 2,559 (7.6%) | 2,467 (7.1%) |
| 75 to 79 Years | 1,560 (4.6%) | 1,725 (5.0%) |
| 80 to 84 Years | 941 (2.8%) | 938 (2.7%) |
| 85 Years and over | 548 (1.6%) | 1,172 (3.4%) |
| Total | 33,661 (100.0%) | 34,692 (100.0%) |
Families and Households in Carteret County
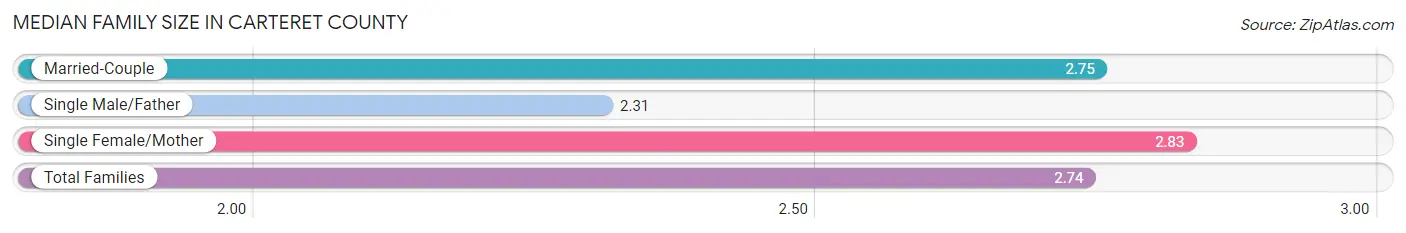
Median Family Size in Carteret County
The median family size in Carteret County is 2.74 persons per family, with single female/mother families (2,707 | 14.0%) accounting for the largest median family size of 2.83 persons per family. On the other hand, single male/father families (998 | 5.2%) represent the smallest median family size with 2.31 persons per family.
| Family Type | # Families | Family Size |
| Married-Couple | 15,651 (80.9%) | 2.75 |
| Single Male/Father | 998 (5.2%) | 2.31 |
| Single Female/Mother | 2,707 (14.0%) | 2.83 |
| Total Families | 19,356 (100.0%) | 2.74 |
Median Household Size in Carteret County
The median household size in Carteret County is 2.21 persons per household, with single female/mother households (2,707 | 8.9%) accounting for the largest median household size of 3.09 persons per household. non-family households (11,058 | 36.4%) represent the smallest median household size with 1.16 persons per household.

| Household Type | # Households | Household Size |
| Married-Couple | 15,651 (51.5%) | 2.76 |
| Single Male/Father | 998 (3.3%) | 2.76 |
| Single Female/Mother | 2,707 (8.9%) | 3.09 |
| Non-family | 11,058 (36.4%) | 1.16 |
| Total Households | 30,414 (100.0%) | 2.21 |
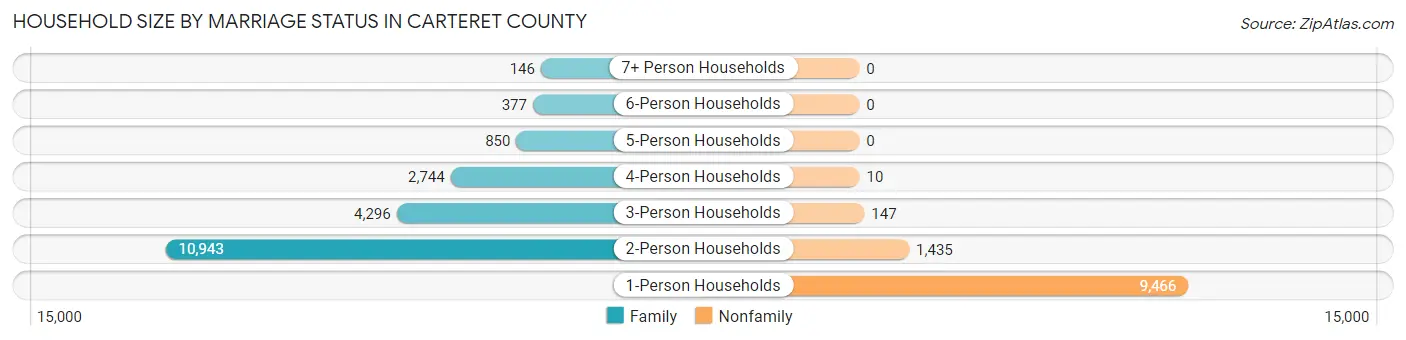
Household Size by Marriage Status in Carteret County
Out of a total of 30,414 households in Carteret County, 19,356 (63.6%) are family households, while 11,058 (36.4%) are nonfamily households. The most numerous type of family households are 2-person households, comprising 10,943, and the most common type of nonfamily households are 1-person households, comprising 9,466.
| Household Size | Family Households | Nonfamily Households |
| 1-Person Households | - | 9,466 (31.1%) |
| 2-Person Households | 10,943 (36.0%) | 1,435 (4.7%) |
| 3-Person Households | 4,296 (14.1%) | 147 (0.5%) |
| 4-Person Households | 2,744 (9.0%) | 10 (0.0%) |
| 5-Person Households | 850 (2.8%) | 0 (0.0%) |
| 6-Person Households | 377 (1.2%) | 0 (0.0%) |
| 7+ Person Households | 146 (0.5%) | 0 (0.0%) |
| Total | 19,356 (63.6%) | 11,058 (36.4%) |
Female Fertility in Carteret County
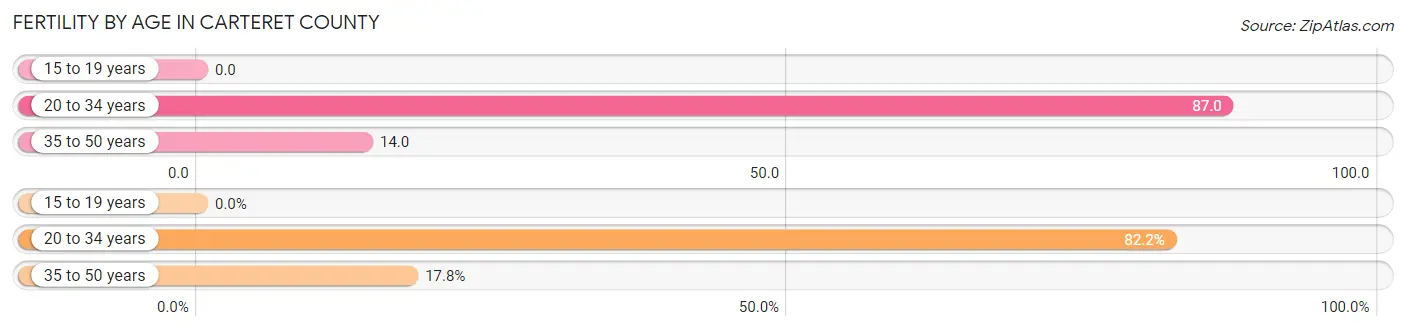
Fertility by Age in Carteret County
Average fertility rate in Carteret County is 39.0 births per 1,000 women. Women in the age bracket of 20 to 34 years have the highest fertility rate with 87.0 births per 1,000 women. Women in the age bracket of 20 to 34 years acount for 82.2% of all women with births.
| Age Bracket | Women with Births | Births / 1,000 Women |
| 15 to 19 years | 0 (0.0%) | 0.0 |
| 20 to 34 years | 401 (82.2%) | 87.0 |
| 35 to 50 years | 87 (17.8%) | 14.0 |
| Total | 488 (100.0%) | 39.0 |
Fertility by Age by Marriage Status in Carteret County
70.3% of women with births (488) in Carteret County are married. The highest percentage of unmarried women with births falls into 20 to 34 years age bracket with 30.9% of them unmarried at the time of birth, while the lowest percentage of unmarried women with births belong to 35 to 50 years age bracket with 24.1% of them unmarried.
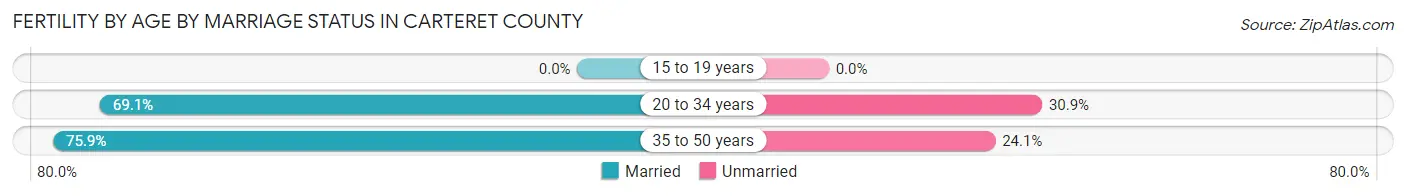
| Age Bracket | Married | Unmarried |
| 15 to 19 years | 0 (0.0%) | 0 (0.0%) |
| 20 to 34 years | 277 (69.1%) | 124 (30.9%) |
| 35 to 50 years | 66 (75.9%) | 21 (24.1%) |
| Total | 343 (70.3%) | 145 (29.7%) |
Fertility by Education in Carteret County
Average fertility rate in Carteret County is 39.0 births per 1,000 women. Women with the education attainment of college or associate's degree have the highest fertility rate of 59.0 births per 1,000 women, while women with the education attainment of bachelor's degree have the lowest fertility at 15.0 births per 1,000 women. Women with the education attainment of college or associate's degree represent 55.1% of all women with births.
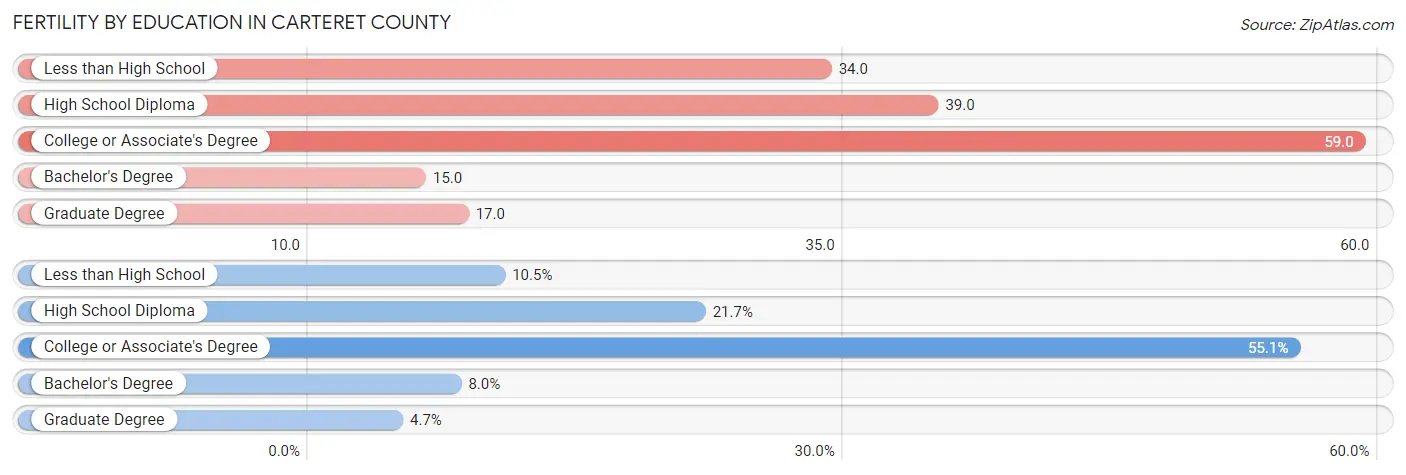
| Educational Attainment | Women with Births | Births / 1,000 Women |
| Less than High School | 51 (10.4%) | 34.0 |
| High School Diploma | 106 (21.7%) | 39.0 |
| College or Associate's Degree | 269 (55.1%) | 59.0 |
| Bachelor's Degree | 39 (8.0%) | 15.0 |
| Graduate Degree | 23 (4.7%) | 17.0 |
| Total | 488 (100.0%) | 39.0 |
Fertility by Education by Marriage Status in Carteret County
29.7% of women with births in Carteret County are unmarried. Women with the educational attainment of bachelor's degree are most likely to be married with 100.0% of them married at childbirth, while women with the educational attainment of less than high school are least likely to be married with 56.9% of them unmarried at childbirth.
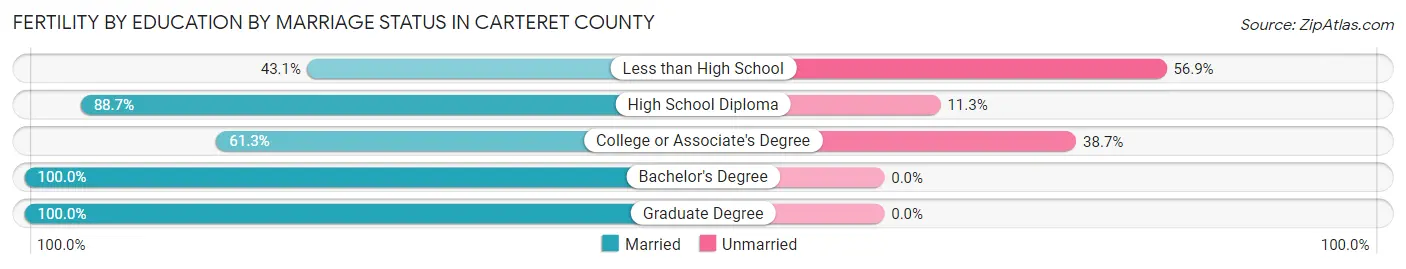
| Educational Attainment | Married | Unmarried |
| Less than High School | 22 (43.1%) | 29 (56.9%) |
| High School Diploma | 94 (88.7%) | 12 (11.3%) |
| College or Associate's Degree | 165 (61.3%) | 104 (38.7%) |
| Bachelor's Degree | 39 (100.0%) | 0 (0.0%) |
| Graduate Degree | 23 (100.0%) | 0 (0.0%) |
| Total | 343 (70.3%) | 145 (29.7%) |
Income in Carteret County
Income Overview in Carteret County
Per Capita Income in Carteret County is $39,817, while median incomes of families and households are $86,312 and $66,965 respectively.
| Characteristic | Number | Measure |
| Per Capita Income | 68,353 | $39,817 |
| Median Family Income | 19,356 | $86,312 |
| Mean Family Income | 19,356 | $108,015 |
| Median Household Income | 30,414 | $66,965 |
| Mean Household Income | 30,414 | $87,752 |
| Income Deficit | 19,356 | $8,857 |
| Wage / Income Gap (%) | 68,353 | 29.52% |
| Wage / Income Gap ($) | 68,353 | 70.48¢ per $1 |
| Gini / Inequality Index | 68,353 | 0.45 |
Earnings by Sex in Carteret County
Average Earnings in Carteret County are $35,949, $42,601 for men and $30,025 for women, a difference of 29.5%.
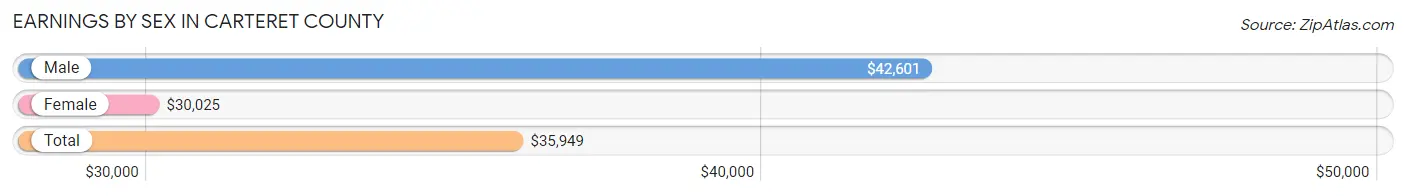
| Sex | Number | Average Earnings |
| Male | 17,953 (52.3%) | $42,601 |
| Female | 16,353 (47.7%) | $30,025 |
| Total | 34,306 (100.0%) | $35,949 |
Earnings by Sex by Income Bracket in Carteret County
The most common earnings brackets in Carteret County are $100,000+ for men (2,895 | 16.1%) and $25,000 to $29,999 for women (1,171 | 7.2%).
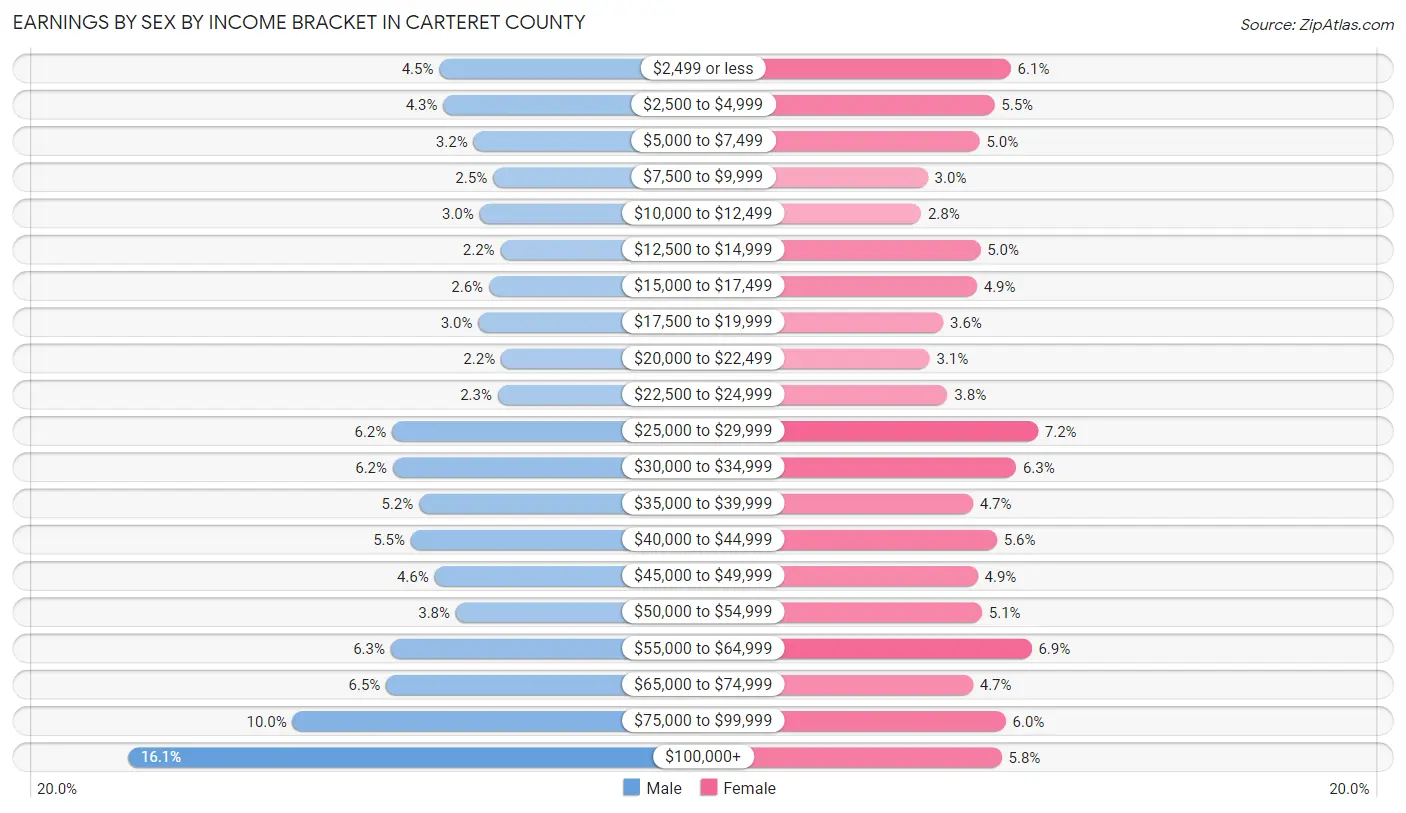
| Income | Male | Female |
| $2,499 or less | 800 (4.5%) | 1,004 (6.1%) |
| $2,500 to $4,999 | 773 (4.3%) | 905 (5.5%) |
| $5,000 to $7,499 | 571 (3.2%) | 813 (5.0%) |
| $7,500 to $9,999 | 439 (2.5%) | 496 (3.0%) |
| $10,000 to $12,499 | 530 (2.9%) | 455 (2.8%) |
| $12,500 to $14,999 | 389 (2.2%) | 817 (5.0%) |
| $15,000 to $17,499 | 466 (2.6%) | 797 (4.9%) |
| $17,500 to $19,999 | 539 (3.0%) | 591 (3.6%) |
| $20,000 to $22,499 | 386 (2.1%) | 507 (3.1%) |
| $22,500 to $24,999 | 408 (2.3%) | 616 (3.8%) |
| $25,000 to $29,999 | 1,118 (6.2%) | 1,171 (7.2%) |
| $30,000 to $34,999 | 1,113 (6.2%) | 1,036 (6.3%) |
| $35,000 to $39,999 | 938 (5.2%) | 772 (4.7%) |
| $40,000 to $44,999 | 992 (5.5%) | 919 (5.6%) |
| $45,000 to $49,999 | 833 (4.6%) | 801 (4.9%) |
| $50,000 to $54,999 | 690 (3.8%) | 828 (5.1%) |
| $55,000 to $64,999 | 1,127 (6.3%) | 1,131 (6.9%) |
| $65,000 to $74,999 | 1,158 (6.5%) | 772 (4.7%) |
| $75,000 to $99,999 | 1,788 (10.0%) | 973 (5.9%) |
| $100,000+ | 2,895 (16.1%) | 949 (5.8%) |
| Total | 17,953 (100.0%) | 16,353 (100.0%) |
Earnings by Sex by Educational Attainment in Carteret County
Average earnings in Carteret County are $48,473 for men and $33,987 for women, a difference of 29.9%. Men with an educational attainment of graduate degree enjoy the highest average annual earnings of $97,750, while those with less than high school education earn the least with $34,080. Women with an educational attainment of graduate degree earn the most with the average annual earnings of $56,654, while those with less than high school education have the smallest earnings of $22,778.
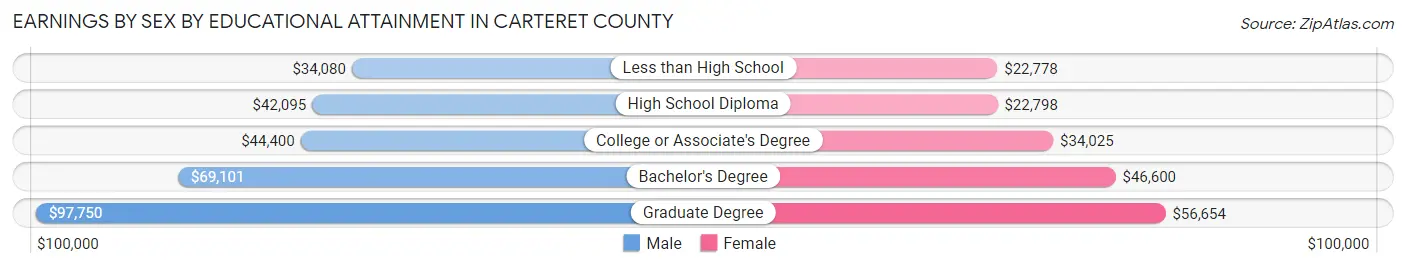
| Educational Attainment | Male Income | Female Income |
| Less than High School | $34,080 | $22,778 |
| High School Diploma | $42,095 | $22,798 |
| College or Associate's Degree | $44,400 | $34,025 |
| Bachelor's Degree | $69,101 | $46,600 |
| Graduate Degree | $97,750 | $56,654 |
| Total | $48,473 | $33,987 |
Family Income in Carteret County
Family Income Brackets in Carteret County
According to the Carteret County family income data, there are 4,084 families falling into the $100,000 to $149,999 income range, which is the most common income bracket and makes up 21.1% of all families. Conversely, the $10,000 to $14,999 income bracket is the least frequent group with only 271 families (1.4%) belonging to this category.
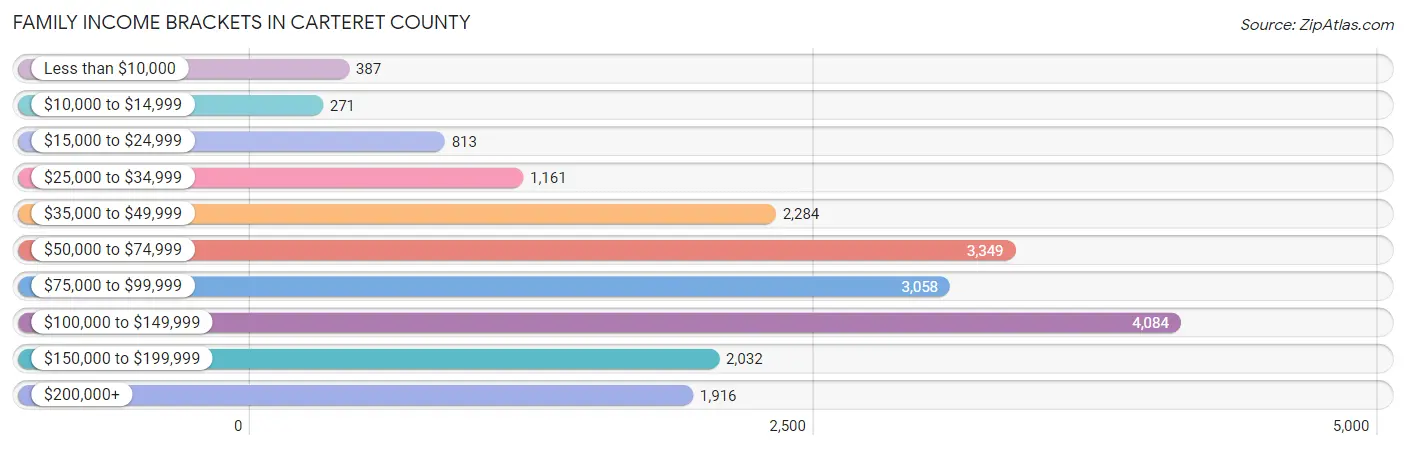
| Income Bracket | # Families | % Families |
| Less than $10,000 | 387 | 2.0% |
| $10,000 to $14,999 | 271 | 1.4% |
| $15,000 to $24,999 | 813 | 4.2% |
| $25,000 to $34,999 | 1,161 | 6.0% |
| $35,000 to $49,999 | 2,284 | 11.8% |
| $50,000 to $74,999 | 3,349 | 17.3% |
| $75,000 to $99,999 | 3,058 | 15.8% |
| $100,000 to $149,999 | 4,084 | 21.1% |
| $150,000 to $199,999 | 2,032 | 10.5% |
| $200,000+ | 1,916 | 9.9% |
Family Income by Famaliy Size in Carteret County
4-person families (2,398 | 12.4%) account for the highest median family income in Carteret County with $117,902 per family, while 2-person families (11,507 | 59.5%) have the highest median income of $41,424 per family member.
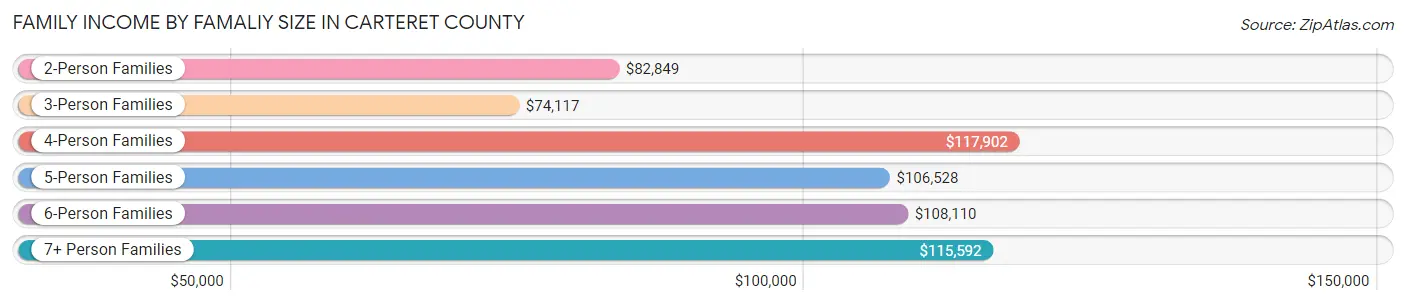
| Income Bracket | # Families | Median Income |
| 2-Person Families | 11,507 (59.5%) | $82,849 |
| 3-Person Families | 4,257 (22.0%) | $74,117 |
| 4-Person Families | 2,398 (12.4%) | $117,902 |
| 5-Person Families | 752 (3.9%) | $106,528 |
| 6-Person Families | 301 (1.6%) | $108,110 |
| 7+ Person Families | 141 (0.7%) | $115,592 |
| Total | 19,356 (100.0%) | $86,312 |
Family Income by Number of Earners in Carteret County
The median family income in Carteret County is $86,312, with families comprising 3+ earners (1,675) having the highest median family income of $125,764, while families with no earners (4,589) have the lowest median family income of $65,274, accounting for 8.6% and 23.7% of families, respectively.
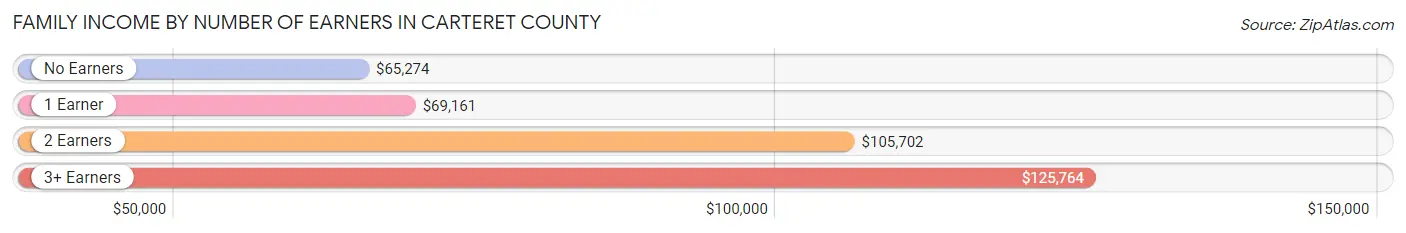
| Number of Earners | # Families | Median Income |
| No Earners | 4,589 (23.7%) | $65,274 |
| 1 Earner | 6,030 (31.1%) | $69,161 |
| 2 Earners | 7,062 (36.5%) | $105,702 |
| 3+ Earners | 1,675 (8.6%) | $125,764 |
| Total | 19,356 (100.0%) | $86,312 |
Household Income in Carteret County
Household Income Brackets in Carteret County
With 5,292 households falling in the category, the $50,000 to $74,999 income range is the most frequent in Carteret County, accounting for 17.4% of all households. In contrast, only 1,156 households (3.8%) fall into the $10,000 to $14,999 income bracket, making it the least populous group.

| Income Bracket | # Households | % Households |
| Less than $10,000 | 1,429 | 4.7% |
| $10,000 to $14,999 | 1,156 | 3.8% |
| $15,000 to $24,999 | 2,616 | 8.6% |
| $25,000 to $34,999 | 2,676 | 8.8% |
| $35,000 to $49,999 | 3,863 | 12.7% |
| $50,000 to $74,999 | 5,292 | 17.4% |
| $75,000 to $99,999 | 4,045 | 13.3% |
| $100,000 to $149,999 | 4,866 | 16.0% |
| $150,000 to $199,999 | 2,403 | 7.9% |
| $200,000+ | 2,068 | 6.8% |
Household Income by Householder Age in Carteret County
The median household income in Carteret County is $66,965, with the highest median household income of $79,631 found in the 25 to 44 years age bracket for the primary householder. A total of 6,838 households (22.5%) fall into this category. Meanwhile, the 15 to 24 years age bracket for the primary householder has the lowest median household income of $37,368, with 808 households (2.7%) in this group.
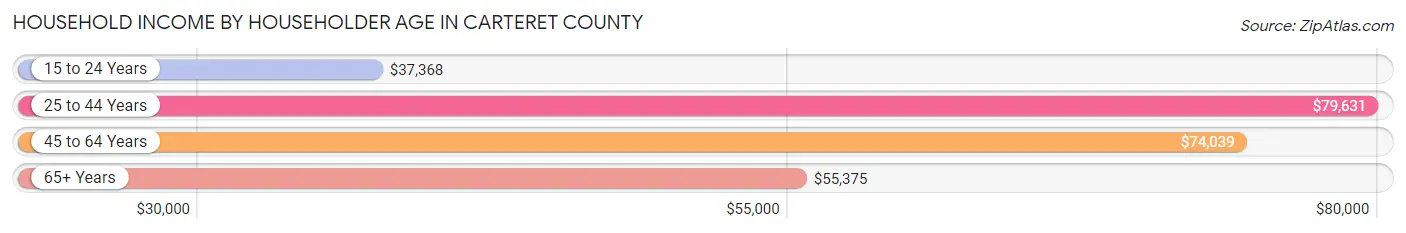
| Income Bracket | # Households | Median Income |
| 15 to 24 Years | 808 (2.7%) | $37,368 |
| 25 to 44 Years | 6,838 (22.5%) | $79,631 |
| 45 to 64 Years | 11,437 (37.6%) | $74,039 |
| 65+ Years | 11,331 (37.3%) | $55,375 |
| Total | 30,414 (100.0%) | $66,965 |
Poverty in Carteret County
Income Below Poverty by Sex and Age in Carteret County
With 7.5% poverty level for males and 11.7% for females among the residents of Carteret County, 5 year old males and 18 to 24 year old females are the most vulnerable to poverty, with 106 males (32.6%) and 440 females (22.1%) in their respective age groups living below the poverty level.
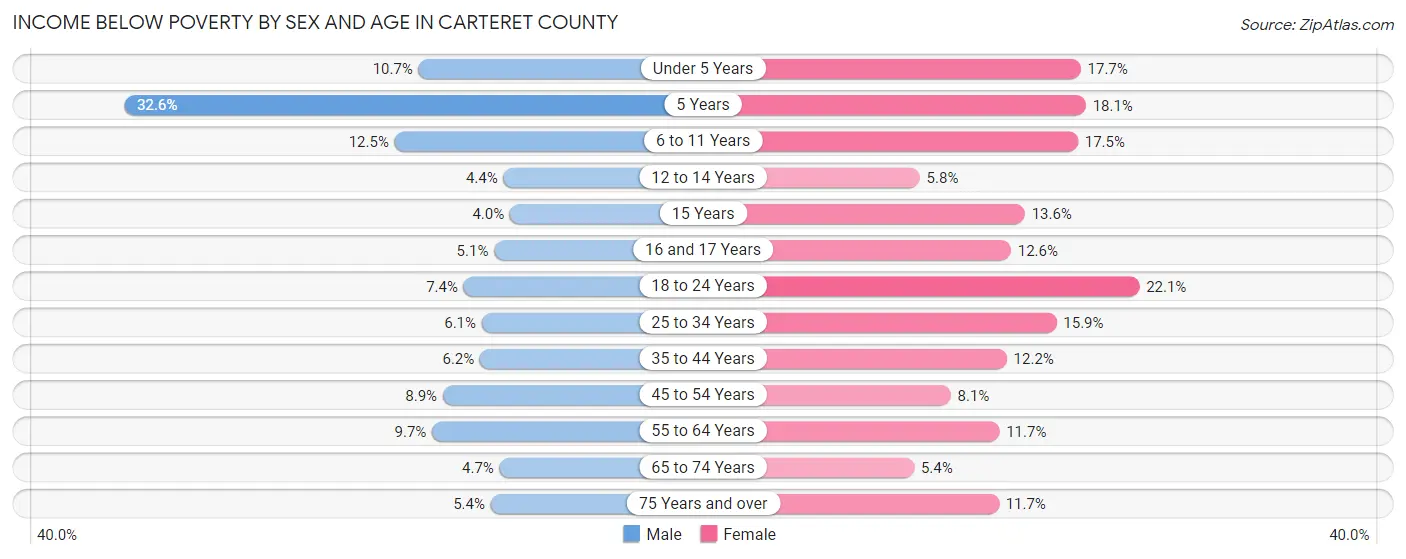
| Age Bracket | Male | Female |
| Under 5 Years | 138 (10.7%) | 222 (17.7%) |
| 5 Years | 106 (32.6%) | 44 (18.1%) |
| 6 to 11 Years | 204 (12.5%) | 347 (17.5%) |
| 12 to 14 Years | 68 (4.4%) | 58 (5.8%) |
| 15 Years | 13 (4.0%) | 44 (13.6%) |
| 16 and 17 Years | 42 (5.1%) | 95 (12.6%) |
| 18 to 24 Years | 170 (7.4%) | 440 (22.1%) |
| 25 to 34 Years | 198 (6.0%) | 508 (15.9%) |
| 35 to 44 Years | 221 (6.2%) | 471 (12.2%) |
| 45 to 54 Years | 378 (8.9%) | 348 (8.1%) |
| 55 to 64 Years | 532 (9.7%) | 713 (11.7%) |
| 65 to 74 Years | 240 (4.7%) | 302 (5.4%) |
| 75 Years and over | 163 (5.4%) | 424 (11.7%) |
| Total | 2,473 (7.5%) | 4,016 (11.7%) |
Income Above Poverty by Sex and Age in Carteret County
According to the poverty statistics in Carteret County, males aged 15 years and females aged 65 to 74 years are the age groups that are most secure financially, with 96.0% of males and 94.6% of females in these age groups living above the poverty line.
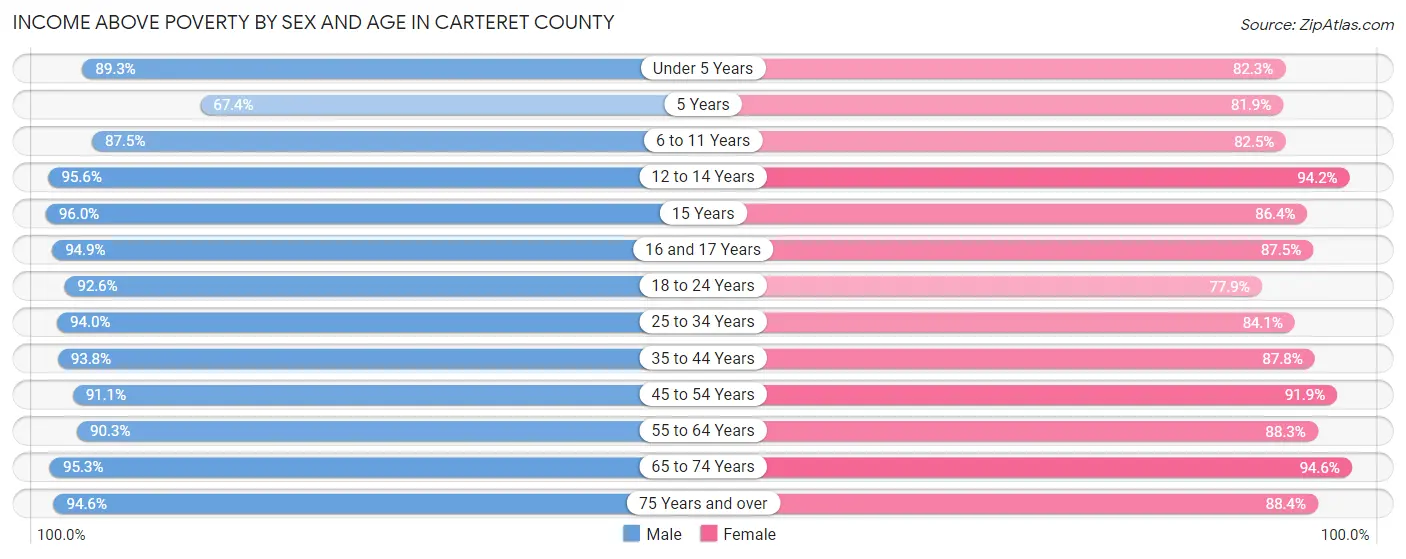
| Age Bracket | Male | Female |
| Under 5 Years | 1,147 (89.3%) | 1,030 (82.3%) |
| 5 Years | 219 (67.4%) | 199 (81.9%) |
| 6 to 11 Years | 1,426 (87.5%) | 1,634 (82.5%) |
| 12 to 14 Years | 1,464 (95.6%) | 945 (94.2%) |
| 15 Years | 315 (96.0%) | 280 (86.4%) |
| 16 and 17 Years | 777 (94.9%) | 662 (87.5%) |
| 18 to 24 Years | 2,129 (92.6%) | 1,553 (77.9%) |
| 25 to 34 Years | 3,073 (94.0%) | 2,680 (84.1%) |
| 35 to 44 Years | 3,355 (93.8%) | 3,377 (87.8%) |
| 45 to 54 Years | 3,849 (91.1%) | 3,957 (91.9%) |
| 55 to 64 Years | 4,929 (90.3%) | 5,384 (88.3%) |
| 65 to 74 Years | 4,837 (95.3%) | 5,337 (94.6%) |
| 75 Years and over | 2,860 (94.6%) | 3,215 (88.3%) |
| Total | 30,380 (92.5%) | 30,253 (88.3%) |
Income Below Poverty Among Married-Couple Families in Carteret County
The poverty statistics for married-couple families in Carteret County show that 3.9% or 616 of the total 15,651 families live below the poverty line. Families with 5 or more children have the highest poverty rate of 38.5%, comprising of 37 families. On the other hand, families with no children have the lowest poverty rate of 3.5%, which includes 381 families.
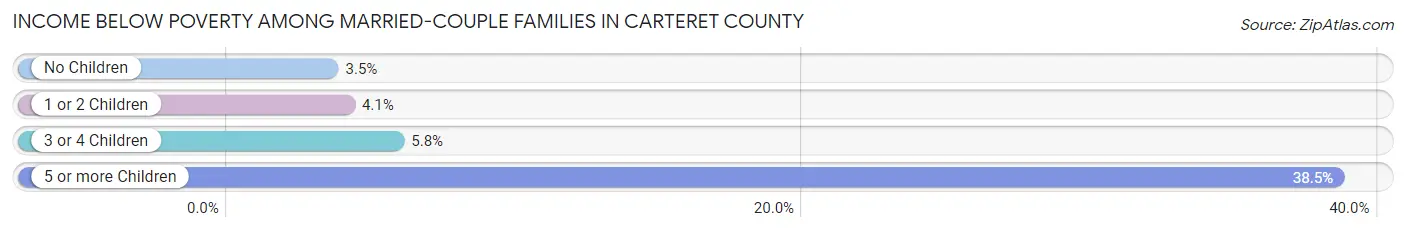
| Children | Above Poverty | Below Poverty |
| No Children | 10,513 (96.5%) | 381 (3.5%) |
| 1 or 2 Children | 4,007 (95.9%) | 170 (4.1%) |
| 3 or 4 Children | 456 (94.2%) | 28 (5.8%) |
| 5 or more Children | 59 (61.5%) | 37 (38.5%) |
| Total | 15,035 (96.1%) | 616 (3.9%) |
Income Below Poverty Among Single-Parent Households in Carteret County
According to the poverty data in Carteret County, 8.2% or 82 single-father households and 18.8% or 509 single-mother households are living below the poverty line. Among single-father households, those with 1 or 2 children have the highest poverty rate, with 64 households (12.7%) experiencing poverty. Likewise, among single-mother households, those with 3 or 4 children have the highest poverty rate, with 33 households (36.3%) falling below the poverty line.
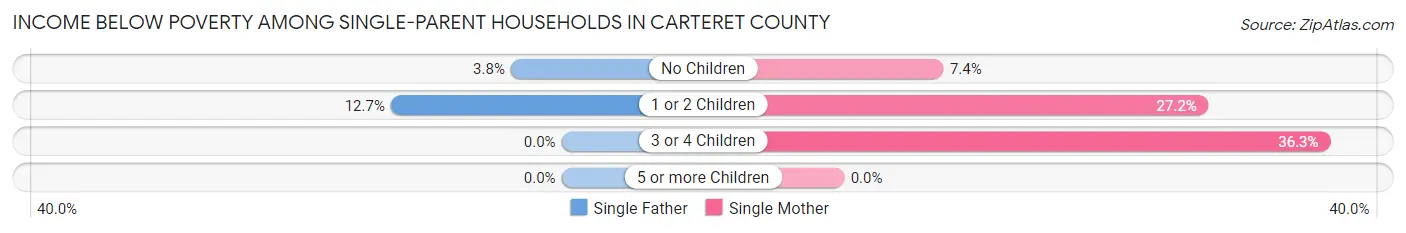
| Children | Single Father | Single Mother |
| No Children | 18 (3.8%) | 88 (7.4%) |
| 1 or 2 Children | 64 (12.7%) | 388 (27.2%) |
| 3 or 4 Children | 0 (0.0%) | 33 (36.3%) |
| 5 or more Children | 0 (0.0%) | 0 (0.0%) |
| Total | 82 (8.2%) | 509 (18.8%) |
Income Below Poverty Among Married-Couple vs Single-Parent Households in Carteret County
The poverty data for Carteret County shows that 616 of the married-couple family households (3.9%) and 591 of the single-parent households (16.0%) are living below the poverty level. Within the married-couple family households, those with 5 or more children have the highest poverty rate, with 37 households (38.5%) falling below the poverty line. Among the single-parent households, those with 3 or 4 children have the highest poverty rate, with 33 household (30.0%) living below poverty.
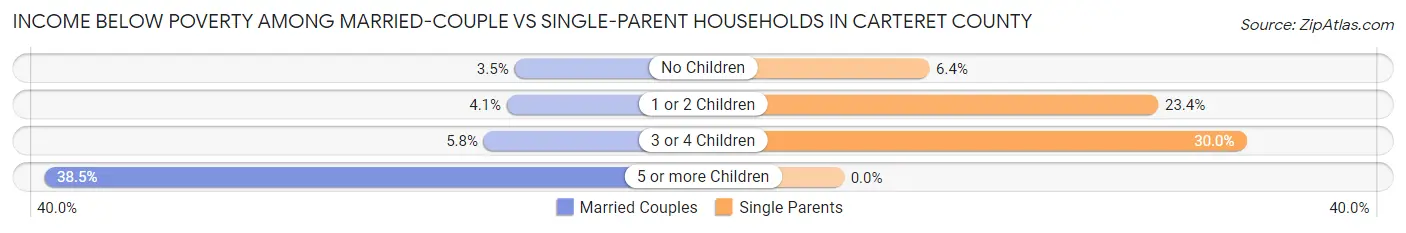
| Children | Married-Couple Families | Single-Parent Households |
| No Children | 381 (3.5%) | 106 (6.4%) |
| 1 or 2 Children | 170 (4.1%) | 452 (23.4%) |
| 3 or 4 Children | 28 (5.8%) | 33 (30.0%) |
| 5 or more Children | 37 (38.5%) | 0 (0.0%) |
| Total | 616 (3.9%) | 591 (16.0%) |
Employment Characteristics in Carteret County
Employment by Class of Employer in Carteret County
Among the 30,080 employed individuals in Carteret County, private company employees (17,516 | 58.2%), federal government employees (3,021 | 10.0%), and self-employed (not incorporated) (2,642 | 8.8%) make up the most common classes of employment.
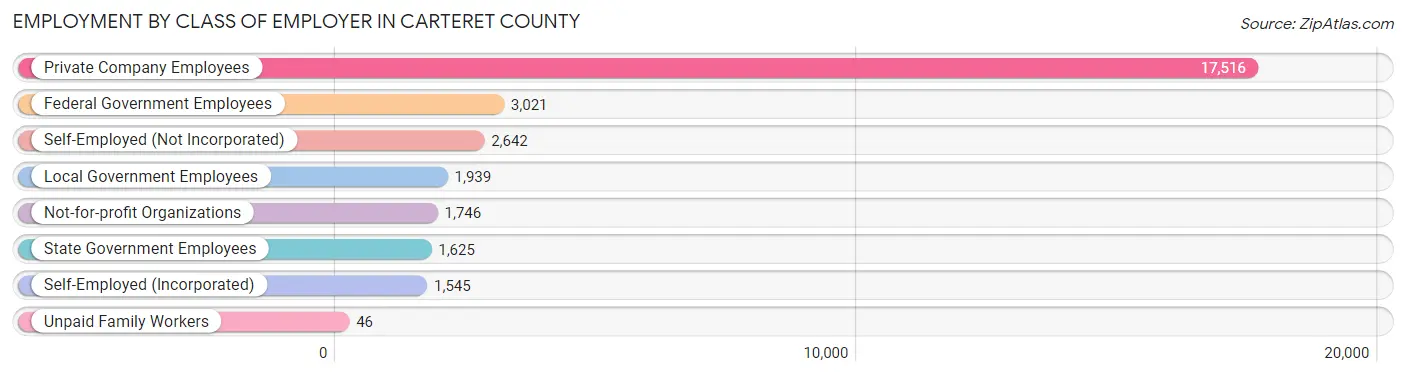
| Employer Class | # Employees | % Employees |
| Private Company Employees | 17,516 | 58.2% |
| Self-Employed (Incorporated) | 1,545 | 5.1% |
| Self-Employed (Not Incorporated) | 2,642 | 8.8% |
| Not-for-profit Organizations | 1,746 | 5.8% |
| Local Government Employees | 1,939 | 6.5% |
| State Government Employees | 1,625 | 5.4% |
| Federal Government Employees | 3,021 | 10.0% |
| Unpaid Family Workers | 46 | 0.2% |
| Total | 30,080 | 100.0% |
Employment Status by Age in Carteret County
According to the labor force statistics for Carteret County, out of the total population over 16 years of age (58,242), 55.4% or 32,266 individuals are in the labor force, with 4.9% or 1,581 of them unemployed. The age group with the highest labor force participation rate is 20 to 24 years, with 85.6% or 2,681 individuals in the labor force. Within the labor force, the 30 to 34 years age range has the highest percentage of unemployed individuals, with 8.1% or 229 of them being unemployed.
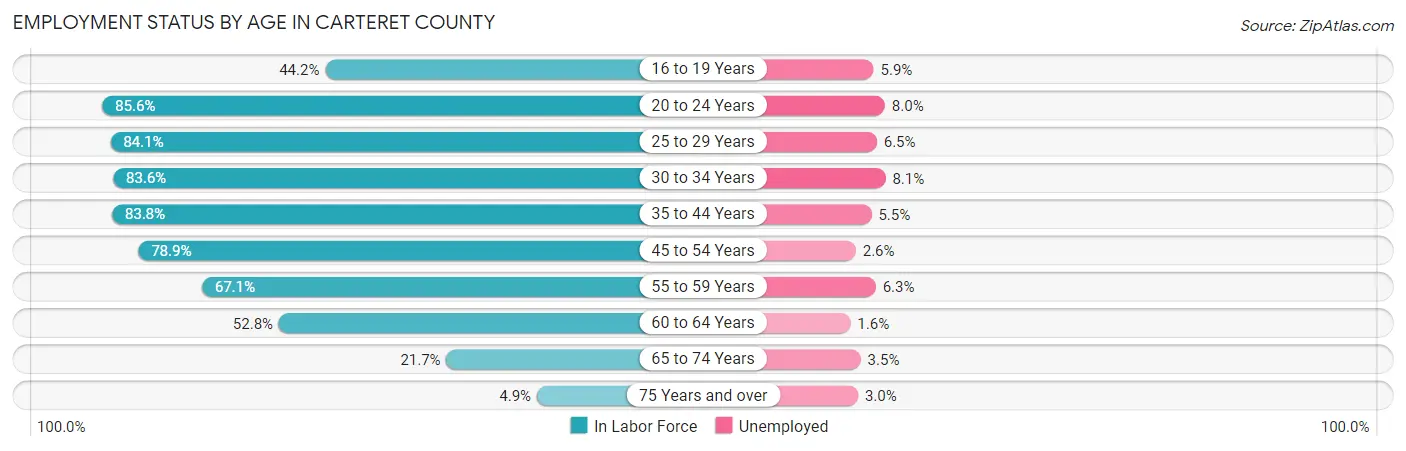
| Age Bracket | In Labor Force | Unemployed |
| 16 to 19 Years | 1,303 (44.2%) | 77 (5.9%) |
| 20 to 24 Years | 2,681 (85.6%) | 214 (8.0%) |
| 25 to 29 Years | 2,644 (84.1%) | 172 (6.5%) |
| 30 to 34 Years | 2,821 (83.6%) | 229 (8.1%) |
| 35 to 44 Years | 6,383 (83.8%) | 351 (5.5%) |
| 45 to 54 Years | 6,869 (78.9%) | 179 (2.6%) |
| 55 to 59 Years | 3,284 (67.1%) | 207 (6.3%) |
| 60 to 64 Years | 3,576 (52.8%) | 57 (1.6%) |
| 65 to 74 Years | 2,337 (21.7%) | 82 (3.5%) |
| 75 Years and over | 337 (4.9%) | 10 (3.0%) |
| Total | 32,266 (55.4%) | 1,581 (4.9%) |
Employment Status by Educational Attainment in Carteret County
According to labor force statistics for Carteret County, 74.1% of individuals (25,570) out of the total population between 25 and 64 years of age (34,507) are in the labor force, with 4.6% or 1,176 of them being unemployed. The group with the highest labor force participation rate are those with the educational attainment of bachelor's degree or higher, with 79.5% or 8,541 individuals in the labor force. Within the labor force, individuals with high school diploma education have the highest percentage of unemployment, with 6.0% or 334 of them being unemployed.
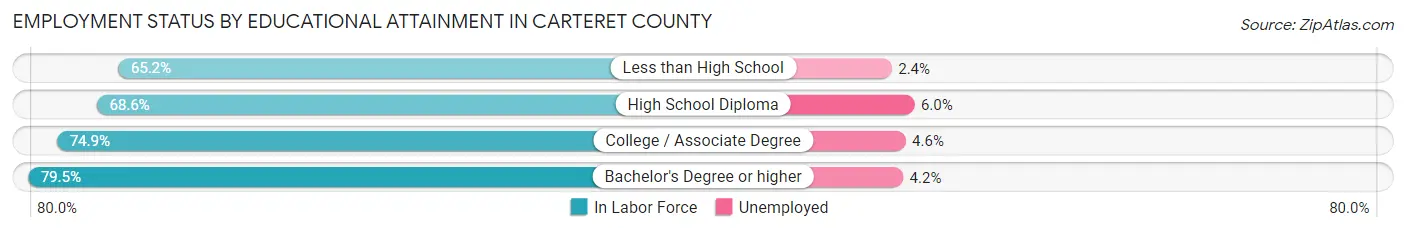
| Educational Attainment | In Labor Force | Unemployed |
| Less than High School | 1,719 (65.2%) | 63 (2.4%) |
| High School Diploma | 5,563 (68.6%) | 487 (6.0%) |
| College / Associate Degree | 9,751 (74.9%) | 599 (4.6%) |
| Bachelor's Degree or higher | 8,541 (79.5%) | 451 (4.2%) |
| Total | 25,570 (74.1%) | 1,587 (4.6%) |
Employment Occupations by Sex in Carteret County
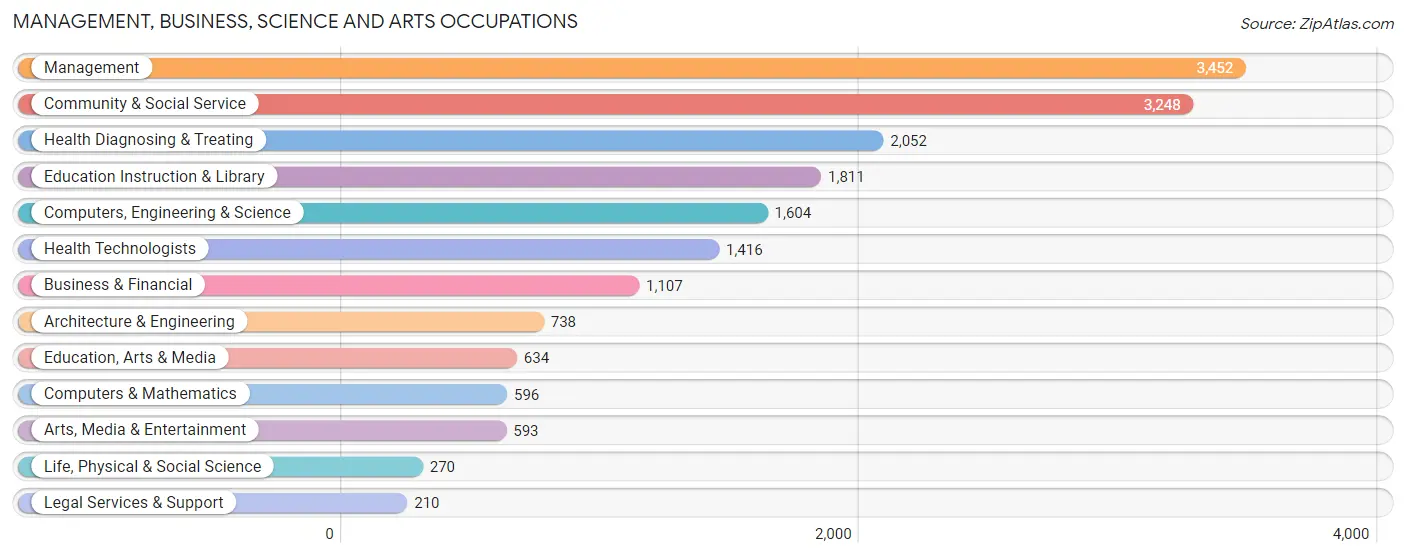
Management, Business, Science and Arts Occupations
The most common Management, Business, Science and Arts occupations in Carteret County are Management (3,452 | 11.5%), Community & Social Service (3,248 | 10.8%), Health Diagnosing & Treating (2,052 | 6.8%), Education Instruction & Library (1,811 | 6.0%), and Computers, Engineering & Science (1,604 | 5.3%).
Management, Business, Science and Arts Occupations by Sex
Within the Management, Business, Science and Arts occupations in Carteret County, the most male-oriented occupations are Architecture & Engineering (86.5%), Computers, Engineering & Science (73.1%), and Computers & Mathematics (64.8%), while the most female-oriented occupations are Health Diagnosing & Treating (77.4%), Health Technologists (75.3%), and Education Instruction & Library (72.5%).
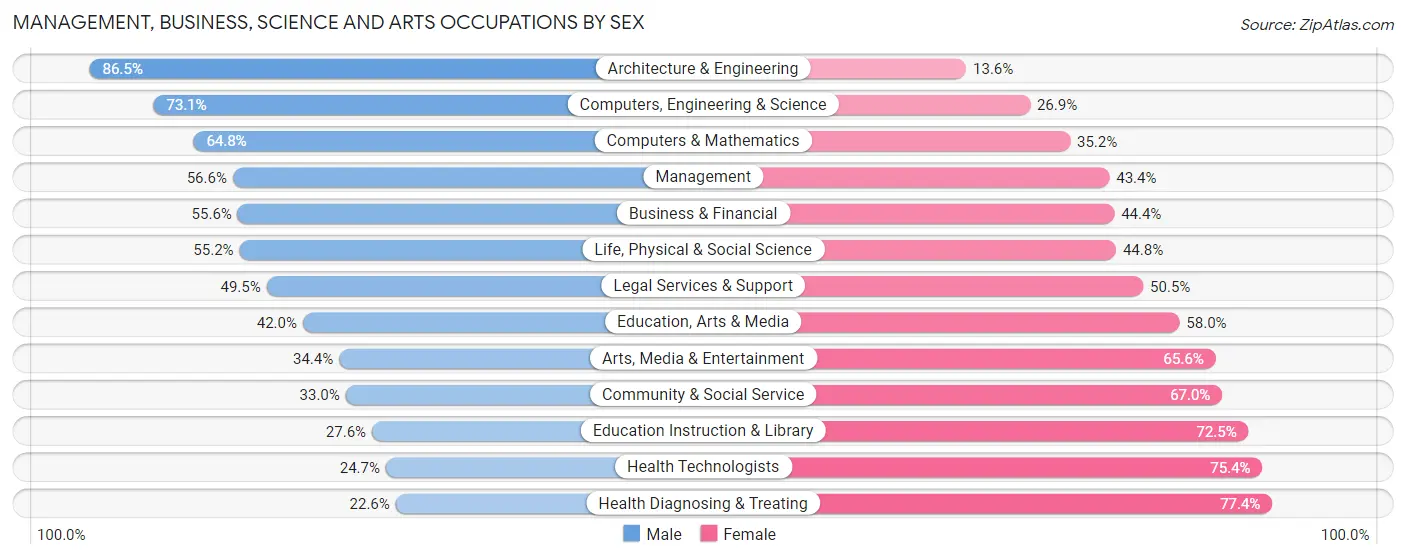
| Occupation | Male | Female |
| Management | 1,953 (56.6%) | 1,499 (43.4%) |
| Business & Financial | 615 (55.6%) | 492 (44.4%) |
| Computers, Engineering & Science | 1,173 (73.1%) | 431 (26.9%) |
| Computers & Mathematics | 386 (64.8%) | 210 (35.2%) |
| Architecture & Engineering | 638 (86.5%) | 100 (13.6%) |
| Life, Physical & Social Science | 149 (55.2%) | 121 (44.8%) |
| Community & Social Service | 1,073 (33.0%) | 2,175 (67.0%) |
| Education, Arts & Media | 266 (42.0%) | 368 (58.0%) |
| Legal Services & Support | 104 (49.5%) | 106 (50.5%) |
| Education Instruction & Library | 499 (27.6%) | 1,312 (72.5%) |
| Arts, Media & Entertainment | 204 (34.4%) | 389 (65.6%) |
| Health Diagnosing & Treating | 464 (22.6%) | 1,588 (77.4%) |
| Health Technologists | 349 (24.6%) | 1,067 (75.3%) |
| Total (Category) | 5,278 (46.0%) | 6,185 (54.0%) |
| Total (Overall) | 15,501 (51.6%) | 14,528 (48.4%) |
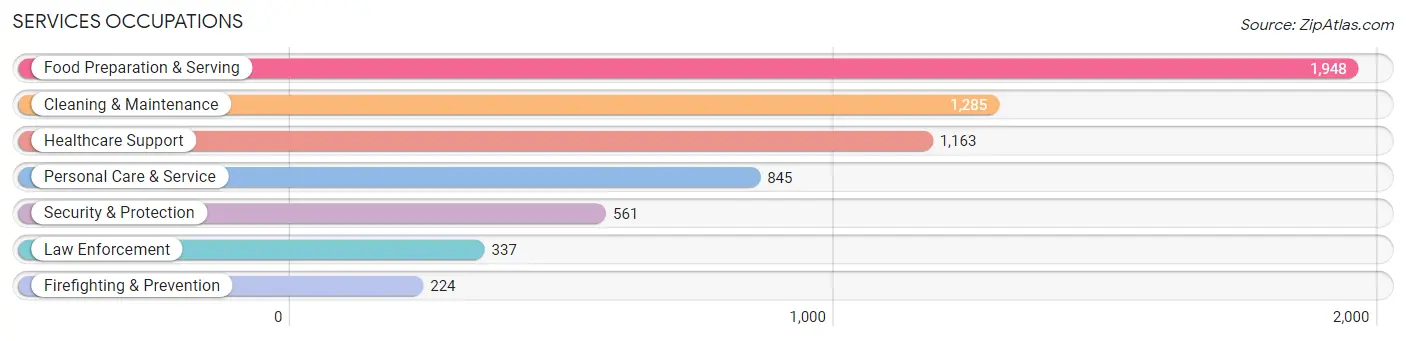
Services Occupations
The most common Services occupations in Carteret County are Food Preparation & Serving (1,948 | 6.5%), Cleaning & Maintenance (1,285 | 4.3%), Healthcare Support (1,163 | 3.9%), Personal Care & Service (845 | 2.8%), and Security & Protection (561 | 1.9%).
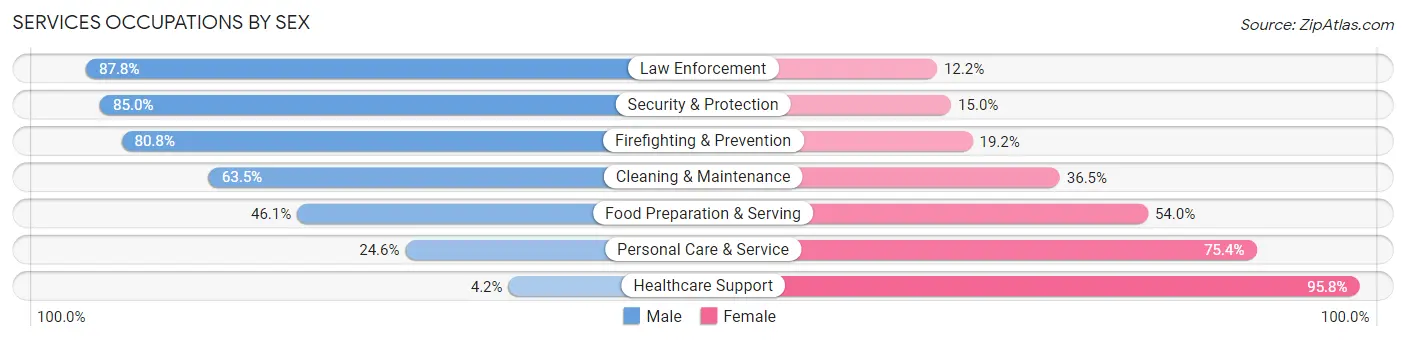
Services Occupations by Sex
Within the Services occupations in Carteret County, the most male-oriented occupations are Law Enforcement (87.8%), Security & Protection (85.0%), and Firefighting & Prevention (80.8%), while the most female-oriented occupations are Healthcare Support (95.8%), Personal Care & Service (75.4%), and Food Preparation & Serving (53.9%).
| Occupation | Male | Female |
| Healthcare Support | 49 (4.2%) | 1,114 (95.8%) |
| Security & Protection | 477 (85.0%) | 84 (15.0%) |
| Firefighting & Prevention | 181 (80.8%) | 43 (19.2%) |
| Law Enforcement | 296 (87.8%) | 41 (12.2%) |
| Food Preparation & Serving | 897 (46.1%) | 1,051 (53.9%) |
| Cleaning & Maintenance | 816 (63.5%) | 469 (36.5%) |
| Personal Care & Service | 208 (24.6%) | 637 (75.4%) |
| Total (Category) | 2,447 (42.2%) | 3,355 (57.8%) |
| Total (Overall) | 15,501 (51.6%) | 14,528 (48.4%) |
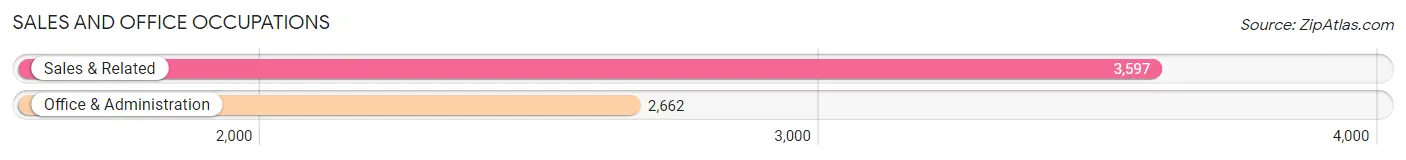
Sales and Office Occupations
The most common Sales and Office occupations in Carteret County are Sales & Related (3,597 | 12.0%), and Office & Administration (2,662 | 8.9%).
Sales and Office Occupations by Sex
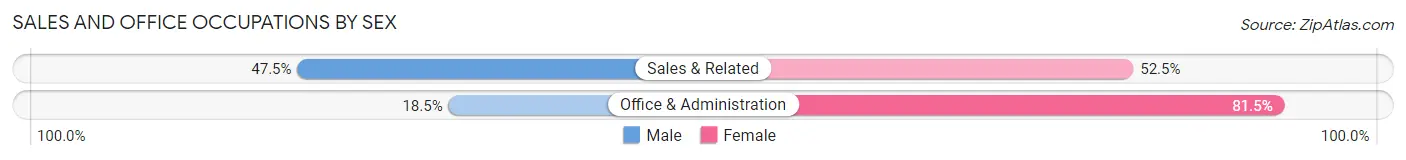
| Occupation | Male | Female |
| Sales & Related | 1,710 (47.5%) | 1,887 (52.5%) |
| Office & Administration | 492 (18.5%) | 2,170 (81.5%) |
| Total (Category) | 2,202 (35.2%) | 4,057 (64.8%) |
| Total (Overall) | 15,501 (51.6%) | 14,528 (48.4%) |
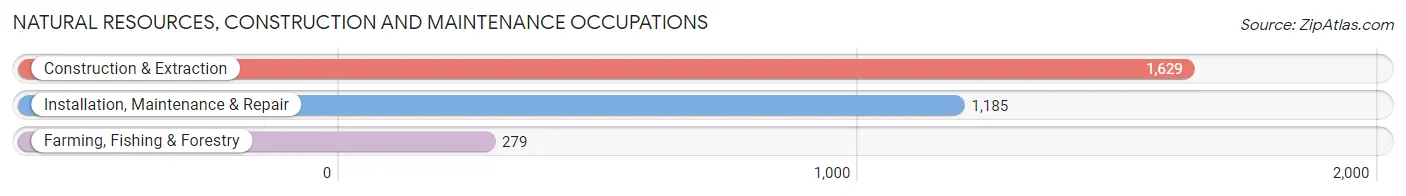
Natural Resources, Construction and Maintenance Occupations
The most common Natural Resources, Construction and Maintenance occupations in Carteret County are Construction & Extraction (1,629 | 5.4%), Installation, Maintenance & Repair (1,185 | 4.0%), and Farming, Fishing & Forestry (279 | 0.9%).
Natural Resources, Construction and Maintenance Occupations by Sex
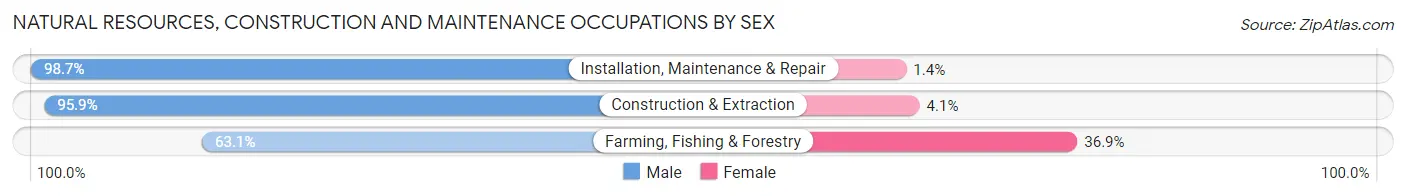
| Occupation | Male | Female |
| Farming, Fishing & Forestry | 176 (63.1%) | 103 (36.9%) |
| Construction & Extraction | 1,562 (95.9%) | 67 (4.1%) |
| Installation, Maintenance & Repair | 1,169 (98.7%) | 16 (1.3%) |
| Total (Category) | 2,907 (94.0%) | 186 (6.0%) |
| Total (Overall) | 15,501 (51.6%) | 14,528 (48.4%) |
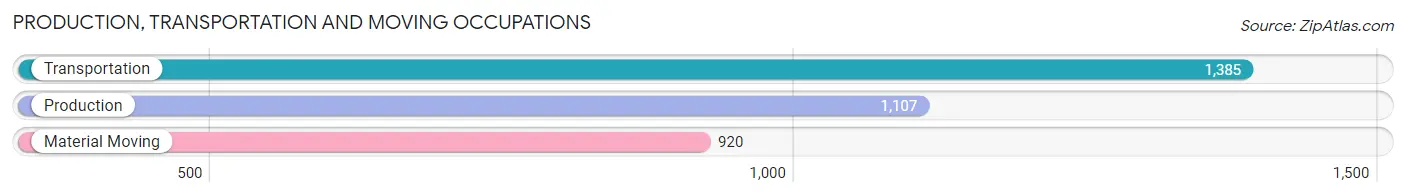
Production, Transportation and Moving Occupations
The most common Production, Transportation and Moving occupations in Carteret County are Transportation (1,385 | 4.6%), Production (1,107 | 3.7%), and Material Moving (920 | 3.1%).
Production, Transportation and Moving Occupations by Sex
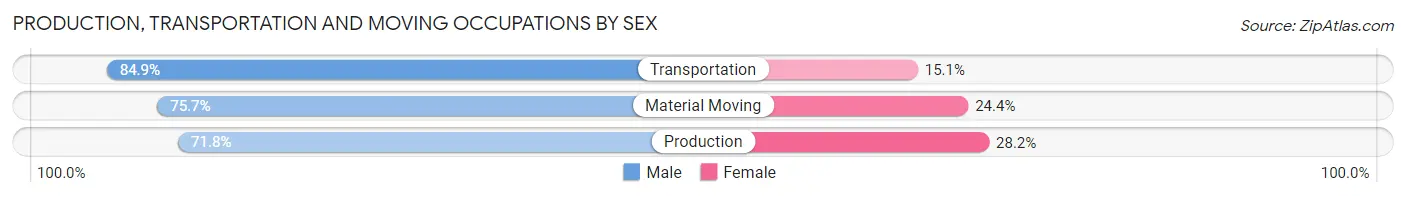
| Occupation | Male | Female |
| Production | 795 (71.8%) | 312 (28.2%) |
| Transportation | 1,176 (84.9%) | 209 (15.1%) |
| Material Moving | 696 (75.6%) | 224 (24.3%) |
| Total (Category) | 2,667 (78.2%) | 745 (21.8%) |
| Total (Overall) | 15,501 (51.6%) | 14,528 (48.4%) |
Employment Industries by Sex in Carteret County
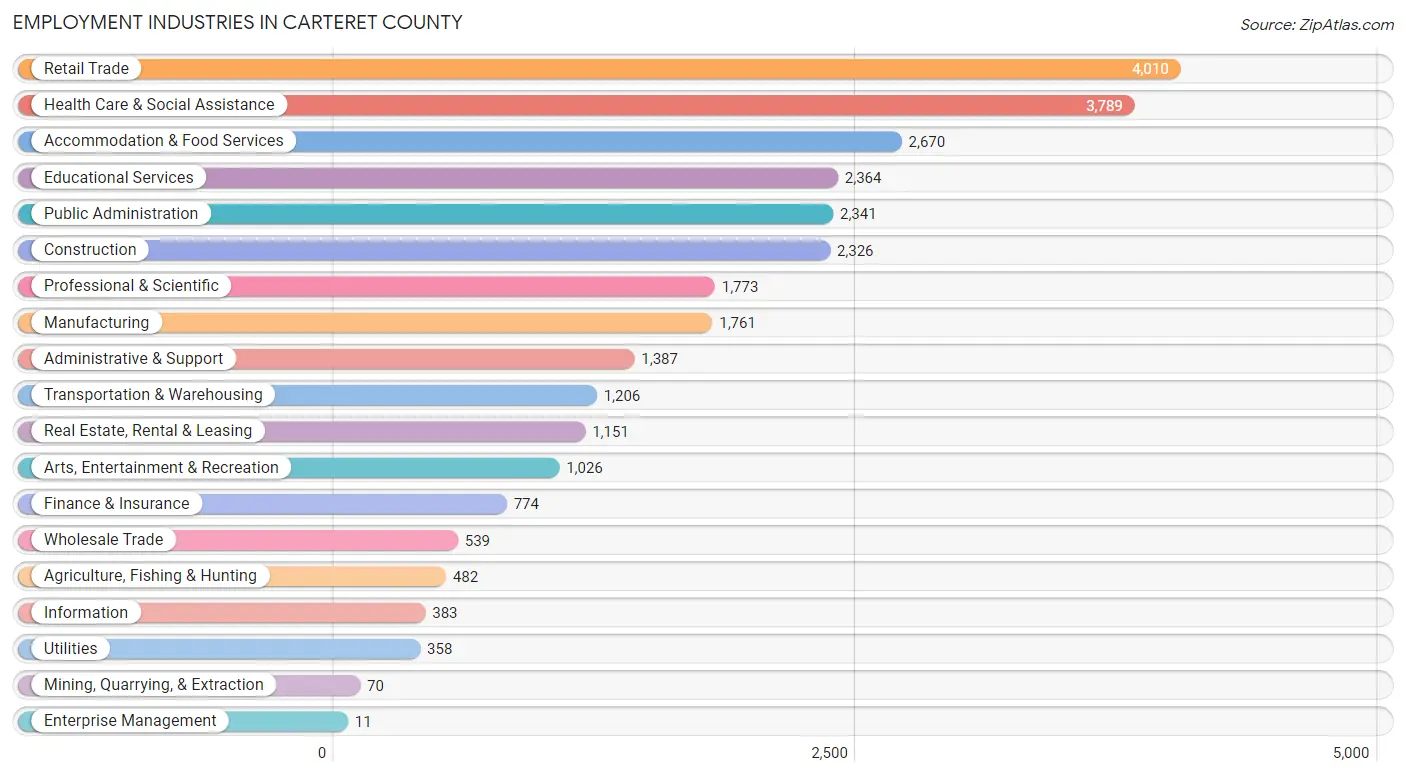
Employment Industries in Carteret County
The major employment industries in Carteret County include Retail Trade (4,010 | 13.4%), Health Care & Social Assistance (3,789 | 12.6%), Accommodation & Food Services (2,670 | 8.9%), Educational Services (2,364 | 7.9%), and Public Administration (2,341 | 7.8%).
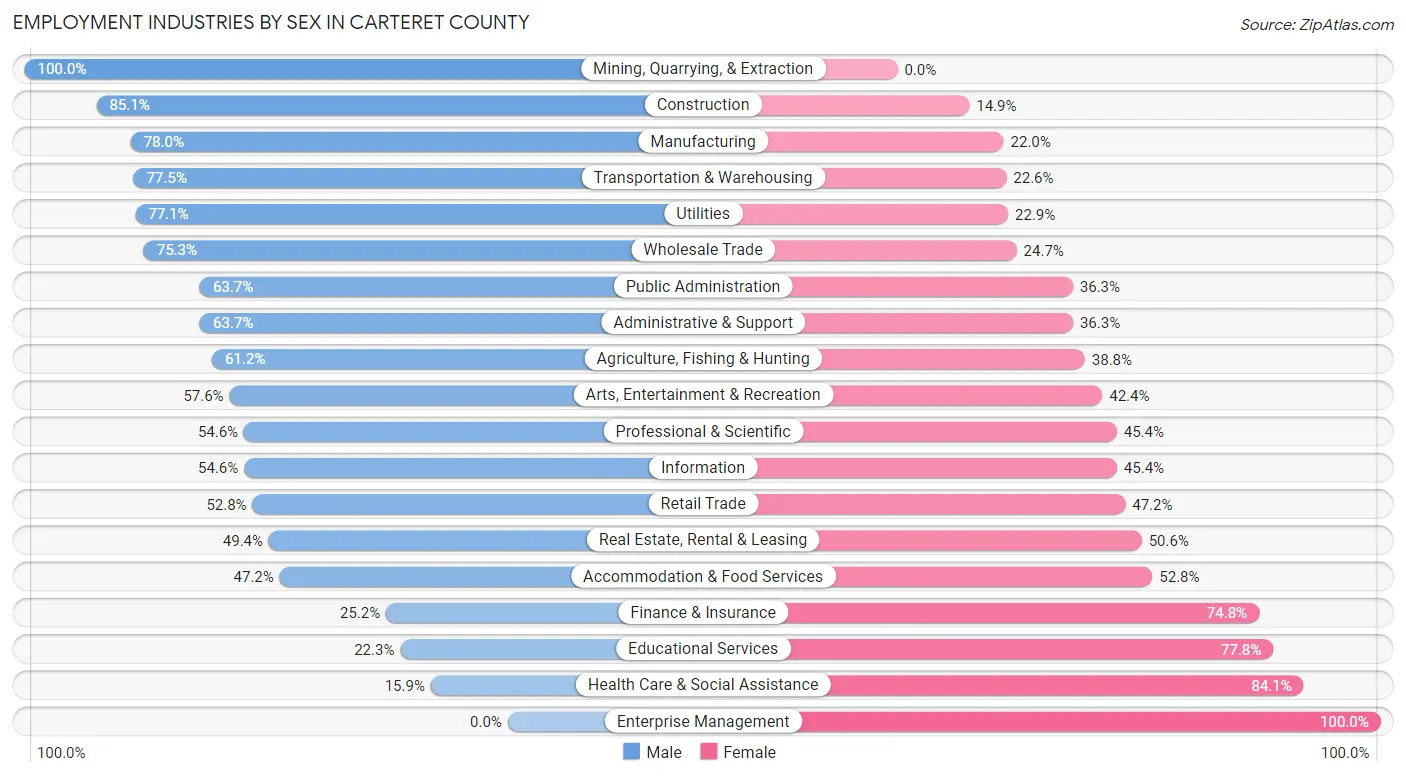
Employment Industries by Sex in Carteret County
The Carteret County industries that see more men than women are Mining, Quarrying, & Extraction (100.0%), Construction (85.1%), and Manufacturing (78.0%), whereas the industries that tend to have a higher number of women are Enterprise Management (100.0%), Health Care & Social Assistance (84.1%), and Educational Services (77.7%).
| Industry | Male | Female |
| Agriculture, Fishing & Hunting | 295 (61.2%) | 187 (38.8%) |
| Mining, Quarrying, & Extraction | 70 (100.0%) | 0 (0.0%) |
| Construction | 1,980 (85.1%) | 346 (14.9%) |
| Manufacturing | 1,374 (78.0%) | 387 (22.0%) |
| Wholesale Trade | 406 (75.3%) | 133 (24.7%) |
| Retail Trade | 2,119 (52.8%) | 1,891 (47.2%) |
| Transportation & Warehousing | 934 (77.4%) | 272 (22.6%) |
| Utilities | 276 (77.1%) | 82 (22.9%) |
| Information | 209 (54.6%) | 174 (45.4%) |
| Finance & Insurance | 195 (25.2%) | 579 (74.8%) |
| Real Estate, Rental & Leasing | 569 (49.4%) | 582 (50.6%) |
| Professional & Scientific | 968 (54.6%) | 805 (45.4%) |
| Enterprise Management | 0 (0.0%) | 11 (100.0%) |
| Administrative & Support | 883 (63.7%) | 504 (36.3%) |
| Educational Services | 526 (22.3%) | 1,838 (77.7%) |
| Health Care & Social Assistance | 604 (15.9%) | 3,185 (84.1%) |
| Arts, Entertainment & Recreation | 591 (57.6%) | 435 (42.4%) |
| Accommodation & Food Services | 1,261 (47.2%) | 1,409 (52.8%) |
| Public Administration | 1,491 (63.7%) | 850 (36.3%) |
| Total | 15,501 (51.6%) | 14,528 (48.4%) |
Education in Carteret County
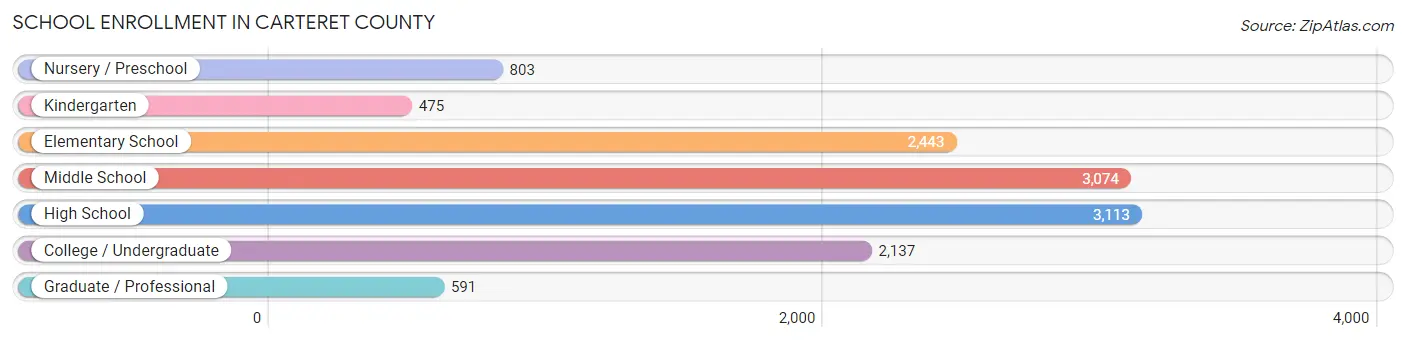
School Enrollment in Carteret County
The most common levels of schooling among the 12,636 students in Carteret County are high school (3,113 | 24.6%), middle school (3,074 | 24.3%), and elementary school (2,443 | 19.3%).
| School Level | # Students | % Students |
| Nursery / Preschool | 803 | 6.4% |
| Kindergarten | 475 | 3.8% |
| Elementary School | 2,443 | 19.3% |
| Middle School | 3,074 | 24.3% |
| High School | 3,113 | 24.6% |
| College / Undergraduate | 2,137 | 16.9% |
| Graduate / Professional | 591 | 4.7% |
| Total | 12,636 | 100.0% |
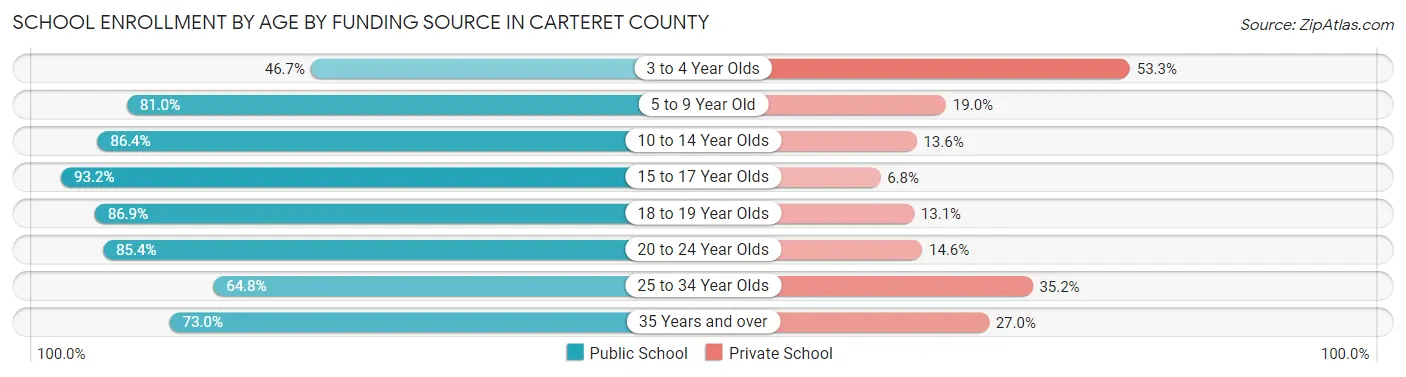
School Enrollment by Age by Funding Source in Carteret County
Out of a total of 12,636 students who are enrolled in schools in Carteret County, 2,199 (17.4%) attend a private institution, while the remaining 10,437 (82.6%) are enrolled in public schools. The age group of 3 to 4 year olds has the highest likelihood of being enrolled in private schools, with 339 (53.3% in the age bracket) enrolled. Conversely, the age group of 15 to 17 year olds has the lowest likelihood of being enrolled in a private school, with 2,040 (93.2% in the age bracket) attending a public institution.
| Age Bracket | Public School | Private School |
| 3 to 4 Year Olds | 297 (46.7%) | 339 (53.3%) |
| 5 to 9 Year Old | 2,241 (81.0%) | 527 (19.0%) |
| 10 to 14 Year Olds | 3,252 (86.4%) | 510 (13.6%) |
| 15 to 17 Year Olds | 2,040 (93.2%) | 149 (6.8%) |
| 18 to 19 Year Olds | 917 (86.9%) | 138 (13.1%) |
| 20 to 24 Year Olds | 795 (85.4%) | 136 (14.6%) |
| 25 to 34 Year Olds | 439 (64.8%) | 238 (35.2%) |
| 35 Years and over | 451 (73.0%) | 167 (27.0%) |
| Total | 10,437 (82.6%) | 2,199 (17.4%) |
Educational Attainment by Field of Study in Carteret County
Business (3,329 | 18.0%), education (2,411 | 13.1%), science & technology (1,761 | 9.5%), arts & humanities (1,619 | 8.8%), and bio, nature & agricultural (1,391 | 7.5%) are the most common fields of study among 18,460 individuals in Carteret County who have obtained a bachelor's degree or higher.
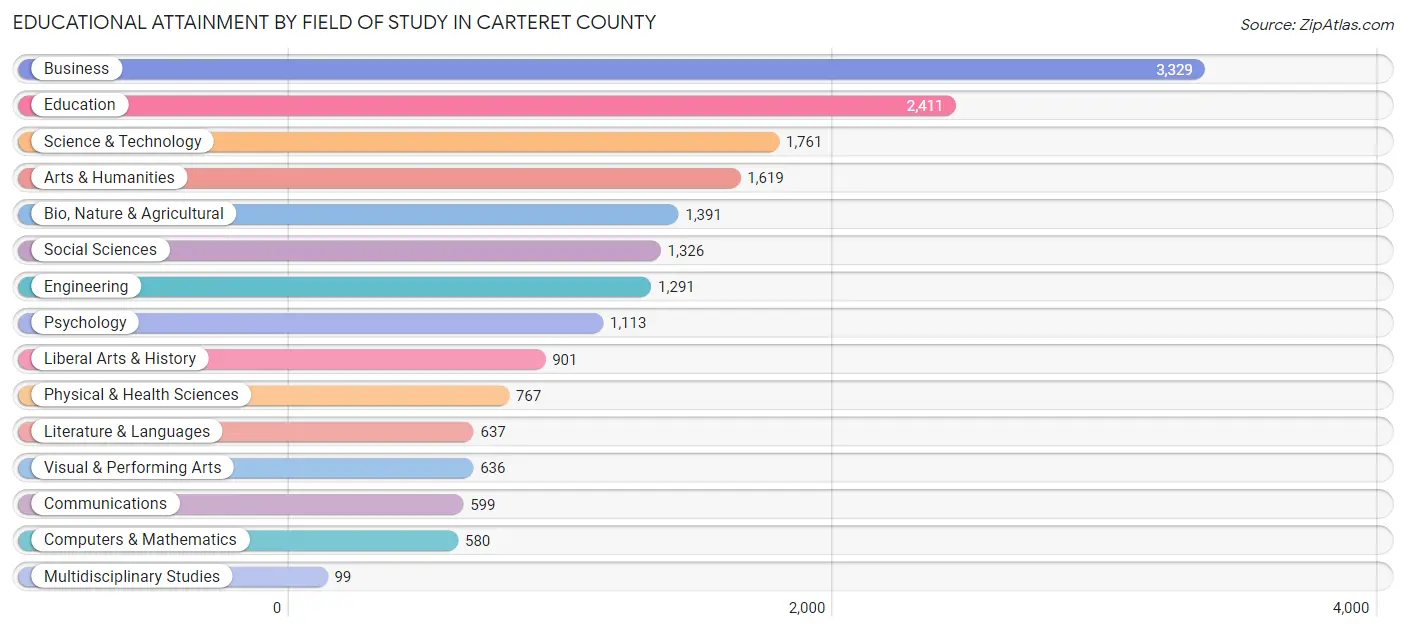
| Field of Study | # Graduates | % Graduates |
| Computers & Mathematics | 580 | 3.1% |
| Bio, Nature & Agricultural | 1,391 | 7.5% |
| Physical & Health Sciences | 767 | 4.2% |
| Psychology | 1,113 | 6.0% |
| Social Sciences | 1,326 | 7.2% |
| Engineering | 1,291 | 7.0% |
| Multidisciplinary Studies | 99 | 0.5% |
| Science & Technology | 1,761 | 9.5% |
| Business | 3,329 | 18.0% |
| Education | 2,411 | 13.1% |
| Literature & Languages | 637 | 3.5% |
| Liberal Arts & History | 901 | 4.9% |
| Visual & Performing Arts | 636 | 3.5% |
| Communications | 599 | 3.2% |
| Arts & Humanities | 1,619 | 8.8% |
| Total | 18,460 | 100.0% |
Transportation & Commute in Carteret County
Vehicle Availability by Sex in Carteret County
The most prevalent vehicle ownership categories in Carteret County are males with 2 vehicles (7,478, accounting for 47.5%) and females with 2 vehicles (5,772, making up 52.6%).
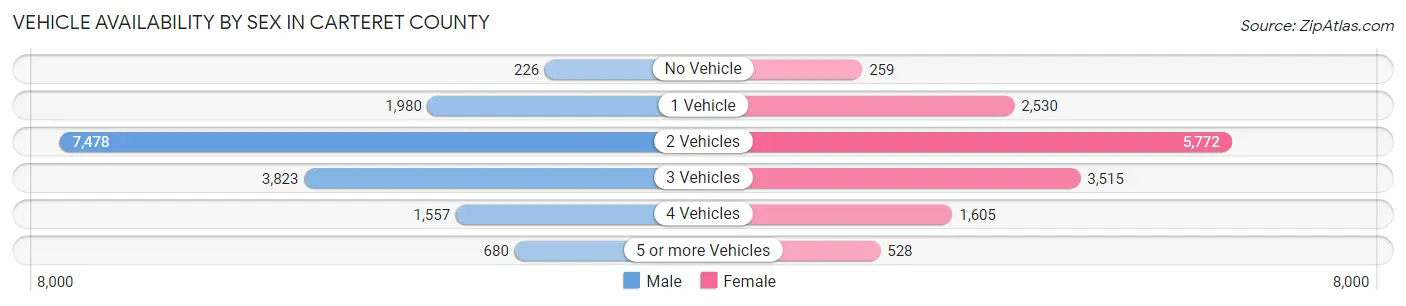
| Vehicles Available | Male | Female |
| No Vehicle | 226 (1.4%) | 259 (1.8%) |
| 1 Vehicle | 1,980 (12.6%) | 2,530 (17.8%) |
| 2 Vehicles | 7,478 (47.5%) | 5,772 (40.6%) |
| 3 Vehicles | 3,823 (24.3%) | 3,515 (24.7%) |
| 4 Vehicles | 1,557 (9.9%) | 1,605 (11.3%) |
| 5 or more Vehicles | 680 (4.3%) | 528 (3.7%) |
| Total | 15,744 (100.0%) | 14,209 (100.0%) |
Commute Time in Carteret County
The most frequently occuring commute durations in Carteret County are 15 to 19 minutes (4,603 commuters, 16.7%), 10 to 14 minutes (4,065 commuters, 14.8%), and 5 to 9 minutes (3,612 commuters, 13.1%).

| Commute Time | # Commuters | % Commuters |
| Less than 5 Minutes | 1,293 | 4.7% |
| 5 to 9 Minutes | 3,612 | 13.1% |
| 10 to 14 Minutes | 4,065 | 14.8% |
| 15 to 19 Minutes | 4,603 | 16.7% |
| 20 to 24 Minutes | 3,534 | 12.8% |
| 25 to 29 Minutes | 1,879 | 6.8% |
| 30 to 34 Minutes | 3,411 | 12.4% |
| 35 to 39 Minutes | 972 | 3.5% |
| 40 to 44 Minutes | 953 | 3.5% |
| 45 to 59 Minutes | 1,646 | 6.0% |
| 60 to 89 Minutes | 796 | 2.9% |
| 90 or more Minutes | 749 | 2.7% |
Commute Time by Sex in Carteret County
The most common commute times in Carteret County are 15 to 19 minutes (2,732 commuters, 18.6%) for males and 10 to 14 minutes (1,998 commuters, 15.6%) for females.
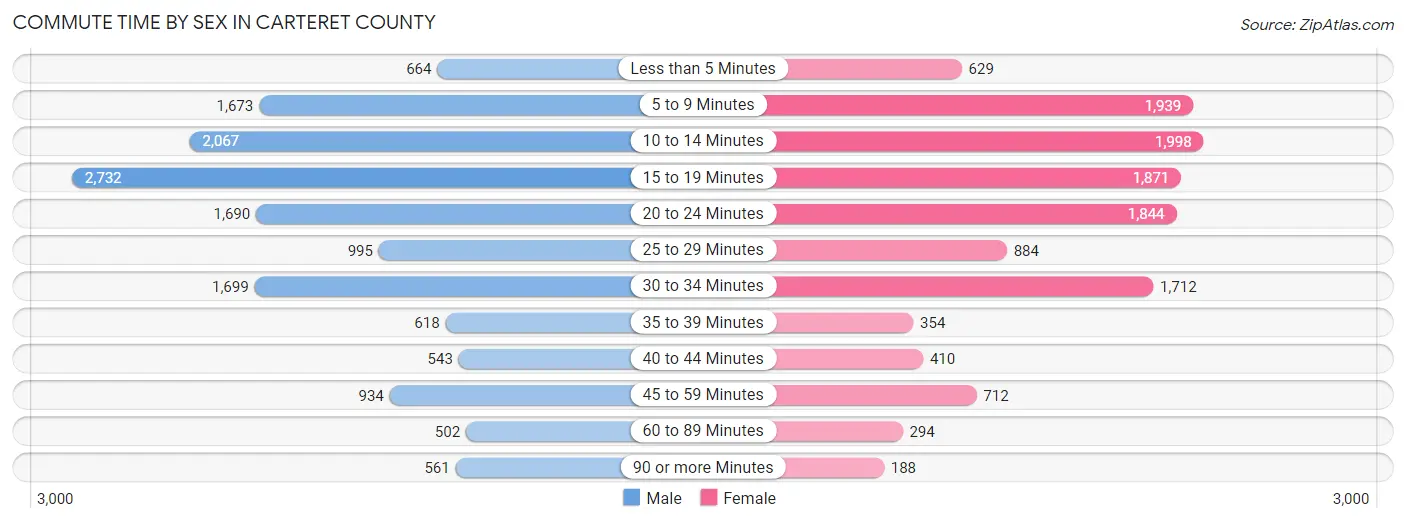
| Commute Time | Male | Female |
| Less than 5 Minutes | 664 (4.5%) | 629 (4.9%) |
| 5 to 9 Minutes | 1,673 (11.4%) | 1,939 (15.1%) |
| 10 to 14 Minutes | 2,067 (14.1%) | 1,998 (15.6%) |
| 15 to 19 Minutes | 2,732 (18.6%) | 1,871 (14.6%) |
| 20 to 24 Minutes | 1,690 (11.5%) | 1,844 (14.4%) |
| 25 to 29 Minutes | 995 (6.8%) | 884 (6.9%) |
| 30 to 34 Minutes | 1,699 (11.6%) | 1,712 (13.3%) |
| 35 to 39 Minutes | 618 (4.2%) | 354 (2.8%) |
| 40 to 44 Minutes | 543 (3.7%) | 410 (3.2%) |
| 45 to 59 Minutes | 934 (6.4%) | 712 (5.6%) |
| 60 to 89 Minutes | 502 (3.4%) | 294 (2.3%) |
| 90 or more Minutes | 561 (3.8%) | 188 (1.5%) |
Time of Departure to Work by Sex in Carteret County
The most frequent times of departure to work in Carteret County are 6:00 AM to 6:29 AM (1,987, 13.5%) for males and 7:00 AM to 7:29 AM (2,259, 17.6%) for females.
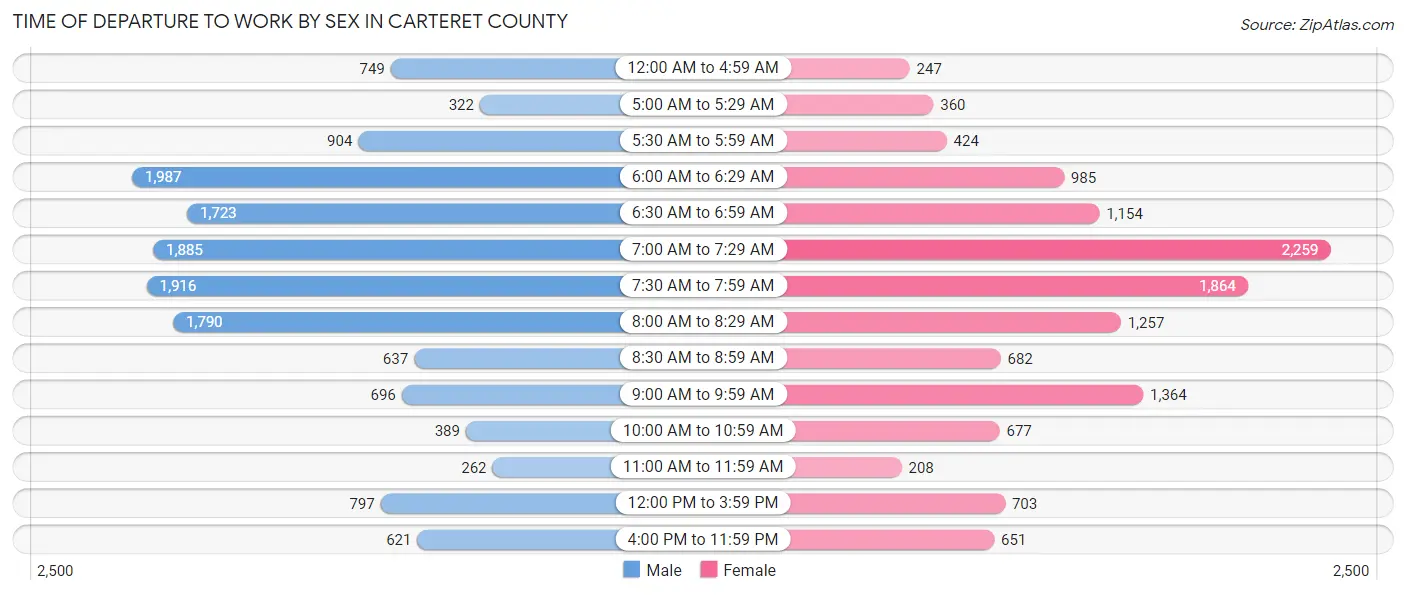
| Time of Departure | Male | Female |
| 12:00 AM to 4:59 AM | 749 (5.1%) | 247 (1.9%) |
| 5:00 AM to 5:29 AM | 322 (2.2%) | 360 (2.8%) |
| 5:30 AM to 5:59 AM | 904 (6.2%) | 424 (3.3%) |
| 6:00 AM to 6:29 AM | 1,987 (13.5%) | 985 (7.7%) |
| 6:30 AM to 6:59 AM | 1,723 (11.7%) | 1,154 (9.0%) |
| 7:00 AM to 7:29 AM | 1,885 (12.8%) | 2,259 (17.6%) |
| 7:30 AM to 7:59 AM | 1,916 (13.1%) | 1,864 (14.5%) |
| 8:00 AM to 8:29 AM | 1,790 (12.2%) | 1,257 (9.8%) |
| 8:30 AM to 8:59 AM | 637 (4.3%) | 682 (5.3%) |
| 9:00 AM to 9:59 AM | 696 (4.7%) | 1,364 (10.6%) |
| 10:00 AM to 10:59 AM | 389 (2.6%) | 677 (5.3%) |
| 11:00 AM to 11:59 AM | 262 (1.8%) | 208 (1.6%) |
| 12:00 PM to 3:59 PM | 797 (5.4%) | 703 (5.5%) |
| 4:00 PM to 11:59 PM | 621 (4.2%) | 651 (5.1%) |
| Total | 14,678 (100.0%) | 12,835 (100.0%) |
Housing Occupancy in Carteret County
Occupancy by Ownership in Carteret County
Of the total 30,414 dwellings in Carteret County, owner-occupied units account for 22,174 (72.9%), while renter-occupied units make up 8,240 (27.1%).
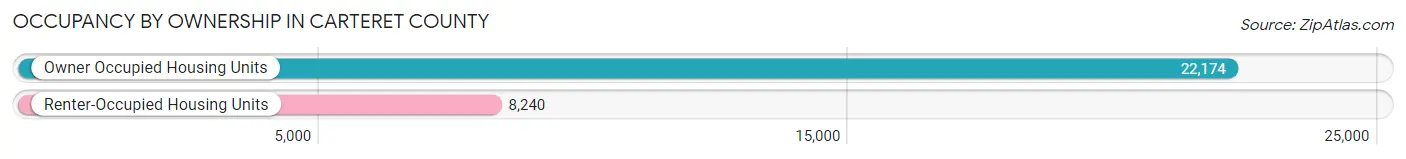
| Occupancy | # Housing Units | % Housing Units |
| Owner Occupied Housing Units | 22,174 | 72.9% |
| Renter-Occupied Housing Units | 8,240 | 27.1% |
| Total Occupied Housing Units | 30,414 | 100.0% |
Occupancy by Household Size in Carteret County
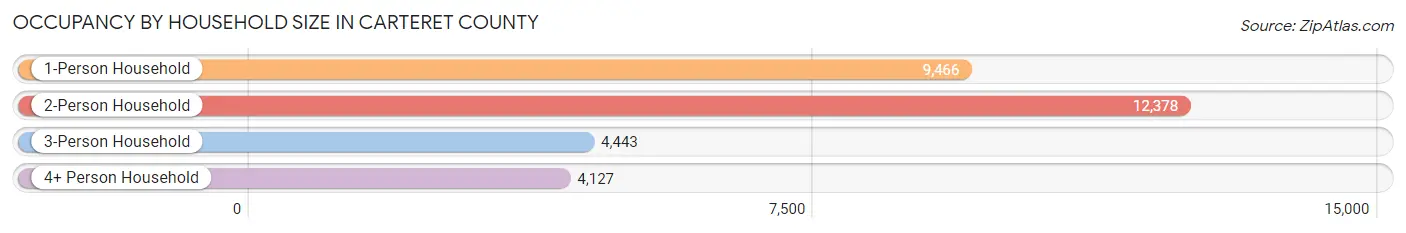
| Household Size | # Housing Units | % Housing Units |
| 1-Person Household | 9,466 | 31.1% |
| 2-Person Household | 12,378 | 40.7% |
| 3-Person Household | 4,443 | 14.6% |
| 4+ Person Household | 4,127 | 13.6% |
| Total Housing Units | 30,414 | 100.0% |
Occupancy by Ownership by Household Size in Carteret County
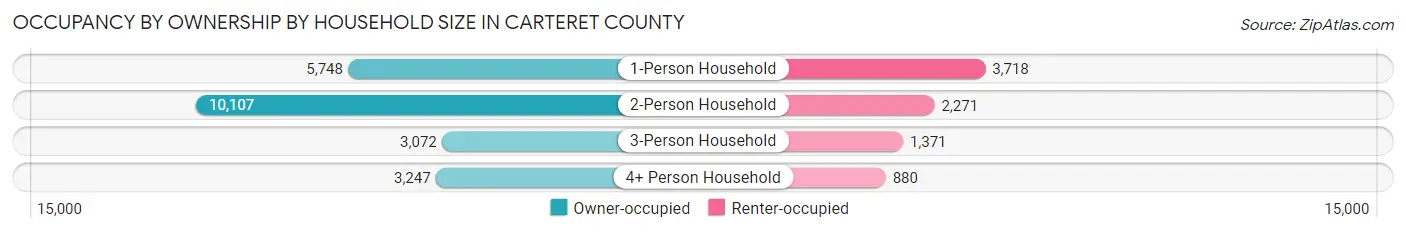
| Household Size | Owner-occupied | Renter-occupied |
| 1-Person Household | 5,748 (60.7%) | 3,718 (39.3%) |
| 2-Person Household | 10,107 (81.7%) | 2,271 (18.3%) |
| 3-Person Household | 3,072 (69.1%) | 1,371 (30.9%) |
| 4+ Person Household | 3,247 (78.7%) | 880 (21.3%) |
| Total Housing Units | 22,174 (72.9%) | 8,240 (27.1%) |
Occupancy by Educational Attainment in Carteret County
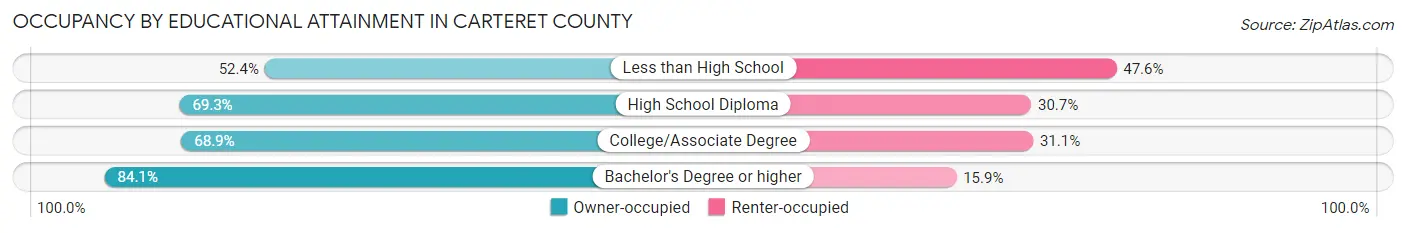
| Household Size | Owner-occupied | Renter-occupied |
| Less than High School | 1,130 (52.4%) | 1,027 (47.6%) |
| High School Diploma | 4,111 (69.3%) | 1,822 (30.7%) |
| College/Associate Degree | 8,369 (68.9%) | 3,776 (31.1%) |
| Bachelor's Degree or higher | 8,564 (84.1%) | 1,615 (15.9%) |
Occupancy by Age of Householder in Carteret County
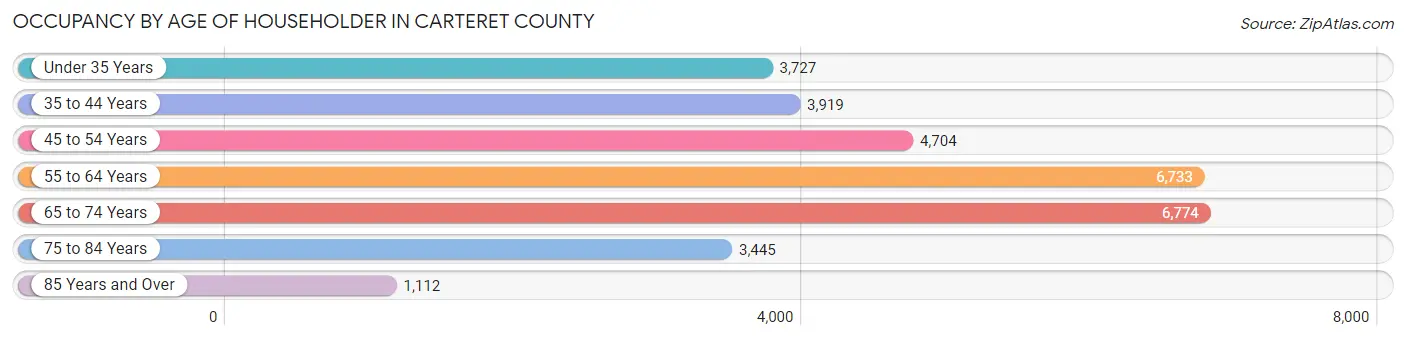
| Age Bracket | # Households | % Households |
| Under 35 Years | 3,727 | 12.2% |
| 35 to 44 Years | 3,919 | 12.9% |
| 45 to 54 Years | 4,704 | 15.5% |
| 55 to 64 Years | 6,733 | 22.1% |
| 65 to 74 Years | 6,774 | 22.3% |
| 75 to 84 Years | 3,445 | 11.3% |
| 85 Years and Over | 1,112 | 3.7% |
| Total | 30,414 | 100.0% |
Housing Finances in Carteret County
Median Income by Occupancy in Carteret County
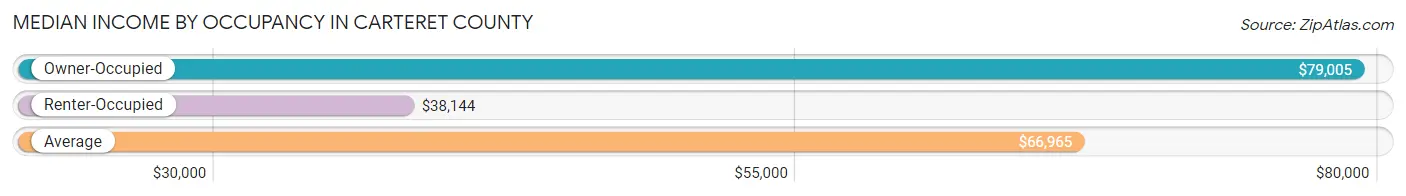
| Occupancy Type | # Households | Median Income |
| Owner-Occupied | 22,174 (72.9%) | $79,005 |
| Renter-Occupied | 8,240 (27.1%) | $38,144 |
| Average | 30,414 (100.0%) | $66,965 |
Occupancy by Householder Income Bracket in Carteret County
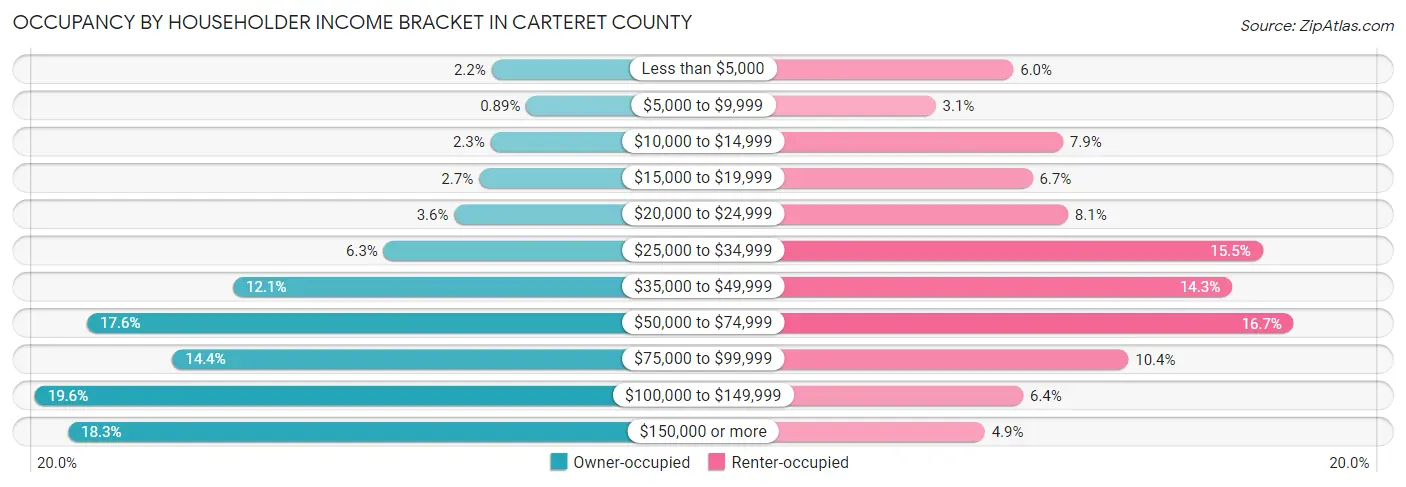
| Income Bracket | Owner-occupied | Renter-occupied |
| Less than $5,000 | 490 (2.2%) | 495 (6.0%) |
| $5,000 to $9,999 | 197 (0.9%) | 251 (3.0%) |
| $10,000 to $14,999 | 499 (2.2%) | 651 (7.9%) |
| $15,000 to $19,999 | 597 (2.7%) | 555 (6.7%) |
| $20,000 to $24,999 | 805 (3.6%) | 667 (8.1%) |
| $25,000 to $34,999 | 1,402 (6.3%) | 1,277 (15.5%) |
| $35,000 to $49,999 | 2,674 (12.1%) | 1,182 (14.3%) |
| $50,000 to $74,999 | 3,908 (17.6%) | 1,375 (16.7%) |
| $75,000 to $99,999 | 3,186 (14.4%) | 856 (10.4%) |
| $100,000 to $149,999 | 4,349 (19.6%) | 526 (6.4%) |
| $150,000 or more | 4,067 (18.3%) | 405 (4.9%) |
| Total | 22,174 (100.0%) | 8,240 (100.0%) |
Monthly Housing Cost Tiers in Carteret County
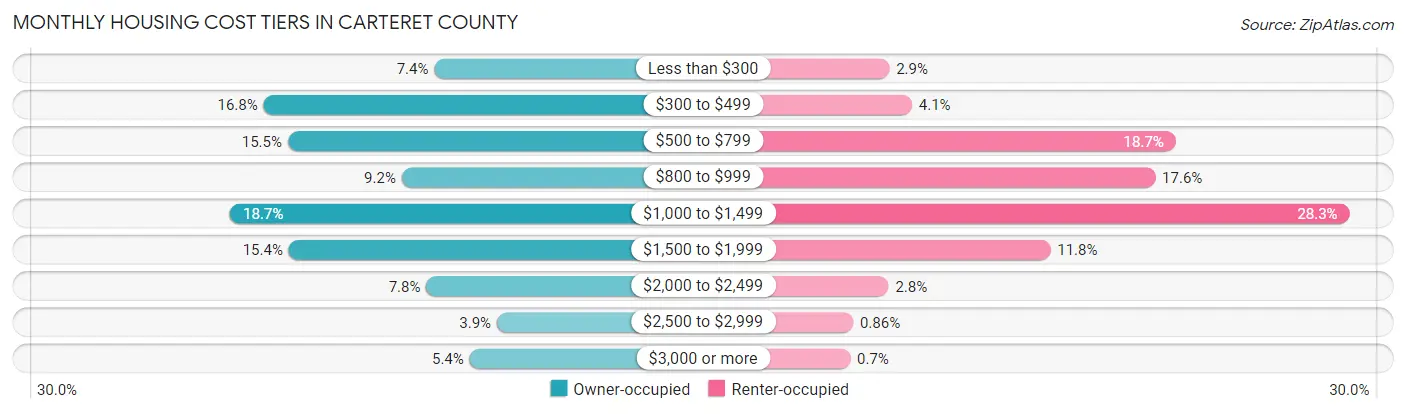
| Monthly Cost | Owner-occupied | Renter-occupied |
| Less than $300 | 1,635 (7.4%) | 236 (2.9%) |
| $300 to $499 | 3,725 (16.8%) | 339 (4.1%) |
| $500 to $799 | 3,427 (15.5%) | 1,539 (18.7%) |
| $800 to $999 | 2,034 (9.2%) | 1,446 (17.5%) |
| $1,000 to $1,499 | 4,135 (18.6%) | 2,330 (28.3%) |
| $1,500 to $1,999 | 3,417 (15.4%) | 969 (11.8%) |
| $2,000 to $2,499 | 1,732 (7.8%) | 232 (2.8%) |
| $2,500 to $2,999 | 868 (3.9%) | 71 (0.9%) |
| $3,000 or more | 1,201 (5.4%) | 58 (0.7%) |
| Total | 22,174 (100.0%) | 8,240 (100.0%) |
Physical Housing Characteristics in Carteret County
Housing Structures in Carteret County
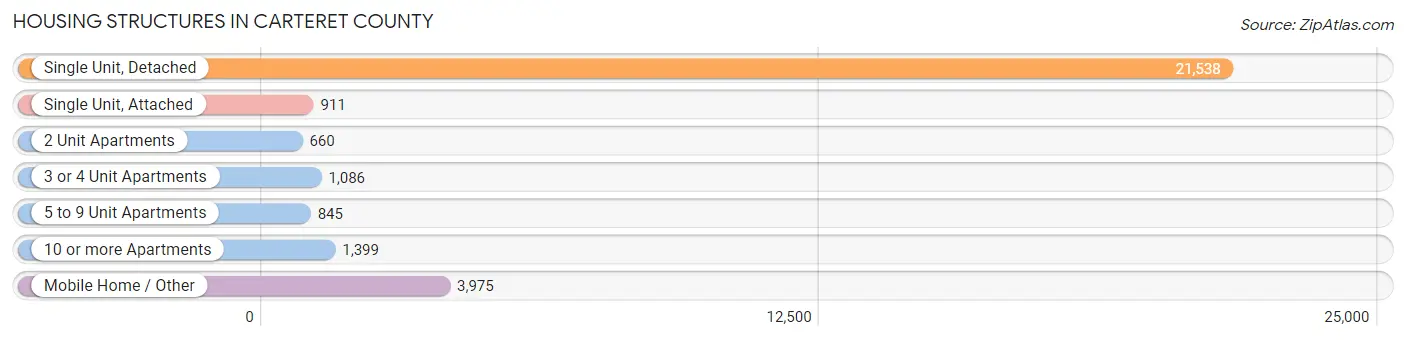
| Structure Type | # Housing Units | % Housing Units |
| Single Unit, Detached | 21,538 | 70.8% |
| Single Unit, Attached | 911 | 3.0% |
| 2 Unit Apartments | 660 | 2.2% |
| 3 or 4 Unit Apartments | 1,086 | 3.6% |
| 5 to 9 Unit Apartments | 845 | 2.8% |
| 10 or more Apartments | 1,399 | 4.6% |
| Mobile Home / Other | 3,975 | 13.1% |
| Total | 30,414 | 100.0% |
Housing Structures by Occupancy in Carteret County
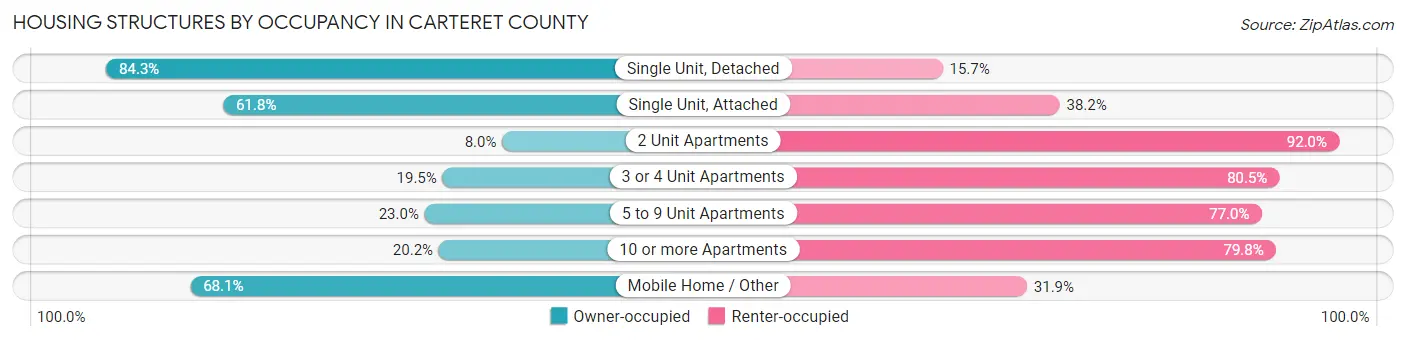
| Structure Type | Owner-occupied | Renter-occupied |
| Single Unit, Detached | 18,162 (84.3%) | 3,376 (15.7%) |
| Single Unit, Attached | 563 (61.8%) | 348 (38.2%) |
| 2 Unit Apartments | 53 (8.0%) | 607 (92.0%) |
| 3 or 4 Unit Apartments | 212 (19.5%) | 874 (80.5%) |
| 5 to 9 Unit Apartments | 194 (23.0%) | 651 (77.0%) |
| 10 or more Apartments | 283 (20.2%) | 1,116 (79.8%) |
| Mobile Home / Other | 2,707 (68.1%) | 1,268 (31.9%) |
| Total | 22,174 (72.9%) | 8,240 (27.1%) |
Housing Structures by Number of Rooms in Carteret County
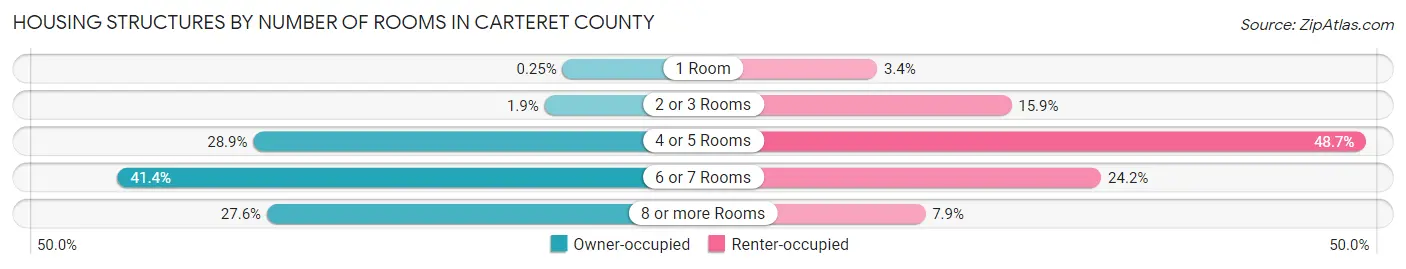
| Number of Rooms | Owner-occupied | Renter-occupied |
| 1 Room | 56 (0.3%) | 283 (3.4%) |
| 2 or 3 Rooms | 424 (1.9%) | 1,306 (15.9%) |
| 4 or 5 Rooms | 6,398 (28.8%) | 4,010 (48.7%) |
| 6 or 7 Rooms | 9,178 (41.4%) | 1,991 (24.2%) |
| 8 or more Rooms | 6,118 (27.6%) | 650 (7.9%) |
| Total | 22,174 (100.0%) | 8,240 (100.0%) |
Housing Structure by Heating Type in Carteret County
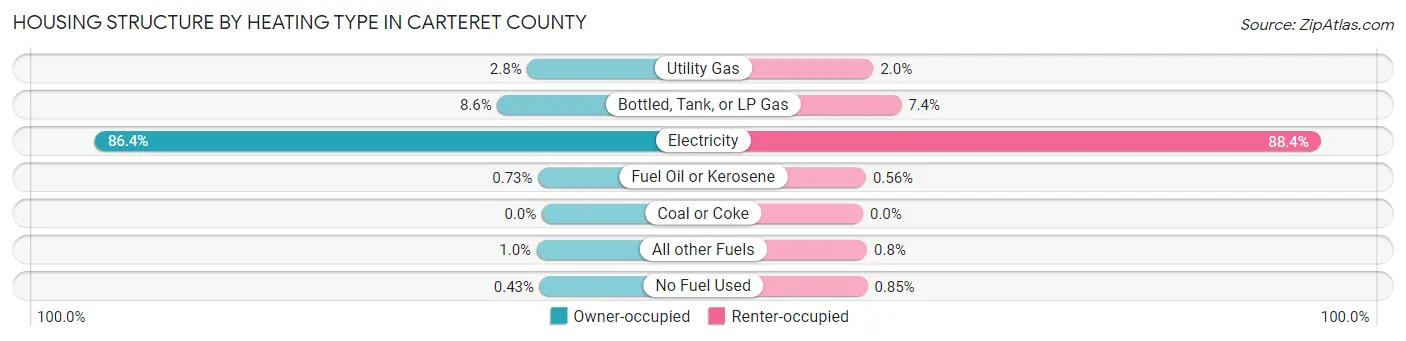
| Heating Type | Owner-occupied | Renter-occupied |
| Utility Gas | 626 (2.8%) | 166 (2.0%) |
| Bottled, Tank, or LP Gas | 1,910 (8.6%) | 608 (7.4%) |
| Electricity | 19,159 (86.4%) | 7,284 (88.4%) |
| Fuel Oil or Kerosene | 162 (0.7%) | 46 (0.6%) |
| Coal or Coke | 0 (0.0%) | 0 (0.0%) |
| All other Fuels | 221 (1.0%) | 66 (0.8%) |
| No Fuel Used | 96 (0.4%) | 70 (0.9%) |
| Total | 22,174 (100.0%) | 8,240 (100.0%) |
Household Vehicle Usage in Carteret County
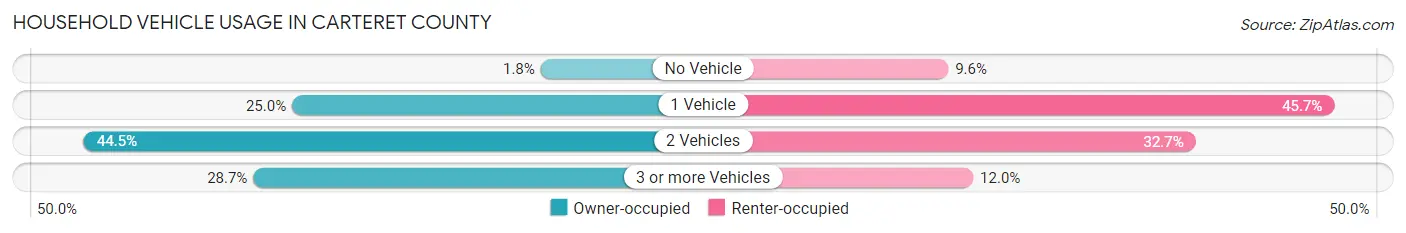
| Vehicles per Household | Owner-occupied | Renter-occupied |
| No Vehicle | 405 (1.8%) | 794 (9.6%) |
| 1 Vehicle | 5,553 (25.0%) | 3,763 (45.7%) |
| 2 Vehicles | 9,860 (44.5%) | 2,697 (32.7%) |
| 3 or more Vehicles | 6,356 (28.7%) | 986 (12.0%) |
| Total | 22,174 (100.0%) | 8,240 (100.0%) |
Real Estate & Mortgages in Carteret County
Real Estate and Mortgage Overview in Carteret County
| Characteristic | Without Mortgage | With Mortgage |
| Housing Units | 9,967 | 12,207 |
| Median Property Value | $251,200 | $295,200 |
| Median Household Income | $60,595 | $2,765 |
| Monthly Housing Costs | $485 | $1,167 |
| Real Estate Taxes | $1,249 | $164 |
Property Value by Mortgage Status in Carteret County
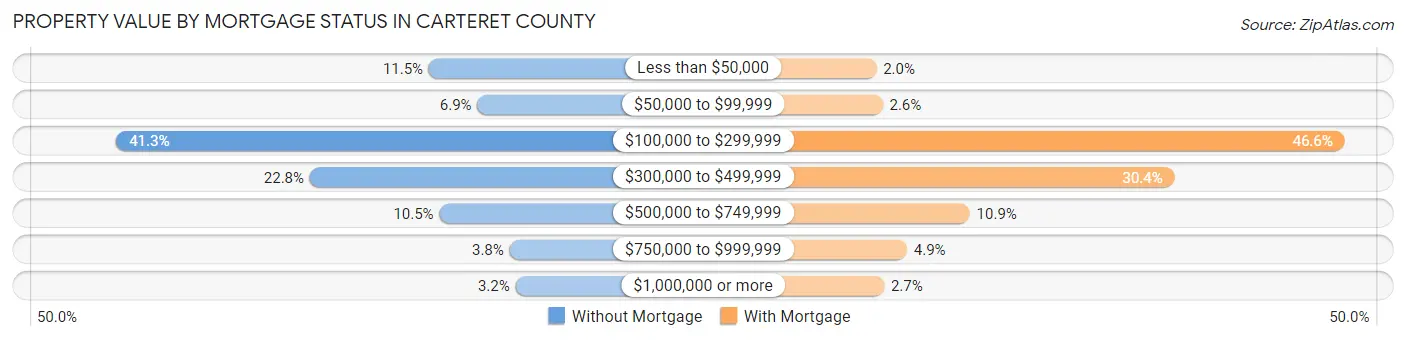
| Property Value | Without Mortgage | With Mortgage |
| Less than $50,000 | 1,145 (11.5%) | 241 (2.0%) |
| $50,000 to $99,999 | 685 (6.9%) | 314 (2.6%) |
| $100,000 to $299,999 | 4,113 (41.3%) | 5,687 (46.6%) |
| $300,000 to $499,999 | 2,275 (22.8%) | 3,710 (30.4%) |
| $500,000 to $749,999 | 1,046 (10.5%) | 1,327 (10.9%) |
| $750,000 to $999,999 | 380 (3.8%) | 597 (4.9%) |
| $1,000,000 or more | 323 (3.2%) | 331 (2.7%) |
| Total | 9,967 (100.0%) | 12,207 (100.0%) |
Household Income by Mortgage Status in Carteret County

| Household Income | Without Mortgage | With Mortgage |
| Less than $10,000 | 521 (5.2%) | 408 (3.3%) |
| $10,000 to $24,999 | 1,393 (14.0%) | 166 (1.4%) |
| $25,000 to $34,999 | 861 (8.6%) | 508 (4.2%) |
| $35,000 to $49,999 | 1,593 (16.0%) | 541 (4.4%) |
| $50,000 to $74,999 | 1,793 (18.0%) | 1,081 (8.9%) |
| $75,000 to $99,999 | 1,241 (12.4%) | 2,115 (17.3%) |
| $100,000 to $149,999 | 1,263 (12.7%) | 1,945 (15.9%) |
| $150,000 or more | 1,302 (13.1%) | 3,086 (25.3%) |
| Total | 9,967 (100.0%) | 12,207 (100.0%) |
Property Value to Household Income Ratio in Carteret County
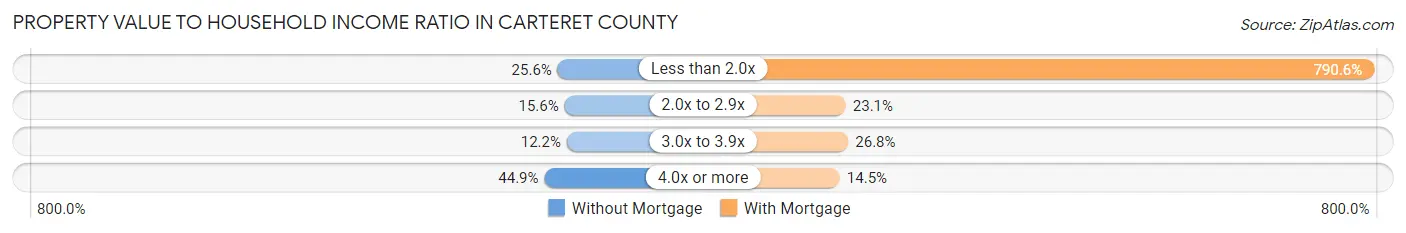
| Value-to-Income Ratio | Without Mortgage | With Mortgage |
| Less than 2.0x | 2,547 (25.6%) | 96,509 (790.6%) |
| 2.0x to 2.9x | 1,550 (15.5%) | 2,825 (23.1%) |
| 3.0x to 3.9x | 1,217 (12.2%) | 3,273 (26.8%) |
| 4.0x or more | 4,474 (44.9%) | 1,770 (14.5%) |
| Total | 9,967 (100.0%) | 12,207 (100.0%) |
Real Estate Taxes by Mortgage Status in Carteret County

| Property Taxes | Without Mortgage | With Mortgage |
| Less than $800 | 2,537 (25.5%) | 21 (0.2%) |
| $800 to $1,499 | 3,378 (33.9%) | 1,933 (15.8%) |
| $800 to $1,499 | 3,552 (35.6%) | 5,044 (41.3%) |
| Total | 9,967 (100.0%) | 12,207 (100.0%) |
Health & Disability in Carteret County
Health Insurance Coverage by Age in Carteret County
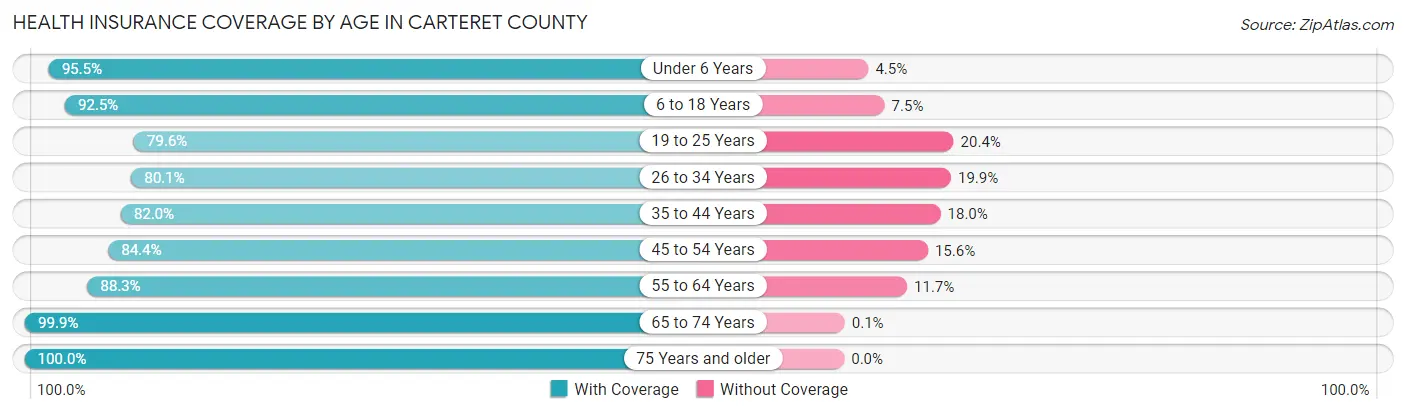
| Age Bracket | With Coverage | Without Coverage |
| Under 6 Years | 3,051 (95.5%) | 144 (4.5%) |
| 6 to 18 Years | 8,684 (92.5%) | 707 (7.5%) |
| 19 to 25 Years | 3,249 (79.6%) | 832 (20.4%) |
| 26 to 34 Years | 4,516 (80.1%) | 1,123 (19.9%) |
| 35 to 44 Years | 5,894 (82.0%) | 1,290 (18.0%) |
| 45 to 54 Years | 7,120 (84.4%) | 1,317 (15.6%) |
| 55 to 64 Years | 10,198 (88.3%) | 1,352 (11.7%) |
| 65 to 74 Years | 10,705 (99.9%) | 11 (0.1%) |
| 75 Years and older | 6,662 (100.0%) | 0 (0.0%) |
| Total | 60,079 (89.9%) | 6,776 (10.1%) |
Health Insurance Coverage by Citizenship Status in Carteret County
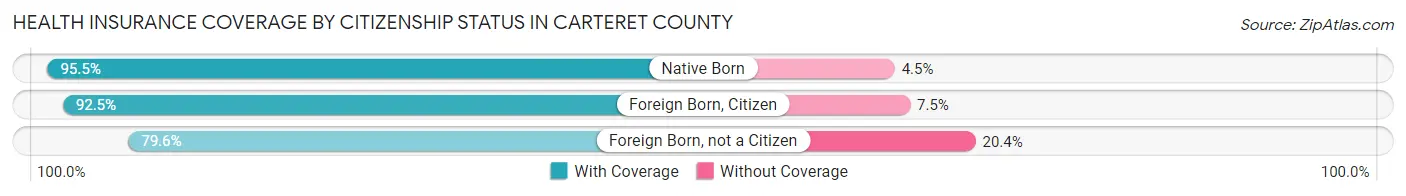
| Citizenship Status | With Coverage | Without Coverage |
| Native Born | 3,051 (95.5%) | 144 (4.5%) |
| Foreign Born, Citizen | 8,684 (92.5%) | 707 (7.5%) |
| Foreign Born, not a Citizen | 3,249 (79.6%) | 832 (20.4%) |
Health Insurance Coverage by Household Income in Carteret County
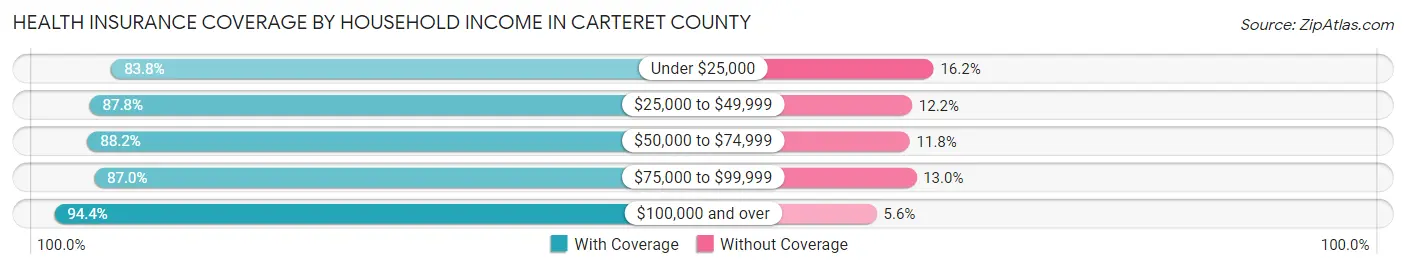
| Household Income | With Coverage | Without Coverage |
| Under $25,000 | 6,025 (83.8%) | 1,168 (16.2%) |
| $25,000 to $49,999 | 11,000 (87.8%) | 1,527 (12.2%) |
| $50,000 to $74,999 | 9,958 (88.2%) | 1,329 (11.8%) |
| $75,000 to $99,999 | 8,626 (87.0%) | 1,290 (13.0%) |
| $100,000 and over | 24,217 (94.4%) | 1,435 (5.6%) |
Public vs Private Health Insurance Coverage by Age in Carteret County
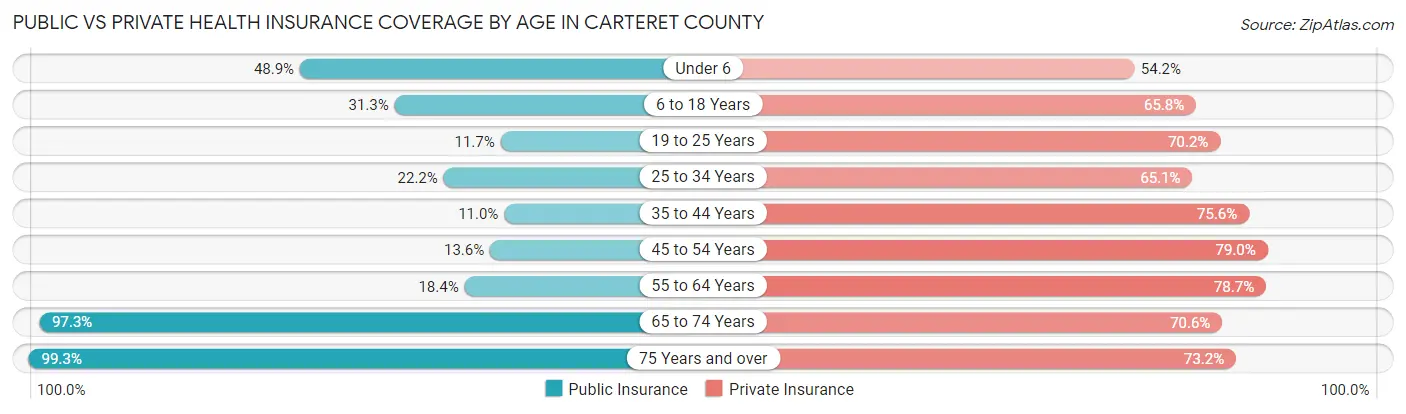
| Age Bracket | Public Insurance | Private Insurance |
| Under 6 | 1,562 (48.9%) | 1,732 (54.2%) |
| 6 to 18 Years | 2,942 (31.3%) | 6,175 (65.7%) |
| 19 to 25 Years | 476 (11.7%) | 2,866 (70.2%) |
| 25 to 34 Years | 1,253 (22.2%) | 3,670 (65.1%) |
| 35 to 44 Years | 789 (11.0%) | 5,431 (75.6%) |
| 45 to 54 Years | 1,148 (13.6%) | 6,668 (79.0%) |
| 55 to 64 Years | 2,119 (18.3%) | 9,093 (78.7%) |
| 65 to 74 Years | 10,430 (97.3%) | 7,566 (70.6%) |
| 75 Years and over | 6,613 (99.3%) | 4,875 (73.2%) |
| Total | 27,332 (40.9%) | 48,076 (71.9%) |
Disability Status by Sex by Age in Carteret County
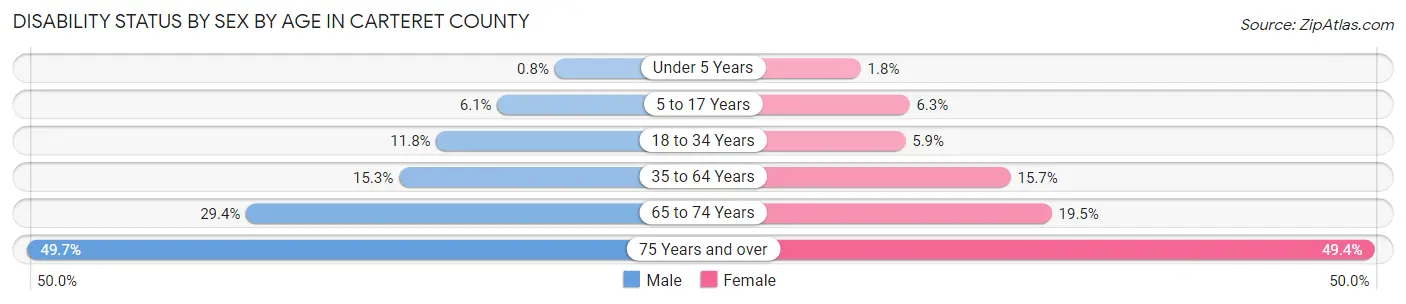
| Age Bracket | Male | Female |
| Under 5 Years | 11 (0.8%) | 22 (1.8%) |
| 5 to 17 Years | 288 (6.1%) | 273 (6.3%) |
| 18 to 34 Years | 636 (11.8%) | 308 (5.9%) |
| 35 to 64 Years | 1,974 (15.2%) | 2,227 (15.7%) |
| 65 to 74 Years | 1,494 (29.4%) | 1,098 (19.5%) |
| 75 Years and over | 1,503 (49.7%) | 1,798 (49.4%) |
Disability Class by Sex by Age in Carteret County
Disability Class: Hearing Difficulty
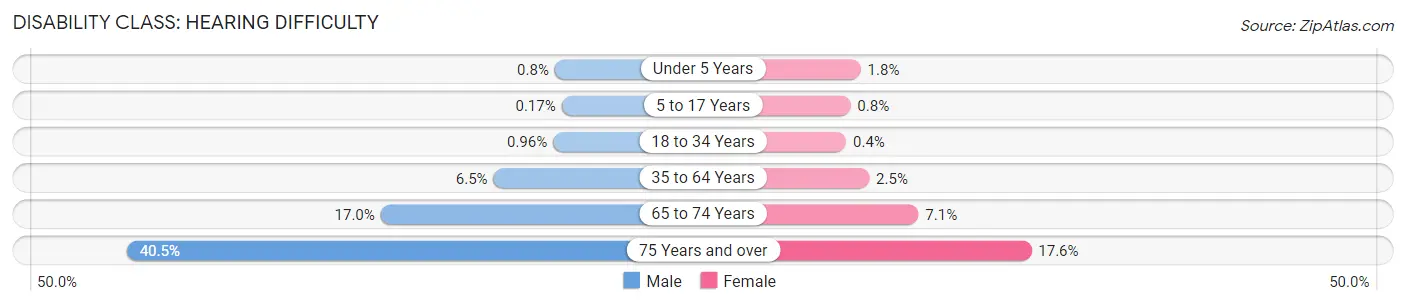
| Age Bracket | Male | Female |
| Under 5 Years | 11 (0.8%) | 22 (1.8%) |
| 5 to 17 Years | 8 (0.2%) | 35 (0.8%) |
| 18 to 34 Years | 52 (1.0%) | 21 (0.4%) |
| 35 to 64 Years | 840 (6.5%) | 362 (2.5%) |
| 65 to 74 Years | 861 (17.0%) | 401 (7.1%) |
| 75 Years and over | 1,225 (40.5%) | 640 (17.6%) |
Disability Class: Vision Difficulty
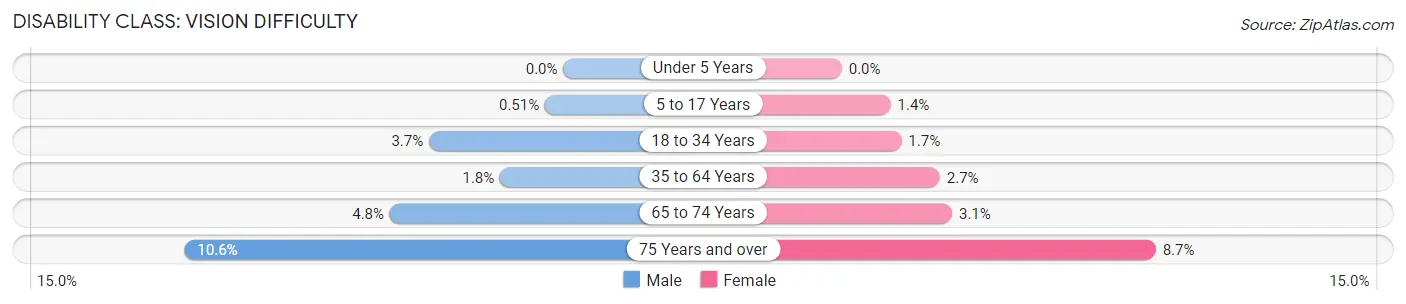
| Age Bracket | Male | Female |
| Under 5 Years | 0 (0.0%) | 0 (0.0%) |
| 5 to 17 Years | 24 (0.5%) | 59 (1.4%) |
| 18 to 34 Years | 202 (3.7%) | 87 (1.7%) |
| 35 to 64 Years | 228 (1.8%) | 389 (2.7%) |
| 65 to 74 Years | 245 (4.8%) | 173 (3.1%) |
| 75 Years and over | 319 (10.5%) | 318 (8.7%) |
Disability Class: Cognitive Difficulty
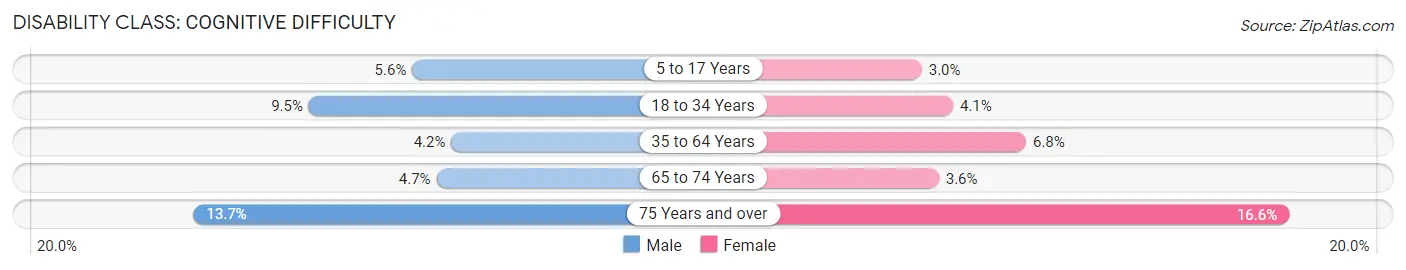
| Age Bracket | Male | Female |
| 5 to 17 Years | 264 (5.6%) | 129 (3.0%) |
| 18 to 34 Years | 510 (9.5%) | 216 (4.1%) |
| 35 to 64 Years | 538 (4.2%) | 973 (6.8%) |
| 65 to 74 Years | 239 (4.7%) | 203 (3.6%) |
| 75 Years and over | 415 (13.7%) | 604 (16.6%) |
Disability Class: Ambulatory Difficulty
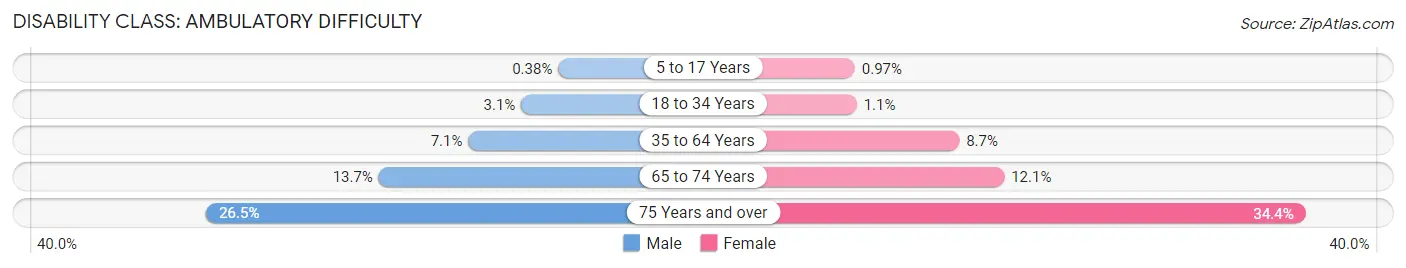
| Age Bracket | Male | Female |
| 5 to 17 Years | 18 (0.4%) | 42 (1.0%) |
| 18 to 34 Years | 169 (3.1%) | 58 (1.1%) |
| 35 to 64 Years | 914 (7.1%) | 1,241 (8.7%) |
| 65 to 74 Years | 696 (13.7%) | 680 (12.1%) |
| 75 Years and over | 802 (26.5%) | 1,253 (34.4%) |
Disability Class: Self-Care Difficulty
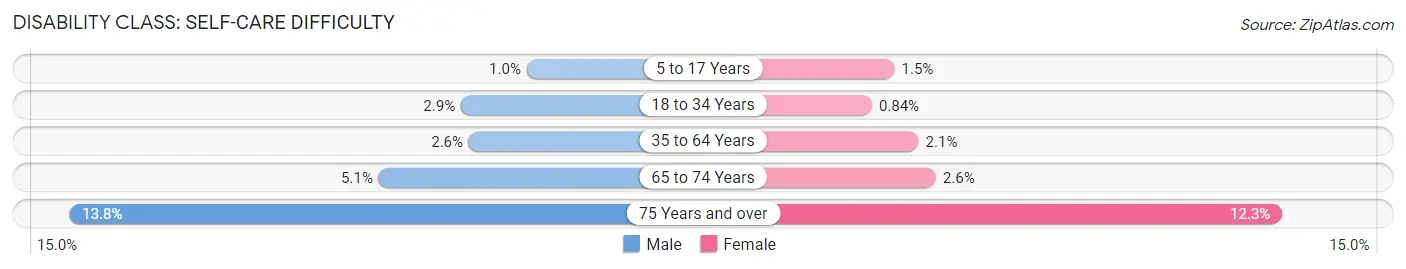
| Age Bracket | Male | Female |
| 5 to 17 Years | 48 (1.0%) | 64 (1.5%) |
| 18 to 34 Years | 154 (2.9%) | 44 (0.8%) |
| 35 to 64 Years | 340 (2.6%) | 304 (2.1%) |
| 65 to 74 Years | 261 (5.1%) | 148 (2.6%) |
| 75 Years and over | 416 (13.8%) | 446 (12.3%) |
Technology Access in Carteret County
Computing Device Access in Carteret County
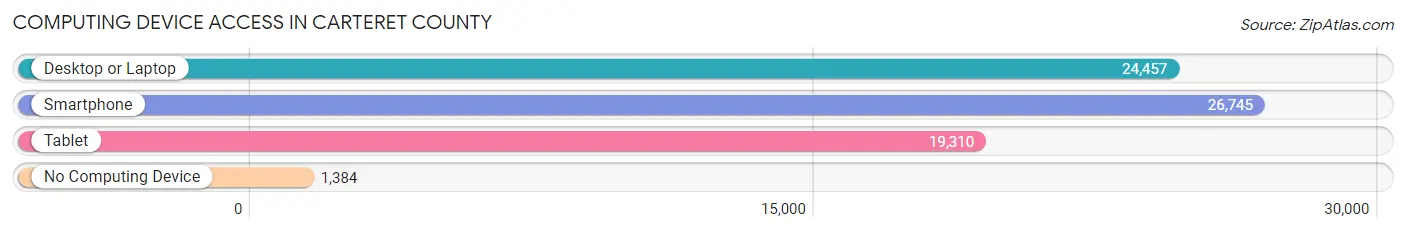
| Device Type | # Households | % Households |
| Desktop or Laptop | 24,457 | 80.4% |
| Smartphone | 26,745 | 87.9% |
| Tablet | 19,310 | 63.5% |
| No Computing Device | 1,384 | 4.5% |
| Total | 30,414 | 100.0% |
Internet Access in Carteret County
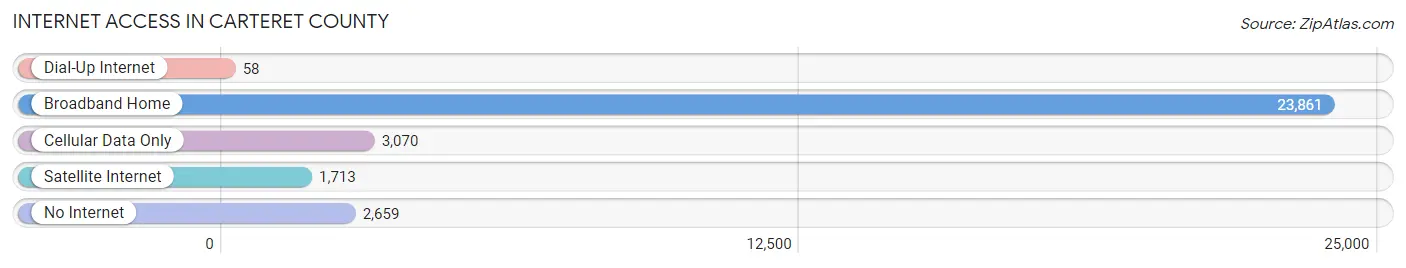
| Internet Type | # Households | % Households |
| Dial-Up Internet | 58 | 0.2% |
| Broadband Home | 23,861 | 78.4% |
| Cellular Data Only | 3,070 | 10.1% |
| Satellite Internet | 1,713 | 5.6% |
| No Internet | 2,659 | 8.7% |
| Total | 30,414 | 100.0% |
Carteret County Summary
Carteret County is located in the eastern part of North Carolina, along the coast of the Atlantic Ocean. It is bordered by Onslow County to the north, Craven County to the west, and Pamlico County to the south. The county seat is Beaufort, and the county is part of the Crystal Coast region.
History
Carteret County was formed in 1722 from parts of Craven and Beaufort counties. It was named for Sir George Carteret, one of the original eight Lords Proprietors of the Province of Carolina. The county was originally part of the Coree Indian territory, and the first European settlers arrived in the area in the early 1700s.
The county was an important port during the American Revolution, and the Battle of Bogue Inlet was fought in the area in 1775. During the Civil War, the county was occupied by Union forces, and the Battle of Fort Macon was fought in 1862.
Geography
Carteret County covers an area of 545 square miles, with a population of 67,844 as of the 2020 census. The county is located on the Atlantic coast, and is bordered by Onslow County to the north, Craven County to the west, and Pamlico County to the south. The county seat is Beaufort, and the county is part of the Crystal Coast region.
The county is divided into two distinct regions: the mainland and the barrier islands. The mainland is mostly flat, with some rolling hills, and is home to the Croatan National Forest. The barrier islands are made up of a series of barrier islands, including Bogue Banks, Shackleford Banks, and Cape Lookout National Seashore.
Economy
The economy of Carteret County is largely based on tourism, fishing, and agriculture. The county is home to several popular tourist destinations, including the Cape Lookout National Seashore, the North Carolina Aquarium at Pine Knoll Shores, and the Fort Macon State Park.
Fishing is an important part of the local economy, with the county’s commercial fishing industry providing a significant source of income. The county is also home to several farms, which produce a variety of crops, including corn, soybeans, and tobacco.
Demographics
As of the 2020 census, Carteret County had a population of 67,844. The population is predominantly white (83.3%), with African Americans making up 11.2% of the population, and Hispanics making up 4.2%. The median household income is $50,845, and the median home value is $212,400.
The county is home to several military installations, including Marine Corps Air Station Cherry Point, Marine Corps Base Camp Lejeune, and Marine Corps Air Station New River. The county is also home to several colleges and universities, including Carteret Community College, East Carolina University, and the University of North Carolina at Wilmington.
Common Questions
What is the Total Population of Carteret County?
Total Population of Carteret County is 68,353.
What is the Total Male Population of Carteret County?
Total Male Population of Carteret County is 33,661.
What is the Total Female Population of Carteret County?
Total Female Population of Carteret County is 34,692.
What is the Ratio of Males per 100 Females in Carteret County?
There are 97.03 Males per 100 Females in Carteret County.
What is the Ratio of Females per 100 Males in Carteret County?
There are 103.06 Females per 100 Males in Carteret County.
What is the Median Population Age in Carteret County?
Median Population Age in Carteret County is 49.9 Years.
What is the Average Family Size in Carteret County
Average Family Size in Carteret County is 2.7 People.
What is the Average Household Size in Carteret County
Average Household Size in Carteret County is 2.2 People.
What is Per Capita Income in Carteret County?
Per Capita income in Carteret County is $39,817.
What is the Median Family Income in Carteret County?
Median Family Income in Carteret County is $86,312.
What is the Median Household income in Carteret County?
Median Household Income in Carteret County is $66,965.
What is Income or Wage Gap in Carteret County?
Income or Wage Gap in Carteret County is 29.5%.
Women in Carteret County earn 70.5 cents for every dollar earned by a man.
What is Family Income Deficit in Carteret County?
Family Income Deficit in Carteret County is $8,857.
Families that are below poverty line in Carteret County earn $8,857 less on average than the poverty threshold level.
What is Inequality or Gini Index in Carteret County?
Inequality or Gini Index in Carteret County is 0.45.
How Large is the Labor Force in Carteret County?
There are 32,266 People in the Labor Forcein in Carteret County.
What is the Percentage of People in the Labor Force in Carteret County?
55.4% of People are in the Labor Force in Carteret County.
What is the Unemployment Rate in Carteret County?
Unemployment Rate in Carteret County is 4.9%.