Caldwell County, NC
Caldwell County Map
Caldwell County Overview
80,716
TOTAL POPULATION
40,091
MALE POPULATION
40,625
FEMALE POPULATION
98.69
MALES / 100 FEMALES
101.33
FEMALES / 100 MALES
45.1
MEDIAN AGE
3.0
AVG FAMILY SIZE
2.5
AVG HOUSEHOLD SIZE
$29,125
PER CAPITA INCOME
$67,132
AVG FAMILY INCOME
$52,362
AVG HOUSEHOLD INCOME
26.6%
WAGE / INCOME GAP [ % ]
73.4¢/ $1
WAGE / INCOME GAP [ $ ]
$9,600
FAMILY INCOME DEFICIT
0.44
INEQUALITY / GINI INDEX
38,729
LABOR FORCE [ PEOPLE ]
58.1%
PERCENT IN LABOR FORCE
5.8%
UNEMPLOYMENT RATE
Caldwell County Area Codes
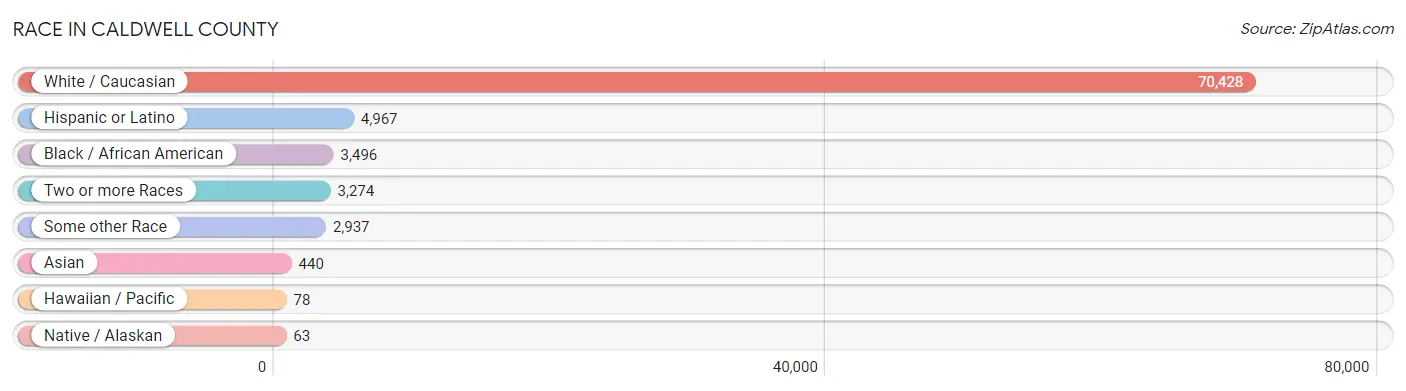
Race in Caldwell County
The most populous races in Caldwell County are White / Caucasian (70,428 | 87.3%), Hispanic or Latino (4,967 | 6.1%), and Black / African American (3,496 | 4.3%).
| Race | # Population | % Population |
| Asian | 440 | 0.5% |
| Black / African American | 3,496 | 4.3% |
| Hawaiian / Pacific | 78 | 0.1% |
| Hispanic or Latino | 4,967 | 6.1% |
| Native / Alaskan | 63 | 0.1% |
| White / Caucasian | 70,428 | 87.3% |
| Two or more Races | 3,274 | 4.1% |
| Some other Race | 2,937 | 3.6% |
| Total | 80,716 | 100.0% |
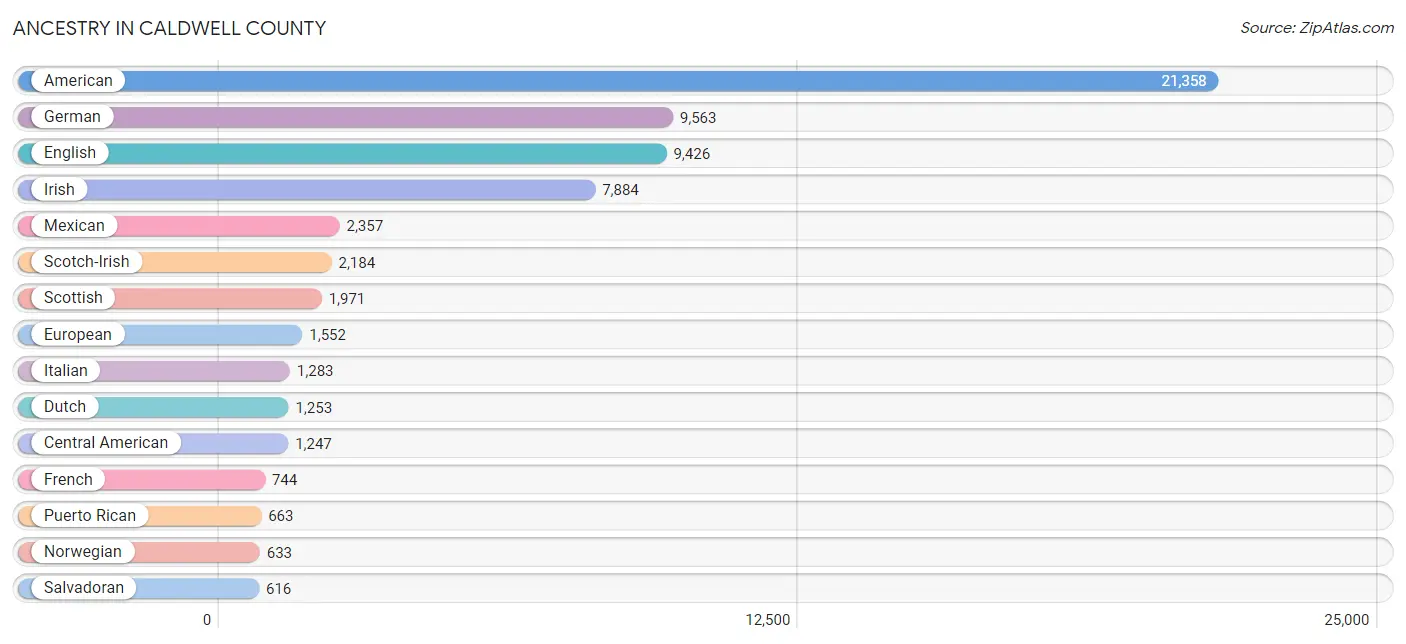
Ancestry in Caldwell County
The most populous ancestries reported in Caldwell County are American (21,358 | 26.5%), German (9,563 | 11.8%), English (9,426 | 11.7%), Irish (7,884 | 9.8%), and Mexican (2,357 | 2.9%), together accounting for 62.7% of all Caldwell County residents.
| Ancestry | # Population | % Population |
| African | 217 | 0.3% |
| Alsatian | 18 | 0.0% |
| American | 21,358 | 26.5% |
| Argentinean | 20 | 0.0% |
| Armenian | 14 | 0.0% |
| Australian | 9 | 0.0% |
| Austrian | 36 | 0.0% |
| Basque | 109 | 0.1% |
| Belgian | 59 | 0.1% |
| Bhutanese | 146 | 0.2% |
| Blackfeet | 39 | 0.1% |
| British | 328 | 0.4% |
| Burmese | 155 | 0.2% |
| Cambodian | 58 | 0.1% |
| Canadian | 100 | 0.1% |
| Celtic | 9 | 0.0% |
| Central American | 1,247 | 1.5% |
| Cherokee | 151 | 0.2% |
| Colombian | 190 | 0.2% |
| Costa Rican | 6 | 0.0% |
| Croatian | 11 | 0.0% |
| Cuban | 35 | 0.0% |
| Czech | 145 | 0.2% |
| Czechoslovakian | 10 | 0.0% |
| Danish | 55 | 0.1% |
| Dominican | 11 | 0.0% |
| Dutch | 1,253 | 1.5% |
| Eastern European | 45 | 0.1% |
| Ecuadorian | 48 | 0.1% |
| English | 9,426 | 11.7% |
| European | 1,552 | 1.9% |
| Finnish | 6 | 0.0% |
| French | 744 | 0.9% |
| French Canadian | 136 | 0.2% |
| German | 9,563 | 11.8% |
| Greek | 28 | 0.0% |
| Guamanian / Chamorro | 9 | 0.0% |
| Guatemalan | 140 | 0.2% |
| Honduran | 485 | 0.6% |
| Hungarian | 136 | 0.2% |
| Indian (Asian) | 148 | 0.2% |
| Iranian | 2 | 0.0% |
| Irish | 7,884 | 9.8% |
| Italian | 1,283 | 1.6% |
| Jamaican | 51 | 0.1% |
| Korean | 256 | 0.3% |
| Laotian | 20 | 0.0% |
| Lithuanian | 20 | 0.0% |
| Lumbee | 6 | 0.0% |
| Mexican | 2,357 | 2.9% |
| Mexican American Indian | 3 | 0.0% |
| Native Hawaiian | 52 | 0.1% |
| Navajo | 3 | 0.0% |
| Nigerian | 9 | 0.0% |
| Northern European | 24 | 0.0% |
| Norwegian | 633 | 0.8% |
| Pakistani | 20 | 0.0% |
| Pennsylvania German | 34 | 0.0% |
| Peruvian | 22 | 0.0% |
| Polish | 386 | 0.5% |
| Portuguese | 119 | 0.2% |
| Puerto Rican | 663 | 0.8% |
| Romanian | 59 | 0.1% |
| Russian | 37 | 0.1% |
| Salvadoran | 616 | 0.8% |
| Samoan | 28 | 0.0% |
| Scandinavian | 162 | 0.2% |
| Scotch-Irish | 2,184 | 2.7% |
| Scottish | 1,971 | 2.4% |
| Slavic | 13 | 0.0% |
| Slovak | 16 | 0.0% |
| South American | 307 | 0.4% |
| South American Indian | 41 | 0.1% |
| Spaniard | 51 | 0.1% |
| Spanish | 57 | 0.1% |
| Subsaharan African | 226 | 0.3% |
| Swedish | 376 | 0.5% |
| Swiss | 17 | 0.0% |
| Thai | 57 | 0.1% |
| Ukrainian | 37 | 0.1% |
| Venezuelan | 27 | 0.0% |
| Welsh | 453 | 0.6% |
| West Indian | 26 | 0.0% | View All 83 Rows |
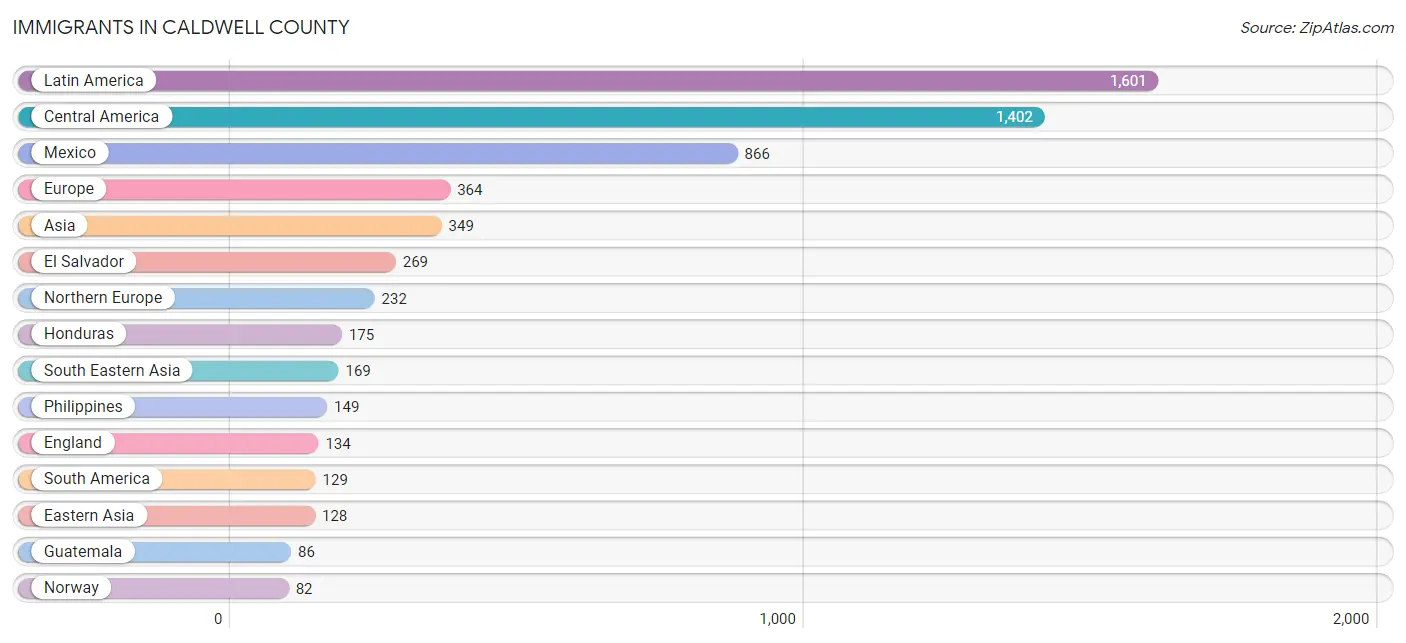
Immigrants in Caldwell County
The most numerous immigrant groups reported in Caldwell County came from Latin America (1,601 | 2.0%), Central America (1,402 | 1.7%), Mexico (866 | 1.1%), Europe (364 | 0.4%), and Asia (349 | 0.4%), together accounting for 5.7% of all Caldwell County residents.
| Immigration Origin | # Population | % Population |
| Africa | 9 | 0.0% |
| Argentina | 4 | 0.0% |
| Asia | 349 | 0.4% |
| Brazil | 18 | 0.0% |
| Canada | 81 | 0.1% |
| Caribbean | 70 | 0.1% |
| Central America | 1,402 | 1.7% |
| China | 3 | 0.0% |
| Colombia | 58 | 0.1% |
| Costa Rica | 6 | 0.0% |
| Cuba | 8 | 0.0% |
| Czechoslovakia | 25 | 0.0% |
| Dominican Republic | 11 | 0.0% |
| Eastern Asia | 128 | 0.2% |
| Eastern Europe | 78 | 0.1% |
| Ecuador | 19 | 0.0% |
| El Salvador | 269 | 0.3% |
| England | 134 | 0.2% |
| Europe | 364 | 0.4% |
| France | 3 | 0.0% |
| Germany | 51 | 0.1% |
| Guatemala | 86 | 0.1% |
| Honduras | 175 | 0.2% |
| Iran | 14 | 0.0% |
| Japan | 62 | 0.1% |
| Korea | 63 | 0.1% |
| Latin America | 1,601 | 2.0% |
| Mexico | 866 | 1.1% |
| Moldova | 23 | 0.0% |
| Nigeria | 9 | 0.0% |
| Northern Europe | 232 | 0.3% |
| Norway | 82 | 0.1% |
| Philippines | 149 | 0.2% |
| Scotland | 7 | 0.0% |
| Serbia | 10 | 0.0% |
| South America | 129 | 0.2% |
| South Central Asia | 14 | 0.0% |
| South Eastern Asia | 169 | 0.2% |
| Sweden | 9 | 0.0% |
| Thailand | 20 | 0.0% |
| Trinidad and Tobago | 51 | 0.1% |
| Ukraine | 20 | 0.0% |
| Uruguay | 12 | 0.0% |
| Venezuela | 18 | 0.0% |
| Western Africa | 9 | 0.0% |
| Western Asia | 38 | 0.1% |
| Western Europe | 54 | 0.1% |
| Yemen | 38 | 0.1% | View All 48 Rows |
Sex and Age in Caldwell County
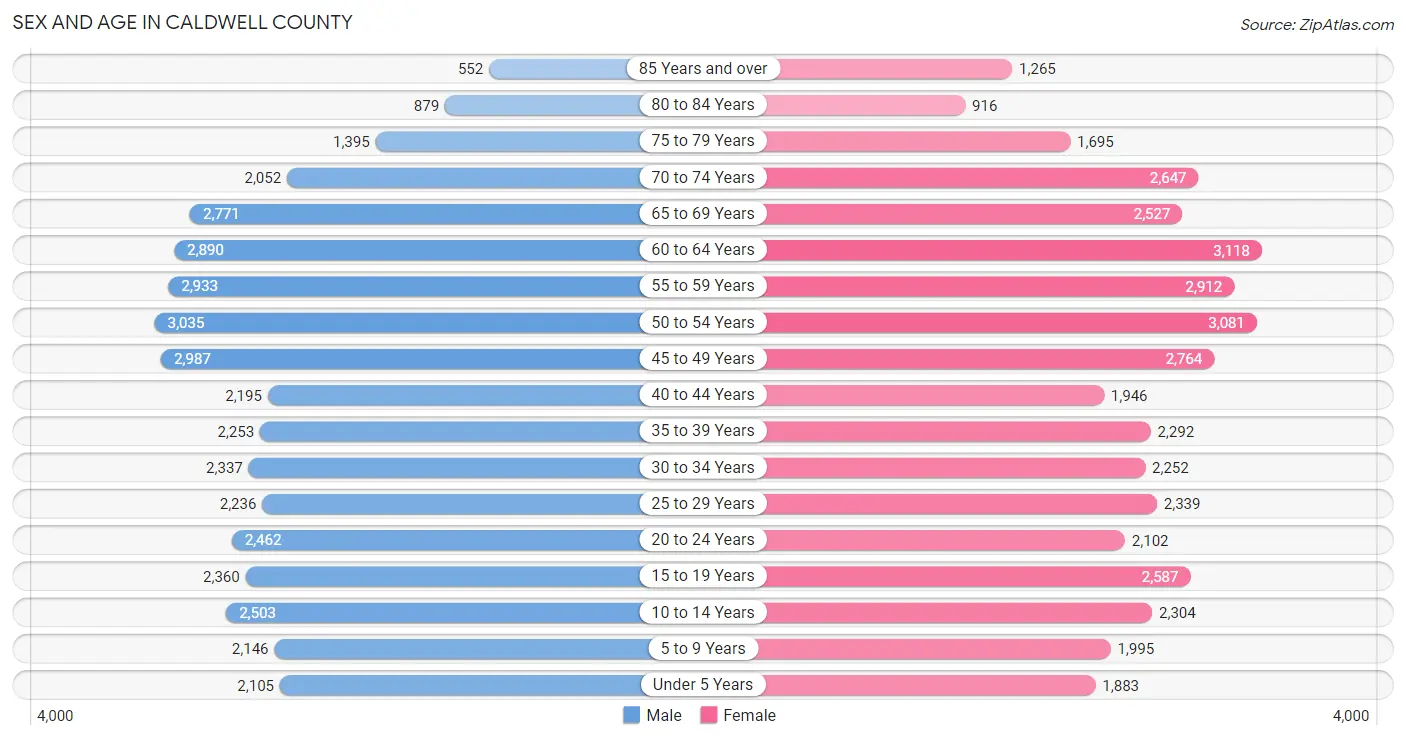
Sex and Age in Caldwell County
The most populous age groups in Caldwell County are 50 to 54 Years (3,035 | 7.6%) for men and 60 to 64 Years (3,118 | 7.7%) for women.
| Age Bracket | Male | Female |
| Under 5 Years | 2,105 (5.2%) | 1,883 (4.6%) |
| 5 to 9 Years | 2,146 (5.3%) | 1,995 (4.9%) |
| 10 to 14 Years | 2,503 (6.2%) | 2,304 (5.7%) |
| 15 to 19 Years | 2,360 (5.9%) | 2,587 (6.4%) |
| 20 to 24 Years | 2,462 (6.1%) | 2,102 (5.2%) |
| 25 to 29 Years | 2,236 (5.6%) | 2,339 (5.8%) |
| 30 to 34 Years | 2,337 (5.8%) | 2,252 (5.5%) |
| 35 to 39 Years | 2,253 (5.6%) | 2,292 (5.6%) |
| 40 to 44 Years | 2,195 (5.5%) | 1,946 (4.8%) |
| 45 to 49 Years | 2,987 (7.4%) | 2,764 (6.8%) |
| 50 to 54 Years | 3,035 (7.6%) | 3,081 (7.6%) |
| 55 to 59 Years | 2,933 (7.3%) | 2,912 (7.2%) |
| 60 to 64 Years | 2,890 (7.2%) | 3,118 (7.7%) |
| 65 to 69 Years | 2,771 (6.9%) | 2,527 (6.2%) |
| 70 to 74 Years | 2,052 (5.1%) | 2,647 (6.5%) |
| 75 to 79 Years | 1,395 (3.5%) | 1,695 (4.2%) |
| 80 to 84 Years | 879 (2.2%) | 916 (2.2%) |
| 85 Years and over | 552 (1.4%) | 1,265 (3.1%) |
| Total | 40,091 (100.0%) | 40,625 (100.0%) |
Families and Households in Caldwell County
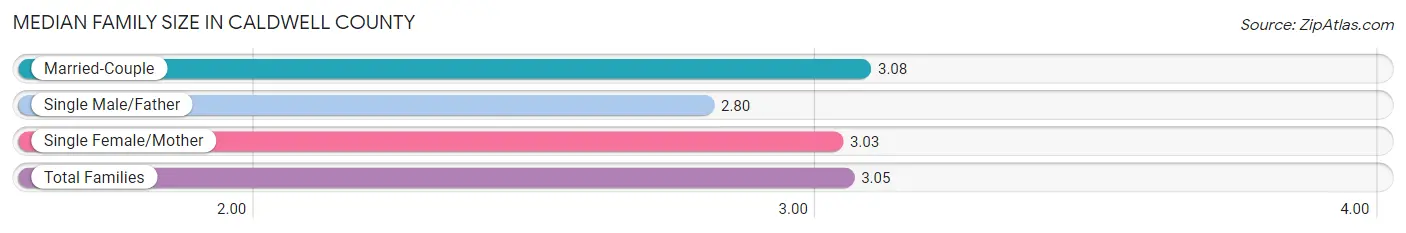
Median Family Size in Caldwell County
The median family size in Caldwell County is 3.05 persons per family, with married-couple families (15,304 | 71.3%) accounting for the largest median family size of 3.08 persons per family. On the other hand, single male/father families (1,717 | 8.0%) represent the smallest median family size with 2.80 persons per family.
| Family Type | # Families | Family Size |
| Married-Couple | 15,304 (71.3%) | 3.08 |
| Single Male/Father | 1,717 (8.0%) | 2.80 |
| Single Female/Mother | 4,446 (20.7%) | 3.03 |
| Total Families | 21,467 (100.0%) | 3.05 |
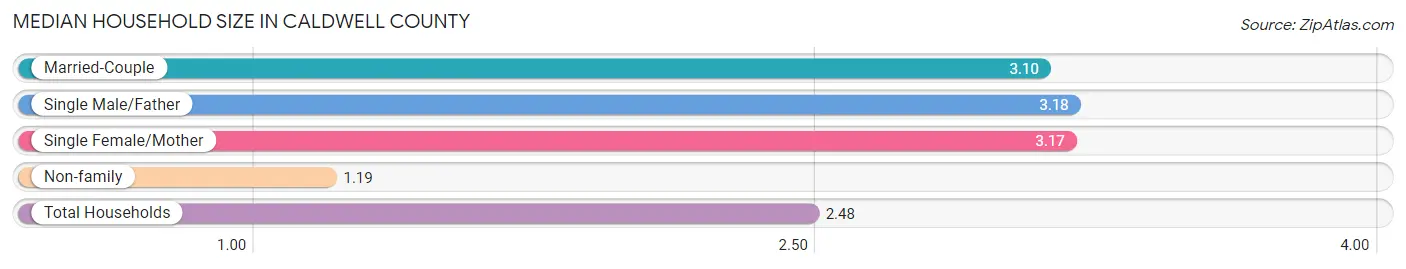
Median Household Size in Caldwell County
The median household size in Caldwell County is 2.48 persons per household, with single male/father households (1,717 | 5.3%) accounting for the largest median household size of 3.18 persons per household. non-family households (10,653 | 33.2%) represent the smallest median household size with 1.19 persons per household.
| Household Type | # Households | Household Size |
| Married-Couple | 15,304 (47.6%) | 3.10 |
| Single Male/Father | 1,717 (5.3%) | 3.18 |
| Single Female/Mother | 4,446 (13.8%) | 3.17 |
| Non-family | 10,653 (33.2%) | 1.19 |
| Total Households | 32,120 (100.0%) | 2.48 |
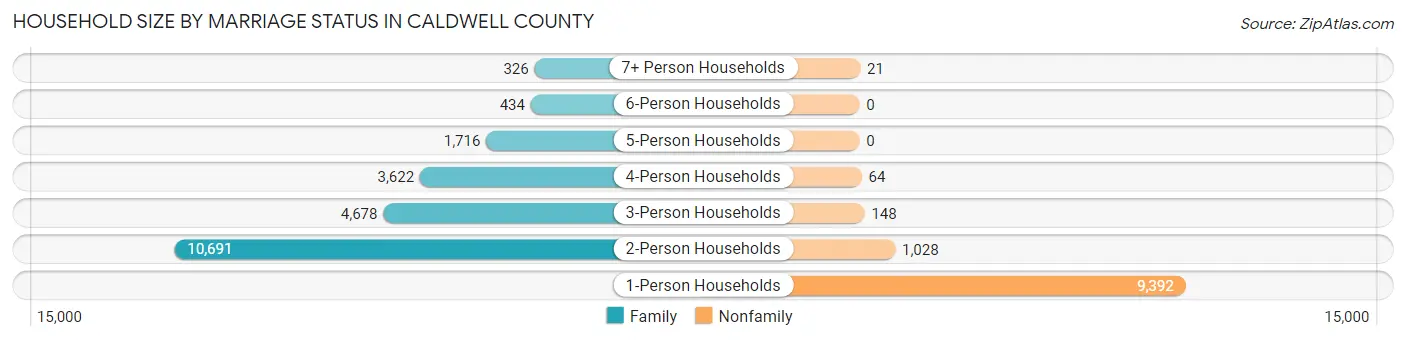
Household Size by Marriage Status in Caldwell County
Out of a total of 32,120 households in Caldwell County, 21,467 (66.8%) are family households, while 10,653 (33.2%) are nonfamily households. The most numerous type of family households are 2-person households, comprising 10,691, and the most common type of nonfamily households are 1-person households, comprising 9,392.
| Household Size | Family Households | Nonfamily Households |
| 1-Person Households | - | 9,392 (29.2%) |
| 2-Person Households | 10,691 (33.3%) | 1,028 (3.2%) |
| 3-Person Households | 4,678 (14.6%) | 148 (0.5%) |
| 4-Person Households | 3,622 (11.3%) | 64 (0.2%) |
| 5-Person Households | 1,716 (5.3%) | 0 (0.0%) |
| 6-Person Households | 434 (1.3%) | 0 (0.0%) |
| 7+ Person Households | 326 (1.0%) | 21 (0.1%) |
| Total | 21,467 (66.8%) | 10,653 (33.2%) |
Female Fertility in Caldwell County
Fertility by Age in Caldwell County
Average fertility rate in Caldwell County is 36.0 births per 1,000 women. Women in the age bracket of 20 to 34 years have the highest fertility rate with 64.0 births per 1,000 women. Women in the age bracket of 20 to 34 years acount for 70.4% of all women with births.
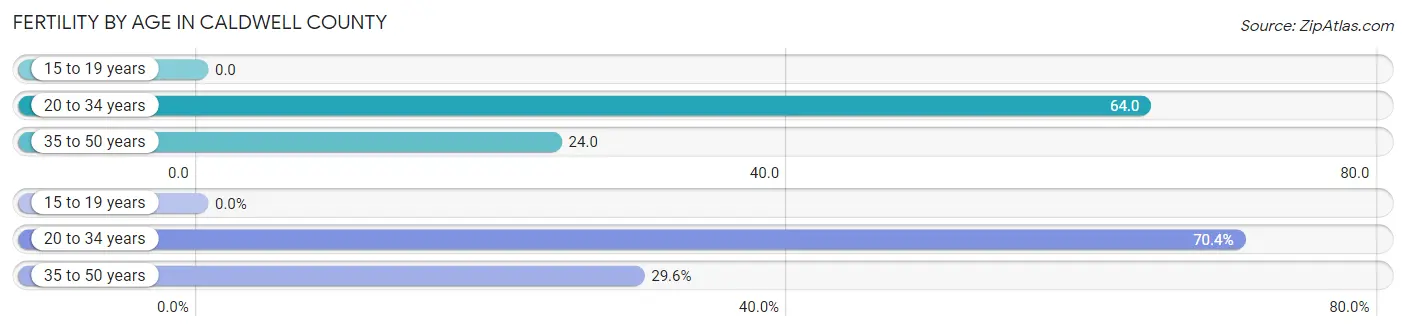
| Age Bracket | Women with Births | Births / 1,000 Women |
| 15 to 19 years | 0 (0.0%) | 0.0 |
| 20 to 34 years | 428 (70.4%) | 64.0 |
| 35 to 50 years | 180 (29.6%) | 24.0 |
| Total | 608 (100.0%) | 36.0 |
Fertility by Age by Marriage Status in Caldwell County
54.8% of women with births (608) in Caldwell County are married. The highest percentage of unmarried women with births falls into 35 to 50 years age bracket with 53.9% of them unmarried at the time of birth, while the lowest percentage of unmarried women with births belong to 20 to 34 years age bracket with 41.6% of them unmarried.
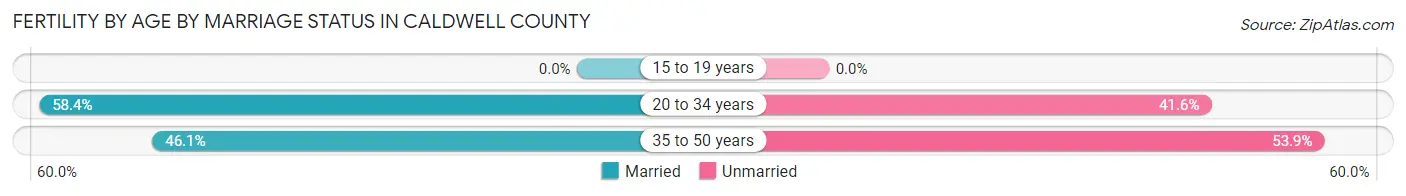
| Age Bracket | Married | Unmarried |
| 15 to 19 years | 0 (0.0%) | 0 (0.0%) |
| 20 to 34 years | 250 (58.4%) | 178 (41.6%) |
| 35 to 50 years | 83 (46.1%) | 97 (53.9%) |
| Total | 333 (54.8%) | 275 (45.2%) |
Fertility by Education in Caldwell County
Average fertility rate in Caldwell County is 36.0 births per 1,000 women. Women with the education attainment of graduate degree have the highest fertility rate of 68.0 births per 1,000 women, while women with the education attainment of less than high school have the lowest fertility at 17.0 births per 1,000 women. Women with the education attainment of college or associate's degree represent 41.6% of all women with births.
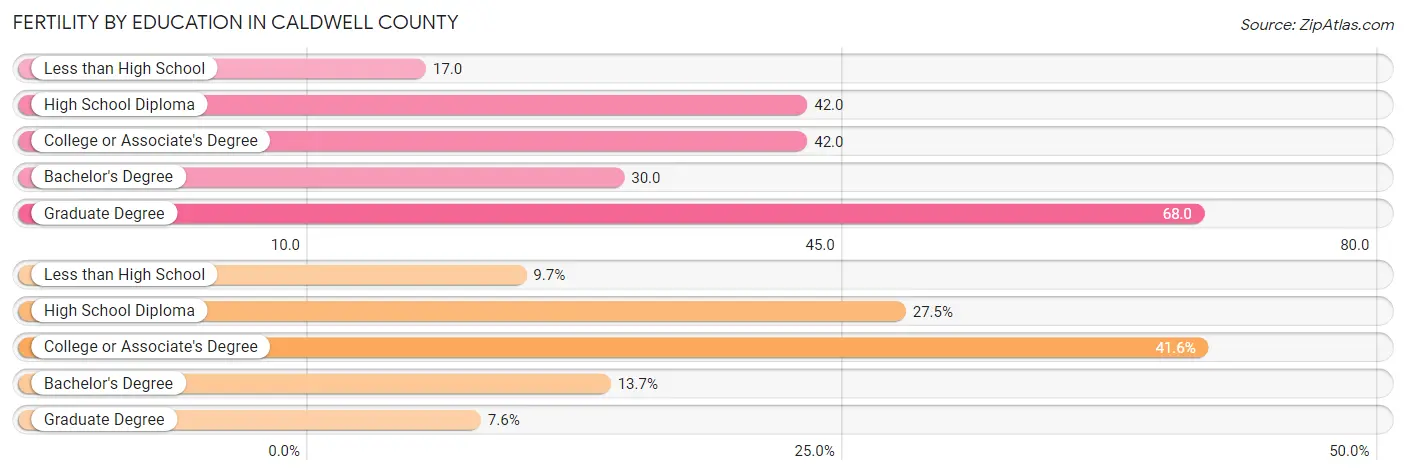
| Educational Attainment | Women with Births | Births / 1,000 Women |
| Less than High School | 59 (9.7%) | 17.0 |
| High School Diploma | 167 (27.5%) | 42.0 |
| College or Associate's Degree | 253 (41.6%) | 42.0 |
| Bachelor's Degree | 83 (13.7%) | 30.0 |
| Graduate Degree | 46 (7.6%) | 68.0 |
| Total | 608 (100.0%) | 36.0 |
Fertility by Education by Marriage Status in Caldwell County
45.2% of women with births in Caldwell County are unmarried. Women with the educational attainment of graduate degree are most likely to be married with 100.0% of them married at childbirth, while women with the educational attainment of college or associate's degree are least likely to be married with 56.1% of them unmarried at childbirth.
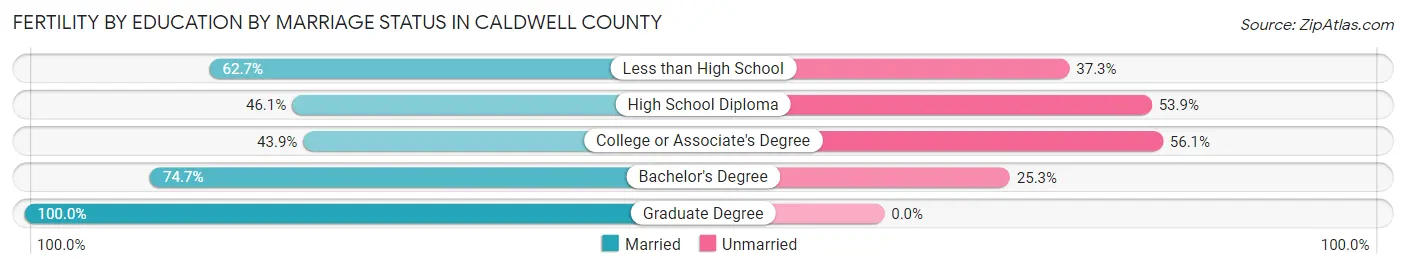
| Educational Attainment | Married | Unmarried |
| Less than High School | 37 (62.7%) | 22 (37.3%) |
| High School Diploma | 77 (46.1%) | 90 (53.9%) |
| College or Associate's Degree | 111 (43.9%) | 142 (56.1%) |
| Bachelor's Degree | 62 (74.7%) | 21 (25.3%) |
| Graduate Degree | 46 (100.0%) | 0 (0.0%) |
| Total | 333 (54.8%) | 275 (45.2%) |
Income in Caldwell County
Income Overview in Caldwell County
Per Capita Income in Caldwell County is $29,125, while median incomes of families and households are $67,132 and $52,362 respectively.
| Characteristic | Number | Measure |
| Per Capita Income | 80,716 | $29,125 |
| Median Family Income | 21,467 | $67,132 |
| Mean Family Income | 21,467 | $82,125 |
| Median Household Income | 32,120 | $52,362 |
| Mean Household Income | 32,120 | $69,926 |
| Income Deficit | 21,467 | $9,600 |
| Wage / Income Gap (%) | 80,716 | 26.63% |
| Wage / Income Gap ($) | 80,716 | 73.37¢ per $1 |
| Gini / Inequality Index | 80,716 | 0.44 |
Earnings by Sex in Caldwell County
Average Earnings in Caldwell County are $34,912, $40,746 for men and $29,895 for women, a difference of 26.6%.
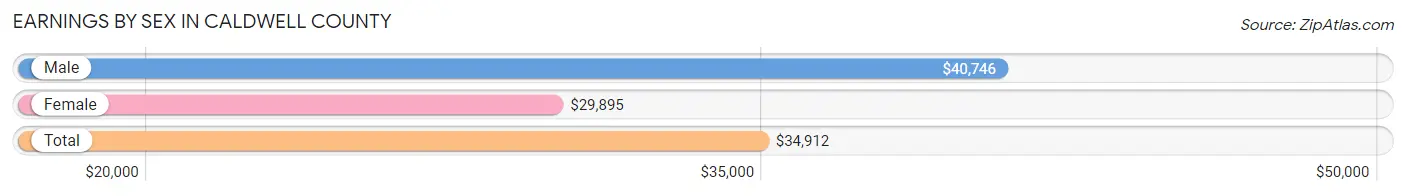
| Sex | Number | Average Earnings |
| Male | 21,294 (52.9%) | $40,746 |
| Female | 18,955 (47.1%) | $29,895 |
| Total | 40,249 (100.0%) | $34,912 |
Earnings by Sex by Income Bracket in Caldwell County
The most common earnings brackets in Caldwell County are $75,000 to $99,999 for men (1,913 | 9.0%) and $30,000 to $34,999 for women (1,544 | 8.2%).
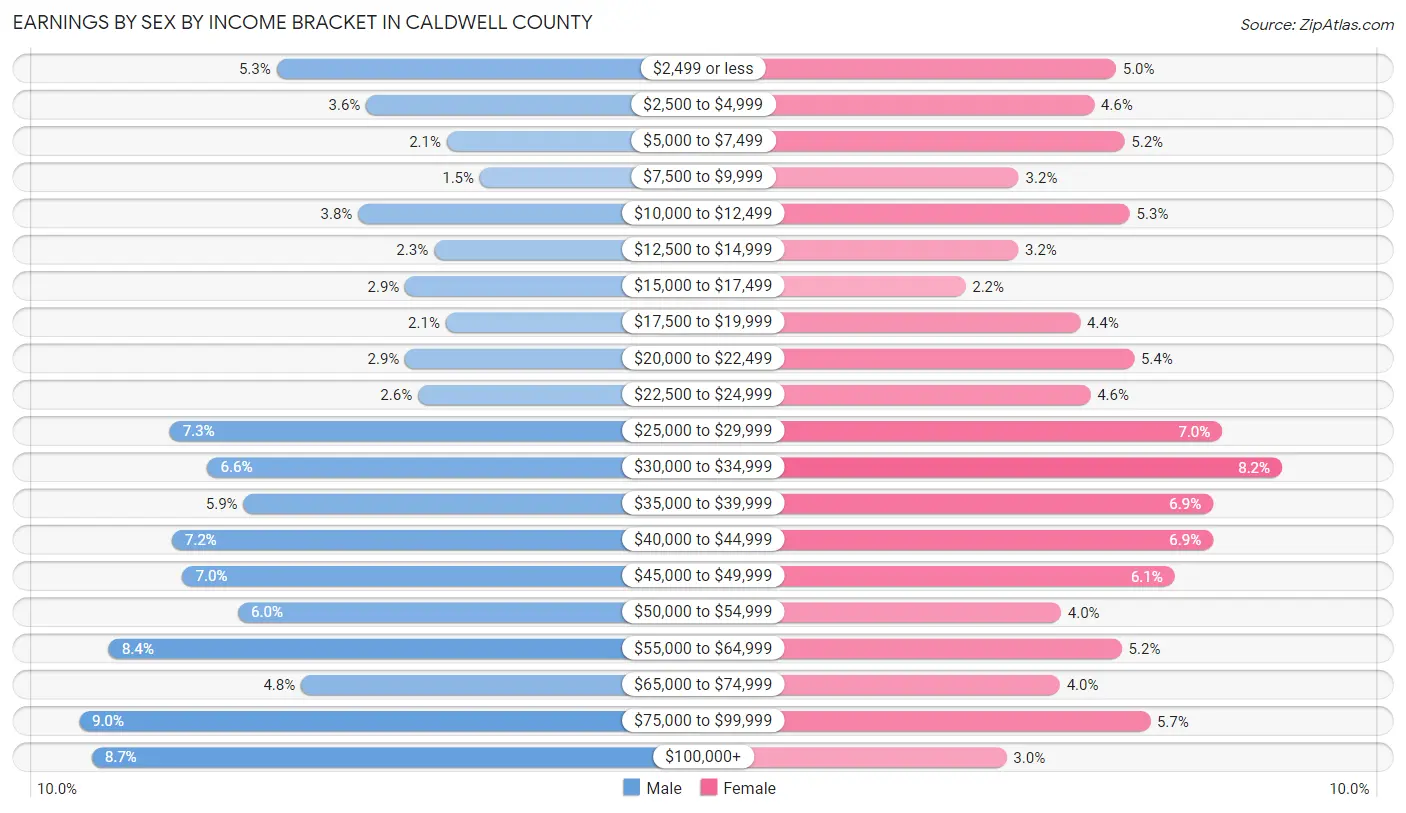
| Income | Male | Female |
| $2,499 or less | 1,124 (5.3%) | 955 (5.0%) |
| $2,500 to $4,999 | 767 (3.6%) | 877 (4.6%) |
| $5,000 to $7,499 | 445 (2.1%) | 986 (5.2%) |
| $7,500 to $9,999 | 314 (1.5%) | 611 (3.2%) |
| $10,000 to $12,499 | 799 (3.7%) | 1,005 (5.3%) |
| $12,500 to $14,999 | 497 (2.3%) | 608 (3.2%) |
| $15,000 to $17,499 | 611 (2.9%) | 421 (2.2%) |
| $17,500 to $19,999 | 449 (2.1%) | 829 (4.4%) |
| $20,000 to $22,499 | 612 (2.9%) | 1,019 (5.4%) |
| $22,500 to $24,999 | 560 (2.6%) | 865 (4.6%) |
| $25,000 to $29,999 | 1,551 (7.3%) | 1,333 (7.0%) |
| $30,000 to $34,999 | 1,398 (6.6%) | 1,544 (8.2%) |
| $35,000 to $39,999 | 1,256 (5.9%) | 1,301 (6.9%) |
| $40,000 to $44,999 | 1,542 (7.2%) | 1,301 (6.9%) |
| $45,000 to $49,999 | 1,499 (7.0%) | 1,163 (6.1%) |
| $50,000 to $54,999 | 1,278 (6.0%) | 760 (4.0%) |
| $55,000 to $64,999 | 1,792 (8.4%) | 977 (5.1%) |
| $65,000 to $74,999 | 1,026 (4.8%) | 757 (4.0%) |
| $75,000 to $99,999 | 1,913 (9.0%) | 1,077 (5.7%) |
| $100,000+ | 1,861 (8.7%) | 566 (3.0%) |
| Total | 21,294 (100.0%) | 18,955 (100.0%) |
Earnings by Sex by Educational Attainment in Caldwell County
Average earnings in Caldwell County are $45,170 for men and $32,937 for women, a difference of 27.1%. Men with an educational attainment of graduate degree enjoy the highest average annual earnings of $75,556, while those with high school diploma education earn the least with $37,843. Women with an educational attainment of graduate degree earn the most with the average annual earnings of $58,418, while those with less than high school education have the smallest earnings of $19,318.
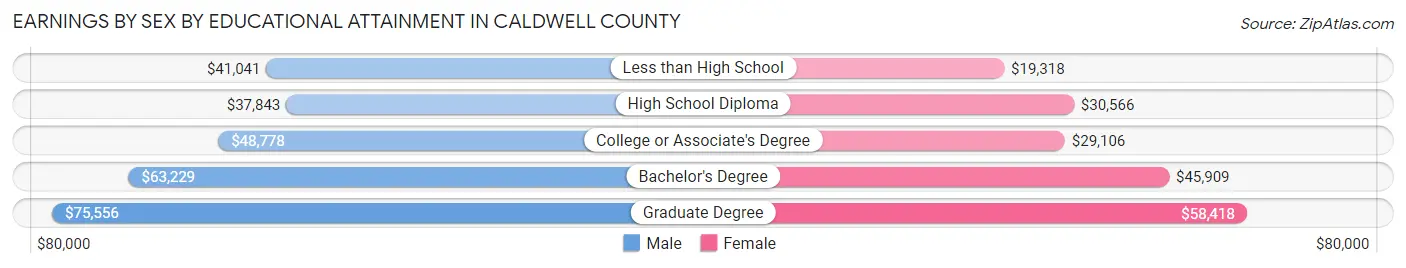
| Educational Attainment | Male Income | Female Income |
| Less than High School | $41,041 | $19,318 |
| High School Diploma | $37,843 | $30,566 |
| College or Associate's Degree | $48,778 | $29,106 |
| Bachelor's Degree | $63,229 | $45,909 |
| Graduate Degree | $75,556 | $58,418 |
| Total | $45,170 | $32,937 |
Family Income in Caldwell County
Family Income Brackets in Caldwell County
According to the Caldwell County family income data, there are 4,122 families falling into the $100,000 to $149,999 income range, which is the most common income bracket and makes up 19.2% of all families. Conversely, the $10,000 to $14,999 income bracket is the least frequent group with only 580 families (2.7%) belonging to this category.
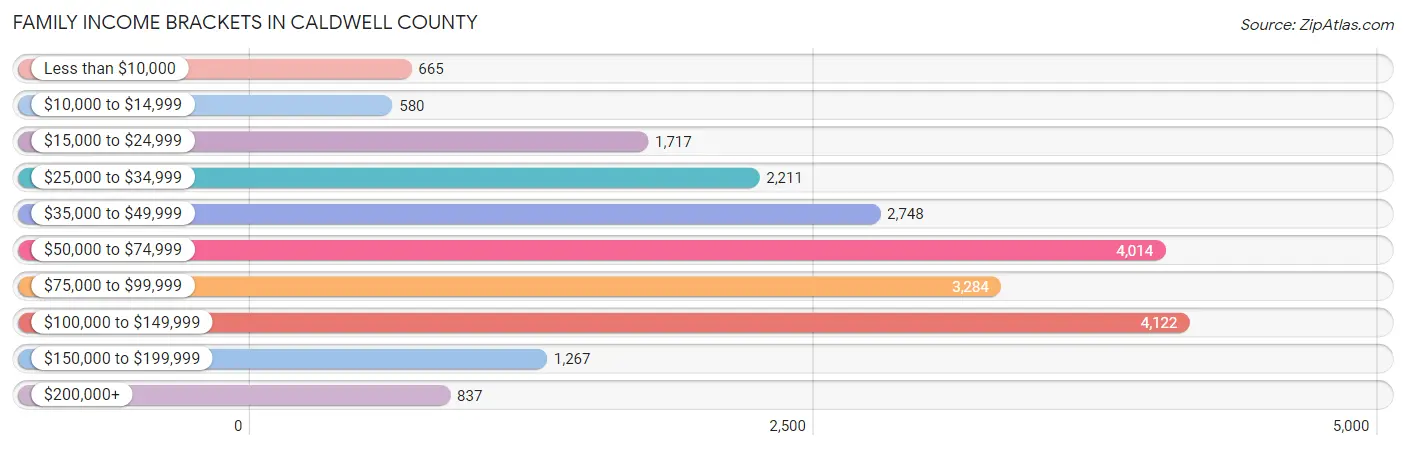
| Income Bracket | # Families | % Families |
| Less than $10,000 | 665 | 3.1% |
| $10,000 to $14,999 | 580 | 2.7% |
| $15,000 to $24,999 | 1,717 | 8.0% |
| $25,000 to $34,999 | 2,211 | 10.3% |
| $35,000 to $49,999 | 2,748 | 12.8% |
| $50,000 to $74,999 | 4,014 | 18.7% |
| $75,000 to $99,999 | 3,284 | 15.3% |
| $100,000 to $149,999 | 4,122 | 19.2% |
| $150,000 to $199,999 | 1,267 | 5.9% |
| $200,000+ | 837 | 3.9% |
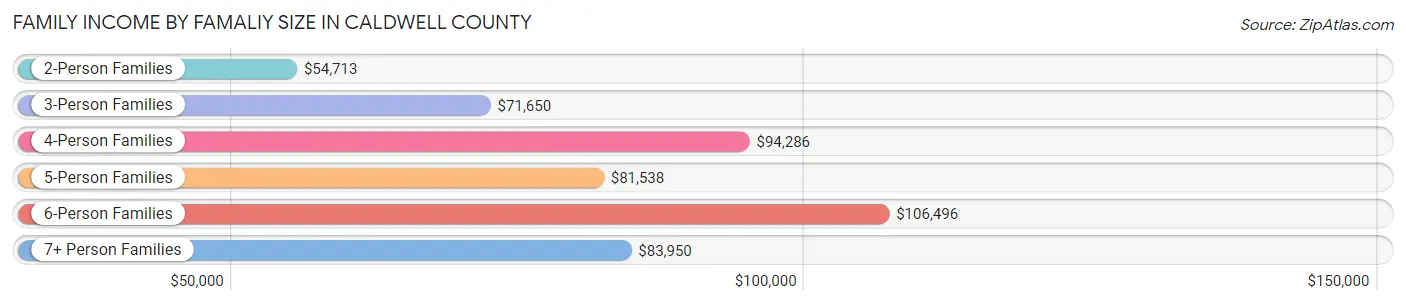
Family Income by Famaliy Size in Caldwell County
6-person families (381 | 1.8%) account for the highest median family income in Caldwell County with $106,496 per family, while 2-person families (11,049 | 51.5%) have the highest median income of $27,356 per family member.
| Income Bracket | # Families | Median Income |
| 2-Person Families | 11,049 (51.5%) | $54,713 |
| 3-Person Families | 4,978 (23.2%) | $71,650 |
| 4-Person Families | 3,152 (14.7%) | $94,286 |
| 5-Person Families | 1,660 (7.7%) | $81,538 |
| 6-Person Families | 381 (1.8%) | $106,496 |
| 7+ Person Families | 247 (1.1%) | $83,950 |
| Total | 21,467 (100.0%) | $67,132 |
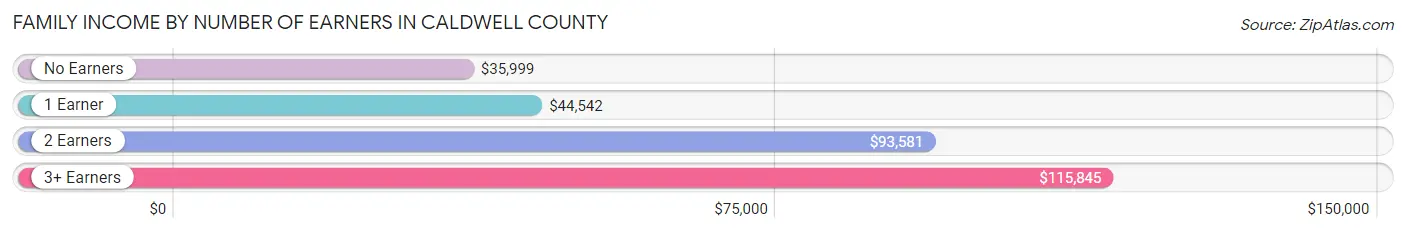
Family Income by Number of Earners in Caldwell County
The median family income in Caldwell County is $67,132, with families comprising 3+ earners (2,021) having the highest median family income of $115,845, while families with no earners (3,967) have the lowest median family income of $35,999, accounting for 9.4% and 18.5% of families, respectively.
| Number of Earners | # Families | Median Income |
| No Earners | 3,967 (18.5%) | $35,999 |
| 1 Earner | 7,482 (34.8%) | $44,542 |
| 2 Earners | 7,997 (37.2%) | $93,581 |
| 3+ Earners | 2,021 (9.4%) | $115,845 |
| Total | 21,467 (100.0%) | $67,132 |
Household Income in Caldwell County
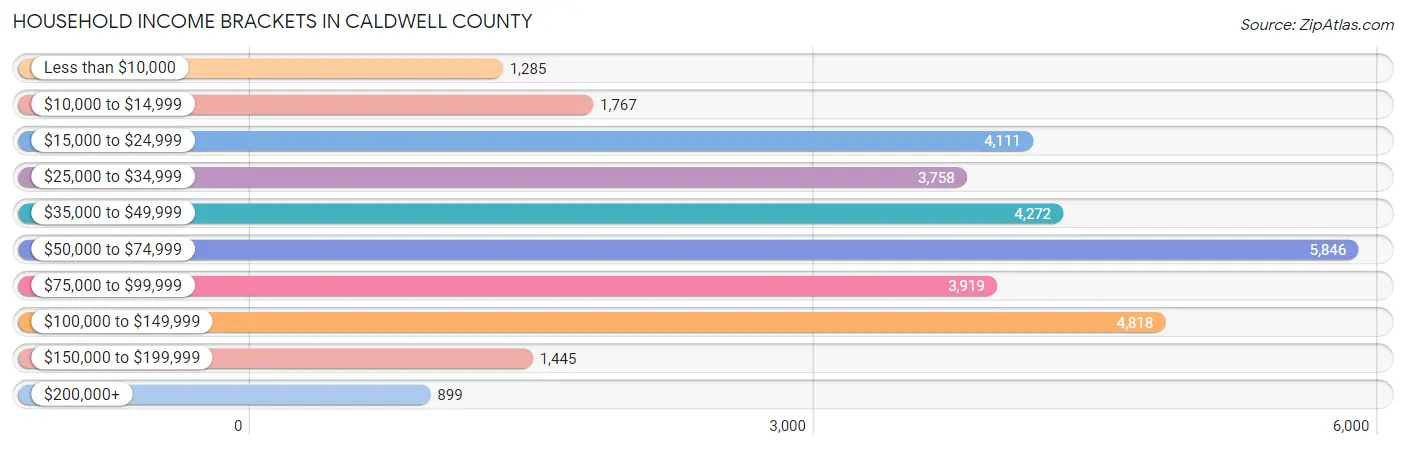
Household Income Brackets in Caldwell County
With 5,846 households falling in the category, the $50,000 to $74,999 income range is the most frequent in Caldwell County, accounting for 18.2% of all households. In contrast, only 899 households (2.8%) fall into the $200,000+ income bracket, making it the least populous group.
| Income Bracket | # Households | % Households |
| Less than $10,000 | 1,285 | 4.0% |
| $10,000 to $14,999 | 1,767 | 5.5% |
| $15,000 to $24,999 | 4,111 | 12.8% |
| $25,000 to $34,999 | 3,758 | 11.7% |
| $35,000 to $49,999 | 4,272 | 13.3% |
| $50,000 to $74,999 | 5,846 | 18.2% |
| $75,000 to $99,999 | 3,919 | 12.2% |
| $100,000 to $149,999 | 4,818 | 15.0% |
| $150,000 to $199,999 | 1,445 | 4.5% |
| $200,000+ | 899 | 2.8% |
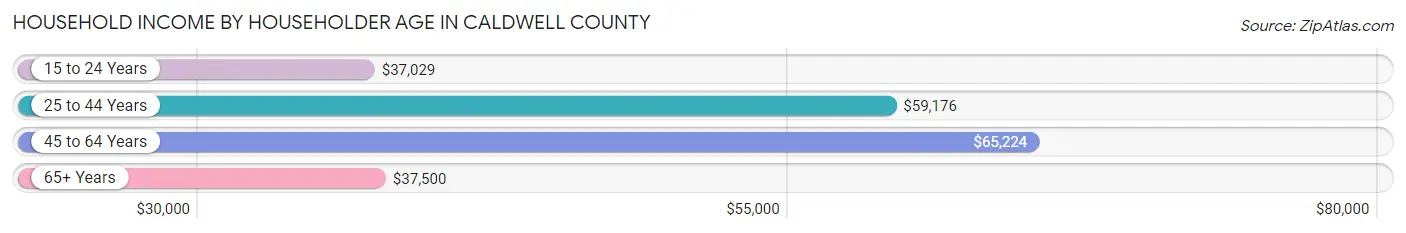
Household Income by Householder Age in Caldwell County
The median household income in Caldwell County is $52,362, with the highest median household income of $65,224 found in the 45 to 64 years age bracket for the primary householder. A total of 12,957 households (40.3%) fall into this category. Meanwhile, the 15 to 24 years age bracket for the primary householder has the lowest median household income of $37,029, with 603 households (1.9%) in this group.
| Income Bracket | # Households | Median Income |
| 15 to 24 Years | 603 (1.9%) | $37,029 |
| 25 to 44 Years | 8,022 (25.0%) | $59,176 |
| 45 to 64 Years | 12,957 (40.3%) | $65,224 |
| 65+ Years | 10,538 (32.8%) | $37,500 |
| Total | 32,120 (100.0%) | $52,362 |
Poverty in Caldwell County
Income Below Poverty by Sex and Age in Caldwell County
With 11.8% poverty level for males and 14.7% for females among the residents of Caldwell County, 15 year old males and 12 to 14 year old females are the most vulnerable to poverty, with 134 males (31.4%) and 403 females (27.3%) in their respective age groups living below the poverty level.
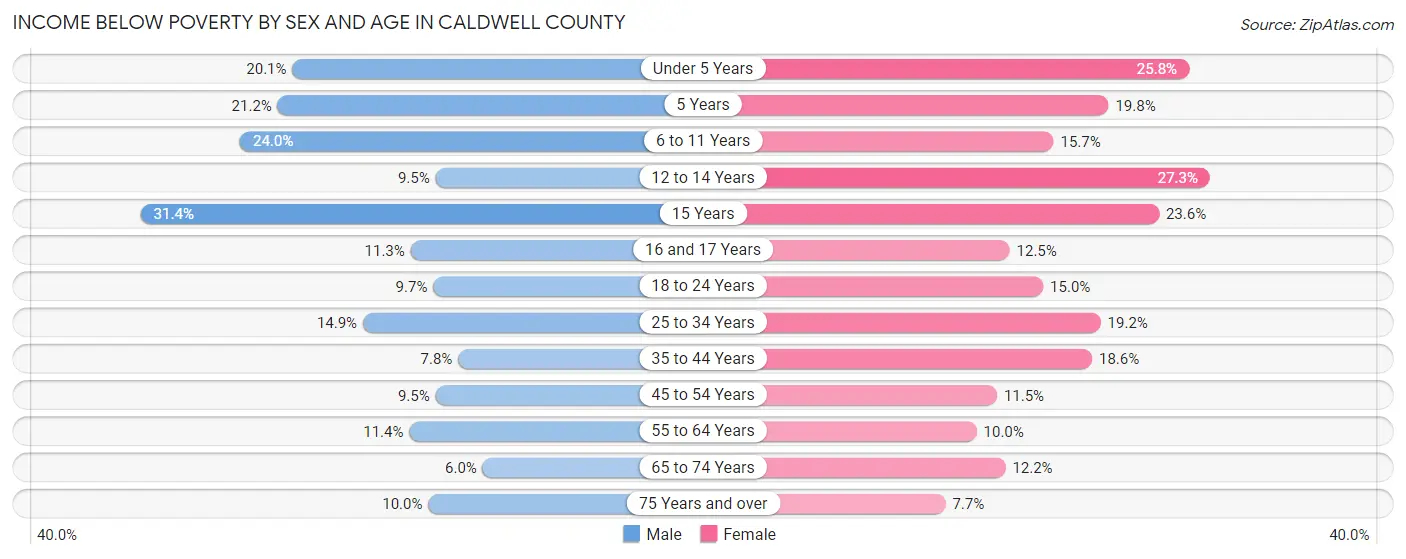
| Age Bracket | Male | Female |
| Under 5 Years | 416 (20.1%) | 476 (25.8%) |
| 5 Years | 70 (21.2%) | 39 (19.8%) |
| 6 to 11 Years | 690 (24.0%) | 393 (15.7%) |
| 12 to 14 Years | 131 (9.5%) | 403 (27.3%) |
| 15 Years | 134 (31.4%) | 163 (23.5%) |
| 16 and 17 Years | 110 (11.3%) | 124 (12.5%) |
| 18 to 24 Years | 327 (9.7%) | 448 (14.9%) |
| 25 to 34 Years | 661 (14.9%) | 878 (19.2%) |
| 35 to 44 Years | 340 (7.8%) | 786 (18.6%) |
| 45 to 54 Years | 563 (9.5%) | 672 (11.5%) |
| 55 to 64 Years | 659 (11.4%) | 599 (10.0%) |
| 65 to 74 Years | 286 (6.0%) | 621 (12.1%) |
| 75 Years and over | 272 (10.0%) | 290 (7.7%) |
| Total | 4,659 (11.8%) | 5,892 (14.7%) |
Income Above Poverty by Sex and Age in Caldwell County
According to the poverty statistics in Caldwell County, males aged 65 to 74 years and females aged 75 years and over are the age groups that are most secure financially, with 94.0% of males and 92.3% of females in these age groups living above the poverty line.
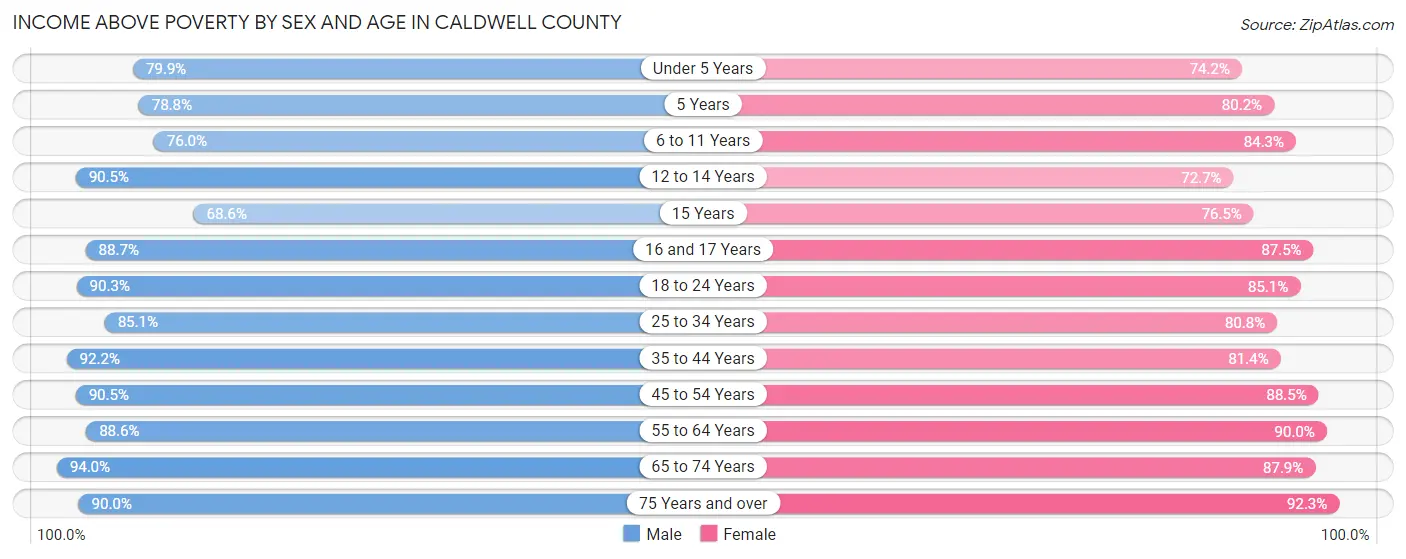
| Age Bracket | Male | Female |
| Under 5 Years | 1,652 (79.9%) | 1,371 (74.2%) |
| 5 Years | 260 (78.8%) | 158 (80.2%) |
| 6 to 11 Years | 2,185 (76.0%) | 2,107 (84.3%) |
| 12 to 14 Years | 1,250 (90.5%) | 1,072 (72.7%) |
| 15 Years | 293 (68.6%) | 529 (76.4%) |
| 16 and 17 Years | 860 (88.7%) | 871 (87.5%) |
| 18 to 24 Years | 3,058 (90.3%) | 2,548 (85.1%) |
| 25 to 34 Years | 3,780 (85.1%) | 3,691 (80.8%) |
| 35 to 44 Years | 4,015 (92.2%) | 3,445 (81.4%) |
| 45 to 54 Years | 5,372 (90.5%) | 5,160 (88.5%) |
| 55 to 64 Years | 5,103 (88.6%) | 5,386 (90.0%) |
| 65 to 74 Years | 4,491 (94.0%) | 4,489 (87.8%) |
| 75 Years and over | 2,439 (90.0%) | 3,476 (92.3%) |
| Total | 34,758 (88.2%) | 34,303 (85.3%) |
Income Below Poverty Among Married-Couple Families in Caldwell County
The poverty statistics for married-couple families in Caldwell County show that 6.6% or 1,004 of the total 15,304 families live below the poverty line. Families with 5 or more children have the highest poverty rate of 20.9%, comprising of 28 families. On the other hand, families with no children have the lowest poverty rate of 4.6%, which includes 443 families.
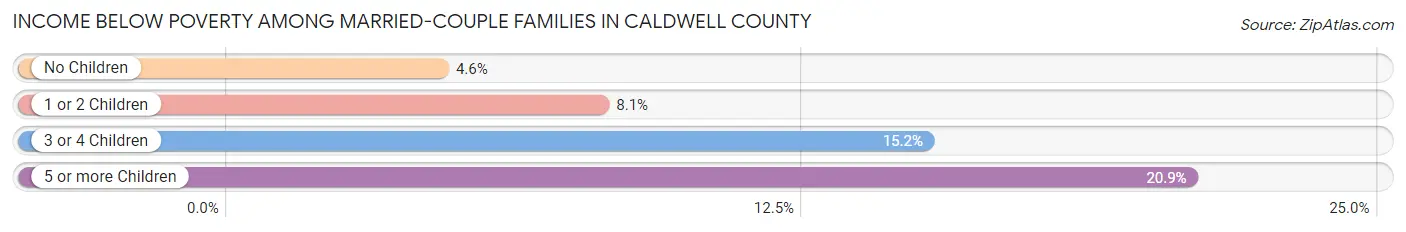
| Children | Above Poverty | Below Poverty |
| No Children | 9,206 (95.4%) | 443 (4.6%) |
| 1 or 2 Children | 3,947 (91.9%) | 347 (8.1%) |
| 3 or 4 Children | 1,041 (84.8%) | 186 (15.2%) |
| 5 or more Children | 106 (79.1%) | 28 (20.9%) |
| Total | 14,300 (93.4%) | 1,004 (6.6%) |
Income Below Poverty Among Single-Parent Households in Caldwell County
According to the poverty data in Caldwell County, 12.7% or 218 single-father households and 23.7% or 1,053 single-mother households are living below the poverty line. Among single-father households, those with 3 or 4 children have the highest poverty rate, with 23 households (36.5%) experiencing poverty. Likewise, among single-mother households, those with 3 or 4 children have the highest poverty rate, with 108 households (70.6%) falling below the poverty line.
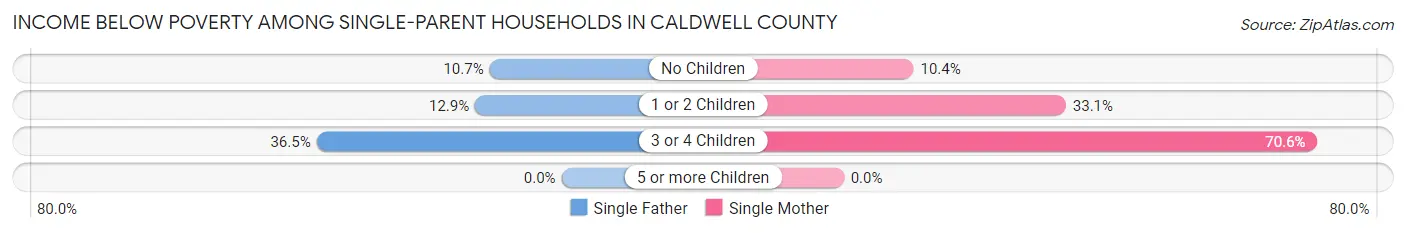
| Children | Single Father | Single Mother |
| No Children | 90 (10.7%) | 217 (10.4%) |
| 1 or 2 Children | 105 (12.9%) | 728 (33.1%) |
| 3 or 4 Children | 23 (36.5%) | 108 (70.6%) |
| 5 or more Children | 0 (0.0%) | 0 (0.0%) |
| Total | 218 (12.7%) | 1,053 (23.7%) |
Income Below Poverty Among Married-Couple vs Single-Parent Households in Caldwell County
The poverty data for Caldwell County shows that 1,004 of the married-couple family households (6.6%) and 1,271 of the single-parent households (20.6%) are living below the poverty level. Within the married-couple family households, those with 5 or more children have the highest poverty rate, with 28 households (20.9%) falling below the poverty line. Among the single-parent households, those with 3 or 4 children have the highest poverty rate, with 131 household (60.7%) living below poverty.
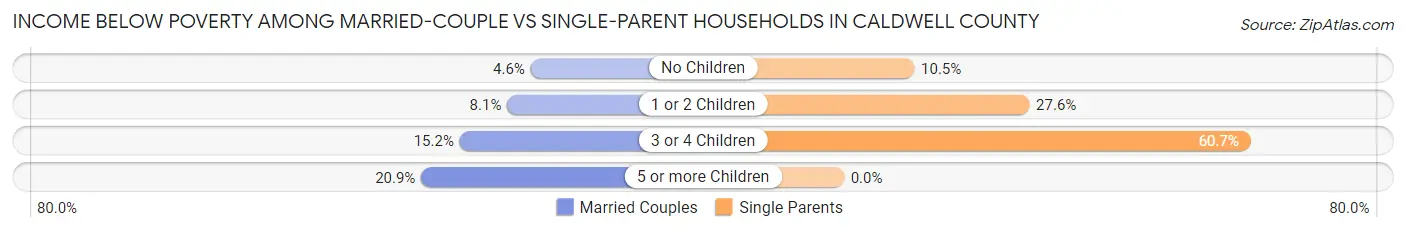
| Children | Married-Couple Families | Single-Parent Households |
| No Children | 443 (4.6%) | 307 (10.5%) |
| 1 or 2 Children | 347 (8.1%) | 833 (27.6%) |
| 3 or 4 Children | 186 (15.2%) | 131 (60.7%) |
| 5 or more Children | 28 (20.9%) | 0 (0.0%) |
| Total | 1,004 (6.6%) | 1,271 (20.6%) |
Employment Characteristics in Caldwell County
Employment by Class of Employer in Caldwell County
Among the 35,284 employed individuals in Caldwell County, private company employees (24,852 | 70.4%), self-employed (not incorporated) (2,357 | 6.7%), and local government employees (2,114 | 6.0%) make up the most common classes of employment.
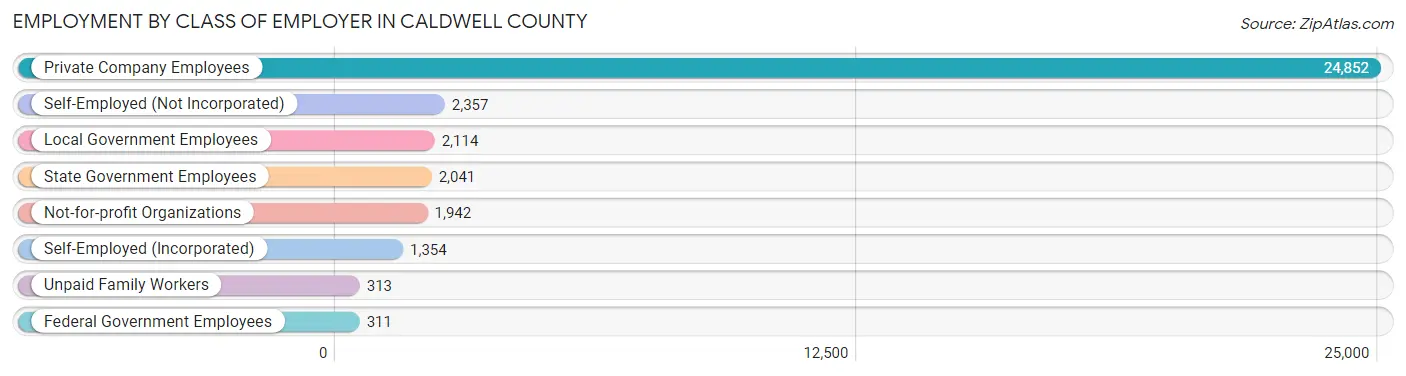
| Employer Class | # Employees | % Employees |
| Private Company Employees | 24,852 | 70.4% |
| Self-Employed (Incorporated) | 1,354 | 3.8% |
| Self-Employed (Not Incorporated) | 2,357 | 6.7% |
| Not-for-profit Organizations | 1,942 | 5.5% |
| Local Government Employees | 2,114 | 6.0% |
| State Government Employees | 2,041 | 5.8% |
| Federal Government Employees | 311 | 0.9% |
| Unpaid Family Workers | 313 | 0.9% |
| Total | 35,284 | 100.0% |
Employment Status by Age in Caldwell County
According to the labor force statistics for Caldwell County, out of the total population over 16 years of age (66,660), 58.1% or 38,729 individuals are in the labor force, with 5.8% or 2,246 of them unemployed. The age group with the highest labor force participation rate is 20 to 24 years, with 83.1% or 3,793 individuals in the labor force. Within the labor force, the 16 to 19 years age range has the highest percentage of unemployed individuals, with 22.6% or 377 of them being unemployed.
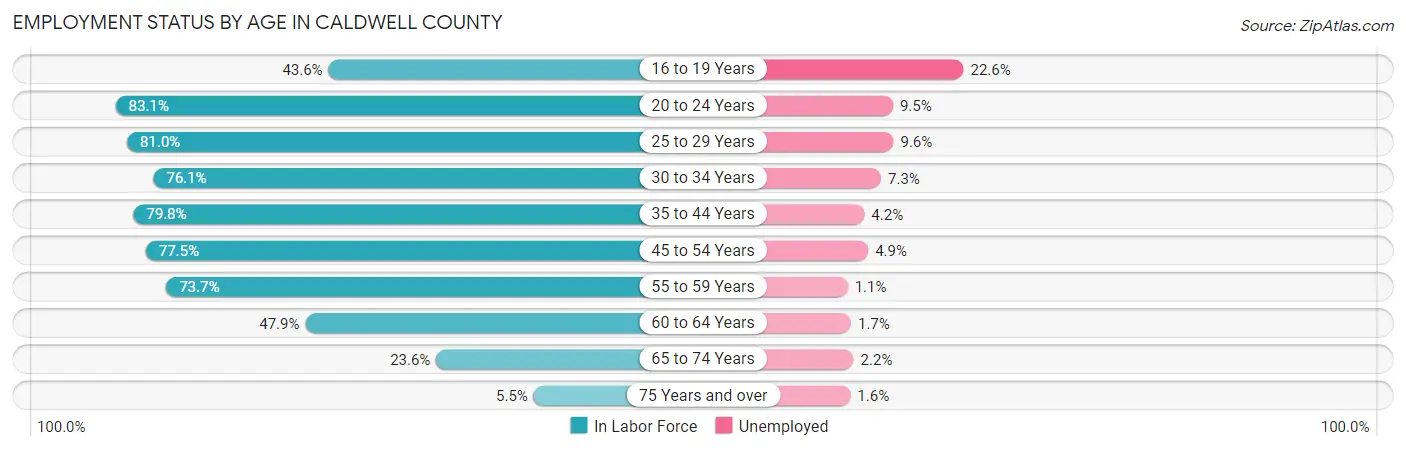
| Age Bracket | In Labor Force | Unemployed |
| 16 to 19 Years | 1,669 (43.6%) | 377 (22.6%) |
| 20 to 24 Years | 3,793 (83.1%) | 360 (9.5%) |
| 25 to 29 Years | 3,706 (81.0%) | 356 (9.6%) |
| 30 to 34 Years | 3,492 (76.1%) | 255 (7.3%) |
| 35 to 44 Years | 6,931 (79.8%) | 291 (4.2%) |
| 45 to 54 Years | 9,197 (77.5%) | 451 (4.9%) |
| 55 to 59 Years | 4,308 (73.7%) | 47 (1.1%) |
| 60 to 64 Years | 2,878 (47.9%) | 49 (1.7%) |
| 65 to 74 Years | 2,359 (23.6%) | 52 (2.2%) |
| 75 Years and over | 369 (5.5%) | 6 (1.6%) |
| Total | 38,729 (58.1%) | 2,246 (5.8%) |
Employment Status by Educational Attainment in Caldwell County
According to labor force statistics for Caldwell County, 73.4% of individuals (30,512) out of the total population between 25 and 64 years of age (41,570) are in the labor force, with 4.7% or 1,434 of them being unemployed. The group with the highest labor force participation rate are those with the educational attainment of bachelor's degree or higher, with 87.7% or 6,567 individuals in the labor force. Within the labor force, individuals with less than high school education have the highest percentage of unemployment, with 9.3% or 361 of them being unemployed.
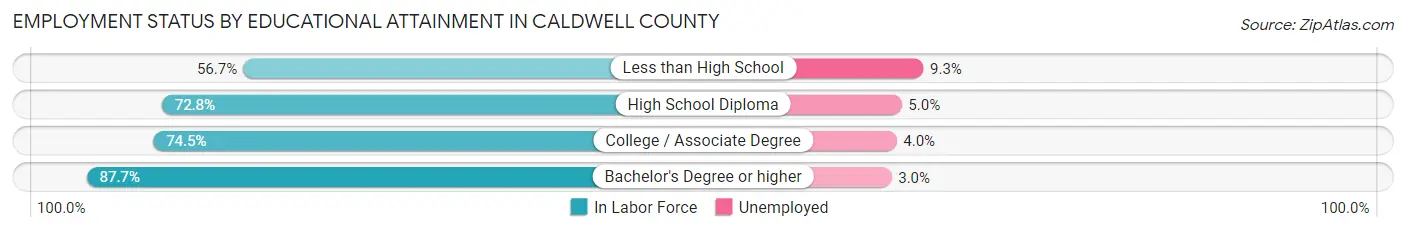
| Educational Attainment | In Labor Force | Unemployed |
| Less than High School | 3,886 (56.7%) | 637 (9.3%) |
| High School Diploma | 9,381 (72.8%) | 644 (5.0%) |
| College / Associate Degree | 10,686 (74.5%) | 574 (4.0%) |
| Bachelor's Degree or higher | 6,567 (87.7%) | 225 (3.0%) |
| Total | 30,512 (73.4%) | 1,954 (4.7%) |
Employment Occupations by Sex in Caldwell County
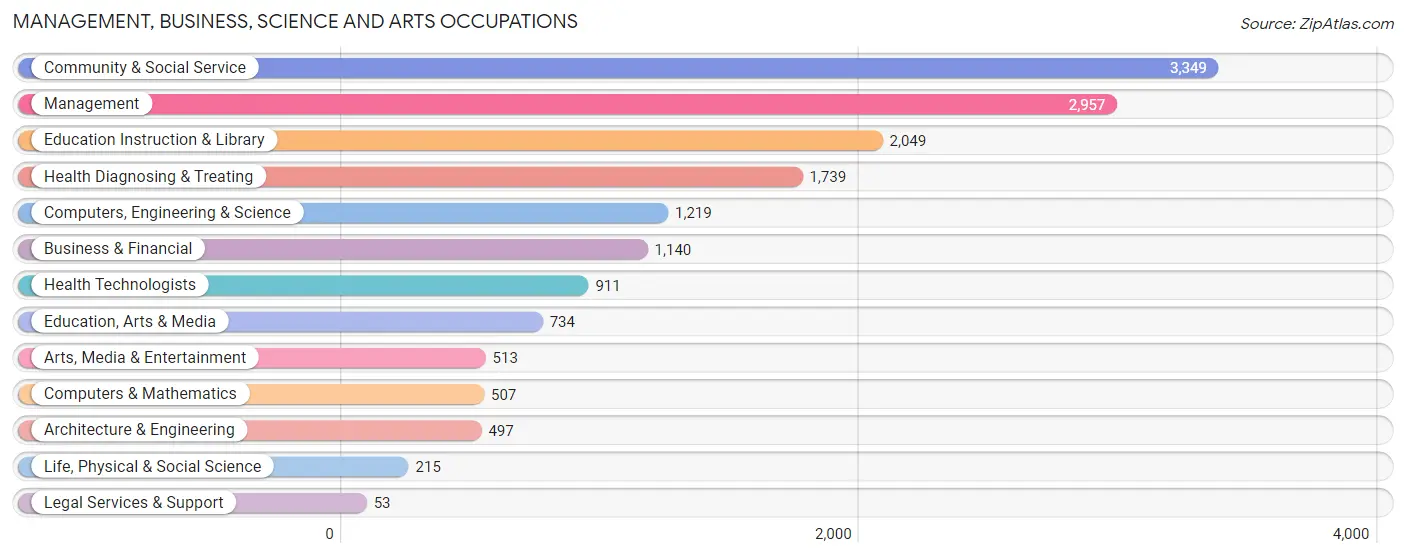
Management, Business, Science and Arts Occupations
The most common Management, Business, Science and Arts occupations in Caldwell County are Community & Social Service (3,349 | 9.2%), Management (2,957 | 8.1%), Education Instruction & Library (2,049 | 5.6%), Health Diagnosing & Treating (1,739 | 4.8%), and Computers, Engineering & Science (1,219 | 3.4%).
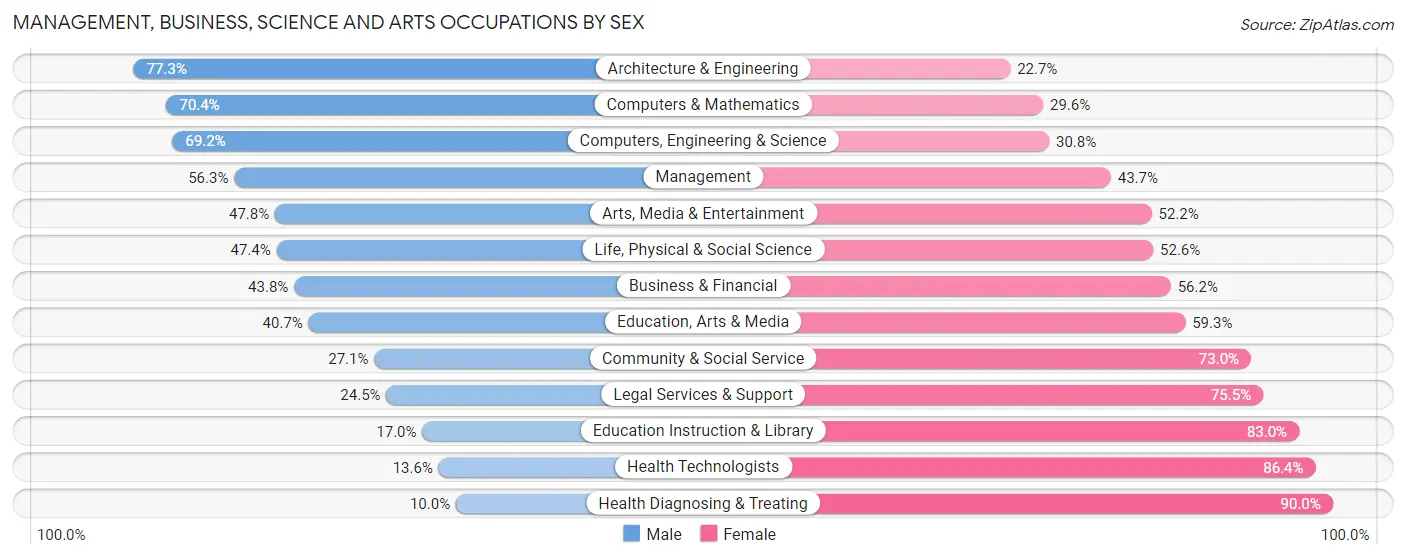
Management, Business, Science and Arts Occupations by Sex
Within the Management, Business, Science and Arts occupations in Caldwell County, the most male-oriented occupations are Architecture & Engineering (77.3%), Computers & Mathematics (70.4%), and Computers, Engineering & Science (69.2%), while the most female-oriented occupations are Health Diagnosing & Treating (90.0%), Health Technologists (86.4%), and Education Instruction & Library (83.0%).
| Occupation | Male | Female |
| Management | 1,664 (56.3%) | 1,293 (43.7%) |
| Business & Financial | 499 (43.8%) | 641 (56.2%) |
| Computers, Engineering & Science | 843 (69.2%) | 376 (30.8%) |
| Computers & Mathematics | 357 (70.4%) | 150 (29.6%) |
| Architecture & Engineering | 384 (77.3%) | 113 (22.7%) |
| Life, Physical & Social Science | 102 (47.4%) | 113 (52.6%) |
| Community & Social Service | 906 (27.1%) | 2,443 (73.0%) |
| Education, Arts & Media | 299 (40.7%) | 435 (59.3%) |
| Legal Services & Support | 13 (24.5%) | 40 (75.5%) |
| Education Instruction & Library | 349 (17.0%) | 1,700 (83.0%) |
| Arts, Media & Entertainment | 245 (47.8%) | 268 (52.2%) |
| Health Diagnosing & Treating | 174 (10.0%) | 1,565 (90.0%) |
| Health Technologists | 124 (13.6%) | 787 (86.4%) |
| Total (Category) | 4,086 (39.3%) | 6,318 (60.7%) |
| Total (Overall) | 19,198 (52.7%) | 17,237 (47.3%) |
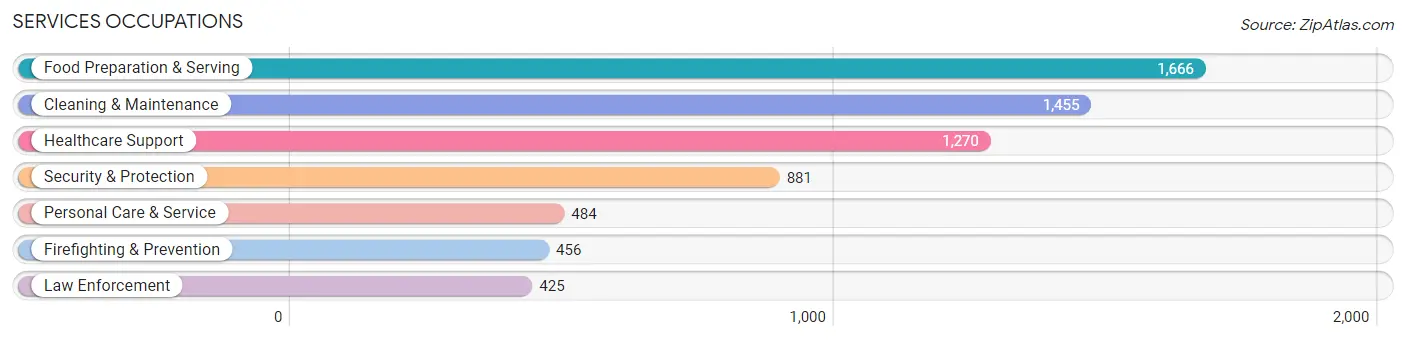
Services Occupations
The most common Services occupations in Caldwell County are Food Preparation & Serving (1,666 | 4.6%), Cleaning & Maintenance (1,455 | 4.0%), Healthcare Support (1,270 | 3.5%), Security & Protection (881 | 2.4%), and Personal Care & Service (484 | 1.3%).
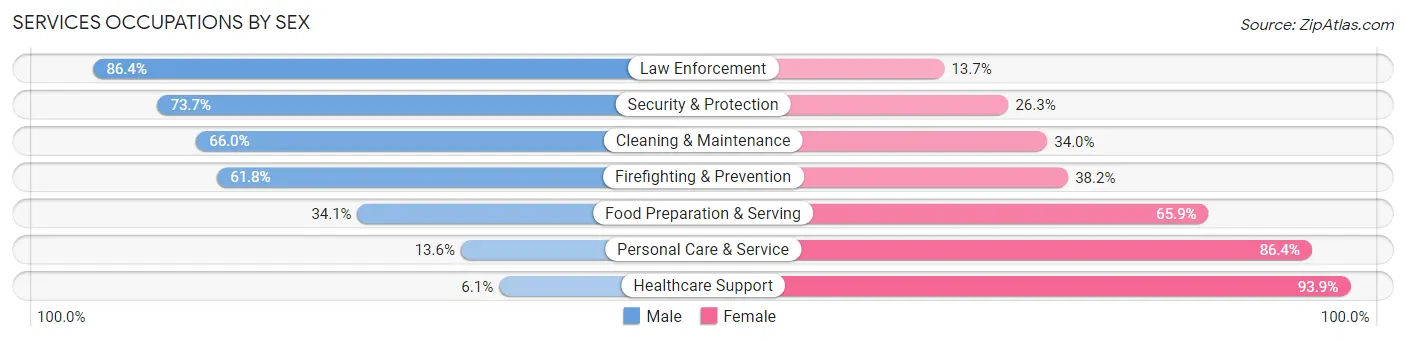
Services Occupations by Sex
Within the Services occupations in Caldwell County, the most male-oriented occupations are Law Enforcement (86.4%), Security & Protection (73.7%), and Cleaning & Maintenance (66.0%), while the most female-oriented occupations are Healthcare Support (93.9%), Personal Care & Service (86.4%), and Food Preparation & Serving (65.9%).
| Occupation | Male | Female |
| Healthcare Support | 77 (6.1%) | 1,193 (93.9%) |
| Security & Protection | 649 (73.7%) | 232 (26.3%) |
| Firefighting & Prevention | 282 (61.8%) | 174 (38.2%) |
| Law Enforcement | 367 (86.4%) | 58 (13.7%) |
| Food Preparation & Serving | 568 (34.1%) | 1,098 (65.9%) |
| Cleaning & Maintenance | 960 (66.0%) | 495 (34.0%) |
| Personal Care & Service | 66 (13.6%) | 418 (86.4%) |
| Total (Category) | 2,320 (40.3%) | 3,436 (59.7%) |
| Total (Overall) | 19,198 (52.7%) | 17,237 (47.3%) |
Sales and Office Occupations
The most common Sales and Office occupations in Caldwell County are Sales & Related (4,071 | 11.2%), and Office & Administration (3,693 | 10.1%).

Sales and Office Occupations by Sex
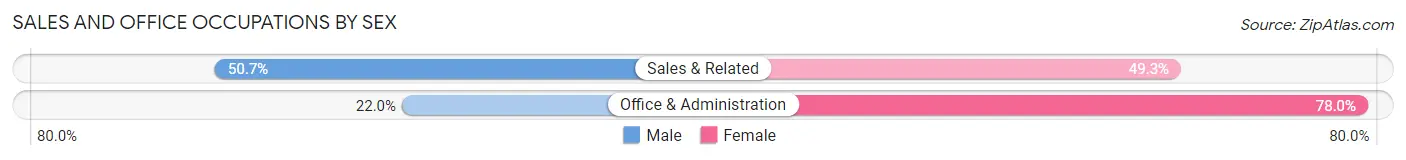
| Occupation | Male | Female |
| Sales & Related | 2,065 (50.7%) | 2,006 (49.3%) |
| Office & Administration | 811 (22.0%) | 2,882 (78.0%) |
| Total (Category) | 2,876 (37.0%) | 4,888 (63.0%) |
| Total (Overall) | 19,198 (52.7%) | 17,237 (47.3%) |
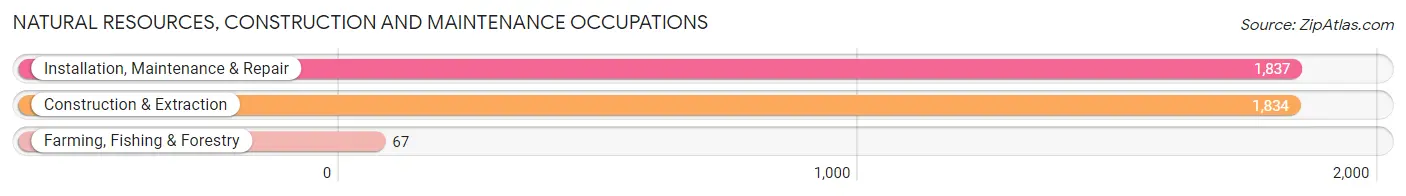
Natural Resources, Construction and Maintenance Occupations
The most common Natural Resources, Construction and Maintenance occupations in Caldwell County are Installation, Maintenance & Repair (1,837 | 5.0%), Construction & Extraction (1,834 | 5.0%), and Farming, Fishing & Forestry (67 | 0.2%).
Natural Resources, Construction and Maintenance Occupations by Sex
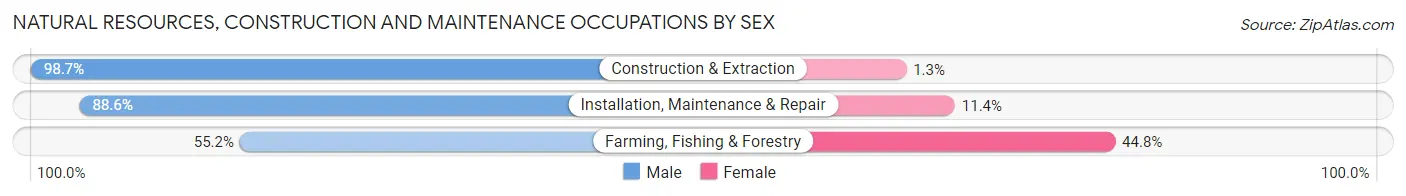
| Occupation | Male | Female |
| Farming, Fishing & Forestry | 37 (55.2%) | 30 (44.8%) |
| Construction & Extraction | 1,810 (98.7%) | 24 (1.3%) |
| Installation, Maintenance & Repair | 1,627 (88.6%) | 210 (11.4%) |
| Total (Category) | 3,474 (92.9%) | 264 (7.1%) |
| Total (Overall) | 19,198 (52.7%) | 17,237 (47.3%) |
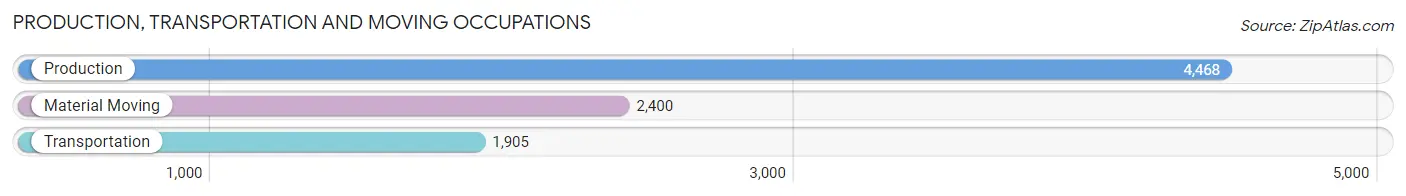
Production, Transportation and Moving Occupations
The most common Production, Transportation and Moving occupations in Caldwell County are Production (4,468 | 12.3%), Material Moving (2,400 | 6.6%), and Transportation (1,905 | 5.2%).
Production, Transportation and Moving Occupations by Sex

| Occupation | Male | Female |
| Production | 2,966 (66.4%) | 1,502 (33.6%) |
| Transportation | 1,579 (82.9%) | 326 (17.1%) |
| Material Moving | 1,897 (79.0%) | 503 (21.0%) |
| Total (Category) | 6,442 (73.4%) | 2,331 (26.6%) |
| Total (Overall) | 19,198 (52.7%) | 17,237 (47.3%) |
Employment Industries by Sex in Caldwell County
Employment Industries in Caldwell County
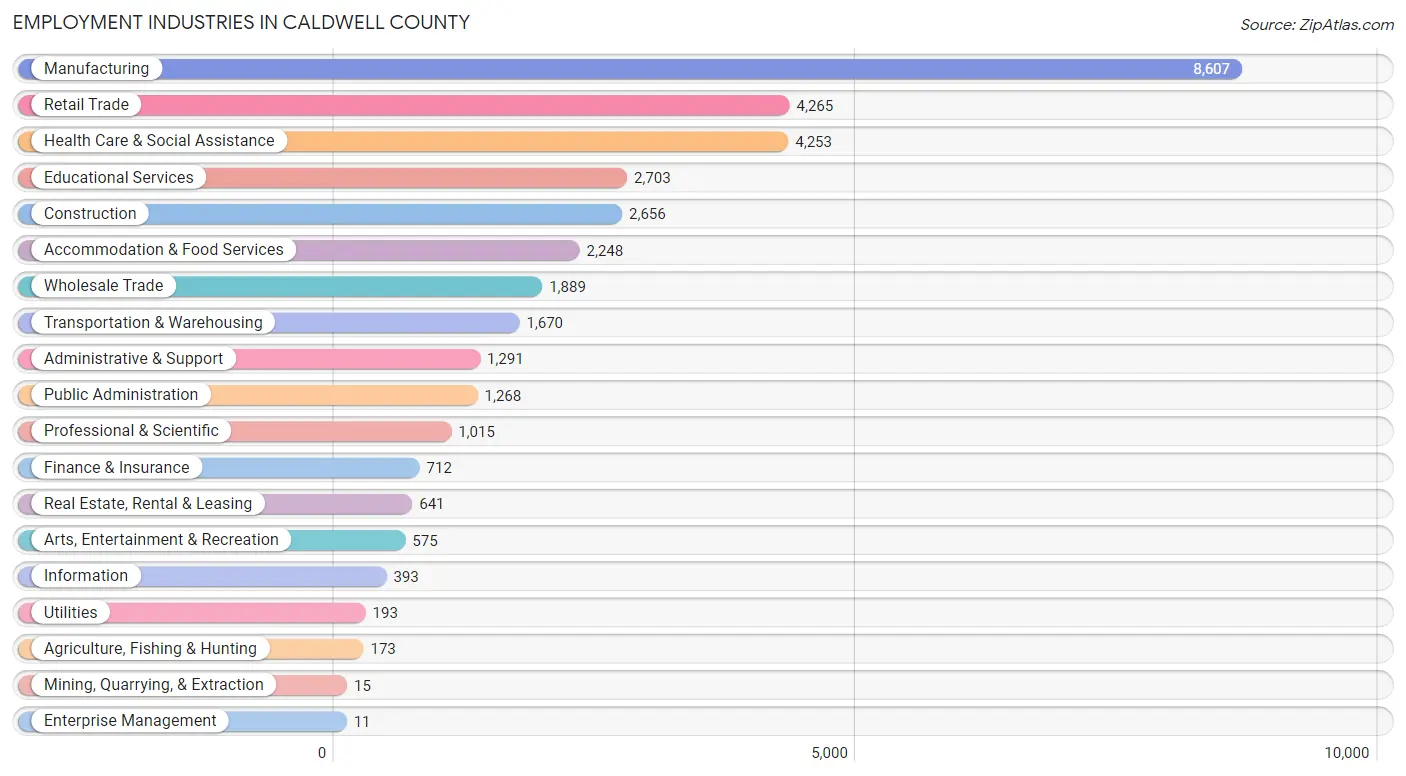
The major employment industries in Caldwell County include Manufacturing (8,607 | 23.6%), Retail Trade (4,265 | 11.7%), Health Care & Social Assistance (4,253 | 11.7%), Educational Services (2,703 | 7.4%), and Construction (2,656 | 7.3%).
Employment Industries by Sex in Caldwell County
The Caldwell County industries that see more men than women are Mining, Quarrying, & Extraction (100.0%), Construction (91.3%), and Information (86.5%), whereas the industries that tend to have a higher number of women are Enterprise Management (100.0%), Health Care & Social Assistance (87.7%), and Finance & Insurance (79.2%).
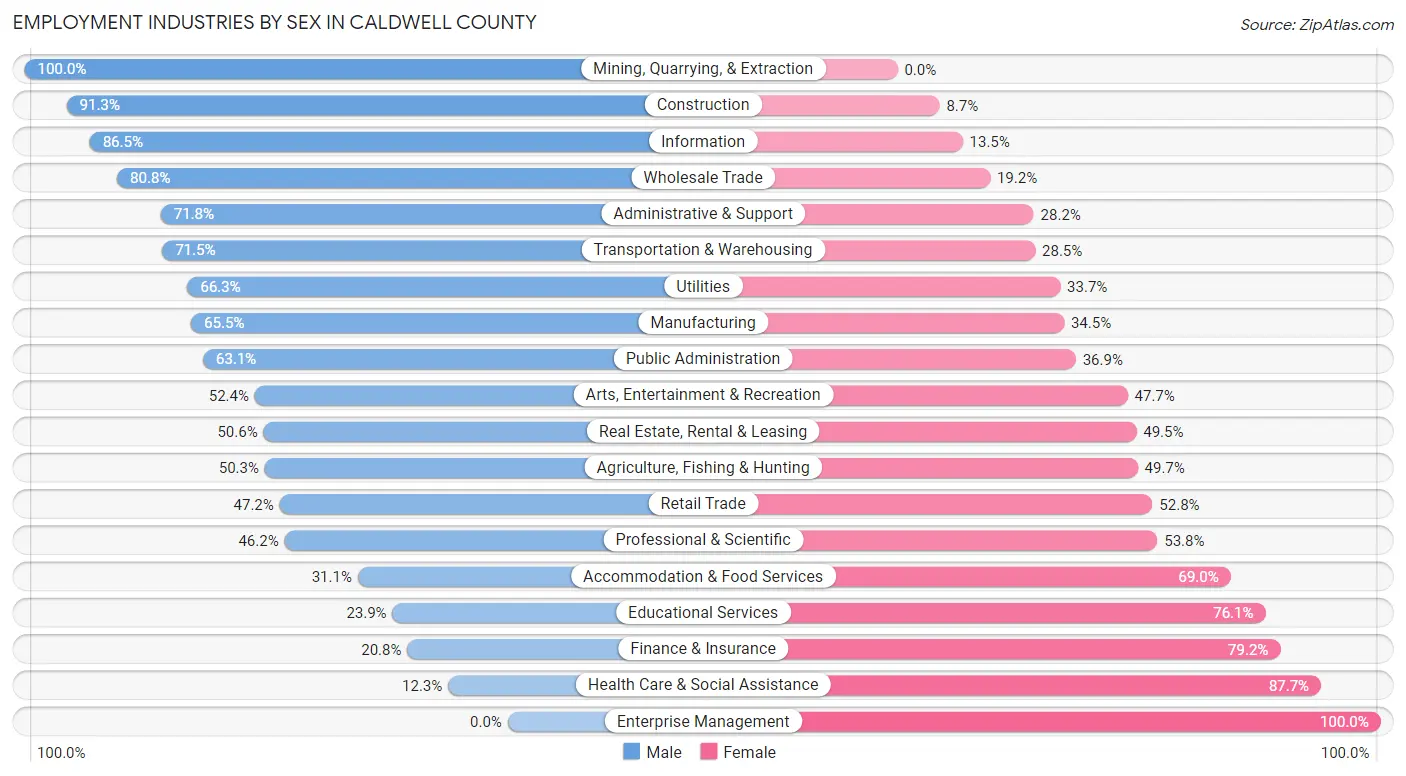
| Industry | Male | Female |
| Agriculture, Fishing & Hunting | 87 (50.3%) | 86 (49.7%) |
| Mining, Quarrying, & Extraction | 15 (100.0%) | 0 (0.0%) |
| Construction | 2,425 (91.3%) | 231 (8.7%) |
| Manufacturing | 5,639 (65.5%) | 2,968 (34.5%) |
| Wholesale Trade | 1,527 (80.8%) | 362 (19.2%) |
| Retail Trade | 2,014 (47.2%) | 2,251 (52.8%) |
| Transportation & Warehousing | 1,194 (71.5%) | 476 (28.5%) |
| Utilities | 128 (66.3%) | 65 (33.7%) |
| Information | 340 (86.5%) | 53 (13.5%) |
| Finance & Insurance | 148 (20.8%) | 564 (79.2%) |
| Real Estate, Rental & Leasing | 324 (50.5%) | 317 (49.4%) |
| Professional & Scientific | 469 (46.2%) | 546 (53.8%) |
| Enterprise Management | 0 (0.0%) | 11 (100.0%) |
| Administrative & Support | 927 (71.8%) | 364 (28.2%) |
| Educational Services | 645 (23.9%) | 2,058 (76.1%) |
| Health Care & Social Assistance | 525 (12.3%) | 3,728 (87.7%) |
| Arts, Entertainment & Recreation | 301 (52.3%) | 274 (47.6%) |
| Accommodation & Food Services | 698 (31.0%) | 1,550 (69.0%) |
| Public Administration | 800 (63.1%) | 468 (36.9%) |
| Total | 19,198 (52.7%) | 17,237 (47.3%) |
Education in Caldwell County
School Enrollment in Caldwell County
The most common levels of schooling among the 15,725 students in Caldwell County are high school (3,933 | 25.0%), elementary school (3,929 | 25.0%), and middle school (3,487 | 22.2%).
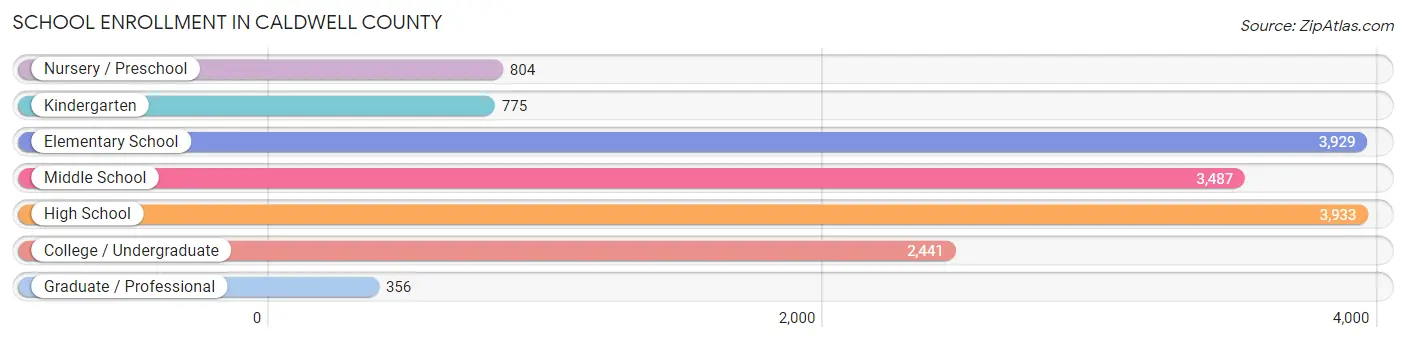
| School Level | # Students | % Students |
| Nursery / Preschool | 804 | 5.1% |
| Kindergarten | 775 | 4.9% |
| Elementary School | 3,929 | 25.0% |
| Middle School | 3,487 | 22.2% |
| High School | 3,933 | 25.0% |
| College / Undergraduate | 2,441 | 15.5% |
| Graduate / Professional | 356 | 2.3% |
| Total | 15,725 | 100.0% |
School Enrollment by Age by Funding Source in Caldwell County
Out of a total of 15,725 students who are enrolled in schools in Caldwell County, 2,280 (14.5%) attend a private institution, while the remaining 13,445 (85.5%) are enrolled in public schools. The age group of 3 to 4 year olds has the highest likelihood of being enrolled in private schools, with 341 (61.6% in the age bracket) enrolled. Conversely, the age group of 15 to 17 year olds has the lowest likelihood of being enrolled in a private school, with 2,650 (95.4% in the age bracket) attending a public institution.
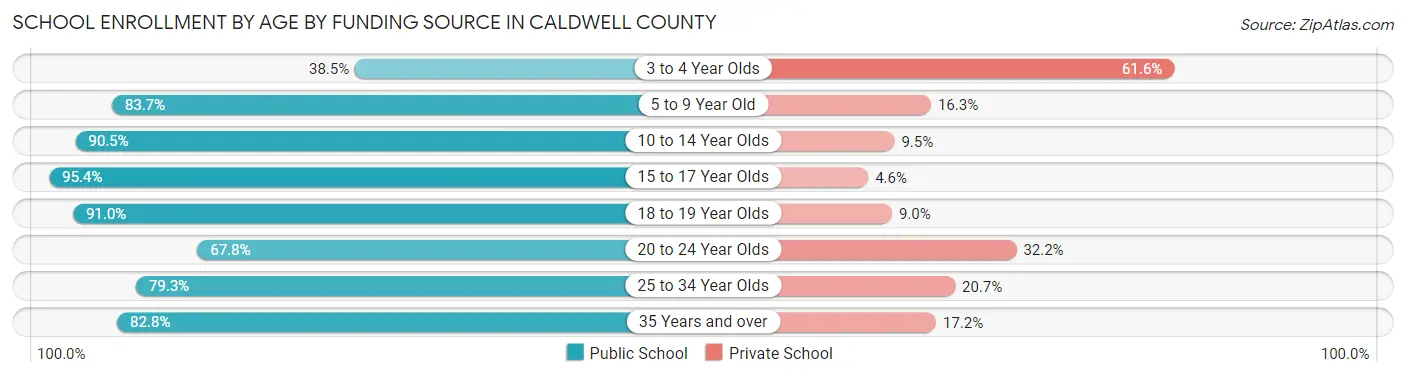
| Age Bracket | Public School | Private School |
| 3 to 4 Year Olds | 213 (38.5%) | 341 (61.6%) |
| 5 to 9 Year Old | 3,400 (83.7%) | 660 (16.3%) |
| 10 to 14 Year Olds | 4,325 (90.5%) | 452 (9.5%) |
| 15 to 17 Year Olds | 2,650 (95.4%) | 127 (4.6%) |
| 18 to 19 Year Olds | 1,061 (91.0%) | 105 (9.0%) |
| 20 to 24 Year Olds | 708 (67.8%) | 336 (32.2%) |
| 25 to 34 Year Olds | 451 (79.3%) | 118 (20.7%) |
| 35 Years and over | 644 (82.8%) | 134 (17.2%) |
| Total | 13,445 (85.5%) | 2,280 (14.5%) |
Educational Attainment by Field of Study in Caldwell County
Education (2,538 | 23.6%), business (1,593 | 14.8%), science & technology (1,274 | 11.9%), arts & humanities (1,054 | 9.8%), and social sciences (630 | 5.9%) are the most common fields of study among 10,740 individuals in Caldwell County who have obtained a bachelor's degree or higher.
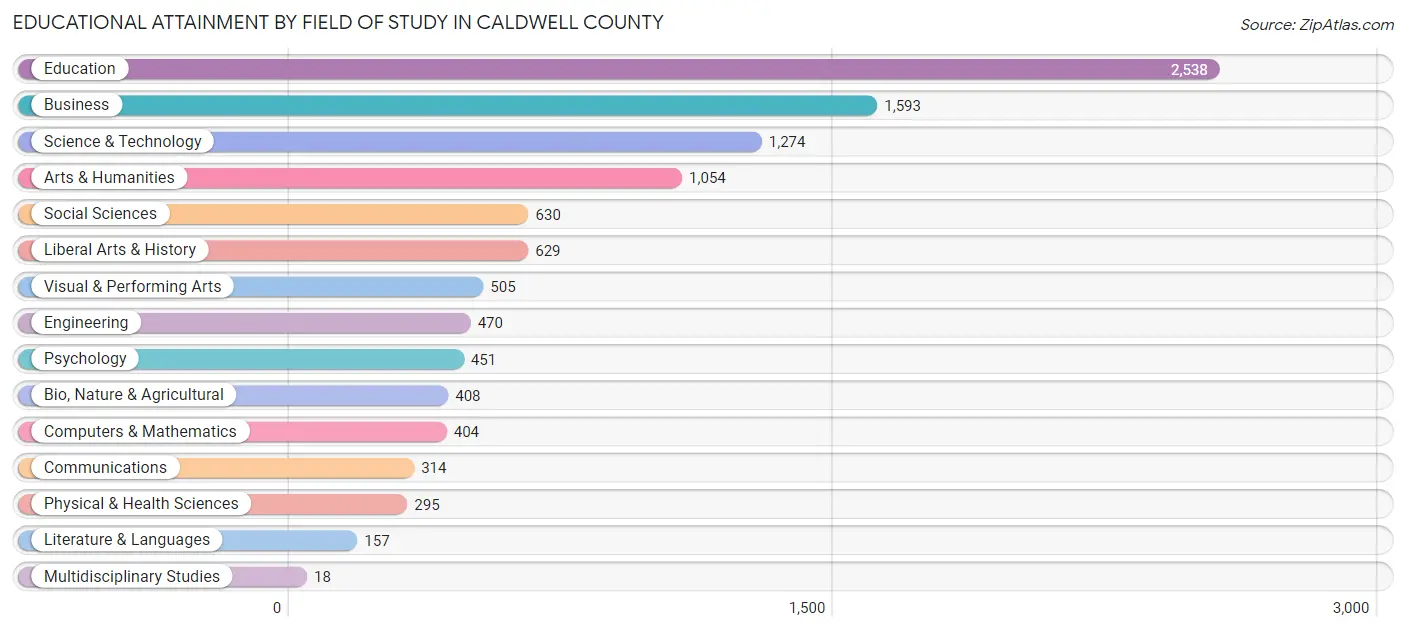
| Field of Study | # Graduates | % Graduates |
| Computers & Mathematics | 404 | 3.8% |
| Bio, Nature & Agricultural | 408 | 3.8% |
| Physical & Health Sciences | 295 | 2.8% |
| Psychology | 451 | 4.2% |
| Social Sciences | 630 | 5.9% |
| Engineering | 470 | 4.4% |
| Multidisciplinary Studies | 18 | 0.2% |
| Science & Technology | 1,274 | 11.9% |
| Business | 1,593 | 14.8% |
| Education | 2,538 | 23.6% |
| Literature & Languages | 157 | 1.5% |
| Liberal Arts & History | 629 | 5.9% |
| Visual & Performing Arts | 505 | 4.7% |
| Communications | 314 | 2.9% |
| Arts & Humanities | 1,054 | 9.8% |
| Total | 10,740 | 100.0% |
Transportation & Commute in Caldwell County
Vehicle Availability by Sex in Caldwell County
The most prevalent vehicle ownership categories in Caldwell County are males with 2 vehicles (7,202, accounting for 38.2%) and females with 2 vehicles (5,381, making up 43.9%).
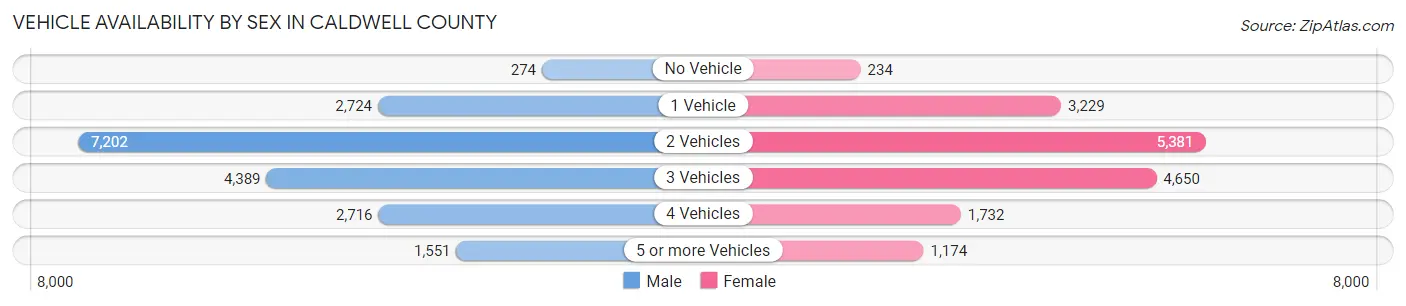
| Vehicles Available | Male | Female |
| No Vehicle | 274 (1.5%) | 234 (1.4%) |
| 1 Vehicle | 2,724 (14.4%) | 3,229 (19.7%) |
| 2 Vehicles | 7,202 (38.2%) | 5,381 (32.8%) |
| 3 Vehicles | 4,389 (23.3%) | 4,650 (28.3%) |
| 4 Vehicles | 2,716 (14.4%) | 1,732 (10.6%) |
| 5 or more Vehicles | 1,551 (8.2%) | 1,174 (7.2%) |
| Total | 18,856 (100.0%) | 16,400 (100.0%) |
Commute Time in Caldwell County
The most frequently occuring commute durations in Caldwell County are 15 to 19 minutes (5,484 commuters, 16.4%), 10 to 14 minutes (5,265 commuters, 15.8%), and 20 to 24 minutes (4,613 commuters, 13.8%).
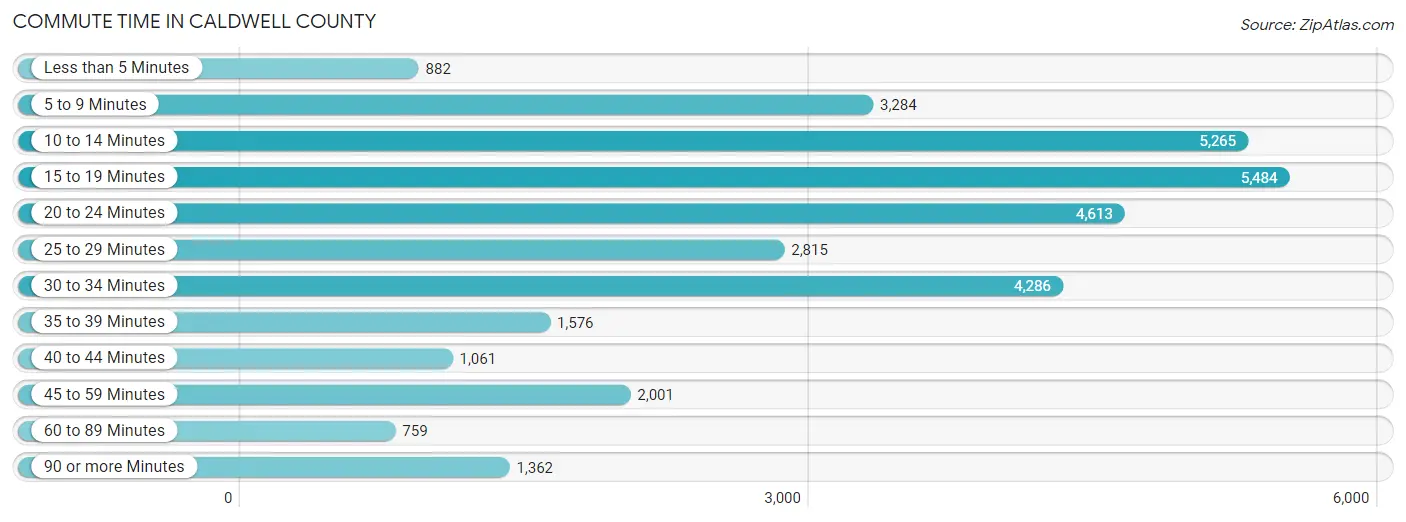
| Commute Time | # Commuters | % Commuters |
| Less than 5 Minutes | 882 | 2.6% |
| 5 to 9 Minutes | 3,284 | 9.8% |
| 10 to 14 Minutes | 5,265 | 15.8% |
| 15 to 19 Minutes | 5,484 | 16.4% |
| 20 to 24 Minutes | 4,613 | 13.8% |
| 25 to 29 Minutes | 2,815 | 8.4% |
| 30 to 34 Minutes | 4,286 | 12.8% |
| 35 to 39 Minutes | 1,576 | 4.7% |
| 40 to 44 Minutes | 1,061 | 3.2% |
| 45 to 59 Minutes | 2,001 | 6.0% |
| 60 to 89 Minutes | 759 | 2.3% |
| 90 or more Minutes | 1,362 | 4.1% |
Commute Time by Sex in Caldwell County
The most common commute times in Caldwell County are 10 to 14 minutes (2,764 commuters, 15.5%) for males and 15 to 19 minutes (3,100 commuters, 20.0%) for females.
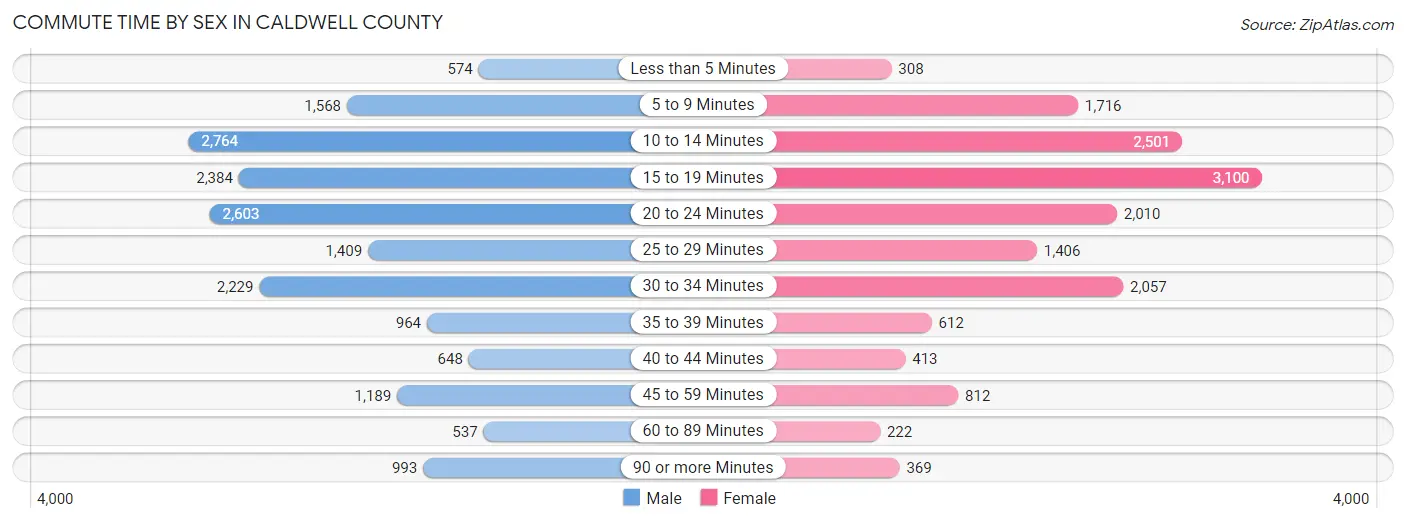
| Commute Time | Male | Female |
| Less than 5 Minutes | 574 (3.2%) | 308 (2.0%) |
| 5 to 9 Minutes | 1,568 (8.8%) | 1,716 (11.1%) |
| 10 to 14 Minutes | 2,764 (15.5%) | 2,501 (16.1%) |
| 15 to 19 Minutes | 2,384 (13.4%) | 3,100 (20.0%) |
| 20 to 24 Minutes | 2,603 (14.6%) | 2,010 (13.0%) |
| 25 to 29 Minutes | 1,409 (7.9%) | 1,406 (9.1%) |
| 30 to 34 Minutes | 2,229 (12.5%) | 2,057 (13.3%) |
| 35 to 39 Minutes | 964 (5.4%) | 612 (3.9%) |
| 40 to 44 Minutes | 648 (3.6%) | 413 (2.7%) |
| 45 to 59 Minutes | 1,189 (6.7%) | 812 (5.2%) |
| 60 to 89 Minutes | 537 (3.0%) | 222 (1.4%) |
| 90 or more Minutes | 993 (5.6%) | 369 (2.4%) |
Time of Departure to Work by Sex in Caldwell County
The most frequent times of departure to work in Caldwell County are 7:00 AM to 7:29 AM (2,718, 15.2%) for males and 7:00 AM to 7:29 AM (2,703, 17.4%) for females.
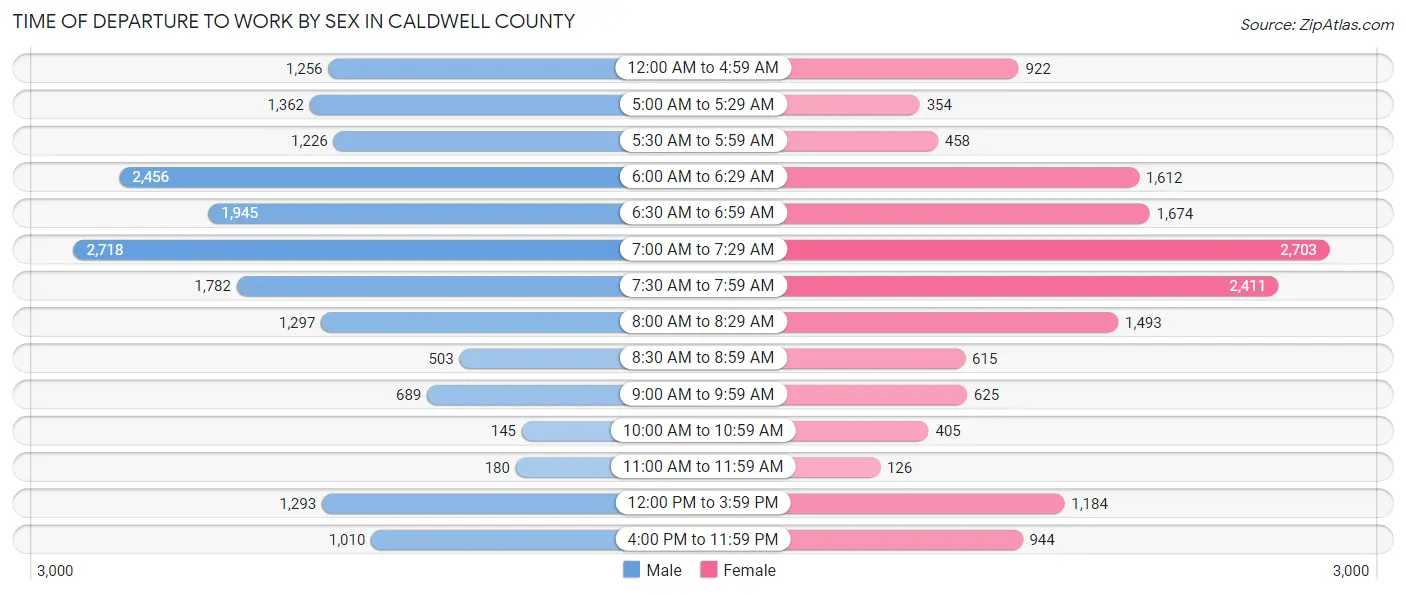
| Time of Departure | Male | Female |
| 12:00 AM to 4:59 AM | 1,256 (7.0%) | 922 (5.9%) |
| 5:00 AM to 5:29 AM | 1,362 (7.6%) | 354 (2.3%) |
| 5:30 AM to 5:59 AM | 1,226 (6.9%) | 458 (2.9%) |
| 6:00 AM to 6:29 AM | 2,456 (13.8%) | 1,612 (10.4%) |
| 6:30 AM to 6:59 AM | 1,945 (10.9%) | 1,674 (10.8%) |
| 7:00 AM to 7:29 AM | 2,718 (15.2%) | 2,703 (17.4%) |
| 7:30 AM to 7:59 AM | 1,782 (10.0%) | 2,411 (15.5%) |
| 8:00 AM to 8:29 AM | 1,297 (7.3%) | 1,493 (9.6%) |
| 8:30 AM to 8:59 AM | 503 (2.8%) | 615 (4.0%) |
| 9:00 AM to 9:59 AM | 689 (3.9%) | 625 (4.0%) |
| 10:00 AM to 10:59 AM | 145 (0.8%) | 405 (2.6%) |
| 11:00 AM to 11:59 AM | 180 (1.0%) | 126 (0.8%) |
| 12:00 PM to 3:59 PM | 1,293 (7.2%) | 1,184 (7.6%) |
| 4:00 PM to 11:59 PM | 1,010 (5.7%) | 944 (6.1%) |
| Total | 17,862 (100.0%) | 15,526 (100.0%) |
Housing Occupancy in Caldwell County
Occupancy by Ownership in Caldwell County
Of the total 32,120 dwellings in Caldwell County, owner-occupied units account for 23,947 (74.6%), while renter-occupied units make up 8,173 (25.5%).
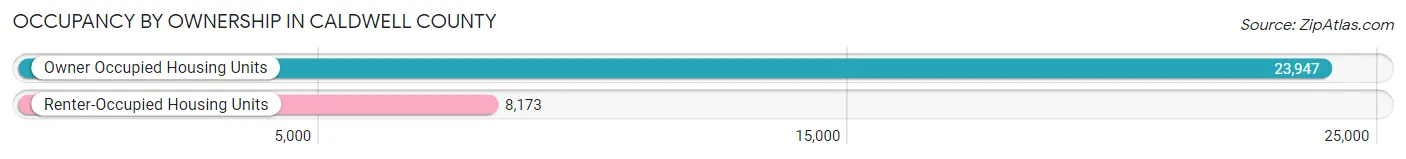
| Occupancy | # Housing Units | % Housing Units |
| Owner Occupied Housing Units | 23,947 | 74.6% |
| Renter-Occupied Housing Units | 8,173 | 25.5% |
| Total Occupied Housing Units | 32,120 | 100.0% |
Occupancy by Household Size in Caldwell County
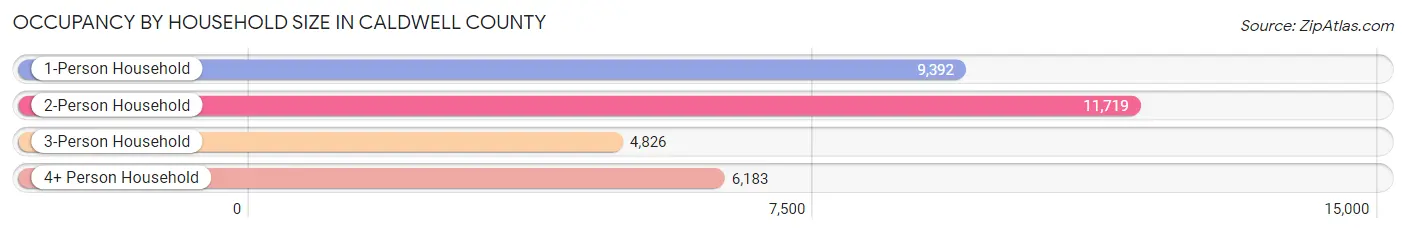
| Household Size | # Housing Units | % Housing Units |
| 1-Person Household | 9,392 | 29.2% |
| 2-Person Household | 11,719 | 36.5% |
| 3-Person Household | 4,826 | 15.0% |
| 4+ Person Household | 6,183 | 19.3% |
| Total Housing Units | 32,120 | 100.0% |
Occupancy by Ownership by Household Size in Caldwell County
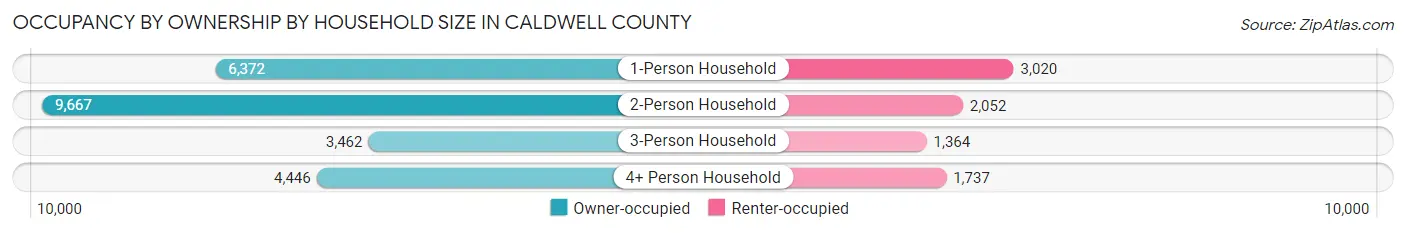
| Household Size | Owner-occupied | Renter-occupied |
| 1-Person Household | 6,372 (67.8%) | 3,020 (32.2%) |
| 2-Person Household | 9,667 (82.5%) | 2,052 (17.5%) |
| 3-Person Household | 3,462 (71.7%) | 1,364 (28.3%) |
| 4+ Person Household | 4,446 (71.9%) | 1,737 (28.1%) |
| Total Housing Units | 23,947 (74.6%) | 8,173 (25.5%) |
Occupancy by Educational Attainment in Caldwell County

| Household Size | Owner-occupied | Renter-occupied |
| Less than High School | 3,675 (69.0%) | 1,653 (31.0%) |
| High School Diploma | 6,668 (68.6%) | 3,054 (31.4%) |
| College/Associate Degree | 8,255 (76.5%) | 2,529 (23.4%) |
| Bachelor's Degree or higher | 5,349 (85.1%) | 937 (14.9%) |
Occupancy by Age of Householder in Caldwell County
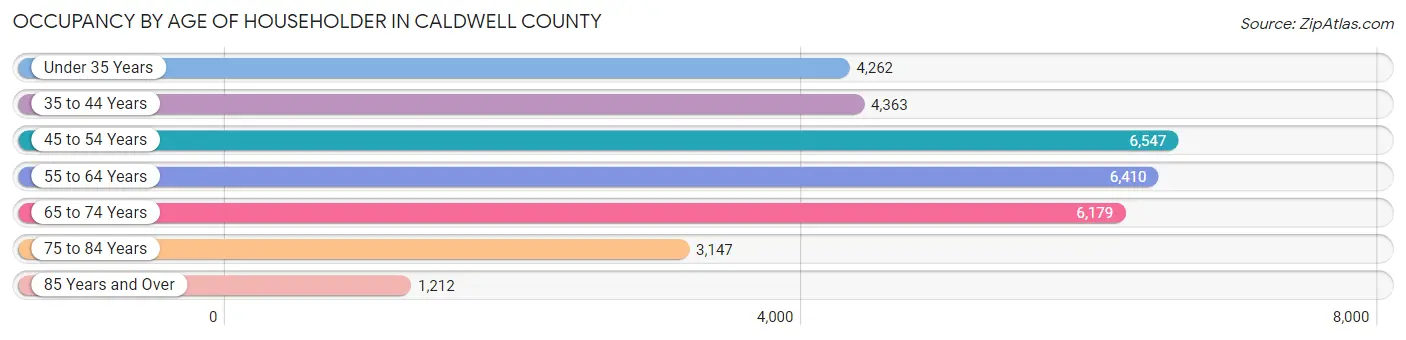
| Age Bracket | # Households | % Households |
| Under 35 Years | 4,262 | 13.3% |
| 35 to 44 Years | 4,363 | 13.6% |
| 45 to 54 Years | 6,547 | 20.4% |
| 55 to 64 Years | 6,410 | 20.0% |
| 65 to 74 Years | 6,179 | 19.2% |
| 75 to 84 Years | 3,147 | 9.8% |
| 85 Years and Over | 1,212 | 3.8% |
| Total | 32,120 | 100.0% |
Housing Finances in Caldwell County
Median Income by Occupancy in Caldwell County

| Occupancy Type | # Households | Median Income |
| Owner-Occupied | 23,947 (74.6%) | $61,347 |
| Renter-Occupied | 8,173 (25.5%) | $33,018 |
| Average | 32,120 (100.0%) | $52,362 |
Occupancy by Householder Income Bracket in Caldwell County
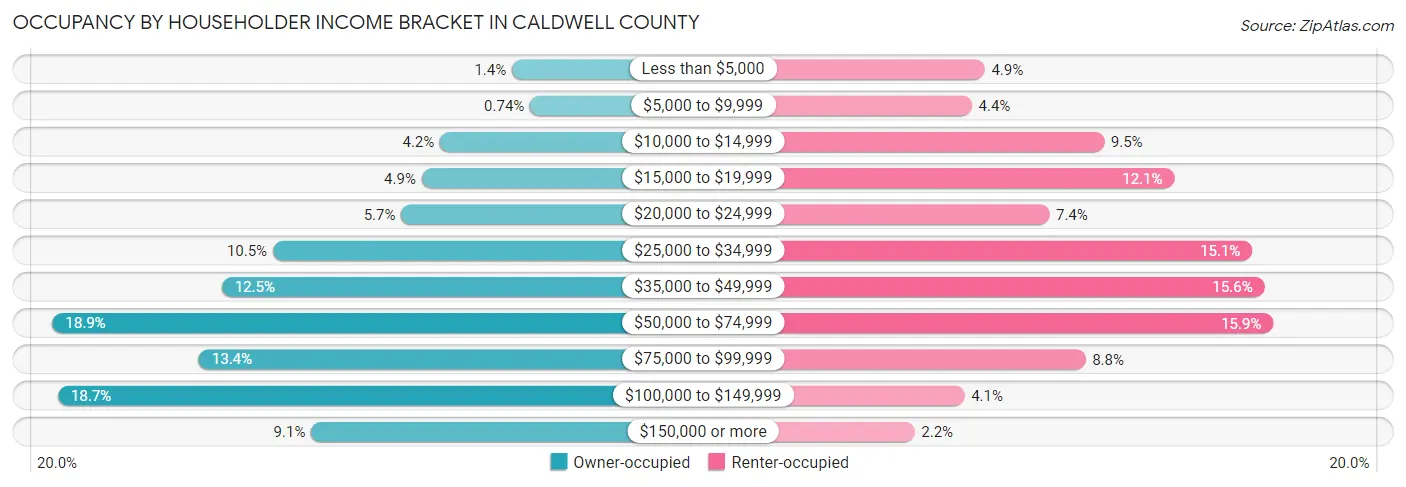
| Income Bracket | Owner-occupied | Renter-occupied |
| Less than $5,000 | 342 (1.4%) | 401 (4.9%) |
| $5,000 to $9,999 | 177 (0.7%) | 361 (4.4%) |
| $10,000 to $14,999 | 999 (4.2%) | 773 (9.5%) |
| $15,000 to $19,999 | 1,166 (4.9%) | 992 (12.1%) |
| $20,000 to $24,999 | 1,353 (5.7%) | 602 (7.4%) |
| $25,000 to $34,999 | 2,523 (10.5%) | 1,235 (15.1%) |
| $35,000 to $49,999 | 2,992 (12.5%) | 1,273 (15.6%) |
| $50,000 to $74,999 | 4,536 (18.9%) | 1,300 (15.9%) |
| $75,000 to $99,999 | 3,200 (13.4%) | 715 (8.7%) |
| $100,000 to $149,999 | 4,485 (18.7%) | 338 (4.1%) |
| $150,000 or more | 2,174 (9.1%) | 183 (2.2%) |
| Total | 23,947 (100.0%) | 8,173 (100.0%) |
Monthly Housing Cost Tiers in Caldwell County

| Monthly Cost | Owner-occupied | Renter-occupied |
| Less than $300 | 4,375 (18.3%) | 408 (5.0%) |
| $300 to $499 | 5,085 (21.2%) | 726 (8.9%) |
| $500 to $799 | 4,320 (18.0%) | 3,681 (45.0%) |
| $800 to $999 | 2,284 (9.5%) | 1,402 (17.2%) |
| $1,000 to $1,499 | 4,895 (20.4%) | 909 (11.1%) |
| $1,500 to $1,999 | 1,644 (6.9%) | 73 (0.9%) |
| $2,000 to $2,499 | 774 (3.2%) | 55 (0.7%) |
| $2,500 to $2,999 | 132 (0.5%) | 17 (0.2%) |
| $3,000 or more | 438 (1.8%) | 0 (0.0%) |
| Total | 23,947 (100.0%) | 8,173 (100.0%) |
Physical Housing Characteristics in Caldwell County
Housing Structures in Caldwell County
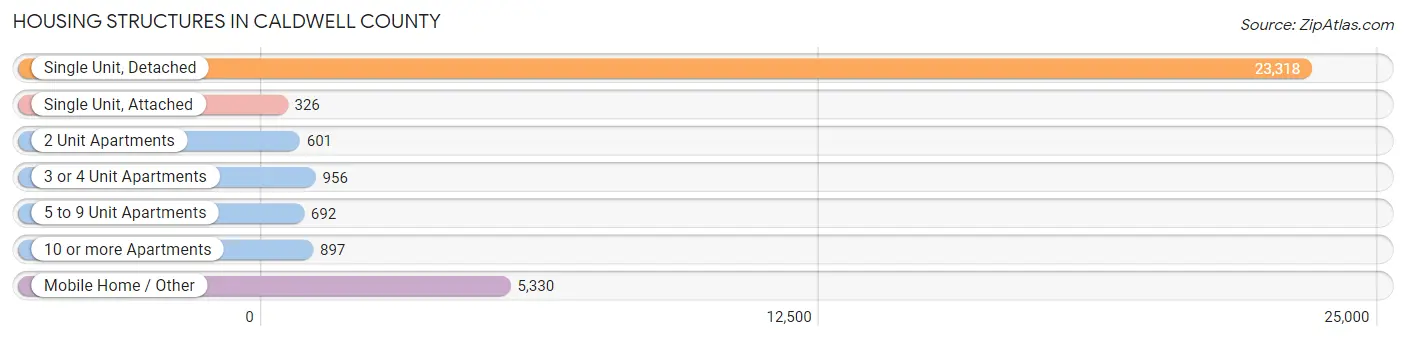
| Structure Type | # Housing Units | % Housing Units |
| Single Unit, Detached | 23,318 | 72.6% |
| Single Unit, Attached | 326 | 1.0% |
| 2 Unit Apartments | 601 | 1.9% |
| 3 or 4 Unit Apartments | 956 | 3.0% |
| 5 to 9 Unit Apartments | 692 | 2.1% |
| 10 or more Apartments | 897 | 2.8% |
| Mobile Home / Other | 5,330 | 16.6% |
| Total | 32,120 | 100.0% |
Housing Structures by Occupancy in Caldwell County
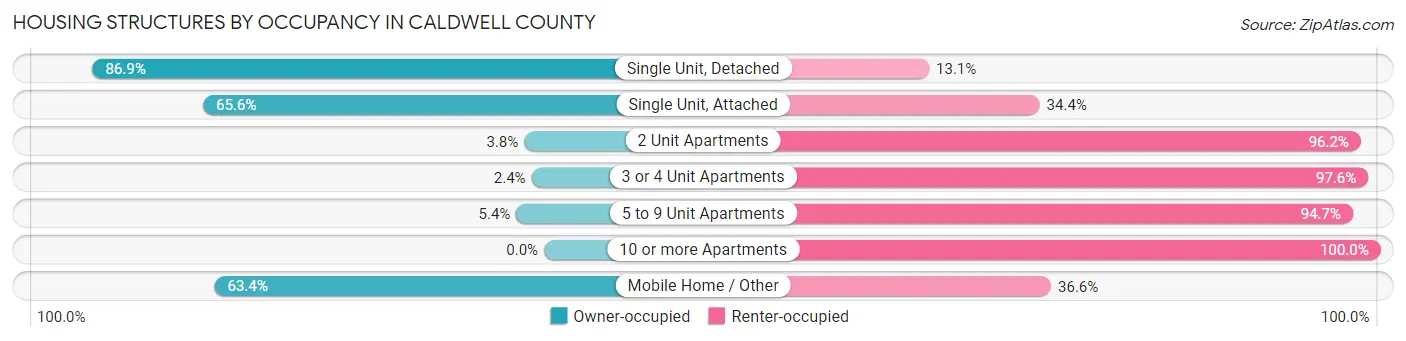
| Structure Type | Owner-occupied | Renter-occupied |
| Single Unit, Detached | 20,269 (86.9%) | 3,049 (13.1%) |
| Single Unit, Attached | 214 (65.6%) | 112 (34.4%) |
| 2 Unit Apartments | 23 (3.8%) | 578 (96.2%) |
| 3 or 4 Unit Apartments | 23 (2.4%) | 933 (97.6%) |
| 5 to 9 Unit Apartments | 37 (5.3%) | 655 (94.7%) |
| 10 or more Apartments | 0 (0.0%) | 897 (100.0%) |
| Mobile Home / Other | 3,381 (63.4%) | 1,949 (36.6%) |
| Total | 23,947 (74.6%) | 8,173 (25.5%) |
Housing Structures by Number of Rooms in Caldwell County
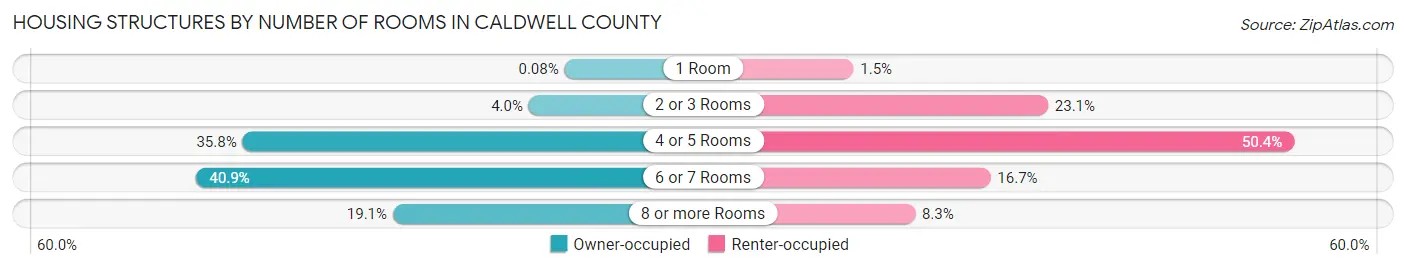
| Number of Rooms | Owner-occupied | Renter-occupied |
| 1 Room | 20 (0.1%) | 122 (1.5%) |
| 2 or 3 Rooms | 968 (4.0%) | 1,886 (23.1%) |
| 4 or 5 Rooms | 8,577 (35.8%) | 4,119 (50.4%) |
| 6 or 7 Rooms | 9,801 (40.9%) | 1,365 (16.7%) |
| 8 or more Rooms | 4,581 (19.1%) | 681 (8.3%) |
| Total | 23,947 (100.0%) | 8,173 (100.0%) |
Housing Structure by Heating Type in Caldwell County
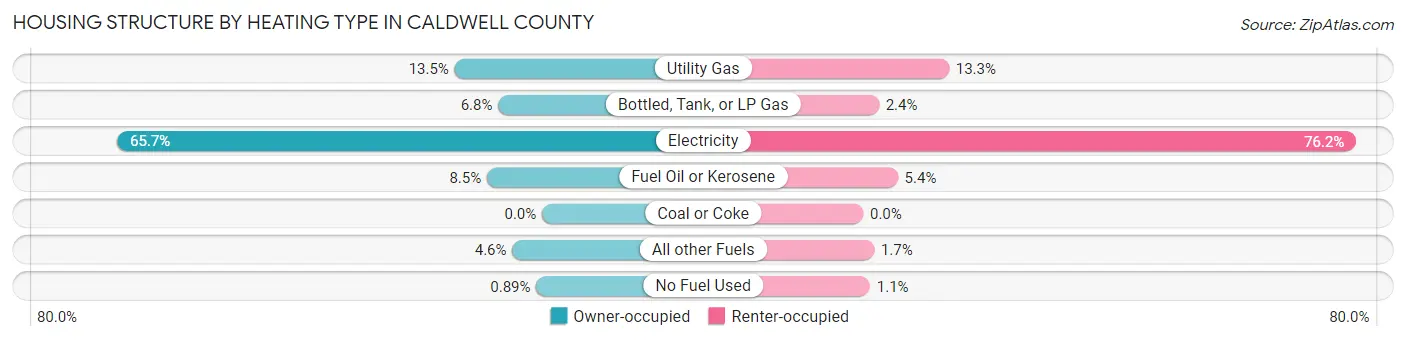
| Heating Type | Owner-occupied | Renter-occupied |
| Utility Gas | 3,235 (13.5%) | 1,084 (13.3%) |
| Bottled, Tank, or LP Gas | 1,622 (6.8%) | 198 (2.4%) |
| Electricity | 15,737 (65.7%) | 6,230 (76.2%) |
| Fuel Oil or Kerosene | 2,038 (8.5%) | 437 (5.3%) |
| Coal or Coke | 0 (0.0%) | 0 (0.0%) |
| All other Fuels | 1,101 (4.6%) | 138 (1.7%) |
| No Fuel Used | 214 (0.9%) | 86 (1.1%) |
| Total | 23,947 (100.0%) | 8,173 (100.0%) |
Household Vehicle Usage in Caldwell County
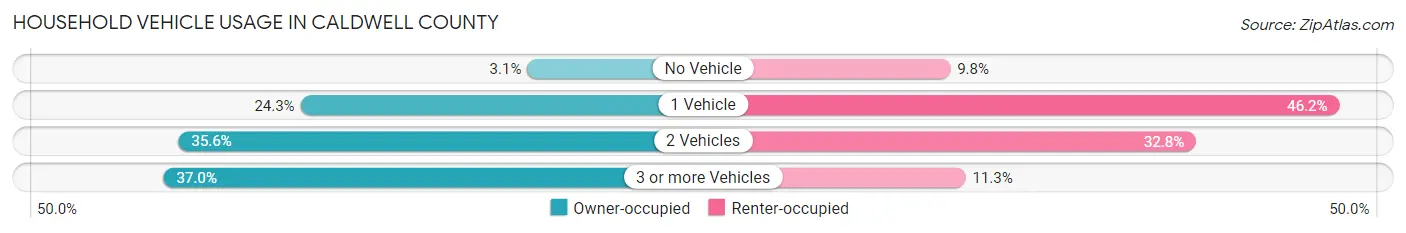
| Vehicles per Household | Owner-occupied | Renter-occupied |
| No Vehicle | 738 (3.1%) | 803 (9.8%) |
| 1 Vehicle | 5,808 (24.2%) | 3,772 (46.2%) |
| 2 Vehicles | 8,534 (35.6%) | 2,678 (32.8%) |
| 3 or more Vehicles | 8,867 (37.0%) | 920 (11.3%) |
| Total | 23,947 (100.0%) | 8,173 (100.0%) |
Real Estate & Mortgages in Caldwell County
Real Estate and Mortgage Overview in Caldwell County
| Characteristic | Without Mortgage | With Mortgage |
| Housing Units | 11,409 | 12,538 |
| Median Property Value | $127,900 | $182,500 |
| Median Household Income | $43,477 | $1,487 |
| Monthly Housing Costs | $333 | $404 |
| Real Estate Taxes | $880 | $203 |
Property Value by Mortgage Status in Caldwell County
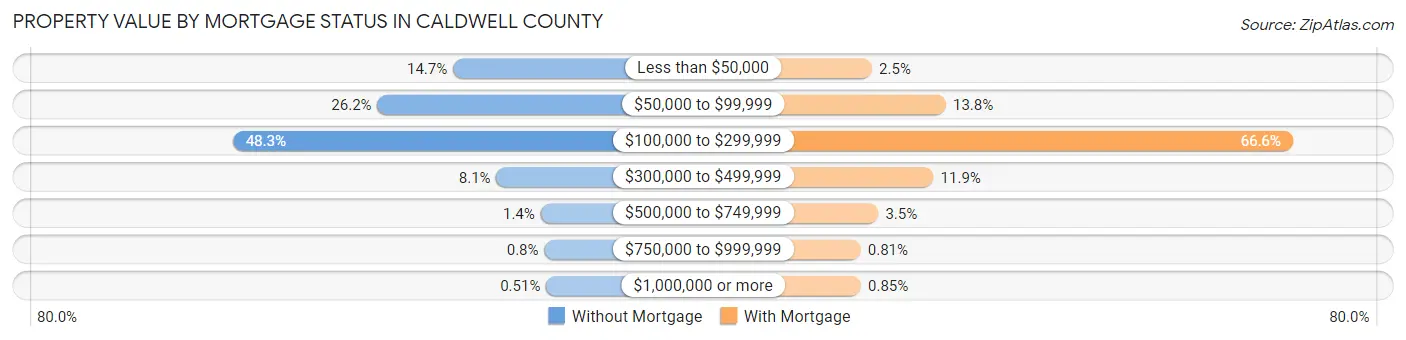
| Property Value | Without Mortgage | With Mortgage |
| Less than $50,000 | 1,678 (14.7%) | 317 (2.5%) |
| $50,000 to $99,999 | 2,994 (26.2%) | 1,729 (13.8%) |
| $100,000 to $299,999 | 5,508 (48.3%) | 8,354 (66.6%) |
| $300,000 to $499,999 | 924 (8.1%) | 1,492 (11.9%) |
| $500,000 to $749,999 | 156 (1.4%) | 438 (3.5%) |
| $750,000 to $999,999 | 91 (0.8%) | 101 (0.8%) |
| $1,000,000 or more | 58 (0.5%) | 107 (0.9%) |
| Total | 11,409 (100.0%) | 12,538 (100.0%) |
Household Income by Mortgage Status in Caldwell County
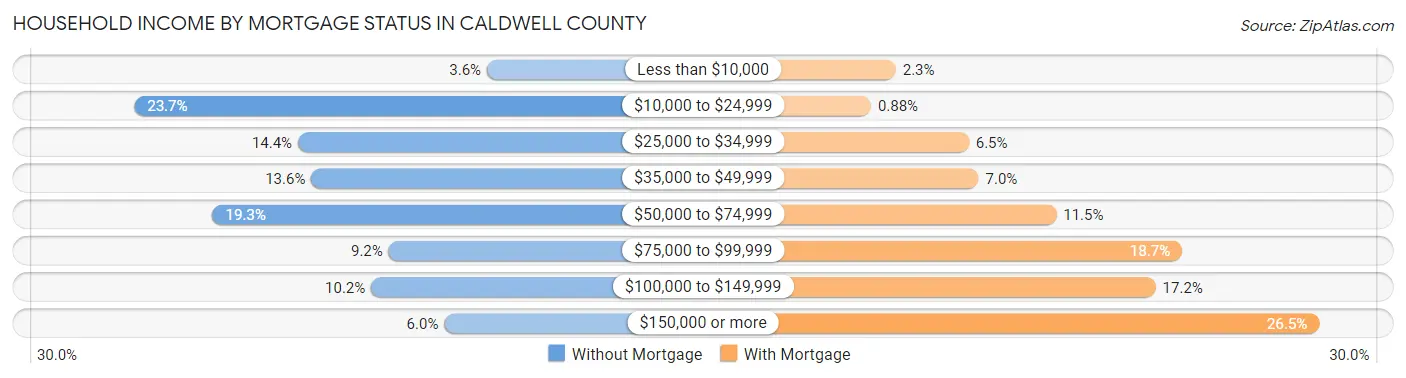
| Household Income | Without Mortgage | With Mortgage |
| Less than $10,000 | 409 (3.6%) | 289 (2.3%) |
| $10,000 to $24,999 | 2,707 (23.7%) | 110 (0.9%) |
| $25,000 to $34,999 | 1,641 (14.4%) | 811 (6.5%) |
| $35,000 to $49,999 | 1,554 (13.6%) | 882 (7.0%) |
| $50,000 to $74,999 | 2,197 (19.3%) | 1,438 (11.5%) |
| $75,000 to $99,999 | 1,050 (9.2%) | 2,339 (18.7%) |
| $100,000 to $149,999 | 1,164 (10.2%) | 2,150 (17.2%) |
| $150,000 or more | 687 (6.0%) | 3,321 (26.5%) |
| Total | 11,409 (100.0%) | 12,538 (100.0%) |
Property Value to Household Income Ratio in Caldwell County
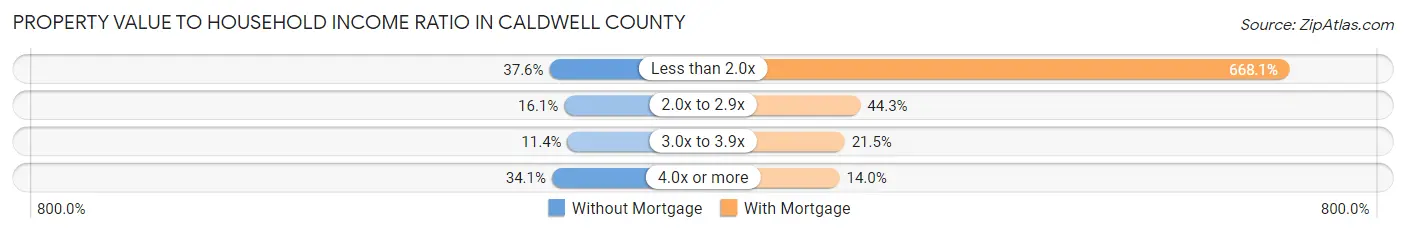
| Value-to-Income Ratio | Without Mortgage | With Mortgage |
| Less than 2.0x | 4,287 (37.6%) | 83,764 (668.1%) |
| 2.0x to 2.9x | 1,841 (16.1%) | 5,554 (44.3%) |
| 3.0x to 3.9x | 1,296 (11.4%) | 2,692 (21.5%) |
| 4.0x or more | 3,889 (34.1%) | 1,754 (14.0%) |
| Total | 11,409 (100.0%) | 12,538 (100.0%) |
Real Estate Taxes by Mortgage Status in Caldwell County
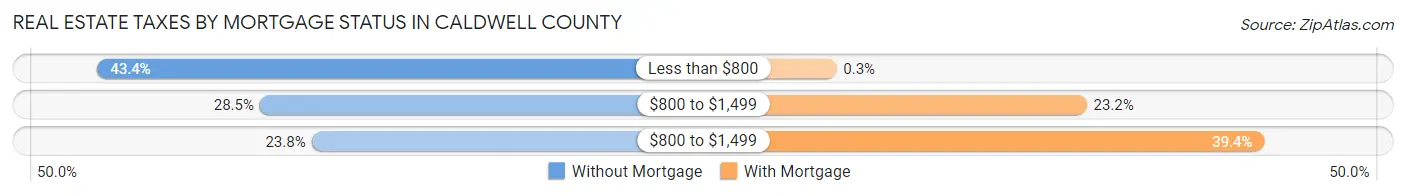
| Property Taxes | Without Mortgage | With Mortgage |
| Less than $800 | 4,946 (43.3%) | 37 (0.3%) |
| $800 to $1,499 | 3,254 (28.5%) | 2,902 (23.2%) |
| $800 to $1,499 | 2,715 (23.8%) | 4,938 (39.4%) |
| Total | 11,409 (100.0%) | 12,538 (100.0%) |
Health & Disability in Caldwell County
Health Insurance Coverage by Age in Caldwell County
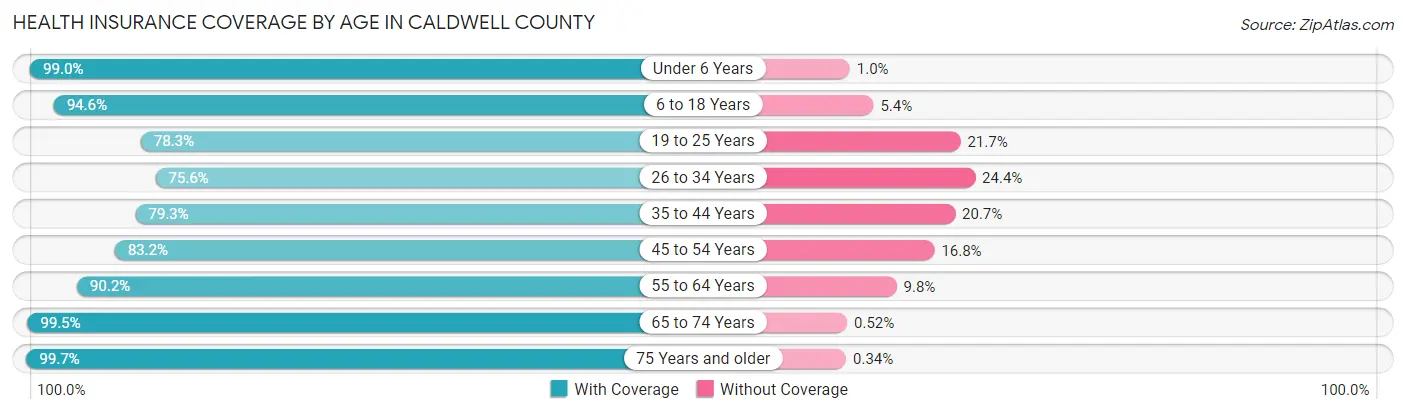
| Age Bracket | With Coverage | Without Coverage |
| Under 6 Years | 4,468 (99.0%) | 47 (1.0%) |
| 6 to 18 Years | 11,925 (94.6%) | 686 (5.4%) |
| 19 to 25 Years | 4,880 (78.3%) | 1,350 (21.7%) |
| 26 to 34 Years | 6,081 (75.6%) | 1,963 (24.4%) |
| 35 to 44 Years | 6,810 (79.3%) | 1,773 (20.7%) |
| 45 to 54 Years | 9,774 (83.2%) | 1,975 (16.8%) |
| 55 to 64 Years | 10,600 (90.2%) | 1,147 (9.8%) |
| 65 to 74 Years | 9,836 (99.5%) | 51 (0.5%) |
| 75 Years and older | 6,455 (99.7%) | 22 (0.3%) |
| Total | 70,829 (88.7%) | 9,014 (11.3%) |
Health Insurance Coverage by Citizenship Status in Caldwell County
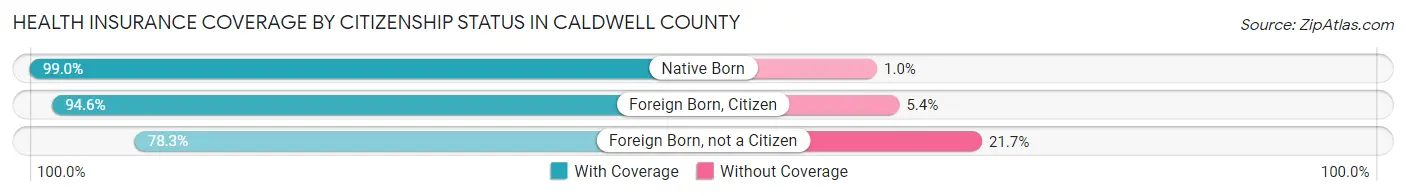
| Citizenship Status | With Coverage | Without Coverage |
| Native Born | 4,468 (99.0%) | 47 (1.0%) |
| Foreign Born, Citizen | 11,925 (94.6%) | 686 (5.4%) |
| Foreign Born, not a Citizen | 4,880 (78.3%) | 1,350 (21.7%) |
Health Insurance Coverage by Household Income in Caldwell County
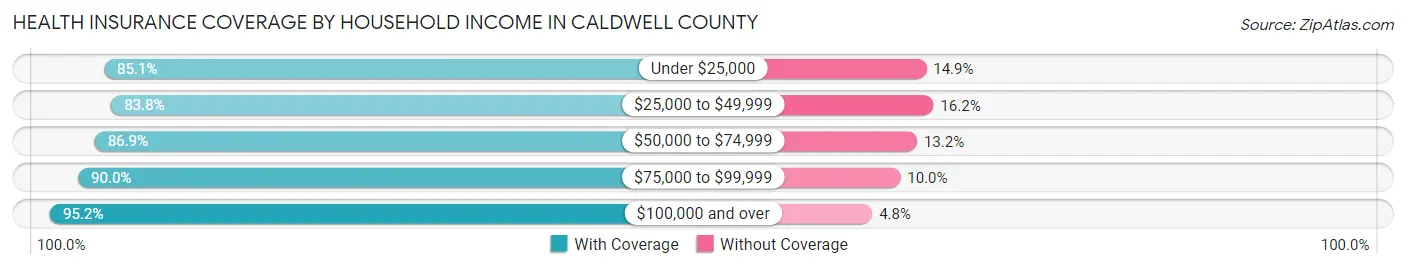
| Household Income | With Coverage | Without Coverage |
| Under $25,000 | 10,271 (85.1%) | 1,797 (14.9%) |
| $25,000 to $49,999 | 14,349 (83.8%) | 2,782 (16.2%) |
| $50,000 to $74,999 | 13,565 (86.9%) | 2,053 (13.2%) |
| $75,000 to $99,999 | 10,630 (90.0%) | 1,187 (10.0%) |
| $100,000 and over | 21,938 (95.2%) | 1,096 (4.8%) |
Public vs Private Health Insurance Coverage by Age in Caldwell County
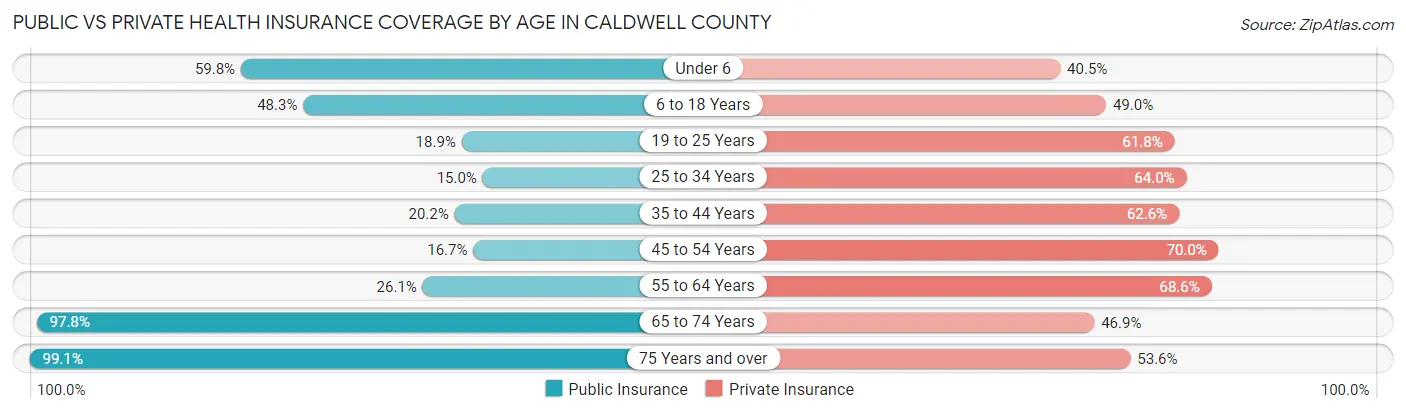
| Age Bracket | Public Insurance | Private Insurance |
| Under 6 | 2,702 (59.8%) | 1,830 (40.5%) |
| 6 to 18 Years | 6,089 (48.3%) | 6,184 (49.0%) |
| 19 to 25 Years | 1,176 (18.9%) | 3,847 (61.8%) |
| 25 to 34 Years | 1,204 (15.0%) | 5,145 (64.0%) |
| 35 to 44 Years | 1,734 (20.2%) | 5,370 (62.6%) |
| 45 to 54 Years | 1,964 (16.7%) | 8,218 (70.0%) |
| 55 to 64 Years | 3,067 (26.1%) | 8,061 (68.6%) |
| 65 to 74 Years | 9,666 (97.8%) | 4,633 (46.9%) |
| 75 Years and over | 6,417 (99.1%) | 3,469 (53.6%) |
| Total | 34,019 (42.6%) | 46,757 (58.6%) |
Disability Status by Sex by Age in Caldwell County
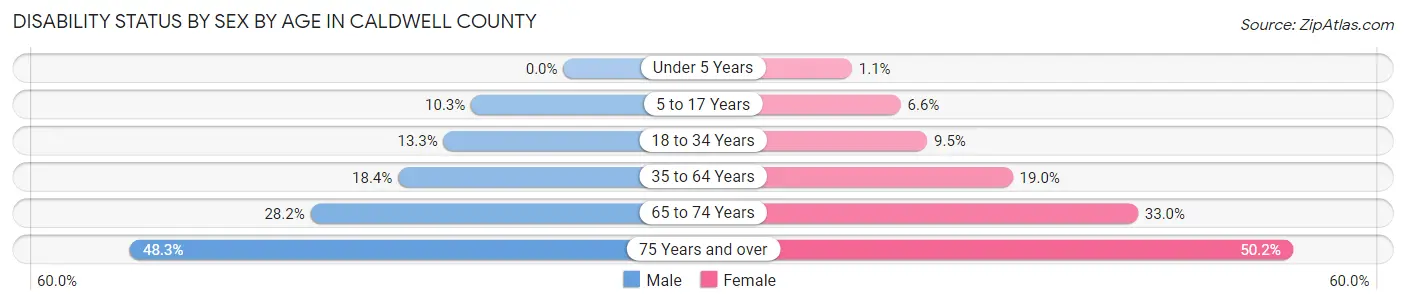
| Age Bracket | Male | Female |
| Under 5 Years | 0 (0.0%) | 21 (1.1%) |
| 5 to 17 Years | 621 (10.3%) | 392 (6.6%) |
| 18 to 34 Years | 1,043 (13.3%) | 719 (9.5%) |
| 35 to 64 Years | 2,950 (18.4%) | 3,053 (19.0%) |
| 65 to 74 Years | 1,345 (28.2%) | 1,685 (33.0%) |
| 75 Years and over | 1,308 (48.2%) | 1,890 (50.2%) |
Disability Class by Sex by Age in Caldwell County
Disability Class: Hearing Difficulty
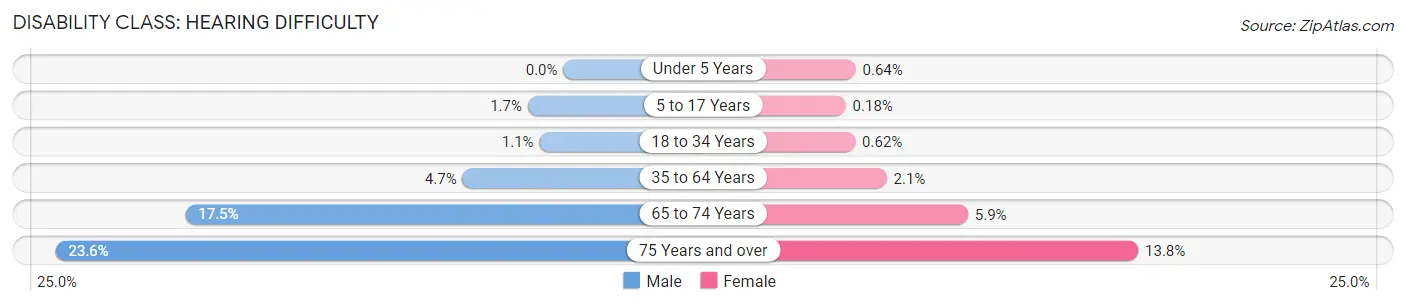
| Age Bracket | Male | Female |
| Under 5 Years | 0 (0.0%) | 12 (0.6%) |
| 5 to 17 Years | 100 (1.7%) | 11 (0.2%) |
| 18 to 34 Years | 87 (1.1%) | 47 (0.6%) |
| 35 to 64 Years | 751 (4.7%) | 334 (2.1%) |
| 65 to 74 Years | 838 (17.5%) | 299 (5.9%) |
| 75 Years and over | 639 (23.6%) | 518 (13.8%) |
Disability Class: Vision Difficulty
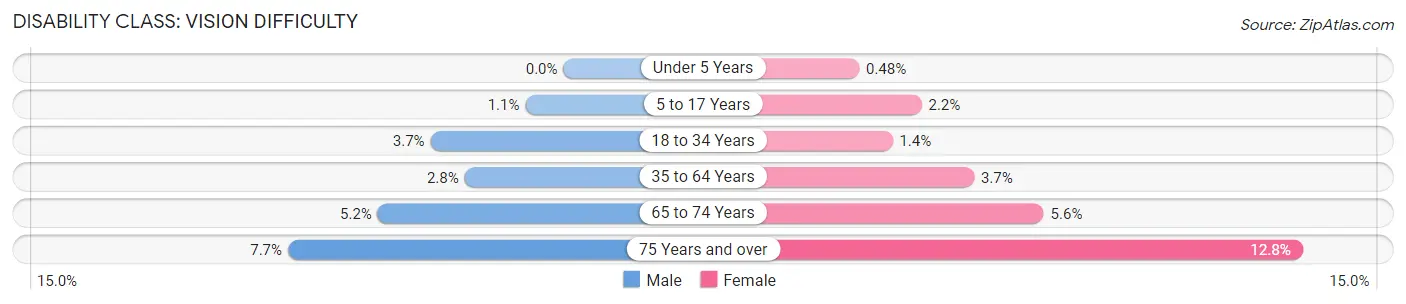
| Age Bracket | Male | Female |
| Under 5 Years | 0 (0.0%) | 9 (0.5%) |
| 5 to 17 Years | 64 (1.1%) | 133 (2.2%) |
| 18 to 34 Years | 289 (3.7%) | 107 (1.4%) |
| 35 to 64 Years | 441 (2.8%) | 591 (3.7%) |
| 65 to 74 Years | 247 (5.2%) | 287 (5.6%) |
| 75 Years and over | 208 (7.7%) | 483 (12.8%) |
Disability Class: Cognitive Difficulty
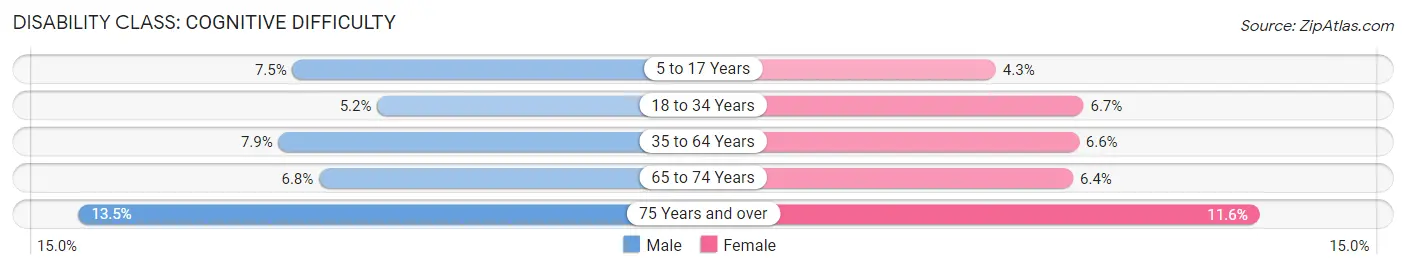
| Age Bracket | Male | Female |
| 5 to 17 Years | 456 (7.5%) | 257 (4.3%) |
| 18 to 34 Years | 405 (5.2%) | 509 (6.7%) |
| 35 to 64 Years | 1,271 (7.9%) | 1,059 (6.6%) |
| 65 to 74 Years | 325 (6.8%) | 329 (6.4%) |
| 75 Years and over | 366 (13.5%) | 438 (11.6%) |
Disability Class: Ambulatory Difficulty
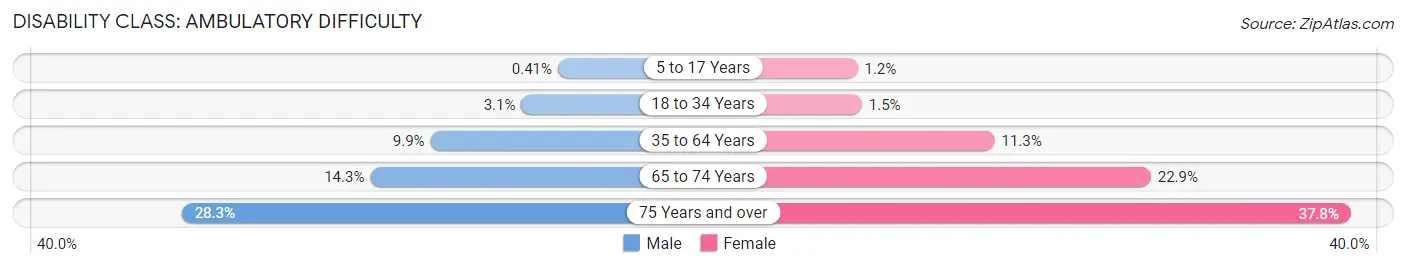
| Age Bracket | Male | Female |
| 5 to 17 Years | 25 (0.4%) | 70 (1.2%) |
| 18 to 34 Years | 244 (3.1%) | 113 (1.5%) |
| 35 to 64 Years | 1,583 (9.9%) | 1,819 (11.3%) |
| 65 to 74 Years | 685 (14.3%) | 1,172 (22.9%) |
| 75 Years and over | 768 (28.3%) | 1,423 (37.8%) |
Disability Class: Self-Care Difficulty
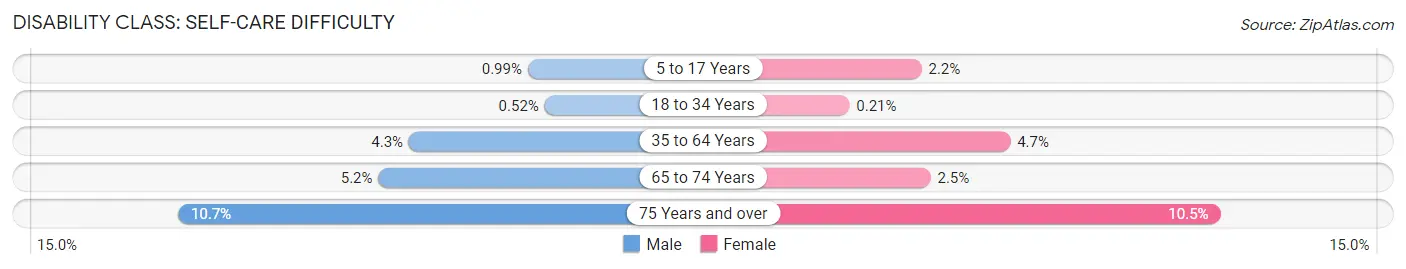
| Age Bracket | Male | Female |
| 5 to 17 Years | 60 (1.0%) | 133 (2.2%) |
| 18 to 34 Years | 41 (0.5%) | 16 (0.2%) |
| 35 to 64 Years | 689 (4.3%) | 753 (4.7%) |
| 65 to 74 Years | 246 (5.1%) | 126 (2.5%) |
| 75 Years and over | 291 (10.7%) | 397 (10.5%) |
Technology Access in Caldwell County
Computing Device Access in Caldwell County
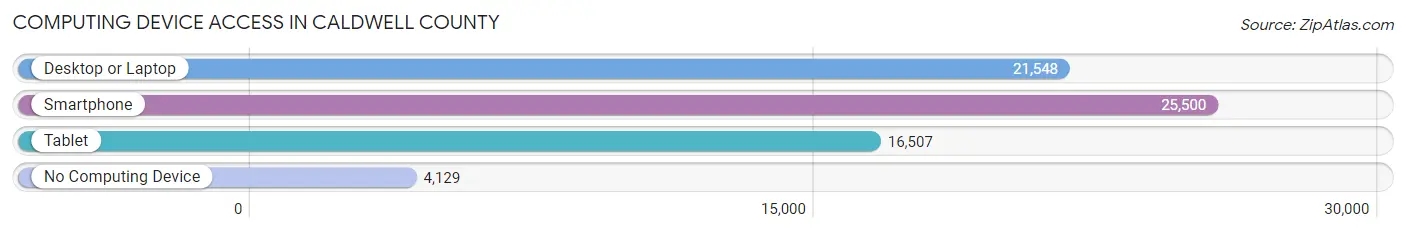
| Device Type | # Households | % Households |
| Desktop or Laptop | 21,548 | 67.1% |
| Smartphone | 25,500 | 79.4% |
| Tablet | 16,507 | 51.4% |
| No Computing Device | 4,129 | 12.9% |
| Total | 32,120 | 100.0% |
Internet Access in Caldwell County
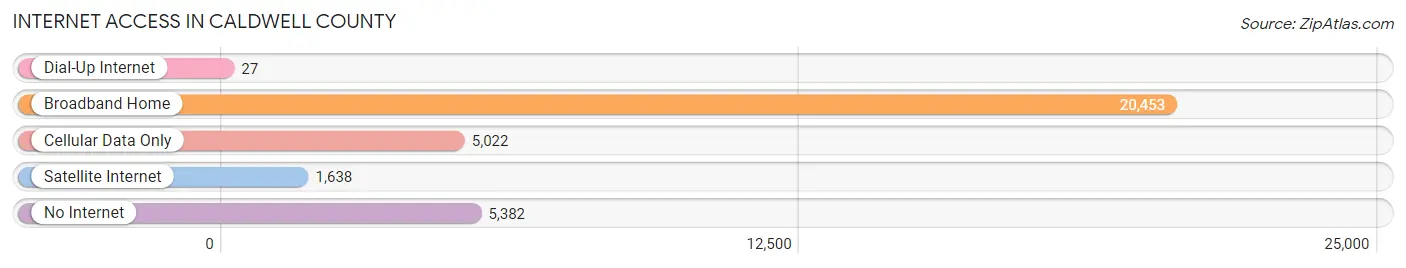
| Internet Type | # Households | % Households |
| Dial-Up Internet | 27 | 0.1% |
| Broadband Home | 20,453 | 63.7% |
| Cellular Data Only | 5,022 | 15.6% |
| Satellite Internet | 1,638 | 5.1% |
| No Internet | 5,382 | 16.8% |
| Total | 32,120 | 100.0% |
Caldwell County Summary
Caldwell County is located in the western part of North Carolina, in the foothills of the Appalachian Mountains. It is bordered by Alexander, Burke, Catawba, Watauga, and Wilkes counties. The county seat is Lenoir, and the largest city is Hudson. The county was formed in 1841 from parts of Burke and Wilkes counties and was named for Joseph Caldwell, the first president of the University of North Carolina.
Geography
Caldwell County covers an area of 437 square miles, with a population of 83,029 as of the 2020 census. The terrain is mostly hilly, with elevations ranging from 1,000 to 3,000 feet. The county is drained by the Catawba River and its tributaries, including the Yadkin River. The county is home to several state parks, including South Mountains State Park, which is located in the southern part of the county.
Climate
Caldwell County has a humid subtropical climate, with hot, humid summers and mild winters. The average annual temperature is around 60°F, with average highs in the summer reaching the mid-80s and lows in the winter reaching the mid-30s. The average annual precipitation is around 45 inches, with most of it falling in the summer months.
Demographics
As of the 2020 census, the population of Caldwell County was 83,029, with a population density of 189 people per square mile. The racial makeup of the county was 87.3% White, 8.2% Black or African American, 0.5% Native American, 0.7% Asian, 0.1% Pacific Islander, 1.7% from other races, and 1.5% from two or more races. Hispanic or Latino of any race were 4.2% of the population.
The median income for a household in the county was $41,945, and the median income for a family was $50,945. The per capita income for the county was $21,845. About 14.2% of families and 17.7% of the population were below the poverty line, including 24.2% of those under age 18 and 11.2% of those age 65 or over.
Economy
Caldwell County’s economy is largely based on manufacturing, with major employers including furniture and textile companies. The county is also home to several wineries and vineyards, as well as a growing tourism industry. Agriculture is also an important part of the local economy, with the county’s main crops being corn, soybeans, and tobacco.
The county is served by the Hickory Regional Airport, which offers daily flights to Charlotte and other cities in the region. The county is also served by several major highways, including Interstate 40, US Highway 321, and US Highway 64.
History
Caldwell County was formed in 1841 from parts of Burke and Wilkes counties. The county was named for Joseph Caldwell, the first president of the University of North Carolina. The county seat was originally located in Lenoir, but was moved to Hudson in 1842.
The county was largely rural until the late 19th century, when the railroad arrived and the furniture and textile industries began to develop. The county’s population grew rapidly during this period, and by the early 20th century, the county was one of the most prosperous in the state.
In the late 20th century, the county’s economy shifted away from manufacturing and towards tourism and agriculture. The county is now home to several wineries and vineyards, as well as a growing tourism industry.
Common Questions
What is the Total Population of Caldwell County?
Total Population of Caldwell County is 80,716.
What is the Total Male Population of Caldwell County?
Total Male Population of Caldwell County is 40,091.
What is the Total Female Population of Caldwell County?
Total Female Population of Caldwell County is 40,625.
What is the Ratio of Males per 100 Females in Caldwell County?
There are 98.69 Males per 100 Females in Caldwell County.
What is the Ratio of Females per 100 Males in Caldwell County?
There are 101.33 Females per 100 Males in Caldwell County.
What is the Median Population Age in Caldwell County?
Median Population Age in Caldwell County is 45.1 Years.
What is the Average Family Size in Caldwell County
Average Family Size in Caldwell County is 3.0 People.
What is the Average Household Size in Caldwell County
Average Household Size in Caldwell County is 2.5 People.
What is Per Capita Income in Caldwell County?
Per Capita income in Caldwell County is $29,125.
What is the Median Family Income in Caldwell County?
Median Family Income in Caldwell County is $67,132.
What is the Median Household income in Caldwell County?
Median Household Income in Caldwell County is $52,362.
What is Income or Wage Gap in Caldwell County?
Income or Wage Gap in Caldwell County is 26.6%.
Women in Caldwell County earn 73.4 cents for every dollar earned by a man.
What is Family Income Deficit in Caldwell County?
Family Income Deficit in Caldwell County is $9,600.
Families that are below poverty line in Caldwell County earn $9,600 less on average than the poverty threshold level.
What is Inequality or Gini Index in Caldwell County?
Inequality or Gini Index in Caldwell County is 0.44.
How Large is the Labor Force in Caldwell County?
There are 38,729 People in the Labor Forcein in Caldwell County.
What is the Percentage of People in the Labor Force in Caldwell County?
58.1% of People are in the Labor Force in Caldwell County.
What is the Unemployment Rate in Caldwell County?
Unemployment Rate in Caldwell County is 5.8%.