Cabarrus County, NC
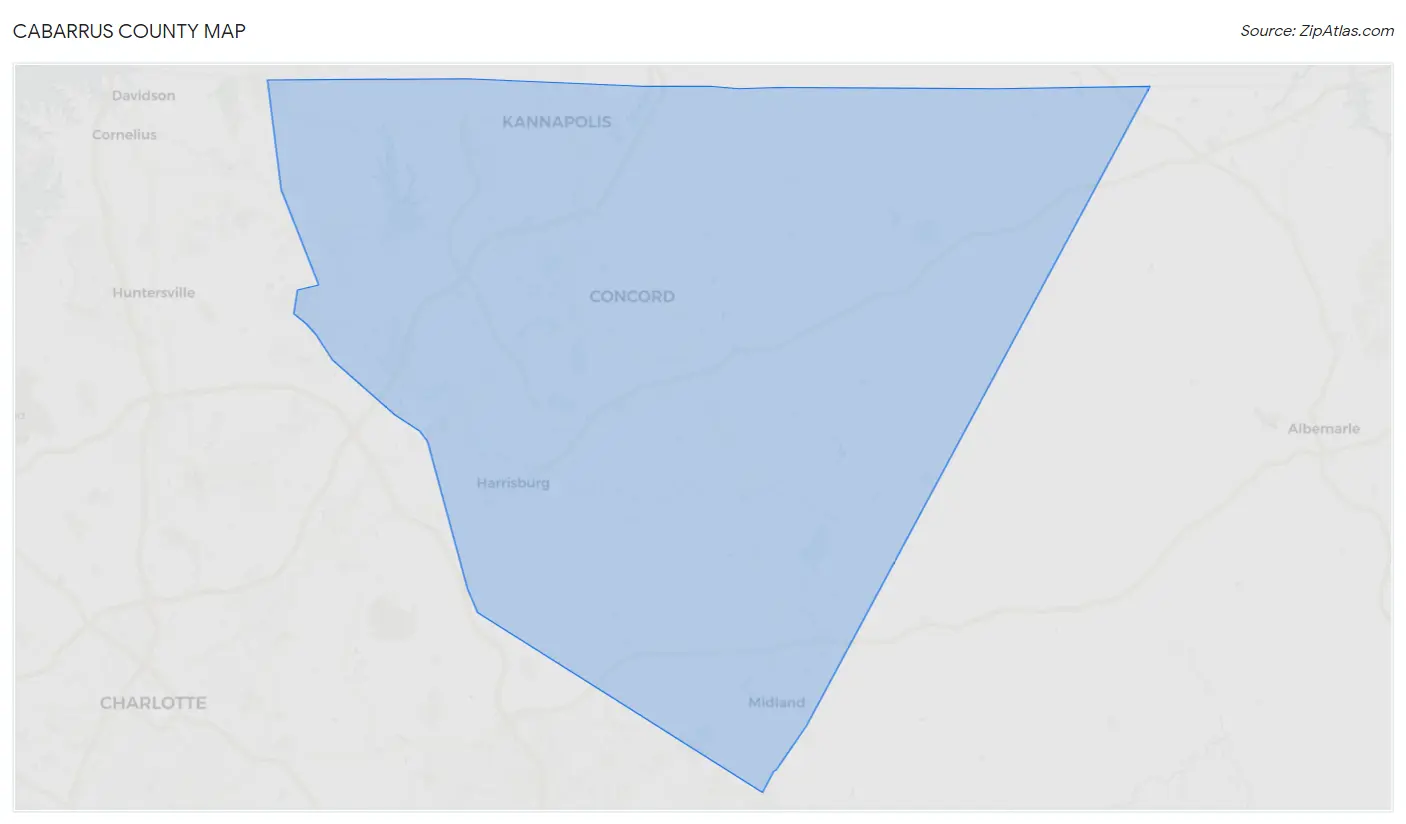
Cabarrus County Map
Cabarrus County Overview
226,396
TOTAL POPULATION
111,333
MALE POPULATION
115,063
FEMALE POPULATION
96.76
MALES / 100 FEMALES
103.35
FEMALES / 100 MALES
37.6
MEDIAN AGE
3.5
AVG FAMILY SIZE
2.9
AVG HOUSEHOLD SIZE
$38,690
PER CAPITA INCOME
$99,008
AVG FAMILY INCOME
$83,828
AVG HOUSEHOLD INCOME
24.9%
WAGE / INCOME GAP [ % ]
75.1¢/ $1
WAGE / INCOME GAP [ $ ]
$9,753
FAMILY INCOME DEFICIT
0.43
INEQUALITY / GINI INDEX
119,661
LABOR FORCE [ PEOPLE ]
67.8%
PERCENT IN LABOR FORCE
4.9%
UNEMPLOYMENT RATE
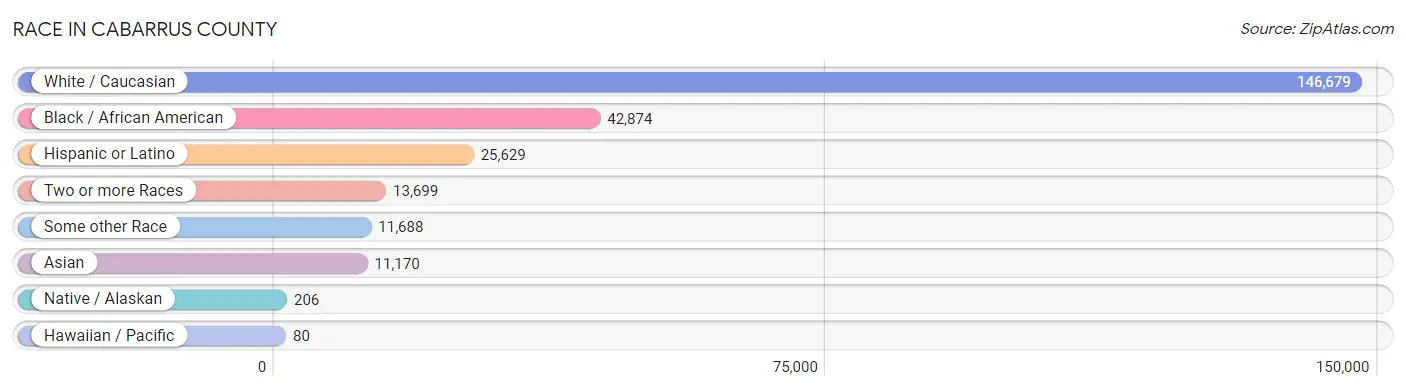
Race in Cabarrus County
The most populous races in Cabarrus County are White / Caucasian (146,679 | 64.8%), Black / African American (42,874 | 18.9%), and Hispanic or Latino (25,629 | 11.3%).
| Race | # Population | % Population |
| Asian | 11,170 | 4.9% |
| Black / African American | 42,874 | 18.9% |
| Hawaiian / Pacific | 80 | 0.0% |
| Hispanic or Latino | 25,629 | 11.3% |
| Native / Alaskan | 206 | 0.1% |
| White / Caucasian | 146,679 | 64.8% |
| Two or more Races | 13,699 | 6.0% |
| Some other Race | 11,688 | 5.2% |
| Total | 226,396 | 100.0% |
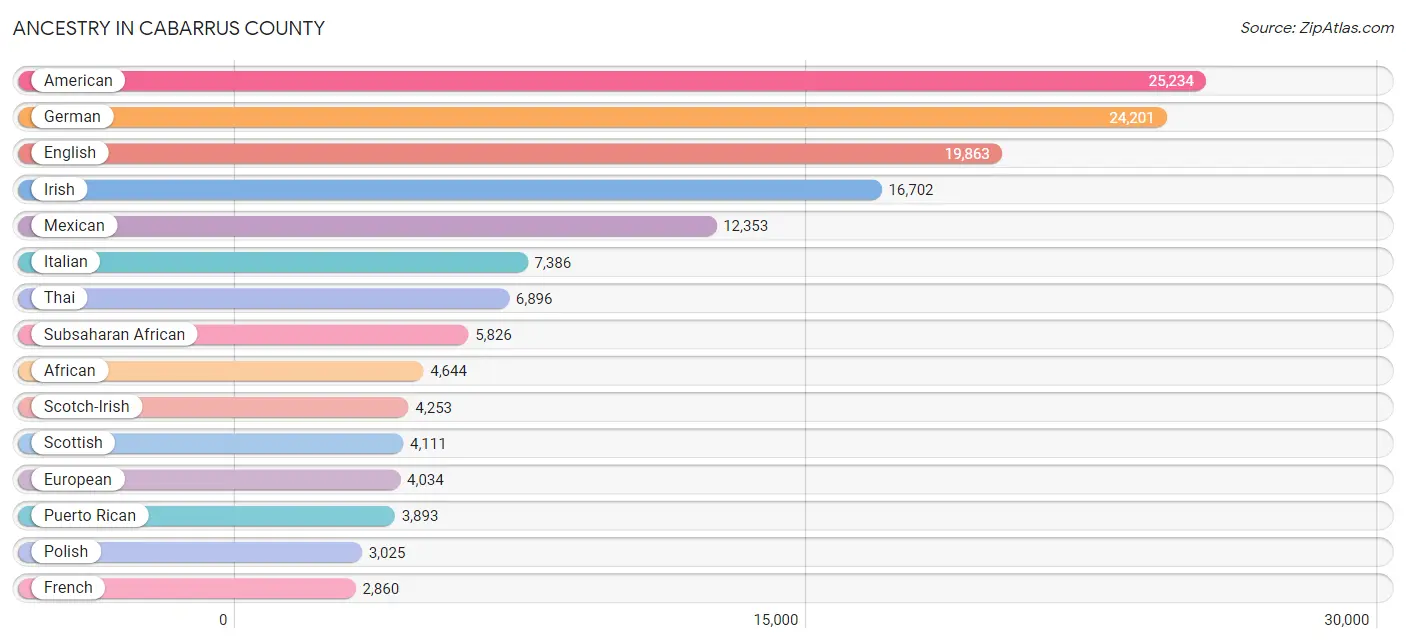
Ancestry in Cabarrus County
The most populous ancestries reported in Cabarrus County are American (25,234 | 11.2%), German (24,201 | 10.7%), English (19,863 | 8.8%), Irish (16,702 | 7.4%), and Mexican (12,353 | 5.5%), together accounting for 43.4% of all Cabarrus County residents.
| Ancestry | # Population | % Population |
| African | 4,644 | 2.1% |
| Alaska Native | 8 | 0.0% |
| American | 25,234 | 11.2% |
| Arab | 652 | 0.3% |
| Argentinean | 105 | 0.1% |
| Australian | 16 | 0.0% |
| Austrian | 137 | 0.1% |
| Bahamian | 18 | 0.0% |
| Bangladeshi | 303 | 0.1% |
| Barbadian | 11 | 0.0% |
| Basque | 7 | 0.0% |
| Belgian | 36 | 0.0% |
| Bhutanese | 242 | 0.1% |
| Blackfeet | 37 | 0.0% |
| Bolivian | 142 | 0.1% |
| Brazilian | 77 | 0.0% |
| British | 1,383 | 0.6% |
| British West Indian | 6 | 0.0% |
| Bulgarian | 53 | 0.0% |
| Burmese | 449 | 0.2% |
| Cajun | 17 | 0.0% |
| Canadian | 164 | 0.1% |
| Celtic | 71 | 0.0% |
| Central American | 2,610 | 1.1% |
| Central American Indian | 111 | 0.1% |
| Cherokee | 774 | 0.3% |
| Chilean | 109 | 0.1% |
| Choctaw | 26 | 0.0% |
| Colombian | 591 | 0.3% |
| Costa Rican | 202 | 0.1% |
| Croatian | 20 | 0.0% |
| Cuban | 944 | 0.4% |
| Czech | 332 | 0.2% |
| Czechoslovakian | 96 | 0.0% |
| Danish | 341 | 0.2% |
| Delaware | 22 | 0.0% |
| Dominican | 1,212 | 0.5% |
| Dutch | 1,111 | 0.5% |
| Eastern European | 279 | 0.1% |
| Ecuadorian | 255 | 0.1% |
| Egyptian | 208 | 0.1% |
| English | 19,863 | 8.8% |
| Estonian | 9 | 0.0% |
| Ethiopian | 284 | 0.1% |
| European | 4,034 | 1.8% |
| Finnish | 172 | 0.1% |
| French | 2,860 | 1.3% |
| French American Indian | 285 | 0.1% |
| French Canadian | 750 | 0.3% |
| German | 24,201 | 10.7% |
| Ghanaian | 70 | 0.0% |
| Greek | 580 | 0.3% |
| Guamanian / Chamorro | 48 | 0.0% |
| Guatemalan | 676 | 0.3% |
| Haitian | 798 | 0.4% |
| Honduran | 488 | 0.2% |
| Hungarian | 413 | 0.2% |
| Indian (Asian) | 1,343 | 0.6% |
| Iranian | 77 | 0.0% |
| Irish | 16,702 | 7.4% |
| Israeli | 14 | 0.0% |
| Italian | 7,386 | 3.3% |
| Jamaican | 905 | 0.4% |
| Japanese | 147 | 0.1% |
| Kenyan | 61 | 0.0% |
| Korean | 1,729 | 0.8% |
| Latvian | 11 | 0.0% |
| Lebanese | 203 | 0.1% |
| Liberian | 83 | 0.0% |
| Lithuanian | 219 | 0.1% |
| Lumbee | 20 | 0.0% |
| Macedonian | 12 | 0.0% |
| Malaysian | 103 | 0.1% |
| Marshallese | 26 | 0.0% |
| Mexican | 12,353 | 5.5% |
| Mexican American Indian | 17 | 0.0% |
| Native Hawaiian | 91 | 0.0% |
| New Zealander | 45 | 0.0% |
| Nicaraguan | 270 | 0.1% |
| Nigerian | 325 | 0.1% |
| Northern European | 181 | 0.1% |
| Norwegian | 671 | 0.3% |
| Osage | 17 | 0.0% |
| Ottawa | 12 | 0.0% |
| Pakistani | 88 | 0.0% |
| Panamanian | 107 | 0.1% |
| Paraguayan | 9 | 0.0% |
| Pennsylvania German | 57 | 0.0% |
| Peruvian | 481 | 0.2% |
| Polish | 3,025 | 1.3% |
| Portuguese | 177 | 0.1% |
| Puerto Rican | 3,893 | 1.7% |
| Romanian | 123 | 0.1% |
| Russian | 506 | 0.2% |
| Salvadoran | 867 | 0.4% |
| Samoan | 63 | 0.0% |
| Scandinavian | 439 | 0.2% |
| Scotch-Irish | 4,253 | 1.9% |
| Scottish | 4,111 | 1.8% |
| Seminole | 10 | 0.0% |
| Serbian | 24 | 0.0% |
| Sioux | 80 | 0.0% |
| Slavic | 41 | 0.0% |
| Slovak | 341 | 0.2% |
| Slovene | 438 | 0.2% |
| South African | 238 | 0.1% |
| South American | 2,155 | 0.9% |
| South American Indian | 23 | 0.0% |
| Spaniard | 756 | 0.3% |
| Spanish | 696 | 0.3% |
| Sri Lankan | 557 | 0.3% |
| Subsaharan African | 5,826 | 2.6% |
| Swedish | 1,281 | 0.6% |
| Swiss | 304 | 0.1% |
| Syrian | 182 | 0.1% |
| Thai | 6,896 | 3.0% |
| Trinidadian and Tobagonian | 115 | 0.1% |
| Ugandan | 100 | 0.0% |
| Ukrainian | 549 | 0.2% |
| Venezuelan | 463 | 0.2% |
| Welsh | 1,155 | 0.5% |
| West Indian | 109 | 0.1% |
| Yugoslavian | 22 | 0.0% |
| Yup'ik | 25 | 0.0% | View All 124 Rows |
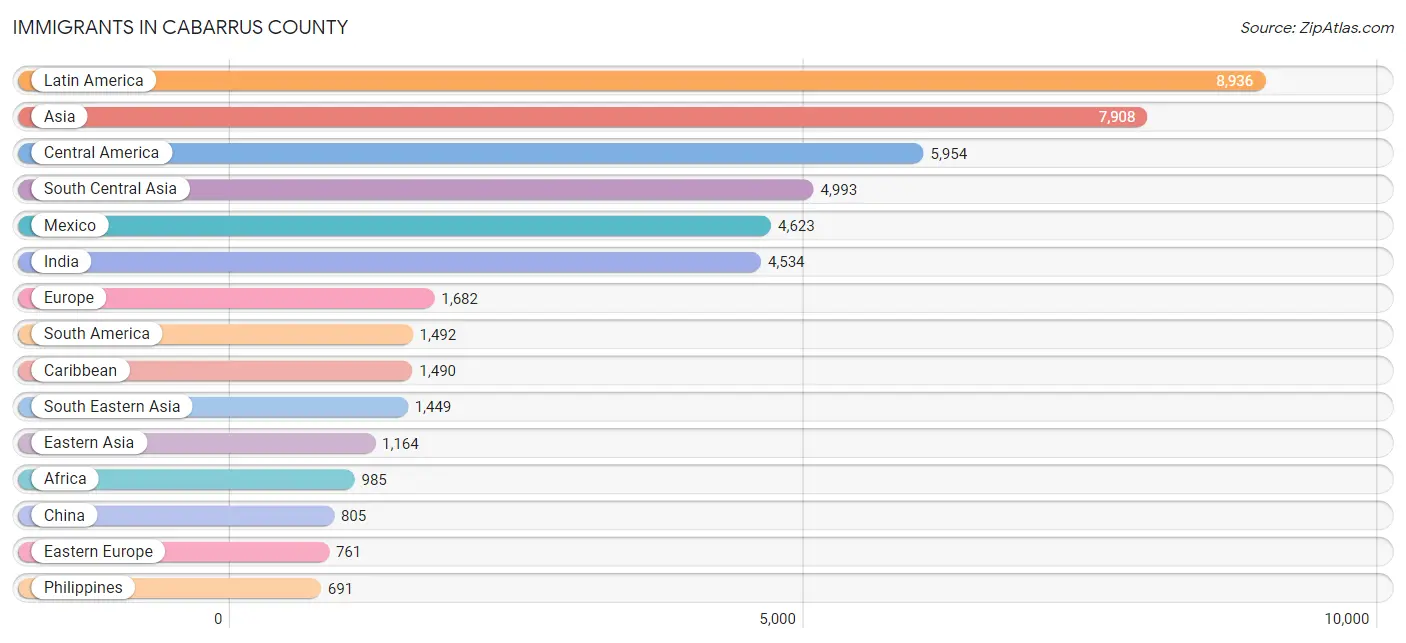
Immigrants in Cabarrus County
The most numerous immigrant groups reported in Cabarrus County came from Latin America (8,936 | 4.0%), Asia (7,908 | 3.5%), Central America (5,954 | 2.6%), South Central Asia (4,993 | 2.2%), and Mexico (4,623 | 2.0%), together accounting for 14.3% of all Cabarrus County residents.
| Immigration Origin | # Population | % Population |
| Africa | 985 | 0.4% |
| Argentina | 107 | 0.1% |
| Asia | 7,908 | 3.5% |
| Australia | 60 | 0.0% |
| Bahamas | 18 | 0.0% |
| Barbados | 16 | 0.0% |
| Belgium | 14 | 0.0% |
| Bolivia | 142 | 0.1% |
| Brazil | 92 | 0.0% |
| Bulgaria | 28 | 0.0% |
| Cambodia | 85 | 0.0% |
| Cameroon | 79 | 0.0% |
| Canada | 229 | 0.1% |
| Caribbean | 1,490 | 0.7% |
| Central America | 5,954 | 2.6% |
| Chile | 19 | 0.0% |
| China | 805 | 0.4% |
| Colombia | 437 | 0.2% |
| Costa Rica | 60 | 0.0% |
| Cuba | 373 | 0.2% |
| Czechoslovakia | 36 | 0.0% |
| Denmark | 1 | 0.0% |
| Dominican Republic | 334 | 0.2% |
| Eastern Africa | 278 | 0.1% |
| Eastern Asia | 1,164 | 0.5% |
| Eastern Europe | 761 | 0.3% |
| Ecuador | 307 | 0.1% |
| Egypt | 56 | 0.0% |
| El Salvador | 271 | 0.1% |
| England | 120 | 0.1% |
| Ethiopia | 103 | 0.1% |
| Europe | 1,682 | 0.7% |
| France | 54 | 0.0% |
| Germany | 230 | 0.1% |
| Ghana | 72 | 0.0% |
| Guatemala | 596 | 0.3% |
| Haiti | 245 | 0.1% |
| Honduras | 209 | 0.1% |
| Hong Kong | 77 | 0.0% |
| Hungary | 20 | 0.0% |
| India | 4,534 | 2.0% |
| Indonesia | 158 | 0.1% |
| Iran | 34 | 0.0% |
| Ireland | 23 | 0.0% |
| Italy | 81 | 0.0% |
| Jamaica | 389 | 0.2% |
| Japan | 12 | 0.0% |
| Jordan | 8 | 0.0% |
| Kenya | 62 | 0.0% |
| Korea | 347 | 0.2% |
| Kuwait | 29 | 0.0% |
| Laos | 82 | 0.0% |
| Latin America | 8,936 | 4.0% |
| Lebanon | 119 | 0.1% |
| Liberia | 195 | 0.1% |
| Malaysia | 12 | 0.0% |
| Mexico | 4,623 | 2.0% |
| Micronesia | 26 | 0.0% |
| Middle Africa | 79 | 0.0% |
| Nepal | 299 | 0.1% |
| Nicaragua | 150 | 0.1% |
| Nigeria | 98 | 0.0% |
| Northern Africa | 56 | 0.0% |
| Northern Europe | 484 | 0.2% |
| Norway | 12 | 0.0% |
| Oceania | 133 | 0.1% |
| Pakistan | 76 | 0.0% |
| Panama | 45 | 0.0% |
| Peru | 185 | 0.1% |
| Philippines | 691 | 0.3% |
| Poland | 41 | 0.0% |
| Romania | 142 | 0.1% |
| Russia | 104 | 0.1% |
| Scotland | 68 | 0.0% |
| Serbia | 20 | 0.0% |
| South Africa | 180 | 0.1% |
| South America | 1,492 | 0.7% |
| South Central Asia | 4,993 | 2.2% |
| South Eastern Asia | 1,449 | 0.6% |
| Southern Europe | 130 | 0.1% |
| Spain | 49 | 0.0% |
| Sweden | 28 | 0.0% |
| Switzerland | 9 | 0.0% |
| Syria | 57 | 0.0% |
| Taiwan | 19 | 0.0% |
| Thailand | 51 | 0.0% |
| Trinidad and Tobago | 77 | 0.0% |
| Uganda | 100 | 0.0% |
| Ukraine | 336 | 0.2% |
| Venezuela | 181 | 0.1% |
| Vietnam | 370 | 0.2% |
| Western Africa | 365 | 0.2% |
| Western Asia | 240 | 0.1% |
| Western Europe | 307 | 0.1% | View All 94 Rows |
Sex and Age in Cabarrus County
Sex and Age in Cabarrus County
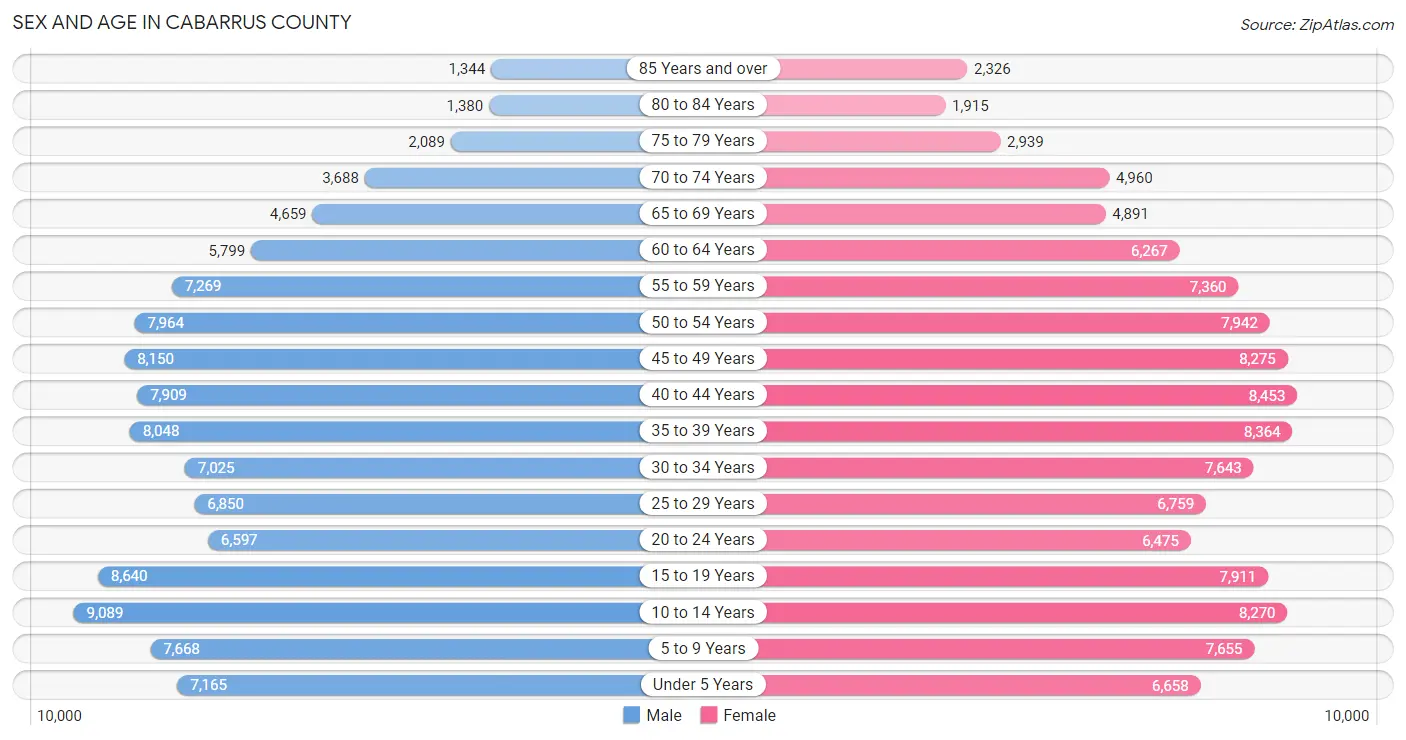
The most populous age groups in Cabarrus County are 10 to 14 Years (9,089 | 8.2%) for men and 40 to 44 Years (8,453 | 7.3%) for women.
| Age Bracket | Male | Female |
| Under 5 Years | 7,165 (6.4%) | 6,658 (5.8%) |
| 5 to 9 Years | 7,668 (6.9%) | 7,655 (6.7%) |
| 10 to 14 Years | 9,089 (8.2%) | 8,270 (7.2%) |
| 15 to 19 Years | 8,640 (7.8%) | 7,911 (6.9%) |
| 20 to 24 Years | 6,597 (5.9%) | 6,475 (5.6%) |
| 25 to 29 Years | 6,850 (6.1%) | 6,759 (5.9%) |
| 30 to 34 Years | 7,025 (6.3%) | 7,643 (6.6%) |
| 35 to 39 Years | 8,048 (7.2%) | 8,364 (7.3%) |
| 40 to 44 Years | 7,909 (7.1%) | 8,453 (7.3%) |
| 45 to 49 Years | 8,150 (7.3%) | 8,275 (7.2%) |
| 50 to 54 Years | 7,964 (7.1%) | 7,942 (6.9%) |
| 55 to 59 Years | 7,269 (6.5%) | 7,360 (6.4%) |
| 60 to 64 Years | 5,799 (5.2%) | 6,267 (5.4%) |
| 65 to 69 Years | 4,659 (4.2%) | 4,891 (4.3%) |
| 70 to 74 Years | 3,688 (3.3%) | 4,960 (4.3%) |
| 75 to 79 Years | 2,089 (1.9%) | 2,939 (2.5%) |
| 80 to 84 Years | 1,380 (1.2%) | 1,915 (1.7%) |
| 85 Years and over | 1,344 (1.2%) | 2,326 (2.0%) |
| Total | 111,333 (100.0%) | 115,063 (100.0%) |
Families and Households in Cabarrus County
Median Family Size in Cabarrus County
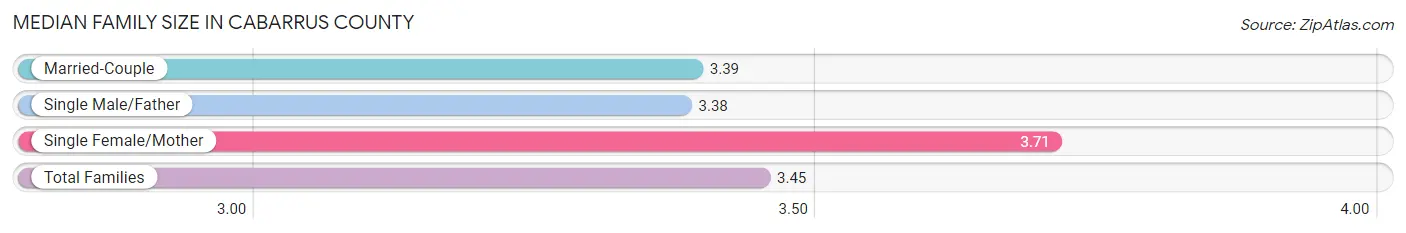
The median family size in Cabarrus County is 3.45 persons per family, with single female/mother families (10,103 | 17.9%) accounting for the largest median family size of 3.71 persons per family. On the other hand, single male/father families (2,758 | 4.9%) represent the smallest median family size with 3.38 persons per family.
| Family Type | # Families | Family Size |
| Married-Couple | 43,506 (77.2%) | 3.39 |
| Single Male/Father | 2,758 (4.9%) | 3.38 |
| Single Female/Mother | 10,103 (17.9%) | 3.71 |
| Total Families | 56,367 (100.0%) | 3.45 |
Median Household Size in Cabarrus County
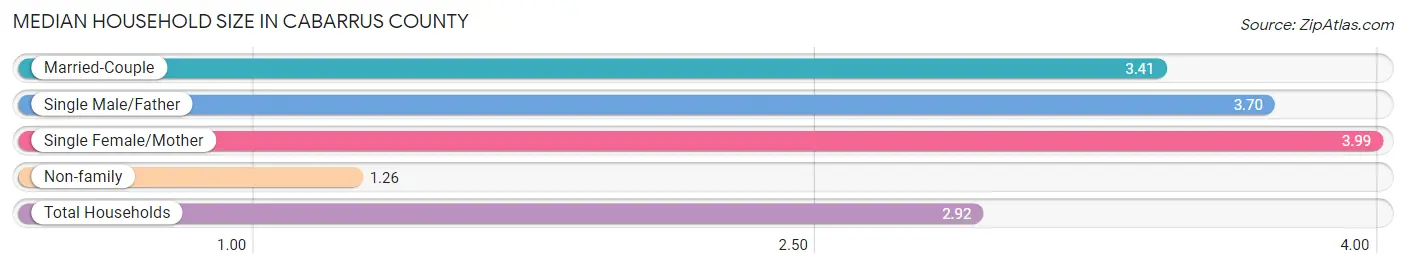
The median household size in Cabarrus County is 2.92 persons per household, with single female/mother households (10,103 | 13.1%) accounting for the largest median household size of 3.99 persons per household. non-family households (20,513 | 26.7%) represent the smallest median household size with 1.26 persons per household.
| Household Type | # Households | Household Size |
| Married-Couple | 43,506 (56.6%) | 3.41 |
| Single Male/Father | 2,758 (3.6%) | 3.70 |
| Single Female/Mother | 10,103 (13.1%) | 3.99 |
| Non-family | 20,513 (26.7%) | 1.26 |
| Total Households | 76,880 (100.0%) | 2.92 |
Household Size by Marriage Status in Cabarrus County
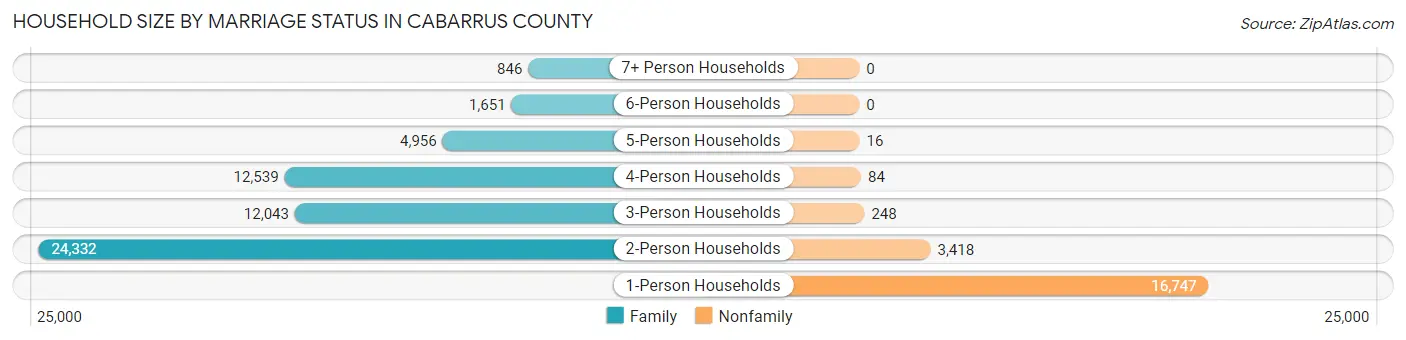
Out of a total of 76,880 households in Cabarrus County, 56,367 (73.3%) are family households, while 20,513 (26.7%) are nonfamily households. The most numerous type of family households are 2-person households, comprising 24,332, and the most common type of nonfamily households are 1-person households, comprising 16,747.
| Household Size | Family Households | Nonfamily Households |
| 1-Person Households | - | 16,747 (21.8%) |
| 2-Person Households | 24,332 (31.7%) | 3,418 (4.4%) |
| 3-Person Households | 12,043 (15.7%) | 248 (0.3%) |
| 4-Person Households | 12,539 (16.3%) | 84 (0.1%) |
| 5-Person Households | 4,956 (6.5%) | 16 (0.0%) |
| 6-Person Households | 1,651 (2.1%) | 0 (0.0%) |
| 7+ Person Households | 846 (1.1%) | 0 (0.0%) |
| Total | 56,367 (73.3%) | 20,513 (26.7%) |
Female Fertility in Cabarrus County
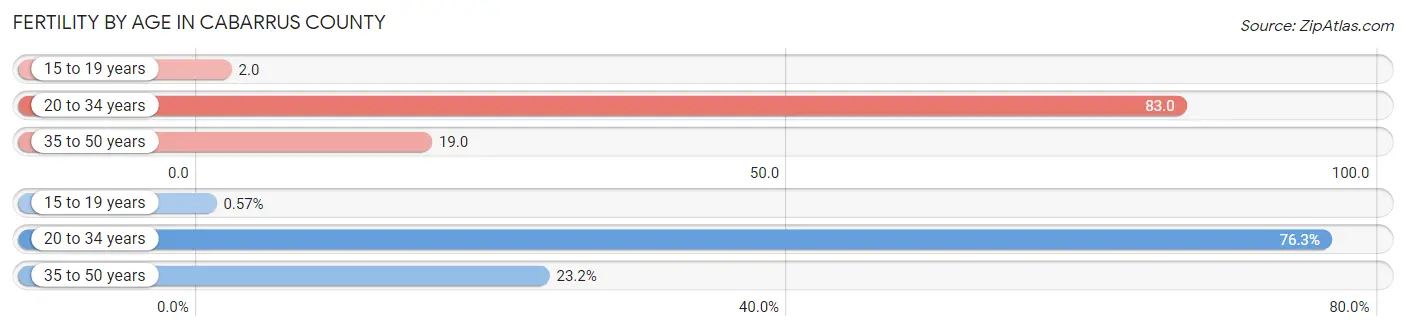
Fertility by Age in Cabarrus County
Average fertility rate in Cabarrus County is 40.0 births per 1,000 women. Women in the age bracket of 20 to 34 years have the highest fertility rate with 83.0 births per 1,000 women. Women in the age bracket of 20 to 34 years acount for 76.2% of all women with births.
| Age Bracket | Women with Births | Births / 1,000 Women |
| 15 to 19 years | 13 (0.6%) | 2.0 |
| 20 to 34 years | 1,724 (76.2%) | 83.0 |
| 35 to 50 years | 524 (23.2%) | 19.0 |
| Total | 2,261 (100.0%) | 40.0 |
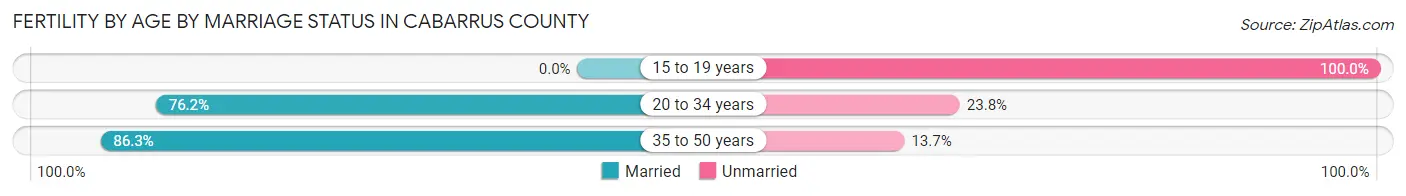
Fertility by Age by Marriage Status in Cabarrus County
78.1% of women with births (2,261) in Cabarrus County are married. The highest percentage of unmarried women with births falls into 15 to 19 years age bracket with 100.0% of them unmarried at the time of birth, while the lowest percentage of unmarried women with births belong to 35 to 50 years age bracket with 13.7% of them unmarried.
| Age Bracket | Married | Unmarried |
| 15 to 19 years | 0 (0.0%) | 13 (100.0%) |
| 20 to 34 years | 1,314 (76.2%) | 410 (23.8%) |
| 35 to 50 years | 452 (86.3%) | 72 (13.7%) |
| Total | 1,766 (78.1%) | 495 (21.9%) |
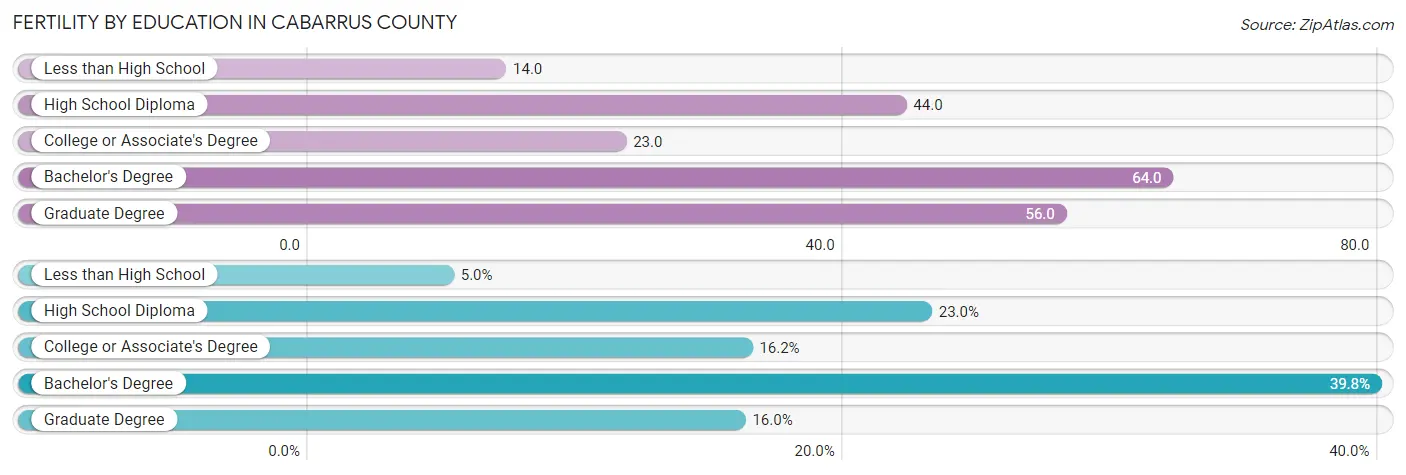
Fertility by Education in Cabarrus County
Average fertility rate in Cabarrus County is 40.0 births per 1,000 women. Women with the education attainment of bachelor's degree have the highest fertility rate of 64.0 births per 1,000 women, while women with the education attainment of less than high school have the lowest fertility at 14.0 births per 1,000 women. Women with the education attainment of bachelor's degree represent 39.8% of all women with births.
| Educational Attainment | Women with Births | Births / 1,000 Women |
| Less than High School | 114 (5.0%) | 14.0 |
| High School Diploma | 519 (23.0%) | 44.0 |
| College or Associate's Degree | 367 (16.2%) | 23.0 |
| Bachelor's Degree | 900 (39.8%) | 64.0 |
| Graduate Degree | 361 (16.0%) | 56.0 |
| Total | 2,261 (100.0%) | 40.0 |
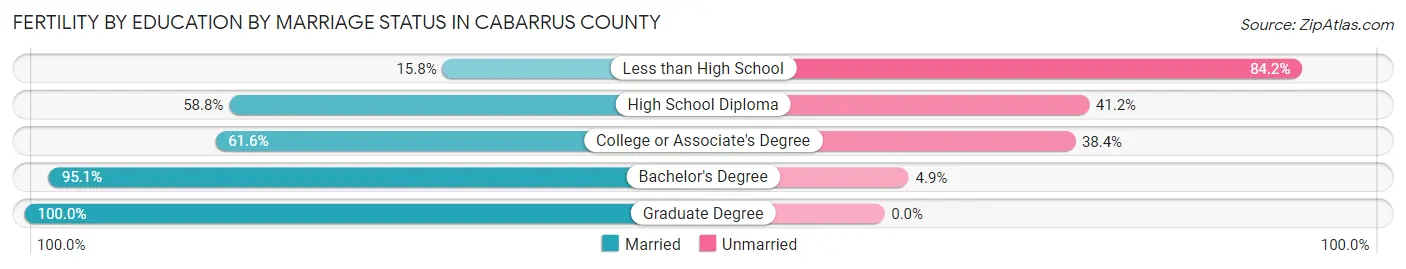
Fertility by Education by Marriage Status in Cabarrus County
21.9% of women with births in Cabarrus County are unmarried. Women with the educational attainment of graduate degree are most likely to be married with 100.0% of them married at childbirth, while women with the educational attainment of less than high school are least likely to be married with 84.2% of them unmarried at childbirth.
| Educational Attainment | Married | Unmarried |
| Less than High School | 18 (15.8%) | 96 (84.2%) |
| High School Diploma | 305 (58.8%) | 214 (41.2%) |
| College or Associate's Degree | 226 (61.6%) | 141 (38.4%) |
| Bachelor's Degree | 856 (95.1%) | 44 (4.9%) |
| Graduate Degree | 361 (100.0%) | 0 (0.0%) |
| Total | 1,766 (78.1%) | 495 (21.9%) |
Income in Cabarrus County
Income Overview in Cabarrus County
Per Capita Income in Cabarrus County is $38,690, while median incomes of families and households are $99,008 and $83,828 respectively.
| Characteristic | Number | Measure |
| Per Capita Income | 226,396 | $38,690 |
| Median Family Income | 56,367 | $99,008 |
| Mean Family Income | 56,367 | $123,587 |
| Median Household Income | 76,880 | $83,828 |
| Mean Household Income | 76,880 | $107,449 |
| Income Deficit | 56,367 | $9,753 |
| Wage / Income Gap (%) | 226,396 | 24.93% |
| Wage / Income Gap ($) | 226,396 | 75.07¢ per $1 |
| Gini / Inequality Index | 226,396 | 0.43 |
Earnings by Sex in Cabarrus County
Average Earnings in Cabarrus County are $43,006, $49,168 for men and $36,912 for women, a difference of 24.9%.
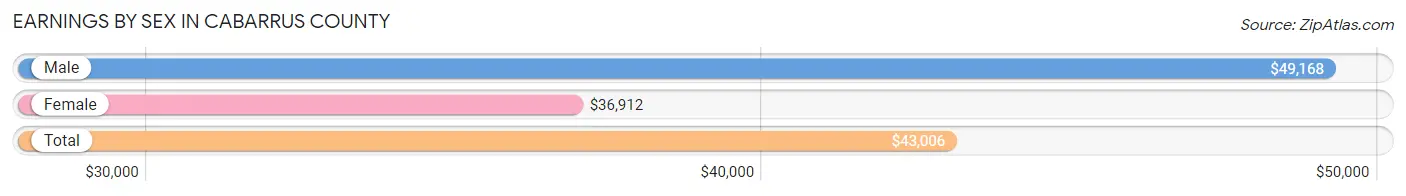
| Sex | Number | Average Earnings |
| Male | 64,196 (52.4%) | $49,168 |
| Female | 58,355 (47.6%) | $36,912 |
| Total | 122,551 (100.0%) | $43,006 |
Earnings by Sex by Income Bracket in Cabarrus County
The most common earnings brackets in Cabarrus County are $100,000+ for men (13,507 | 21.0%) and $100,000+ for women (5,216 | 8.9%).
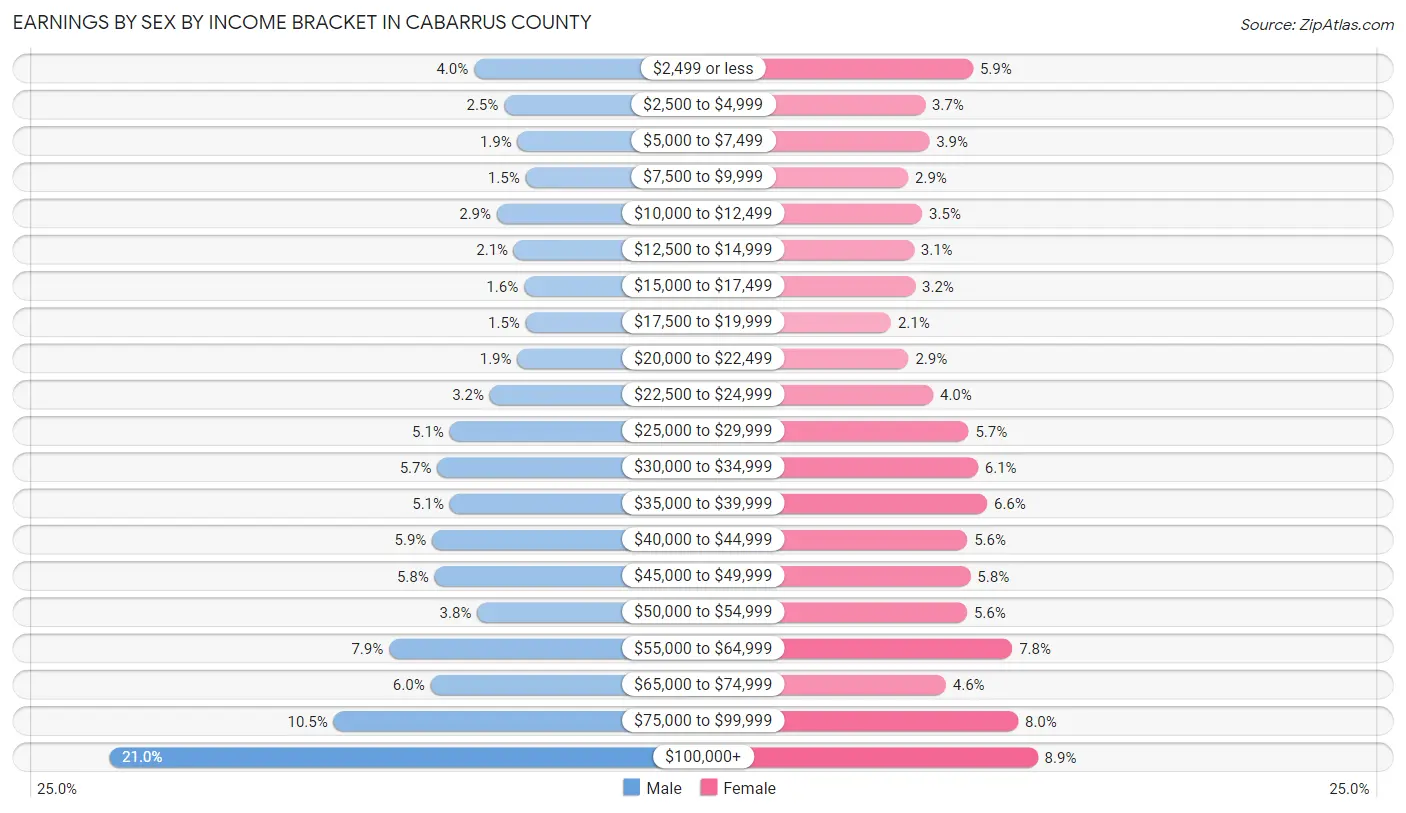
| Income | Male | Female |
| $2,499 or less | 2,533 (4.0%) | 3,450 (5.9%) |
| $2,500 to $4,999 | 1,630 (2.5%) | 2,136 (3.7%) |
| $5,000 to $7,499 | 1,223 (1.9%) | 2,253 (3.9%) |
| $7,500 to $9,999 | 988 (1.5%) | 1,675 (2.9%) |
| $10,000 to $12,499 | 1,849 (2.9%) | 2,059 (3.5%) |
| $12,500 to $14,999 | 1,336 (2.1%) | 1,834 (3.1%) |
| $15,000 to $17,499 | 1,033 (1.6%) | 1,866 (3.2%) |
| $17,500 to $19,999 | 983 (1.5%) | 1,209 (2.1%) |
| $20,000 to $22,499 | 1,233 (1.9%) | 1,689 (2.9%) |
| $22,500 to $24,999 | 2,061 (3.2%) | 2,356 (4.0%) |
| $25,000 to $29,999 | 3,270 (5.1%) | 3,326 (5.7%) |
| $30,000 to $34,999 | 3,638 (5.7%) | 3,582 (6.1%) |
| $35,000 to $39,999 | 3,258 (5.1%) | 3,836 (6.6%) |
| $40,000 to $44,999 | 3,793 (5.9%) | 3,291 (5.6%) |
| $45,000 to $49,999 | 3,725 (5.8%) | 3,381 (5.8%) |
| $50,000 to $54,999 | 2,438 (3.8%) | 3,288 (5.6%) |
| $55,000 to $64,999 | 5,089 (7.9%) | 4,524 (7.7%) |
| $65,000 to $74,999 | 3,846 (6.0%) | 2,705 (4.6%) |
| $75,000 to $99,999 | 6,763 (10.5%) | 4,679 (8.0%) |
| $100,000+ | 13,507 (21.0%) | 5,216 (8.9%) |
| Total | 64,196 (100.0%) | 58,355 (100.0%) |
Earnings by Sex by Educational Attainment in Cabarrus County
Average earnings in Cabarrus County are $56,986 for men and $41,970 for women, a difference of 26.4%. Men with an educational attainment of graduate degree enjoy the highest average annual earnings of $123,338, while those with less than high school education earn the least with $39,411. Women with an educational attainment of graduate degree earn the most with the average annual earnings of $63,202, while those with less than high school education have the smallest earnings of $26,898.
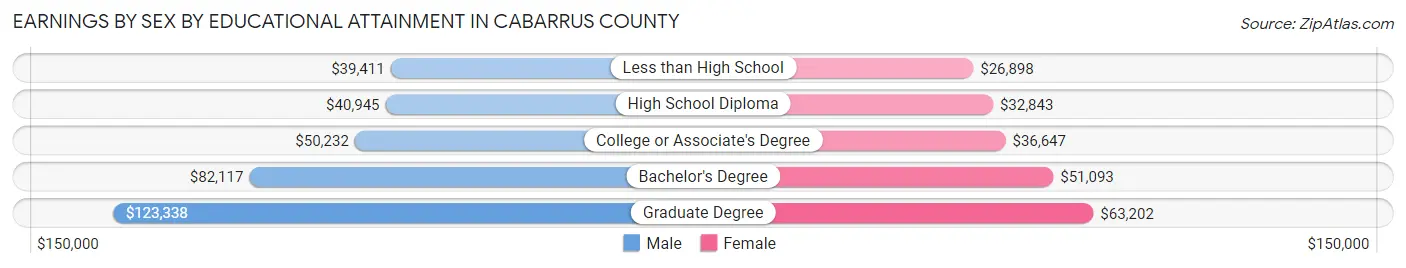
| Educational Attainment | Male Income | Female Income |
| Less than High School | $39,411 | $26,898 |
| High School Diploma | $40,945 | $32,843 |
| College or Associate's Degree | $50,232 | $36,647 |
| Bachelor's Degree | $82,117 | $51,093 |
| Graduate Degree | $123,338 | $63,202 |
| Total | $56,986 | $41,970 |
Family Income in Cabarrus County
Family Income Brackets in Cabarrus County
According to the Cabarrus County family income data, there are 12,626 families falling into the $100,000 to $149,999 income range, which is the most common income bracket and makes up 22.4% of all families. Conversely, the less than $10,000 income bracket is the least frequent group with only 958 families (1.7%) belonging to this category.
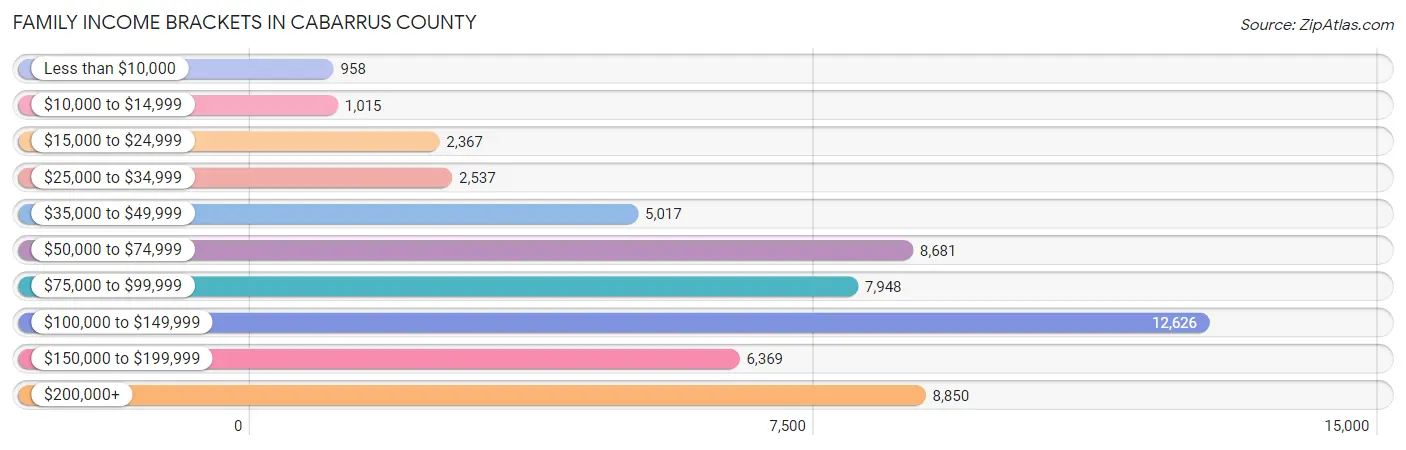
| Income Bracket | # Families | % Families |
| Less than $10,000 | 958 | 1.7% |
| $10,000 to $14,999 | 1,015 | 1.8% |
| $15,000 to $24,999 | 2,367 | 4.2% |
| $25,000 to $34,999 | 2,537 | 4.5% |
| $35,000 to $49,999 | 5,017 | 8.9% |
| $50,000 to $74,999 | 8,681 | 15.4% |
| $75,000 to $99,999 | 7,948 | 14.1% |
| $100,000 to $149,999 | 12,626 | 22.4% |
| $150,000 to $199,999 | 6,369 | 11.3% |
| $200,000+ | 8,850 | 15.7% |
Family Income by Famaliy Size in Cabarrus County
7+ person families (610 | 1.1%) account for the highest median family income in Cabarrus County with $143,036 per family, while 2-person families (25,442 | 45.1%) have the highest median income of $40,188 per family member.
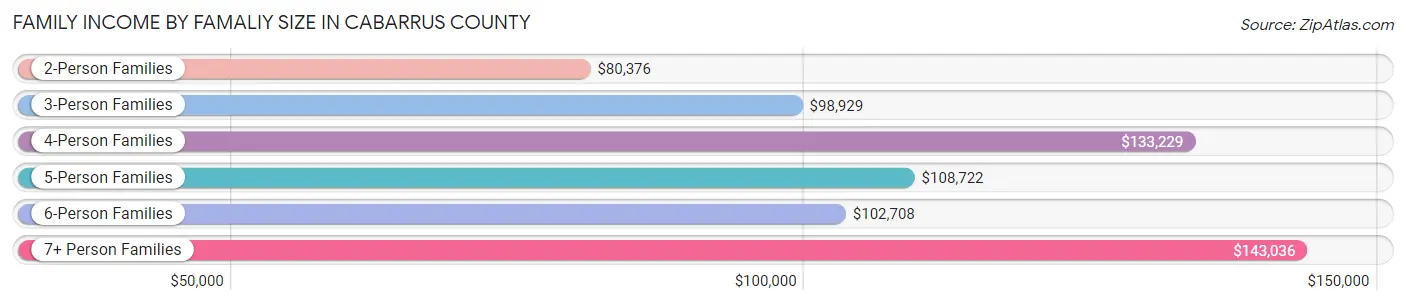
| Income Bracket | # Families | Median Income |
| 2-Person Families | 25,442 (45.1%) | $80,376 |
| 3-Person Families | 11,994 (21.3%) | $98,929 |
| 4-Person Families | 12,082 (21.4%) | $133,229 |
| 5-Person Families | 4,666 (8.3%) | $108,722 |
| 6-Person Families | 1,573 (2.8%) | $102,708 |
| 7+ Person Families | 610 (1.1%) | $143,036 |
| Total | 56,367 (100.0%) | $99,008 |
Family Income by Number of Earners in Cabarrus County
The median family income in Cabarrus County is $99,008, with families comprising 3+ earners (6,317) having the highest median family income of $148,916, while families with no earners (7,045) have the lowest median family income of $50,766, accounting for 11.2% and 12.5% of families, respectively.
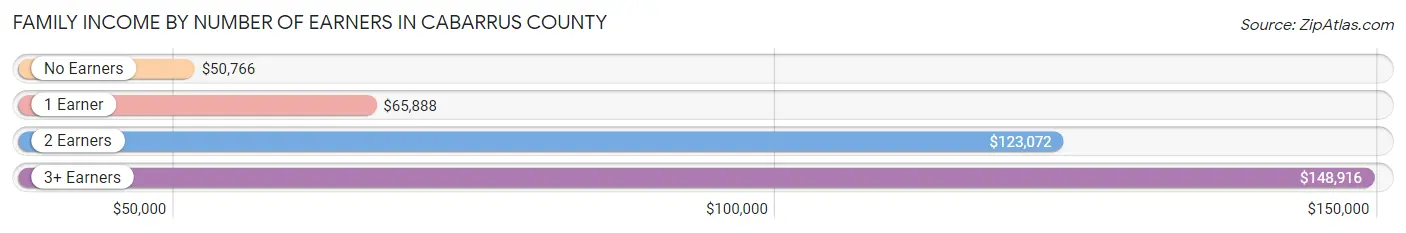
| Number of Earners | # Families | Median Income |
| No Earners | 7,045 (12.5%) | $50,766 |
| 1 Earner | 17,838 (31.7%) | $65,888 |
| 2 Earners | 25,167 (44.7%) | $123,072 |
| 3+ Earners | 6,317 (11.2%) | $148,916 |
| Total | 56,367 (100.0%) | $99,008 |
Household Income in Cabarrus County
Household Income Brackets in Cabarrus County
With 14,915 households falling in the category, the $100,000 to $149,999 income range is the most frequent in Cabarrus County, accounting for 19.4% of all households. In contrast, only 2,153 households (2.8%) fall into the $10,000 to $14,999 income bracket, making it the least populous group.
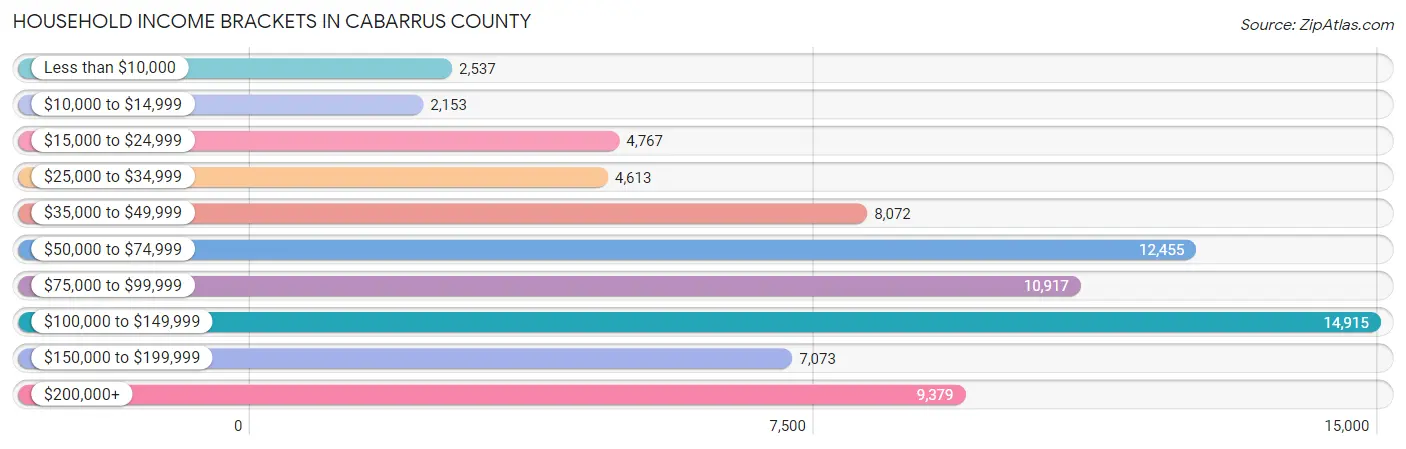
| Income Bracket | # Households | % Households |
| Less than $10,000 | 2,537 | 3.3% |
| $10,000 to $14,999 | 2,153 | 2.8% |
| $15,000 to $24,999 | 4,767 | 6.2% |
| $25,000 to $34,999 | 4,613 | 6.0% |
| $35,000 to $49,999 | 8,072 | 10.5% |
| $50,000 to $74,999 | 12,455 | 16.2% |
| $75,000 to $99,999 | 10,917 | 14.2% |
| $100,000 to $149,999 | 14,915 | 19.4% |
| $150,000 to $199,999 | 7,073 | 9.2% |
| $200,000+ | 9,379 | 12.2% |
Household Income by Householder Age in Cabarrus County
The median household income in Cabarrus County is $83,828, with the highest median household income of $98,021 found in the 45 to 64 years age bracket for the primary householder. A total of 30,699 households (39.9%) fall into this category. Meanwhile, the 15 to 24 years age bracket for the primary householder has the lowest median household income of $44,960, with 1,961 households (2.5%) in this group.
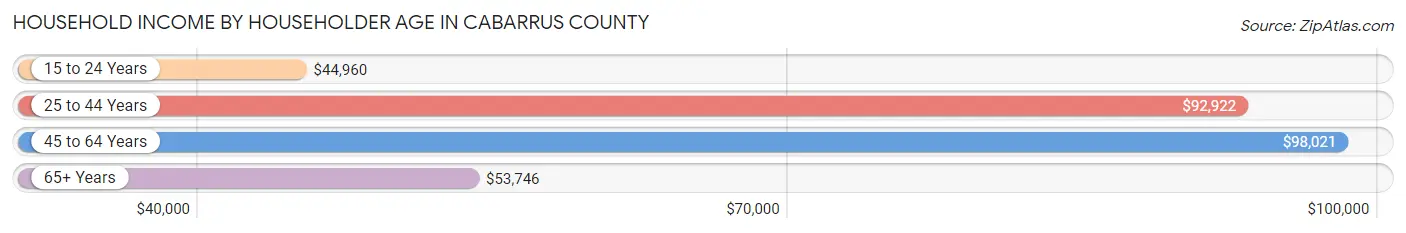
| Income Bracket | # Households | Median Income |
| 15 to 24 Years | 1,961 (2.5%) | $44,960 |
| 25 to 44 Years | 27,499 (35.8%) | $92,922 |
| 45 to 64 Years | 30,699 (39.9%) | $98,021 |
| 65+ Years | 16,721 (21.7%) | $53,746 |
| Total | 76,880 (100.0%) | $83,828 |
Poverty in Cabarrus County
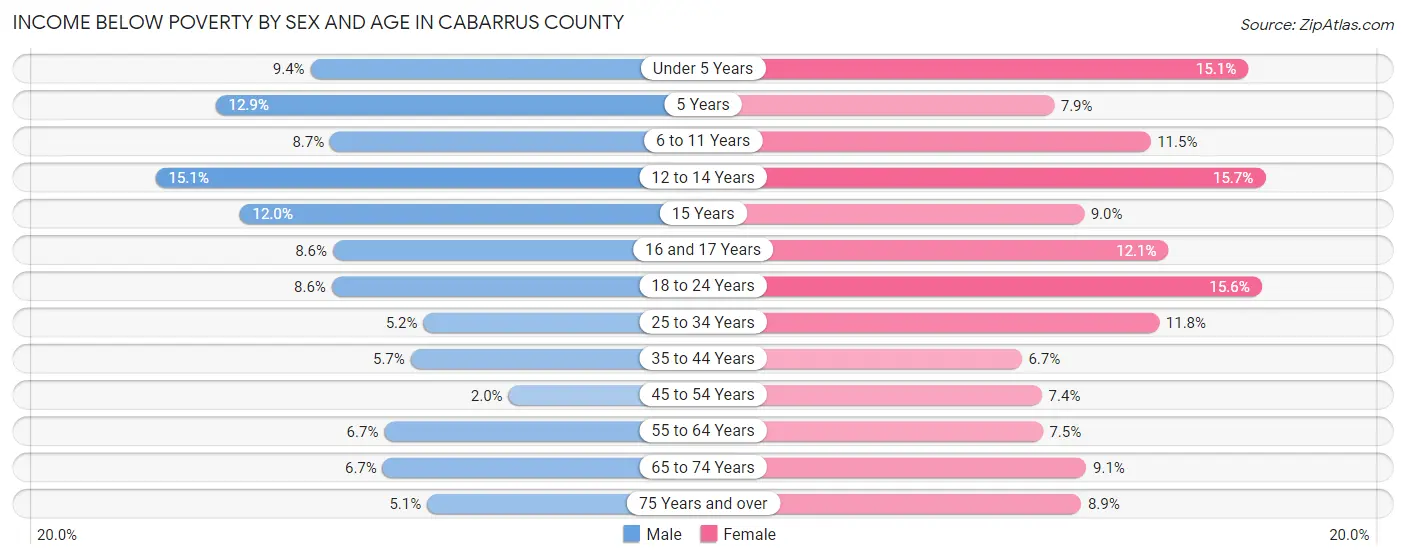
Income Below Poverty by Sex and Age in Cabarrus County
With 6.7% poverty level for males and 10.0% for females among the residents of Cabarrus County, 12 to 14 year old males and 12 to 14 year old females are the most vulnerable to poverty, with 736 males (15.1%) and 714 females (15.7%) in their respective age groups living below the poverty level.
| Age Bracket | Male | Female |
| Under 5 Years | 657 (9.4%) | 971 (15.1%) |
| 5 Years | 166 (12.9%) | 113 (7.9%) |
| 6 to 11 Years | 910 (8.7%) | 1,119 (11.5%) |
| 12 to 14 Years | 736 (15.1%) | 714 (15.7%) |
| 15 Years | 236 (12.0%) | 128 (9.0%) |
| 16 and 17 Years | 301 (8.6%) | 438 (12.1%) |
| 18 to 24 Years | 817 (8.6%) | 1,453 (15.6%) |
| 25 to 34 Years | 713 (5.2%) | 1,690 (11.8%) |
| 35 to 44 Years | 903 (5.7%) | 1,119 (6.7%) |
| 45 to 54 Years | 327 (2.0%) | 1,202 (7.4%) |
| 55 to 64 Years | 866 (6.7%) | 1,014 (7.4%) |
| 65 to 74 Years | 556 (6.7%) | 886 (9.1%) |
| 75 Years and over | 239 (5.1%) | 591 (8.9%) |
| Total | 7,427 (6.7%) | 11,438 (10.0%) |
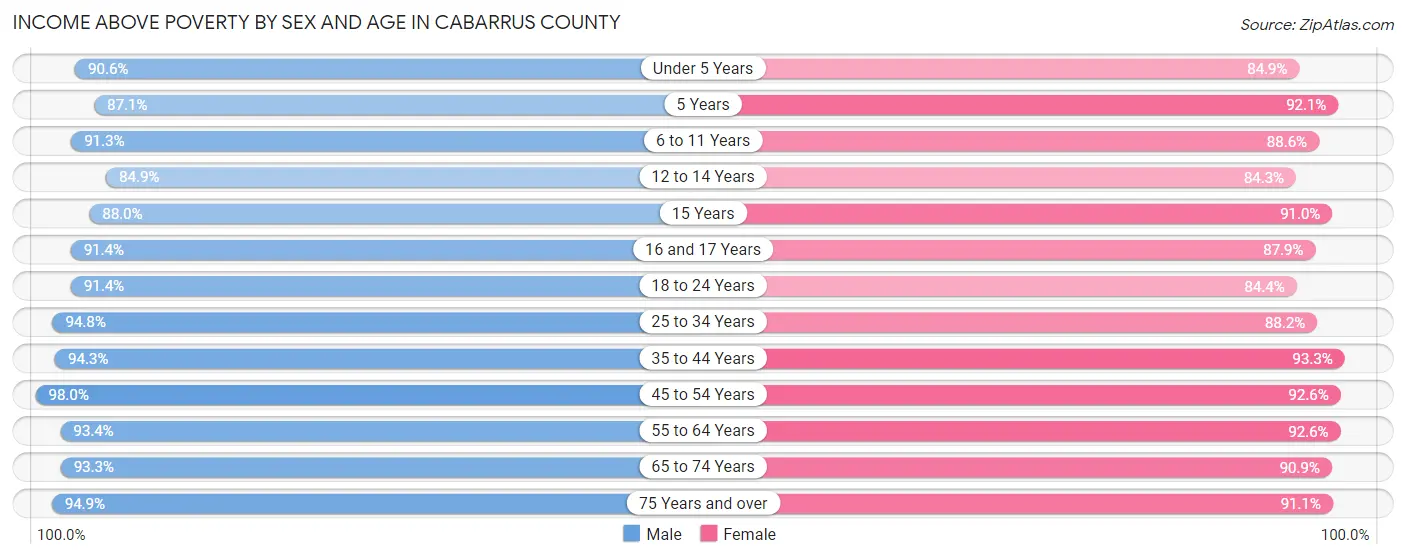
Income Above Poverty by Sex and Age in Cabarrus County
According to the poverty statistics in Cabarrus County, males aged 45 to 54 years and females aged 35 to 44 years are the age groups that are most secure financially, with 98.0% of males and 93.3% of females in these age groups living above the poverty line.
| Age Bracket | Male | Female |
| Under 5 Years | 6,341 (90.6%) | 5,470 (84.9%) |
| 5 Years | 1,120 (87.1%) | 1,323 (92.1%) |
| 6 to 11 Years | 9,601 (91.3%) | 8,655 (88.5%) |
| 12 to 14 Years | 4,125 (84.9%) | 3,830 (84.3%) |
| 15 Years | 1,728 (88.0%) | 1,297 (91.0%) |
| 16 and 17 Years | 3,214 (91.4%) | 3,177 (87.9%) |
| 18 to 24 Years | 8,679 (91.4%) | 7,873 (84.4%) |
| 25 to 34 Years | 12,996 (94.8%) | 12,667 (88.2%) |
| 35 to 44 Years | 15,009 (94.3%) | 15,668 (93.3%) |
| 45 to 54 Years | 15,735 (98.0%) | 15,000 (92.6%) |
| 55 to 64 Years | 12,166 (93.3%) | 12,588 (92.5%) |
| 65 to 74 Years | 7,730 (93.3%) | 8,887 (90.9%) |
| 75 Years and over | 4,483 (94.9%) | 6,061 (91.1%) |
| Total | 102,927 (93.3%) | 102,496 (90.0%) |
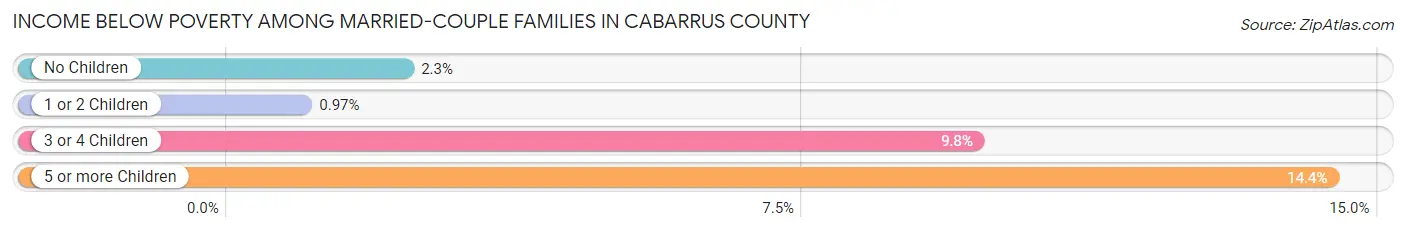
Income Below Poverty Among Married-Couple Families in Cabarrus County
The poverty statistics for married-couple families in Cabarrus County show that 2.5% or 1,087 of the total 43,506 families live below the poverty line. Families with 5 or more children have the highest poverty rate of 14.4%, comprising of 23 families. On the other hand, families with 1 or 2 children have the lowest poverty rate of 1.0%, which includes 154 families.
| Children | Above Poverty | Below Poverty |
| No Children | 23,235 (97.7%) | 548 (2.3%) |
| 1 or 2 Children | 15,695 (99.0%) | 154 (1.0%) |
| 3 or 4 Children | 3,352 (90.2%) | 362 (9.8%) |
| 5 or more Children | 137 (85.6%) | 23 (14.4%) |
| Total | 42,419 (97.5%) | 1,087 (2.5%) |
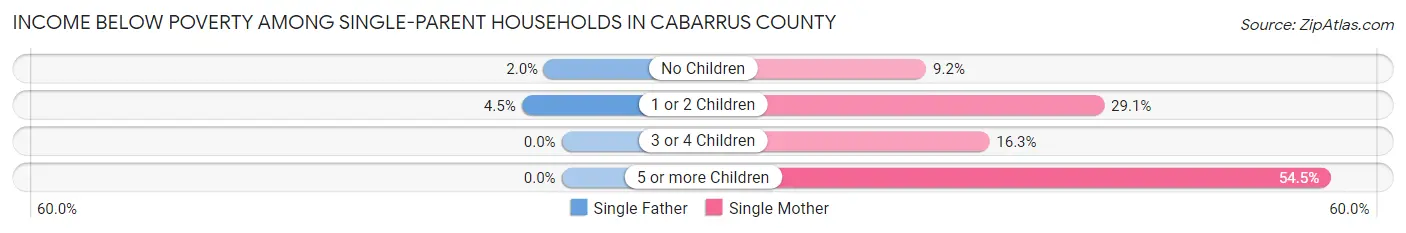
Income Below Poverty Among Single-Parent Households in Cabarrus County
According to the poverty data in Cabarrus County, 2.7% or 74 single-father households and 22.4% or 2,264 single-mother households are living below the poverty line. Among single-father households, those with 1 or 2 children have the highest poverty rate, with 44 households (4.5%) experiencing poverty. Likewise, among single-mother households, those with 5 or more children have the highest poverty rate, with 55 households (54.5%) falling below the poverty line.
| Children | Single Father | Single Mother |
| No Children | 30 (2.0%) | 264 (9.2%) |
| 1 or 2 Children | 44 (4.5%) | 1,776 (29.1%) |
| 3 or 4 Children | 0 (0.0%) | 169 (16.3%) |
| 5 or more Children | 0 (0.0%) | 55 (54.5%) |
| Total | 74 (2.7%) | 2,264 (22.4%) |
Income Below Poverty Among Married-Couple vs Single-Parent Households in Cabarrus County
The poverty data for Cabarrus County shows that 1,087 of the married-couple family households (2.5%) and 2,338 of the single-parent households (18.2%) are living below the poverty level. Within the married-couple family households, those with 5 or more children have the highest poverty rate, with 23 households (14.4%) falling below the poverty line. Among the single-parent households, those with 5 or more children have the highest poverty rate, with 55 household (54.5%) living below poverty.
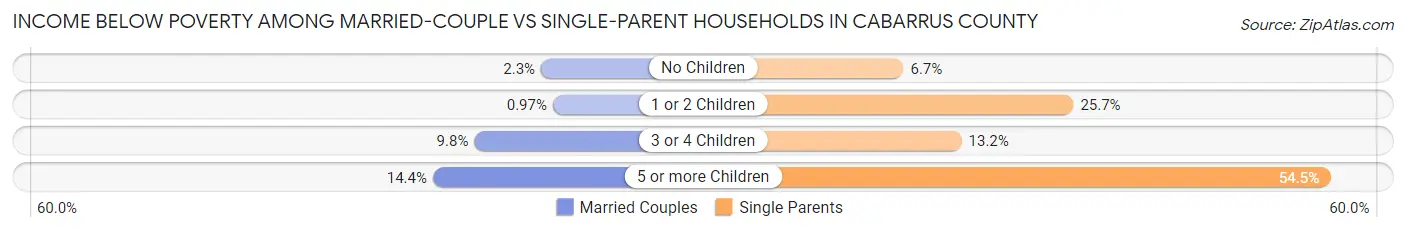
| Children | Married-Couple Families | Single-Parent Households |
| No Children | 548 (2.3%) | 294 (6.7%) |
| 1 or 2 Children | 154 (1.0%) | 1,820 (25.7%) |
| 3 or 4 Children | 362 (9.8%) | 169 (13.2%) |
| 5 or more Children | 23 (14.4%) | 55 (54.5%) |
| Total | 1,087 (2.5%) | 2,338 (18.2%) |
Employment Characteristics in Cabarrus County
Employment by Class of Employer in Cabarrus County
Among the 111,840 employed individuals in Cabarrus County, private company employees (78,887 | 70.5%), local government employees (7,706 | 6.9%), and not-for-profit organizations (7,671 | 6.9%) make up the most common classes of employment.
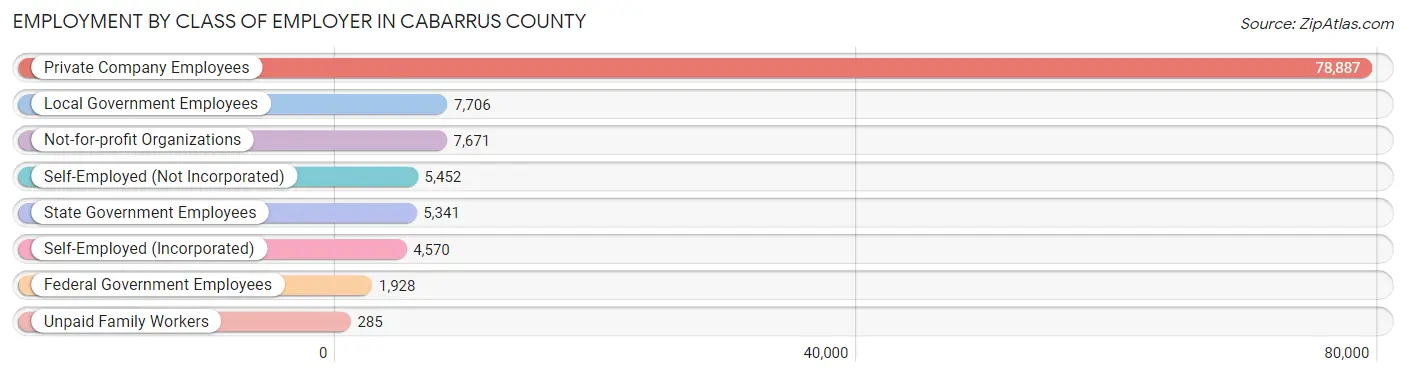
| Employer Class | # Employees | % Employees |
| Private Company Employees | 78,887 | 70.5% |
| Self-Employed (Incorporated) | 4,570 | 4.1% |
| Self-Employed (Not Incorporated) | 5,452 | 4.9% |
| Not-for-profit Organizations | 7,671 | 6.9% |
| Local Government Employees | 7,706 | 6.9% |
| State Government Employees | 5,341 | 4.8% |
| Federal Government Employees | 1,928 | 1.7% |
| Unpaid Family Workers | 285 | 0.3% |
| Total | 111,840 | 100.0% |
Employment Status by Age in Cabarrus County
According to the labor force statistics for Cabarrus County, out of the total population over 16 years of age (176,491), 67.8% or 119,661 individuals are in the labor force, with 4.9% or 5,863 of them unemployed. The age group with the highest labor force participation rate is 30 to 34 years, with 88.1% or 12,923 individuals in the labor force. Within the labor force, the 16 to 19 years age range has the highest percentage of unemployed individuals, with 17.9% or 1,116 of them being unemployed.
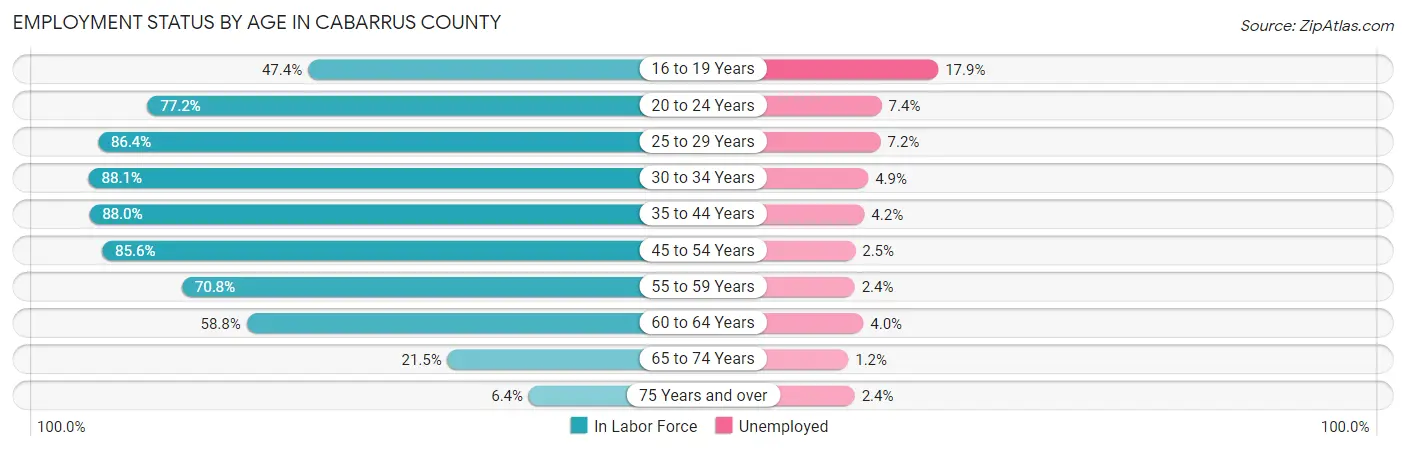
| Age Bracket | In Labor Force | Unemployed |
| 16 to 19 Years | 6,234 (47.4%) | 1,116 (17.9%) |
| 20 to 24 Years | 10,092 (77.2%) | 747 (7.4%) |
| 25 to 29 Years | 11,758 (86.4%) | 847 (7.2%) |
| 30 to 34 Years | 12,923 (88.1%) | 633 (4.9%) |
| 35 to 44 Years | 28,841 (88.0%) | 1,211 (4.2%) |
| 45 to 54 Years | 27,675 (85.6%) | 692 (2.5%) |
| 55 to 59 Years | 10,357 (70.8%) | 249 (2.4%) |
| 60 to 64 Years | 7,095 (58.8%) | 284 (4.0%) |
| 65 to 74 Years | 3,913 (21.5%) | 47 (1.2%) |
| 75 Years and over | 768 (6.4%) | 18 (2.4%) |
| Total | 119,661 (67.8%) | 5,863 (4.9%) |
Employment Status by Educational Attainment in Cabarrus County
According to labor force statistics for Cabarrus County, 82.2% of individuals (98,703) out of the total population between 25 and 64 years of age (120,077) are in the labor force, with 4.0% or 3,948 of them being unemployed. The group with the highest labor force participation rate are those with the educational attainment of bachelor's degree or higher, with 87.2% or 41,490 individuals in the labor force. Within the labor force, individuals with high school diploma education have the highest percentage of unemployment, with 7.3% or 1,604 of them being unemployed.
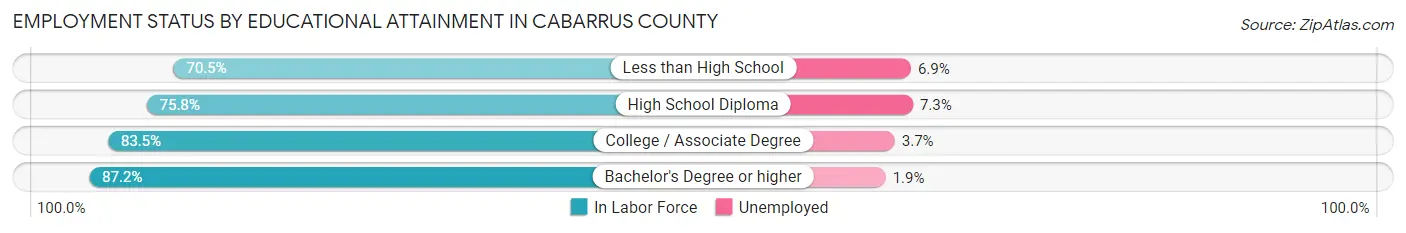
| Educational Attainment | In Labor Force | Unemployed |
| Less than High School | 6,009 (70.5%) | 588 (6.9%) |
| High School Diploma | 21,968 (75.8%) | 2,116 (7.3%) |
| College / Associate Degree | 29,218 (83.5%) | 1,295 (3.7%) |
| Bachelor's Degree or higher | 41,490 (87.2%) | 904 (1.9%) |
| Total | 98,703 (82.2%) | 4,803 (4.0%) |
Employment Occupations by Sex in Cabarrus County
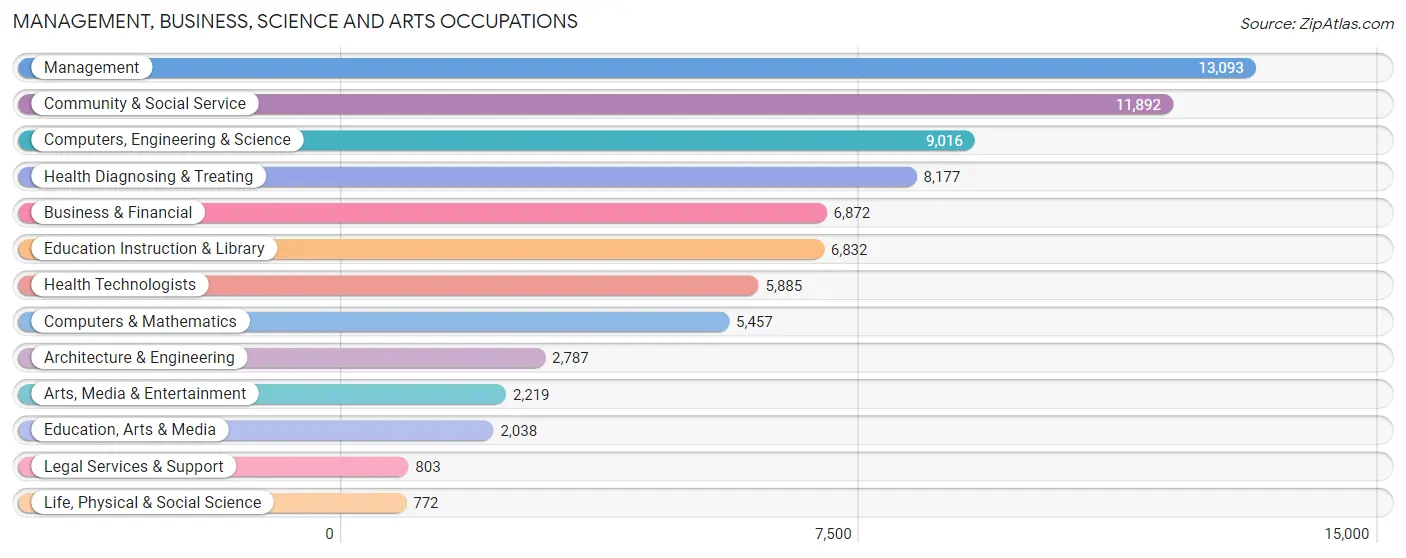
Management, Business, Science and Arts Occupations
The most common Management, Business, Science and Arts occupations in Cabarrus County are Management (13,093 | 11.5%), Community & Social Service (11,892 | 10.5%), Computers, Engineering & Science (9,016 | 7.9%), Health Diagnosing & Treating (8,177 | 7.2%), and Business & Financial (6,872 | 6.0%).
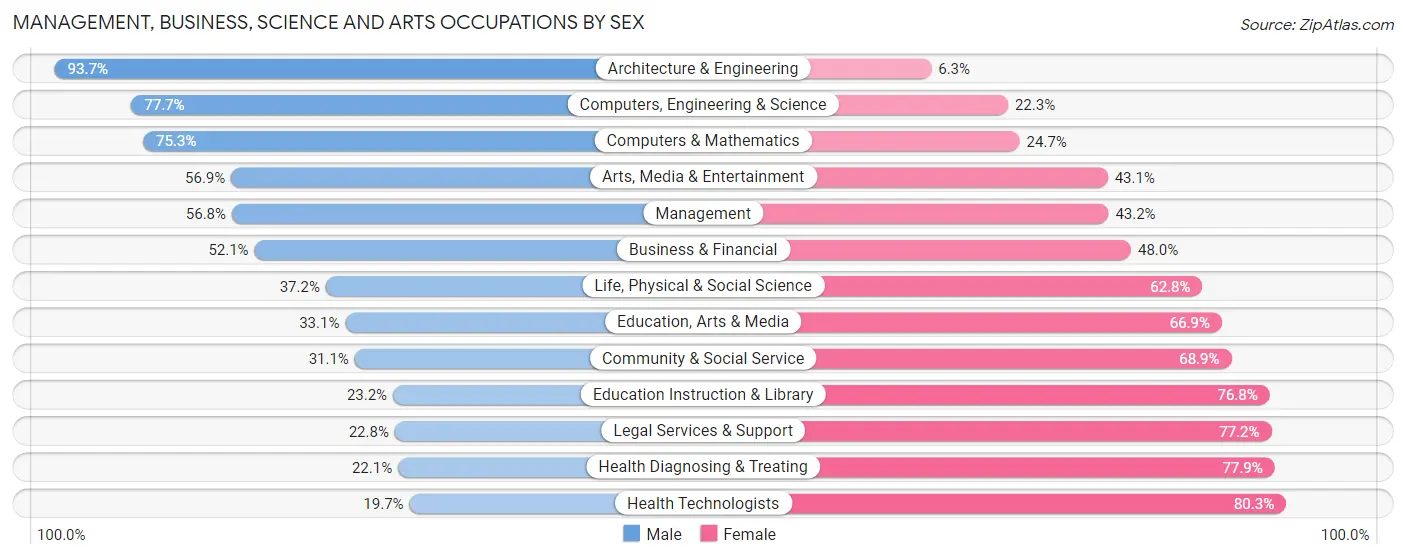
Management, Business, Science and Arts Occupations by Sex
Within the Management, Business, Science and Arts occupations in Cabarrus County, the most male-oriented occupations are Architecture & Engineering (93.7%), Computers, Engineering & Science (77.7%), and Computers & Mathematics (75.3%), while the most female-oriented occupations are Health Technologists (80.3%), Health Diagnosing & Treating (77.9%), and Legal Services & Support (77.2%).
| Occupation | Male | Female |
| Management | 7,432 (56.8%) | 5,661 (43.2%) |
| Business & Financial | 3,577 (52.0%) | 3,295 (47.9%) |
| Computers, Engineering & Science | 7,007 (77.7%) | 2,009 (22.3%) |
| Computers & Mathematics | 4,108 (75.3%) | 1,349 (24.7%) |
| Architecture & Engineering | 2,612 (93.7%) | 175 (6.3%) |
| Life, Physical & Social Science | 287 (37.2%) | 485 (62.8%) |
| Community & Social Service | 3,703 (31.1%) | 8,189 (68.9%) |
| Education, Arts & Media | 675 (33.1%) | 1,363 (66.9%) |
| Legal Services & Support | 183 (22.8%) | 620 (77.2%) |
| Education Instruction & Library | 1,582 (23.2%) | 5,250 (76.8%) |
| Arts, Media & Entertainment | 1,263 (56.9%) | 956 (43.1%) |
| Health Diagnosing & Treating | 1,808 (22.1%) | 6,369 (77.9%) |
| Health Technologists | 1,161 (19.7%) | 4,724 (80.3%) |
| Total (Category) | 23,527 (48.0%) | 25,523 (52.0%) |
| Total (Overall) | 60,095 (52.9%) | 53,484 (47.1%) |
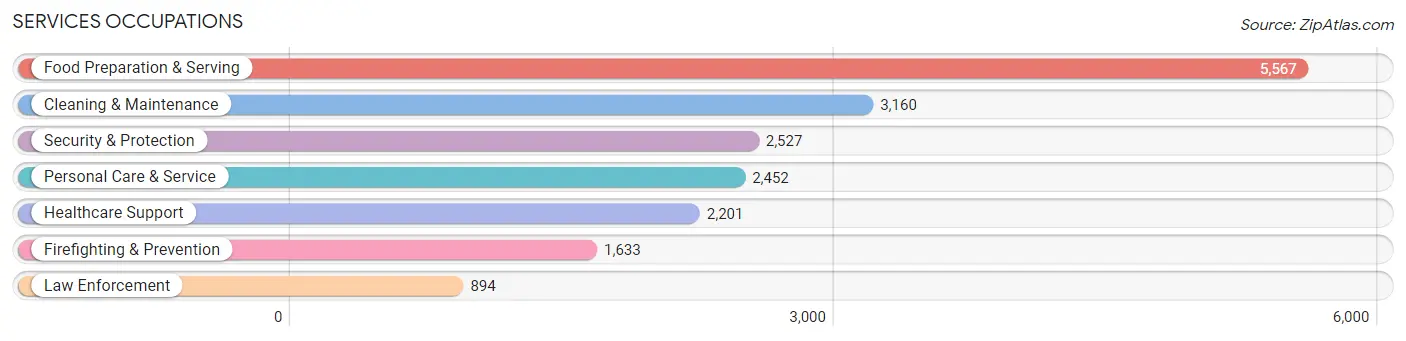
Services Occupations
The most common Services occupations in Cabarrus County are Food Preparation & Serving (5,567 | 4.9%), Cleaning & Maintenance (3,160 | 2.8%), Security & Protection (2,527 | 2.2%), Personal Care & Service (2,452 | 2.2%), and Healthcare Support (2,201 | 1.9%).
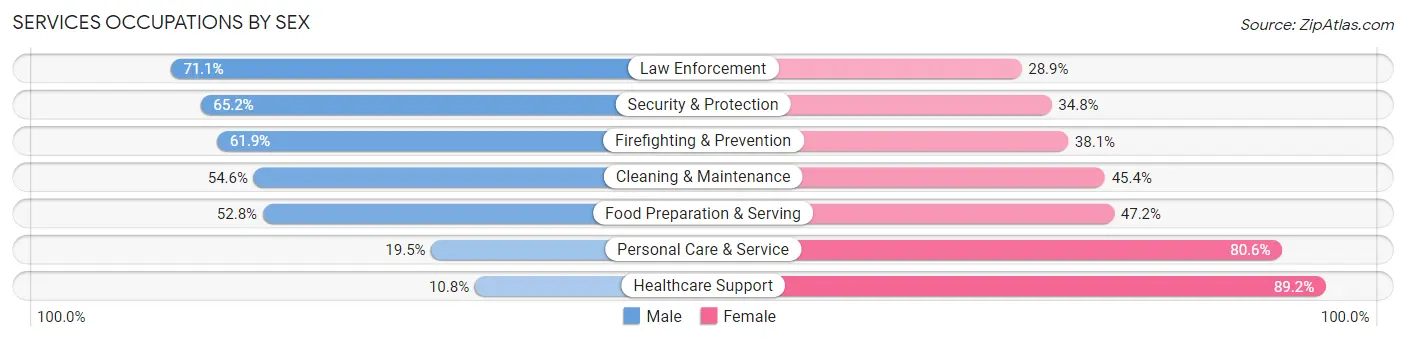
Services Occupations by Sex
Within the Services occupations in Cabarrus County, the most male-oriented occupations are Law Enforcement (71.1%), Security & Protection (65.2%), and Firefighting & Prevention (61.9%), while the most female-oriented occupations are Healthcare Support (89.2%), Personal Care & Service (80.5%), and Food Preparation & Serving (47.2%).
| Occupation | Male | Female |
| Healthcare Support | 238 (10.8%) | 1,963 (89.2%) |
| Security & Protection | 1,647 (65.2%) | 880 (34.8%) |
| Firefighting & Prevention | 1,011 (61.9%) | 622 (38.1%) |
| Law Enforcement | 636 (71.1%) | 258 (28.9%) |
| Food Preparation & Serving | 2,940 (52.8%) | 2,627 (47.2%) |
| Cleaning & Maintenance | 1,726 (54.6%) | 1,434 (45.4%) |
| Personal Care & Service | 477 (19.5%) | 1,975 (80.5%) |
| Total (Category) | 7,028 (44.2%) | 8,879 (55.8%) |
| Total (Overall) | 60,095 (52.9%) | 53,484 (47.1%) |
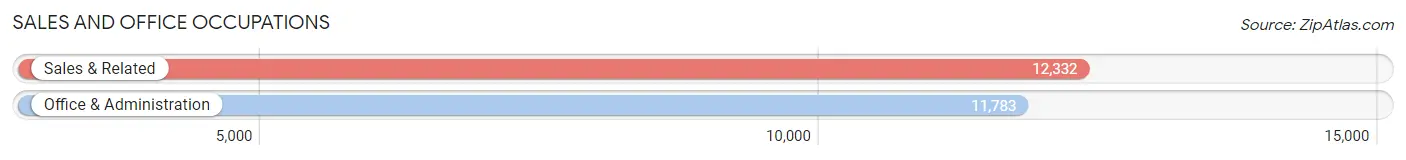
Sales and Office Occupations
The most common Sales and Office occupations in Cabarrus County are Sales & Related (12,332 | 10.9%), and Office & Administration (11,783 | 10.4%).
Sales and Office Occupations by Sex
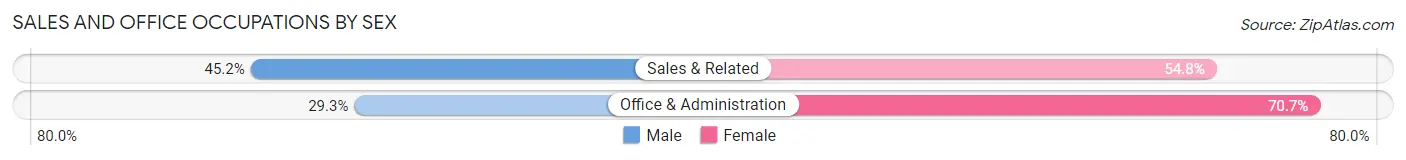
| Occupation | Male | Female |
| Sales & Related | 5,579 (45.2%) | 6,753 (54.8%) |
| Office & Administration | 3,451 (29.3%) | 8,332 (70.7%) |
| Total (Category) | 9,030 (37.4%) | 15,085 (62.5%) |
| Total (Overall) | 60,095 (52.9%) | 53,484 (47.1%) |
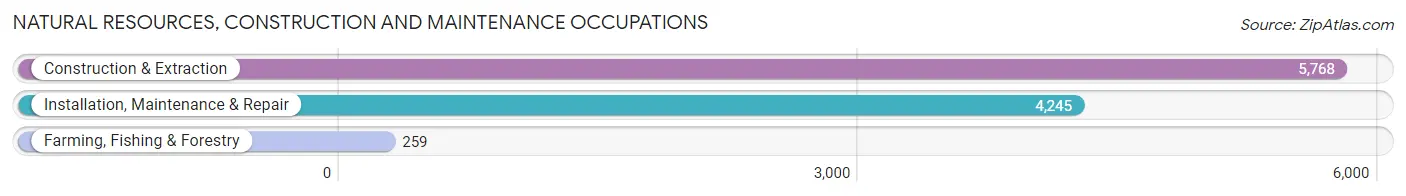
Natural Resources, Construction and Maintenance Occupations
The most common Natural Resources, Construction and Maintenance occupations in Cabarrus County are Construction & Extraction (5,768 | 5.1%), Installation, Maintenance & Repair (4,245 | 3.7%), and Farming, Fishing & Forestry (259 | 0.2%).
Natural Resources, Construction and Maintenance Occupations by Sex
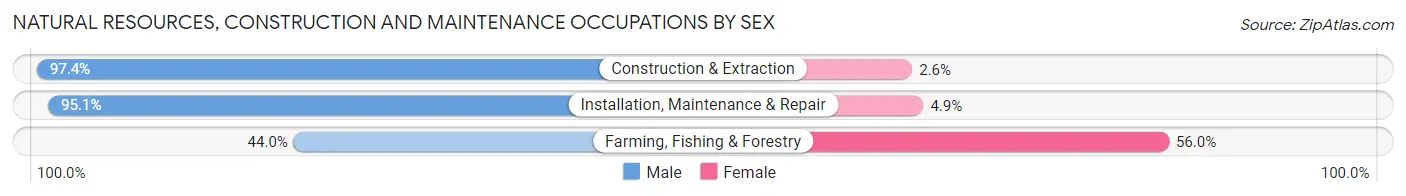
| Occupation | Male | Female |
| Farming, Fishing & Forestry | 114 (44.0%) | 145 (56.0%) |
| Construction & Extraction | 5,620 (97.4%) | 148 (2.6%) |
| Installation, Maintenance & Repair | 4,037 (95.1%) | 208 (4.9%) |
| Total (Category) | 9,771 (95.1%) | 501 (4.9%) |
| Total (Overall) | 60,095 (52.9%) | 53,484 (47.1%) |
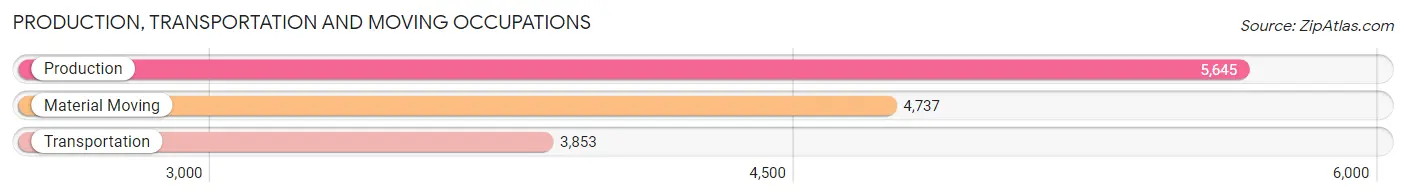
Production, Transportation and Moving Occupations
The most common Production, Transportation and Moving occupations in Cabarrus County are Production (5,645 | 5.0%), Material Moving (4,737 | 4.2%), and Transportation (3,853 | 3.4%).
Production, Transportation and Moving Occupations by Sex
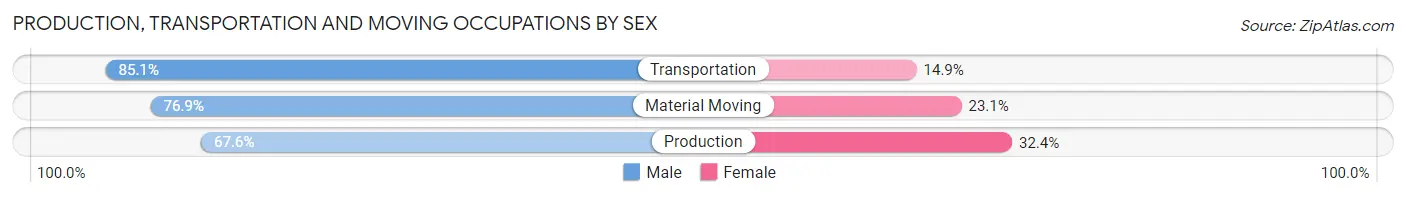
| Occupation | Male | Female |
| Production | 3,817 (67.6%) | 1,828 (32.4%) |
| Transportation | 3,280 (85.1%) | 573 (14.9%) |
| Material Moving | 3,642 (76.9%) | 1,095 (23.1%) |
| Total (Category) | 10,739 (75.4%) | 3,496 (24.6%) |
| Total (Overall) | 60,095 (52.9%) | 53,484 (47.1%) |
Employment Industries by Sex in Cabarrus County
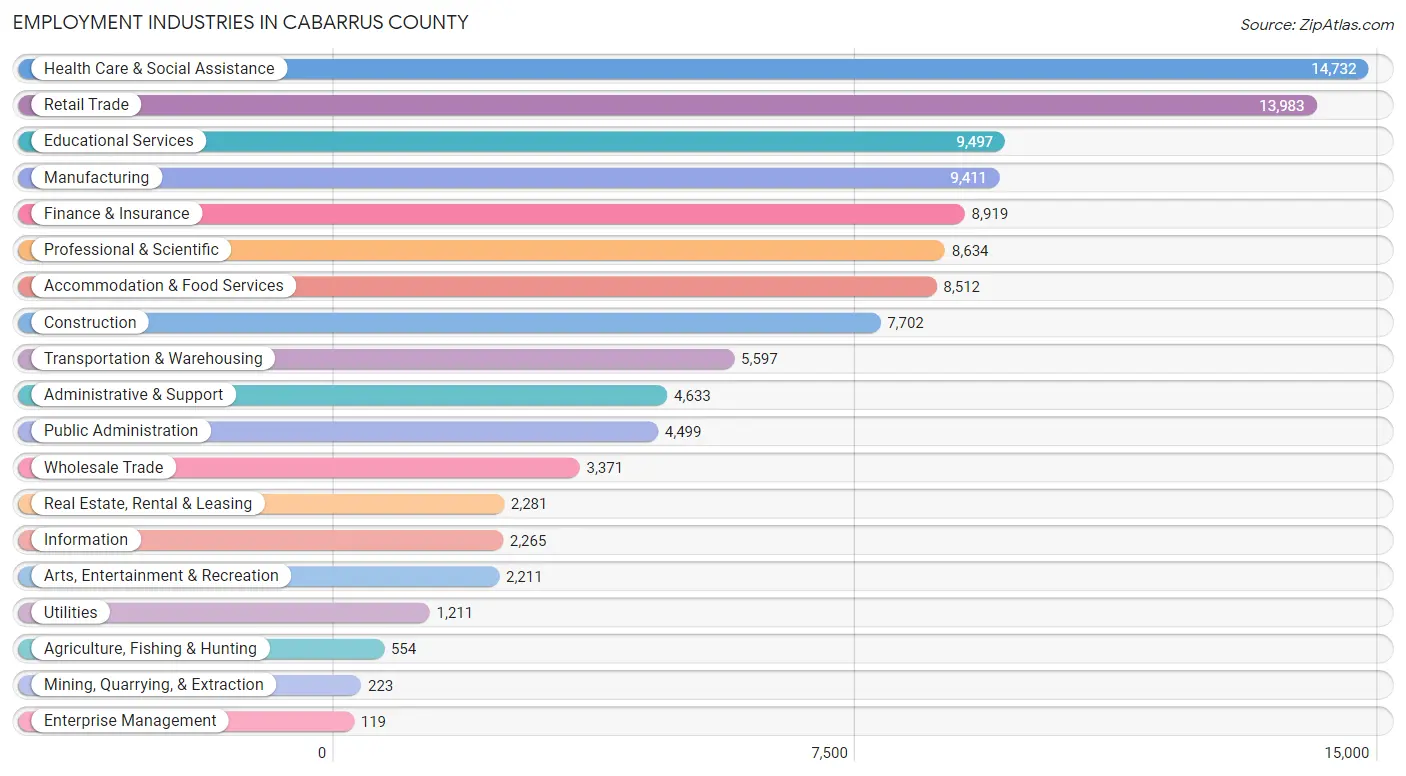
Employment Industries in Cabarrus County
The major employment industries in Cabarrus County include Health Care & Social Assistance (14,732 | 13.0%), Retail Trade (13,983 | 12.3%), Educational Services (9,497 | 8.4%), Manufacturing (9,411 | 8.3%), and Finance & Insurance (8,919 | 7.9%).
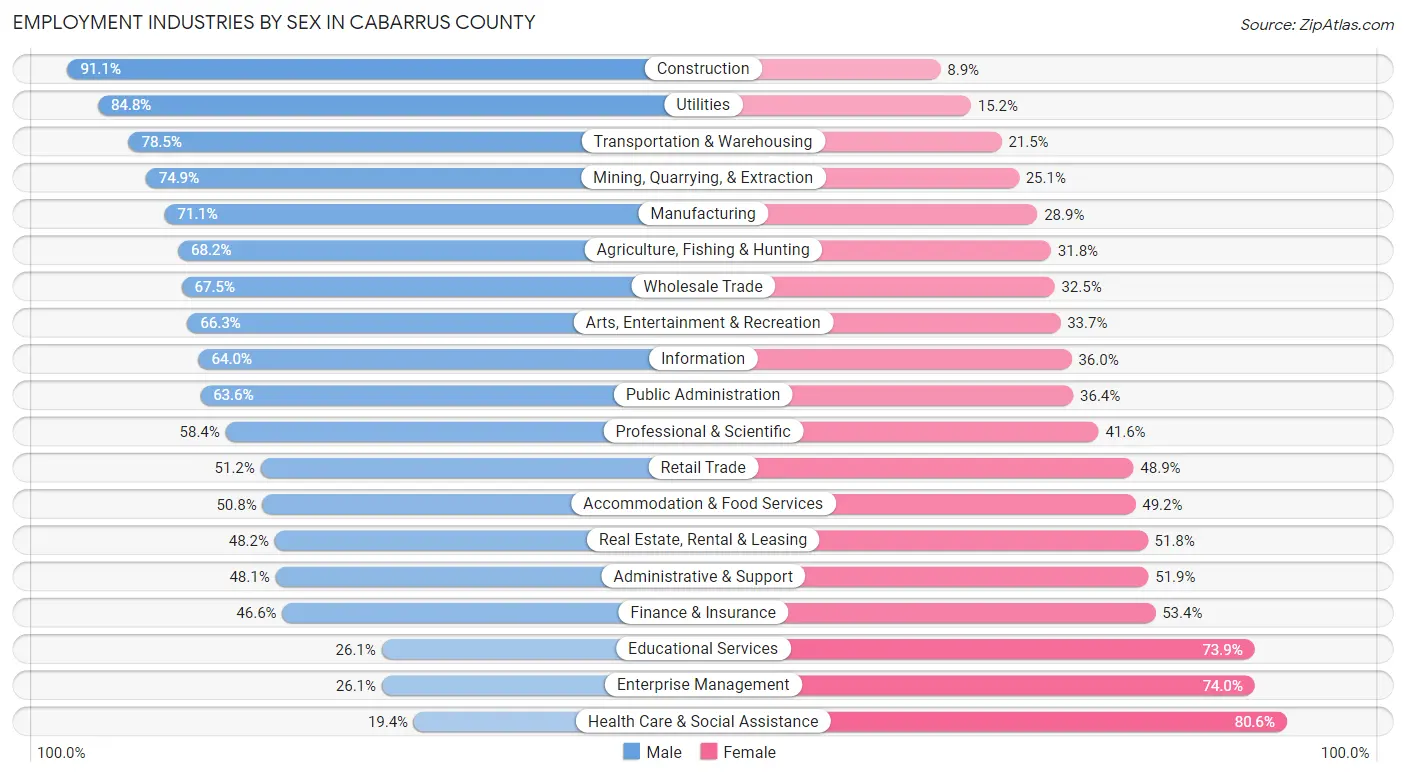
Employment Industries by Sex in Cabarrus County
The Cabarrus County industries that see more men than women are Construction (91.1%), Utilities (84.8%), and Transportation & Warehousing (78.5%), whereas the industries that tend to have a higher number of women are Health Care & Social Assistance (80.6%), Enterprise Management (74.0%), and Educational Services (73.9%).
| Industry | Male | Female |
| Agriculture, Fishing & Hunting | 378 (68.2%) | 176 (31.8%) |
| Mining, Quarrying, & Extraction | 167 (74.9%) | 56 (25.1%) |
| Construction | 7,018 (91.1%) | 684 (8.9%) |
| Manufacturing | 6,687 (71.1%) | 2,724 (28.9%) |
| Wholesale Trade | 2,275 (67.5%) | 1,096 (32.5%) |
| Retail Trade | 7,153 (51.1%) | 6,830 (48.8%) |
| Transportation & Warehousing | 4,392 (78.5%) | 1,205 (21.5%) |
| Utilities | 1,027 (84.8%) | 184 (15.2%) |
| Information | 1,449 (64.0%) | 816 (36.0%) |
| Finance & Insurance | 4,160 (46.6%) | 4,759 (53.4%) |
| Real Estate, Rental & Leasing | 1,100 (48.2%) | 1,181 (51.8%) |
| Professional & Scientific | 5,041 (58.4%) | 3,593 (41.6%) |
| Enterprise Management | 31 (26.1%) | 88 (74.0%) |
| Administrative & Support | 2,227 (48.1%) | 2,406 (51.9%) |
| Educational Services | 2,479 (26.1%) | 7,018 (73.9%) |
| Health Care & Social Assistance | 2,859 (19.4%) | 11,873 (80.6%) |
| Arts, Entertainment & Recreation | 1,466 (66.3%) | 745 (33.7%) |
| Accommodation & Food Services | 4,321 (50.8%) | 4,191 (49.2%) |
| Public Administration | 2,863 (63.6%) | 1,636 (36.4%) |
| Total | 60,095 (52.9%) | 53,484 (47.1%) |
Education in Cabarrus County
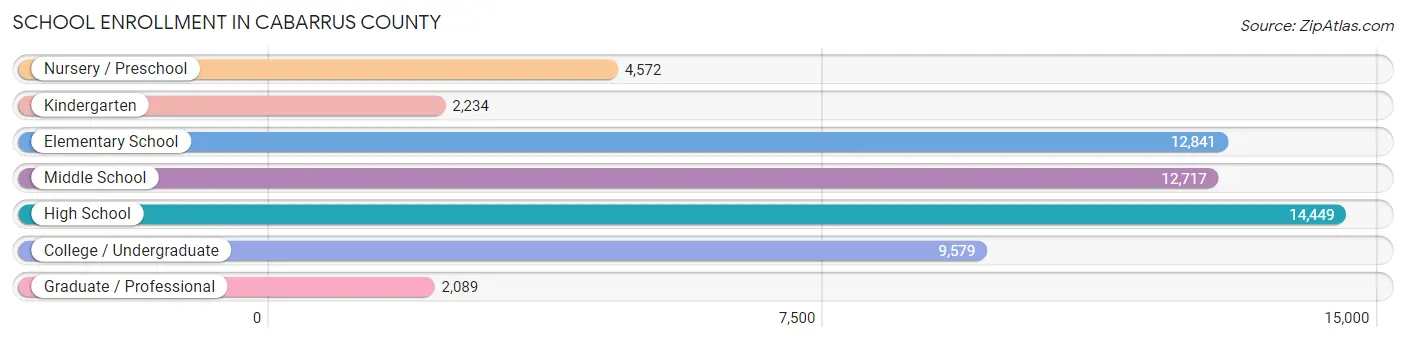
School Enrollment in Cabarrus County
The most common levels of schooling among the 58,481 students in Cabarrus County are high school (14,449 | 24.7%), elementary school (12,841 | 22.0%), and middle school (12,717 | 21.7%).
| School Level | # Students | % Students |
| Nursery / Preschool | 4,572 | 7.8% |
| Kindergarten | 2,234 | 3.8% |
| Elementary School | 12,841 | 22.0% |
| Middle School | 12,717 | 21.7% |
| High School | 14,449 | 24.7% |
| College / Undergraduate | 9,579 | 16.4% |
| Graduate / Professional | 2,089 | 3.6% |
| Total | 58,481 | 100.0% |
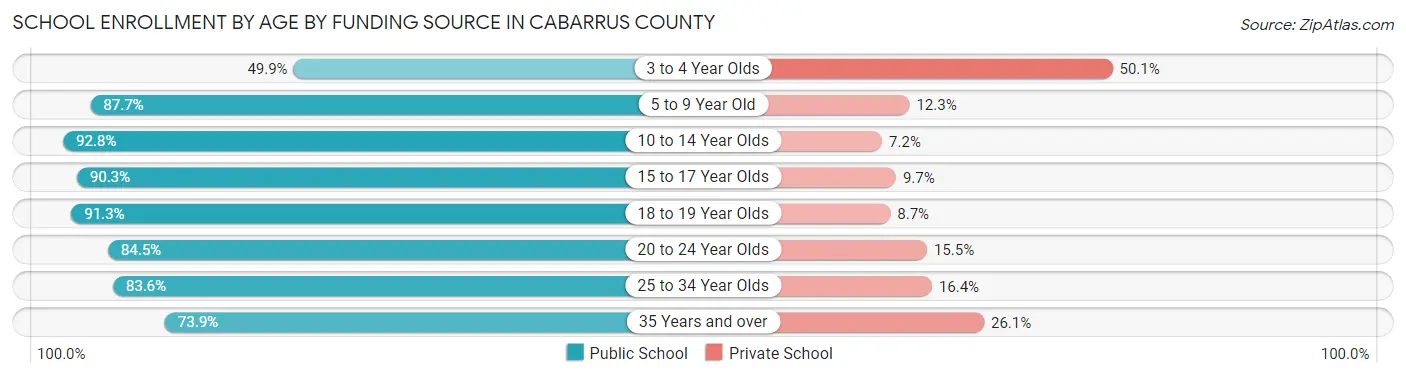
School Enrollment by Age by Funding Source in Cabarrus County
Out of a total of 58,481 students who are enrolled in schools in Cabarrus County, 7,895 (13.5%) attend a private institution, while the remaining 50,586 (86.5%) are enrolled in public schools. The age group of 3 to 4 year olds has the highest likelihood of being enrolled in private schools, with 1,800 (50.1% in the age bracket) enrolled. Conversely, the age group of 10 to 14 year olds has the lowest likelihood of being enrolled in a private school, with 15,722 (92.8% in the age bracket) attending a public institution.
| Age Bracket | Public School | Private School |
| 3 to 4 Year Olds | 1,794 (49.9%) | 1,800 (50.1%) |
| 5 to 9 Year Old | 12,233 (87.7%) | 1,709 (12.3%) |
| 10 to 14 Year Olds | 15,722 (92.8%) | 1,215 (7.2%) |
| 15 to 17 Year Olds | 9,074 (90.3%) | 979 (9.7%) |
| 18 to 19 Year Olds | 3,755 (91.3%) | 358 (8.7%) |
| 20 to 24 Year Olds | 3,523 (84.5%) | 647 (15.5%) |
| 25 to 34 Year Olds | 2,313 (83.6%) | 455 (16.4%) |
| 35 Years and over | 2,145 (73.9%) | 759 (26.1%) |
| Total | 50,586 (86.5%) | 7,895 (13.5%) |
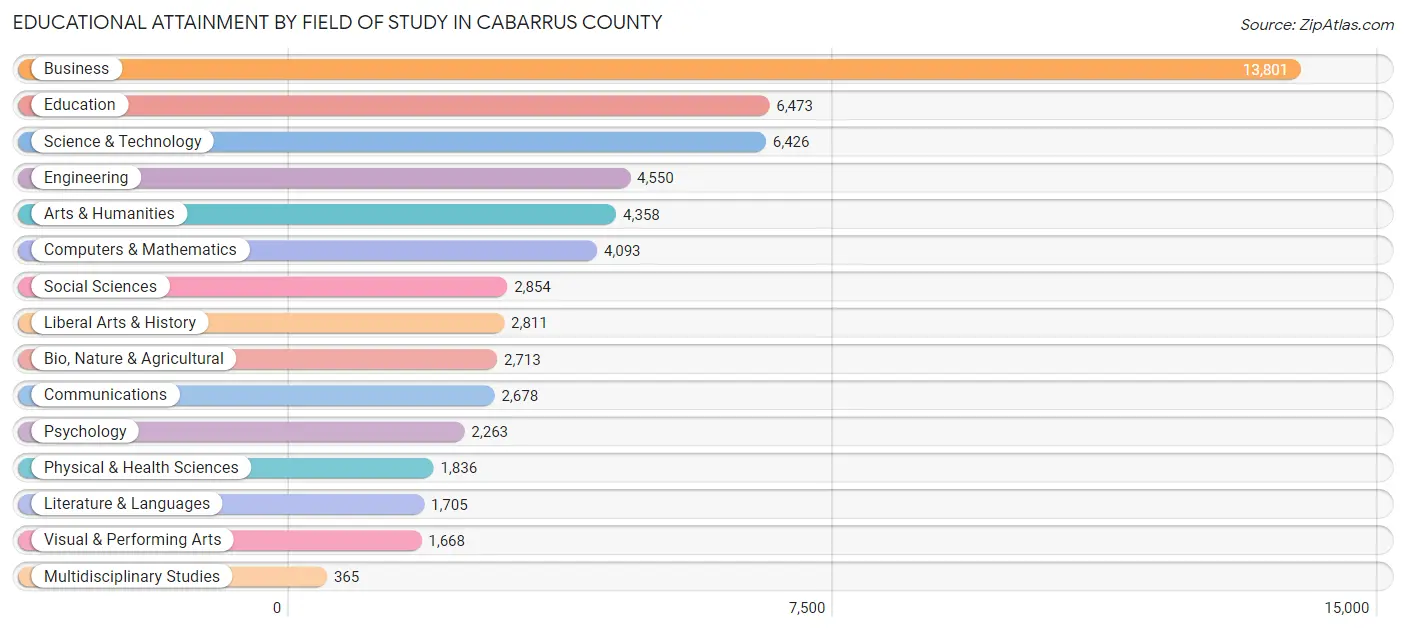
Educational Attainment by Field of Study in Cabarrus County
Business (13,801 | 23.5%), education (6,473 | 11.1%), science & technology (6,426 | 11.0%), engineering (4,550 | 7.8%), and arts & humanities (4,358 | 7.4%) are the most common fields of study among 58,594 individuals in Cabarrus County who have obtained a bachelor's degree or higher.
| Field of Study | # Graduates | % Graduates |
| Computers & Mathematics | 4,093 | 7.0% |
| Bio, Nature & Agricultural | 2,713 | 4.6% |
| Physical & Health Sciences | 1,836 | 3.1% |
| Psychology | 2,263 | 3.9% |
| Social Sciences | 2,854 | 4.9% |
| Engineering | 4,550 | 7.8% |
| Multidisciplinary Studies | 365 | 0.6% |
| Science & Technology | 6,426 | 11.0% |
| Business | 13,801 | 23.5% |
| Education | 6,473 | 11.1% |
| Literature & Languages | 1,705 | 2.9% |
| Liberal Arts & History | 2,811 | 4.8% |
| Visual & Performing Arts | 1,668 | 2.9% |
| Communications | 2,678 | 4.6% |
| Arts & Humanities | 4,358 | 7.4% |
| Total | 58,594 | 100.0% |
Transportation & Commute in Cabarrus County
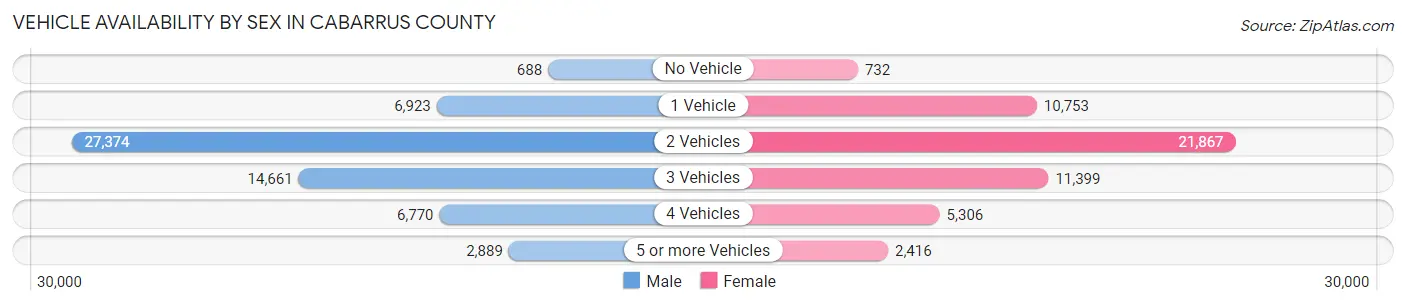
Vehicle Availability by Sex in Cabarrus County
The most prevalent vehicle ownership categories in Cabarrus County are males with 2 vehicles (27,374, accounting for 46.2%) and females with 2 vehicles (21,867, making up 52.2%).
| Vehicles Available | Male | Female |
| No Vehicle | 688 (1.2%) | 732 (1.4%) |
| 1 Vehicle | 6,923 (11.7%) | 10,753 (20.5%) |
| 2 Vehicles | 27,374 (46.2%) | 21,867 (41.7%) |
| 3 Vehicles | 14,661 (24.7%) | 11,399 (21.7%) |
| 4 Vehicles | 6,770 (11.4%) | 5,306 (10.1%) |
| 5 or more Vehicles | 2,889 (4.9%) | 2,416 (4.6%) |
| Total | 59,305 (100.0%) | 52,473 (100.0%) |
Commute Time in Cabarrus County
The most frequently occuring commute durations in Cabarrus County are 30 to 34 minutes (16,663 commuters, 17.4%), 15 to 19 minutes (15,651 commuters, 16.3%), and 20 to 24 minutes (12,767 commuters, 13.3%).
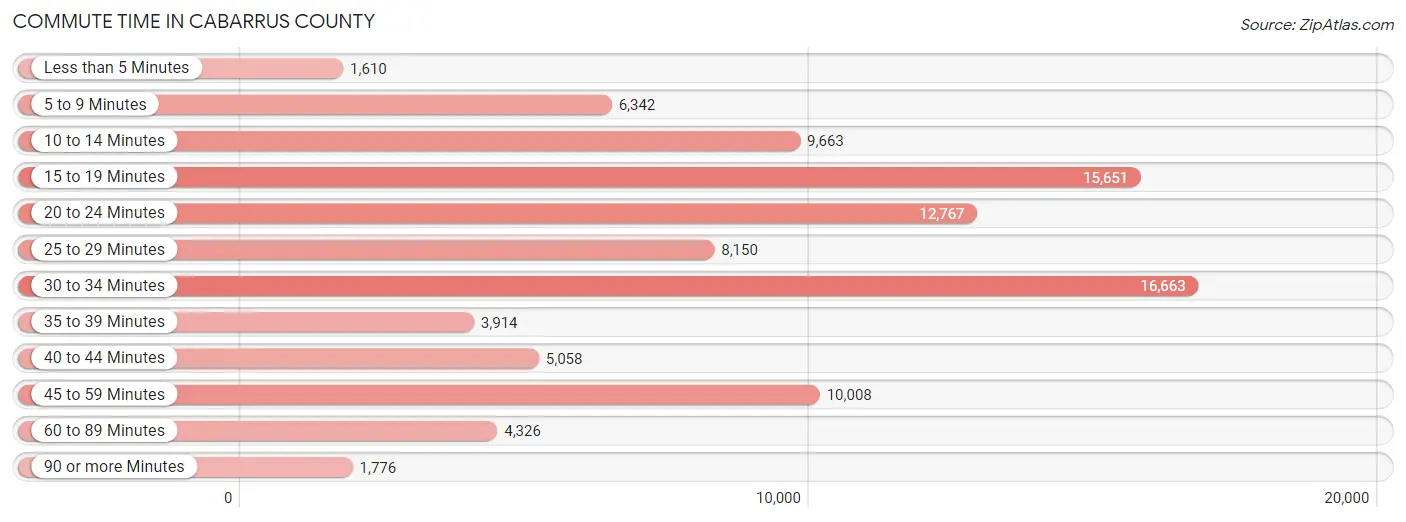
| Commute Time | # Commuters | % Commuters |
| Less than 5 Minutes | 1,610 | 1.7% |
| 5 to 9 Minutes | 6,342 | 6.6% |
| 10 to 14 Minutes | 9,663 | 10.1% |
| 15 to 19 Minutes | 15,651 | 16.3% |
| 20 to 24 Minutes | 12,767 | 13.3% |
| 25 to 29 Minutes | 8,150 | 8.5% |
| 30 to 34 Minutes | 16,663 | 17.4% |
| 35 to 39 Minutes | 3,914 | 4.1% |
| 40 to 44 Minutes | 5,058 | 5.3% |
| 45 to 59 Minutes | 10,008 | 10.4% |
| 60 to 89 Minutes | 4,326 | 4.5% |
| 90 or more Minutes | 1,776 | 1.8% |
Commute Time by Sex in Cabarrus County
The most common commute times in Cabarrus County are 30 to 34 minutes (9,672 commuters, 18.8%) for males and 15 to 19 minutes (7,838 commuters, 17.6%) for females.
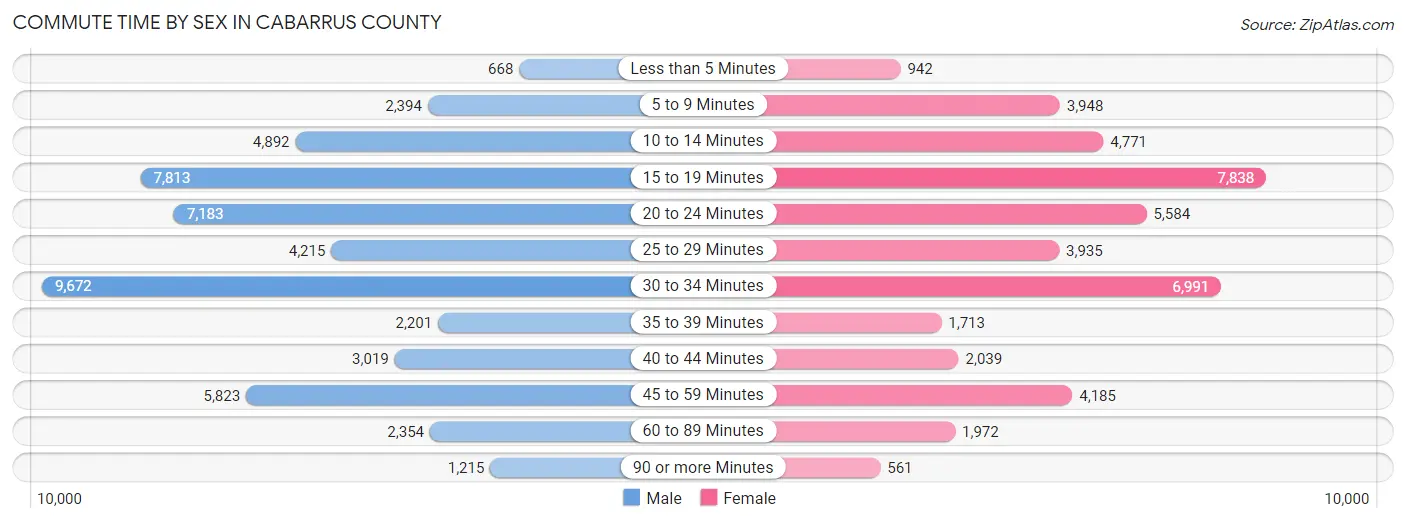
| Commute Time | Male | Female |
| Less than 5 Minutes | 668 (1.3%) | 942 (2.1%) |
| 5 to 9 Minutes | 2,394 (4.6%) | 3,948 (8.9%) |
| 10 to 14 Minutes | 4,892 (9.5%) | 4,771 (10.7%) |
| 15 to 19 Minutes | 7,813 (15.2%) | 7,838 (17.6%) |
| 20 to 24 Minutes | 7,183 (14.0%) | 5,584 (12.6%) |
| 25 to 29 Minutes | 4,215 (8.2%) | 3,935 (8.8%) |
| 30 to 34 Minutes | 9,672 (18.8%) | 6,991 (15.7%) |
| 35 to 39 Minutes | 2,201 (4.3%) | 1,713 (3.8%) |
| 40 to 44 Minutes | 3,019 (5.9%) | 2,039 (4.6%) |
| 45 to 59 Minutes | 5,823 (11.3%) | 4,185 (9.4%) |
| 60 to 89 Minutes | 2,354 (4.6%) | 1,972 (4.4%) |
| 90 or more Minutes | 1,215 (2.4%) | 561 (1.3%) |
Time of Departure to Work by Sex in Cabarrus County
The most frequent times of departure to work in Cabarrus County are 7:00 AM to 7:29 AM (8,198, 15.9%) for males and 7:00 AM to 7:29 AM (7,288, 16.4%) for females.
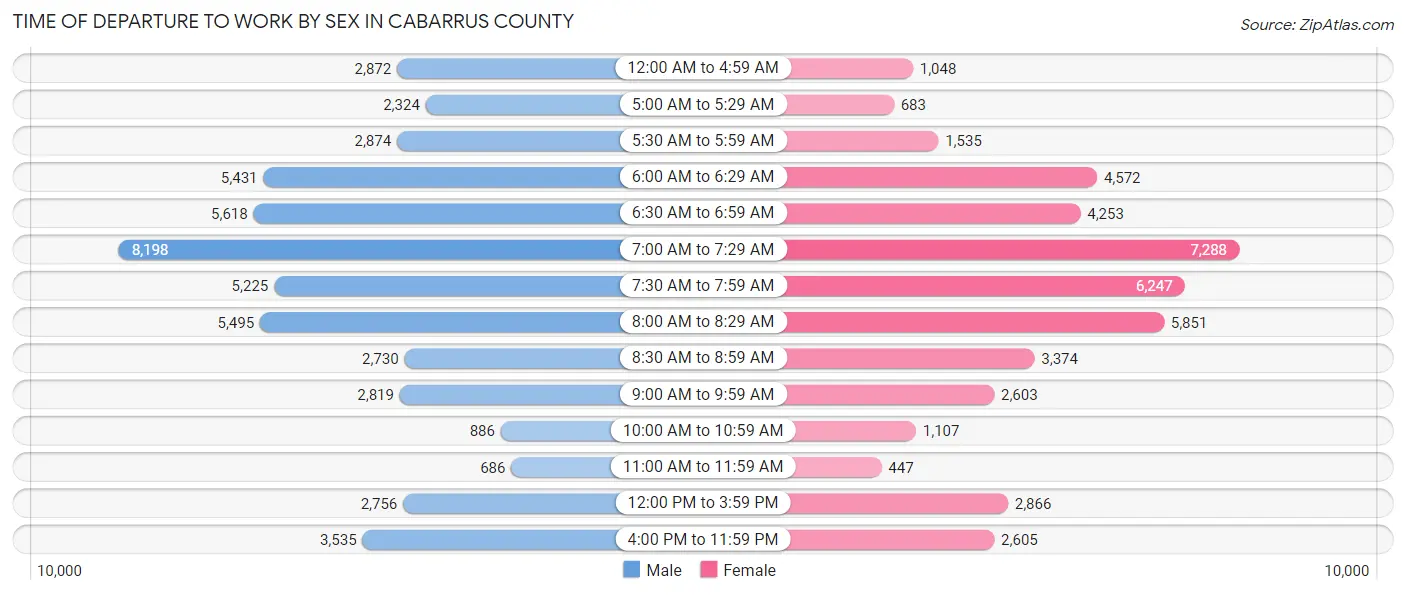
| Time of Departure | Male | Female |
| 12:00 AM to 4:59 AM | 2,872 (5.6%) | 1,048 (2.4%) |
| 5:00 AM to 5:29 AM | 2,324 (4.5%) | 683 (1.5%) |
| 5:30 AM to 5:59 AM | 2,874 (5.6%) | 1,535 (3.5%) |
| 6:00 AM to 6:29 AM | 5,431 (10.6%) | 4,572 (10.3%) |
| 6:30 AM to 6:59 AM | 5,618 (10.9%) | 4,253 (9.6%) |
| 7:00 AM to 7:29 AM | 8,198 (15.9%) | 7,288 (16.4%) |
| 7:30 AM to 7:59 AM | 5,225 (10.2%) | 6,247 (14.0%) |
| 8:00 AM to 8:29 AM | 5,495 (10.7%) | 5,851 (13.2%) |
| 8:30 AM to 8:59 AM | 2,730 (5.3%) | 3,374 (7.6%) |
| 9:00 AM to 9:59 AM | 2,819 (5.5%) | 2,603 (5.9%) |
| 10:00 AM to 10:59 AM | 886 (1.7%) | 1,107 (2.5%) |
| 11:00 AM to 11:59 AM | 686 (1.3%) | 447 (1.0%) |
| 12:00 PM to 3:59 PM | 2,756 (5.4%) | 2,866 (6.4%) |
| 4:00 PM to 11:59 PM | 3,535 (6.9%) | 2,605 (5.9%) |
| Total | 51,449 (100.0%) | 44,479 (100.0%) |
Housing Occupancy in Cabarrus County
Occupancy by Ownership in Cabarrus County
Of the total 76,880 dwellings in Cabarrus County, owner-occupied units account for 56,113 (73.0%), while renter-occupied units make up 20,767 (27.0%).
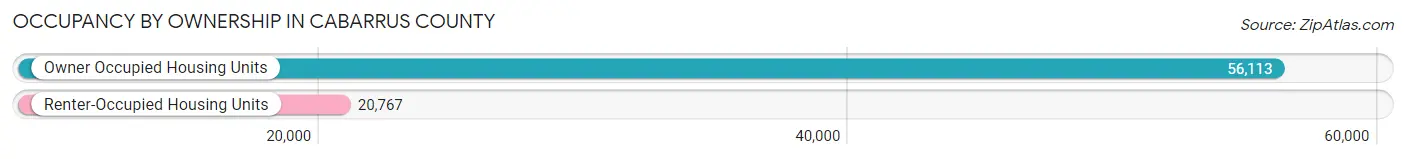
| Occupancy | # Housing Units | % Housing Units |
| Owner Occupied Housing Units | 56,113 | 73.0% |
| Renter-Occupied Housing Units | 20,767 | 27.0% |
| Total Occupied Housing Units | 76,880 | 100.0% |
Occupancy by Household Size in Cabarrus County
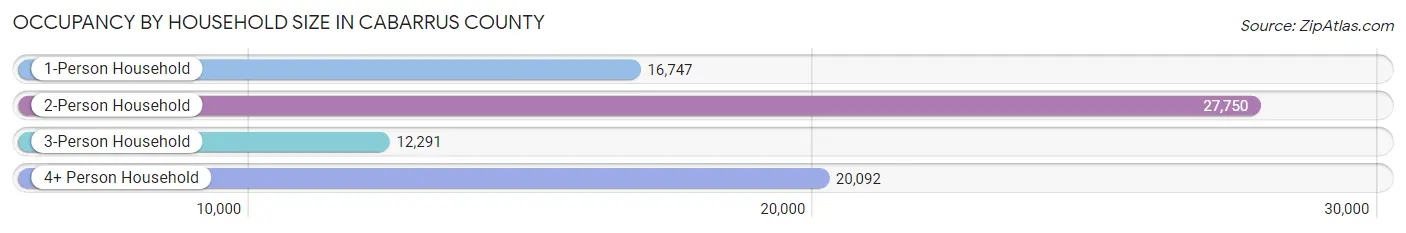
| Household Size | # Housing Units | % Housing Units |
| 1-Person Household | 16,747 | 21.8% |
| 2-Person Household | 27,750 | 36.1% |
| 3-Person Household | 12,291 | 16.0% |
| 4+ Person Household | 20,092 | 26.1% |
| Total Housing Units | 76,880 | 100.0% |
Occupancy by Ownership by Household Size in Cabarrus County
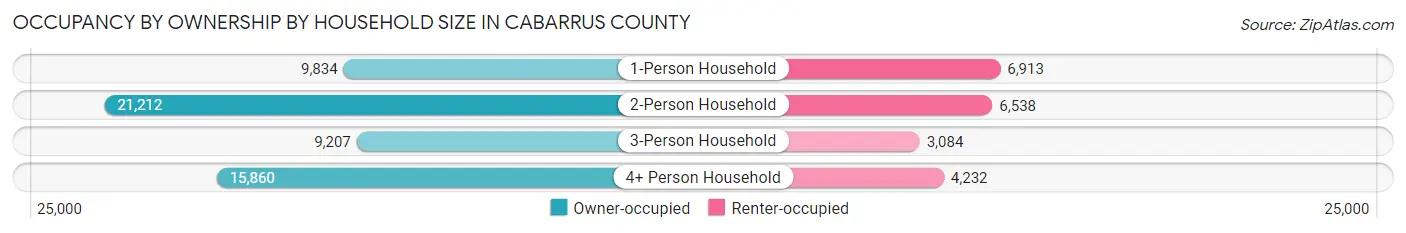
| Household Size | Owner-occupied | Renter-occupied |
| 1-Person Household | 9,834 (58.7%) | 6,913 (41.3%) |
| 2-Person Household | 21,212 (76.4%) | 6,538 (23.6%) |
| 3-Person Household | 9,207 (74.9%) | 3,084 (25.1%) |
| 4+ Person Household | 15,860 (78.9%) | 4,232 (21.1%) |
| Total Housing Units | 56,113 (73.0%) | 20,767 (27.0%) |
Occupancy by Educational Attainment in Cabarrus County
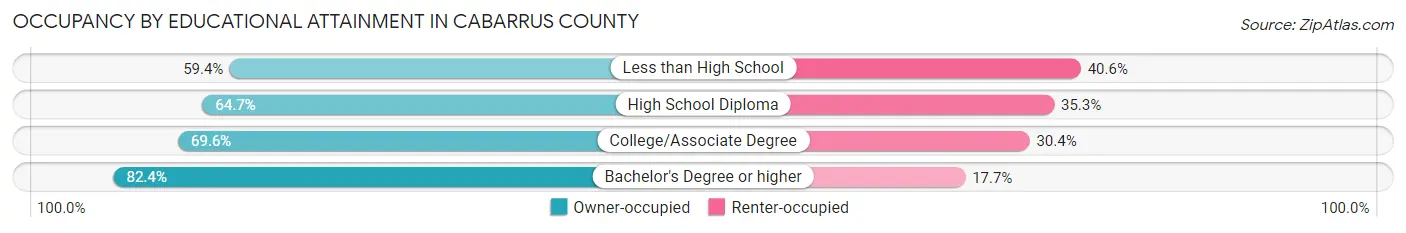
| Household Size | Owner-occupied | Renter-occupied |
| Less than High School | 2,581 (59.4%) | 1,761 (40.6%) |
| High School Diploma | 11,444 (64.7%) | 6,233 (35.3%) |
| College/Associate Degree | 16,857 (69.6%) | 7,364 (30.4%) |
| Bachelor's Degree or higher | 25,231 (82.4%) | 5,409 (17.6%) |
Occupancy by Age of Householder in Cabarrus County
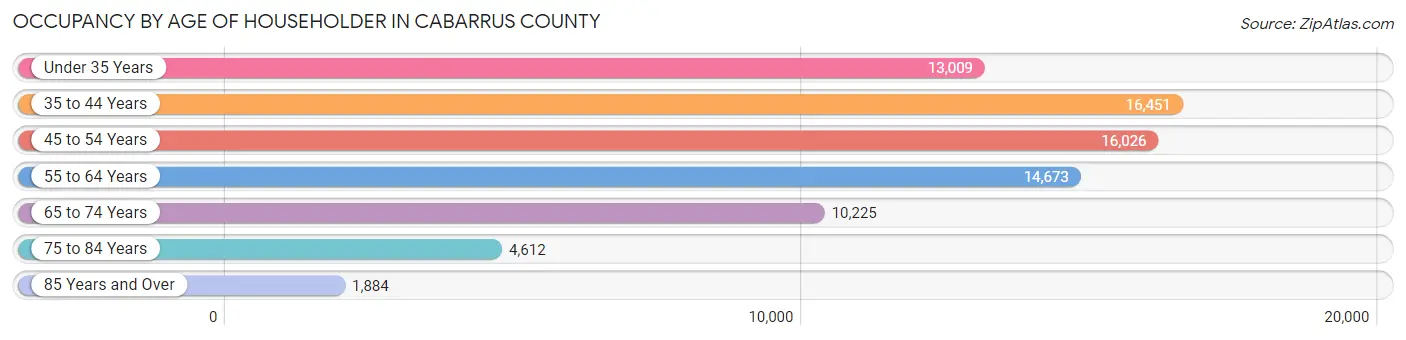
| Age Bracket | # Households | % Households |
| Under 35 Years | 13,009 | 16.9% |
| 35 to 44 Years | 16,451 | 21.4% |
| 45 to 54 Years | 16,026 | 20.8% |
| 55 to 64 Years | 14,673 | 19.1% |
| 65 to 74 Years | 10,225 | 13.3% |
| 75 to 84 Years | 4,612 | 6.0% |
| 85 Years and Over | 1,884 | 2.5% |
| Total | 76,880 | 100.0% |
Housing Finances in Cabarrus County
Median Income by Occupancy in Cabarrus County
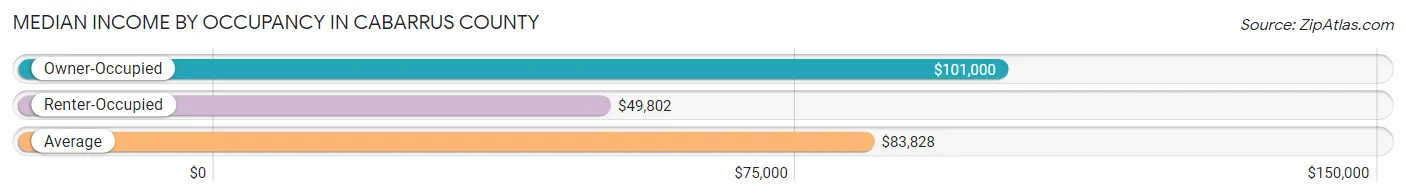
| Occupancy Type | # Households | Median Income |
| Owner-Occupied | 56,113 (73.0%) | $101,000 |
| Renter-Occupied | 20,767 (27.0%) | $49,802 |
| Average | 76,880 (100.0%) | $83,828 |
Occupancy by Householder Income Bracket in Cabarrus County
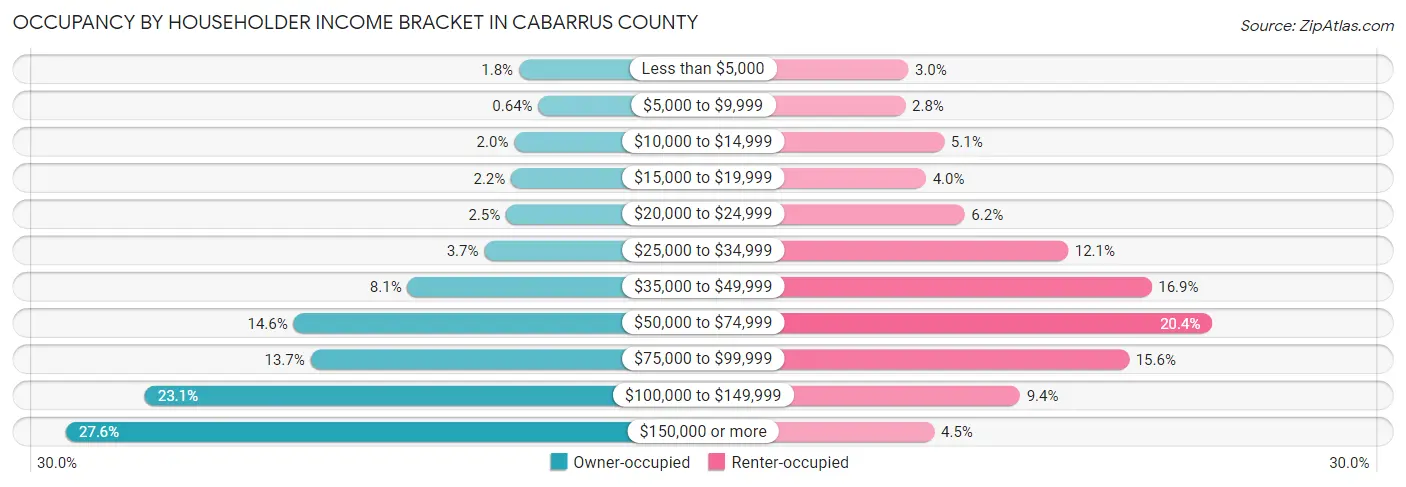
| Income Bracket | Owner-occupied | Renter-occupied |
| Less than $5,000 | 982 (1.8%) | 624 (3.0%) |
| $5,000 to $9,999 | 360 (0.6%) | 588 (2.8%) |
| $10,000 to $14,999 | 1,136 (2.0%) | 1,048 (5.1%) |
| $15,000 to $19,999 | 1,234 (2.2%) | 832 (4.0%) |
| $20,000 to $24,999 | 1,397 (2.5%) | 1,291 (6.2%) |
| $25,000 to $34,999 | 2,092 (3.7%) | 2,519 (12.1%) |
| $35,000 to $49,999 | 4,554 (8.1%) | 3,510 (16.9%) |
| $50,000 to $74,999 | 8,208 (14.6%) | 4,233 (20.4%) |
| $75,000 to $99,999 | 7,666 (13.7%) | 3,242 (15.6%) |
| $100,000 to $149,999 | 12,977 (23.1%) | 1,948 (9.4%) |
| $150,000 or more | 15,507 (27.6%) | 932 (4.5%) |
| Total | 56,113 (100.0%) | 20,767 (100.0%) |
Monthly Housing Cost Tiers in Cabarrus County
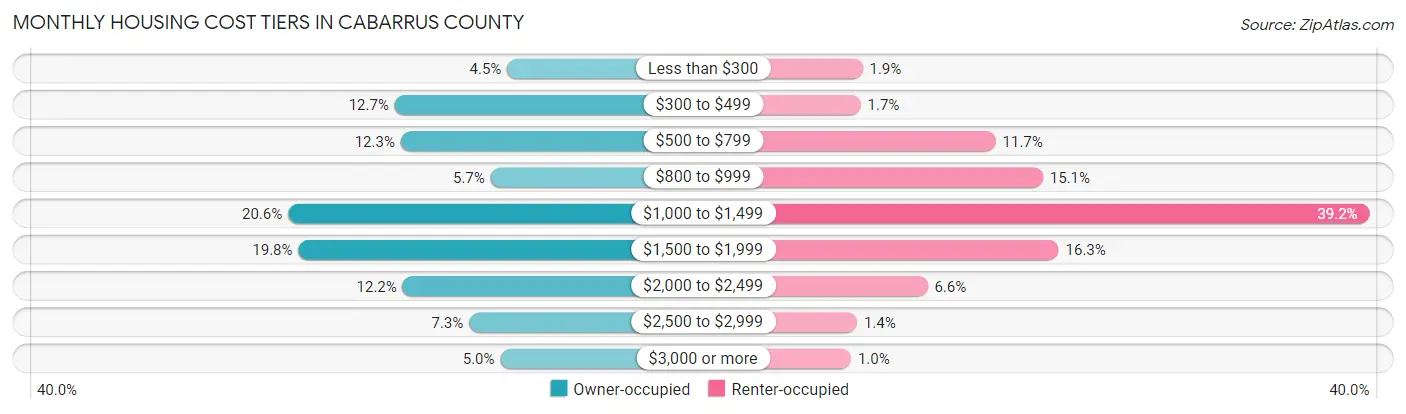
| Monthly Cost | Owner-occupied | Renter-occupied |
| Less than $300 | 2,500 (4.5%) | 385 (1.8%) |
| $300 to $499 | 7,151 (12.7%) | 356 (1.7%) |
| $500 to $799 | 6,902 (12.3%) | 2,420 (11.7%) |
| $800 to $999 | 3,185 (5.7%) | 3,142 (15.1%) |
| $1,000 to $1,499 | 11,561 (20.6%) | 8,137 (39.2%) |
| $1,500 to $1,999 | 11,133 (19.8%) | 3,383 (16.3%) |
| $2,000 to $2,499 | 6,826 (12.2%) | 1,376 (6.6%) |
| $2,500 to $2,999 | 4,071 (7.3%) | 299 (1.4%) |
| $3,000 or more | 2,784 (5.0%) | 208 (1.0%) |
| Total | 56,113 (100.0%) | 20,767 (100.0%) |
Physical Housing Characteristics in Cabarrus County
Housing Structures in Cabarrus County
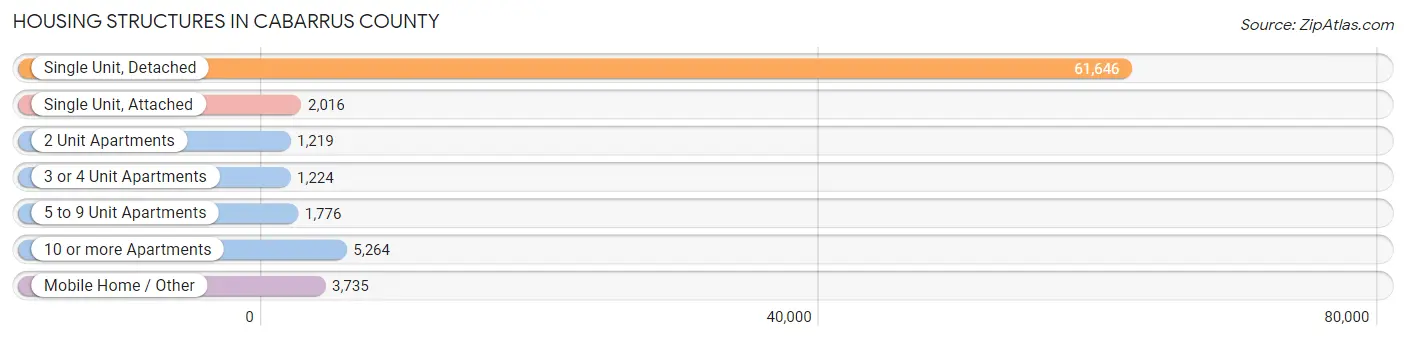
| Structure Type | # Housing Units | % Housing Units |
| Single Unit, Detached | 61,646 | 80.2% |
| Single Unit, Attached | 2,016 | 2.6% |
| 2 Unit Apartments | 1,219 | 1.6% |
| 3 or 4 Unit Apartments | 1,224 | 1.6% |
| 5 to 9 Unit Apartments | 1,776 | 2.3% |
| 10 or more Apartments | 5,264 | 6.9% |
| Mobile Home / Other | 3,735 | 4.9% |
| Total | 76,880 | 100.0% |
Housing Structures by Occupancy in Cabarrus County
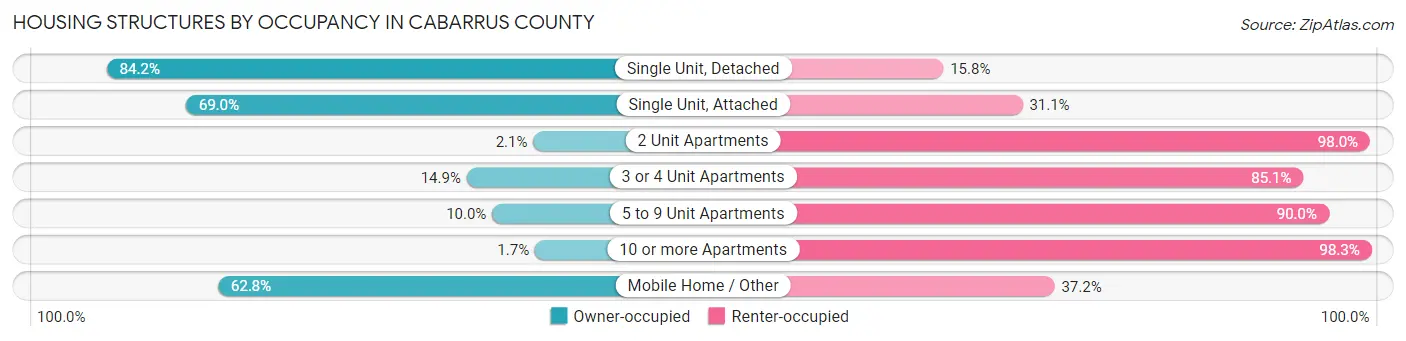
| Structure Type | Owner-occupied | Renter-occupied |
| Single Unit, Detached | 51,903 (84.2%) | 9,743 (15.8%) |
| Single Unit, Attached | 1,390 (69.0%) | 626 (31.0%) |
| 2 Unit Apartments | 25 (2.1%) | 1,194 (98.0%) |
| 3 or 4 Unit Apartments | 182 (14.9%) | 1,042 (85.1%) |
| 5 to 9 Unit Apartments | 177 (10.0%) | 1,599 (90.0%) |
| 10 or more Apartments | 91 (1.7%) | 5,173 (98.3%) |
| Mobile Home / Other | 2,345 (62.8%) | 1,390 (37.2%) |
| Total | 56,113 (73.0%) | 20,767 (27.0%) |
Housing Structures by Number of Rooms in Cabarrus County
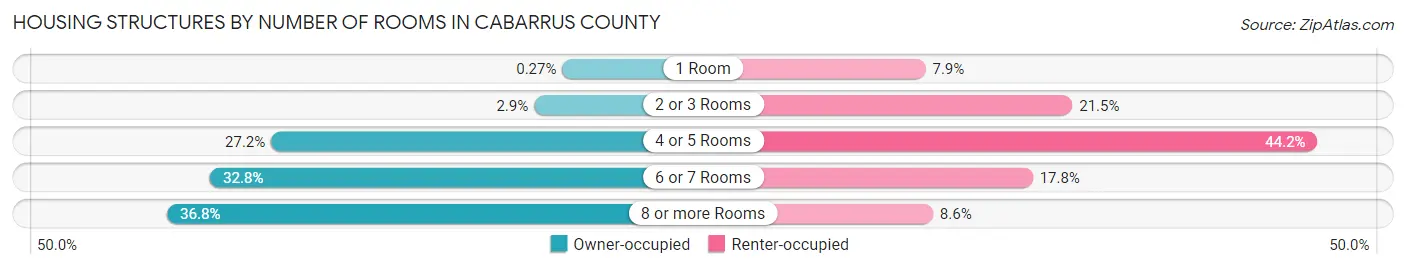
| Number of Rooms | Owner-occupied | Renter-occupied |
| 1 Room | 153 (0.3%) | 1,645 (7.9%) |
| 2 or 3 Rooms | 1,616 (2.9%) | 4,463 (21.5%) |
| 4 or 5 Rooms | 15,262 (27.2%) | 9,171 (44.2%) |
| 6 or 7 Rooms | 18,425 (32.8%) | 3,702 (17.8%) |
| 8 or more Rooms | 20,657 (36.8%) | 1,786 (8.6%) |
| Total | 56,113 (100.0%) | 20,767 (100.0%) |
Housing Structure by Heating Type in Cabarrus County
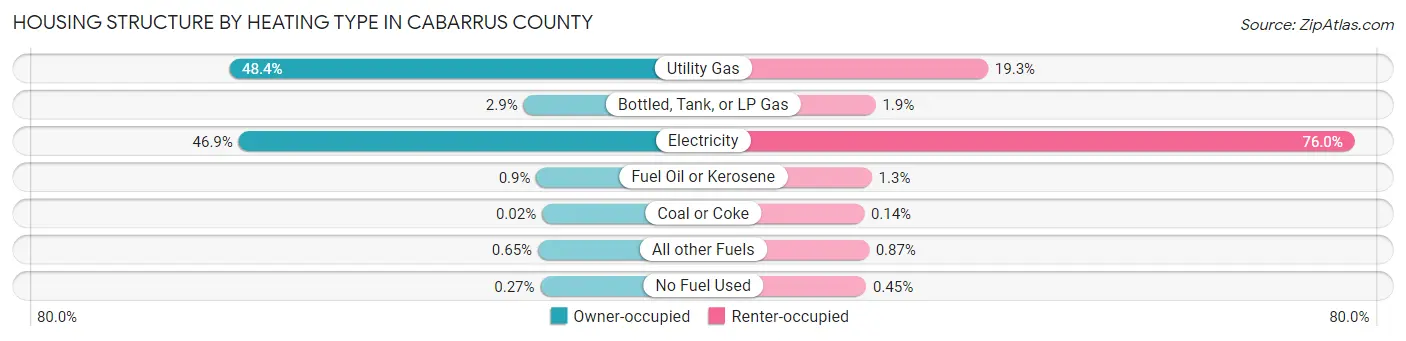
| Heating Type | Owner-occupied | Renter-occupied |
| Utility Gas | 27,142 (48.4%) | 4,007 (19.3%) |
| Bottled, Tank, or LP Gas | 1,617 (2.9%) | 398 (1.9%) |
| Electricity | 26,326 (46.9%) | 15,781 (76.0%) |
| Fuel Oil or Kerosene | 505 (0.9%) | 277 (1.3%) |
| Coal or Coke | 9 (0.0%) | 30 (0.1%) |
| All other Fuels | 363 (0.6%) | 181 (0.9%) |
| No Fuel Used | 151 (0.3%) | 93 (0.4%) |
| Total | 56,113 (100.0%) | 20,767 (100.0%) |
Household Vehicle Usage in Cabarrus County
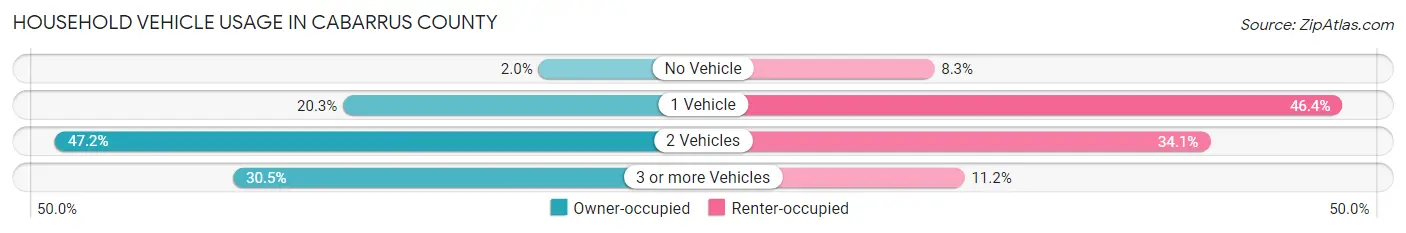
| Vehicles per Household | Owner-occupied | Renter-occupied |
| No Vehicle | 1,140 (2.0%) | 1,731 (8.3%) |
| 1 Vehicle | 11,376 (20.3%) | 9,640 (46.4%) |
| 2 Vehicles | 26,458 (47.1%) | 7,079 (34.1%) |
| 3 or more Vehicles | 17,139 (30.5%) | 2,317 (11.2%) |
| Total | 56,113 (100.0%) | 20,767 (100.0%) |
Real Estate & Mortgages in Cabarrus County
Real Estate and Mortgage Overview in Cabarrus County
| Characteristic | Without Mortgage | With Mortgage |
| Housing Units | 16,415 | 39,698 |
| Median Property Value | $231,900 | $302,800 |
| Median Household Income | $64,565 | $12,557 |
| Monthly Housing Costs | $471 | $2,669 |
| Real Estate Taxes | $1,861 | $519 |
Property Value by Mortgage Status in Cabarrus County
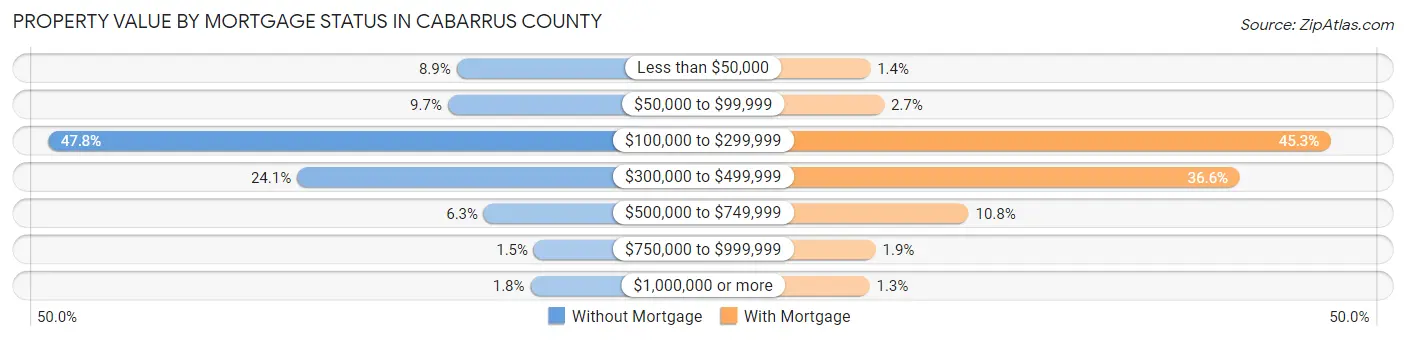
| Property Value | Without Mortgage | With Mortgage |
| Less than $50,000 | 1,455 (8.9%) | 555 (1.4%) |
| $50,000 to $99,999 | 1,593 (9.7%) | 1,075 (2.7%) |
| $100,000 to $299,999 | 7,843 (47.8%) | 17,981 (45.3%) |
| $300,000 to $499,999 | 3,950 (24.1%) | 14,529 (36.6%) |
| $500,000 to $749,999 | 1,028 (6.3%) | 4,270 (10.8%) |
| $750,000 to $999,999 | 246 (1.5%) | 760 (1.9%) |
| $1,000,000 or more | 300 (1.8%) | 528 (1.3%) |
| Total | 16,415 (100.0%) | 39,698 (100.0%) |
Household Income by Mortgage Status in Cabarrus County
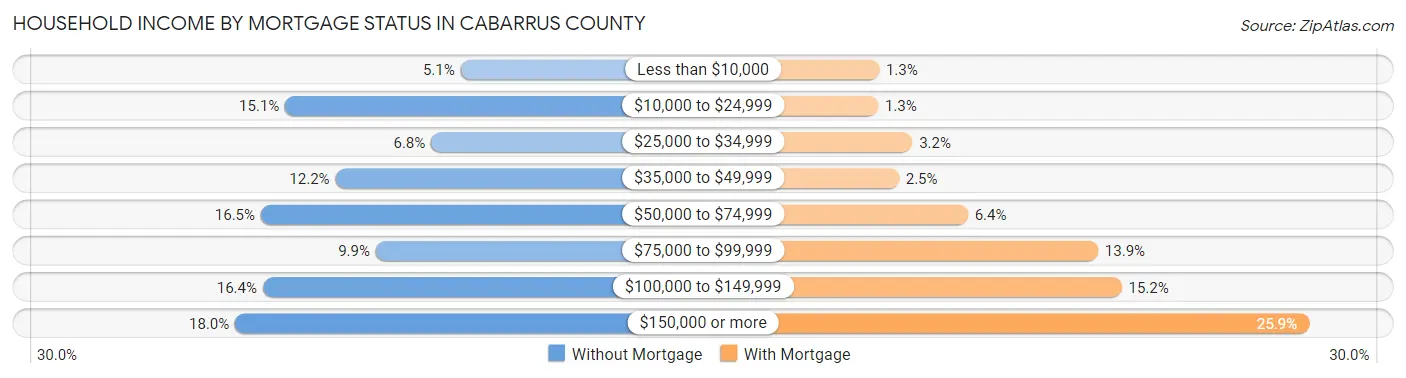
| Household Income | Without Mortgage | With Mortgage |
| Less than $10,000 | 835 (5.1%) | 530 (1.3%) |
| $10,000 to $24,999 | 2,481 (15.1%) | 507 (1.3%) |
| $25,000 to $34,999 | 1,111 (6.8%) | 1,286 (3.2%) |
| $35,000 to $49,999 | 2,009 (12.2%) | 981 (2.5%) |
| $50,000 to $74,999 | 2,708 (16.5%) | 2,545 (6.4%) |
| $75,000 to $99,999 | 1,630 (9.9%) | 5,500 (13.9%) |
| $100,000 to $149,999 | 2,691 (16.4%) | 6,036 (15.2%) |
| $150,000 or more | 2,950 (18.0%) | 10,286 (25.9%) |
| Total | 16,415 (100.0%) | 39,698 (100.0%) |
Property Value to Household Income Ratio in Cabarrus County
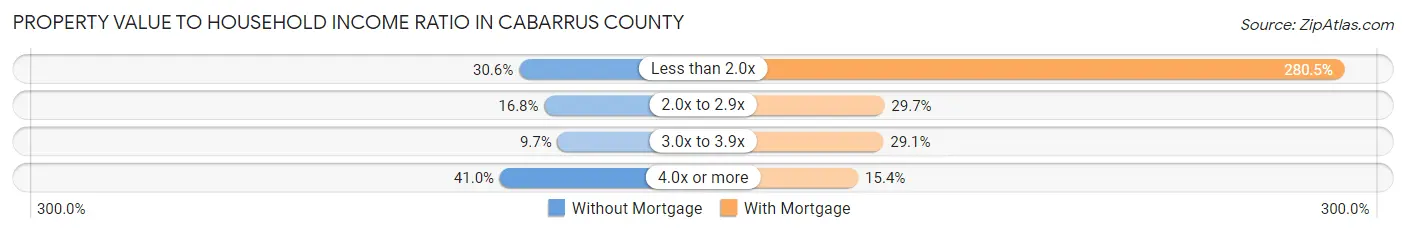
| Value-to-Income Ratio | Without Mortgage | With Mortgage |
| Less than 2.0x | 5,026 (30.6%) | 111,352 (280.5%) |
| 2.0x to 2.9x | 2,761 (16.8%) | 11,782 (29.7%) |
| 3.0x to 3.9x | 1,584 (9.7%) | 11,539 (29.1%) |
| 4.0x or more | 6,736 (41.0%) | 6,110 (15.4%) |
| Total | 16,415 (100.0%) | 39,698 (100.0%) |
Real Estate Taxes by Mortgage Status in Cabarrus County
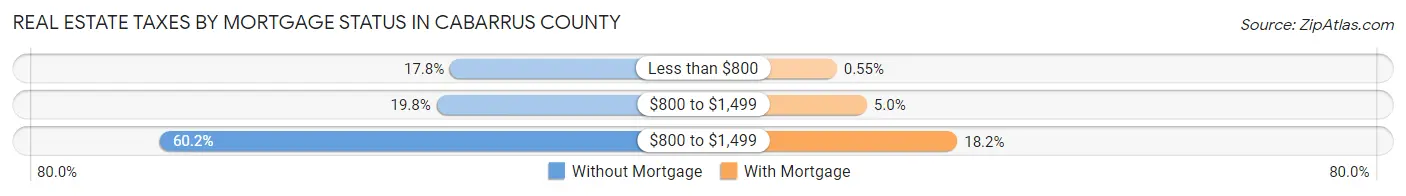
| Property Taxes | Without Mortgage | With Mortgage |
| Less than $800 | 2,926 (17.8%) | 217 (0.5%) |
| $800 to $1,499 | 3,252 (19.8%) | 1,964 (5.0%) |
| $800 to $1,499 | 9,884 (60.2%) | 7,208 (18.2%) |
| Total | 16,415 (100.0%) | 39,698 (100.0%) |
Health & Disability in Cabarrus County
Health Insurance Coverage by Age in Cabarrus County
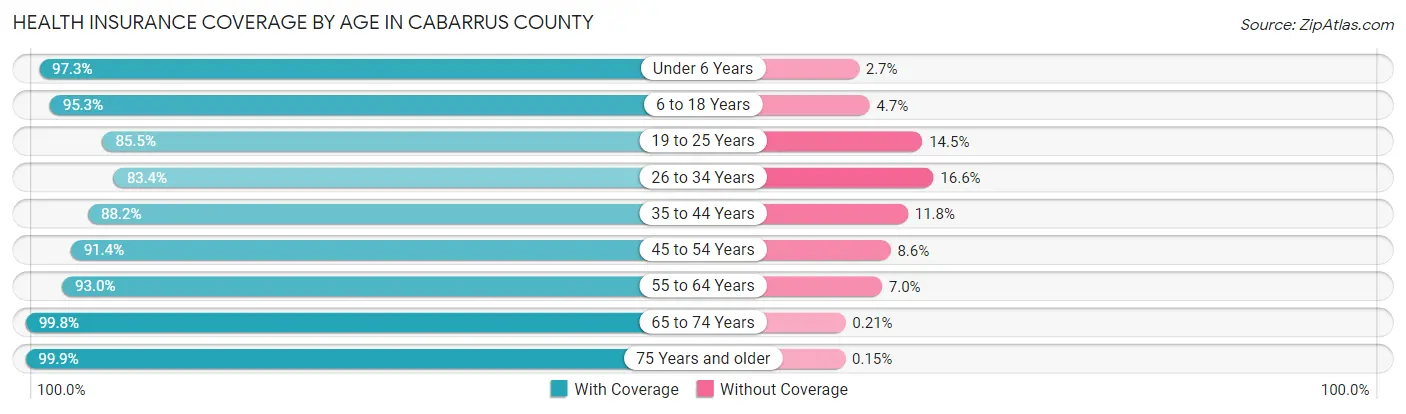
| Age Bracket | With Coverage | Without Coverage |
| Under 6 Years | 16,154 (97.3%) | 449 (2.7%) |
| 6 to 18 Years | 41,725 (95.3%) | 2,060 (4.7%) |
| 19 to 25 Years | 15,381 (85.5%) | 2,614 (14.5%) |
| 26 to 34 Years | 21,211 (83.4%) | 4,227 (16.6%) |
| 35 to 44 Years | 28,763 (88.2%) | 3,863 (11.8%) |
| 45 to 54 Years | 29,486 (91.4%) | 2,778 (8.6%) |
| 55 to 64 Years | 24,710 (93.0%) | 1,864 (7.0%) |
| 65 to 74 Years | 18,021 (99.8%) | 38 (0.2%) |
| 75 Years and older | 11,357 (99.9%) | 17 (0.2%) |
| Total | 206,808 (92.0%) | 17,910 (8.0%) |
Health Insurance Coverage by Citizenship Status in Cabarrus County
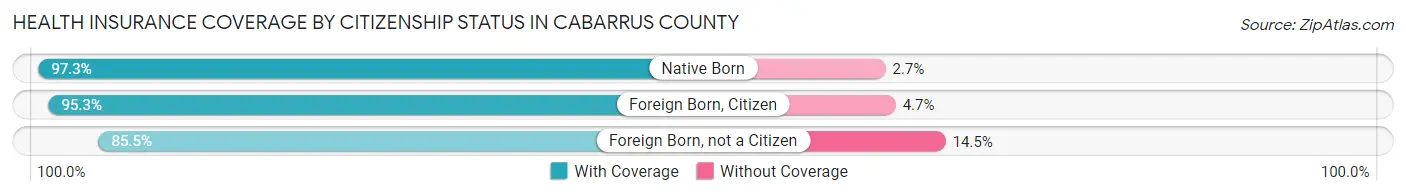
| Citizenship Status | With Coverage | Without Coverage |
| Native Born | 16,154 (97.3%) | 449 (2.7%) |
| Foreign Born, Citizen | 41,725 (95.3%) | 2,060 (4.7%) |
| Foreign Born, not a Citizen | 15,381 (85.5%) | 2,614 (14.5%) |
Health Insurance Coverage by Household Income in Cabarrus County
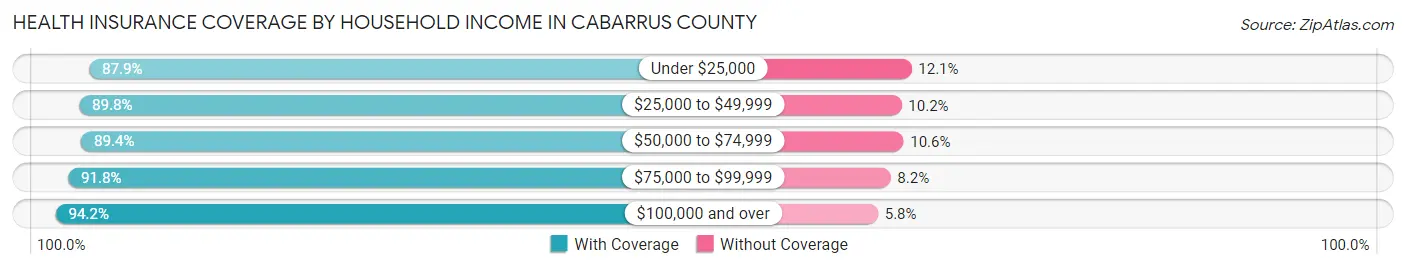
| Household Income | With Coverage | Without Coverage |
| Under $25,000 | 15,807 (87.9%) | 2,176 (12.1%) |
| $25,000 to $49,999 | 27,244 (89.8%) | 3,104 (10.2%) |
| $50,000 to $74,999 | 29,744 (89.4%) | 3,519 (10.6%) |
| $75,000 to $99,999 | 32,076 (91.8%) | 2,854 (8.2%) |
| $100,000 and over | 101,548 (94.2%) | 6,250 (5.8%) |
Public vs Private Health Insurance Coverage by Age in Cabarrus County
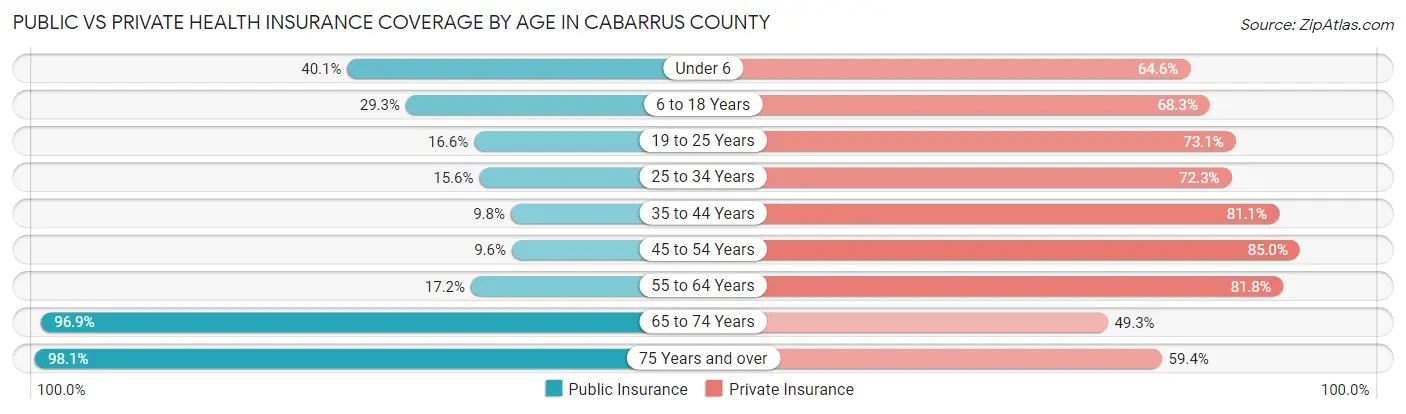
| Age Bracket | Public Insurance | Private Insurance |
| Under 6 | 6,659 (40.1%) | 10,731 (64.6%) |
| 6 to 18 Years | 12,806 (29.2%) | 29,899 (68.3%) |
| 19 to 25 Years | 2,982 (16.6%) | 13,151 (73.1%) |
| 25 to 34 Years | 3,969 (15.6%) | 18,393 (72.3%) |
| 35 to 44 Years | 3,183 (9.8%) | 26,467 (81.1%) |
| 45 to 54 Years | 3,087 (9.6%) | 27,427 (85.0%) |
| 55 to 64 Years | 4,564 (17.2%) | 21,749 (81.8%) |
| 65 to 74 Years | 17,498 (96.9%) | 8,905 (49.3%) |
| 75 Years and over | 11,152 (98.1%) | 6,753 (59.4%) |
| Total | 65,900 (29.3%) | 163,475 (72.8%) |
Disability Status by Sex by Age in Cabarrus County
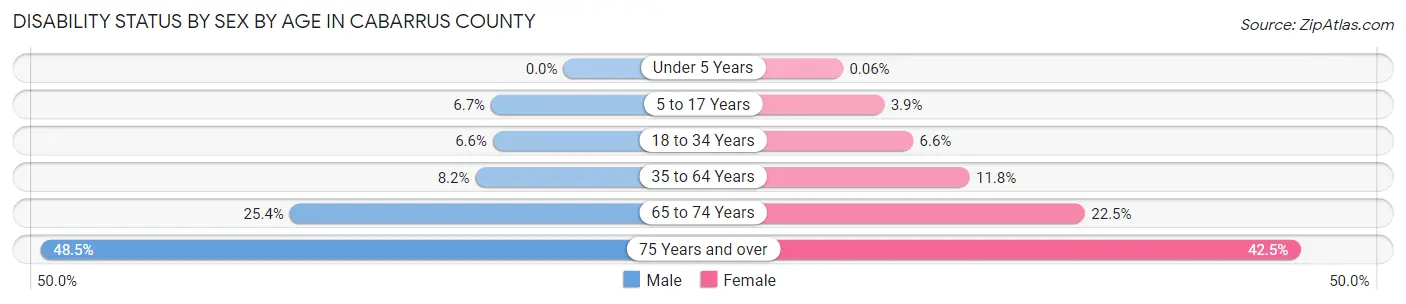
| Age Bracket | Male | Female |
| Under 5 Years | 0 (0.0%) | 4 (0.1%) |
| 5 to 17 Years | 1,495 (6.7%) | 815 (3.9%) |
| 18 to 34 Years | 1,520 (6.6%) | 1,549 (6.6%) |
| 35 to 64 Years | 3,668 (8.2%) | 5,501 (11.8%) |
| 65 to 74 Years | 2,105 (25.4%) | 2,200 (22.5%) |
| 75 Years and over | 2,292 (48.5%) | 2,830 (42.5%) |
Disability Class by Sex by Age in Cabarrus County
Disability Class: Hearing Difficulty
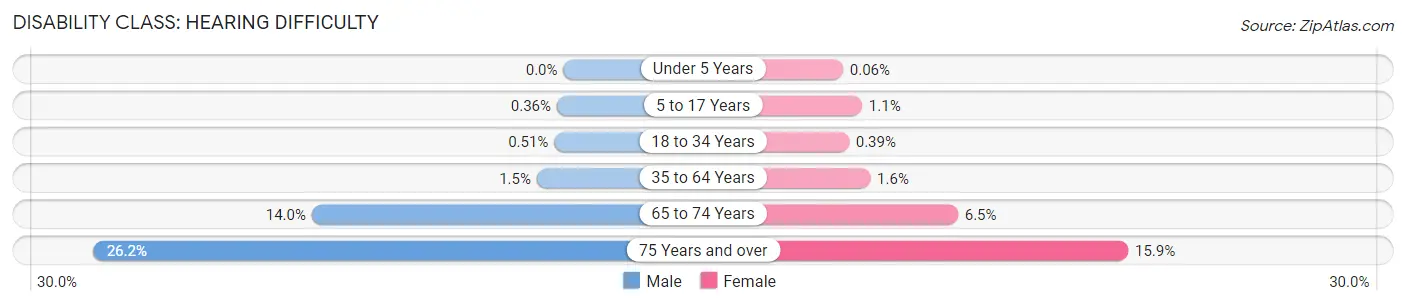
| Age Bracket | Male | Female |
| Under 5 Years | 0 (0.0%) | 4 (0.1%) |
| 5 to 17 Years | 80 (0.4%) | 235 (1.1%) |
| 18 to 34 Years | 119 (0.5%) | 91 (0.4%) |
| 35 to 64 Years | 663 (1.5%) | 734 (1.6%) |
| 65 to 74 Years | 1,161 (14.0%) | 631 (6.5%) |
| 75 Years and over | 1,235 (26.2%) | 1,060 (15.9%) |
Disability Class: Vision Difficulty
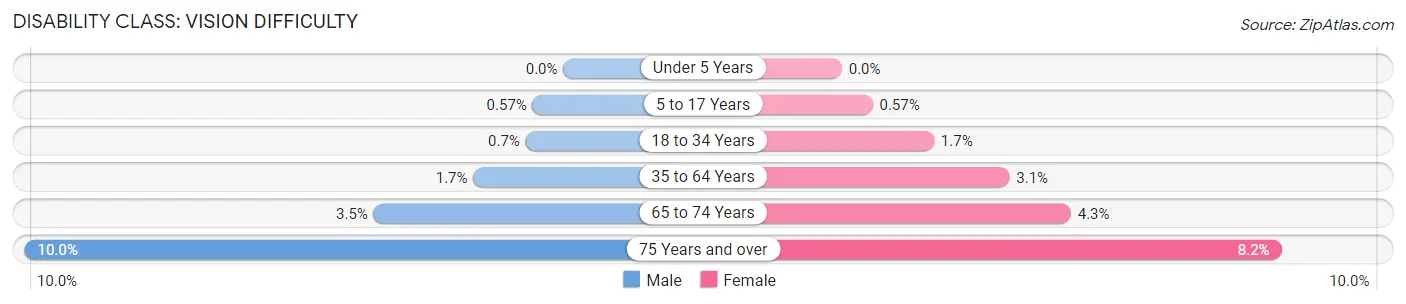
| Age Bracket | Male | Female |
| Under 5 Years | 0 (0.0%) | 0 (0.0%) |
| 5 to 17 Years | 127 (0.6%) | 119 (0.6%) |
| 18 to 34 Years | 162 (0.7%) | 404 (1.7%) |
| 35 to 64 Years | 751 (1.7%) | 1,450 (3.1%) |
| 65 to 74 Years | 292 (3.5%) | 415 (4.3%) |
| 75 Years and over | 472 (10.0%) | 543 (8.2%) |
Disability Class: Cognitive Difficulty
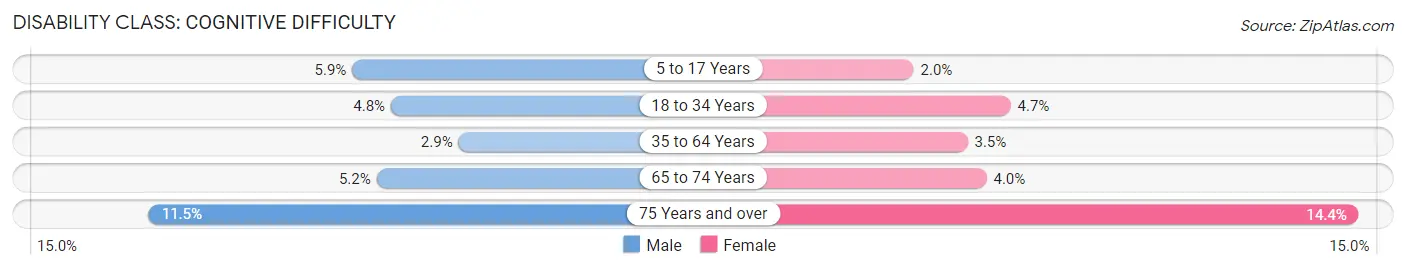
| Age Bracket | Male | Female |
| 5 to 17 Years | 1,308 (5.9%) | 420 (2.0%) |
| 18 to 34 Years | 1,113 (4.8%) | 1,108 (4.7%) |
| 35 to 64 Years | 1,313 (2.9%) | 1,631 (3.5%) |
| 65 to 74 Years | 431 (5.2%) | 394 (4.0%) |
| 75 Years and over | 545 (11.5%) | 957 (14.4%) |
Disability Class: Ambulatory Difficulty
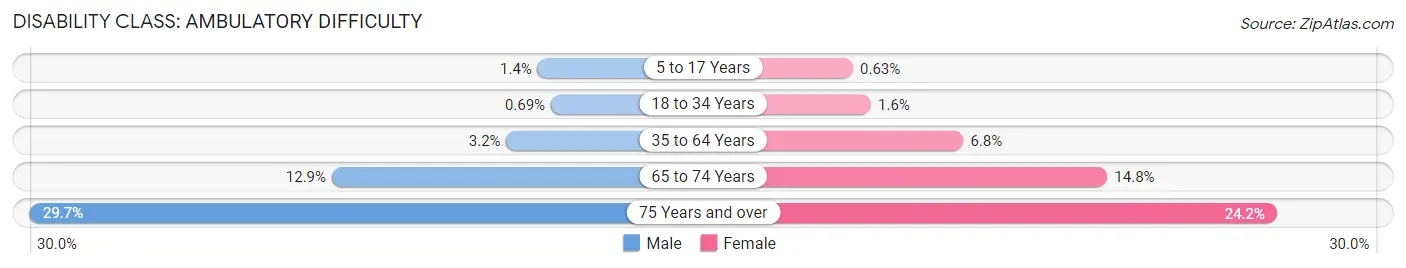
| Age Bracket | Male | Female |
| 5 to 17 Years | 319 (1.4%) | 133 (0.6%) |
| 18 to 34 Years | 160 (0.7%) | 385 (1.6%) |
| 35 to 64 Years | 1,421 (3.2%) | 3,155 (6.8%) |
| 65 to 74 Years | 1,068 (12.9%) | 1,445 (14.8%) |
| 75 Years and over | 1,403 (29.7%) | 1,611 (24.2%) |
Disability Class: Self-Care Difficulty
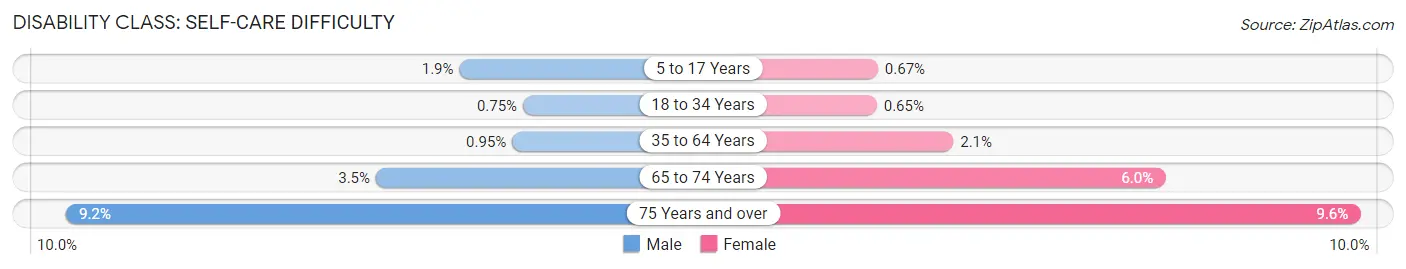
| Age Bracket | Male | Female |
| 5 to 17 Years | 430 (1.9%) | 141 (0.7%) |
| 18 to 34 Years | 175 (0.7%) | 154 (0.6%) |
| 35 to 64 Years | 425 (0.9%) | 963 (2.1%) |
| 65 to 74 Years | 288 (3.5%) | 586 (6.0%) |
| 75 Years and over | 436 (9.2%) | 640 (9.6%) |
Technology Access in Cabarrus County
Computing Device Access in Cabarrus County
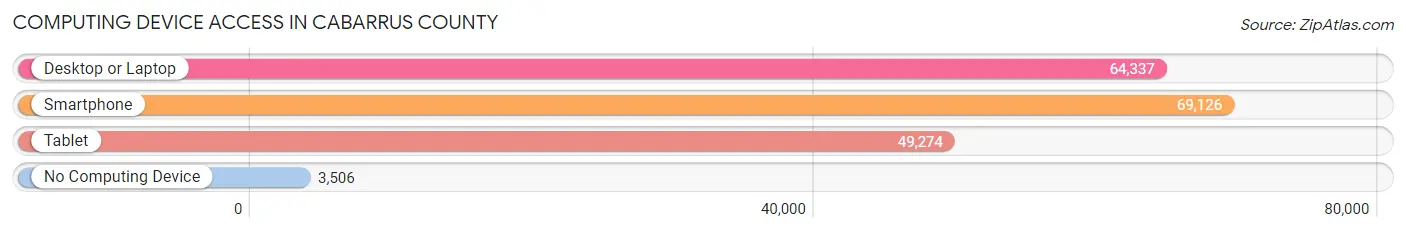
| Device Type | # Households | % Households |
| Desktop or Laptop | 64,337 | 83.7% |
| Smartphone | 69,126 | 89.9% |
| Tablet | 49,274 | 64.1% |
| No Computing Device | 3,506 | 4.6% |
| Total | 76,880 | 100.0% |
Internet Access in Cabarrus County
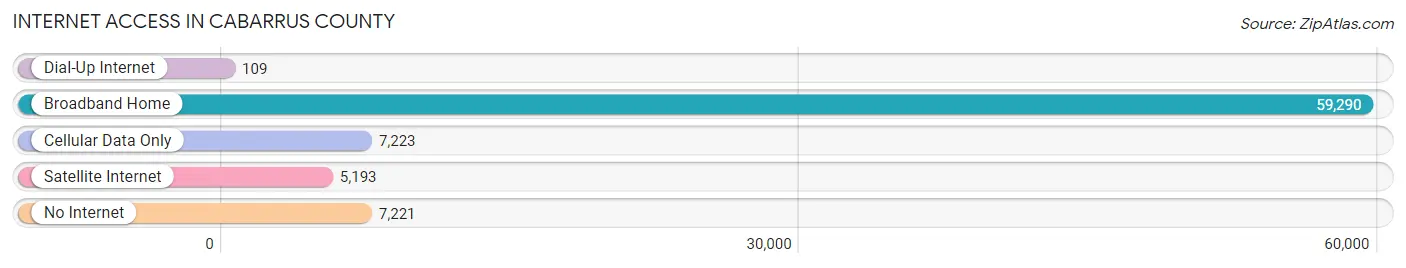
| Internet Type | # Households | % Households |
| Dial-Up Internet | 109 | 0.1% |
| Broadband Home | 59,290 | 77.1% |
| Cellular Data Only | 7,223 | 9.4% |
| Satellite Internet | 5,193 | 6.8% |
| No Internet | 7,221 | 9.4% |
| Total | 76,880 | 100.0% |
Cabarrus County Summary
Cabarrus County is located in the central part of North Carolina, and is part of the Charlotte metropolitan area. It is bordered by Mecklenburg, Union, Stanly, Rowan, and Iredell counties. The county seat is Concord, and the largest city is Kannapolis. The county was formed in 1792 from Mecklenburg County and was named after Stephen Cabarrus, a member of the North Carolina General Assembly.
Geography
Cabarrus County covers an area of 517 square miles, of which 514 square miles is land and 3 square miles is water. The county is located in the Piedmont region of North Carolina, and is characterized by rolling hills and flat plains. The county is drained by the Rocky River, which flows through the center of the county. The county is also home to several lakes, including Lake Concord, Lake Fisher, and Lake Corriher.
The climate of Cabarrus County is humid subtropical, with hot, humid summers and mild winters. The average annual temperature is around 61°F, and the average annual precipitation is around 44 inches.
Demographics
As of the 2010 census, Cabarrus County had a population of 178,011. The racial makeup of the county was 79.2% White, 14.3% African American, 0.5% Native American, 2.3% Asian, 0.1% Pacific Islander, 2.2% from other races, and 1.5% from two or more races. Hispanic or Latino of any race were 5.2% of the population.
The median household income in Cabarrus County was $54,945, and the median family income was $63,945. The per capita income was $25,945. About 8.7% of families and 11.2% of the population were below the poverty line.
Economy
Cabarrus County has a diverse economy, with a mix of manufacturing, agriculture, and services. The county is home to several major employers, including Continental Tire, Duke Energy, and Lowe's. The county is also home to several universities and colleges, including the University of North Carolina at Charlotte, Central Piedmont Community College, and Johnson C. Smith University.
Agriculture is an important part of the economy in Cabarrus County. The county is home to several large farms, and the main crops grown in the county are corn, soybeans, wheat, and hay. Livestock production is also important, with cattle, hogs, and poultry being the main animals raised.
The county is also home to several tourist attractions, including the North Carolina Music Hall of Fame, the Charlotte Motor Speedway, and the Carolina Renaissance Festival.
Conclusion
Cabarrus County is a vibrant and diverse county located in the central part of North Carolina. The county is home to a diverse economy, with a mix of manufacturing, agriculture, and services. The county is also home to several tourist attractions, and is a popular destination for visitors from all over the world.
Common Questions
What is the Total Population of Cabarrus County?
Total Population of Cabarrus County is 226,396.
What is the Total Male Population of Cabarrus County?
Total Male Population of Cabarrus County is 111,333.
What is the Total Female Population of Cabarrus County?
Total Female Population of Cabarrus County is 115,063.
What is the Ratio of Males per 100 Females in Cabarrus County?
There are 96.76 Males per 100 Females in Cabarrus County.
What is the Ratio of Females per 100 Males in Cabarrus County?
There are 103.35 Females per 100 Males in Cabarrus County.
What is the Median Population Age in Cabarrus County?
Median Population Age in Cabarrus County is 37.6 Years.
What is the Average Family Size in Cabarrus County
Average Family Size in Cabarrus County is 3.5 People.
What is the Average Household Size in Cabarrus County
Average Household Size in Cabarrus County is 2.9 People.
What is Per Capita Income in Cabarrus County?
Per Capita income in Cabarrus County is $38,690.
What is the Median Family Income in Cabarrus County?
Median Family Income in Cabarrus County is $99,008.
What is the Median Household income in Cabarrus County?
Median Household Income in Cabarrus County is $83,828.
What is Income or Wage Gap in Cabarrus County?
Income or Wage Gap in Cabarrus County is 24.9%.
Women in Cabarrus County earn 75.1 cents for every dollar earned by a man.
What is Family Income Deficit in Cabarrus County?
Family Income Deficit in Cabarrus County is $9,753.
Families that are below poverty line in Cabarrus County earn $9,753 less on average than the poverty threshold level.
What is Inequality or Gini Index in Cabarrus County?
Inequality or Gini Index in Cabarrus County is 0.43.
How Large is the Labor Force in Cabarrus County?
There are 119,661 People in the Labor Forcein in Cabarrus County.
What is the Percentage of People in the Labor Force in Cabarrus County?
67.8% of People are in the Labor Force in Cabarrus County.
What is the Unemployment Rate in Cabarrus County?
Unemployment Rate in Cabarrus County is 4.9%.