Buncombe County, NC
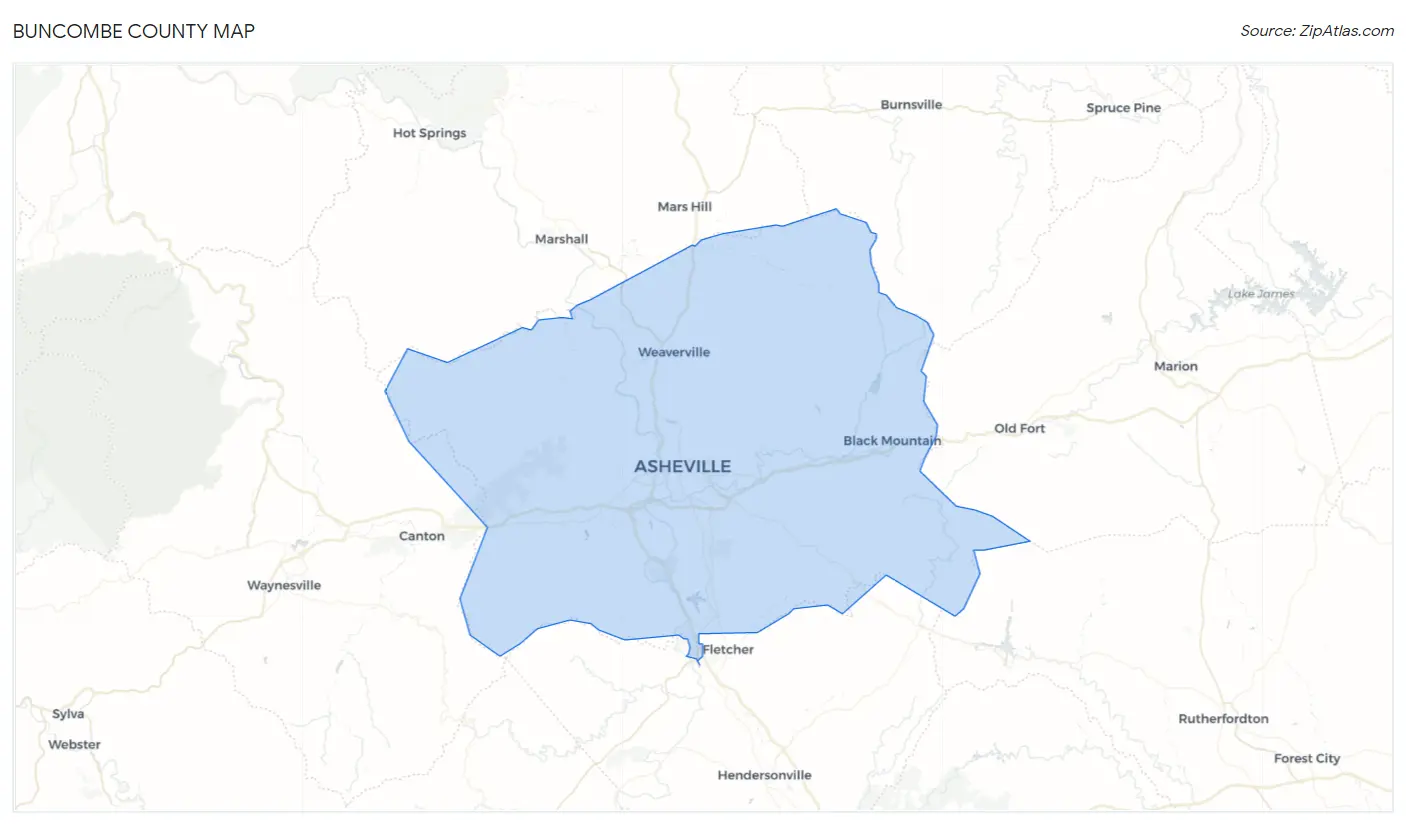
Buncombe County Map
Buncombe County Overview
269,449
TOTAL POPULATION
130,266
MALE POPULATION
139,183
FEMALE POPULATION
93.59
MALES / 100 FEMALES
106.85
FEMALES / 100 MALES
42.3
MEDIAN AGE
3.2
AVG FAMILY SIZE
2.5
AVG HOUSEHOLD SIZE
$39,495
PER CAPITA INCOME
$85,099
AVG FAMILY INCOME
$66,531
AVG HOUSEHOLD INCOME
16.7%
WAGE / INCOME GAP [ % ]
83.3¢/ $1
WAGE / INCOME GAP [ $ ]
$8,666
FAMILY INCOME DEFICIT
0.48
INEQUALITY / GINI INDEX
137,028
LABOR FORCE [ PEOPLE ]
60.5%
PERCENT IN LABOR FORCE
3.6%
UNEMPLOYMENT RATE
Buncombe County Area Codes
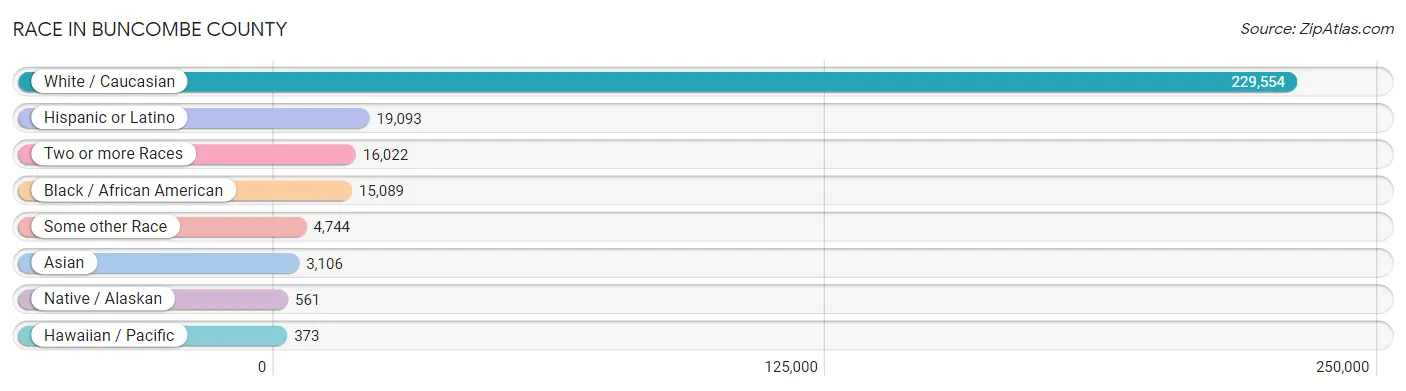
Race in Buncombe County
The most populous races in Buncombe County are White / Caucasian (229,554 | 85.2%), Hispanic or Latino (19,093 | 7.1%), and Two or more Races (16,022 | 5.9%).
| Race | # Population | % Population |
| Asian | 3,106 | 1.1% |
| Black / African American | 15,089 | 5.6% |
| Hawaiian / Pacific | 373 | 0.1% |
| Hispanic or Latino | 19,093 | 7.1% |
| Native / Alaskan | 561 | 0.2% |
| White / Caucasian | 229,554 | 85.2% |
| Two or more Races | 16,022 | 5.9% |
| Some other Race | 4,744 | 1.8% |
| Total | 269,449 | 100.0% |
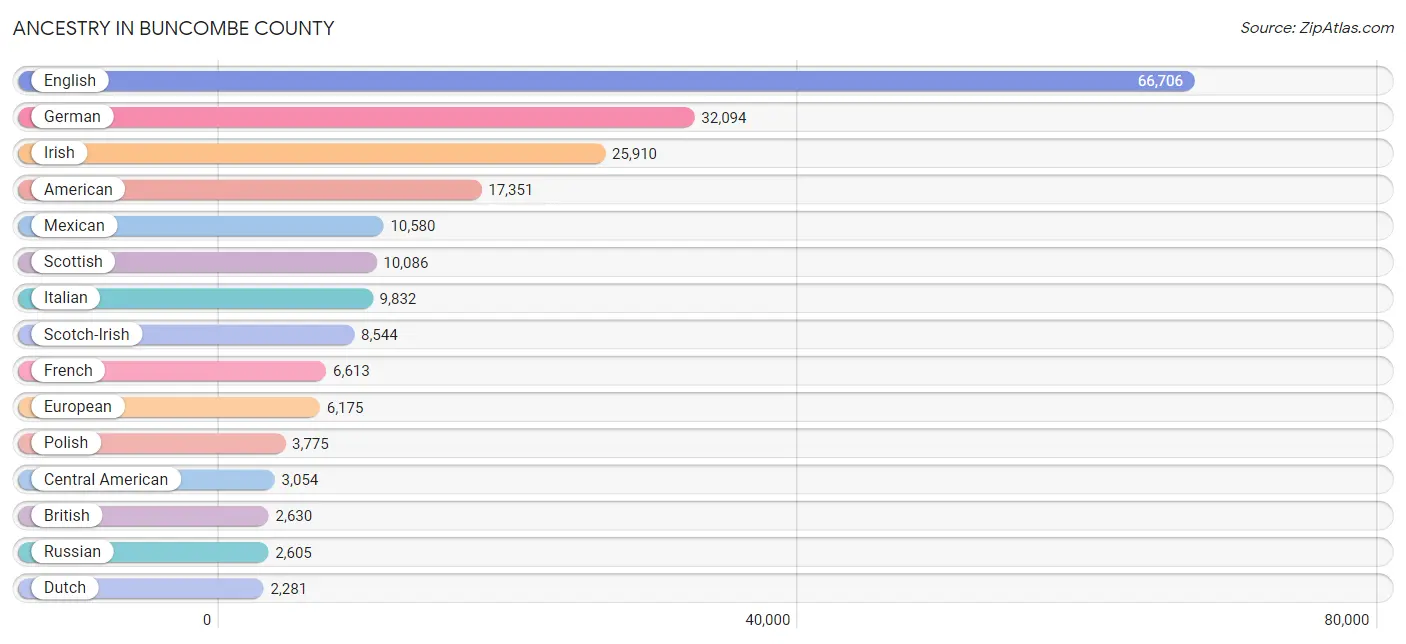
Ancestry in Buncombe County
The most populous ancestries reported in Buncombe County are English (66,706 | 24.8%), German (32,094 | 11.9%), Irish (25,910 | 9.6%), American (17,351 | 6.4%), and Mexican (10,580 | 3.9%), together accounting for 56.7% of all Buncombe County residents.
| Ancestry | # Population | % Population |
| African | 198 | 0.1% |
| Albanian | 37 | 0.0% |
| American | 17,351 | 6.4% |
| Apache | 29 | 0.0% |
| Arab | 718 | 0.3% |
| Argentinean | 223 | 0.1% |
| Armenian | 172 | 0.1% |
| Australian | 73 | 0.0% |
| Austrian | 718 | 0.3% |
| Barbadian | 5 | 0.0% |
| Belgian | 295 | 0.1% |
| Bermudan | 24 | 0.0% |
| Bhutanese | 809 | 0.3% |
| Blackfeet | 65 | 0.0% |
| Bolivian | 78 | 0.0% |
| Brazilian | 101 | 0.0% |
| British | 2,630 | 1.0% |
| Bulgarian | 94 | 0.0% |
| Burmese | 809 | 0.3% |
| Cajun | 17 | 0.0% |
| Canadian | 199 | 0.1% |
| Carpatho Rusyn | 38 | 0.0% |
| Celtic | 143 | 0.1% |
| Central American | 3,054 | 1.1% |
| Central American Indian | 159 | 0.1% |
| Cherokee | 946 | 0.4% |
| Chippewa | 54 | 0.0% |
| Choctaw | 42 | 0.0% |
| Colombian | 567 | 0.2% |
| Costa Rican | 44 | 0.0% |
| Cree | 5 | 0.0% |
| Creek | 35 | 0.0% |
| Croatian | 187 | 0.1% |
| Cuban | 581 | 0.2% |
| Czech | 767 | 0.3% |
| Czechoslovakian | 108 | 0.0% |
| Danish | 666 | 0.3% |
| Dominican | 400 | 0.2% |
| Dutch | 2,281 | 0.9% |
| Eastern European | 640 | 0.2% |
| Ecuadorian | 218 | 0.1% |
| Egyptian | 100 | 0.0% |
| English | 66,706 | 24.8% |
| Estonian | 19 | 0.0% |
| Ethiopian | 41 | 0.0% |
| European | 6,175 | 2.3% |
| Fijian | 283 | 0.1% |
| Filipino | 19 | 0.0% |
| Finnish | 186 | 0.1% |
| French | 6,613 | 2.5% |
| French American Indian | 10 | 0.0% |
| French Canadian | 870 | 0.3% |
| German | 32,094 | 11.9% |
| German Russian | 18 | 0.0% |
| Ghanaian | 37 | 0.0% |
| Greek | 1,781 | 0.7% |
| Guamanian / Chamorro | 147 | 0.1% |
| Guatemalan | 1,036 | 0.4% |
| Haitian | 23 | 0.0% |
| Honduran | 950 | 0.4% |
| Hungarian | 887 | 0.3% |
| Icelander | 60 | 0.0% |
| Indian (Asian) | 677 | 0.3% |
| Indonesian | 1 | 0.0% |
| Inupiat | 2 | 0.0% |
| Iranian | 70 | 0.0% |
| Irish | 25,910 | 9.6% |
| Iroquois | 23 | 0.0% |
| Israeli | 74 | 0.0% |
| Italian | 9,832 | 3.6% |
| Jamaican | 683 | 0.3% |
| Japanese | 27 | 0.0% |
| Jordanian | 76 | 0.0% |
| Kiowa | 18 | 0.0% |
| Korean | 743 | 0.3% |
| Laotian | 43 | 0.0% |
| Latvian | 29 | 0.0% |
| Lebanese | 443 | 0.2% |
| Lithuanian | 415 | 0.2% |
| Lumbee | 209 | 0.1% |
| Luxembourger | 59 | 0.0% |
| Macedonian | 12 | 0.0% |
| Malaysian | 56 | 0.0% |
| Mexican | 10,580 | 3.9% |
| Mexican American Indian | 69 | 0.0% |
| Native Hawaiian | 187 | 0.1% |
| Navajo | 11 | 0.0% |
| New Zealander | 15 | 0.0% |
| Nicaraguan | 72 | 0.0% |
| Nigerian | 63 | 0.0% |
| Northern European | 650 | 0.2% |
| Norwegian | 2,136 | 0.8% |
| Pakistani | 248 | 0.1% |
| Palestinian | 53 | 0.0% |
| Panamanian | 6 | 0.0% |
| Pennsylvania German | 90 | 0.0% |
| Peruvian | 82 | 0.0% |
| Polish | 3,775 | 1.4% |
| Portuguese | 389 | 0.1% |
| Puerto Rican | 1,334 | 0.5% |
| Romanian | 944 | 0.4% |
| Russian | 2,605 | 1.0% |
| Salvadoran | 946 | 0.4% |
| Samoan | 37 | 0.0% |
| Scandinavian | 952 | 0.4% |
| Scotch-Irish | 8,544 | 3.2% |
| Scottish | 10,086 | 3.7% |
| Serbian | 35 | 0.0% |
| Shoshone | 35 | 0.0% |
| Sioux | 61 | 0.0% |
| Slavic | 384 | 0.1% |
| Slovak | 398 | 0.2% |
| Slovene | 60 | 0.0% |
| South African | 115 | 0.0% |
| South American | 2,235 | 0.8% |
| South American Indian | 3 | 0.0% |
| Spaniard | 353 | 0.1% |
| Spanish | 125 | 0.1% |
| Sri Lankan | 79 | 0.0% |
| Subsaharan African | 490 | 0.2% |
| Swedish | 1,606 | 0.6% |
| Swiss | 581 | 0.2% |
| Syrian | 22 | 0.0% |
| Thai | 1,131 | 0.4% |
| Trinidadian and Tobagonian | 41 | 0.0% |
| Turkish | 99 | 0.0% |
| U.S. Virgin Islander | 24 | 0.0% |
| Ugandan | 5 | 0.0% |
| Ukrainian | 1,708 | 0.6% |
| Uruguayan | 29 | 0.0% |
| Venezuelan | 611 | 0.2% |
| Welsh | 1,913 | 0.7% |
| West Indian | 36 | 0.0% |
| Yaqui | 2 | 0.0% |
| Yugoslavian | 44 | 0.0% | View All 135 Rows |
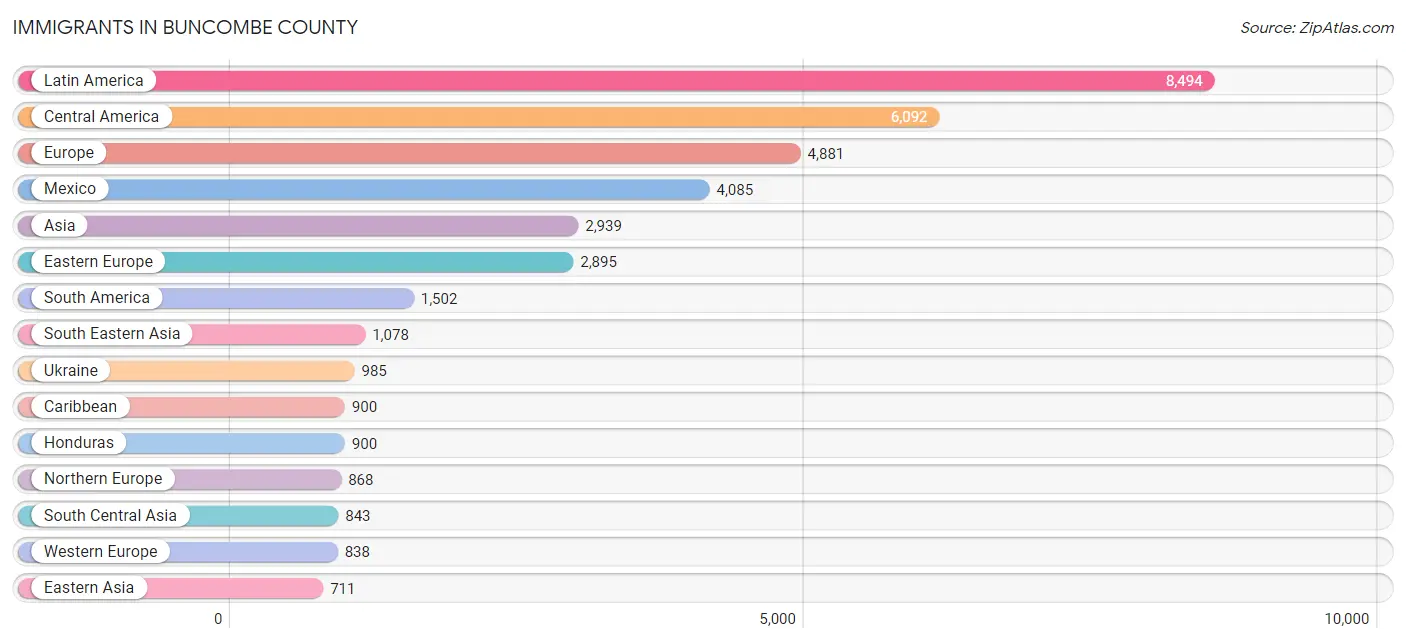
Immigrants in Buncombe County
The most numerous immigrant groups reported in Buncombe County came from Latin America (8,494 | 3.2%), Central America (6,092 | 2.3%), Europe (4,881 | 1.8%), Mexico (4,085 | 1.5%), and Asia (2,939 | 1.1%), together accounting for 9.8% of all Buncombe County residents.
| Immigration Origin | # Population | % Population |
| Africa | 379 | 0.1% |
| Argentina | 76 | 0.0% |
| Asia | 2,939 | 1.1% |
| Australia | 20 | 0.0% |
| Austria | 14 | 0.0% |
| Bangladesh | 53 | 0.0% |
| Belarus | 103 | 0.0% |
| Belgium | 44 | 0.0% |
| Brazil | 235 | 0.1% |
| Bulgaria | 47 | 0.0% |
| Cambodia | 27 | 0.0% |
| Canada | 498 | 0.2% |
| Caribbean | 900 | 0.3% |
| Central America | 6,092 | 2.3% |
| Chile | 11 | 0.0% |
| China | 315 | 0.1% |
| Colombia | 431 | 0.2% |
| Costa Rica | 20 | 0.0% |
| Croatia | 26 | 0.0% |
| Cuba | 398 | 0.2% |
| Czechoslovakia | 26 | 0.0% |
| Denmark | 52 | 0.0% |
| Dominican Republic | 203 | 0.1% |
| Eastern Africa | 75 | 0.0% |
| Eastern Asia | 711 | 0.3% |
| Eastern Europe | 2,895 | 1.1% |
| Ecuador | 121 | 0.0% |
| Egypt | 14 | 0.0% |
| El Salvador | 455 | 0.2% |
| England | 268 | 0.1% |
| Ethiopia | 9 | 0.0% |
| Europe | 4,881 | 1.8% |
| Fiji | 8 | 0.0% |
| France | 151 | 0.1% |
| Germany | 549 | 0.2% |
| Ghana | 48 | 0.0% |
| Greece | 51 | 0.0% |
| Guatemala | 590 | 0.2% |
| Haiti | 12 | 0.0% |
| Honduras | 900 | 0.3% |
| Hong Kong | 46 | 0.0% |
| Hungary | 94 | 0.0% |
| India | 402 | 0.2% |
| Indonesia | 99 | 0.0% |
| Iran | 51 | 0.0% |
| Ireland | 91 | 0.0% |
| Italy | 135 | 0.1% |
| Jamaica | 274 | 0.1% |
| Japan | 206 | 0.1% |
| Jordan | 35 | 0.0% |
| Kazakhstan | 63 | 0.0% |
| Korea | 190 | 0.1% |
| Kuwait | 87 | 0.0% |
| Laos | 11 | 0.0% |
| Latin America | 8,494 | 3.2% |
| Latvia | 33 | 0.0% |
| Lebanon | 48 | 0.0% |
| Malaysia | 40 | 0.0% |
| Mexico | 4,085 | 1.5% |
| Moldova | 580 | 0.2% |
| Nepal | 2 | 0.0% |
| Netherlands | 24 | 0.0% |
| Nicaragua | 42 | 0.0% |
| Nigeria | 36 | 0.0% |
| Northern Africa | 42 | 0.0% |
| Northern Europe | 868 | 0.3% |
| Norway | 7 | 0.0% |
| Oceania | 80 | 0.0% |
| Pakistan | 39 | 0.0% |
| Peru | 26 | 0.0% |
| Philippines | 543 | 0.2% |
| Poland | 39 | 0.0% |
| Portugal | 17 | 0.0% |
| Romania | 76 | 0.0% |
| Russia | 599 | 0.2% |
| Saudi Arabia | 40 | 0.0% |
| Scotland | 43 | 0.0% |
| Singapore | 8 | 0.0% |
| South Africa | 171 | 0.1% |
| South America | 1,502 | 0.6% |
| South Central Asia | 843 | 0.3% |
| South Eastern Asia | 1,078 | 0.4% |
| Southern Europe | 280 | 0.1% |
| Spain | 77 | 0.0% |
| Sweden | 44 | 0.0% |
| Switzerland | 56 | 0.0% |
| Thailand | 282 | 0.1% |
| Trinidad and Tobago | 3 | 0.0% |
| Turkey | 37 | 0.0% |
| Uganda | 5 | 0.0% |
| Ukraine | 985 | 0.4% |
| Uruguay | 29 | 0.0% |
| Uzbekistan | 233 | 0.1% |
| Venezuela | 573 | 0.2% |
| Vietnam | 67 | 0.0% |
| Western Africa | 84 | 0.0% |
| Western Asia | 307 | 0.1% |
| Western Europe | 838 | 0.3% |
| Zimbabwe | 61 | 0.0% | View All 99 Rows |
Sex and Age in Buncombe County
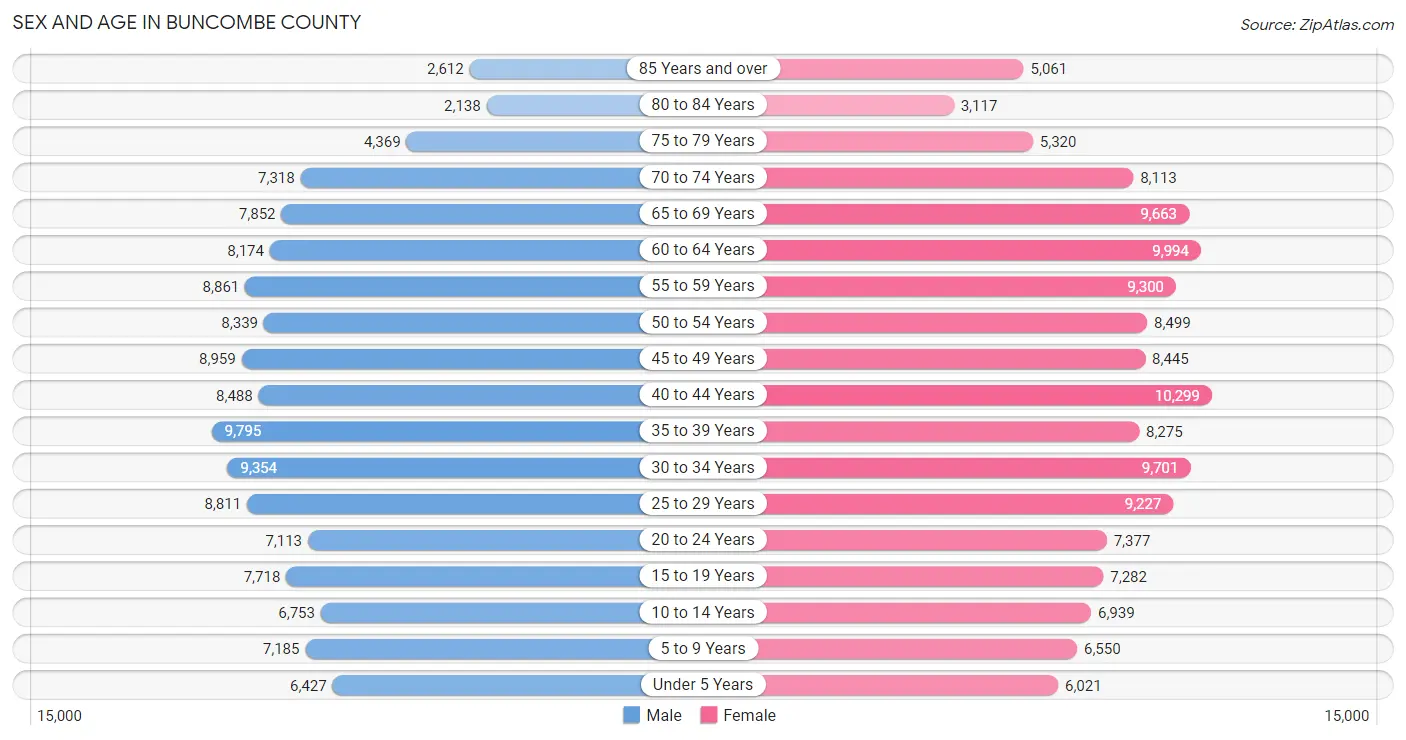
Sex and Age in Buncombe County
The most populous age groups in Buncombe County are 35 to 39 Years (9,795 | 7.5%) for men and 40 to 44 Years (10,299 | 7.4%) for women.
| Age Bracket | Male | Female |
| Under 5 Years | 6,427 (4.9%) | 6,021 (4.3%) |
| 5 to 9 Years | 7,185 (5.5%) | 6,550 (4.7%) |
| 10 to 14 Years | 6,753 (5.2%) | 6,939 (5.0%) |
| 15 to 19 Years | 7,718 (5.9%) | 7,282 (5.2%) |
| 20 to 24 Years | 7,113 (5.5%) | 7,377 (5.3%) |
| 25 to 29 Years | 8,811 (6.8%) | 9,227 (6.6%) |
| 30 to 34 Years | 9,354 (7.2%) | 9,701 (7.0%) |
| 35 to 39 Years | 9,795 (7.5%) | 8,275 (5.9%) |
| 40 to 44 Years | 8,488 (6.5%) | 10,299 (7.4%) |
| 45 to 49 Years | 8,959 (6.9%) | 8,445 (6.1%) |
| 50 to 54 Years | 8,339 (6.4%) | 8,499 (6.1%) |
| 55 to 59 Years | 8,861 (6.8%) | 9,300 (6.7%) |
| 60 to 64 Years | 8,174 (6.3%) | 9,994 (7.2%) |
| 65 to 69 Years | 7,852 (6.0%) | 9,663 (6.9%) |
| 70 to 74 Years | 7,318 (5.6%) | 8,113 (5.8%) |
| 75 to 79 Years | 4,369 (3.4%) | 5,320 (3.8%) |
| 80 to 84 Years | 2,138 (1.6%) | 3,117 (2.2%) |
| 85 Years and over | 2,612 (2.0%) | 5,061 (3.6%) |
| Total | 130,266 (100.0%) | 139,183 (100.0%) |
Families and Households in Buncombe County
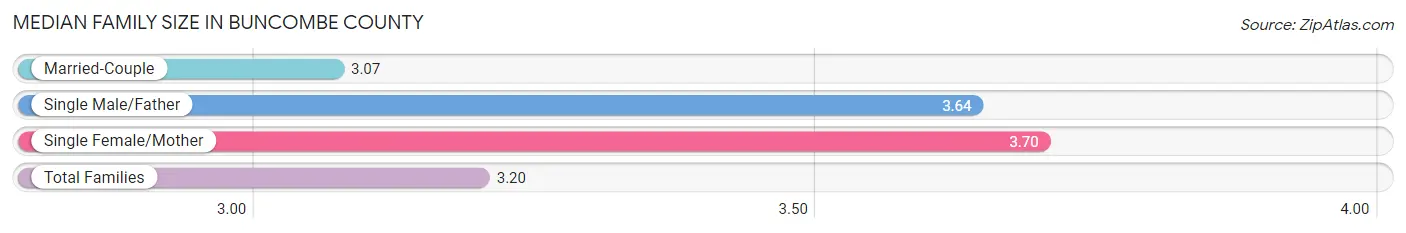
Median Family Size in Buncombe County
The median family size in Buncombe County is 3.20 persons per family, with single female/mother families (9,801 | 16.0%) accounting for the largest median family size of 3.7 persons per family. On the other hand, married-couple families (47,977 | 78.4%) represent the smallest median family size with 3.07 persons per family.
| Family Type | # Families | Family Size |
| Married-Couple | 47,977 (78.4%) | 3.07 |
| Single Male/Father | 3,405 (5.6%) | 3.64 |
| Single Female/Mother | 9,801 (16.0%) | 3.70 |
| Total Families | 61,183 (100.0%) | 3.20 |
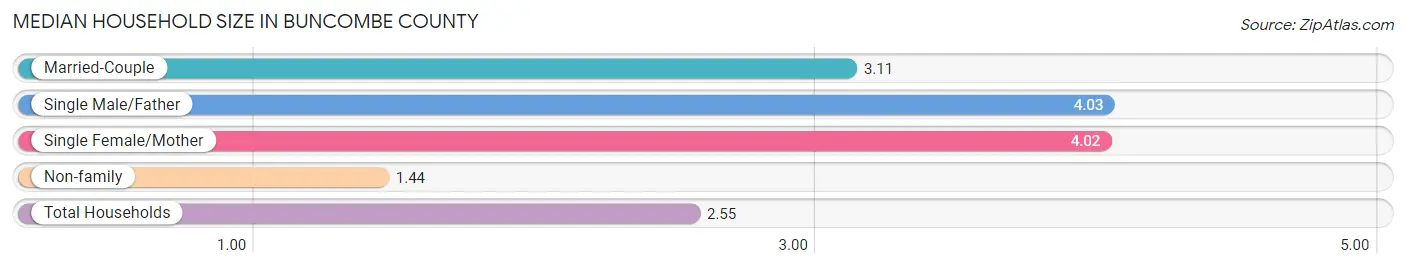
Median Household Size in Buncombe County
The median household size in Buncombe County is 2.55 persons per household, with single male/father households (3,405 | 3.3%) accounting for the largest median household size of 4.03 persons per household. non-family households (41,738 | 40.6%) represent the smallest median household size with 1.44 persons per household.
| Household Type | # Households | Household Size |
| Married-Couple | 47,977 (46.6%) | 3.11 |
| Single Male/Father | 3,405 (3.3%) | 4.03 |
| Single Female/Mother | 9,801 (9.5%) | 4.02 |
| Non-family | 41,738 (40.6%) | 1.44 |
| Total Households | 102,921 (100.0%) | 2.55 |
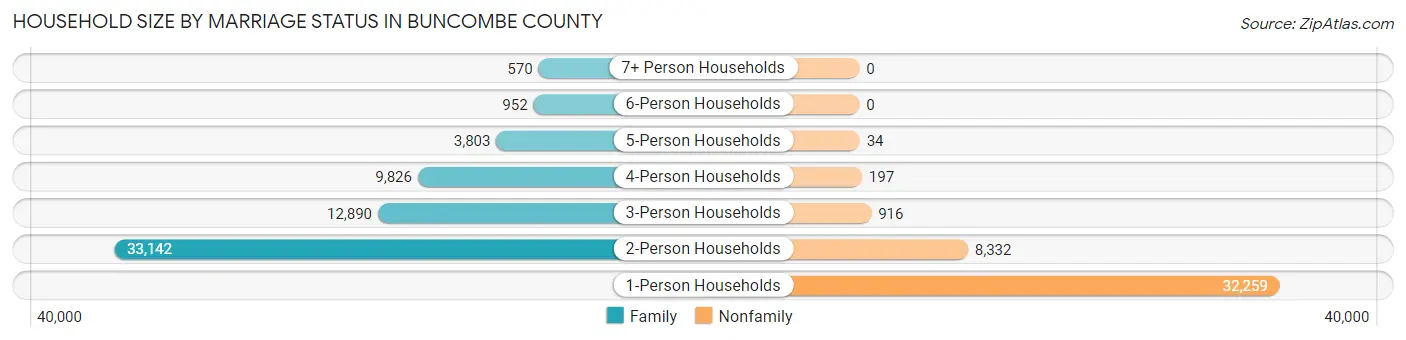
Household Size by Marriage Status in Buncombe County
Out of a total of 102,921 households in Buncombe County, 61,183 (59.5%) are family households, while 41,738 (40.6%) are nonfamily households. The most numerous type of family households are 2-person households, comprising 33,142, and the most common type of nonfamily households are 1-person households, comprising 32,259.
| Household Size | Family Households | Nonfamily Households |
| 1-Person Households | - | 32,259 (31.3%) |
| 2-Person Households | 33,142 (32.2%) | 8,332 (8.1%) |
| 3-Person Households | 12,890 (12.5%) | 916 (0.9%) |
| 4-Person Households | 9,826 (9.6%) | 197 (0.2%) |
| 5-Person Households | 3,803 (3.7%) | 34 (0.0%) |
| 6-Person Households | 952 (0.9%) | 0 (0.0%) |
| 7+ Person Households | 570 (0.5%) | 0 (0.0%) |
| Total | 61,183 (59.5%) | 41,738 (40.6%) |
Female Fertility in Buncombe County
Fertility by Age in Buncombe County
Average fertility rate in Buncombe County is 37.0 births per 1,000 women. Women in the age bracket of 20 to 34 years have the highest fertility rate with 62.0 births per 1,000 women. Women in the age bracket of 20 to 34 years acount for 71.6% of all women with births.

| Age Bracket | Women with Births | Births / 1,000 Women |
| 15 to 19 years | 79 (3.5%) | 11.0 |
| 20 to 34 years | 1,642 (71.6%) | 62.0 |
| 35 to 50 years | 572 (24.9%) | 20.0 |
| Total | 2,293 (100.0%) | 37.0 |
Fertility by Age by Marriage Status in Buncombe County
64.5% of women with births (2,293) in Buncombe County are married. The highest percentage of unmarried women with births falls into 15 to 19 years age bracket with 100.0% of them unmarried at the time of birth, while the lowest percentage of unmarried women with births belong to 35 to 50 years age bracket with 5.2% of them unmarried.
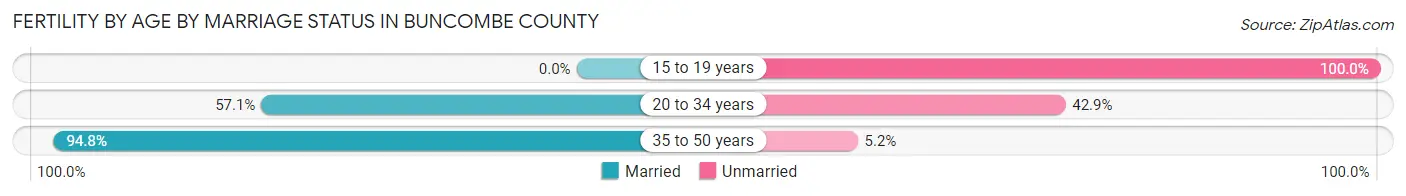
| Age Bracket | Married | Unmarried |
| 15 to 19 years | 0 (0.0%) | 79 (100.0%) |
| 20 to 34 years | 938 (57.1%) | 704 (42.9%) |
| 35 to 50 years | 542 (94.8%) | 30 (5.2%) |
| Total | 1,479 (64.5%) | 814 (35.5%) |
Fertility by Education in Buncombe County
Average fertility rate in Buncombe County is 37.0 births per 1,000 women. Women with the education attainment of high school diploma have the highest fertility rate of 52.0 births per 1,000 women, while women with the education attainment of college or associate's degree have the lowest fertility at 23.0 births per 1,000 women. Women with the education attainment of bachelor's degree represent 30.9% of all women with births.
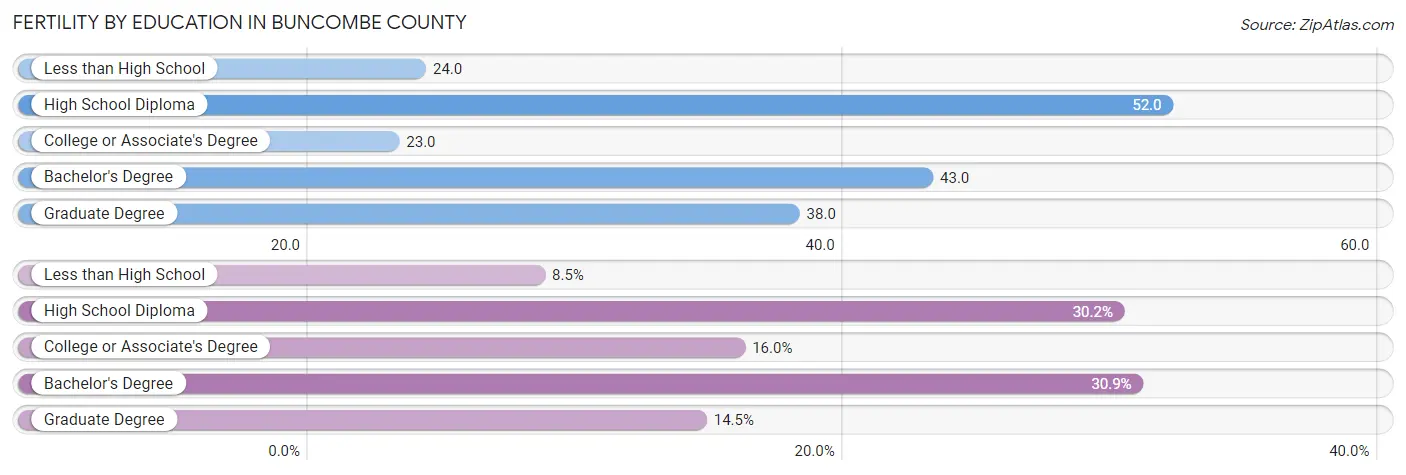
| Educational Attainment | Women with Births | Births / 1,000 Women |
| Less than High School | 194 (8.5%) | 24.0 |
| High School Diploma | 692 (30.2%) | 52.0 |
| College or Associate's Degree | 366 (16.0%) | 23.0 |
| Bachelor's Degree | 708 (30.9%) | 43.0 |
| Graduate Degree | 333 (14.5%) | 38.0 |
| Total | 2,293 (100.0%) | 37.0 |
Fertility by Education by Marriage Status in Buncombe County
35.5% of women with births in Buncombe County are unmarried. Women with the educational attainment of graduate degree are most likely to be married with 94.6% of them married at childbirth, while women with the educational attainment of less than high school are least likely to be married with 64.4% of them unmarried at childbirth.
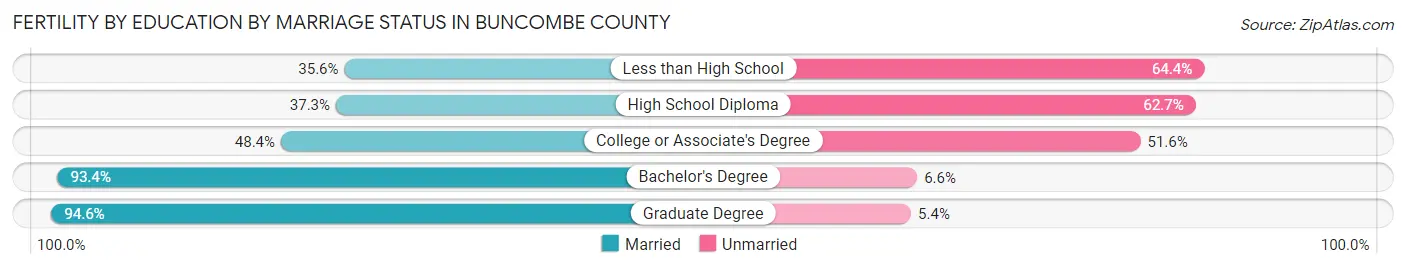
| Educational Attainment | Married | Unmarried |
| Less than High School | 69 (35.6%) | 125 (64.4%) |
| High School Diploma | 258 (37.3%) | 434 (62.7%) |
| College or Associate's Degree | 177 (48.4%) | 189 (51.6%) |
| Bachelor's Degree | 661 (93.4%) | 47 (6.6%) |
| Graduate Degree | 315 (94.6%) | 18 (5.4%) |
| Total | 1,479 (64.5%) | 814 (35.5%) |
Income in Buncombe County
Income Overview in Buncombe County
Per Capita Income in Buncombe County is $39,495, while median incomes of families and households are $85,099 and $66,531 respectively.
| Characteristic | Number | Measure |
| Per Capita Income | 269,449 | $39,495 |
| Median Family Income | 61,183 | $85,099 |
| Mean Family Income | 61,183 | $115,909 |
| Median Household Income | 102,921 | $66,531 |
| Mean Household Income | 102,921 | $94,799 |
| Income Deficit | 61,183 | $8,666 |
| Wage / Income Gap (%) | 269,449 | 16.72% |
| Wage / Income Gap ($) | 269,449 | 83.28¢ per $1 |
| Gini / Inequality Index | 269,449 | 0.48 |
Earnings by Sex in Buncombe County
Average Earnings in Buncombe County are $36,694, $40,323 for men and $33,581 for women, a difference of 16.7%.
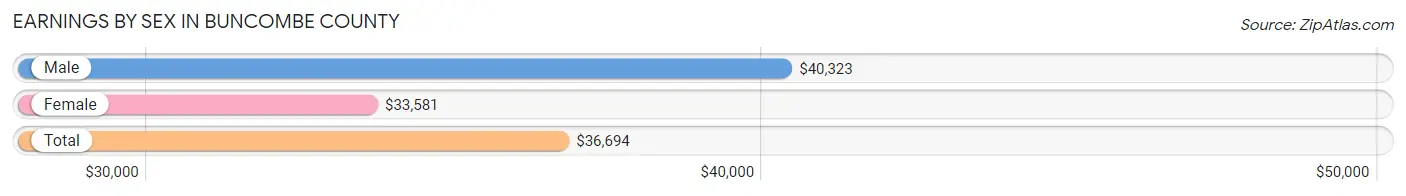
| Sex | Number | Average Earnings |
| Male | 73,659 (51.4%) | $40,323 |
| Female | 69,683 (48.6%) | $33,581 |
| Total | 143,342 (100.0%) | $36,694 |
Earnings by Sex by Income Bracket in Buncombe County
The most common earnings brackets in Buncombe County are $100,000+ for men (10,241 | 13.9%) and $25,000 to $29,999 for women (6,043 | 8.7%).
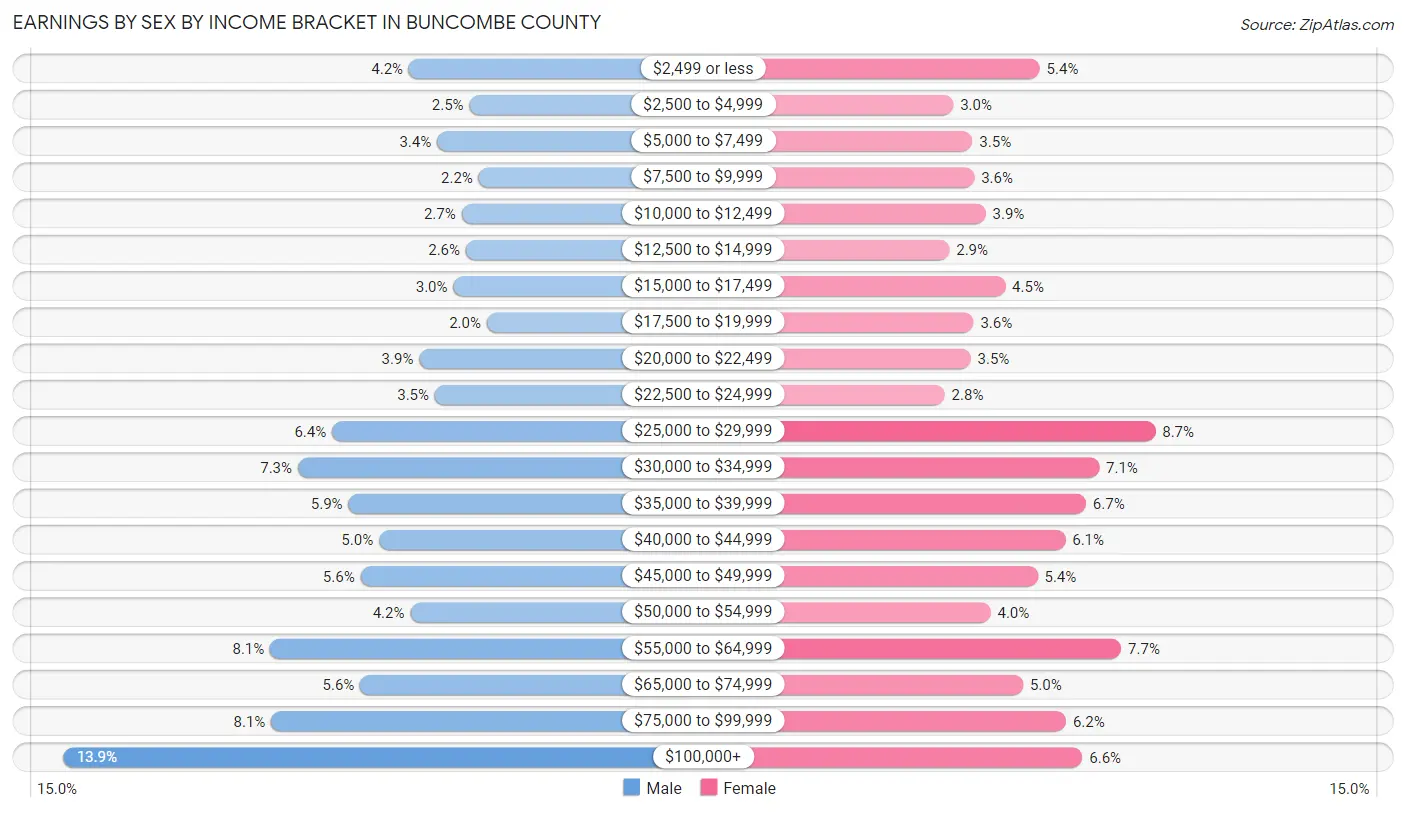
| Income | Male | Female |
| $2,499 or less | 3,095 (4.2%) | 3,777 (5.4%) |
| $2,500 to $4,999 | 1,839 (2.5%) | 2,086 (3.0%) |
| $5,000 to $7,499 | 2,509 (3.4%) | 2,461 (3.5%) |
| $7,500 to $9,999 | 1,652 (2.2%) | 2,498 (3.6%) |
| $10,000 to $12,499 | 2,002 (2.7%) | 2,716 (3.9%) |
| $12,500 to $14,999 | 1,918 (2.6%) | 2,007 (2.9%) |
| $15,000 to $17,499 | 2,170 (2.9%) | 3,102 (4.4%) |
| $17,500 to $19,999 | 1,483 (2.0%) | 2,484 (3.6%) |
| $20,000 to $22,499 | 2,879 (3.9%) | 2,422 (3.5%) |
| $22,500 to $24,999 | 2,559 (3.5%) | 1,913 (2.8%) |
| $25,000 to $29,999 | 4,688 (6.4%) | 6,043 (8.7%) |
| $30,000 to $34,999 | 5,392 (7.3%) | 4,943 (7.1%) |
| $35,000 to $39,999 | 4,349 (5.9%) | 4,686 (6.7%) |
| $40,000 to $44,999 | 3,712 (5.0%) | 4,278 (6.1%) |
| $45,000 to $49,999 | 4,092 (5.6%) | 3,733 (5.4%) |
| $50,000 to $54,999 | 3,067 (4.2%) | 2,814 (4.0%) |
| $55,000 to $64,999 | 5,965 (8.1%) | 5,372 (7.7%) |
| $65,000 to $74,999 | 4,105 (5.6%) | 3,448 (5.0%) |
| $75,000 to $99,999 | 5,942 (8.1%) | 4,289 (6.2%) |
| $100,000+ | 10,241 (13.9%) | 4,611 (6.6%) |
| Total | 73,659 (100.0%) | 69,683 (100.0%) |
Earnings by Sex by Educational Attainment in Buncombe County
Average earnings in Buncombe County are $45,758 for men and $37,830 for women, a difference of 17.3%. Men with an educational attainment of graduate degree enjoy the highest average annual earnings of $75,404, while those with less than high school education earn the least with $27,126. Women with an educational attainment of graduate degree earn the most with the average annual earnings of $57,115, while those with less than high school education have the smallest earnings of $22,228.
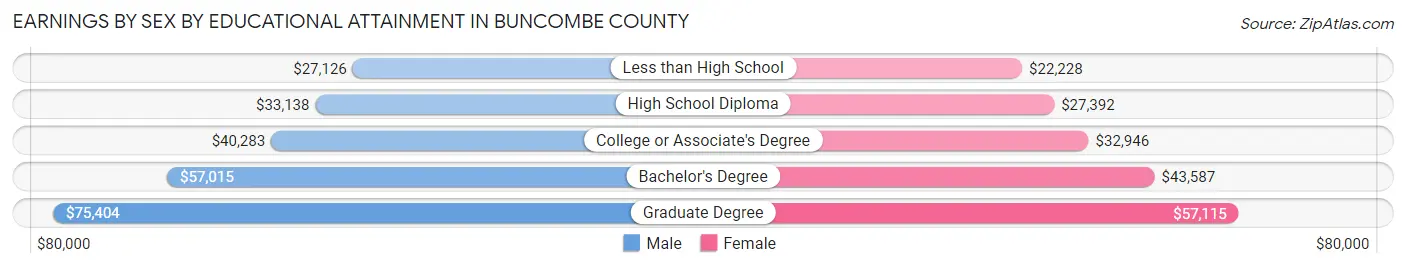
| Educational Attainment | Male Income | Female Income |
| Less than High School | $27,126 | $22,228 |
| High School Diploma | $33,138 | $27,392 |
| College or Associate's Degree | $40,283 | $32,946 |
| Bachelor's Degree | $57,015 | $43,587 |
| Graduate Degree | $75,404 | $57,115 |
| Total | $45,758 | $37,830 |
Family Income in Buncombe County
Family Income Brackets in Buncombe County
According to the Buncombe County family income data, there are 12,481 families falling into the $100,000 to $149,999 income range, which is the most common income bracket and makes up 20.4% of all families. Conversely, the $10,000 to $14,999 income bracket is the least frequent group with only 857 families (1.4%) belonging to this category.
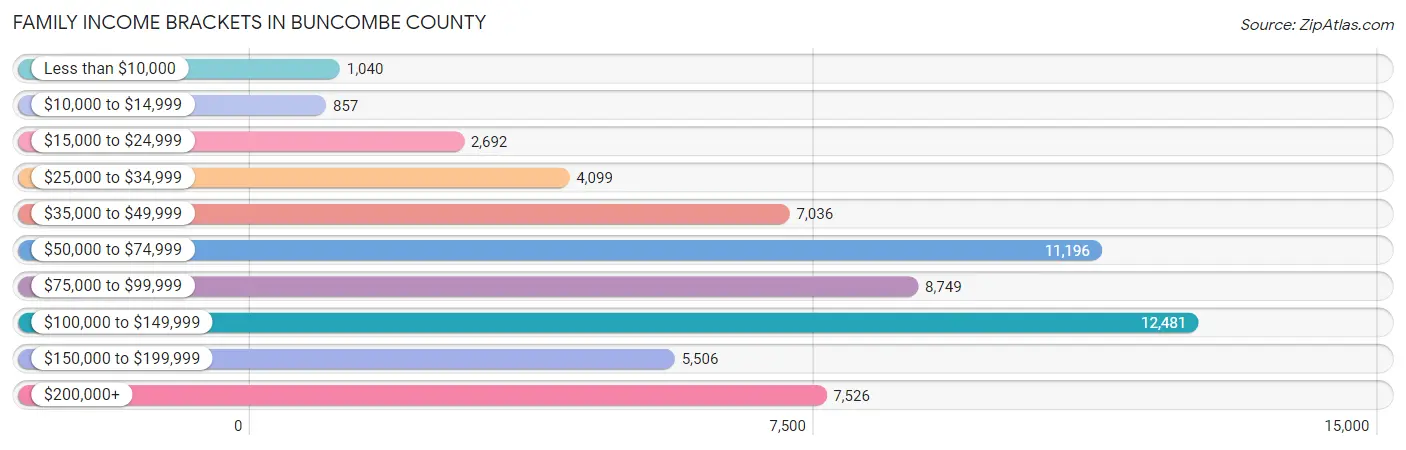
| Income Bracket | # Families | % Families |
| Less than $10,000 | 1,040 | 1.7% |
| $10,000 to $14,999 | 857 | 1.4% |
| $15,000 to $24,999 | 2,692 | 4.4% |
| $25,000 to $34,999 | 4,099 | 6.7% |
| $35,000 to $49,999 | 7,036 | 11.5% |
| $50,000 to $74,999 | 11,196 | 18.3% |
| $75,000 to $99,999 | 8,749 | 14.3% |
| $100,000 to $149,999 | 12,481 | 20.4% |
| $150,000 to $199,999 | 5,506 | 9.0% |
| $200,000+ | 7,526 | 12.3% |
Family Income by Famaliy Size in Buncombe County
7+ person families (441 | 0.7%) account for the highest median family income in Buncombe County with $105,013 per family, while 2-person families (34,910 | 57.1%) have the highest median income of $40,608 per family member.
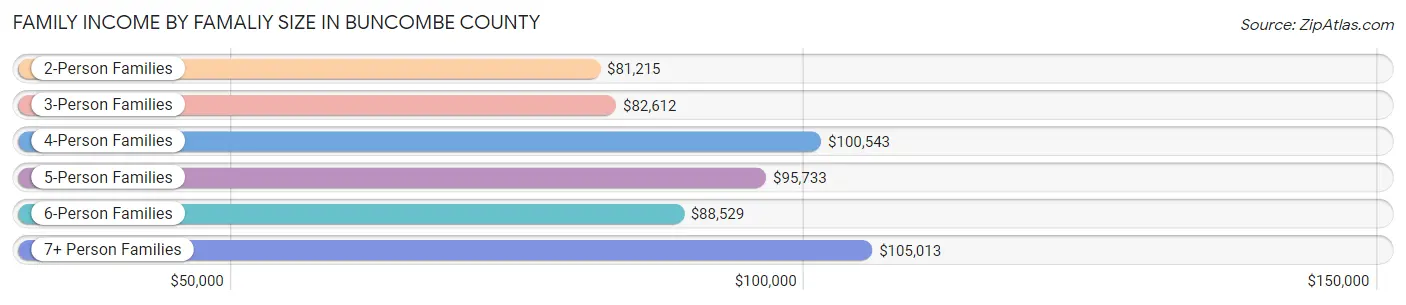
| Income Bracket | # Families | Median Income |
| 2-Person Families | 34,910 (57.1%) | $81,215 |
| 3-Person Families | 12,093 (19.8%) | $82,612 |
| 4-Person Families | 9,512 (15.5%) | $100,543 |
| 5-Person Families | 3,421 (5.6%) | $95,733 |
| 6-Person Families | 806 (1.3%) | $88,529 |
| 7+ Person Families | 441 (0.7%) | $105,013 |
| Total | 61,183 (100.0%) | $85,099 |
Family Income by Number of Earners in Buncombe County
The median family income in Buncombe County is $85,099, with families comprising 3+ earners (5,077) having the highest median family income of $126,810, while families with 1 earner (19,627) have the lowest median family income of $59,942, accounting for 8.3% and 32.1% of families, respectively.
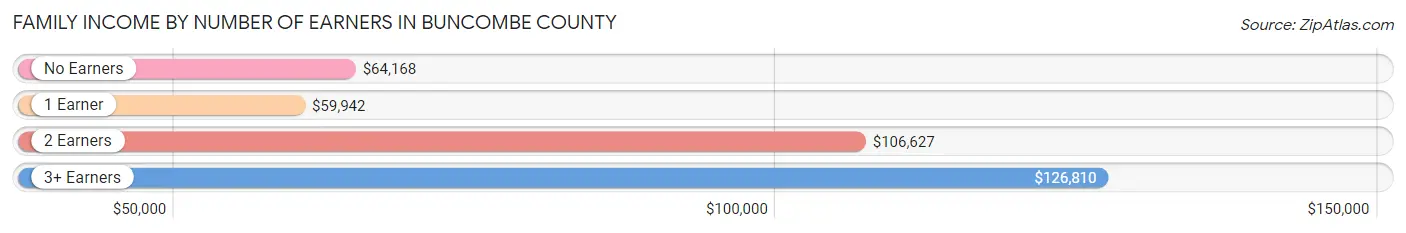
| Number of Earners | # Families | Median Income |
| No Earners | 11,823 (19.3%) | $64,168 |
| 1 Earner | 19,627 (32.1%) | $59,942 |
| 2 Earners | 24,656 (40.3%) | $106,627 |
| 3+ Earners | 5,077 (8.3%) | $126,810 |
| Total | 61,183 (100.0%) | $85,099 |
Household Income in Buncombe County
Household Income Brackets in Buncombe County
With 18,835 households falling in the category, the $50,000 to $74,999 income range is the most frequent in Buncombe County, accounting for 18.3% of all households. In contrast, only 4,117 households (4.0%) fall into the less than $10,000 income bracket, making it the least populous group.

| Income Bracket | # Households | % Households |
| Less than $10,000 | 4,117 | 4.0% |
| $10,000 to $14,999 | 4,426 | 4.3% |
| $15,000 to $24,999 | 8,954 | 8.7% |
| $25,000 to $34,999 | 8,440 | 8.2% |
| $35,000 to $49,999 | 13,071 | 12.7% |
| $50,000 to $74,999 | 18,835 | 18.3% |
| $75,000 to $99,999 | 13,174 | 12.8% |
| $100,000 to $149,999 | 16,159 | 15.7% |
| $150,000 to $199,999 | 6,793 | 6.6% |
| $200,000+ | 9,057 | 8.8% |
Household Income by Householder Age in Buncombe County
The median household income in Buncombe County is $66,531, with the highest median household income of $76,968 found in the 45 to 64 years age bracket for the primary householder. A total of 36,083 households (35.1%) fall into this category. Meanwhile, the 15 to 24 years age bracket for the primary householder has the lowest median household income of $41,090, with 2,725 households (2.6%) in this group.
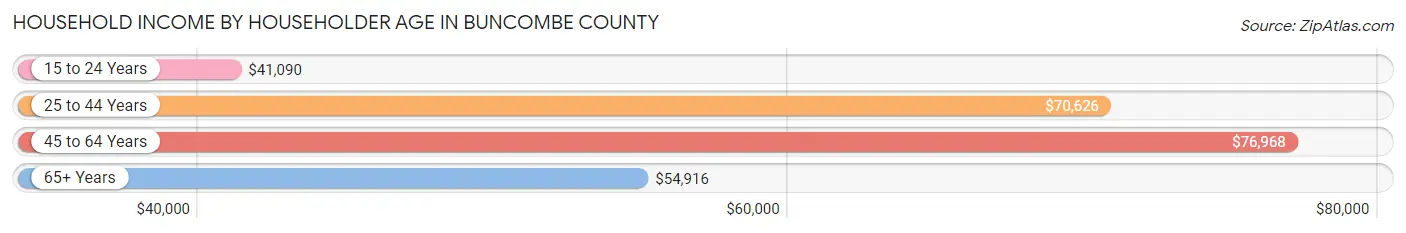
| Income Bracket | # Households | Median Income |
| 15 to 24 Years | 2,725 (2.6%) | $41,090 |
| 25 to 44 Years | 30,734 (29.9%) | $70,626 |
| 45 to 64 Years | 36,083 (35.1%) | $76,968 |
| 65+ Years | 33,379 (32.4%) | $54,916 |
| Total | 102,921 (100.0%) | $66,531 |
Poverty in Buncombe County
Income Below Poverty by Sex and Age in Buncombe County
With 11.0% poverty level for males and 11.5% for females among the residents of Buncombe County, 6 to 11 year old males and under 5 year old females are the most vulnerable to poverty, with 1,722 males (21.7%) and 1,181 females (20.8%) in their respective age groups living below the poverty level.
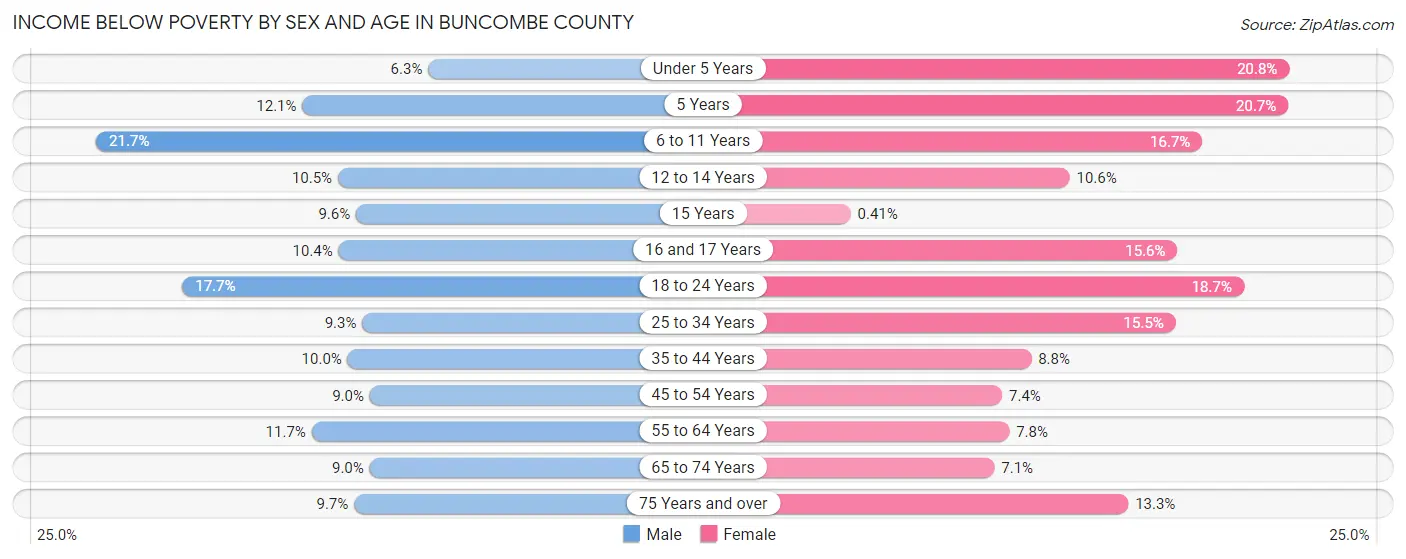
| Age Bracket | Male | Female |
| Under 5 Years | 390 (6.3%) | 1,181 (20.8%) |
| 5 Years | 175 (12.1%) | 252 (20.7%) |
| 6 to 11 Years | 1,722 (21.7%) | 1,350 (16.7%) |
| 12 to 14 Years | 450 (10.5%) | 429 (10.6%) |
| 15 Years | 176 (9.6%) | 5 (0.4%) |
| 16 and 17 Years | 274 (10.4%) | 453 (15.6%) |
| 18 to 24 Years | 1,632 (17.7%) | 1,745 (18.6%) |
| 25 to 34 Years | 1,668 (9.3%) | 2,911 (15.5%) |
| 35 to 44 Years | 1,793 (10.0%) | 1,622 (8.8%) |
| 45 to 54 Years | 1,533 (9.0%) | 1,258 (7.4%) |
| 55 to 64 Years | 1,982 (11.7%) | 1,492 (7.8%) |
| 65 to 74 Years | 1,353 (9.0%) | 1,248 (7.1%) |
| 75 Years and over | 822 (9.7%) | 1,627 (13.3%) |
| Total | 13,970 (11.0%) | 15,573 (11.5%) |
Income Above Poverty by Sex and Age in Buncombe County
According to the poverty statistics in Buncombe County, males aged under 5 years and females aged 15 years are the age groups that are most secure financially, with 93.7% of males and 99.6% of females in these age groups living above the poverty line.
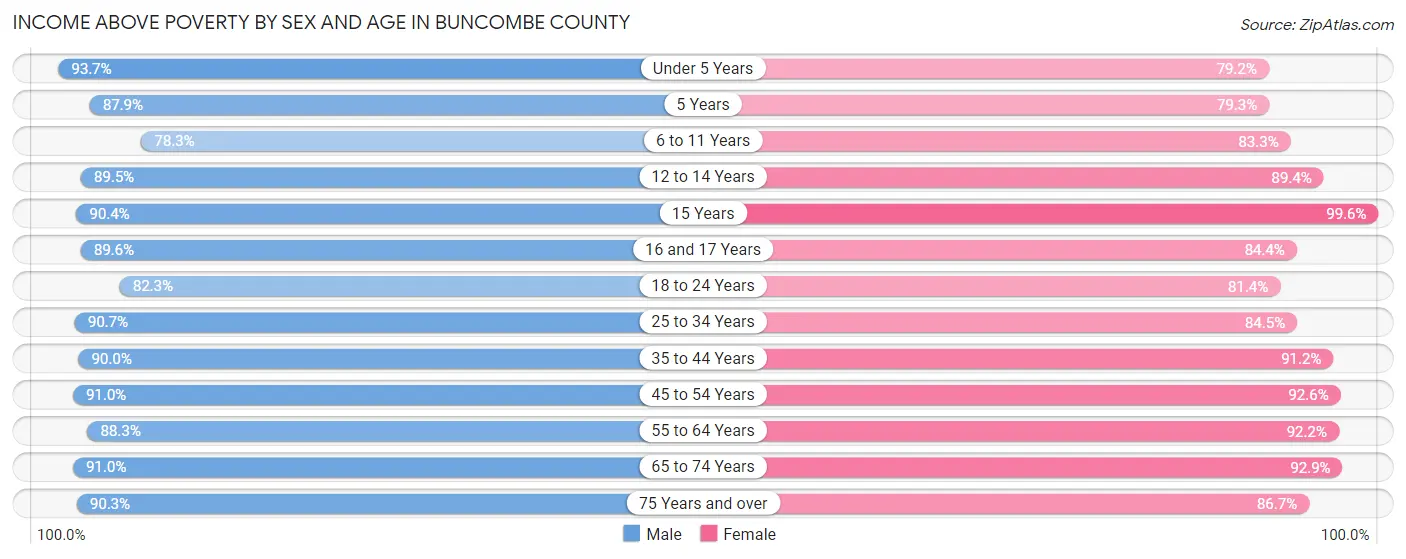
| Age Bracket | Male | Female |
| Under 5 Years | 5,832 (93.7%) | 4,507 (79.2%) |
| 5 Years | 1,270 (87.9%) | 965 (79.3%) |
| 6 to 11 Years | 6,220 (78.3%) | 6,724 (83.3%) |
| 12 to 14 Years | 3,853 (89.5%) | 3,631 (89.4%) |
| 15 Years | 1,654 (90.4%) | 1,228 (99.6%) |
| 16 and 17 Years | 2,354 (89.6%) | 2,456 (84.4%) |
| 18 to 24 Years | 7,601 (82.3%) | 7,614 (81.4%) |
| 25 to 34 Years | 16,219 (90.7%) | 15,881 (84.5%) |
| 35 to 44 Years | 16,127 (90.0%) | 16,823 (91.2%) |
| 45 to 54 Years | 15,545 (91.0%) | 15,645 (92.6%) |
| 55 to 64 Years | 14,985 (88.3%) | 17,714 (92.2%) |
| 65 to 74 Years | 13,703 (91.0%) | 16,369 (92.9%) |
| 75 Years and over | 7,642 (90.3%) | 10,619 (86.7%) |
| Total | 113,005 (89.0%) | 120,176 (88.5%) |
Income Below Poverty Among Married-Couple Families in Buncombe County
The poverty statistics for married-couple families in Buncombe County show that 3.7% or 1,776 of the total 47,977 families live below the poverty line. Families with 3 or 4 children have the highest poverty rate of 13.6%, comprising of 298 families. On the other hand, families with 5 or more children have the lowest poverty rate of 0.0%, which includes 0 families.
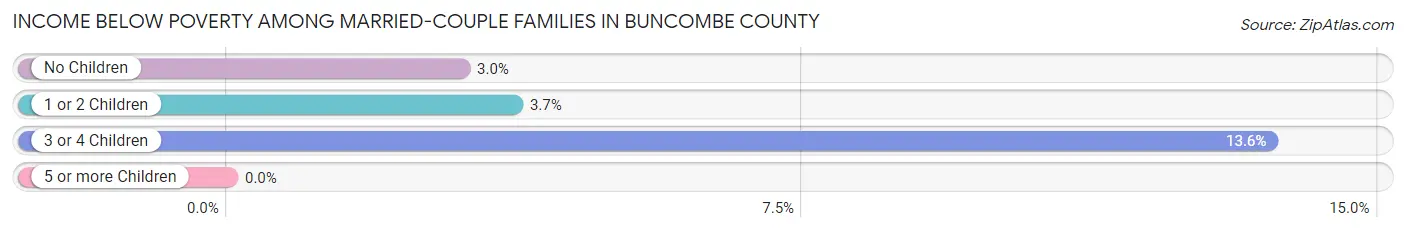
| Children | Above Poverty | Below Poverty |
| No Children | 31,040 (97.0%) | 971 (3.0%) |
| 1 or 2 Children | 13,122 (96.3%) | 507 (3.7%) |
| 3 or 4 Children | 1,897 (86.4%) | 298 (13.6%) |
| 5 or more Children | 142 (100.0%) | 0 (0.0%) |
| Total | 46,201 (96.3%) | 1,776 (3.7%) |
Income Below Poverty Among Single-Parent Households in Buncombe County
According to the poverty data in Buncombe County, 10.2% or 348 single-father households and 19.9% or 1,951 single-mother households are living below the poverty line. Among single-father households, those with 3 or 4 children have the highest poverty rate, with 61 households (27.9%) experiencing poverty. Likewise, among single-mother households, those with 5 or more children have the highest poverty rate, with 25 households (100.0%) falling below the poverty line.
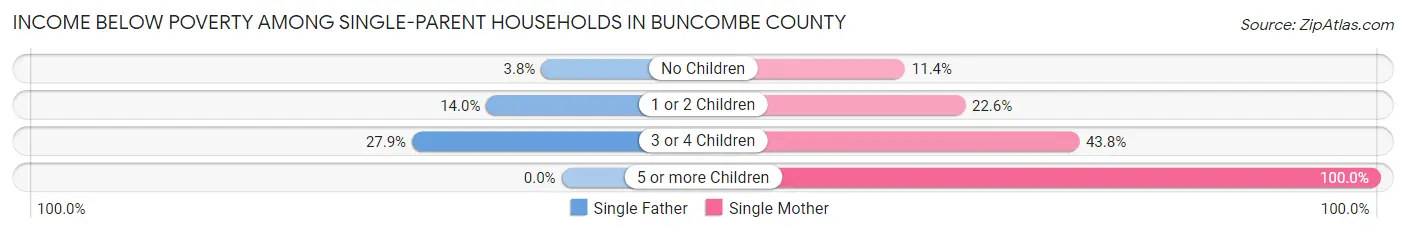
| Children | Single Father | Single Mother |
| No Children | 59 (3.8%) | 422 (11.4%) |
| 1 or 2 Children | 228 (14.0%) | 1,234 (22.6%) |
| 3 or 4 Children | 61 (27.9%) | 270 (43.8%) |
| 5 or more Children | 0 (0.0%) | 25 (100.0%) |
| Total | 348 (10.2%) | 1,951 (19.9%) |
Income Below Poverty Among Married-Couple vs Single-Parent Households in Buncombe County
The poverty data for Buncombe County shows that 1,776 of the married-couple family households (3.7%) and 2,299 of the single-parent households (17.4%) are living below the poverty level. Within the married-couple family households, those with 3 or 4 children have the highest poverty rate, with 298 households (13.6%) falling below the poverty line. Among the single-parent households, those with 5 or more children have the highest poverty rate, with 25 household (100.0%) living below poverty.
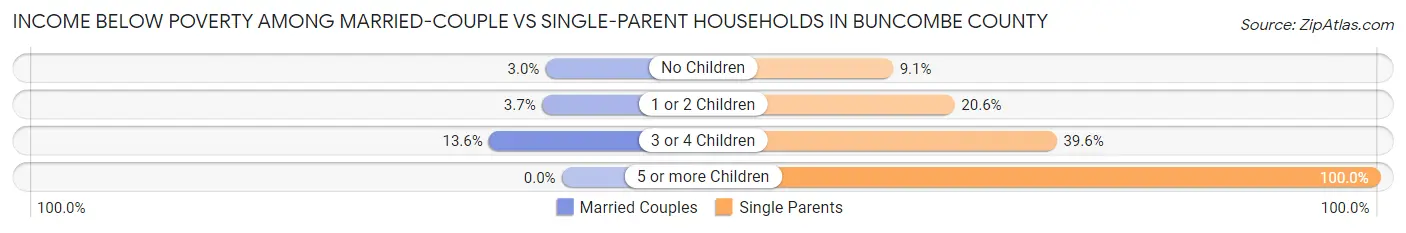
| Children | Married-Couple Families | Single-Parent Households |
| No Children | 971 (3.0%) | 481 (9.1%) |
| 1 or 2 Children | 507 (3.7%) | 1,462 (20.6%) |
| 3 or 4 Children | 298 (13.6%) | 331 (39.6%) |
| 5 or more Children | 0 (0.0%) | 25 (100.0%) |
| Total | 1,776 (3.7%) | 2,299 (17.4%) |
Employment Characteristics in Buncombe County
Employment by Class of Employer in Buncombe County
Among the 130,073 employed individuals in Buncombe County, private company employees (88,342 | 67.9%), self-employed (not incorporated) (9,761 | 7.5%), and not-for-profit organizations (9,324 | 7.2%) make up the most common classes of employment.
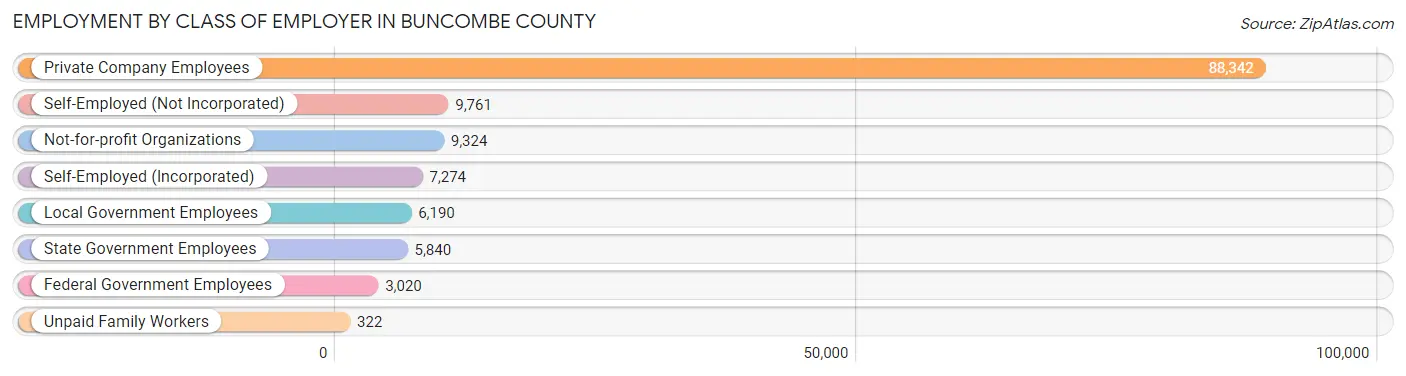
| Employer Class | # Employees | % Employees |
| Private Company Employees | 88,342 | 67.9% |
| Self-Employed (Incorporated) | 7,274 | 5.6% |
| Self-Employed (Not Incorporated) | 9,761 | 7.5% |
| Not-for-profit Organizations | 9,324 | 7.2% |
| Local Government Employees | 6,190 | 4.8% |
| State Government Employees | 5,840 | 4.5% |
| Federal Government Employees | 3,020 | 2.3% |
| Unpaid Family Workers | 322 | 0.3% |
| Total | 130,073 | 100.0% |
Employment Status by Age in Buncombe County
According to the labor force statistics for Buncombe County, out of the total population over 16 years of age (226,493), 60.5% or 137,028 individuals are in the labor force, with 3.6% or 4,933 of them unemployed. The age group with the highest labor force participation rate is 30 to 34 years, with 87.4% or 16,654 individuals in the labor force. Within the labor force, the 16 to 19 years age range has the highest percentage of unemployed individuals, with 12.9% or 650 of them being unemployed.
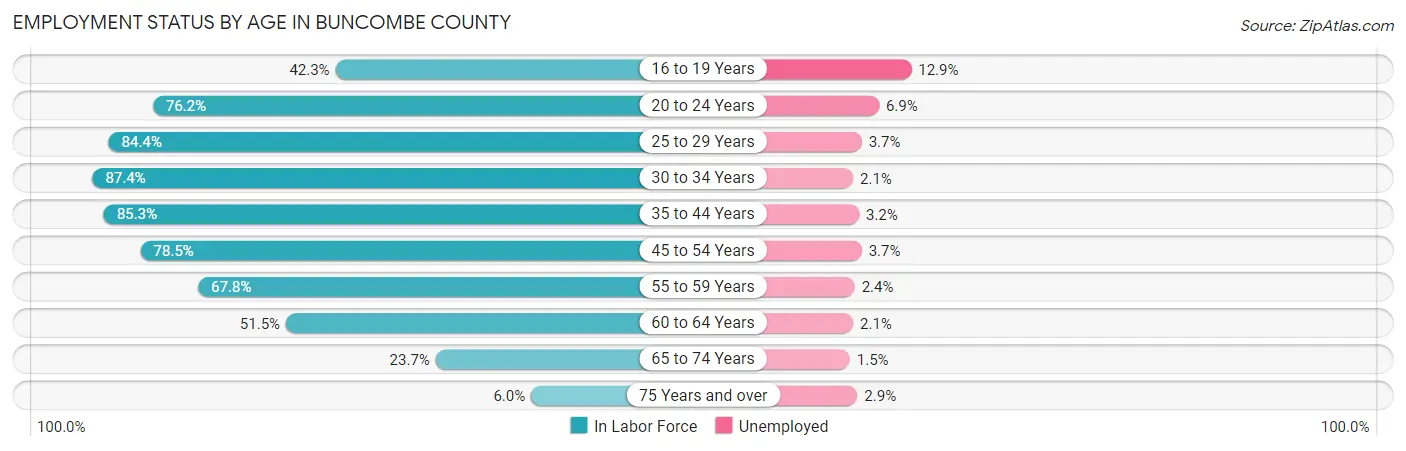
| Age Bracket | In Labor Force | Unemployed |
| 16 to 19 Years | 5,042 (42.3%) | 650 (12.9%) |
| 20 to 24 Years | 11,041 (76.2%) | 762 (6.9%) |
| 25 to 29 Years | 15,224 (84.4%) | 563 (3.7%) |
| 30 to 34 Years | 16,654 (87.4%) | 350 (2.1%) |
| 35 to 44 Years | 31,439 (85.3%) | 1,006 (3.2%) |
| 45 to 54 Years | 26,880 (78.5%) | 995 (3.7%) |
| 55 to 59 Years | 12,313 (67.8%) | 296 (2.4%) |
| 60 to 64 Years | 9,357 (51.5%) | 196 (2.1%) |
| 65 to 74 Years | 7,808 (23.7%) | 117 (1.5%) |
| 75 Years and over | 1,357 (6.0%) | 39 (2.9%) |
| Total | 137,028 (60.5%) | 4,933 (3.6%) |
Employment Status by Educational Attainment in Buncombe County
According to labor force statistics for Buncombe County, 77.4% of individuals (111,859) out of the total population between 25 and 64 years of age (144,521) are in the labor force, with 3.1% or 3,468 of them being unemployed. The group with the highest labor force participation rate are those with the educational attainment of bachelor's degree or higher, with 84.5% or 52,908 individuals in the labor force. Within the labor force, individuals with less than high school education have the highest percentage of unemployment, with 5.2% or 300 of them being unemployed.
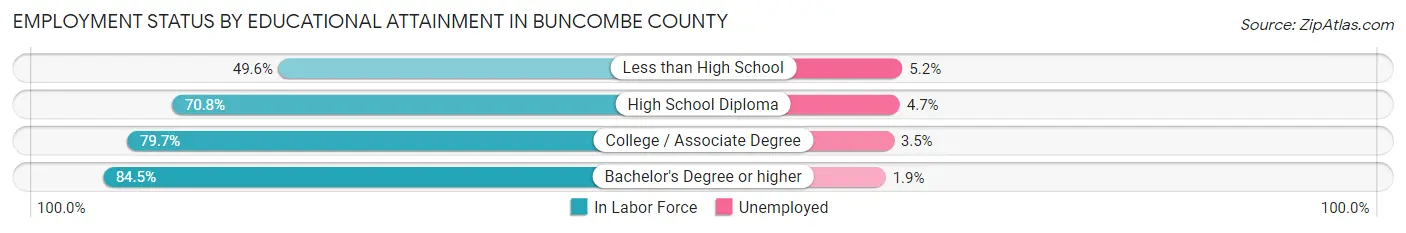
| Educational Attainment | In Labor Force | Unemployed |
| Less than High School | 5,768 (49.6%) | 605 (5.2%) |
| High School Diploma | 22,440 (70.8%) | 1,490 (4.7%) |
| College / Associate Degree | 30,751 (79.7%) | 1,350 (3.5%) |
| Bachelor's Degree or higher | 52,908 (84.5%) | 1,190 (1.9%) |
| Total | 111,859 (77.4%) | 4,480 (3.1%) |
Employment Occupations by Sex in Buncombe County
Management, Business, Science and Arts Occupations
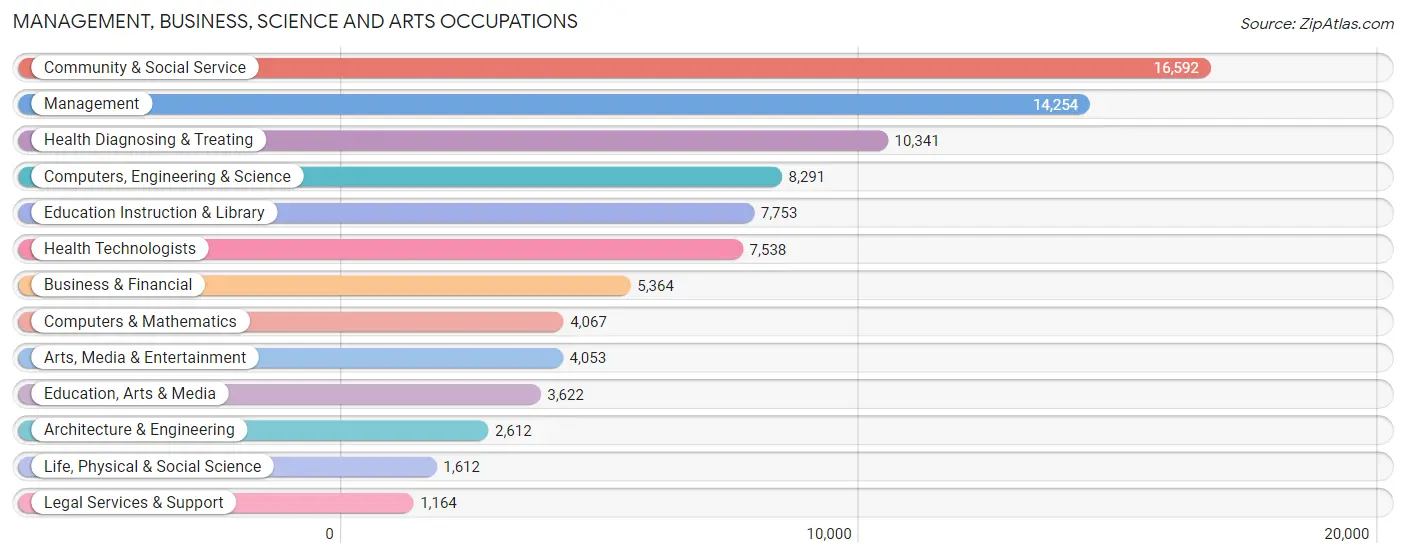
The most common Management, Business, Science and Arts occupations in Buncombe County are Community & Social Service (16,592 | 12.6%), Management (14,254 | 10.8%), Health Diagnosing & Treating (10,341 | 7.8%), Computers, Engineering & Science (8,291 | 6.3%), and Education Instruction & Library (7,753 | 5.9%).
Management, Business, Science and Arts Occupations by Sex
Within the Management, Business, Science and Arts occupations in Buncombe County, the most male-oriented occupations are Architecture & Engineering (83.3%), Computers & Mathematics (75.3%), and Computers, Engineering & Science (71.7%), while the most female-oriented occupations are Education Instruction & Library (75.0%), Education, Arts & Media (68.7%), and Health Diagnosing & Treating (68.5%).
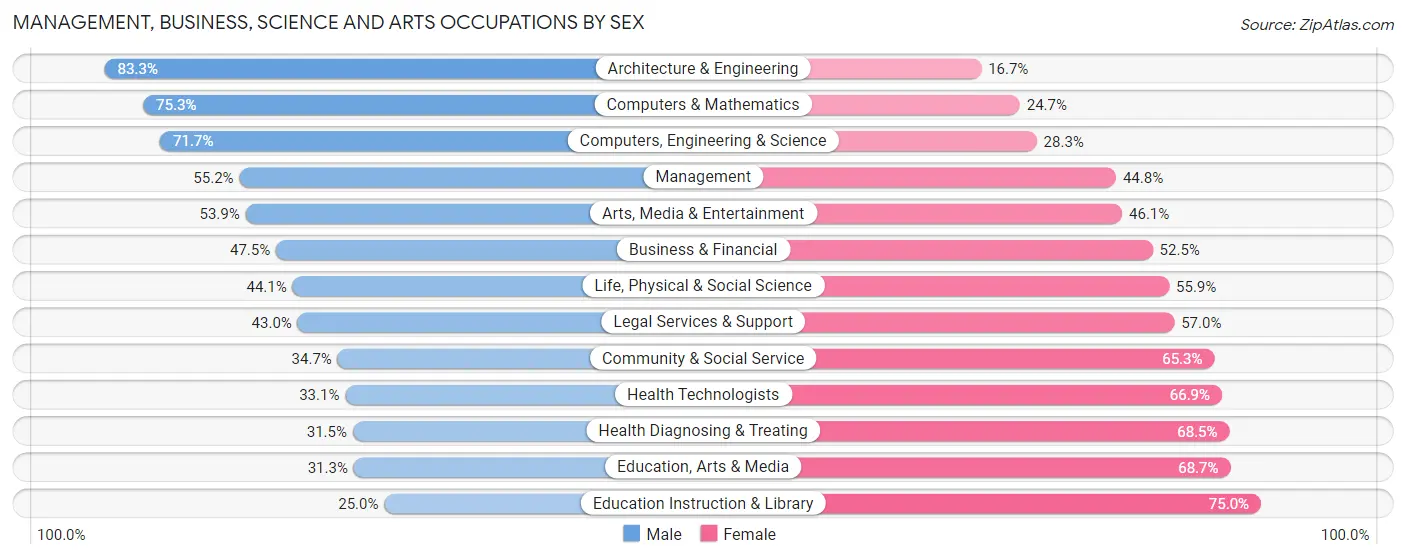
| Occupation | Male | Female |
| Management | 7,867 (55.2%) | 6,387 (44.8%) |
| Business & Financial | 2,550 (47.5%) | 2,814 (52.5%) |
| Computers, Engineering & Science | 5,948 (71.7%) | 2,343 (28.3%) |
| Computers & Mathematics | 3,061 (75.3%) | 1,006 (24.7%) |
| Architecture & Engineering | 2,176 (83.3%) | 436 (16.7%) |
| Life, Physical & Social Science | 711 (44.1%) | 901 (55.9%) |
| Community & Social Service | 5,756 (34.7%) | 10,836 (65.3%) |
| Education, Arts & Media | 1,135 (31.3%) | 2,487 (68.7%) |
| Legal Services & Support | 501 (43.0%) | 663 (57.0%) |
| Education Instruction & Library | 1,935 (25.0%) | 5,818 (75.0%) |
| Arts, Media & Entertainment | 2,185 (53.9%) | 1,868 (46.1%) |
| Health Diagnosing & Treating | 3,262 (31.5%) | 7,079 (68.5%) |
| Health Technologists | 2,496 (33.1%) | 5,042 (66.9%) |
| Total (Category) | 25,383 (46.3%) | 29,459 (53.7%) |
| Total (Overall) | 67,608 (51.3%) | 64,275 (48.7%) |
Services Occupations
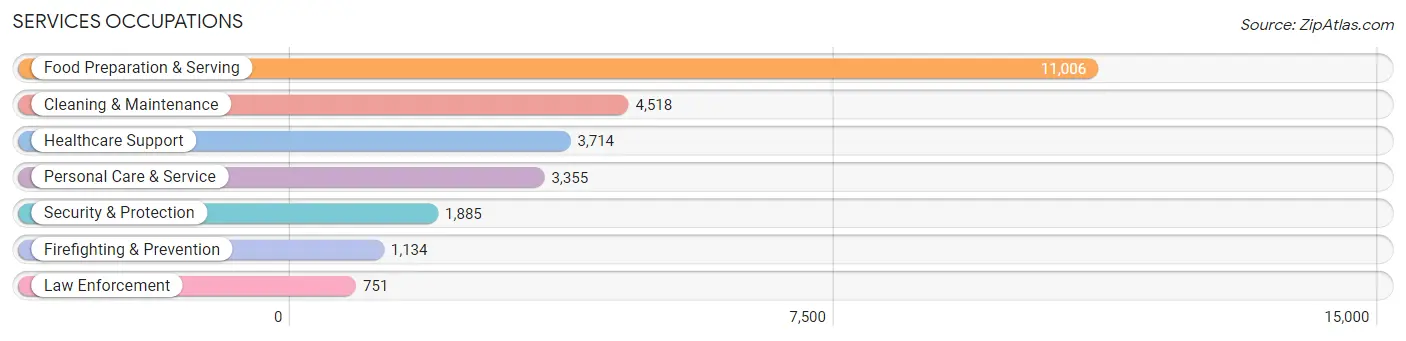
The most common Services occupations in Buncombe County are Food Preparation & Serving (11,006 | 8.4%), Cleaning & Maintenance (4,518 | 3.4%), Healthcare Support (3,714 | 2.8%), Personal Care & Service (3,355 | 2.5%), and Security & Protection (1,885 | 1.4%).
Services Occupations by Sex
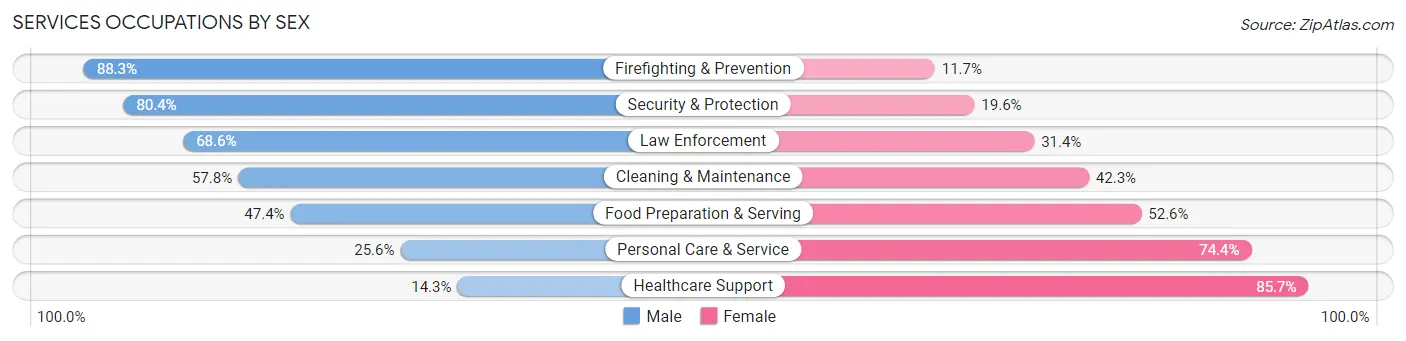
Within the Services occupations in Buncombe County, the most male-oriented occupations are Firefighting & Prevention (88.3%), Security & Protection (80.4%), and Law Enforcement (68.6%), while the most female-oriented occupations are Healthcare Support (85.7%), Personal Care & Service (74.4%), and Food Preparation & Serving (52.6%).
| Occupation | Male | Female |
| Healthcare Support | 532 (14.3%) | 3,182 (85.7%) |
| Security & Protection | 1,516 (80.4%) | 369 (19.6%) |
| Firefighting & Prevention | 1,001 (88.3%) | 133 (11.7%) |
| Law Enforcement | 515 (68.6%) | 236 (31.4%) |
| Food Preparation & Serving | 5,213 (47.4%) | 5,793 (52.6%) |
| Cleaning & Maintenance | 2,609 (57.8%) | 1,909 (42.2%) |
| Personal Care & Service | 859 (25.6%) | 2,496 (74.4%) |
| Total (Category) | 10,729 (43.8%) | 13,749 (56.2%) |
| Total (Overall) | 67,608 (51.3%) | 64,275 (48.7%) |
Sales and Office Occupations
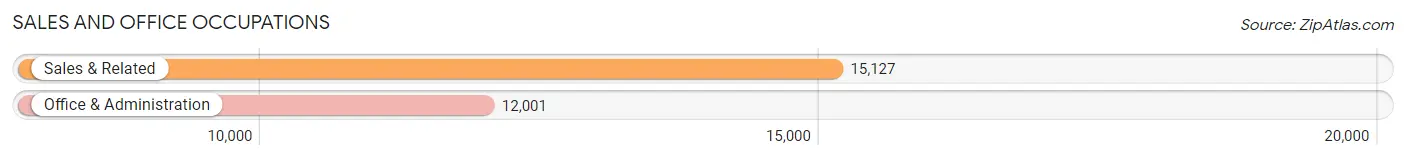
The most common Sales and Office occupations in Buncombe County are Sales & Related (15,127 | 11.5%), and Office & Administration (12,001 | 9.1%).
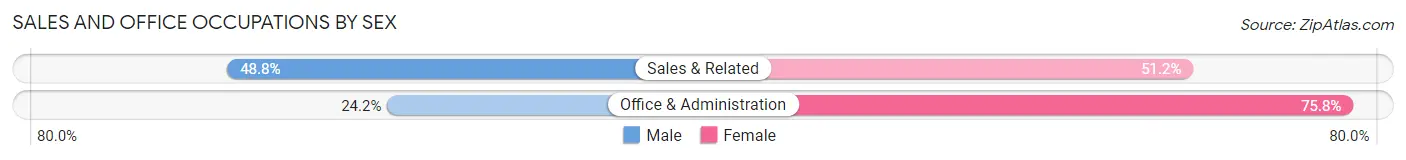
Sales and Office Occupations by Sex
| Occupation | Male | Female |
| Sales & Related | 7,385 (48.8%) | 7,742 (51.2%) |
| Office & Administration | 2,906 (24.2%) | 9,095 (75.8%) |
| Total (Category) | 10,291 (37.9%) | 16,837 (62.1%) |
| Total (Overall) | 67,608 (51.3%) | 64,275 (48.7%) |
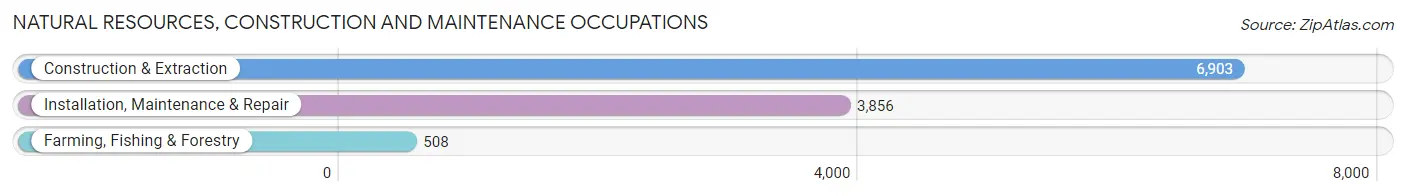
Natural Resources, Construction and Maintenance Occupations
The most common Natural Resources, Construction and Maintenance occupations in Buncombe County are Construction & Extraction (6,903 | 5.2%), Installation, Maintenance & Repair (3,856 | 2.9%), and Farming, Fishing & Forestry (508 | 0.4%).
Natural Resources, Construction and Maintenance Occupations by Sex
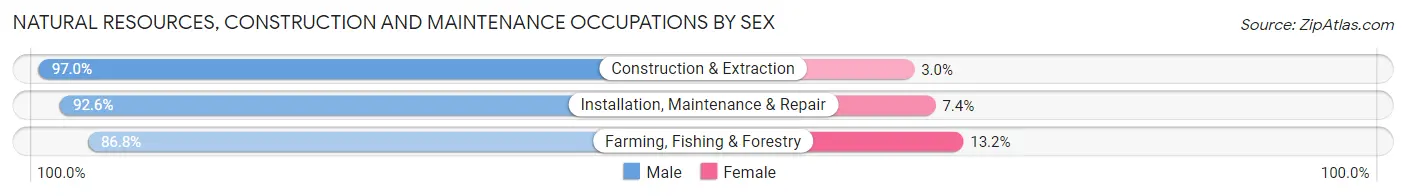
| Occupation | Male | Female |
| Farming, Fishing & Forestry | 441 (86.8%) | 67 (13.2%) |
| Construction & Extraction | 6,698 (97.0%) | 205 (3.0%) |
| Installation, Maintenance & Repair | 3,571 (92.6%) | 285 (7.4%) |
| Total (Category) | 10,710 (95.1%) | 557 (4.9%) |
| Total (Overall) | 67,608 (51.3%) | 64,275 (48.7%) |
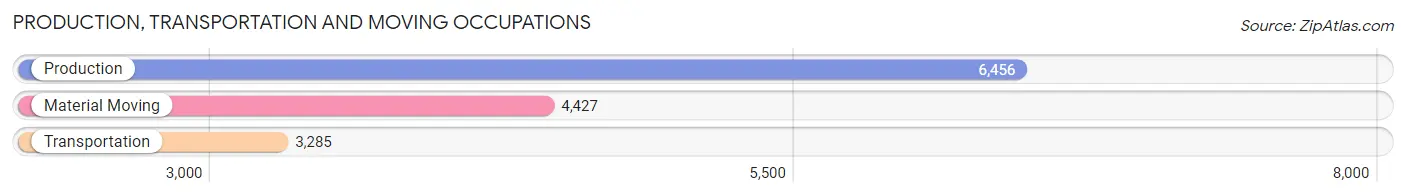
Production, Transportation and Moving Occupations
The most common Production, Transportation and Moving occupations in Buncombe County are Production (6,456 | 4.9%), Material Moving (4,427 | 3.4%), and Transportation (3,285 | 2.5%).
Production, Transportation and Moving Occupations by Sex
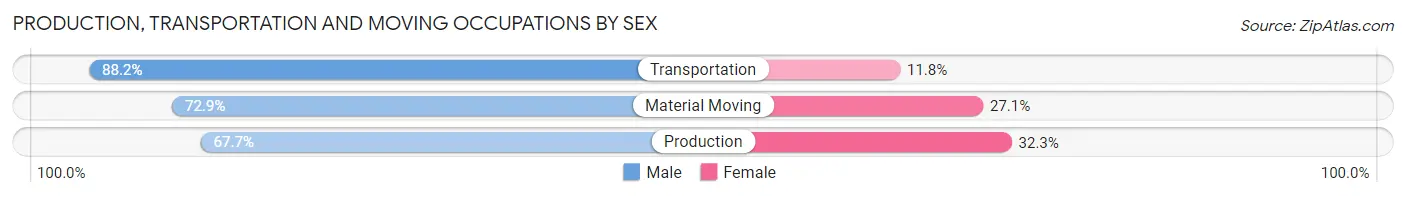
| Occupation | Male | Female |
| Production | 4,370 (67.7%) | 2,086 (32.3%) |
| Transportation | 2,896 (88.2%) | 389 (11.8%) |
| Material Moving | 3,229 (72.9%) | 1,198 (27.1%) |
| Total (Category) | 10,495 (74.1%) | 3,673 (25.9%) |
| Total (Overall) | 67,608 (51.3%) | 64,275 (48.7%) |
Employment Industries by Sex in Buncombe County
Employment Industries in Buncombe County
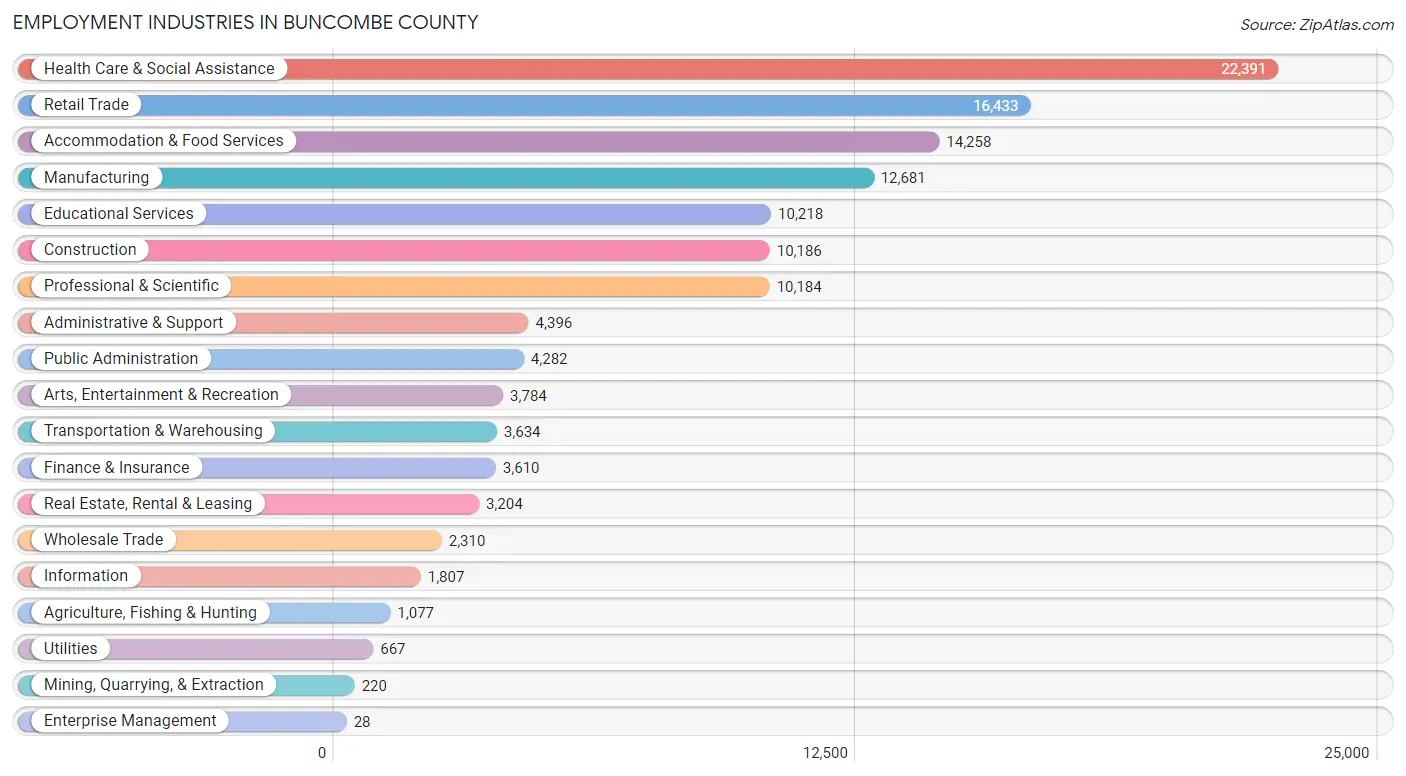
The major employment industries in Buncombe County include Health Care & Social Assistance (22,391 | 17.0%), Retail Trade (16,433 | 12.5%), Accommodation & Food Services (14,258 | 10.8%), Manufacturing (12,681 | 9.6%), and Educational Services (10,218 | 7.7%).
Employment Industries by Sex in Buncombe County
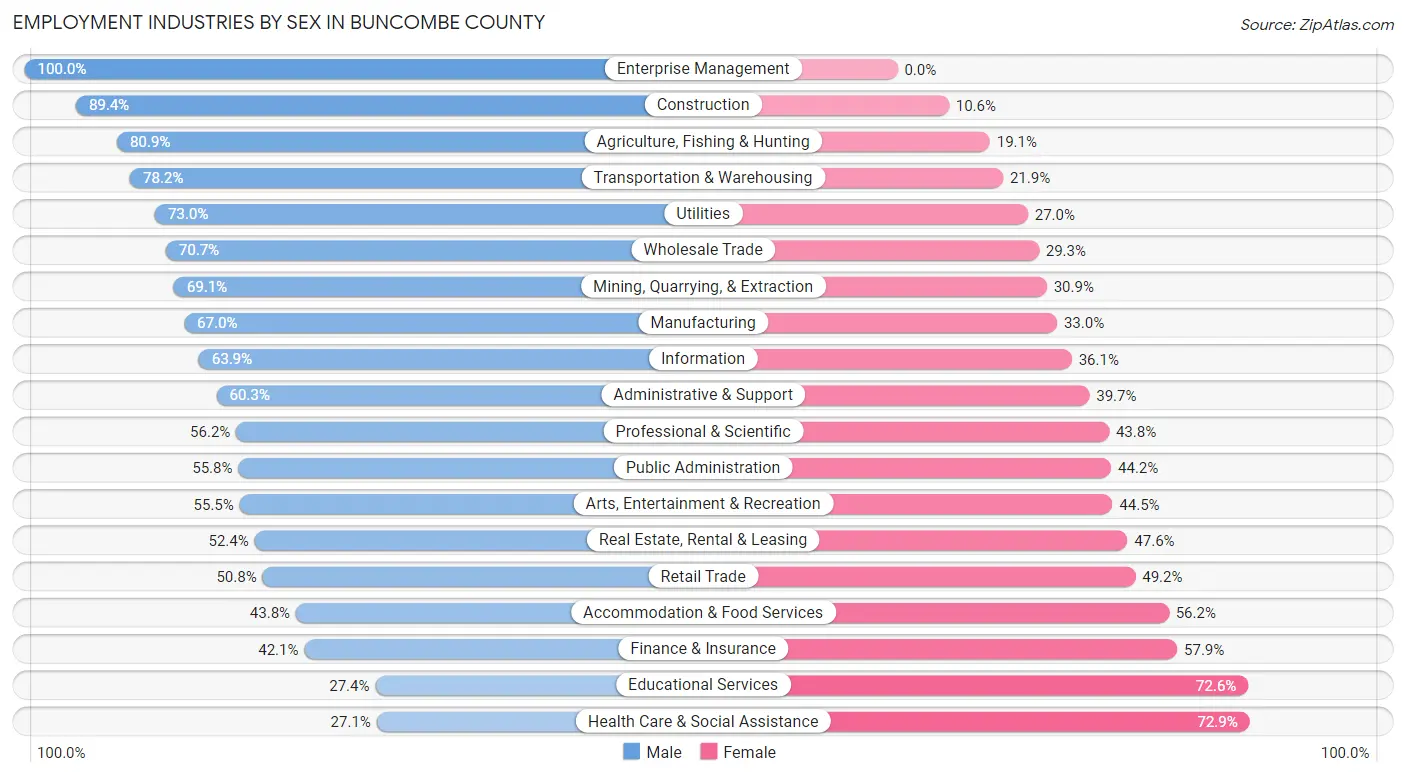
The Buncombe County industries that see more men than women are Enterprise Management (100.0%), Construction (89.4%), and Agriculture, Fishing & Hunting (80.9%), whereas the industries that tend to have a higher number of women are Health Care & Social Assistance (72.9%), Educational Services (72.6%), and Finance & Insurance (57.9%).
| Industry | Male | Female |
| Agriculture, Fishing & Hunting | 871 (80.9%) | 206 (19.1%) |
| Mining, Quarrying, & Extraction | 152 (69.1%) | 68 (30.9%) |
| Construction | 9,102 (89.4%) | 1,084 (10.6%) |
| Manufacturing | 8,493 (67.0%) | 4,188 (33.0%) |
| Wholesale Trade | 1,634 (70.7%) | 676 (29.3%) |
| Retail Trade | 8,341 (50.8%) | 8,092 (49.2%) |
| Transportation & Warehousing | 2,840 (78.1%) | 794 (21.8%) |
| Utilities | 487 (73.0%) | 180 (27.0%) |
| Information | 1,155 (63.9%) | 652 (36.1%) |
| Finance & Insurance | 1,520 (42.1%) | 2,090 (57.9%) |
| Real Estate, Rental & Leasing | 1,679 (52.4%) | 1,525 (47.6%) |
| Professional & Scientific | 5,724 (56.2%) | 4,460 (43.8%) |
| Enterprise Management | 28 (100.0%) | 0 (0.0%) |
| Administrative & Support | 2,650 (60.3%) | 1,746 (39.7%) |
| Educational Services | 2,801 (27.4%) | 7,417 (72.6%) |
| Health Care & Social Assistance | 6,075 (27.1%) | 16,316 (72.9%) |
| Arts, Entertainment & Recreation | 2,100 (55.5%) | 1,684 (44.5%) |
| Accommodation & Food Services | 6,250 (43.8%) | 8,008 (56.2%) |
| Public Administration | 2,388 (55.8%) | 1,894 (44.2%) |
| Total | 67,608 (51.3%) | 64,275 (48.7%) |
Education in Buncombe County
School Enrollment in Buncombe County
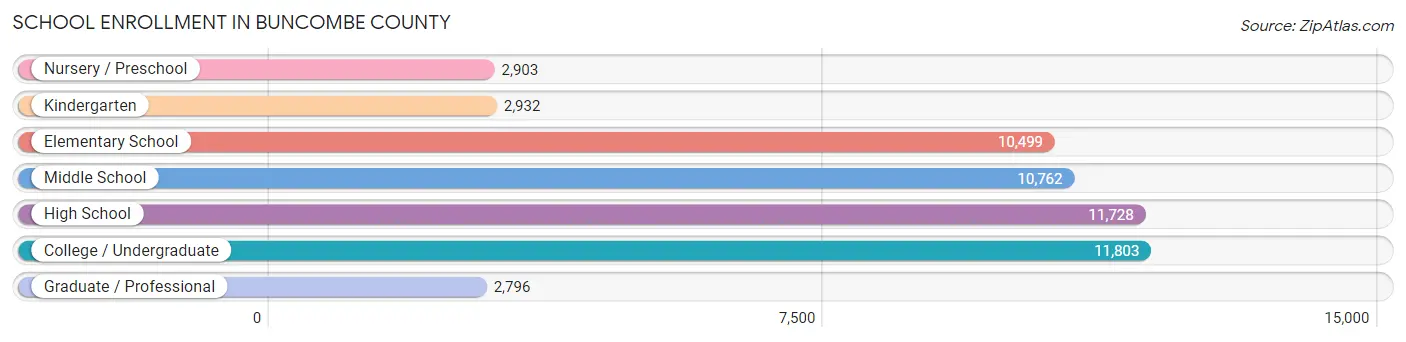
The most common levels of schooling among the 53,423 students in Buncombe County are college / undergraduate (11,803 | 22.1%), high school (11,728 | 22.0%), and middle school (10,762 | 20.1%).
| School Level | # Students | % Students |
| Nursery / Preschool | 2,903 | 5.4% |
| Kindergarten | 2,932 | 5.5% |
| Elementary School | 10,499 | 19.7% |
| Middle School | 10,762 | 20.1% |
| High School | 11,728 | 22.0% |
| College / Undergraduate | 11,803 | 22.1% |
| Graduate / Professional | 2,796 | 5.2% |
| Total | 53,423 | 100.0% |
School Enrollment by Age by Funding Source in Buncombe County
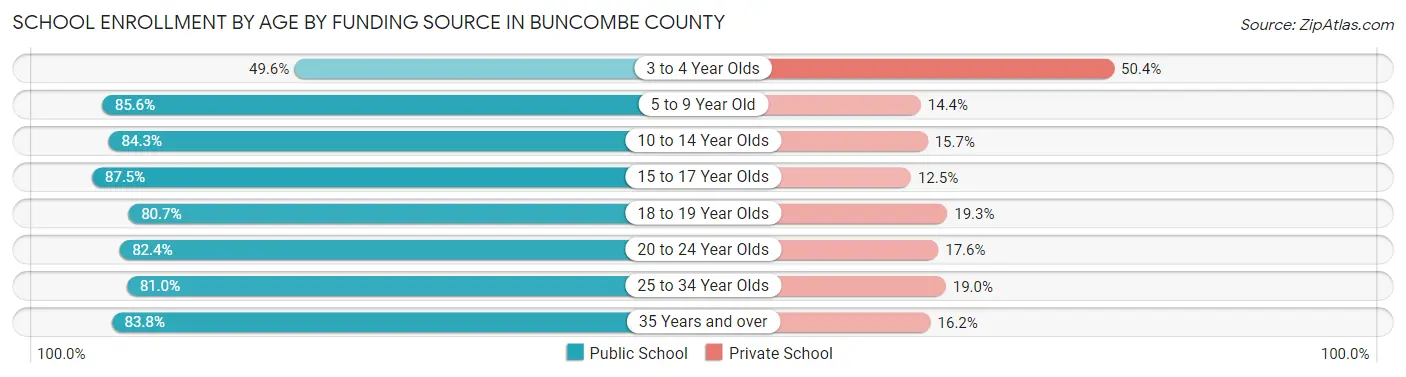
Out of a total of 53,423 students who are enrolled in schools in Buncombe County, 9,028 (16.9%) attend a private institution, while the remaining 44,395 (83.1%) are enrolled in public schools. The age group of 3 to 4 year olds has the highest likelihood of being enrolled in private schools, with 961 (50.4% in the age bracket) enrolled. Conversely, the age group of 15 to 17 year olds has the lowest likelihood of being enrolled in a private school, with 7,275 (87.5% in the age bracket) attending a public institution.
| Age Bracket | Public School | Private School |
| 3 to 4 Year Olds | 947 (49.6%) | 961 (50.4%) |
| 5 to 9 Year Old | 11,133 (85.6%) | 1,870 (14.4%) |
| 10 to 14 Year Olds | 11,276 (84.3%) | 2,094 (15.7%) |
| 15 to 17 Year Olds | 7,275 (87.5%) | 1,043 (12.5%) |
| 18 to 19 Year Olds | 3,794 (80.7%) | 908 (19.3%) |
| 20 to 24 Year Olds | 4,199 (82.4%) | 899 (17.6%) |
| 25 to 34 Year Olds | 3,357 (81.0%) | 789 (19.0%) |
| 35 Years and over | 2,412 (83.8%) | 466 (16.2%) |
| Total | 44,395 (83.1%) | 9,028 (16.9%) |
Educational Attainment by Field of Study in Buncombe County
Business (14,682 | 15.7%), education (10,784 | 11.6%), science & technology (8,350 | 8.9%), social sciences (7,181 | 7.7%), and bio, nature & agricultural (6,965 | 7.5%) are the most common fields of study among 93,331 individuals in Buncombe County who have obtained a bachelor's degree or higher.
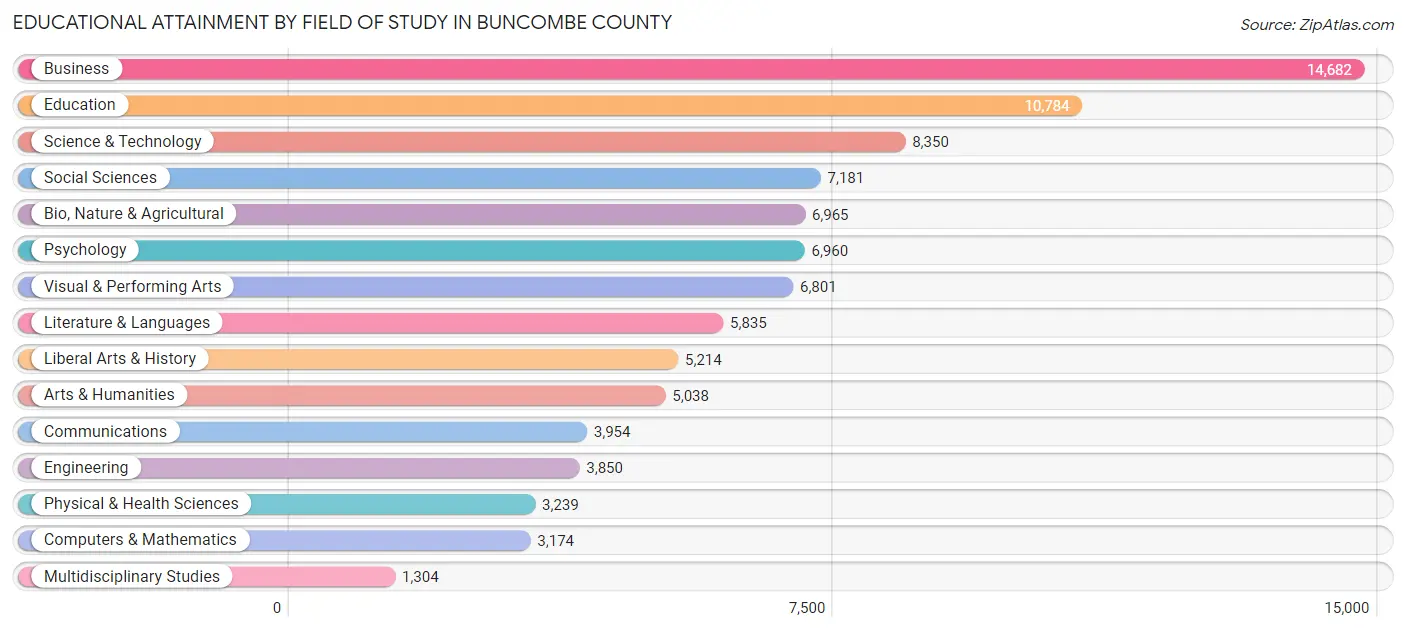
| Field of Study | # Graduates | % Graduates |
| Computers & Mathematics | 3,174 | 3.4% |
| Bio, Nature & Agricultural | 6,965 | 7.5% |
| Physical & Health Sciences | 3,239 | 3.5% |
| Psychology | 6,960 | 7.5% |
| Social Sciences | 7,181 | 7.7% |
| Engineering | 3,850 | 4.1% |
| Multidisciplinary Studies | 1,304 | 1.4% |
| Science & Technology | 8,350 | 8.9% |
| Business | 14,682 | 15.7% |
| Education | 10,784 | 11.6% |
| Literature & Languages | 5,835 | 6.2% |
| Liberal Arts & History | 5,214 | 5.6% |
| Visual & Performing Arts | 6,801 | 7.3% |
| Communications | 3,954 | 4.2% |
| Arts & Humanities | 5,038 | 5.4% |
| Total | 93,331 | 100.0% |
Transportation & Commute in Buncombe County
Vehicle Availability by Sex in Buncombe County
The most prevalent vehicle ownership categories in Buncombe County are males with 2 vehicles (29,229, accounting for 44.2%) and females with 2 vehicles (25,145, making up 46.6%).
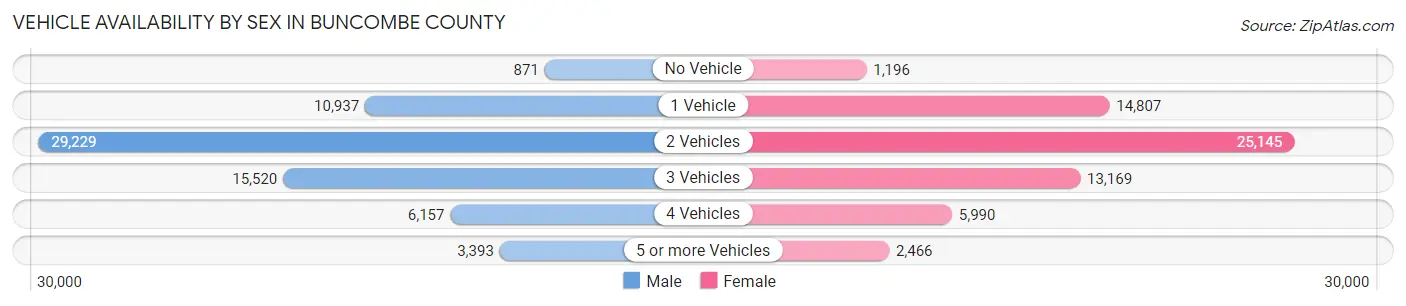
| Vehicles Available | Male | Female |
| No Vehicle | 871 (1.3%) | 1,196 (1.9%) |
| 1 Vehicle | 10,937 (16.5%) | 14,807 (23.6%) |
| 2 Vehicles | 29,229 (44.2%) | 25,145 (40.1%) |
| 3 Vehicles | 15,520 (23.5%) | 13,169 (21.0%) |
| 4 Vehicles | 6,157 (9.3%) | 5,990 (9.5%) |
| 5 or more Vehicles | 3,393 (5.1%) | 2,466 (3.9%) |
| Total | 66,107 (100.0%) | 62,773 (100.0%) |
Commute Time in Buncombe County
The most frequently occuring commute durations in Buncombe County are 20 to 24 minutes (28,261 commuters, 25.4%), 15 to 19 minutes (24,757 commuters, 22.2%), and 10 to 14 minutes (17,469 commuters, 15.7%).
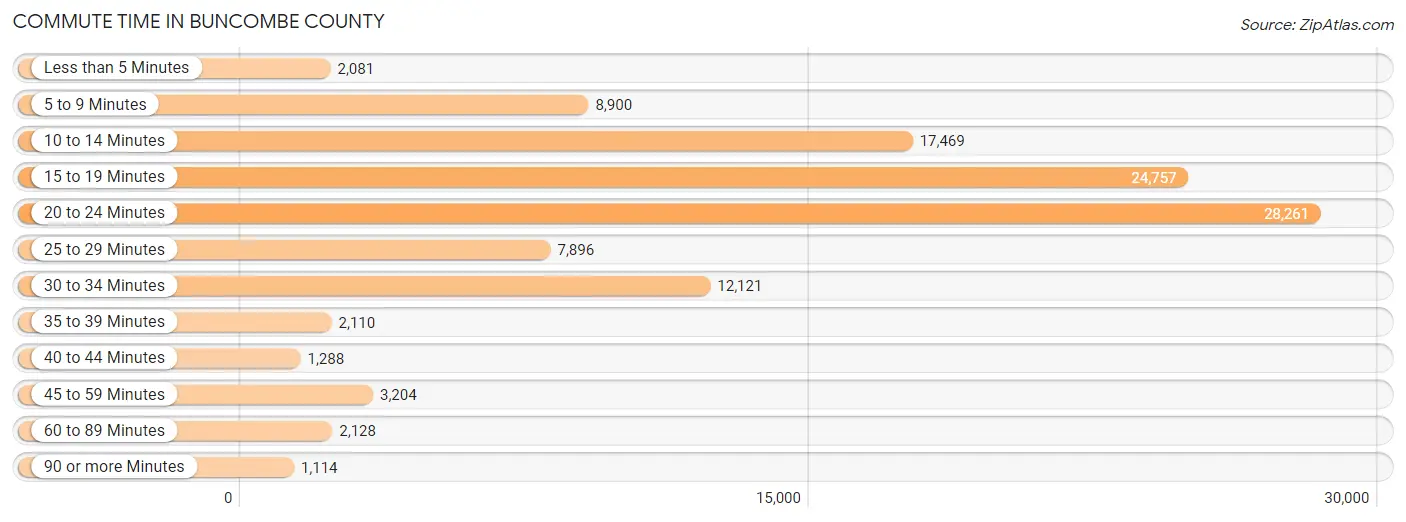
| Commute Time | # Commuters | % Commuters |
| Less than 5 Minutes | 2,081 | 1.9% |
| 5 to 9 Minutes | 8,900 | 8.0% |
| 10 to 14 Minutes | 17,469 | 15.7% |
| 15 to 19 Minutes | 24,757 | 22.2% |
| 20 to 24 Minutes | 28,261 | 25.4% |
| 25 to 29 Minutes | 7,896 | 7.1% |
| 30 to 34 Minutes | 12,121 | 10.9% |
| 35 to 39 Minutes | 2,110 | 1.9% |
| 40 to 44 Minutes | 1,288 | 1.2% |
| 45 to 59 Minutes | 3,204 | 2.9% |
| 60 to 89 Minutes | 2,128 | 1.9% |
| 90 or more Minutes | 1,114 | 1.0% |
Commute Time by Sex in Buncombe County
The most common commute times in Buncombe County are 20 to 24 minutes (14,274 commuters, 25.1%) for males and 20 to 24 minutes (13,987 commuters, 25.7%) for females.
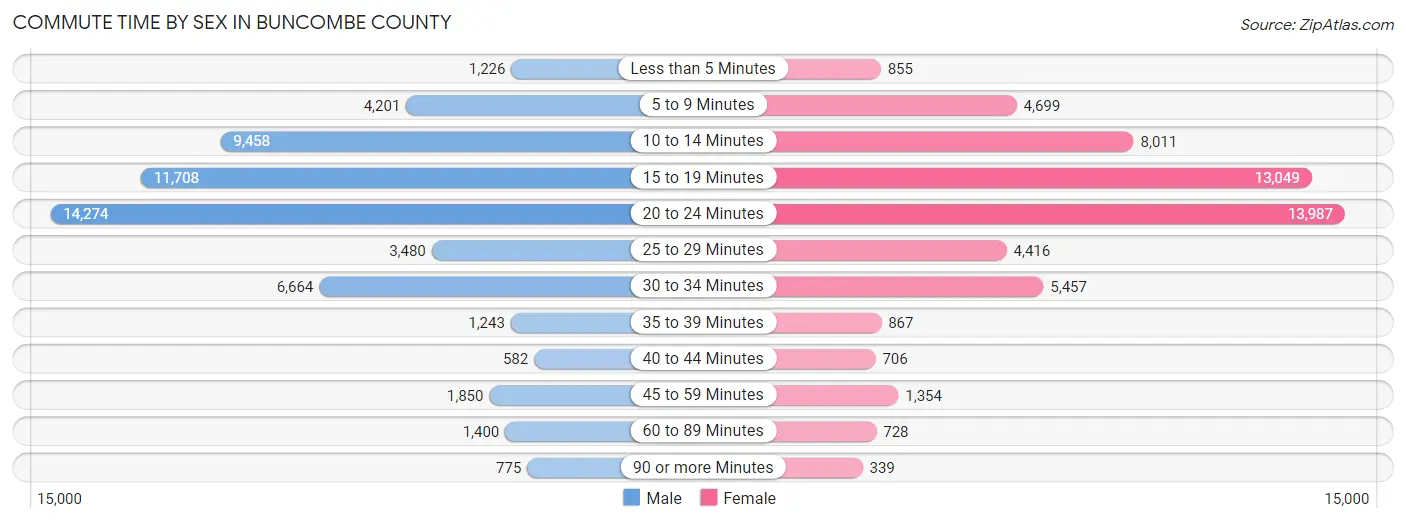
| Commute Time | Male | Female |
| Less than 5 Minutes | 1,226 (2.2%) | 855 (1.6%) |
| 5 to 9 Minutes | 4,201 (7.4%) | 4,699 (8.6%) |
| 10 to 14 Minutes | 9,458 (16.6%) | 8,011 (14.7%) |
| 15 to 19 Minutes | 11,708 (20.6%) | 13,049 (24.0%) |
| 20 to 24 Minutes | 14,274 (25.1%) | 13,987 (25.7%) |
| 25 to 29 Minutes | 3,480 (6.1%) | 4,416 (8.1%) |
| 30 to 34 Minutes | 6,664 (11.7%) | 5,457 (10.0%) |
| 35 to 39 Minutes | 1,243 (2.2%) | 867 (1.6%) |
| 40 to 44 Minutes | 582 (1.0%) | 706 (1.3%) |
| 45 to 59 Minutes | 1,850 (3.3%) | 1,354 (2.5%) |
| 60 to 89 Minutes | 1,400 (2.5%) | 728 (1.3%) |
| 90 or more Minutes | 775 (1.4%) | 339 (0.6%) |
Time of Departure to Work by Sex in Buncombe County
The most frequent times of departure to work in Buncombe County are 7:30 AM to 7:59 AM (8,642, 15.2%) for males and 7:30 AM to 7:59 AM (7,791, 14.3%) for females.
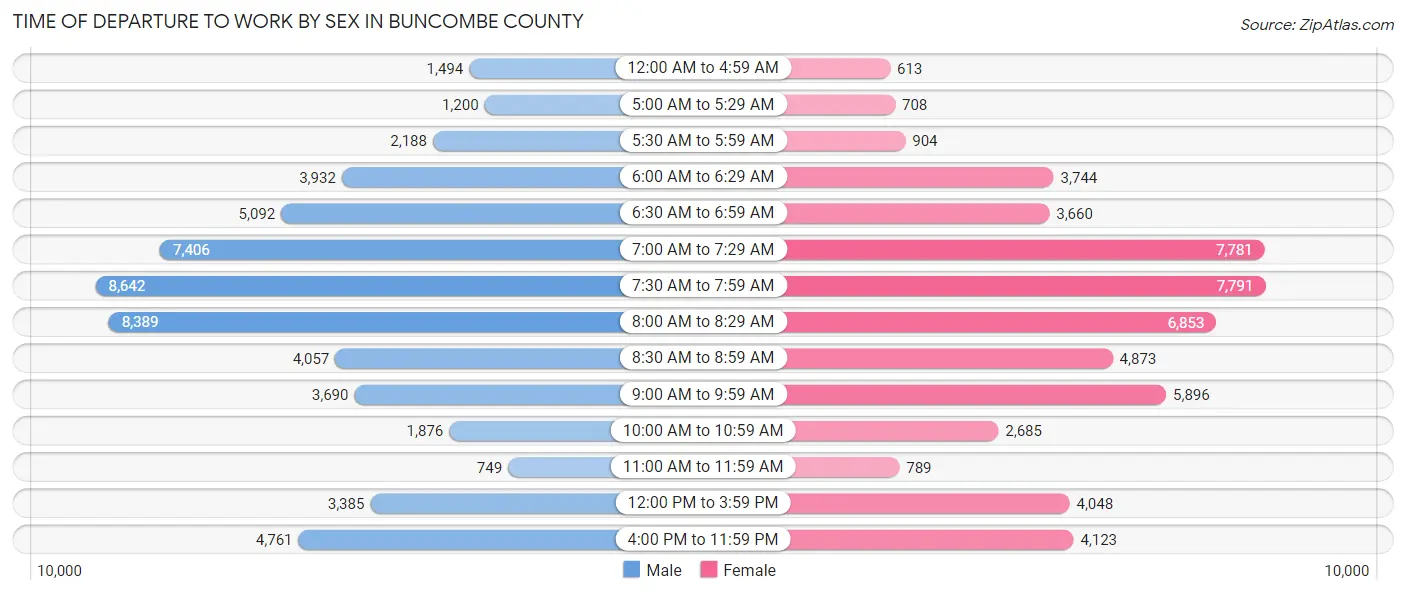
| Time of Departure | Male | Female |
| 12:00 AM to 4:59 AM | 1,494 (2.6%) | 613 (1.1%) |
| 5:00 AM to 5:29 AM | 1,200 (2.1%) | 708 (1.3%) |
| 5:30 AM to 5:59 AM | 2,188 (3.8%) | 904 (1.7%) |
| 6:00 AM to 6:29 AM | 3,932 (6.9%) | 3,744 (6.9%) |
| 6:30 AM to 6:59 AM | 5,092 (9.0%) | 3,660 (6.7%) |
| 7:00 AM to 7:29 AM | 7,406 (13.0%) | 7,781 (14.3%) |
| 7:30 AM to 7:59 AM | 8,642 (15.2%) | 7,791 (14.3%) |
| 8:00 AM to 8:29 AM | 8,389 (14.7%) | 6,853 (12.6%) |
| 8:30 AM to 8:59 AM | 4,057 (7.1%) | 4,873 (8.9%) |
| 9:00 AM to 9:59 AM | 3,690 (6.5%) | 5,896 (10.8%) |
| 10:00 AM to 10:59 AM | 1,876 (3.3%) | 2,685 (4.9%) |
| 11:00 AM to 11:59 AM | 749 (1.3%) | 789 (1.5%) |
| 12:00 PM to 3:59 PM | 3,385 (5.9%) | 4,048 (7.4%) |
| 4:00 PM to 11:59 PM | 4,761 (8.4%) | 4,123 (7.6%) |
| Total | 56,861 (100.0%) | 54,468 (100.0%) |
Housing Occupancy in Buncombe County
Occupancy by Ownership in Buncombe County
Of the total 102,921 dwellings in Buncombe County, owner-occupied units account for 66,276 (64.4%), while renter-occupied units make up 36,645 (35.6%).
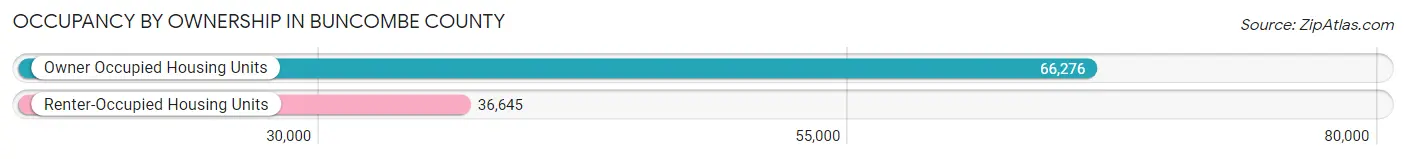
| Occupancy | # Housing Units | % Housing Units |
| Owner Occupied Housing Units | 66,276 | 64.4% |
| Renter-Occupied Housing Units | 36,645 | 35.6% |
| Total Occupied Housing Units | 102,921 | 100.0% |
Occupancy by Household Size in Buncombe County
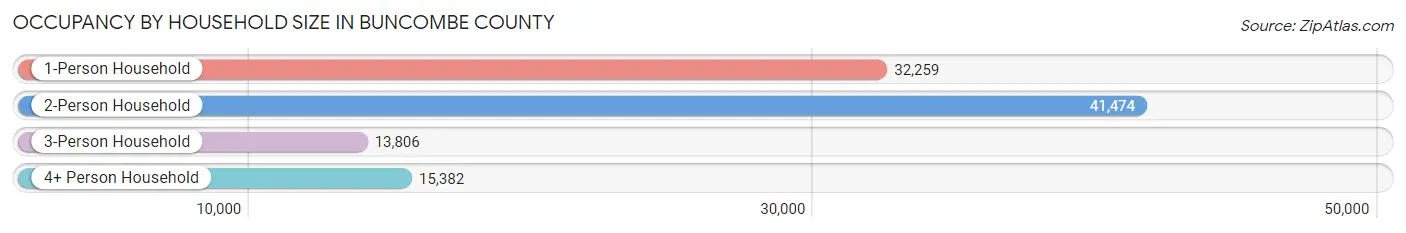
| Household Size | # Housing Units | % Housing Units |
| 1-Person Household | 32,259 | 31.3% |
| 2-Person Household | 41,474 | 40.3% |
| 3-Person Household | 13,806 | 13.4% |
| 4+ Person Household | 15,382 | 14.9% |
| Total Housing Units | 102,921 | 100.0% |
Occupancy by Ownership by Household Size in Buncombe County
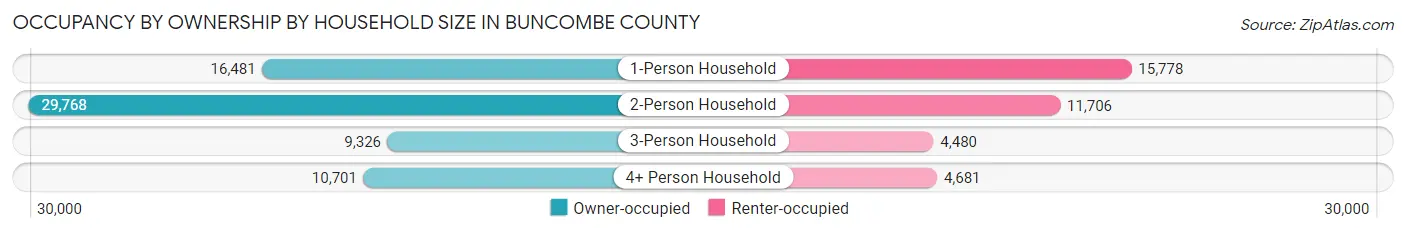
| Household Size | Owner-occupied | Renter-occupied |
| 1-Person Household | 16,481 (51.1%) | 15,778 (48.9%) |
| 2-Person Household | 29,768 (71.8%) | 11,706 (28.2%) |
| 3-Person Household | 9,326 (67.5%) | 4,480 (32.5%) |
| 4+ Person Household | 10,701 (69.6%) | 4,681 (30.4%) |
| Total Housing Units | 66,276 (64.4%) | 36,645 (35.6%) |
Occupancy by Educational Attainment in Buncombe County
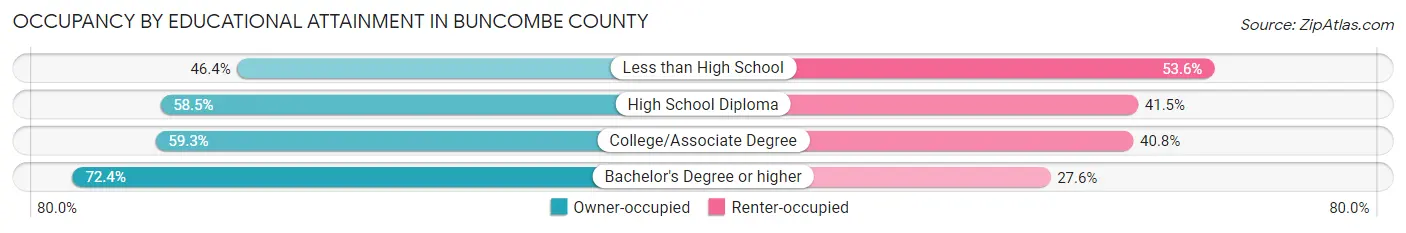
| Household Size | Owner-occupied | Renter-occupied |
| Less than High School | 3,023 (46.4%) | 3,493 (53.6%) |
| High School Diploma | 11,952 (58.5%) | 8,484 (41.5%) |
| College/Associate Degree | 16,671 (59.3%) | 11,465 (40.7%) |
| Bachelor's Degree or higher | 34,630 (72.4%) | 13,203 (27.6%) |
Occupancy by Age of Householder in Buncombe County
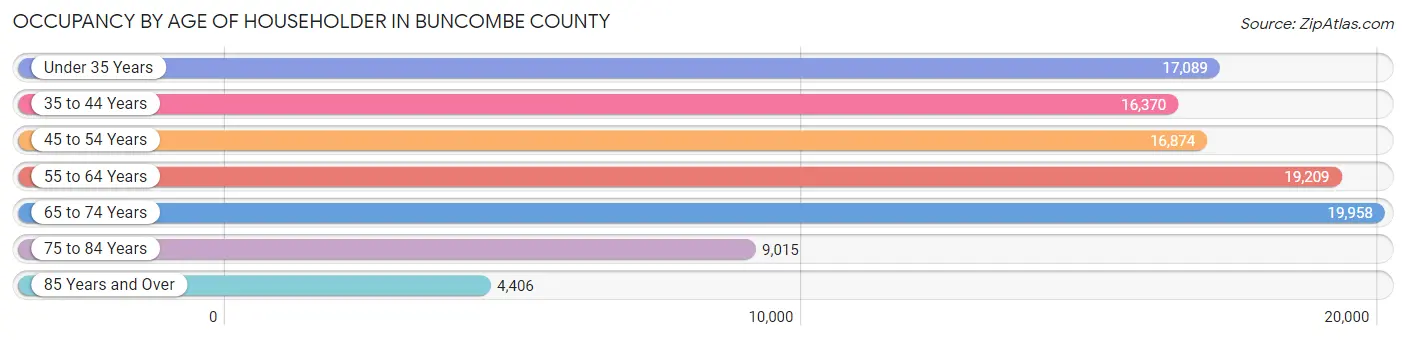
| Age Bracket | # Households | % Households |
| Under 35 Years | 17,089 | 16.6% |
| 35 to 44 Years | 16,370 | 15.9% |
| 45 to 54 Years | 16,874 | 16.4% |
| 55 to 64 Years | 19,209 | 18.7% |
| 65 to 74 Years | 19,958 | 19.4% |
| 75 to 84 Years | 9,015 | 8.8% |
| 85 Years and Over | 4,406 | 4.3% |
| Total | 102,921 | 100.0% |
Housing Finances in Buncombe County
Median Income by Occupancy in Buncombe County
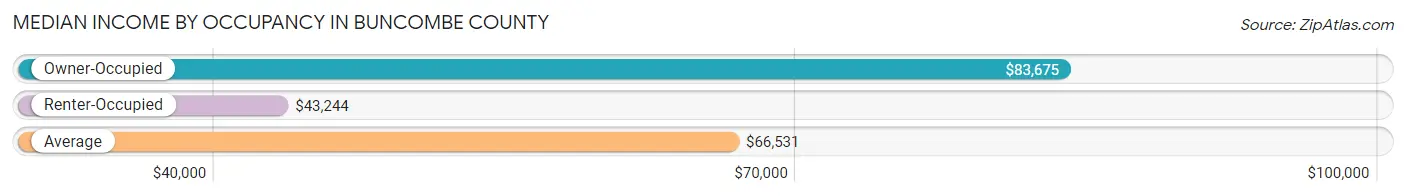
| Occupancy Type | # Households | Median Income |
| Owner-Occupied | 66,276 (64.4%) | $83,675 |
| Renter-Occupied | 36,645 (35.6%) | $43,244 |
| Average | 102,921 (100.0%) | $66,531 |
Occupancy by Householder Income Bracket in Buncombe County
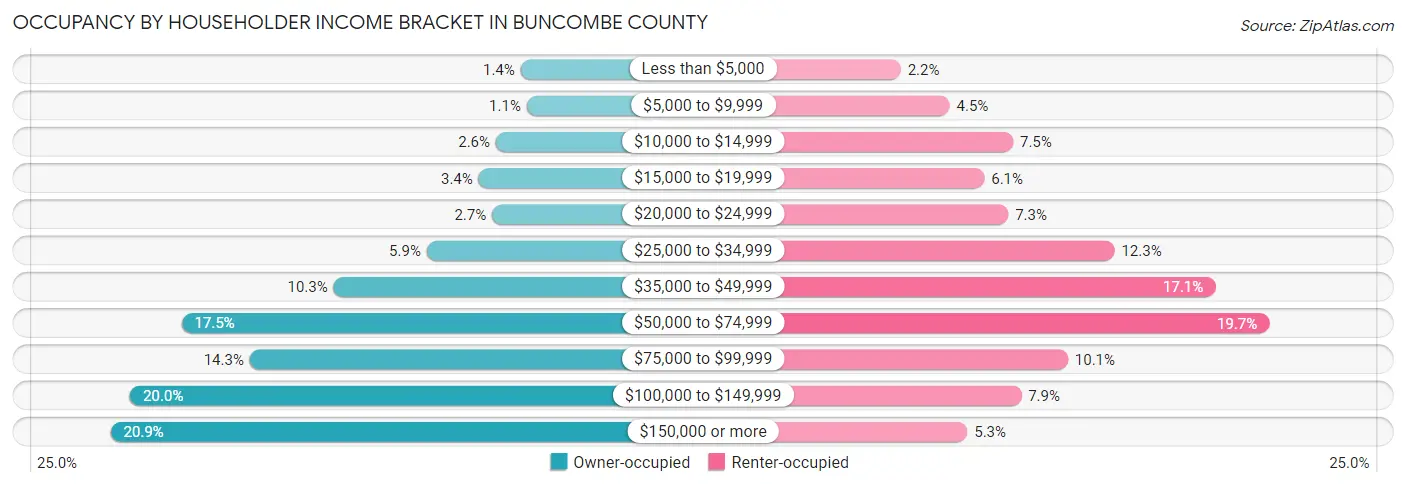
| Income Bracket | Owner-occupied | Renter-occupied |
| Less than $5,000 | 913 (1.4%) | 789 (2.1%) |
| $5,000 to $9,999 | 725 (1.1%) | 1,642 (4.5%) |
| $10,000 to $14,999 | 1,699 (2.6%) | 2,748 (7.5%) |
| $15,000 to $19,999 | 2,242 (3.4%) | 2,246 (6.1%) |
| $20,000 to $24,999 | 1,819 (2.7%) | 2,665 (7.3%) |
| $25,000 to $34,999 | 3,876 (5.9%) | 4,518 (12.3%) |
| $35,000 to $49,999 | 6,821 (10.3%) | 6,273 (17.1%) |
| $50,000 to $74,999 | 11,618 (17.5%) | 7,215 (19.7%) |
| $75,000 to $99,999 | 9,466 (14.3%) | 3,705 (10.1%) |
| $100,000 to $149,999 | 13,242 (20.0%) | 2,893 (7.9%) |
| $150,000 or more | 13,855 (20.9%) | 1,951 (5.3%) |
| Total | 66,276 (100.0%) | 36,645 (100.0%) |
Monthly Housing Cost Tiers in Buncombe County
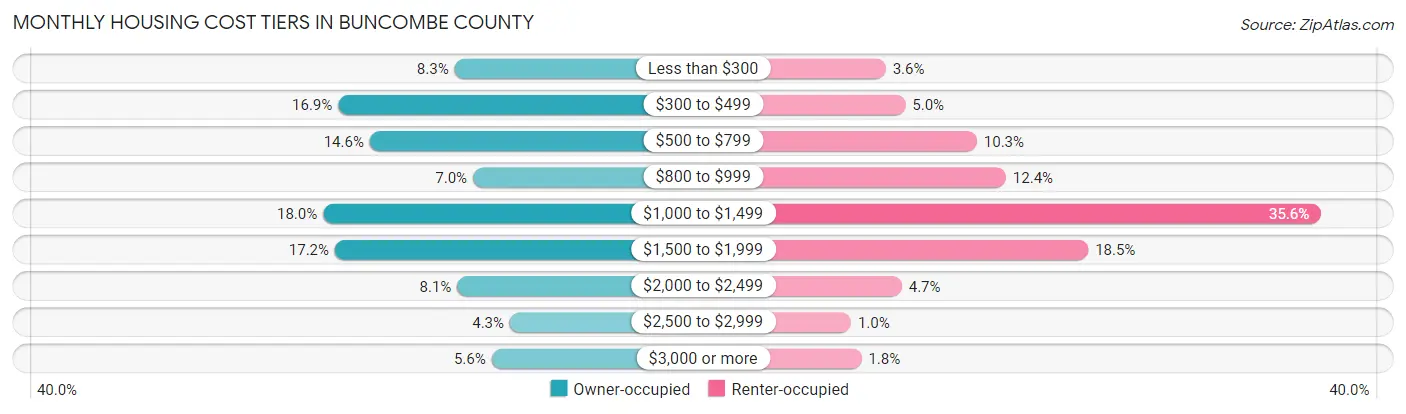
| Monthly Cost | Owner-occupied | Renter-occupied |
| Less than $300 | 5,525 (8.3%) | 1,305 (3.6%) |
| $300 to $499 | 11,208 (16.9%) | 1,834 (5.0%) |
| $500 to $799 | 9,660 (14.6%) | 3,763 (10.3%) |
| $800 to $999 | 4,628 (7.0%) | 4,546 (12.4%) |
| $1,000 to $1,499 | 11,944 (18.0%) | 13,053 (35.6%) |
| $1,500 to $1,999 | 11,369 (17.2%) | 6,770 (18.5%) |
| $2,000 to $2,499 | 5,398 (8.1%) | 1,736 (4.7%) |
| $2,500 to $2,999 | 2,823 (4.3%) | 367 (1.0%) |
| $3,000 or more | 3,721 (5.6%) | 650 (1.8%) |
| Total | 66,276 (100.0%) | 36,645 (100.0%) |
Physical Housing Characteristics in Buncombe County
Housing Structures in Buncombe County
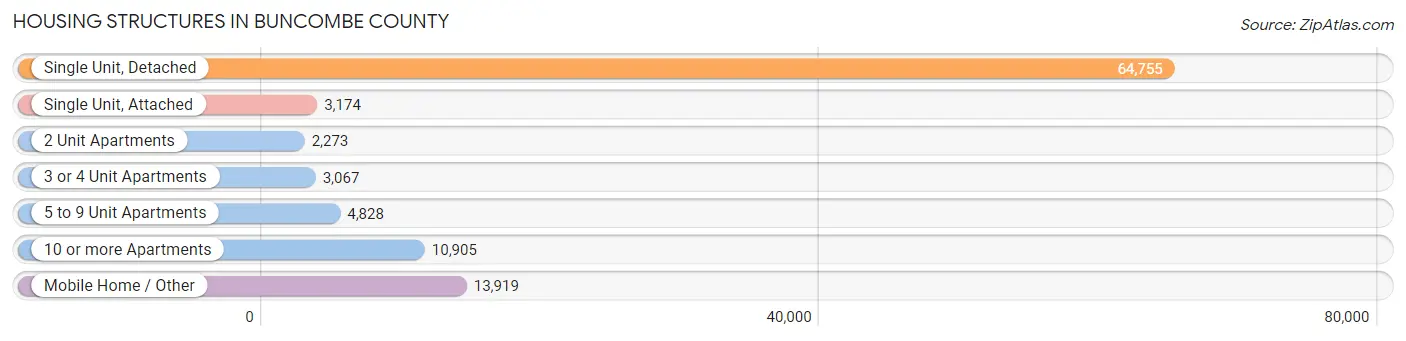
| Structure Type | # Housing Units | % Housing Units |
| Single Unit, Detached | 64,755 | 62.9% |
| Single Unit, Attached | 3,174 | 3.1% |
| 2 Unit Apartments | 2,273 | 2.2% |
| 3 or 4 Unit Apartments | 3,067 | 3.0% |
| 5 to 9 Unit Apartments | 4,828 | 4.7% |
| 10 or more Apartments | 10,905 | 10.6% |
| Mobile Home / Other | 13,919 | 13.5% |
| Total | 102,921 | 100.0% |
Housing Structures by Occupancy in Buncombe County
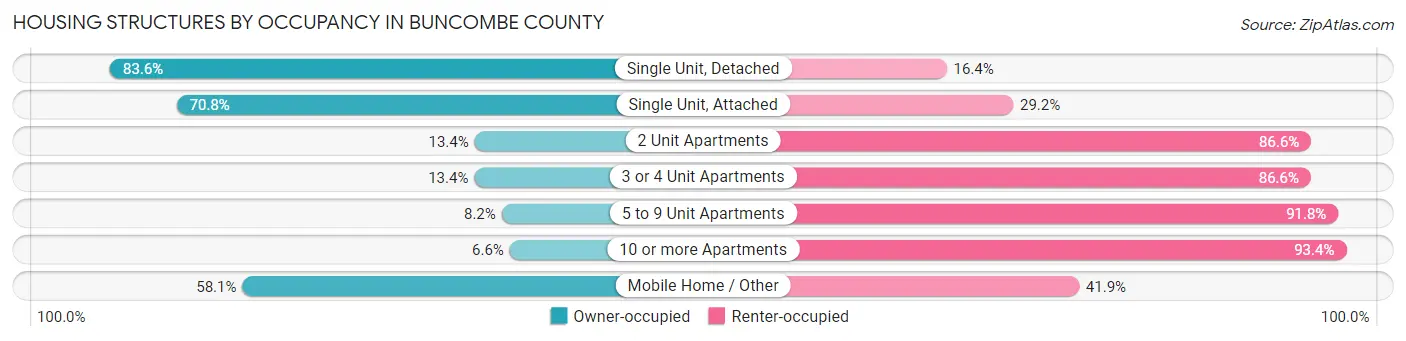
| Structure Type | Owner-occupied | Renter-occupied |
| Single Unit, Detached | 54,115 (83.6%) | 10,640 (16.4%) |
| Single Unit, Attached | 2,246 (70.8%) | 928 (29.2%) |
| 2 Unit Apartments | 304 (13.4%) | 1,969 (86.6%) |
| 3 or 4 Unit Apartments | 412 (13.4%) | 2,655 (86.6%) |
| 5 to 9 Unit Apartments | 394 (8.2%) | 4,434 (91.8%) |
| 10 or more Apartments | 721 (6.6%) | 10,184 (93.4%) |
| Mobile Home / Other | 8,084 (58.1%) | 5,835 (41.9%) |
| Total | 66,276 (64.4%) | 36,645 (35.6%) |
Housing Structures by Number of Rooms in Buncombe County
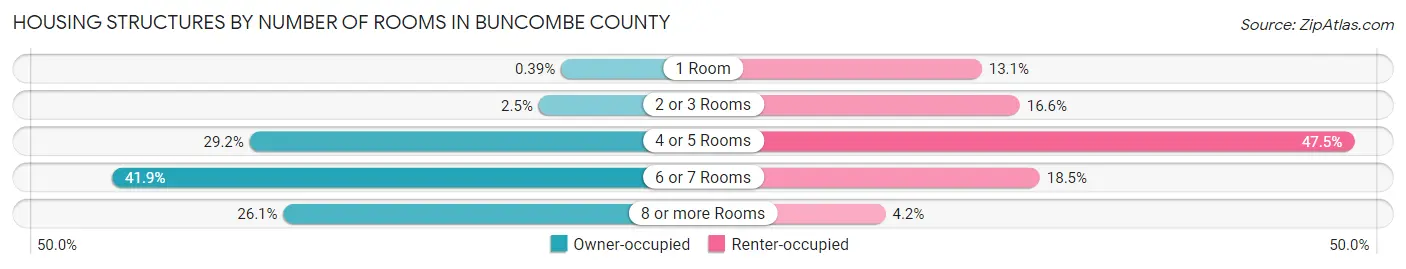
| Number of Rooms | Owner-occupied | Renter-occupied |
| 1 Room | 258 (0.4%) | 4,806 (13.1%) |
| 2 or 3 Rooms | 1,625 (2.5%) | 6,097 (16.6%) |
| 4 or 5 Rooms | 19,345 (29.2%) | 17,420 (47.5%) |
| 6 or 7 Rooms | 27,773 (41.9%) | 6,777 (18.5%) |
| 8 or more Rooms | 17,275 (26.1%) | 1,545 (4.2%) |
| Total | 66,276 (100.0%) | 36,645 (100.0%) |
Housing Structure by Heating Type in Buncombe County
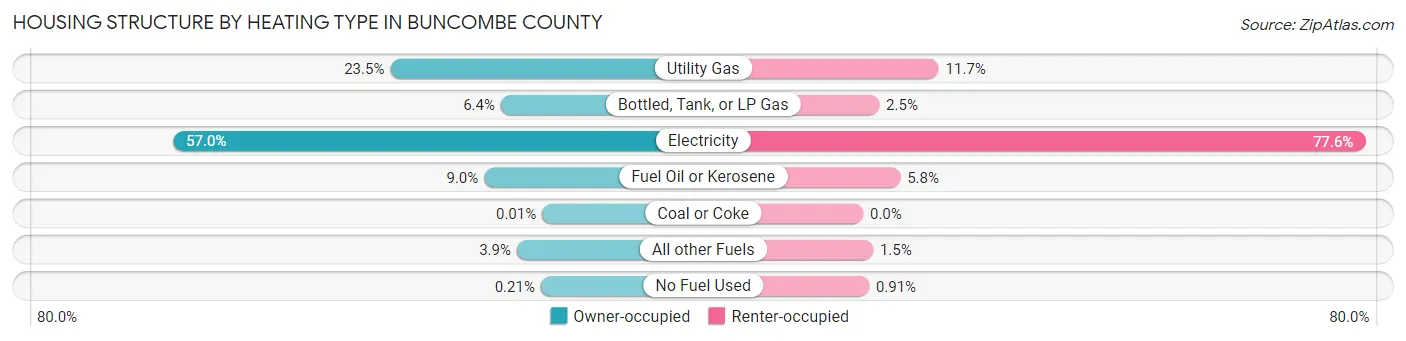
| Heating Type | Owner-occupied | Renter-occupied |
| Utility Gas | 15,560 (23.5%) | 4,285 (11.7%) |
| Bottled, Tank, or LP Gas | 4,230 (6.4%) | 914 (2.5%) |
| Electricity | 37,804 (57.0%) | 28,443 (77.6%) |
| Fuel Oil or Kerosene | 5,940 (9.0%) | 2,108 (5.8%) |
| Coal or Coke | 9 (0.0%) | 0 (0.0%) |
| All other Fuels | 2,594 (3.9%) | 562 (1.5%) |
| No Fuel Used | 139 (0.2%) | 333 (0.9%) |
| Total | 66,276 (100.0%) | 36,645 (100.0%) |
Household Vehicle Usage in Buncombe County
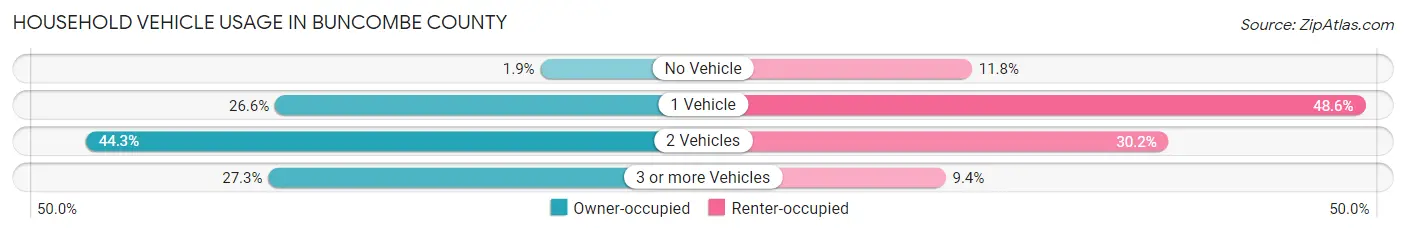
| Vehicles per Household | Owner-occupied | Renter-occupied |
| No Vehicle | 1,227 (1.8%) | 4,338 (11.8%) |
| 1 Vehicle | 17,641 (26.6%) | 17,800 (48.6%) |
| 2 Vehicles | 29,350 (44.3%) | 11,067 (30.2%) |
| 3 or more Vehicles | 18,058 (27.3%) | 3,440 (9.4%) |
| Total | 66,276 (100.0%) | 36,645 (100.0%) |
Real Estate & Mortgages in Buncombe County
Real Estate and Mortgage Overview in Buncombe County
| Characteristic | Without Mortgage | With Mortgage |
| Housing Units | 28,258 | 38,018 |
| Median Property Value | $292,800 | $349,600 |
| Median Household Income | $59,098 | $9,957 |
| Monthly Housing Costs | $460 | $3,637 |
| Real Estate Taxes | $1,804 | $611 |
Property Value by Mortgage Status in Buncombe County
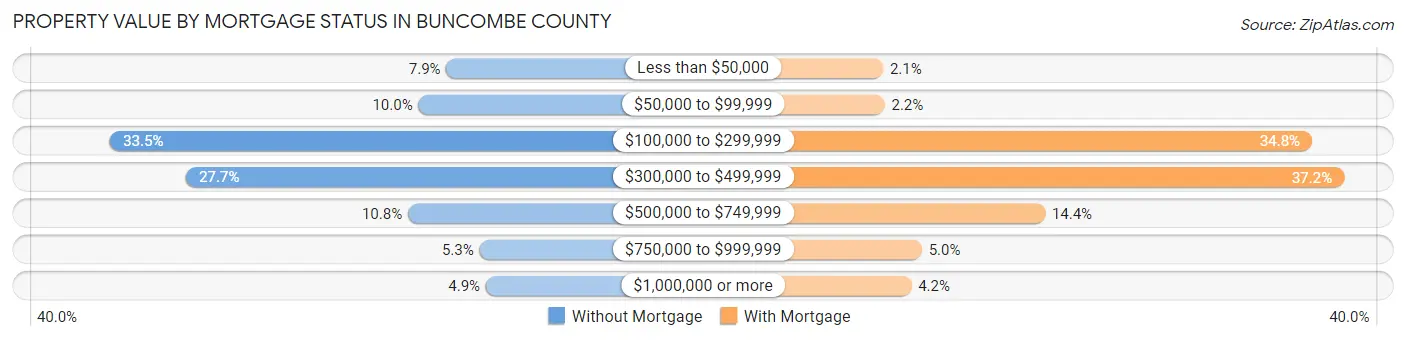
| Property Value | Without Mortgage | With Mortgage |
| Less than $50,000 | 2,220 (7.9%) | 795 (2.1%) |
| $50,000 to $99,999 | 2,822 (10.0%) | 842 (2.2%) |
| $100,000 to $299,999 | 9,460 (33.5%) | 13,220 (34.8%) |
| $300,000 to $499,999 | 7,827 (27.7%) | 14,147 (37.2%) |
| $500,000 to $749,999 | 3,049 (10.8%) | 5,486 (14.4%) |
| $750,000 to $999,999 | 1,509 (5.3%) | 1,916 (5.0%) |
| $1,000,000 or more | 1,371 (4.9%) | 1,612 (4.2%) |
| Total | 28,258 (100.0%) | 38,018 (100.0%) |
Household Income by Mortgage Status in Buncombe County

| Household Income | Without Mortgage | With Mortgage |
| Less than $10,000 | 1,092 (3.9%) | 516 (1.4%) |
| $10,000 to $24,999 | 4,364 (15.4%) | 546 (1.4%) |
| $25,000 to $34,999 | 2,419 (8.6%) | 1,396 (3.7%) |
| $35,000 to $49,999 | 4,170 (14.8%) | 1,457 (3.8%) |
| $50,000 to $74,999 | 4,848 (17.2%) | 2,651 (7.0%) |
| $75,000 to $99,999 | 3,264 (11.6%) | 6,770 (17.8%) |
| $100,000 to $149,999 | 4,203 (14.9%) | 6,202 (16.3%) |
| $150,000 or more | 3,898 (13.8%) | 9,039 (23.8%) |
| Total | 28,258 (100.0%) | 38,018 (100.0%) |
Property Value to Household Income Ratio in Buncombe County
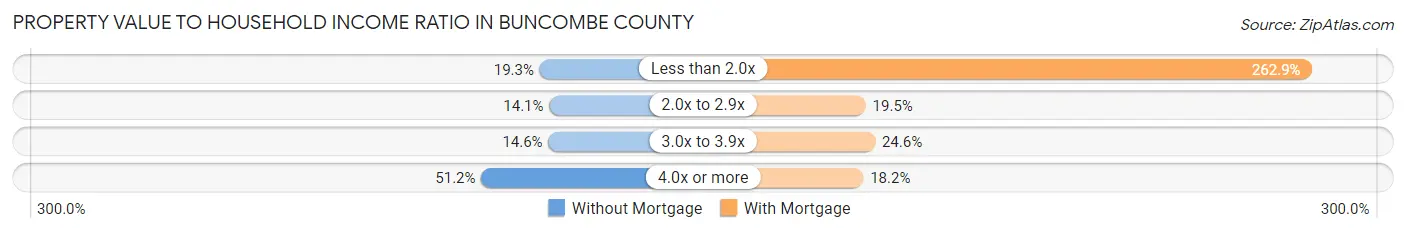
| Value-to-Income Ratio | Without Mortgage | With Mortgage |
| Less than 2.0x | 5,459 (19.3%) | 99,937 (262.9%) |
| 2.0x to 2.9x | 3,984 (14.1%) | 7,404 (19.5%) |
| 3.0x to 3.9x | 4,121 (14.6%) | 9,337 (24.6%) |
| 4.0x or more | 14,455 (51.1%) | 6,902 (18.1%) |
| Total | 28,258 (100.0%) | 38,018 (100.0%) |
Real Estate Taxes by Mortgage Status in Buncombe County
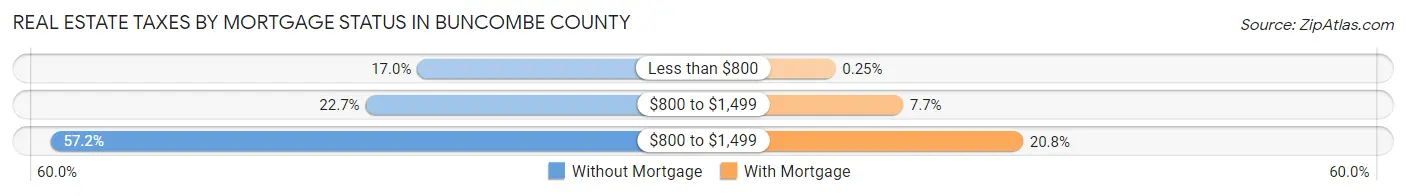
| Property Taxes | Without Mortgage | With Mortgage |
| Less than $800 | 4,796 (17.0%) | 94 (0.3%) |
| $800 to $1,499 | 6,401 (22.7%) | 2,910 (7.6%) |
| $800 to $1,499 | 16,149 (57.2%) | 7,903 (20.8%) |
| Total | 28,258 (100.0%) | 38,018 (100.0%) |
Health & Disability in Buncombe County
Health Insurance Coverage by Age in Buncombe County
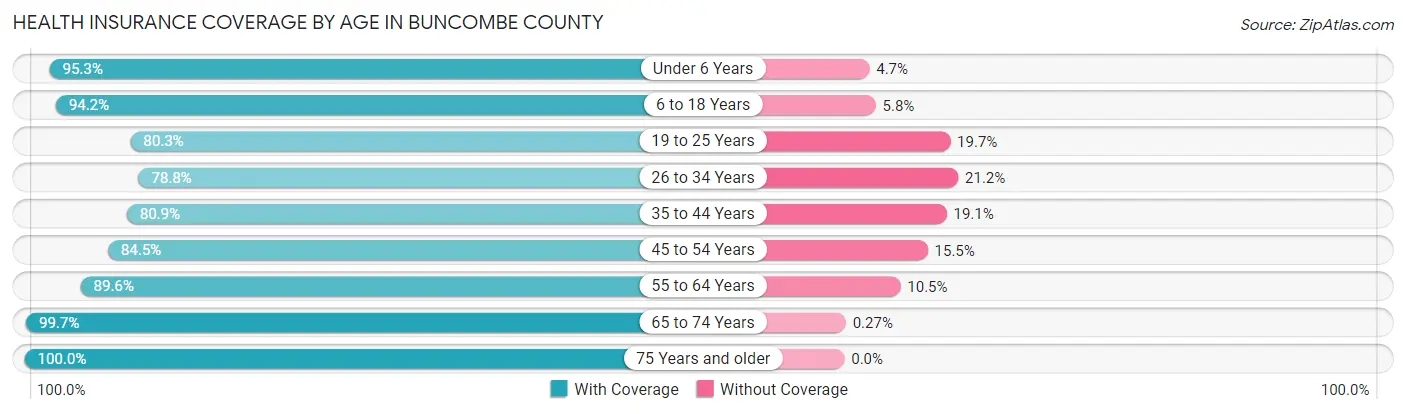
| Age Bracket | With Coverage | Without Coverage |
| Under 6 Years | 14,457 (95.3%) | 707 (4.7%) |
| 6 to 18 Years | 34,123 (94.2%) | 2,118 (5.8%) |
| 19 to 25 Years | 17,869 (80.3%) | 4,394 (19.7%) |
| 26 to 34 Years | 25,341 (78.8%) | 6,829 (21.2%) |
| 35 to 44 Years | 29,346 (80.9%) | 6,913 (19.1%) |
| 45 to 54 Years | 28,670 (84.5%) | 5,277 (15.5%) |
| 55 to 64 Years | 32,393 (89.5%) | 3,780 (10.4%) |
| 65 to 74 Years | 32,586 (99.7%) | 87 (0.3%) |
| 75 Years and older | 20,710 (100.0%) | 0 (0.0%) |
| Total | 235,495 (88.7%) | 30,105 (11.3%) |
Health Insurance Coverage by Citizenship Status in Buncombe County
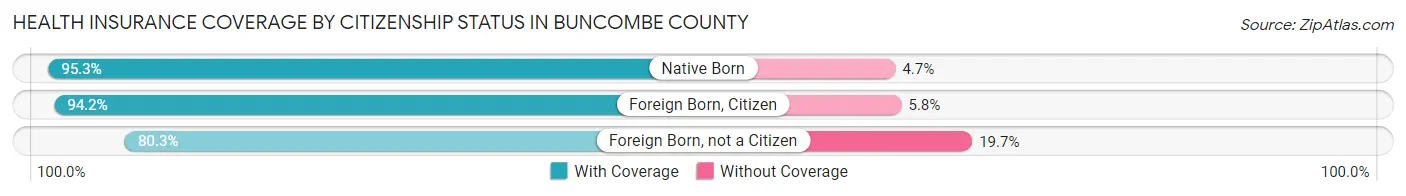
| Citizenship Status | With Coverage | Without Coverage |
| Native Born | 14,457 (95.3%) | 707 (4.7%) |
| Foreign Born, Citizen | 34,123 (94.2%) | 2,118 (5.8%) |
| Foreign Born, not a Citizen | 17,869 (80.3%) | 4,394 (19.7%) |
Health Insurance Coverage by Household Income in Buncombe County
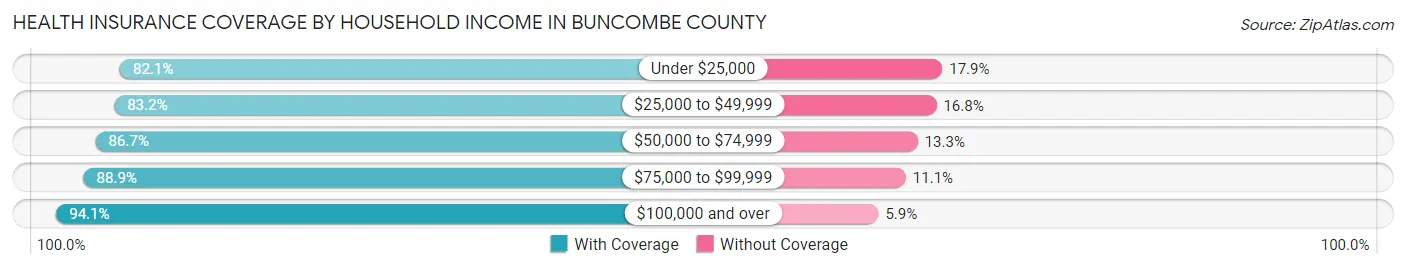
| Household Income | With Coverage | Without Coverage |
| Under $25,000 | 22,567 (82.1%) | 4,916 (17.9%) |
| $25,000 to $49,999 | 41,289 (83.2%) | 8,340 (16.8%) |
| $50,000 to $74,999 | 42,251 (86.7%) | 6,477 (13.3%) |
| $75,000 to $99,999 | 33,312 (88.9%) | 4,146 (11.1%) |
| $100,000 and over | 93,019 (94.1%) | 5,870 (5.9%) |
Public vs Private Health Insurance Coverage by Age in Buncombe County
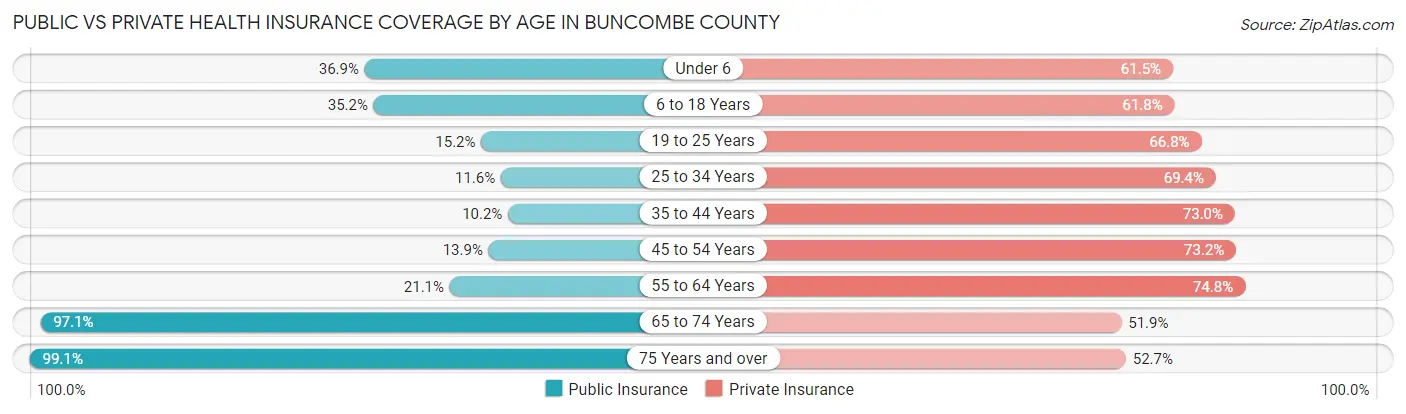
| Age Bracket | Public Insurance | Private Insurance |
| Under 6 | 5,588 (36.8%) | 9,319 (61.5%) |
| 6 to 18 Years | 12,750 (35.2%) | 22,383 (61.8%) |
| 19 to 25 Years | 3,389 (15.2%) | 14,860 (66.7%) |
| 25 to 34 Years | 3,722 (11.6%) | 22,329 (69.4%) |
| 35 to 44 Years | 3,714 (10.2%) | 26,450 (73.0%) |
| 45 to 54 Years | 4,703 (13.9%) | 24,845 (73.2%) |
| 55 to 64 Years | 7,617 (21.1%) | 27,072 (74.8%) |
| 65 to 74 Years | 31,727 (97.1%) | 16,951 (51.9%) |
| 75 Years and over | 20,517 (99.1%) | 10,919 (52.7%) |
| Total | 93,727 (35.3%) | 175,128 (65.9%) |
Disability Status by Sex by Age in Buncombe County
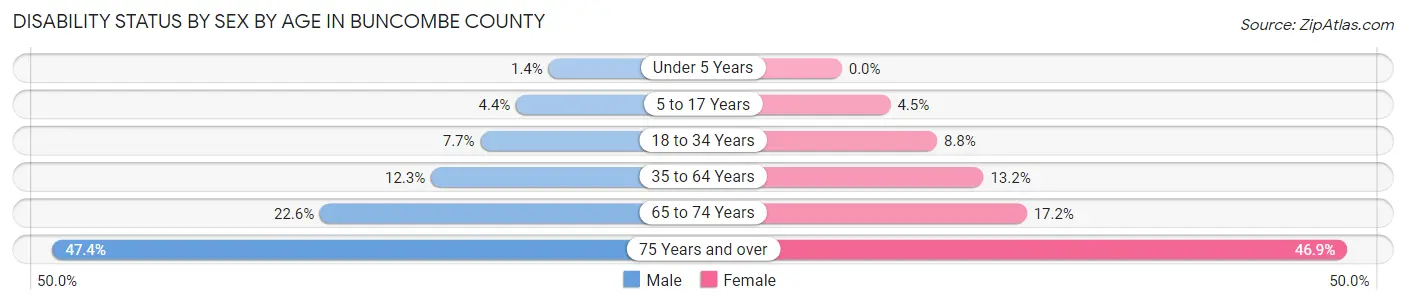
| Age Bracket | Male | Female |
| Under 5 Years | 88 (1.4%) | 0 (0.0%) |
| 5 to 17 Years | 805 (4.4%) | 796 (4.5%) |
| 18 to 34 Years | 2,166 (7.7%) | 2,587 (8.8%) |
| 35 to 64 Years | 6,369 (12.3%) | 7,170 (13.2%) |
| 65 to 74 Years | 3,400 (22.6%) | 3,023 (17.2%) |
| 75 Years and over | 4,012 (47.4%) | 5,742 (46.9%) |
Disability Class by Sex by Age in Buncombe County
Disability Class: Hearing Difficulty
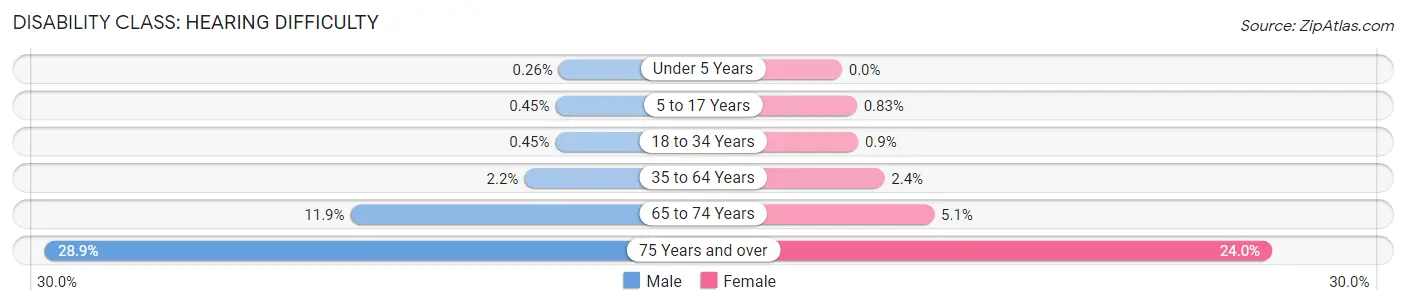
| Age Bracket | Male | Female |
| Under 5 Years | 17 (0.3%) | 0 (0.0%) |
| 5 to 17 Years | 83 (0.4%) | 146 (0.8%) |
| 18 to 34 Years | 126 (0.4%) | 264 (0.9%) |
| 35 to 64 Years | 1,131 (2.2%) | 1,293 (2.4%) |
| 65 to 74 Years | 1,786 (11.9%) | 905 (5.1%) |
| 75 Years and over | 2,443 (28.9%) | 2,933 (23.9%) |
Disability Class: Vision Difficulty
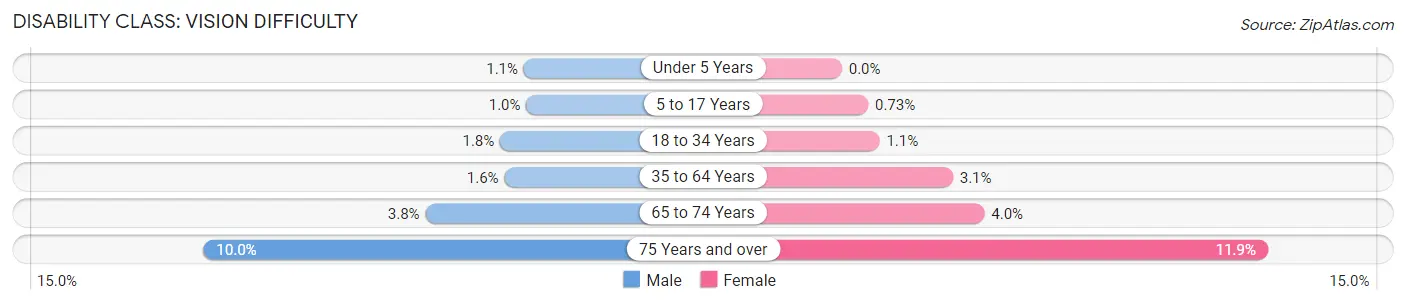
| Age Bracket | Male | Female |
| Under 5 Years | 71 (1.1%) | 0 (0.0%) |
| 5 to 17 Years | 190 (1.0%) | 129 (0.7%) |
| 18 to 34 Years | 494 (1.8%) | 307 (1.1%) |
| 35 to 64 Years | 851 (1.6%) | 1,687 (3.1%) |
| 65 to 74 Years | 578 (3.8%) | 699 (4.0%) |
| 75 Years and over | 848 (10.0%) | 1,452 (11.9%) |
Disability Class: Cognitive Difficulty
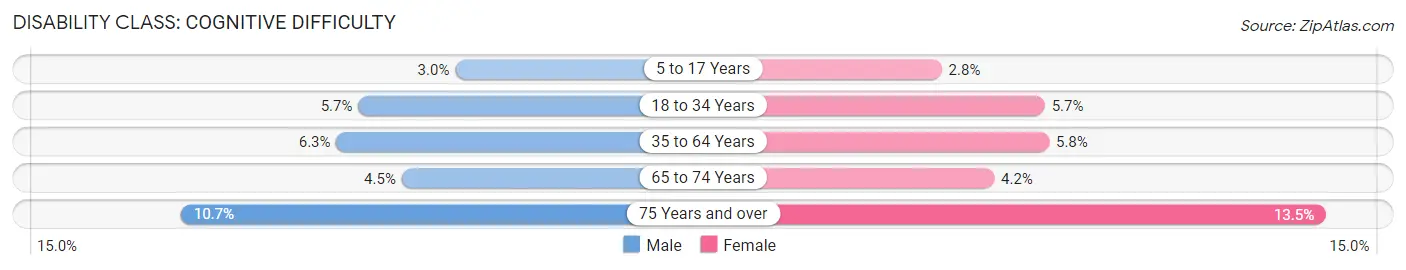
| Age Bracket | Male | Female |
| 5 to 17 Years | 553 (3.0%) | 490 (2.8%) |
| 18 to 34 Years | 1,607 (5.7%) | 1,653 (5.7%) |
| 35 to 64 Years | 3,279 (6.3%) | 3,146 (5.8%) |
| 65 to 74 Years | 678 (4.5%) | 747 (4.2%) |
| 75 Years and over | 901 (10.6%) | 1,651 (13.5%) |
Disability Class: Ambulatory Difficulty
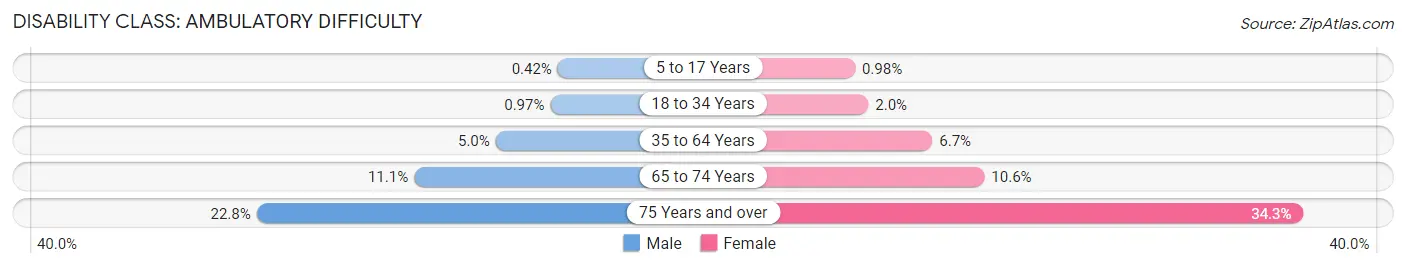
| Age Bracket | Male | Female |
| 5 to 17 Years | 78 (0.4%) | 173 (1.0%) |
| 18 to 34 Years | 274 (1.0%) | 577 (2.0%) |
| 35 to 64 Years | 2,611 (5.0%) | 3,664 (6.7%) |
| 65 to 74 Years | 1,670 (11.1%) | 1,865 (10.6%) |
| 75 Years and over | 1,928 (22.8%) | 4,196 (34.3%) |
Disability Class: Self-Care Difficulty
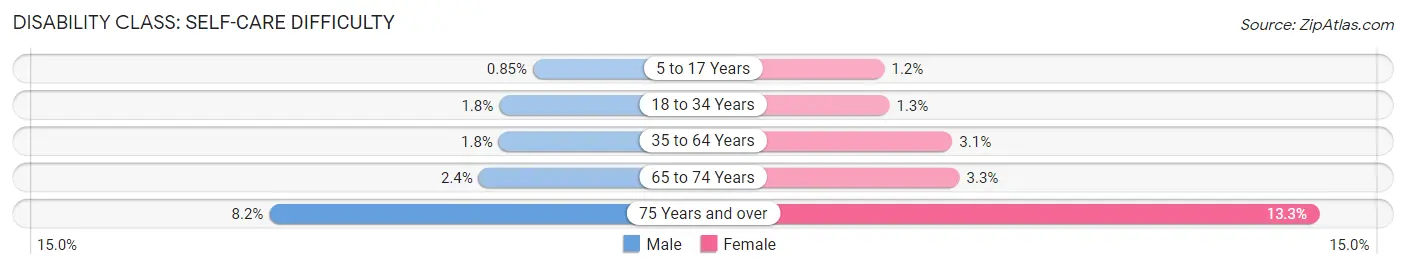
| Age Bracket | Male | Female |
| 5 to 17 Years | 156 (0.9%) | 210 (1.2%) |
| 18 to 34 Years | 503 (1.8%) | 389 (1.3%) |
| 35 to 64 Years | 936 (1.8%) | 1,680 (3.1%) |
| 65 to 74 Years | 355 (2.4%) | 578 (3.3%) |
| 75 Years and over | 693 (8.2%) | 1,626 (13.3%) |
Technology Access in Buncombe County
Computing Device Access in Buncombe County
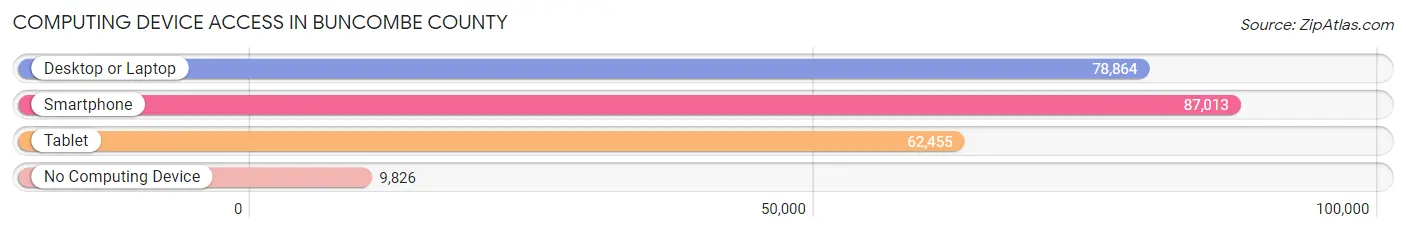
| Device Type | # Households | % Households |
| Desktop or Laptop | 78,864 | 76.6% |
| Smartphone | 87,013 | 84.5% |
| Tablet | 62,455 | 60.7% |
| No Computing Device | 9,826 | 9.6% |
| Total | 102,921 | 100.0% |
Internet Access in Buncombe County
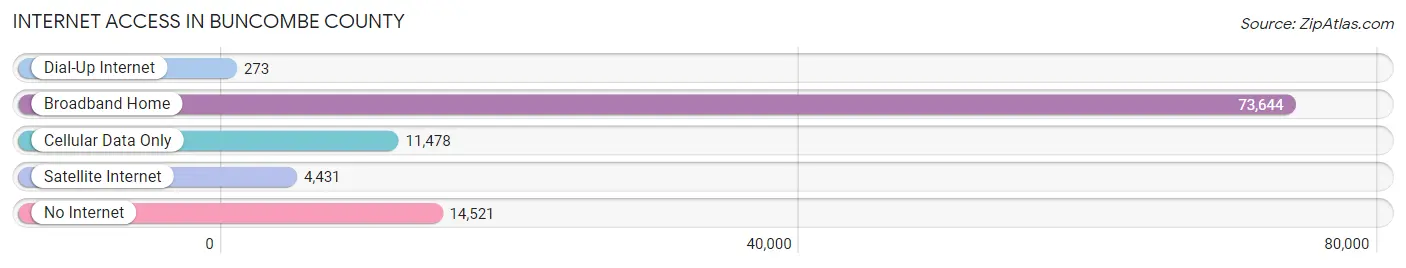
| Internet Type | # Households | % Households |
| Dial-Up Internet | 273 | 0.3% |
| Broadband Home | 73,644 | 71.6% |
| Cellular Data Only | 11,478 | 11.2% |
| Satellite Internet | 4,431 | 4.3% |
| No Internet | 14,521 | 14.1% |
| Total | 102,921 | 100.0% |
Buncombe County Summary
Buncombe County is located in the western part of North Carolina, and is part of the Asheville Metropolitan Statistical Area. It is bordered by Madison County to the north, Haywood County to the west, Henderson County to the east, and McDowell County to the south. The county seat is Asheville, and the county has a population of 253,928 as of the 2020 census.
History
Buncombe County was formed in 1791 from parts of Burke and Rutherford counties. It was named for Edward Buncombe, a colonel in the American Revolutionary War who was killed in the Battle of Germantown. The county was initially part of the Cherokee Nation, and the first European settlers arrived in the late 1700s. The county was home to several prominent families, including the Vanderbilts, who built the Biltmore Estate in Asheville.
The county was an important center of the Civil War, with several battles taking place in the area. After the war, the county experienced a period of economic growth, with the development of the railroad and the growth of the timber and mining industries. The county also became a popular tourist destination, with the opening of the Biltmore Estate in 1895.
Geography
Buncombe County covers an area of 651 square miles, and is located in the Appalachian Mountains. The county is home to the Blue Ridge Parkway, which runs through the county and provides access to the Great Smoky Mountains National Park. The county is also home to the Pisgah National Forest, which covers much of the county. The highest point in the county is Mount Mitchell, which has an elevation of 6,684 feet.
The county is divided into two distinct regions: the Blue Ridge Mountains in the west, and the Piedmont Plateau in the east. The Blue Ridge Mountains are home to the Appalachian Trail, which runs through the county. The Piedmont Plateau is home to the French Broad River, which runs through the county and is a popular destination for fishing and rafting.
Economy
Buncombe County has a diverse economy, with a mix of manufacturing, tourism, and agriculture. The county is home to several major employers, including the Biltmore Estate, the Asheville Regional Airport, and the Mission Health System. The county is also home to several major manufacturing companies, including GE Aviation, Linamar, and New Belgium Brewing.
Tourism is a major industry in the county, with the Biltmore Estate being the most popular tourist destination. The county is also home to several other attractions, including the Blue Ridge Parkway, the Great Smoky Mountains National Park, and the Pisgah National Forest.
Demographics
As of the 2020 census, Buncombe County had a population of 253,928. The population is racially diverse, with the largest racial group being White (77.3%), followed by Black or African American (14.2%), Hispanic or Latino (5.2%), and Asian (2.2%). The median household income in the county is $50,945, and the median home value is $242,400. The county has a poverty rate of 15.2%, and the unemployment rate is 4.2%.
Common Questions
What is the Total Population of Buncombe County?
Total Population of Buncombe County is 269,449.
What is the Total Male Population of Buncombe County?
Total Male Population of Buncombe County is 130,266.
What is the Total Female Population of Buncombe County?
Total Female Population of Buncombe County is 139,183.
What is the Ratio of Males per 100 Females in Buncombe County?
There are 93.59 Males per 100 Females in Buncombe County.
What is the Ratio of Females per 100 Males in Buncombe County?
There are 106.85 Females per 100 Males in Buncombe County.
What is the Median Population Age in Buncombe County?
Median Population Age in Buncombe County is 42.3 Years.
What is the Average Family Size in Buncombe County
Average Family Size in Buncombe County is 3.2 People.
What is the Average Household Size in Buncombe County
Average Household Size in Buncombe County is 2.5 People.
What is Per Capita Income in Buncombe County?
Per Capita income in Buncombe County is $39,495.
What is the Median Family Income in Buncombe County?
Median Family Income in Buncombe County is $85,099.
What is the Median Household income in Buncombe County?
Median Household Income in Buncombe County is $66,531.
What is Income or Wage Gap in Buncombe County?
Income or Wage Gap in Buncombe County is 16.7%.
Women in Buncombe County earn 83.3 cents for every dollar earned by a man.
What is Family Income Deficit in Buncombe County?
Family Income Deficit in Buncombe County is $8,666.
Families that are below poverty line in Buncombe County earn $8,666 less on average than the poverty threshold level.
What is Inequality or Gini Index in Buncombe County?
Inequality or Gini Index in Buncombe County is 0.48.
How Large is the Labor Force in Buncombe County?
There are 137,028 People in the Labor Forcein in Buncombe County.
What is the Percentage of People in the Labor Force in Buncombe County?
60.5% of People are in the Labor Force in Buncombe County.
What is the Unemployment Rate in Buncombe County?
Unemployment Rate in Buncombe County is 3.6%.