Brunswick County, NC
Brunswick County Overview
139,721
TOTAL POPULATION
67,404
MALE POPULATION
72,317
FEMALE POPULATION
93.21
MALES / 100 FEMALES
107.29
FEMALES / 100 MALES
55.7
MEDIAN AGE
2.7
AVG FAMILY SIZE
2.3
AVG HOUSEHOLD SIZE
$42,263
PER CAPITA INCOME
$85,162
AVG FAMILY INCOME
$71,193
AVG HOUSEHOLD INCOME
19.5%
WAGE / INCOME GAP [ % ]
80.5¢/ $1
WAGE / INCOME GAP [ $ ]
$10,232
FAMILY INCOME DEFICIT
0.44
INEQUALITY / GINI INDEX
59,595
LABOR FORCE [ PEOPLE ]
48.9%
PERCENT IN LABOR FORCE
5.0%
UNEMPLOYMENT RATE
Brunswick County Area Codes
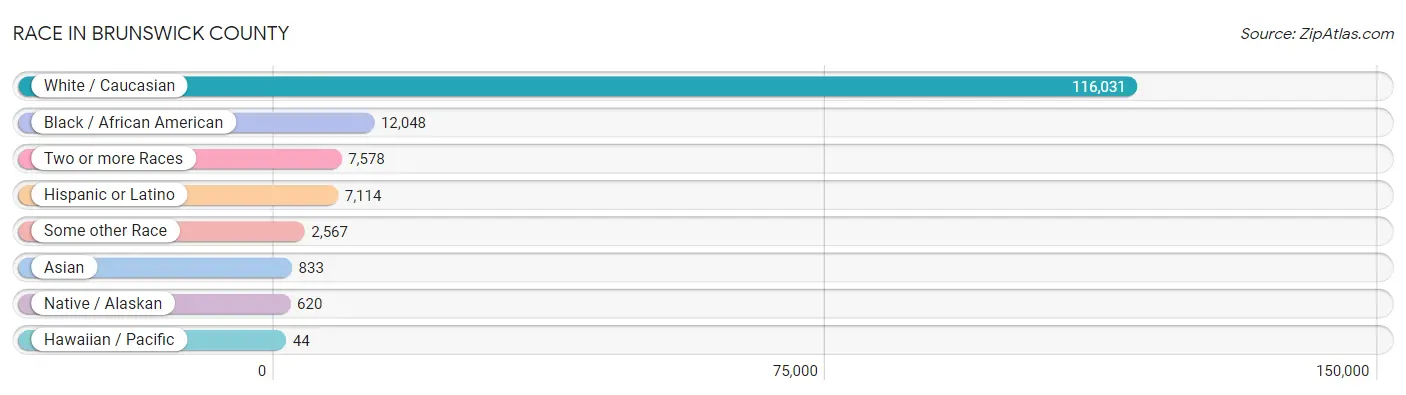
Race in Brunswick County
The most populous races in Brunswick County are White / Caucasian (116,031 | 83.0%), Black / African American (12,048 | 8.6%), and Two or more Races (7,578 | 5.4%).
| Race | # Population | % Population |
| Asian | 833 | 0.6% |
| Black / African American | 12,048 | 8.6% |
| Hawaiian / Pacific | 44 | 0.0% |
| Hispanic or Latino | 7,114 | 5.1% |
| Native / Alaskan | 620 | 0.4% |
| White / Caucasian | 116,031 | 83.0% |
| Two or more Races | 7,578 | 5.4% |
| Some other Race | 2,567 | 1.8% |
| Total | 139,721 | 100.0% |
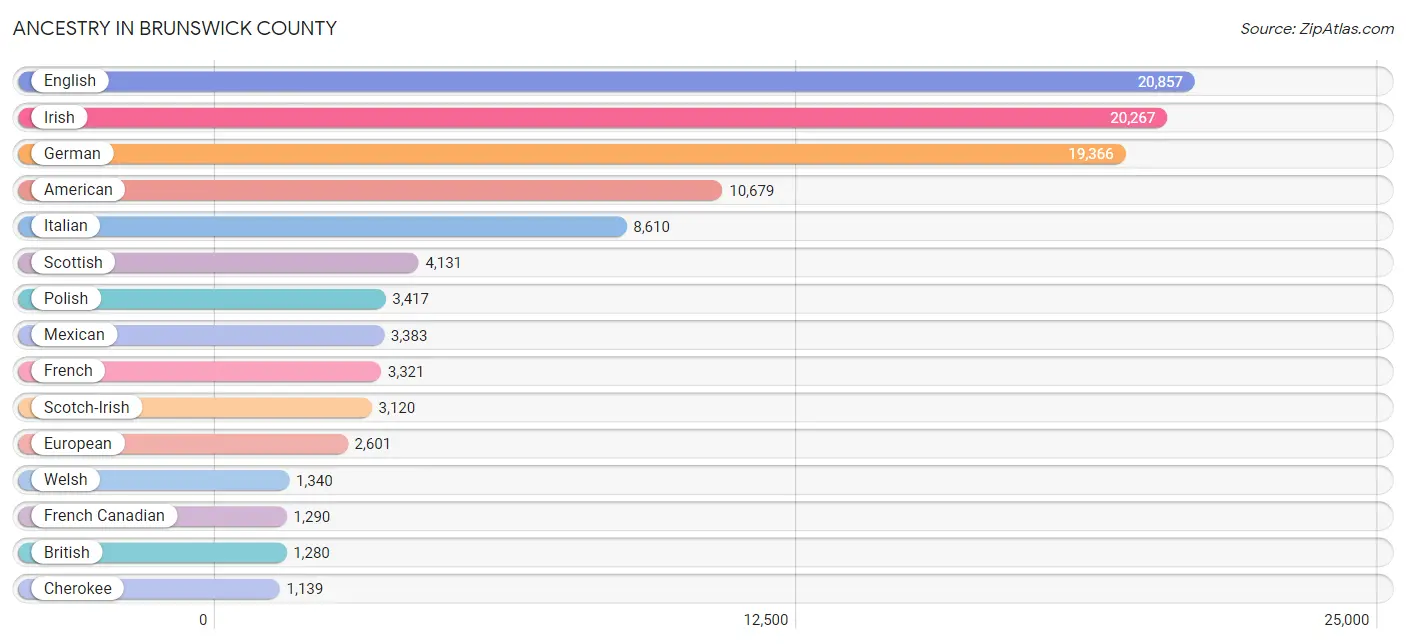
Ancestry in Brunswick County
The most populous ancestries reported in Brunswick County are English (20,857 | 14.9%), Irish (20,267 | 14.5%), German (19,366 | 13.9%), American (10,679 | 7.6%), and Italian (8,610 | 6.2%), together accounting for 57.1% of all Brunswick County residents.
| Ancestry | # Population | % Population |
| African | 335 | 0.2% |
| Aleut | 1 | 0.0% |
| Alsatian | 10 | 0.0% |
| American | 10,679 | 7.6% |
| Apache | 284 | 0.2% |
| Arab | 376 | 0.3% |
| Argentinean | 51 | 0.0% |
| Armenian | 92 | 0.1% |
| Australian | 14 | 0.0% |
| Austrian | 511 | 0.4% |
| Bahamian | 11 | 0.0% |
| Belgian | 44 | 0.0% |
| Bhutanese | 213 | 0.2% |
| Blackfeet | 187 | 0.1% |
| Brazilian | 27 | 0.0% |
| British | 1,280 | 0.9% |
| British West Indian | 7 | 0.0% |
| Bulgarian | 46 | 0.0% |
| Burmese | 110 | 0.1% |
| Canadian | 269 | 0.2% |
| Cape Verdean | 19 | 0.0% |
| Carpatho Rusyn | 12 | 0.0% |
| Celtic | 61 | 0.0% |
| Central American | 568 | 0.4% |
| Central American Indian | 9 | 0.0% |
| Cherokee | 1,139 | 0.8% |
| Chickasaw | 172 | 0.1% |
| Chilean | 55 | 0.0% |
| Chippewa | 171 | 0.1% |
| Choctaw | 25 | 0.0% |
| Colombian | 207 | 0.2% |
| Costa Rican | 35 | 0.0% |
| Creek | 13 | 0.0% |
| Croatian | 31 | 0.0% |
| Cuban | 291 | 0.2% |
| Cypriot | 10 | 0.0% |
| Czech | 457 | 0.3% |
| Czechoslovakian | 103 | 0.1% |
| Danish | 425 | 0.3% |
| Dominican | 330 | 0.2% |
| Dutch | 1,137 | 0.8% |
| Dutch West Indian | 7 | 0.0% |
| Eastern European | 675 | 0.5% |
| Ecuadorian | 33 | 0.0% |
| Egyptian | 129 | 0.1% |
| English | 20,857 | 14.9% |
| European | 2,601 | 1.9% |
| Filipino | 20 | 0.0% |
| Finnish | 107 | 0.1% |
| French | 3,321 | 2.4% |
| French Canadian | 1,290 | 0.9% |
| German | 19,366 | 13.9% |
| Greek | 373 | 0.3% |
| Guamanian / Chamorro | 10 | 0.0% |
| Guatemalan | 193 | 0.1% |
| Guyanese | 107 | 0.1% |
| Haitian | 35 | 0.0% |
| Honduran | 162 | 0.1% |
| Hungarian | 729 | 0.5% |
| Indian (Asian) | 378 | 0.3% |
| Iranian | 25 | 0.0% |
| Irish | 20,267 | 14.5% |
| Iroquois | 298 | 0.2% |
| Israeli | 14 | 0.0% |
| Italian | 8,610 | 6.2% |
| Jamaican | 124 | 0.1% |
| Japanese | 10 | 0.0% |
| Korean | 289 | 0.2% |
| Laotian | 10 | 0.0% |
| Latvian | 44 | 0.0% |
| Lebanese | 156 | 0.1% |
| Lithuanian | 436 | 0.3% |
| Lumbee | 168 | 0.1% |
| Luxembourger | 8 | 0.0% |
| Macedonian | 19 | 0.0% |
| Malaysian | 16 | 0.0% |
| Maltese | 10 | 0.0% |
| Mexican | 3,383 | 2.4% |
| Native Hawaiian | 36 | 0.0% |
| Navajo | 19 | 0.0% |
| Nicaraguan | 19 | 0.0% |
| Northern European | 132 | 0.1% |
| Norwegian | 900 | 0.6% |
| Pakistani | 42 | 0.0% |
| Palestinian | 78 | 0.1% |
| Panamanian | 47 | 0.0% |
| Pennsylvania German | 93 | 0.1% |
| Peruvian | 111 | 0.1% |
| Polish | 3,417 | 2.5% |
| Portuguese | 136 | 0.1% |
| Puerto Rican | 991 | 0.7% |
| Romanian | 94 | 0.1% |
| Russian | 670 | 0.5% |
| Salvadoran | 112 | 0.1% |
| Samoan | 45 | 0.0% |
| Scandinavian | 324 | 0.2% |
| Scotch-Irish | 3,120 | 2.2% |
| Scottish | 4,131 | 3.0% |
| Seminole | 4 | 0.0% |
| Serbian | 80 | 0.1% |
| Slavic | 58 | 0.0% |
| Slovak | 296 | 0.2% |
| Slovene | 101 | 0.1% |
| South African | 23 | 0.0% |
| South American | 532 | 0.4% |
| Spaniard | 543 | 0.4% |
| Spanish | 213 | 0.2% |
| Sri Lankan | 53 | 0.0% |
| Subsaharan African | 465 | 0.3% |
| Swedish | 1,060 | 0.8% |
| Swiss | 223 | 0.2% |
| Syrian | 17 | 0.0% |
| Thai | 259 | 0.2% |
| Turkish | 93 | 0.1% |
| Ukrainian | 307 | 0.2% |
| Uruguayan | 20 | 0.0% |
| Venezuelan | 55 | 0.0% |
| Welsh | 1,340 | 1.0% |
| West Indian | 41 | 0.0% |
| Yugoslavian | 33 | 0.0% | View All 120 Rows |
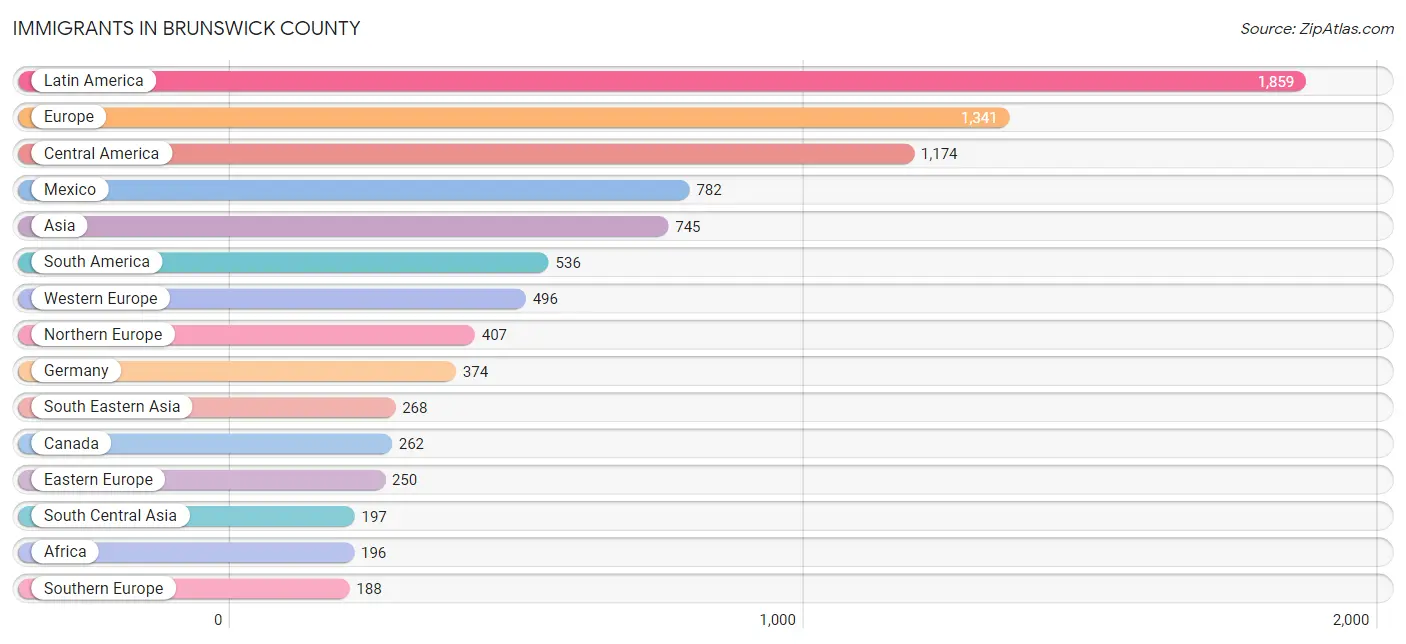
Immigrants in Brunswick County
The most numerous immigrant groups reported in Brunswick County came from Latin America (1,859 | 1.3%), Europe (1,341 | 1.0%), Central America (1,174 | 0.8%), Mexico (782 | 0.6%), and Asia (745 | 0.5%), together accounting for 4.2% of all Brunswick County residents.
| Immigration Origin | # Population | % Population |
| Africa | 196 | 0.1% |
| Argentina | 51 | 0.0% |
| Asia | 745 | 0.5% |
| Australia | 47 | 0.0% |
| Austria | 22 | 0.0% |
| Belgium | 8 | 0.0% |
| Bosnia and Herzegovina | 7 | 0.0% |
| Canada | 262 | 0.2% |
| Caribbean | 149 | 0.1% |
| Central America | 1,174 | 0.8% |
| Chile | 21 | 0.0% |
| China | 125 | 0.1% |
| Colombia | 118 | 0.1% |
| Costa Rica | 49 | 0.0% |
| Cuba | 5 | 0.0% |
| Czechoslovakia | 24 | 0.0% |
| Dominican Republic | 137 | 0.1% |
| Eastern Africa | 9 | 0.0% |
| Eastern Asia | 178 | 0.1% |
| Eastern Europe | 250 | 0.2% |
| Ecuador | 37 | 0.0% |
| Egypt | 90 | 0.1% |
| El Salvador | 89 | 0.1% |
| England | 118 | 0.1% |
| Europe | 1,341 | 1.0% |
| France | 53 | 0.0% |
| Germany | 374 | 0.3% |
| Grenada | 7 | 0.0% |
| Guatemala | 101 | 0.1% |
| Guyana | 123 | 0.1% |
| Honduras | 132 | 0.1% |
| Hungary | 43 | 0.0% |
| India | 177 | 0.1% |
| Indonesia | 10 | 0.0% |
| Ireland | 59 | 0.0% |
| Israel | 14 | 0.0% |
| Italy | 159 | 0.1% |
| Korea | 53 | 0.0% |
| Latin America | 1,859 | 1.3% |
| Lebanon | 74 | 0.1% |
| Mexico | 782 | 0.6% |
| Morocco | 16 | 0.0% |
| Nepal | 20 | 0.0% |
| Netherlands | 39 | 0.0% |
| Nicaragua | 21 | 0.0% |
| Northern Africa | 106 | 0.1% |
| Northern Europe | 407 | 0.3% |
| Norway | 16 | 0.0% |
| Oceania | 52 | 0.0% |
| Peru | 111 | 0.1% |
| Philippines | 163 | 0.1% |
| Poland | 78 | 0.1% |
| Portugal | 10 | 0.0% |
| Romania | 16 | 0.0% |
| Russia | 19 | 0.0% |
| Scotland | 47 | 0.0% |
| South Africa | 74 | 0.1% |
| South America | 536 | 0.4% |
| South Central Asia | 197 | 0.1% |
| South Eastern Asia | 268 | 0.2% |
| Southern Europe | 188 | 0.1% |
| Spain | 19 | 0.0% |
| Sweden | 15 | 0.0% |
| Syria | 4 | 0.0% |
| Taiwan | 20 | 0.0% |
| Thailand | 70 | 0.1% |
| Ukraine | 52 | 0.0% |
| Uruguay | 20 | 0.0% |
| Venezuela | 55 | 0.0% |
| Vietnam | 12 | 0.0% |
| Western Asia | 102 | 0.1% |
| Western Europe | 496 | 0.4% | View All 72 Rows |
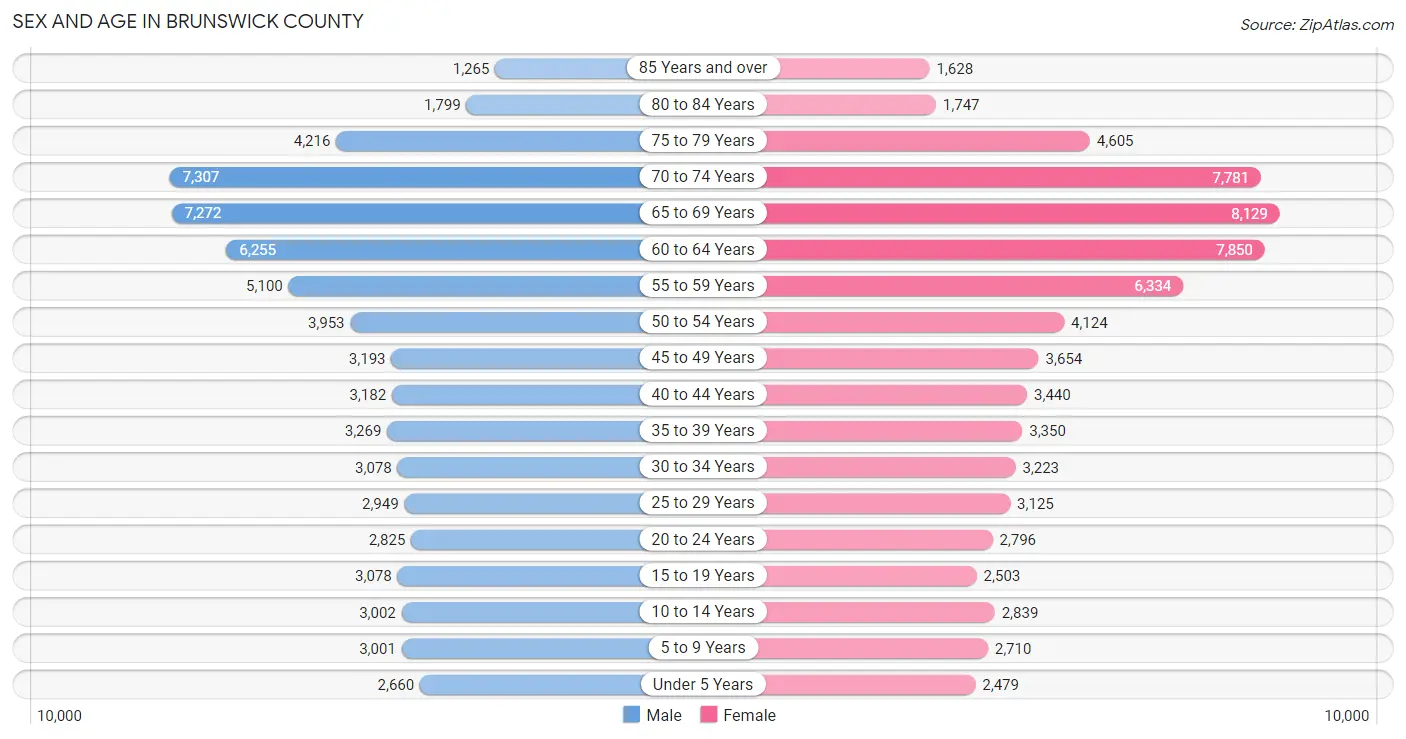
Sex and Age in Brunswick County
Sex and Age in Brunswick County
The most populous age groups in Brunswick County are 70 to 74 Years (7,307 | 10.8%) for men and 65 to 69 Years (8,129 | 11.2%) for women.
| Age Bracket | Male | Female |
| Under 5 Years | 2,660 (4.0%) | 2,479 (3.4%) |
| 5 to 9 Years | 3,001 (4.4%) | 2,710 (3.7%) |
| 10 to 14 Years | 3,002 (4.4%) | 2,839 (3.9%) |
| 15 to 19 Years | 3,078 (4.6%) | 2,503 (3.5%) |
| 20 to 24 Years | 2,825 (4.2%) | 2,796 (3.9%) |
| 25 to 29 Years | 2,949 (4.4%) | 3,125 (4.3%) |
| 30 to 34 Years | 3,078 (4.6%) | 3,223 (4.5%) |
| 35 to 39 Years | 3,269 (4.9%) | 3,350 (4.6%) |
| 40 to 44 Years | 3,182 (4.7%) | 3,440 (4.8%) |
| 45 to 49 Years | 3,193 (4.7%) | 3,654 (5.1%) |
| 50 to 54 Years | 3,953 (5.9%) | 4,124 (5.7%) |
| 55 to 59 Years | 5,100 (7.6%) | 6,334 (8.8%) |
| 60 to 64 Years | 6,255 (9.3%) | 7,850 (10.8%) |
| 65 to 69 Years | 7,272 (10.8%) | 8,129 (11.2%) |
| 70 to 74 Years | 7,307 (10.8%) | 7,781 (10.8%) |
| 75 to 79 Years | 4,216 (6.2%) | 4,605 (6.4%) |
| 80 to 84 Years | 1,799 (2.7%) | 1,747 (2.4%) |
| 85 Years and over | 1,265 (1.9%) | 1,628 (2.2%) |
| Total | 67,404 (100.0%) | 72,317 (100.0%) |
Families and Households in Brunswick County
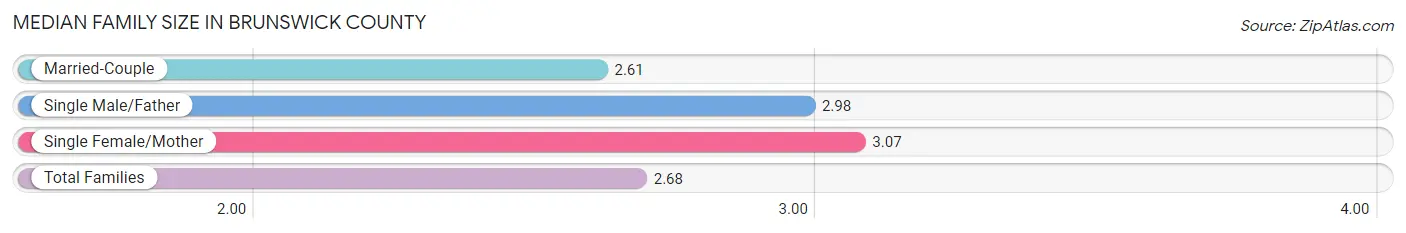
Median Family Size in Brunswick County
The median family size in Brunswick County is 2.68 persons per family, with single female/mother families (4,932 | 11.6%) accounting for the largest median family size of 3.07 persons per family. On the other hand, married-couple families (35,469 | 83.3%) represent the smallest median family size with 2.61 persons per family.
| Family Type | # Families | Family Size |
| Married-Couple | 35,469 (83.3%) | 2.61 |
| Single Male/Father | 2,187 (5.1%) | 2.98 |
| Single Female/Mother | 4,932 (11.6%) | 3.07 |
| Total Families | 42,588 (100.0%) | 2.68 |
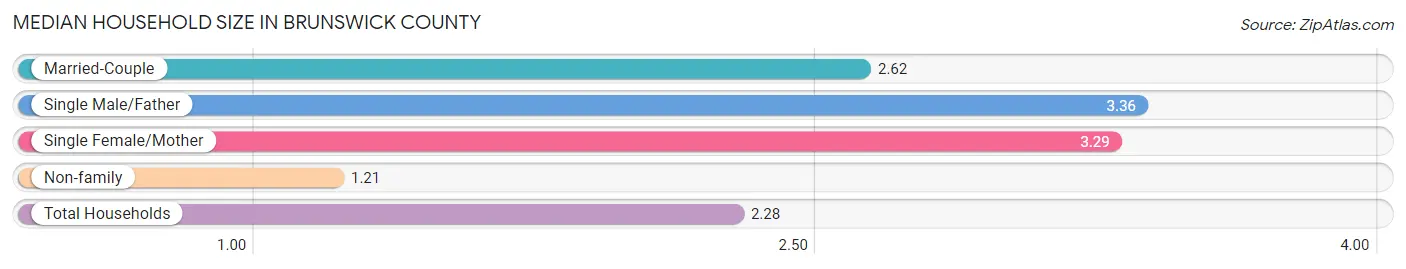
Median Household Size in Brunswick County
The median household size in Brunswick County is 2.28 persons per household, with single male/father households (2,187 | 3.6%) accounting for the largest median household size of 3.36 persons per household. non-family households (18,327 | 30.1%) represent the smallest median household size with 1.21 persons per household.
| Household Type | # Households | Household Size |
| Married-Couple | 35,469 (58.2%) | 2.62 |
| Single Male/Father | 2,187 (3.6%) | 3.36 |
| Single Female/Mother | 4,932 (8.1%) | 3.29 |
| Non-family | 18,327 (30.1%) | 1.21 |
| Total Households | 60,915 (100.0%) | 2.28 |
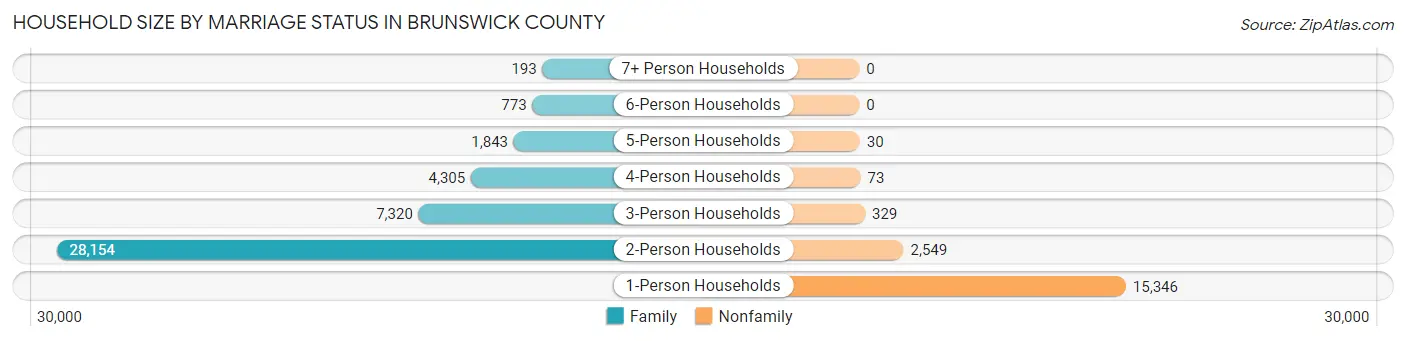
Household Size by Marriage Status in Brunswick County
Out of a total of 60,915 households in Brunswick County, 42,588 (69.9%) are family households, while 18,327 (30.1%) are nonfamily households. The most numerous type of family households are 2-person households, comprising 28,154, and the most common type of nonfamily households are 1-person households, comprising 15,346.
| Household Size | Family Households | Nonfamily Households |
| 1-Person Households | - | 15,346 (25.2%) |
| 2-Person Households | 28,154 (46.2%) | 2,549 (4.2%) |
| 3-Person Households | 7,320 (12.0%) | 329 (0.5%) |
| 4-Person Households | 4,305 (7.1%) | 73 (0.1%) |
| 5-Person Households | 1,843 (3.0%) | 30 (0.1%) |
| 6-Person Households | 773 (1.3%) | 0 (0.0%) |
| 7+ Person Households | 193 (0.3%) | 0 (0.0%) |
| Total | 42,588 (69.9%) | 18,327 (30.1%) |
Female Fertility in Brunswick County
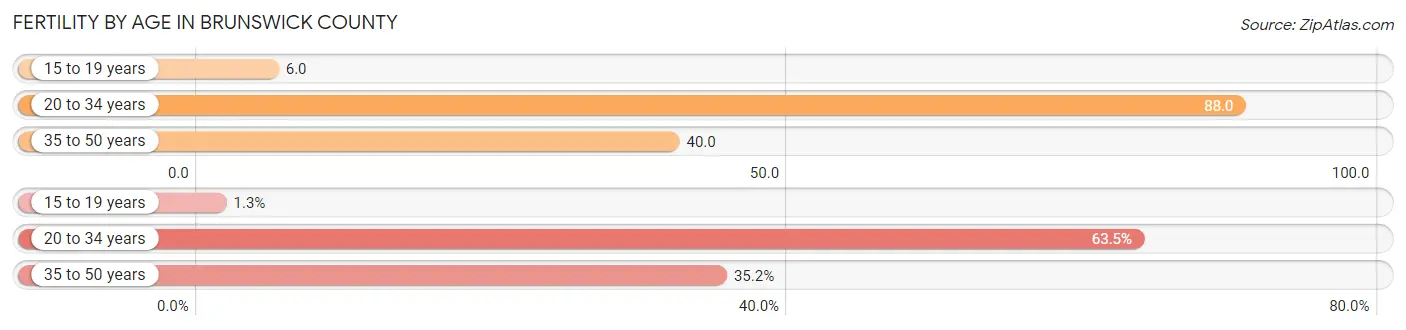
Fertility by Age in Brunswick County
Average fertility rate in Brunswick County is 56.0 births per 1,000 women. Women in the age bracket of 20 to 34 years have the highest fertility rate with 88.0 births per 1,000 women. Women in the age bracket of 20 to 34 years acount for 63.5% of all women with births.
| Age Bracket | Women with Births | Births / 1,000 Women |
| 15 to 19 years | 16 (1.3%) | 6.0 |
| 20 to 34 years | 806 (63.5%) | 88.0 |
| 35 to 50 years | 447 (35.2%) | 40.0 |
| Total | 1,269 (100.0%) | 56.0 |
Fertility by Age by Marriage Status in Brunswick County
57.5% of women with births (1,269) in Brunswick County are married. The highest percentage of unmarried women with births falls into 15 to 19 years age bracket with 100.0% of them unmarried at the time of birth, while the lowest percentage of unmarried women with births belong to 20 to 34 years age bracket with 39.3% of them unmarried.
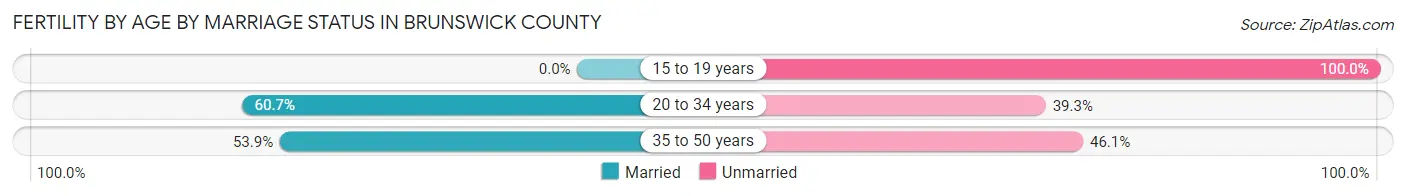
| Age Bracket | Married | Unmarried |
| 15 to 19 years | 0 (0.0%) | 16 (100.0%) |
| 20 to 34 years | 489 (60.7%) | 317 (39.3%) |
| 35 to 50 years | 241 (53.9%) | 206 (46.1%) |
| Total | 730 (57.5%) | 539 (42.5%) |
Fertility by Education in Brunswick County
Average fertility rate in Brunswick County is 56.0 births per 1,000 women. Women with the education attainment of graduate degree have the highest fertility rate of 74.0 births per 1,000 women, while women with the education attainment of college or associate's degree have the lowest fertility at 50.0 births per 1,000 women. Women with the education attainment of college or associate's degree represent 32.9% of all women with births.
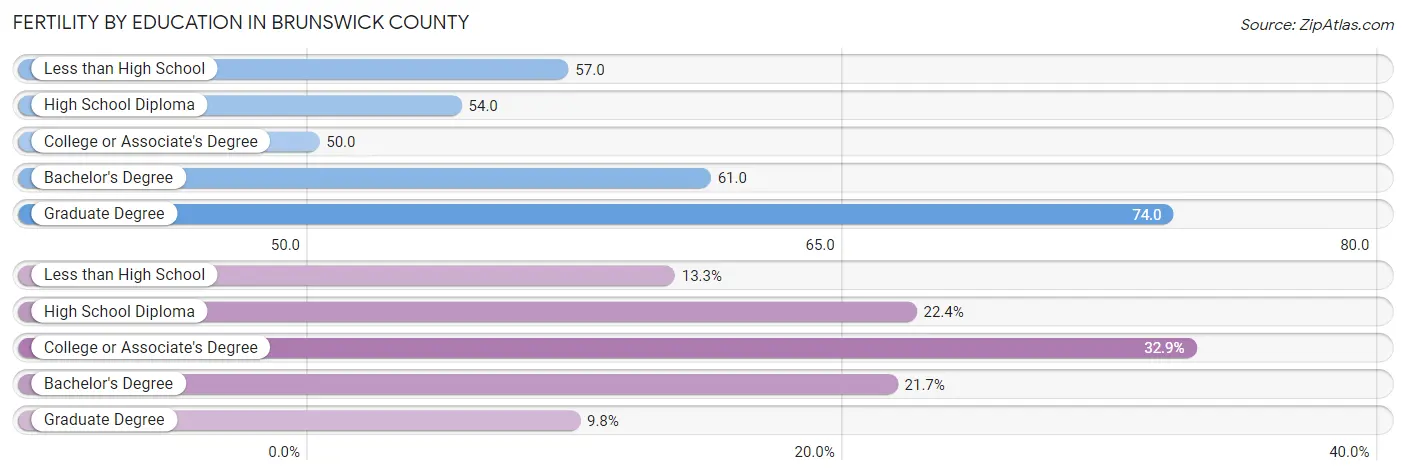
| Educational Attainment | Women with Births | Births / 1,000 Women |
| Less than High School | 169 (13.3%) | 57.0 |
| High School Diploma | 284 (22.4%) | 54.0 |
| College or Associate's Degree | 417 (32.9%) | 50.0 |
| Bachelor's Degree | 275 (21.7%) | 61.0 |
| Graduate Degree | 124 (9.8%) | 74.0 |
| Total | 1,269 (100.0%) | 56.0 |
Fertility by Education by Marriage Status in Brunswick County
42.5% of women with births in Brunswick County are unmarried. Women with the educational attainment of graduate degree are most likely to be married with 100.0% of them married at childbirth, while women with the educational attainment of high school diploma are least likely to be married with 78.2% of them unmarried at childbirth.
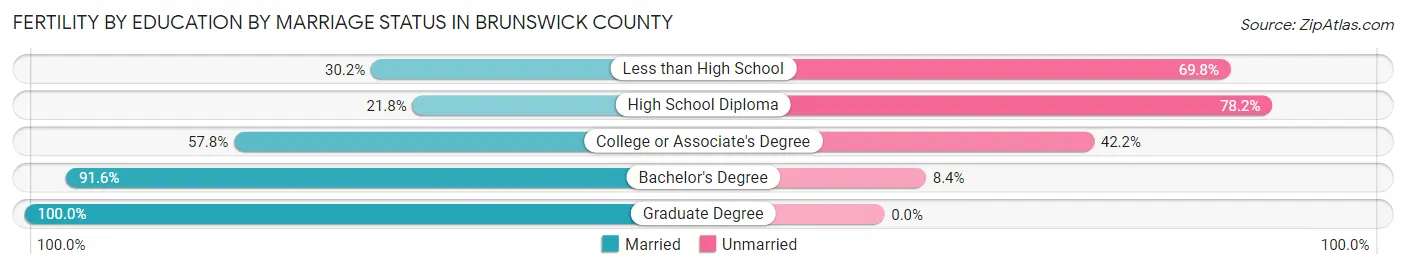
| Educational Attainment | Married | Unmarried |
| Less than High School | 51 (30.2%) | 118 (69.8%) |
| High School Diploma | 62 (21.8%) | 222 (78.2%) |
| College or Associate's Degree | 241 (57.8%) | 176 (42.2%) |
| Bachelor's Degree | 252 (91.6%) | 23 (8.4%) |
| Graduate Degree | 124 (100.0%) | 0 (0.0%) |
| Total | 730 (57.5%) | 539 (42.5%) |
Income in Brunswick County
Income Overview in Brunswick County
Per Capita Income in Brunswick County is $42,263, while median incomes of families and households are $85,162 and $71,193 respectively.
| Characteristic | Number | Measure |
| Per Capita Income | 139,721 | $42,263 |
| Median Family Income | 42,588 | $85,162 |
| Mean Family Income | 42,588 | $105,196 |
| Median Household Income | 60,915 | $71,193 |
| Mean Household Income | 60,915 | $93,733 |
| Income Deficit | 42,588 | $10,232 |
| Wage / Income Gap (%) | 139,721 | 19.46% |
| Wage / Income Gap ($) | 139,721 | 80.54¢ per $1 |
| Gini / Inequality Index | 139,721 | 0.44 |
Earnings by Sex in Brunswick County
Average Earnings in Brunswick County are $36,585, $40,632 for men and $32,723 for women, a difference of 19.5%.
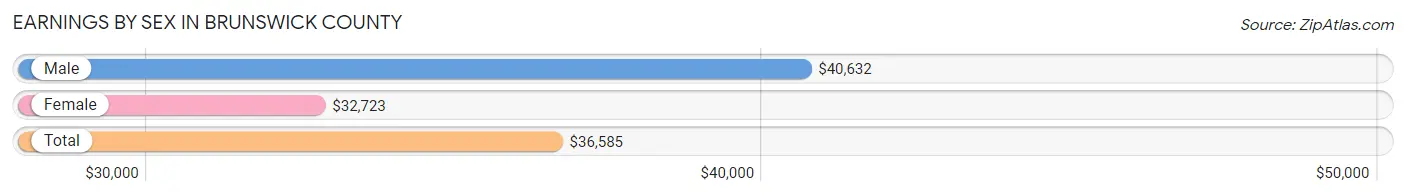
| Sex | Number | Average Earnings |
| Male | 32,690 (51.7%) | $40,632 |
| Female | 30,563 (48.3%) | $32,723 |
| Total | 63,253 (100.0%) | $36,585 |
Earnings by Sex by Income Bracket in Brunswick County
The most common earnings brackets in Brunswick County are $100,000+ for men (4,590 | 14.0%) and $25,000 to $29,999 for women (2,328 | 7.6%).
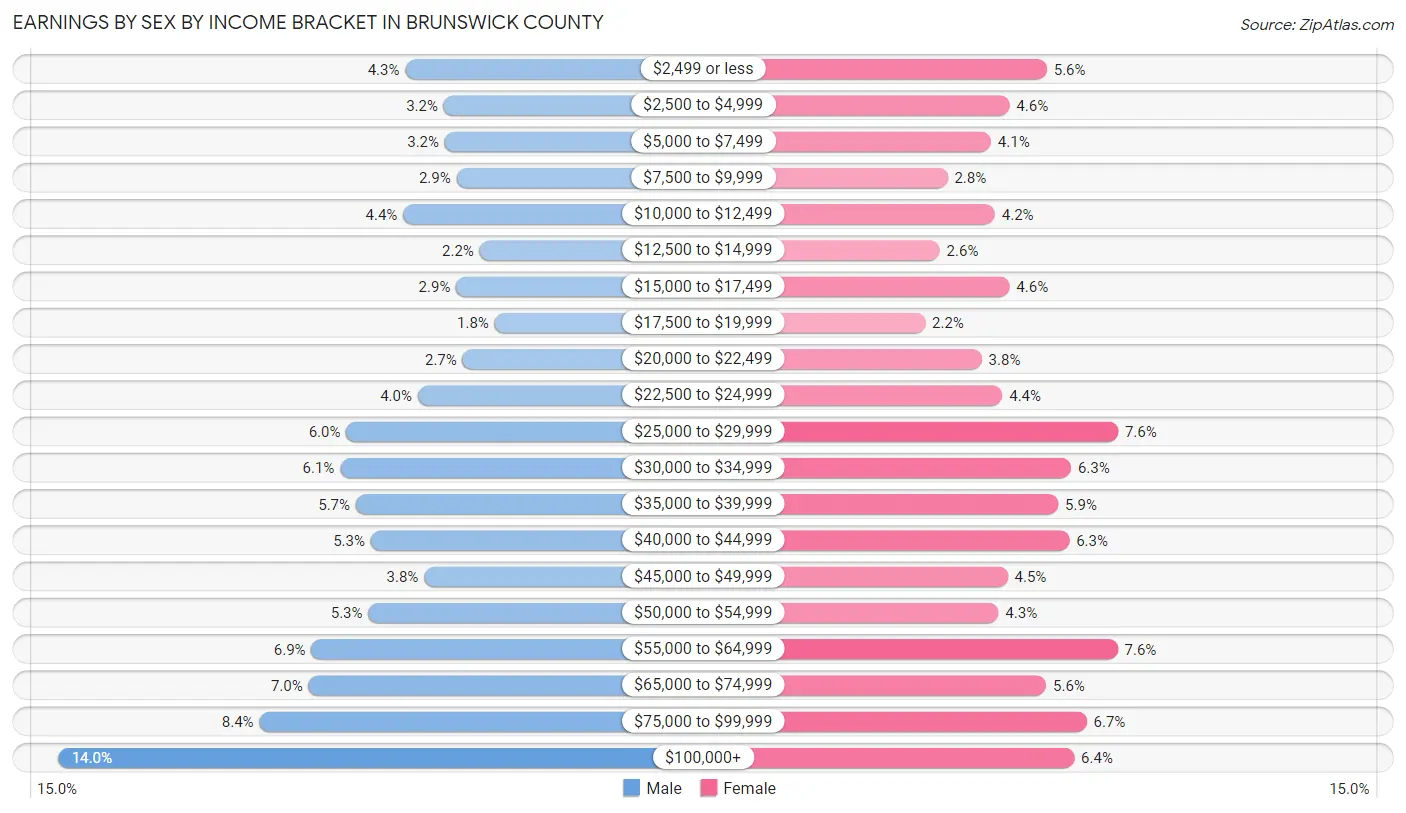
| Income | Male | Female |
| $2,499 or less | 1,407 (4.3%) | 1,719 (5.6%) |
| $2,500 to $4,999 | 1,052 (3.2%) | 1,398 (4.6%) |
| $5,000 to $7,499 | 1,042 (3.2%) | 1,237 (4.1%) |
| $7,500 to $9,999 | 935 (2.9%) | 866 (2.8%) |
| $10,000 to $12,499 | 1,425 (4.4%) | 1,271 (4.2%) |
| $12,500 to $14,999 | 722 (2.2%) | 797 (2.6%) |
| $15,000 to $17,499 | 937 (2.9%) | 1,397 (4.6%) |
| $17,500 to $19,999 | 586 (1.8%) | 671 (2.2%) |
| $20,000 to $22,499 | 878 (2.7%) | 1,159 (3.8%) |
| $22,500 to $24,999 | 1,291 (4.0%) | 1,335 (4.4%) |
| $25,000 to $29,999 | 1,948 (6.0%) | 2,328 (7.6%) |
| $30,000 to $34,999 | 2,003 (6.1%) | 1,925 (6.3%) |
| $35,000 to $39,999 | 1,861 (5.7%) | 1,814 (5.9%) |
| $40,000 to $44,999 | 1,723 (5.3%) | 1,911 (6.2%) |
| $45,000 to $49,999 | 1,231 (3.8%) | 1,380 (4.5%) |
| $50,000 to $54,999 | 1,747 (5.3%) | 1,303 (4.3%) |
| $55,000 to $64,999 | 2,270 (6.9%) | 2,325 (7.6%) |
| $65,000 to $74,999 | 2,295 (7.0%) | 1,712 (5.6%) |
| $75,000 to $99,999 | 2,747 (8.4%) | 2,061 (6.7%) |
| $100,000+ | 4,590 (14.0%) | 1,954 (6.4%) |
| Total | 32,690 (100.0%) | 30,563 (100.0%) |
Earnings by Sex by Educational Attainment in Brunswick County
Average earnings in Brunswick County are $44,993 for men and $36,755 for women, a difference of 18.3%. Men with an educational attainment of bachelor's degree enjoy the highest average annual earnings of $64,045, while those with less than high school education earn the least with $28,996. Women with an educational attainment of graduate degree earn the most with the average annual earnings of $65,188, while those with less than high school education have the smallest earnings of $15,190.
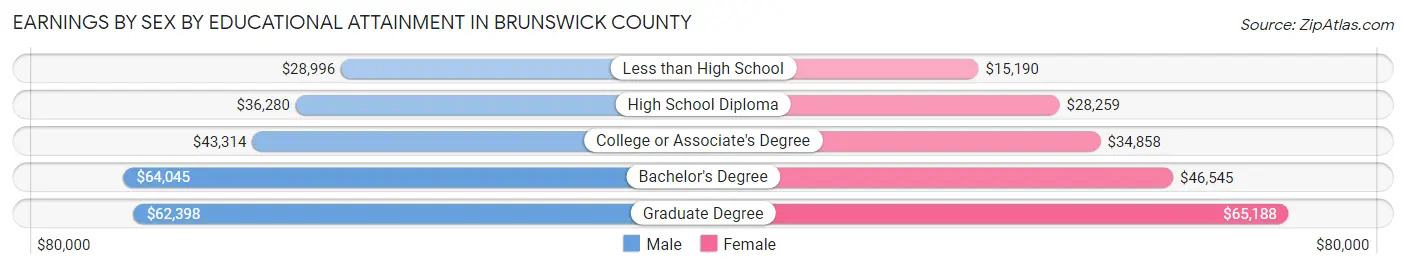
| Educational Attainment | Male Income | Female Income |
| Less than High School | $28,996 | $15,190 |
| High School Diploma | $36,280 | $28,259 |
| College or Associate's Degree | $43,314 | $34,858 |
| Bachelor's Degree | $64,045 | $46,545 |
| Graduate Degree | $62,398 | $65,188 |
| Total | $44,993 | $36,755 |
Family Income in Brunswick County
Family Income Brackets in Brunswick County
According to the Brunswick County family income data, there are 8,943 families falling into the $100,000 to $149,999 income range, which is the most common income bracket and makes up 21.0% of all families. Conversely, the $10,000 to $14,999 income bracket is the least frequent group with only 724 families (1.7%) belonging to this category.
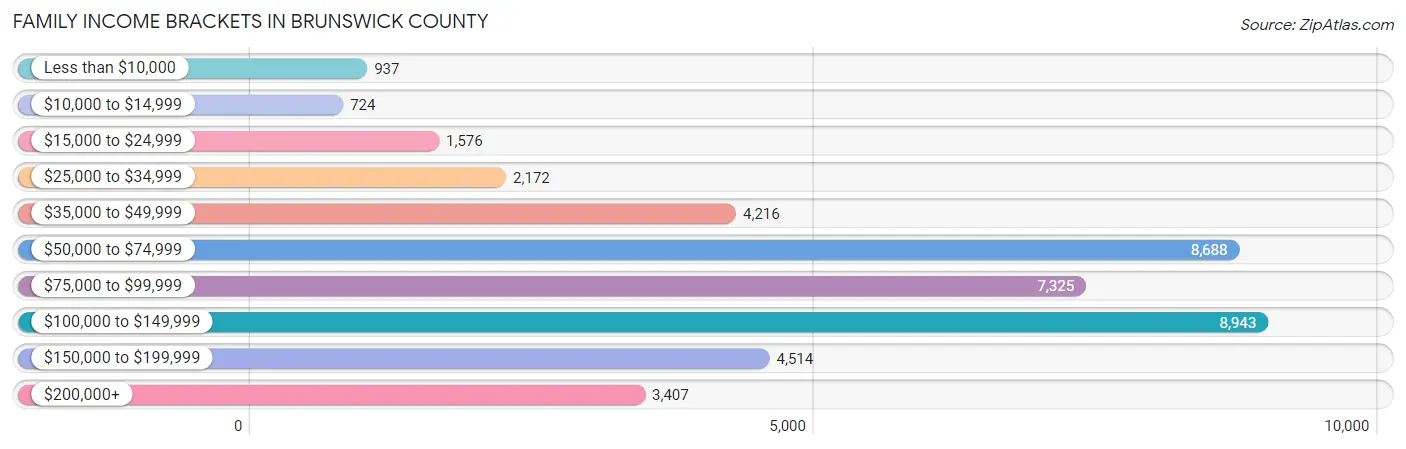
| Income Bracket | # Families | % Families |
| Less than $10,000 | 937 | 2.2% |
| $10,000 to $14,999 | 724 | 1.7% |
| $15,000 to $24,999 | 1,576 | 3.7% |
| $25,000 to $34,999 | 2,172 | 5.1% |
| $35,000 to $49,999 | 4,216 | 9.9% |
| $50,000 to $74,999 | 8,688 | 20.4% |
| $75,000 to $99,999 | 7,325 | 17.2% |
| $100,000 to $149,999 | 8,943 | 21.0% |
| $150,000 to $199,999 | 4,514 | 10.6% |
| $200,000+ | 3,407 | 8.0% |
Family Income by Famaliy Size in Brunswick County
6-person families (701 | 1.7%) account for the highest median family income in Brunswick County with $127,765 per family, while 2-person families (28,966 | 68.0%) have the highest median income of $41,615 per family member.
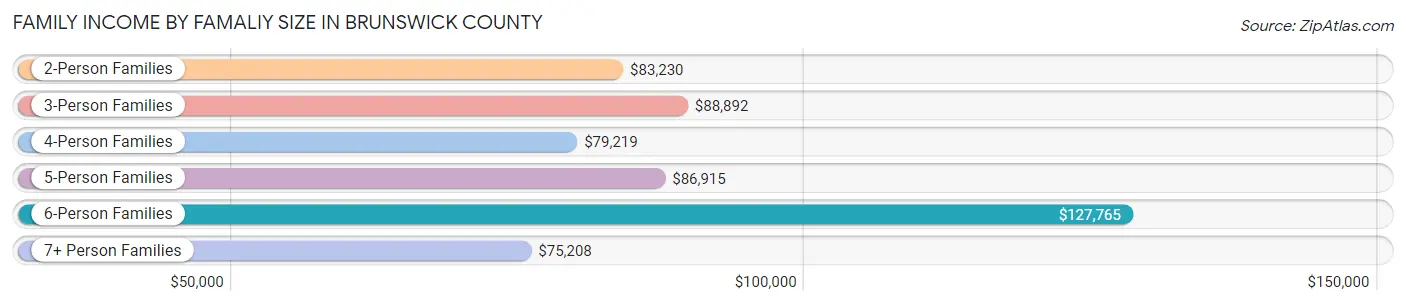
| Income Bracket | # Families | Median Income |
| 2-Person Families | 28,966 (68.0%) | $83,230 |
| 3-Person Families | 7,156 (16.8%) | $88,892 |
| 4-Person Families | 3,957 (9.3%) | $79,219 |
| 5-Person Families | 1,627 (3.8%) | $86,915 |
| 6-Person Families | 701 (1.7%) | $127,765 |
| 7+ Person Families | 181 (0.4%) | $75,208 |
| Total | 42,588 (100.0%) | $85,162 |
Family Income by Number of Earners in Brunswick County
The median family income in Brunswick County is $85,162, with families comprising 3+ earners (2,447) having the highest median family income of $136,764, while families with 1 earner (12,782) have the lowest median family income of $69,370, accounting for 5.8% and 30.0% of families, respectively.
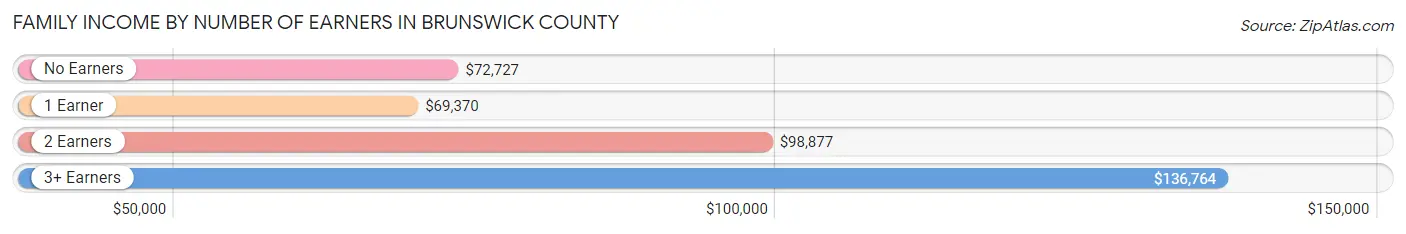
| Number of Earners | # Families | Median Income |
| No Earners | 14,401 (33.8%) | $72,727 |
| 1 Earner | 12,782 (30.0%) | $69,370 |
| 2 Earners | 12,958 (30.4%) | $98,877 |
| 3+ Earners | 2,447 (5.8%) | $136,764 |
| Total | 42,588 (100.0%) | $85,162 |
Household Income in Brunswick County
Household Income Brackets in Brunswick County
With 12,427 households falling in the category, the $50,000 to $74,999 income range is the most frequent in Brunswick County, accounting for 20.4% of all households. In contrast, only 1,949 households (3.2%) fall into the $10,000 to $14,999 income bracket, making it the least populous group.
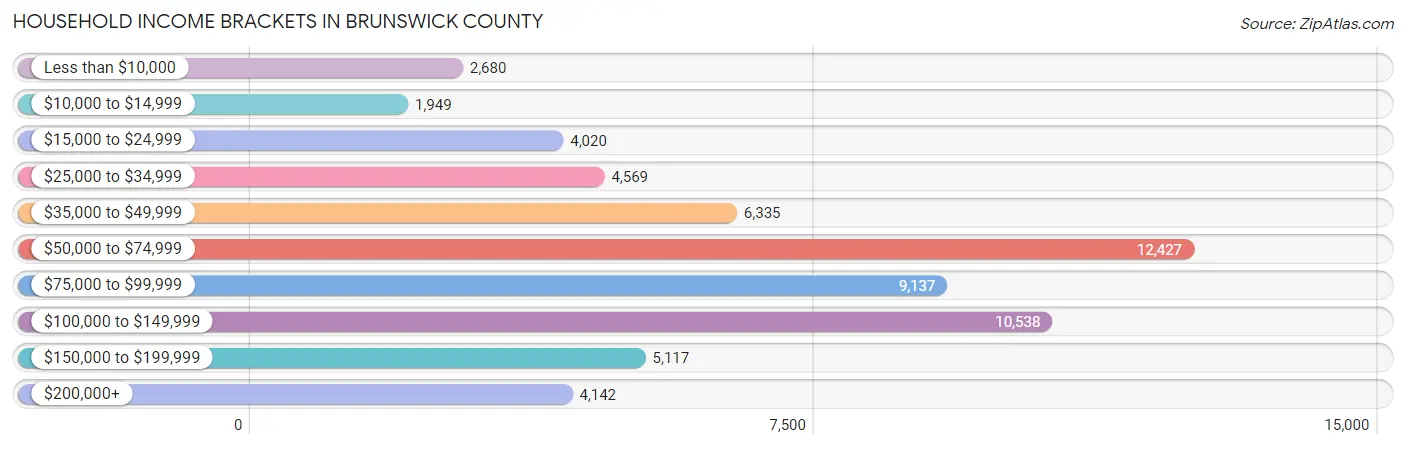
| Income Bracket | # Households | % Households |
| Less than $10,000 | 2,680 | 4.4% |
| $10,000 to $14,999 | 1,949 | 3.2% |
| $15,000 to $24,999 | 4,020 | 6.6% |
| $25,000 to $34,999 | 4,569 | 7.5% |
| $35,000 to $49,999 | 6,335 | 10.4% |
| $50,000 to $74,999 | 12,427 | 20.4% |
| $75,000 to $99,999 | 9,137 | 15.0% |
| $100,000 to $149,999 | 10,538 | 17.3% |
| $150,000 to $199,999 | 5,117 | 8.4% |
| $200,000+ | 4,142 | 6.8% |
Household Income by Householder Age in Brunswick County
The median household income in Brunswick County is $71,193, with the highest median household income of $79,184 found in the 45 to 64 years age bracket for the primary householder. A total of 21,561 households (35.4%) fall into this category. Meanwhile, the 15 to 24 years age bracket for the primary householder has the lowest median household income of $47,337, with 865 households (1.4%) in this group.
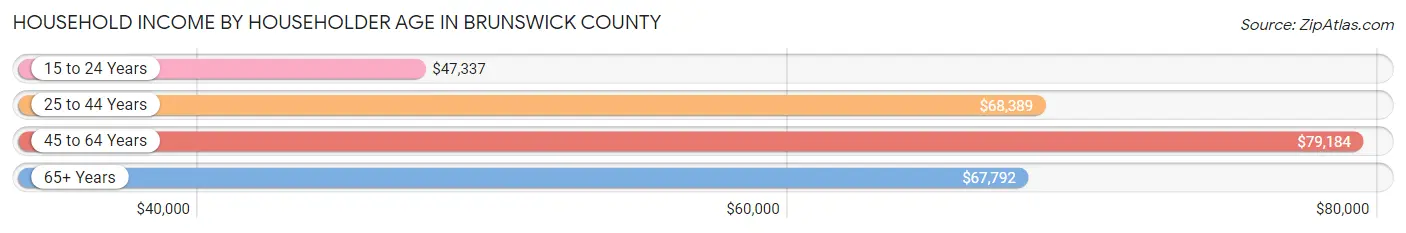
| Income Bracket | # Households | Median Income |
| 15 to 24 Years | 865 (1.4%) | $47,337 |
| 25 to 44 Years | 11,035 (18.1%) | $68,389 |
| 45 to 64 Years | 21,561 (35.4%) | $79,184 |
| 65+ Years | 27,454 (45.1%) | $67,792 |
| Total | 60,915 (100.0%) | $71,193 |
Poverty in Brunswick County
Income Below Poverty by Sex and Age in Brunswick County
With 8.1% poverty level for males and 10.0% for females among the residents of Brunswick County, 18 to 24 year old males and 15 year old females are the most vulnerable to poverty, with 579 males (14.4%) and 239 females (40.0%) in their respective age groups living below the poverty level.
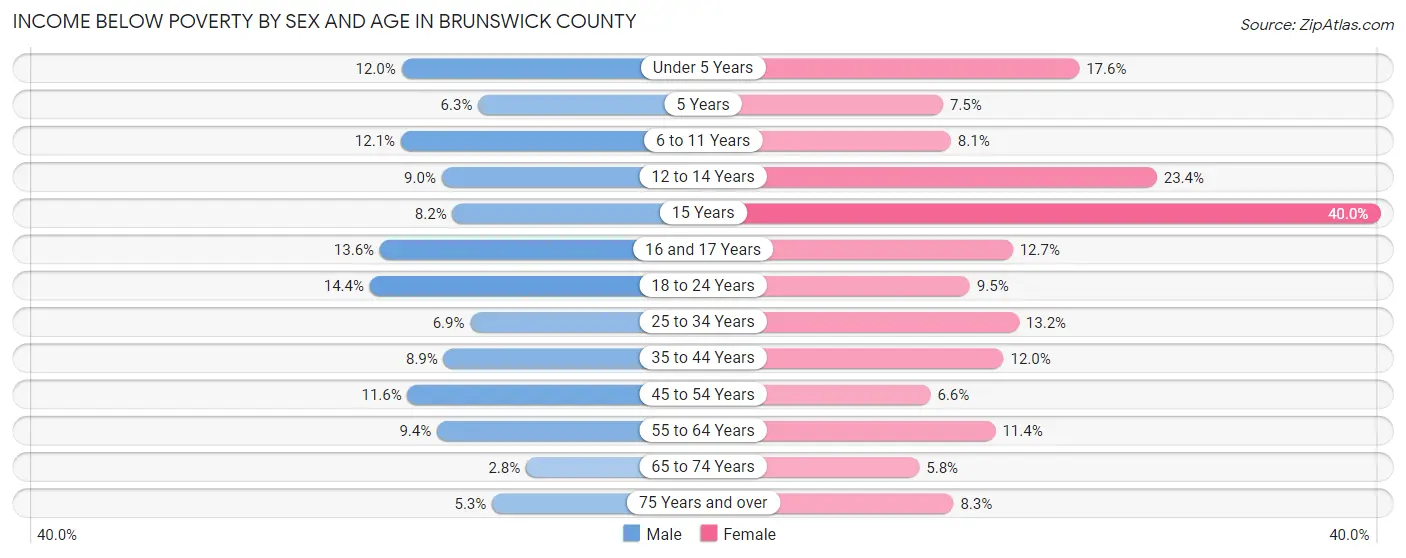
| Age Bracket | Male | Female |
| Under 5 Years | 317 (12.0%) | 435 (17.6%) |
| 5 Years | 32 (6.3%) | 48 (7.5%) |
| 6 to 11 Years | 428 (12.1%) | 241 (8.1%) |
| 12 to 14 Years | 167 (9.0%) | 422 (23.4%) |
| 15 Years | 46 (8.2%) | 239 (40.0%) |
| 16 and 17 Years | 174 (13.6%) | 139 (12.7%) |
| 18 to 24 Years | 579 (14.4%) | 343 (9.5%) |
| 25 to 34 Years | 408 (6.9%) | 835 (13.2%) |
| 35 to 44 Years | 567 (8.9%) | 813 (12.0%) |
| 45 to 54 Years | 825 (11.6%) | 512 (6.6%) |
| 55 to 64 Years | 1,057 (9.4%) | 1,619 (11.4%) |
| 65 to 74 Years | 402 (2.8%) | 910 (5.8%) |
| 75 Years and over | 380 (5.3%) | 640 (8.3%) |
| Total | 5,382 (8.1%) | 7,196 (10.0%) |
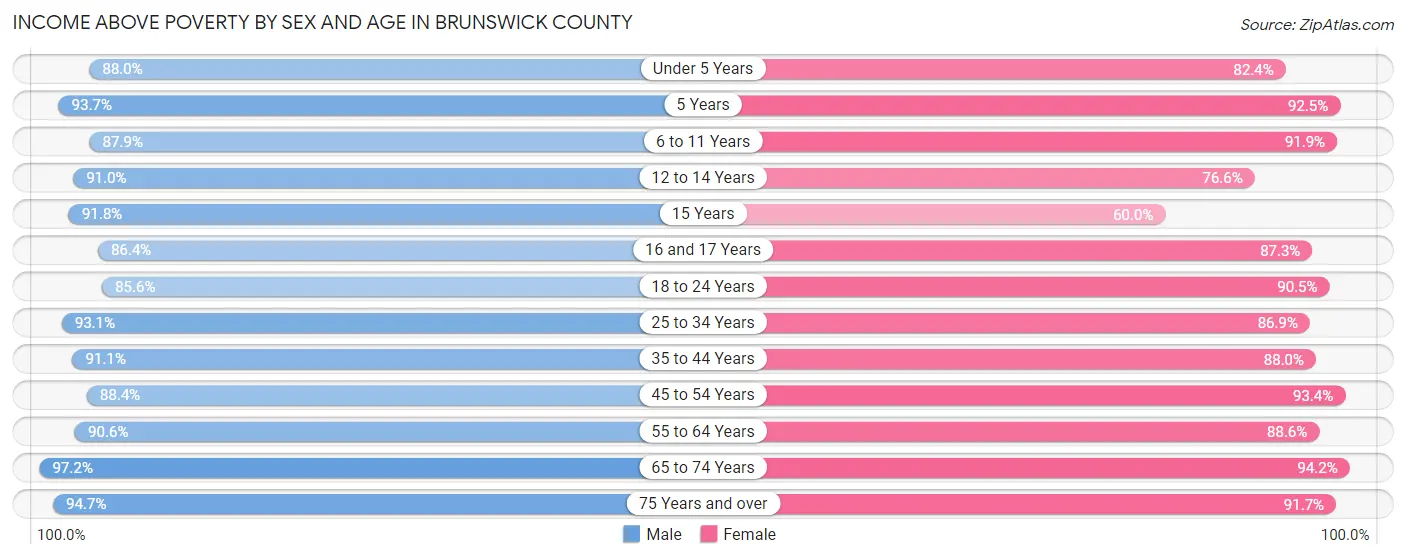
Income Above Poverty by Sex and Age in Brunswick County
According to the poverty statistics in Brunswick County, males aged 65 to 74 years and females aged 65 to 74 years are the age groups that are most secure financially, with 97.2% of males and 94.2% of females in these age groups living above the poverty line.
| Age Bracket | Male | Female |
| Under 5 Years | 2,323 (88.0%) | 2,033 (82.4%) |
| 5 Years | 474 (93.7%) | 591 (92.5%) |
| 6 to 11 Years | 3,122 (87.9%) | 2,734 (91.9%) |
| 12 to 14 Years | 1,682 (91.0%) | 1,382 (76.6%) |
| 15 Years | 513 (91.8%) | 359 (60.0%) |
| 16 and 17 Years | 1,104 (86.4%) | 956 (87.3%) |
| 18 to 24 Years | 3,450 (85.6%) | 3,263 (90.5%) |
| 25 to 34 Years | 5,495 (93.1%) | 5,513 (86.9%) |
| 35 to 44 Years | 5,813 (91.1%) | 5,959 (88.0%) |
| 45 to 54 Years | 6,303 (88.4%) | 7,261 (93.4%) |
| 55 to 64 Years | 10,212 (90.6%) | 12,565 (88.6%) |
| 65 to 74 Years | 14,122 (97.2%) | 14,891 (94.2%) |
| 75 Years and over | 6,802 (94.7%) | 7,084 (91.7%) |
| Total | 61,415 (91.9%) | 64,591 (90.0%) |
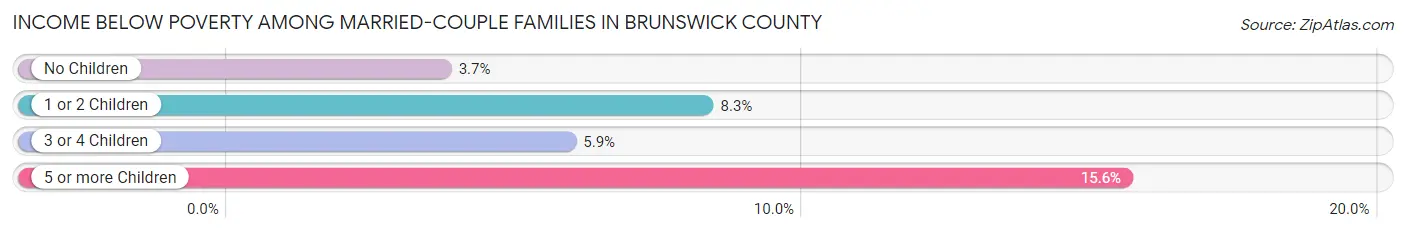
Income Below Poverty Among Married-Couple Families in Brunswick County
The poverty statistics for married-couple families in Brunswick County show that 4.6% or 1,633 of the total 35,469 families live below the poverty line. Families with 5 or more children have the highest poverty rate of 15.6%, comprising of 12 families. On the other hand, families with no children have the lowest poverty rate of 3.7%, which includes 1,047 families.
| Children | Above Poverty | Below Poverty |
| No Children | 27,067 (96.3%) | 1,047 (3.7%) |
| 1 or 2 Children | 5,569 (91.7%) | 503 (8.3%) |
| 3 or 4 Children | 1,135 (94.1%) | 71 (5.9%) |
| 5 or more Children | 65 (84.4%) | 12 (15.6%) |
| Total | 33,836 (95.4%) | 1,633 (4.6%) |
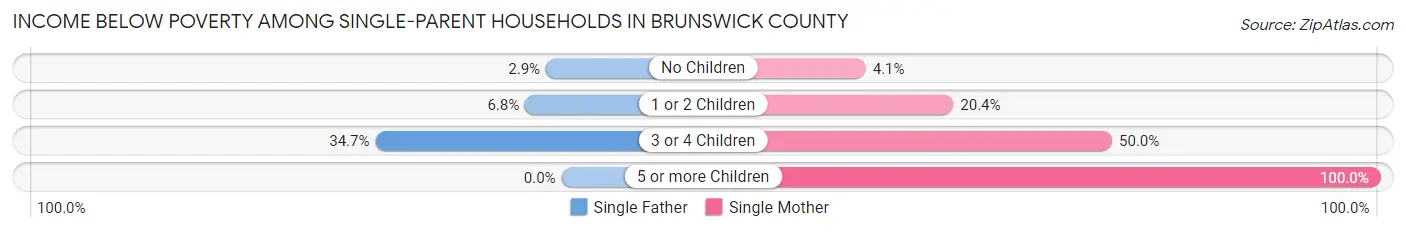
Income Below Poverty Among Single-Parent Households in Brunswick County
According to the poverty data in Brunswick County, 5.4% or 118 single-father households and 15.3% or 754 single-mother households are living below the poverty line. Among single-father households, those with 3 or 4 children have the highest poverty rate, with 26 households (34.7%) experiencing poverty. Likewise, among single-mother households, those with 5 or more children have the highest poverty rate, with 8 households (100.0%) falling below the poverty line.
| Children | Single Father | Single Mother |
| No Children | 38 (2.9%) | 90 (4.1%) |
| 1 or 2 Children | 54 (6.8%) | 494 (20.4%) |
| 3 or 4 Children | 26 (34.7%) | 162 (50.0%) |
| 5 or more Children | 0 (0.0%) | 8 (100.0%) |
| Total | 118 (5.4%) | 754 (15.3%) |
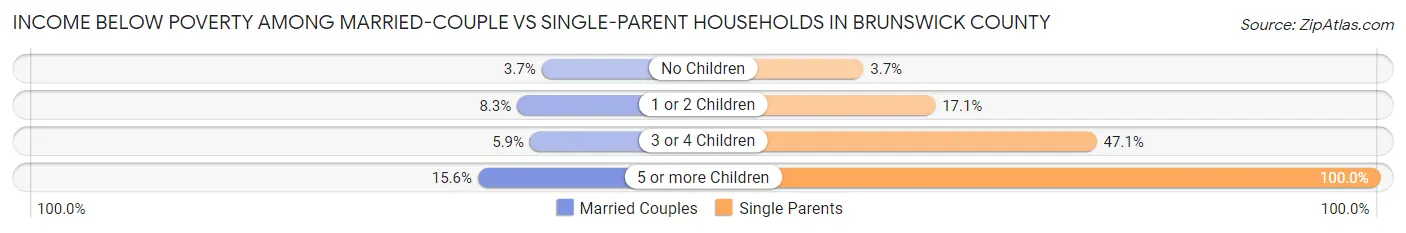
Income Below Poverty Among Married-Couple vs Single-Parent Households in Brunswick County
The poverty data for Brunswick County shows that 1,633 of the married-couple family households (4.6%) and 872 of the single-parent households (12.2%) are living below the poverty level. Within the married-couple family households, those with 5 or more children have the highest poverty rate, with 12 households (15.6%) falling below the poverty line. Among the single-parent households, those with 5 or more children have the highest poverty rate, with 8 household (100.0%) living below poverty.
| Children | Married-Couple Families | Single-Parent Households |
| No Children | 1,047 (3.7%) | 128 (3.7%) |
| 1 or 2 Children | 503 (8.3%) | 548 (17.1%) |
| 3 or 4 Children | 71 (5.9%) | 188 (47.1%) |
| 5 or more Children | 12 (15.6%) | 8 (100.0%) |
| Total | 1,633 (4.6%) | 872 (12.2%) |
Employment Characteristics in Brunswick County
Employment by Class of Employer in Brunswick County
Among the 55,354 employed individuals in Brunswick County, private company employees (37,424 | 67.6%), local government employees (4,693 | 8.5%), and self-employed (not incorporated) (3,756 | 6.8%) make up the most common classes of employment.
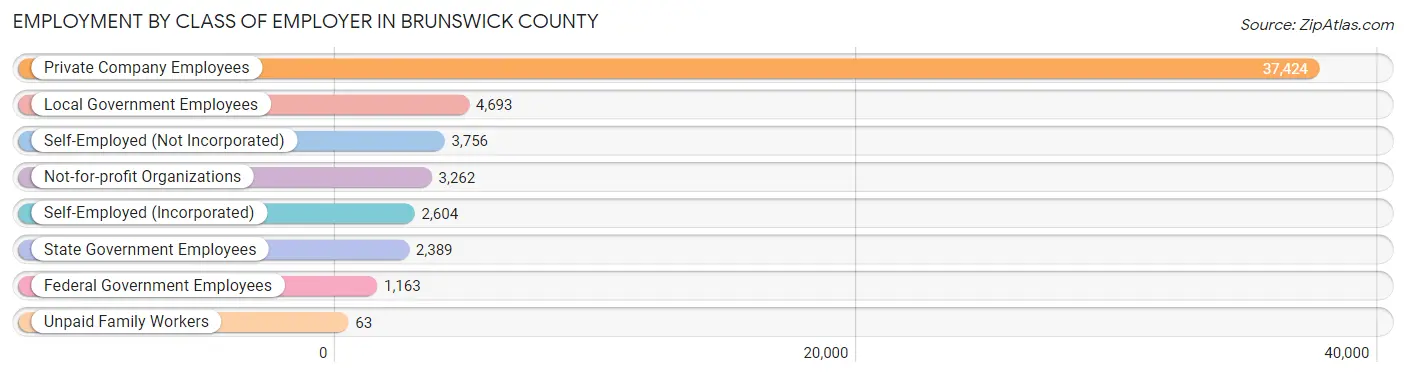
| Employer Class | # Employees | % Employees |
| Private Company Employees | 37,424 | 67.6% |
| Self-Employed (Incorporated) | 2,604 | 4.7% |
| Self-Employed (Not Incorporated) | 3,756 | 6.8% |
| Not-for-profit Organizations | 3,262 | 5.9% |
| Local Government Employees | 4,693 | 8.5% |
| State Government Employees | 2,389 | 4.3% |
| Federal Government Employees | 1,163 | 2.1% |
| Unpaid Family Workers | 63 | 0.1% |
| Total | 55,354 | 100.0% |
Employment Status by Age in Brunswick County
According to the labor force statistics for Brunswick County, out of the total population over 16 years of age (121,872), 48.9% or 59,595 individuals are in the labor force, with 5.0% or 2,980 of them unemployed. The age group with the highest labor force participation rate is 35 to 44 years, with 86.6% or 11,467 individuals in the labor force. Within the labor force, the 16 to 19 years age range has the highest percentage of unemployed individuals, with 11.6% or 221 of them being unemployed.
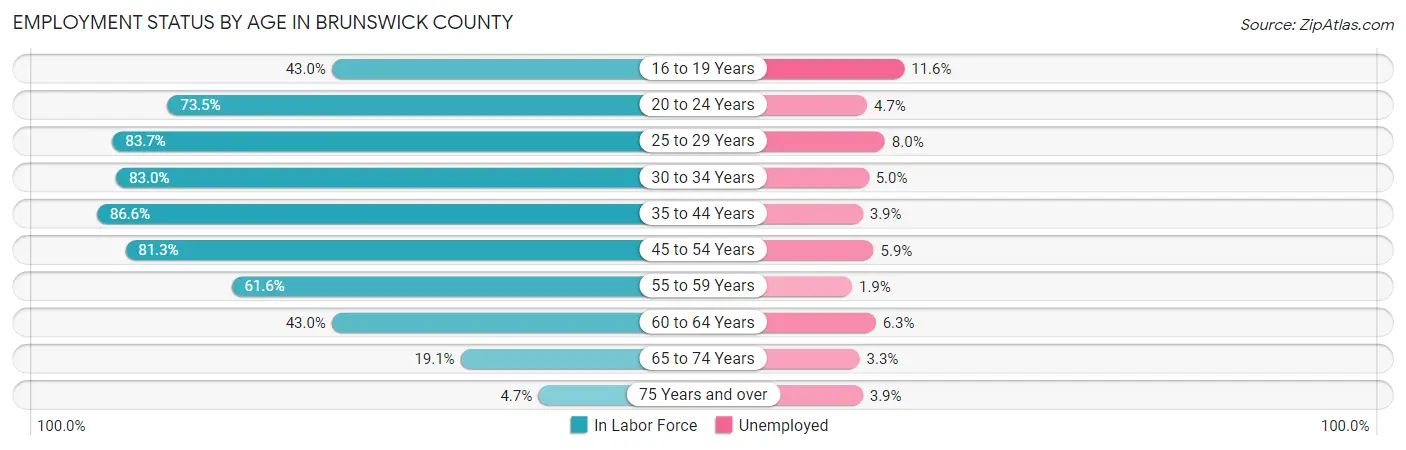
| Age Bracket | In Labor Force | Unemployed |
| 16 to 19 Years | 1,902 (43.0%) | 221 (11.6%) |
| 20 to 24 Years | 4,131 (73.5%) | 194 (4.7%) |
| 25 to 29 Years | 5,084 (83.7%) | 407 (8.0%) |
| 30 to 34 Years | 5,230 (83.0%) | 262 (5.0%) |
| 35 to 44 Years | 11,467 (86.6%) | 447 (3.9%) |
| 45 to 54 Years | 12,133 (81.3%) | 716 (5.9%) |
| 55 to 59 Years | 7,043 (61.6%) | 134 (1.9%) |
| 60 to 64 Years | 6,065 (43.0%) | 382 (6.3%) |
| 65 to 74 Years | 5,823 (19.1%) | 192 (3.3%) |
| 75 Years and over | 717 (4.7%) | 28 (3.9%) |
| Total | 59,595 (48.9%) | 2,980 (5.0%) |
Employment Status by Educational Attainment in Brunswick County
According to labor force statistics for Brunswick County, 71.1% of individuals (46,982) out of the total population between 25 and 64 years of age (66,079) are in the labor force, with 5.0% or 2,349 of them being unemployed. The group with the highest labor force participation rate are those with the educational attainment of bachelor's degree or higher, with 74.8% or 14,187 individuals in the labor force. Within the labor force, individuals with less than high school education have the highest percentage of unemployment, with 13.5% or 360 of them being unemployed.
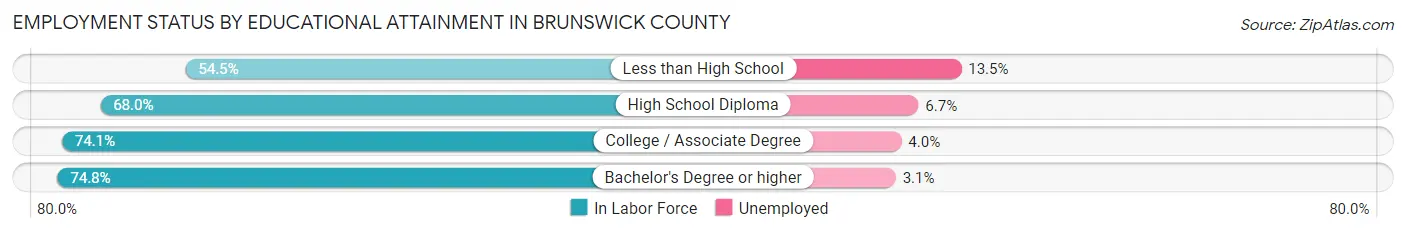
| Educational Attainment | In Labor Force | Unemployed |
| Less than High School | 2,666 (54.5%) | 660 (13.5%) |
| High School Diploma | 12,473 (68.0%) | 1,229 (6.7%) |
| College / Associate Degree | 17,694 (74.1%) | 955 (4.0%) |
| Bachelor's Degree or higher | 14,187 (74.8%) | 588 (3.1%) |
| Total | 46,982 (71.1%) | 3,304 (5.0%) |
Employment Occupations by Sex in Brunswick County
Management, Business, Science and Arts Occupations
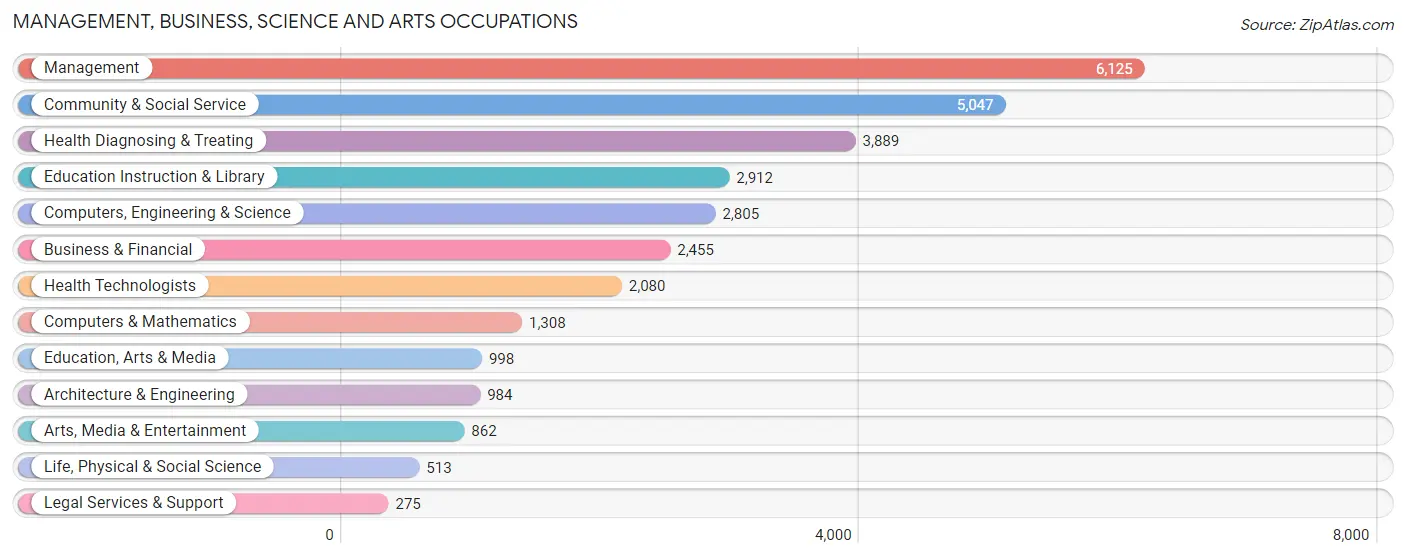
The most common Management, Business, Science and Arts occupations in Brunswick County are Management (6,125 | 10.8%), Community & Social Service (5,047 | 8.9%), Health Diagnosing & Treating (3,889 | 6.9%), Education Instruction & Library (2,912 | 5.2%), and Computers, Engineering & Science (2,805 | 5.0%).
Management, Business, Science and Arts Occupations by Sex
Within the Management, Business, Science and Arts occupations in Brunswick County, the most male-oriented occupations are Architecture & Engineering (78.0%), Computers, Engineering & Science (63.8%), and Computers & Mathematics (61.2%), while the most female-oriented occupations are Health Diagnosing & Treating (85.5%), Health Technologists (85.1%), and Education Instruction & Library (81.1%).
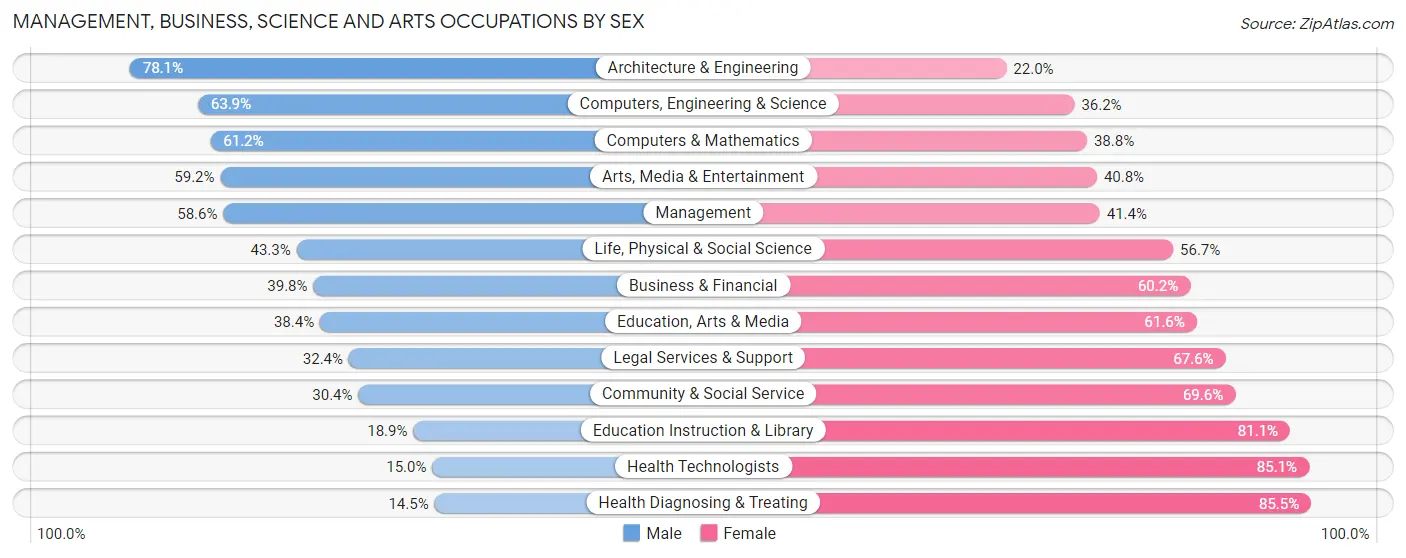
| Occupation | Male | Female |
| Management | 3,587 (58.6%) | 2,538 (41.4%) |
| Business & Financial | 976 (39.8%) | 1,479 (60.2%) |
| Computers, Engineering & Science | 1,791 (63.8%) | 1,014 (36.1%) |
| Computers & Mathematics | 801 (61.2%) | 507 (38.8%) |
| Architecture & Engineering | 768 (78.0%) | 216 (22.0%) |
| Life, Physical & Social Science | 222 (43.3%) | 291 (56.7%) |
| Community & Social Service | 1,533 (30.4%) | 3,514 (69.6%) |
| Education, Arts & Media | 383 (38.4%) | 615 (61.6%) |
| Legal Services & Support | 89 (32.4%) | 186 (67.6%) |
| Education Instruction & Library | 551 (18.9%) | 2,361 (81.1%) |
| Arts, Media & Entertainment | 510 (59.2%) | 352 (40.8%) |
| Health Diagnosing & Treating | 564 (14.5%) | 3,325 (85.5%) |
| Health Technologists | 311 (14.9%) | 1,769 (85.1%) |
| Total (Category) | 8,451 (41.6%) | 11,870 (58.4%) |
| Total (Overall) | 29,160 (51.6%) | 27,303 (48.4%) |
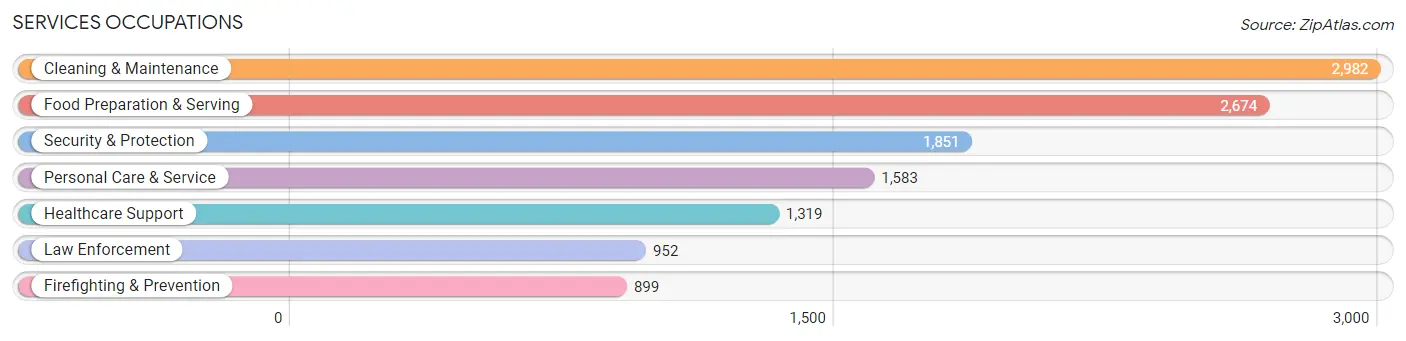
Services Occupations
The most common Services occupations in Brunswick County are Cleaning & Maintenance (2,982 | 5.3%), Food Preparation & Serving (2,674 | 4.7%), Security & Protection (1,851 | 3.3%), Personal Care & Service (1,583 | 2.8%), and Healthcare Support (1,319 | 2.3%).
Services Occupations by Sex
Within the Services occupations in Brunswick County, the most male-oriented occupations are Firefighting & Prevention (87.5%), Security & Protection (86.5%), and Law Enforcement (85.5%), while the most female-oriented occupations are Healthcare Support (83.2%), Personal Care & Service (61.2%), and Food Preparation & Serving (60.5%).
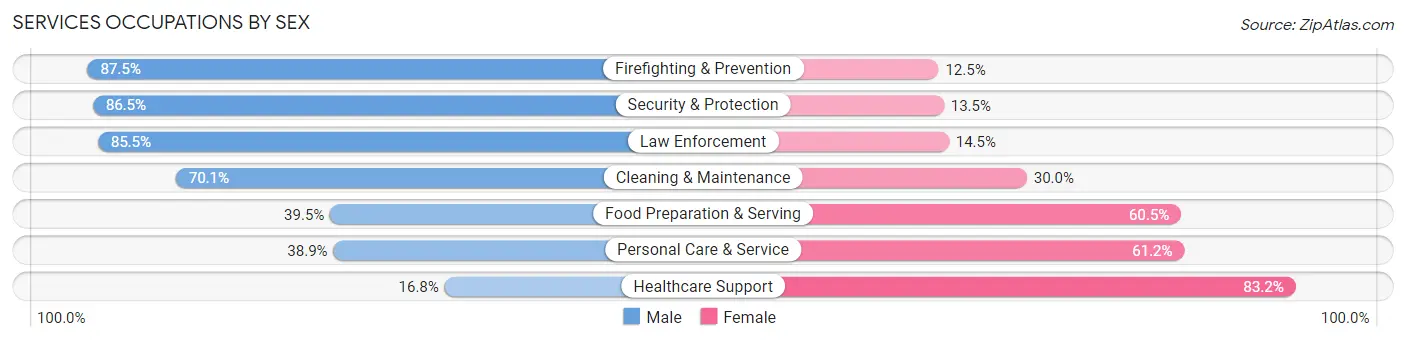
| Occupation | Male | Female |
| Healthcare Support | 222 (16.8%) | 1,097 (83.2%) |
| Security & Protection | 1,601 (86.5%) | 250 (13.5%) |
| Firefighting & Prevention | 787 (87.5%) | 112 (12.5%) |
| Law Enforcement | 814 (85.5%) | 138 (14.5%) |
| Food Preparation & Serving | 1,056 (39.5%) | 1,618 (60.5%) |
| Cleaning & Maintenance | 2,089 (70.1%) | 893 (29.9%) |
| Personal Care & Service | 615 (38.9%) | 968 (61.2%) |
| Total (Category) | 5,583 (53.6%) | 4,826 (46.4%) |
| Total (Overall) | 29,160 (51.6%) | 27,303 (48.4%) |
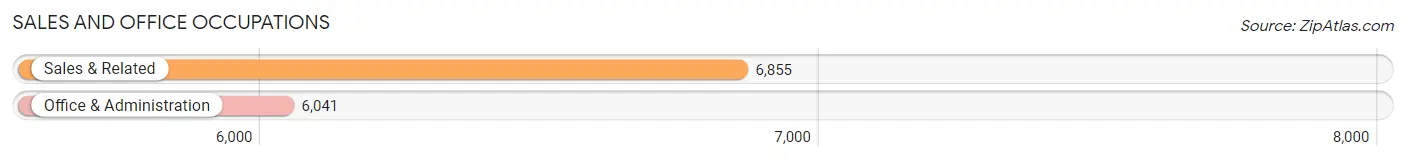
Sales and Office Occupations
The most common Sales and Office occupations in Brunswick County are Sales & Related (6,855 | 12.1%), and Office & Administration (6,041 | 10.7%).
Sales and Office Occupations by Sex
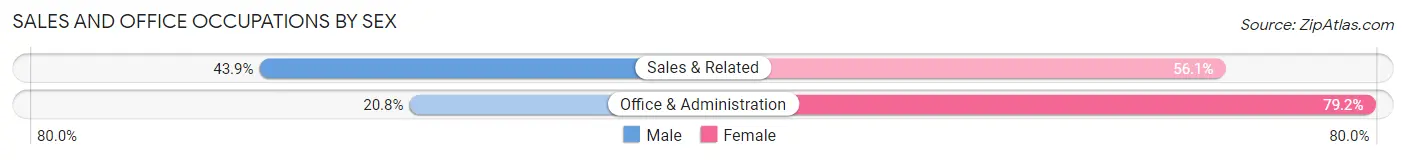
| Occupation | Male | Female |
| Sales & Related | 3,009 (43.9%) | 3,846 (56.1%) |
| Office & Administration | 1,258 (20.8%) | 4,783 (79.2%) |
| Total (Category) | 4,267 (33.1%) | 8,629 (66.9%) |
| Total (Overall) | 29,160 (51.6%) | 27,303 (48.4%) |
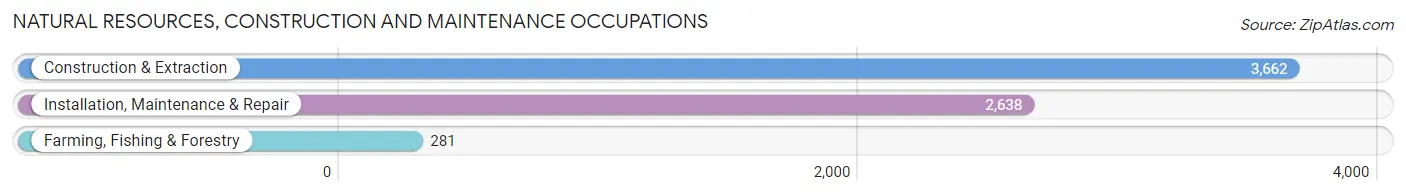
Natural Resources, Construction and Maintenance Occupations
The most common Natural Resources, Construction and Maintenance occupations in Brunswick County are Construction & Extraction (3,662 | 6.5%), Installation, Maintenance & Repair (2,638 | 4.7%), and Farming, Fishing & Forestry (281 | 0.5%).
Natural Resources, Construction and Maintenance Occupations by Sex
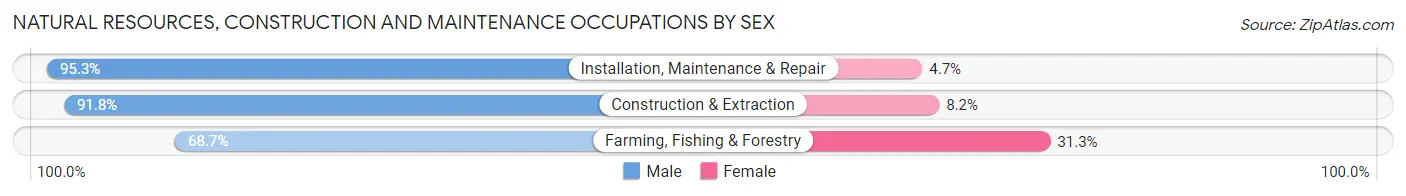
| Occupation | Male | Female |
| Farming, Fishing & Forestry | 193 (68.7%) | 88 (31.3%) |
| Construction & Extraction | 3,362 (91.8%) | 300 (8.2%) |
| Installation, Maintenance & Repair | 2,515 (95.3%) | 123 (4.7%) |
| Total (Category) | 6,070 (92.2%) | 511 (7.8%) |
| Total (Overall) | 29,160 (51.6%) | 27,303 (48.4%) |
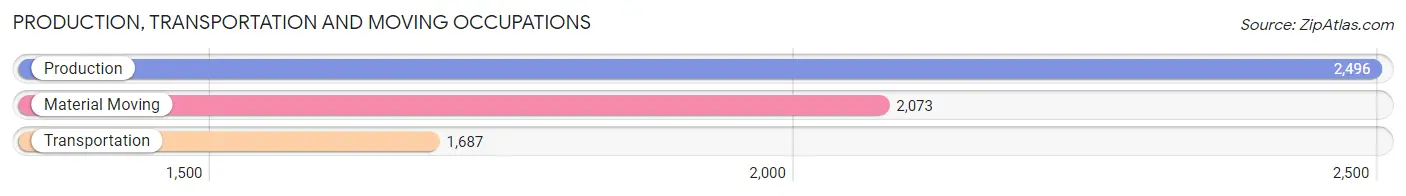
Production, Transportation and Moving Occupations
The most common Production, Transportation and Moving occupations in Brunswick County are Production (2,496 | 4.4%), Material Moving (2,073 | 3.7%), and Transportation (1,687 | 3.0%).
Production, Transportation and Moving Occupations by Sex
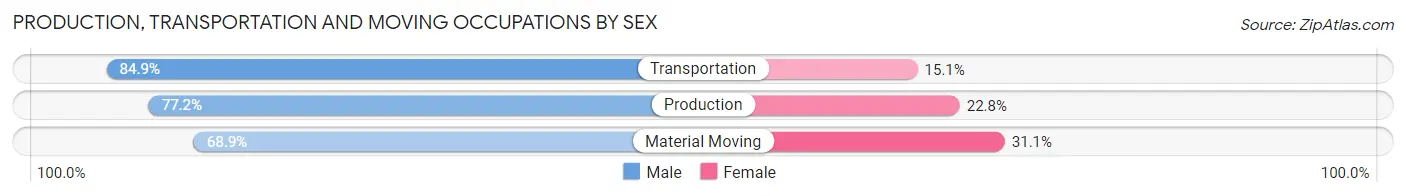
| Occupation | Male | Female |
| Production | 1,927 (77.2%) | 569 (22.8%) |
| Transportation | 1,433 (84.9%) | 254 (15.1%) |
| Material Moving | 1,429 (68.9%) | 644 (31.1%) |
| Total (Category) | 4,789 (76.5%) | 1,467 (23.4%) |
| Total (Overall) | 29,160 (51.6%) | 27,303 (48.4%) |
Employment Industries by Sex in Brunswick County
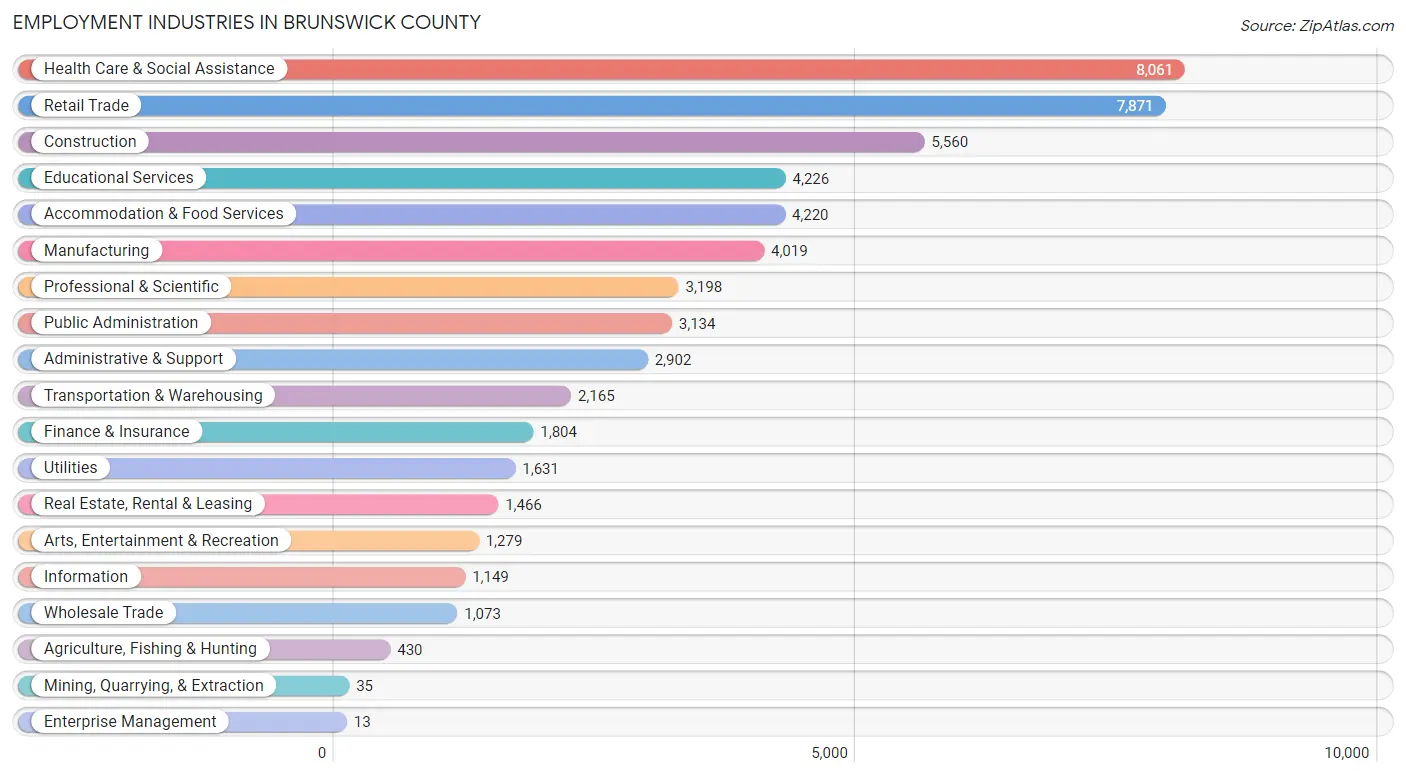
Employment Industries in Brunswick County
The major employment industries in Brunswick County include Health Care & Social Assistance (8,061 | 14.3%), Retail Trade (7,871 | 13.9%), Construction (5,560 | 9.9%), Educational Services (4,226 | 7.5%), and Accommodation & Food Services (4,220 | 7.5%).
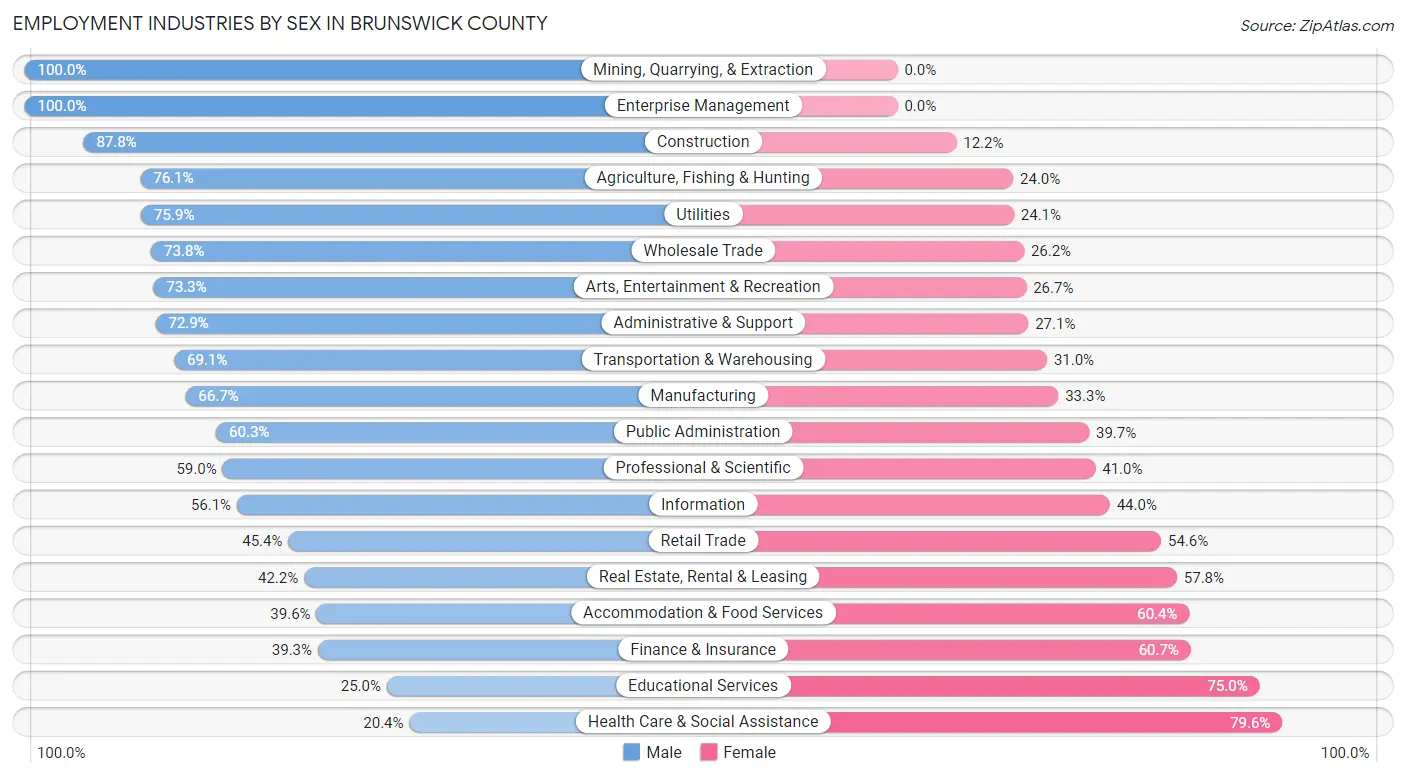
Employment Industries by Sex in Brunswick County
The Brunswick County industries that see more men than women are Mining, Quarrying, & Extraction (100.0%), Enterprise Management (100.0%), and Construction (87.8%), whereas the industries that tend to have a higher number of women are Health Care & Social Assistance (79.6%), Educational Services (75.0%), and Finance & Insurance (60.7%).
| Industry | Male | Female |
| Agriculture, Fishing & Hunting | 327 (76.0%) | 103 (23.9%) |
| Mining, Quarrying, & Extraction | 35 (100.0%) | 0 (0.0%) |
| Construction | 4,882 (87.8%) | 678 (12.2%) |
| Manufacturing | 2,681 (66.7%) | 1,338 (33.3%) |
| Wholesale Trade | 792 (73.8%) | 281 (26.2%) |
| Retail Trade | 3,575 (45.4%) | 4,296 (54.6%) |
| Transportation & Warehousing | 1,495 (69.1%) | 670 (30.9%) |
| Utilities | 1,238 (75.9%) | 393 (24.1%) |
| Information | 644 (56.0%) | 505 (44.0%) |
| Finance & Insurance | 709 (39.3%) | 1,095 (60.7%) |
| Real Estate, Rental & Leasing | 618 (42.2%) | 848 (57.8%) |
| Professional & Scientific | 1,888 (59.0%) | 1,310 (41.0%) |
| Enterprise Management | 13 (100.0%) | 0 (0.0%) |
| Administrative & Support | 2,116 (72.9%) | 786 (27.1%) |
| Educational Services | 1,058 (25.0%) | 3,168 (75.0%) |
| Health Care & Social Assistance | 1,641 (20.4%) | 6,420 (79.6%) |
| Arts, Entertainment & Recreation | 938 (73.3%) | 341 (26.7%) |
| Accommodation & Food Services | 1,671 (39.6%) | 2,549 (60.4%) |
| Public Administration | 1,891 (60.3%) | 1,243 (39.7%) |
| Total | 29,160 (51.6%) | 27,303 (48.4%) |
Education in Brunswick County
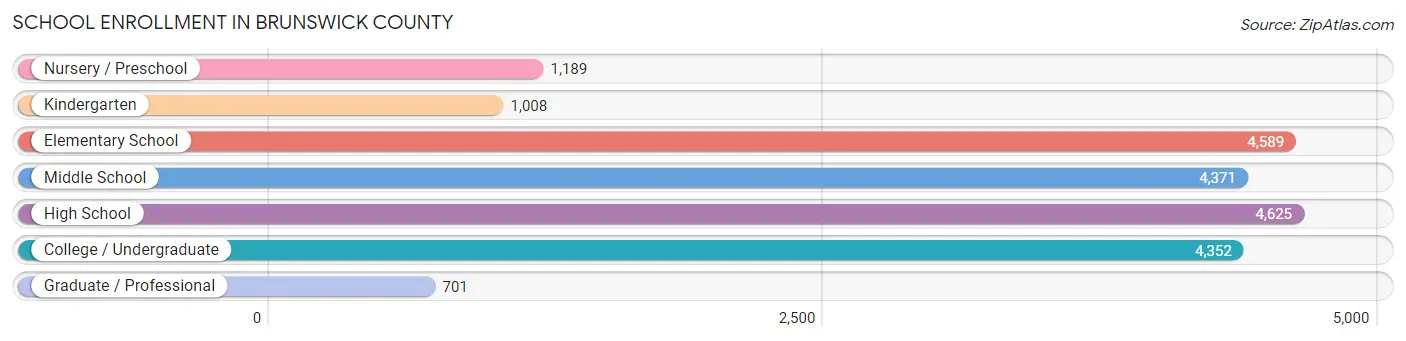
School Enrollment in Brunswick County
The most common levels of schooling among the 20,835 students in Brunswick County are high school (4,625 | 22.2%), elementary school (4,589 | 22.0%), and middle school (4,371 | 21.0%).
| School Level | # Students | % Students |
| Nursery / Preschool | 1,189 | 5.7% |
| Kindergarten | 1,008 | 4.8% |
| Elementary School | 4,589 | 22.0% |
| Middle School | 4,371 | 21.0% |
| High School | 4,625 | 22.2% |
| College / Undergraduate | 4,352 | 20.9% |
| Graduate / Professional | 701 | 3.4% |
| Total | 20,835 | 100.0% |
School Enrollment by Age by Funding Source in Brunswick County
Out of a total of 20,835 students who are enrolled in schools in Brunswick County, 3,042 (14.6%) attend a private institution, while the remaining 17,793 (85.4%) are enrolled in public schools. The age group of 3 to 4 year olds has the highest likelihood of being enrolled in private schools, with 386 (45.4% in the age bracket) enrolled. Conversely, the age group of 15 to 17 year olds has the lowest likelihood of being enrolled in a private school, with 3,092 (93.1% in the age bracket) attending a public institution.
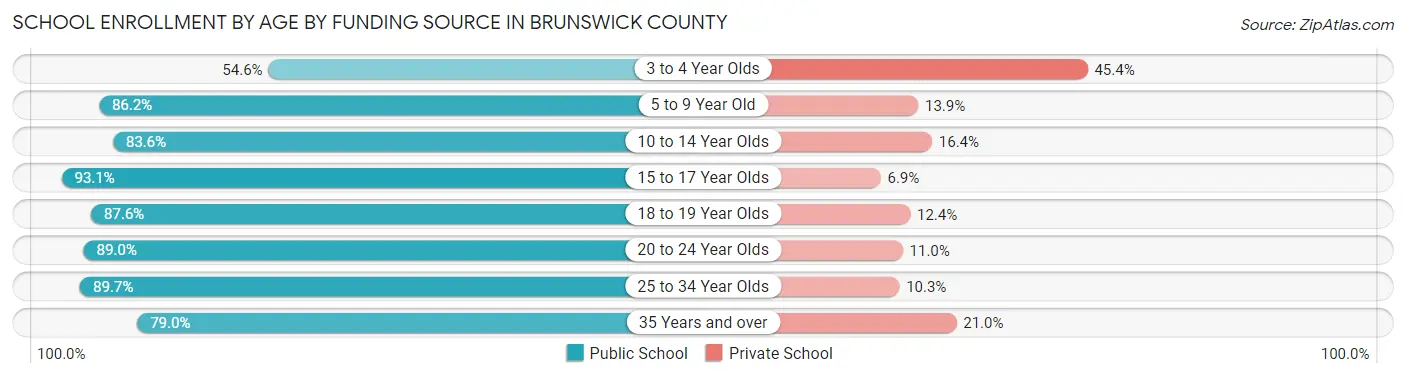
| Age Bracket | Public School | Private School |
| 3 to 4 Year Olds | 464 (54.6%) | 386 (45.4%) |
| 5 to 9 Year Old | 4,447 (86.2%) | 715 (13.9%) |
| 10 to 14 Year Olds | 4,630 (83.6%) | 910 (16.4%) |
| 15 to 17 Year Olds | 3,092 (93.1%) | 228 (6.9%) |
| 18 to 19 Year Olds | 1,298 (87.6%) | 183 (12.4%) |
| 20 to 24 Year Olds | 1,686 (89.0%) | 208 (11.0%) |
| 25 to 34 Year Olds | 1,145 (89.7%) | 132 (10.3%) |
| 35 Years and over | 1,036 (79.0%) | 275 (21.0%) |
| Total | 17,793 (85.4%) | 3,042 (14.6%) |
Educational Attainment by Field of Study in Brunswick County
Business (8,521 | 21.9%), education (6,399 | 16.5%), science & technology (4,464 | 11.5%), social sciences (2,916 | 7.5%), and arts & humanities (2,773 | 7.1%) are the most common fields of study among 38,842 individuals in Brunswick County who have obtained a bachelor's degree or higher.
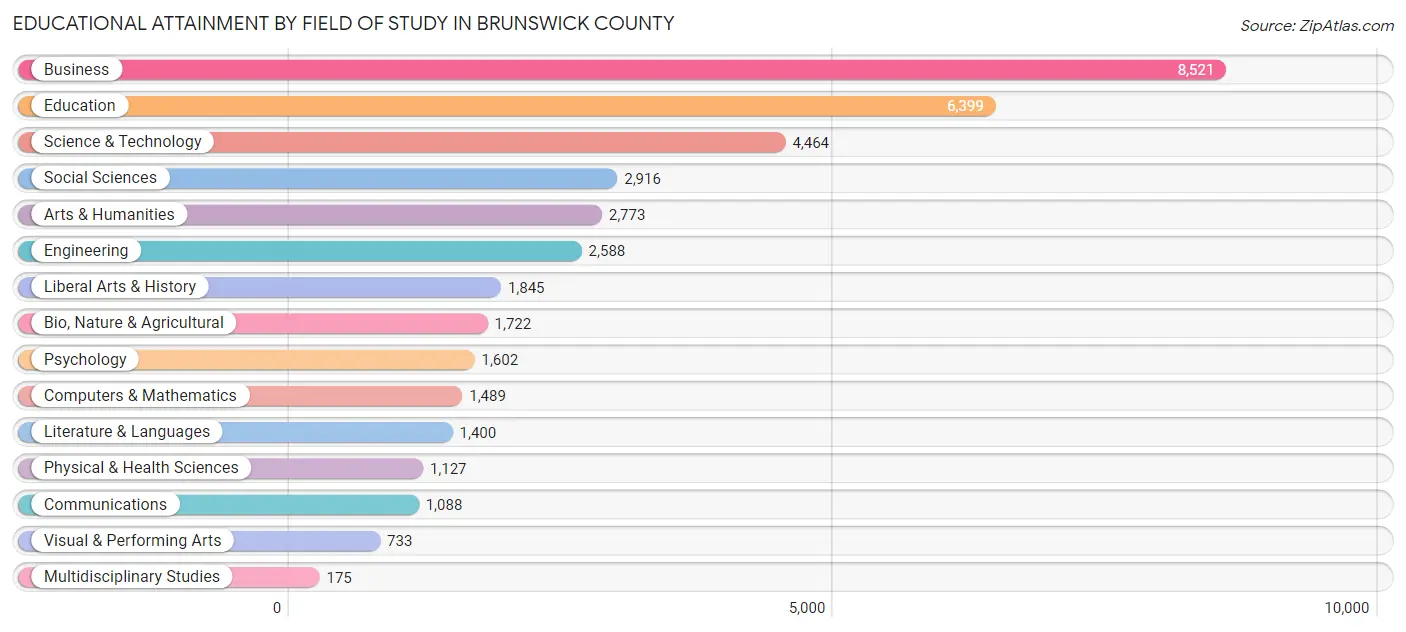
| Field of Study | # Graduates | % Graduates |
| Computers & Mathematics | 1,489 | 3.8% |
| Bio, Nature & Agricultural | 1,722 | 4.4% |
| Physical & Health Sciences | 1,127 | 2.9% |
| Psychology | 1,602 | 4.1% |
| Social Sciences | 2,916 | 7.5% |
| Engineering | 2,588 | 6.7% |
| Multidisciplinary Studies | 175 | 0.4% |
| Science & Technology | 4,464 | 11.5% |
| Business | 8,521 | 21.9% |
| Education | 6,399 | 16.5% |
| Literature & Languages | 1,400 | 3.6% |
| Liberal Arts & History | 1,845 | 4.8% |
| Visual & Performing Arts | 733 | 1.9% |
| Communications | 1,088 | 2.8% |
| Arts & Humanities | 2,773 | 7.1% |
| Total | 38,842 | 100.0% |
Transportation & Commute in Brunswick County
Vehicle Availability by Sex in Brunswick County
The most prevalent vehicle ownership categories in Brunswick County are males with 2 vehicles (12,634, accounting for 44.2%) and females with 2 vehicles (10,854, making up 47.2%).
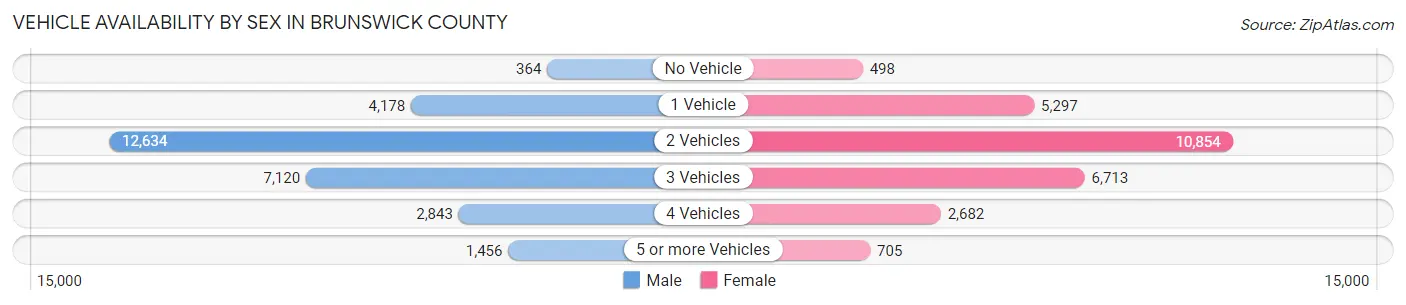
| Vehicles Available | Male | Female |
| No Vehicle | 364 (1.3%) | 498 (1.9%) |
| 1 Vehicle | 4,178 (14.6%) | 5,297 (19.8%) |
| 2 Vehicles | 12,634 (44.2%) | 10,854 (40.6%) |
| 3 Vehicles | 7,120 (24.9%) | 6,713 (25.1%) |
| 4 Vehicles | 2,843 (9.9%) | 2,682 (10.0%) |
| 5 or more Vehicles | 1,456 (5.1%) | 705 (2.6%) |
| Total | 28,595 (100.0%) | 26,749 (100.0%) |
Commute Time in Brunswick County
The most frequently occuring commute durations in Brunswick County are 20 to 24 minutes (8,669 commuters, 17.5%), 15 to 19 minutes (8,205 commuters, 16.6%), and 30 to 34 minutes (7,075 commuters, 14.3%).
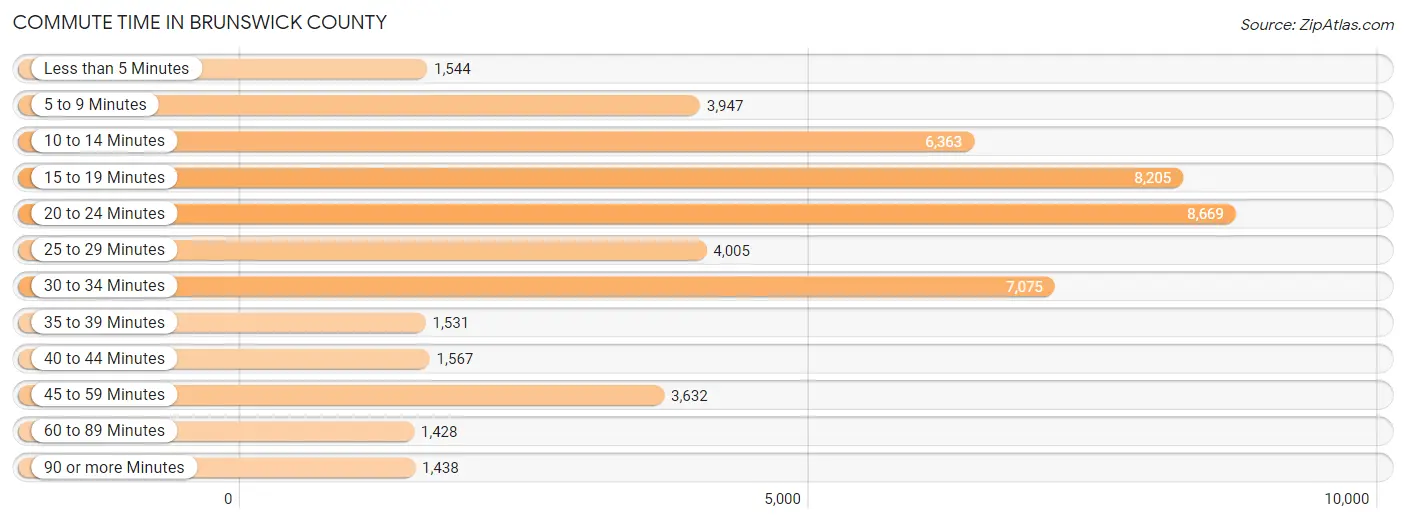
| Commute Time | # Commuters | % Commuters |
| Less than 5 Minutes | 1,544 | 3.1% |
| 5 to 9 Minutes | 3,947 | 8.0% |
| 10 to 14 Minutes | 6,363 | 12.9% |
| 15 to 19 Minutes | 8,205 | 16.6% |
| 20 to 24 Minutes | 8,669 | 17.5% |
| 25 to 29 Minutes | 4,005 | 8.1% |
| 30 to 34 Minutes | 7,075 | 14.3% |
| 35 to 39 Minutes | 1,531 | 3.1% |
| 40 to 44 Minutes | 1,567 | 3.2% |
| 45 to 59 Minutes | 3,632 | 7.3% |
| 60 to 89 Minutes | 1,428 | 2.9% |
| 90 or more Minutes | 1,438 | 2.9% |
Commute Time by Sex in Brunswick County
The most common commute times in Brunswick County are 20 to 24 minutes (4,421 commuters, 17.3%) for males and 15 to 19 minutes (4,290 commuters, 18.0%) for females.
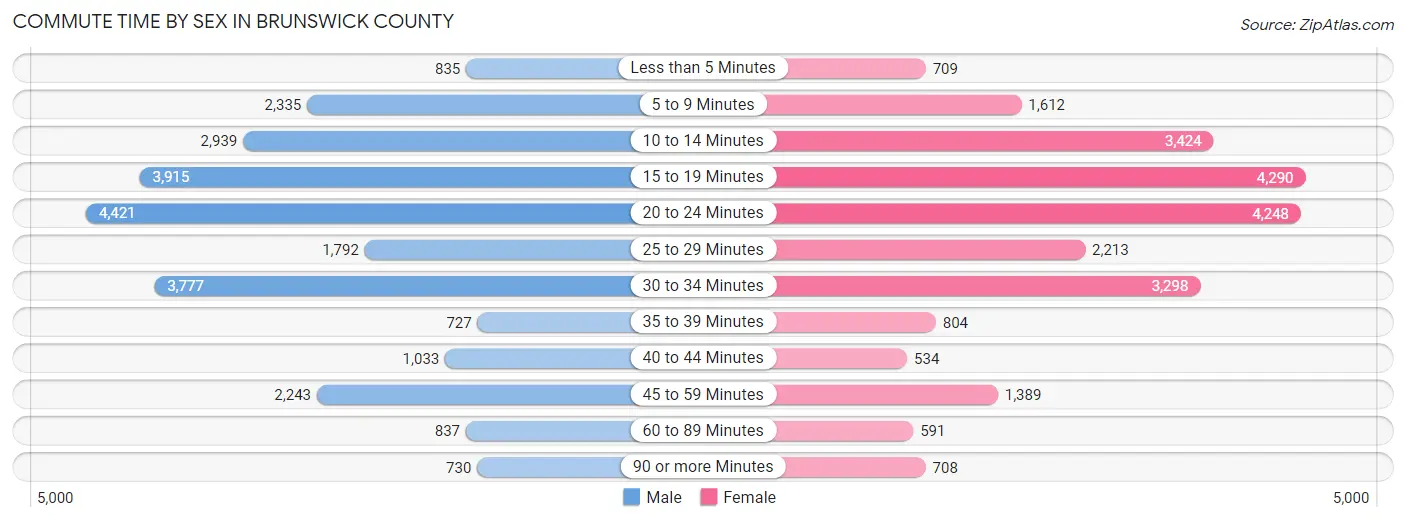
| Commute Time | Male | Female |
| Less than 5 Minutes | 835 (3.3%) | 709 (3.0%) |
| 5 to 9 Minutes | 2,335 (9.1%) | 1,612 (6.8%) |
| 10 to 14 Minutes | 2,939 (11.5%) | 3,424 (14.4%) |
| 15 to 19 Minutes | 3,915 (15.3%) | 4,290 (18.0%) |
| 20 to 24 Minutes | 4,421 (17.3%) | 4,248 (17.8%) |
| 25 to 29 Minutes | 1,792 (7.0%) | 2,213 (9.3%) |
| 30 to 34 Minutes | 3,777 (14.8%) | 3,298 (13.9%) |
| 35 to 39 Minutes | 727 (2.8%) | 804 (3.4%) |
| 40 to 44 Minutes | 1,033 (4.0%) | 534 (2.2%) |
| 45 to 59 Minutes | 2,243 (8.8%) | 1,389 (5.8%) |
| 60 to 89 Minutes | 837 (3.3%) | 591 (2.5%) |
| 90 or more Minutes | 730 (2.9%) | 708 (3.0%) |
Time of Departure to Work by Sex in Brunswick County
The most frequent times of departure to work in Brunswick County are 7:00 AM to 7:29 AM (4,151, 16.2%) for males and 7:00 AM to 7:29 AM (4,331, 18.2%) for females.
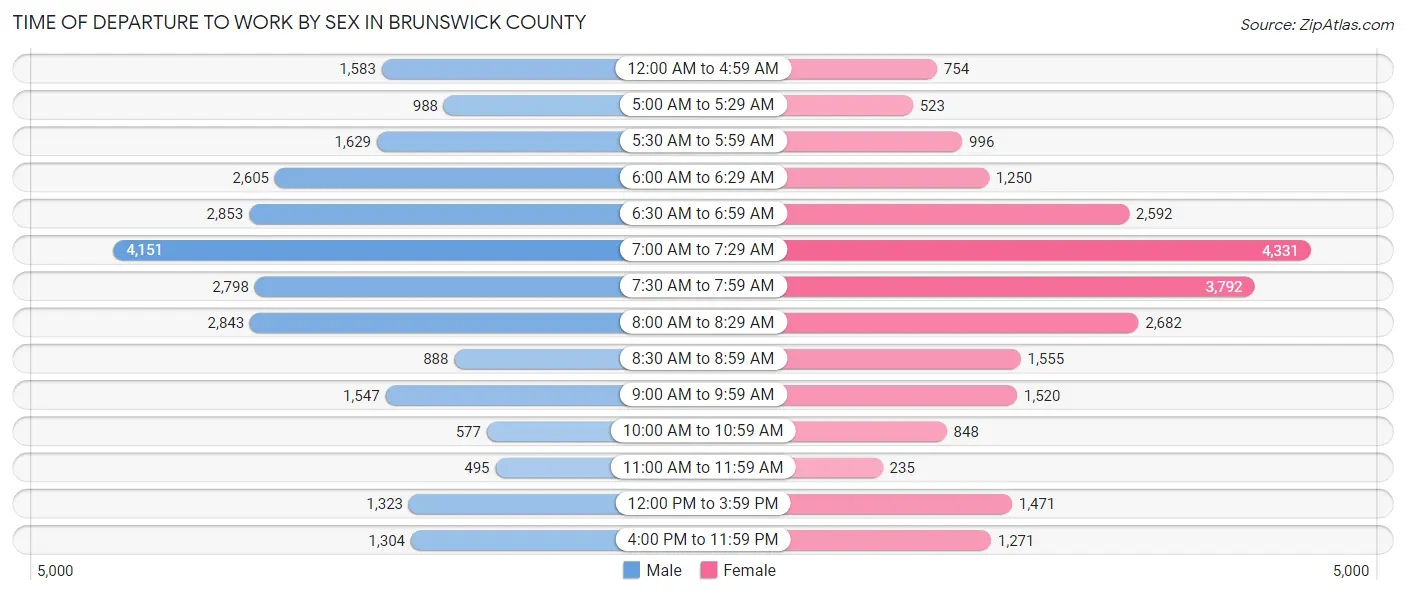
| Time of Departure | Male | Female |
| 12:00 AM to 4:59 AM | 1,583 (6.2%) | 754 (3.2%) |
| 5:00 AM to 5:29 AM | 988 (3.9%) | 523 (2.2%) |
| 5:30 AM to 5:59 AM | 1,629 (6.4%) | 996 (4.2%) |
| 6:00 AM to 6:29 AM | 2,605 (10.2%) | 1,250 (5.2%) |
| 6:30 AM to 6:59 AM | 2,853 (11.2%) | 2,592 (10.9%) |
| 7:00 AM to 7:29 AM | 4,151 (16.2%) | 4,331 (18.2%) |
| 7:30 AM to 7:59 AM | 2,798 (10.9%) | 3,792 (15.9%) |
| 8:00 AM to 8:29 AM | 2,843 (11.1%) | 2,682 (11.3%) |
| 8:30 AM to 8:59 AM | 888 (3.5%) | 1,555 (6.5%) |
| 9:00 AM to 9:59 AM | 1,547 (6.0%) | 1,520 (6.4%) |
| 10:00 AM to 10:59 AM | 577 (2.3%) | 848 (3.6%) |
| 11:00 AM to 11:59 AM | 495 (1.9%) | 235 (1.0%) |
| 12:00 PM to 3:59 PM | 1,323 (5.2%) | 1,471 (6.2%) |
| 4:00 PM to 11:59 PM | 1,304 (5.1%) | 1,271 (5.3%) |
| Total | 25,584 (100.0%) | 23,820 (100.0%) |
Housing Occupancy in Brunswick County
Occupancy by Ownership in Brunswick County
Of the total 60,915 dwellings in Brunswick County, owner-occupied units account for 51,008 (83.7%), while renter-occupied units make up 9,907 (16.3%).
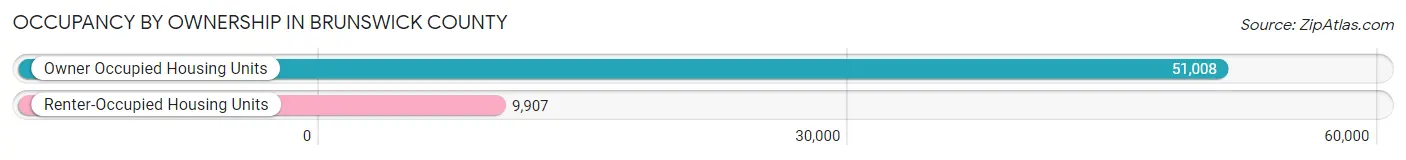
| Occupancy | # Housing Units | % Housing Units |
| Owner Occupied Housing Units | 51,008 | 83.7% |
| Renter-Occupied Housing Units | 9,907 | 16.3% |
| Total Occupied Housing Units | 60,915 | 100.0% |
Occupancy by Household Size in Brunswick County
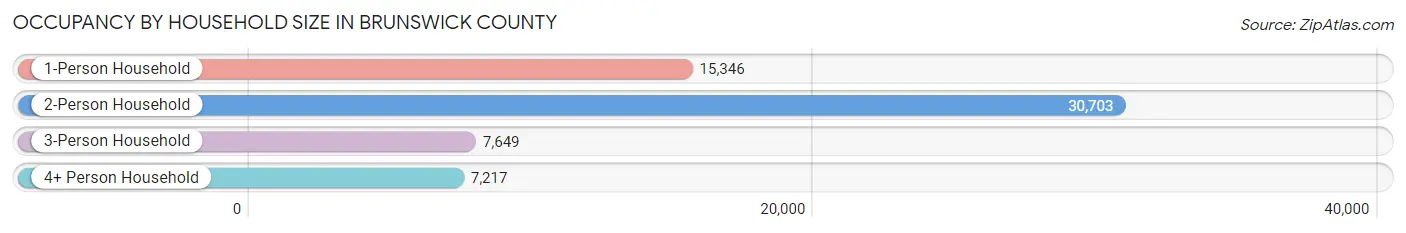
| Household Size | # Housing Units | % Housing Units |
| 1-Person Household | 15,346 | 25.2% |
| 2-Person Household | 30,703 | 50.4% |
| 3-Person Household | 7,649 | 12.6% |
| 4+ Person Household | 7,217 | 11.8% |
| Total Housing Units | 60,915 | 100.0% |
Occupancy by Ownership by Household Size in Brunswick County
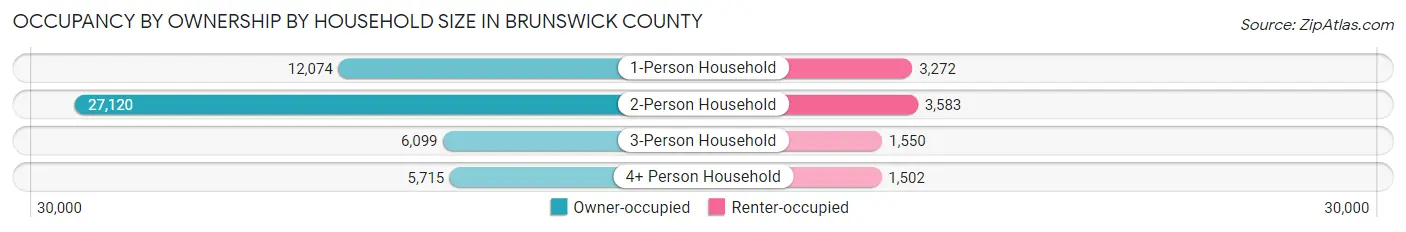
| Household Size | Owner-occupied | Renter-occupied |
| 1-Person Household | 12,074 (78.7%) | 3,272 (21.3%) |
| 2-Person Household | 27,120 (88.3%) | 3,583 (11.7%) |
| 3-Person Household | 6,099 (79.7%) | 1,550 (20.3%) |
| 4+ Person Household | 5,715 (79.2%) | 1,502 (20.8%) |
| Total Housing Units | 51,008 (83.7%) | 9,907 (16.3%) |
Occupancy by Educational Attainment in Brunswick County
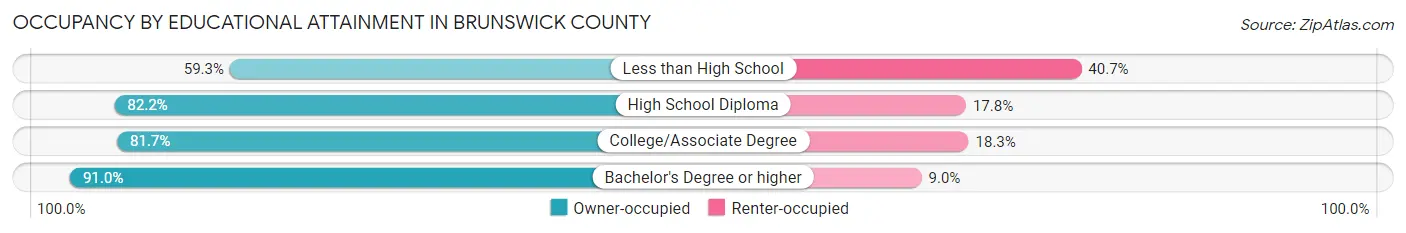
| Household Size | Owner-occupied | Renter-occupied |
| Less than High School | 2,205 (59.3%) | 1,513 (40.7%) |
| High School Diploma | 11,636 (82.2%) | 2,522 (17.8%) |
| College/Associate Degree | 17,483 (81.7%) | 3,924 (18.3%) |
| Bachelor's Degree or higher | 19,684 (91.0%) | 1,948 (9.0%) |
Occupancy by Age of Householder in Brunswick County
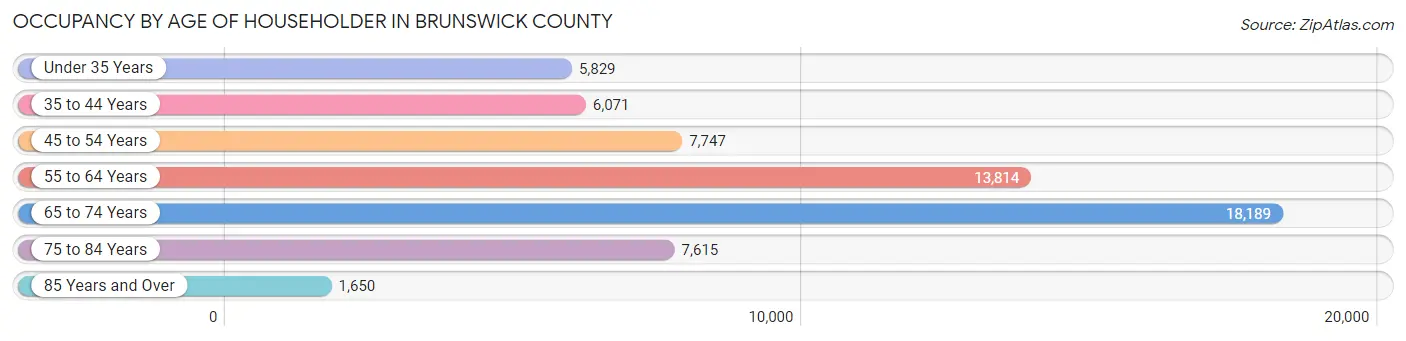
| Age Bracket | # Households | % Households |
| Under 35 Years | 5,829 | 9.6% |
| 35 to 44 Years | 6,071 | 10.0% |
| 45 to 54 Years | 7,747 | 12.7% |
| 55 to 64 Years | 13,814 | 22.7% |
| 65 to 74 Years | 18,189 | 29.9% |
| 75 to 84 Years | 7,615 | 12.5% |
| 85 Years and Over | 1,650 | 2.7% |
| Total | 60,915 | 100.0% |
Housing Finances in Brunswick County
Median Income by Occupancy in Brunswick County
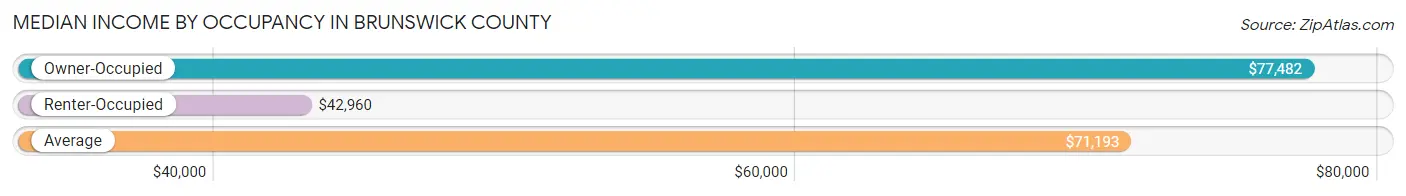
| Occupancy Type | # Households | Median Income |
| Owner-Occupied | 51,008 (83.7%) | $77,482 |
| Renter-Occupied | 9,907 (16.3%) | $42,960 |
| Average | 60,915 (100.0%) | $71,193 |
Occupancy by Householder Income Bracket in Brunswick County
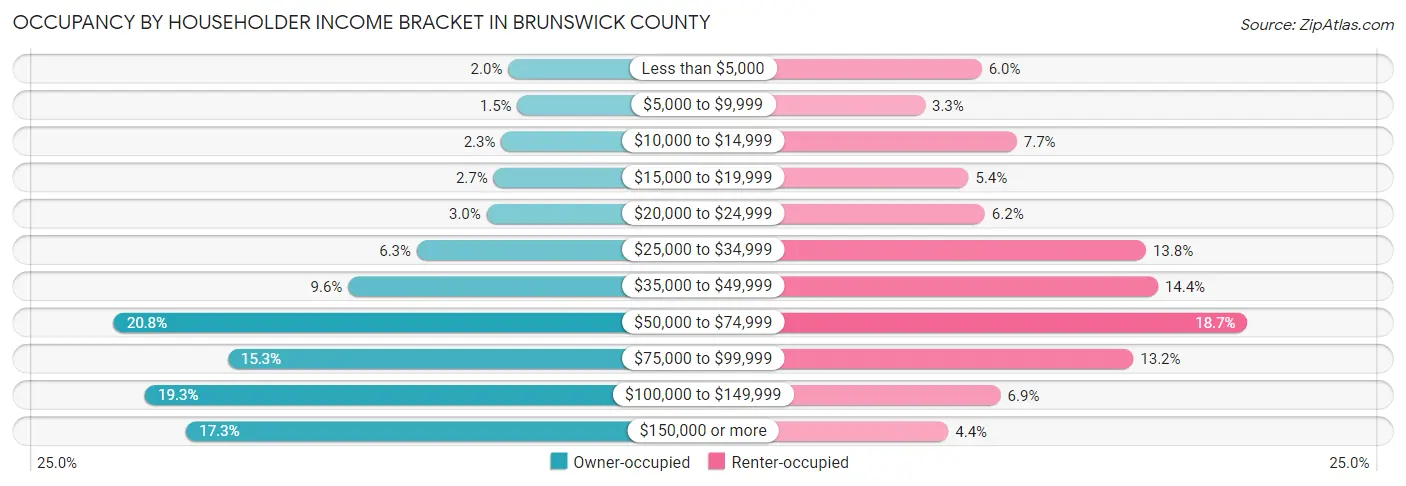
| Income Bracket | Owner-occupied | Renter-occupied |
| Less than $5,000 | 1,007 (2.0%) | 595 (6.0%) |
| $5,000 to $9,999 | 778 (1.5%) | 328 (3.3%) |
| $10,000 to $14,999 | 1,171 (2.3%) | 761 (7.7%) |
| $15,000 to $19,999 | 1,362 (2.7%) | 533 (5.4%) |
| $20,000 to $24,999 | 1,530 (3.0%) | 610 (6.2%) |
| $25,000 to $34,999 | 3,224 (6.3%) | 1,370 (13.8%) |
| $35,000 to $49,999 | 4,890 (9.6%) | 1,427 (14.4%) |
| $50,000 to $74,999 | 10,585 (20.7%) | 1,849 (18.7%) |
| $75,000 to $99,999 | 7,815 (15.3%) | 1,311 (13.2%) |
| $100,000 to $149,999 | 9,824 (19.3%) | 685 (6.9%) |
| $150,000 or more | 8,822 (17.3%) | 438 (4.4%) |
| Total | 51,008 (100.0%) | 9,907 (100.0%) |
Monthly Housing Cost Tiers in Brunswick County
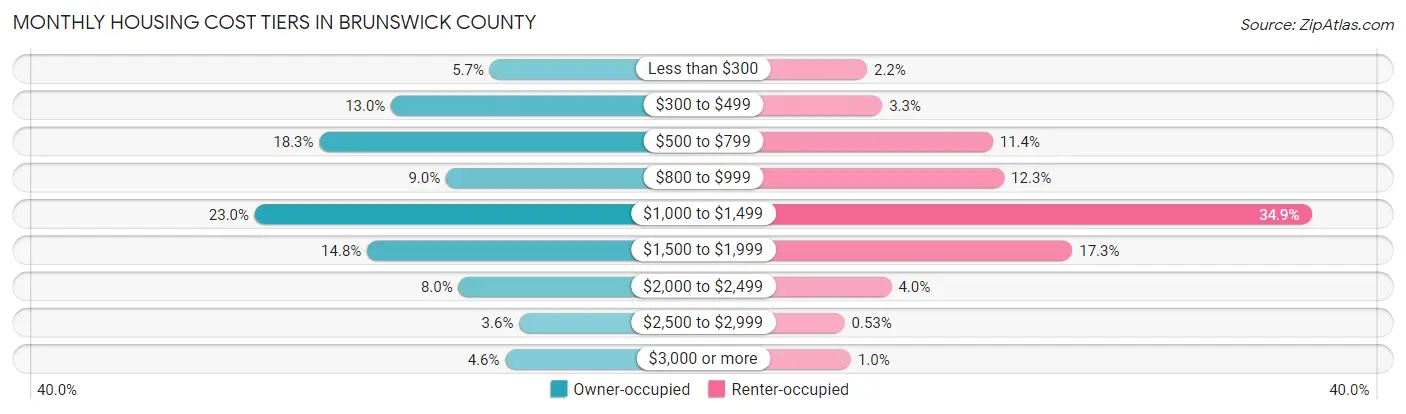
| Monthly Cost | Owner-occupied | Renter-occupied |
| Less than $300 | 2,929 (5.7%) | 216 (2.2%) |
| $300 to $499 | 6,630 (13.0%) | 327 (3.3%) |
| $500 to $799 | 9,327 (18.3%) | 1,133 (11.4%) |
| $800 to $999 | 4,569 (9.0%) | 1,217 (12.3%) |
| $1,000 to $1,499 | 11,753 (23.0%) | 3,458 (34.9%) |
| $1,500 to $1,999 | 7,534 (14.8%) | 1,714 (17.3%) |
| $2,000 to $2,499 | 4,100 (8.0%) | 394 (4.0%) |
| $2,500 to $2,999 | 1,822 (3.6%) | 53 (0.5%) |
| $3,000 or more | 2,344 (4.6%) | 99 (1.0%) |
| Total | 51,008 (100.0%) | 9,907 (100.0%) |
Physical Housing Characteristics in Brunswick County
Housing Structures in Brunswick County
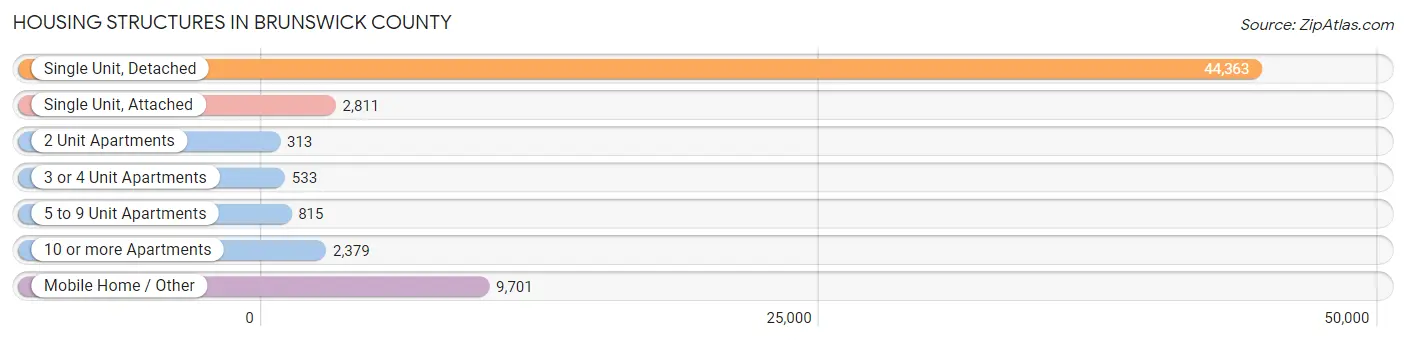
| Structure Type | # Housing Units | % Housing Units |
| Single Unit, Detached | 44,363 | 72.8% |
| Single Unit, Attached | 2,811 | 4.6% |
| 2 Unit Apartments | 313 | 0.5% |
| 3 or 4 Unit Apartments | 533 | 0.9% |
| 5 to 9 Unit Apartments | 815 | 1.3% |
| 10 or more Apartments | 2,379 | 3.9% |
| Mobile Home / Other | 9,701 | 15.9% |
| Total | 60,915 | 100.0% |
Housing Structures by Occupancy in Brunswick County
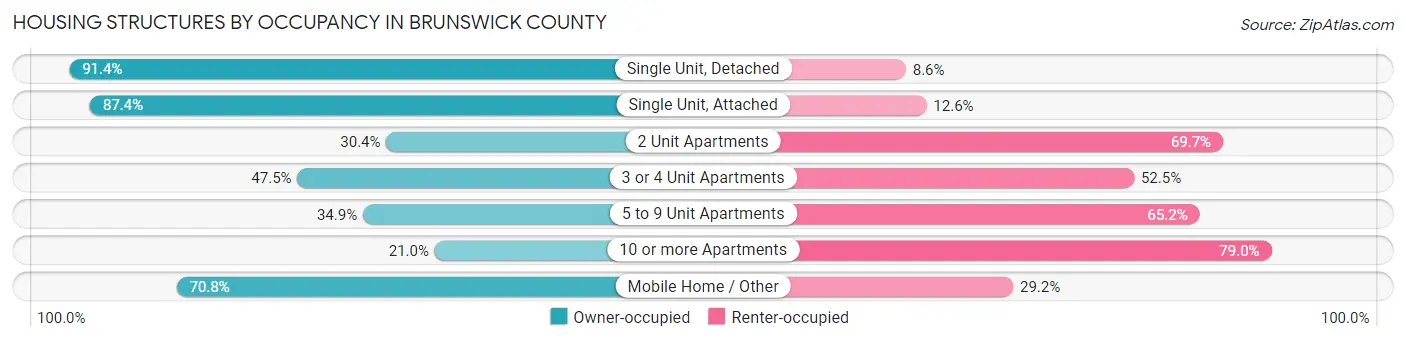
| Structure Type | Owner-occupied | Renter-occupied |
| Single Unit, Detached | 40,554 (91.4%) | 3,809 (8.6%) |
| Single Unit, Attached | 2,458 (87.4%) | 353 (12.6%) |
| 2 Unit Apartments | 95 (30.3%) | 218 (69.7%) |
| 3 or 4 Unit Apartments | 253 (47.5%) | 280 (52.5%) |
| 5 to 9 Unit Apartments | 284 (34.8%) | 531 (65.1%) |
| 10 or more Apartments | 500 (21.0%) | 1,879 (79.0%) |
| Mobile Home / Other | 6,864 (70.8%) | 2,837 (29.2%) |
| Total | 51,008 (83.7%) | 9,907 (16.3%) |
Housing Structures by Number of Rooms in Brunswick County
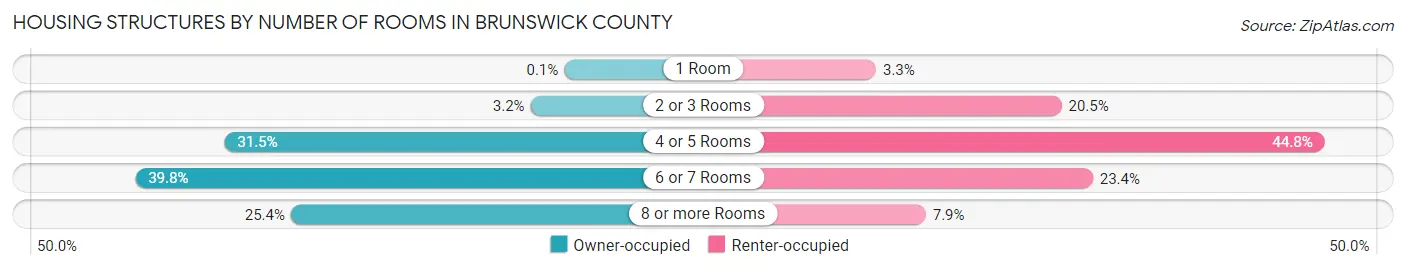
| Number of Rooms | Owner-occupied | Renter-occupied |
| 1 Room | 51 (0.1%) | 331 (3.3%) |
| 2 or 3 Rooms | 1,643 (3.2%) | 2,031 (20.5%) |
| 4 or 5 Rooms | 16,079 (31.5%) | 4,441 (44.8%) |
| 6 or 7 Rooms | 20,288 (39.8%) | 2,317 (23.4%) |
| 8 or more Rooms | 12,947 (25.4%) | 787 (7.9%) |
| Total | 51,008 (100.0%) | 9,907 (100.0%) |
Housing Structure by Heating Type in Brunswick County
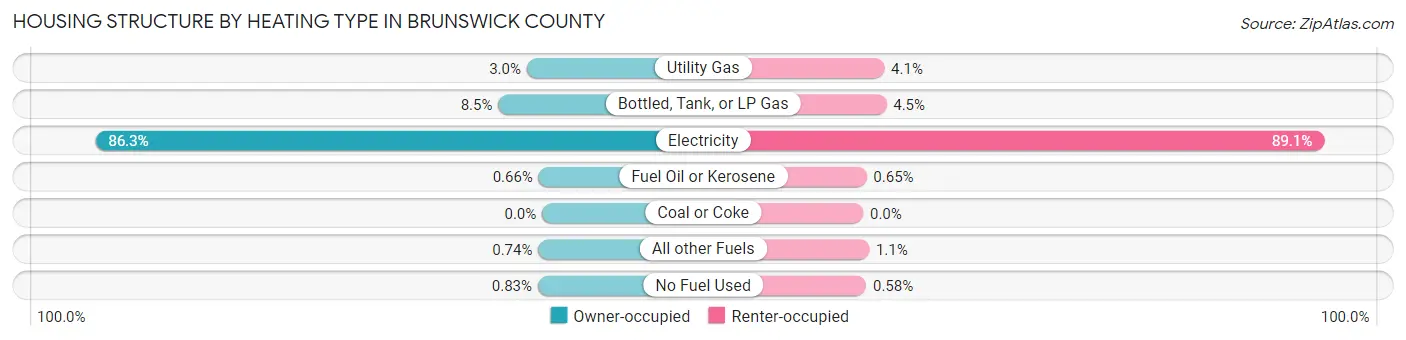
| Heating Type | Owner-occupied | Renter-occupied |
| Utility Gas | 1,509 (3.0%) | 404 (4.1%) |
| Bottled, Tank, or LP Gas | 4,317 (8.5%) | 445 (4.5%) |
| Electricity | 44,041 (86.3%) | 8,824 (89.1%) |
| Fuel Oil or Kerosene | 339 (0.7%) | 64 (0.6%) |
| Coal or Coke | 0 (0.0%) | 0 (0.0%) |
| All other Fuels | 379 (0.7%) | 113 (1.1%) |
| No Fuel Used | 423 (0.8%) | 57 (0.6%) |
| Total | 51,008 (100.0%) | 9,907 (100.0%) |
Household Vehicle Usage in Brunswick County
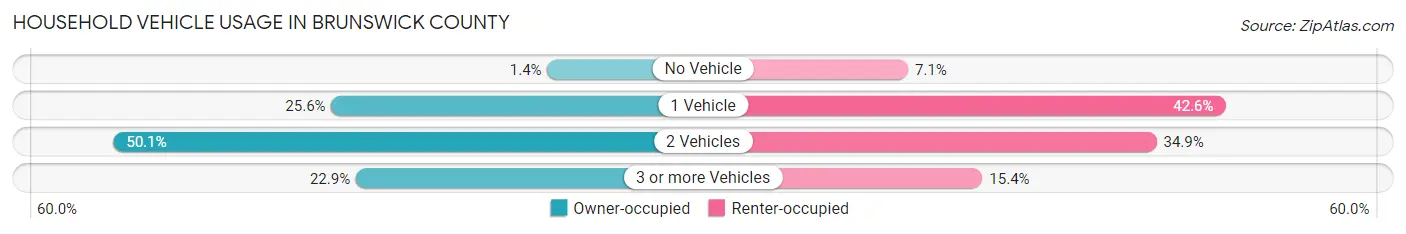
| Vehicles per Household | Owner-occupied | Renter-occupied |
| No Vehicle | 731 (1.4%) | 701 (7.1%) |
| 1 Vehicle | 13,073 (25.6%) | 4,221 (42.6%) |
| 2 Vehicles | 25,534 (50.1%) | 3,459 (34.9%) |
| 3 or more Vehicles | 11,670 (22.9%) | 1,526 (15.4%) |
| Total | 51,008 (100.0%) | 9,907 (100.0%) |
Real Estate & Mortgages in Brunswick County
Real Estate and Mortgage Overview in Brunswick County
| Characteristic | Without Mortgage | With Mortgage |
| Housing Units | 20,799 | 30,209 |
| Median Property Value | $280,600 | $285,700 |
| Median Household Income | $62,927 | $6,177 |
| Monthly Housing Costs | $535 | $2,312 |
| Real Estate Taxes | $1,602 | $565 |
Property Value by Mortgage Status in Brunswick County
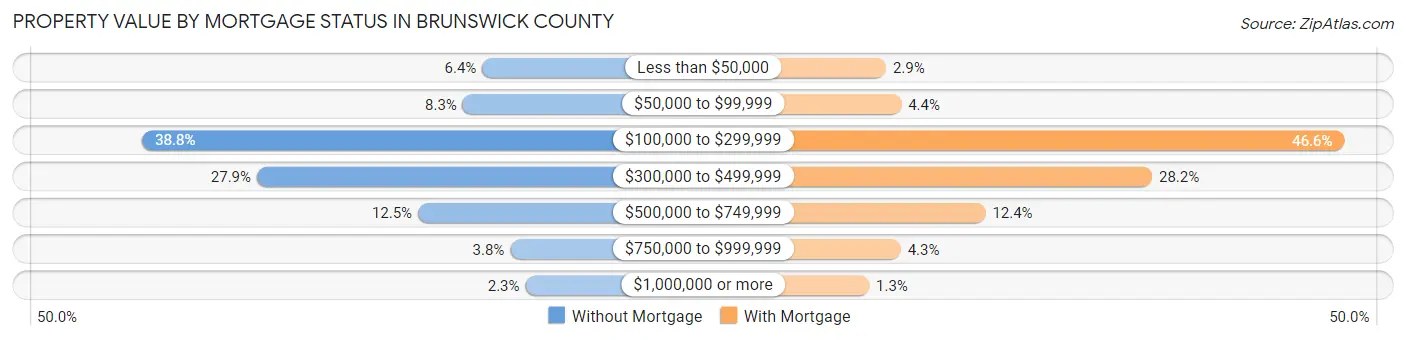
| Property Value | Without Mortgage | With Mortgage |
| Less than $50,000 | 1,336 (6.4%) | 876 (2.9%) |
| $50,000 to $99,999 | 1,723 (8.3%) | 1,314 (4.3%) |
| $100,000 to $299,999 | 8,072 (38.8%) | 14,061 (46.6%) |
| $300,000 to $499,999 | 5,798 (27.9%) | 8,532 (28.2%) |
| $500,000 to $749,999 | 2,609 (12.5%) | 3,736 (12.4%) |
| $750,000 to $999,999 | 780 (3.7%) | 1,299 (4.3%) |
| $1,000,000 or more | 481 (2.3%) | 391 (1.3%) |
| Total | 20,799 (100.0%) | 30,209 (100.0%) |
Household Income by Mortgage Status in Brunswick County
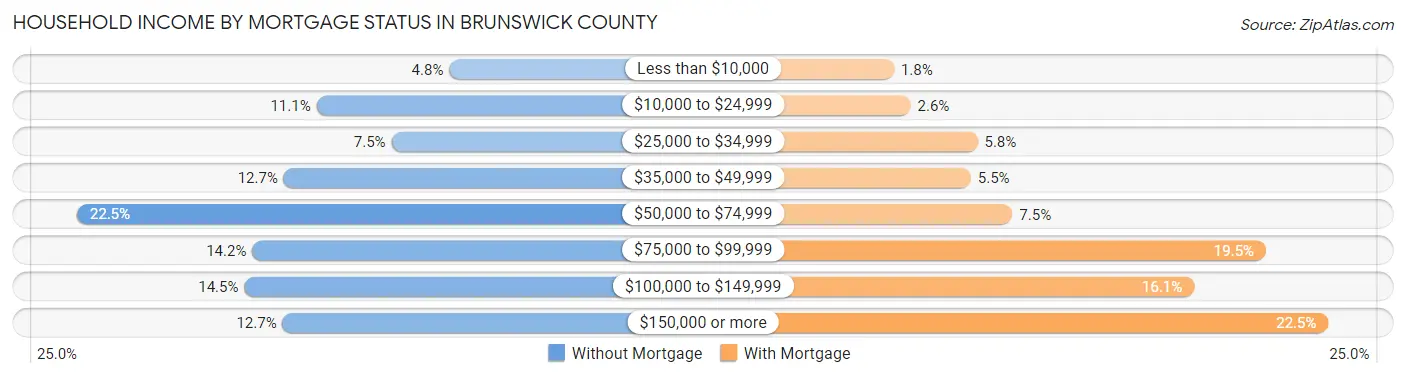
| Household Income | Without Mortgage | With Mortgage |
| Less than $10,000 | 994 (4.8%) | 554 (1.8%) |
| $10,000 to $24,999 | 2,308 (11.1%) | 791 (2.6%) |
| $25,000 to $34,999 | 1,567 (7.5%) | 1,755 (5.8%) |
| $35,000 to $49,999 | 2,634 (12.7%) | 1,657 (5.5%) |
| $50,000 to $74,999 | 4,682 (22.5%) | 2,256 (7.5%) |
| $75,000 to $99,999 | 2,945 (14.2%) | 5,903 (19.5%) |
| $100,000 to $149,999 | 3,024 (14.5%) | 4,870 (16.1%) |
| $150,000 or more | 2,645 (12.7%) | 6,800 (22.5%) |
| Total | 20,799 (100.0%) | 30,209 (100.0%) |
Property Value to Household Income Ratio in Brunswick County
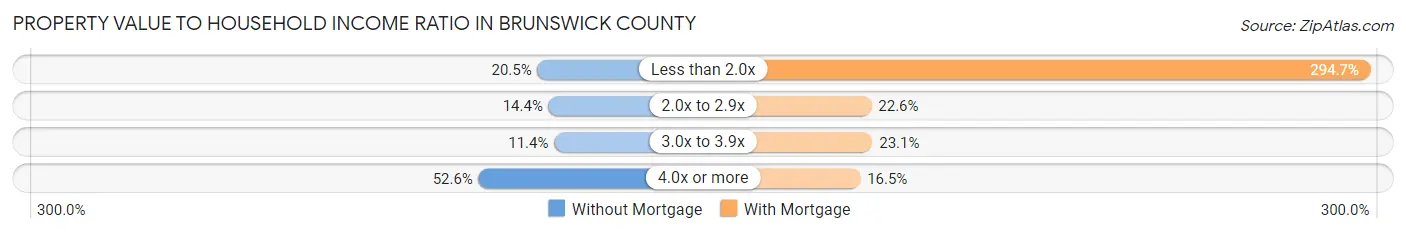
| Value-to-Income Ratio | Without Mortgage | With Mortgage |
| Less than 2.0x | 4,269 (20.5%) | 89,027 (294.7%) |
| 2.0x to 2.9x | 3,003 (14.4%) | 6,822 (22.6%) |
| 3.0x to 3.9x | 2,370 (11.4%) | 6,978 (23.1%) |
| 4.0x or more | 10,936 (52.6%) | 4,980 (16.5%) |
| Total | 20,799 (100.0%) | 30,209 (100.0%) |
Real Estate Taxes by Mortgage Status in Brunswick County
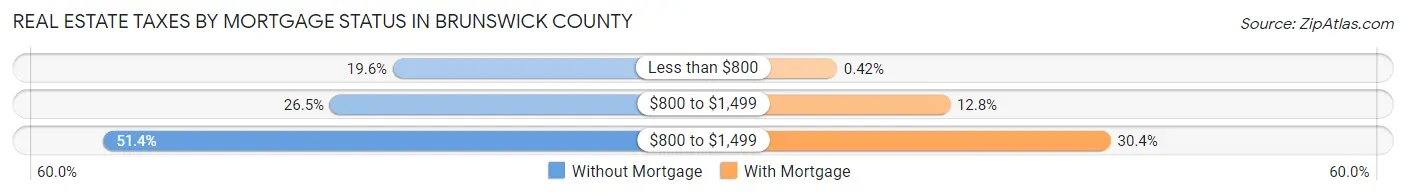
| Property Taxes | Without Mortgage | With Mortgage |
| Less than $800 | 4,085 (19.6%) | 126 (0.4%) |
| $800 to $1,499 | 5,520 (26.5%) | 3,871 (12.8%) |
| $800 to $1,499 | 10,685 (51.4%) | 9,191 (30.4%) |
| Total | 20,799 (100.0%) | 30,209 (100.0%) |
Health & Disability in Brunswick County
Health Insurance Coverage by Age in Brunswick County
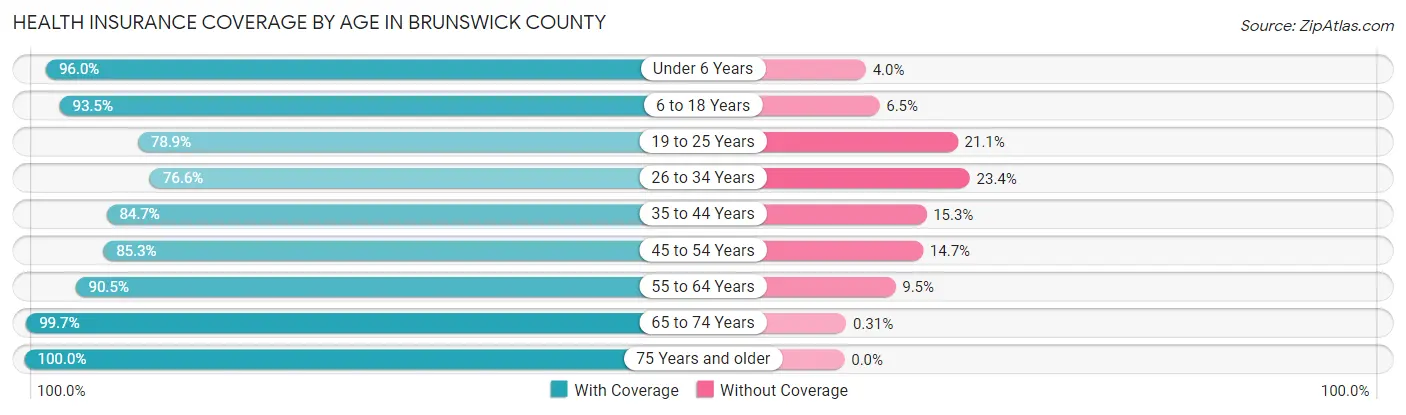
| Age Bracket | With Coverage | Without Coverage |
| Under 6 Years | 6,069 (96.0%) | 252 (4.0%) |
| 6 to 18 Years | 13,953 (93.5%) | 973 (6.5%) |
| 19 to 25 Years | 5,959 (78.9%) | 1,596 (21.1%) |
| 26 to 34 Years | 8,567 (76.6%) | 2,613 (23.4%) |
| 35 to 44 Years | 11,139 (84.7%) | 2,007 (15.3%) |
| 45 to 54 Years | 12,699 (85.3%) | 2,182 (14.7%) |
| 55 to 64 Years | 23,032 (90.5%) | 2,421 (9.5%) |
| 65 to 74 Years | 30,232 (99.7%) | 93 (0.3%) |
| 75 Years and older | 14,906 (100.0%) | 0 (0.0%) |
| Total | 126,556 (91.2%) | 12,137 (8.7%) |
Health Insurance Coverage by Citizenship Status in Brunswick County
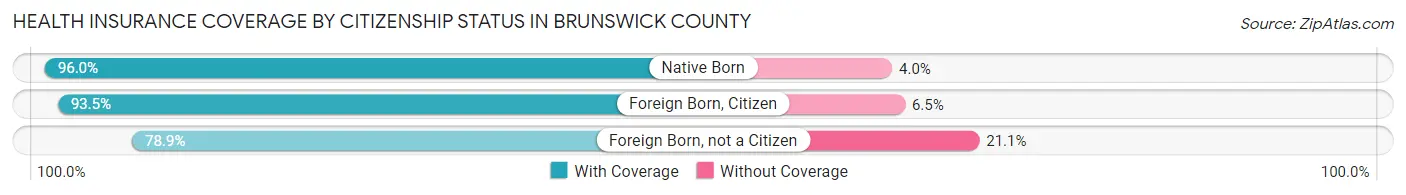
| Citizenship Status | With Coverage | Without Coverage |
| Native Born | 6,069 (96.0%) | 252 (4.0%) |
| Foreign Born, Citizen | 13,953 (93.5%) | 973 (6.5%) |
| Foreign Born, not a Citizen | 5,959 (78.9%) | 1,596 (21.1%) |
Health Insurance Coverage by Household Income in Brunswick County
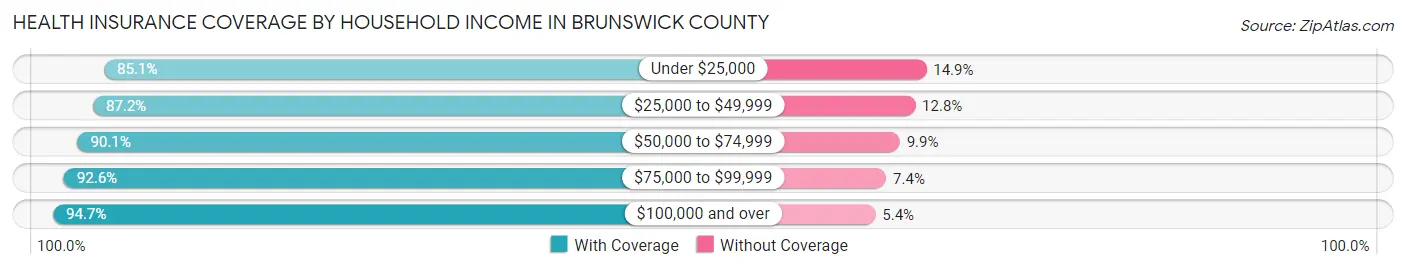
| Household Income | With Coverage | Without Coverage |
| Under $25,000 | 12,324 (85.1%) | 2,157 (14.9%) |
| $25,000 to $49,999 | 18,760 (87.2%) | 2,755 (12.8%) |
| $50,000 to $74,999 | 25,167 (90.1%) | 2,770 (9.9%) |
| $75,000 to $99,999 | 21,084 (92.6%) | 1,678 (7.4%) |
| $100,000 and over | 49,166 (94.7%) | 2,777 (5.3%) |
Public vs Private Health Insurance Coverage by Age in Brunswick County
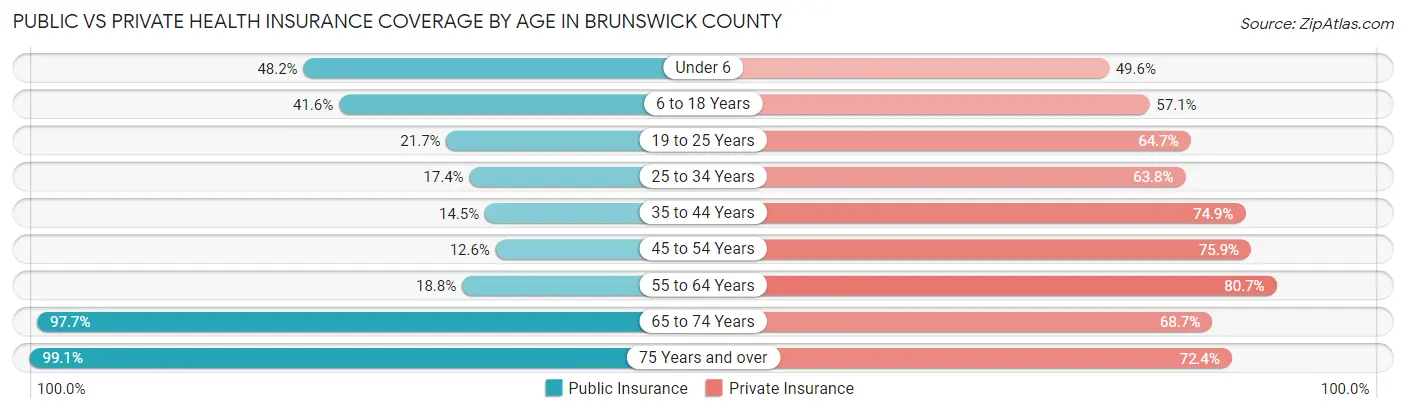
| Age Bracket | Public Insurance | Private Insurance |
| Under 6 | 3,049 (48.2%) | 3,132 (49.5%) |
| 6 to 18 Years | 6,215 (41.6%) | 8,523 (57.1%) |
| 19 to 25 Years | 1,640 (21.7%) | 4,890 (64.7%) |
| 25 to 34 Years | 1,950 (17.4%) | 7,127 (63.7%) |
| 35 to 44 Years | 1,911 (14.5%) | 9,845 (74.9%) |
| 45 to 54 Years | 1,869 (12.6%) | 11,301 (75.9%) |
| 55 to 64 Years | 4,787 (18.8%) | 20,531 (80.7%) |
| 65 to 74 Years | 29,626 (97.7%) | 20,838 (68.7%) |
| 75 Years and over | 14,769 (99.1%) | 10,789 (72.4%) |
| Total | 65,816 (47.4%) | 96,976 (69.9%) |
Disability Status by Sex by Age in Brunswick County
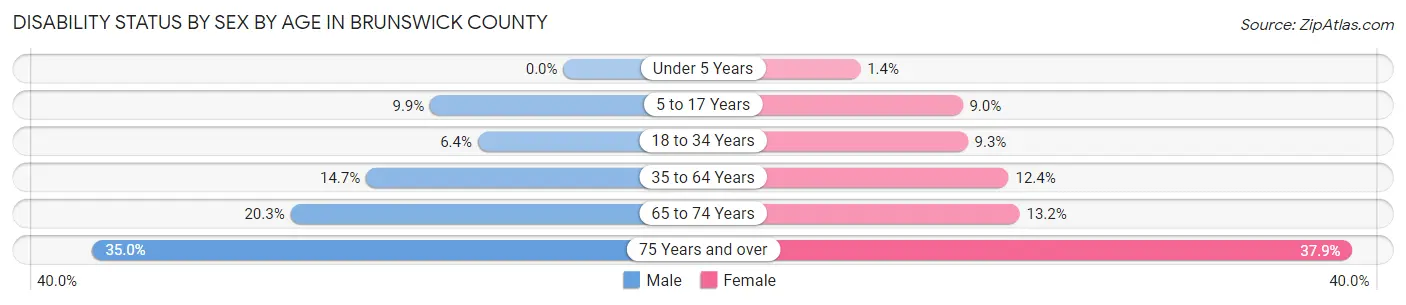
| Age Bracket | Male | Female |
| Under 5 Years | 0 (0.0%) | 34 (1.4%) |
| 5 to 17 Years | 775 (9.9%) | 649 (9.0%) |
| 18 to 34 Years | 623 (6.4%) | 930 (9.3%) |
| 35 to 64 Years | 3,625 (14.6%) | 3,558 (12.4%) |
| 65 to 74 Years | 2,943 (20.3%) | 2,085 (13.2%) |
| 75 Years and over | 2,511 (35.0%) | 2,928 (37.9%) |
Disability Class by Sex by Age in Brunswick County
Disability Class: Hearing Difficulty
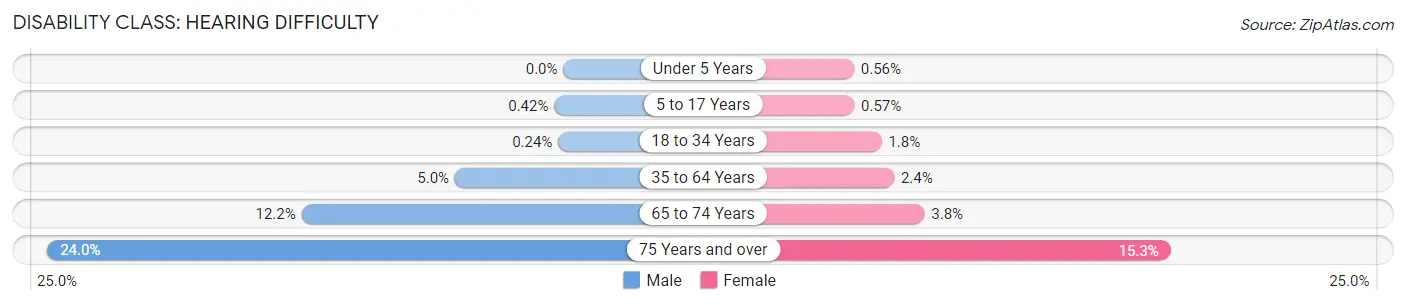
| Age Bracket | Male | Female |
| Under 5 Years | 0 (0.0%) | 14 (0.6%) |
| 5 to 17 Years | 33 (0.4%) | 41 (0.6%) |
| 18 to 34 Years | 24 (0.2%) | 183 (1.8%) |
| 35 to 64 Years | 1,244 (5.0%) | 695 (2.4%) |
| 65 to 74 Years | 1,765 (12.1%) | 605 (3.8%) |
| 75 Years and over | 1,720 (23.9%) | 1,179 (15.3%) |
Disability Class: Vision Difficulty
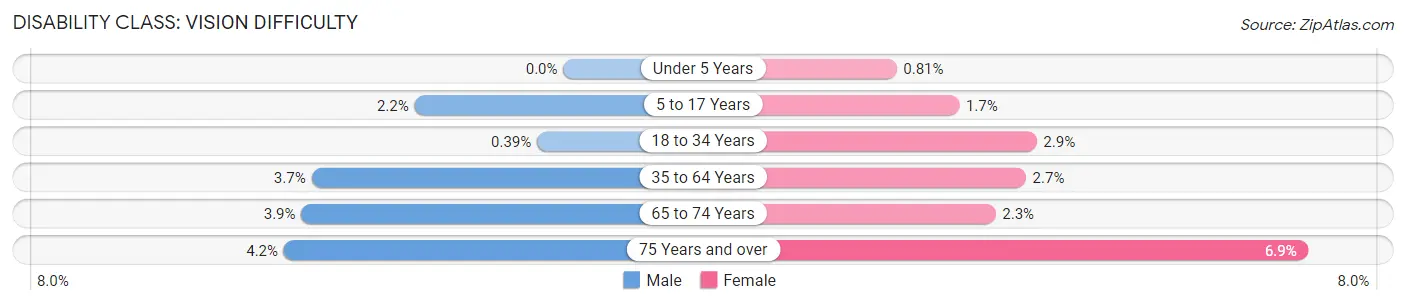
| Age Bracket | Male | Female |
| Under 5 Years | 0 (0.0%) | 20 (0.8%) |
| 5 to 17 Years | 173 (2.2%) | 126 (1.7%) |
| 18 to 34 Years | 38 (0.4%) | 288 (2.9%) |
| 35 to 64 Years | 925 (3.7%) | 785 (2.7%) |
| 65 to 74 Years | 565 (3.9%) | 361 (2.3%) |
| 75 Years and over | 298 (4.2%) | 535 (6.9%) |
Disability Class: Cognitive Difficulty
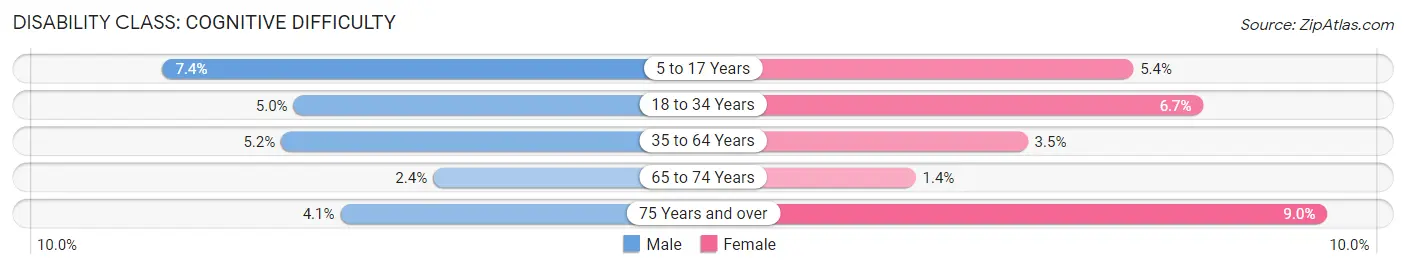
| Age Bracket | Male | Female |
| 5 to 17 Years | 583 (7.4%) | 392 (5.4%) |
| 18 to 34 Years | 491 (5.0%) | 668 (6.7%) |
| 35 to 64 Years | 1,297 (5.2%) | 991 (3.5%) |
| 65 to 74 Years | 351 (2.4%) | 217 (1.4%) |
| 75 Years and over | 297 (4.1%) | 696 (9.0%) |
Disability Class: Ambulatory Difficulty
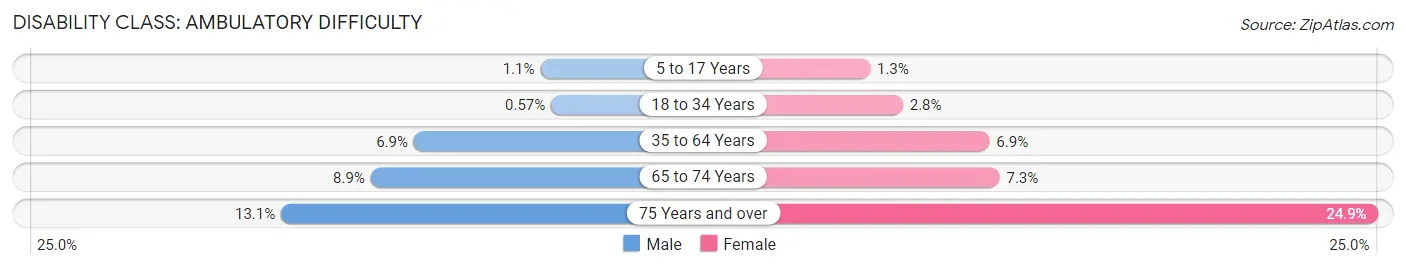
| Age Bracket | Male | Female |
| 5 to 17 Years | 84 (1.1%) | 95 (1.3%) |
| 18 to 34 Years | 56 (0.6%) | 282 (2.8%) |
| 35 to 64 Years | 1,718 (6.9%) | 1,967 (6.9%) |
| 65 to 74 Years | 1,299 (8.9%) | 1,157 (7.3%) |
| 75 Years and over | 941 (13.1%) | 1,923 (24.9%) |
Disability Class: Self-Care Difficulty
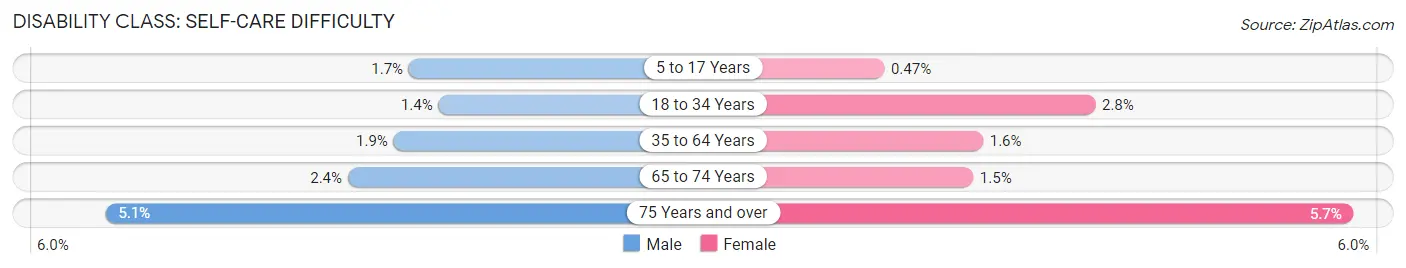
| Age Bracket | Male | Female |
| 5 to 17 Years | 135 (1.7%) | 34 (0.5%) |
| 18 to 34 Years | 136 (1.4%) | 281 (2.8%) |
| 35 to 64 Years | 467 (1.9%) | 451 (1.6%) |
| 65 to 74 Years | 348 (2.4%) | 231 (1.5%) |
| 75 Years and over | 366 (5.1%) | 440 (5.7%) |
Technology Access in Brunswick County
Computing Device Access in Brunswick County
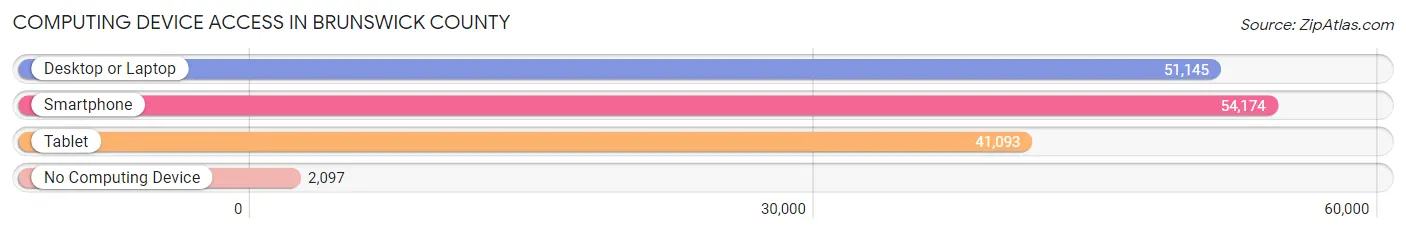
| Device Type | # Households | % Households |
| Desktop or Laptop | 51,145 | 84.0% |
| Smartphone | 54,174 | 88.9% |
| Tablet | 41,093 | 67.5% |
| No Computing Device | 2,097 | 3.4% |
| Total | 60,915 | 100.0% |
Internet Access in Brunswick County
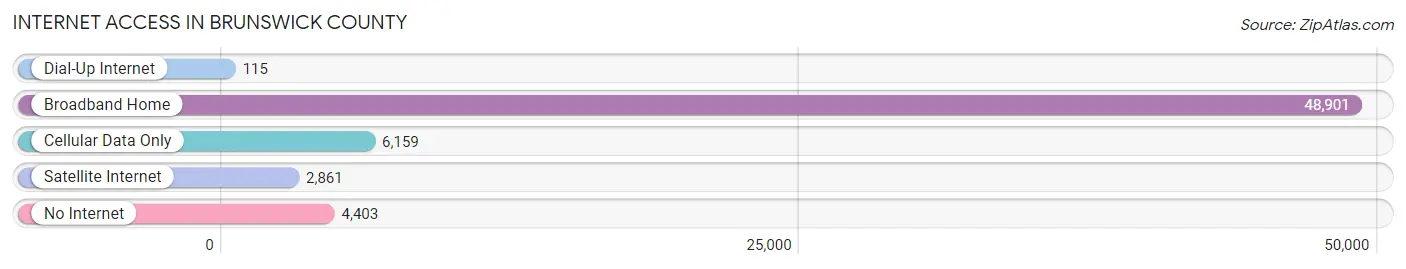
| Internet Type | # Households | % Households |
| Dial-Up Internet | 115 | 0.2% |
| Broadband Home | 48,901 | 80.3% |
| Cellular Data Only | 6,159 | 10.1% |
| Satellite Internet | 2,861 | 4.7% |
| No Internet | 4,403 | 7.2% |
| Total | 60,915 | 100.0% |
Brunswick County Summary
Brunswick County is located in the southeastern corner of North Carolina, and is part of the Cape Fear region. It is bordered by New Hanover County to the north, Columbus County to the west, and the Atlantic Ocean to the east. The county seat is Bolivia, and the largest city is Southport. The county was formed in 1764 from parts of Bladen County and New Hanover County.
Geography
Brunswick County covers an area of 845 square miles, making it the largest county in North Carolina. The terrain is mostly flat, with some rolling hills in the western part of the county. The majority of the county is covered in forests, with some agricultural land in the western part. The county is home to several rivers, including the Cape Fear River, the Northeast Cape Fear River, and the Shallotte River. The county also contains several lakes, including Lake Waccamaw, Lake Tabor, and Lake Sutton.
The climate of Brunswick County is humid subtropical, with hot, humid summers and mild winters. The average annual temperature is around 70°F, and the average annual precipitation is around 50 inches.
Demographics
As of the 2010 census, the population of Brunswick County was 107,431, making it the fourth most populous county in North Carolina. The population density was 126 people per square mile. The racial makeup of the county was 79.2% White, 15.3% African American, 0.7% Native American, 1.7% Asian, 0.1% Pacific Islander, 1.3% from other races, and 1.7% from two or more races. Hispanic or Latino of any race were 4.2% of the population.
The median income for a household in the county was $41,945, and the median income for a family was $50,945. The per capita income for the county was $21,945. About 11.2% of families and 14.7% of the population were below the poverty line, including 19.2% of those under age 18 and 11.2% of those age 65 or over.
Economy
Brunswick County has a diverse economy, with a mix of manufacturing, agriculture, tourism, and services. The county is home to several large employers, including GE Aviation, Corning, and Smithfield Foods. The county is also home to several military installations, including Camp Lejeune and the Marine Corps Air Station Cherry Point.
Agriculture is an important part of the economy, with the county producing a variety of crops, including corn, soybeans, cotton, and tobacco. The county is also home to several wineries and vineyards.
Tourism is also an important part of the economy, with the county being home to several popular beaches, including Holden Beach, Ocean Isle Beach, and Sunset Beach. The county is also home to several golf courses, and is a popular destination for fishing and boating.
Conclusion
Brunswick County is a large county in the southeastern corner of North Carolina. It is home to a diverse economy, with a mix of manufacturing, agriculture, tourism, and services. The county is also home to several popular beaches, golf courses, and military installations. The population of the county is 107,431, and the median income for a household is $41,945.
Common Questions
What is the Total Population of Brunswick County?
Total Population of Brunswick County is 139,721.
What is the Total Male Population of Brunswick County?
Total Male Population of Brunswick County is 67,404.
What is the Total Female Population of Brunswick County?
Total Female Population of Brunswick County is 72,317.
What is the Ratio of Males per 100 Females in Brunswick County?
There are 93.21 Males per 100 Females in Brunswick County.
What is the Ratio of Females per 100 Males in Brunswick County?
There are 107.29 Females per 100 Males in Brunswick County.
What is the Median Population Age in Brunswick County?
Median Population Age in Brunswick County is 55.7 Years.
What is the Average Family Size in Brunswick County
Average Family Size in Brunswick County is 2.7 People.
What is the Average Household Size in Brunswick County
Average Household Size in Brunswick County is 2.3 People.
What is Per Capita Income in Brunswick County?
Per Capita income in Brunswick County is $42,263.
What is the Median Family Income in Brunswick County?
Median Family Income in Brunswick County is $85,162.
What is the Median Household income in Brunswick County?
Median Household Income in Brunswick County is $71,193.
What is Income or Wage Gap in Brunswick County?
Income or Wage Gap in Brunswick County is 19.5%.
Women in Brunswick County earn 80.5 cents for every dollar earned by a man.
What is Family Income Deficit in Brunswick County?
Family Income Deficit in Brunswick County is $10,232.
Families that are below poverty line in Brunswick County earn $10,232 less on average than the poverty threshold level.
What is Inequality or Gini Index in Brunswick County?
Inequality or Gini Index in Brunswick County is 0.44.
How Large is the Labor Force in Brunswick County?
There are 59,595 People in the Labor Forcein in Brunswick County.
What is the Percentage of People in the Labor Force in Brunswick County?
48.9% of People are in the Labor Force in Brunswick County.
What is the Unemployment Rate in Brunswick County?
Unemployment Rate in Brunswick County is 5.0%.