Bladen County, NC
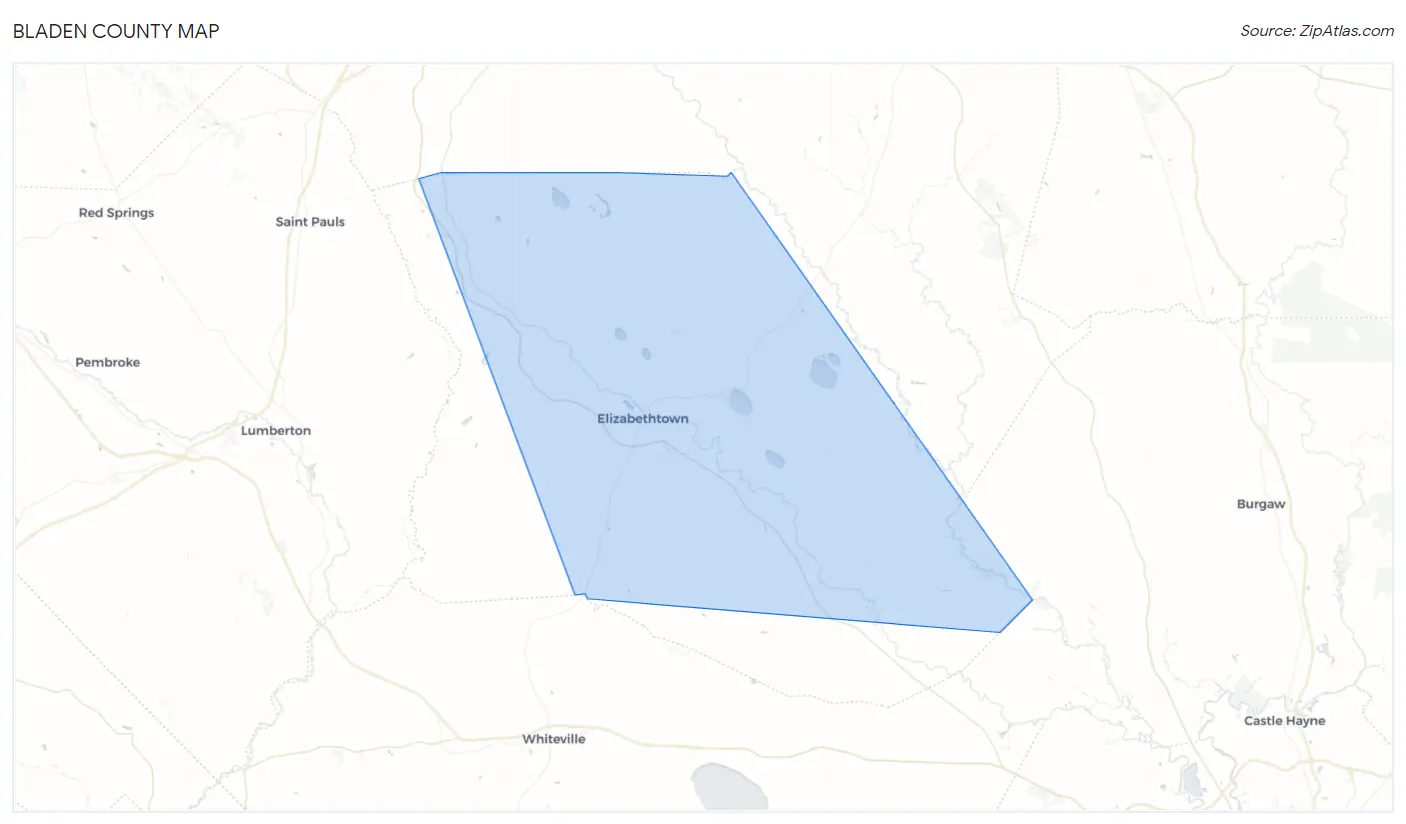
Bladen County Map
Bladen County Overview
29,807
TOTAL POPULATION
14,326
MALE POPULATION
15,481
FEMALE POPULATION
92.54
MALES / 100 FEMALES
108.06
FEMALES / 100 MALES
45.0
MEDIAN AGE
3.4
AVG FAMILY SIZE
2.6
AVG HOUSEHOLD SIZE
$26,544
PER CAPITA INCOME
$54,679
AVG FAMILY INCOME
$40,476
AVG HOUSEHOLD INCOME
14.0%
WAGE / INCOME GAP [ % ]
86.0¢/ $1
WAGE / INCOME GAP [ $ ]
$12,424
FAMILY INCOME DEFICIT
0.53
INEQUALITY / GINI INDEX
11,610
LABOR FORCE [ PEOPLE ]
47.7%
PERCENT IN LABOR FORCE
5.5%
UNEMPLOYMENT RATE
Bladen County Area Codes
Race in Bladen County
The most populous races in Bladen County are White / Caucasian (16,874 | 56.6%), Black / African American (10,057 | 33.7%), and Hispanic or Latino (2,411 | 8.1%).
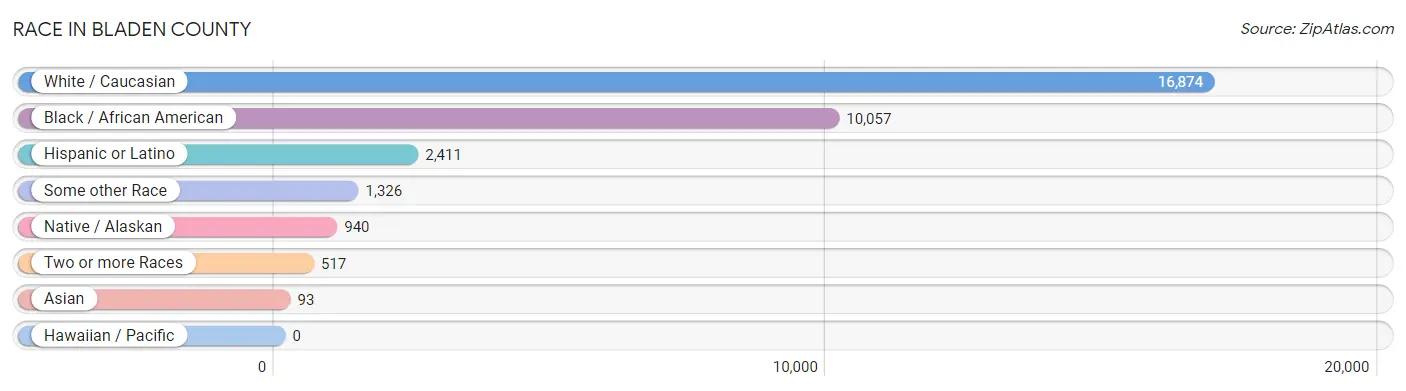
| Race | # Population | % Population |
| Asian | 93 | 0.3% |
| Black / African American | 10,057 | 33.7% |
| Hawaiian / Pacific | 0 | 0.0% |
| Hispanic or Latino | 2,411 | 8.1% |
| Native / Alaskan | 940 | 3.2% |
| White / Caucasian | 16,874 | 56.6% |
| Two or more Races | 517 | 1.7% |
| Some other Race | 1,326 | 4.4% |
| Total | 29,807 | 100.0% |
Ancestry in Bladen County
The most populous ancestries reported in Bladen County are American (8,363 | 28.1%), Mexican (1,478 | 5.0%), English (1,316 | 4.4%), Scotch-Irish (837 | 2.8%), and Irish (806 | 2.7%), together accounting for 43.0% of all Bladen County residents.
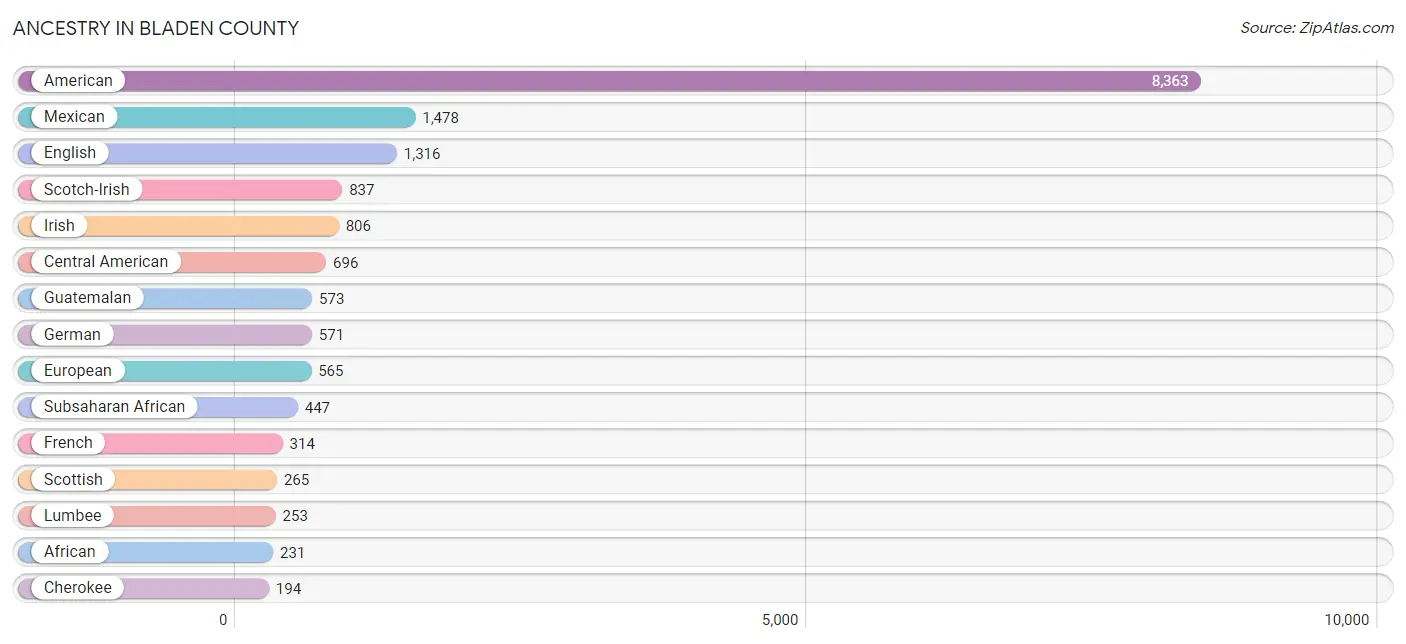
| Ancestry | # Population | % Population |
| African | 231 | 0.8% |
| Alaska Native | 6 | 0.0% |
| American | 8,363 | 28.1% |
| Apache | 7 | 0.0% |
| British | 22 | 0.1% |
| Burmese | 33 | 0.1% |
| Canadian | 43 | 0.1% |
| Central American | 696 | 2.3% |
| Central American Indian | 8 | 0.0% |
| Cherokee | 194 | 0.6% |
| Chippewa | 11 | 0.0% |
| Cuban | 74 | 0.3% |
| Czech | 98 | 0.3% |
| Danish | 21 | 0.1% |
| Dutch | 48 | 0.2% |
| Eastern European | 1 | 0.0% |
| English | 1,316 | 4.4% |
| European | 565 | 1.9% |
| French | 314 | 1.1% |
| French American Indian | 11 | 0.0% |
| French Canadian | 7 | 0.0% |
| German | 571 | 1.9% |
| Guatemalan | 573 | 1.9% |
| Honduran | 54 | 0.2% |
| Indian (Asian) | 27 | 0.1% |
| Irish | 806 | 2.7% |
| Italian | 61 | 0.2% |
| Korean | 49 | 0.2% |
| Lumbee | 253 | 0.9% |
| Mexican | 1,478 | 5.0% |
| Mexican American Indian | 33 | 0.1% |
| Nicaraguan | 26 | 0.1% |
| Northern European | 21 | 0.1% |
| Norwegian | 57 | 0.2% |
| Polish | 63 | 0.2% |
| Portuguese | 13 | 0.0% |
| Puerto Rican | 118 | 0.4% |
| Salvadoran | 43 | 0.1% |
| Scandinavian | 41 | 0.1% |
| Scotch-Irish | 837 | 2.8% |
| Scottish | 265 | 0.9% |
| Slovak | 15 | 0.1% |
| Spanish | 45 | 0.2% |
| Subsaharan African | 447 | 1.5% |
| Swedish | 108 | 0.4% |
| Welsh | 18 | 0.1% | View All 46 Rows |
Immigrants in Bladen County
The most numerous immigrant groups reported in Bladen County came from Latin America (574 | 1.9%), Central America (491 | 1.7%), Mexico (266 | 0.9%), Guatemala (170 | 0.6%), and Asia (91 | 0.3%), together accounting for 5.3% of all Bladen County residents.
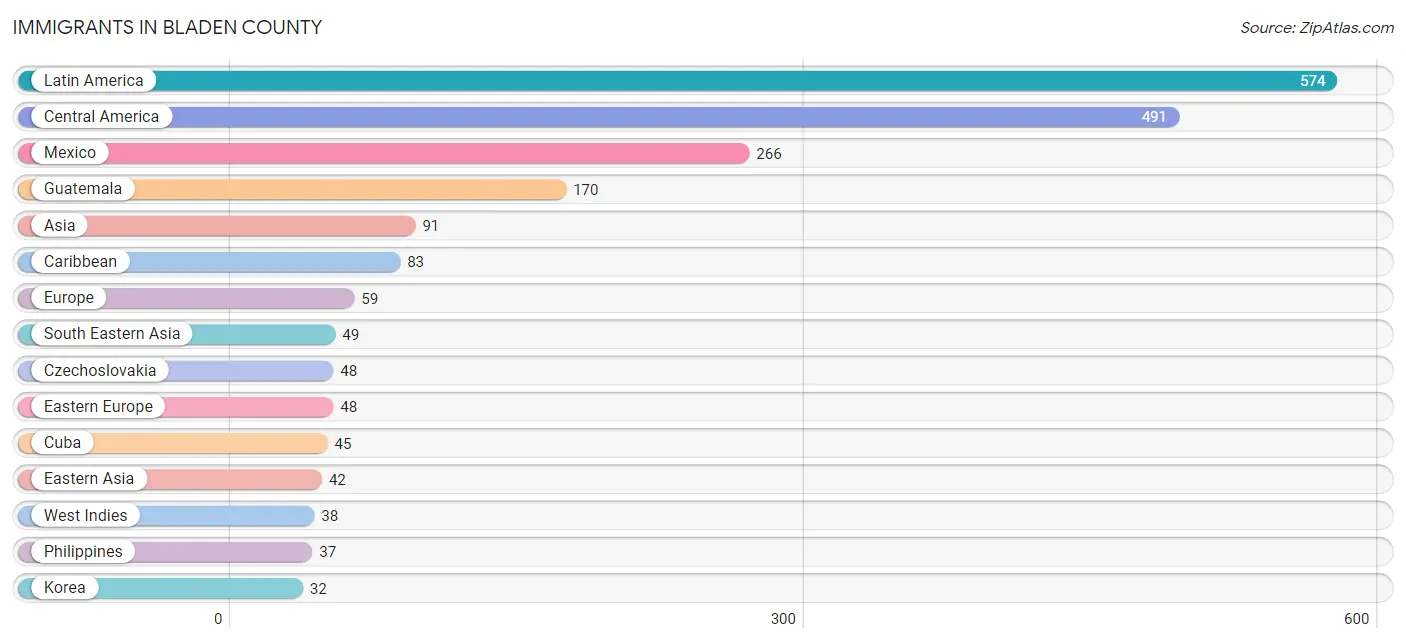
| Immigration Origin | # Population | % Population |
| Asia | 91 | 0.3% |
| Caribbean | 83 | 0.3% |
| Central America | 491 | 1.7% |
| China | 10 | 0.0% |
| Cuba | 45 | 0.2% |
| Czechoslovakia | 48 | 0.2% |
| Eastern Asia | 42 | 0.1% |
| Eastern Europe | 48 | 0.2% |
| El Salvador | 24 | 0.1% |
| Europe | 59 | 0.2% |
| Germany | 11 | 0.0% |
| Guatemala | 170 | 0.6% |
| Honduras | 5 | 0.0% |
| Korea | 32 | 0.1% |
| Latin America | 574 | 1.9% |
| Mexico | 266 | 0.9% |
| Nicaragua | 26 | 0.1% |
| Philippines | 37 | 0.1% |
| South Eastern Asia | 49 | 0.2% |
| Vietnam | 12 | 0.0% |
| West Indies | 38 | 0.1% |
| Western Europe | 11 | 0.0% | View All 22 Rows |
Sex and Age in Bladen County
Sex and Age in Bladen County
The most populous age groups in Bladen County are 65 to 69 Years (1,265 | 8.8%) for men and 65 to 69 Years (1,249 | 8.1%) for women.
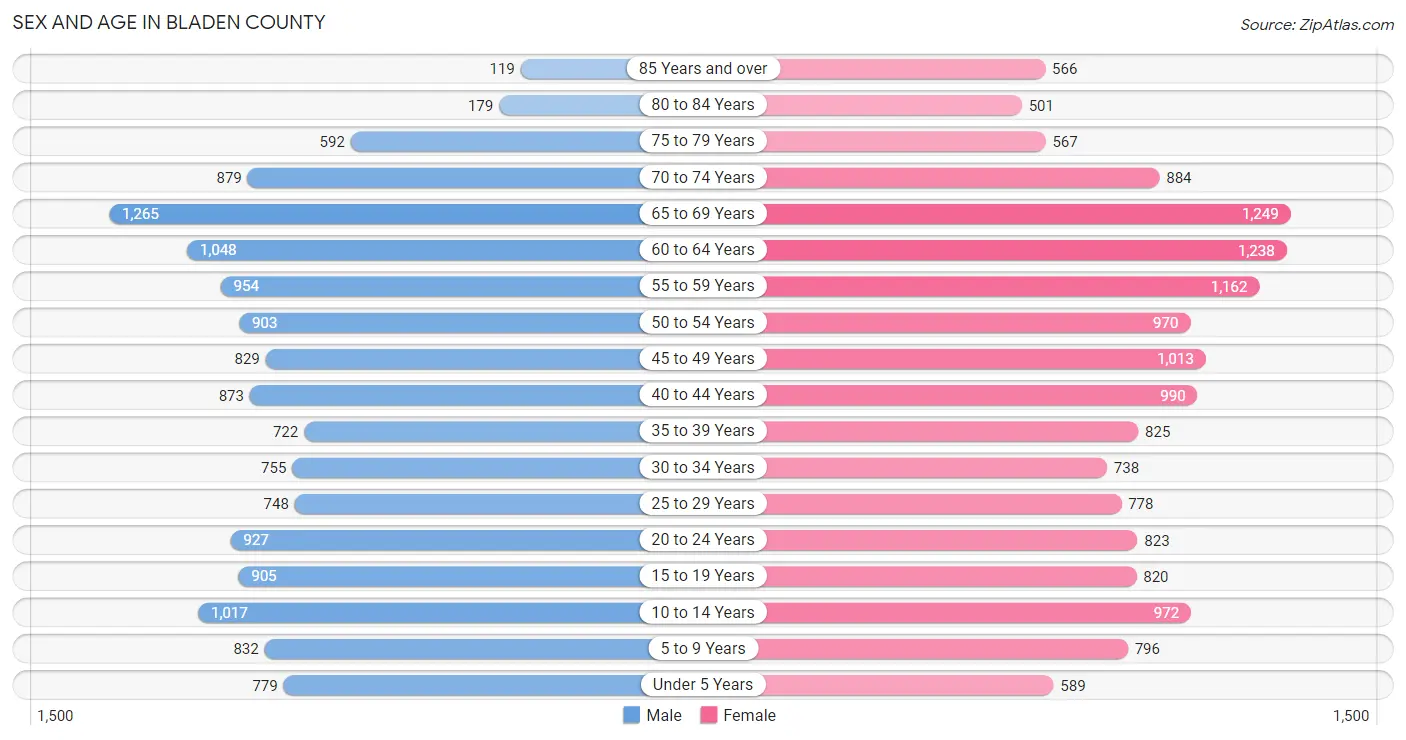
| Age Bracket | Male | Female |
| Under 5 Years | 779 (5.4%) | 589 (3.8%) |
| 5 to 9 Years | 832 (5.8%) | 796 (5.1%) |
| 10 to 14 Years | 1,017 (7.1%) | 972 (6.3%) |
| 15 to 19 Years | 905 (6.3%) | 820 (5.3%) |
| 20 to 24 Years | 927 (6.5%) | 823 (5.3%) |
| 25 to 29 Years | 748 (5.2%) | 778 (5.0%) |
| 30 to 34 Years | 755 (5.3%) | 738 (4.8%) |
| 35 to 39 Years | 722 (5.0%) | 825 (5.3%) |
| 40 to 44 Years | 873 (6.1%) | 990 (6.4%) |
| 45 to 49 Years | 829 (5.8%) | 1,013 (6.5%) |
| 50 to 54 Years | 903 (6.3%) | 970 (6.3%) |
| 55 to 59 Years | 954 (6.7%) | 1,162 (7.5%) |
| 60 to 64 Years | 1,048 (7.3%) | 1,238 (8.0%) |
| 65 to 69 Years | 1,265 (8.8%) | 1,249 (8.1%) |
| 70 to 74 Years | 879 (6.1%) | 884 (5.7%) |
| 75 to 79 Years | 592 (4.1%) | 567 (3.7%) |
| 80 to 84 Years | 179 (1.3%) | 501 (3.2%) |
| 85 Years and over | 119 (0.8%) | 566 (3.7%) |
| Total | 14,326 (100.0%) | 15,481 (100.0%) |
Families and Households in Bladen County
Median Family Size in Bladen County
The median family size in Bladen County is 3.41 persons per family, with single male/father families (415 | 5.9%) accounting for the largest median family size of 3.87 persons per family. On the other hand, married-couple families (4,738 | 67.9%) represent the smallest median family size with 3.29 persons per family.
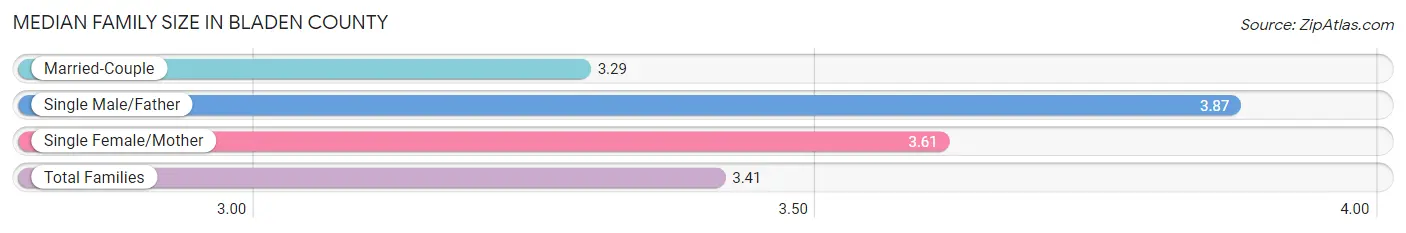
| Family Type | # Families | Family Size |
| Married-Couple | 4,738 (67.9%) | 3.29 |
| Single Male/Father | 415 (5.9%) | 3.87 |
| Single Female/Mother | 1,825 (26.2%) | 3.61 |
| Total Families | 6,978 (100.0%) | 3.41 |
Median Household Size in Bladen County
The median household size in Bladen County is 2.58 persons per household, with single male/father households (415 | 3.6%) accounting for the largest median household size of 4.36 persons per household. non-family households (4,408 | 38.7%) represent the smallest median household size with 1.16 persons per household.
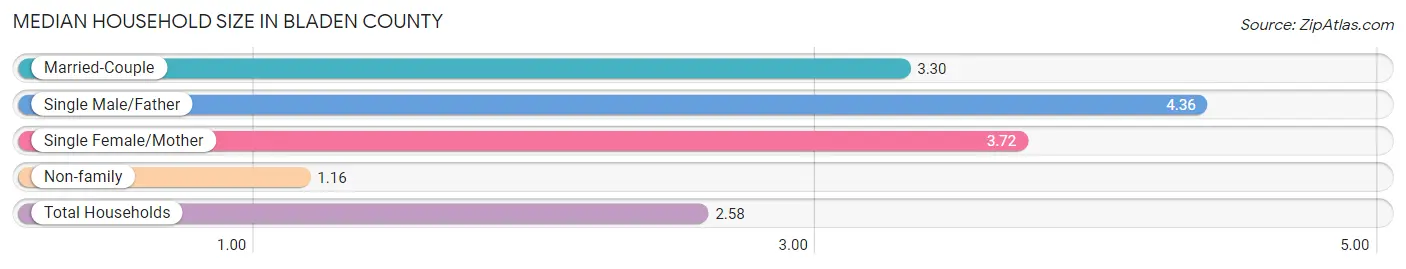
| Household Type | # Households | Household Size |
| Married-Couple | 4,738 (41.6%) | 3.30 |
| Single Male/Father | 415 (3.6%) | 4.36 |
| Single Female/Mother | 1,825 (16.0%) | 3.72 |
| Non-family | 4,408 (38.7%) | 1.16 |
| Total Households | 11,386 (100.0%) | 2.58 |
Household Size by Marriage Status in Bladen County
Out of a total of 11,386 households in Bladen County, 6,978 (61.3%) are family households, while 4,408 (38.7%) are nonfamily households. The most numerous type of family households are 2-person households, comprising 3,747, and the most common type of nonfamily households are 1-person households, comprising 3,928.
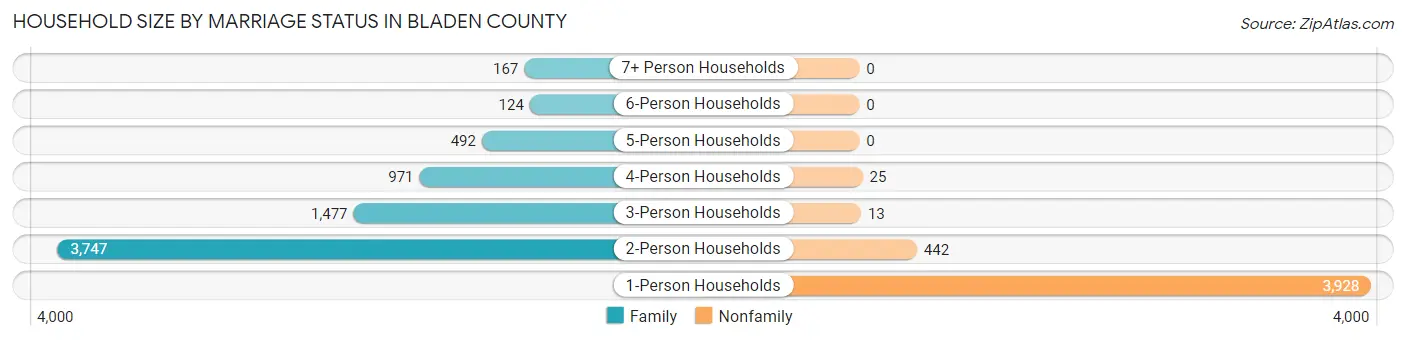
| Household Size | Family Households | Nonfamily Households |
| 1-Person Households | - | 3,928 (34.5%) |
| 2-Person Households | 3,747 (32.9%) | 442 (3.9%) |
| 3-Person Households | 1,477 (13.0%) | 13 (0.1%) |
| 4-Person Households | 971 (8.5%) | 25 (0.2%) |
| 5-Person Households | 492 (4.3%) | 0 (0.0%) |
| 6-Person Households | 124 (1.1%) | 0 (0.0%) |
| 7+ Person Households | 167 (1.5%) | 0 (0.0%) |
| Total | 6,978 (61.3%) | 4,408 (38.7%) |
Female Fertility in Bladen County
Fertility by Age in Bladen County
Average fertility rate in Bladen County is 44.0 births per 1,000 women. Women in the age bracket of 20 to 34 years have the highest fertility rate with 74.0 births per 1,000 women. Women in the age bracket of 20 to 34 years acount for 65.0% of all women with births.
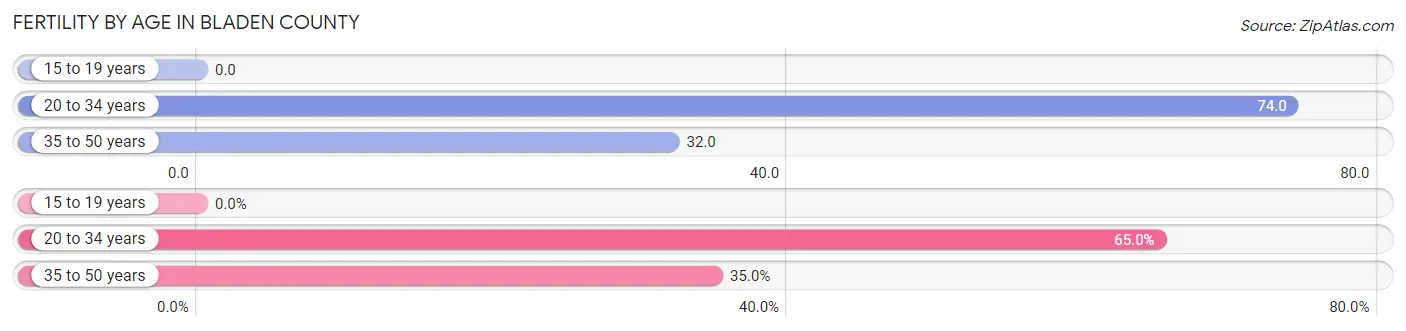
| Age Bracket | Women with Births | Births / 1,000 Women |
| 15 to 19 years | 0 (0.0%) | 0.0 |
| 20 to 34 years | 173 (65.0%) | 74.0 |
| 35 to 50 years | 93 (35.0%) | 32.0 |
| Total | 266 (100.0%) | 44.0 |
Fertility by Age by Marriage Status in Bladen County
16.9% of women with births (266) in Bladen County are married. The highest percentage of unmarried women with births falls into 35 to 50 years age bracket with 90.3% of them unmarried at the time of birth, while the lowest percentage of unmarried women with births belong to 20 to 34 years age bracket with 79.2% of them unmarried.
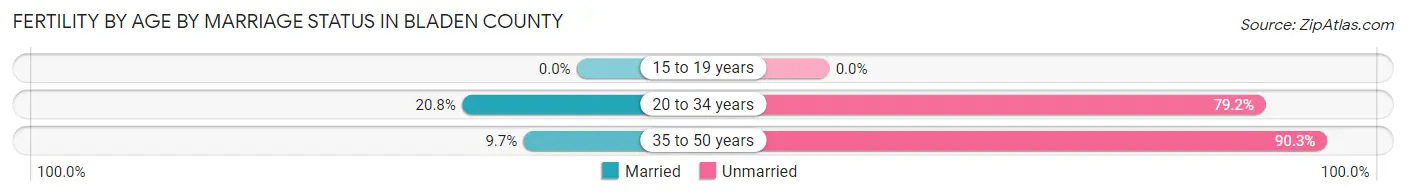
| Age Bracket | Married | Unmarried |
| 15 to 19 years | 0 (0.0%) | 0 (0.0%) |
| 20 to 34 years | 36 (20.8%) | 137 (79.2%) |
| 35 to 50 years | 9 (9.7%) | 84 (90.3%) |
| Total | 45 (16.9%) | 221 (83.1%) |
Fertility by Education in Bladen County
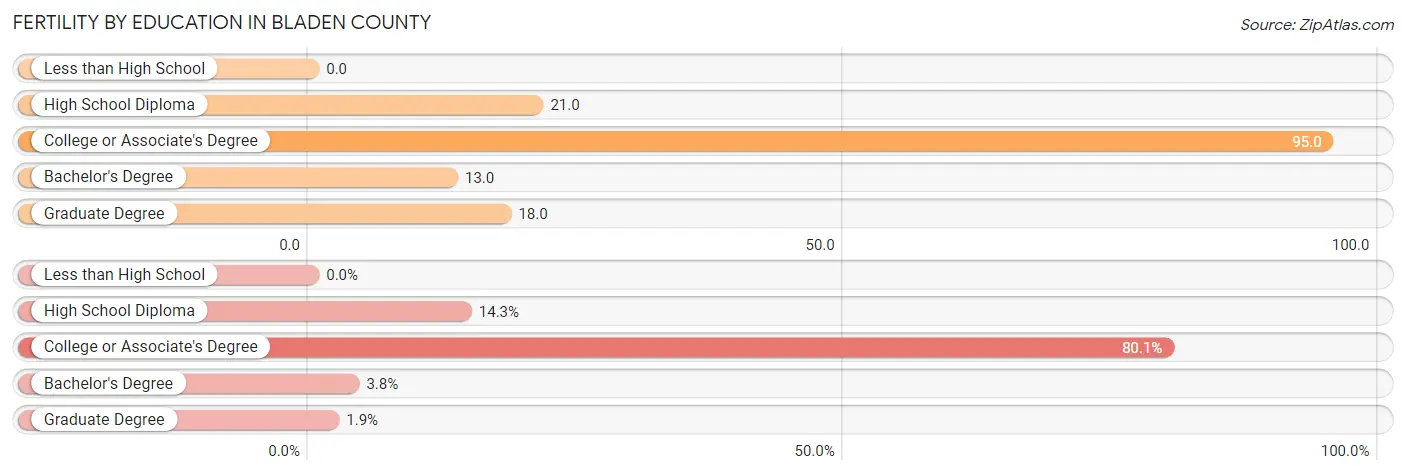
| Educational Attainment | Women with Births | Births / 1,000 Women |
| Less than High School | 0 (0.0%) | 0.0 |
| High School Diploma | 38 (14.3%) | 21.0 |
| College or Associate's Degree | 213 (80.1%) | 95.0 |
| Bachelor's Degree | 10 (3.8%) | 13.0 |
| Graduate Degree | 5 (1.9%) | 18.0 |
| Total | 266 (100.0%) | 44.0 |
Fertility by Education by Marriage Status in Bladen County
83.1% of women with births in Bladen County are unmarried. Women with the educational attainment of college or associate's degree are most likely to be married with 20.2% of them married at childbirth, while women with the educational attainment of high school diploma are least likely to be married with 100.0% of them unmarried at childbirth.
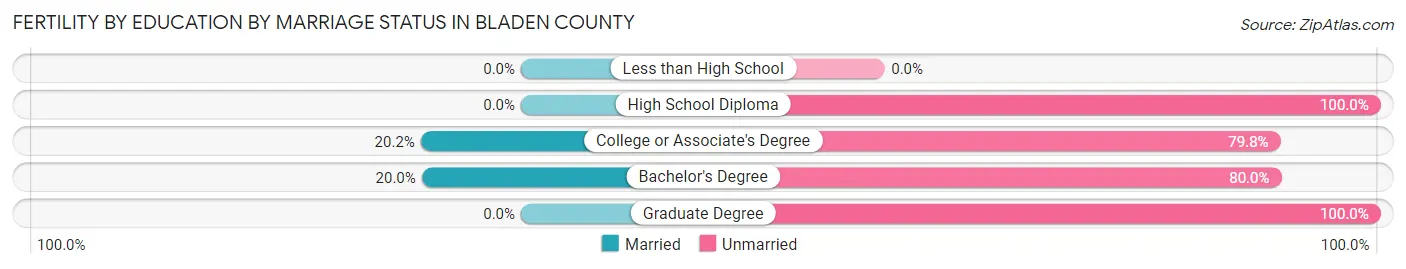
| Educational Attainment | Married | Unmarried |
| Less than High School | 0 (0.0%) | 0 (0.0%) |
| High School Diploma | 0 (0.0%) | 38 (100.0%) |
| College or Associate's Degree | 43 (20.2%) | 170 (79.8%) |
| Bachelor's Degree | 2 (20.0%) | 8 (80.0%) |
| Graduate Degree | 0 (0.0%) | 5 (100.0%) |
| Total | 45 (16.9%) | 221 (83.1%) |
Income in Bladen County
Income Overview in Bladen County
Per Capita Income in Bladen County is $26,544, while median incomes of families and households are $54,679 and $40,476 respectively.
| Characteristic | Number | Measure |
| Per Capita Income | 29,807 | $26,544 |
| Median Family Income | 6,978 | $54,679 |
| Mean Family Income | 6,978 | $78,538 |
| Median Household Income | 11,386 | $40,476 |
| Mean Household Income | 11,386 | $62,016 |
| Income Deficit | 6,978 | $12,424 |
| Wage / Income Gap (%) | 29,807 | 13.98% |
| Wage / Income Gap ($) | 29,807 | 86.02¢ per $1 |
| Gini / Inequality Index | 29,807 | 0.53 |
Earnings by Sex in Bladen County
Average Earnings in Bladen County are $33,731, $37,382 for men and $32,155 for women, a difference of 14.0%.
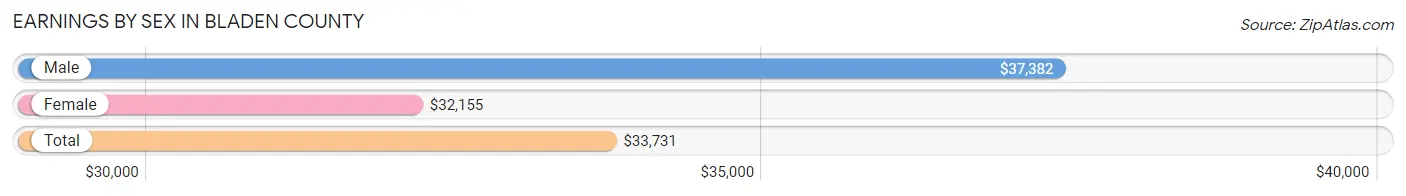
| Sex | Number | Average Earnings |
| Male | 6,311 (51.9%) | $37,382 |
| Female | 5,838 (48.0%) | $32,155 |
| Total | 12,149 (100.0%) | $33,731 |
Earnings by Sex by Income Bracket in Bladen County
The most common earnings brackets in Bladen County are $75,000 to $99,999 for men (566 | 9.0%) and $30,000 to $34,999 for women (732 | 12.5%).
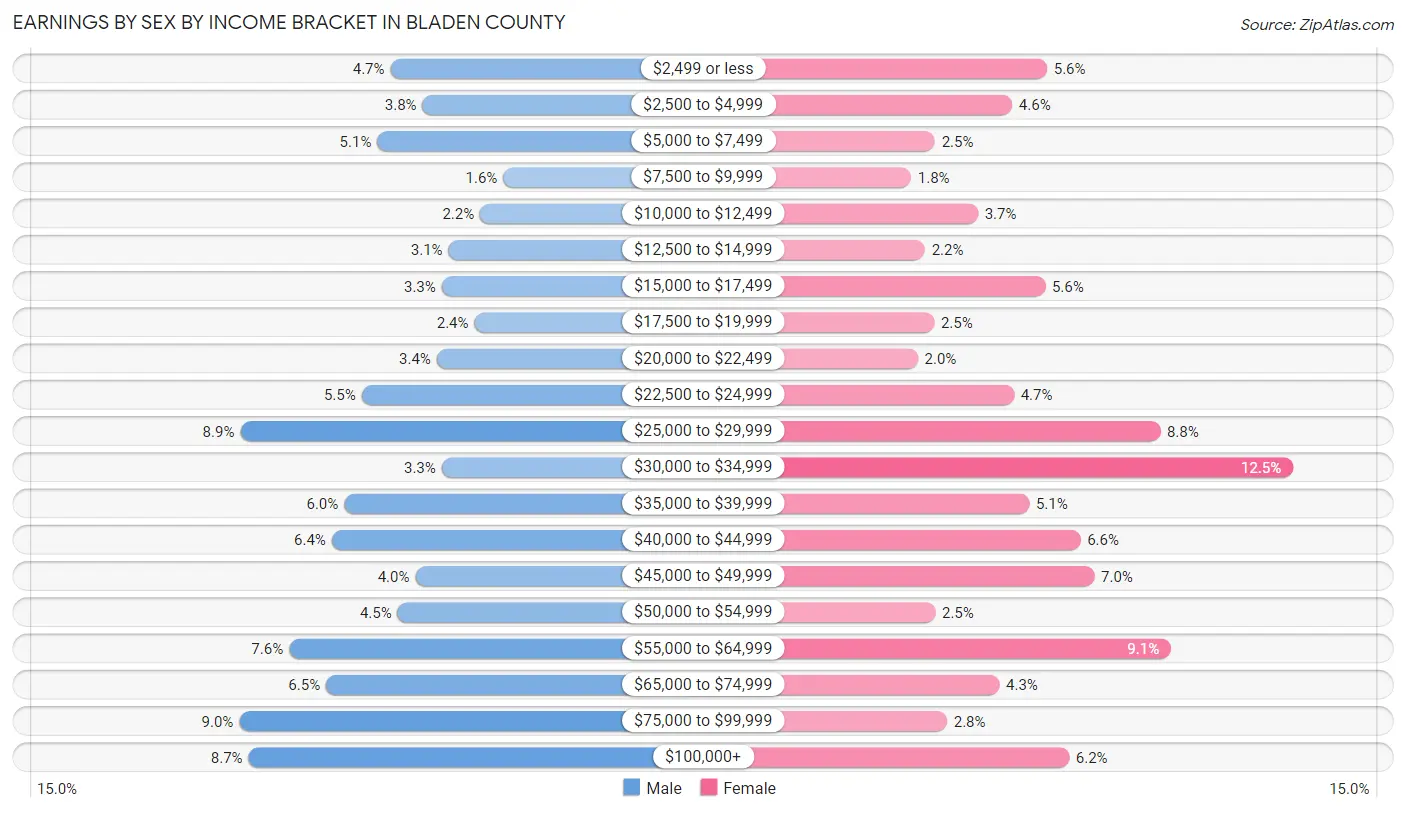
| Income | Male | Female |
| $2,499 or less | 298 (4.7%) | 328 (5.6%) |
| $2,500 to $4,999 | 241 (3.8%) | 271 (4.6%) |
| $5,000 to $7,499 | 321 (5.1%) | 144 (2.5%) |
| $7,500 to $9,999 | 98 (1.5%) | 105 (1.8%) |
| $10,000 to $12,499 | 139 (2.2%) | 215 (3.7%) |
| $12,500 to $14,999 | 195 (3.1%) | 128 (2.2%) |
| $15,000 to $17,499 | 207 (3.3%) | 325 (5.6%) |
| $17,500 to $19,999 | 149 (2.4%) | 143 (2.5%) |
| $20,000 to $22,499 | 216 (3.4%) | 116 (2.0%) |
| $22,500 to $24,999 | 349 (5.5%) | 274 (4.7%) |
| $25,000 to $29,999 | 564 (8.9%) | 514 (8.8%) |
| $30,000 to $34,999 | 207 (3.3%) | 732 (12.5%) |
| $35,000 to $39,999 | 380 (6.0%) | 299 (5.1%) |
| $40,000 to $44,999 | 402 (6.4%) | 383 (6.6%) |
| $45,000 to $49,999 | 254 (4.0%) | 406 (7.0%) |
| $50,000 to $54,999 | 285 (4.5%) | 145 (2.5%) |
| $55,000 to $64,999 | 478 (7.6%) | 532 (9.1%) |
| $65,000 to $74,999 | 412 (6.5%) | 250 (4.3%) |
| $75,000 to $99,999 | 566 (9.0%) | 164 (2.8%) |
| $100,000+ | 550 (8.7%) | 364 (6.2%) |
| Total | 6,311 (100.0%) | 5,838 (100.0%) |
Earnings by Sex by Educational Attainment in Bladen County
Average earnings in Bladen County are $39,923 for men and $33,654 for women, a difference of 15.7%. Men with an educational attainment of graduate degree enjoy the highest average annual earnings of $57,308, while those with less than high school education earn the least with $29,213. Women with an educational attainment of graduate degree earn the most with the average annual earnings of $55,625, while those with less than high school education have the smallest earnings of $27,542.
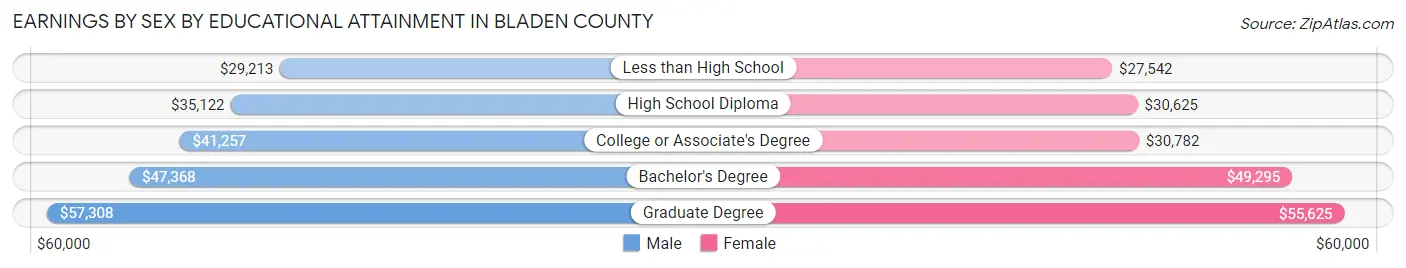
| Educational Attainment | Male Income | Female Income |
| Less than High School | $29,213 | $27,542 |
| High School Diploma | $35,122 | $30,625 |
| College or Associate's Degree | $41,257 | $30,782 |
| Bachelor's Degree | $47,368 | $49,295 |
| Graduate Degree | $57,308 | $55,625 |
| Total | $39,923 | $33,654 |
Family Income in Bladen County
Family Income Brackets in Bladen County
According to the Bladen County family income data, there are 1,172 families falling into the $50,000 to $74,999 income range, which is the most common income bracket and makes up 16.8% of all families. Conversely, the $10,000 to $14,999 income bracket is the least frequent group with only 237 families (3.4%) belonging to this category.
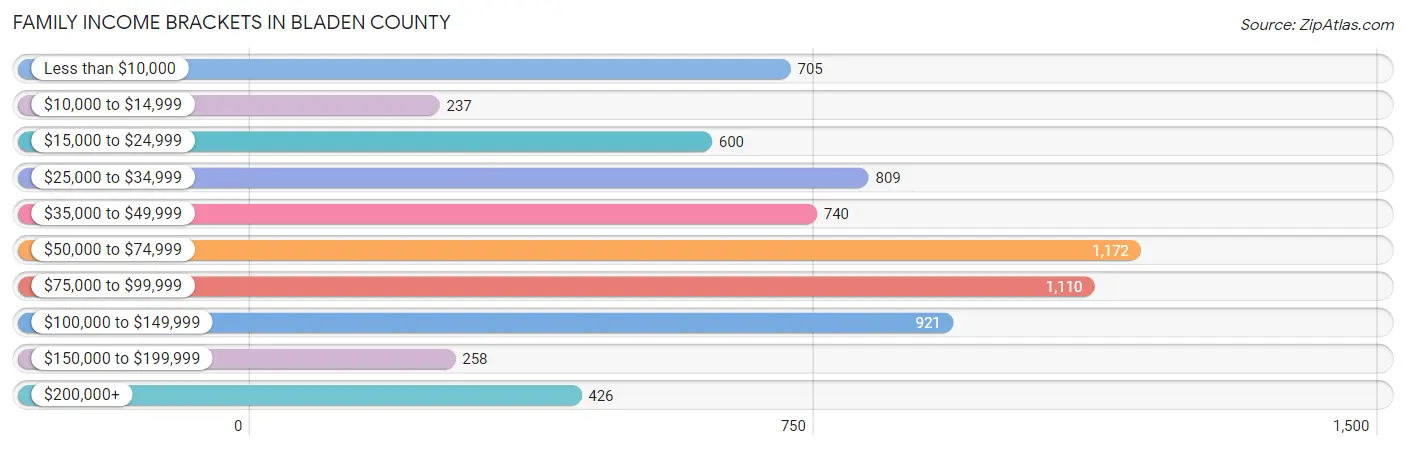
| Income Bracket | # Families | % Families |
| Less than $10,000 | 705 | 10.1% |
| $10,000 to $14,999 | 237 | 3.4% |
| $15,000 to $24,999 | 600 | 8.6% |
| $25,000 to $34,999 | 809 | 11.6% |
| $35,000 to $49,999 | 740 | 10.6% |
| $50,000 to $74,999 | 1,172 | 16.8% |
| $75,000 to $99,999 | 1,110 | 15.9% |
| $100,000 to $149,999 | 921 | 13.2% |
| $150,000 to $199,999 | 258 | 3.7% |
| $200,000+ | 426 | 6.1% |
Family Income by Famaliy Size in Bladen County
6-person families (100 | 1.4%) account for the highest median family income in Bladen County with $145,266 per family, while 6-person families (100 | 1.4%) have the highest median income of $24,211 per family member.
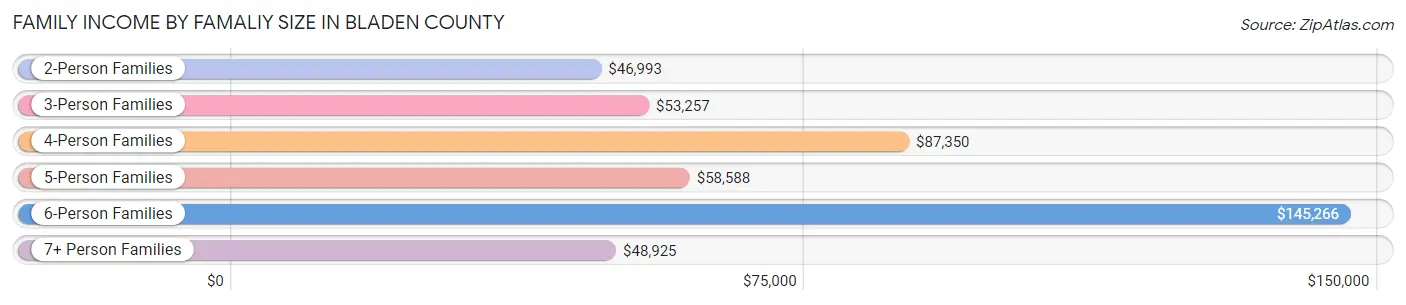
| Income Bracket | # Families | Median Income |
| 2-Person Families | 3,984 (57.1%) | $46,993 |
| 3-Person Families | 1,355 (19.4%) | $53,257 |
| 4-Person Families | 905 (13.0%) | $87,350 |
| 5-Person Families | 467 (6.7%) | $58,588 |
| 6-Person Families | 100 (1.4%) | $145,266 |
| 7+ Person Families | 167 (2.4%) | $48,925 |
| Total | 6,978 (100.0%) | $54,679 |
Family Income by Number of Earners in Bladen County
The median family income in Bladen County is $54,679, with families comprising 3+ earners (418) having the highest median family income of $145,357, while families with no earners (1,967) have the lowest median family income of $26,465, accounting for 6.0% and 28.2% of families, respectively.
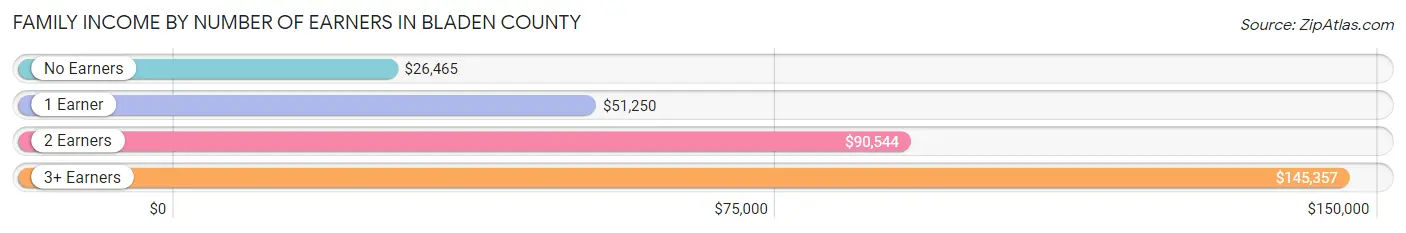
| Number of Earners | # Families | Median Income |
| No Earners | 1,967 (28.2%) | $26,465 |
| 1 Earner | 2,442 (35.0%) | $51,250 |
| 2 Earners | 2,151 (30.8%) | $90,544 |
| 3+ Earners | 418 (6.0%) | $145,357 |
| Total | 6,978 (100.0%) | $54,679 |
Household Income in Bladen County
Household Income Brackets in Bladen County
With 1,628 households falling in the category, the $50,000 to $74,999 income range is the most frequent in Bladen County, accounting for 14.3% of all households. In contrast, only 262 households (2.3%) fall into the $150,000 to $199,999 income bracket, making it the least populous group.
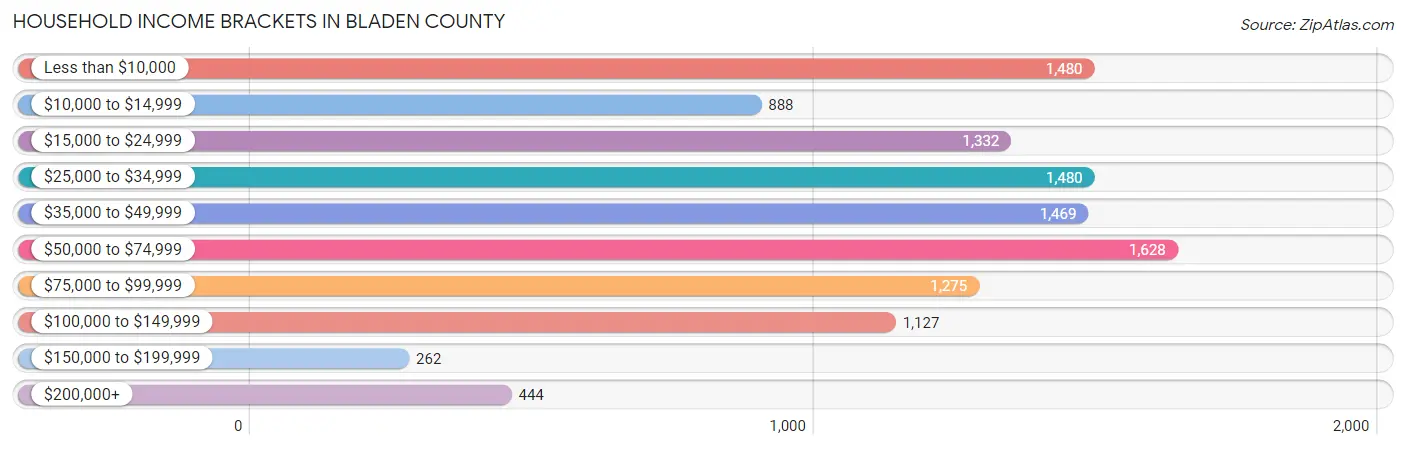
| Income Bracket | # Households | % Households |
| Less than $10,000 | 1,480 | 13.0% |
| $10,000 to $14,999 | 888 | 7.8% |
| $15,000 to $24,999 | 1,332 | 11.7% |
| $25,000 to $34,999 | 1,480 | 13.0% |
| $35,000 to $49,999 | 1,469 | 12.9% |
| $50,000 to $74,999 | 1,628 | 14.3% |
| $75,000 to $99,999 | 1,275 | 11.2% |
| $100,000 to $149,999 | 1,127 | 9.9% |
| $150,000 to $199,999 | 262 | 2.3% |
| $200,000+ | 444 | 3.9% |
Household Income by Householder Age in Bladen County
The median household income in Bladen County is $40,476, with the highest median household income of $44,191 found in the 25 to 44 years age bracket for the primary householder. A total of 2,450 households (21.5%) fall into this category. Meanwhile, the 15 to 24 years age bracket for the primary householder has the lowest median household income of $0, with 248 households (2.2%) in this group.

| Income Bracket | # Households | Median Income |
| 15 to 24 Years | 248 (2.2%) | $0 |
| 25 to 44 Years | 2,450 (21.5%) | $44,191 |
| 45 to 64 Years | 4,255 (37.4%) | $42,098 |
| 65+ Years | 4,433 (38.9%) | $37,165 |
| Total | 11,386 (100.0%) | $40,476 |
Poverty in Bladen County
Income Below Poverty by Sex and Age in Bladen County
With 21.7% poverty level for males and 26.9% for females among the residents of Bladen County, 15 year old males and 16 and 17 year old females are the most vulnerable to poverty, with 128 males (67.4%) and 156 females (64.7%) in their respective age groups living below the poverty level.
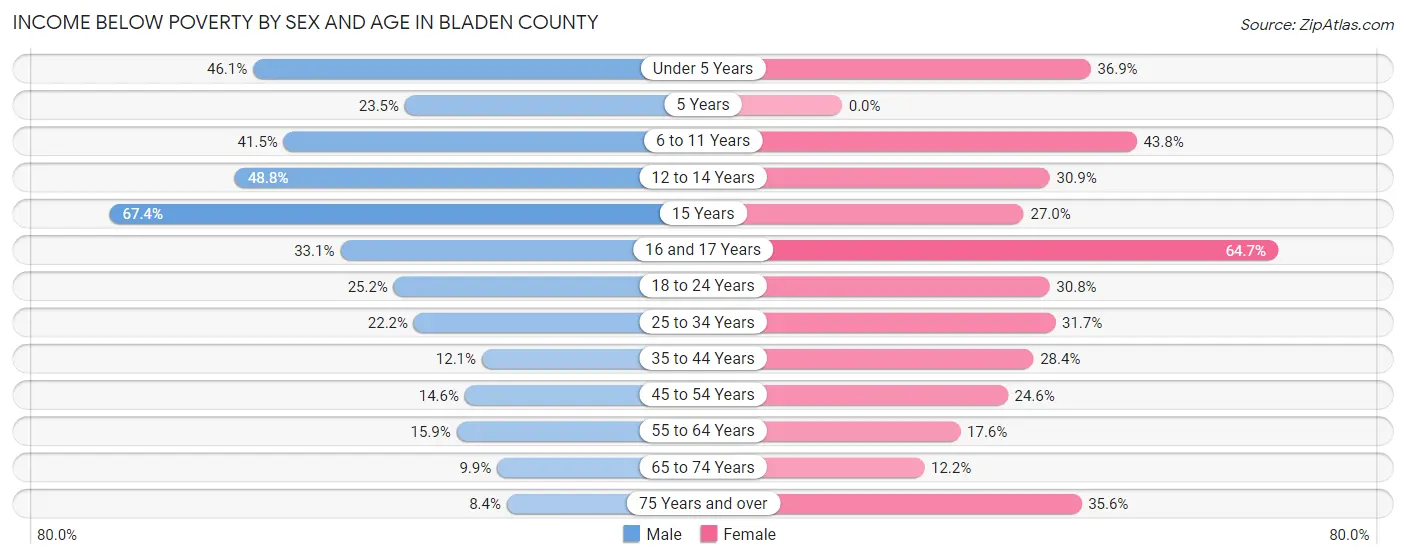
| Age Bracket | Male | Female |
| Under 5 Years | 347 (46.1%) | 216 (36.9%) |
| 5 Years | 16 (23.5%) | 0 (0.0%) |
| 6 to 11 Years | 471 (41.5%) | 428 (43.8%) |
| 12 to 14 Years | 312 (48.7%) | 178 (30.8%) |
| 15 Years | 128 (67.4%) | 78 (27.0%) |
| 16 and 17 Years | 111 (33.1%) | 156 (64.7%) |
| 18 to 24 Years | 326 (25.2%) | 340 (30.8%) |
| 25 to 34 Years | 329 (22.2%) | 480 (31.7%) |
| 35 to 44 Years | 191 (12.1%) | 516 (28.4%) |
| 45 to 54 Years | 252 (14.6%) | 487 (24.6%) |
| 55 to 64 Years | 314 (15.9%) | 420 (17.6%) |
| 65 to 74 Years | 210 (9.9%) | 255 (12.2%) |
| 75 Years and over | 71 (8.4%) | 556 (35.5%) |
| Total | 3,078 (21.7%) | 4,110 (26.9%) |
Income Above Poverty by Sex and Age in Bladen County
According to the poverty statistics in Bladen County, males aged 75 years and over and females aged 5 years are the age groups that are most secure financially, with 91.6% of males and 100.0% of females in these age groups living above the poverty line.
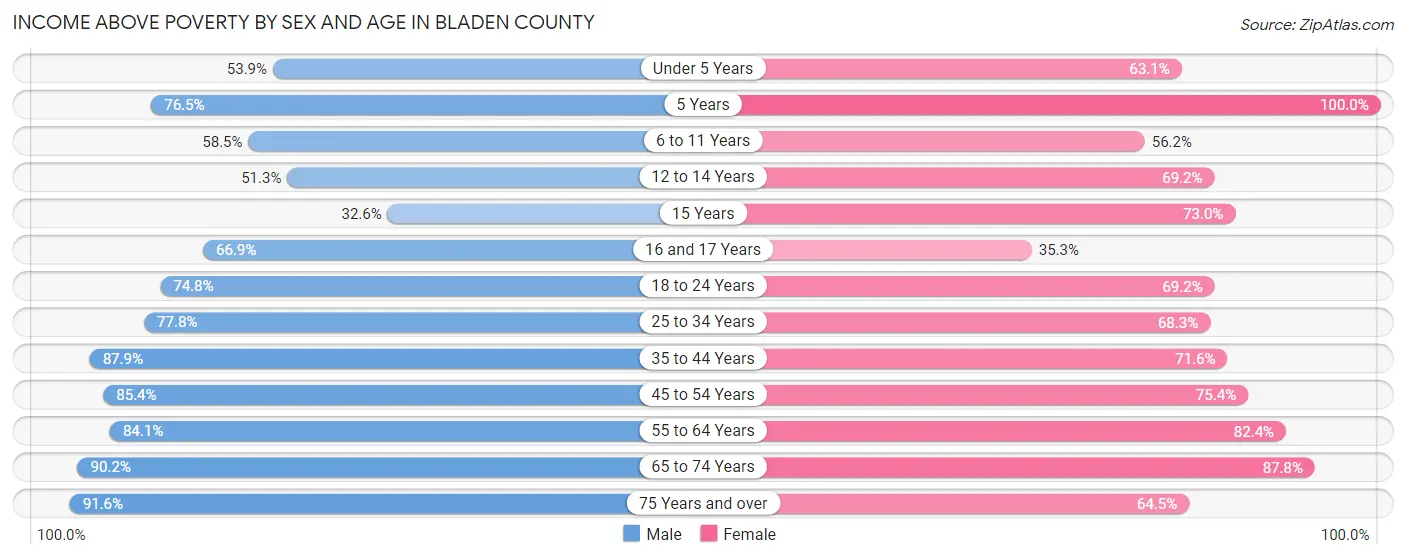
| Age Bracket | Male | Female |
| Under 5 Years | 406 (53.9%) | 369 (63.1%) |
| 5 Years | 52 (76.5%) | 155 (100.0%) |
| 6 to 11 Years | 663 (58.5%) | 550 (56.2%) |
| 12 to 14 Years | 328 (51.2%) | 399 (69.2%) |
| 15 Years | 62 (32.6%) | 211 (73.0%) |
| 16 and 17 Years | 224 (66.9%) | 85 (35.3%) |
| 18 to 24 Years | 968 (74.8%) | 763 (69.2%) |
| 25 to 34 Years | 1,153 (77.8%) | 1,036 (68.3%) |
| 35 to 44 Years | 1,388 (87.9%) | 1,299 (71.6%) |
| 45 to 54 Years | 1,471 (85.4%) | 1,492 (75.4%) |
| 55 to 64 Years | 1,666 (84.1%) | 1,970 (82.4%) |
| 65 to 74 Years | 1,922 (90.1%) | 1,834 (87.8%) |
| 75 Years and over | 774 (91.6%) | 1,008 (64.4%) |
| Total | 11,077 (78.3%) | 11,171 (73.1%) |
Income Below Poverty Among Married-Couple Families in Bladen County
The poverty statistics for married-couple families in Bladen County show that 8.0% or 379 of the total 4,738 families live below the poverty line. Families with 5 or more children have the highest poverty rate of 39.8%, comprising of 51 families. On the other hand, families with no children have the lowest poverty rate of 4.3%, which includes 138 families.
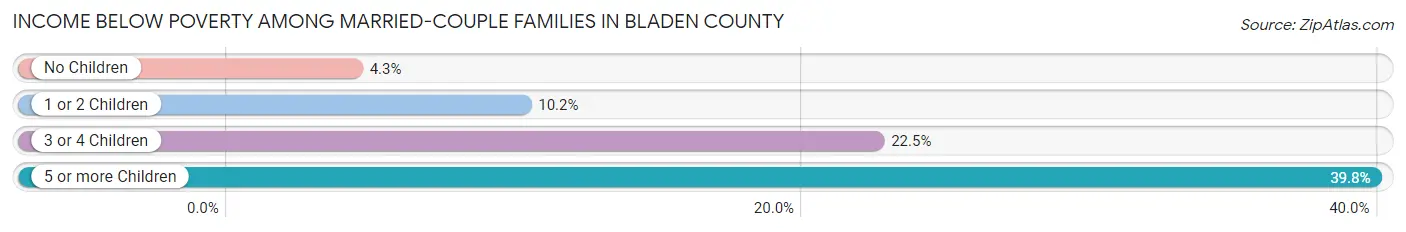
| Children | Above Poverty | Below Poverty |
| No Children | 3,044 (95.7%) | 138 (4.3%) |
| 1 or 2 Children | 959 (89.8%) | 109 (10.2%) |
| 3 or 4 Children | 279 (77.5%) | 81 (22.5%) |
| 5 or more Children | 77 (60.2%) | 51 (39.8%) |
| Total | 4,359 (92.0%) | 379 (8.0%) |
Income Below Poverty Among Single-Parent Households in Bladen County
According to the poverty data in Bladen County, 30.4% or 126 single-father households and 50.7% or 925 single-mother households are living below the poverty line. Among single-father households, those with 1 or 2 children have the highest poverty rate, with 106 households (43.6%) experiencing poverty. Likewise, among single-mother households, those with 5 or more children have the highest poverty rate, with 4 households (100.0%) falling below the poverty line.
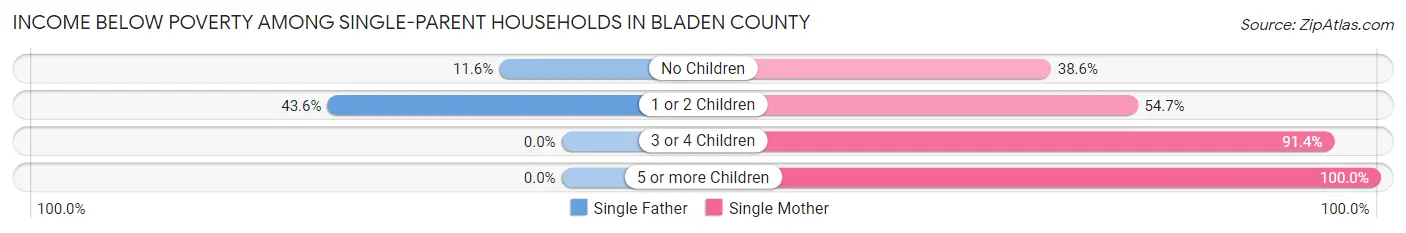
| Children | Single Father | Single Mother |
| No Children | 20 (11.6%) | 282 (38.6%) |
| 1 or 2 Children | 106 (43.6%) | 533 (54.7%) |
| 3 or 4 Children | 0 (0.0%) | 106 (91.4%) |
| 5 or more Children | 0 (0.0%) | 4 (100.0%) |
| Total | 126 (30.4%) | 925 (50.7%) |
Income Below Poverty Among Married-Couple vs Single-Parent Households in Bladen County
The poverty data for Bladen County shows that 379 of the married-couple family households (8.0%) and 1,051 of the single-parent households (46.9%) are living below the poverty level. Within the married-couple family households, those with 5 or more children have the highest poverty rate, with 51 households (39.8%) falling below the poverty line. Among the single-parent households, those with 5 or more children have the highest poverty rate, with 4 household (100.0%) living below poverty.
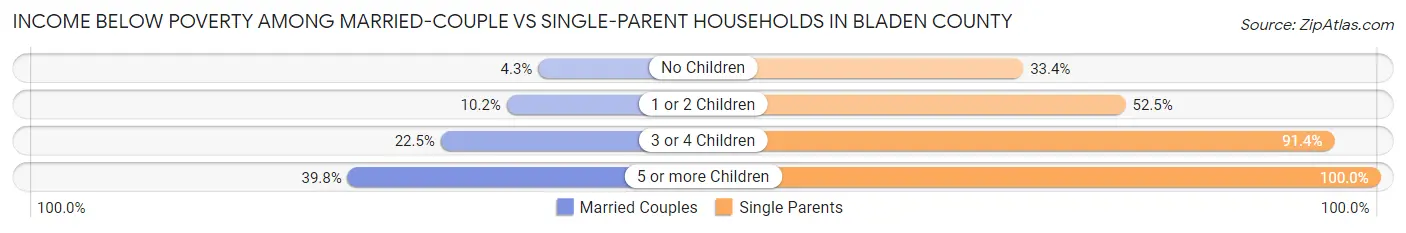
| Children | Married-Couple Families | Single-Parent Households |
| No Children | 138 (4.3%) | 302 (33.4%) |
| 1 or 2 Children | 109 (10.2%) | 639 (52.5%) |
| 3 or 4 Children | 81 (22.5%) | 106 (91.4%) |
| 5 or more Children | 51 (39.8%) | 4 (100.0%) |
| Total | 379 (8.0%) | 1,051 (46.9%) |
Employment Characteristics in Bladen County
Employment by Class of Employer in Bladen County
Among the 10,567 employed individuals in Bladen County, private company employees (6,758 | 63.9%), state government employees (1,185 | 11.2%), and self-employed (not incorporated) (725 | 6.9%) make up the most common classes of employment.
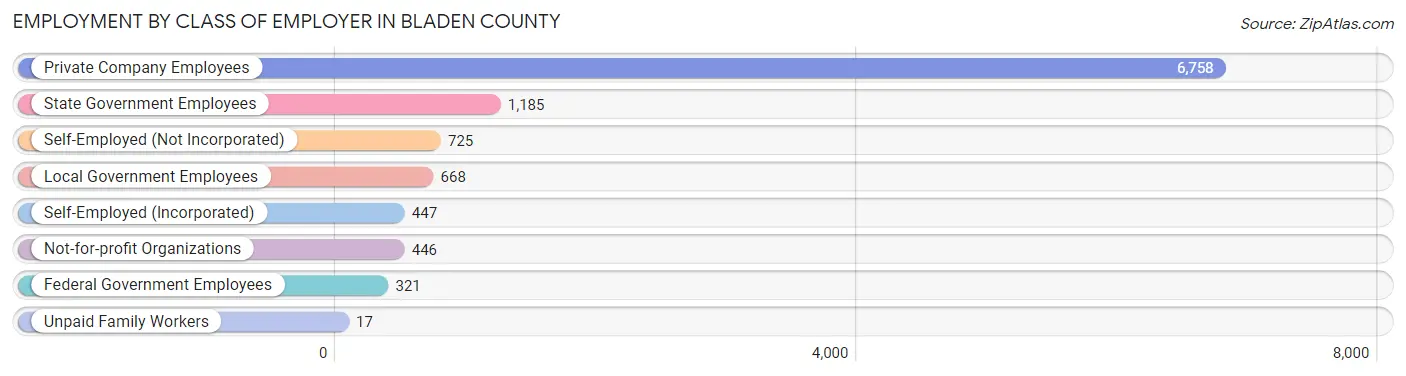
| Employer Class | # Employees | % Employees |
| Private Company Employees | 6,758 | 63.9% |
| Self-Employed (Incorporated) | 447 | 4.2% |
| Self-Employed (Not Incorporated) | 725 | 6.9% |
| Not-for-profit Organizations | 446 | 4.2% |
| Local Government Employees | 668 | 6.3% |
| State Government Employees | 1,185 | 11.2% |
| Federal Government Employees | 321 | 3.0% |
| Unpaid Family Workers | 17 | 0.2% |
| Total | 10,567 | 100.0% |
Employment Status by Age in Bladen County
According to the labor force statistics for Bladen County, out of the total population over 16 years of age (24,339), 47.7% or 11,610 individuals are in the labor force, with 5.5% or 639 of them unemployed. The age group with the highest labor force participation rate is 25 to 29 years, with 69.9% or 1,067 individuals in the labor force. Within the labor force, the 30 to 34 years age range has the highest percentage of unemployed individuals, with 8.2% or 80 of them being unemployed.
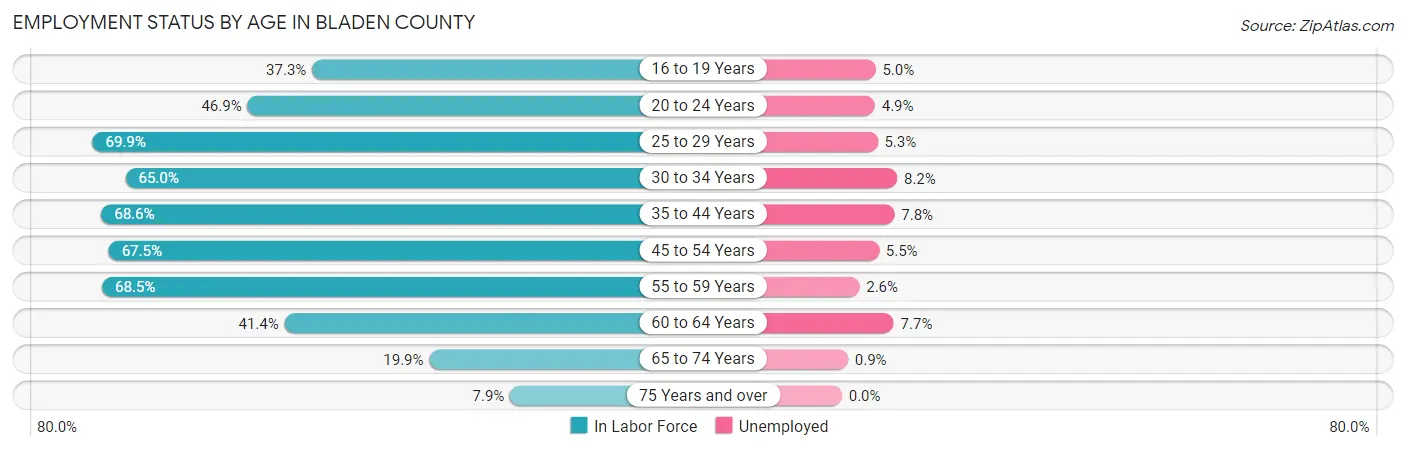
| Age Bracket | In Labor Force | Unemployed |
| 16 to 19 Years | 463 (37.3%) | 23 (5.0%) |
| 20 to 24 Years | 821 (46.9%) | 40 (4.9%) |
| 25 to 29 Years | 1,067 (69.9%) | 57 (5.3%) |
| 30 to 34 Years | 970 (65.0%) | 80 (8.2%) |
| 35 to 44 Years | 2,339 (68.6%) | 182 (7.8%) |
| 45 to 54 Years | 2,508 (67.5%) | 138 (5.5%) |
| 55 to 59 Years | 1,449 (68.5%) | 38 (2.6%) |
| 60 to 64 Years | 946 (41.4%) | 73 (7.7%) |
| 65 to 74 Years | 851 (19.9%) | 8 (0.9%) |
| 75 Years and over | 199 (7.9%) | 0 (0.0%) |
| Total | 11,610 (47.7%) | 639 (5.5%) |
Employment Status by Educational Attainment in Bladen County
According to labor force statistics for Bladen County, 63.8% of individuals (9,280) out of the total population between 25 and 64 years of age (14,546) are in the labor force, with 6.1% or 566 of them being unemployed. The group with the highest labor force participation rate are those with the educational attainment of college / associate degree, with 72.3% or 3,765 individuals in the labor force. Within the labor force, individuals with high school diploma education have the highest percentage of unemployment, with 10.3% or 291 of them being unemployed.
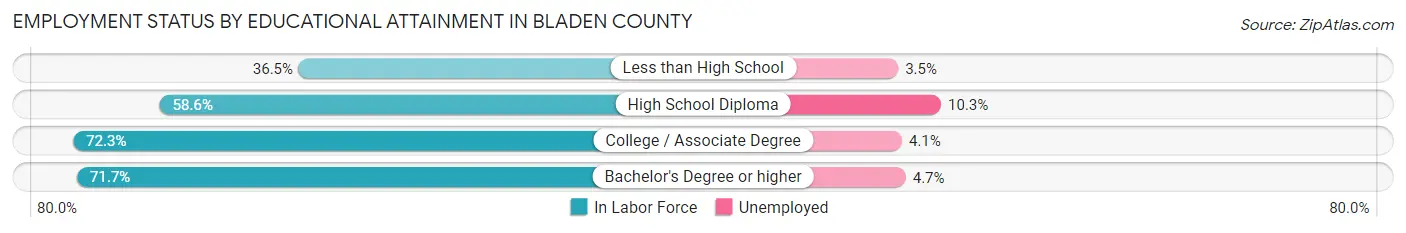
| Educational Attainment | In Labor Force | Unemployed |
| Less than High School | 570 (36.5%) | 55 (3.5%) |
| High School Diploma | 2,830 (58.6%) | 497 (10.3%) |
| College / Associate Degree | 3,765 (72.3%) | 214 (4.1%) |
| Bachelor's Degree or higher | 2,113 (71.7%) | 139 (4.7%) |
| Total | 9,280 (63.8%) | 887 (6.1%) |
Employment Occupations by Sex in Bladen County
Management, Business, Science and Arts Occupations
The most common Management, Business, Science and Arts occupations in Bladen County are Community & Social Service (1,037 | 9.5%), Management (1,010 | 9.2%), Education Instruction & Library (693 | 6.3%), Health Diagnosing & Treating (653 | 6.0%), and Health Technologists (477 | 4.4%).

Management, Business, Science and Arts Occupations by Sex
Within the Management, Business, Science and Arts occupations in Bladen County, the most male-oriented occupations are Legal Services & Support (67.4%), Architecture & Engineering (66.7%), and Management (65.4%), while the most female-oriented occupations are Arts, Media & Entertainment (100.0%), Health Diagnosing & Treating (90.3%), and Health Technologists (88.3%).
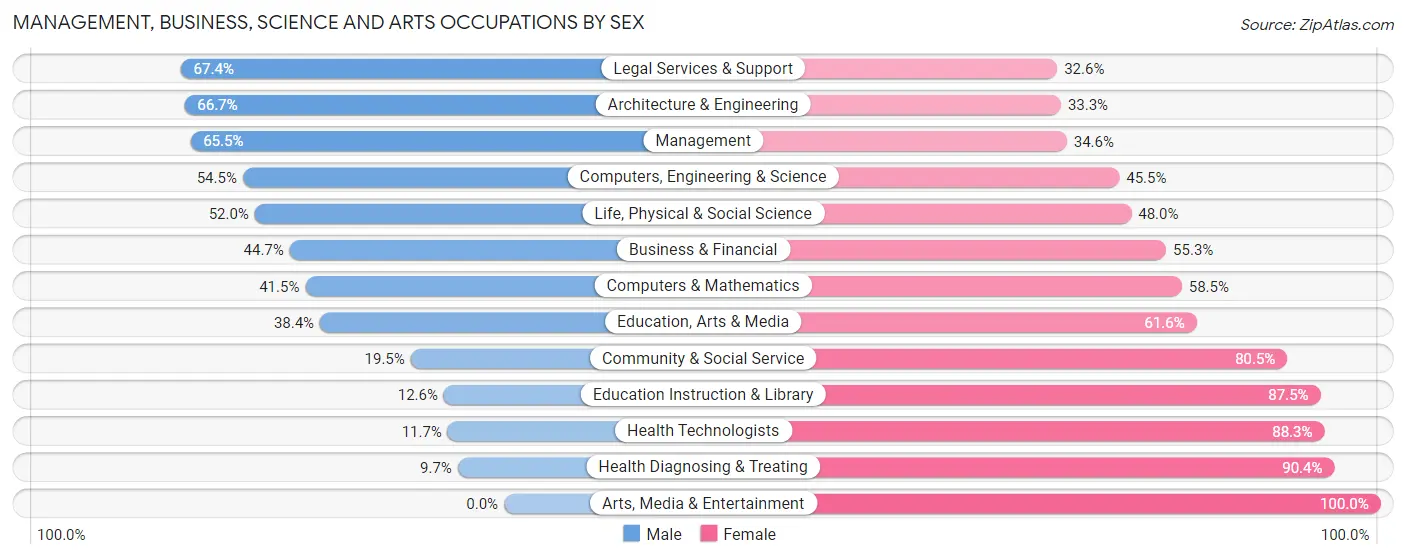
| Occupation | Male | Female |
| Management | 661 (65.4%) | 349 (34.5%) |
| Business & Financial | 161 (44.7%) | 199 (55.3%) |
| Computers, Engineering & Science | 109 (54.5%) | 91 (45.5%) |
| Computers & Mathematics | 34 (41.5%) | 48 (58.5%) |
| Architecture & Engineering | 62 (66.7%) | 31 (33.3%) |
| Life, Physical & Social Science | 13 (52.0%) | 12 (48.0%) |
| Community & Social Service | 202 (19.5%) | 835 (80.5%) |
| Education, Arts & Media | 86 (38.4%) | 138 (61.6%) |
| Legal Services & Support | 29 (67.4%) | 14 (32.6%) |
| Education Instruction & Library | 87 (12.6%) | 606 (87.5%) |
| Arts, Media & Entertainment | 0 (0.0%) | 77 (100.0%) |
| Health Diagnosing & Treating | 63 (9.7%) | 590 (90.3%) |
| Health Technologists | 56 (11.7%) | 421 (88.3%) |
| Total (Category) | 1,196 (36.7%) | 2,064 (63.3%) |
| Total (Overall) | 5,761 (52.6%) | 5,188 (47.4%) |
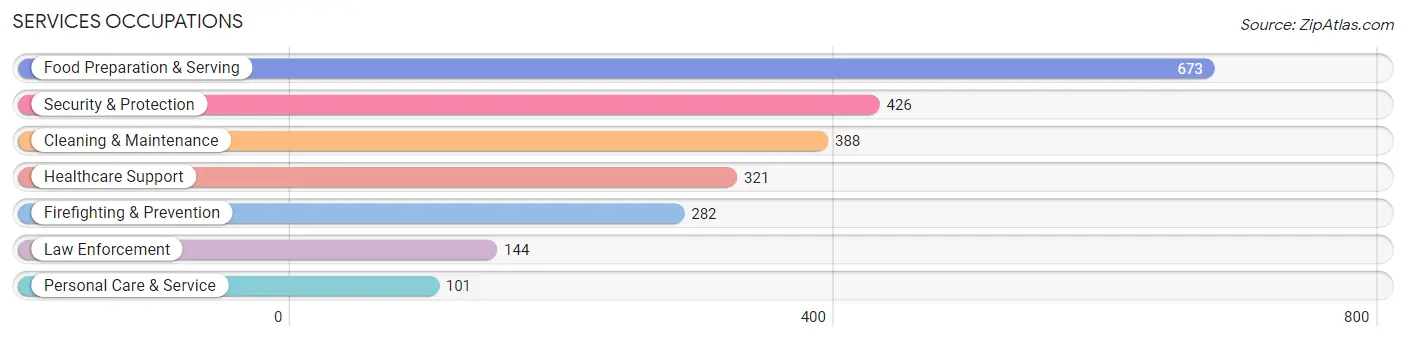
Services Occupations
The most common Services occupations in Bladen County are Food Preparation & Serving (673 | 6.1%), Security & Protection (426 | 3.9%), Cleaning & Maintenance (388 | 3.5%), Healthcare Support (321 | 2.9%), and Firefighting & Prevention (282 | 2.6%).
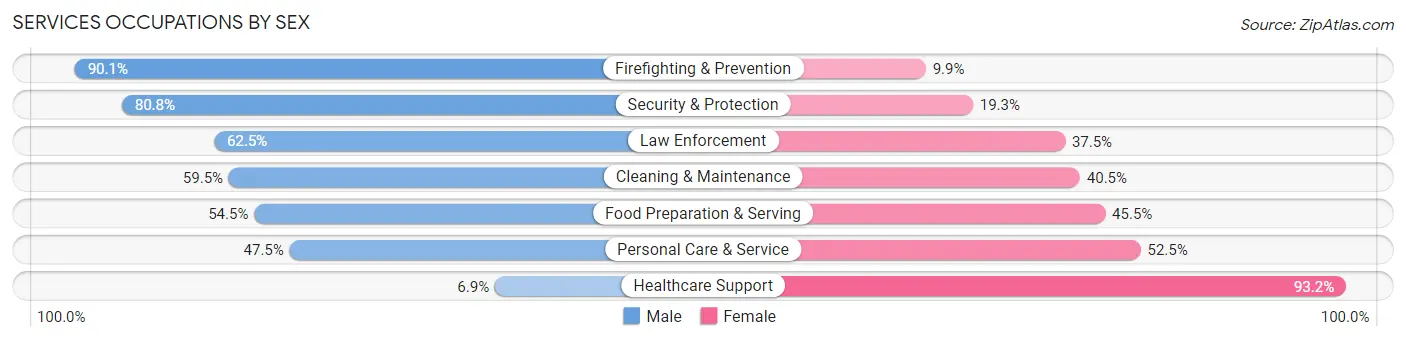
Services Occupations by Sex
Within the Services occupations in Bladen County, the most male-oriented occupations are Firefighting & Prevention (90.1%), Security & Protection (80.7%), and Law Enforcement (62.5%), while the most female-oriented occupations are Healthcare Support (93.1%), Personal Care & Service (52.5%), and Food Preparation & Serving (45.5%).
| Occupation | Male | Female |
| Healthcare Support | 22 (6.9%) | 299 (93.1%) |
| Security & Protection | 344 (80.7%) | 82 (19.3%) |
| Firefighting & Prevention | 254 (90.1%) | 28 (9.9%) |
| Law Enforcement | 90 (62.5%) | 54 (37.5%) |
| Food Preparation & Serving | 367 (54.5%) | 306 (45.5%) |
| Cleaning & Maintenance | 231 (59.5%) | 157 (40.5%) |
| Personal Care & Service | 48 (47.5%) | 53 (52.5%) |
| Total (Category) | 1,012 (53.0%) | 897 (47.0%) |
| Total (Overall) | 5,761 (52.6%) | 5,188 (47.4%) |
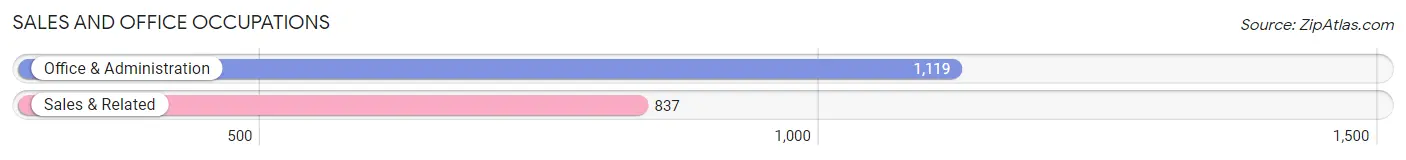
Sales and Office Occupations
The most common Sales and Office occupations in Bladen County are Office & Administration (1,119 | 10.2%), and Sales & Related (837 | 7.6%).
Sales and Office Occupations by Sex
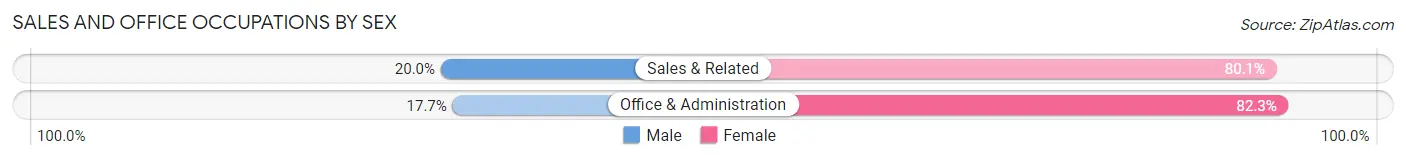
| Occupation | Male | Female |
| Sales & Related | 167 (20.0%) | 670 (80.0%) |
| Office & Administration | 198 (17.7%) | 921 (82.3%) |
| Total (Category) | 365 (18.7%) | 1,591 (81.3%) |
| Total (Overall) | 5,761 (52.6%) | 5,188 (47.4%) |
Natural Resources, Construction and Maintenance Occupations
The most common Natural Resources, Construction and Maintenance occupations in Bladen County are Construction & Extraction (619 | 5.7%), Installation, Maintenance & Repair (579 | 5.3%), and Farming, Fishing & Forestry (317 | 2.9%).
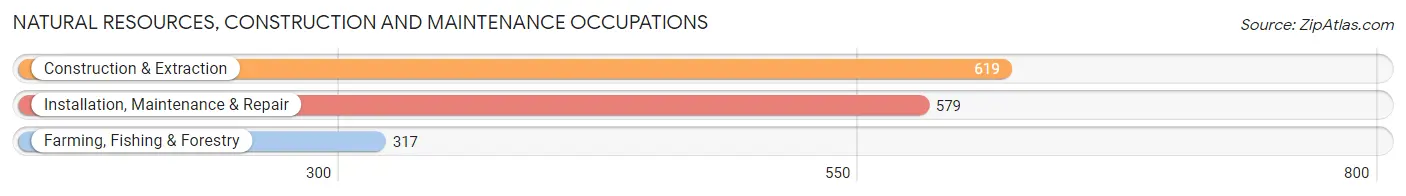
Natural Resources, Construction and Maintenance Occupations by Sex

| Occupation | Male | Female |
| Farming, Fishing & Forestry | 257 (81.1%) | 60 (18.9%) |
| Construction & Extraction | 545 (88.0%) | 74 (11.9%) |
| Installation, Maintenance & Repair | 547 (94.5%) | 32 (5.5%) |
| Total (Category) | 1,349 (89.0%) | 166 (11.0%) |
| Total (Overall) | 5,761 (52.6%) | 5,188 (47.4%) |
Production, Transportation and Moving Occupations
The most common Production, Transportation and Moving occupations in Bladen County are Production (1,238 | 11.3%), Transportation (543 | 5.0%), and Material Moving (528 | 4.8%).
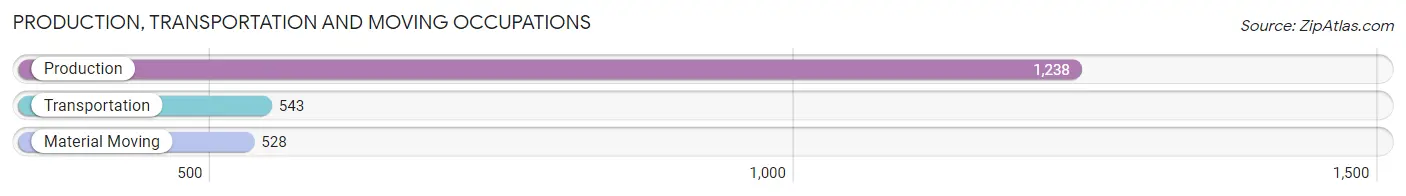
Production, Transportation and Moving Occupations by Sex
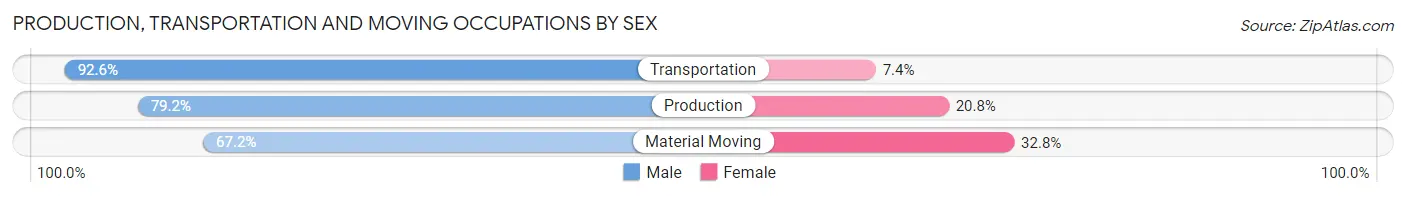
| Occupation | Male | Female |
| Production | 981 (79.2%) | 257 (20.8%) |
| Transportation | 503 (92.6%) | 40 (7.4%) |
| Material Moving | 355 (67.2%) | 173 (32.8%) |
| Total (Category) | 1,839 (79.6%) | 470 (20.4%) |
| Total (Overall) | 5,761 (52.6%) | 5,188 (47.4%) |
Employment Industries by Sex in Bladen County
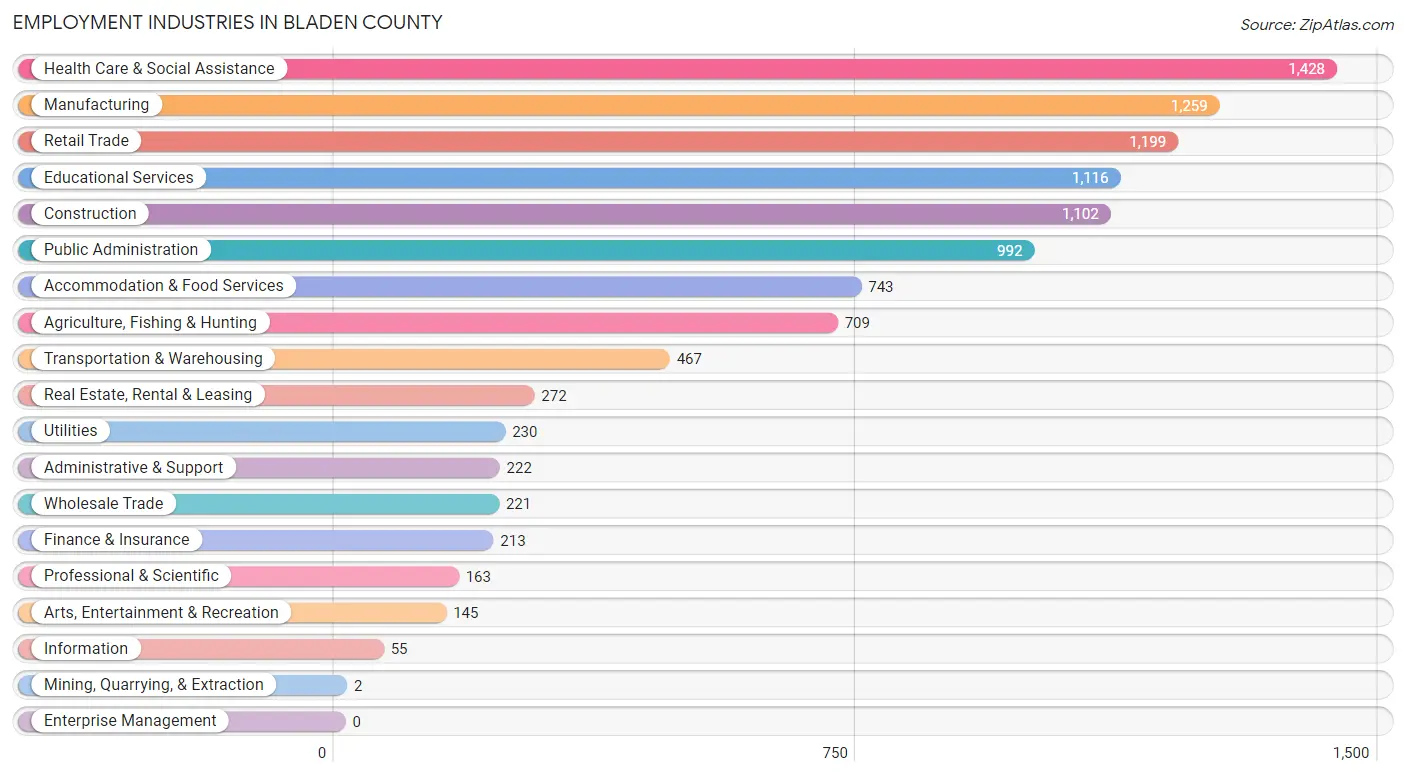
Employment Industries in Bladen County
The major employment industries in Bladen County include Health Care & Social Assistance (1,428 | 13.0%), Manufacturing (1,259 | 11.5%), Retail Trade (1,199 | 11.0%), Educational Services (1,116 | 10.2%), and Construction (1,102 | 10.1%).
Employment Industries by Sex in Bladen County
The Bladen County industries that see more men than women are Transportation & Warehousing (91.6%), Arts, Entertainment & Recreation (91.0%), and Utilities (88.7%), whereas the industries that tend to have a higher number of women are Mining, Quarrying, & Extraction (100.0%), Real Estate, Rental & Leasing (95.2%), and Finance & Insurance (93.9%).

| Industry | Male | Female |
| Agriculture, Fishing & Hunting | 622 (87.7%) | 87 (12.3%) |
| Mining, Quarrying, & Extraction | 0 (0.0%) | 2 (100.0%) |
| Construction | 837 (75.9%) | 265 (24.0%) |
| Manufacturing | 948 (75.3%) | 311 (24.7%) |
| Wholesale Trade | 184 (83.3%) | 37 (16.7%) |
| Retail Trade | 517 (43.1%) | 682 (56.9%) |
| Transportation & Warehousing | 428 (91.6%) | 39 (8.4%) |
| Utilities | 204 (88.7%) | 26 (11.3%) |
| Information | 38 (69.1%) | 17 (30.9%) |
| Finance & Insurance | 13 (6.1%) | 200 (93.9%) |
| Real Estate, Rental & Leasing | 13 (4.8%) | 259 (95.2%) |
| Professional & Scientific | 52 (31.9%) | 111 (68.1%) |
| Enterprise Management | 0 (0.0%) | 0 (0.0%) |
| Administrative & Support | 120 (54.0%) | 102 (46.0%) |
| Educational Services | 376 (33.7%) | 740 (66.3%) |
| Health Care & Social Assistance | 128 (9.0%) | 1,300 (91.0%) |
| Arts, Entertainment & Recreation | 132 (91.0%) | 13 (9.0%) |
| Accommodation & Food Services | 352 (47.4%) | 391 (52.6%) |
| Public Administration | 533 (53.7%) | 459 (46.3%) |
| Total | 5,761 (52.6%) | 5,188 (47.4%) |
Education in Bladen County
School Enrollment in Bladen County
The most common levels of schooling among the 5,880 students in Bladen County are high school (1,622 | 27.6%), elementary school (1,407 | 23.9%), and middle school (1,404 | 23.9%).
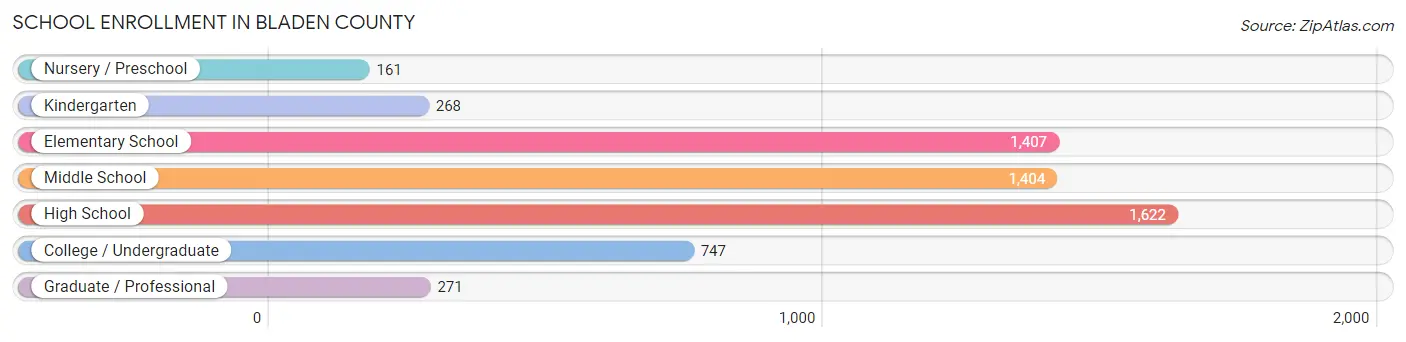
| School Level | # Students | % Students |
| Nursery / Preschool | 161 | 2.7% |
| Kindergarten | 268 | 4.6% |
| Elementary School | 1,407 | 23.9% |
| Middle School | 1,404 | 23.9% |
| High School | 1,622 | 27.6% |
| College / Undergraduate | 747 | 12.7% |
| Graduate / Professional | 271 | 4.6% |
| Total | 5,880 | 100.0% |
School Enrollment by Age by Funding Source in Bladen County
Out of a total of 5,880 students who are enrolled in schools in Bladen County, 700 (11.9%) attend a private institution, while the remaining 5,180 (88.1%) are enrolled in public schools. The age group of 3 to 4 year olds has the highest likelihood of being enrolled in private schools, with 32 (30.2% in the age bracket) enrolled. Conversely, the age group of 18 to 19 year olds has the lowest likelihood of being enrolled in a private school, with 280 (96.2% in the age bracket) attending a public institution.
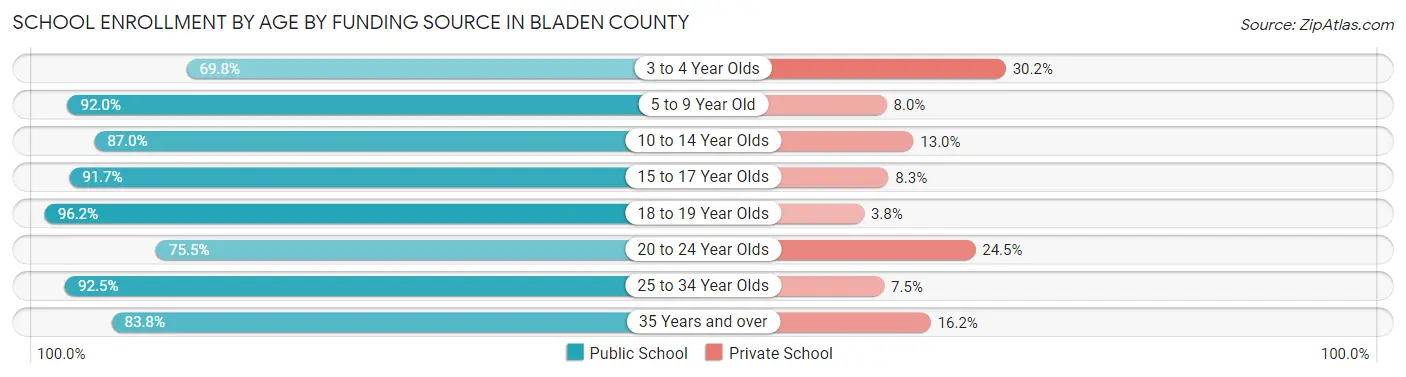
| Age Bracket | Public School | Private School |
| 3 to 4 Year Olds | 74 (69.8%) | 32 (30.2%) |
| 5 to 9 Year Old | 1,369 (92.0%) | 119 (8.0%) |
| 10 to 14 Year Olds | 1,622 (87.0%) | 242 (13.0%) |
| 15 to 17 Year Olds | 925 (91.7%) | 84 (8.3%) |
| 18 to 19 Year Olds | 280 (96.2%) | 11 (3.8%) |
| 20 to 24 Year Olds | 422 (75.5%) | 137 (24.5%) |
| 25 to 34 Year Olds | 184 (92.5%) | 15 (7.5%) |
| 35 Years and over | 305 (83.8%) | 59 (16.2%) |
| Total | 5,180 (88.1%) | 700 (11.9%) |
Educational Attainment by Field of Study in Bladen County
Education (946 | 20.6%), business (924 | 20.2%), science & technology (705 | 15.4%), arts & humanities (517 | 11.3%), and social sciences (256 | 5.6%) are the most common fields of study among 4,581 individuals in Bladen County who have obtained a bachelor's degree or higher.
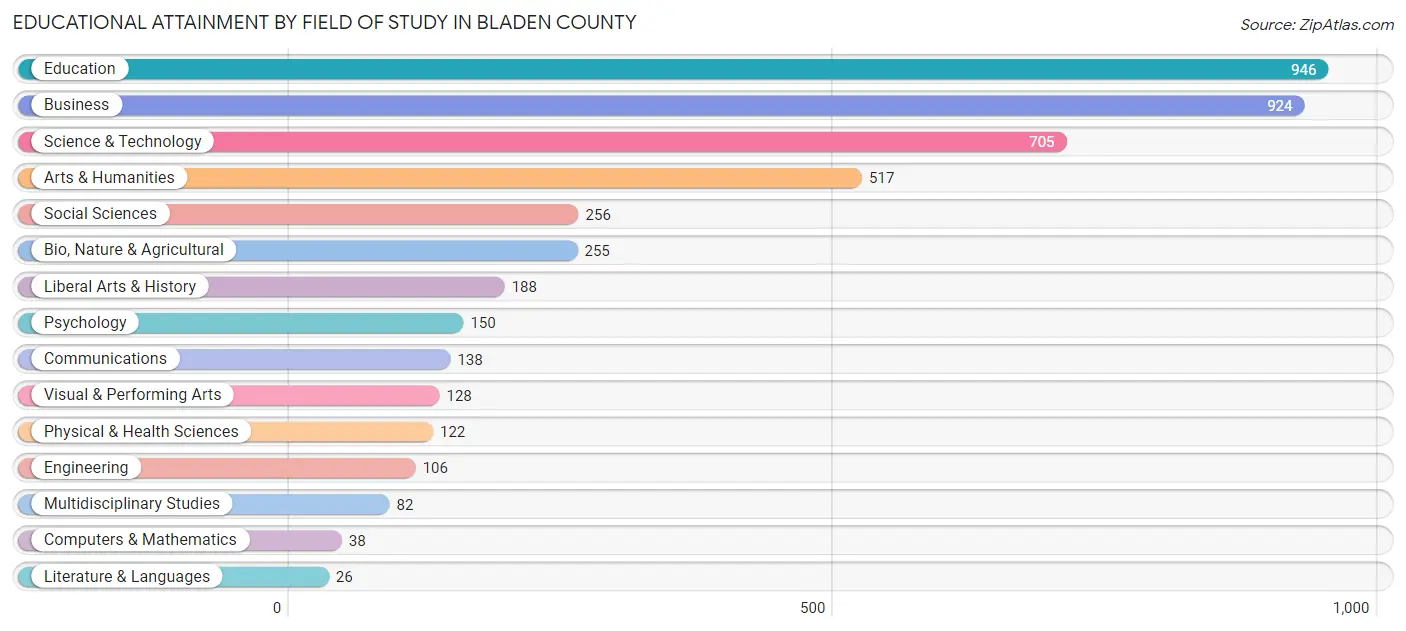
| Field of Study | # Graduates | % Graduates |
| Computers & Mathematics | 38 | 0.8% |
| Bio, Nature & Agricultural | 255 | 5.6% |
| Physical & Health Sciences | 122 | 2.7% |
| Psychology | 150 | 3.3% |
| Social Sciences | 256 | 5.6% |
| Engineering | 106 | 2.3% |
| Multidisciplinary Studies | 82 | 1.8% |
| Science & Technology | 705 | 15.4% |
| Business | 924 | 20.2% |
| Education | 946 | 20.6% |
| Literature & Languages | 26 | 0.6% |
| Liberal Arts & History | 188 | 4.1% |
| Visual & Performing Arts | 128 | 2.8% |
| Communications | 138 | 3.0% |
| Arts & Humanities | 517 | 11.3% |
| Total | 4,581 | 100.0% |
Transportation & Commute in Bladen County
Vehicle Availability by Sex in Bladen County
The most prevalent vehicle ownership categories in Bladen County are males with 2 vehicles (1,922, accounting for 35.1%) and females with 2 vehicles (2,008, making up 38.2%).
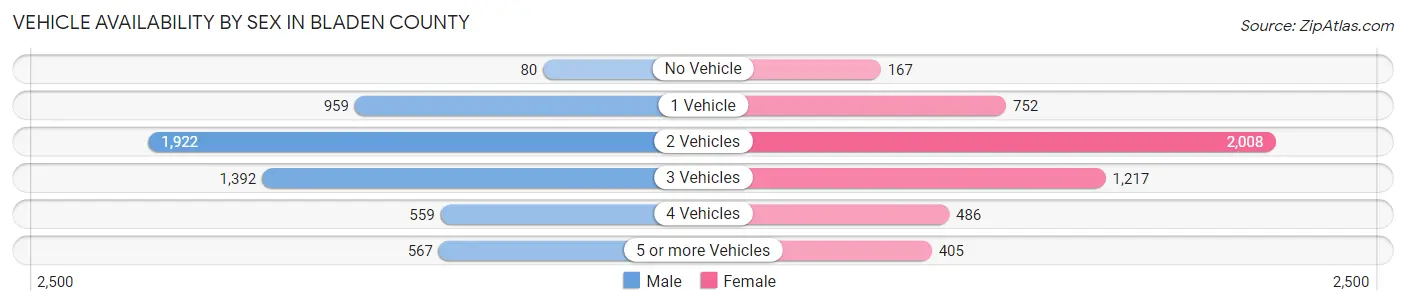
| Vehicles Available | Male | Female |
| No Vehicle | 80 (1.5%) | 167 (3.3%) |
| 1 Vehicle | 959 (17.5%) | 752 (14.9%) |
| 2 Vehicles | 1,922 (35.1%) | 2,008 (39.9%) |
| 3 Vehicles | 1,392 (25.4%) | 1,217 (24.2%) |
| 4 Vehicles | 559 (10.2%) | 486 (9.7%) |
| 5 or more Vehicles | 567 (10.3%) | 405 (8.0%) |
| Total | 5,479 (100.0%) | 5,035 (100.0%) |
Commute Time in Bladen County
The most frequently occuring commute durations in Bladen County are 30 to 34 minutes (1,489 commuters, 14.9%), 15 to 19 minutes (1,481 commuters, 14.8%), and 45 to 59 minutes (1,265 commuters, 12.7%).
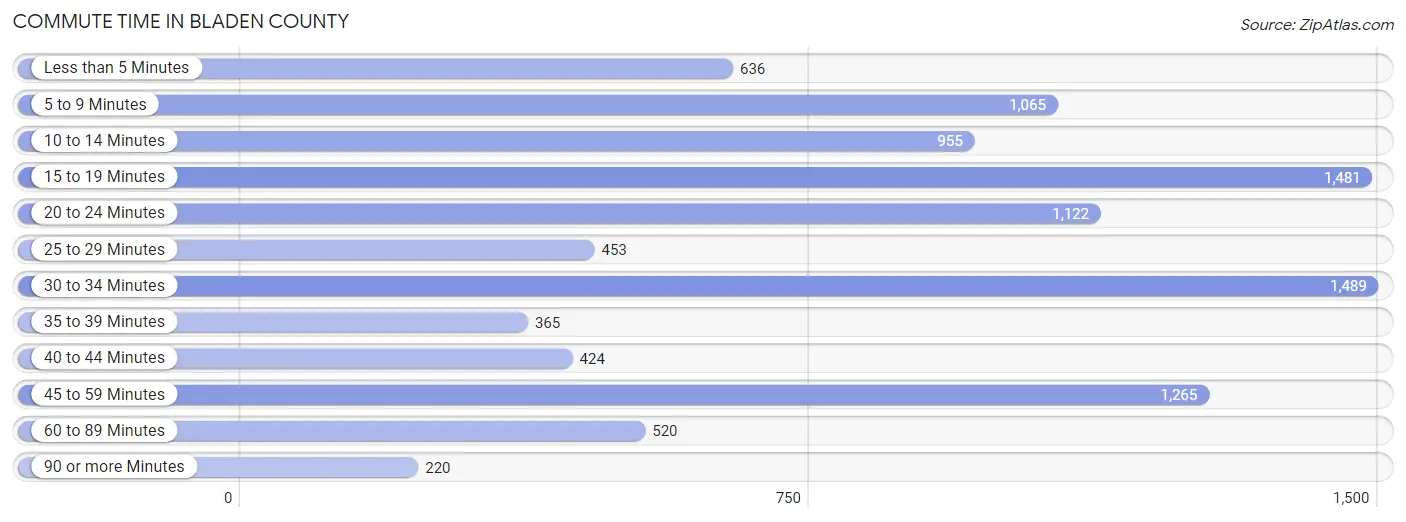
| Commute Time | # Commuters | % Commuters |
| Less than 5 Minutes | 636 | 6.4% |
| 5 to 9 Minutes | 1,065 | 10.7% |
| 10 to 14 Minutes | 955 | 9.6% |
| 15 to 19 Minutes | 1,481 | 14.8% |
| 20 to 24 Minutes | 1,122 | 11.2% |
| 25 to 29 Minutes | 453 | 4.5% |
| 30 to 34 Minutes | 1,489 | 14.9% |
| 35 to 39 Minutes | 365 | 3.6% |
| 40 to 44 Minutes | 424 | 4.2% |
| 45 to 59 Minutes | 1,265 | 12.7% |
| 60 to 89 Minutes | 520 | 5.2% |
| 90 or more Minutes | 220 | 2.2% |
Commute Time by Sex in Bladen County
The most common commute times in Bladen County are 30 to 34 minutes (1,097 commuters, 20.5%) for males and 15 to 19 minutes (878 commuters, 18.9%) for females.
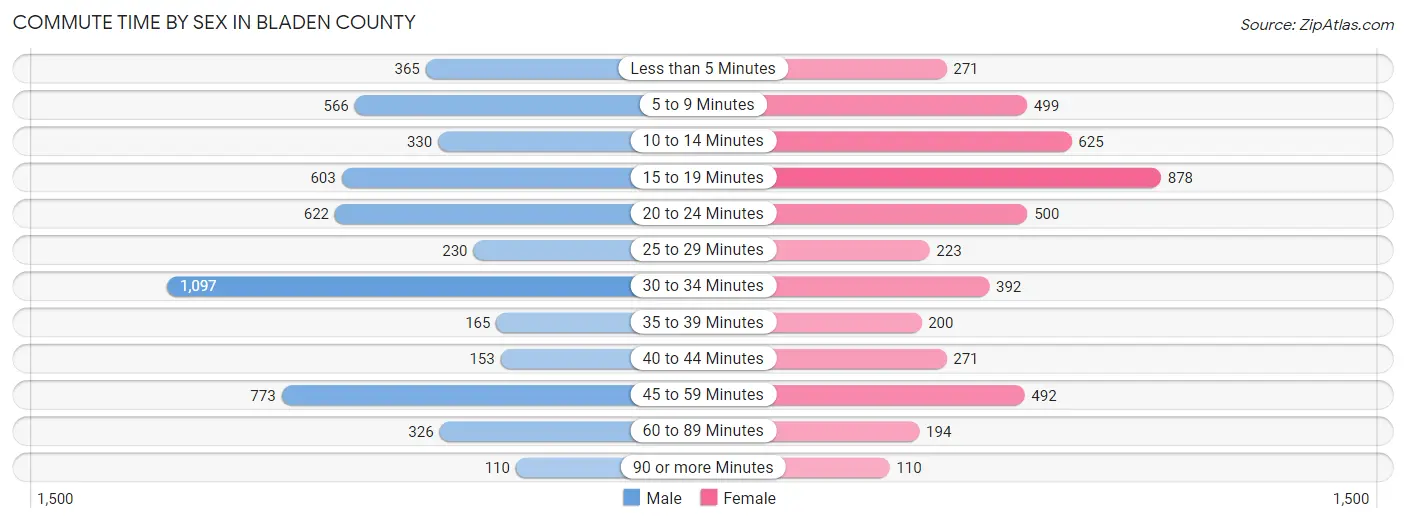
| Commute Time | Male | Female |
| Less than 5 Minutes | 365 (6.8%) | 271 (5.8%) |
| 5 to 9 Minutes | 566 (10.6%) | 499 (10.7%) |
| 10 to 14 Minutes | 330 (6.2%) | 625 (13.4%) |
| 15 to 19 Minutes | 603 (11.3%) | 878 (18.9%) |
| 20 to 24 Minutes | 622 (11.7%) | 500 (10.7%) |
| 25 to 29 Minutes | 230 (4.3%) | 223 (4.8%) |
| 30 to 34 Minutes | 1,097 (20.5%) | 392 (8.4%) |
| 35 to 39 Minutes | 165 (3.1%) | 200 (4.3%) |
| 40 to 44 Minutes | 153 (2.9%) | 271 (5.8%) |
| 45 to 59 Minutes | 773 (14.5%) | 492 (10.6%) |
| 60 to 89 Minutes | 326 (6.1%) | 194 (4.2%) |
| 90 or more Minutes | 110 (2.1%) | 110 (2.4%) |
Time of Departure to Work by Sex in Bladen County
The most frequent times of departure to work in Bladen County are 6:00 AM to 6:29 AM (859, 16.1%) for males and 7:30 AM to 7:59 AM (1,089, 23.4%) for females.
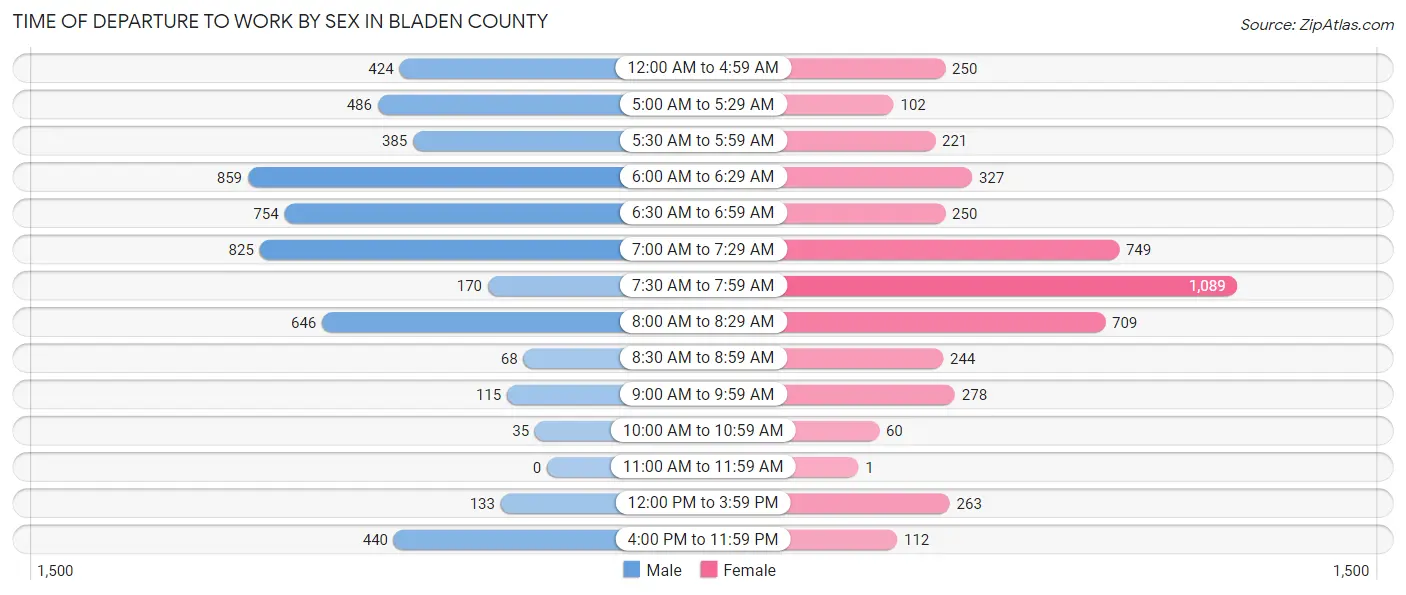
| Time of Departure | Male | Female |
| 12:00 AM to 4:59 AM | 424 (7.9%) | 250 (5.4%) |
| 5:00 AM to 5:29 AM | 486 (9.1%) | 102 (2.2%) |
| 5:30 AM to 5:59 AM | 385 (7.2%) | 221 (4.8%) |
| 6:00 AM to 6:29 AM | 859 (16.1%) | 327 (7.0%) |
| 6:30 AM to 6:59 AM | 754 (14.1%) | 250 (5.4%) |
| 7:00 AM to 7:29 AM | 825 (15.4%) | 749 (16.1%) |
| 7:30 AM to 7:59 AM | 170 (3.2%) | 1,089 (23.4%) |
| 8:00 AM to 8:29 AM | 646 (12.1%) | 709 (15.2%) |
| 8:30 AM to 8:59 AM | 68 (1.3%) | 244 (5.2%) |
| 9:00 AM to 9:59 AM | 115 (2.1%) | 278 (6.0%) |
| 10:00 AM to 10:59 AM | 35 (0.7%) | 60 (1.3%) |
| 11:00 AM to 11:59 AM | 0 (0.0%) | 1 (0.0%) |
| 12:00 PM to 3:59 PM | 133 (2.5%) | 263 (5.7%) |
| 4:00 PM to 11:59 PM | 440 (8.2%) | 112 (2.4%) |
| Total | 5,340 (100.0%) | 4,655 (100.0%) |
Housing Occupancy in Bladen County
Occupancy by Ownership in Bladen County
Of the total 11,386 dwellings in Bladen County, owner-occupied units account for 7,933 (69.7%), while renter-occupied units make up 3,453 (30.3%).
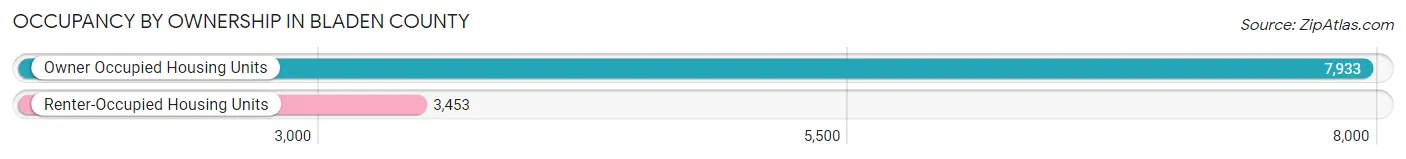
| Occupancy | # Housing Units | % Housing Units |
| Owner Occupied Housing Units | 7,933 | 69.7% |
| Renter-Occupied Housing Units | 3,453 | 30.3% |
| Total Occupied Housing Units | 11,386 | 100.0% |
Occupancy by Household Size in Bladen County
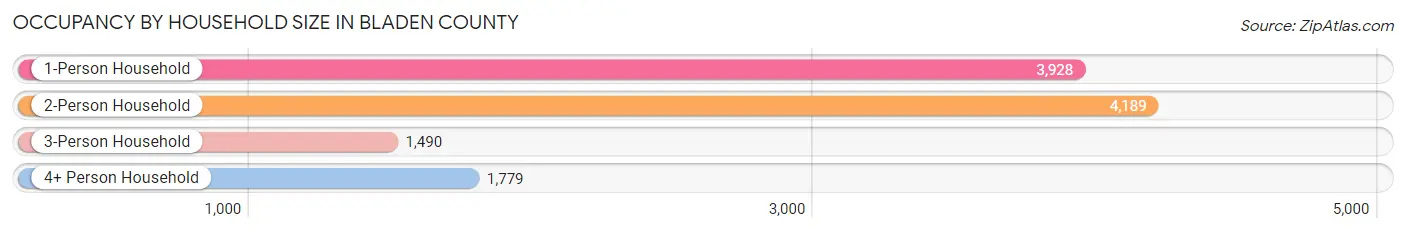
| Household Size | # Housing Units | % Housing Units |
| 1-Person Household | 3,928 | 34.5% |
| 2-Person Household | 4,189 | 36.8% |
| 3-Person Household | 1,490 | 13.1% |
| 4+ Person Household | 1,779 | 15.6% |
| Total Housing Units | 11,386 | 100.0% |
Occupancy by Ownership by Household Size in Bladen County
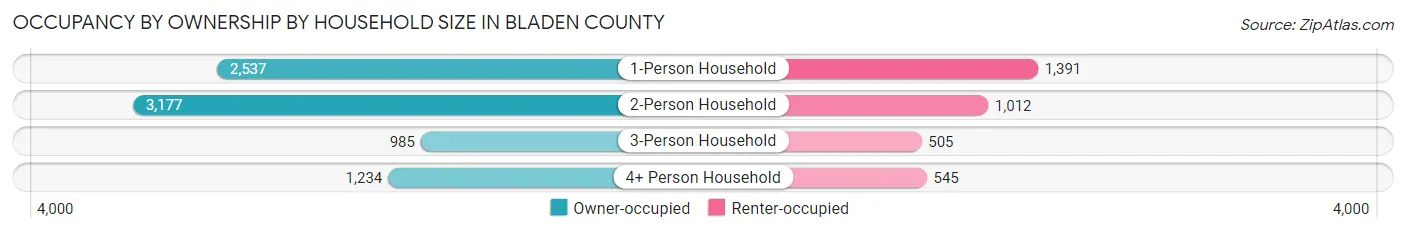
| Household Size | Owner-occupied | Renter-occupied |
| 1-Person Household | 2,537 (64.6%) | 1,391 (35.4%) |
| 2-Person Household | 3,177 (75.8%) | 1,012 (24.2%) |
| 3-Person Household | 985 (66.1%) | 505 (33.9%) |
| 4+ Person Household | 1,234 (69.4%) | 545 (30.6%) |
| Total Housing Units | 7,933 (69.7%) | 3,453 (30.3%) |
Occupancy by Educational Attainment in Bladen County
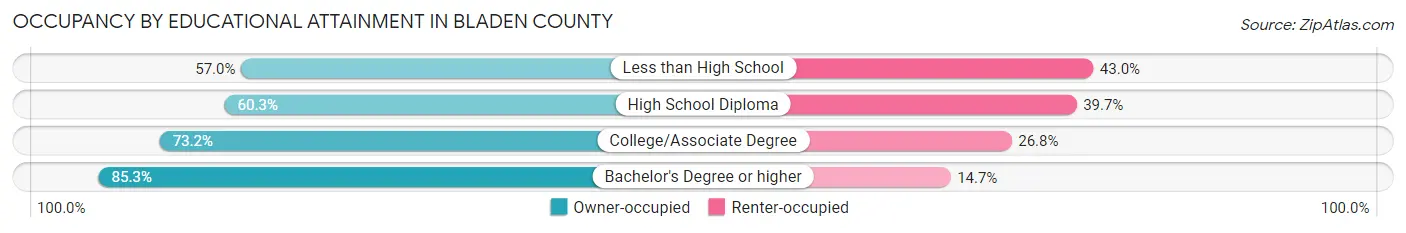
| Household Size | Owner-occupied | Renter-occupied |
| Less than High School | 669 (57.0%) | 504 (43.0%) |
| High School Diploma | 2,249 (60.3%) | 1,478 (39.7%) |
| College/Associate Degree | 3,137 (73.2%) | 1,148 (26.8%) |
| Bachelor's Degree or higher | 1,878 (85.3%) | 323 (14.7%) |
Occupancy by Age of Householder in Bladen County
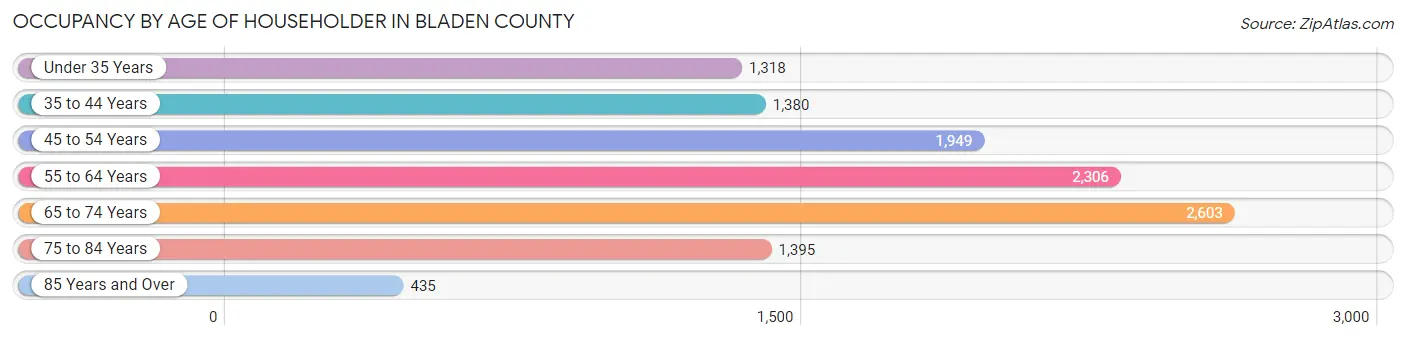
| Age Bracket | # Households | % Households |
| Under 35 Years | 1,318 | 11.6% |
| 35 to 44 Years | 1,380 | 12.1% |
| 45 to 54 Years | 1,949 | 17.1% |
| 55 to 64 Years | 2,306 | 20.3% |
| 65 to 74 Years | 2,603 | 22.9% |
| 75 to 84 Years | 1,395 | 12.2% |
| 85 Years and Over | 435 | 3.8% |
| Total | 11,386 | 100.0% |
Housing Finances in Bladen County
Median Income by Occupancy in Bladen County
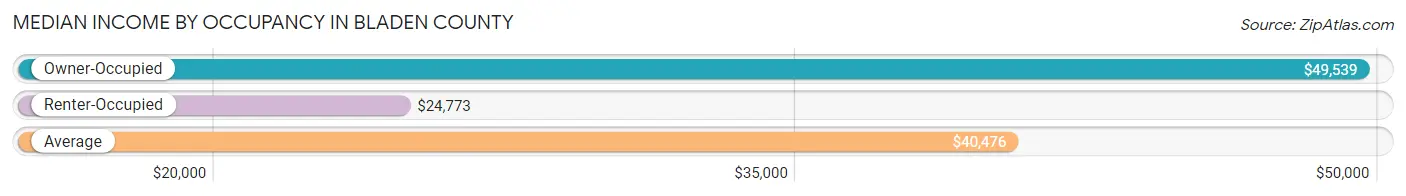
| Occupancy Type | # Households | Median Income |
| Owner-Occupied | 7,933 (69.7%) | $49,539 |
| Renter-Occupied | 3,453 (30.3%) | $24,773 |
| Average | 11,386 (100.0%) | $40,476 |
Occupancy by Householder Income Bracket in Bladen County
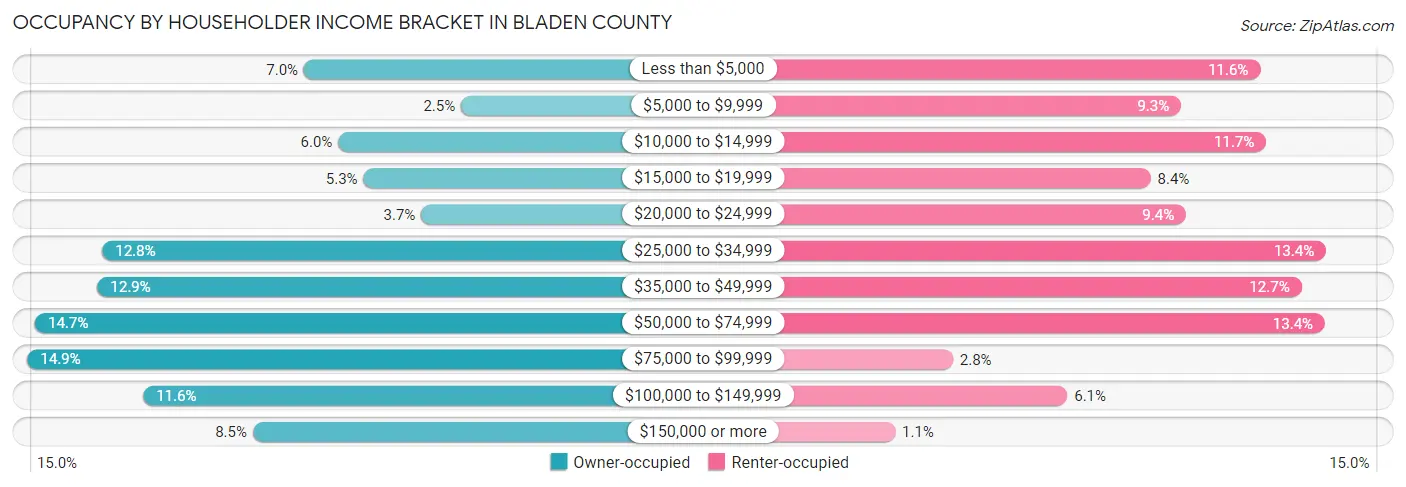
| Income Bracket | Owner-occupied | Renter-occupied |
| Less than $5,000 | 557 (7.0%) | 399 (11.6%) |
| $5,000 to $9,999 | 201 (2.5%) | 321 (9.3%) |
| $10,000 to $14,999 | 479 (6.0%) | 405 (11.7%) |
| $15,000 to $19,999 | 422 (5.3%) | 291 (8.4%) |
| $20,000 to $24,999 | 291 (3.7%) | 326 (9.4%) |
| $25,000 to $34,999 | 1,014 (12.8%) | 464 (13.4%) |
| $35,000 to $49,999 | 1,025 (12.9%) | 440 (12.7%) |
| $50,000 to $74,999 | 1,166 (14.7%) | 463 (13.4%) |
| $75,000 to $99,999 | 1,184 (14.9%) | 96 (2.8%) |
| $100,000 to $149,999 | 921 (11.6%) | 209 (6.0%) |
| $150,000 or more | 673 (8.5%) | 39 (1.1%) |
| Total | 7,933 (100.0%) | 3,453 (100.0%) |
Monthly Housing Cost Tiers in Bladen County
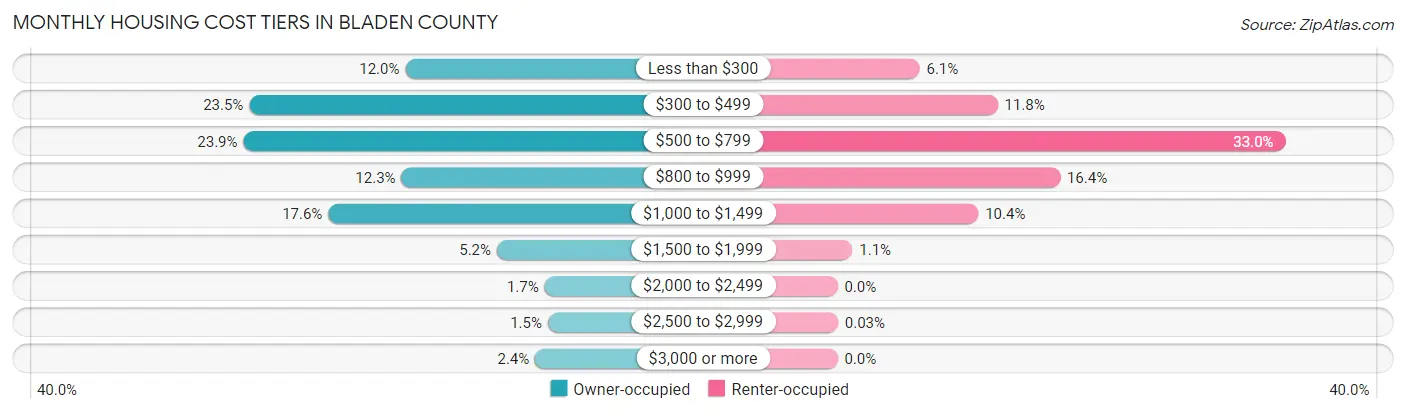
| Monthly Cost | Owner-occupied | Renter-occupied |
| Less than $300 | 949 (12.0%) | 209 (6.0%) |
| $300 to $499 | 1,861 (23.5%) | 407 (11.8%) |
| $500 to $799 | 1,895 (23.9%) | 1,139 (33.0%) |
| $800 to $999 | 972 (12.2%) | 566 (16.4%) |
| $1,000 to $1,499 | 1,399 (17.6%) | 358 (10.4%) |
| $1,500 to $1,999 | 414 (5.2%) | 38 (1.1%) |
| $2,000 to $2,499 | 136 (1.7%) | 0 (0.0%) |
| $2,500 to $2,999 | 117 (1.5%) | 1 (0.0%) |
| $3,000 or more | 190 (2.4%) | 0 (0.0%) |
| Total | 7,933 (100.0%) | 3,453 (100.0%) |
Physical Housing Characteristics in Bladen County
Housing Structures in Bladen County
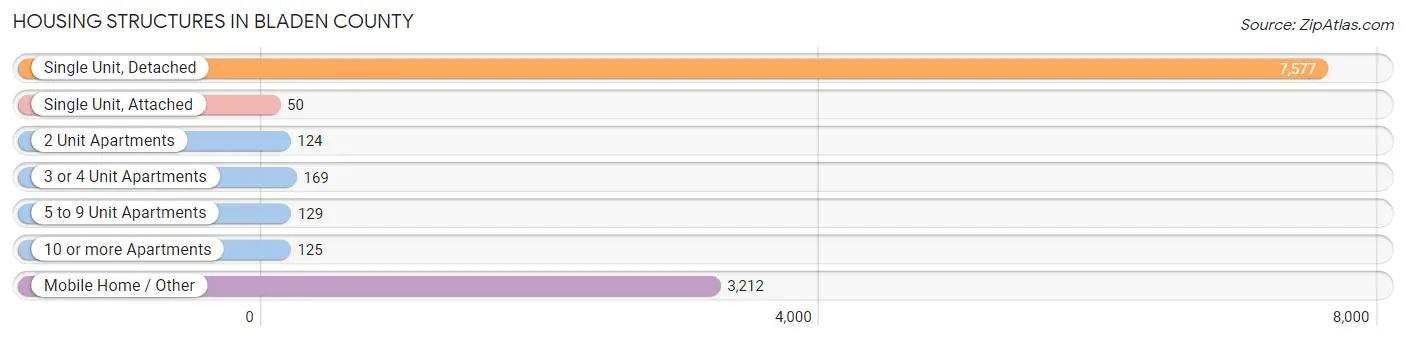
| Structure Type | # Housing Units | % Housing Units |
| Single Unit, Detached | 7,577 | 66.5% |
| Single Unit, Attached | 50 | 0.4% |
| 2 Unit Apartments | 124 | 1.1% |
| 3 or 4 Unit Apartments | 169 | 1.5% |
| 5 to 9 Unit Apartments | 129 | 1.1% |
| 10 or more Apartments | 125 | 1.1% |
| Mobile Home / Other | 3,212 | 28.2% |
| Total | 11,386 | 100.0% |
Housing Structures by Occupancy in Bladen County
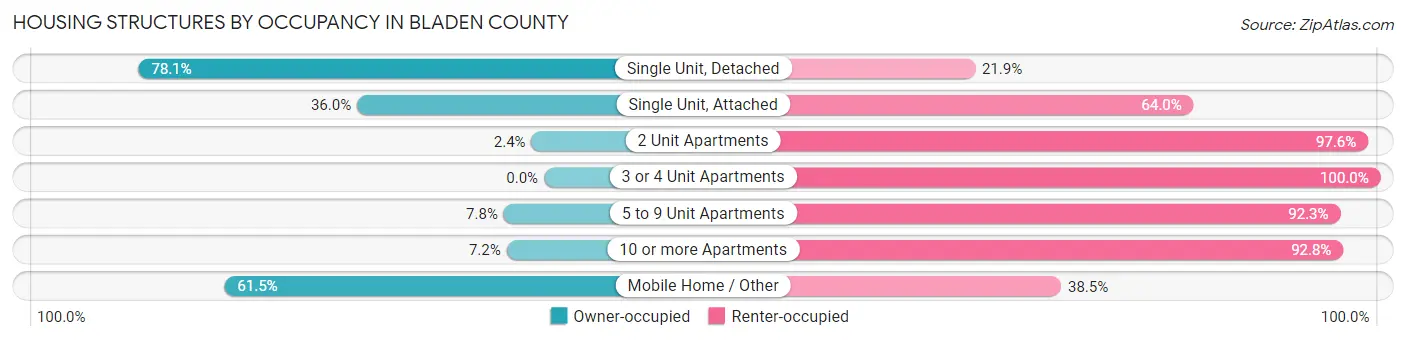
| Structure Type | Owner-occupied | Renter-occupied |
| Single Unit, Detached | 5,917 (78.1%) | 1,660 (21.9%) |
| Single Unit, Attached | 18 (36.0%) | 32 (64.0%) |
| 2 Unit Apartments | 3 (2.4%) | 121 (97.6%) |
| 3 or 4 Unit Apartments | 0 (0.0%) | 169 (100.0%) |
| 5 to 9 Unit Apartments | 10 (7.7%) | 119 (92.2%) |
| 10 or more Apartments | 9 (7.2%) | 116 (92.8%) |
| Mobile Home / Other | 1,976 (61.5%) | 1,236 (38.5%) |
| Total | 7,933 (69.7%) | 3,453 (30.3%) |
Housing Structures by Number of Rooms in Bladen County
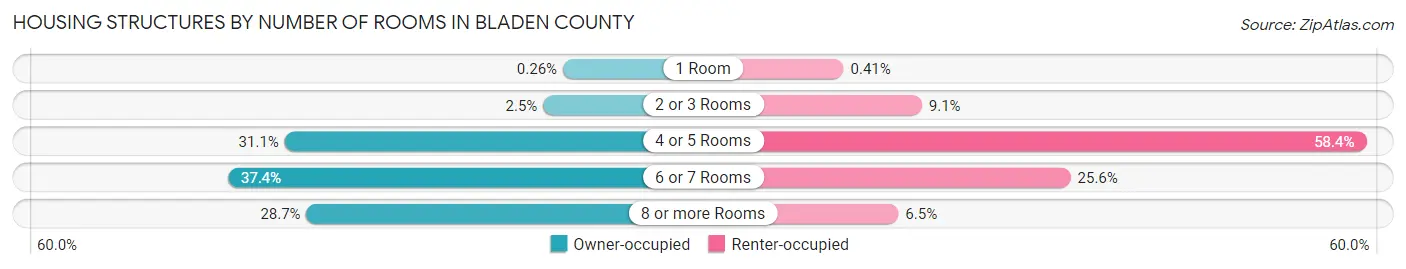
| Number of Rooms | Owner-occupied | Renter-occupied |
| 1 Room | 21 (0.3%) | 14 (0.4%) |
| 2 or 3 Rooms | 194 (2.5%) | 314 (9.1%) |
| 4 or 5 Rooms | 2,470 (31.1%) | 2,017 (58.4%) |
| 6 or 7 Rooms | 2,970 (37.4%) | 884 (25.6%) |
| 8 or more Rooms | 2,278 (28.7%) | 224 (6.5%) |
| Total | 7,933 (100.0%) | 3,453 (100.0%) |
Housing Structure by Heating Type in Bladen County
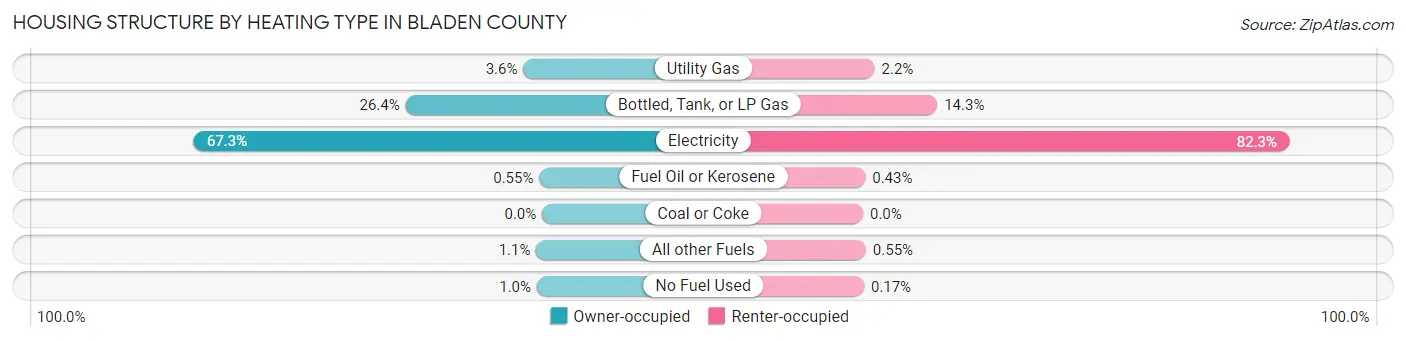
| Heating Type | Owner-occupied | Renter-occupied |
| Utility Gas | 288 (3.6%) | 77 (2.2%) |
| Bottled, Tank, or LP Gas | 2,093 (26.4%) | 495 (14.3%) |
| Electricity | 5,339 (67.3%) | 2,841 (82.3%) |
| Fuel Oil or Kerosene | 44 (0.5%) | 15 (0.4%) |
| Coal or Coke | 0 (0.0%) | 0 (0.0%) |
| All other Fuels | 89 (1.1%) | 19 (0.5%) |
| No Fuel Used | 80 (1.0%) | 6 (0.2%) |
| Total | 7,933 (100.0%) | 3,453 (100.0%) |
Household Vehicle Usage in Bladen County
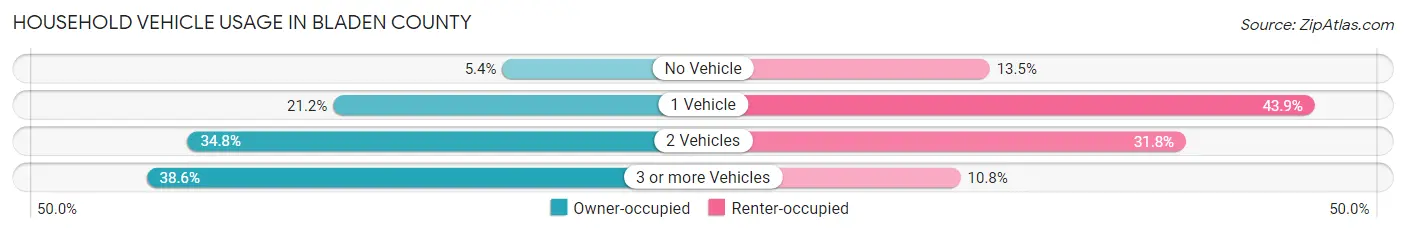
| Vehicles per Household | Owner-occupied | Renter-occupied |
| No Vehicle | 429 (5.4%) | 467 (13.5%) |
| 1 Vehicle | 1,682 (21.2%) | 1,514 (43.9%) |
| 2 Vehicles | 2,759 (34.8%) | 1,099 (31.8%) |
| 3 or more Vehicles | 3,063 (38.6%) | 373 (10.8%) |
| Total | 7,933 (100.0%) | 3,453 (100.0%) |
Real Estate & Mortgages in Bladen County
Real Estate and Mortgage Overview in Bladen County
| Characteristic | Without Mortgage | With Mortgage |
| Housing Units | 4,815 | 3,118 |
| Median Property Value | $100,700 | $147,400 |
| Median Household Income | $41,682 | $375 |
| Monthly Housing Costs | $450 | $190 |
| Real Estate Taxes | $954 | $27 |
Property Value by Mortgage Status in Bladen County
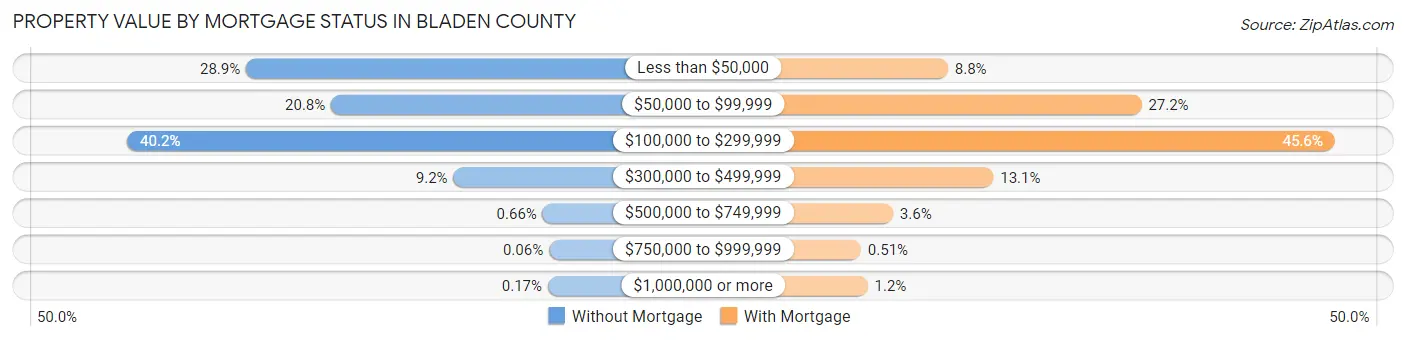
| Property Value | Without Mortgage | With Mortgage |
| Less than $50,000 | 1,392 (28.9%) | 274 (8.8%) |
| $50,000 to $99,999 | 1,002 (20.8%) | 849 (27.2%) |
| $100,000 to $299,999 | 1,937 (40.2%) | 1,423 (45.6%) |
| $300,000 to $499,999 | 441 (9.2%) | 409 (13.1%) |
| $500,000 to $749,999 | 32 (0.7%) | 111 (3.6%) |
| $750,000 to $999,999 | 3 (0.1%) | 16 (0.5%) |
| $1,000,000 or more | 8 (0.2%) | 36 (1.1%) |
| Total | 4,815 (100.0%) | 3,118 (100.0%) |
Household Income by Mortgage Status in Bladen County
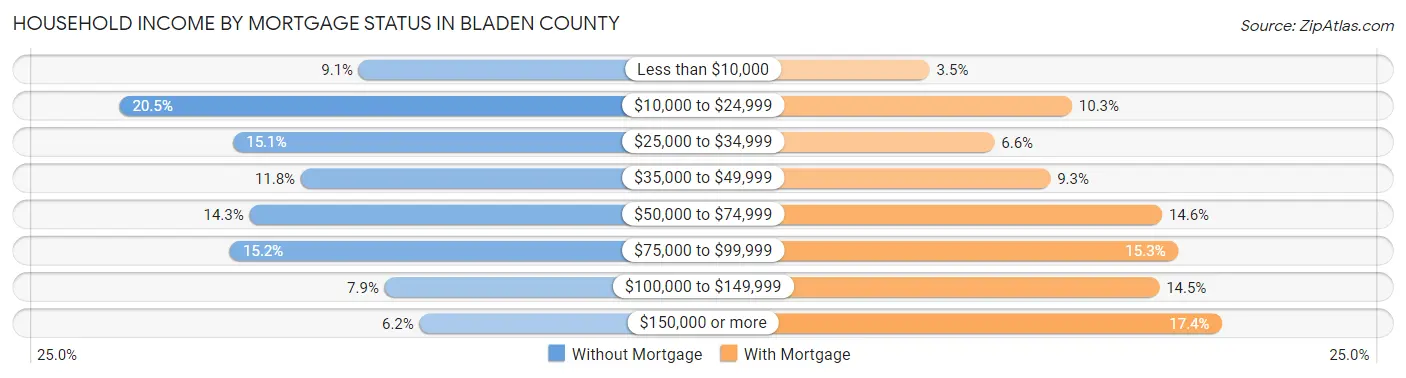
| Household Income | Without Mortgage | With Mortgage |
| Less than $10,000 | 437 (9.1%) | 110 (3.5%) |
| $10,000 to $24,999 | 986 (20.5%) | 321 (10.3%) |
| $25,000 to $34,999 | 725 (15.1%) | 206 (6.6%) |
| $35,000 to $49,999 | 570 (11.8%) | 289 (9.3%) |
| $50,000 to $74,999 | 688 (14.3%) | 455 (14.6%) |
| $75,000 to $99,999 | 733 (15.2%) | 478 (15.3%) |
| $100,000 to $149,999 | 378 (7.9%) | 451 (14.5%) |
| $150,000 or more | 298 (6.2%) | 543 (17.4%) |
| Total | 4,815 (100.0%) | 3,118 (100.0%) |
Property Value to Household Income Ratio in Bladen County
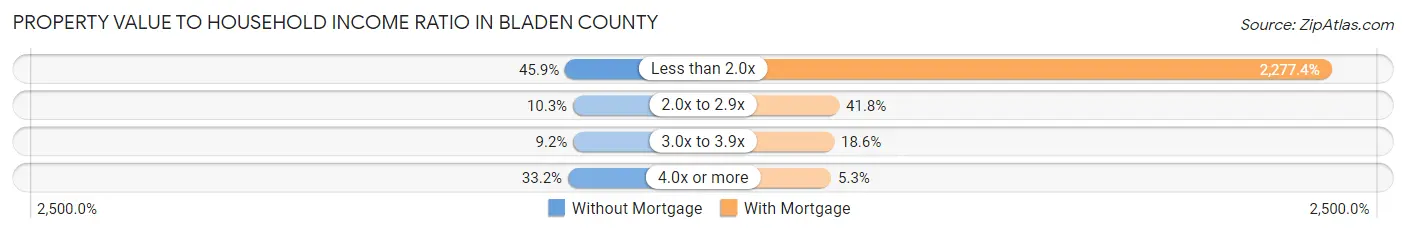
| Value-to-Income Ratio | Without Mortgage | With Mortgage |
| Less than 2.0x | 2,210 (45.9%) | 71,010 (2,277.4%) |
| 2.0x to 2.9x | 498 (10.3%) | 1,302 (41.8%) |
| 3.0x to 3.9x | 441 (9.2%) | 581 (18.6%) |
| 4.0x or more | 1,600 (33.2%) | 165 (5.3%) |
| Total | 4,815 (100.0%) | 3,118 (100.0%) |
Real Estate Taxes by Mortgage Status in Bladen County
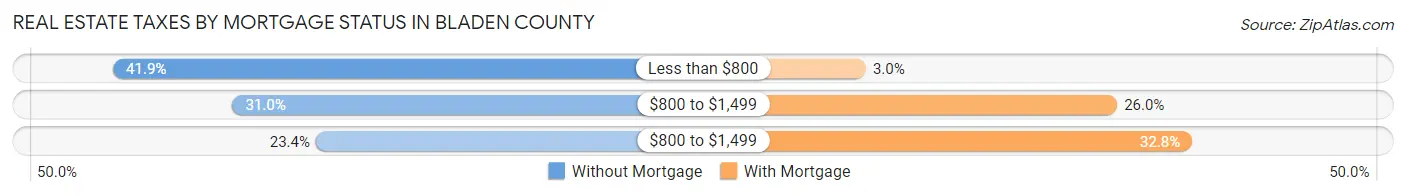
| Property Taxes | Without Mortgage | With Mortgage |
| Less than $800 | 2,018 (41.9%) | 94 (3.0%) |
| $800 to $1,499 | 1,493 (31.0%) | 809 (26.0%) |
| $800 to $1,499 | 1,127 (23.4%) | 1,022 (32.8%) |
| Total | 4,815 (100.0%) | 3,118 (100.0%) |
Health & Disability in Bladen County
Health Insurance Coverage by Age in Bladen County
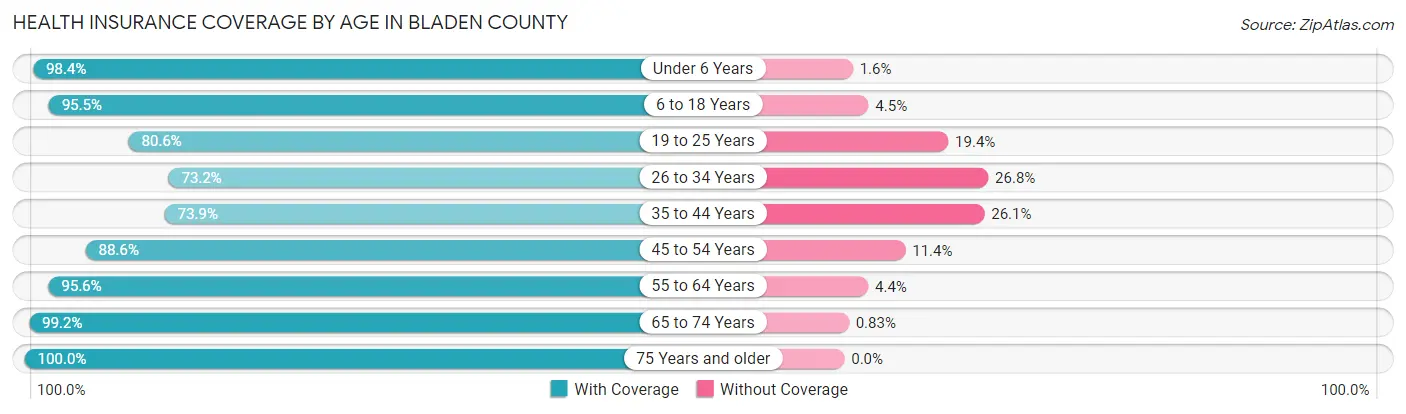
| Age Bracket | With Coverage | Without Coverage |
| Under 6 Years | 1,566 (98.4%) | 25 (1.6%) |
| 6 to 18 Years | 4,671 (95.5%) | 220 (4.5%) |
| 19 to 25 Years | 1,777 (80.6%) | 427 (19.4%) |
| 26 to 34 Years | 2,010 (73.2%) | 737 (26.8%) |
| 35 to 44 Years | 2,486 (73.9%) | 878 (26.1%) |
| 45 to 54 Years | 3,281 (88.6%) | 421 (11.4%) |
| 55 to 64 Years | 4,176 (95.6%) | 194 (4.4%) |
| 65 to 74 Years | 4,186 (99.2%) | 35 (0.8%) |
| 75 Years and older | 2,409 (100.0%) | 0 (0.0%) |
| Total | 26,562 (90.0%) | 2,937 (10.0%) |
Health Insurance Coverage by Citizenship Status in Bladen County
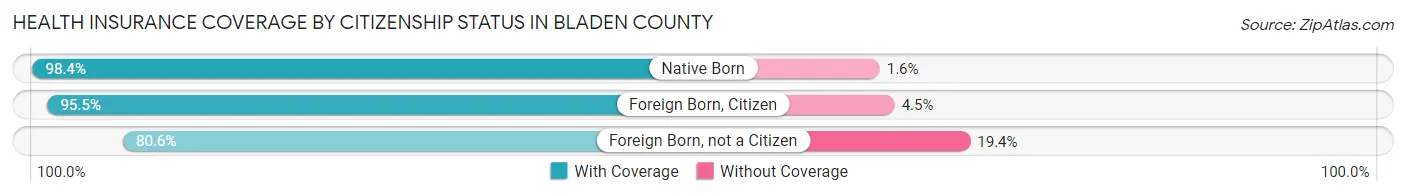
| Citizenship Status | With Coverage | Without Coverage |
| Native Born | 1,566 (98.4%) | 25 (1.6%) |
| Foreign Born, Citizen | 4,671 (95.5%) | 220 (4.5%) |
| Foreign Born, not a Citizen | 1,777 (80.6%) | 427 (19.4%) |
Health Insurance Coverage by Household Income in Bladen County
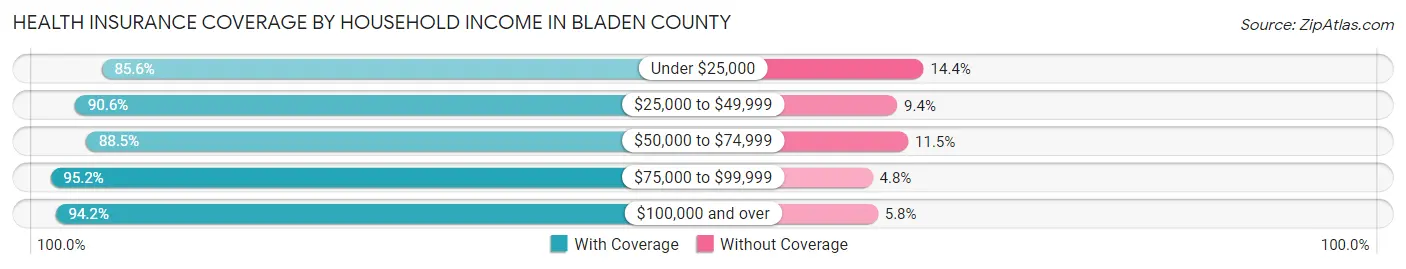
| Household Income | With Coverage | Without Coverage |
| Under $25,000 | 6,444 (85.6%) | 1,084 (14.4%) |
| $25,000 to $49,999 | 5,869 (90.6%) | 611 (9.4%) |
| $50,000 to $74,999 | 4,153 (88.5%) | 539 (11.5%) |
| $75,000 to $99,999 | 4,013 (95.2%) | 204 (4.8%) |
| $100,000 and over | 6,031 (94.2%) | 371 (5.8%) |
Public vs Private Health Insurance Coverage by Age in Bladen County
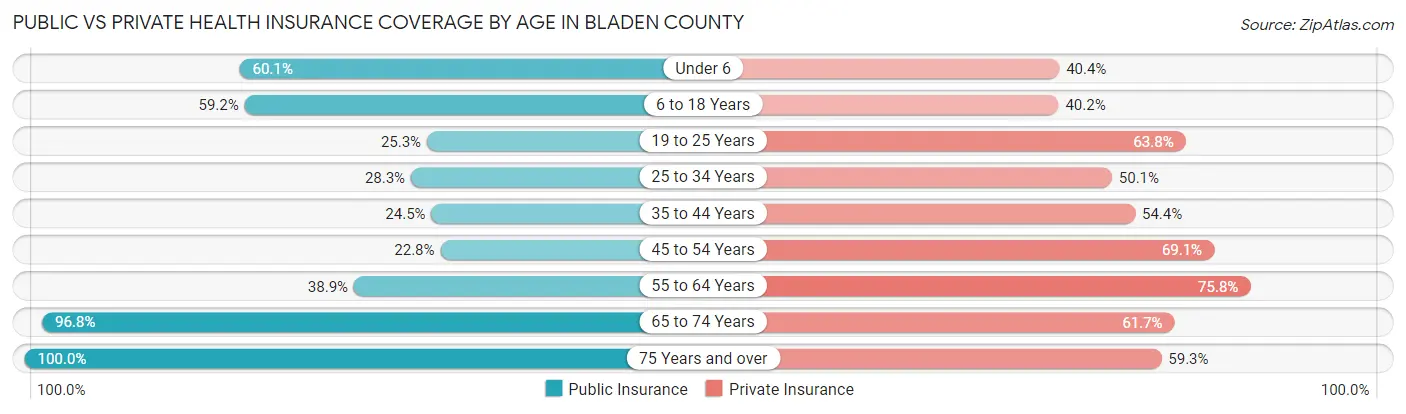
| Age Bracket | Public Insurance | Private Insurance |
| Under 6 | 956 (60.1%) | 642 (40.4%) |
| 6 to 18 Years | 2,894 (59.2%) | 1,967 (40.2%) |
| 19 to 25 Years | 558 (25.3%) | 1,406 (63.8%) |
| 25 to 34 Years | 777 (28.3%) | 1,377 (50.1%) |
| 35 to 44 Years | 824 (24.5%) | 1,831 (54.4%) |
| 45 to 54 Years | 845 (22.8%) | 2,557 (69.1%) |
| 55 to 64 Years | 1,699 (38.9%) | 3,312 (75.8%) |
| 65 to 74 Years | 4,084 (96.8%) | 2,606 (61.7%) |
| 75 Years and over | 2,409 (100.0%) | 1,429 (59.3%) |
| Total | 15,046 (51.0%) | 17,127 (58.1%) |
Disability Status by Sex by Age in Bladen County
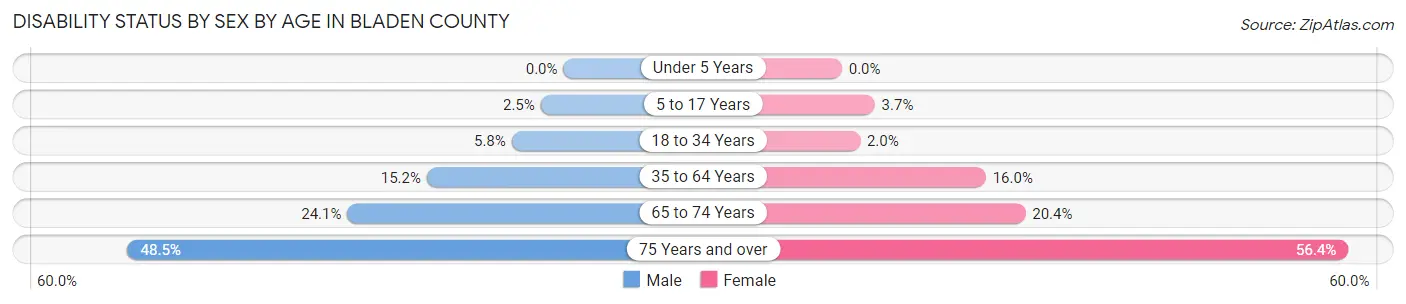
| Age Bracket | Male | Female |
| Under 5 Years | 0 (0.0%) | 0 (0.0%) |
| 5 to 17 Years | 60 (2.5%) | 84 (3.7%) |
| 18 to 34 Years | 160 (5.8%) | 53 (2.0%) |
| 35 to 64 Years | 799 (15.2%) | 991 (16.0%) |
| 65 to 74 Years | 513 (24.1%) | 427 (20.4%) |
| 75 Years and over | 410 (48.5%) | 882 (56.4%) |
Disability Class by Sex by Age in Bladen County
Disability Class: Hearing Difficulty
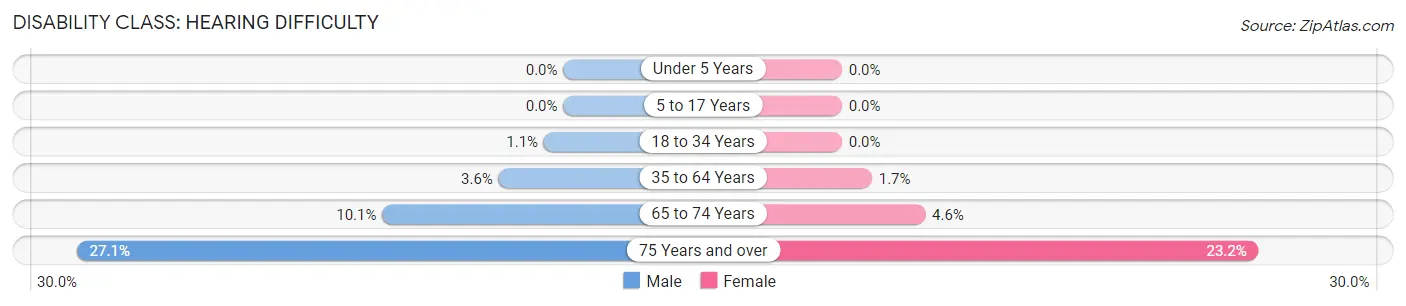
| Age Bracket | Male | Female |
| Under 5 Years | 0 (0.0%) | 0 (0.0%) |
| 5 to 17 Years | 0 (0.0%) | 0 (0.0%) |
| 18 to 34 Years | 30 (1.1%) | 0 (0.0%) |
| 35 to 64 Years | 189 (3.6%) | 103 (1.7%) |
| 65 to 74 Years | 215 (10.1%) | 97 (4.6%) |
| 75 Years and over | 229 (27.1%) | 363 (23.2%) |
Disability Class: Vision Difficulty
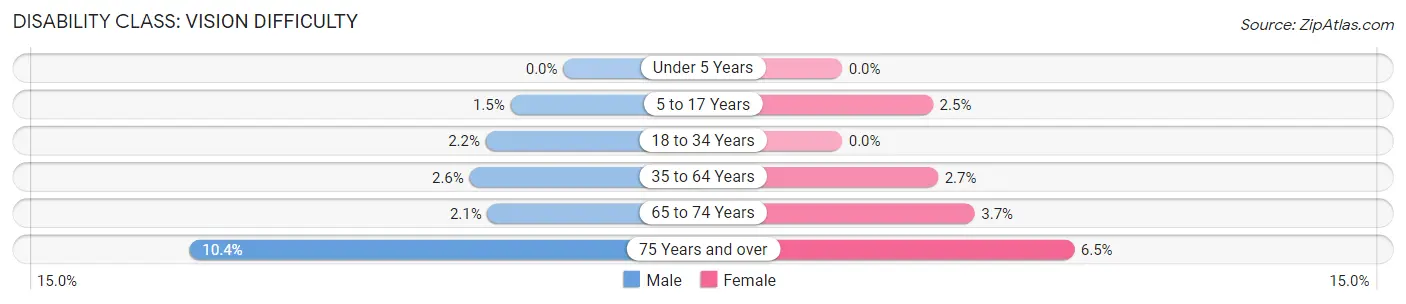
| Age Bracket | Male | Female |
| Under 5 Years | 0 (0.0%) | 0 (0.0%) |
| 5 to 17 Years | 35 (1.5%) | 58 (2.5%) |
| 18 to 34 Years | 60 (2.2%) | 0 (0.0%) |
| 35 to 64 Years | 137 (2.6%) | 165 (2.7%) |
| 65 to 74 Years | 45 (2.1%) | 77 (3.7%) |
| 75 Years and over | 88 (10.4%) | 101 (6.5%) |
Disability Class: Cognitive Difficulty
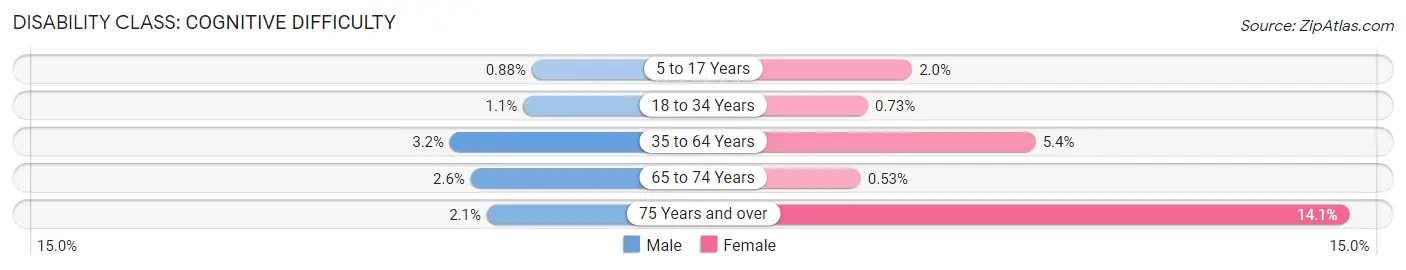
| Age Bracket | Male | Female |
| 5 to 17 Years | 21 (0.9%) | 45 (2.0%) |
| 18 to 34 Years | 31 (1.1%) | 19 (0.7%) |
| 35 to 64 Years | 166 (3.2%) | 334 (5.4%) |
| 65 to 74 Years | 55 (2.6%) | 11 (0.5%) |
| 75 Years and over | 18 (2.1%) | 221 (14.1%) |
Disability Class: Ambulatory Difficulty
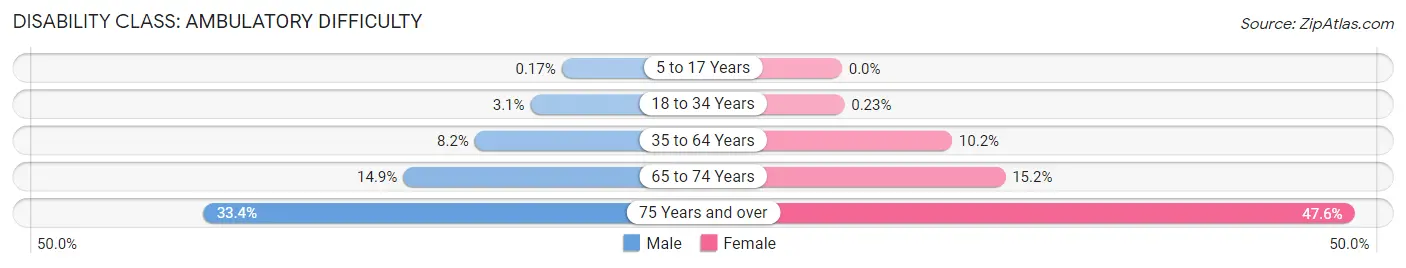
| Age Bracket | Male | Female |
| 5 to 17 Years | 4 (0.2%) | 0 (0.0%) |
| 18 to 34 Years | 85 (3.1%) | 6 (0.2%) |
| 35 to 64 Years | 432 (8.2%) | 632 (10.2%) |
| 65 to 74 Years | 317 (14.9%) | 317 (15.2%) |
| 75 Years and over | 282 (33.4%) | 744 (47.6%) |
Disability Class: Self-Care Difficulty

| Age Bracket | Male | Female |
| 5 to 17 Years | 4 (0.2%) | 0 (0.0%) |
| 18 to 34 Years | 46 (1.7%) | 0 (0.0%) |
| 35 to 64 Years | 114 (2.2%) | 118 (1.9%) |
| 65 to 74 Years | 120 (5.6%) | 45 (2.1%) |
| 75 Years and over | 55 (6.5%) | 278 (17.8%) |
Technology Access in Bladen County
Computing Device Access in Bladen County
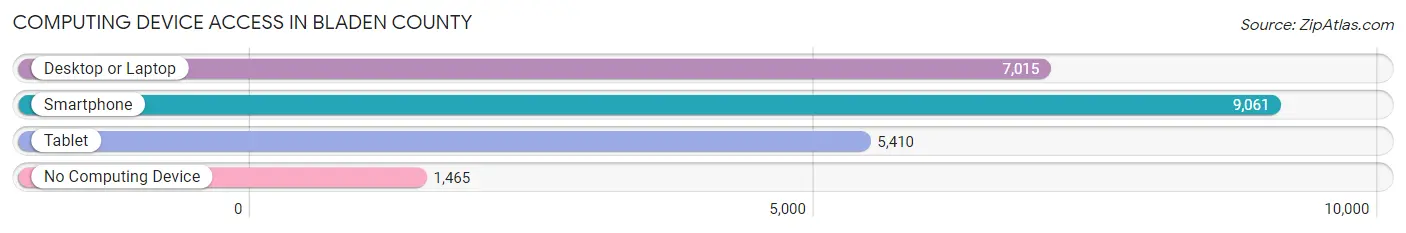
| Device Type | # Households | % Households |
| Desktop or Laptop | 7,015 | 61.6% |
| Smartphone | 9,061 | 79.6% |
| Tablet | 5,410 | 47.5% |
| No Computing Device | 1,465 | 12.9% |
| Total | 11,386 | 100.0% |
Internet Access in Bladen County
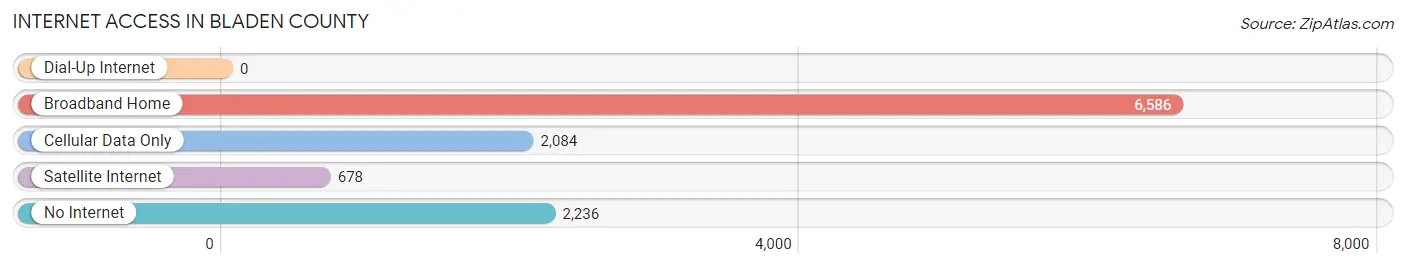
| Internet Type | # Households | % Households |
| Dial-Up Internet | 0 | 0.0% |
| Broadband Home | 6,586 | 57.8% |
| Cellular Data Only | 2,084 | 18.3% |
| Satellite Internet | 678 | 5.9% |
| No Internet | 2,236 | 19.6% |
| Total | 11,386 | 100.0% |
Bladen County Summary
Bladen County is located in the southeastern part of North Carolina, and is part of the Cape Fear region. It is bordered by Cumberland County to the north, Robeson County to the west, Columbus County to the south, and the Atlantic Ocean to the east. The county seat is Elizabethtown, and the largest city is Elizabethtown. The county was formed in 1734 from New Hanover County and named for Martin Bladen, a member of the Board of Trade and Plantations.
History
The area that is now Bladen County was originally inhabited by the Tuscarora and other Native American tribes. The first European settlers arrived in the area in the early 1700s, and the county was officially established in 1734. The county was named for Martin Bladen, a member of the Board of Trade and Plantations.
During the American Revolution, Bladen County was the site of several battles, including the Battle of Elizabethtown in 1781. After the war, the county experienced a period of growth and prosperity, with the development of the lumber and turpentine industries.
In the late 19th century, the county was the site of several lynchings, including the lynching of a black man named John Brown in 1891. The county also experienced a period of racial violence in the early 20th century, with several lynchings and other acts of violence against African Americans.
Geography
Bladen County is located in the southeastern part of North Carolina, and is part of the Cape Fear region. It is bordered by Cumberland County to the north, Robeson County to the west, Columbus County to the south, and the Atlantic Ocean to the east. The county has a total area of 545 square miles, of which 541 square miles is land and 4.2 square miles is water.
The terrain of Bladen County is mostly flat, with some rolling hills in the northern part of the county. The Cape Fear River forms the eastern border of the county, and the Black River forms the western border. The county is home to several state parks, including Jones Lake State Park and Singletary Lake State Park.
Economy
The economy of Bladen County is largely based on agriculture, with the county being one of the leading producers of tobacco in the state. Other major agricultural products include corn, soybeans, cotton, and peanuts. The county is also home to several manufacturing companies, including a paper mill and a furniture factory.
The county is also home to several military installations, including Fort Bragg and Pope Air Force Base. These installations provide a significant economic boost to the county, as well as providing employment opportunities for local residents.
Demographics
As of the 2010 census, Bladen County had a population of 35,190. The racial makeup of the county was 68.3% White, 25.2% African American, 0.5% Native American, 0.7% Asian, 0.1% Pacific Islander, 3.7% from other races, and 1.4% from two or more races. Hispanic or Latino of any race were 6.2% of the population.
The median income for a household in the county was $30,945, and the median income for a family was $37,945. The per capita income for the county was $16,845. About 19.2% of the population was below the poverty line.
Common Questions
What is the Total Population of Bladen County?
Total Population of Bladen County is 29,807.
What is the Total Male Population of Bladen County?
Total Male Population of Bladen County is 14,326.
What is the Total Female Population of Bladen County?
Total Female Population of Bladen County is 15,481.
What is the Ratio of Males per 100 Females in Bladen County?
There are 92.54 Males per 100 Females in Bladen County.
What is the Ratio of Females per 100 Males in Bladen County?
There are 108.06 Females per 100 Males in Bladen County.
What is the Median Population Age in Bladen County?
Median Population Age in Bladen County is 45.0 Years.
What is the Average Family Size in Bladen County
Average Family Size in Bladen County is 3.4 People.
What is the Average Household Size in Bladen County
Average Household Size in Bladen County is 2.6 People.
What is Per Capita Income in Bladen County?
Per Capita income in Bladen County is $26,544.
What is the Median Family Income in Bladen County?
Median Family Income in Bladen County is $54,679.
What is the Median Household income in Bladen County?
Median Household Income in Bladen County is $40,476.
What is Income or Wage Gap in Bladen County?
Income or Wage Gap in Bladen County is 14.0%.
Women in Bladen County earn 86.0 cents for every dollar earned by a man.
What is Family Income Deficit in Bladen County?
Family Income Deficit in Bladen County is $12,424.
Families that are below poverty line in Bladen County earn $12,424 less on average than the poverty threshold level.
What is Inequality or Gini Index in Bladen County?
Inequality or Gini Index in Bladen County is 0.53.
How Large is the Labor Force in Bladen County?
There are 11,610 People in the Labor Forcein in Bladen County.
What is the Percentage of People in the Labor Force in Bladen County?
47.7% of People are in the Labor Force in Bladen County.
What is the Unemployment Rate in Bladen County?
Unemployment Rate in Bladen County is 5.5%.