Avery County, NC
Avery County Map

Avery County Overview
17,679
TOTAL POPULATION
9,666
MALE POPULATION
8,013
FEMALE POPULATION
120.63
MALES / 100 FEMALES
82.90
FEMALES / 100 MALES
46.5
MEDIAN AGE
2.8
AVG FAMILY SIZE
2.3
AVG HOUSEHOLD SIZE
$30,578
PER CAPITA INCOME
$70,968
AVG FAMILY INCOME
$53,513
AVG HOUSEHOLD INCOME
14.6%
WAGE / INCOME GAP [ % ]
85.4¢/ $1
WAGE / INCOME GAP [ $ ]
$8,101
FAMILY INCOME DEFICIT
0.49
INEQUALITY / GINI INDEX
7,050
LABOR FORCE [ PEOPLE ]
45.3%
PERCENT IN LABOR FORCE
5.0%
UNEMPLOYMENT RATE
Avery County Area Codes
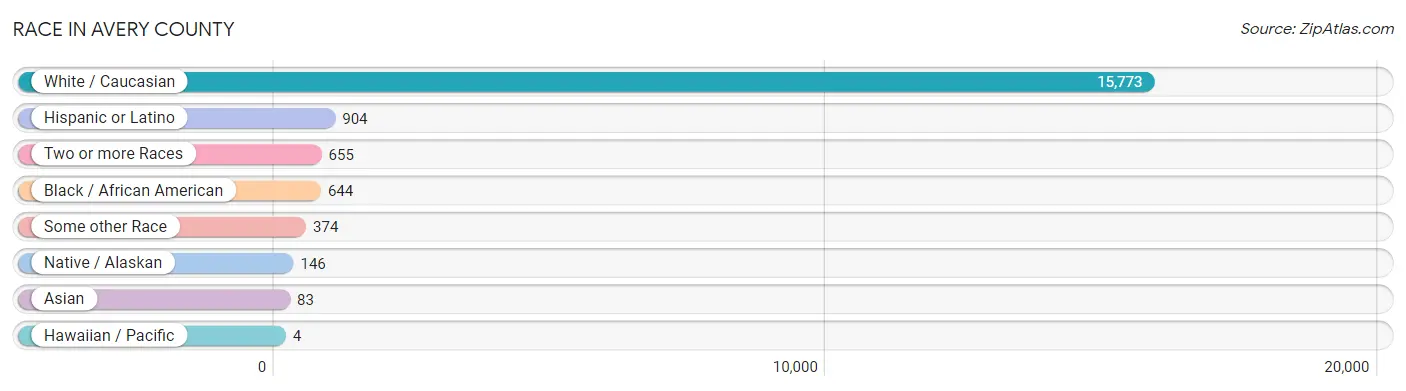
Race in Avery County
The most populous races in Avery County are White / Caucasian (15,773 | 89.2%), Hispanic or Latino (904 | 5.1%), and Two or more Races (655 | 3.7%).
| Race | # Population | % Population |
| Asian | 83 | 0.5% |
| Black / African American | 644 | 3.6% |
| Hawaiian / Pacific | 4 | 0.0% |
| Hispanic or Latino | 904 | 5.1% |
| Native / Alaskan | 146 | 0.8% |
| White / Caucasian | 15,773 | 89.2% |
| Two or more Races | 655 | 3.7% |
| Some other Race | 374 | 2.1% |
| Total | 17,679 | 100.0% |
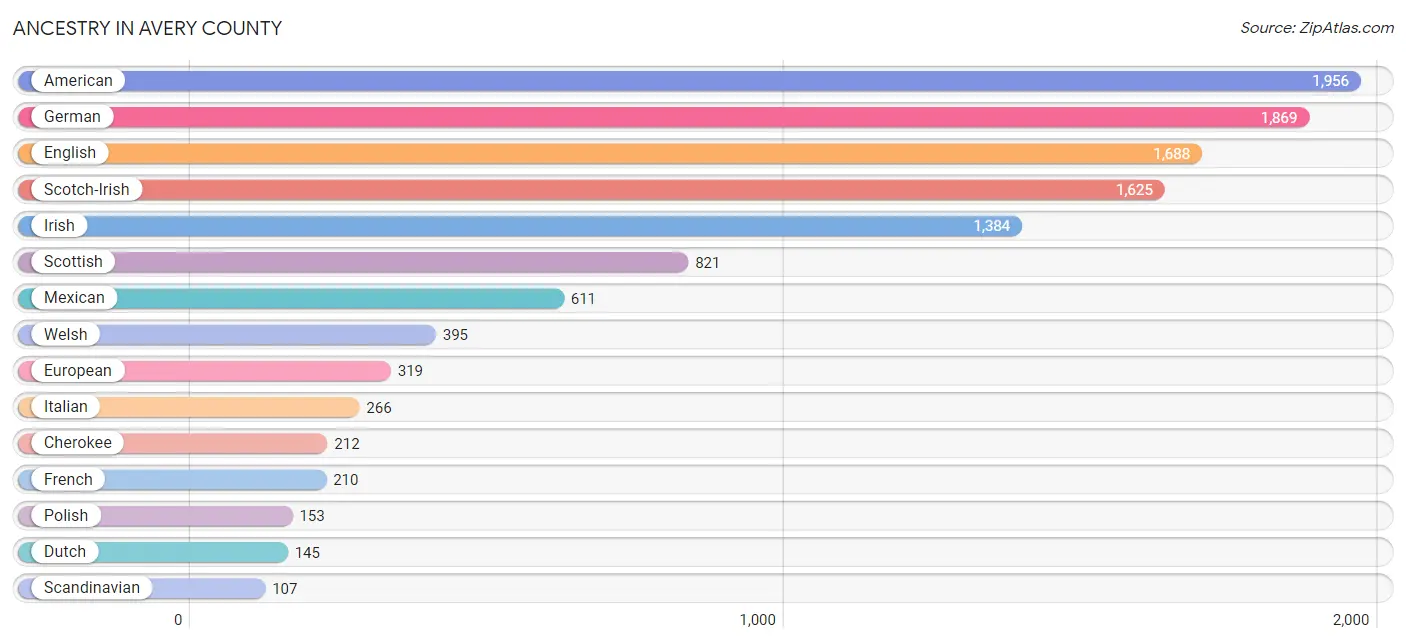
Ancestry in Avery County
The most populous ancestries reported in Avery County are American (1,956 | 11.1%), German (1,869 | 10.6%), English (1,688 | 9.6%), Scotch-Irish (1,625 | 9.2%), and Irish (1,384 | 7.8%), together accounting for 48.2% of all Avery County residents.
| Ancestry | # Population | % Population |
| African | 39 | 0.2% |
| Albanian | 5 | 0.0% |
| American | 1,956 | 11.1% |
| Arab | 14 | 0.1% |
| Austrian | 61 | 0.4% |
| Bhutanese | 25 | 0.1% |
| Blackfeet | 13 | 0.1% |
| British | 15 | 0.1% |
| Bulgarian | 23 | 0.1% |
| Burmese | 47 | 0.3% |
| Canadian | 61 | 0.4% |
| Central American | 51 | 0.3% |
| Central American Indian | 20 | 0.1% |
| Cherokee | 212 | 1.2% |
| Chippewa | 20 | 0.1% |
| Colombian | 2 | 0.0% |
| Costa Rican | 18 | 0.1% |
| Cuban | 90 | 0.5% |
| Czech | 1 | 0.0% |
| Danish | 9 | 0.1% |
| Dominican | 13 | 0.1% |
| Dutch | 145 | 0.8% |
| Dutch West Indian | 32 | 0.2% |
| Eastern European | 9 | 0.1% |
| English | 1,688 | 9.6% |
| Estonian | 4 | 0.0% |
| European | 319 | 1.8% |
| Finnish | 47 | 0.3% |
| French | 210 | 1.2% |
| French Canadian | 7 | 0.0% |
| German | 1,869 | 10.6% |
| Greek | 21 | 0.1% |
| Guatemalan | 1 | 0.0% |
| Haitian | 14 | 0.1% |
| Hungarian | 20 | 0.1% |
| Icelander | 2 | 0.0% |
| Indian (Asian) | 5 | 0.0% |
| Iranian | 4 | 0.0% |
| Irish | 1,384 | 7.8% |
| Italian | 266 | 1.5% |
| Korean | 23 | 0.1% |
| Laotian | 5 | 0.0% |
| Lebanese | 14 | 0.1% |
| Lithuanian | 8 | 0.1% |
| Lumbee | 25 | 0.1% |
| Malaysian | 3 | 0.0% |
| Mexican | 611 | 3.5% |
| Native Hawaiian | 4 | 0.0% |
| Navajo | 4 | 0.0% |
| Nigerian | 2 | 0.0% |
| Northern European | 46 | 0.3% |
| Norwegian | 55 | 0.3% |
| Panamanian | 12 | 0.1% |
| Polish | 153 | 0.9% |
| Portuguese | 50 | 0.3% |
| Puerto Rican | 85 | 0.5% |
| Russian | 62 | 0.4% |
| Salvadoran | 20 | 0.1% |
| Scandinavian | 107 | 0.6% |
| Scotch-Irish | 1,625 | 9.2% |
| Scottish | 821 | 4.6% |
| Sioux | 16 | 0.1% |
| Slavic | 13 | 0.1% |
| Slovak | 17 | 0.1% |
| Somali | 7 | 0.0% |
| South American | 7 | 0.0% |
| Spaniard | 23 | 0.1% |
| Spanish | 3 | 0.0% |
| Subsaharan African | 48 | 0.3% |
| Swedish | 67 | 0.4% |
| Swiss | 22 | 0.1% |
| Thai | 13 | 0.1% |
| Turkish | 11 | 0.1% |
| Ukrainian | 15 | 0.1% |
| Venezuelan | 5 | 0.0% |
| Welsh | 395 | 2.2% | View All 76 Rows |
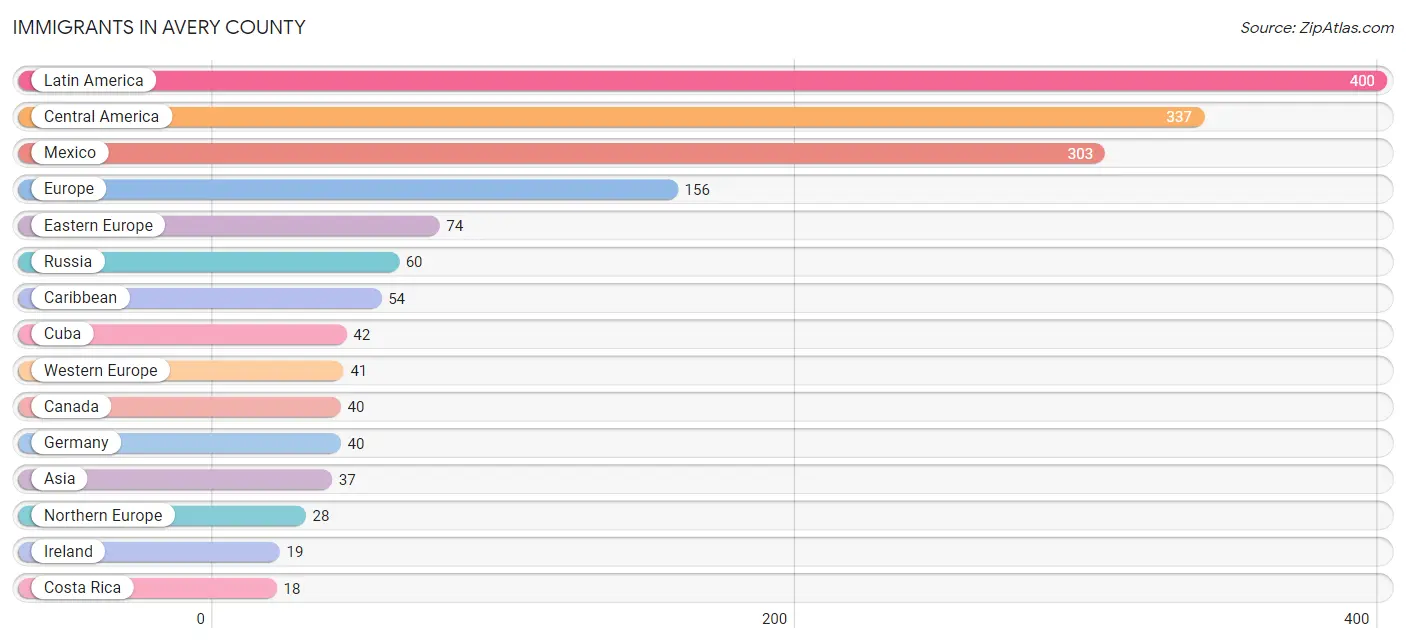
Immigrants in Avery County
The most numerous immigrant groups reported in Avery County came from Latin America (400 | 2.3%), Central America (337 | 1.9%), Mexico (303 | 1.7%), Europe (156 | 0.9%), and Eastern Europe (74 | 0.4%), together accounting for 7.2% of all Avery County residents.
| Immigration Origin | # Population | % Population |
| Africa | 9 | 0.1% |
| Asia | 37 | 0.2% |
| Austria | 1 | 0.0% |
| Canada | 40 | 0.2% |
| Caribbean | 54 | 0.3% |
| Central America | 337 | 1.9% |
| Costa Rica | 18 | 0.1% |
| Cuba | 42 | 0.2% |
| Eastern Africa | 7 | 0.0% |
| Eastern Asia | 12 | 0.1% |
| Eastern Europe | 74 | 0.4% |
| El Salvador | 6 | 0.0% |
| England | 2 | 0.0% |
| Europe | 156 | 0.9% |
| Germany | 40 | 0.2% |
| Greece | 4 | 0.0% |
| Guatemala | 1 | 0.0% |
| Honduras | 9 | 0.1% |
| Hungary | 1 | 0.0% |
| India | 3 | 0.0% |
| Iran | 7 | 0.0% |
| Ireland | 19 | 0.1% |
| Italy | 3 | 0.0% |
| Jamaica | 12 | 0.1% |
| Japan | 9 | 0.1% |
| Kenya | 7 | 0.0% |
| Korea | 3 | 0.0% |
| Latin America | 400 | 2.3% |
| Mexico | 303 | 1.7% |
| Micronesia | 10 | 0.1% |
| Nigeria | 2 | 0.0% |
| Northern Europe | 28 | 0.2% |
| Norway | 5 | 0.0% |
| Oceania | 10 | 0.1% |
| Philippines | 15 | 0.1% |
| Russia | 60 | 0.3% |
| South America | 9 | 0.1% |
| South Central Asia | 10 | 0.1% |
| South Eastern Asia | 15 | 0.1% |
| Southern Europe | 7 | 0.0% |
| Venezuela | 9 | 0.1% |
| Western Africa | 2 | 0.0% |
| Western Europe | 41 | 0.2% | View All 43 Rows |
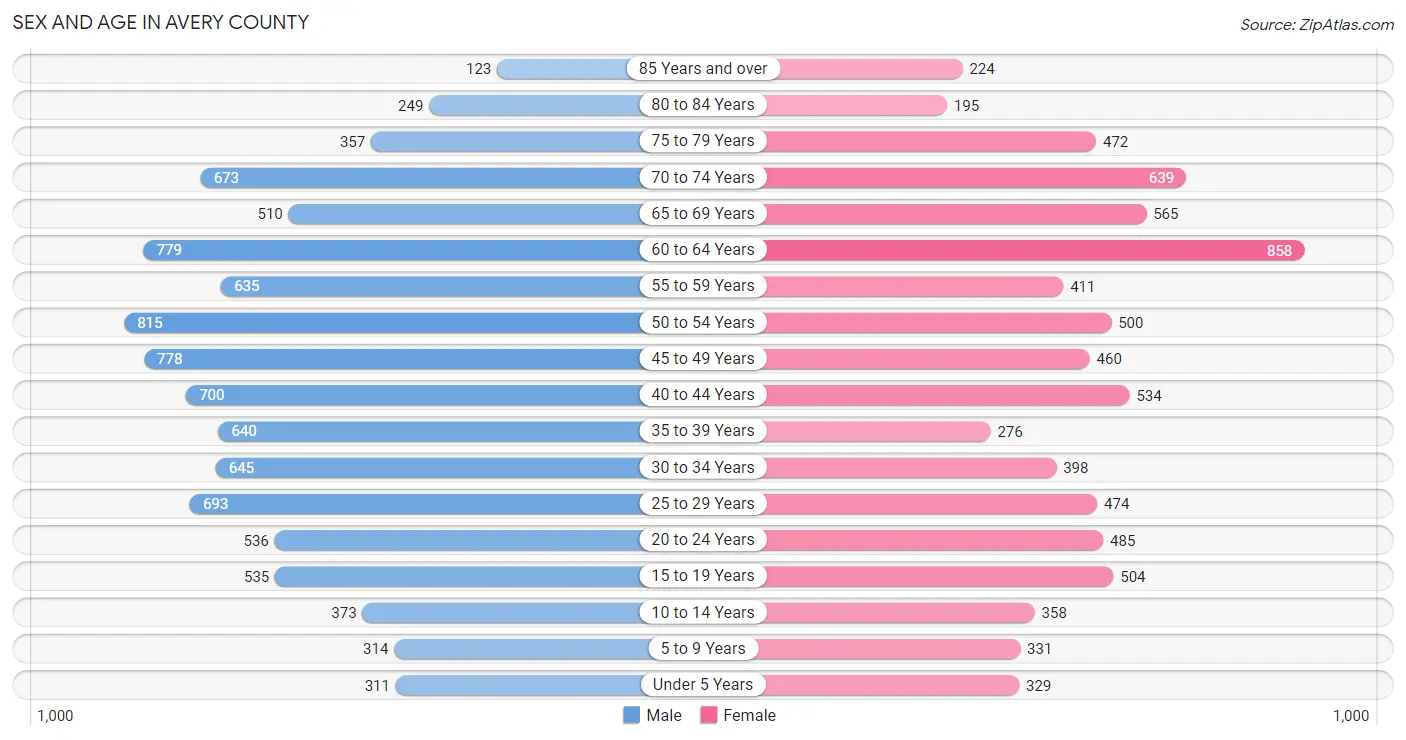
Sex and Age in Avery County
Sex and Age in Avery County
The most populous age groups in Avery County are 50 to 54 Years (815 | 8.4%) for men and 60 to 64 Years (858 | 10.7%) for women.
| Age Bracket | Male | Female |
| Under 5 Years | 311 (3.2%) | 329 (4.1%) |
| 5 to 9 Years | 314 (3.3%) | 331 (4.1%) |
| 10 to 14 Years | 373 (3.9%) | 358 (4.5%) |
| 15 to 19 Years | 535 (5.5%) | 504 (6.3%) |
| 20 to 24 Years | 536 (5.6%) | 485 (6.0%) |
| 25 to 29 Years | 693 (7.2%) | 474 (5.9%) |
| 30 to 34 Years | 645 (6.7%) | 398 (5.0%) |
| 35 to 39 Years | 640 (6.6%) | 276 (3.4%) |
| 40 to 44 Years | 700 (7.2%) | 534 (6.7%) |
| 45 to 49 Years | 778 (8.1%) | 460 (5.7%) |
| 50 to 54 Years | 815 (8.4%) | 500 (6.2%) |
| 55 to 59 Years | 635 (6.6%) | 411 (5.1%) |
| 60 to 64 Years | 779 (8.1%) | 858 (10.7%) |
| 65 to 69 Years | 510 (5.3%) | 565 (7.0%) |
| 70 to 74 Years | 673 (7.0%) | 639 (8.0%) |
| 75 to 79 Years | 357 (3.7%) | 472 (5.9%) |
| 80 to 84 Years | 249 (2.6%) | 195 (2.4%) |
| 85 Years and over | 123 (1.3%) | 224 (2.8%) |
| Total | 9,666 (100.0%) | 8,013 (100.0%) |
Families and Households in Avery County
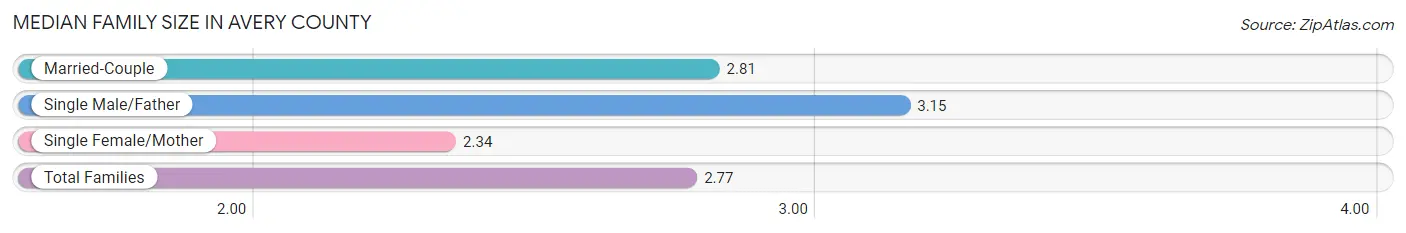
Median Family Size in Avery County
The median family size in Avery County is 2.77 persons per family, with single male/father families (220 | 5.0%) accounting for the largest median family size of 3.15 persons per family. On the other hand, single female/mother families (553 | 12.7%) represent the smallest median family size with 2.34 persons per family.
| Family Type | # Families | Family Size |
| Married-Couple | 3,593 (82.3%) | 2.81 |
| Single Male/Father | 220 (5.0%) | 3.15 |
| Single Female/Mother | 553 (12.7%) | 2.34 |
| Total Families | 4,366 (100.0%) | 2.77 |
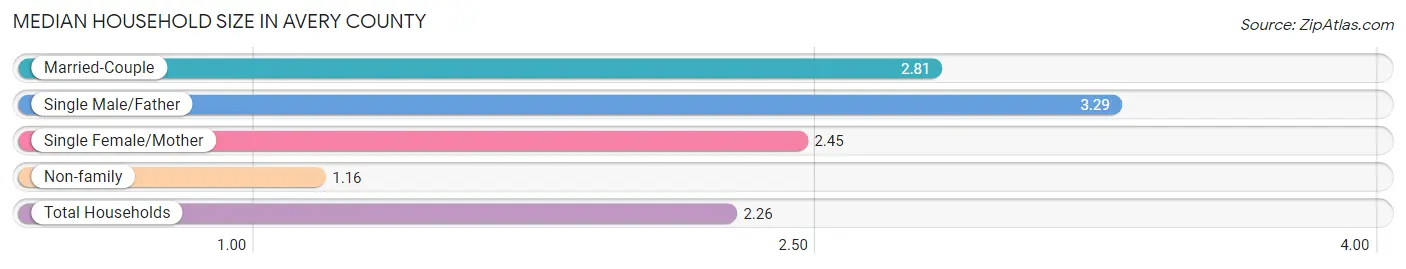
Median Household Size in Avery County
The median household size in Avery County is 2.26 persons per household, with single male/father households (220 | 3.4%) accounting for the largest median household size of 3.29 persons per household. non-family households (2,115 | 32.6%) represent the smallest median household size with 1.16 persons per household.
| Household Type | # Households | Household Size |
| Married-Couple | 3,593 (55.4%) | 2.81 |
| Single Male/Father | 220 (3.4%) | 3.29 |
| Single Female/Mother | 553 (8.5%) | 2.45 |
| Non-family | 2,115 (32.6%) | 1.16 |
| Total Households | 6,481 (100.0%) | 2.26 |
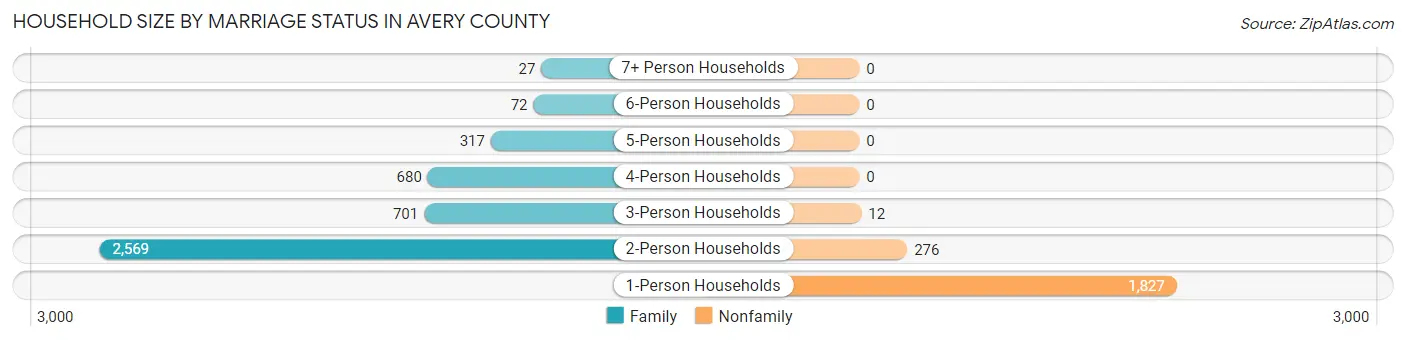
Household Size by Marriage Status in Avery County
Out of a total of 6,481 households in Avery County, 4,366 (67.4%) are family households, while 2,115 (32.6%) are nonfamily households. The most numerous type of family households are 2-person households, comprising 2,569, and the most common type of nonfamily households are 1-person households, comprising 1,827.
| Household Size | Family Households | Nonfamily Households |
| 1-Person Households | - | 1,827 (28.2%) |
| 2-Person Households | 2,569 (39.6%) | 276 (4.3%) |
| 3-Person Households | 701 (10.8%) | 12 (0.2%) |
| 4-Person Households | 680 (10.5%) | 0 (0.0%) |
| 5-Person Households | 317 (4.9%) | 0 (0.0%) |
| 6-Person Households | 72 (1.1%) | 0 (0.0%) |
| 7+ Person Households | 27 (0.4%) | 0 (0.0%) |
| Total | 4,366 (67.4%) | 2,115 (32.6%) |
Female Fertility in Avery County
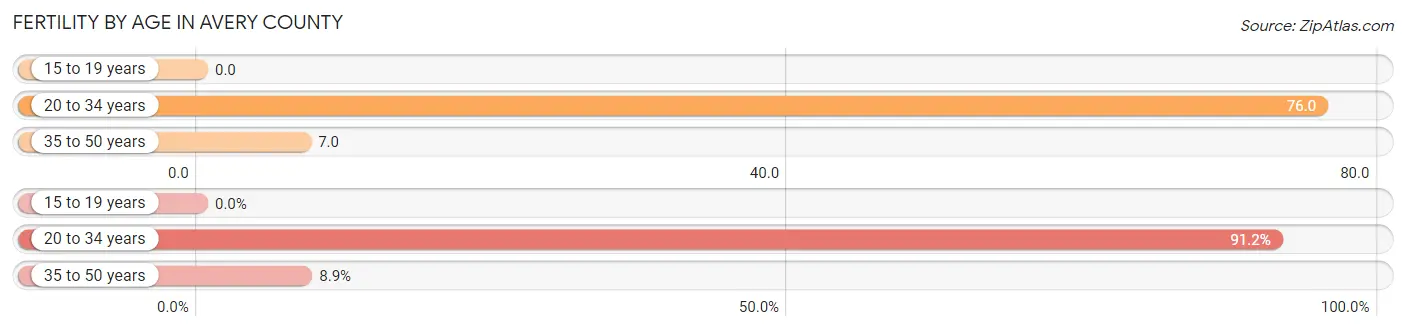
Fertility by Age in Avery County
Average fertility rate in Avery County is 34.0 births per 1,000 women. Women in the age bracket of 20 to 34 years have the highest fertility rate with 76.0 births per 1,000 women. Women in the age bracket of 20 to 34 years acount for 91.1% of all women with births.
| Age Bracket | Women with Births | Births / 1,000 Women |
| 15 to 19 years | 0 (0.0%) | 0.0 |
| 20 to 34 years | 103 (91.1%) | 76.0 |
| 35 to 50 years | 10 (8.8%) | 7.0 |
| Total | 113 (100.0%) | 34.0 |
Fertility by Age by Marriage Status in Avery County
91.2% of women with births (113) in Avery County are married. The highest percentage of unmarried women with births falls into 35 to 50 years age bracket with 100.0% of them unmarried at the time of birth, while the lowest percentage of unmarried women with births belong to 20 to 34 years age bracket with 0.0% of them unmarried.
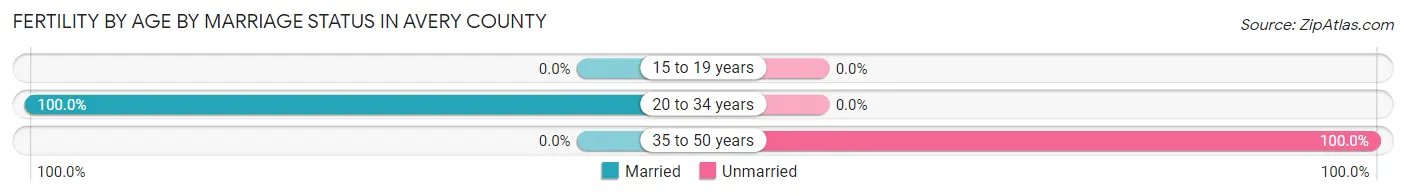
| Age Bracket | Married | Unmarried |
| 15 to 19 years | 0 (0.0%) | 0 (0.0%) |
| 20 to 34 years | 103 (100.0%) | 0 (0.0%) |
| 35 to 50 years | 0 (0.0%) | 10 (100.0%) |
| Total | 103 (91.1%) | 10 (8.8%) |
Fertility by Education in Avery County
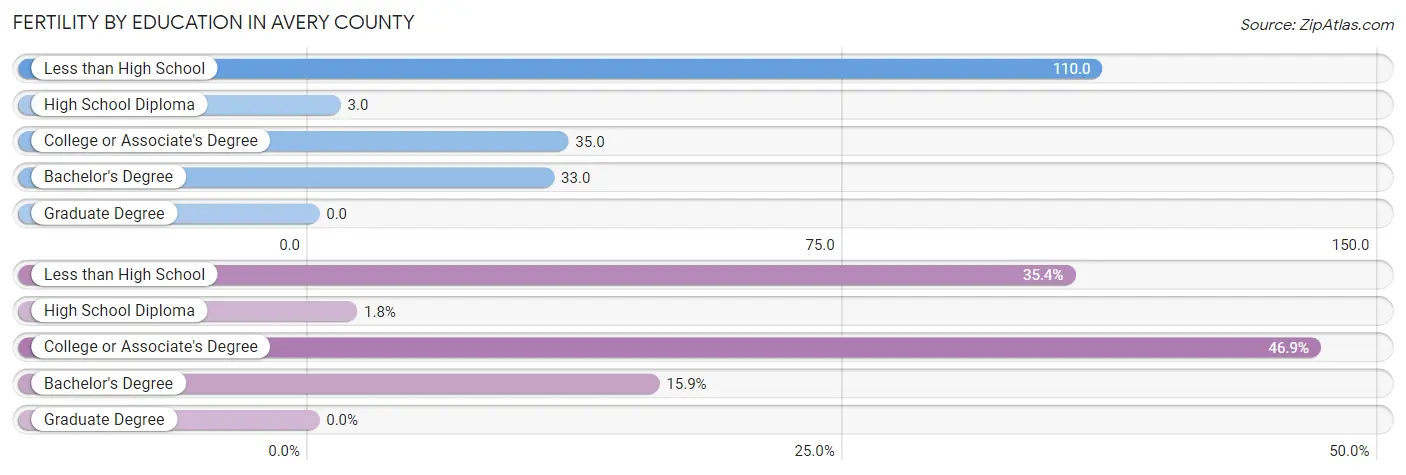
| Educational Attainment | Women with Births | Births / 1,000 Women |
| Less than High School | 40 (35.4%) | 110.0 |
| High School Diploma | 2 (1.8%) | 3.0 |
| College or Associate's Degree | 53 (46.9%) | 35.0 |
| Bachelor's Degree | 18 (15.9%) | 33.0 |
| Graduate Degree | 0 (0.0%) | 0.0 |
| Total | 113 (100.0%) | 34.0 |
Fertility by Education by Marriage Status in Avery County
8.8% of women with births in Avery County are unmarried. Women with the educational attainment of less than high school are most likely to be married with 100.0% of them married at childbirth, while women with the educational attainment of college or associate's degree are least likely to be married with 18.9% of them unmarried at childbirth.
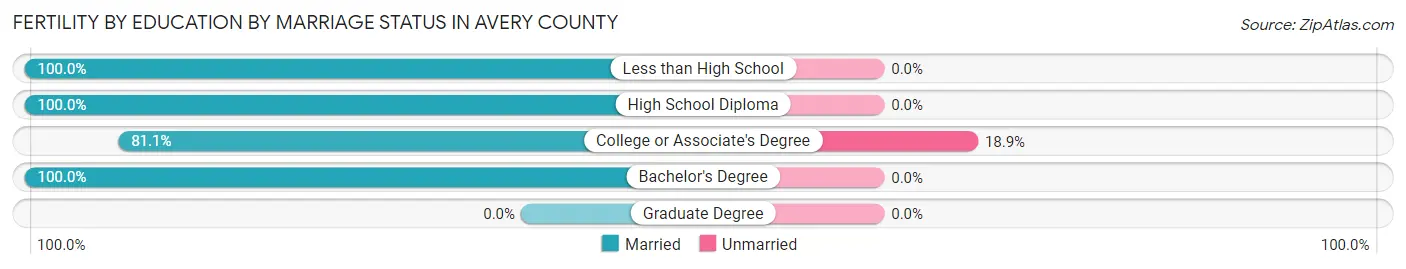
| Educational Attainment | Married | Unmarried |
| Less than High School | 40 (100.0%) | 0 (0.0%) |
| High School Diploma | 2 (100.0%) | 0 (0.0%) |
| College or Associate's Degree | 43 (81.1%) | 10 (18.9%) |
| Bachelor's Degree | 18 (100.0%) | 0 (0.0%) |
| Graduate Degree | 0 (0.0%) | 0 (0.0%) |
| Total | 103 (91.1%) | 10 (8.8%) |
Income in Avery County
Income Overview in Avery County
Per Capita Income in Avery County is $30,578, while median incomes of families and households are $70,968 and $53,513 respectively.
| Characteristic | Number | Measure |
| Per Capita Income | 17,679 | $30,578 |
| Median Family Income | 4,366 | $70,968 |
| Mean Family Income | 4,366 | $98,101 |
| Median Household Income | 6,481 | $53,513 |
| Mean Household Income | 6,481 | $79,769 |
| Income Deficit | 4,366 | $8,101 |
| Wage / Income Gap (%) | 17,679 | 14.55% |
| Wage / Income Gap ($) | 17,679 | 85.45¢ per $1 |
| Gini / Inequality Index | 17,679 | 0.49 |
Earnings by Sex in Avery County
Average Earnings in Avery County are $27,278, $28,898 for men and $24,693 for women, a difference of 14.5%.
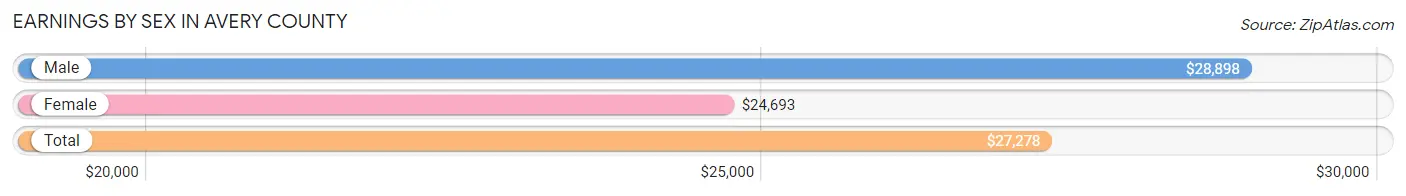
| Sex | Number | Average Earnings |
| Male | 4,868 (57.0%) | $28,898 |
| Female | 3,667 (43.0%) | $24,693 |
| Total | 8,535 (100.0%) | $27,278 |
Earnings by Sex by Income Bracket in Avery County
The most common earnings brackets in Avery County are $2,499 or less for men (637 | 13.1%) and $2,499 or less for women (316 | 8.6%).
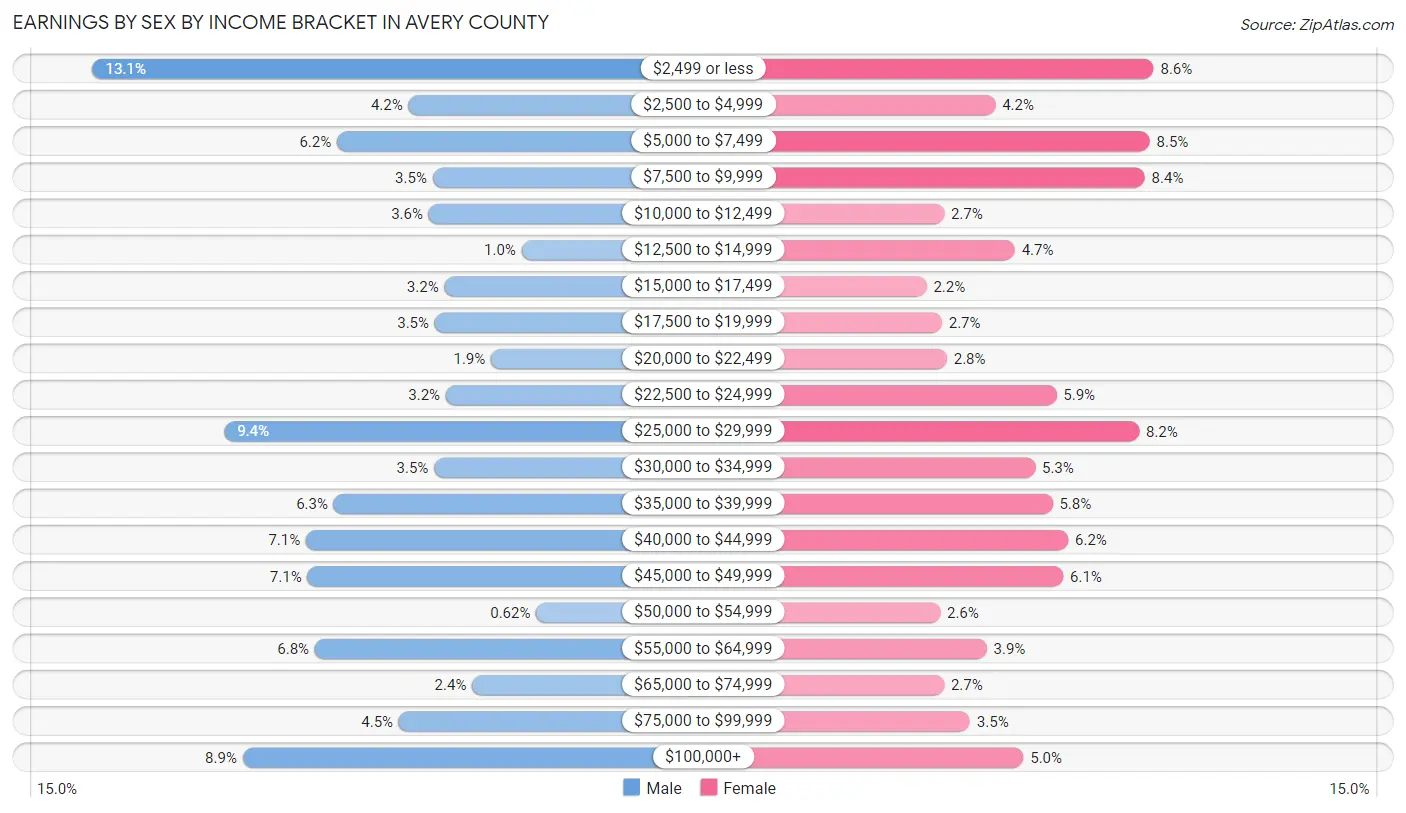
| Income | Male | Female |
| $2,499 or less | 637 (13.1%) | 316 (8.6%) |
| $2,500 to $4,999 | 205 (4.2%) | 153 (4.2%) |
| $5,000 to $7,499 | 303 (6.2%) | 312 (8.5%) |
| $7,500 to $9,999 | 172 (3.5%) | 307 (8.4%) |
| $10,000 to $12,499 | 177 (3.6%) | 100 (2.7%) |
| $12,500 to $14,999 | 50 (1.0%) | 173 (4.7%) |
| $15,000 to $17,499 | 156 (3.2%) | 82 (2.2%) |
| $17,500 to $19,999 | 169 (3.5%) | 98 (2.7%) |
| $20,000 to $22,499 | 92 (1.9%) | 103 (2.8%) |
| $22,500 to $24,999 | 154 (3.2%) | 216 (5.9%) |
| $25,000 to $29,999 | 457 (9.4%) | 301 (8.2%) |
| $30,000 to $34,999 | 170 (3.5%) | 194 (5.3%) |
| $35,000 to $39,999 | 307 (6.3%) | 212 (5.8%) |
| $40,000 to $44,999 | 345 (7.1%) | 228 (6.2%) |
| $45,000 to $49,999 | 343 (7.0%) | 223 (6.1%) |
| $50,000 to $54,999 | 30 (0.6%) | 96 (2.6%) |
| $55,000 to $64,999 | 333 (6.8%) | 144 (3.9%) |
| $65,000 to $74,999 | 118 (2.4%) | 100 (2.7%) |
| $75,000 to $99,999 | 218 (4.5%) | 127 (3.5%) |
| $100,000+ | 432 (8.9%) | 182 (5.0%) |
| Total | 4,868 (100.0%) | 3,667 (100.0%) |
Earnings by Sex by Educational Attainment in Avery County
Average earnings in Avery County are $31,526 for men and $29,395 for women, a difference of 6.8%. Men with an educational attainment of college or associate's degree enjoy the highest average annual earnings of $39,188, while those with less than high school education earn the least with $27,105. Women with an educational attainment of graduate degree earn the most with the average annual earnings of $50,288, while those with college or associate's degree education have the smallest earnings of $26,007.
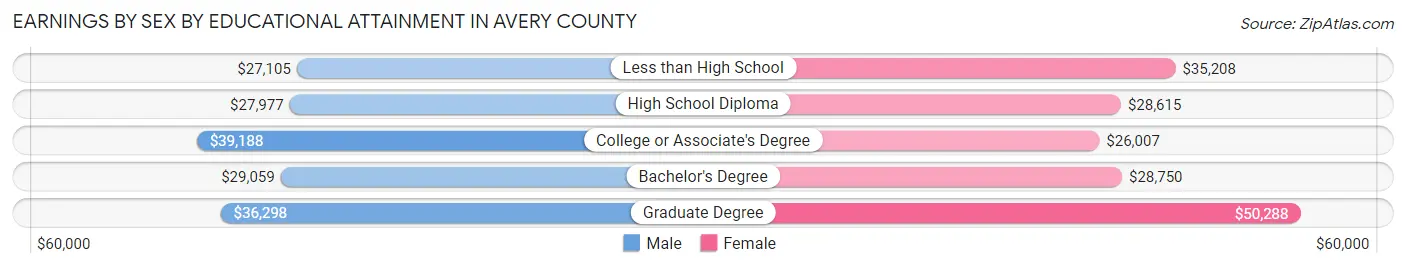
| Educational Attainment | Male Income | Female Income |
| Less than High School | $27,105 | $35,208 |
| High School Diploma | $27,977 | $28,615 |
| College or Associate's Degree | $39,188 | $26,007 |
| Bachelor's Degree | $29,059 | $28,750 |
| Graduate Degree | $36,298 | $50,288 |
| Total | $31,526 | $29,395 |
Family Income in Avery County
Family Income Brackets in Avery County
According to the Avery County family income data, there are 878 families falling into the $50,000 to $74,999 income range, which is the most common income bracket and makes up 20.1% of all families. Conversely, the less than $10,000 income bracket is the least frequent group with only 122 families (2.8%) belonging to this category.
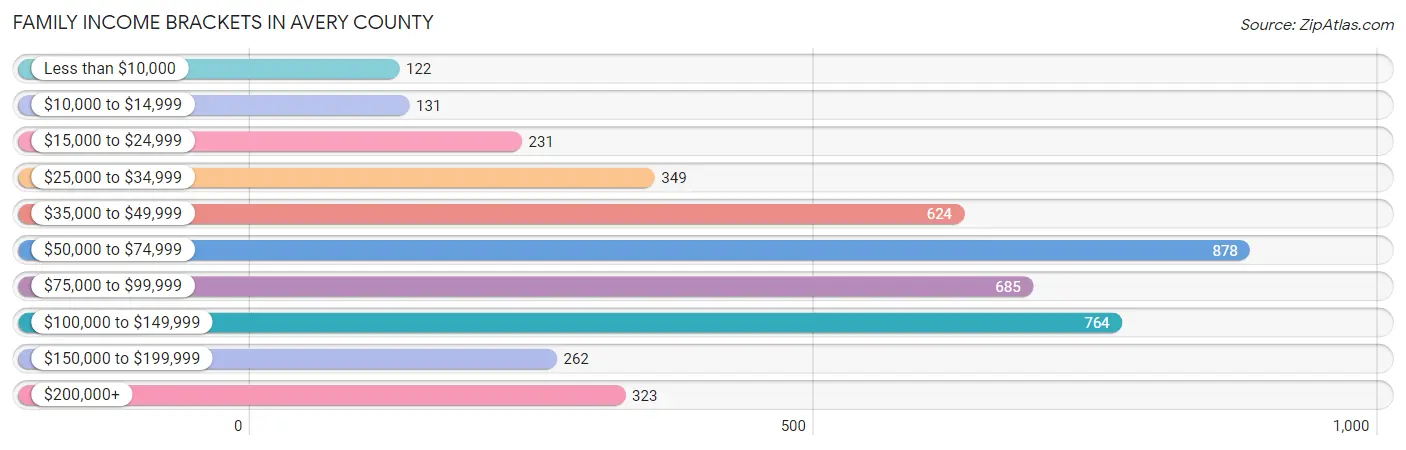
| Income Bracket | # Families | % Families |
| Less than $10,000 | 122 | 2.8% |
| $10,000 to $14,999 | 131 | 3.0% |
| $15,000 to $24,999 | 231 | 5.3% |
| $25,000 to $34,999 | 349 | 8.0% |
| $35,000 to $49,999 | 624 | 14.3% |
| $50,000 to $74,999 | 878 | 20.1% |
| $75,000 to $99,999 | 685 | 15.7% |
| $100,000 to $149,999 | 764 | 17.5% |
| $150,000 to $199,999 | 262 | 6.0% |
| $200,000+ | 323 | 7.4% |
Family Income by Famaliy Size in Avery County
7+ person families (27 | 0.6%) account for the highest median family income in Avery County with $81,146 per family, while 2-person families (2,581 | 59.1%) have the highest median income of $35,502 per family member.
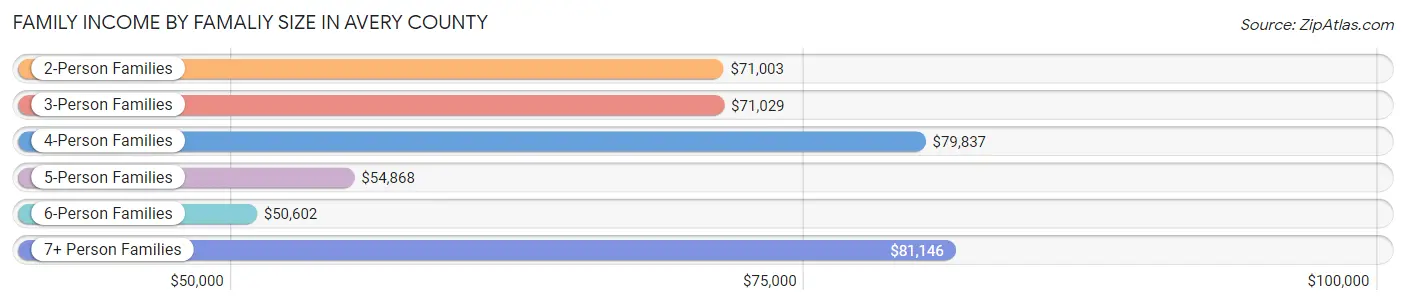
| Income Bracket | # Families | Median Income |
| 2-Person Families | 2,581 (59.1%) | $71,003 |
| 3-Person Families | 772 (17.7%) | $71,029 |
| 4-Person Families | 599 (13.7%) | $79,837 |
| 5-Person Families | 326 (7.5%) | $54,868 |
| 6-Person Families | 61 (1.4%) | $50,602 |
| 7+ Person Families | 27 (0.6%) | $81,146 |
| Total | 4,366 (100.0%) | $70,968 |
Family Income by Number of Earners in Avery County
The median family income in Avery County is $70,968, with families comprising 3+ earners (419) having the highest median family income of $112,639, while families with no earners (1,077) have the lowest median family income of $55,492, accounting for 9.6% and 24.7% of families, respectively.
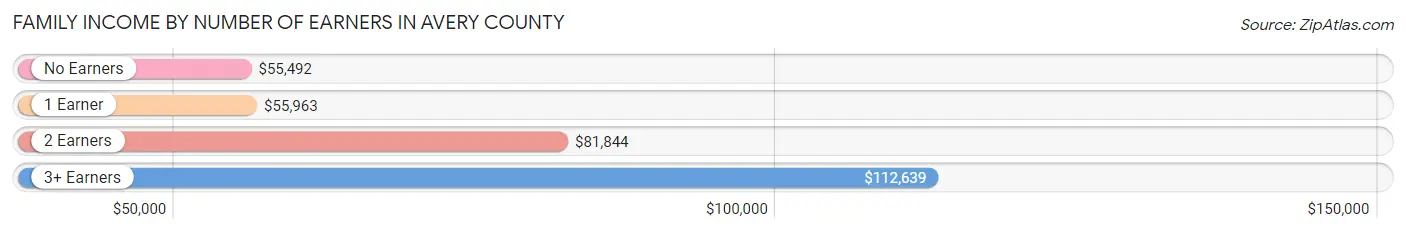
| Number of Earners | # Families | Median Income |
| No Earners | 1,077 (24.7%) | $55,492 |
| 1 Earner | 1,459 (33.4%) | $55,963 |
| 2 Earners | 1,411 (32.3%) | $81,844 |
| 3+ Earners | 419 (9.6%) | $112,639 |
| Total | 4,366 (100.0%) | $70,968 |
Household Income in Avery County
Household Income Brackets in Avery County
With 1,147 households falling in the category, the $50,000 to $74,999 income range is the most frequent in Avery County, accounting for 17.7% of all households. In contrast, only 311 households (4.8%) fall into the $150,000 to $199,999 income bracket, making it the least populous group.
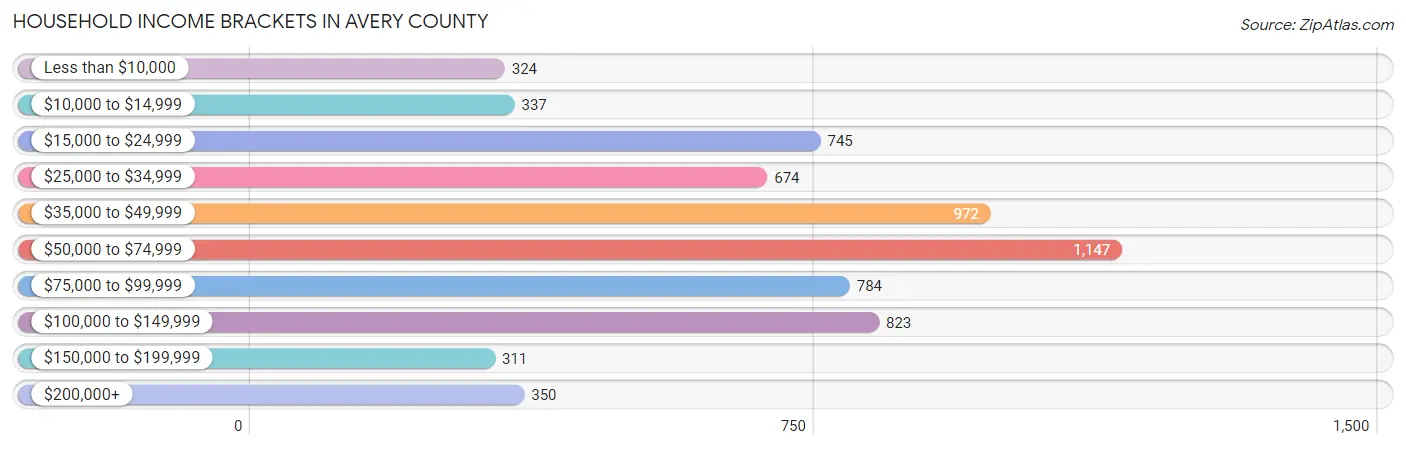
| Income Bracket | # Households | % Households |
| Less than $10,000 | 324 | 5.0% |
| $10,000 to $14,999 | 337 | 5.2% |
| $15,000 to $24,999 | 745 | 11.5% |
| $25,000 to $34,999 | 674 | 10.4% |
| $35,000 to $49,999 | 972 | 15.0% |
| $50,000 to $74,999 | 1,147 | 17.7% |
| $75,000 to $99,999 | 784 | 12.1% |
| $100,000 to $149,999 | 823 | 12.7% |
| $150,000 to $199,999 | 311 | 4.8% |
| $200,000+ | 350 | 5.4% |
Household Income by Householder Age in Avery County
The median household income in Avery County is $53,513, with the highest median household income of $57,052 found in the 45 to 64 years age bracket for the primary householder. A total of 2,362 households (36.4%) fall into this category. Meanwhile, the 15 to 24 years age bracket for the primary householder has the lowest median household income of $46,544, with 137 households (2.1%) in this group.
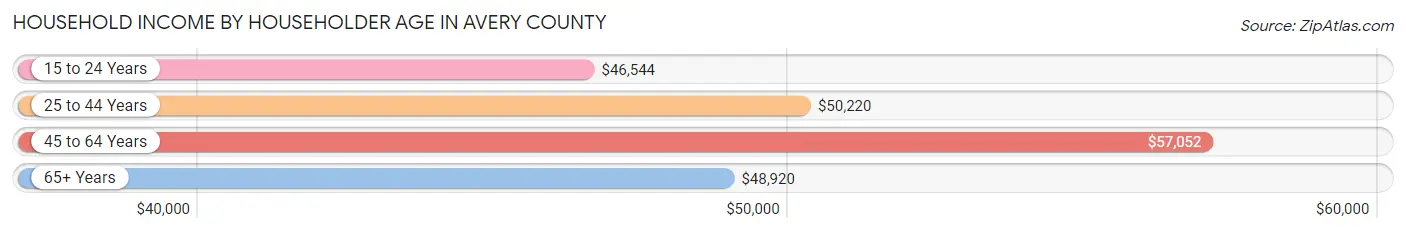
| Income Bracket | # Households | Median Income |
| 15 to 24 Years | 137 (2.1%) | $46,544 |
| 25 to 44 Years | 1,497 (23.1%) | $50,220 |
| 45 to 64 Years | 2,362 (36.4%) | $57,052 |
| 65+ Years | 2,485 (38.3%) | $48,920 |
| Total | 6,481 (100.0%) | $53,513 |
Poverty in Avery County
Income Below Poverty by Sex and Age in Avery County
With 10.3% poverty level for males and 12.1% for females among the residents of Avery County, 12 to 14 year old males and 16 and 17 year old females are the most vulnerable to poverty, with 91 males (38.4%) and 39 females (24.4%) in their respective age groups living below the poverty level.
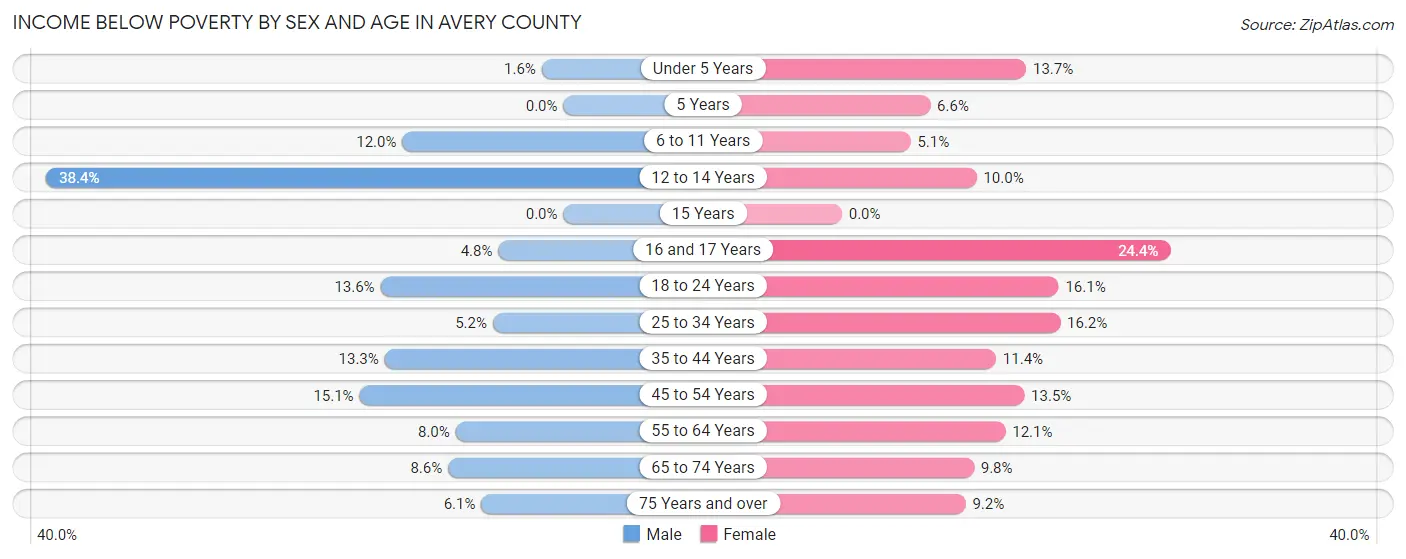
| Age Bracket | Male | Female |
| Under 5 Years | 5 (1.6%) | 45 (13.7%) |
| 5 Years | 0 (0.0%) | 4 (6.6%) |
| 6 to 11 Years | 47 (12.0%) | 20 (5.1%) |
| 12 to 14 Years | 91 (38.4%) | 23 (10.0%) |
| 15 Years | 0 (0.0%) | 0 (0.0%) |
| 16 and 17 Years | 7 (4.8%) | 39 (24.4%) |
| 18 to 24 Years | 47 (13.6%) | 84 (16.1%) |
| 25 to 34 Years | 46 (5.2%) | 141 (16.2%) |
| 35 to 44 Years | 108 (13.3%) | 92 (11.4%) |
| 45 to 54 Years | 160 (15.1%) | 130 (13.5%) |
| 55 to 64 Years | 75 (8.0%) | 153 (12.1%) |
| 65 to 74 Years | 98 (8.6%) | 118 (9.8%) |
| 75 Years and over | 44 (6.1%) | 76 (9.2%) |
| Total | 728 (10.3%) | 925 (12.1%) |
Income Above Poverty by Sex and Age in Avery County
According to the poverty statistics in Avery County, males aged 5 years and females aged 15 years are the age groups that are most secure financially, with 100.0% of males and 100.0% of females in these age groups living above the poverty line.
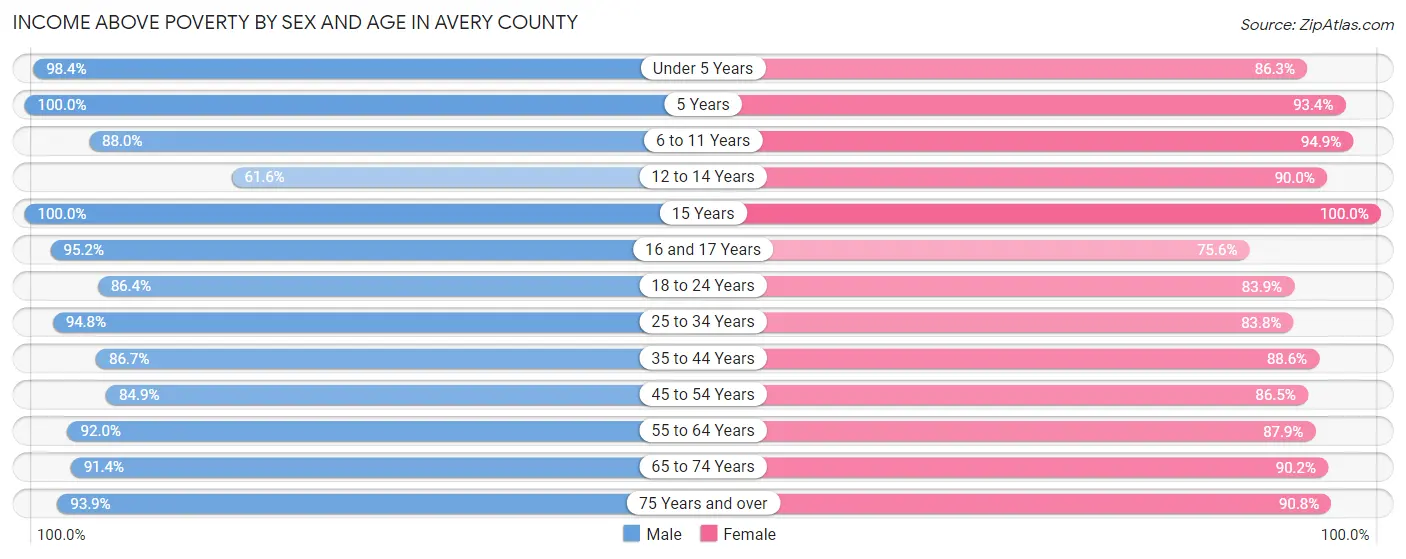
| Age Bracket | Male | Female |
| Under 5 Years | 306 (98.4%) | 284 (86.3%) |
| 5 Years | 29 (100.0%) | 57 (93.4%) |
| 6 to 11 Years | 346 (88.0%) | 372 (94.9%) |
| 12 to 14 Years | 146 (61.6%) | 207 (90.0%) |
| 15 Years | 58 (100.0%) | 40 (100.0%) |
| 16 and 17 Years | 138 (95.2%) | 121 (75.6%) |
| 18 to 24 Years | 299 (86.4%) | 438 (83.9%) |
| 25 to 34 Years | 832 (94.8%) | 729 (83.8%) |
| 35 to 44 Years | 706 (86.7%) | 712 (88.6%) |
| 45 to 54 Years | 897 (84.9%) | 830 (86.5%) |
| 55 to 64 Years | 862 (92.0%) | 1,107 (87.9%) |
| 65 to 74 Years | 1,047 (91.4%) | 1,086 (90.2%) |
| 75 Years and over | 678 (93.9%) | 752 (90.8%) |
| Total | 6,344 (89.7%) | 6,735 (87.9%) |
Income Below Poverty Among Married-Couple Families in Avery County
The poverty statistics for married-couple families in Avery County show that 5.3% or 191 of the total 3,593 families live below the poverty line. Families with 1 or 2 children have the highest poverty rate of 8.2%, comprising of 67 families. On the other hand, families with 5 or more children have the lowest poverty rate of 0.0%, which includes 0 families.
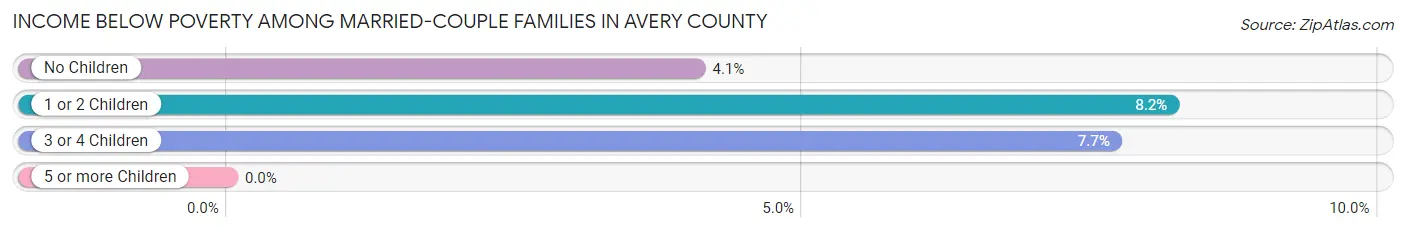
| Children | Above Poverty | Below Poverty |
| No Children | 2,355 (95.9%) | 100 (4.1%) |
| 1 or 2 Children | 751 (91.8%) | 67 (8.2%) |
| 3 or 4 Children | 288 (92.3%) | 24 (7.7%) |
| 5 or more Children | 8 (100.0%) | 0 (0.0%) |
| Total | 3,402 (94.7%) | 191 (5.3%) |
Income Below Poverty Among Single-Parent Households in Avery County
According to the poverty data in Avery County, 17.3% or 38 single-father households and 23.0% or 127 single-mother households are living below the poverty line. Among single-father households, those with 1 or 2 children have the highest poverty rate, with 31 households (34.8%) experiencing poverty. Likewise, among single-mother households, those with 1 or 2 children have the highest poverty rate, with 96 households (33.1%) falling below the poverty line.
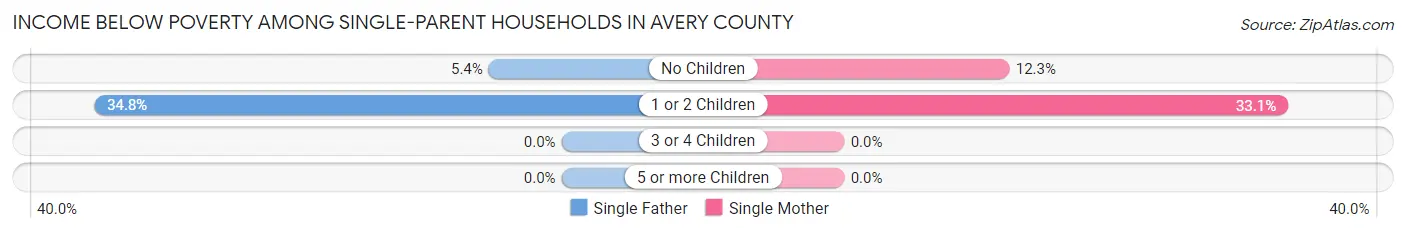
| Children | Single Father | Single Mother |
| No Children | 7 (5.4%) | 31 (12.3%) |
| 1 or 2 Children | 31 (34.8%) | 96 (33.1%) |
| 3 or 4 Children | 0 (0.0%) | 0 (0.0%) |
| 5 or more Children | 0 (0.0%) | 0 (0.0%) |
| Total | 38 (17.3%) | 127 (23.0%) |
Income Below Poverty Among Married-Couple vs Single-Parent Households in Avery County
The poverty data for Avery County shows that 191 of the married-couple family households (5.3%) and 165 of the single-parent households (21.3%) are living below the poverty level. Within the married-couple family households, those with 1 or 2 children have the highest poverty rate, with 67 households (8.2%) falling below the poverty line. Among the single-parent households, those with 1 or 2 children have the highest poverty rate, with 127 household (33.5%) living below poverty.
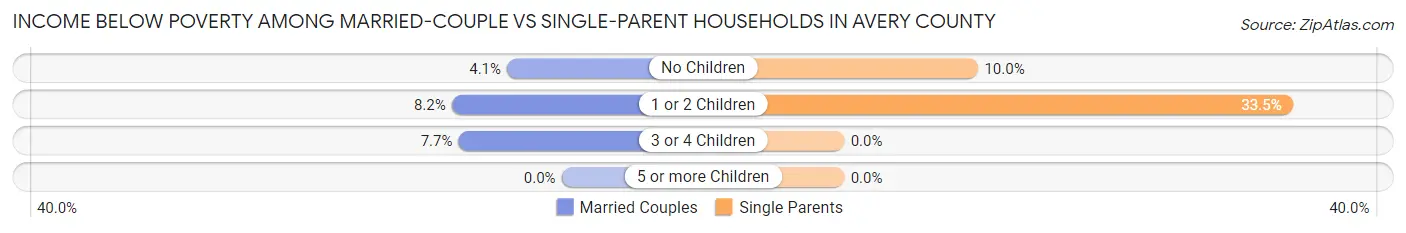
| Children | Married-Couple Families | Single-Parent Households |
| No Children | 100 (4.1%) | 38 (10.0%) |
| 1 or 2 Children | 67 (8.2%) | 127 (33.5%) |
| 3 or 4 Children | 24 (7.7%) | 0 (0.0%) |
| 5 or more Children | 0 (0.0%) | 0 (0.0%) |
| Total | 191 (5.3%) | 165 (21.3%) |
Employment Characteristics in Avery County
Employment by Class of Employer in Avery County
Among the 6,209 employed individuals in Avery County, private company employees (3,541 | 57.0%), local government employees (588 | 9.5%), and self-employed (incorporated) (582 | 9.4%) make up the most common classes of employment.
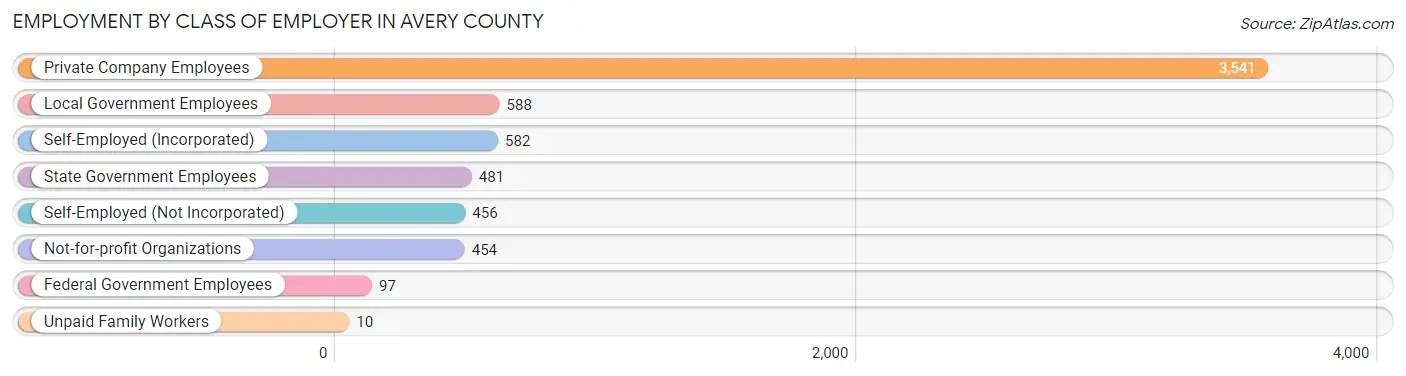
| Employer Class | # Employees | % Employees |
| Private Company Employees | 3,541 | 57.0% |
| Self-Employed (Incorporated) | 582 | 9.4% |
| Self-Employed (Not Incorporated) | 456 | 7.3% |
| Not-for-profit Organizations | 454 | 7.3% |
| Local Government Employees | 588 | 9.5% |
| State Government Employees | 481 | 7.7% |
| Federal Government Employees | 97 | 1.6% |
| Unpaid Family Workers | 10 | 0.2% |
| Total | 6,209 | 100.0% |
Employment Status by Age in Avery County
According to the labor force statistics for Avery County, out of the total population over 16 years of age (15,564), 45.3% or 7,050 individuals are in the labor force, with 5.0% or 352 of them unemployed. The age group with the highest labor force participation rate is 30 to 34 years, with 67.8% or 707 individuals in the labor force. Within the labor force, the 16 to 19 years age range has the highest percentage of unemployed individuals, with 27.2% or 101 of them being unemployed.
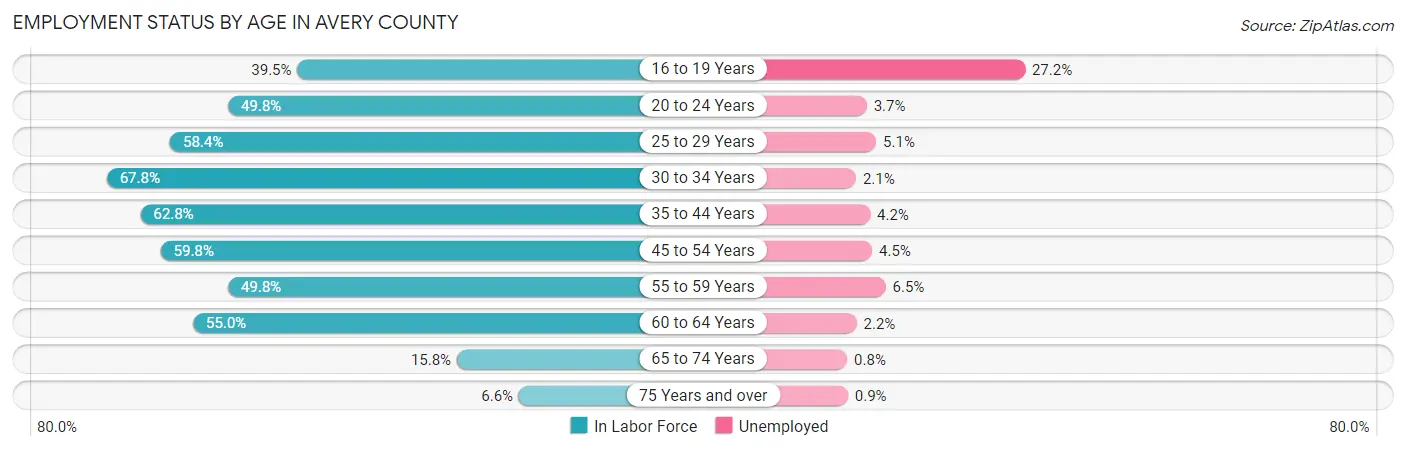
| Age Bracket | In Labor Force | Unemployed |
| 16 to 19 Years | 371 (39.5%) | 101 (27.2%) |
| 20 to 24 Years | 508 (49.8%) | 19 (3.7%) |
| 25 to 29 Years | 682 (58.4%) | 35 (5.1%) |
| 30 to 34 Years | 707 (67.8%) | 15 (2.1%) |
| 35 to 44 Years | 1,350 (62.8%) | 57 (4.2%) |
| 45 to 54 Years | 1,527 (59.8%) | 69 (4.5%) |
| 55 to 59 Years | 521 (49.8%) | 34 (6.5%) |
| 60 to 64 Years | 900 (55.0%) | 20 (2.2%) |
| 65 to 74 Years | 377 (15.8%) | 3 (0.8%) |
| 75 Years and over | 107 (6.6%) | 1 (0.9%) |
| Total | 7,050 (45.3%) | 352 (5.0%) |
Employment Status by Educational Attainment in Avery County
According to labor force statistics for Avery County, 59.3% of individuals (5,690) out of the total population between 25 and 64 years of age (9,596) are in the labor force, with 4.0% or 228 of them being unemployed. The group with the highest labor force participation rate are those with the educational attainment of bachelor's degree or higher, with 74.6% or 1,378 individuals in the labor force. Within the labor force, individuals with high school diploma education have the highest percentage of unemployment, with 6.7% or 110 of them being unemployed.
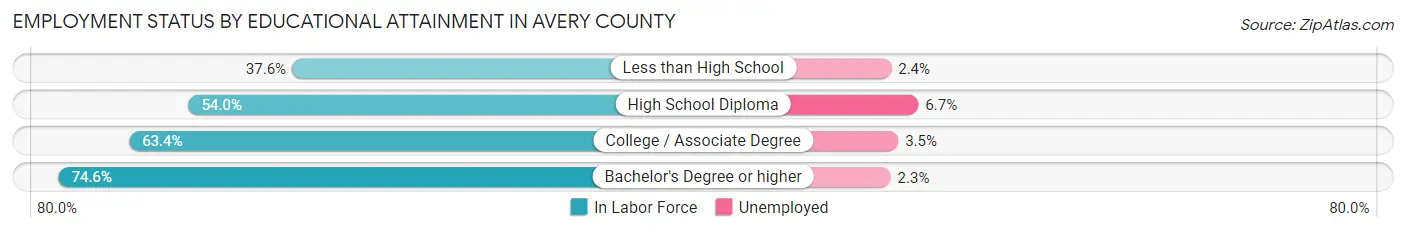
| Educational Attainment | In Labor Force | Unemployed |
| Less than High School | 462 (37.6%) | 29 (2.4%) |
| High School Diploma | 1,648 (54.0%) | 204 (6.7%) |
| College / Associate Degree | 2,199 (63.4%) | 121 (3.5%) |
| Bachelor's Degree or higher | 1,378 (74.6%) | 42 (2.3%) |
| Total | 5,690 (59.3%) | 384 (4.0%) |
Employment Occupations by Sex in Avery County
Management, Business, Science and Arts Occupations
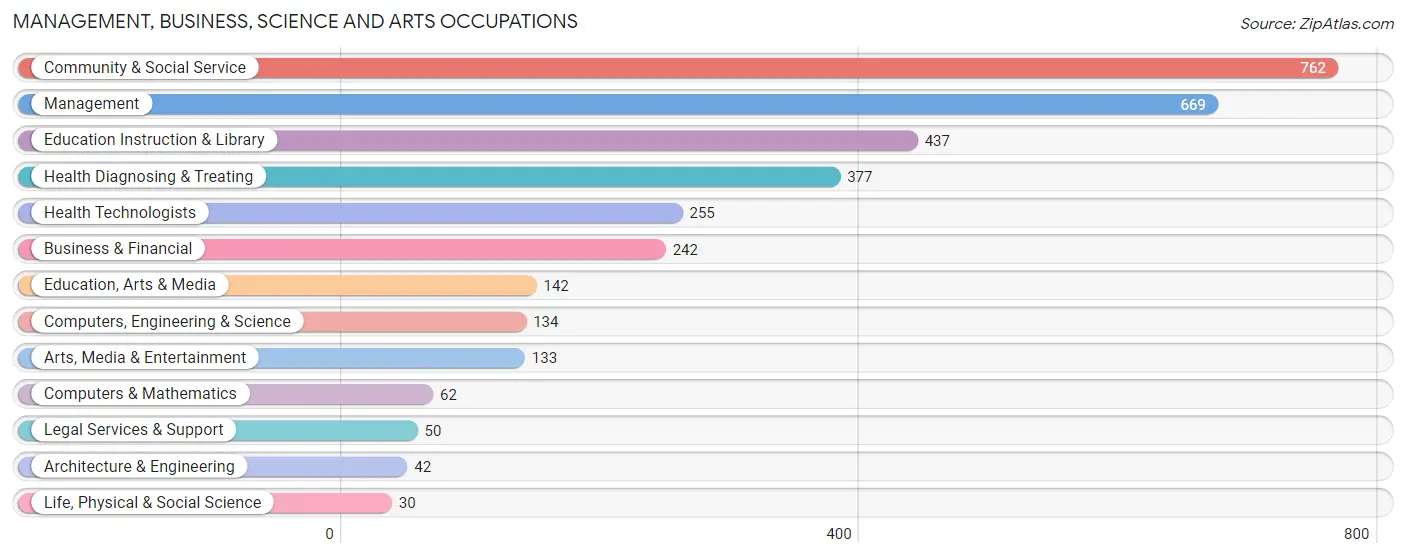
The most common Management, Business, Science and Arts occupations in Avery County are Community & Social Service (762 | 11.4%), Management (669 | 10.0%), Education Instruction & Library (437 | 6.5%), Health Diagnosing & Treating (377 | 5.6%), and Health Technologists (255 | 3.8%).
Management, Business, Science and Arts Occupations by Sex
Within the Management, Business, Science and Arts occupations in Avery County, the most male-oriented occupations are Computers & Mathematics (100.0%), Architecture & Engineering (100.0%), and Computers, Engineering & Science (89.5%), while the most female-oriented occupations are Education, Arts & Media (88.0%), Education Instruction & Library (78.5%), and Health Technologists (75.7%).
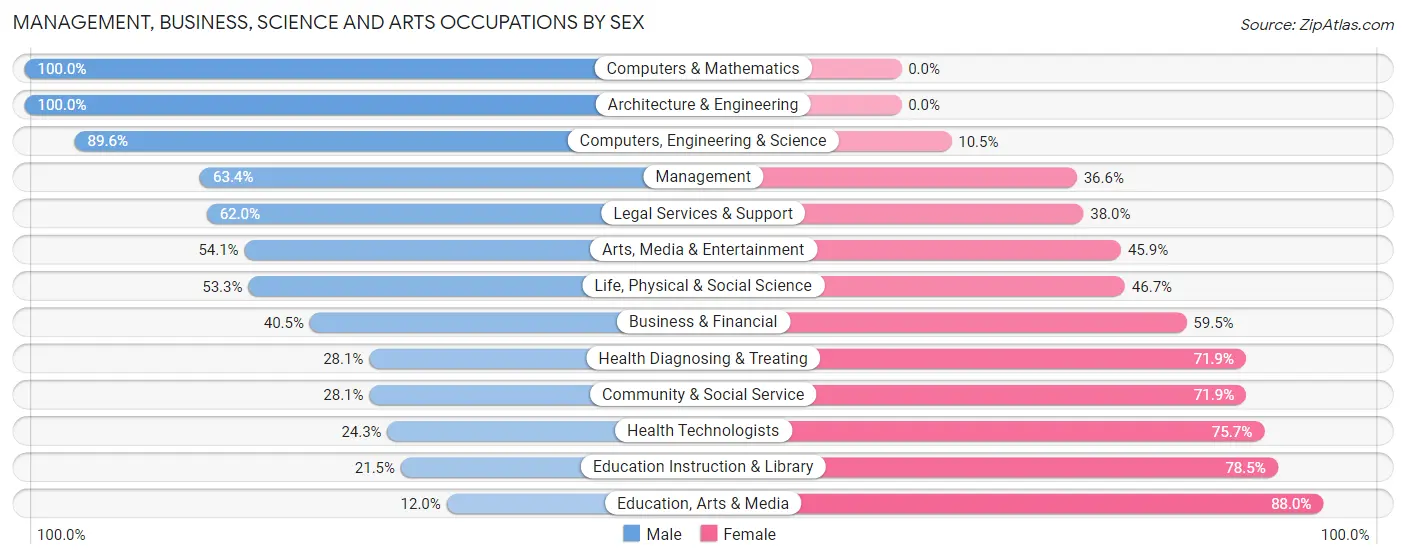
| Occupation | Male | Female |
| Management | 424 (63.4%) | 245 (36.6%) |
| Business & Financial | 98 (40.5%) | 144 (59.5%) |
| Computers, Engineering & Science | 120 (89.5%) | 14 (10.4%) |
| Computers & Mathematics | 62 (100.0%) | 0 (0.0%) |
| Architecture & Engineering | 42 (100.0%) | 0 (0.0%) |
| Life, Physical & Social Science | 16 (53.3%) | 14 (46.7%) |
| Community & Social Service | 214 (28.1%) | 548 (71.9%) |
| Education, Arts & Media | 17 (12.0%) | 125 (88.0%) |
| Legal Services & Support | 31 (62.0%) | 19 (38.0%) |
| Education Instruction & Library | 94 (21.5%) | 343 (78.5%) |
| Arts, Media & Entertainment | 72 (54.1%) | 61 (45.9%) |
| Health Diagnosing & Treating | 106 (28.1%) | 271 (71.9%) |
| Health Technologists | 62 (24.3%) | 193 (75.7%) |
| Total (Category) | 962 (44.1%) | 1,222 (55.9%) |
| Total (Overall) | 3,562 (53.2%) | 3,136 (46.8%) |
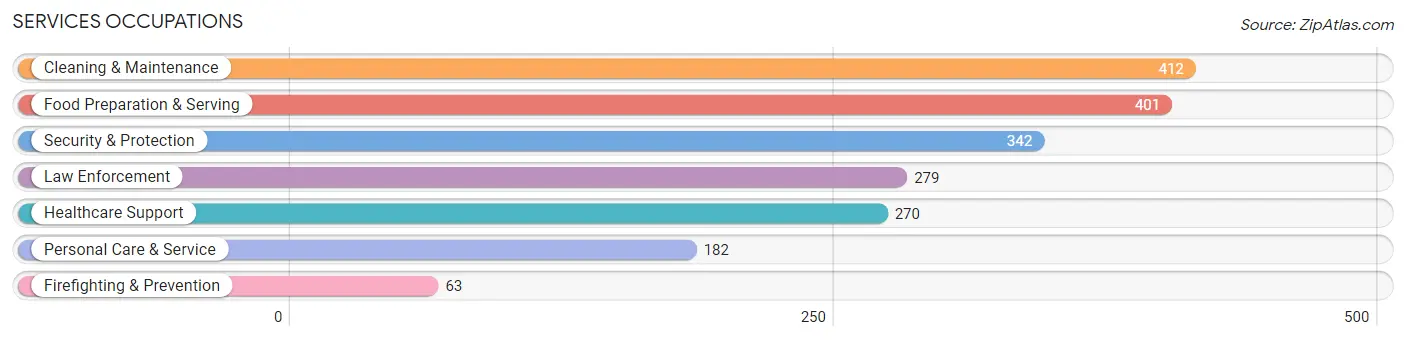
Services Occupations
The most common Services occupations in Avery County are Cleaning & Maintenance (412 | 6.1%), Food Preparation & Serving (401 | 6.0%), Security & Protection (342 | 5.1%), Law Enforcement (279 | 4.2%), and Healthcare Support (270 | 4.0%).
Services Occupations by Sex
Within the Services occupations in Avery County, the most male-oriented occupations are Firefighting & Prevention (100.0%), Security & Protection (95.3%), and Law Enforcement (94.3%), while the most female-oriented occupations are Healthcare Support (100.0%), Personal Care & Service (64.3%), and Food Preparation & Serving (50.9%).
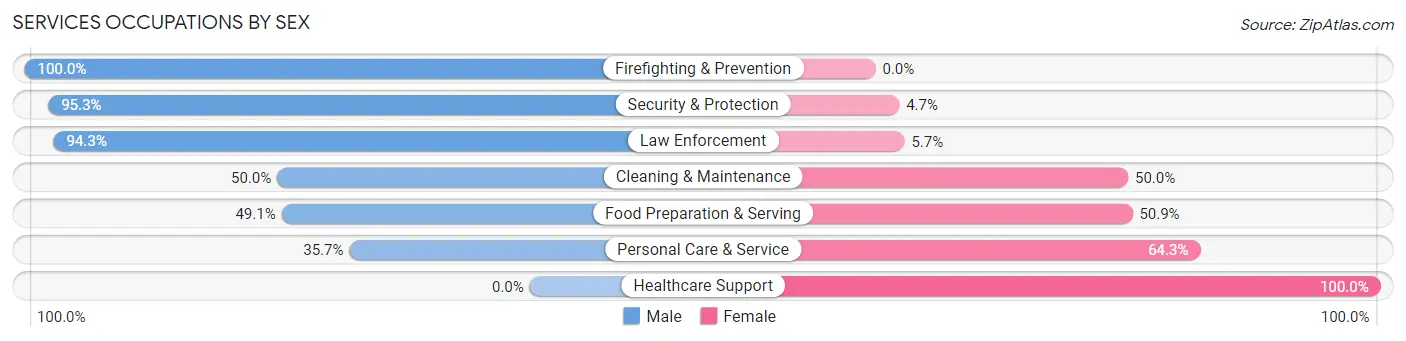
| Occupation | Male | Female |
| Healthcare Support | 0 (0.0%) | 270 (100.0%) |
| Security & Protection | 326 (95.3%) | 16 (4.7%) |
| Firefighting & Prevention | 63 (100.0%) | 0 (0.0%) |
| Law Enforcement | 263 (94.3%) | 16 (5.7%) |
| Food Preparation & Serving | 197 (49.1%) | 204 (50.9%) |
| Cleaning & Maintenance | 206 (50.0%) | 206 (50.0%) |
| Personal Care & Service | 65 (35.7%) | 117 (64.3%) |
| Total (Category) | 794 (49.4%) | 813 (50.6%) |
| Total (Overall) | 3,562 (53.2%) | 3,136 (46.8%) |
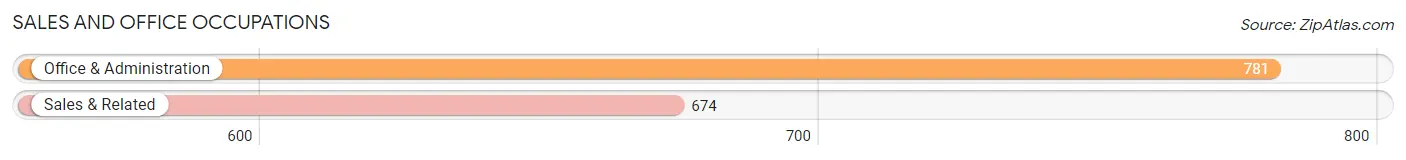
Sales and Office Occupations
The most common Sales and Office occupations in Avery County are Office & Administration (781 | 11.7%), and Sales & Related (674 | 10.1%).
Sales and Office Occupations by Sex
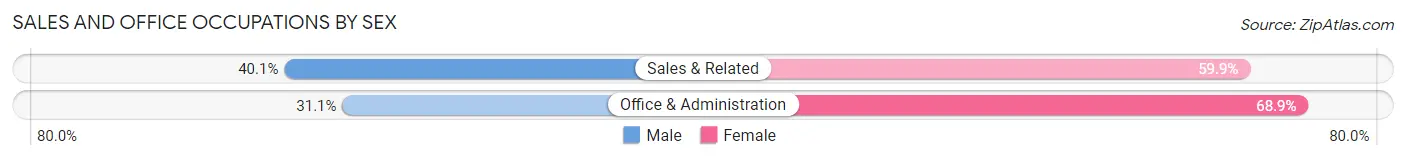
| Occupation | Male | Female |
| Sales & Related | 270 (40.1%) | 404 (59.9%) |
| Office & Administration | 243 (31.1%) | 538 (68.9%) |
| Total (Category) | 513 (35.3%) | 942 (64.7%) |
| Total (Overall) | 3,562 (53.2%) | 3,136 (46.8%) |
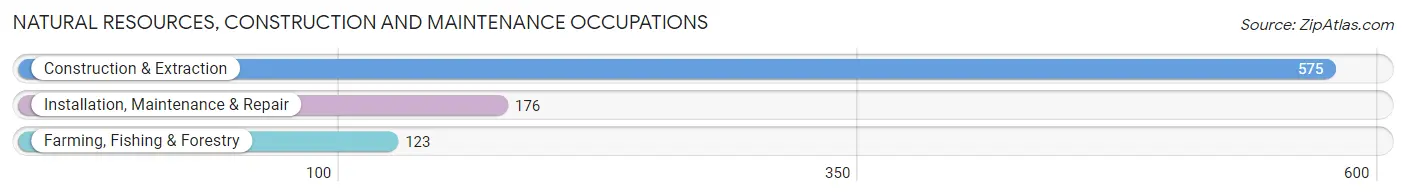
Natural Resources, Construction and Maintenance Occupations
The most common Natural Resources, Construction and Maintenance occupations in Avery County are Construction & Extraction (575 | 8.6%), Installation, Maintenance & Repair (176 | 2.6%), and Farming, Fishing & Forestry (123 | 1.8%).
Natural Resources, Construction and Maintenance Occupations by Sex
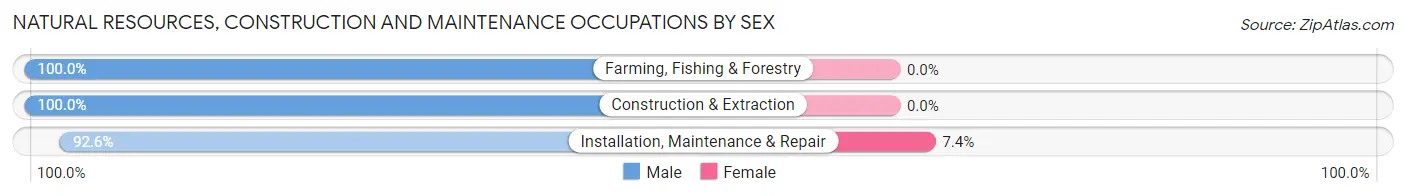
| Occupation | Male | Female |
| Farming, Fishing & Forestry | 123 (100.0%) | 0 (0.0%) |
| Construction & Extraction | 575 (100.0%) | 0 (0.0%) |
| Installation, Maintenance & Repair | 163 (92.6%) | 13 (7.4%) |
| Total (Category) | 861 (98.5%) | 13 (1.5%) |
| Total (Overall) | 3,562 (53.2%) | 3,136 (46.8%) |
Production, Transportation and Moving Occupations
The most common Production, Transportation and Moving occupations in Avery County are Production (315 | 4.7%), Material Moving (155 | 2.3%), and Transportation (108 | 1.6%).
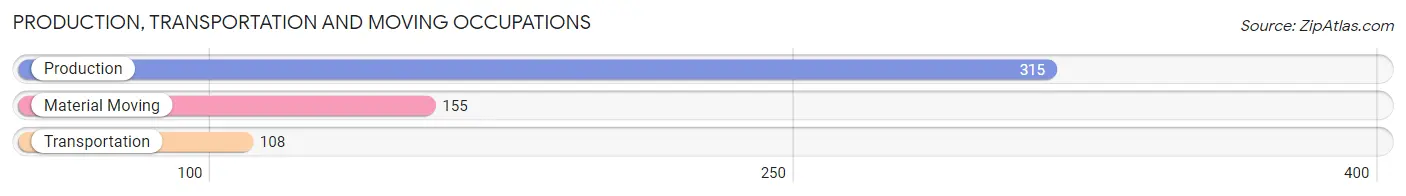
Production, Transportation and Moving Occupations by Sex
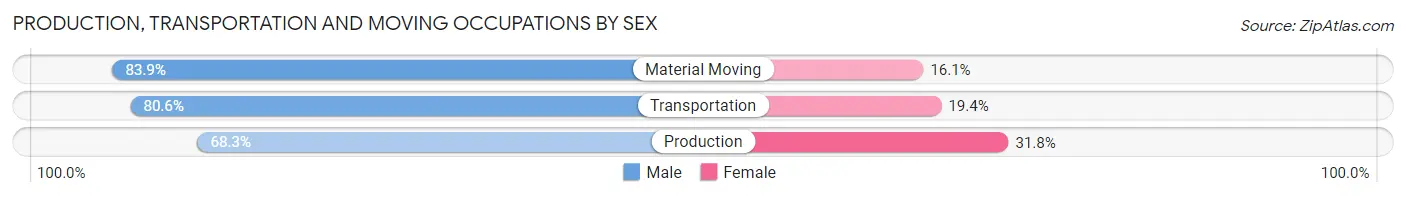
| Occupation | Male | Female |
| Production | 215 (68.2%) | 100 (31.8%) |
| Transportation | 87 (80.6%) | 21 (19.4%) |
| Material Moving | 130 (83.9%) | 25 (16.1%) |
| Total (Category) | 432 (74.7%) | 146 (25.3%) |
| Total (Overall) | 3,562 (53.2%) | 3,136 (46.8%) |
Employment Industries by Sex in Avery County
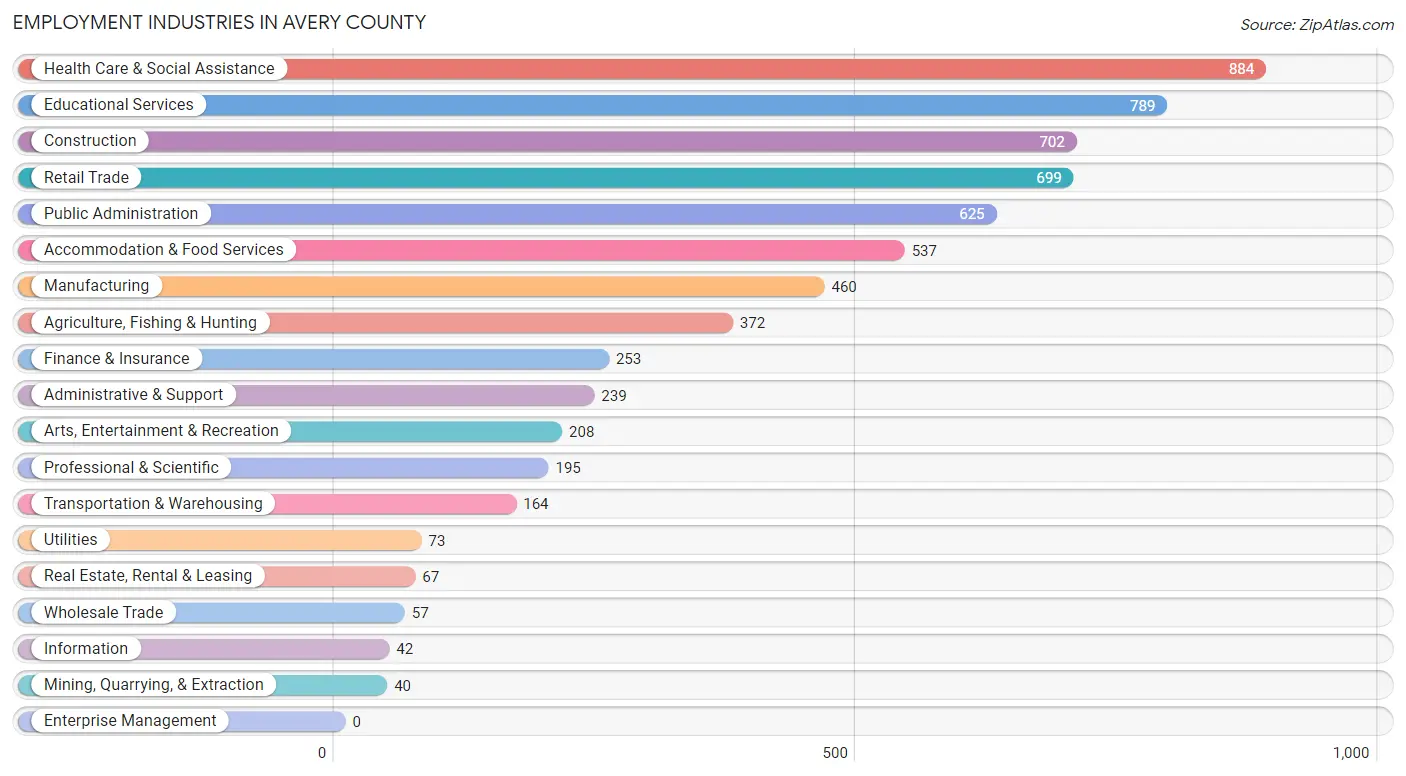
Employment Industries in Avery County
The major employment industries in Avery County include Health Care & Social Assistance (884 | 13.2%), Educational Services (789 | 11.8%), Construction (702 | 10.5%), Retail Trade (699 | 10.4%), and Public Administration (625 | 9.3%).
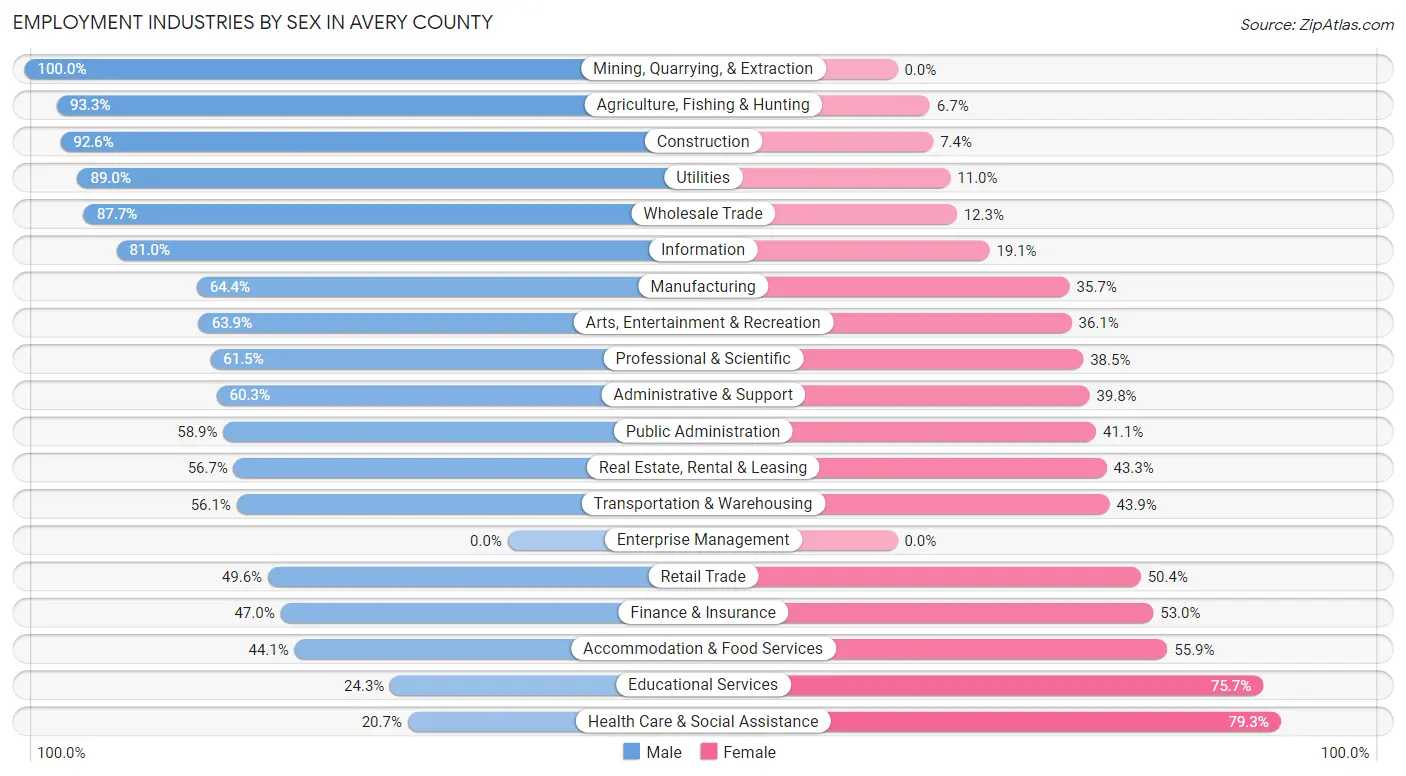
Employment Industries by Sex in Avery County
The Avery County industries that see more men than women are Mining, Quarrying, & Extraction (100.0%), Agriculture, Fishing & Hunting (93.3%), and Construction (92.6%), whereas the industries that tend to have a higher number of women are Health Care & Social Assistance (79.3%), Educational Services (75.7%), and Accommodation & Food Services (55.9%).
| Industry | Male | Female |
| Agriculture, Fishing & Hunting | 347 (93.3%) | 25 (6.7%) |
| Mining, Quarrying, & Extraction | 40 (100.0%) | 0 (0.0%) |
| Construction | 650 (92.6%) | 52 (7.4%) |
| Manufacturing | 296 (64.3%) | 164 (35.6%) |
| Wholesale Trade | 50 (87.7%) | 7 (12.3%) |
| Retail Trade | 347 (49.6%) | 352 (50.4%) |
| Transportation & Warehousing | 92 (56.1%) | 72 (43.9%) |
| Utilities | 65 (89.0%) | 8 (11.0%) |
| Information | 34 (80.9%) | 8 (19.1%) |
| Finance & Insurance | 119 (47.0%) | 134 (53.0%) |
| Real Estate, Rental & Leasing | 38 (56.7%) | 29 (43.3%) |
| Professional & Scientific | 120 (61.5%) | 75 (38.5%) |
| Enterprise Management | 0 (0.0%) | 0 (0.0%) |
| Administrative & Support | 144 (60.3%) | 95 (39.8%) |
| Educational Services | 192 (24.3%) | 597 (75.7%) |
| Health Care & Social Assistance | 183 (20.7%) | 701 (79.3%) |
| Arts, Entertainment & Recreation | 133 (63.9%) | 75 (36.1%) |
| Accommodation & Food Services | 237 (44.1%) | 300 (55.9%) |
| Public Administration | 368 (58.9%) | 257 (41.1%) |
| Total | 3,562 (53.2%) | 3,136 (46.8%) |
Education in Avery County
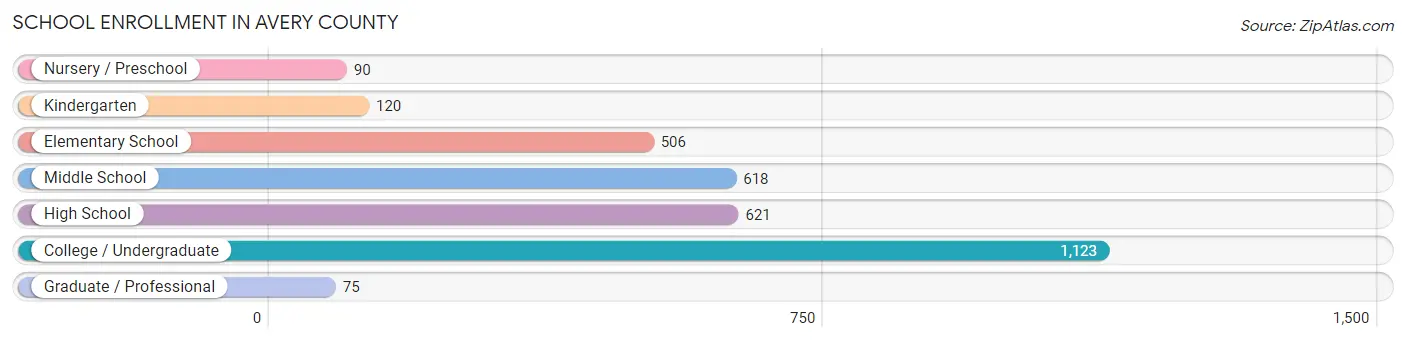
School Enrollment in Avery County
The most common levels of schooling among the 3,153 students in Avery County are college / undergraduate (1,123 | 35.6%), high school (621 | 19.7%), and middle school (618 | 19.6%).
| School Level | # Students | % Students |
| Nursery / Preschool | 90 | 2.9% |
| Kindergarten | 120 | 3.8% |
| Elementary School | 506 | 16.1% |
| Middle School | 618 | 19.6% |
| High School | 621 | 19.7% |
| College / Undergraduate | 1,123 | 35.6% |
| Graduate / Professional | 75 | 2.4% |
| Total | 3,153 | 100.0% |
School Enrollment by Age by Funding Source in Avery County
Out of a total of 3,153 students who are enrolled in schools in Avery County, 870 (27.6%) attend a private institution, while the remaining 2,283 (72.4%) are enrolled in public schools. The age group of 20 to 24 year olds has the highest likelihood of being enrolled in private schools, with 261 (52.0% in the age bracket) enrolled. Conversely, the age group of 15 to 17 year olds has the lowest likelihood of being enrolled in a private school, with 396 (90.2% in the age bracket) attending a public institution.

| Age Bracket | Public School | Private School |
| 3 to 4 Year Olds | 31 (59.6%) | 21 (40.4%) |
| 5 to 9 Year Old | 512 (80.6%) | 123 (19.4%) |
| 10 to 14 Year Olds | 569 (78.0%) | 160 (22.0%) |
| 15 to 17 Year Olds | 396 (90.2%) | 43 (9.8%) |
| 18 to 19 Year Olds | 317 (61.2%) | 201 (38.8%) |
| 20 to 24 Year Olds | 241 (48.0%) | 261 (52.0%) |
| 25 to 34 Year Olds | 85 (73.3%) | 31 (26.7%) |
| 35 Years and over | 133 (82.1%) | 29 (17.9%) |
| Total | 2,283 (72.4%) | 870 (27.6%) |
Educational Attainment by Field of Study in Avery County
Business (574 | 17.9%), education (508 | 15.9%), science & technology (366 | 11.4%), social sciences (313 | 9.8%), and arts & humanities (261 | 8.1%) are the most common fields of study among 3,205 individuals in Avery County who have obtained a bachelor's degree or higher.

| Field of Study | # Graduates | % Graduates |
| Computers & Mathematics | 156 | 4.9% |
| Bio, Nature & Agricultural | 208 | 6.5% |
| Physical & Health Sciences | 70 | 2.2% |
| Psychology | 130 | 4.1% |
| Social Sciences | 313 | 9.8% |
| Engineering | 119 | 3.7% |
| Multidisciplinary Studies | 7 | 0.2% |
| Science & Technology | 366 | 11.4% |
| Business | 574 | 17.9% |
| Education | 508 | 15.9% |
| Literature & Languages | 82 | 2.6% |
| Liberal Arts & History | 234 | 7.3% |
| Visual & Performing Arts | 122 | 3.8% |
| Communications | 55 | 1.7% |
| Arts & Humanities | 261 | 8.1% |
| Total | 3,205 | 100.0% |
Transportation & Commute in Avery County
Vehicle Availability by Sex in Avery County
The most prevalent vehicle ownership categories in Avery County are males with 2 vehicles (1,273, accounting for 39.4%) and females with 2 vehicles (1,073, making up 45.4%).
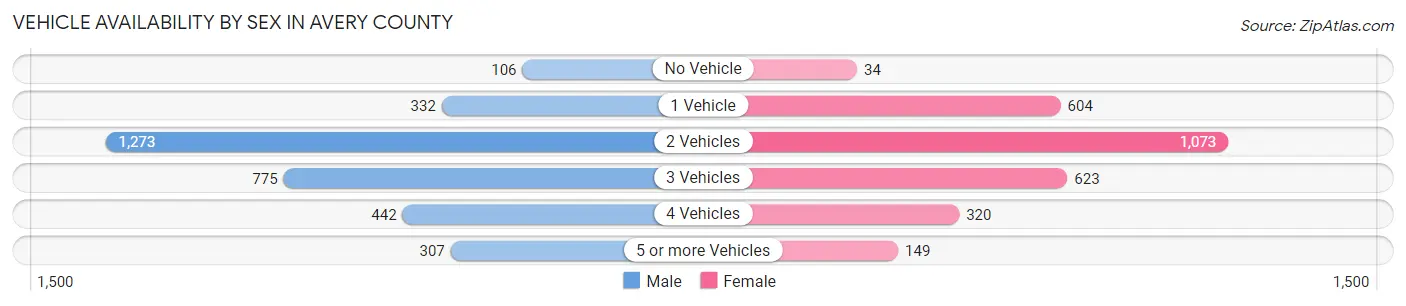
| Vehicles Available | Male | Female |
| No Vehicle | 106 (3.3%) | 34 (1.2%) |
| 1 Vehicle | 332 (10.3%) | 604 (21.5%) |
| 2 Vehicles | 1,273 (39.4%) | 1,073 (38.3%) |
| 3 Vehicles | 775 (24.0%) | 623 (22.2%) |
| 4 Vehicles | 442 (13.7%) | 320 (11.4%) |
| 5 or more Vehicles | 307 (9.5%) | 149 (5.3%) |
| Total | 3,235 (100.0%) | 2,803 (100.0%) |
Commute Time in Avery County
The most frequently occuring commute durations in Avery County are 15 to 19 minutes (907 commuters, 15.8%), 20 to 24 minutes (875 commuters, 15.2%), and 5 to 9 minutes (864 commuters, 15.0%).
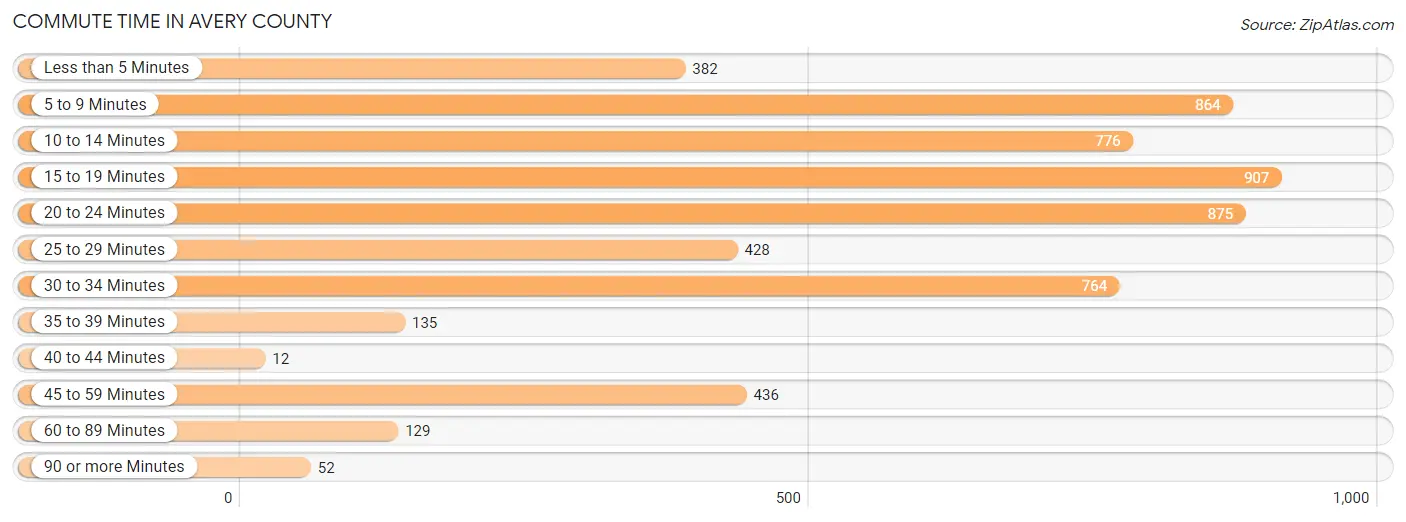
| Commute Time | # Commuters | % Commuters |
| Less than 5 Minutes | 382 | 6.6% |
| 5 to 9 Minutes | 864 | 15.0% |
| 10 to 14 Minutes | 776 | 13.5% |
| 15 to 19 Minutes | 907 | 15.8% |
| 20 to 24 Minutes | 875 | 15.2% |
| 25 to 29 Minutes | 428 | 7.4% |
| 30 to 34 Minutes | 764 | 13.3% |
| 35 to 39 Minutes | 135 | 2.3% |
| 40 to 44 Minutes | 12 | 0.2% |
| 45 to 59 Minutes | 436 | 7.6% |
| 60 to 89 Minutes | 129 | 2.2% |
| 90 or more Minutes | 52 | 0.9% |
Commute Time by Sex in Avery County
The most common commute times in Avery County are 20 to 24 minutes (573 commuters, 18.4%) for males and 15 to 19 minutes (478 commuters, 18.1%) for females.
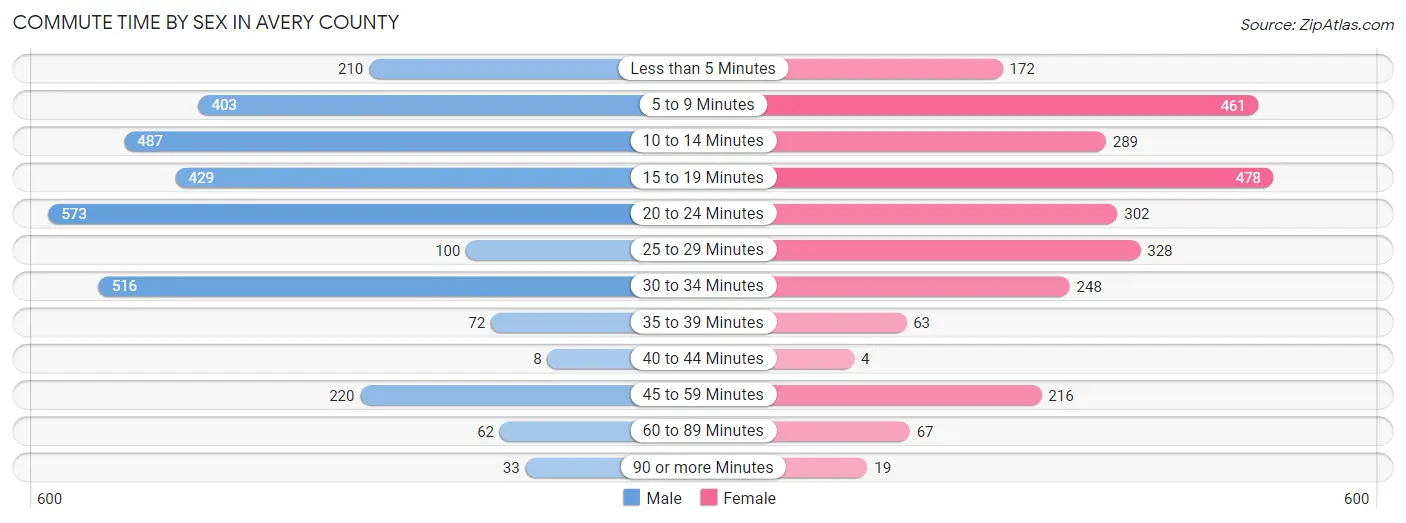
| Commute Time | Male | Female |
| Less than 5 Minutes | 210 (6.8%) | 172 (6.5%) |
| 5 to 9 Minutes | 403 (13.0%) | 461 (17.4%) |
| 10 to 14 Minutes | 487 (15.6%) | 289 (10.9%) |
| 15 to 19 Minutes | 429 (13.8%) | 478 (18.1%) |
| 20 to 24 Minutes | 573 (18.4%) | 302 (11.4%) |
| 25 to 29 Minutes | 100 (3.2%) | 328 (12.4%) |
| 30 to 34 Minutes | 516 (16.6%) | 248 (9.4%) |
| 35 to 39 Minutes | 72 (2.3%) | 63 (2.4%) |
| 40 to 44 Minutes | 8 (0.3%) | 4 (0.2%) |
| 45 to 59 Minutes | 220 (7.1%) | 216 (8.2%) |
| 60 to 89 Minutes | 62 (2.0%) | 67 (2.5%) |
| 90 or more Minutes | 33 (1.1%) | 19 (0.7%) |
Time of Departure to Work by Sex in Avery County
The most frequent times of departure to work in Avery County are 7:00 AM to 7:29 AM (483, 15.5%) for males and 7:30 AM to 7:59 AM (531, 20.1%) for females.
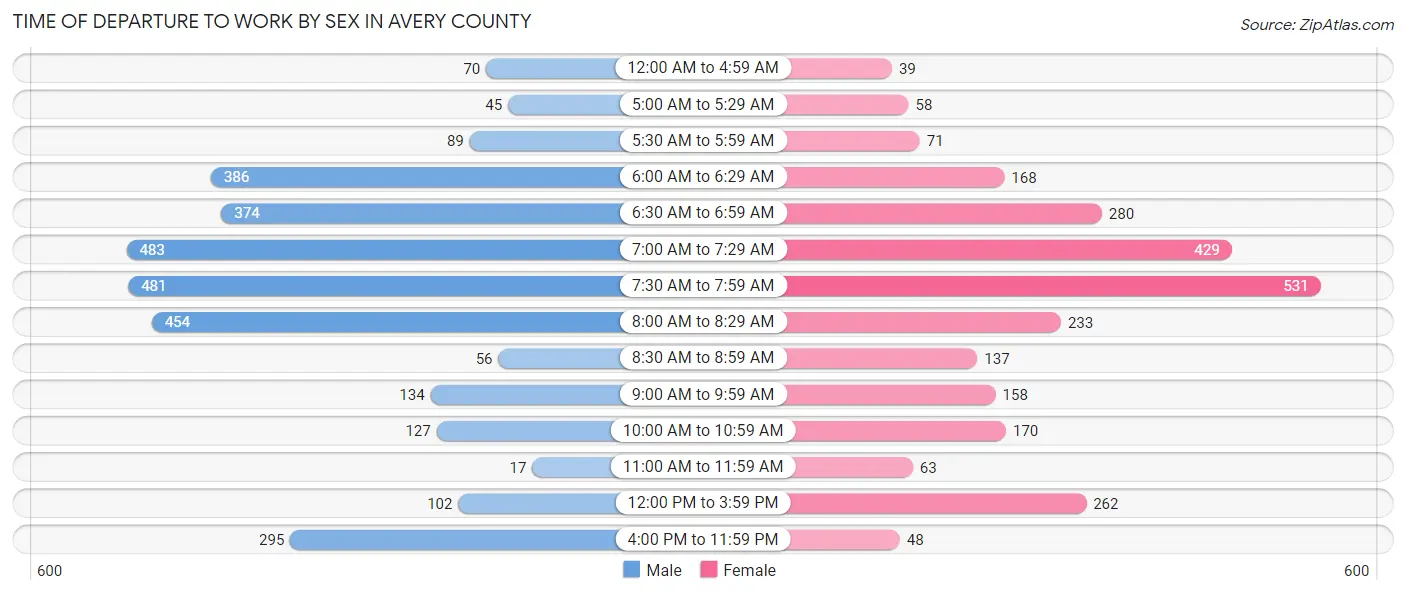
| Time of Departure | Male | Female |
| 12:00 AM to 4:59 AM | 70 (2.2%) | 39 (1.5%) |
| 5:00 AM to 5:29 AM | 45 (1.5%) | 58 (2.2%) |
| 5:30 AM to 5:59 AM | 89 (2.9%) | 71 (2.7%) |
| 6:00 AM to 6:29 AM | 386 (12.4%) | 168 (6.4%) |
| 6:30 AM to 6:59 AM | 374 (12.0%) | 280 (10.6%) |
| 7:00 AM to 7:29 AM | 483 (15.5%) | 429 (16.2%) |
| 7:30 AM to 7:59 AM | 481 (15.4%) | 531 (20.1%) |
| 8:00 AM to 8:29 AM | 454 (14.6%) | 233 (8.8%) |
| 8:30 AM to 8:59 AM | 56 (1.8%) | 137 (5.2%) |
| 9:00 AM to 9:59 AM | 134 (4.3%) | 158 (6.0%) |
| 10:00 AM to 10:59 AM | 127 (4.1%) | 170 (6.4%) |
| 11:00 AM to 11:59 AM | 17 (0.5%) | 63 (2.4%) |
| 12:00 PM to 3:59 PM | 102 (3.3%) | 262 (9.9%) |
| 4:00 PM to 11:59 PM | 295 (9.5%) | 48 (1.8%) |
| Total | 3,113 (100.0%) | 2,647 (100.0%) |
Housing Occupancy in Avery County
Occupancy by Ownership in Avery County
Of the total 6,481 dwellings in Avery County, owner-occupied units account for 5,091 (78.5%), while renter-occupied units make up 1,390 (21.4%).
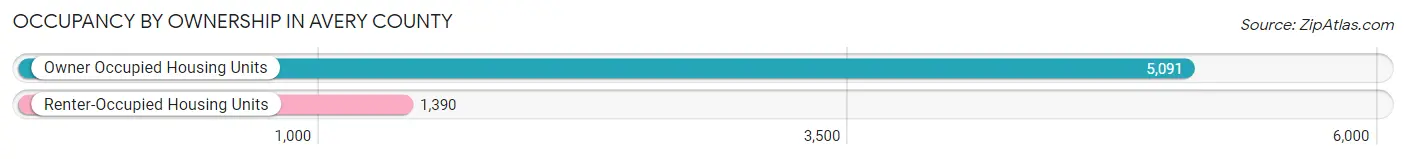
| Occupancy | # Housing Units | % Housing Units |
| Owner Occupied Housing Units | 5,091 | 78.5% |
| Renter-Occupied Housing Units | 1,390 | 21.4% |
| Total Occupied Housing Units | 6,481 | 100.0% |
Occupancy by Household Size in Avery County
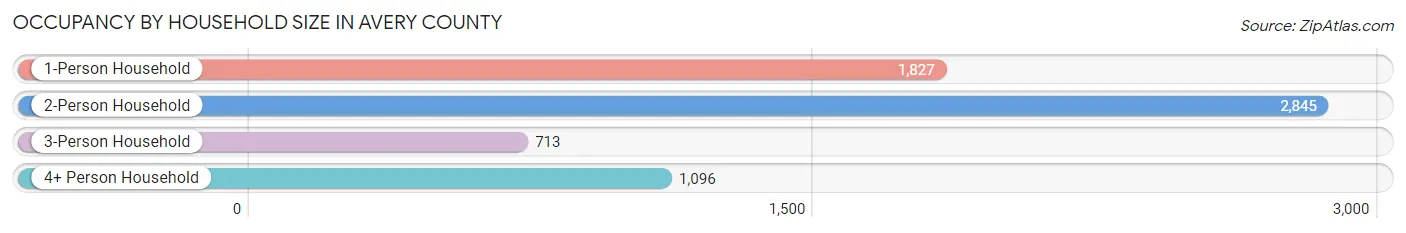
| Household Size | # Housing Units | % Housing Units |
| 1-Person Household | 1,827 | 28.2% |
| 2-Person Household | 2,845 | 43.9% |
| 3-Person Household | 713 | 11.0% |
| 4+ Person Household | 1,096 | 16.9% |
| Total Housing Units | 6,481 | 100.0% |
Occupancy by Ownership by Household Size in Avery County
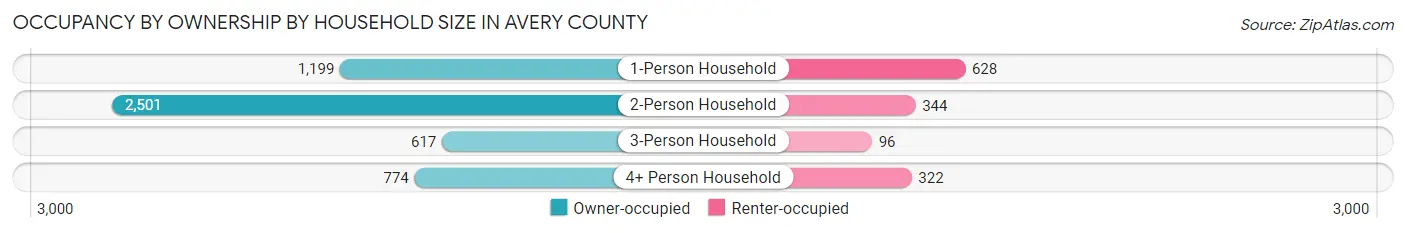
| Household Size | Owner-occupied | Renter-occupied |
| 1-Person Household | 1,199 (65.6%) | 628 (34.4%) |
| 2-Person Household | 2,501 (87.9%) | 344 (12.1%) |
| 3-Person Household | 617 (86.5%) | 96 (13.5%) |
| 4+ Person Household | 774 (70.6%) | 322 (29.4%) |
| Total Housing Units | 5,091 (78.5%) | 1,390 (21.4%) |
Occupancy by Educational Attainment in Avery County
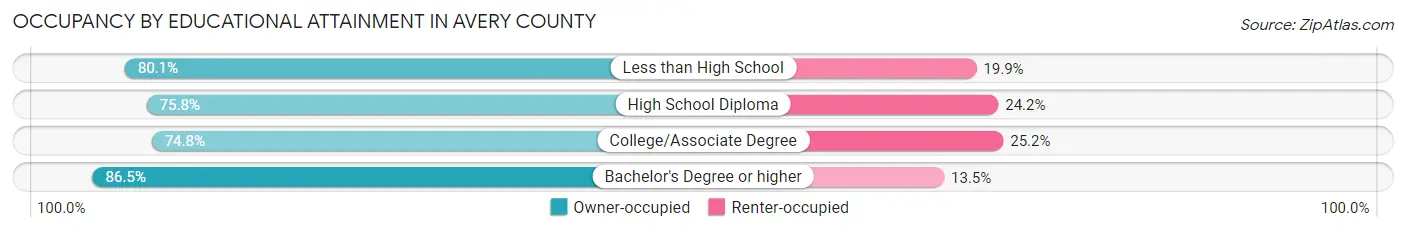
| Household Size | Owner-occupied | Renter-occupied |
| Less than High School | 548 (80.1%) | 136 (19.9%) |
| High School Diploma | 1,255 (75.8%) | 401 (24.2%) |
| College/Associate Degree | 1,881 (74.8%) | 634 (25.2%) |
| Bachelor's Degree or higher | 1,407 (86.5%) | 219 (13.5%) |
Occupancy by Age of Householder in Avery County
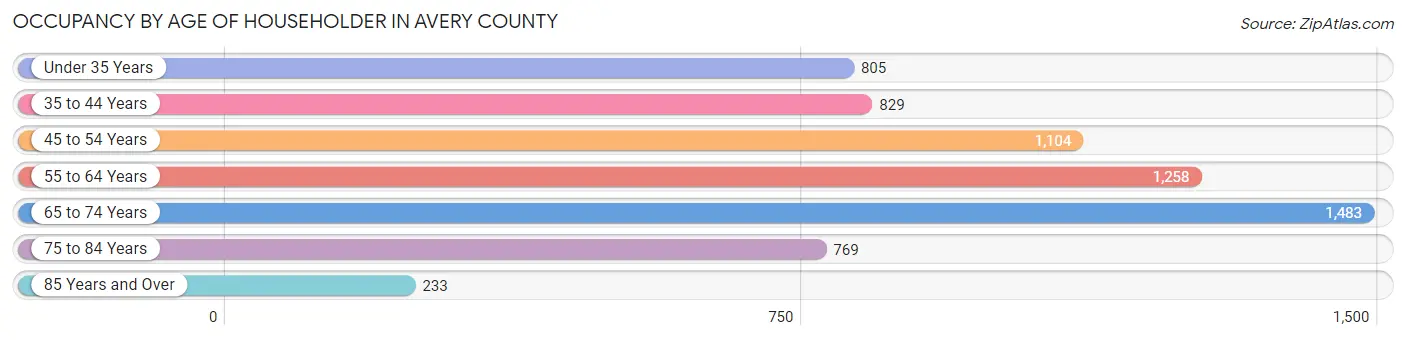
| Age Bracket | # Households | % Households |
| Under 35 Years | 805 | 12.4% |
| 35 to 44 Years | 829 | 12.8% |
| 45 to 54 Years | 1,104 | 17.0% |
| 55 to 64 Years | 1,258 | 19.4% |
| 65 to 74 Years | 1,483 | 22.9% |
| 75 to 84 Years | 769 | 11.9% |
| 85 Years and Over | 233 | 3.6% |
| Total | 6,481 | 100.0% |
Housing Finances in Avery County
Median Income by Occupancy in Avery County
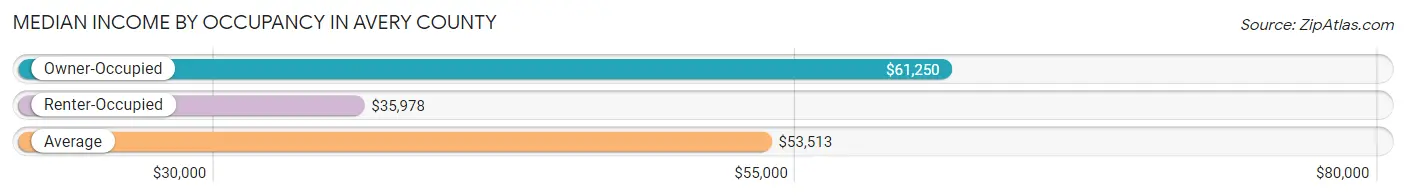
| Occupancy Type | # Households | Median Income |
| Owner-Occupied | 5,091 (78.5%) | $61,250 |
| Renter-Occupied | 1,390 (21.4%) | $35,978 |
| Average | 6,481 (100.0%) | $53,513 |
Occupancy by Householder Income Bracket in Avery County
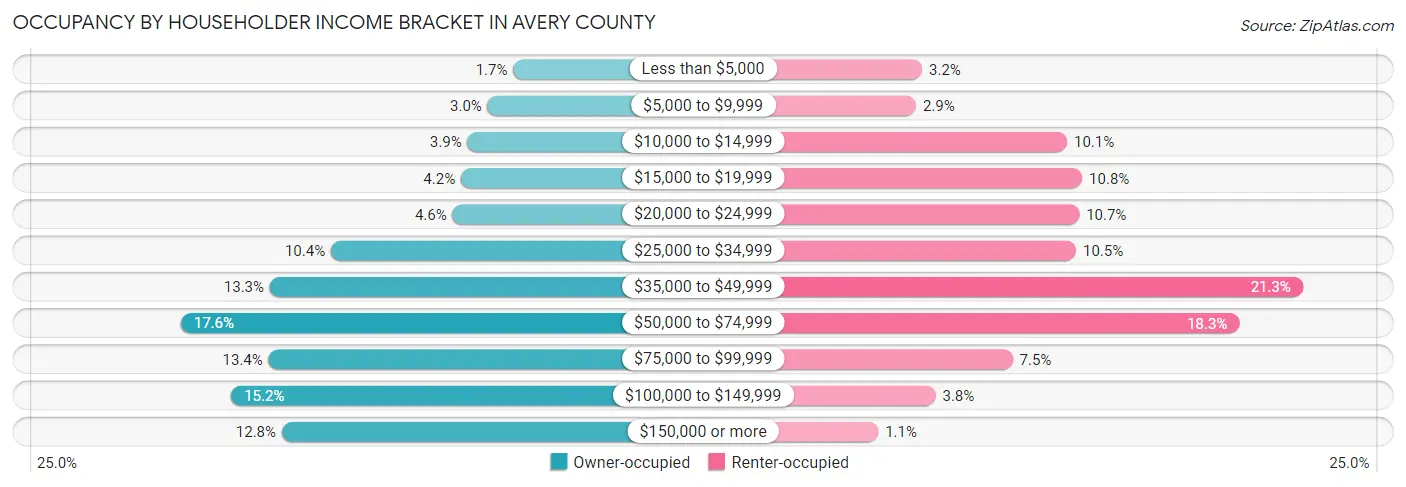
| Income Bracket | Owner-occupied | Renter-occupied |
| Less than $5,000 | 88 (1.7%) | 44 (3.2%) |
| $5,000 to $9,999 | 150 (2.9%) | 40 (2.9%) |
| $10,000 to $14,999 | 199 (3.9%) | 140 (10.1%) |
| $15,000 to $19,999 | 215 (4.2%) | 150 (10.8%) |
| $20,000 to $24,999 | 235 (4.6%) | 148 (10.6%) |
| $25,000 to $34,999 | 530 (10.4%) | 146 (10.5%) |
| $35,000 to $49,999 | 678 (13.3%) | 296 (21.3%) |
| $50,000 to $74,999 | 894 (17.6%) | 254 (18.3%) |
| $75,000 to $99,999 | 681 (13.4%) | 104 (7.5%) |
| $100,000 to $149,999 | 772 (15.2%) | 53 (3.8%) |
| $150,000 or more | 649 (12.8%) | 15 (1.1%) |
| Total | 5,091 (100.0%) | 1,390 (100.0%) |
Monthly Housing Cost Tiers in Avery County
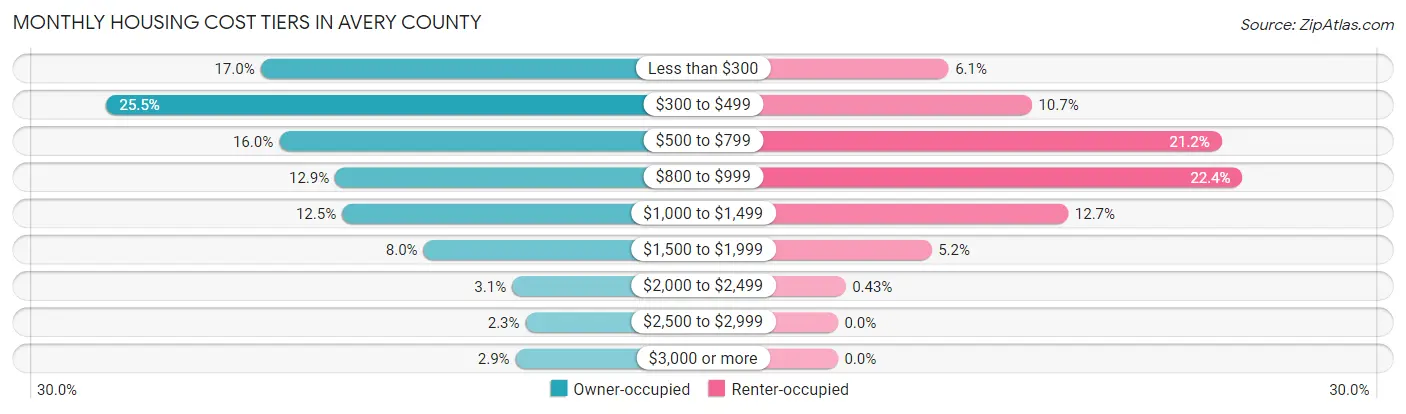
| Monthly Cost | Owner-occupied | Renter-occupied |
| Less than $300 | 864 (17.0%) | 85 (6.1%) |
| $300 to $499 | 1,297 (25.5%) | 149 (10.7%) |
| $500 to $799 | 812 (16.0%) | 295 (21.2%) |
| $800 to $999 | 654 (12.9%) | 311 (22.4%) |
| $1,000 to $1,499 | 635 (12.5%) | 177 (12.7%) |
| $1,500 to $1,999 | 406 (8.0%) | 72 (5.2%) |
| $2,000 to $2,499 | 157 (3.1%) | 6 (0.4%) |
| $2,500 to $2,999 | 119 (2.3%) | 0 (0.0%) |
| $3,000 or more | 147 (2.9%) | 0 (0.0%) |
| Total | 5,091 (100.0%) | 1,390 (100.0%) |
Physical Housing Characteristics in Avery County
Housing Structures in Avery County
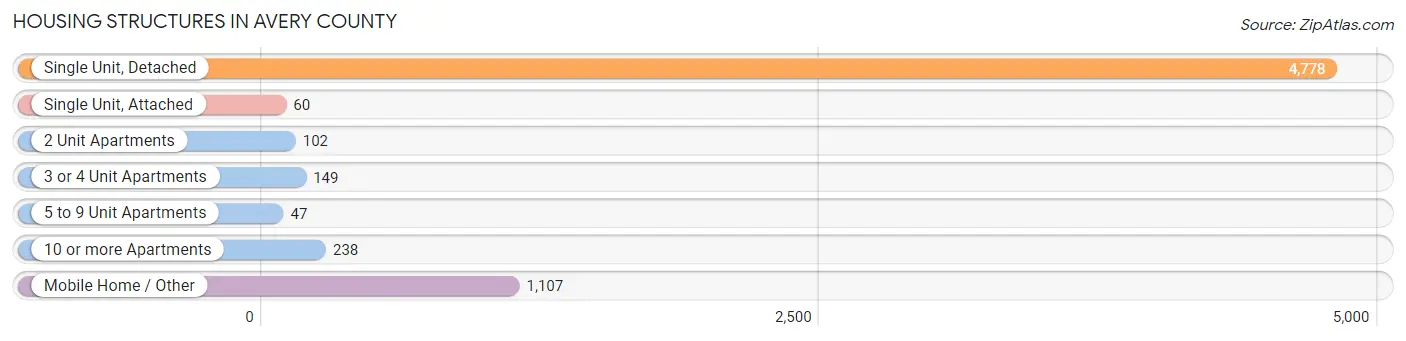
| Structure Type | # Housing Units | % Housing Units |
| Single Unit, Detached | 4,778 | 73.7% |
| Single Unit, Attached | 60 | 0.9% |
| 2 Unit Apartments | 102 | 1.6% |
| 3 or 4 Unit Apartments | 149 | 2.3% |
| 5 to 9 Unit Apartments | 47 | 0.7% |
| 10 or more Apartments | 238 | 3.7% |
| Mobile Home / Other | 1,107 | 17.1% |
| Total | 6,481 | 100.0% |
Housing Structures by Occupancy in Avery County
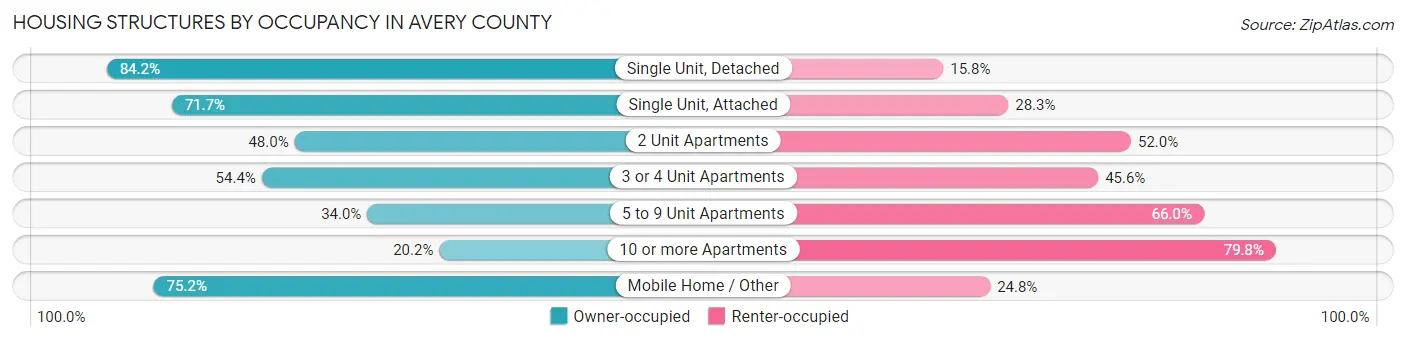
| Structure Type | Owner-occupied | Renter-occupied |
| Single Unit, Detached | 4,022 (84.2%) | 756 (15.8%) |
| Single Unit, Attached | 43 (71.7%) | 17 (28.3%) |
| 2 Unit Apartments | 49 (48.0%) | 53 (52.0%) |
| 3 or 4 Unit Apartments | 81 (54.4%) | 68 (45.6%) |
| 5 to 9 Unit Apartments | 16 (34.0%) | 31 (66.0%) |
| 10 or more Apartments | 48 (20.2%) | 190 (79.8%) |
| Mobile Home / Other | 832 (75.2%) | 275 (24.8%) |
| Total | 5,091 (78.5%) | 1,390 (21.4%) |
Housing Structures by Number of Rooms in Avery County
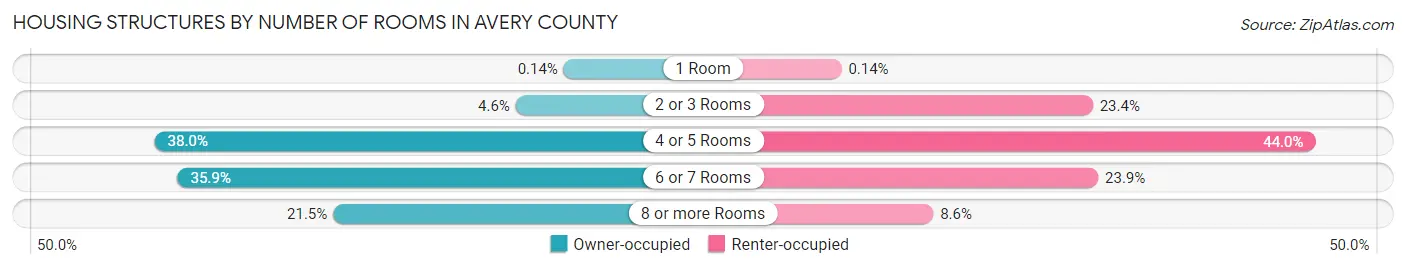
| Number of Rooms | Owner-occupied | Renter-occupied |
| 1 Room | 7 (0.1%) | 2 (0.1%) |
| 2 or 3 Rooms | 233 (4.6%) | 325 (23.4%) |
| 4 or 5 Rooms | 1,933 (38.0%) | 611 (44.0%) |
| 6 or 7 Rooms | 1,825 (35.8%) | 332 (23.9%) |
| 8 or more Rooms | 1,093 (21.5%) | 120 (8.6%) |
| Total | 5,091 (100.0%) | 1,390 (100.0%) |
Housing Structure by Heating Type in Avery County
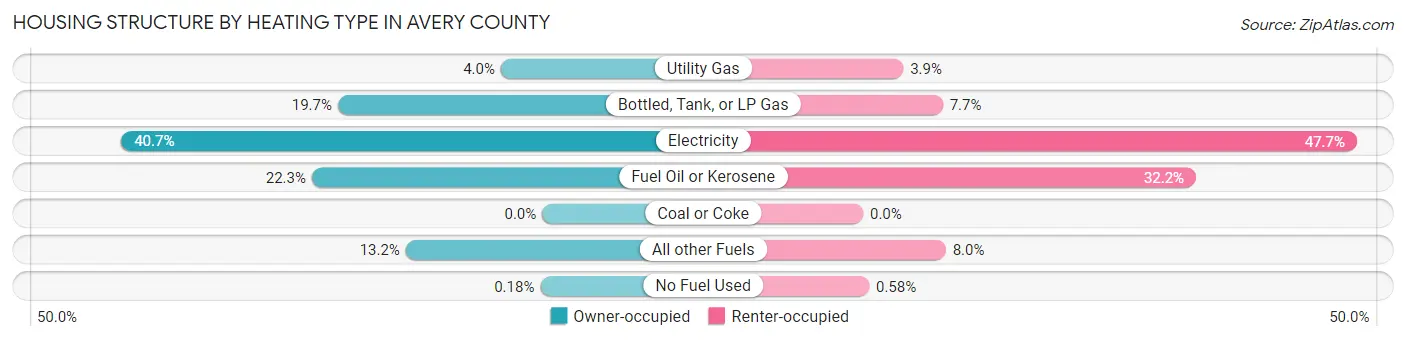
| Heating Type | Owner-occupied | Renter-occupied |
| Utility Gas | 203 (4.0%) | 54 (3.9%) |
| Bottled, Tank, or LP Gas | 1,005 (19.7%) | 107 (7.7%) |
| Electricity | 2,070 (40.7%) | 663 (47.7%) |
| Fuel Oil or Kerosene | 1,133 (22.3%) | 447 (32.2%) |
| Coal or Coke | 0 (0.0%) | 0 (0.0%) |
| All other Fuels | 671 (13.2%) | 111 (8.0%) |
| No Fuel Used | 9 (0.2%) | 8 (0.6%) |
| Total | 5,091 (100.0%) | 1,390 (100.0%) |
Household Vehicle Usage in Avery County
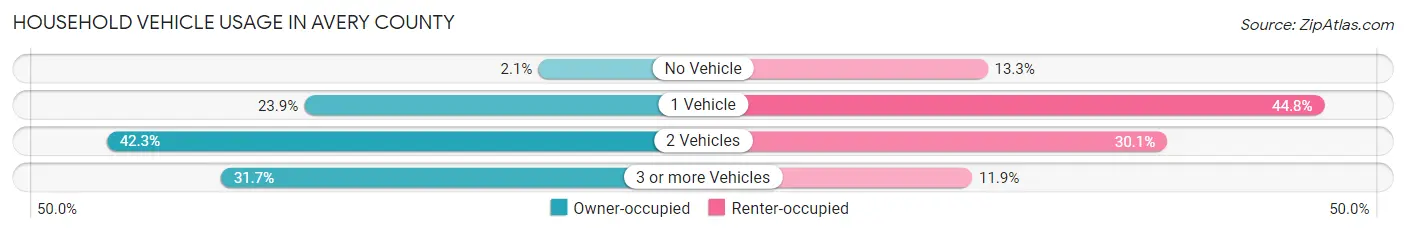
| Vehicles per Household | Owner-occupied | Renter-occupied |
| No Vehicle | 105 (2.1%) | 185 (13.3%) |
| 1 Vehicle | 1,218 (23.9%) | 622 (44.8%) |
| 2 Vehicles | 2,155 (42.3%) | 418 (30.1%) |
| 3 or more Vehicles | 1,613 (31.7%) | 165 (11.9%) |
| Total | 5,091 (100.0%) | 1,390 (100.0%) |
Real Estate & Mortgages in Avery County
Real Estate and Mortgage Overview in Avery County
| Characteristic | Without Mortgage | With Mortgage |
| Housing Units | 2,781 | 2,310 |
| Median Property Value | $210,300 | $220,700 |
| Median Household Income | $53,031 | $351 |
| Monthly Housing Costs | $373 | $143 |
| Real Estate Taxes | $811 | $16 |
Property Value by Mortgage Status in Avery County
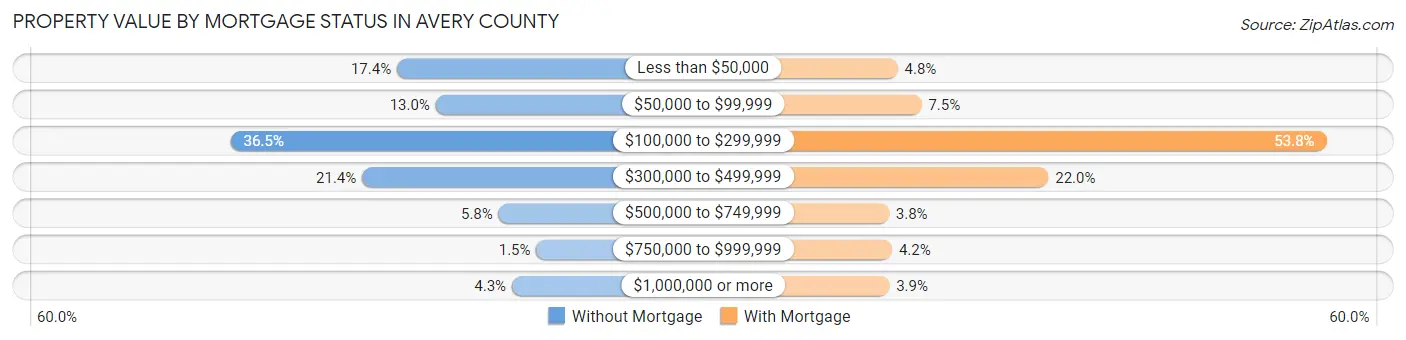
| Property Value | Without Mortgage | With Mortgage |
| Less than $50,000 | 485 (17.4%) | 111 (4.8%) |
| $50,000 to $99,999 | 362 (13.0%) | 174 (7.5%) |
| $100,000 to $299,999 | 1,014 (36.5%) | 1,243 (53.8%) |
| $300,000 to $499,999 | 596 (21.4%) | 509 (22.0%) |
| $500,000 to $749,999 | 162 (5.8%) | 88 (3.8%) |
| $750,000 to $999,999 | 42 (1.5%) | 96 (4.2%) |
| $1,000,000 or more | 120 (4.3%) | 89 (3.8%) |
| Total | 2,781 (100.0%) | 2,310 (100.0%) |
Household Income by Mortgage Status in Avery County
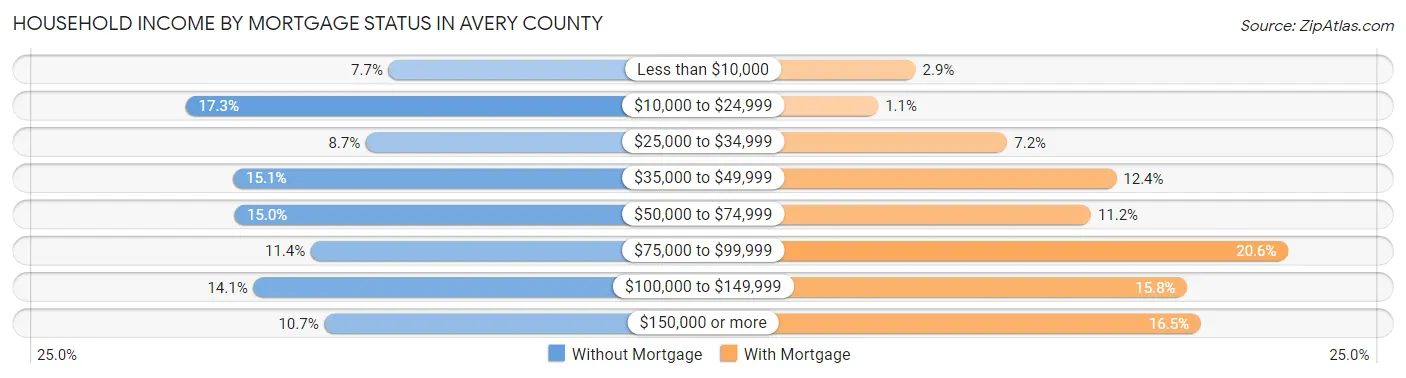
| Household Income | Without Mortgage | With Mortgage |
| Less than $10,000 | 213 (7.7%) | 66 (2.9%) |
| $10,000 to $24,999 | 482 (17.3%) | 25 (1.1%) |
| $25,000 to $34,999 | 243 (8.7%) | 167 (7.2%) |
| $35,000 to $49,999 | 419 (15.1%) | 287 (12.4%) |
| $50,000 to $74,999 | 418 (15.0%) | 259 (11.2%) |
| $75,000 to $99,999 | 316 (11.4%) | 476 (20.6%) |
| $100,000 to $149,999 | 392 (14.1%) | 365 (15.8%) |
| $150,000 or more | 298 (10.7%) | 380 (16.5%) |
| Total | 2,781 (100.0%) | 2,310 (100.0%) |
Property Value to Household Income Ratio in Avery County
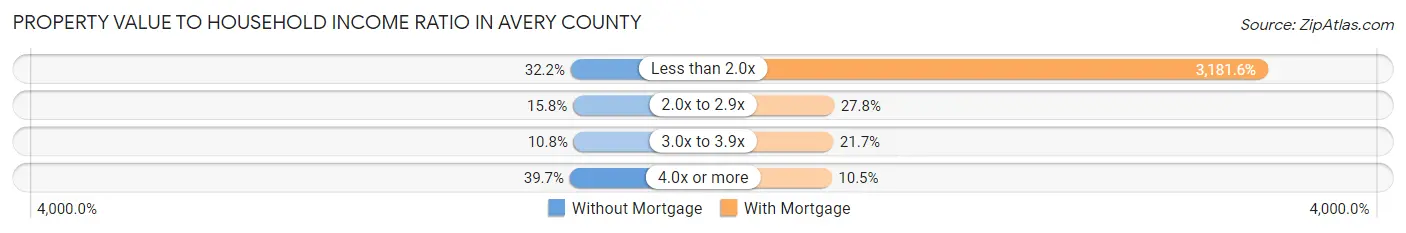
| Value-to-Income Ratio | Without Mortgage | With Mortgage |
| Less than 2.0x | 895 (32.2%) | 73,495 (3,181.6%) |
| 2.0x to 2.9x | 438 (15.8%) | 642 (27.8%) |
| 3.0x to 3.9x | 301 (10.8%) | 501 (21.7%) |
| 4.0x or more | 1,104 (39.7%) | 242 (10.5%) |
| Total | 2,781 (100.0%) | 2,310 (100.0%) |
Real Estate Taxes by Mortgage Status in Avery County
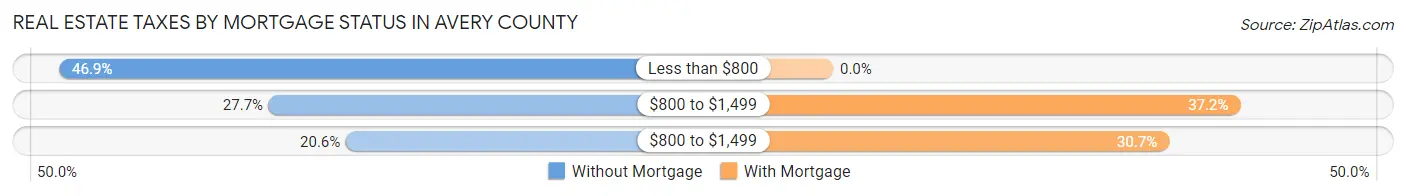
| Property Taxes | Without Mortgage | With Mortgage |
| Less than $800 | 1,303 (46.9%) | 0 (0.0%) |
| $800 to $1,499 | 770 (27.7%) | 859 (37.2%) |
| $800 to $1,499 | 574 (20.6%) | 709 (30.7%) |
| Total | 2,781 (100.0%) | 2,310 (100.0%) |
Health & Disability in Avery County
Health Insurance Coverage by Age in Avery County
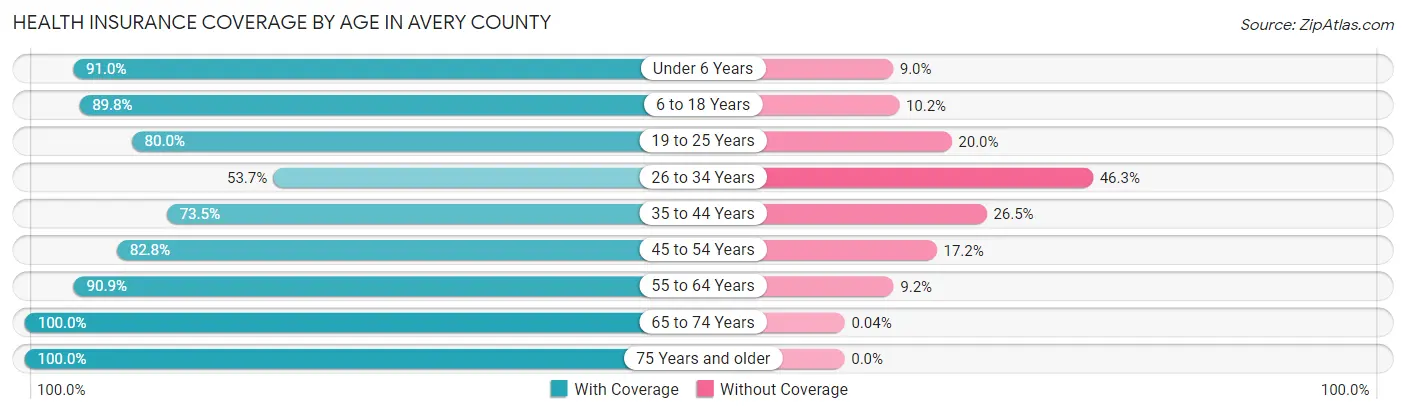
| Age Bracket | With Coverage | Without Coverage |
| Under 6 Years | 664 (91.0%) | 66 (9.0%) |
| 6 to 18 Years | 1,771 (89.8%) | 201 (10.2%) |
| 19 to 25 Years | 1,098 (80.0%) | 274 (20.0%) |
| 26 to 34 Years | 849 (53.7%) | 733 (46.3%) |
| 35 to 44 Years | 1,189 (73.5%) | 429 (26.5%) |
| 45 to 54 Years | 1,670 (82.8%) | 347 (17.2%) |
| 55 to 64 Years | 1,996 (90.8%) | 201 (9.1%) |
| 65 to 74 Years | 2,348 (100.0%) | 1 (0.0%) |
| 75 Years and older | 1,550 (100.0%) | 0 (0.0%) |
| Total | 13,135 (85.4%) | 2,252 (14.6%) |
Health Insurance Coverage by Citizenship Status in Avery County

| Citizenship Status | With Coverage | Without Coverage |
| Native Born | 664 (91.0%) | 66 (9.0%) |
| Foreign Born, Citizen | 1,771 (89.8%) | 201 (10.2%) |
| Foreign Born, not a Citizen | 1,098 (80.0%) | 274 (20.0%) |
Health Insurance Coverage by Household Income in Avery County
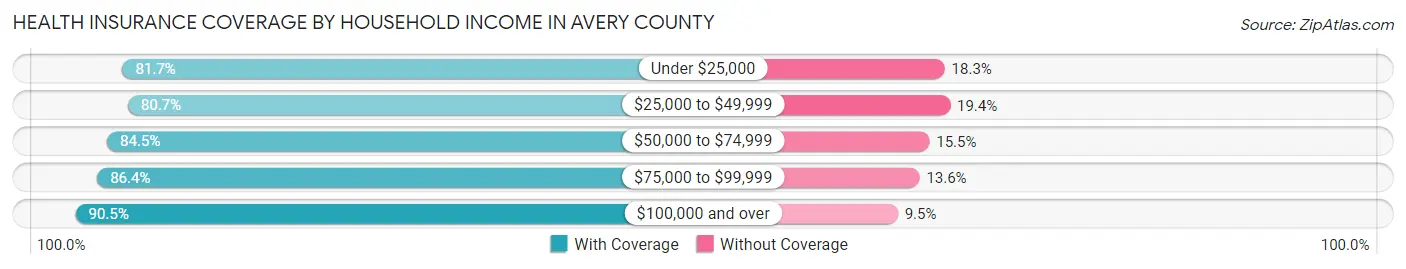
| Household Income | With Coverage | Without Coverage |
| Under $25,000 | 1,737 (81.7%) | 390 (18.3%) |
| $25,000 to $49,999 | 2,701 (80.6%) | 648 (19.4%) |
| $50,000 to $74,999 | 2,565 (84.5%) | 469 (15.5%) |
| $75,000 to $99,999 | 1,917 (86.4%) | 302 (13.6%) |
| $100,000 and over | 3,548 (90.5%) | 374 (9.5%) |
Public vs Private Health Insurance Coverage by Age in Avery County
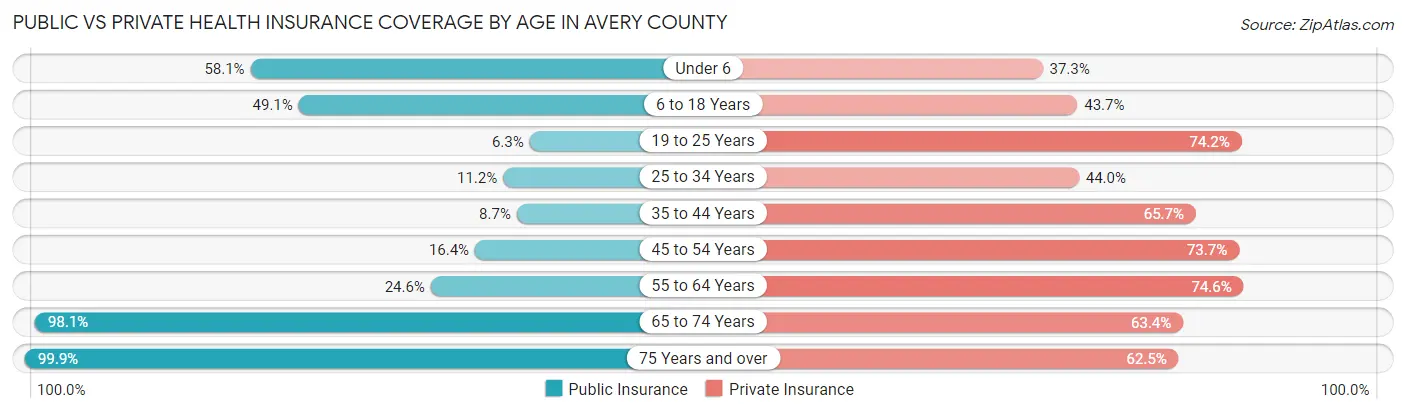
| Age Bracket | Public Insurance | Private Insurance |
| Under 6 | 424 (58.1%) | 272 (37.3%) |
| 6 to 18 Years | 969 (49.1%) | 862 (43.7%) |
| 19 to 25 Years | 86 (6.3%) | 1,018 (74.2%) |
| 25 to 34 Years | 177 (11.2%) | 696 (44.0%) |
| 35 to 44 Years | 140 (8.6%) | 1,063 (65.7%) |
| 45 to 54 Years | 331 (16.4%) | 1,487 (73.7%) |
| 55 to 64 Years | 541 (24.6%) | 1,638 (74.6%) |
| 65 to 74 Years | 2,304 (98.1%) | 1,488 (63.3%) |
| 75 Years and over | 1,549 (99.9%) | 969 (62.5%) |
| Total | 6,521 (42.4%) | 9,493 (61.7%) |
Disability Status by Sex by Age in Avery County
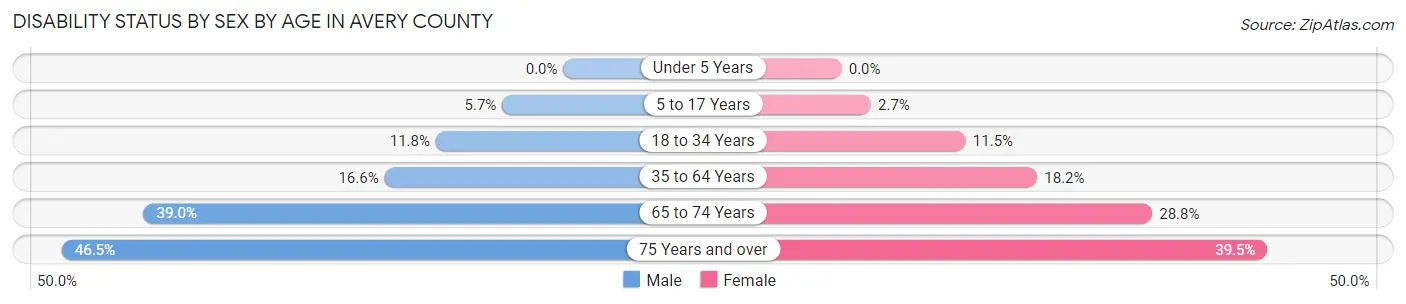
| Age Bracket | Male | Female |
| Under 5 Years | 0 (0.0%) | 0 (0.0%) |
| 5 to 17 Years | 49 (5.7%) | 24 (2.7%) |
| 18 to 34 Years | 192 (11.8%) | 190 (11.5%) |
| 35 to 64 Years | 466 (16.6%) | 549 (18.1%) |
| 65 to 74 Years | 446 (39.0%) | 347 (28.8%) |
| 75 Years and over | 336 (46.5%) | 327 (39.5%) |
Disability Class by Sex by Age in Avery County
Disability Class: Hearing Difficulty
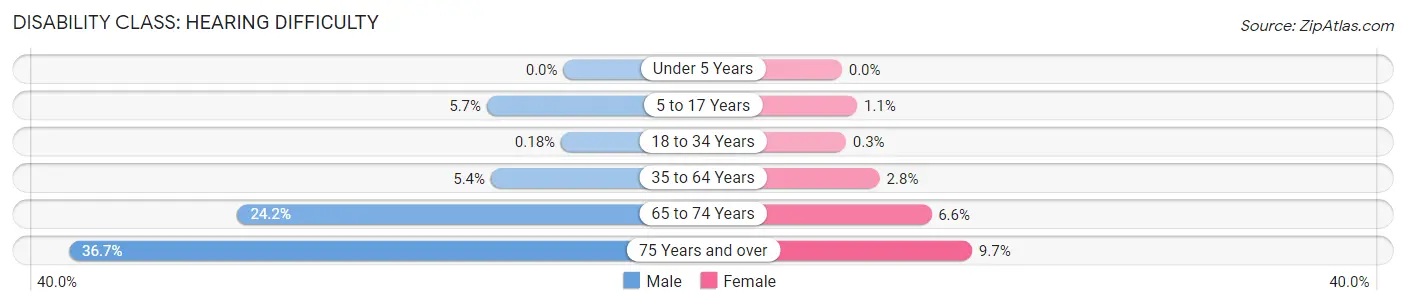
| Age Bracket | Male | Female |
| Under 5 Years | 0 (0.0%) | 0 (0.0%) |
| 5 to 17 Years | 49 (5.7%) | 10 (1.1%) |
| 18 to 34 Years | 3 (0.2%) | 5 (0.3%) |
| 35 to 64 Years | 151 (5.4%) | 85 (2.8%) |
| 65 to 74 Years | 277 (24.2%) | 80 (6.6%) |
| 75 Years and over | 265 (36.7%) | 80 (9.7%) |
Disability Class: Vision Difficulty
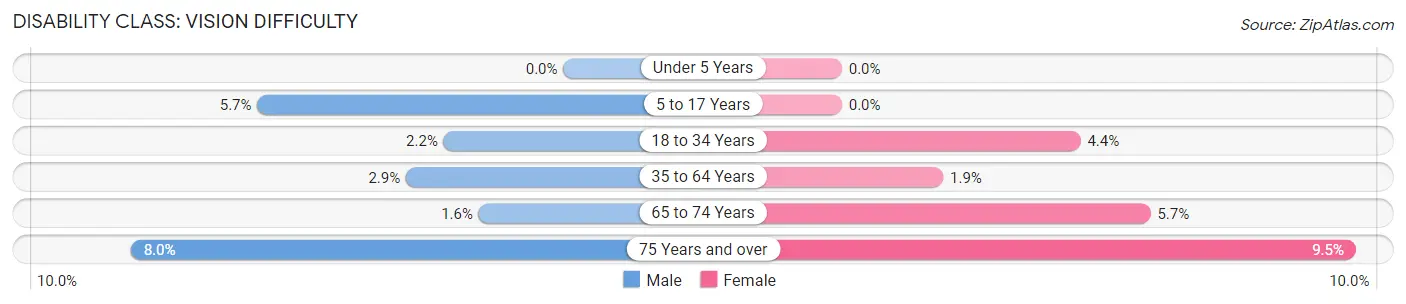
| Age Bracket | Male | Female |
| Under 5 Years | 0 (0.0%) | 0 (0.0%) |
| 5 to 17 Years | 49 (5.7%) | 0 (0.0%) |
| 18 to 34 Years | 36 (2.2%) | 73 (4.4%) |
| 35 to 64 Years | 82 (2.9%) | 57 (1.9%) |
| 65 to 74 Years | 18 (1.6%) | 69 (5.7%) |
| 75 Years and over | 58 (8.0%) | 79 (9.5%) |
Disability Class: Cognitive Difficulty
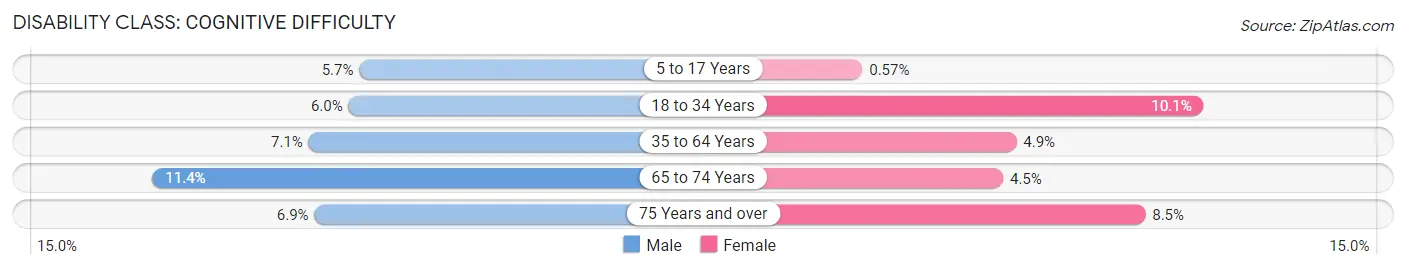
| Age Bracket | Male | Female |
| 5 to 17 Years | 49 (5.7%) | 5 (0.6%) |
| 18 to 34 Years | 97 (6.0%) | 166 (10.1%) |
| 35 to 64 Years | 199 (7.1%) | 147 (4.9%) |
| 65 to 74 Years | 131 (11.4%) | 54 (4.5%) |
| 75 Years and over | 50 (6.9%) | 70 (8.5%) |
Disability Class: Ambulatory Difficulty
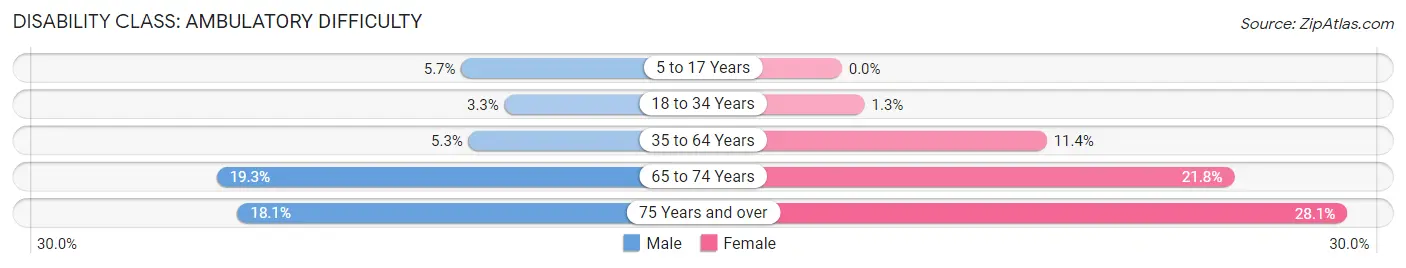
| Age Bracket | Male | Female |
| 5 to 17 Years | 49 (5.7%) | 0 (0.0%) |
| 18 to 34 Years | 53 (3.3%) | 21 (1.3%) |
| 35 to 64 Years | 148 (5.3%) | 345 (11.4%) |
| 65 to 74 Years | 221 (19.3%) | 263 (21.8%) |
| 75 Years and over | 131 (18.1%) | 233 (28.1%) |
Disability Class: Self-Care Difficulty
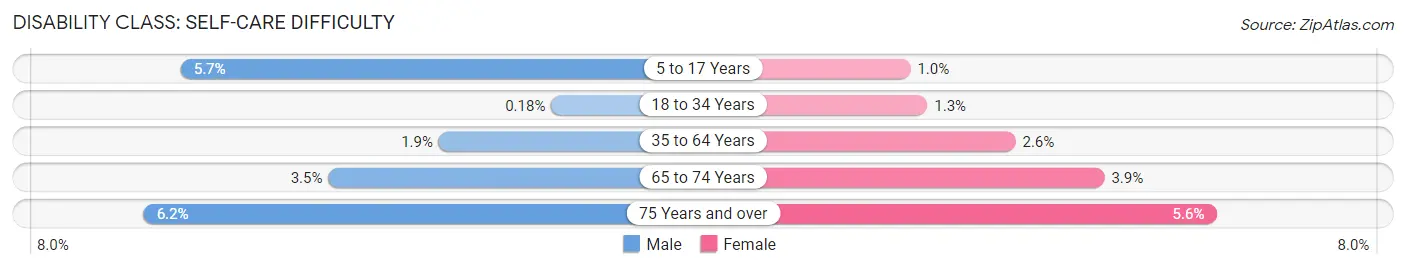
| Age Bracket | Male | Female |
| 5 to 17 Years | 49 (5.7%) | 9 (1.0%) |
| 18 to 34 Years | 3 (0.2%) | 21 (1.3%) |
| 35 to 64 Years | 52 (1.8%) | 78 (2.6%) |
| 65 to 74 Years | 40 (3.5%) | 47 (3.9%) |
| 75 Years and over | 45 (6.2%) | 46 (5.6%) |
Technology Access in Avery County
Computing Device Access in Avery County
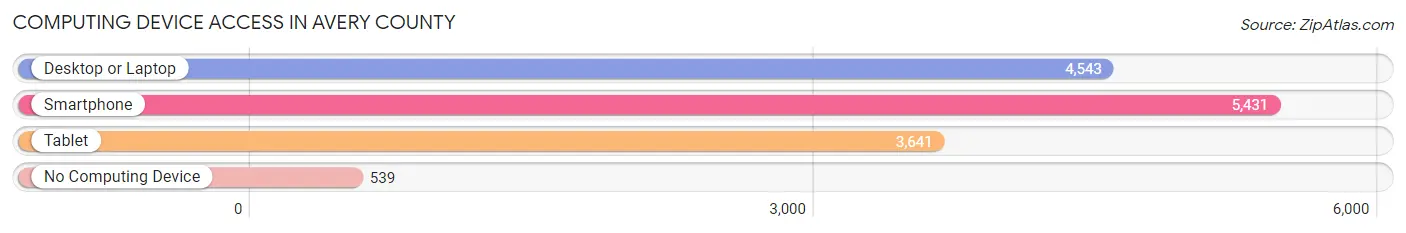
| Device Type | # Households | % Households |
| Desktop or Laptop | 4,543 | 70.1% |
| Smartphone | 5,431 | 83.8% |
| Tablet | 3,641 | 56.2% |
| No Computing Device | 539 | 8.3% |
| Total | 6,481 | 100.0% |
Internet Access in Avery County
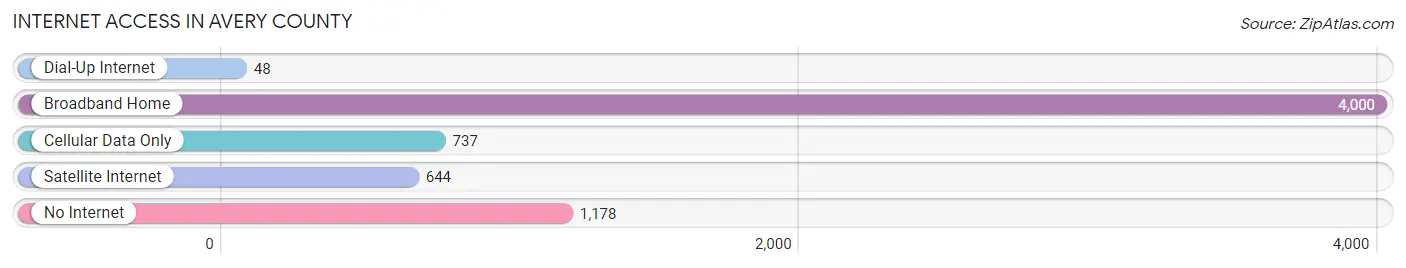
| Internet Type | # Households | % Households |
| Dial-Up Internet | 48 | 0.7% |
| Broadband Home | 4,000 | 61.7% |
| Cellular Data Only | 737 | 11.4% |
| Satellite Internet | 644 | 9.9% |
| No Internet | 1,178 | 18.2% |
| Total | 6,481 | 100.0% |
Avery County Summary
Avery County is located in the western part of North Carolina, and is part of the Blue Ridge Mountains. It is bordered by Watauga County to the north, Caldwell County to the east, Mitchell County to the south, and Johnson County, Tennessee to the west. The county seat is Newland, and the largest city is Banner Elk. The county was formed in 1911 from parts of Caldwell and Mitchell counties, and was named for Waightstill Avery, a Revolutionary War hero.
Geography
Avery County covers an area of approximately 300 square miles, and is located in the Appalachian Mountains. The terrain is mostly mountainous, with elevations ranging from 1,500 to 6,000 feet. The highest point in the county is Mount Mitchell, which is the highest peak in the eastern United States at 6,684 feet. The county is home to several rivers, including the Toe, Elk, and Cranberry. The county is also home to several lakes, including Lake Watauga, Elk River Lake, and Cranberry Lake.
Climate
Avery County has a humid subtropical climate, with hot, humid summers and cold, wet winters. The average annual temperature is around 54°F, and the average annual precipitation is around 45 inches.
Demographics
As of the 2010 census, Avery County had a population of 17,797. The population density was 59.3 people per square mile. The racial makeup of the county was 95.3% White, 1.7% African American, 0.3% Native American, 0.5% Asian, 0.1% Pacific Islander, 1.2% from other races, and 1.0% from two or more races. Hispanic or Latino of any race were 2.7% of the population.
Economy
Avery County's economy is largely based on tourism, with the county's mountainous terrain and numerous outdoor recreational opportunities drawing visitors from all over the country. The county is also home to several ski resorts, including Beech Mountain Resort, Sugar Mountain Resort, and Appalachian Ski Mountain. Other major industries in the county include manufacturing, forestry, and agriculture.
The county's largest employers include the Avery County Schools, Appalachian Regional Healthcare, and the Avery County Government. The county also has a large number of small businesses, including restaurants, retail stores, and lodging establishments.
Conclusion
Avery County is a beautiful and diverse county located in the western part of North Carolina. The county is home to a variety of outdoor recreational opportunities, as well as a thriving tourism industry. The county also has a strong manufacturing, forestry, and agricultural sector, and is home to several major employers. With its stunning mountain scenery and vibrant economy, Avery County is an ideal place to live and work.
Common Questions
What is the Total Population of Avery County?
Total Population of Avery County is 17,679.
What is the Total Male Population of Avery County?
Total Male Population of Avery County is 9,666.
What is the Total Female Population of Avery County?
Total Female Population of Avery County is 8,013.
What is the Ratio of Males per 100 Females in Avery County?
There are 120.63 Males per 100 Females in Avery County.
What is the Ratio of Females per 100 Males in Avery County?
There are 82.90 Females per 100 Males in Avery County.
What is the Median Population Age in Avery County?
Median Population Age in Avery County is 46.5 Years.
What is the Average Family Size in Avery County
Average Family Size in Avery County is 2.8 People.
What is the Average Household Size in Avery County
Average Household Size in Avery County is 2.3 People.
What is Per Capita Income in Avery County?
Per Capita income in Avery County is $30,578.
What is the Median Family Income in Avery County?
Median Family Income in Avery County is $70,968.
What is the Median Household income in Avery County?
Median Household Income in Avery County is $53,513.
What is Income or Wage Gap in Avery County?
Income or Wage Gap in Avery County is 14.6%.
Women in Avery County earn 85.4 cents for every dollar earned by a man.
What is Family Income Deficit in Avery County?
Family Income Deficit in Avery County is $8,101.
Families that are below poverty line in Avery County earn $8,101 less on average than the poverty threshold level.
What is Inequality or Gini Index in Avery County?
Inequality or Gini Index in Avery County is 0.49.
How Large is the Labor Force in Avery County?
There are 7,050 People in the Labor Forcein in Avery County.
What is the Percentage of People in the Labor Force in Avery County?
45.3% of People are in the Labor Force in Avery County.
What is the Unemployment Rate in Avery County?
Unemployment Rate in Avery County is 5.0%.