Alamance County, NC
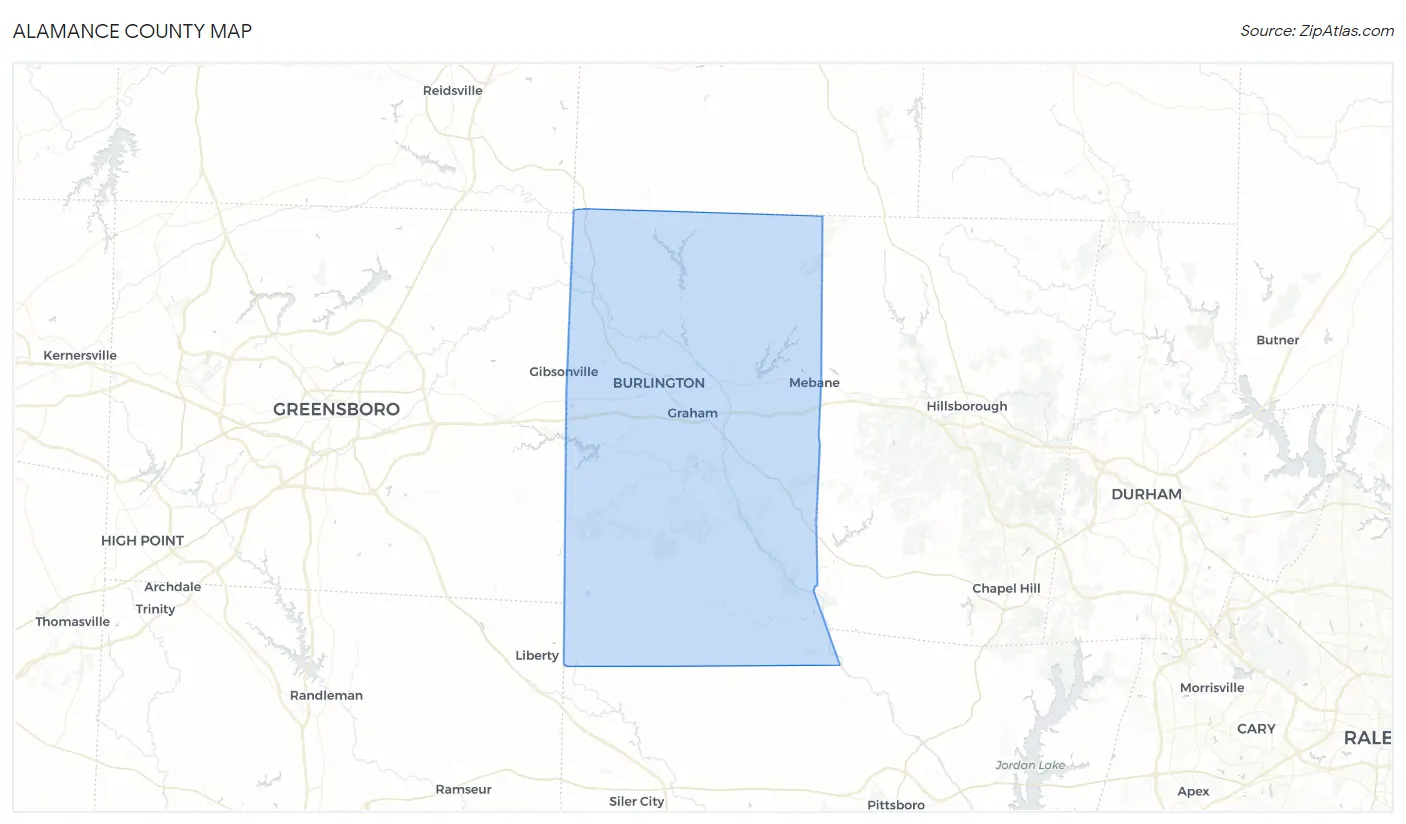
Alamance County Map
Alamance County Overview
171,779
TOTAL POPULATION
82,328
MALE POPULATION
89,451
FEMALE POPULATION
92.04
MALES / 100 FEMALES
108.65
FEMALES / 100 MALES
39.1
MEDIAN AGE
3.1
AVG FAMILY SIZE
2.5
AVG HOUSEHOLD SIZE
$32,105
PER CAPITA INCOME
$78,033
AVG FAMILY INCOME
$60,866
AVG HOUSEHOLD INCOME
20.8%
WAGE / INCOME GAP [ % ]
79.2¢/ $1
WAGE / INCOME GAP [ $ ]
$9,270
FAMILY INCOME DEFICIT
0.44
INEQUALITY / GINI INDEX
86,795
LABOR FORCE [ PEOPLE ]
62.8%
PERCENT IN LABOR FORCE
5.0%
UNEMPLOYMENT RATE
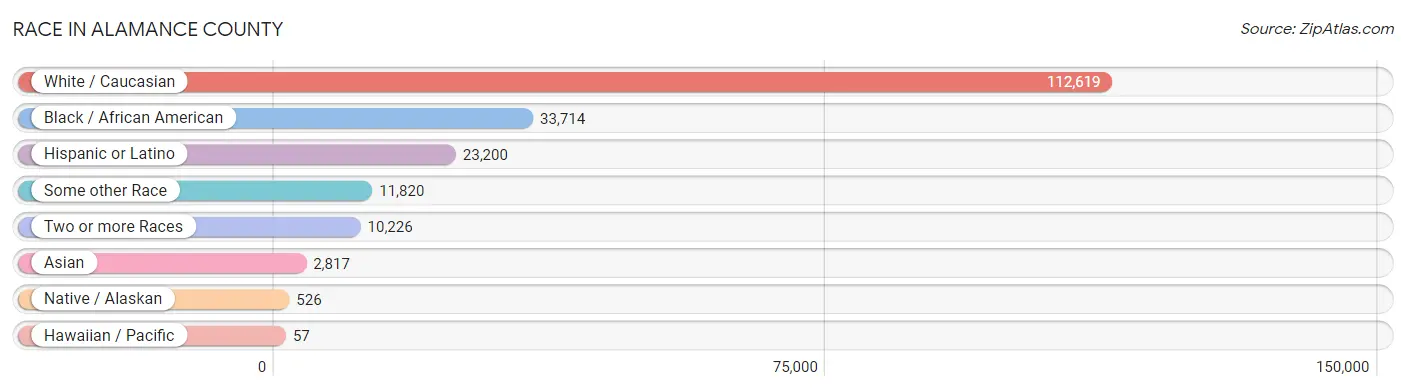
Race in Alamance County
The most populous races in Alamance County are White / Caucasian (112,619 | 65.6%), Black / African American (33,714 | 19.6%), and Hispanic or Latino (23,200 | 13.5%).
| Race | # Population | % Population |
| Asian | 2,817 | 1.6% |
| Black / African American | 33,714 | 19.6% |
| Hawaiian / Pacific | 57 | 0.0% |
| Hispanic or Latino | 23,200 | 13.5% |
| Native / Alaskan | 526 | 0.3% |
| White / Caucasian | 112,619 | 65.6% |
| Two or more Races | 10,226 | 5.9% |
| Some other Race | 11,820 | 6.9% |
| Total | 171,779 | 100.0% |
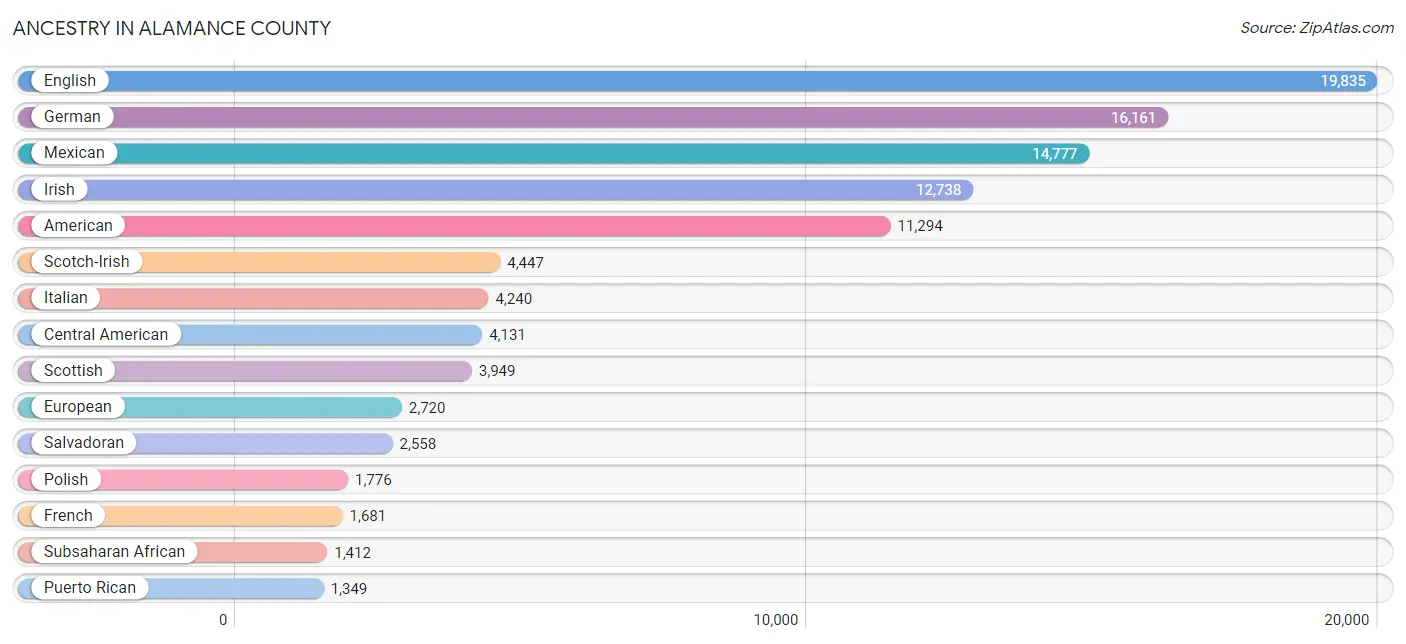
Ancestry in Alamance County
The most populous ancestries reported in Alamance County are English (19,835 | 11.6%), German (16,161 | 9.4%), Mexican (14,777 | 8.6%), Irish (12,738 | 7.4%), and American (11,294 | 6.6%), together accounting for 43.5% of all Alamance County residents.
| Ancestry | # Population | % Population |
| Afghan | 48 | 0.0% |
| African | 902 | 0.5% |
| Alaska Native | 6 | 0.0% |
| Albanian | 117 | 0.1% |
| American | 11,294 | 6.6% |
| Arab | 303 | 0.2% |
| Argentinean | 57 | 0.0% |
| Armenian | 56 | 0.0% |
| Australian | 22 | 0.0% |
| Austrian | 161 | 0.1% |
| Bahamian | 19 | 0.0% |
| Bangladeshi | 13 | 0.0% |
| Barbadian | 17 | 0.0% |
| Belgian | 76 | 0.0% |
| Bhutanese | 75 | 0.0% |
| Blackfeet | 97 | 0.1% |
| Bolivian | 34 | 0.0% |
| Brazilian | 69 | 0.0% |
| British | 704 | 0.4% |
| British West Indian | 17 | 0.0% |
| Bulgarian | 53 | 0.0% |
| Burmese | 505 | 0.3% |
| Cajun | 11 | 0.0% |
| Canadian | 150 | 0.1% |
| Cape Verdean | 100 | 0.1% |
| Celtic | 64 | 0.0% |
| Central American | 4,131 | 2.4% |
| Central American Indian | 86 | 0.1% |
| Cherokee | 629 | 0.4% |
| Chilean | 49 | 0.0% |
| Chippewa | 18 | 0.0% |
| Choctaw | 24 | 0.0% |
| Colombian | 242 | 0.1% |
| Comanche | 12 | 0.0% |
| Costa Rican | 197 | 0.1% |
| Croatian | 117 | 0.1% |
| Cuban | 309 | 0.2% |
| Czech | 190 | 0.1% |
| Czechoslovakian | 109 | 0.1% |
| Danish | 271 | 0.2% |
| Delaware | 9 | 0.0% |
| Dominican | 636 | 0.4% |
| Dutch | 1,188 | 0.7% |
| Eastern European | 182 | 0.1% |
| Ecuadorian | 431 | 0.3% |
| Egyptian | 101 | 0.1% |
| English | 19,835 | 11.6% |
| European | 2,720 | 1.6% |
| Filipino | 56 | 0.0% |
| Finnish | 92 | 0.1% |
| French | 1,681 | 1.0% |
| French American Indian | 21 | 0.0% |
| French Canadian | 532 | 0.3% |
| German | 16,161 | 9.4% |
| Greek | 379 | 0.2% |
| Guamanian / Chamorro | 48 | 0.0% |
| Guatemalan | 188 | 0.1% |
| Guyanese | 61 | 0.0% |
| Haitian | 46 | 0.0% |
| Honduran | 831 | 0.5% |
| Hungarian | 446 | 0.3% |
| Icelander | 3 | 0.0% |
| Indian (Asian) | 520 | 0.3% |
| Indonesian | 140 | 0.1% |
| Iranian | 102 | 0.1% |
| Irish | 12,738 | 7.4% |
| Iroquois | 12 | 0.0% |
| Israeli | 2 | 0.0% |
| Italian | 4,240 | 2.5% |
| Jamaican | 174 | 0.1% |
| Japanese | 1 | 0.0% |
| Kenyan | 104 | 0.1% |
| Korean | 460 | 0.3% |
| Laotian | 25 | 0.0% |
| Latvian | 22 | 0.0% |
| Lebanese | 62 | 0.0% |
| Lithuanian | 66 | 0.0% |
| Lumbee | 122 | 0.1% |
| Malaysian | 6 | 0.0% |
| Mexican | 14,777 | 8.6% |
| Mexican American Indian | 153 | 0.1% |
| Mongolian | 23 | 0.0% |
| Moroccan | 68 | 0.0% |
| Native Hawaiian | 54 | 0.0% |
| Navajo | 28 | 0.0% |
| Nicaraguan | 335 | 0.2% |
| Nigerian | 136 | 0.1% |
| Northern European | 113 | 0.1% |
| Norwegian | 588 | 0.3% |
| Pakistani | 172 | 0.1% |
| Palestinian | 8 | 0.0% |
| Panamanian | 22 | 0.0% |
| Pennsylvania German | 42 | 0.0% |
| Peruvian | 61 | 0.0% |
| Polish | 1,776 | 1.0% |
| Portuguese | 234 | 0.1% |
| Pueblo | 87 | 0.1% |
| Puerto Rican | 1,349 | 0.8% |
| Romanian | 50 | 0.0% |
| Russian | 257 | 0.2% |
| Salvadoran | 2,558 | 1.5% |
| Samoan | 4 | 0.0% |
| Scandinavian | 359 | 0.2% |
| Scotch-Irish | 4,447 | 2.6% |
| Scottish | 3,949 | 2.3% |
| Sierra Leonean | 95 | 0.1% |
| Sioux | 58 | 0.0% |
| Slovak | 304 | 0.2% |
| Slovene | 55 | 0.0% |
| South American | 1,038 | 0.6% |
| Spaniard | 141 | 0.1% |
| Spanish | 311 | 0.2% |
| Sri Lankan | 431 | 0.3% |
| Subsaharan African | 1,412 | 0.8% |
| Sudanese | 48 | 0.0% |
| Swedish | 608 | 0.4% |
| Swiss | 375 | 0.2% |
| Syrian | 12 | 0.0% |
| Thai | 821 | 0.5% |
| Tongan | 6 | 0.0% |
| Trinidadian and Tobagonian | 65 | 0.0% |
| Turkish | 12 | 0.0% |
| Ugandan | 23 | 0.0% |
| Ukrainian | 376 | 0.2% |
| Uruguayan | 29 | 0.0% |
| Venezuelan | 135 | 0.1% |
| Welsh | 886 | 0.5% |
| West Indian | 81 | 0.1% |
| Yaqui | 24 | 0.0% |
| Yugoslavian | 27 | 0.0% |
| Zimbabwean | 4 | 0.0% | View All 131 Rows |
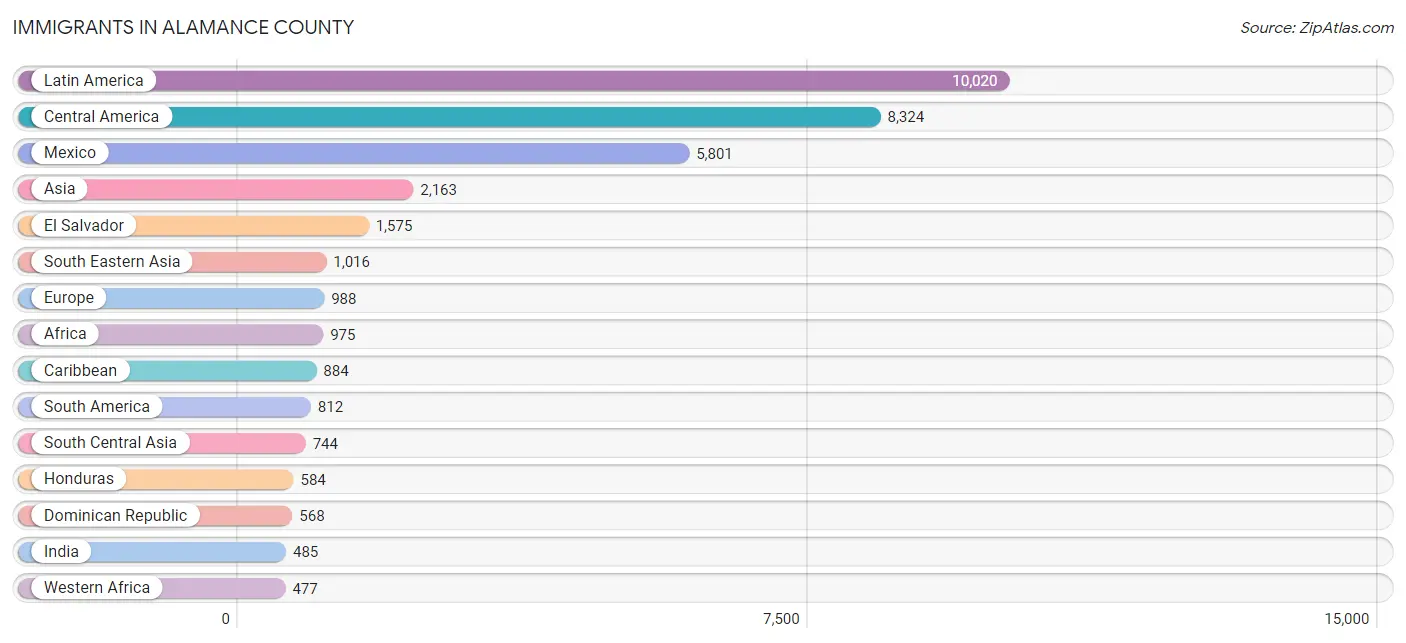
Immigrants in Alamance County
The most numerous immigrant groups reported in Alamance County came from Latin America (10,020 | 5.8%), Central America (8,324 | 4.9%), Mexico (5,801 | 3.4%), Asia (2,163 | 1.3%), and El Salvador (1,575 | 0.9%), together accounting for 16.2% of all Alamance County residents.
| Immigration Origin | # Population | % Population |
| Afghanistan | 39 | 0.0% |
| Africa | 975 | 0.6% |
| Albania | 25 | 0.0% |
| Argentina | 152 | 0.1% |
| Asia | 2,163 | 1.3% |
| Australia | 9 | 0.0% |
| Bolivia | 72 | 0.0% |
| Bosnia and Herzegovina | 9 | 0.0% |
| Brazil | 59 | 0.0% |
| Canada | 348 | 0.2% |
| Caribbean | 884 | 0.5% |
| Central America | 8,324 | 4.9% |
| Chile | 16 | 0.0% |
| China | 164 | 0.1% |
| Colombia | 256 | 0.2% |
| Costa Rica | 77 | 0.0% |
| Croatia | 1 | 0.0% |
| Cuba | 131 | 0.1% |
| Czechoslovakia | 31 | 0.0% |
| Dominican Republic | 568 | 0.3% |
| Eastern Africa | 155 | 0.1% |
| Eastern Asia | 239 | 0.1% |
| Eastern Europe | 303 | 0.2% |
| Ecuador | 215 | 0.1% |
| Egypt | 87 | 0.1% |
| El Salvador | 1,575 | 0.9% |
| England | 90 | 0.1% |
| Ethiopia | 5 | 0.0% |
| Europe | 988 | 0.6% |
| France | 1 | 0.0% |
| Germany | 167 | 0.1% |
| Ghana | 161 | 0.1% |
| Greece | 18 | 0.0% |
| Guatemala | 111 | 0.1% |
| Guyana | 19 | 0.0% |
| Honduras | 584 | 0.3% |
| Hong Kong | 29 | 0.0% |
| India | 485 | 0.3% |
| Iran | 38 | 0.0% |
| Ireland | 9 | 0.0% |
| Italy | 92 | 0.1% |
| Jamaica | 51 | 0.0% |
| Japan | 13 | 0.0% |
| Kenya | 104 | 0.1% |
| Korea | 62 | 0.0% |
| Laos | 13 | 0.0% |
| Latin America | 10,020 | 5.8% |
| Lebanon | 10 | 0.0% |
| Malaysia | 4 | 0.0% |
| Mexico | 5,801 | 3.4% |
| Middle Africa | 12 | 0.0% |
| Moldova | 9 | 0.0% |
| Morocco | 39 | 0.0% |
| Netherlands | 17 | 0.0% |
| Nicaragua | 171 | 0.1% |
| Nigeria | 111 | 0.1% |
| Northern Africa | 234 | 0.1% |
| Northern Europe | 238 | 0.1% |
| Oceania | 9 | 0.0% |
| Pakistan | 182 | 0.1% |
| Panama | 5 | 0.0% |
| Peru | 23 | 0.0% |
| Philippines | 471 | 0.3% |
| Poland | 1 | 0.0% |
| Portugal | 39 | 0.0% |
| Romania | 19 | 0.0% |
| Russia | 63 | 0.0% |
| Saudi Arabia | 99 | 0.1% |
| Scotland | 37 | 0.0% |
| Serbia | 12 | 0.0% |
| Sierra Leone | 95 | 0.1% |
| South Africa | 13 | 0.0% |
| South America | 812 | 0.5% |
| South Central Asia | 744 | 0.4% |
| South Eastern Asia | 1,016 | 0.6% |
| Southern Europe | 262 | 0.2% |
| Spain | 113 | 0.1% |
| Sudan | 98 | 0.1% |
| Syria | 13 | 0.0% |
| Thailand | 218 | 0.1% |
| Trinidad and Tobago | 106 | 0.1% |
| Uganda | 27 | 0.0% |
| Ukraine | 133 | 0.1% |
| Vietnam | 241 | 0.1% |
| Western Africa | 477 | 0.3% |
| Western Asia | 156 | 0.1% |
| Western Europe | 185 | 0.1% |
| Yemen | 34 | 0.0% |
| Zaire | 12 | 0.0% |
| Zimbabwe | 4 | 0.0% | View All 90 Rows |
Sex and Age in Alamance County
Sex and Age in Alamance County
The most populous age groups in Alamance County are 15 to 19 Years (6,441 | 7.8%) for men and 15 to 19 Years (6,712 | 7.5%) for women.
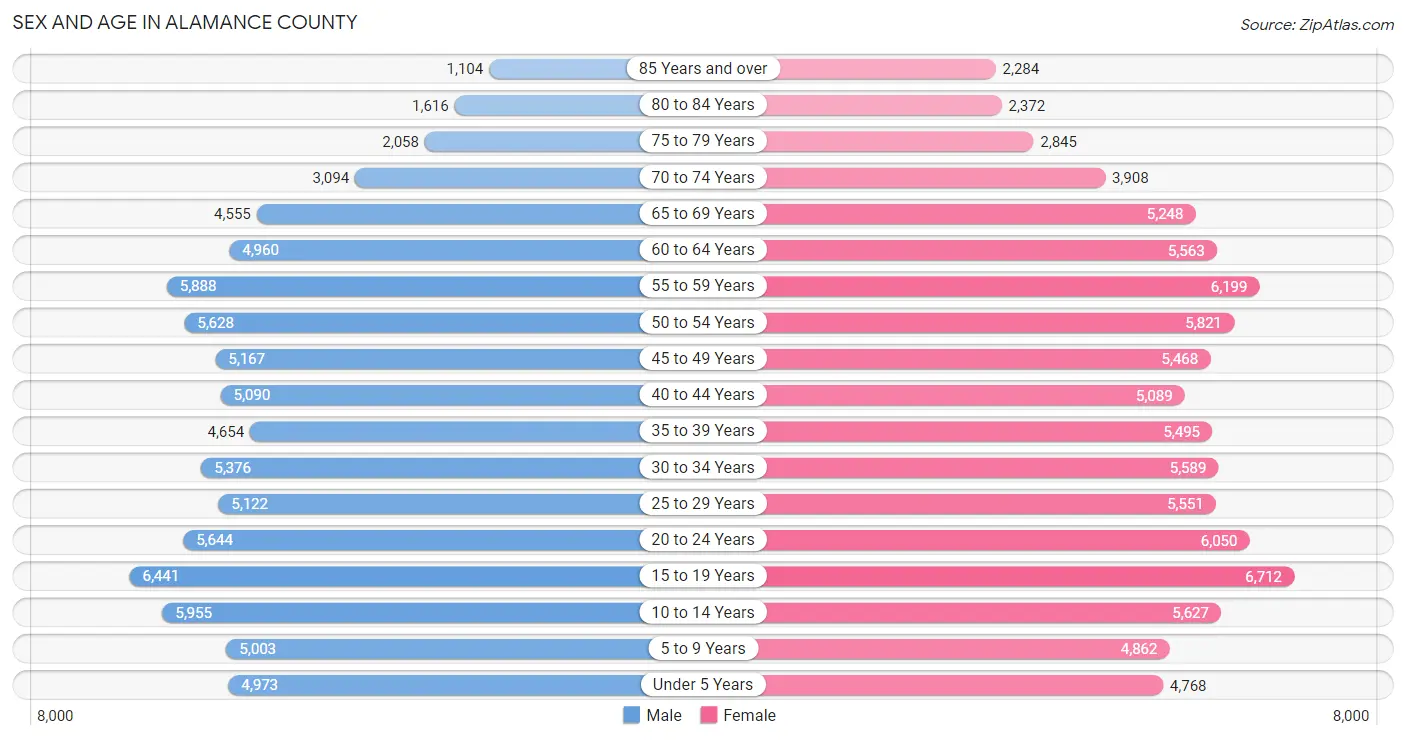
| Age Bracket | Male | Female |
| Under 5 Years | 4,973 (6.0%) | 4,768 (5.3%) |
| 5 to 9 Years | 5,003 (6.1%) | 4,862 (5.4%) |
| 10 to 14 Years | 5,955 (7.2%) | 5,627 (6.3%) |
| 15 to 19 Years | 6,441 (7.8%) | 6,712 (7.5%) |
| 20 to 24 Years | 5,644 (6.9%) | 6,050 (6.8%) |
| 25 to 29 Years | 5,122 (6.2%) | 5,551 (6.2%) |
| 30 to 34 Years | 5,376 (6.5%) | 5,589 (6.2%) |
| 35 to 39 Years | 4,654 (5.7%) | 5,495 (6.1%) |
| 40 to 44 Years | 5,090 (6.2%) | 5,089 (5.7%) |
| 45 to 49 Years | 5,167 (6.3%) | 5,468 (6.1%) |
| 50 to 54 Years | 5,628 (6.8%) | 5,821 (6.5%) |
| 55 to 59 Years | 5,888 (7.1%) | 6,199 (6.9%) |
| 60 to 64 Years | 4,960 (6.0%) | 5,563 (6.2%) |
| 65 to 69 Years | 4,555 (5.5%) | 5,248 (5.9%) |
| 70 to 74 Years | 3,094 (3.8%) | 3,908 (4.4%) |
| 75 to 79 Years | 2,058 (2.5%) | 2,845 (3.2%) |
| 80 to 84 Years | 1,616 (2.0%) | 2,372 (2.6%) |
| 85 Years and over | 1,104 (1.3%) | 2,284 (2.5%) |
| Total | 82,328 (100.0%) | 89,451 (100.0%) |
Families and Households in Alamance County
Median Family Size in Alamance County
The median family size in Alamance County is 3.10 persons per family, with single male/father families (2,677 | 6.2%) accounting for the largest median family size of 3.22 persons per family. On the other hand, married-couple families (31,854 | 73.4%) represent the smallest median family size with 3.08 persons per family.
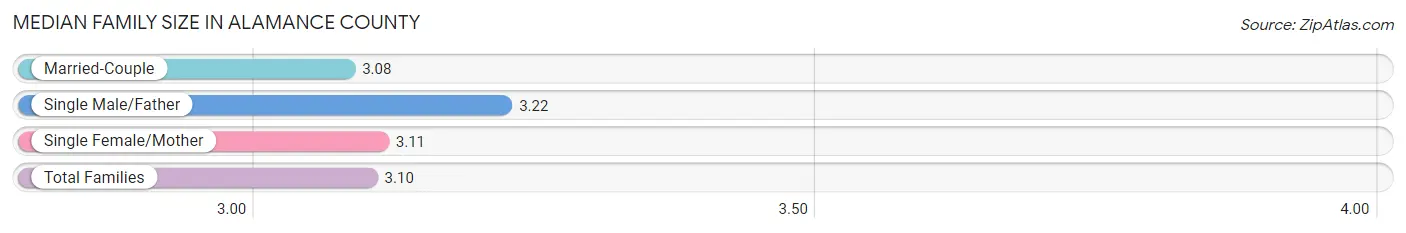
| Family Type | # Families | Family Size |
| Married-Couple | 31,854 (73.4%) | 3.08 |
| Single Male/Father | 2,677 (6.2%) | 3.22 |
| Single Female/Mother | 8,850 (20.4%) | 3.11 |
| Total Families | 43,381 (100.0%) | 3.10 |
Median Household Size in Alamance County
The median household size in Alamance County is 2.48 persons per household, with single male/father households (2,677 | 4.0%) accounting for the largest median household size of 3.74 persons per household. non-family households (23,989 | 35.6%) represent the smallest median household size with 1.22 persons per household.
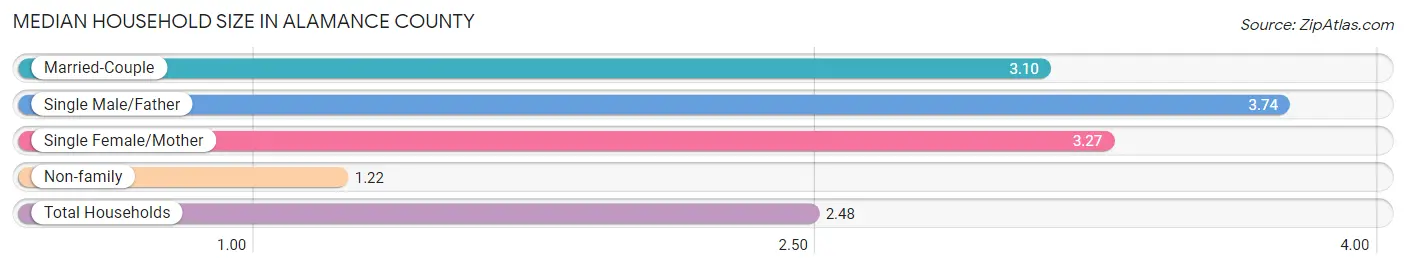
| Household Type | # Households | Household Size |
| Married-Couple | 31,854 (47.3%) | 3.10 |
| Single Male/Father | 2,677 (4.0%) | 3.74 |
| Single Female/Mother | 8,850 (13.1%) | 3.27 |
| Non-family | 23,989 (35.6%) | 1.22 |
| Total Households | 67,370 (100.0%) | 2.48 |
Household Size by Marriage Status in Alamance County
Out of a total of 67,370 households in Alamance County, 43,381 (64.4%) are family households, while 23,989 (35.6%) are nonfamily households. The most numerous type of family households are 2-person households, comprising 20,085, and the most common type of nonfamily households are 1-person households, comprising 20,350.
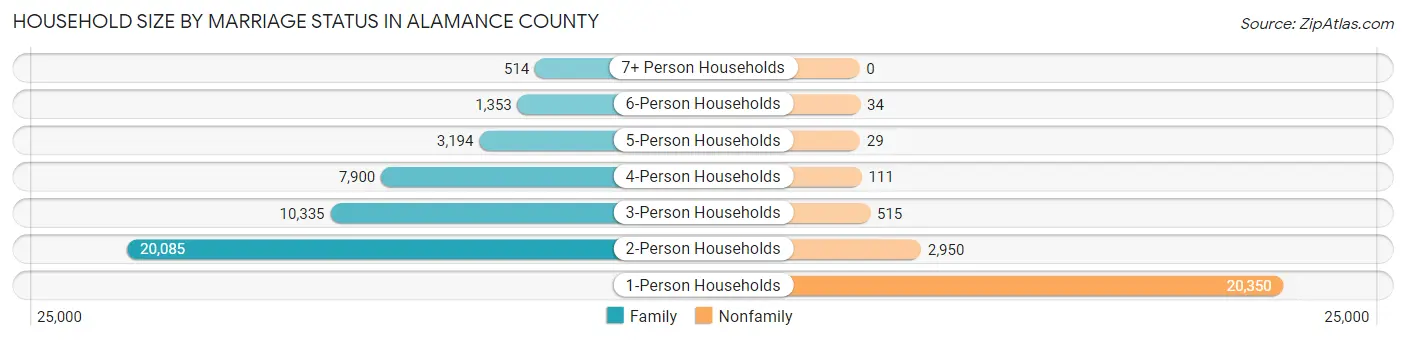
| Household Size | Family Households | Nonfamily Households |
| 1-Person Households | - | 20,350 (30.2%) |
| 2-Person Households | 20,085 (29.8%) | 2,950 (4.4%) |
| 3-Person Households | 10,335 (15.3%) | 515 (0.8%) |
| 4-Person Households | 7,900 (11.7%) | 111 (0.2%) |
| 5-Person Households | 3,194 (4.7%) | 29 (0.0%) |
| 6-Person Households | 1,353 (2.0%) | 34 (0.1%) |
| 7+ Person Households | 514 (0.8%) | 0 (0.0%) |
| Total | 43,381 (64.4%) | 23,989 (35.6%) |
Female Fertility in Alamance County
Fertility by Age in Alamance County
Average fertility rate in Alamance County is 52.0 births per 1,000 women. Women in the age bracket of 20 to 34 years have the highest fertility rate with 104.0 births per 1,000 women. Women in the age bracket of 20 to 34 years acount for 83.5% of all women with births.
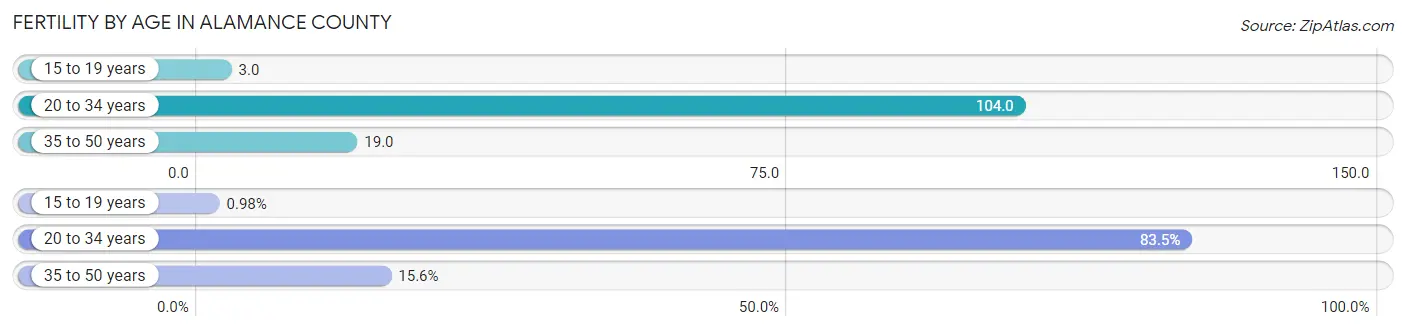
| Age Bracket | Women with Births | Births / 1,000 Women |
| 15 to 19 years | 21 (1.0%) | 3.0 |
| 20 to 34 years | 1,782 (83.5%) | 104.0 |
| 35 to 50 years | 332 (15.5%) | 19.0 |
| Total | 2,135 (100.0%) | 52.0 |
Fertility by Age by Marriage Status in Alamance County
55.4% of women with births (2,135) in Alamance County are married. The highest percentage of unmarried women with births falls into 15 to 19 years age bracket with 100.0% of them unmarried at the time of birth, while the lowest percentage of unmarried women with births belong to 35 to 50 years age bracket with 12.1% of them unmarried.
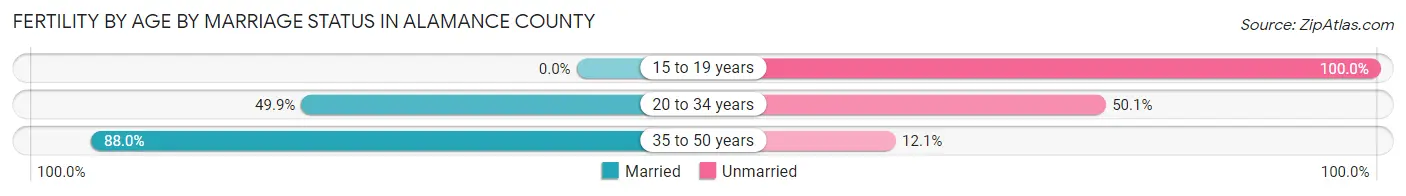
| Age Bracket | Married | Unmarried |
| 15 to 19 years | 0 (0.0%) | 21 (100.0%) |
| 20 to 34 years | 889 (49.9%) | 893 (50.1%) |
| 35 to 50 years | 292 (87.9%) | 40 (12.0%) |
| Total | 1,183 (55.4%) | 952 (44.6%) |
Fertility by Education in Alamance County
Average fertility rate in Alamance County is 52.0 births per 1,000 women. Women with the education attainment of high school diploma have the highest fertility rate of 76.0 births per 1,000 women, while women with the education attainment of less than high school have the lowest fertility at 26.0 births per 1,000 women. Women with the education attainment of high school diploma represent 35.4% of all women with births.
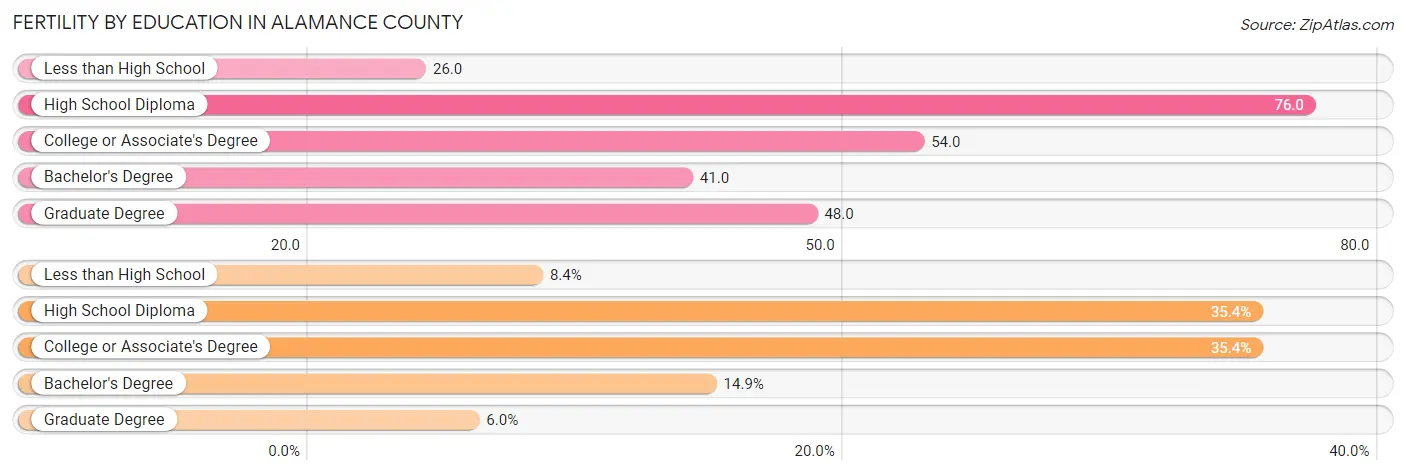
| Educational Attainment | Women with Births | Births / 1,000 Women |
| Less than High School | 179 (8.4%) | 26.0 |
| High School Diploma | 755 (35.4%) | 76.0 |
| College or Associate's Degree | 755 (35.4%) | 54.0 |
| Bachelor's Degree | 318 (14.9%) | 41.0 |
| Graduate Degree | 128 (6.0%) | 48.0 |
| Total | 2,135 (100.0%) | 52.0 |
Fertility by Education by Marriage Status in Alamance County
44.6% of women with births in Alamance County are unmarried. Women with the educational attainment of graduate degree are most likely to be married with 93.8% of them married at childbirth, while women with the educational attainment of high school diploma are least likely to be married with 66.4% of them unmarried at childbirth.
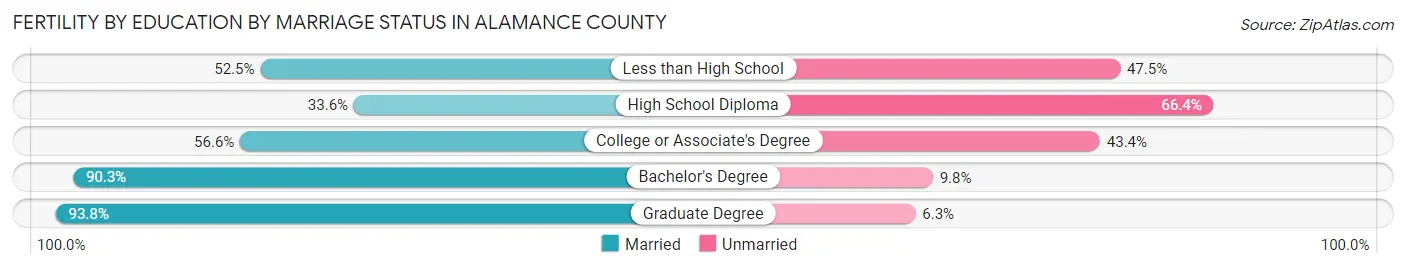
| Educational Attainment | Married | Unmarried |
| Less than High School | 94 (52.5%) | 85 (47.5%) |
| High School Diploma | 254 (33.6%) | 501 (66.4%) |
| College or Associate's Degree | 427 (56.6%) | 328 (43.4%) |
| Bachelor's Degree | 287 (90.2%) | 31 (9.8%) |
| Graduate Degree | 120 (93.8%) | 8 (6.2%) |
| Total | 1,183 (55.4%) | 952 (44.6%) |
Income in Alamance County
Income Overview in Alamance County
Per Capita Income in Alamance County is $32,105, while median incomes of families and households are $78,033 and $60,866 respectively.
| Characteristic | Number | Measure |
| Per Capita Income | 171,779 | $32,105 |
| Median Family Income | 43,381 | $78,033 |
| Mean Family Income | 43,381 | $94,923 |
| Median Household Income | 67,370 | $60,866 |
| Mean Household Income | 67,370 | $79,258 |
| Income Deficit | 43,381 | $9,270 |
| Wage / Income Gap (%) | 171,779 | 20.77% |
| Wage / Income Gap ($) | 171,779 | 79.23¢ per $1 |
| Gini / Inequality Index | 171,779 | 0.44 |
Earnings by Sex in Alamance County
Average Earnings in Alamance County are $37,142, $41,756 for men and $33,085 for women, a difference of 20.8%.
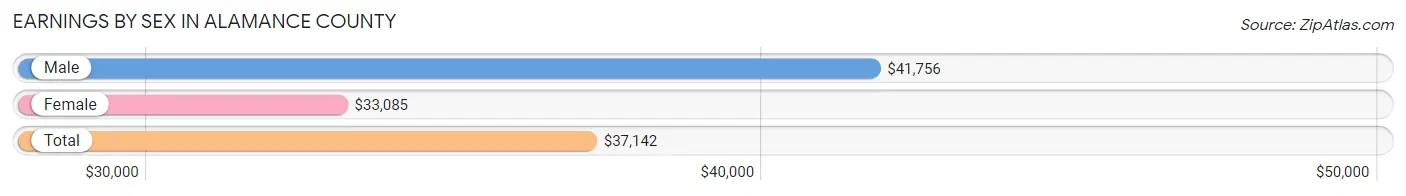
| Sex | Number | Average Earnings |
| Male | 45,549 (50.6%) | $41,756 |
| Female | 44,406 (49.4%) | $33,085 |
| Total | 89,955 (100.0%) | $37,142 |
Earnings by Sex by Income Bracket in Alamance County
The most common earnings brackets in Alamance County are $100,000+ for men (5,649 | 12.4%) and $30,000 to $34,999 for women (3,366 | 7.6%).
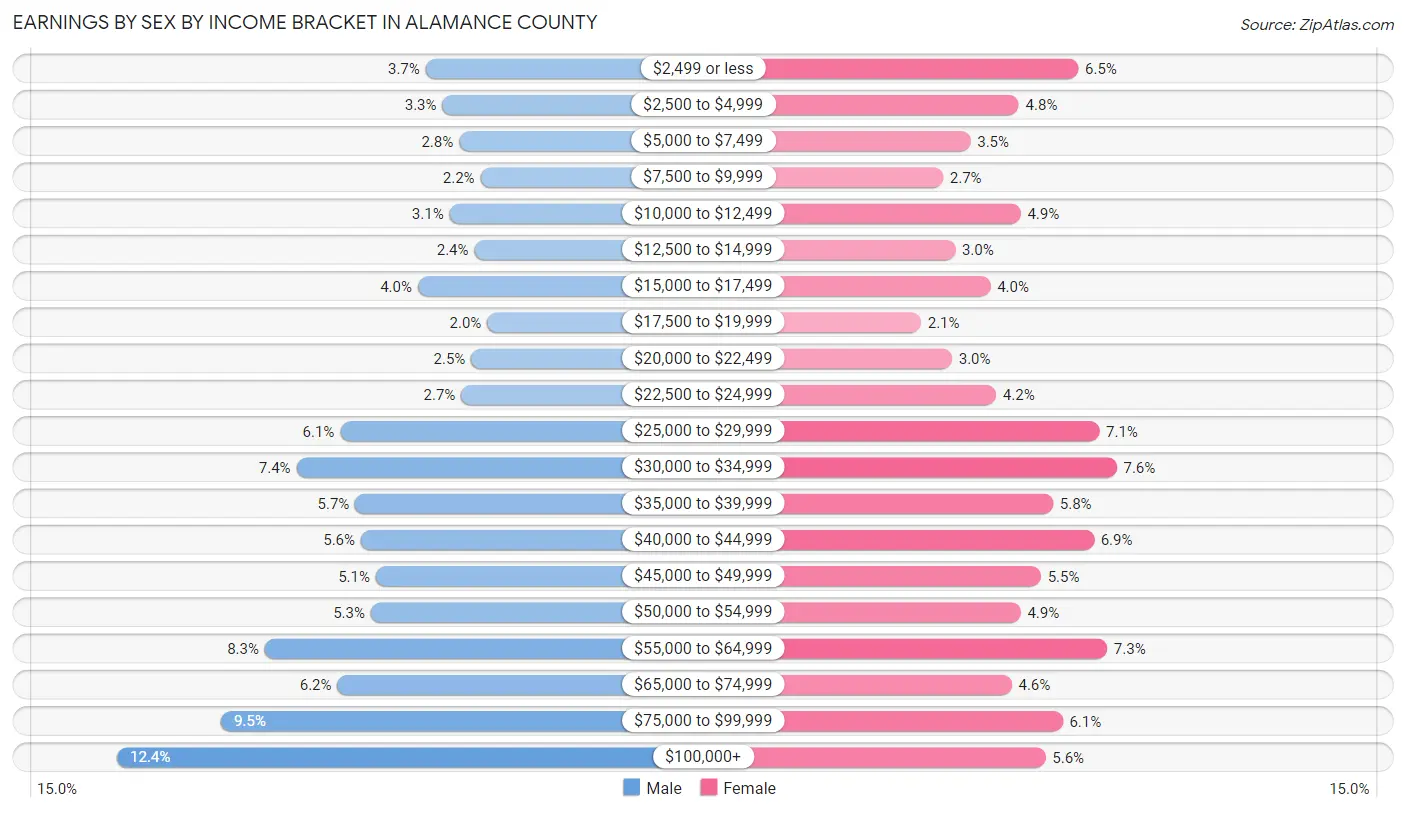
| Income | Male | Female |
| $2,499 or less | 1,698 (3.7%) | 2,886 (6.5%) |
| $2,500 to $4,999 | 1,485 (3.3%) | 2,146 (4.8%) |
| $5,000 to $7,499 | 1,270 (2.8%) | 1,540 (3.5%) |
| $7,500 to $9,999 | 996 (2.2%) | 1,198 (2.7%) |
| $10,000 to $12,499 | 1,395 (3.1%) | 2,168 (4.9%) |
| $12,500 to $14,999 | 1,077 (2.4%) | 1,348 (3.0%) |
| $15,000 to $17,499 | 1,798 (4.0%) | 1,791 (4.0%) |
| $17,500 to $19,999 | 911 (2.0%) | 923 (2.1%) |
| $20,000 to $22,499 | 1,114 (2.5%) | 1,312 (2.9%) |
| $22,500 to $24,999 | 1,243 (2.7%) | 1,862 (4.2%) |
| $25,000 to $29,999 | 2,793 (6.1%) | 3,150 (7.1%) |
| $30,000 to $34,999 | 3,354 (7.4%) | 3,366 (7.6%) |
| $35,000 to $39,999 | 2,600 (5.7%) | 2,573 (5.8%) |
| $40,000 to $44,999 | 2,526 (5.6%) | 3,080 (6.9%) |
| $45,000 to $49,999 | 2,335 (5.1%) | 2,420 (5.4%) |
| $50,000 to $54,999 | 2,400 (5.3%) | 2,169 (4.9%) |
| $55,000 to $64,999 | 3,759 (8.3%) | 3,245 (7.3%) |
| $65,000 to $74,999 | 2,827 (6.2%) | 2,058 (4.6%) |
| $75,000 to $99,999 | 4,319 (9.5%) | 2,693 (6.1%) |
| $100,000+ | 5,649 (12.4%) | 2,478 (5.6%) |
| Total | 45,549 (100.0%) | 44,406 (100.0%) |
Earnings by Sex by Educational Attainment in Alamance County
Average earnings in Alamance County are $48,479 for men and $38,661 for women, a difference of 20.3%. Men with an educational attainment of graduate degree enjoy the highest average annual earnings of $80,298, while those with less than high school education earn the least with $29,106. Women with an educational attainment of graduate degree earn the most with the average annual earnings of $66,679, while those with less than high school education have the smallest earnings of $25,294.
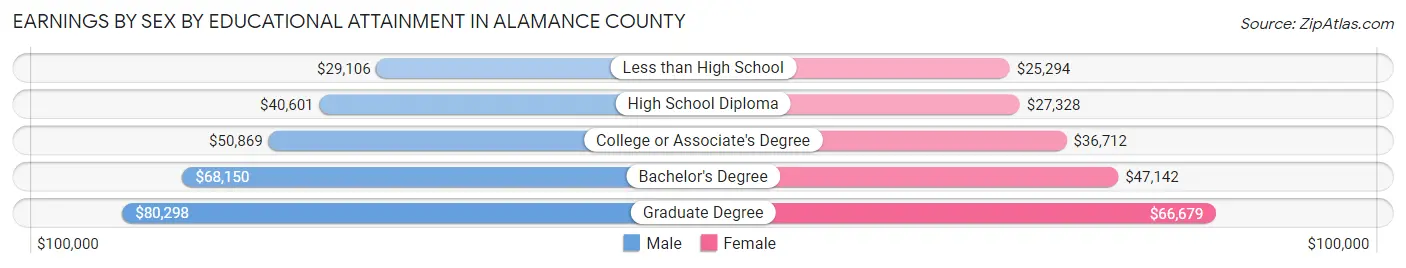
| Educational Attainment | Male Income | Female Income |
| Less than High School | $29,106 | $25,294 |
| High School Diploma | $40,601 | $27,328 |
| College or Associate's Degree | $50,869 | $36,712 |
| Bachelor's Degree | $68,150 | $47,142 |
| Graduate Degree | $80,298 | $66,679 |
| Total | $48,479 | $38,661 |
Family Income in Alamance County
Family Income Brackets in Alamance County
According to the Alamance County family income data, there are 8,980 families falling into the $100,000 to $149,999 income range, which is the most common income bracket and makes up 20.7% of all families. Conversely, the $10,000 to $14,999 income bracket is the least frequent group with only 954 families (2.2%) belonging to this category.
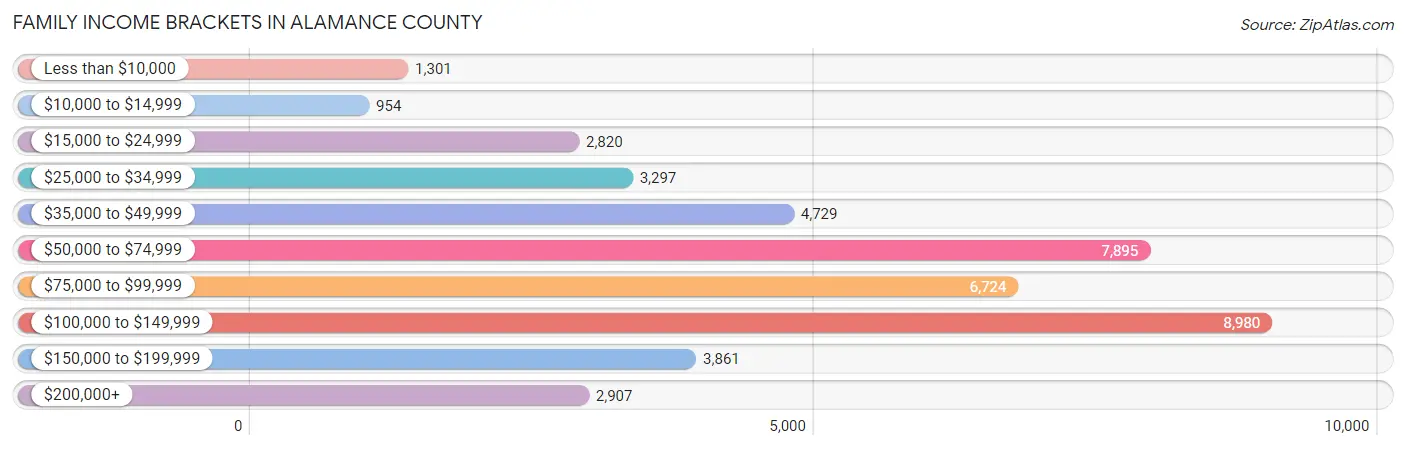
| Income Bracket | # Families | % Families |
| Less than $10,000 | 1,301 | 3.0% |
| $10,000 to $14,999 | 954 | 2.2% |
| $15,000 to $24,999 | 2,820 | 6.5% |
| $25,000 to $34,999 | 3,297 | 7.6% |
| $35,000 to $49,999 | 4,729 | 10.9% |
| $50,000 to $74,999 | 7,895 | 18.2% |
| $75,000 to $99,999 | 6,724 | 15.5% |
| $100,000 to $149,999 | 8,980 | 20.7% |
| $150,000 to $199,999 | 3,861 | 8.9% |
| $200,000+ | 2,907 | 6.7% |
Family Income by Famaliy Size in Alamance County
5-person families (2,841 | 6.6%) account for the highest median family income in Alamance County with $99,619 per family, while 2-person families (21,512 | 49.6%) have the highest median income of $33,878 per family member.
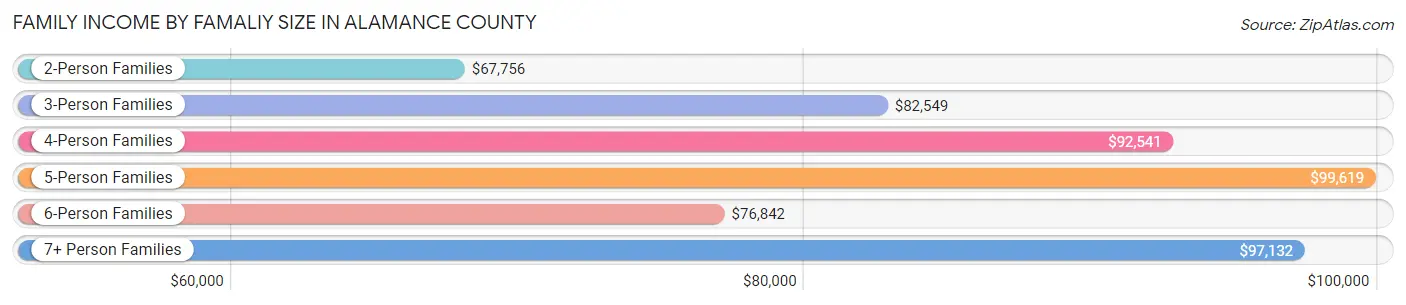
| Income Bracket | # Families | Median Income |
| 2-Person Families | 21,512 (49.6%) | $67,756 |
| 3-Person Families | 9,835 (22.7%) | $82,549 |
| 4-Person Families | 7,550 (17.4%) | $92,541 |
| 5-Person Families | 2,841 (6.6%) | $99,619 |
| 6-Person Families | 1,234 (2.8%) | $76,842 |
| 7+ Person Families | 409 (0.9%) | $97,132 |
| Total | 43,381 (100.0%) | $78,033 |
Family Income by Number of Earners in Alamance County
The median family income in Alamance County is $78,033, with families comprising 3+ earners (4,265) having the highest median family income of $126,728, while families with no earners (6,978) have the lowest median family income of $43,316, accounting for 9.8% and 16.1% of families, respectively.
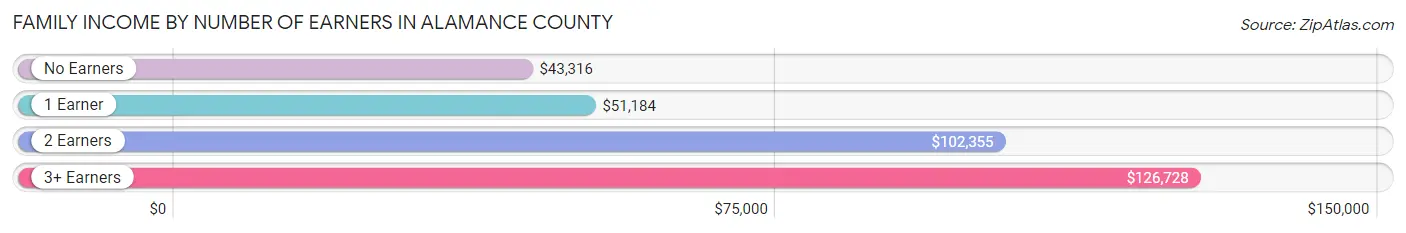
| Number of Earners | # Families | Median Income |
| No Earners | 6,978 (16.1%) | $43,316 |
| 1 Earner | 14,060 (32.4%) | $51,184 |
| 2 Earners | 18,078 (41.7%) | $102,355 |
| 3+ Earners | 4,265 (9.8%) | $126,728 |
| Total | 43,381 (100.0%) | $78,033 |
Household Income in Alamance County
Household Income Brackets in Alamance County
With 11,992 households falling in the category, the $50,000 to $74,999 income range is the most frequent in Alamance County, accounting for 17.8% of all households. In contrast, only 2,627 households (3.9%) fall into the $10,000 to $14,999 income bracket, making it the least populous group.
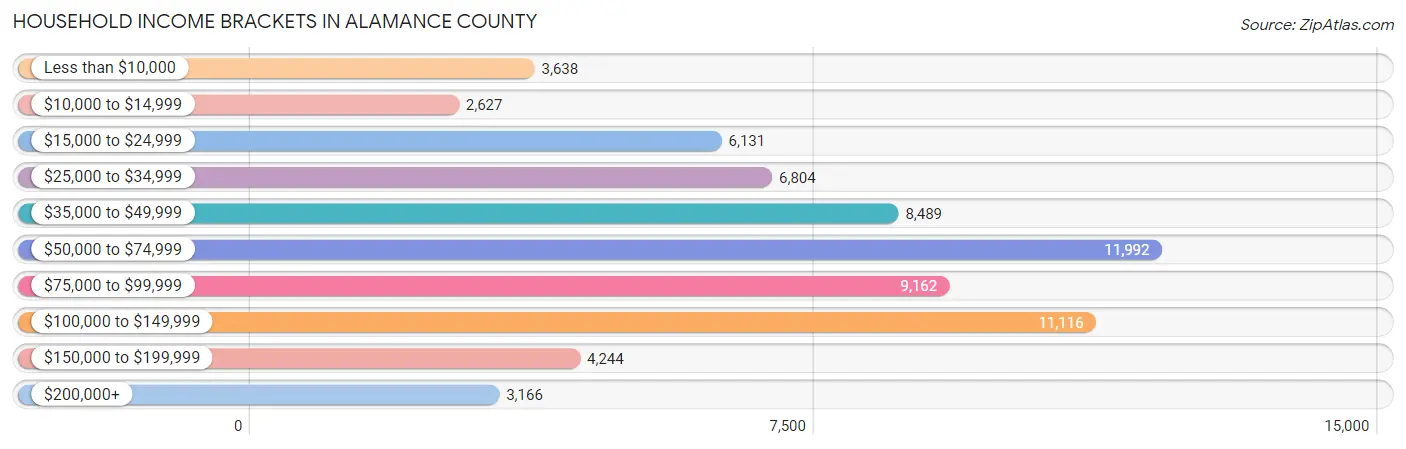
| Income Bracket | # Households | % Households |
| Less than $10,000 | 3,638 | 5.4% |
| $10,000 to $14,999 | 2,627 | 3.9% |
| $15,000 to $24,999 | 6,131 | 9.1% |
| $25,000 to $34,999 | 6,804 | 10.1% |
| $35,000 to $49,999 | 8,489 | 12.6% |
| $50,000 to $74,999 | 11,992 | 17.8% |
| $75,000 to $99,999 | 9,162 | 13.6% |
| $100,000 to $149,999 | 11,116 | 16.5% |
| $150,000 to $199,999 | 4,244 | 6.3% |
| $200,000+ | 3,166 | 4.7% |
Household Income by Householder Age in Alamance County
The median household income in Alamance County is $60,866, with the highest median household income of $74,441 found in the 45 to 64 years age bracket for the primary householder. A total of 25,790 households (38.3%) fall into this category. Meanwhile, the 15 to 24 years age bracket for the primary householder has the lowest median household income of $32,436, with 2,440 households (3.6%) in this group.
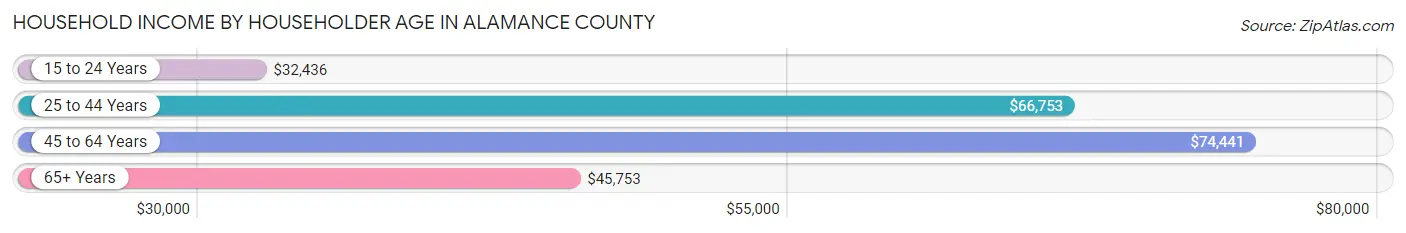
| Income Bracket | # Households | Median Income |
| 15 to 24 Years | 2,440 (3.6%) | $32,436 |
| 25 to 44 Years | 20,555 (30.5%) | $66,753 |
| 45 to 64 Years | 25,790 (38.3%) | $74,441 |
| 65+ Years | 18,585 (27.6%) | $45,753 |
| Total | 67,370 (100.0%) | $60,866 |
Poverty in Alamance County
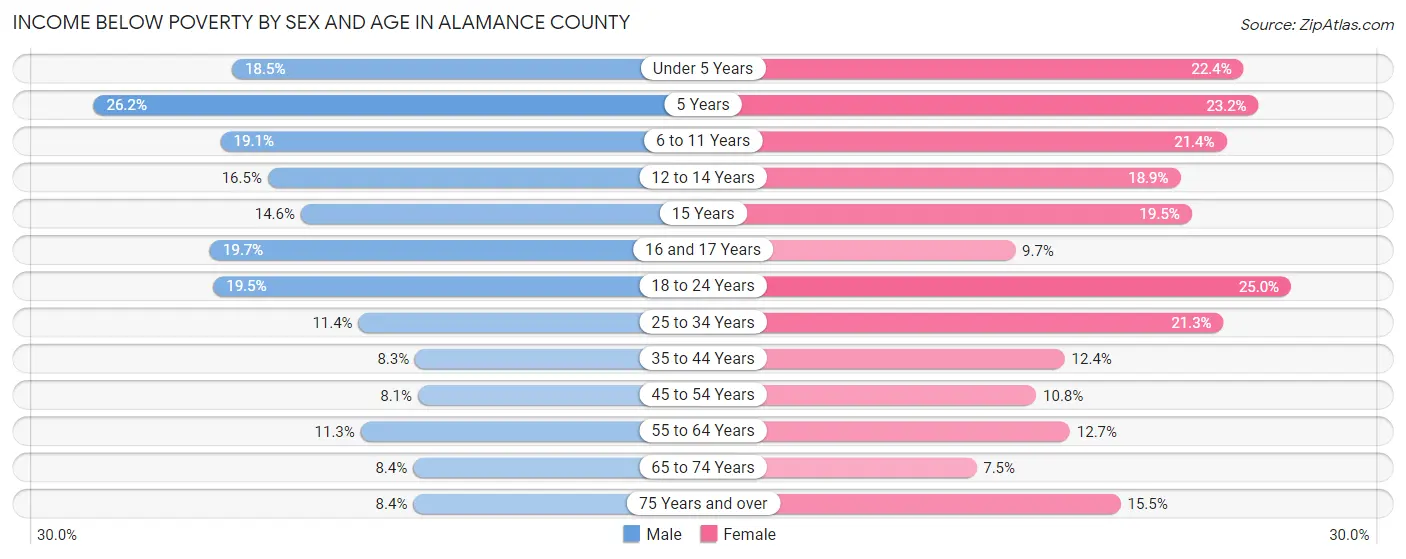
Income Below Poverty by Sex and Age in Alamance County
With 12.5% poverty level for males and 15.8% for females among the residents of Alamance County, 5 year old males and 18 to 24 year old females are the most vulnerable to poverty, with 181 males (26.2%) and 1,926 females (25.0%) in their respective age groups living below the poverty level.
| Age Bracket | Male | Female |
| Under 5 Years | 880 (18.4%) | 1,066 (22.4%) |
| 5 Years | 181 (26.2%) | 242 (23.2%) |
| 6 to 11 Years | 1,233 (19.1%) | 1,279 (21.4%) |
| 12 to 14 Years | 608 (16.5%) | 627 (18.9%) |
| 15 Years | 179 (14.6%) | 225 (19.5%) |
| 16 and 17 Years | 426 (19.7%) | 199 (9.7%) |
| 18 to 24 Years | 1,405 (19.5%) | 1,926 (25.0%) |
| 25 to 34 Years | 1,192 (11.4%) | 2,364 (21.2%) |
| 35 to 44 Years | 803 (8.3%) | 1,313 (12.4%) |
| 45 to 54 Years | 872 (8.1%) | 1,218 (10.8%) |
| 55 to 64 Years | 1,218 (11.3%) | 1,491 (12.7%) |
| 65 to 74 Years | 633 (8.4%) | 680 (7.5%) |
| 75 Years and over | 389 (8.4%) | 1,114 (15.5%) |
| Total | 10,019 (12.5%) | 13,744 (15.8%) |
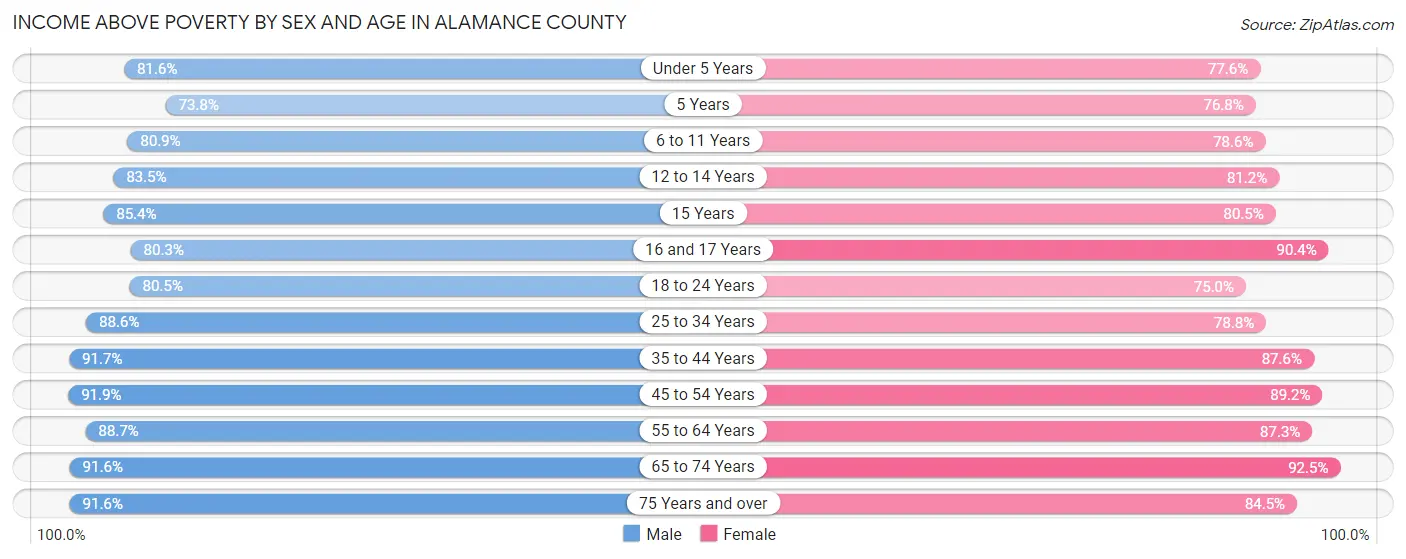
Income Above Poverty by Sex and Age in Alamance County
According to the poverty statistics in Alamance County, males aged 45 to 54 years and females aged 65 to 74 years are the age groups that are most secure financially, with 91.9% of males and 92.5% of females in these age groups living above the poverty line.
| Age Bracket | Male | Female |
| Under 5 Years | 3,890 (81.6%) | 3,699 (77.6%) |
| 5 Years | 511 (73.8%) | 801 (76.8%) |
| 6 to 11 Years | 5,229 (80.9%) | 4,695 (78.6%) |
| 12 to 14 Years | 3,086 (83.5%) | 2,699 (81.1%) |
| 15 Years | 1,045 (85.4%) | 930 (80.5%) |
| 16 and 17 Years | 1,739 (80.3%) | 1,864 (90.3%) |
| 18 to 24 Years | 5,802 (80.5%) | 5,776 (75.0%) |
| 25 to 34 Years | 9,251 (88.6%) | 8,760 (78.7%) |
| 35 to 44 Years | 8,917 (91.7%) | 9,271 (87.6%) |
| 45 to 54 Years | 9,891 (91.9%) | 10,038 (89.2%) |
| 55 to 64 Years | 9,569 (88.7%) | 10,252 (87.3%) |
| 65 to 74 Years | 6,928 (91.6%) | 8,400 (92.5%) |
| 75 Years and over | 4,266 (91.6%) | 6,065 (84.5%) |
| Total | 70,124 (87.5%) | 73,250 (84.2%) |
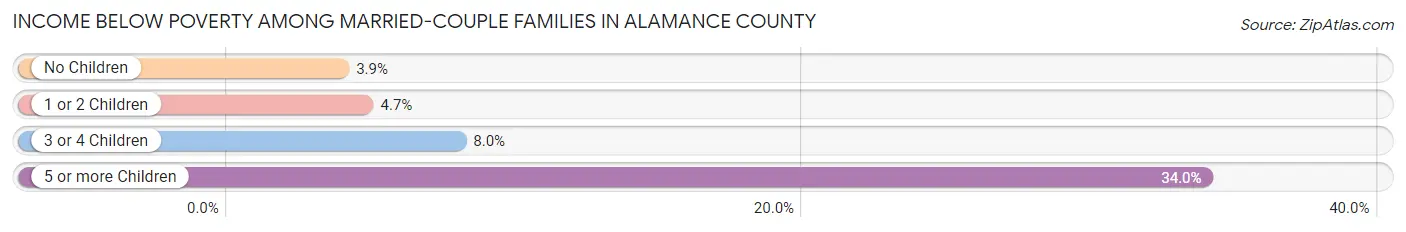
Income Below Poverty Among Married-Couple Families in Alamance County
The poverty statistics for married-couple families in Alamance County show that 4.5% or 1,437 of the total 31,854 families live below the poverty line. Families with 5 or more children have the highest poverty rate of 34.0%, comprising of 18 families. On the other hand, families with no children have the lowest poverty rate of 3.9%, which includes 729 families.
| Children | Above Poverty | Below Poverty |
| No Children | 18,101 (96.1%) | 729 (3.9%) |
| 1 or 2 Children | 10,070 (95.3%) | 499 (4.7%) |
| 3 or 4 Children | 2,211 (92.0%) | 191 (8.0%) |
| 5 or more Children | 35 (66.0%) | 18 (34.0%) |
| Total | 30,417 (95.5%) | 1,437 (4.5%) |
Income Below Poverty Among Single-Parent Households in Alamance County
According to the poverty data in Alamance County, 14.6% or 390 single-father households and 30.6% or 2,709 single-mother households are living below the poverty line. Among single-father households, those with 5 or more children have the highest poverty rate, with 35 households (42.2%) experiencing poverty. Likewise, among single-mother households, those with 3 or 4 children have the highest poverty rate, with 795 households (72.4%) falling below the poverty line.

| Children | Single Father | Single Mother |
| No Children | 112 (11.7%) | 462 (13.6%) |
| 1 or 2 Children | 190 (14.1%) | 1,431 (33.4%) |
| 3 or 4 Children | 53 (18.7%) | 795 (72.4%) |
| 5 or more Children | 35 (42.2%) | 21 (33.9%) |
| Total | 390 (14.6%) | 2,709 (30.6%) |
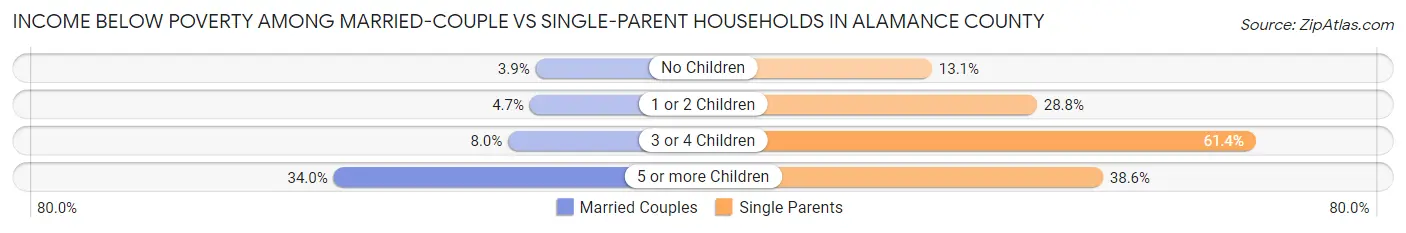
Income Below Poverty Among Married-Couple vs Single-Parent Households in Alamance County
The poverty data for Alamance County shows that 1,437 of the married-couple family households (4.5%) and 3,099 of the single-parent households (26.9%) are living below the poverty level. Within the married-couple family households, those with 5 or more children have the highest poverty rate, with 18 households (34.0%) falling below the poverty line. Among the single-parent households, those with 3 or 4 children have the highest poverty rate, with 848 household (61.4%) living below poverty.
| Children | Married-Couple Families | Single-Parent Households |
| No Children | 729 (3.9%) | 574 (13.1%) |
| 1 or 2 Children | 499 (4.7%) | 1,621 (28.8%) |
| 3 or 4 Children | 191 (8.0%) | 848 (61.4%) |
| 5 or more Children | 18 (34.0%) | 56 (38.6%) |
| Total | 1,437 (4.5%) | 3,099 (26.9%) |
Employment Characteristics in Alamance County
Employment by Class of Employer in Alamance County
Among the 80,839 employed individuals in Alamance County, private company employees (57,283 | 70.9%), local government employees (5,465 | 6.8%), and not-for-profit organizations (5,391 | 6.7%) make up the most common classes of employment.
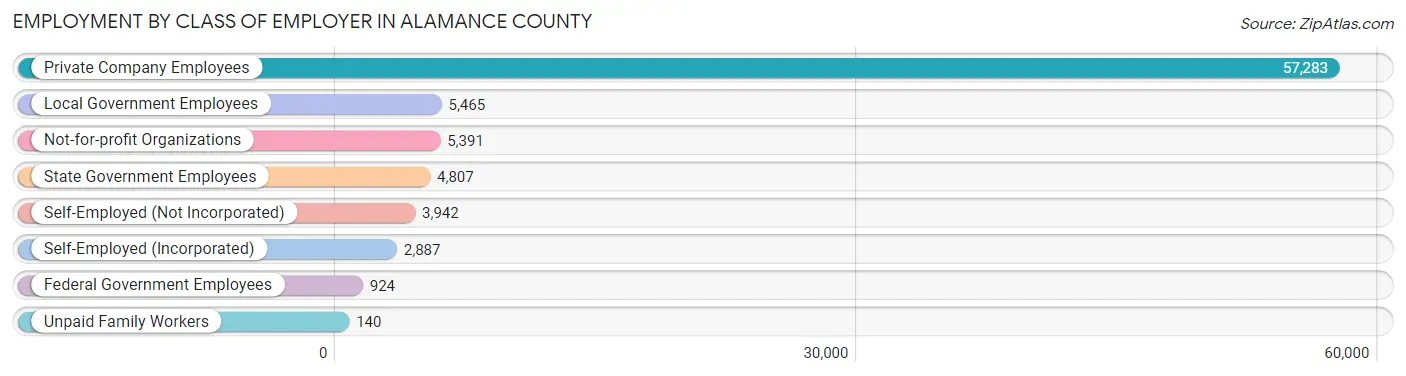
| Employer Class | # Employees | % Employees |
| Private Company Employees | 57,283 | 70.9% |
| Self-Employed (Incorporated) | 2,887 | 3.6% |
| Self-Employed (Not Incorporated) | 3,942 | 4.9% |
| Not-for-profit Organizations | 5,391 | 6.7% |
| Local Government Employees | 5,465 | 6.8% |
| State Government Employees | 4,807 | 5.9% |
| Federal Government Employees | 924 | 1.1% |
| Unpaid Family Workers | 140 | 0.2% |
| Total | 80,839 | 100.0% |
Employment Status by Age in Alamance County
According to the labor force statistics for Alamance County, out of the total population over 16 years of age (138,209), 62.8% or 86,795 individuals are in the labor force, with 5.0% or 4,340 of them unemployed. The age group with the highest labor force participation rate is 35 to 44 years, with 87.3% or 17,746 individuals in the labor force. Within the labor force, the 16 to 19 years age range has the highest percentage of unemployed individuals, with 12.8% or 609 of them being unemployed.
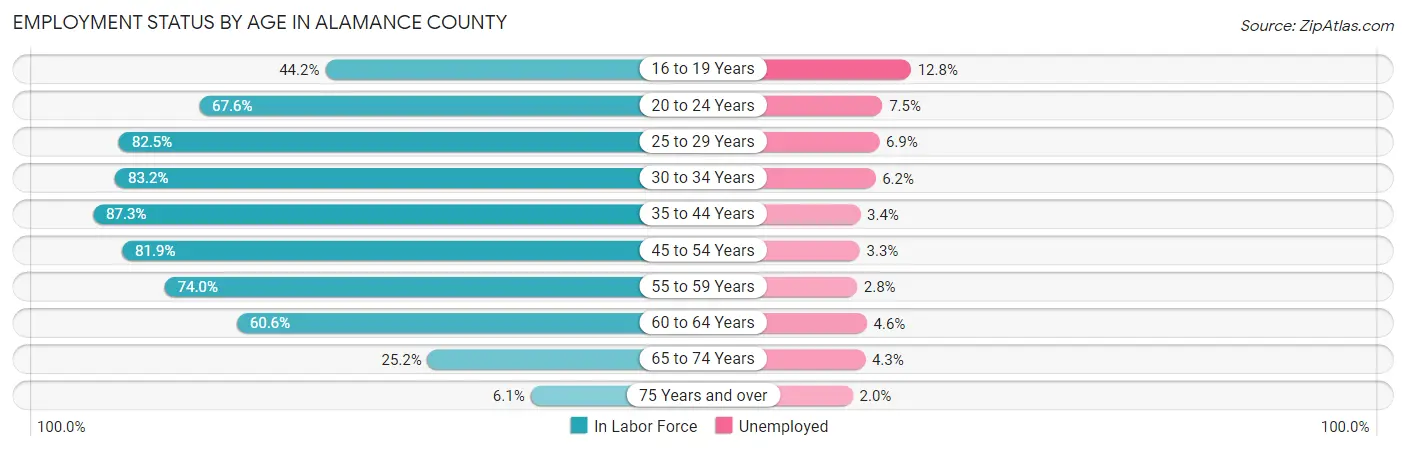
| Age Bracket | In Labor Force | Unemployed |
| 16 to 19 Years | 4,761 (44.2%) | 609 (12.8%) |
| 20 to 24 Years | 7,905 (67.6%) | 593 (7.5%) |
| 25 to 29 Years | 8,805 (82.5%) | 608 (6.9%) |
| 30 to 34 Years | 9,123 (83.2%) | 566 (6.2%) |
| 35 to 44 Years | 17,746 (87.3%) | 603 (3.4%) |
| 45 to 54 Years | 18,087 (81.9%) | 597 (3.3%) |
| 55 to 59 Years | 8,944 (74.0%) | 250 (2.8%) |
| 60 to 64 Years | 6,377 (60.6%) | 293 (4.6%) |
| 65 to 74 Years | 4,235 (25.2%) | 182 (4.3%) |
| 75 Years and over | 749 (6.1%) | 15 (2.0%) |
| Total | 86,795 (62.8%) | 4,340 (5.0%) |
Employment Status by Educational Attainment in Alamance County
According to labor force statistics for Alamance County, 79.7% of individuals (69,068) out of the total population between 25 and 64 years of age (86,660) are in the labor force, with 4.2% or 2,901 of them being unemployed. The group with the highest labor force participation rate are those with the educational attainment of bachelor's degree or higher, with 87.3% or 21,684 individuals in the labor force. Within the labor force, individuals with less than high school education have the highest percentage of unemployment, with 8.6% or 544 of them being unemployed.
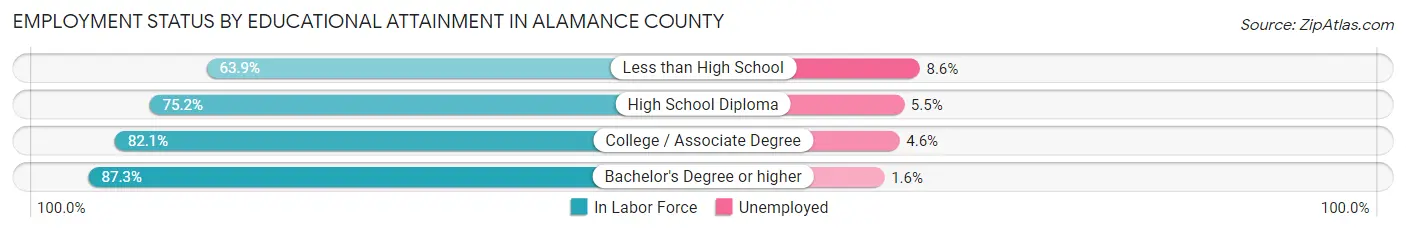
| Educational Attainment | In Labor Force | Unemployed |
| Less than High School | 6,329 (63.9%) | 852 (8.6%) |
| High School Diploma | 17,122 (75.2%) | 1,252 (5.5%) |
| College / Associate Degree | 23,931 (82.1%) | 1,341 (4.6%) |
| Bachelor's Degree or higher | 21,684 (87.3%) | 397 (1.6%) |
| Total | 69,068 (79.7%) | 3,640 (4.2%) |
Employment Occupations by Sex in Alamance County
Management, Business, Science and Arts Occupations
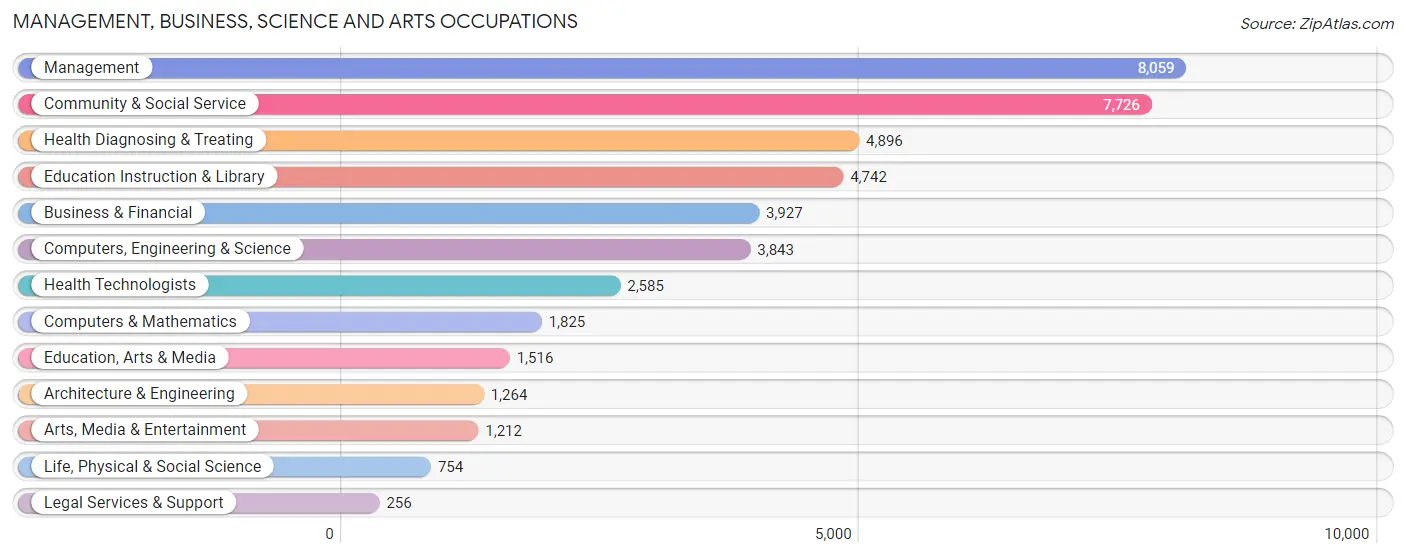
The most common Management, Business, Science and Arts occupations in Alamance County are Management (8,059 | 9.8%), Community & Social Service (7,726 | 9.4%), Health Diagnosing & Treating (4,896 | 5.9%), Education Instruction & Library (4,742 | 5.8%), and Business & Financial (3,927 | 4.8%).
Management, Business, Science and Arts Occupations by Sex
Within the Management, Business, Science and Arts occupations in Alamance County, the most male-oriented occupations are Architecture & Engineering (93.8%), Computers, Engineering & Science (74.8%), and Computers & Mathematics (73.6%), while the most female-oriented occupations are Health Technologists (82.4%), Health Diagnosing & Treating (81.2%), and Education Instruction & Library (73.9%).
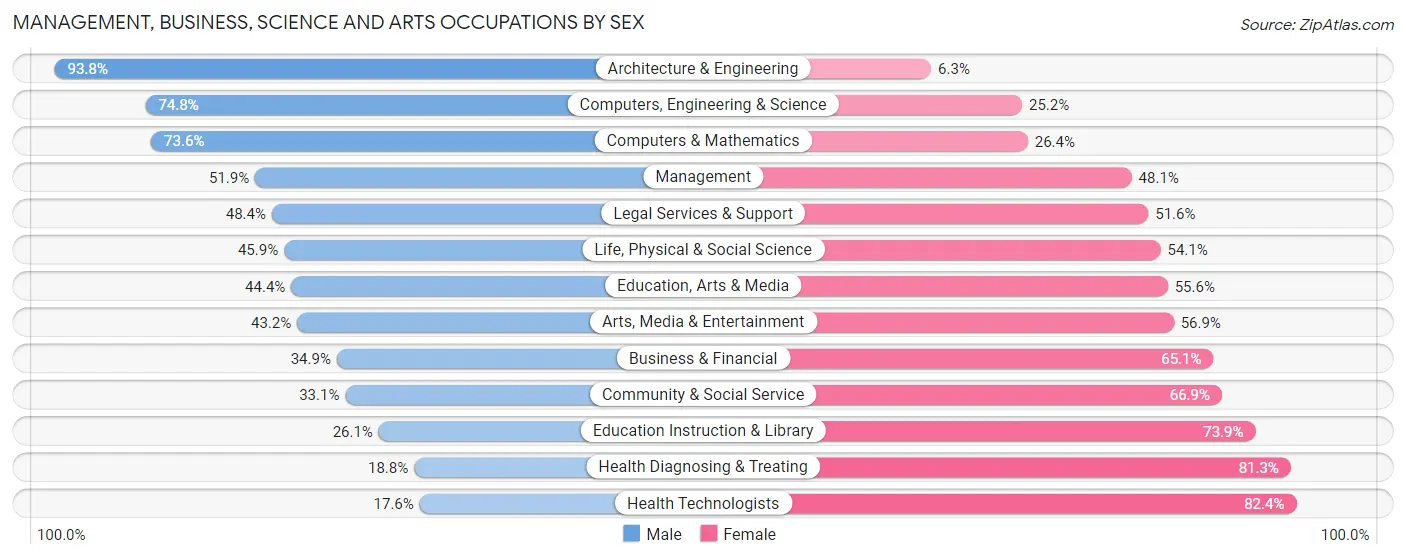
| Occupation | Male | Female |
| Management | 4,184 (51.9%) | 3,875 (48.1%) |
| Business & Financial | 1,370 (34.9%) | 2,557 (65.1%) |
| Computers, Engineering & Science | 2,874 (74.8%) | 969 (25.2%) |
| Computers & Mathematics | 1,343 (73.6%) | 482 (26.4%) |
| Architecture & Engineering | 1,185 (93.8%) | 79 (6.2%) |
| Life, Physical & Social Science | 346 (45.9%) | 408 (54.1%) |
| Community & Social Service | 2,559 (33.1%) | 5,167 (66.9%) |
| Education, Arts & Media | 673 (44.4%) | 843 (55.6%) |
| Legal Services & Support | 124 (48.4%) | 132 (51.6%) |
| Education Instruction & Library | 1,239 (26.1%) | 3,503 (73.9%) |
| Arts, Media & Entertainment | 523 (43.1%) | 689 (56.9%) |
| Health Diagnosing & Treating | 918 (18.8%) | 3,978 (81.2%) |
| Health Technologists | 455 (17.6%) | 2,130 (82.4%) |
| Total (Category) | 11,905 (41.8%) | 16,546 (58.2%) |
| Total (Overall) | 42,440 (51.6%) | 39,858 (48.4%) |
Services Occupations
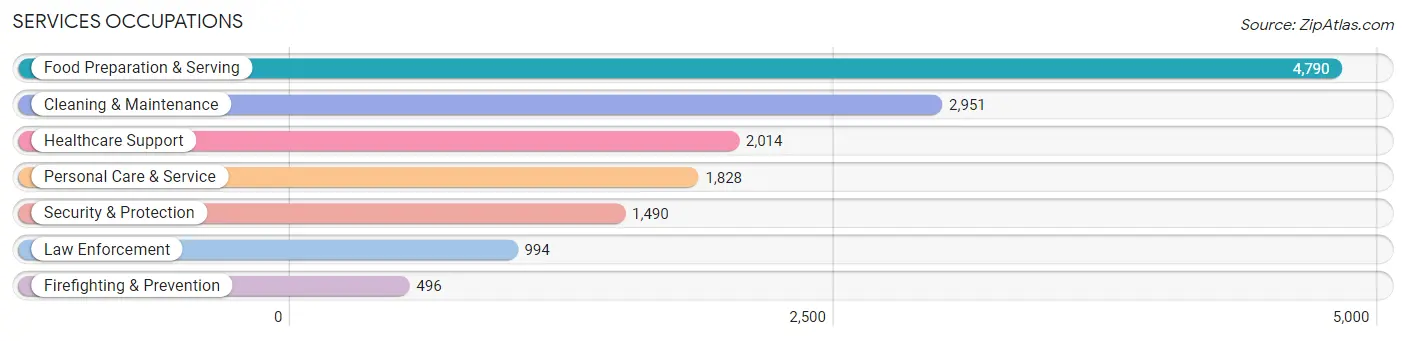
The most common Services occupations in Alamance County are Food Preparation & Serving (4,790 | 5.8%), Cleaning & Maintenance (2,951 | 3.6%), Healthcare Support (2,014 | 2.5%), Personal Care & Service (1,828 | 2.2%), and Security & Protection (1,490 | 1.8%).
Services Occupations by Sex
Within the Services occupations in Alamance County, the most male-oriented occupations are Firefighting & Prevention (85.9%), Security & Protection (85.3%), and Law Enforcement (85.0%), while the most female-oriented occupations are Healthcare Support (92.3%), Personal Care & Service (75.7%), and Food Preparation & Serving (54.7%).
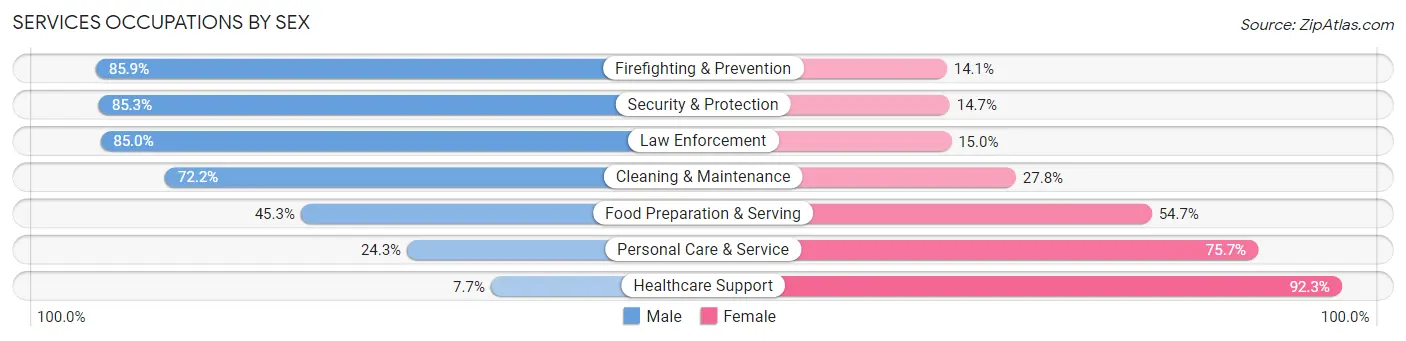
| Occupation | Male | Female |
| Healthcare Support | 155 (7.7%) | 1,859 (92.3%) |
| Security & Protection | 1,271 (85.3%) | 219 (14.7%) |
| Firefighting & Prevention | 426 (85.9%) | 70 (14.1%) |
| Law Enforcement | 845 (85.0%) | 149 (15.0%) |
| Food Preparation & Serving | 2,171 (45.3%) | 2,619 (54.7%) |
| Cleaning & Maintenance | 2,131 (72.2%) | 820 (27.8%) |
| Personal Care & Service | 444 (24.3%) | 1,384 (75.7%) |
| Total (Category) | 6,172 (47.2%) | 6,901 (52.8%) |
| Total (Overall) | 42,440 (51.6%) | 39,858 (48.4%) |
Sales and Office Occupations
The most common Sales and Office occupations in Alamance County are Office & Administration (10,108 | 12.3%), and Sales & Related (8,707 | 10.6%).

Sales and Office Occupations by Sex
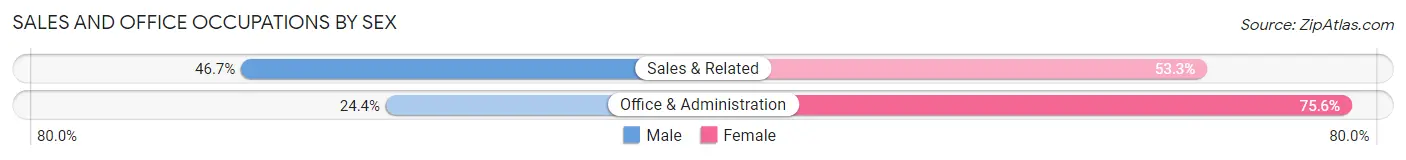
| Occupation | Male | Female |
| Sales & Related | 4,065 (46.7%) | 4,642 (53.3%) |
| Office & Administration | 2,468 (24.4%) | 7,640 (75.6%) |
| Total (Category) | 6,533 (34.7%) | 12,282 (65.3%) |
| Total (Overall) | 42,440 (51.6%) | 39,858 (48.4%) |
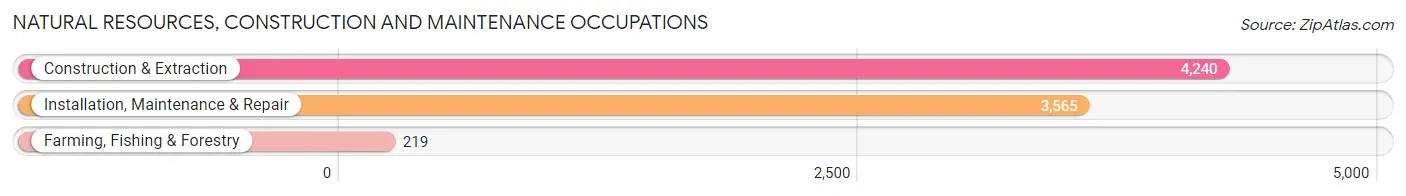
Natural Resources, Construction and Maintenance Occupations
The most common Natural Resources, Construction and Maintenance occupations in Alamance County are Construction & Extraction (4,240 | 5.1%), Installation, Maintenance & Repair (3,565 | 4.3%), and Farming, Fishing & Forestry (219 | 0.3%).
Natural Resources, Construction and Maintenance Occupations by Sex
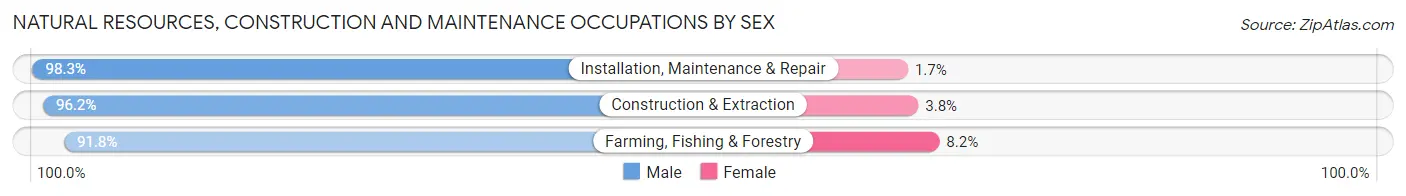
| Occupation | Male | Female |
| Farming, Fishing & Forestry | 201 (91.8%) | 18 (8.2%) |
| Construction & Extraction | 4,077 (96.2%) | 163 (3.8%) |
| Installation, Maintenance & Repair | 3,505 (98.3%) | 60 (1.7%) |
| Total (Category) | 7,783 (97.0%) | 241 (3.0%) |
| Total (Overall) | 42,440 (51.6%) | 39,858 (48.4%) |
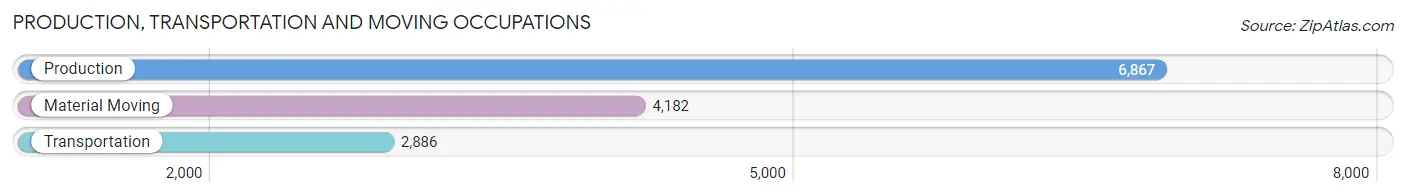
Production, Transportation and Moving Occupations
The most common Production, Transportation and Moving occupations in Alamance County are Production (6,867 | 8.3%), Material Moving (4,182 | 5.1%), and Transportation (2,886 | 3.5%).
Production, Transportation and Moving Occupations by Sex
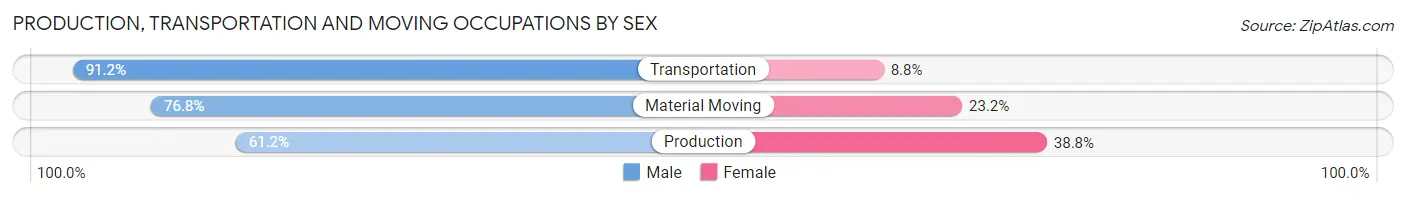
| Occupation | Male | Female |
| Production | 4,205 (61.2%) | 2,662 (38.8%) |
| Transportation | 2,631 (91.2%) | 255 (8.8%) |
| Material Moving | 3,211 (76.8%) | 971 (23.2%) |
| Total (Category) | 10,047 (72.1%) | 3,888 (27.9%) |
| Total (Overall) | 42,440 (51.6%) | 39,858 (48.4%) |
Employment Industries by Sex in Alamance County
Employment Industries in Alamance County
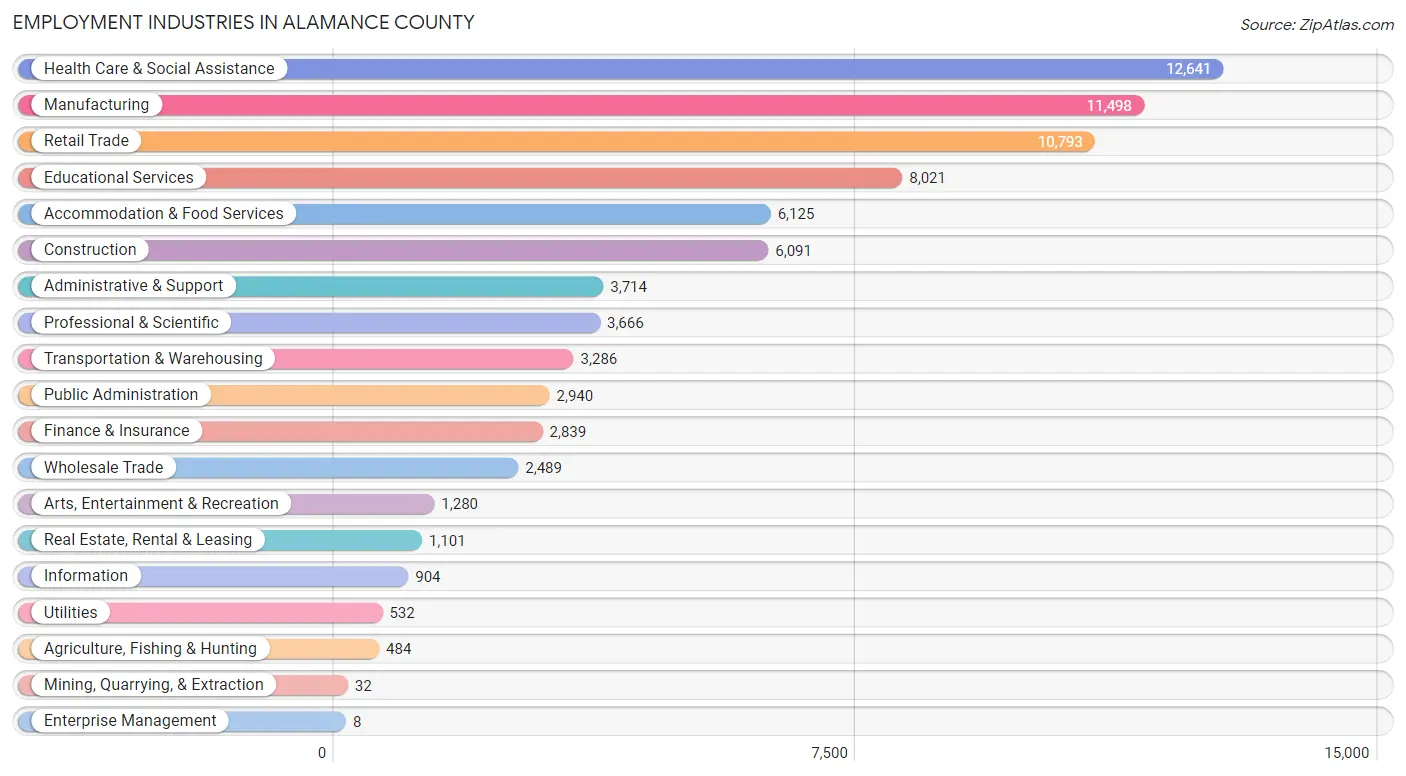
The major employment industries in Alamance County include Health Care & Social Assistance (12,641 | 15.4%), Manufacturing (11,498 | 14.0%), Retail Trade (10,793 | 13.1%), Educational Services (8,021 | 9.8%), and Accommodation & Food Services (6,125 | 7.4%).
Employment Industries by Sex in Alamance County
The Alamance County industries that see more men than women are Mining, Quarrying, & Extraction (100.0%), Enterprise Management (100.0%), and Agriculture, Fishing & Hunting (94.8%), whereas the industries that tend to have a higher number of women are Health Care & Social Assistance (78.9%), Finance & Insurance (72.0%), and Educational Services (69.9%).

| Industry | Male | Female |
| Agriculture, Fishing & Hunting | 459 (94.8%) | 25 (5.2%) |
| Mining, Quarrying, & Extraction | 32 (100.0%) | 0 (0.0%) |
| Construction | 5,543 (91.0%) | 548 (9.0%) |
| Manufacturing | 7,246 (63.0%) | 4,252 (37.0%) |
| Wholesale Trade | 1,552 (62.4%) | 937 (37.7%) |
| Retail Trade | 5,588 (51.8%) | 5,205 (48.2%) |
| Transportation & Warehousing | 2,674 (81.4%) | 612 (18.6%) |
| Utilities | 454 (85.3%) | 78 (14.7%) |
| Information | 456 (50.4%) | 448 (49.6%) |
| Finance & Insurance | 794 (28.0%) | 2,045 (72.0%) |
| Real Estate, Rental & Leasing | 410 (37.2%) | 691 (62.8%) |
| Professional & Scientific | 1,970 (53.7%) | 1,696 (46.3%) |
| Enterprise Management | 8 (100.0%) | 0 (0.0%) |
| Administrative & Support | 2,639 (71.1%) | 1,075 (28.9%) |
| Educational Services | 2,416 (30.1%) | 5,605 (69.9%) |
| Health Care & Social Assistance | 2,669 (21.1%) | 9,972 (78.9%) |
| Arts, Entertainment & Recreation | 854 (66.7%) | 426 (33.3%) |
| Accommodation & Food Services | 2,632 (43.0%) | 3,493 (57.0%) |
| Public Administration | 1,811 (61.6%) | 1,129 (38.4%) |
| Total | 42,440 (51.6%) | 39,858 (48.4%) |
Education in Alamance County
School Enrollment in Alamance County
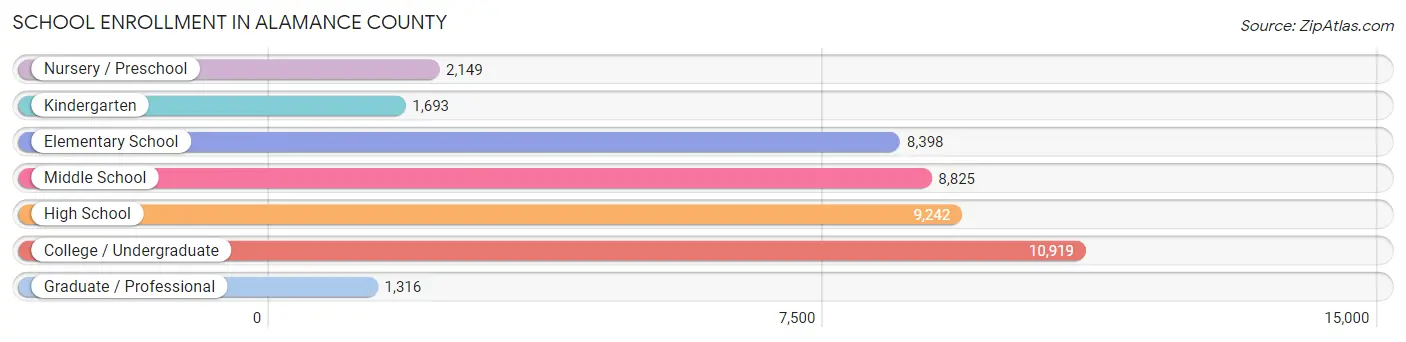
The most common levels of schooling among the 42,542 students in Alamance County are college / undergraduate (10,919 | 25.7%), high school (9,242 | 21.7%), and middle school (8,825 | 20.7%).
| School Level | # Students | % Students |
| Nursery / Preschool | 2,149 | 5.1% |
| Kindergarten | 1,693 | 4.0% |
| Elementary School | 8,398 | 19.7% |
| Middle School | 8,825 | 20.7% |
| High School | 9,242 | 21.7% |
| College / Undergraduate | 10,919 | 25.7% |
| Graduate / Professional | 1,316 | 3.1% |
| Total | 42,542 | 100.0% |
School Enrollment by Age by Funding Source in Alamance County
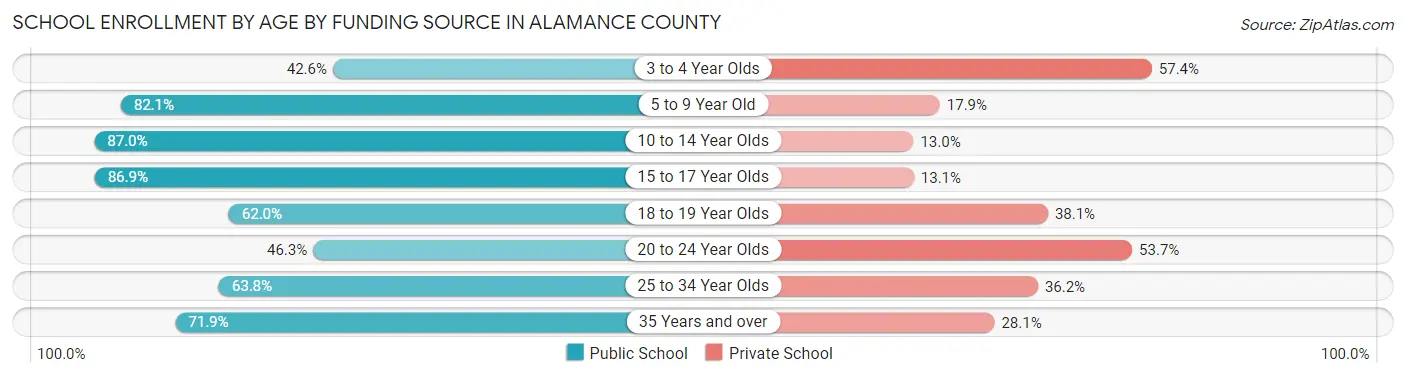
Out of a total of 42,542 students who are enrolled in schools in Alamance County, 10,933 (25.7%) attend a private institution, while the remaining 31,609 (74.3%) are enrolled in public schools. The age group of 3 to 4 year olds has the highest likelihood of being enrolled in private schools, with 953 (57.4% in the age bracket) enrolled. Conversely, the age group of 10 to 14 year olds has the lowest likelihood of being enrolled in a private school, with 9,606 (87.0% in the age bracket) attending a public institution.
| Age Bracket | Public School | Private School |
| 3 to 4 Year Olds | 707 (42.6%) | 953 (57.4%) |
| 5 to 9 Year Old | 7,651 (82.1%) | 1,670 (17.9%) |
| 10 to 14 Year Olds | 9,606 (87.0%) | 1,436 (13.0%) |
| 15 to 17 Year Olds | 5,573 (86.9%) | 838 (13.1%) |
| 18 to 19 Year Olds | 3,227 (62.0%) | 1,982 (38.1%) |
| 20 to 24 Year Olds | 2,566 (46.3%) | 2,980 (53.7%) |
| 25 to 34 Year Olds | 1,072 (63.8%) | 608 (36.2%) |
| 35 Years and over | 1,203 (71.9%) | 470 (28.1%) |
| Total | 31,609 (74.3%) | 10,933 (25.7%) |
Educational Attainment by Field of Study in Alamance County
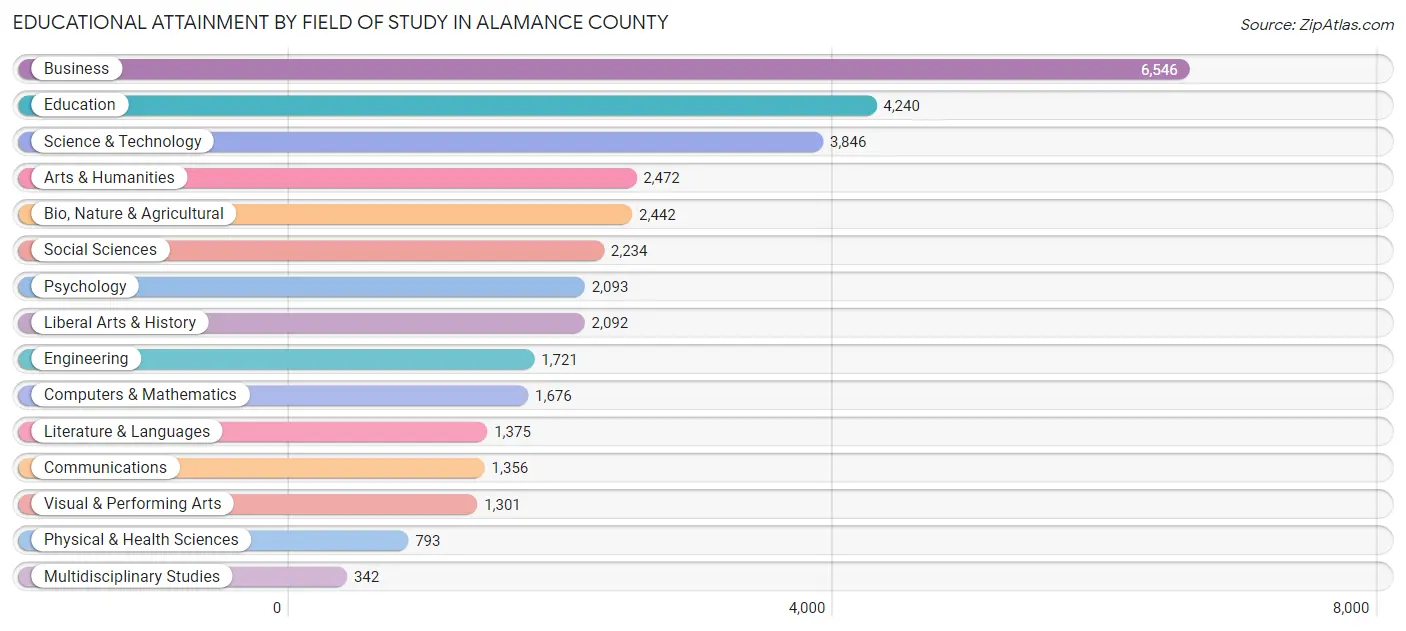
Business (6,546 | 19.0%), education (4,240 | 12.3%), science & technology (3,846 | 11.1%), arts & humanities (2,472 | 7.2%), and bio, nature & agricultural (2,442 | 7.1%) are the most common fields of study among 34,529 individuals in Alamance County who have obtained a bachelor's degree or higher.
| Field of Study | # Graduates | % Graduates |
| Computers & Mathematics | 1,676 | 4.9% |
| Bio, Nature & Agricultural | 2,442 | 7.1% |
| Physical & Health Sciences | 793 | 2.3% |
| Psychology | 2,093 | 6.1% |
| Social Sciences | 2,234 | 6.5% |
| Engineering | 1,721 | 5.0% |
| Multidisciplinary Studies | 342 | 1.0% |
| Science & Technology | 3,846 | 11.1% |
| Business | 6,546 | 19.0% |
| Education | 4,240 | 12.3% |
| Literature & Languages | 1,375 | 4.0% |
| Liberal Arts & History | 2,092 | 6.1% |
| Visual & Performing Arts | 1,301 | 3.8% |
| Communications | 1,356 | 3.9% |
| Arts & Humanities | 2,472 | 7.2% |
| Total | 34,529 | 100.0% |
Transportation & Commute in Alamance County
Vehicle Availability by Sex in Alamance County
The most prevalent vehicle ownership categories in Alamance County are males with 2 vehicles (15,920, accounting for 38.8%) and females with 2 vehicles (14,025, making up 41.2%).
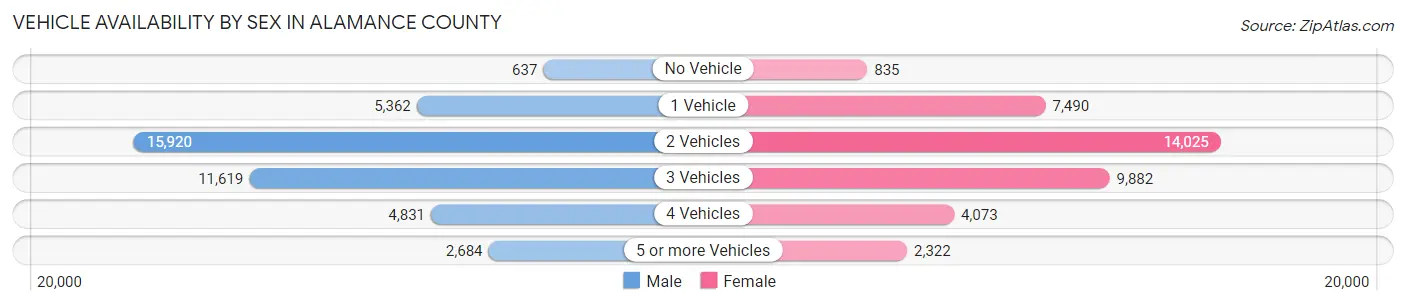
| Vehicles Available | Male | Female |
| No Vehicle | 637 (1.5%) | 835 (2.2%) |
| 1 Vehicle | 5,362 (13.1%) | 7,490 (19.4%) |
| 2 Vehicles | 15,920 (38.8%) | 14,025 (36.3%) |
| 3 Vehicles | 11,619 (28.3%) | 9,882 (25.6%) |
| 4 Vehicles | 4,831 (11.8%) | 4,073 (10.5%) |
| 5 or more Vehicles | 2,684 (6.5%) | 2,322 (6.0%) |
| Total | 41,053 (100.0%) | 38,627 (100.0%) |
Commute Time in Alamance County
The most frequently occuring commute durations in Alamance County are 15 to 19 minutes (12,553 commuters, 17.0%), 20 to 24 minutes (10,208 commuters, 13.8%), and 10 to 14 minutes (9,712 commuters, 13.1%).
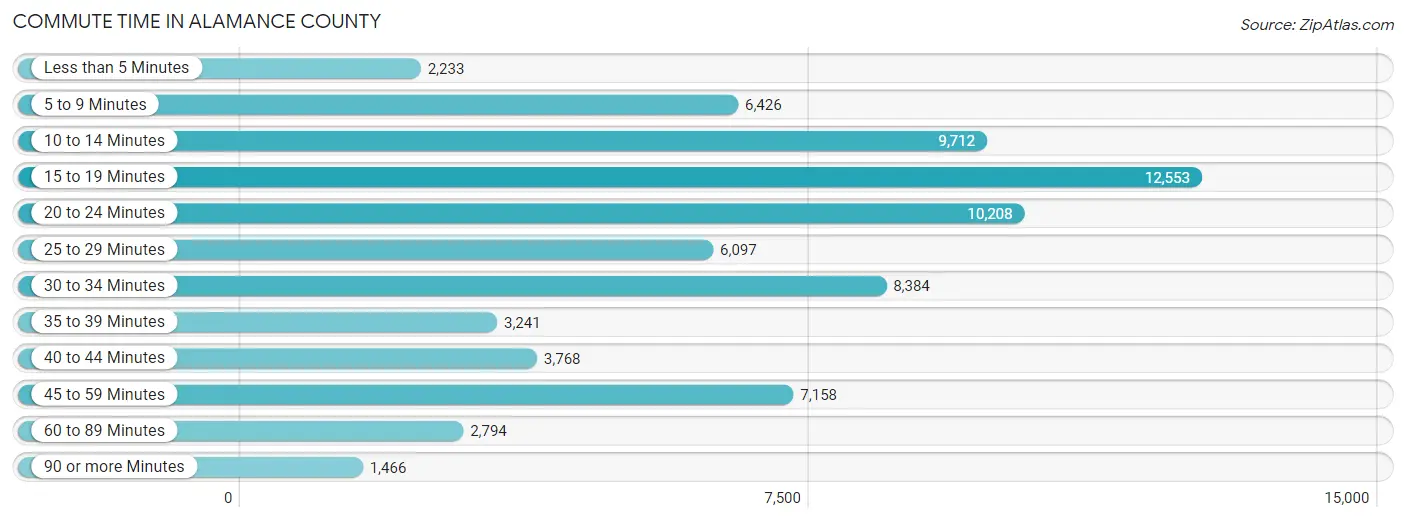
| Commute Time | # Commuters | % Commuters |
| Less than 5 Minutes | 2,233 | 3.0% |
| 5 to 9 Minutes | 6,426 | 8.7% |
| 10 to 14 Minutes | 9,712 | 13.1% |
| 15 to 19 Minutes | 12,553 | 17.0% |
| 20 to 24 Minutes | 10,208 | 13.8% |
| 25 to 29 Minutes | 6,097 | 8.2% |
| 30 to 34 Minutes | 8,384 | 11.3% |
| 35 to 39 Minutes | 3,241 | 4.4% |
| 40 to 44 Minutes | 3,768 | 5.1% |
| 45 to 59 Minutes | 7,158 | 9.7% |
| 60 to 89 Minutes | 2,794 | 3.8% |
| 90 or more Minutes | 1,466 | 2.0% |
Commute Time by Sex in Alamance County
The most common commute times in Alamance County are 15 to 19 minutes (5,980 commuters, 15.5%) for males and 15 to 19 minutes (6,573 commuters, 18.6%) for females.
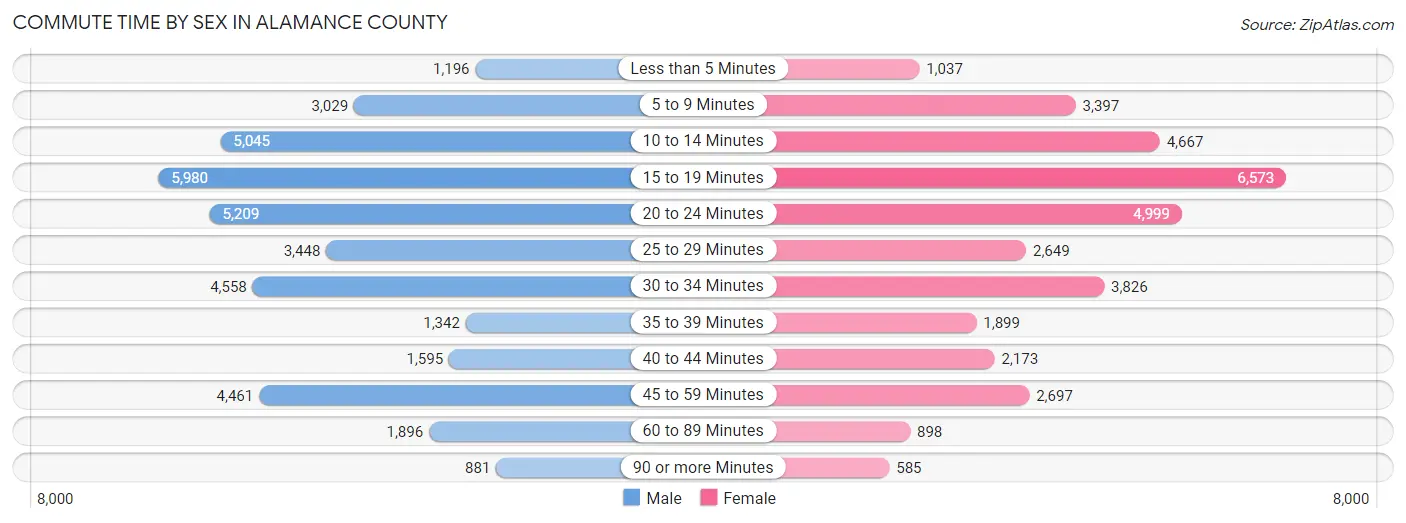
| Commute Time | Male | Female |
| Less than 5 Minutes | 1,196 (3.1%) | 1,037 (2.9%) |
| 5 to 9 Minutes | 3,029 (7.8%) | 3,397 (9.6%) |
| 10 to 14 Minutes | 5,045 (13.1%) | 4,667 (13.2%) |
| 15 to 19 Minutes | 5,980 (15.5%) | 6,573 (18.6%) |
| 20 to 24 Minutes | 5,209 (13.5%) | 4,999 (14.1%) |
| 25 to 29 Minutes | 3,448 (8.9%) | 2,649 (7.5%) |
| 30 to 34 Minutes | 4,558 (11.8%) | 3,826 (10.8%) |
| 35 to 39 Minutes | 1,342 (3.5%) | 1,899 (5.4%) |
| 40 to 44 Minutes | 1,595 (4.1%) | 2,173 (6.1%) |
| 45 to 59 Minutes | 4,461 (11.6%) | 2,697 (7.6%) |
| 60 to 89 Minutes | 1,896 (4.9%) | 898 (2.5%) |
| 90 or more Minutes | 881 (2.3%) | 585 (1.7%) |
Time of Departure to Work by Sex in Alamance County
The most frequent times of departure to work in Alamance County are 7:00 AM to 7:29 AM (5,763, 14.9%) for males and 7:00 AM to 7:29 AM (6,011, 17.0%) for females.

| Time of Departure | Male | Female |
| 12:00 AM to 4:59 AM | 2,898 (7.5%) | 1,007 (2.8%) |
| 5:00 AM to 5:29 AM | 1,885 (4.9%) | 951 (2.7%) |
| 5:30 AM to 5:59 AM | 1,839 (4.8%) | 1,203 (3.4%) |
| 6:00 AM to 6:29 AM | 4,052 (10.5%) | 2,182 (6.2%) |
| 6:30 AM to 6:59 AM | 4,963 (12.8%) | 3,521 (10.0%) |
| 7:00 AM to 7:29 AM | 5,763 (14.9%) | 6,011 (17.0%) |
| 7:30 AM to 7:59 AM | 4,200 (10.9%) | 5,469 (15.4%) |
| 8:00 AM to 8:29 AM | 3,230 (8.4%) | 4,213 (11.9%) |
| 8:30 AM to 8:59 AM | 1,780 (4.6%) | 1,420 (4.0%) |
| 9:00 AM to 9:59 AM | 1,482 (3.8%) | 1,807 (5.1%) |
| 10:00 AM to 10:59 AM | 711 (1.8%) | 1,359 (3.8%) |
| 11:00 AM to 11:59 AM | 215 (0.6%) | 356 (1.0%) |
| 12:00 PM to 3:59 PM | 2,824 (7.3%) | 2,799 (7.9%) |
| 4:00 PM to 11:59 PM | 2,798 (7.2%) | 3,102 (8.8%) |
| Total | 38,640 (100.0%) | 35,400 (100.0%) |
Housing Occupancy in Alamance County
Occupancy by Ownership in Alamance County
Of the total 67,370 dwellings in Alamance County, owner-occupied units account for 44,487 (66.0%), while renter-occupied units make up 22,883 (34.0%).

| Occupancy | # Housing Units | % Housing Units |
| Owner Occupied Housing Units | 44,487 | 66.0% |
| Renter-Occupied Housing Units | 22,883 | 34.0% |
| Total Occupied Housing Units | 67,370 | 100.0% |
Occupancy by Household Size in Alamance County
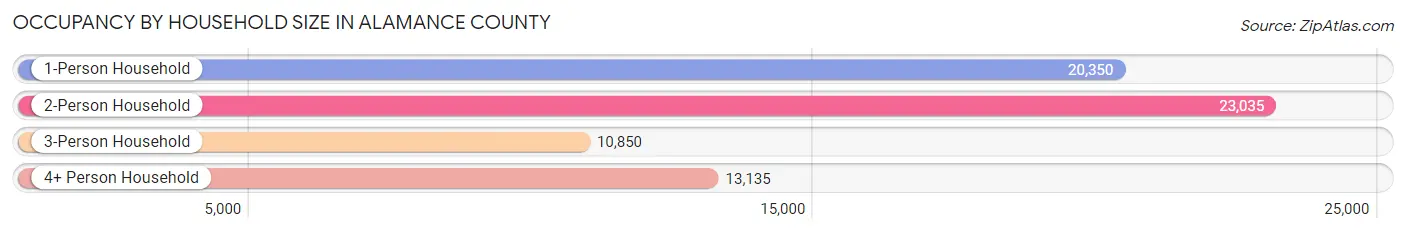
| Household Size | # Housing Units | % Housing Units |
| 1-Person Household | 20,350 | 30.2% |
| 2-Person Household | 23,035 | 34.2% |
| 3-Person Household | 10,850 | 16.1% |
| 4+ Person Household | 13,135 | 19.5% |
| Total Housing Units | 67,370 | 100.0% |
Occupancy by Ownership by Household Size in Alamance County

| Household Size | Owner-occupied | Renter-occupied |
| 1-Person Household | 10,806 (53.1%) | 9,544 (46.9%) |
| 2-Person Household | 16,948 (73.6%) | 6,087 (26.4%) |
| 3-Person Household | 7,378 (68.0%) | 3,472 (32.0%) |
| 4+ Person Household | 9,355 (71.2%) | 3,780 (28.8%) |
| Total Housing Units | 44,487 (66.0%) | 22,883 (34.0%) |
Occupancy by Educational Attainment in Alamance County
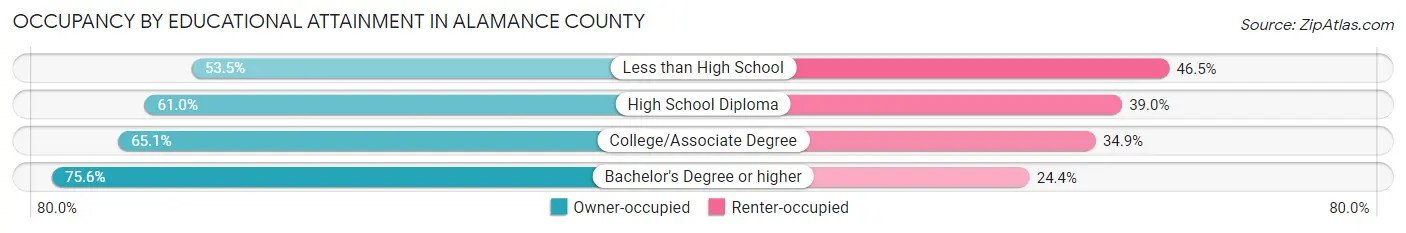
| Household Size | Owner-occupied | Renter-occupied |
| Less than High School | 3,447 (53.5%) | 2,998 (46.5%) |
| High School Diploma | 10,648 (61.0%) | 6,816 (39.0%) |
| College/Associate Degree | 15,395 (65.1%) | 8,237 (34.9%) |
| Bachelor's Degree or higher | 14,997 (75.6%) | 4,832 (24.4%) |
Occupancy by Age of Householder in Alamance County
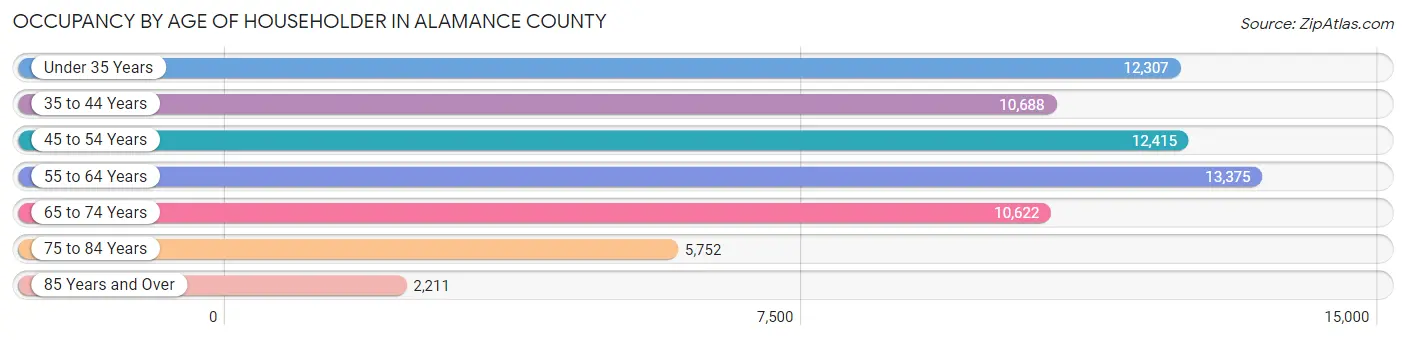
| Age Bracket | # Households | % Households |
| Under 35 Years | 12,307 | 18.3% |
| 35 to 44 Years | 10,688 | 15.9% |
| 45 to 54 Years | 12,415 | 18.4% |
| 55 to 64 Years | 13,375 | 19.9% |
| 65 to 74 Years | 10,622 | 15.8% |
| 75 to 84 Years | 5,752 | 8.5% |
| 85 Years and Over | 2,211 | 3.3% |
| Total | 67,370 | 100.0% |
Housing Finances in Alamance County
Median Income by Occupancy in Alamance County
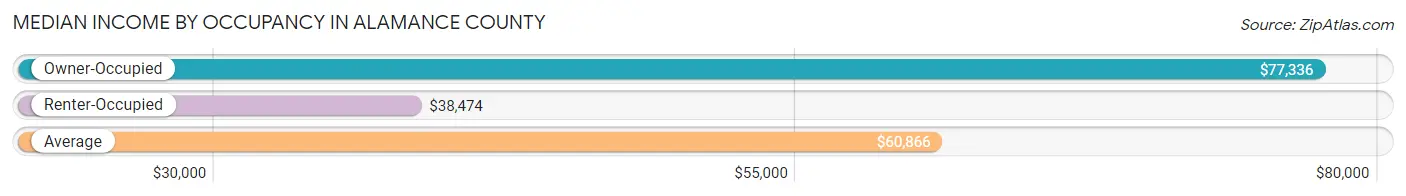
| Occupancy Type | # Households | Median Income |
| Owner-Occupied | 44,487 (66.0%) | $77,336 |
| Renter-Occupied | 22,883 (34.0%) | $38,474 |
| Average | 67,370 (100.0%) | $60,866 |
Occupancy by Householder Income Bracket in Alamance County
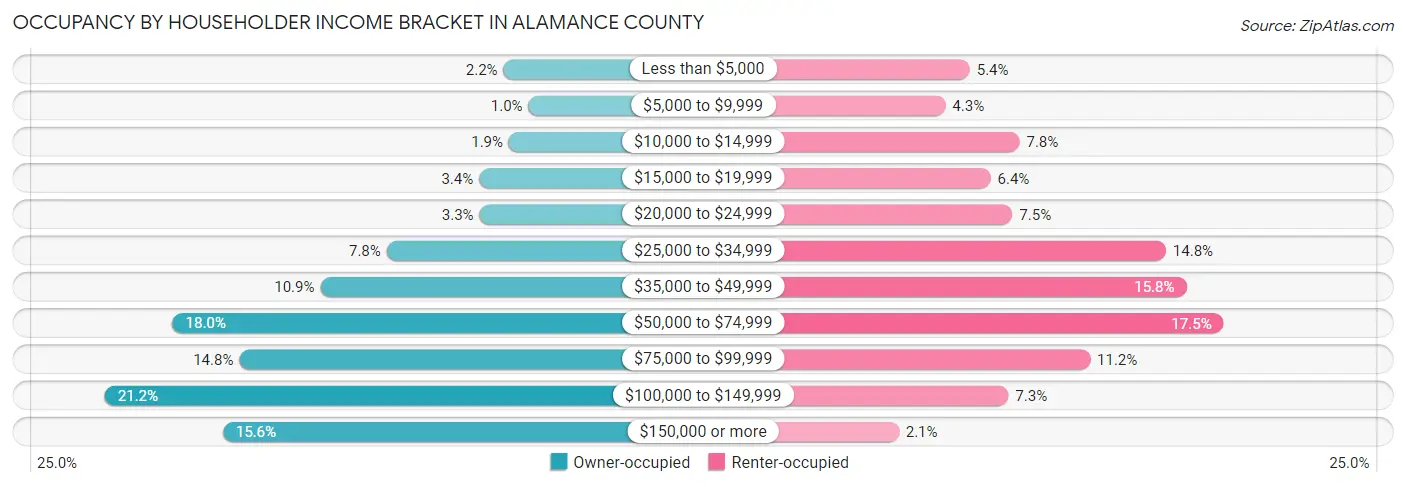
| Income Bracket | Owner-occupied | Renter-occupied |
| Less than $5,000 | 978 (2.2%) | 1,244 (5.4%) |
| $5,000 to $9,999 | 451 (1.0%) | 980 (4.3%) |
| $10,000 to $14,999 | 861 (1.9%) | 1,787 (7.8%) |
| $15,000 to $19,999 | 1,495 (3.4%) | 1,472 (6.4%) |
| $20,000 to $24,999 | 1,485 (3.3%) | 1,710 (7.5%) |
| $25,000 to $34,999 | 3,452 (7.8%) | 3,383 (14.8%) |
| $35,000 to $49,999 | 4,858 (10.9%) | 3,605 (15.8%) |
| $50,000 to $74,999 | 7,986 (17.9%) | 4,008 (17.5%) |
| $75,000 to $99,999 | 6,574 (14.8%) | 2,557 (11.2%) |
| $100,000 to $149,999 | 9,423 (21.2%) | 1,665 (7.3%) |
| $150,000 or more | 6,924 (15.6%) | 472 (2.1%) |
| Total | 44,487 (100.0%) | 22,883 (100.0%) |
Monthly Housing Cost Tiers in Alamance County
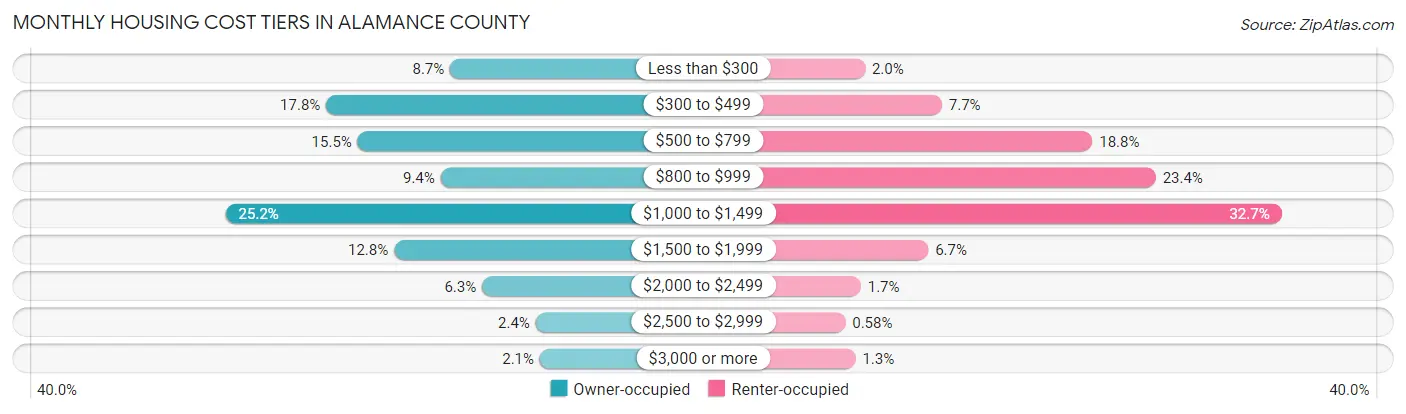
| Monthly Cost | Owner-occupied | Renter-occupied |
| Less than $300 | 3,853 (8.7%) | 464 (2.0%) |
| $300 to $499 | 7,914 (17.8%) | 1,759 (7.7%) |
| $500 to $799 | 6,880 (15.5%) | 4,296 (18.8%) |
| $800 to $999 | 4,163 (9.4%) | 5,364 (23.4%) |
| $1,000 to $1,499 | 11,215 (25.2%) | 7,483 (32.7%) |
| $1,500 to $1,999 | 5,692 (12.8%) | 1,531 (6.7%) |
| $2,000 to $2,499 | 2,807 (6.3%) | 393 (1.7%) |
| $2,500 to $2,999 | 1,049 (2.4%) | 133 (0.6%) |
| $3,000 or more | 914 (2.1%) | 305 (1.3%) |
| Total | 44,487 (100.0%) | 22,883 (100.0%) |
Physical Housing Characteristics in Alamance County
Housing Structures in Alamance County

| Structure Type | # Housing Units | % Housing Units |
| Single Unit, Detached | 44,956 | 66.7% |
| Single Unit, Attached | 2,268 | 3.4% |
| 2 Unit Apartments | 1,636 | 2.4% |
| 3 or 4 Unit Apartments | 2,309 | 3.4% |
| 5 to 9 Unit Apartments | 3,642 | 5.4% |
| 10 or more Apartments | 5,388 | 8.0% |
| Mobile Home / Other | 7,171 | 10.6% |
| Total | 67,370 | 100.0% |
Housing Structures by Occupancy in Alamance County
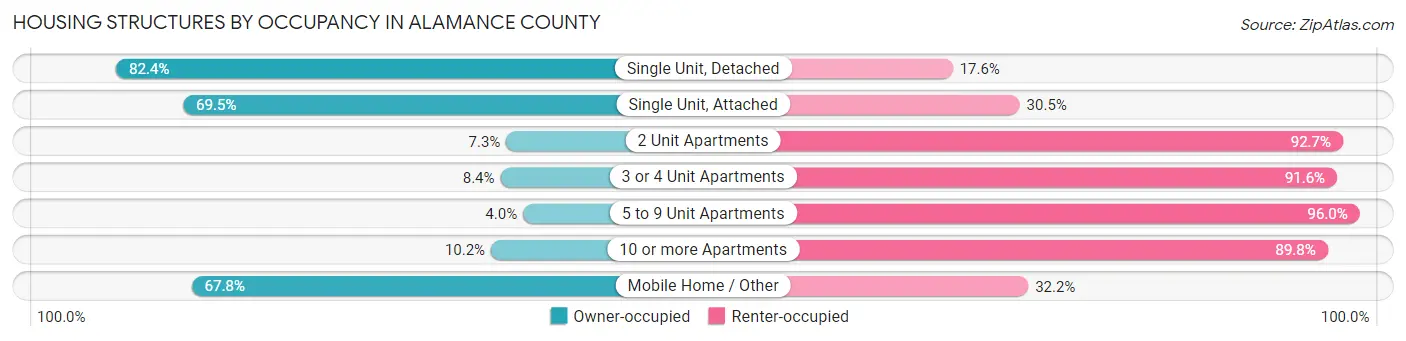
| Structure Type | Owner-occupied | Renter-occupied |
| Single Unit, Detached | 37,036 (82.4%) | 7,920 (17.6%) |
| Single Unit, Attached | 1,576 (69.5%) | 692 (30.5%) |
| 2 Unit Apartments | 119 (7.3%) | 1,517 (92.7%) |
| 3 or 4 Unit Apartments | 194 (8.4%) | 2,115 (91.6%) |
| 5 to 9 Unit Apartments | 147 (4.0%) | 3,495 (96.0%) |
| 10 or more Apartments | 550 (10.2%) | 4,838 (89.8%) |
| Mobile Home / Other | 4,865 (67.8%) | 2,306 (32.2%) |
| Total | 44,487 (66.0%) | 22,883 (34.0%) |
Housing Structures by Number of Rooms in Alamance County
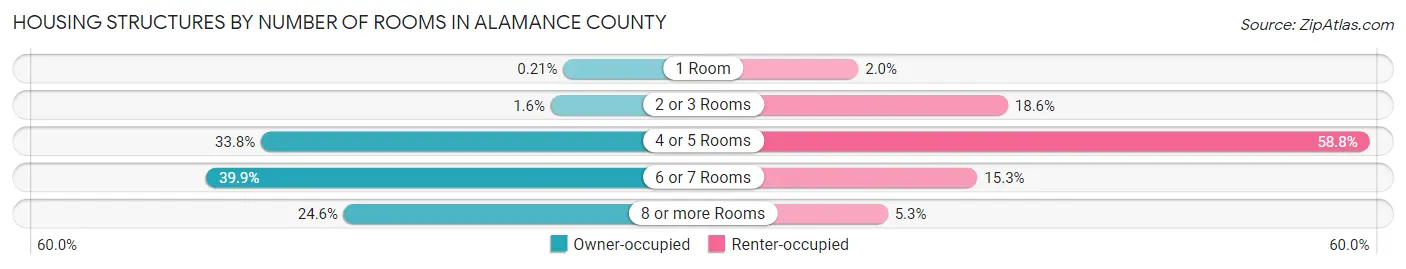
| Number of Rooms | Owner-occupied | Renter-occupied |
| 1 Room | 92 (0.2%) | 466 (2.0%) |
| 2 or 3 Rooms | 712 (1.6%) | 4,265 (18.6%) |
| 4 or 5 Rooms | 15,020 (33.8%) | 13,449 (58.8%) |
| 6 or 7 Rooms | 17,732 (39.9%) | 3,491 (15.3%) |
| 8 or more Rooms | 10,931 (24.6%) | 1,212 (5.3%) |
| Total | 44,487 (100.0%) | 22,883 (100.0%) |
Housing Structure by Heating Type in Alamance County
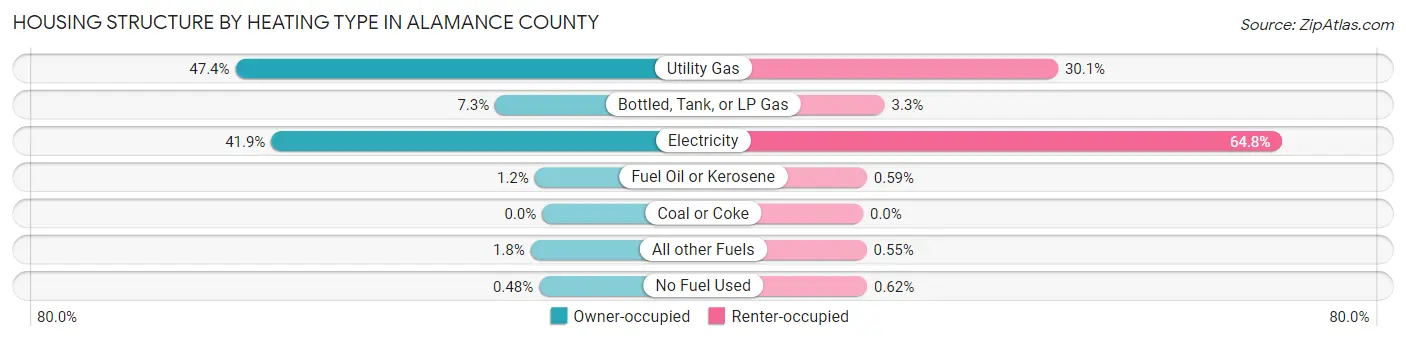
| Heating Type | Owner-occupied | Renter-occupied |
| Utility Gas | 21,096 (47.4%) | 6,895 (30.1%) |
| Bottled, Tank, or LP Gas | 3,235 (7.3%) | 762 (3.3%) |
| Electricity | 18,633 (41.9%) | 14,824 (64.8%) |
| Fuel Oil or Kerosene | 518 (1.2%) | 136 (0.6%) |
| Coal or Coke | 0 (0.0%) | 0 (0.0%) |
| All other Fuels | 791 (1.8%) | 125 (0.5%) |
| No Fuel Used | 214 (0.5%) | 141 (0.6%) |
| Total | 44,487 (100.0%) | 22,883 (100.0%) |
Household Vehicle Usage in Alamance County
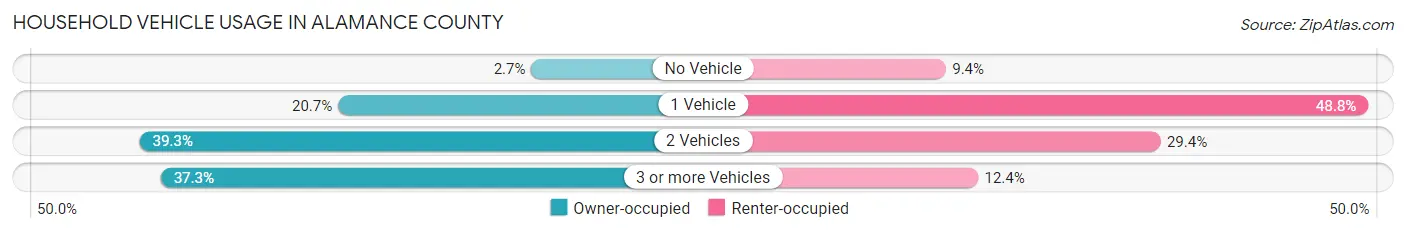
| Vehicles per Household | Owner-occupied | Renter-occupied |
| No Vehicle | 1,200 (2.7%) | 2,143 (9.4%) |
| 1 Vehicle | 9,228 (20.7%) | 11,175 (48.8%) |
| 2 Vehicles | 17,471 (39.3%) | 6,731 (29.4%) |
| 3 or more Vehicles | 16,588 (37.3%) | 2,834 (12.4%) |
| Total | 44,487 (100.0%) | 22,883 (100.0%) |
Real Estate & Mortgages in Alamance County
Real Estate and Mortgage Overview in Alamance County
| Characteristic | Without Mortgage | With Mortgage |
| Housing Units | 17,109 | 27,378 |
| Median Property Value | $165,100 | $216,800 |
| Median Household Income | $53,024 | $5,568 |
| Monthly Housing Costs | $419 | $867 |
| Real Estate Taxes | $1,239 | $550 |
Property Value by Mortgage Status in Alamance County
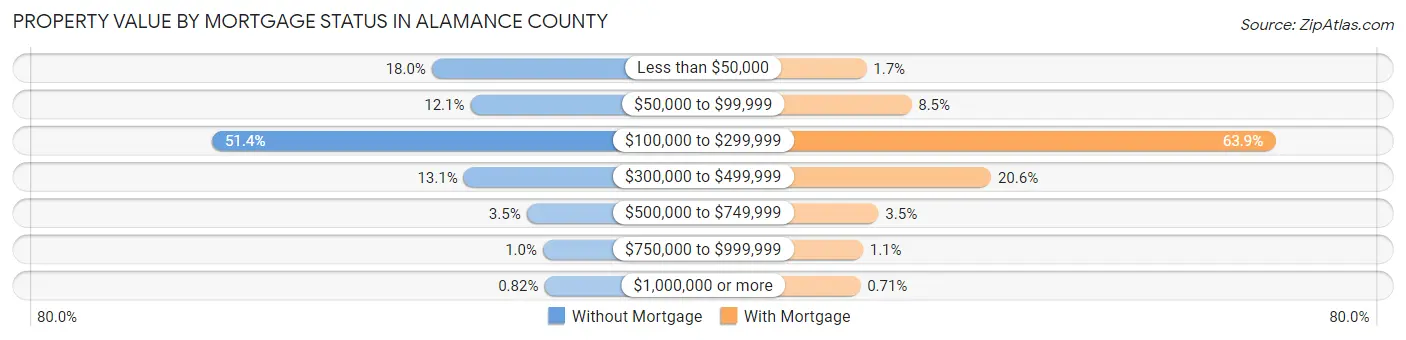
| Property Value | Without Mortgage | With Mortgage |
| Less than $50,000 | 3,075 (18.0%) | 453 (1.7%) |
| $50,000 to $99,999 | 2,067 (12.1%) | 2,324 (8.5%) |
| $100,000 to $299,999 | 8,801 (51.4%) | 17,501 (63.9%) |
| $300,000 to $499,999 | 2,245 (13.1%) | 5,651 (20.6%) |
| $500,000 to $749,999 | 603 (3.5%) | 953 (3.5%) |
| $750,000 to $999,999 | 178 (1.0%) | 302 (1.1%) |
| $1,000,000 or more | 140 (0.8%) | 194 (0.7%) |
| Total | 17,109 (100.0%) | 27,378 (100.0%) |
Household Income by Mortgage Status in Alamance County
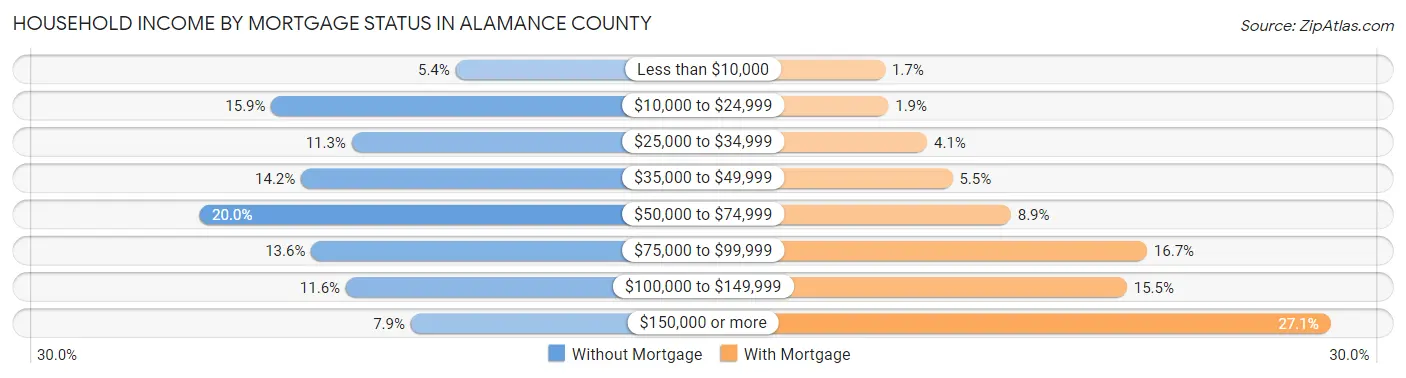
| Household Income | Without Mortgage | With Mortgage |
| Less than $10,000 | 918 (5.4%) | 461 (1.7%) |
| $10,000 to $24,999 | 2,721 (15.9%) | 511 (1.9%) |
| $25,000 to $34,999 | 1,935 (11.3%) | 1,120 (4.1%) |
| $35,000 to $49,999 | 2,430 (14.2%) | 1,517 (5.5%) |
| $50,000 to $74,999 | 3,427 (20.0%) | 2,428 (8.9%) |
| $75,000 to $99,999 | 2,330 (13.6%) | 4,559 (16.7%) |
| $100,000 to $149,999 | 1,992 (11.6%) | 4,244 (15.5%) |
| $150,000 or more | 1,356 (7.9%) | 7,431 (27.1%) |
| Total | 17,109 (100.0%) | 27,378 (100.0%) |
Property Value to Household Income Ratio in Alamance County
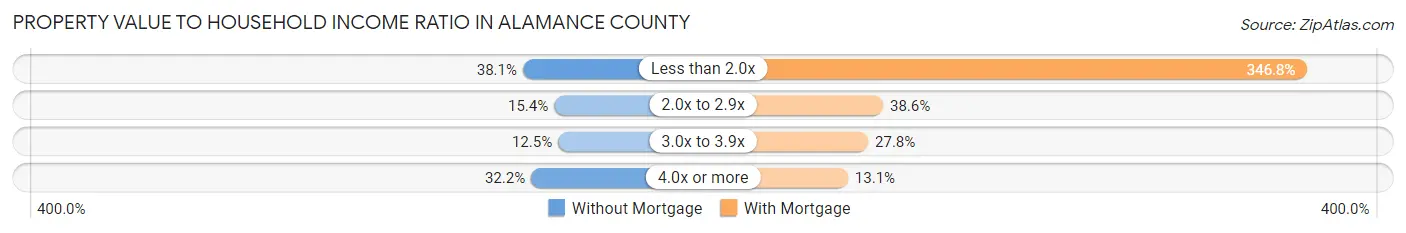
| Value-to-Income Ratio | Without Mortgage | With Mortgage |
| Less than 2.0x | 6,516 (38.1%) | 94,944 (346.8%) |
| 2.0x to 2.9x | 2,631 (15.4%) | 10,571 (38.6%) |
| 3.0x to 3.9x | 2,145 (12.5%) | 7,600 (27.8%) |
| 4.0x or more | 5,501 (32.2%) | 3,582 (13.1%) |
| Total | 17,109 (100.0%) | 27,378 (100.0%) |
Real Estate Taxes by Mortgage Status in Alamance County

| Property Taxes | Without Mortgage | With Mortgage |
| Less than $800 | 5,108 (29.9%) | 84 (0.3%) |
| $800 to $1,499 | 4,775 (27.9%) | 4,477 (16.4%) |
| $800 to $1,499 | 6,342 (37.1%) | 9,598 (35.1%) |
| Total | 17,109 (100.0%) | 27,378 (100.0%) |
Health & Disability in Alamance County
Health Insurance Coverage by Age in Alamance County
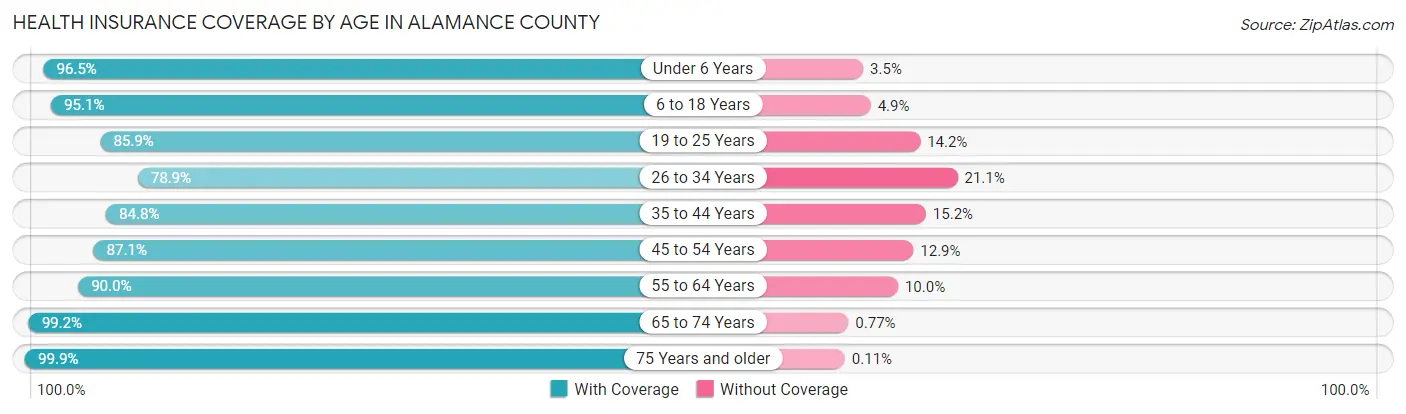
| Age Bracket | With Coverage | Without Coverage |
| Under 6 Years | 11,115 (96.5%) | 405 (3.5%) |
| 6 to 18 Years | 28,718 (95.1%) | 1,490 (4.9%) |
| 19 to 25 Years | 13,920 (85.9%) | 2,294 (14.1%) |
| 26 to 34 Years | 15,395 (78.9%) | 4,123 (21.1%) |
| 35 to 44 Years | 17,214 (84.8%) | 3,090 (15.2%) |
| 45 to 54 Years | 19,169 (87.1%) | 2,834 (12.9%) |
| 55 to 64 Years | 20,272 (90.0%) | 2,254 (10.0%) |
| 65 to 74 Years | 16,513 (99.2%) | 128 (0.8%) |
| 75 Years and older | 11,821 (99.9%) | 13 (0.1%) |
| Total | 154,137 (90.3%) | 16,631 (9.7%) |
Health Insurance Coverage by Citizenship Status in Alamance County
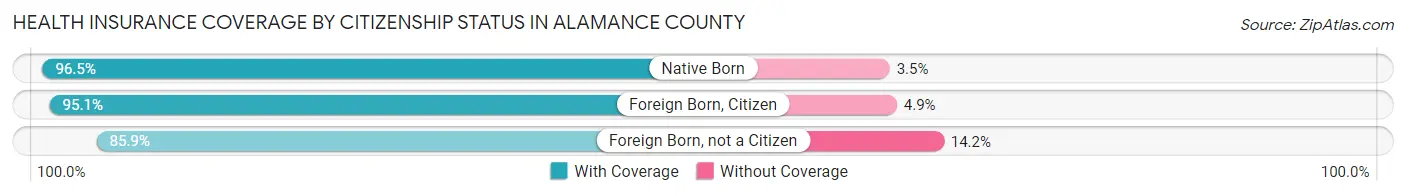
| Citizenship Status | With Coverage | Without Coverage |
| Native Born | 11,115 (96.5%) | 405 (3.5%) |
| Foreign Born, Citizen | 28,718 (95.1%) | 1,490 (4.9%) |
| Foreign Born, not a Citizen | 13,920 (85.9%) | 2,294 (14.1%) |
Health Insurance Coverage by Household Income in Alamance County
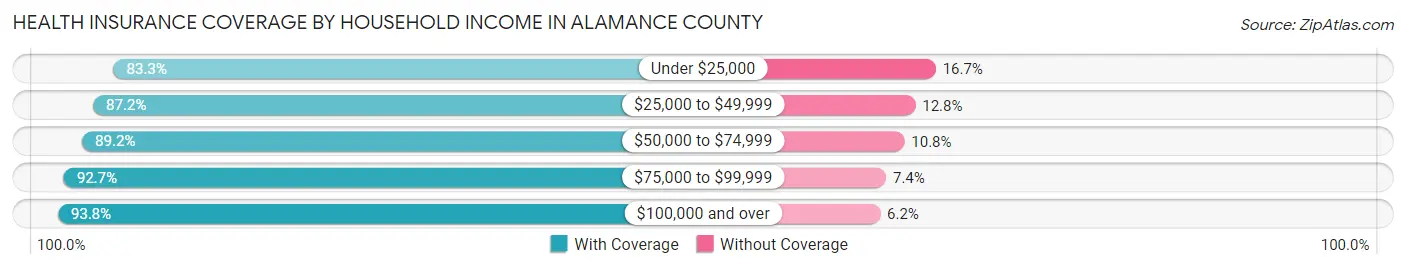
| Household Income | With Coverage | Without Coverage |
| Under $25,000 | 18,949 (83.3%) | 3,789 (16.7%) |
| $25,000 to $49,999 | 27,454 (87.2%) | 4,042 (12.8%) |
| $50,000 to $74,999 | 26,607 (89.2%) | 3,219 (10.8%) |
| $75,000 to $99,999 | 23,170 (92.6%) | 1,838 (7.3%) |
| $100,000 and over | 54,087 (93.8%) | 3,602 (6.2%) |
Public vs Private Health Insurance Coverage by Age in Alamance County
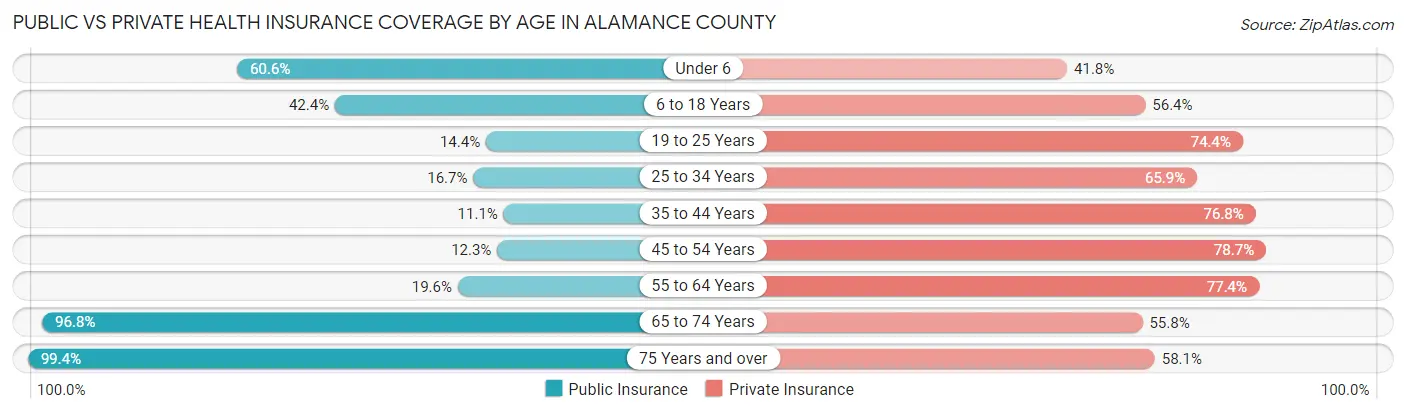
| Age Bracket | Public Insurance | Private Insurance |
| Under 6 | 6,978 (60.6%) | 4,818 (41.8%) |
| 6 to 18 Years | 12,806 (42.4%) | 17,022 (56.4%) |
| 19 to 25 Years | 2,329 (14.4%) | 12,067 (74.4%) |
| 25 to 34 Years | 3,262 (16.7%) | 12,869 (65.9%) |
| 35 to 44 Years | 2,249 (11.1%) | 15,594 (76.8%) |
| 45 to 54 Years | 2,703 (12.3%) | 17,324 (78.7%) |
| 55 to 64 Years | 4,412 (19.6%) | 17,438 (77.4%) |
| 65 to 74 Years | 16,101 (96.8%) | 9,288 (55.8%) |
| 75 Years and over | 11,764 (99.4%) | 6,876 (58.1%) |
| Total | 62,604 (36.7%) | 113,296 (66.3%) |
Disability Status by Sex by Age in Alamance County
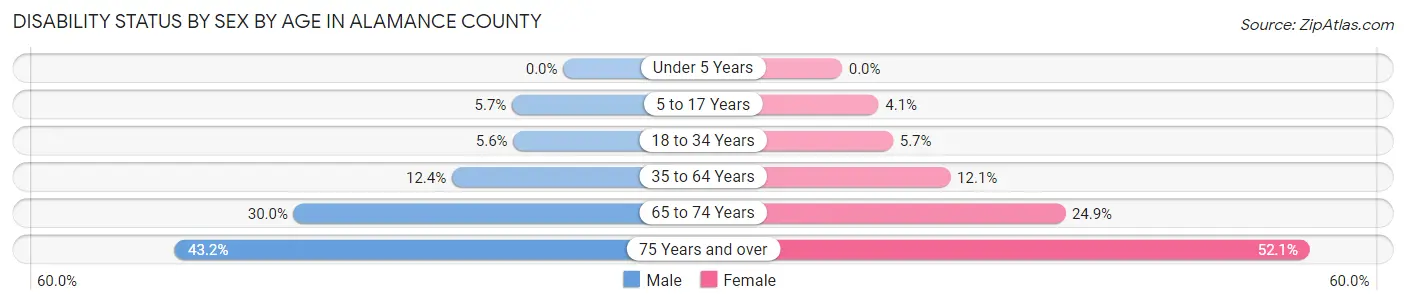
| Age Bracket | Male | Female |
| Under 5 Years | 0 (0.0%) | 0 (0.0%) |
| 5 to 17 Years | 818 (5.7%) | 557 (4.1%) |
| 18 to 34 Years | 1,059 (5.6%) | 1,172 (5.7%) |
| 35 to 64 Years | 3,876 (12.4%) | 4,055 (12.1%) |
| 65 to 74 Years | 2,270 (30.0%) | 2,256 (24.8%) |
| 75 Years and over | 2,013 (43.2%) | 3,742 (52.1%) |
Disability Class by Sex by Age in Alamance County
Disability Class: Hearing Difficulty
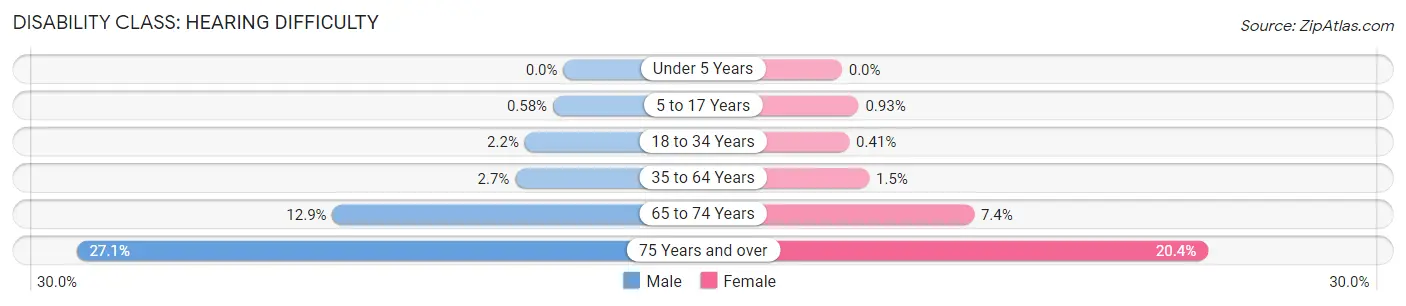
| Age Bracket | Male | Female |
| Under 5 Years | 0 (0.0%) | 0 (0.0%) |
| 5 to 17 Years | 83 (0.6%) | 127 (0.9%) |
| 18 to 34 Years | 410 (2.1%) | 84 (0.4%) |
| 35 to 64 Years | 836 (2.7%) | 512 (1.5%) |
| 65 to 74 Years | 972 (12.9%) | 668 (7.4%) |
| 75 Years and over | 1,262 (27.1%) | 1,464 (20.4%) |
Disability Class: Vision Difficulty
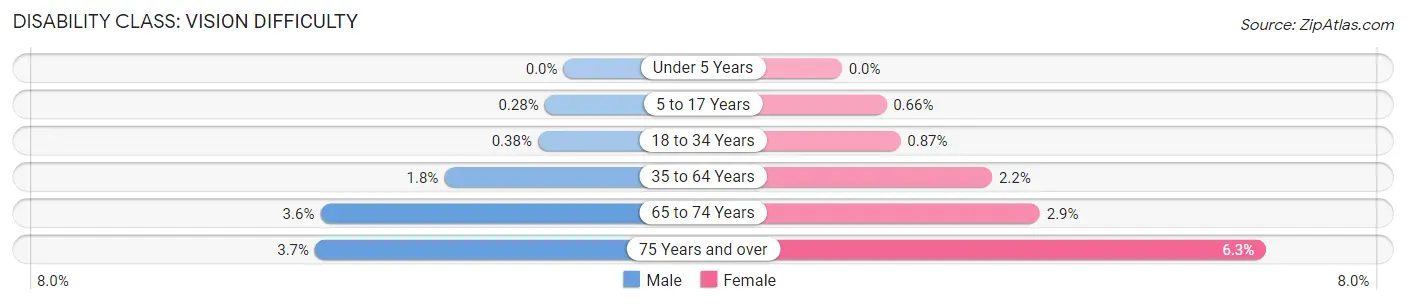
| Age Bracket | Male | Female |
| Under 5 Years | 0 (0.0%) | 0 (0.0%) |
| 5 to 17 Years | 40 (0.3%) | 90 (0.7%) |
| 18 to 34 Years | 73 (0.4%) | 179 (0.9%) |
| 35 to 64 Years | 552 (1.8%) | 749 (2.2%) |
| 65 to 74 Years | 273 (3.6%) | 267 (2.9%) |
| 75 Years and over | 172 (3.7%) | 452 (6.3%) |
Disability Class: Cognitive Difficulty
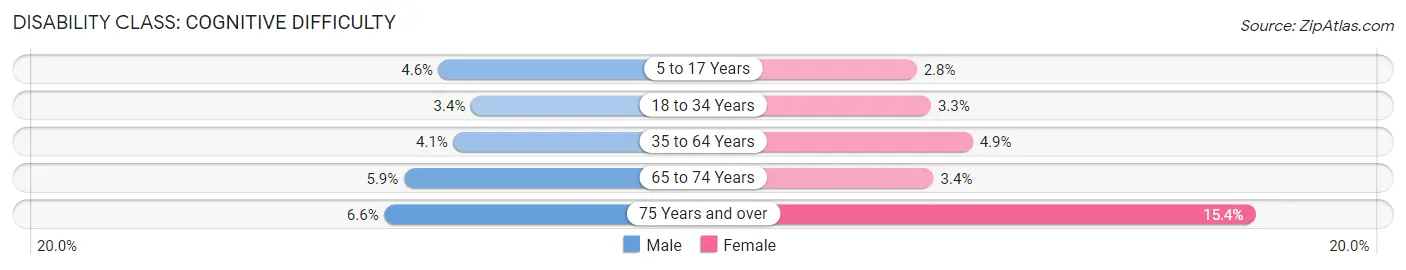
| Age Bracket | Male | Female |
| 5 to 17 Years | 663 (4.6%) | 381 (2.8%) |
| 18 to 34 Years | 651 (3.4%) | 683 (3.3%) |
| 35 to 64 Years | 1,273 (4.1%) | 1,633 (4.9%) |
| 65 to 74 Years | 447 (5.9%) | 310 (3.4%) |
| 75 Years and over | 309 (6.6%) | 1,102 (15.3%) |
Disability Class: Ambulatory Difficulty
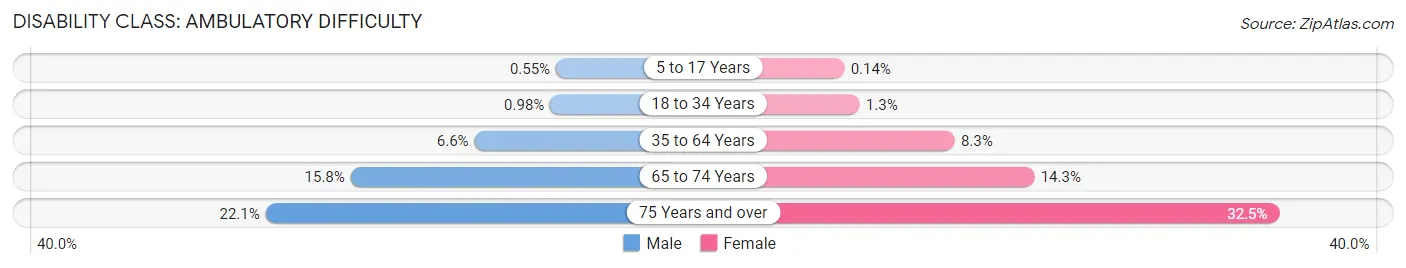
| Age Bracket | Male | Female |
| 5 to 17 Years | 79 (0.5%) | 19 (0.1%) |
| 18 to 34 Years | 187 (1.0%) | 261 (1.3%) |
| 35 to 64 Years | 2,064 (6.6%) | 2,797 (8.3%) |
| 65 to 74 Years | 1,195 (15.8%) | 1,294 (14.2%) |
| 75 Years and over | 1,029 (22.1%) | 2,332 (32.5%) |
Disability Class: Self-Care Difficulty
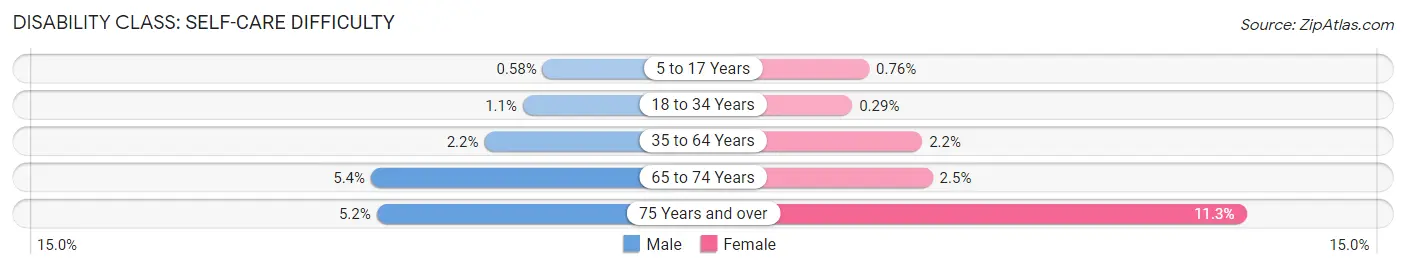
| Age Bracket | Male | Female |
| 5 to 17 Years | 83 (0.6%) | 104 (0.8%) |
| 18 to 34 Years | 215 (1.1%) | 59 (0.3%) |
| 35 to 64 Years | 688 (2.2%) | 752 (2.2%) |
| 65 to 74 Years | 405 (5.4%) | 230 (2.5%) |
| 75 Years and over | 242 (5.2%) | 808 (11.3%) |
Technology Access in Alamance County
Computing Device Access in Alamance County
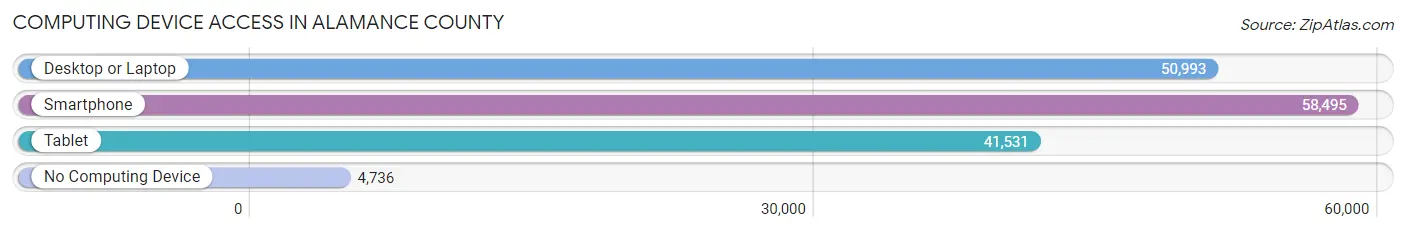
| Device Type | # Households | % Households |
| Desktop or Laptop | 50,993 | 75.7% |
| Smartphone | 58,495 | 86.8% |
| Tablet | 41,531 | 61.7% |
| No Computing Device | 4,736 | 7.0% |
| Total | 67,370 | 100.0% |
Internet Access in Alamance County

| Internet Type | # Households | % Households |
| Dial-Up Internet | 49 | 0.1% |
| Broadband Home | 49,458 | 73.4% |
| Cellular Data Only | 6,542 | 9.7% |
| Satellite Internet | 3,940 | 5.9% |
| No Internet | 9,354 | 13.9% |
| Total | 67,370 | 100.0% |
Alamance County Summary
Alamance County is located in the Piedmont region of North Carolina, and is part of the Burlington Metropolitan Statistical Area. The county was formed in 1849 from Orange County and named after Great Alamance Creek, which runs through the county. The county seat is Graham, and the largest city is Burlington. As of the 2010 census, the population was 151,131, making it the 37th most populous county in North Carolina.
Geography
Alamance County is located in the Piedmont region of North Carolina, and is part of the Burlington Metropolitan Statistical Area. The county is bordered by Orange County to the north, Chatham County to the east, Randolph County to the south, and Guilford County to the west. The county covers an area of 517 square miles, with a population density of 294 people per square mile. The terrain is mostly rolling hills, with the Haw River running through the center of the county.
Climate
Alamance County has a humid subtropical climate, with hot, humid summers and mild winters. The average annual temperature is 61°F, with an average high of 79°F in July and an average low of 43°F in January. The average annual precipitation is 44 inches, with the wettest month being July, with an average of 5.5 inches of rain.
Demographics
As of the 2010 census, the population of Alamance County was 151,131, with a population density of 294 people per square mile. The racial makeup of the county was 79.2% White, 14.3% African American, 0.5% Native American, 2.2% Asian, 0.1% Pacific Islander, 2.2% from other races, and 1.5% from two or more races. Hispanic or Latino of any race were 5.3% of the population.
The median income for a household in the county was $45,945, and the median income for a family was $54,817. The per capita income for the county was $22,945. About 11.2% of families and 14.7% of the population were below the poverty line, including 19.2% of those under age 18 and 10.2% of those age 65 or over.
Economy
Alamance County has a diverse economy, with a mix of manufacturing, agriculture, and service industries. The largest employers in the county are LabCorp, Burlington Industries, and Alamance Regional Medical Center. The county is also home to several universities and colleges, including Elon University, Alamance Community College, and the University of North Carolina at Greensboro.
Agriculture is an important part of the county's economy, with the top crops being corn, soybeans, wheat, and hay. The county is also home to several wineries, including the Alamance County Winery and the Haw River Wine Trail.
History
Alamance County was formed in 1849 from Orange County and named after Great Alamance Creek, which runs through the county. The county seat is Graham, and the largest city is Burlington. The county was home to several Native American tribes, including the Catawba, Cherokee, and Tuscarora.
The county was the site of the Battle of Alamance in 1771, which was the first battle of the American Revolution. The county was also the site of the Alamance Cotton Mill Strike of 1882, which was the first major labor strike in the South.
In the early 20th century, Alamance County was a major center of textile production, with several large mills located in the county. The county was also home to several prominent figures in the civil rights movement, including Dr. Martin Luther King Jr., who visited the county in 1957.
Today, Alamance County is a vibrant and diverse community, with a mix of manufacturing, agriculture, and service industries. The county is home to several universities and colleges, and is a popular destination for outdoor recreation, with several state parks and trails located in the county.
Common Questions
What is the Total Population of Alamance County?
Total Population of Alamance County is 171,779.
What is the Total Male Population of Alamance County?
Total Male Population of Alamance County is 82,328.
What is the Total Female Population of Alamance County?
Total Female Population of Alamance County is 89,451.
What is the Ratio of Males per 100 Females in Alamance County?
There are 92.04 Males per 100 Females in Alamance County.
What is the Ratio of Females per 100 Males in Alamance County?
There are 108.65 Females per 100 Males in Alamance County.
What is the Median Population Age in Alamance County?
Median Population Age in Alamance County is 39.1 Years.
What is the Average Family Size in Alamance County
Average Family Size in Alamance County is 3.1 People.
What is the Average Household Size in Alamance County
Average Household Size in Alamance County is 2.5 People.
What is Per Capita Income in Alamance County?
Per Capita income in Alamance County is $32,105.
What is the Median Family Income in Alamance County?
Median Family Income in Alamance County is $78,033.
What is the Median Household income in Alamance County?
Median Household Income in Alamance County is $60,866.
What is Income or Wage Gap in Alamance County?
Income or Wage Gap in Alamance County is 20.8%.
Women in Alamance County earn 79.2 cents for every dollar earned by a man.
What is Family Income Deficit in Alamance County?
Family Income Deficit in Alamance County is $9,270.
Families that are below poverty line in Alamance County earn $9,270 less on average than the poverty threshold level.
What is Inequality or Gini Index in Alamance County?
Inequality or Gini Index in Alamance County is 0.44.
How Large is the Labor Force in Alamance County?
There are 86,795 People in the Labor Forcein in Alamance County.
What is the Percentage of People in the Labor Force in Alamance County?
62.8% of People are in the Labor Force in Alamance County.
What is the Unemployment Rate in Alamance County?
Unemployment Rate in Alamance County is 5.0%.