Broad Creek, NC
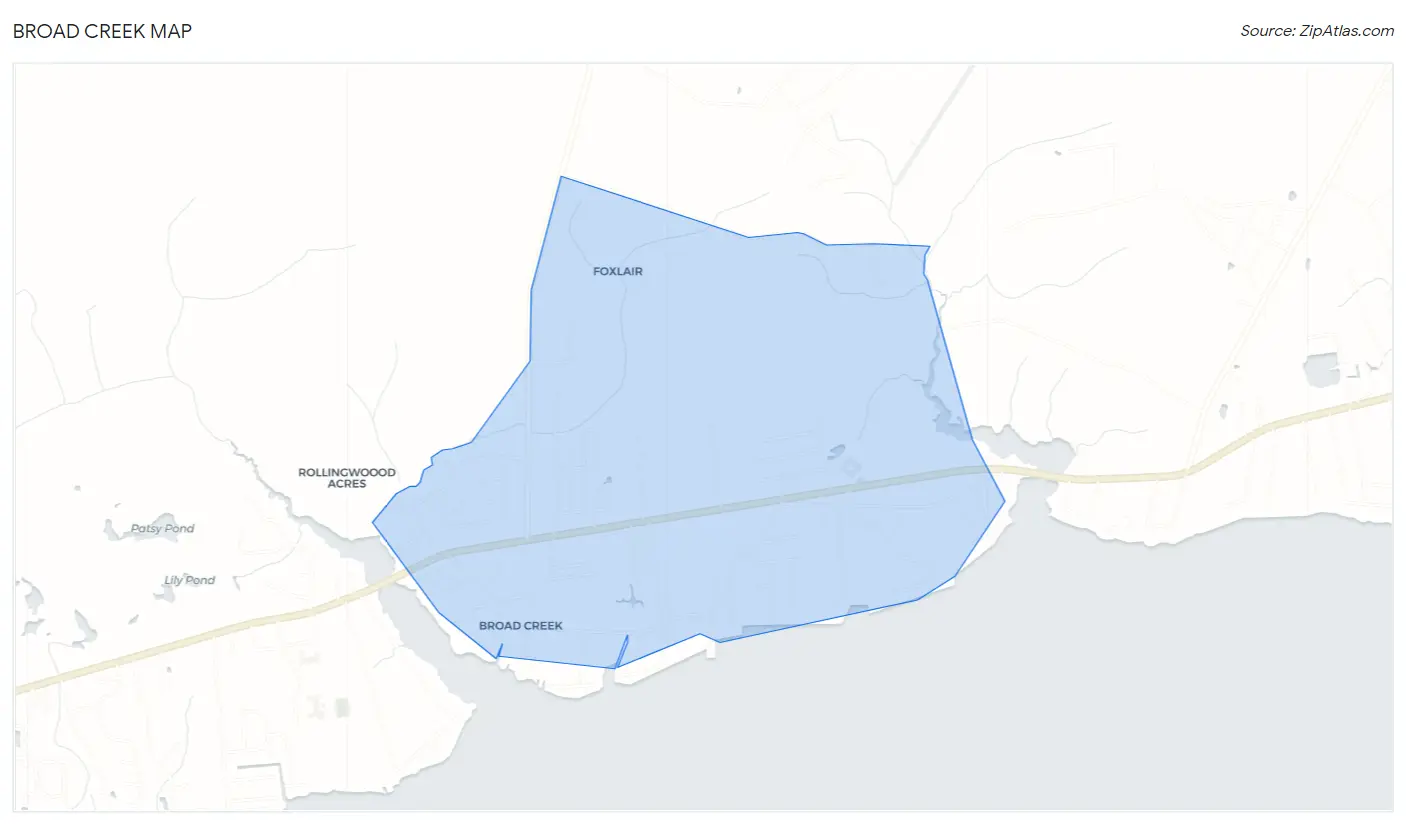
Broad Creek Map
Broad Creek Overview
2,013
TOTAL POPULATION
963
MALE POPULATION
1,050
FEMALE POPULATION
91.71
MALES / 100 FEMALES
109.03
FEMALES / 100 MALES
50.2
MEDIAN AGE
2.9
AVG FAMILY SIZE
2.5
AVG HOUSEHOLD SIZE
$30,177
PER CAPITA INCOME
$72,153
AVG FAMILY INCOME
$59,500
AVG HOUSEHOLD INCOME
19.0%
WAGE / INCOME GAP [ % ]
81.0¢/ $1
WAGE / INCOME GAP [ $ ]
0.41
INEQUALITY / GINI INDEX
895
LABOR FORCE [ PEOPLE ]
53.4%
PERCENT IN LABOR FORCE
3.9%
UNEMPLOYMENT RATE
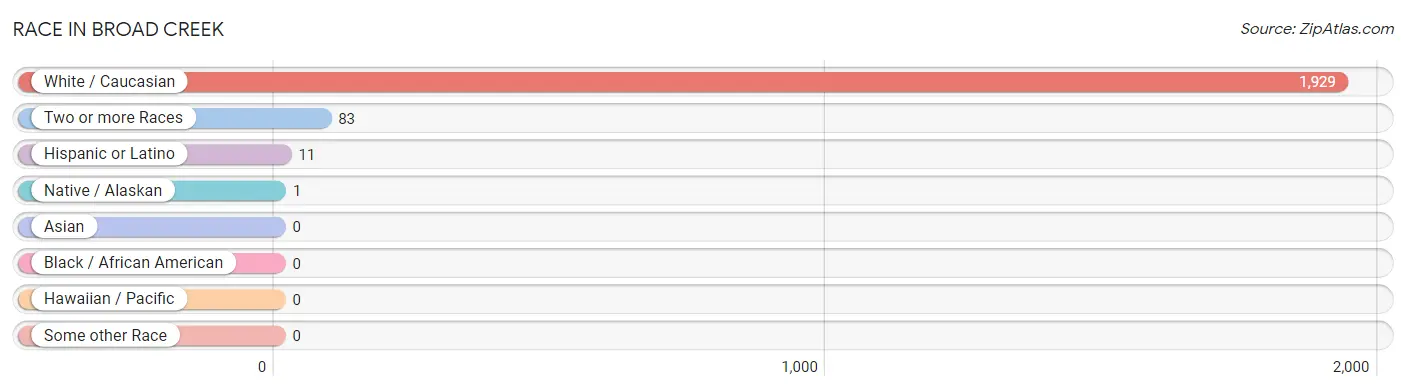
Race in Broad Creek
The most populous races in Broad Creek are White / Caucasian (1,929 | 95.8%), Two or more Races (83 | 4.1%), and Hispanic or Latino (11 | 0.5%).
| Race | # Population | % Population |
| Asian | 0 | 0.0% |
| Black / African American | 0 | 0.0% |
| Hawaiian / Pacific | 0 | 0.0% |
| Hispanic or Latino | 11 | 0.5% |
| Native / Alaskan | 1 | 0.1% |
| White / Caucasian | 1,929 | 95.8% |
| Two or more Races | 83 | 4.1% |
| Some other Race | 0 | 0.0% |
| Total | 2,013 | 100.0% |
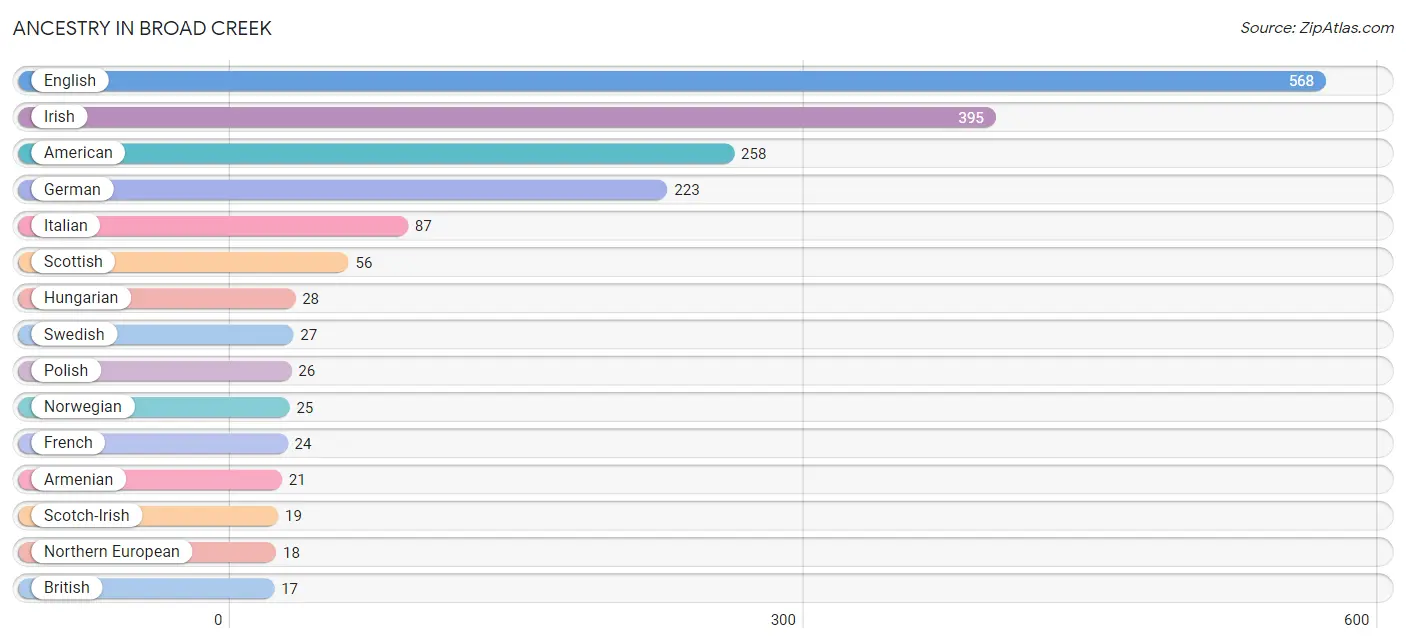
Ancestry in Broad Creek
The most populous ancestries reported in Broad Creek are English (568 | 28.2%), Irish (395 | 19.6%), American (258 | 12.8%), German (223 | 11.1%), and Italian (87 | 4.3%), together accounting for 76.1% of all Broad Creek residents.
| Ancestry | # Population | % Population |
| American | 258 | 12.8% |
| Armenian | 21 | 1.0% |
| Austrian | 12 | 0.6% |
| Blackfeet | 8 | 0.4% |
| British | 17 | 0.8% |
| Cajun | 6 | 0.3% |
| Canadian | 11 | 0.5% |
| Celtic | 17 | 0.8% |
| Central American | 8 | 0.4% |
| Cherokee | 3 | 0.2% |
| Dutch | 11 | 0.5% |
| English | 568 | 28.2% |
| French | 24 | 1.2% |
| French Canadian | 9 | 0.4% |
| German | 223 | 11.1% |
| Guamanian / Chamorro | 4 | 0.2% |
| Guatemalan | 8 | 0.4% |
| Hungarian | 28 | 1.4% |
| Irish | 395 | 19.6% |
| Italian | 87 | 4.3% |
| Lumbee | 2 | 0.1% |
| Mexican | 3 | 0.2% |
| Northern European | 18 | 0.9% |
| Norwegian | 25 | 1.2% |
| Pennsylvania German | 5 | 0.3% |
| Polish | 26 | 1.3% |
| Scandinavian | 12 | 0.6% |
| Scotch-Irish | 19 | 0.9% |
| Scottish | 56 | 2.8% |
| Swedish | 27 | 1.3% | View All 30 Rows |
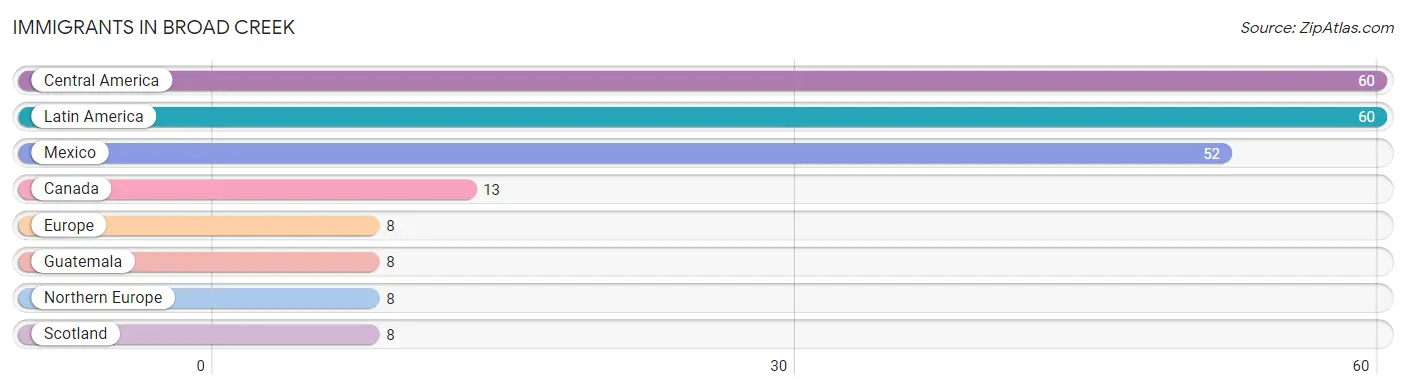
Immigrants in Broad Creek
The most numerous immigrant groups reported in Broad Creek came from Central America (60 | 3.0%), Latin America (60 | 3.0%), Mexico (52 | 2.6%), Canada (13 | 0.6%), and Europe (8 | 0.4%), together accounting for 9.6% of all Broad Creek residents.
| Immigration Origin | # Population | % Population |
| Canada | 13 | 0.6% |
| Central America | 60 | 3.0% |
| Europe | 8 | 0.4% |
| Guatemala | 8 | 0.4% |
| Latin America | 60 | 3.0% |
| Mexico | 52 | 2.6% |
| Northern Europe | 8 | 0.4% |
| Scotland | 8 | 0.4% | View All 8 Rows |
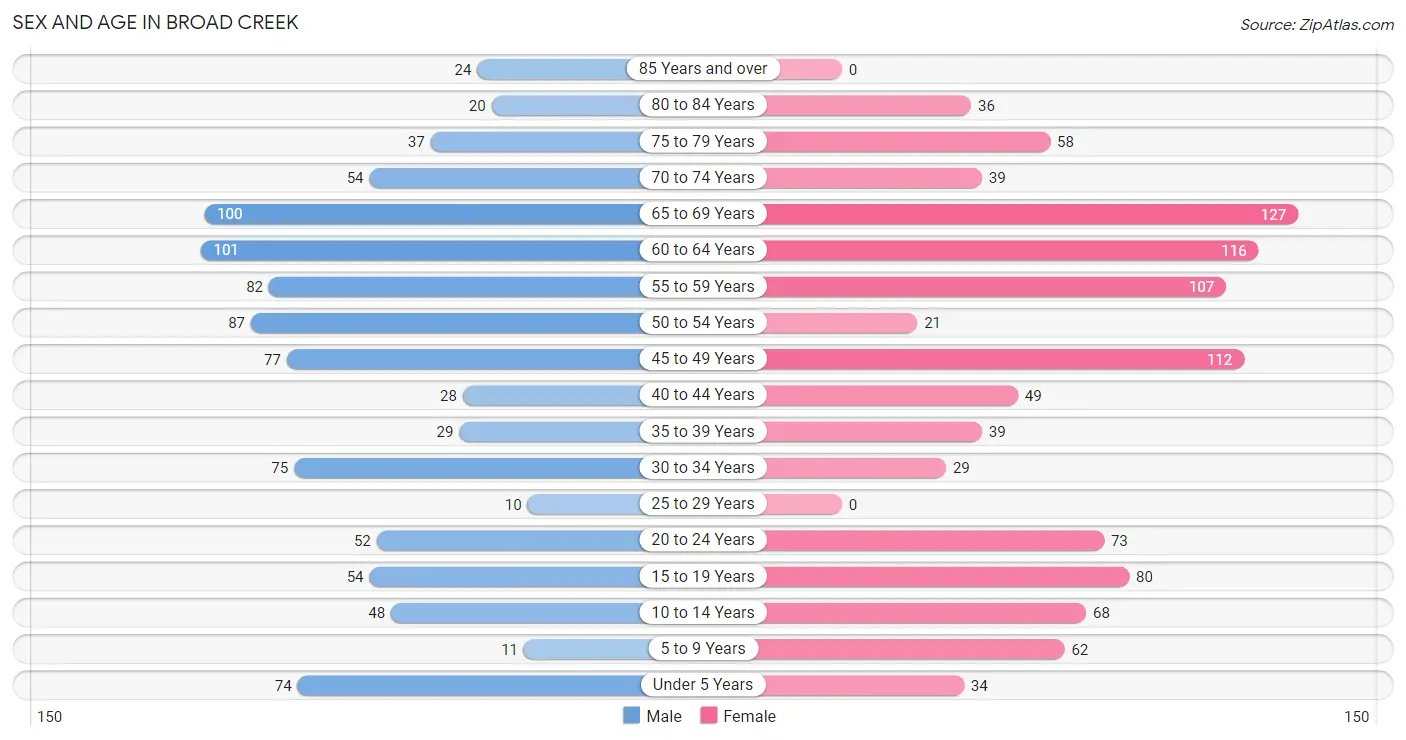
Sex and Age in Broad Creek
Sex and Age in Broad Creek
The most populous age groups in Broad Creek are 60 to 64 Years (101 | 10.5%) for men and 65 to 69 Years (127 | 12.1%) for women.
| Age Bracket | Male | Female |
| Under 5 Years | 74 (7.7%) | 34 (3.2%) |
| 5 to 9 Years | 11 (1.1%) | 62 (5.9%) |
| 10 to 14 Years | 48 (5.0%) | 68 (6.5%) |
| 15 to 19 Years | 54 (5.6%) | 80 (7.6%) |
| 20 to 24 Years | 52 (5.4%) | 73 (7.0%) |
| 25 to 29 Years | 10 (1.0%) | 0 (0.0%) |
| 30 to 34 Years | 75 (7.8%) | 29 (2.8%) |
| 35 to 39 Years | 29 (3.0%) | 39 (3.7%) |
| 40 to 44 Years | 28 (2.9%) | 49 (4.7%) |
| 45 to 49 Years | 77 (8.0%) | 112 (10.7%) |
| 50 to 54 Years | 87 (9.0%) | 21 (2.0%) |
| 55 to 59 Years | 82 (8.5%) | 107 (10.2%) |
| 60 to 64 Years | 101 (10.5%) | 116 (11.1%) |
| 65 to 69 Years | 100 (10.4%) | 127 (12.1%) |
| 70 to 74 Years | 54 (5.6%) | 39 (3.7%) |
| 75 to 79 Years | 37 (3.8%) | 58 (5.5%) |
| 80 to 84 Years | 20 (2.1%) | 36 (3.4%) |
| 85 Years and over | 24 (2.5%) | 0 (0.0%) |
| Total | 963 (100.0%) | 1,050 (100.0%) |
Families and Households in Broad Creek
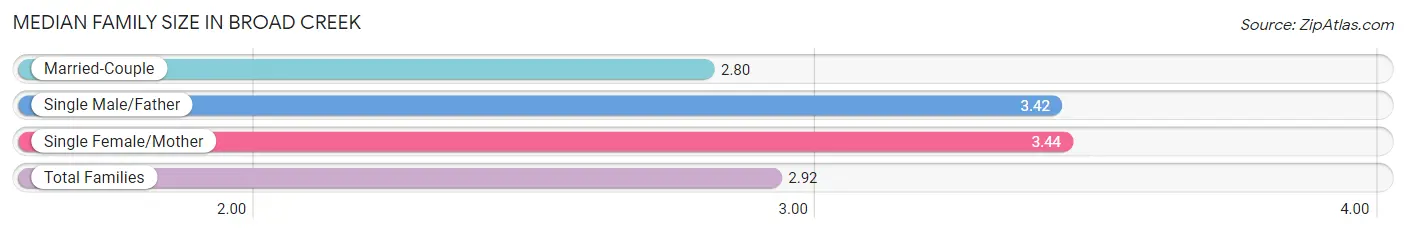
Median Family Size in Broad Creek
The median family size in Broad Creek is 2.92 persons per family, with single female/mother families (78 | 13.2%) accounting for the largest median family size of 3.44 persons per family. On the other hand, married-couple families (482 | 81.6%) represent the smallest median family size with 2.80 persons per family.
| Family Type | # Families | Family Size |
| Married-Couple | 482 (81.6%) | 2.80 |
| Single Male/Father | 31 (5.2%) | 3.42 |
| Single Female/Mother | 78 (13.2%) | 3.44 |
| Total Families | 591 (100.0%) | 2.92 |
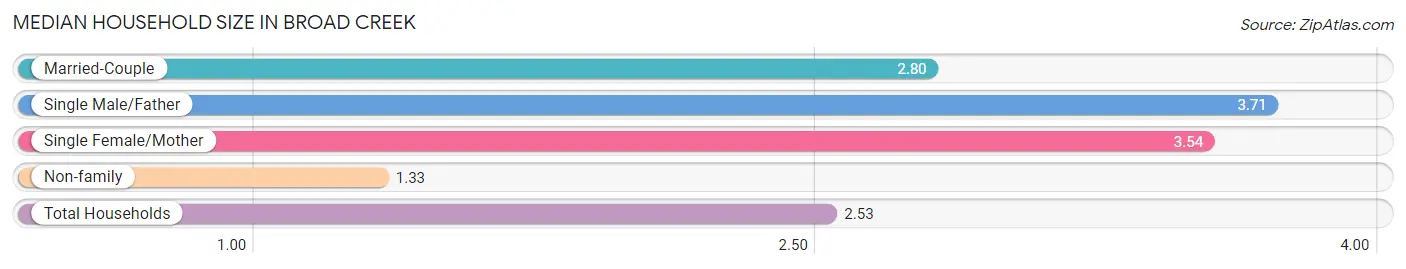
Median Household Size in Broad Creek
The median household size in Broad Creek is 2.53 persons per household, with single male/father households (31 | 3.9%) accounting for the largest median household size of 3.71 persons per household. non-family households (205 | 25.8%) represent the smallest median household size with 1.33 persons per household.
| Household Type | # Households | Household Size |
| Married-Couple | 482 (60.6%) | 2.80 |
| Single Male/Father | 31 (3.9%) | 3.71 |
| Single Female/Mother | 78 (9.8%) | 3.54 |
| Non-family | 205 (25.8%) | 1.33 |
| Total Households | 796 (100.0%) | 2.53 |
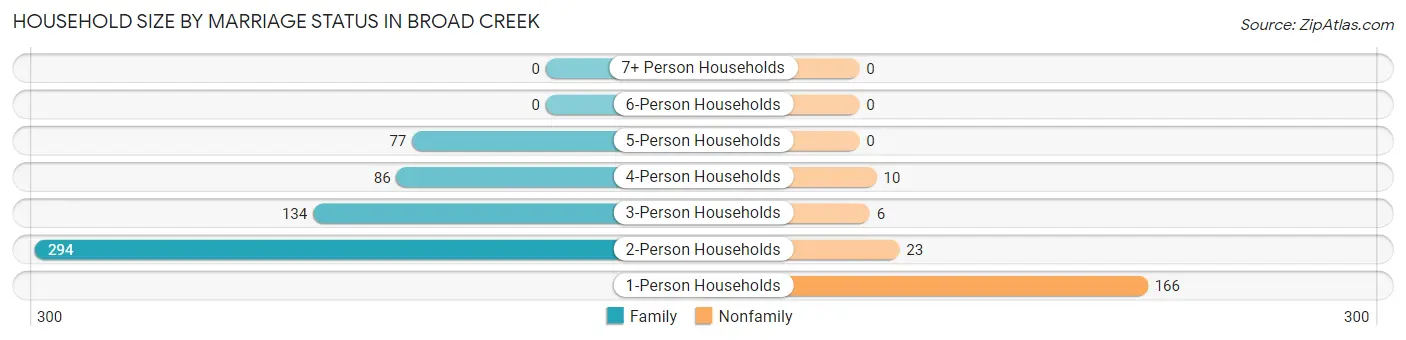
Household Size by Marriage Status in Broad Creek
Out of a total of 796 households in Broad Creek, 591 (74.3%) are family households, while 205 (25.8%) are nonfamily households. The most numerous type of family households are 2-person households, comprising 294, and the most common type of nonfamily households are 1-person households, comprising 166.
| Household Size | Family Households | Nonfamily Households |
| 1-Person Households | - | 166 (20.8%) |
| 2-Person Households | 294 (36.9%) | 23 (2.9%) |
| 3-Person Households | 134 (16.8%) | 6 (0.7%) |
| 4-Person Households | 86 (10.8%) | 10 (1.3%) |
| 5-Person Households | 77 (9.7%) | 0 (0.0%) |
| 6-Person Households | 0 (0.0%) | 0 (0.0%) |
| 7+ Person Households | 0 (0.0%) | 0 (0.0%) |
| Total | 591 (74.3%) | 205 (25.8%) |
Female Fertility in Broad Creek
Fertility by Age in Broad Creek
Average fertility rate in Broad Creek is 10.0 births per 1,000 women. Women in the age bracket of 35 to 50 years have the highest fertility rate with 19.0 births per 1,000 women. Women in the age bracket of 35 to 50 years acount for 100.0% of all women with births.
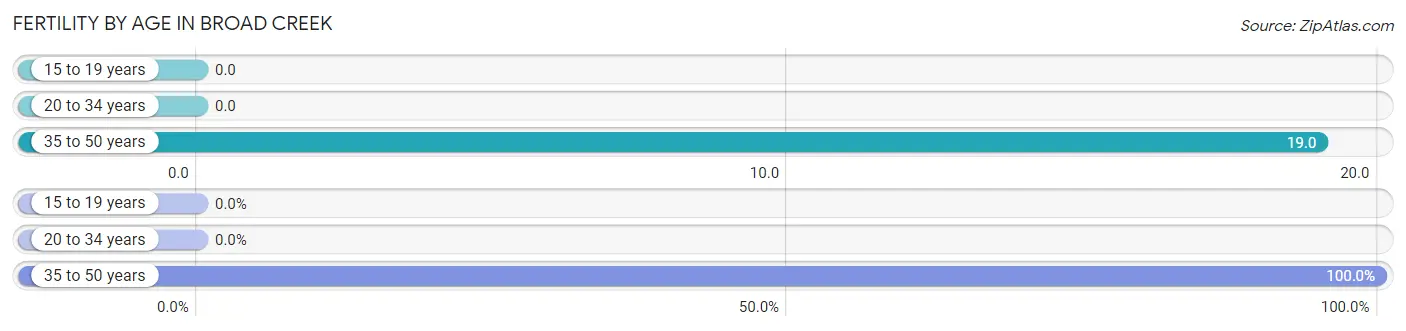
| Age Bracket | Women with Births | Births / 1,000 Women |
| 15 to 19 years | 0 (0.0%) | 0.0 |
| 20 to 34 years | 0 (0.0%) | 0.0 |
| 35 to 50 years | 4 (100.0%) | 19.0 |
| Total | 4 (100.0%) | 10.0 |
Fertility by Age by Marriage Status in Broad Creek
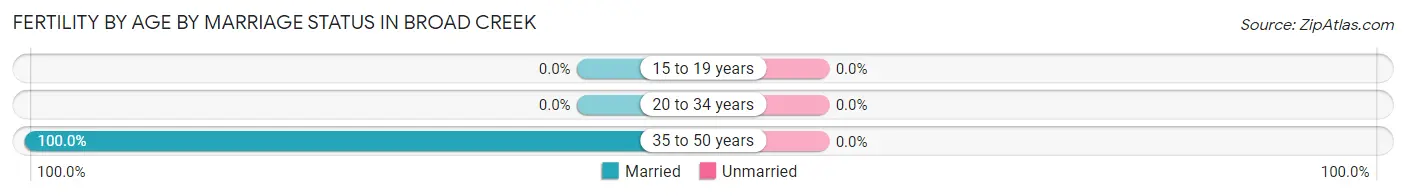
| Age Bracket | Married | Unmarried |
| 15 to 19 years | 0 (0.0%) | 0 (0.0%) |
| 20 to 34 years | 0 (0.0%) | 0 (0.0%) |
| 35 to 50 years | 4 (100.0%) | 0 (0.0%) |
| Total | 4 (100.0%) | 0 (0.0%) |
Fertility by Education in Broad Creek
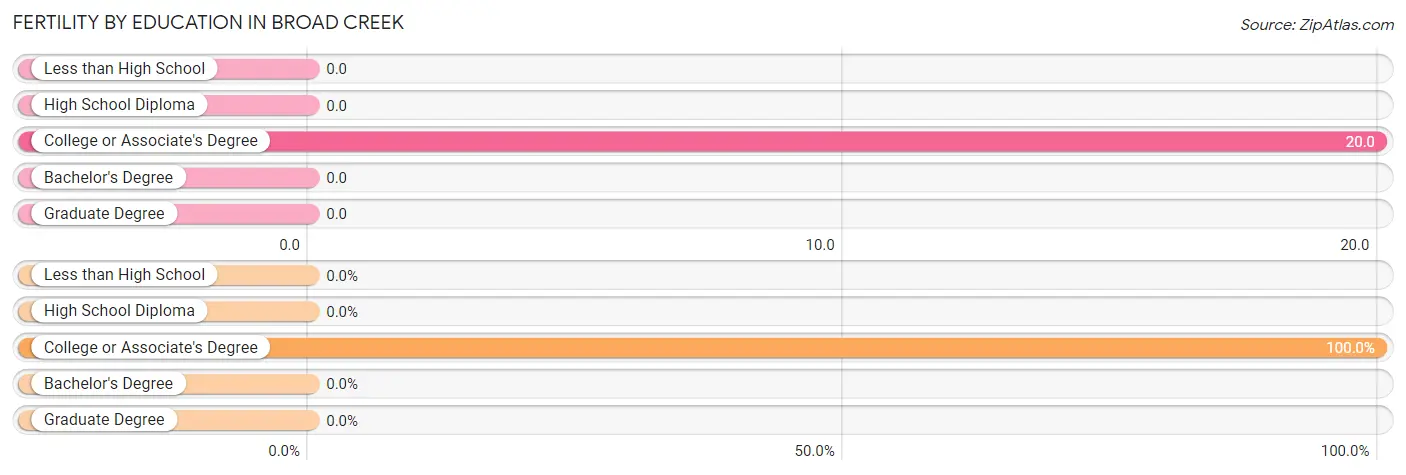
| Educational Attainment | Women with Births | Births / 1,000 Women |
| Less than High School | 0 (0.0%) | 0.0 |
| High School Diploma | 0 (0.0%) | 0.0 |
| College or Associate's Degree | 4 (100.0%) | 20.0 |
| Bachelor's Degree | 0 (0.0%) | 0.0 |
| Graduate Degree | 0 (0.0%) | 0.0 |
| Total | 4 (100.0%) | 10.0 |
Fertility by Education by Marriage Status in Broad Creek
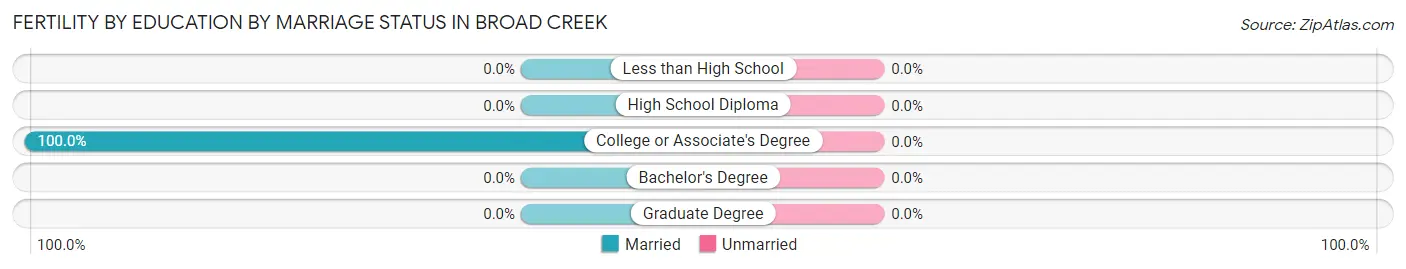
| Educational Attainment | Married | Unmarried |
| Less than High School | 0 (0.0%) | 0 (0.0%) |
| High School Diploma | 0 (0.0%) | 0 (0.0%) |
| College or Associate's Degree | 4 (100.0%) | 0 (0.0%) |
| Bachelor's Degree | 0 (0.0%) | 0 (0.0%) |
| Graduate Degree | 0 (0.0%) | 0 (0.0%) |
| Total | 4 (100.0%) | 0 (0.0%) |
Income in Broad Creek
Income Overview in Broad Creek
Per Capita Income in Broad Creek is $30,177, while median incomes of families and households are $72,153 and $59,500 respectively.
| Characteristic | Number | Measure |
| Per Capita Income | 2,013 | $30,177 |
| Median Family Income | 591 | $72,153 |
| Mean Family Income | 591 | $88,839 |
| Median Household Income | 796 | $59,500 |
| Mean Household Income | 796 | $76,913 |
| Income Deficit | 591 | $0 |
| Wage / Income Gap (%) | 2,013 | 19.02% |
| Wage / Income Gap ($) | 2,013 | 80.98¢ per $1 |
| Gini / Inequality Index | 2,013 | 0.41 |
Earnings by Sex in Broad Creek
Average Earnings in Broad Creek are $32,109, $34,513 for men and $27,950 for women, a difference of 19.0%.
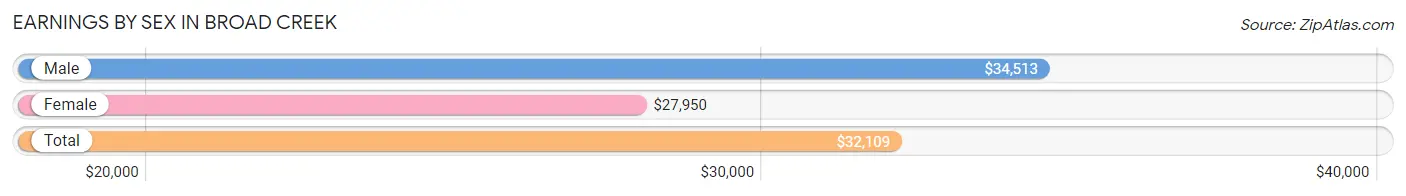
| Sex | Number | Average Earnings |
| Male | 523 (54.2%) | $34,513 |
| Female | 441 (45.8%) | $27,950 |
| Total | 964 (100.0%) | $32,109 |
Earnings by Sex by Income Bracket in Broad Creek
The most common earnings brackets in Broad Creek are $55,000 to $64,999 for men (94 | 18.0%) and $22,500 to $24,999 for women (53 | 12.0%).
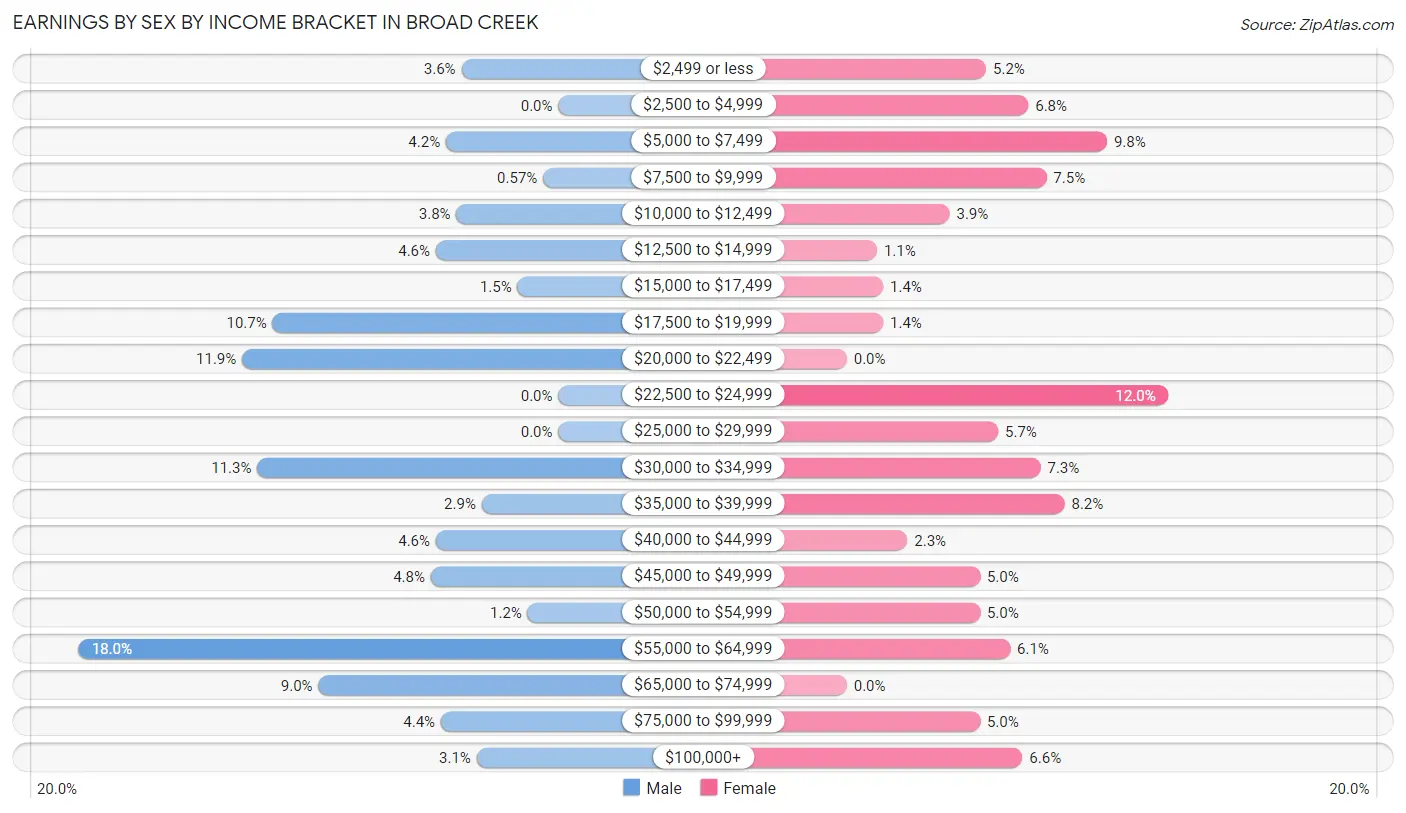
| Income | Male | Female |
| $2,499 or less | 19 (3.6%) | 23 (5.2%) |
| $2,500 to $4,999 | 0 (0.0%) | 30 (6.8%) |
| $5,000 to $7,499 | 22 (4.2%) | 43 (9.8%) |
| $7,500 to $9,999 | 3 (0.6%) | 33 (7.5%) |
| $10,000 to $12,499 | 20 (3.8%) | 17 (3.8%) |
| $12,500 to $14,999 | 24 (4.6%) | 5 (1.1%) |
| $15,000 to $17,499 | 8 (1.5%) | 6 (1.4%) |
| $17,500 to $19,999 | 56 (10.7%) | 6 (1.4%) |
| $20,000 to $22,499 | 62 (11.8%) | 0 (0.0%) |
| $22,500 to $24,999 | 0 (0.0%) | 53 (12.0%) |
| $25,000 to $29,999 | 0 (0.0%) | 25 (5.7%) |
| $30,000 to $34,999 | 59 (11.3%) | 32 (7.3%) |
| $35,000 to $39,999 | 15 (2.9%) | 36 (8.2%) |
| $40,000 to $44,999 | 24 (4.6%) | 10 (2.3%) |
| $45,000 to $49,999 | 25 (4.8%) | 22 (5.0%) |
| $50,000 to $54,999 | 6 (1.1%) | 22 (5.0%) |
| $55,000 to $64,999 | 94 (18.0%) | 27 (6.1%) |
| $65,000 to $74,999 | 47 (9.0%) | 0 (0.0%) |
| $75,000 to $99,999 | 23 (4.4%) | 22 (5.0%) |
| $100,000+ | 16 (3.1%) | 29 (6.6%) |
| Total | 523 (100.0%) | 441 (100.0%) |
Earnings by Sex by Educational Attainment in Broad Creek
Average earnings in Broad Creek are $42,697 for men and $30,508 for women, a difference of 28.5%. Men with an educational attainment of college or associate's degree enjoy the highest average annual earnings of $56,165, while those with less than high school education earn the least with $32,542. Women with an educational attainment of graduate degree earn the most with the average annual earnings of $51,667, while those with high school diploma education have the smallest earnings of $16,250.
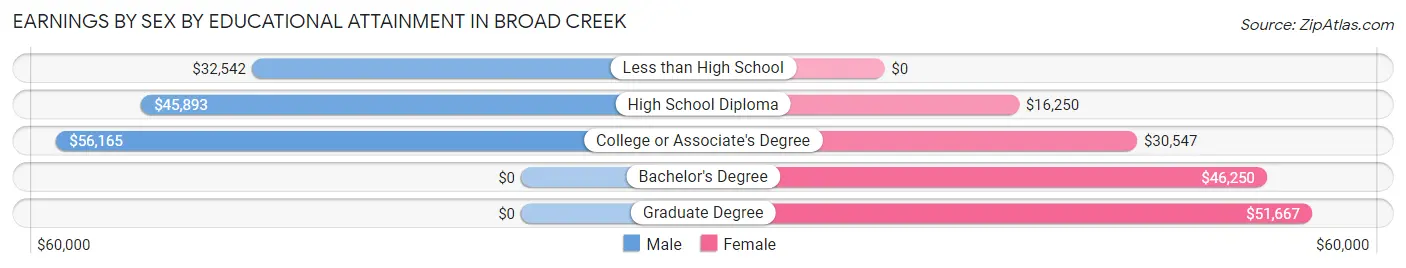
| Educational Attainment | Male Income | Female Income |
| Less than High School | $32,542 | $0 |
| High School Diploma | $45,893 | $16,250 |
| College or Associate's Degree | $56,165 | $30,547 |
| Bachelor's Degree | - | - |
| Graduate Degree | - | - |
| Total | $42,697 | $30,508 |
Family Income in Broad Creek
Family Income Brackets in Broad Creek
According to the Broad Creek family income data, there are 143 families falling into the $50,000 to $74,999 income range, which is the most common income bracket and makes up 24.2% of all families.
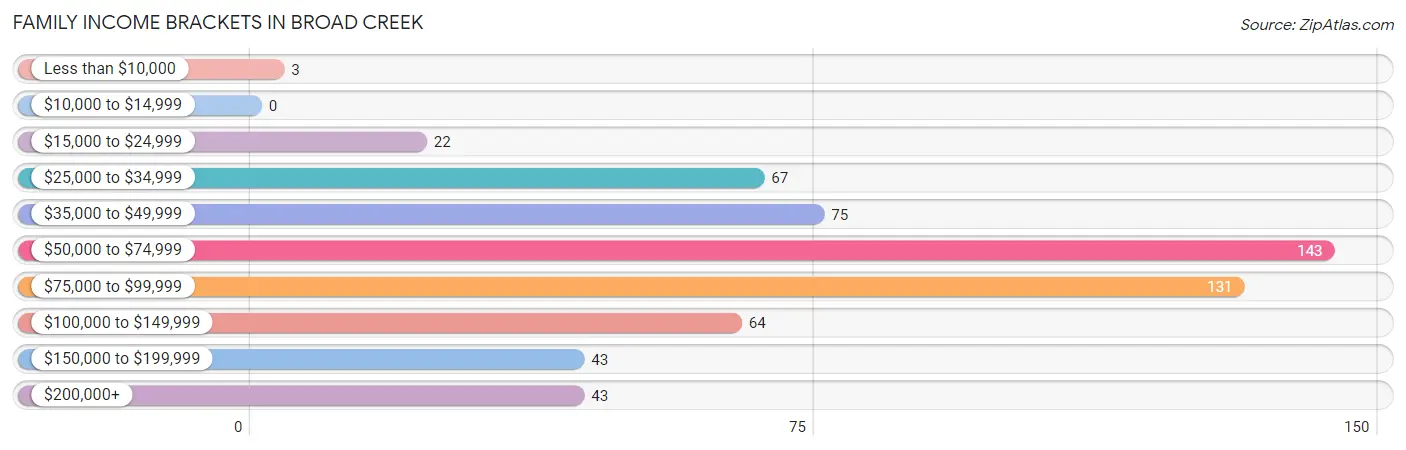
| Income Bracket | # Families | % Families |
| Less than $10,000 | 3 | 0.5% |
| $10,000 to $14,999 | 0 | 0.0% |
| $15,000 to $24,999 | 22 | 3.7% |
| $25,000 to $34,999 | 67 | 11.3% |
| $35,000 to $49,999 | 75 | 12.7% |
| $50,000 to $74,999 | 143 | 24.2% |
| $75,000 to $99,999 | 131 | 22.2% |
| $100,000 to $149,999 | 64 | 10.8% |
| $150,000 to $199,999 | 43 | 7.3% |
| $200,000+ | 43 | 7.3% |
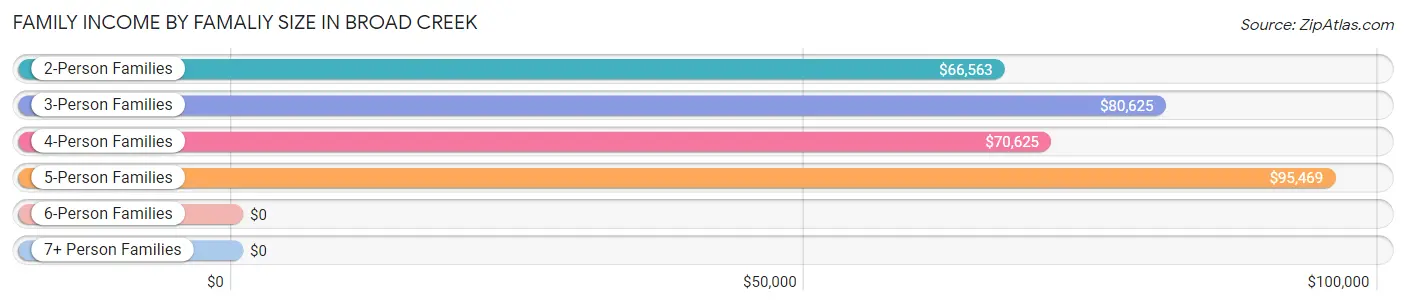
Family Income by Famaliy Size in Broad Creek
5-person families (67 | 11.3%) account for the highest median family income in Broad Creek with $95,469 per family, while 2-person families (301 | 50.9%) have the highest median income of $33,282 per family member.
| Income Bracket | # Families | Median Income |
| 2-Person Families | 301 (50.9%) | $66,563 |
| 3-Person Families | 127 (21.5%) | $80,625 |
| 4-Person Families | 96 (16.2%) | $70,625 |
| 5-Person Families | 67 (11.3%) | $95,469 |
| 6-Person Families | 0 (0.0%) | $0 |
| 7+ Person Families | 0 (0.0%) | $0 |
| Total | 591 (100.0%) | $72,153 |
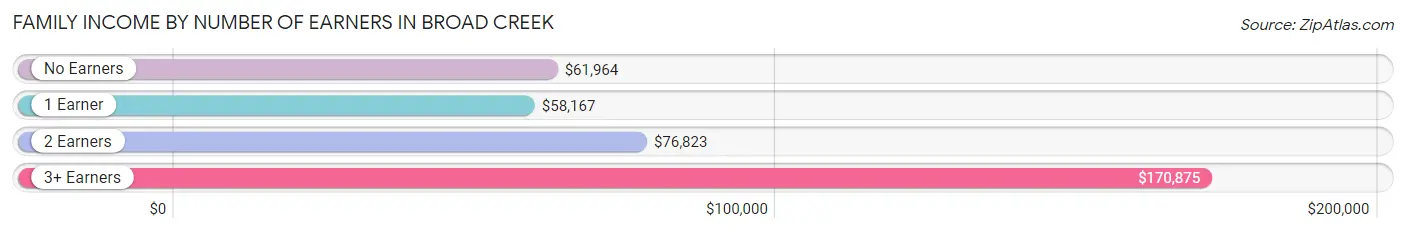
Family Income by Number of Earners in Broad Creek
The median family income in Broad Creek is $72,153, with families comprising 3+ earners (43) having the highest median family income of $170,875, while families with 1 earner (240) have the lowest median family income of $58,167, accounting for 7.3% and 40.6% of families, respectively.
| Number of Earners | # Families | Median Income |
| No Earners | 111 (18.8%) | $61,964 |
| 1 Earner | 240 (40.6%) | $58,167 |
| 2 Earners | 197 (33.3%) | $76,823 |
| 3+ Earners | 43 (7.3%) | $170,875 |
| Total | 591 (100.0%) | $72,153 |
Household Income in Broad Creek
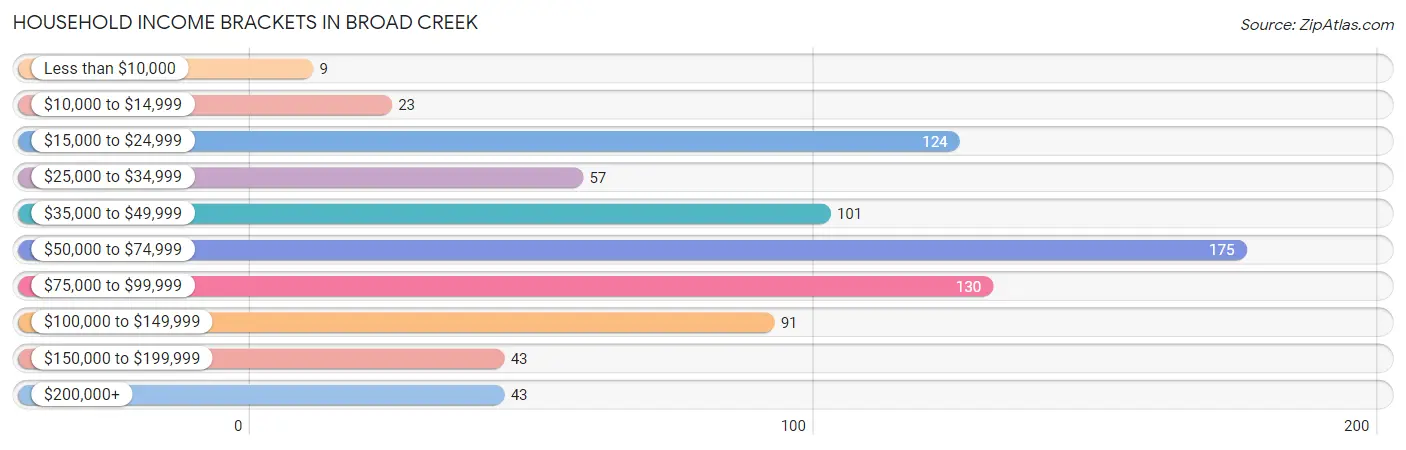
Household Income Brackets in Broad Creek
With 175 households falling in the category, the $50,000 to $74,999 income range is the most frequent in Broad Creek, accounting for 22.0% of all households. In contrast, only 9 households (1.1%) fall into the less than $10,000 income bracket, making it the least populous group.
| Income Bracket | # Households | % Households |
| Less than $10,000 | 9 | 1.1% |
| $10,000 to $14,999 | 23 | 2.9% |
| $15,000 to $24,999 | 124 | 15.6% |
| $25,000 to $34,999 | 57 | 7.2% |
| $35,000 to $49,999 | 101 | 12.7% |
| $50,000 to $74,999 | 175 | 22.0% |
| $75,000 to $99,999 | 130 | 16.3% |
| $100,000 to $149,999 | 91 | 11.4% |
| $150,000 to $199,999 | 43 | 5.4% |
| $200,000+ | 43 | 5.4% |
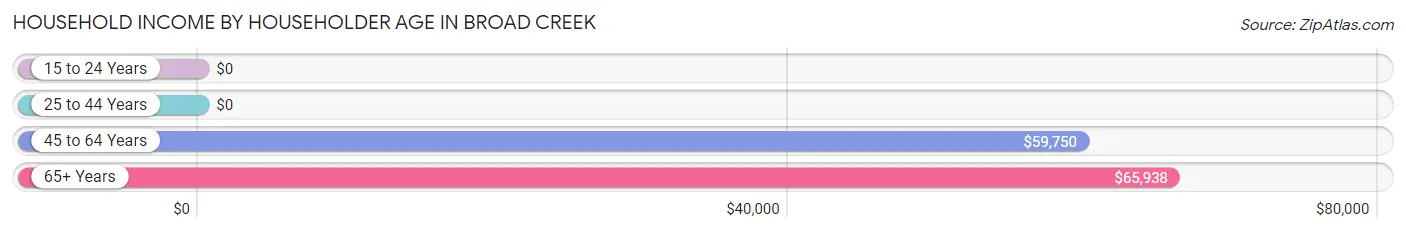
Household Income by Householder Age in Broad Creek
The median household income in Broad Creek is $59,500, with the highest median household income of $65,938 found in the 65+ years age bracket for the primary householder. A total of 331 households (41.6%) fall into this category. Meanwhile, the 15 to 24 years age bracket for the primary householder has the lowest median household income of $0, with 10 households (1.3%) in this group.
| Income Bracket | # Households | Median Income |
| 15 to 24 Years | 10 (1.3%) | $0 |
| 25 to 44 Years | 142 (17.8%) | $0 |
| 45 to 64 Years | 313 (39.3%) | $59,750 |
| 65+ Years | 331 (41.6%) | $65,938 |
| Total | 796 (100.0%) | $59,500 |
Poverty in Broad Creek
Income Below Poverty by Sex and Age in Broad Creek
With 7.9% poverty level for males and 13.5% for females among the residents of Broad Creek, 5 year old males and 25 to 34 year old females are the most vulnerable to poverty, with 3 males (100.0%) and 29 females (100.0%) in their respective age groups living below the poverty level.
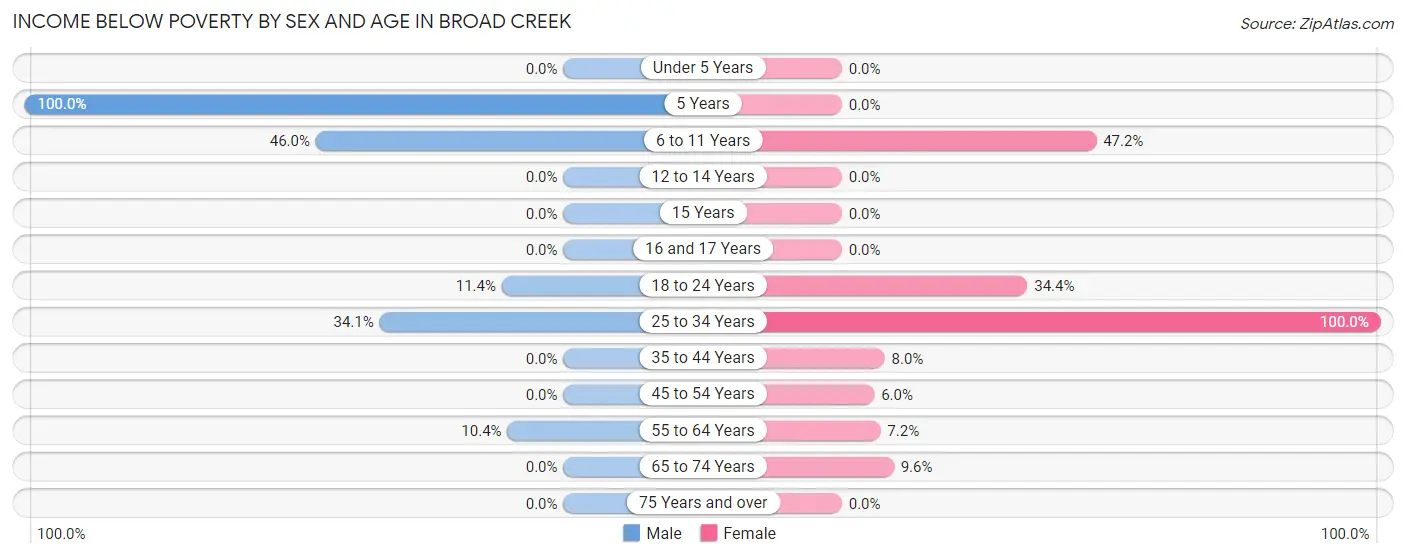
| Age Bracket | Male | Female |
| Under 5 Years | 0 (0.0%) | 0 (0.0%) |
| 5 Years | 3 (100.0%) | 0 (0.0%) |
| 6 to 11 Years | 17 (46.0%) | 34 (47.2%) |
| 12 to 14 Years | 0 (0.0%) | 0 (0.0%) |
| 15 Years | 0 (0.0%) | 0 (0.0%) |
| 16 and 17 Years | 0 (0.0%) | 0 (0.0%) |
| 18 to 24 Years | 8 (11.4%) | 31 (34.4%) |
| 25 to 34 Years | 29 (34.1%) | 29 (100.0%) |
| 35 to 44 Years | 0 (0.0%) | 7 (8.0%) |
| 45 to 54 Years | 0 (0.0%) | 8 (6.0%) |
| 55 to 64 Years | 19 (10.4%) | 16 (7.2%) |
| 65 to 74 Years | 0 (0.0%) | 16 (9.6%) |
| 75 Years and over | 0 (0.0%) | 0 (0.0%) |
| Total | 76 (7.9%) | 141 (13.5%) |
Income Above Poverty by Sex and Age in Broad Creek
According to the poverty statistics in Broad Creek, males aged under 5 years and females aged under 5 years are the age groups that are most secure financially, with 100.0% of males and 100.0% of females in these age groups living above the poverty line.
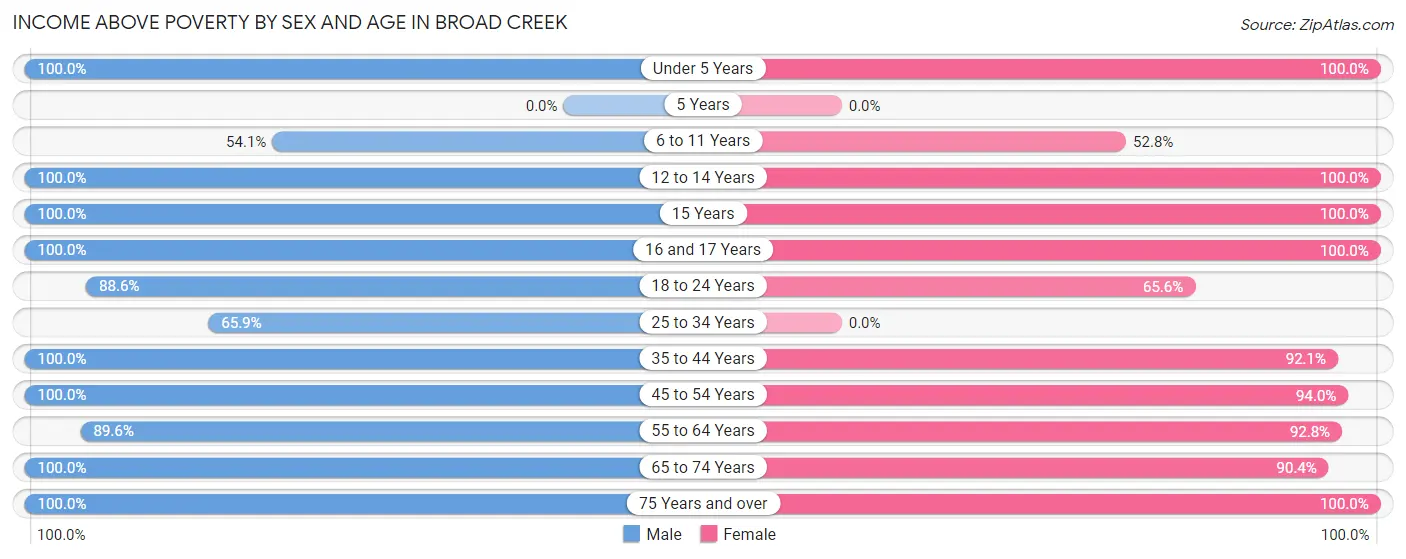
| Age Bracket | Male | Female |
| Under 5 Years | 74 (100.0%) | 34 (100.0%) |
| 5 Years | 0 (0.0%) | 0 (0.0%) |
| 6 to 11 Years | 20 (54.0%) | 38 (52.8%) |
| 12 to 14 Years | 19 (100.0%) | 50 (100.0%) |
| 15 Years | 20 (100.0%) | 20 (100.0%) |
| 16 and 17 Years | 16 (100.0%) | 43 (100.0%) |
| 18 to 24 Years | 62 (88.6%) | 59 (65.6%) |
| 25 to 34 Years | 56 (65.9%) | 0 (0.0%) |
| 35 to 44 Years | 57 (100.0%) | 81 (92.0%) |
| 45 to 54 Years | 164 (100.0%) | 125 (94.0%) |
| 55 to 64 Years | 164 (89.6%) | 207 (92.8%) |
| 65 to 74 Years | 154 (100.0%) | 150 (90.4%) |
| 75 Years and over | 81 (100.0%) | 94 (100.0%) |
| Total | 887 (92.1%) | 901 (86.5%) |
Income Below Poverty Among Married-Couple Families in Broad Creek
The poverty statistics for married-couple families in Broad Creek show that 8.3% or 40 of the total 482 families live below the poverty line. Families with 1 or 2 children have the highest poverty rate of 25.0%, comprising of 29 families. On the other hand, families with 3 or 4 children have the lowest poverty rate of 0.0%, which includes 0 families.
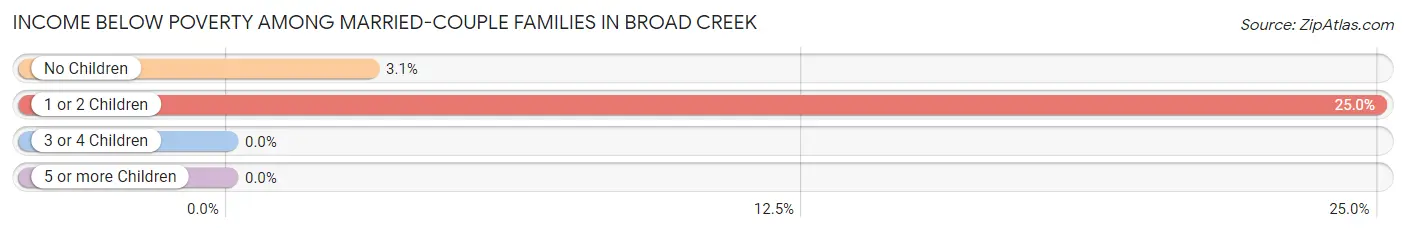
| Children | Above Poverty | Below Poverty |
| No Children | 347 (96.9%) | 11 (3.1%) |
| 1 or 2 Children | 87 (75.0%) | 29 (25.0%) |
| 3 or 4 Children | 8 (100.0%) | 0 (0.0%) |
| 5 or more Children | 0 (0.0%) | 0 (0.0%) |
| Total | 442 (91.7%) | 40 (8.3%) |
Income Below Poverty Among Single-Parent Households in Broad Creek
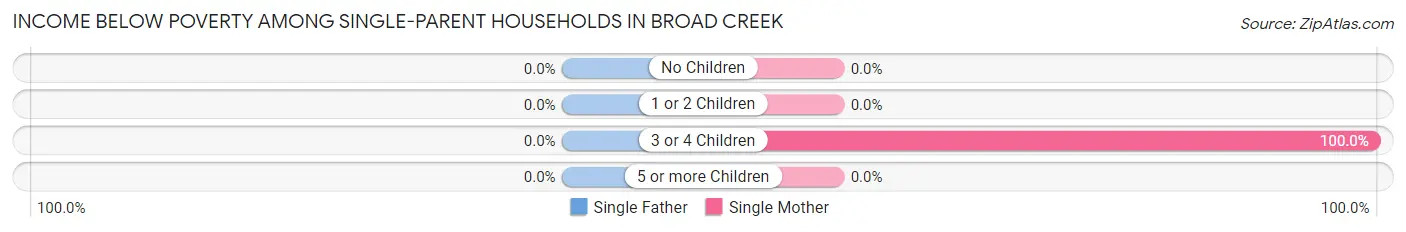
| Children | Single Father | Single Mother |
| No Children | 0 (0.0%) | 0 (0.0%) |
| 1 or 2 Children | 0 (0.0%) | 0 (0.0%) |
| 3 or 4 Children | 0 (0.0%) | 3 (100.0%) |
| 5 or more Children | 0 (0.0%) | 0 (0.0%) |
| Total | 0 (0.0%) | 3 (3.8%) |
Income Below Poverty Among Married-Couple vs Single-Parent Households in Broad Creek
The poverty data for Broad Creek shows that 40 of the married-couple family households (8.3%) and 3 of the single-parent households (2.8%) are living below the poverty level. Within the married-couple family households, those with 1 or 2 children have the highest poverty rate, with 29 households (25.0%) falling below the poverty line. Among the single-parent households, those with 3 or 4 children have the highest poverty rate, with 3 household (23.1%) living below poverty.
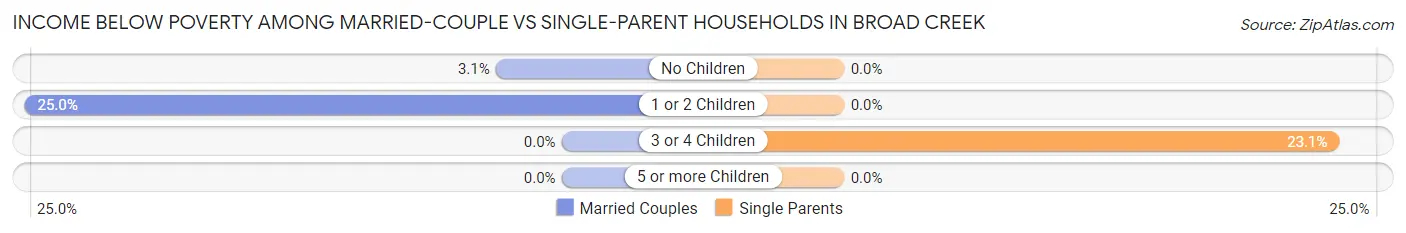
| Children | Married-Couple Families | Single-Parent Households |
| No Children | 11 (3.1%) | 0 (0.0%) |
| 1 or 2 Children | 29 (25.0%) | 0 (0.0%) |
| 3 or 4 Children | 0 (0.0%) | 3 (23.1%) |
| 5 or more Children | 0 (0.0%) | 0 (0.0%) |
| Total | 40 (8.3%) | 3 (2.8%) |
Employment Characteristics in Broad Creek
Employment by Class of Employer in Broad Creek
Among the 839 employed individuals in Broad Creek, private company employees (523 | 62.3%), self-employed (incorporated) (86 | 10.2%), and not-for-profit organizations (57 | 6.8%) make up the most common classes of employment.
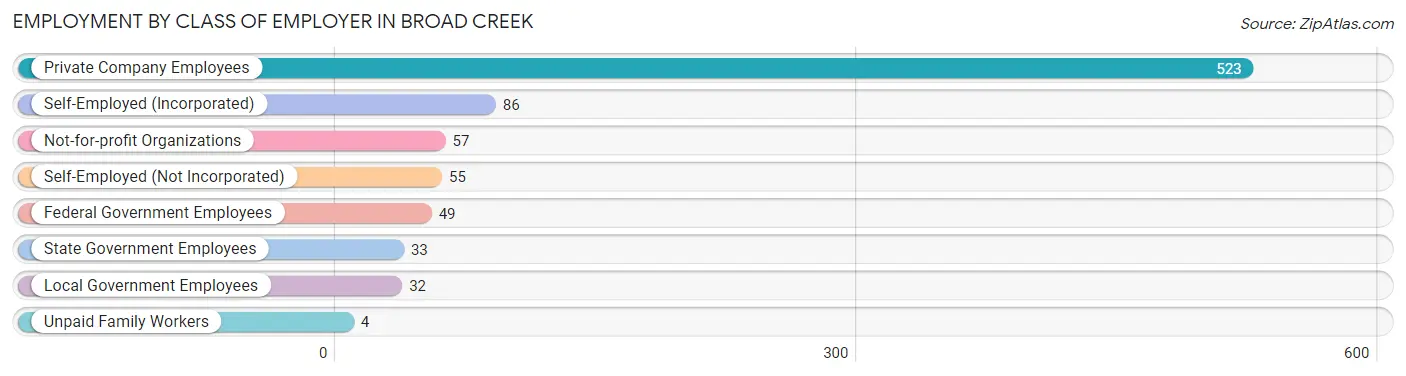
| Employer Class | # Employees | % Employees |
| Private Company Employees | 523 | 62.3% |
| Self-Employed (Incorporated) | 86 | 10.2% |
| Self-Employed (Not Incorporated) | 55 | 6.6% |
| Not-for-profit Organizations | 57 | 6.8% |
| Local Government Employees | 32 | 3.8% |
| State Government Employees | 33 | 3.9% |
| Federal Government Employees | 49 | 5.8% |
| Unpaid Family Workers | 4 | 0.5% |
| Total | 839 | 100.0% |
Employment Status by Age in Broad Creek
According to the labor force statistics for Broad Creek, out of the total population over 16 years of age (1,676), 53.4% or 895 individuals are in the labor force, with 3.9% or 35 of them unemployed. The age group with the highest labor force participation rate is 25 to 29 years, with 100.0% or 10 individuals in the labor force. Within the labor force, the 30 to 34 years age range has the highest percentage of unemployed individuals, with 24.7% or 23 of them being unemployed.
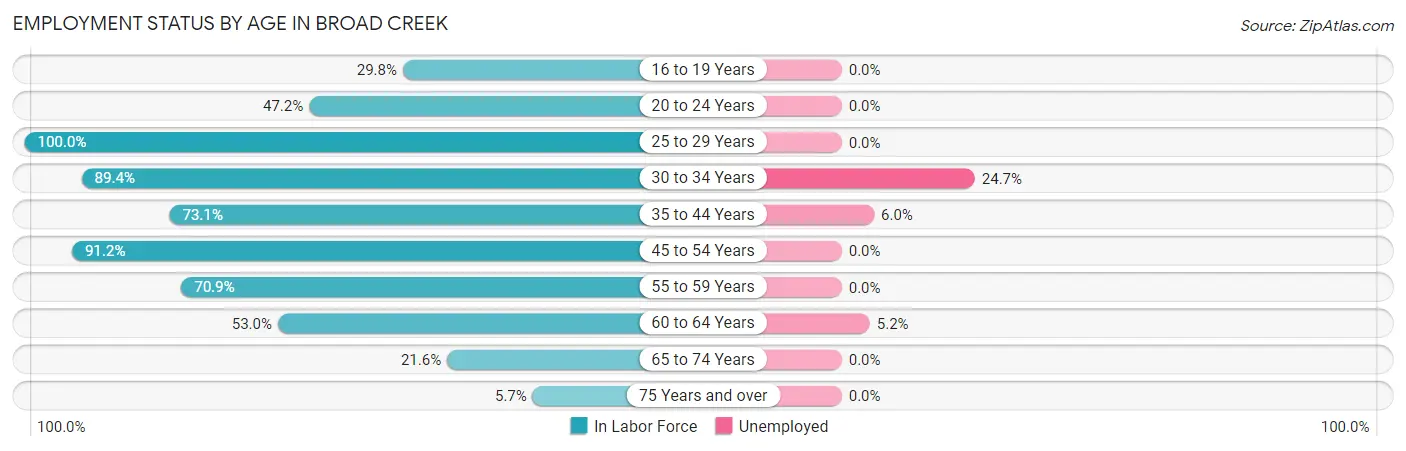
| Age Bracket | In Labor Force | Unemployed |
| 16 to 19 Years | 28 (29.8%) | 0 (0.0%) |
| 20 to 24 Years | 59 (47.2%) | 0 (0.0%) |
| 25 to 29 Years | 10 (100.0%) | 0 (0.0%) |
| 30 to 34 Years | 93 (89.4%) | 23 (24.7%) |
| 35 to 44 Years | 106 (73.1%) | 6 (6.0%) |
| 45 to 54 Years | 271 (91.2%) | 0 (0.0%) |
| 55 to 59 Years | 134 (70.9%) | 0 (0.0%) |
| 60 to 64 Years | 115 (53.0%) | 6 (5.2%) |
| 65 to 74 Years | 69 (21.6%) | 0 (0.0%) |
| 75 Years and over | 10 (5.7%) | 0 (0.0%) |
| Total | 895 (53.4%) | 35 (3.9%) |
Employment Status by Educational Attainment in Broad Creek
According to labor force statistics for Broad Creek, 75.8% of individuals (729) out of the total population between 25 and 64 years of age (962) are in the labor force, with 4.8% or 35 of them being unemployed. The group with the highest labor force participation rate are those with the educational attainment of less than high school, with 94.1% or 95 individuals in the labor force. Within the labor force, individuals with college / associate degree education have the highest percentage of unemployment, with 6.3% or 23 of them being unemployed.
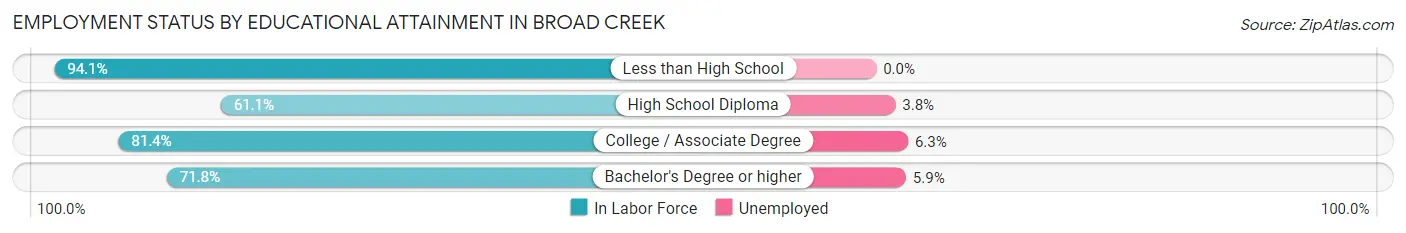
| Educational Attainment | In Labor Force | Unemployed |
| Less than High School | 95 (94.1%) | 0 (0.0%) |
| High School Diploma | 160 (61.1%) | 10 (3.8%) |
| College / Associate Degree | 372 (81.4%) | 29 (6.3%) |
| Bachelor's Degree or higher | 102 (71.8%) | 8 (5.9%) |
| Total | 729 (75.8%) | 46 (4.8%) |
Employment Occupations by Sex in Broad Creek
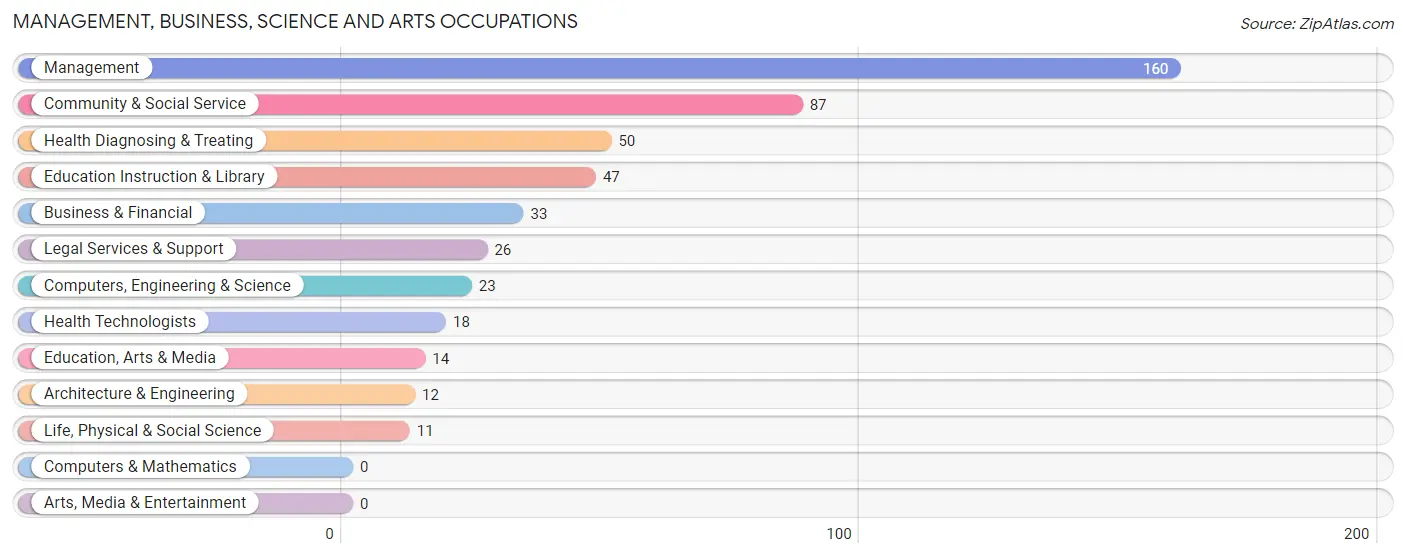
Management, Business, Science and Arts Occupations
The most common Management, Business, Science and Arts occupations in Broad Creek are Management (160 | 18.7%), Community & Social Service (87 | 10.2%), Health Diagnosing & Treating (50 | 5.9%), Education Instruction & Library (47 | 5.5%), and Business & Financial (33 | 3.9%).
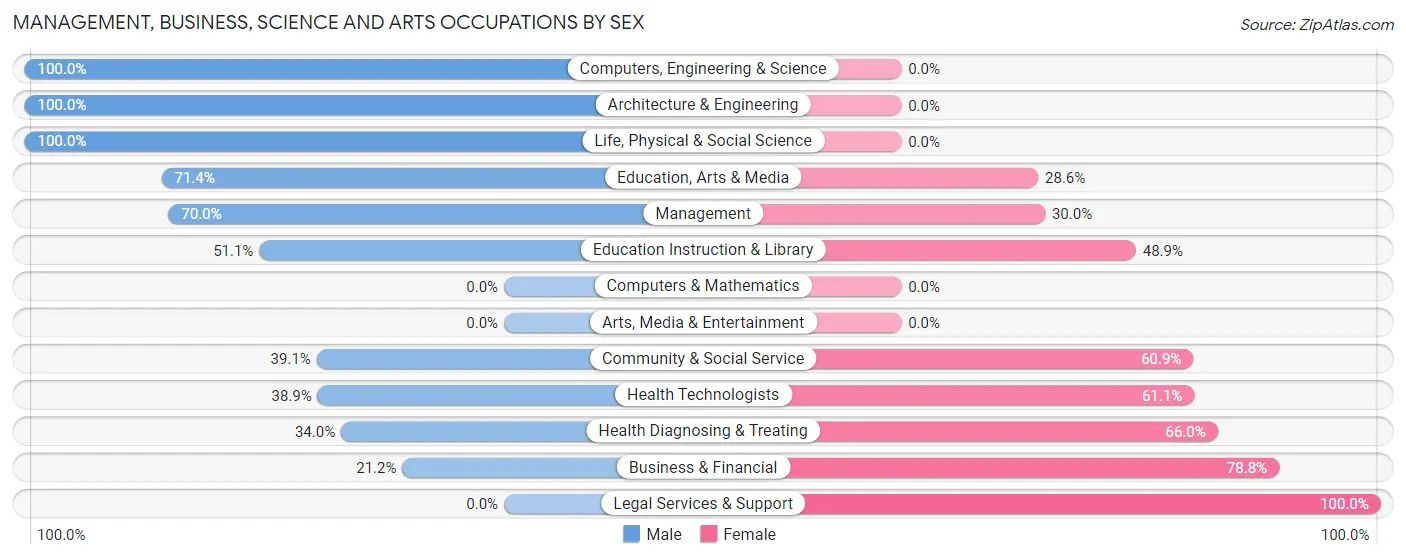
Management, Business, Science and Arts Occupations by Sex
Within the Management, Business, Science and Arts occupations in Broad Creek, the most male-oriented occupations are Computers, Engineering & Science (100.0%), Architecture & Engineering (100.0%), and Life, Physical & Social Science (100.0%), while the most female-oriented occupations are Legal Services & Support (100.0%), Business & Financial (78.8%), and Health Diagnosing & Treating (66.0%).
| Occupation | Male | Female |
| Management | 112 (70.0%) | 48 (30.0%) |
| Business & Financial | 7 (21.2%) | 26 (78.8%) |
| Computers, Engineering & Science | 23 (100.0%) | 0 (0.0%) |
| Computers & Mathematics | 0 (0.0%) | 0 (0.0%) |
| Architecture & Engineering | 12 (100.0%) | 0 (0.0%) |
| Life, Physical & Social Science | 11 (100.0%) | 0 (0.0%) |
| Community & Social Service | 34 (39.1%) | 53 (60.9%) |
| Education, Arts & Media | 10 (71.4%) | 4 (28.6%) |
| Legal Services & Support | 0 (0.0%) | 26 (100.0%) |
| Education Instruction & Library | 24 (51.1%) | 23 (48.9%) |
| Arts, Media & Entertainment | 0 (0.0%) | 0 (0.0%) |
| Health Diagnosing & Treating | 17 (34.0%) | 33 (66.0%) |
| Health Technologists | 7 (38.9%) | 11 (61.1%) |
| Total (Category) | 193 (54.7%) | 160 (45.3%) |
| Total (Overall) | 494 (57.9%) | 360 (42.1%) |
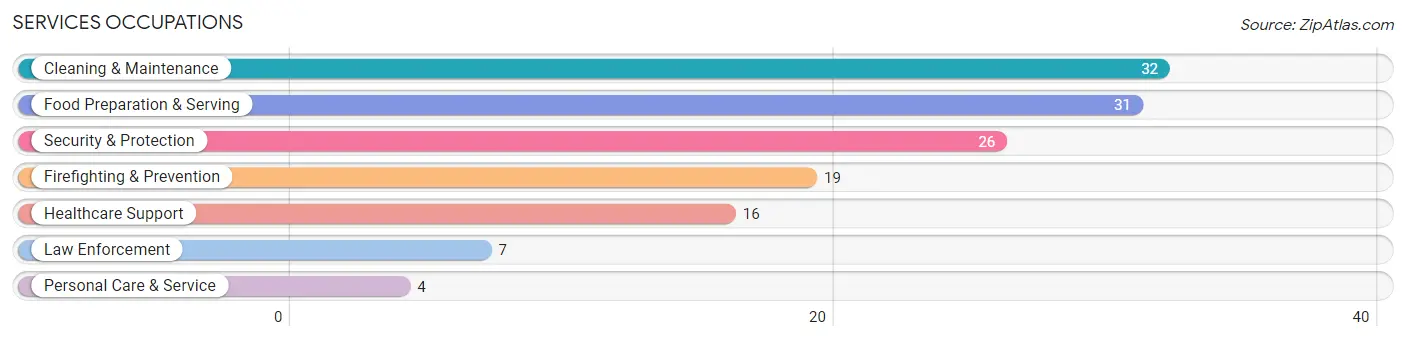
Services Occupations
The most common Services occupations in Broad Creek are Cleaning & Maintenance (32 | 3.7%), Food Preparation & Serving (31 | 3.6%), Security & Protection (26 | 3.0%), Firefighting & Prevention (19 | 2.2%), and Healthcare Support (16 | 1.9%).
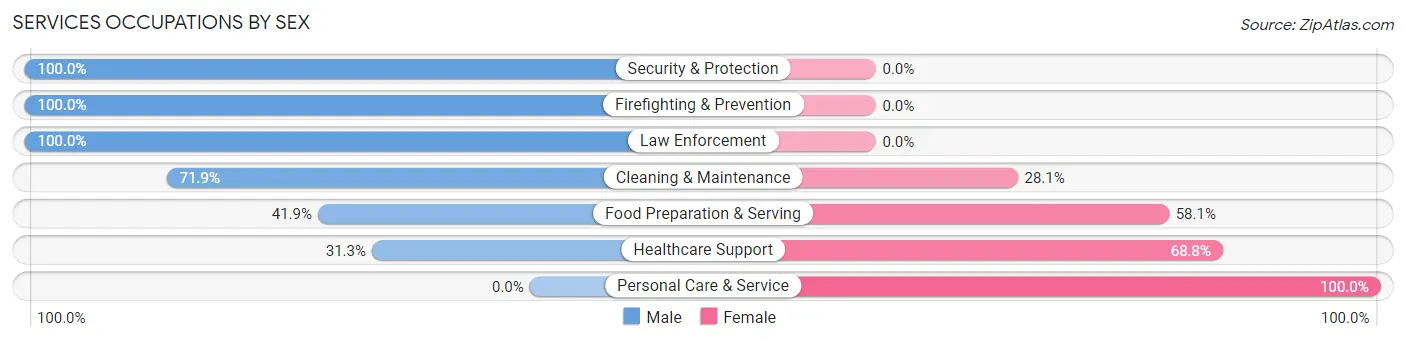
Services Occupations by Sex
Within the Services occupations in Broad Creek, the most male-oriented occupations are Security & Protection (100.0%), Firefighting & Prevention (100.0%), and Law Enforcement (100.0%), while the most female-oriented occupations are Personal Care & Service (100.0%), Healthcare Support (68.8%), and Food Preparation & Serving (58.1%).
| Occupation | Male | Female |
| Healthcare Support | 5 (31.2%) | 11 (68.8%) |
| Security & Protection | 26 (100.0%) | 0 (0.0%) |
| Firefighting & Prevention | 19 (100.0%) | 0 (0.0%) |
| Law Enforcement | 7 (100.0%) | 0 (0.0%) |
| Food Preparation & Serving | 13 (41.9%) | 18 (58.1%) |
| Cleaning & Maintenance | 23 (71.9%) | 9 (28.1%) |
| Personal Care & Service | 0 (0.0%) | 4 (100.0%) |
| Total (Category) | 67 (61.5%) | 42 (38.5%) |
| Total (Overall) | 494 (57.9%) | 360 (42.1%) |
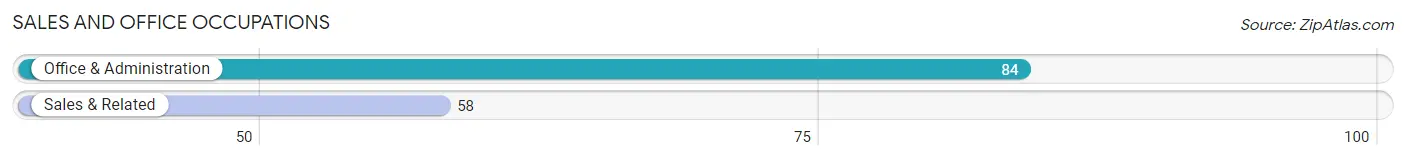
Sales and Office Occupations
The most common Sales and Office occupations in Broad Creek are Office & Administration (84 | 9.8%), and Sales & Related (58 | 6.8%).
Sales and Office Occupations by Sex
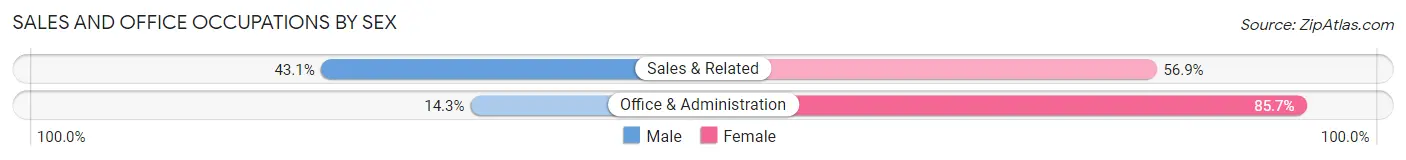
| Occupation | Male | Female |
| Sales & Related | 25 (43.1%) | 33 (56.9%) |
| Office & Administration | 12 (14.3%) | 72 (85.7%) |
| Total (Category) | 37 (26.1%) | 105 (73.9%) |
| Total (Overall) | 494 (57.9%) | 360 (42.1%) |
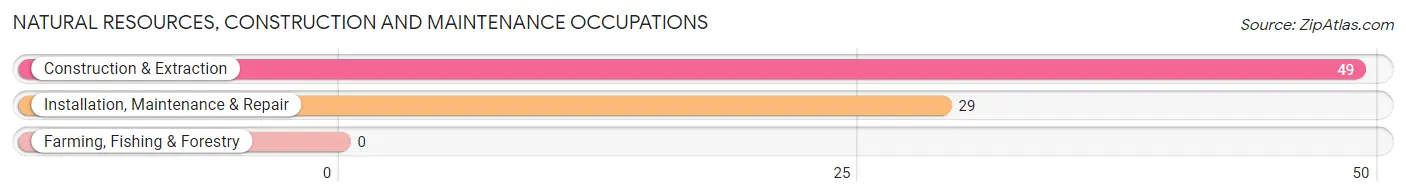
Natural Resources, Construction and Maintenance Occupations
The most common Natural Resources, Construction and Maintenance occupations in Broad Creek are Construction & Extraction (49 | 5.7%), and Installation, Maintenance & Repair (29 | 3.4%).
Natural Resources, Construction and Maintenance Occupations by Sex
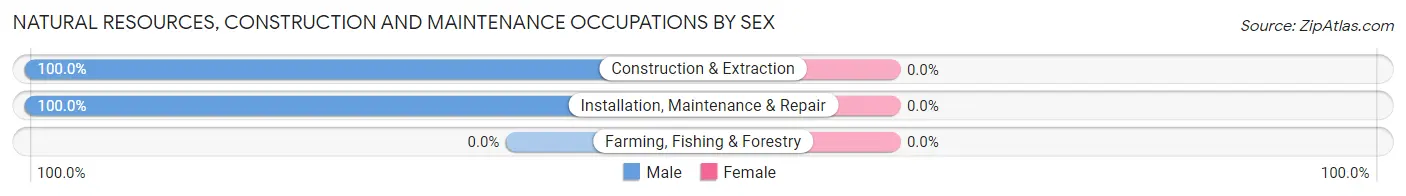
| Occupation | Male | Female |
| Farming, Fishing & Forestry | 0 (0.0%) | 0 (0.0%) |
| Construction & Extraction | 49 (100.0%) | 0 (0.0%) |
| Installation, Maintenance & Repair | 29 (100.0%) | 0 (0.0%) |
| Total (Category) | 78 (100.0%) | 0 (0.0%) |
| Total (Overall) | 494 (57.9%) | 360 (42.1%) |
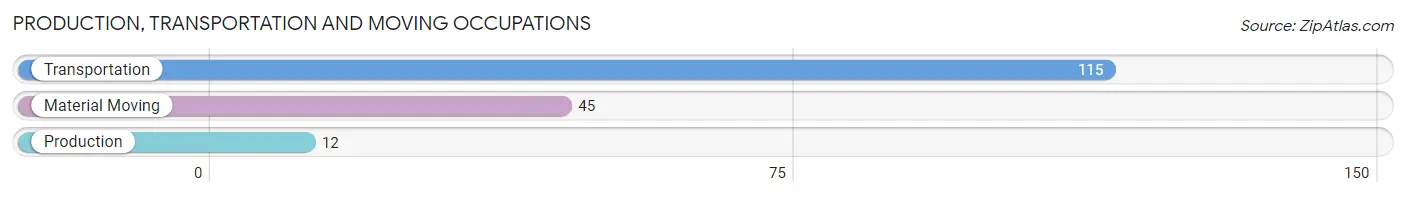
Production, Transportation and Moving Occupations
The most common Production, Transportation and Moving occupations in Broad Creek are Transportation (115 | 13.5%), Material Moving (45 | 5.3%), and Production (12 | 1.4%).
Production, Transportation and Moving Occupations by Sex
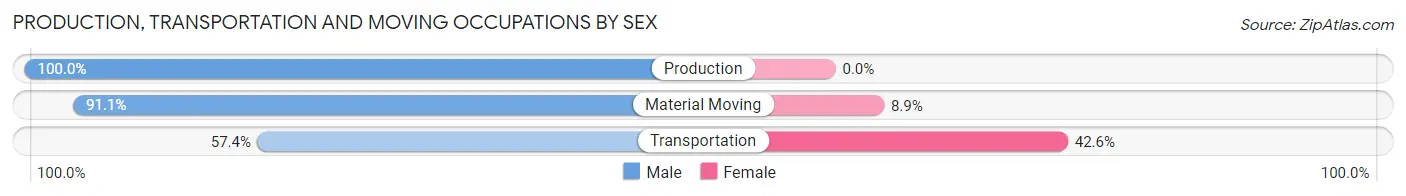
| Occupation | Male | Female |
| Production | 12 (100.0%) | 0 (0.0%) |
| Transportation | 66 (57.4%) | 49 (42.6%) |
| Material Moving | 41 (91.1%) | 4 (8.9%) |
| Total (Category) | 119 (69.2%) | 53 (30.8%) |
| Total (Overall) | 494 (57.9%) | 360 (42.1%) |
Employment Industries by Sex in Broad Creek
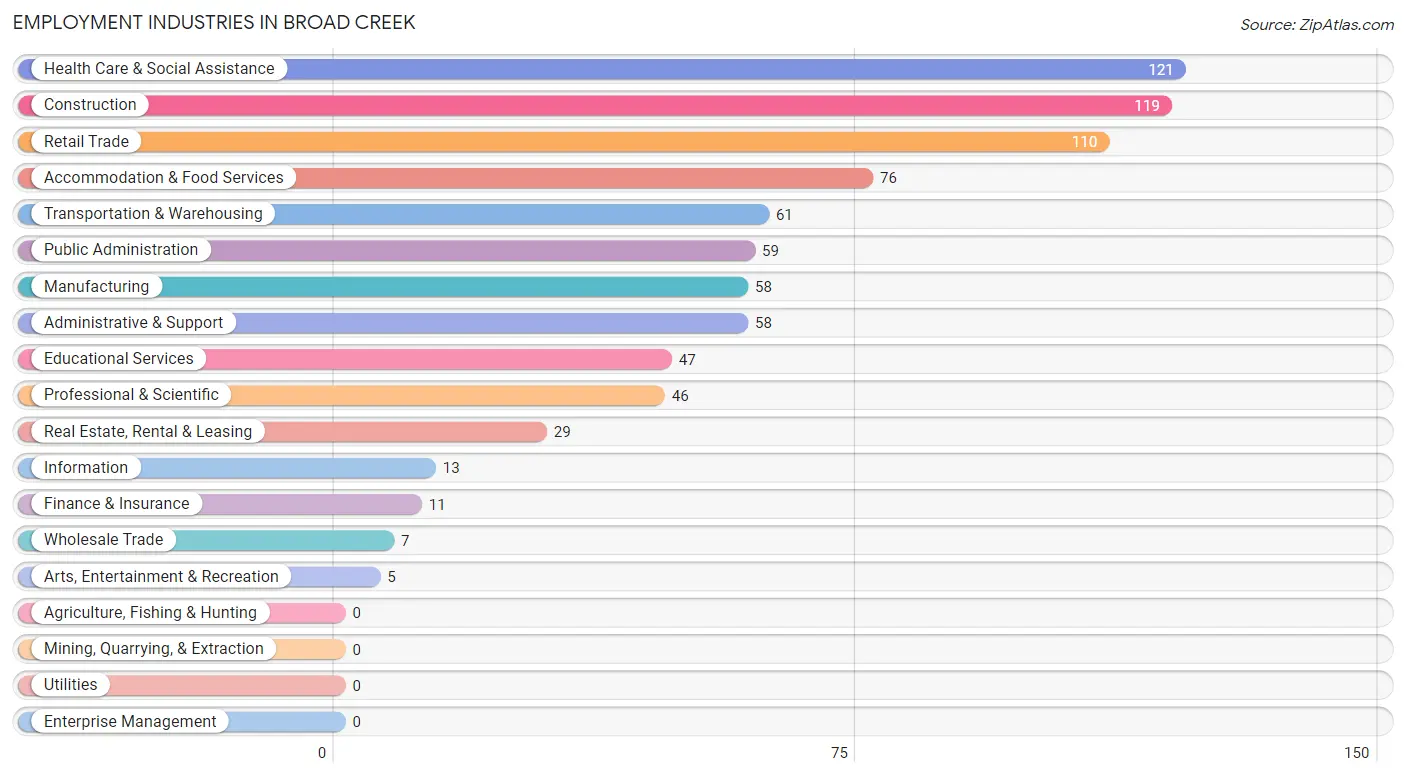
Employment Industries in Broad Creek
The major employment industries in Broad Creek include Health Care & Social Assistance (121 | 14.2%), Construction (119 | 13.9%), Retail Trade (110 | 12.9%), Accommodation & Food Services (76 | 8.9%), and Transportation & Warehousing (61 | 7.1%).
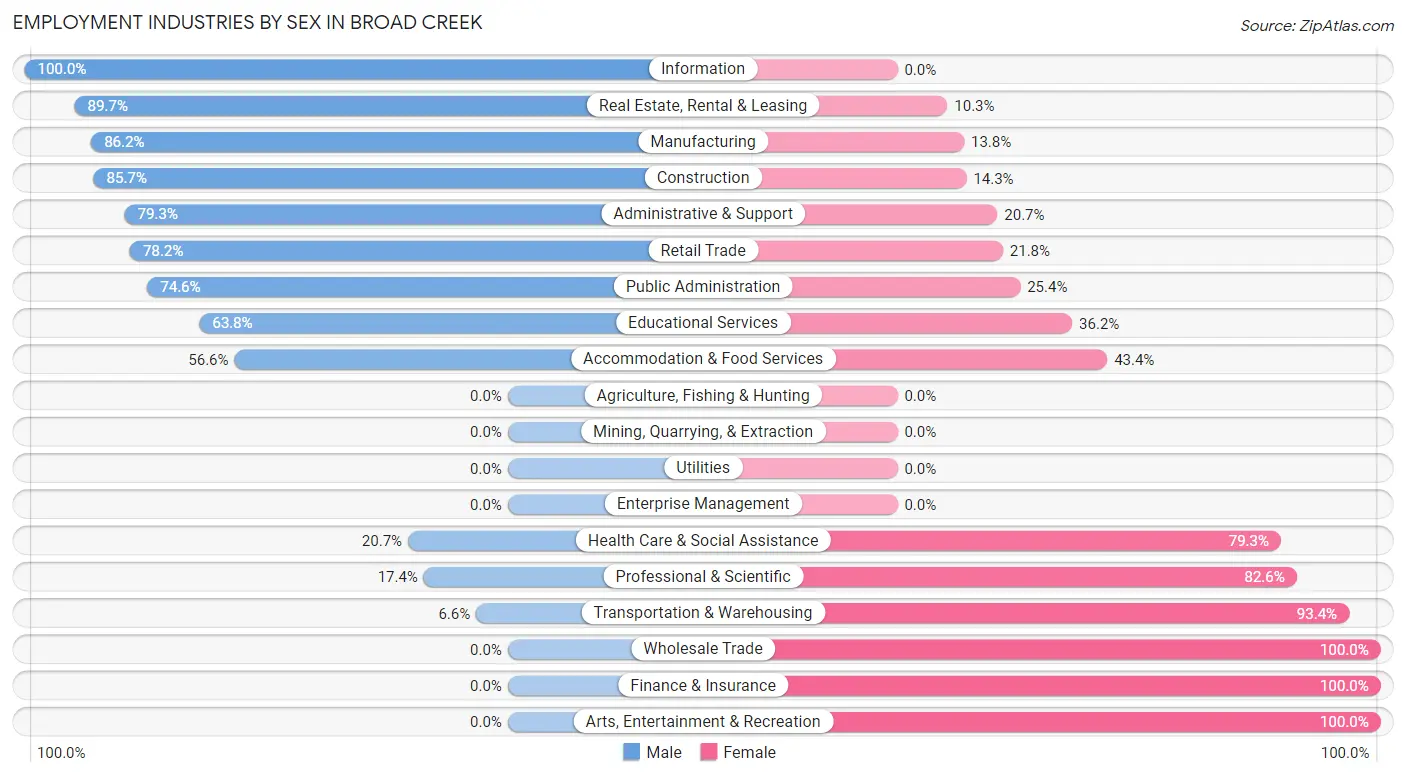
Employment Industries by Sex in Broad Creek
The Broad Creek industries that see more men than women are Information (100.0%), Real Estate, Rental & Leasing (89.7%), and Manufacturing (86.2%), whereas the industries that tend to have a higher number of women are Wholesale Trade (100.0%), Finance & Insurance (100.0%), and Arts, Entertainment & Recreation (100.0%).
| Industry | Male | Female |
| Agriculture, Fishing & Hunting | 0 (0.0%) | 0 (0.0%) |
| Mining, Quarrying, & Extraction | 0 (0.0%) | 0 (0.0%) |
| Construction | 102 (85.7%) | 17 (14.3%) |
| Manufacturing | 50 (86.2%) | 8 (13.8%) |
| Wholesale Trade | 0 (0.0%) | 7 (100.0%) |
| Retail Trade | 86 (78.2%) | 24 (21.8%) |
| Transportation & Warehousing | 4 (6.6%) | 57 (93.4%) |
| Utilities | 0 (0.0%) | 0 (0.0%) |
| Information | 13 (100.0%) | 0 (0.0%) |
| Finance & Insurance | 0 (0.0%) | 11 (100.0%) |
| Real Estate, Rental & Leasing | 26 (89.7%) | 3 (10.3%) |
| Professional & Scientific | 8 (17.4%) | 38 (82.6%) |
| Enterprise Management | 0 (0.0%) | 0 (0.0%) |
| Administrative & Support | 46 (79.3%) | 12 (20.7%) |
| Educational Services | 30 (63.8%) | 17 (36.2%) |
| Health Care & Social Assistance | 25 (20.7%) | 96 (79.3%) |
| Arts, Entertainment & Recreation | 0 (0.0%) | 5 (100.0%) |
| Accommodation & Food Services | 43 (56.6%) | 33 (43.4%) |
| Public Administration | 44 (74.6%) | 15 (25.4%) |
| Total | 494 (57.9%) | 360 (42.1%) |
Education in Broad Creek
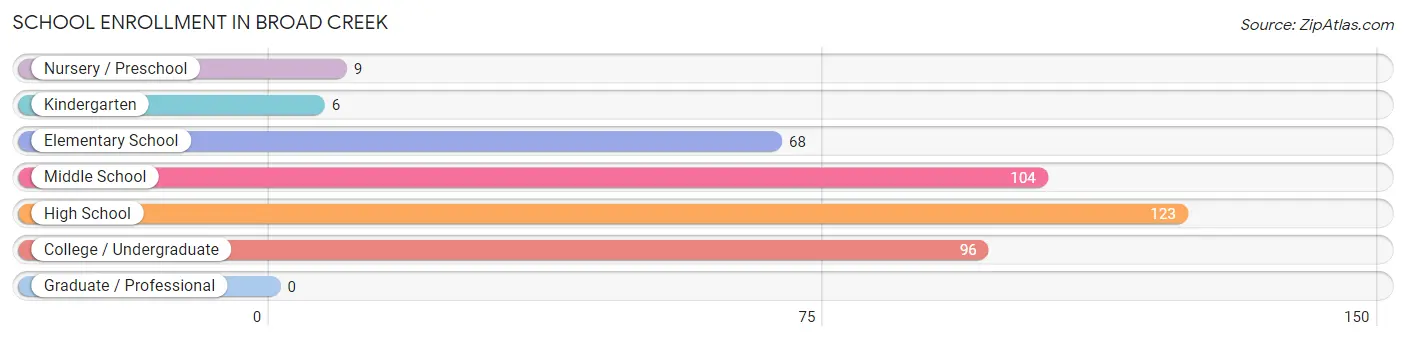
School Enrollment in Broad Creek
The most common levels of schooling among the 406 students in Broad Creek are high school (123 | 30.3%), middle school (104 | 25.6%), and college / undergraduate (96 | 23.6%).
| School Level | # Students | % Students |
| Nursery / Preschool | 9 | 2.2% |
| Kindergarten | 6 | 1.5% |
| Elementary School | 68 | 16.8% |
| Middle School | 104 | 25.6% |
| High School | 123 | 30.3% |
| College / Undergraduate | 96 | 23.6% |
| Graduate / Professional | 0 | 0.0% |
| Total | 406 | 100.0% |
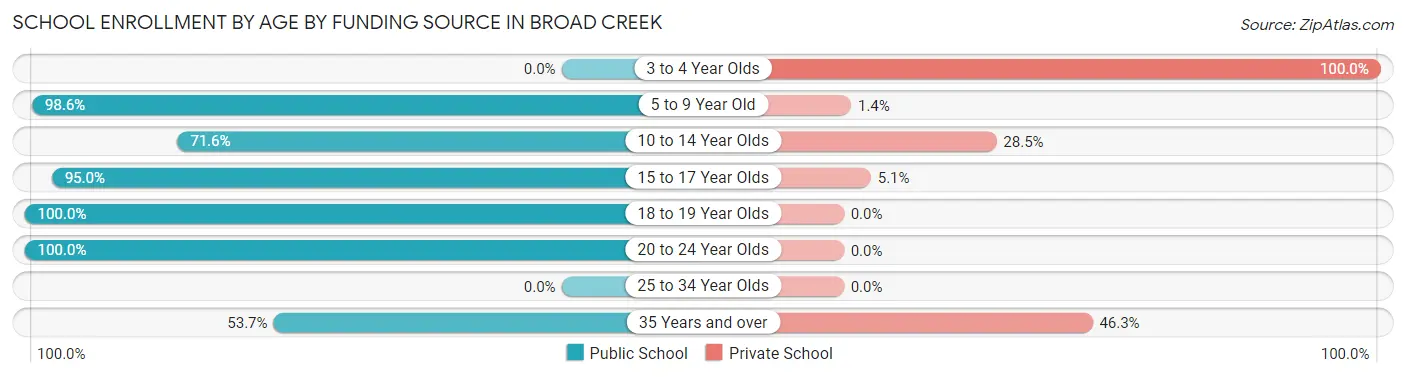
School Enrollment by Age by Funding Source in Broad Creek
Out of a total of 406 students who are enrolled in schools in Broad Creek, 64 (15.8%) attend a private institution, while the remaining 342 (84.2%) are enrolled in public schools. The age group of 3 to 4 year olds has the highest likelihood of being enrolled in private schools, with 6 (100.0% in the age bracket) enrolled. Conversely, the age group of 18 to 19 year olds has the lowest likelihood of being enrolled in a private school, with 12 (100.0% in the age bracket) attending a public institution.
| Age Bracket | Public School | Private School |
| 3 to 4 Year Olds | 0 (0.0%) | 6 (100.0%) |
| 5 to 9 Year Old | 72 (98.6%) | 1 (1.4%) |
| 10 to 14 Year Olds | 83 (71.6%) | 33 (28.4%) |
| 15 to 17 Year Olds | 94 (95.0%) | 5 (5.1%) |
| 18 to 19 Year Olds | 12 (100.0%) | 0 (0.0%) |
| 20 to 24 Year Olds | 59 (100.0%) | 0 (0.0%) |
| 25 to 34 Year Olds | 0 (0.0%) | 0 (0.0%) |
| 35 Years and over | 22 (53.7%) | 19 (46.3%) |
| Total | 342 (84.2%) | 64 (15.8%) |
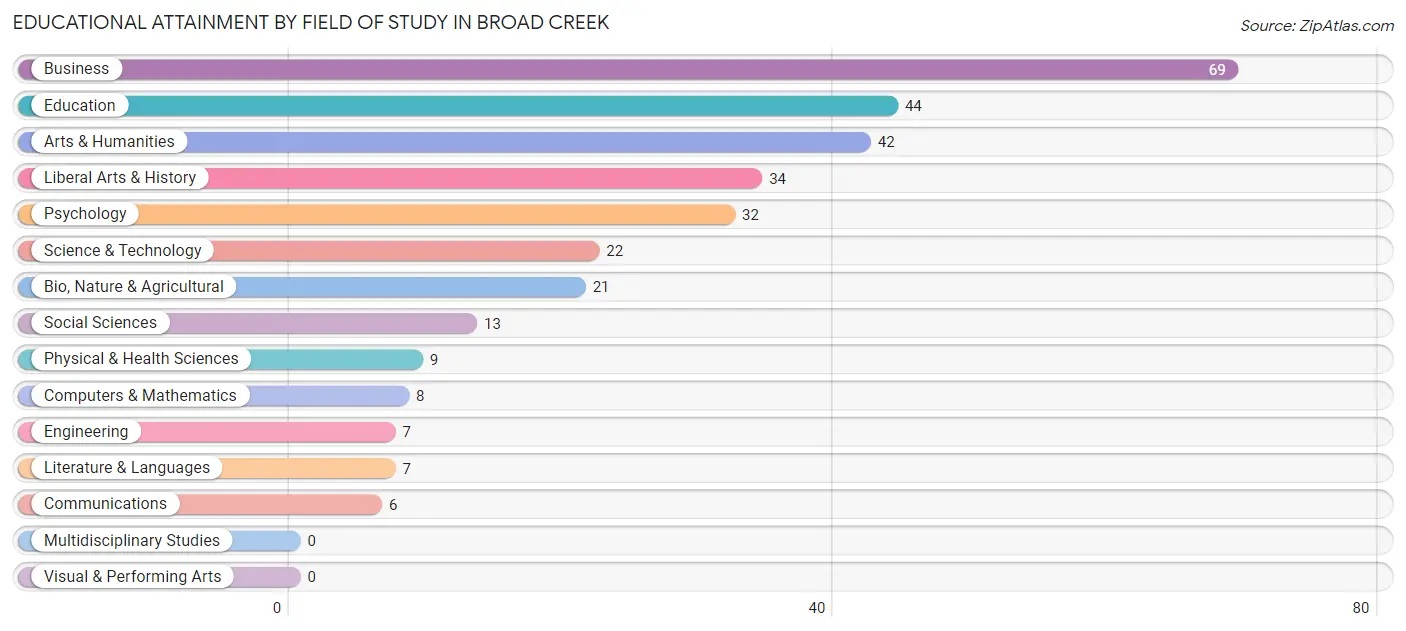
Educational Attainment by Field of Study in Broad Creek
Business (69 | 22.0%), education (44 | 14.0%), arts & humanities (42 | 13.4%), liberal arts & history (34 | 10.8%), and psychology (32 | 10.2%) are the most common fields of study among 314 individuals in Broad Creek who have obtained a bachelor's degree or higher.
| Field of Study | # Graduates | % Graduates |
| Computers & Mathematics | 8 | 2.5% |
| Bio, Nature & Agricultural | 21 | 6.7% |
| Physical & Health Sciences | 9 | 2.9% |
| Psychology | 32 | 10.2% |
| Social Sciences | 13 | 4.1% |
| Engineering | 7 | 2.2% |
| Multidisciplinary Studies | 0 | 0.0% |
| Science & Technology | 22 | 7.0% |
| Business | 69 | 22.0% |
| Education | 44 | 14.0% |
| Literature & Languages | 7 | 2.2% |
| Liberal Arts & History | 34 | 10.8% |
| Visual & Performing Arts | 0 | 0.0% |
| Communications | 6 | 1.9% |
| Arts & Humanities | 42 | 13.4% |
| Total | 314 | 100.0% |
Transportation & Commute in Broad Creek
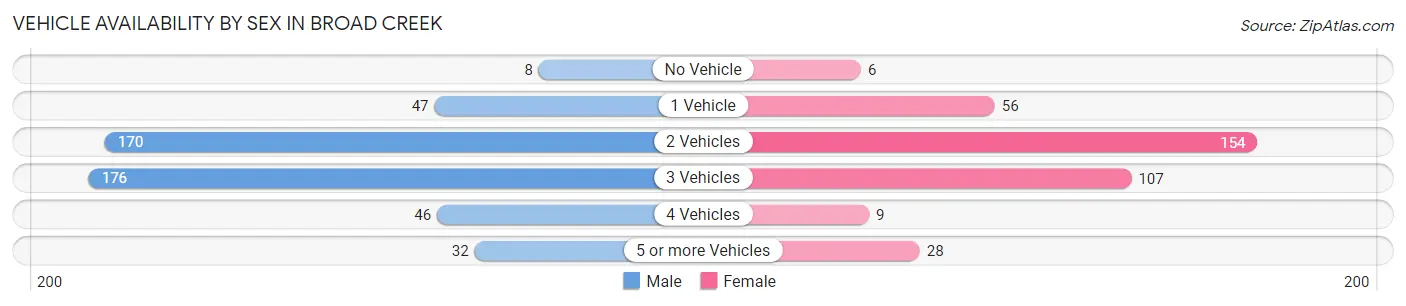
Vehicle Availability by Sex in Broad Creek
The most prevalent vehicle ownership categories in Broad Creek are males with 3 vehicles (176, accounting for 36.7%) and females with 3 vehicles (107, making up 48.9%).
| Vehicles Available | Male | Female |
| No Vehicle | 8 (1.7%) | 6 (1.7%) |
| 1 Vehicle | 47 (9.8%) | 56 (15.6%) |
| 2 Vehicles | 170 (35.5%) | 154 (42.8%) |
| 3 Vehicles | 176 (36.7%) | 107 (29.7%) |
| 4 Vehicles | 46 (9.6%) | 9 (2.5%) |
| 5 or more Vehicles | 32 (6.7%) | 28 (7.8%) |
| Total | 479 (100.0%) | 360 (100.0%) |
Commute Time in Broad Creek
The most frequently occuring commute durations in Broad Creek are 15 to 19 minutes (191 commuters, 25.4%), 20 to 24 minutes (97 commuters, 12.9%), and 40 to 44 minutes (72 commuters, 9.6%).
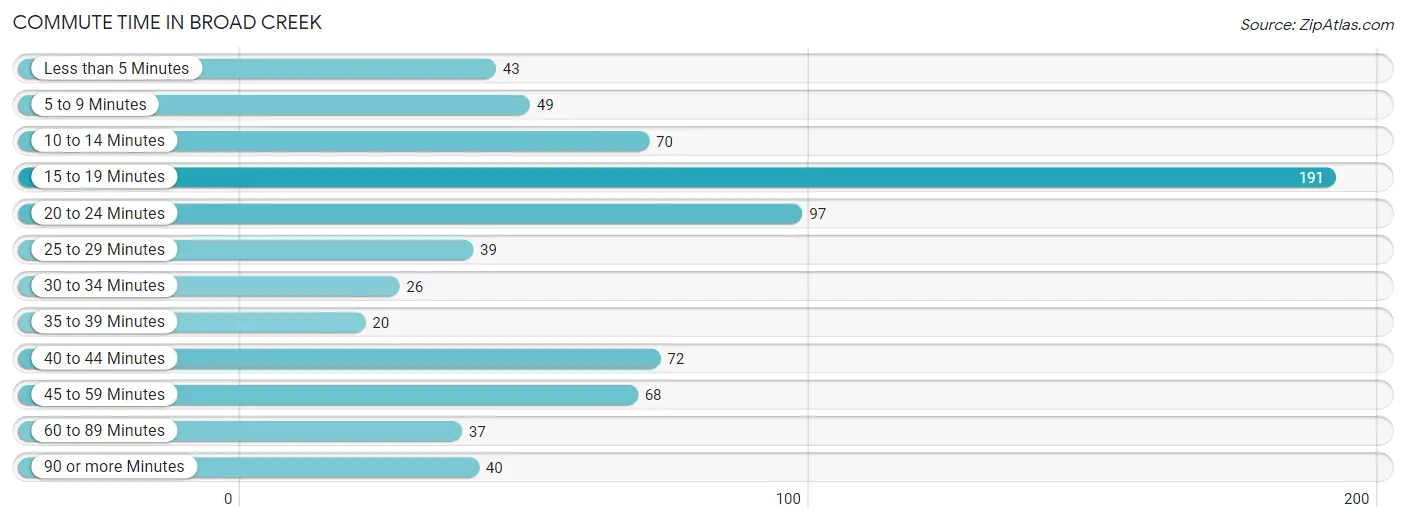
| Commute Time | # Commuters | % Commuters |
| Less than 5 Minutes | 43 | 5.7% |
| 5 to 9 Minutes | 49 | 6.5% |
| 10 to 14 Minutes | 70 | 9.3% |
| 15 to 19 Minutes | 191 | 25.4% |
| 20 to 24 Minutes | 97 | 12.9% |
| 25 to 29 Minutes | 39 | 5.2% |
| 30 to 34 Minutes | 26 | 3.5% |
| 35 to 39 Minutes | 20 | 2.7% |
| 40 to 44 Minutes | 72 | 9.6% |
| 45 to 59 Minutes | 68 | 9.0% |
| 60 to 89 Minutes | 37 | 4.9% |
| 90 or more Minutes | 40 | 5.3% |
Commute Time by Sex in Broad Creek
The most common commute times in Broad Creek are 15 to 19 minutes (118 commuters, 26.2%) for males and 15 to 19 minutes (73 commuters, 24.2%) for females.
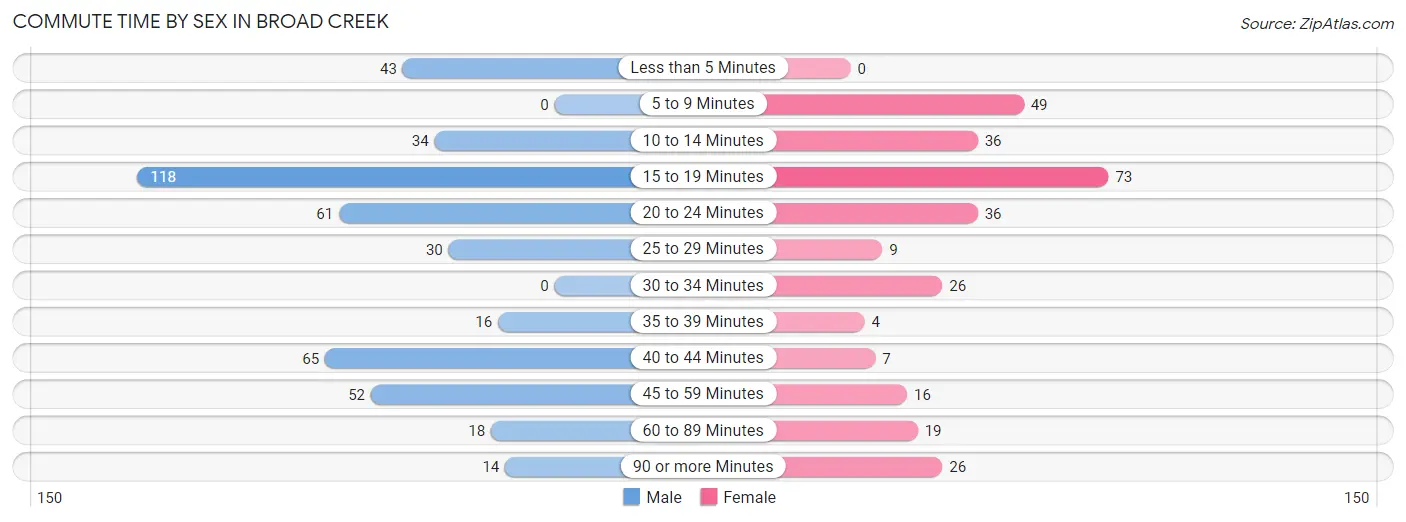
| Commute Time | Male | Female |
| Less than 5 Minutes | 43 (9.5%) | 0 (0.0%) |
| 5 to 9 Minutes | 0 (0.0%) | 49 (16.3%) |
| 10 to 14 Minutes | 34 (7.5%) | 36 (12.0%) |
| 15 to 19 Minutes | 118 (26.2%) | 73 (24.2%) |
| 20 to 24 Minutes | 61 (13.5%) | 36 (12.0%) |
| 25 to 29 Minutes | 30 (6.7%) | 9 (3.0%) |
| 30 to 34 Minutes | 0 (0.0%) | 26 (8.6%) |
| 35 to 39 Minutes | 16 (3.5%) | 4 (1.3%) |
| 40 to 44 Minutes | 65 (14.4%) | 7 (2.3%) |
| 45 to 59 Minutes | 52 (11.5%) | 16 (5.3%) |
| 60 to 89 Minutes | 18 (4.0%) | 19 (6.3%) |
| 90 or more Minutes | 14 (3.1%) | 26 (8.6%) |
Time of Departure to Work by Sex in Broad Creek
The most frequent times of departure to work in Broad Creek are 8:00 AM to 8:29 AM (100, 22.2%) for males and 8:00 AM to 8:29 AM (56, 18.6%) for females.
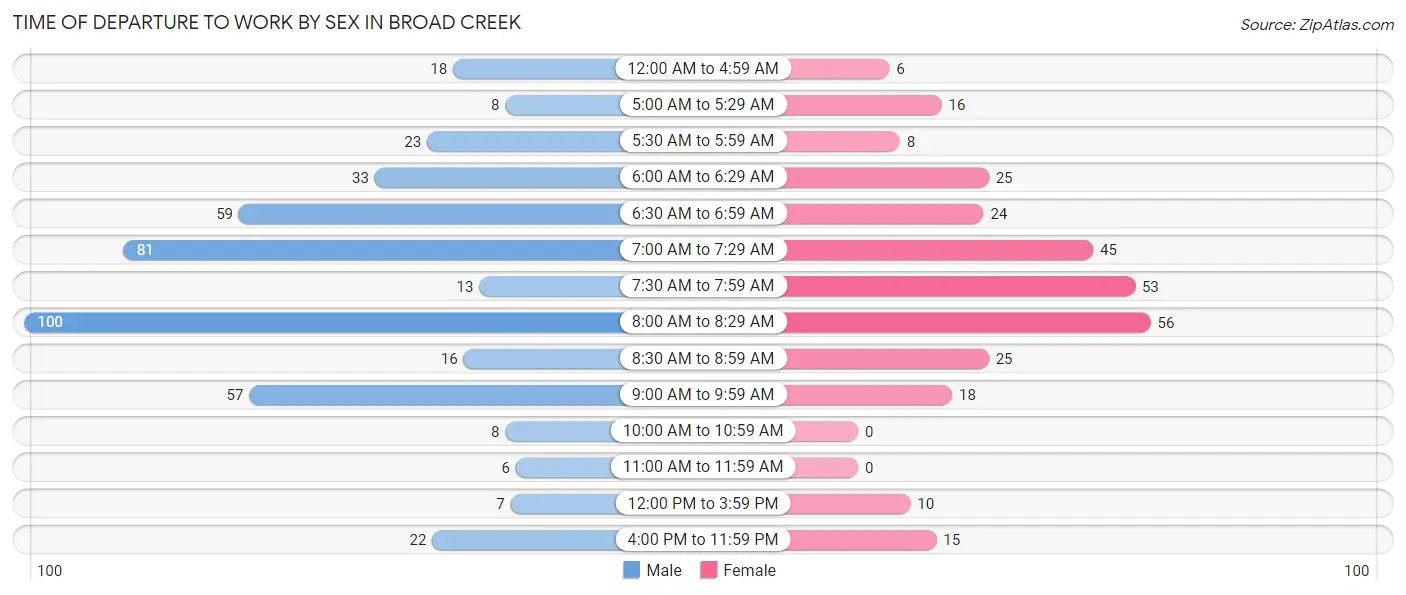
| Time of Departure | Male | Female |
| 12:00 AM to 4:59 AM | 18 (4.0%) | 6 (2.0%) |
| 5:00 AM to 5:29 AM | 8 (1.8%) | 16 (5.3%) |
| 5:30 AM to 5:59 AM | 23 (5.1%) | 8 (2.7%) |
| 6:00 AM to 6:29 AM | 33 (7.3%) | 25 (8.3%) |
| 6:30 AM to 6:59 AM | 59 (13.1%) | 24 (8.0%) |
| 7:00 AM to 7:29 AM | 81 (18.0%) | 45 (14.9%) |
| 7:30 AM to 7:59 AM | 13 (2.9%) | 53 (17.6%) |
| 8:00 AM to 8:29 AM | 100 (22.2%) | 56 (18.6%) |
| 8:30 AM to 8:59 AM | 16 (3.5%) | 25 (8.3%) |
| 9:00 AM to 9:59 AM | 57 (12.6%) | 18 (6.0%) |
| 10:00 AM to 10:59 AM | 8 (1.8%) | 0 (0.0%) |
| 11:00 AM to 11:59 AM | 6 (1.3%) | 0 (0.0%) |
| 12:00 PM to 3:59 PM | 7 (1.5%) | 10 (3.3%) |
| 4:00 PM to 11:59 PM | 22 (4.9%) | 15 (5.0%) |
| Total | 451 (100.0%) | 301 (100.0%) |
Housing Occupancy in Broad Creek
Occupancy by Ownership in Broad Creek
Of the total 796 dwellings in Broad Creek, owner-occupied units account for 641 (80.5%), while renter-occupied units make up 155 (19.5%).
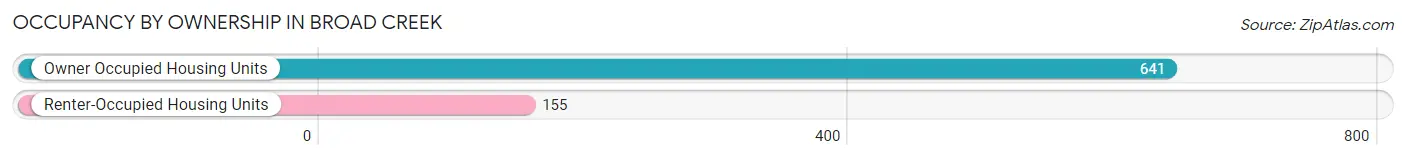
| Occupancy | # Housing Units | % Housing Units |
| Owner Occupied Housing Units | 641 | 80.5% |
| Renter-Occupied Housing Units | 155 | 19.5% |
| Total Occupied Housing Units | 796 | 100.0% |
Occupancy by Household Size in Broad Creek
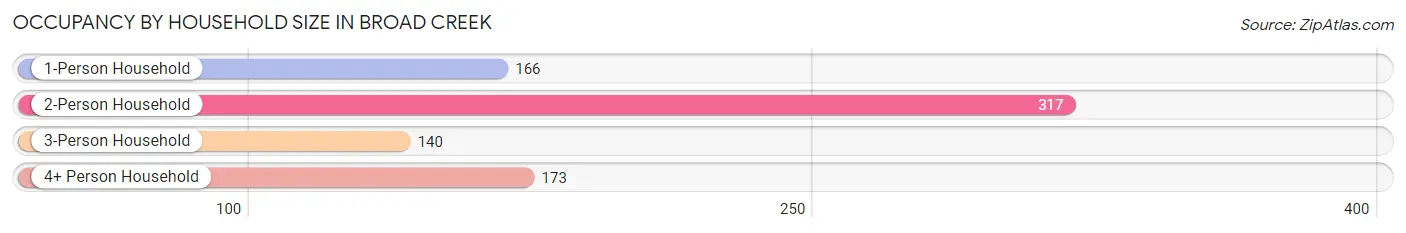
| Household Size | # Housing Units | % Housing Units |
| 1-Person Household | 166 | 20.8% |
| 2-Person Household | 317 | 39.8% |
| 3-Person Household | 140 | 17.6% |
| 4+ Person Household | 173 | 21.7% |
| Total Housing Units | 796 | 100.0% |
Occupancy by Ownership by Household Size in Broad Creek
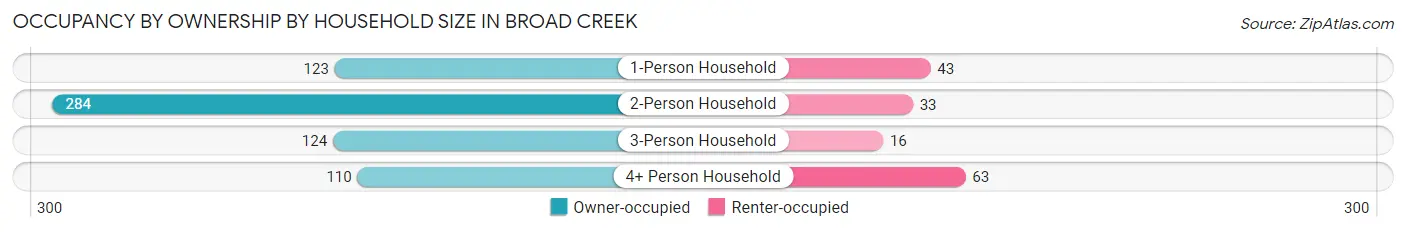
| Household Size | Owner-occupied | Renter-occupied |
| 1-Person Household | 123 (74.1%) | 43 (25.9%) |
| 2-Person Household | 284 (89.6%) | 33 (10.4%) |
| 3-Person Household | 124 (88.6%) | 16 (11.4%) |
| 4+ Person Household | 110 (63.6%) | 63 (36.4%) |
| Total Housing Units | 641 (80.5%) | 155 (19.5%) |
Occupancy by Educational Attainment in Broad Creek
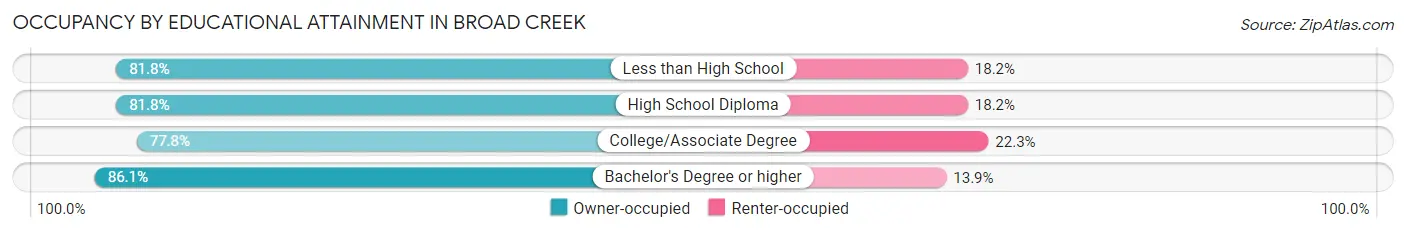
| Household Size | Owner-occupied | Renter-occupied |
| Less than High School | 45 (81.8%) | 10 (18.2%) |
| High School Diploma | 135 (81.8%) | 30 (18.2%) |
| College/Associate Degree | 325 (77.7%) | 93 (22.3%) |
| Bachelor's Degree or higher | 136 (86.1%) | 22 (13.9%) |
Occupancy by Age of Householder in Broad Creek
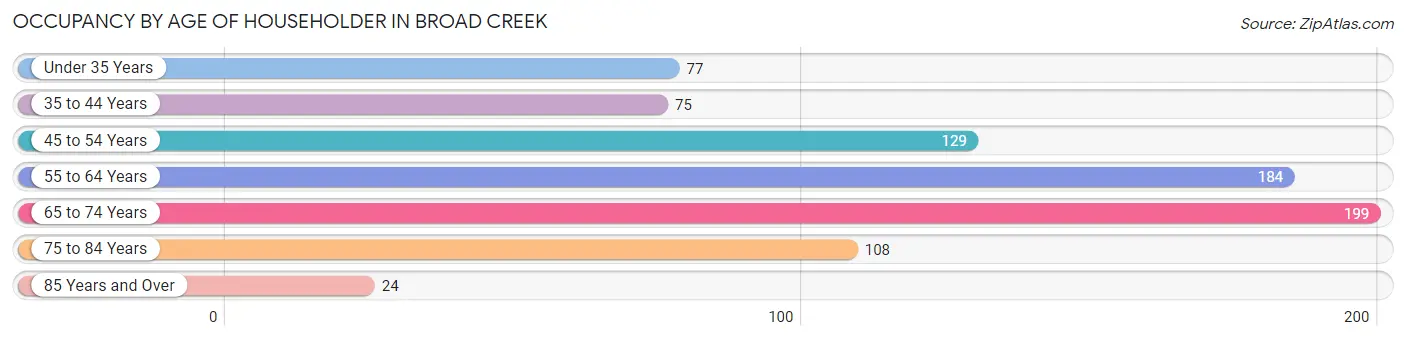
| Age Bracket | # Households | % Households |
| Under 35 Years | 77 | 9.7% |
| 35 to 44 Years | 75 | 9.4% |
| 45 to 54 Years | 129 | 16.2% |
| 55 to 64 Years | 184 | 23.1% |
| 65 to 74 Years | 199 | 25.0% |
| 75 to 84 Years | 108 | 13.6% |
| 85 Years and Over | 24 | 3.0% |
| Total | 796 | 100.0% |
Housing Finances in Broad Creek
Median Income by Occupancy in Broad Creek
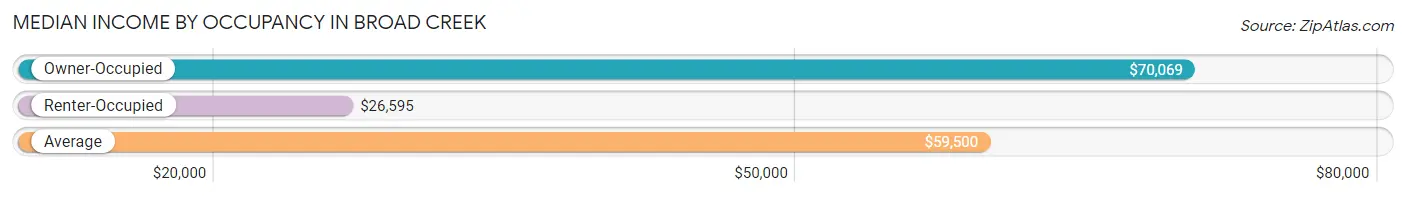
| Occupancy Type | # Households | Median Income |
| Owner-Occupied | 641 (80.5%) | $70,069 |
| Renter-Occupied | 155 (19.5%) | $26,595 |
| Average | 796 (100.0%) | $59,500 |
Occupancy by Householder Income Bracket in Broad Creek
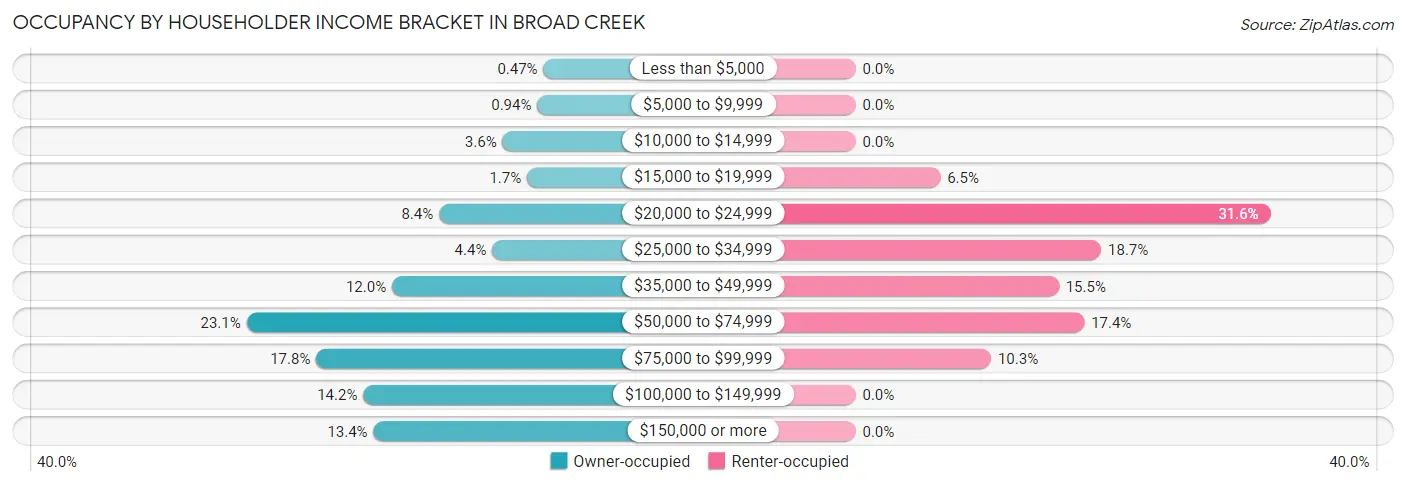
| Income Bracket | Owner-occupied | Renter-occupied |
| Less than $5,000 | 3 (0.5%) | 0 (0.0%) |
| $5,000 to $9,999 | 6 (0.9%) | 0 (0.0%) |
| $10,000 to $14,999 | 23 (3.6%) | 0 (0.0%) |
| $15,000 to $19,999 | 11 (1.7%) | 10 (6.5%) |
| $20,000 to $24,999 | 54 (8.4%) | 49 (31.6%) |
| $25,000 to $34,999 | 28 (4.4%) | 29 (18.7%) |
| $35,000 to $49,999 | 77 (12.0%) | 24 (15.5%) |
| $50,000 to $74,999 | 148 (23.1%) | 27 (17.4%) |
| $75,000 to $99,999 | 114 (17.8%) | 16 (10.3%) |
| $100,000 to $149,999 | 91 (14.2%) | 0 (0.0%) |
| $150,000 or more | 86 (13.4%) | 0 (0.0%) |
| Total | 641 (100.0%) | 155 (100.0%) |
Monthly Housing Cost Tiers in Broad Creek
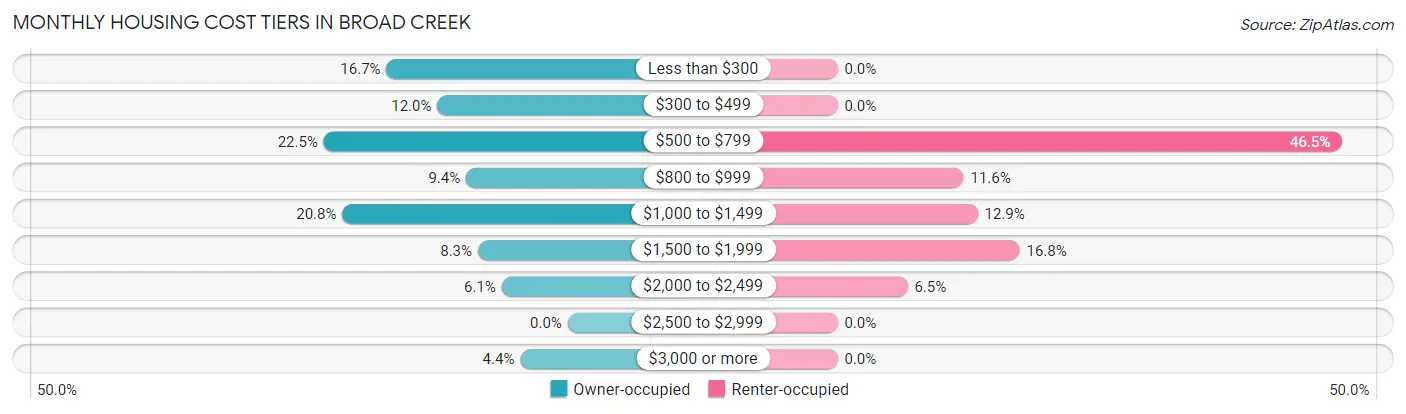
| Monthly Cost | Owner-occupied | Renter-occupied |
| Less than $300 | 107 (16.7%) | 0 (0.0%) |
| $300 to $499 | 77 (12.0%) | 0 (0.0%) |
| $500 to $799 | 144 (22.5%) | 72 (46.5%) |
| $800 to $999 | 60 (9.4%) | 18 (11.6%) |
| $1,000 to $1,499 | 133 (20.7%) | 20 (12.9%) |
| $1,500 to $1,999 | 53 (8.3%) | 26 (16.8%) |
| $2,000 to $2,499 | 39 (6.1%) | 10 (6.5%) |
| $2,500 to $2,999 | 0 (0.0%) | 0 (0.0%) |
| $3,000 or more | 28 (4.4%) | 0 (0.0%) |
| Total | 641 (100.0%) | 155 (100.0%) |
Physical Housing Characteristics in Broad Creek
Housing Structures in Broad Creek
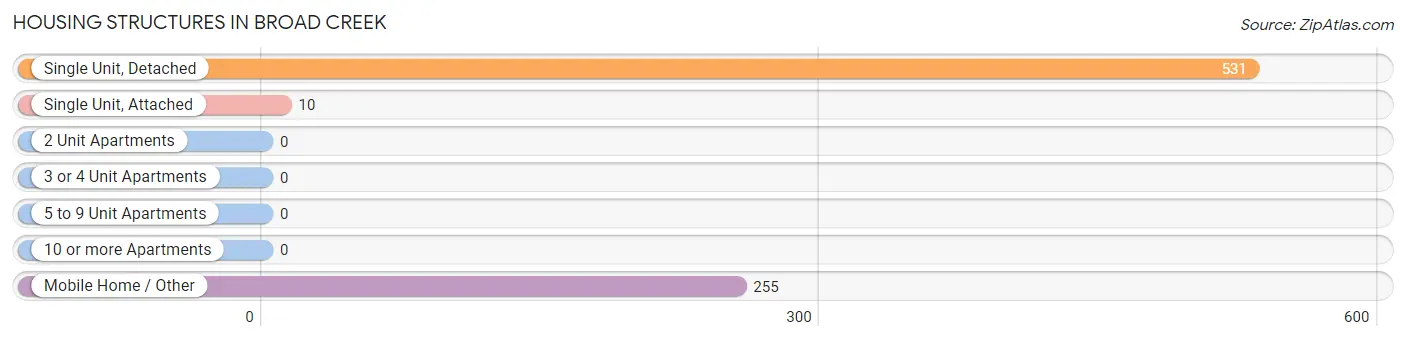
| Structure Type | # Housing Units | % Housing Units |
| Single Unit, Detached | 531 | 66.7% |
| Single Unit, Attached | 10 | 1.3% |
| 2 Unit Apartments | 0 | 0.0% |
| 3 or 4 Unit Apartments | 0 | 0.0% |
| 5 to 9 Unit Apartments | 0 | 0.0% |
| 10 or more Apartments | 0 | 0.0% |
| Mobile Home / Other | 255 | 32.0% |
| Total | 796 | 100.0% |
Housing Structures by Occupancy in Broad Creek
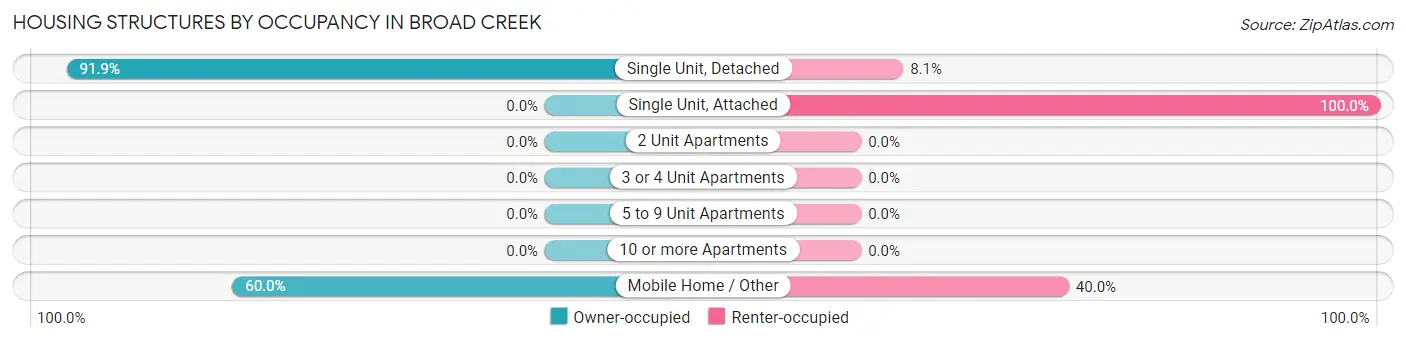
| Structure Type | Owner-occupied | Renter-occupied |
| Single Unit, Detached | 488 (91.9%) | 43 (8.1%) |
| Single Unit, Attached | 0 (0.0%) | 10 (100.0%) |
| 2 Unit Apartments | 0 (0.0%) | 0 (0.0%) |
| 3 or 4 Unit Apartments | 0 (0.0%) | 0 (0.0%) |
| 5 to 9 Unit Apartments | 0 (0.0%) | 0 (0.0%) |
| 10 or more Apartments | 0 (0.0%) | 0 (0.0%) |
| Mobile Home / Other | 153 (60.0%) | 102 (40.0%) |
| Total | 641 (80.5%) | 155 (19.5%) |
Housing Structures by Number of Rooms in Broad Creek
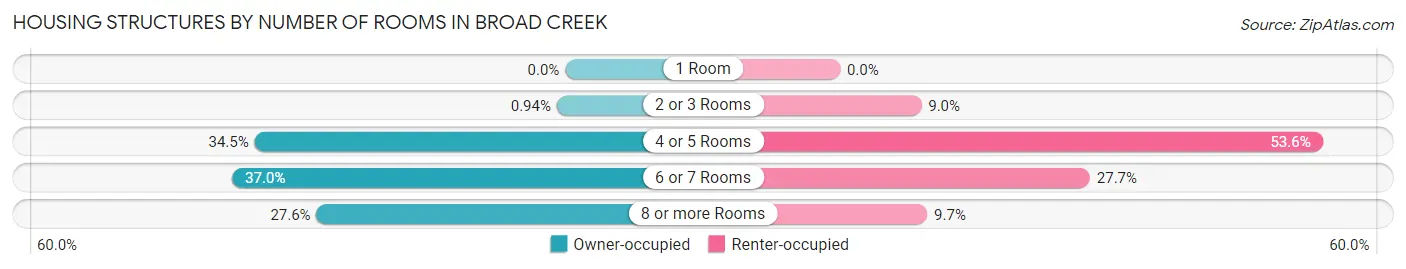
| Number of Rooms | Owner-occupied | Renter-occupied |
| 1 Room | 0 (0.0%) | 0 (0.0%) |
| 2 or 3 Rooms | 6 (0.9%) | 14 (9.0%) |
| 4 or 5 Rooms | 221 (34.5%) | 83 (53.5%) |
| 6 or 7 Rooms | 237 (37.0%) | 43 (27.7%) |
| 8 or more Rooms | 177 (27.6%) | 15 (9.7%) |
| Total | 641 (100.0%) | 155 (100.0%) |
Housing Structure by Heating Type in Broad Creek
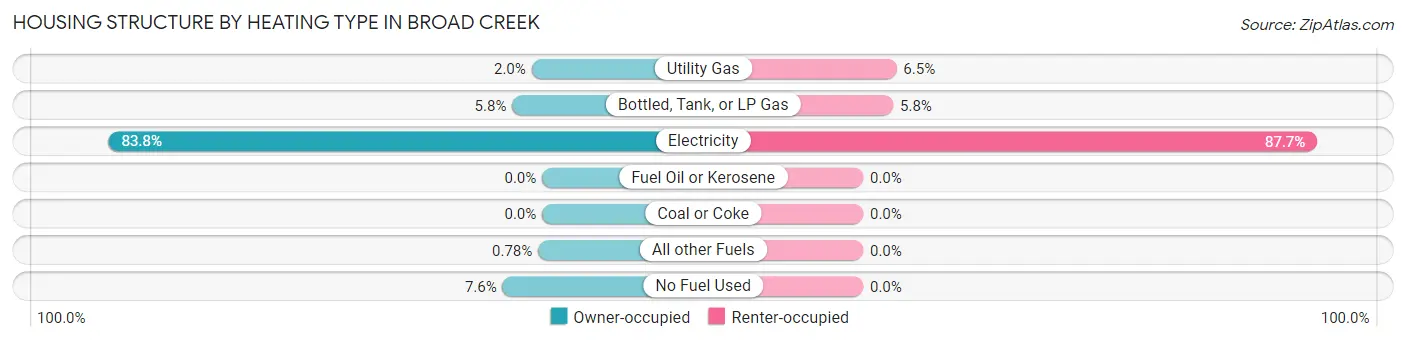
| Heating Type | Owner-occupied | Renter-occupied |
| Utility Gas | 13 (2.0%) | 10 (6.5%) |
| Bottled, Tank, or LP Gas | 37 (5.8%) | 9 (5.8%) |
| Electricity | 537 (83.8%) | 136 (87.7%) |
| Fuel Oil or Kerosene | 0 (0.0%) | 0 (0.0%) |
| Coal or Coke | 0 (0.0%) | 0 (0.0%) |
| All other Fuels | 5 (0.8%) | 0 (0.0%) |
| No Fuel Used | 49 (7.6%) | 0 (0.0%) |
| Total | 641 (100.0%) | 155 (100.0%) |
Household Vehicle Usage in Broad Creek
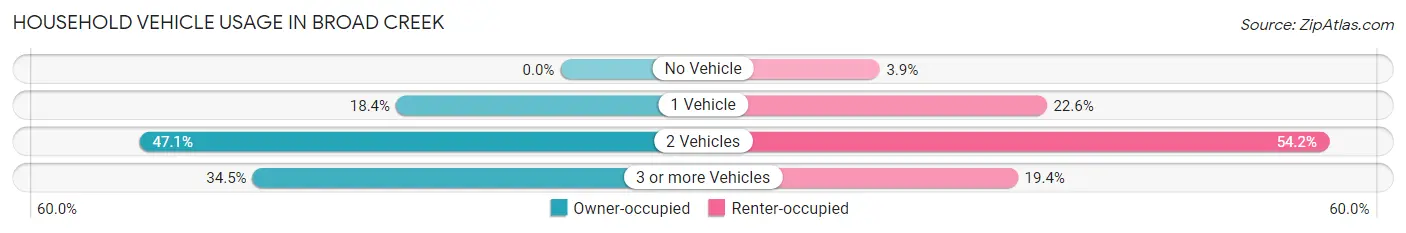
| Vehicles per Household | Owner-occupied | Renter-occupied |
| No Vehicle | 0 (0.0%) | 6 (3.9%) |
| 1 Vehicle | 118 (18.4%) | 35 (22.6%) |
| 2 Vehicles | 302 (47.1%) | 84 (54.2%) |
| 3 or more Vehicles | 221 (34.5%) | 30 (19.4%) |
| Total | 641 (100.0%) | 155 (100.0%) |
Real Estate & Mortgages in Broad Creek
Real Estate and Mortgage Overview in Broad Creek
| Characteristic | Without Mortgage | With Mortgage |
| Housing Units | 316 | 325 |
| Median Property Value | $159,800 | $197,600 |
| Median Household Income | $63,594 | $48 |
| Monthly Housing Costs | $452 | $28 |
| Real Estate Taxes | $919 | $29 |
Property Value by Mortgage Status in Broad Creek
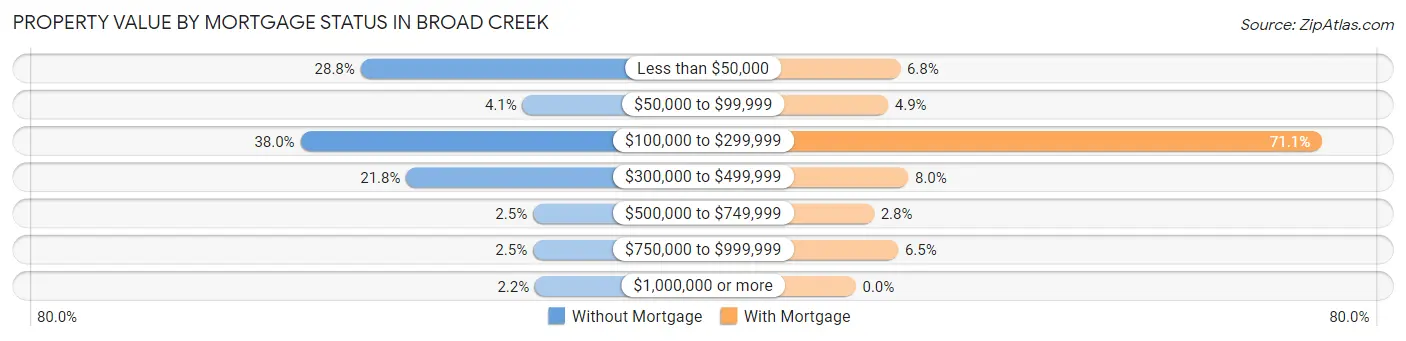
| Property Value | Without Mortgage | With Mortgage |
| Less than $50,000 | 91 (28.8%) | 22 (6.8%) |
| $50,000 to $99,999 | 13 (4.1%) | 16 (4.9%) |
| $100,000 to $299,999 | 120 (38.0%) | 231 (71.1%) |
| $300,000 to $499,999 | 69 (21.8%) | 26 (8.0%) |
| $500,000 to $749,999 | 8 (2.5%) | 9 (2.8%) |
| $750,000 to $999,999 | 8 (2.5%) | 21 (6.5%) |
| $1,000,000 or more | 7 (2.2%) | 0 (0.0%) |
| Total | 316 (100.0%) | 325 (100.0%) |
Household Income by Mortgage Status in Broad Creek
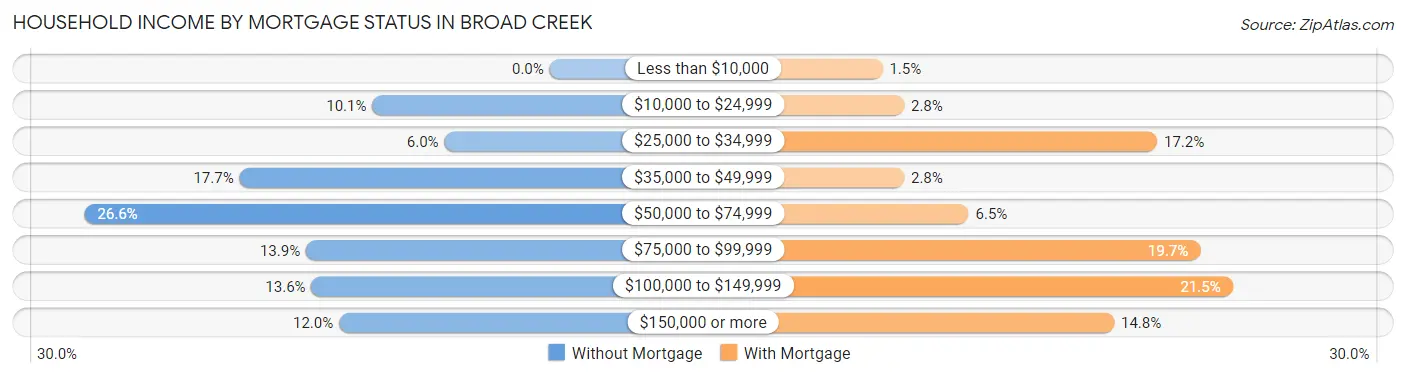
| Household Income | Without Mortgage | With Mortgage |
| Less than $10,000 | 0 (0.0%) | 5 (1.5%) |
| $10,000 to $24,999 | 32 (10.1%) | 9 (2.8%) |
| $25,000 to $34,999 | 19 (6.0%) | 56 (17.2%) |
| $35,000 to $49,999 | 56 (17.7%) | 9 (2.8%) |
| $50,000 to $74,999 | 84 (26.6%) | 21 (6.5%) |
| $75,000 to $99,999 | 44 (13.9%) | 64 (19.7%) |
| $100,000 to $149,999 | 43 (13.6%) | 70 (21.5%) |
| $150,000 or more | 38 (12.0%) | 48 (14.8%) |
| Total | 316 (100.0%) | 325 (100.0%) |
Property Value to Household Income Ratio in Broad Creek
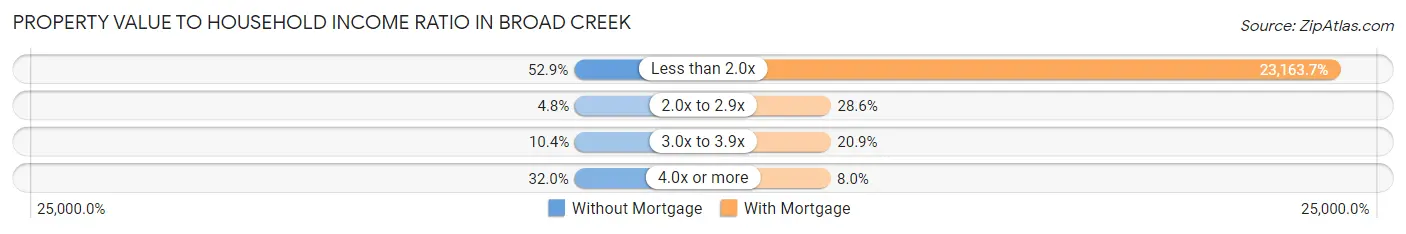
| Value-to-Income Ratio | Without Mortgage | With Mortgage |
| Less than 2.0x | 167 (52.8%) | 75,282 (23,163.7%) |
| 2.0x to 2.9x | 15 (4.8%) | 93 (28.6%) |
| 3.0x to 3.9x | 33 (10.4%) | 68 (20.9%) |
| 4.0x or more | 101 (32.0%) | 26 (8.0%) |
| Total | 316 (100.0%) | 325 (100.0%) |
Real Estate Taxes by Mortgage Status in Broad Creek
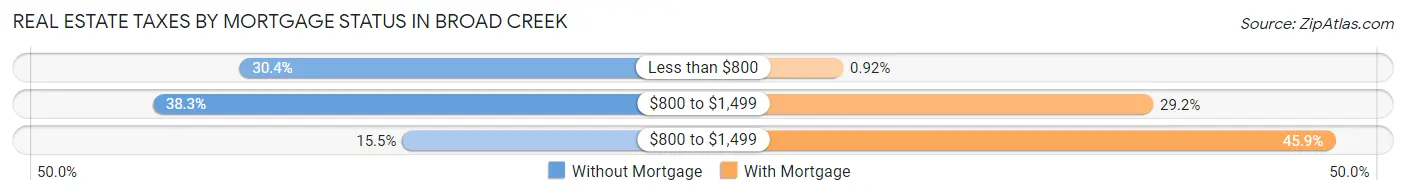
| Property Taxes | Without Mortgage | With Mortgage |
| Less than $800 | 96 (30.4%) | 3 (0.9%) |
| $800 to $1,499 | 121 (38.3%) | 95 (29.2%) |
| $800 to $1,499 | 49 (15.5%) | 149 (45.9%) |
| Total | 316 (100.0%) | 325 (100.0%) |
Health & Disability in Broad Creek
Health Insurance Coverage by Age in Broad Creek
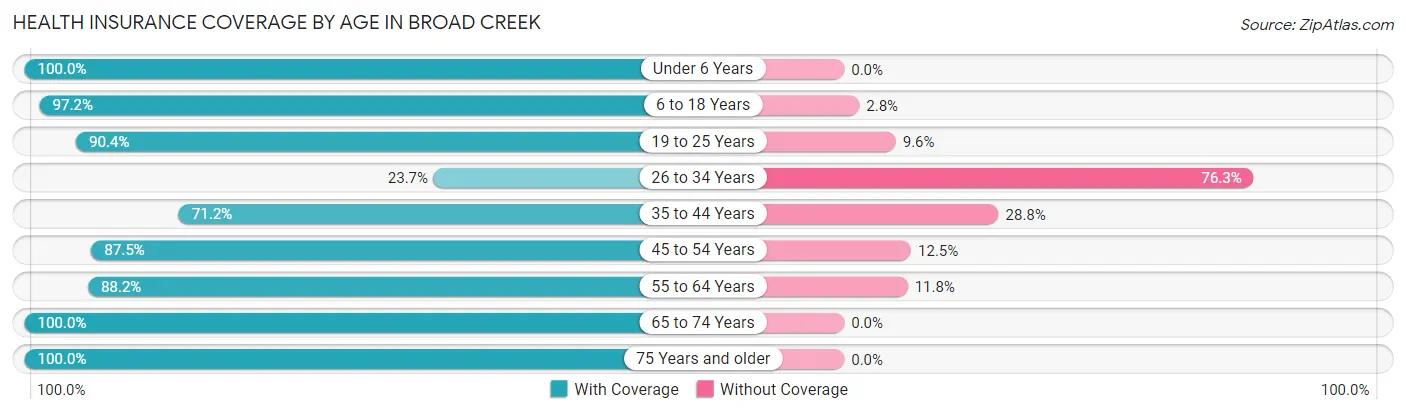
| Age Bracket | With Coverage | Without Coverage |
| Under 6 Years | 111 (100.0%) | 0 (0.0%) |
| 6 to 18 Years | 311 (97.2%) | 9 (2.8%) |
| 19 to 25 Years | 113 (90.4%) | 12 (9.6%) |
| 26 to 34 Years | 27 (23.7%) | 87 (76.3%) |
| 35 to 44 Years | 99 (71.2%) | 40 (28.8%) |
| 45 to 54 Years | 260 (87.5%) | 37 (12.5%) |
| 55 to 64 Years | 358 (88.2%) | 48 (11.8%) |
| 65 to 74 Years | 320 (100.0%) | 0 (0.0%) |
| 75 Years and older | 175 (100.0%) | 0 (0.0%) |
| Total | 1,774 (88.4%) | 233 (11.6%) |
Health Insurance Coverage by Citizenship Status in Broad Creek
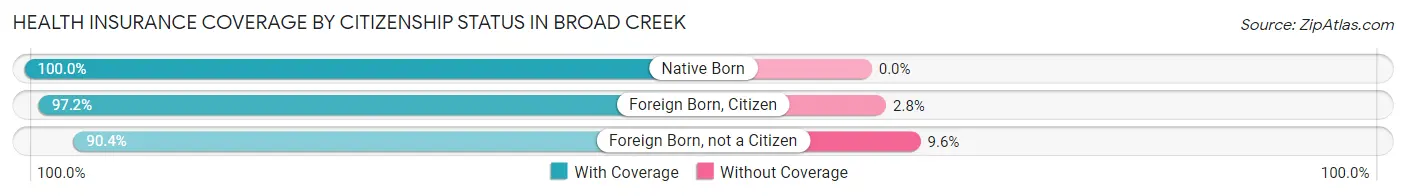
| Citizenship Status | With Coverage | Without Coverage |
| Native Born | 111 (100.0%) | 0 (0.0%) |
| Foreign Born, Citizen | 311 (97.2%) | 9 (2.8%) |
| Foreign Born, not a Citizen | 113 (90.4%) | 12 (9.6%) |
Health Insurance Coverage by Household Income in Broad Creek
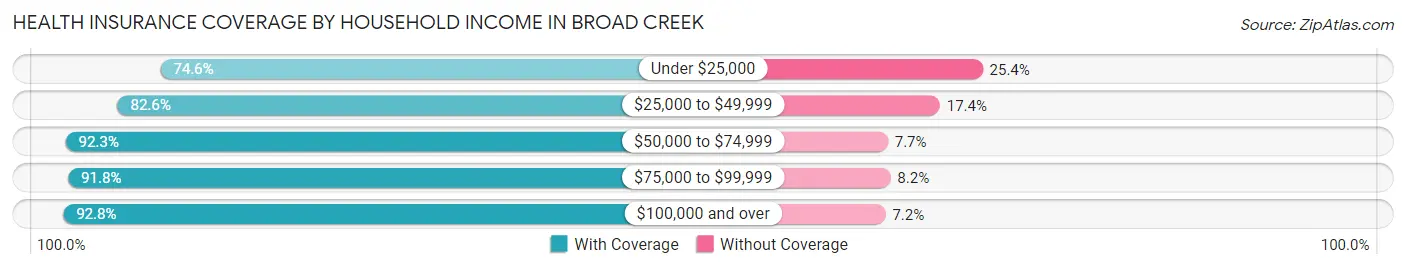
| Household Income | With Coverage | Without Coverage |
| Under $25,000 | 170 (74.6%) | 58 (25.4%) |
| $25,000 to $49,999 | 327 (82.6%) | 69 (17.4%) |
| $50,000 to $74,999 | 445 (92.3%) | 37 (7.7%) |
| $75,000 to $99,999 | 371 (91.8%) | 33 (8.2%) |
| $100,000 and over | 461 (92.8%) | 36 (7.2%) |
Public vs Private Health Insurance Coverage by Age in Broad Creek
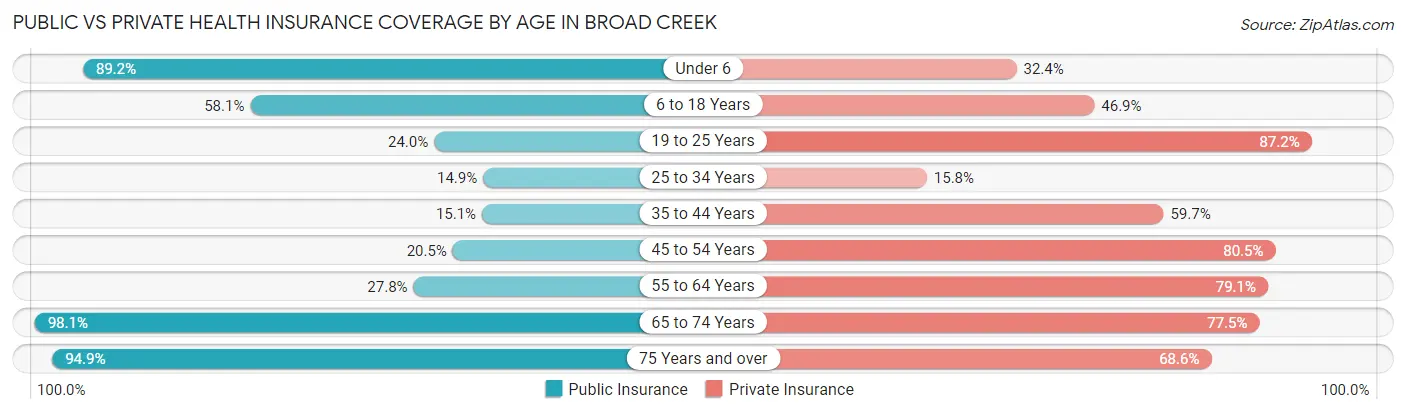
| Age Bracket | Public Insurance | Private Insurance |
| Under 6 | 99 (89.2%) | 36 (32.4%) |
| 6 to 18 Years | 186 (58.1%) | 150 (46.9%) |
| 19 to 25 Years | 30 (24.0%) | 109 (87.2%) |
| 25 to 34 Years | 17 (14.9%) | 18 (15.8%) |
| 35 to 44 Years | 21 (15.1%) | 83 (59.7%) |
| 45 to 54 Years | 61 (20.5%) | 239 (80.5%) |
| 55 to 64 Years | 113 (27.8%) | 321 (79.1%) |
| 65 to 74 Years | 314 (98.1%) | 248 (77.5%) |
| 75 Years and over | 166 (94.9%) | 120 (68.6%) |
| Total | 1,007 (50.2%) | 1,324 (66.0%) |
Disability Status by Sex by Age in Broad Creek
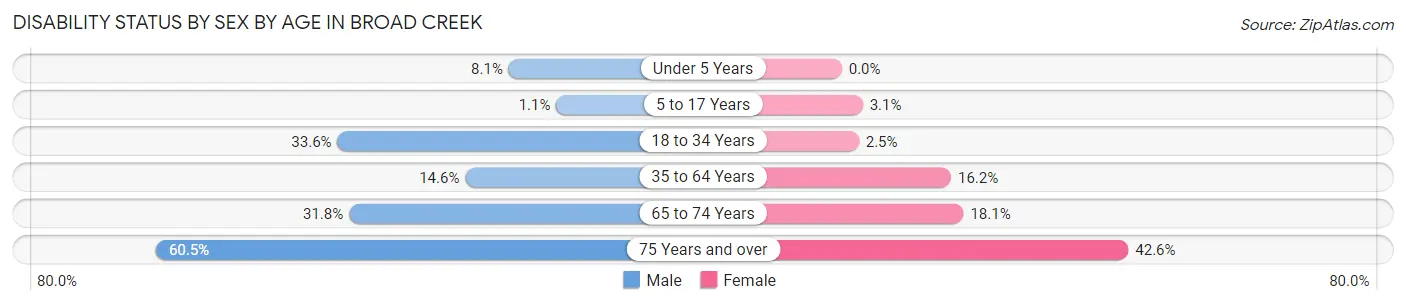
| Age Bracket | Male | Female |
| Under 5 Years | 6 (8.1%) | 0 (0.0%) |
| 5 to 17 Years | 1 (1.1%) | 6 (3.1%) |
| 18 to 34 Years | 52 (33.6%) | 3 (2.5%) |
| 35 to 64 Years | 58 (14.6%) | 72 (16.2%) |
| 65 to 74 Years | 49 (31.8%) | 30 (18.1%) |
| 75 Years and over | 49 (60.5%) | 40 (42.5%) |
Disability Class by Sex by Age in Broad Creek
Disability Class: Hearing Difficulty
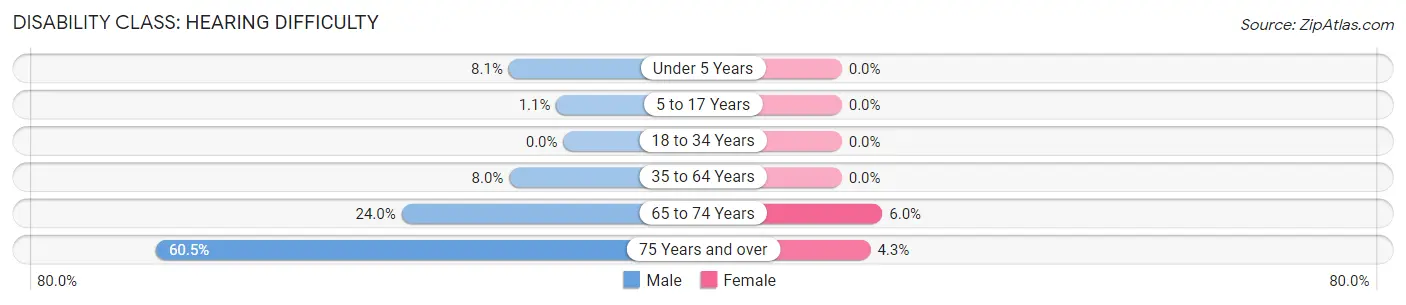
| Age Bracket | Male | Female |
| Under 5 Years | 6 (8.1%) | 0 (0.0%) |
| 5 to 17 Years | 1 (1.1%) | 0 (0.0%) |
| 18 to 34 Years | 0 (0.0%) | 0 (0.0%) |
| 35 to 64 Years | 32 (8.0%) | 0 (0.0%) |
| 65 to 74 Years | 37 (24.0%) | 10 (6.0%) |
| 75 Years and over | 49 (60.5%) | 4 (4.3%) |
Disability Class: Vision Difficulty
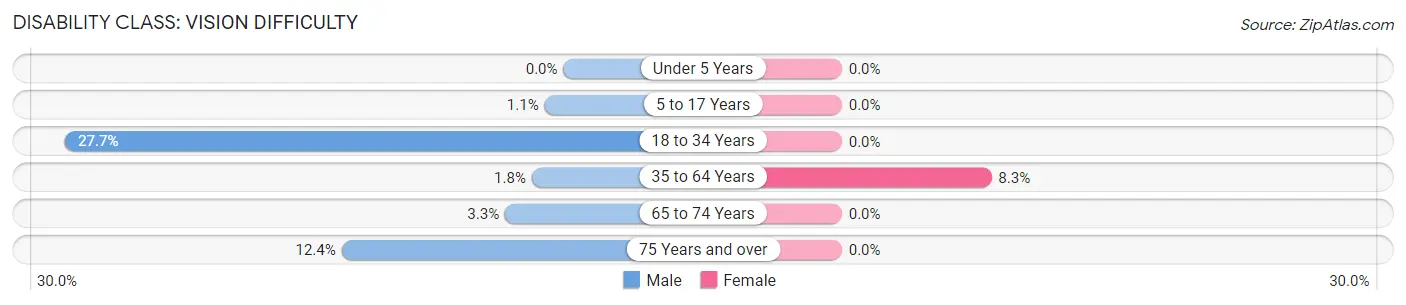
| Age Bracket | Male | Female |
| Under 5 Years | 0 (0.0%) | 0 (0.0%) |
| 5 to 17 Years | 1 (1.1%) | 0 (0.0%) |
| 18 to 34 Years | 43 (27.7%) | 0 (0.0%) |
| 35 to 64 Years | 7 (1.8%) | 37 (8.3%) |
| 65 to 74 Years | 5 (3.3%) | 0 (0.0%) |
| 75 Years and over | 10 (12.3%) | 0 (0.0%) |
Disability Class: Cognitive Difficulty
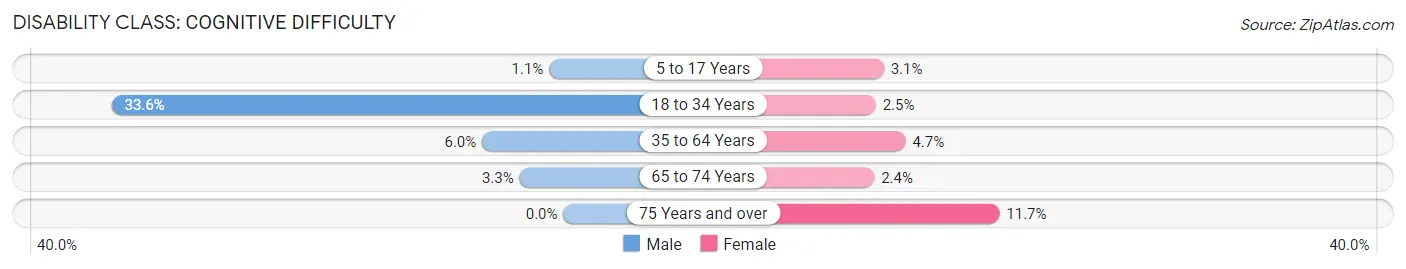
| Age Bracket | Male | Female |
| 5 to 17 Years | 1 (1.1%) | 6 (3.1%) |
| 18 to 34 Years | 52 (33.6%) | 3 (2.5%) |
| 35 to 64 Years | 24 (6.0%) | 21 (4.7%) |
| 65 to 74 Years | 5 (3.3%) | 4 (2.4%) |
| 75 Years and over | 0 (0.0%) | 11 (11.7%) |
Disability Class: Ambulatory Difficulty
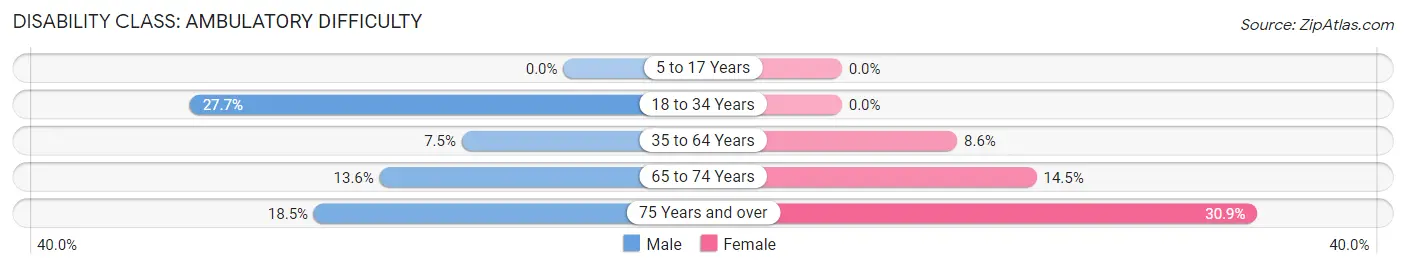
| Age Bracket | Male | Female |
| 5 to 17 Years | 0 (0.0%) | 0 (0.0%) |
| 18 to 34 Years | 43 (27.7%) | 0 (0.0%) |
| 35 to 64 Years | 30 (7.5%) | 38 (8.6%) |
| 65 to 74 Years | 21 (13.6%) | 24 (14.5%) |
| 75 Years and over | 15 (18.5%) | 29 (30.8%) |
Disability Class: Self-Care Difficulty
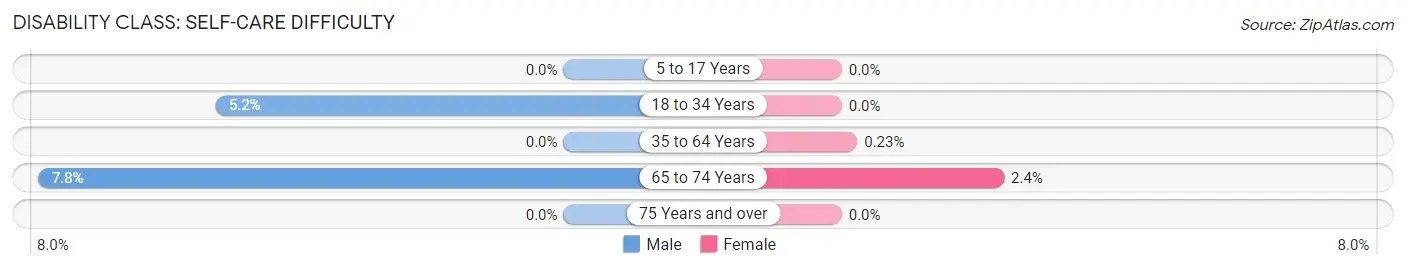
| Age Bracket | Male | Female |
| 5 to 17 Years | 0 (0.0%) | 0 (0.0%) |
| 18 to 34 Years | 8 (5.2%) | 0 (0.0%) |
| 35 to 64 Years | 0 (0.0%) | 1 (0.2%) |
| 65 to 74 Years | 12 (7.8%) | 4 (2.4%) |
| 75 Years and over | 0 (0.0%) | 0 (0.0%) |
Technology Access in Broad Creek
Computing Device Access in Broad Creek
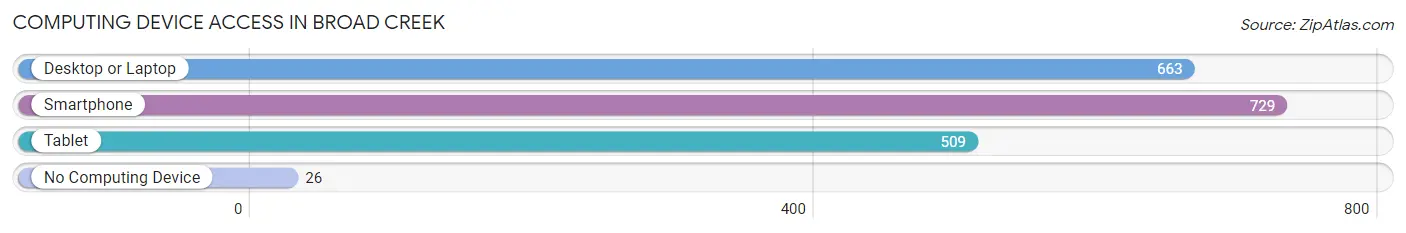
| Device Type | # Households | % Households |
| Desktop or Laptop | 663 | 83.3% |
| Smartphone | 729 | 91.6% |
| Tablet | 509 | 63.9% |
| No Computing Device | 26 | 3.3% |
| Total | 796 | 100.0% |
Internet Access in Broad Creek
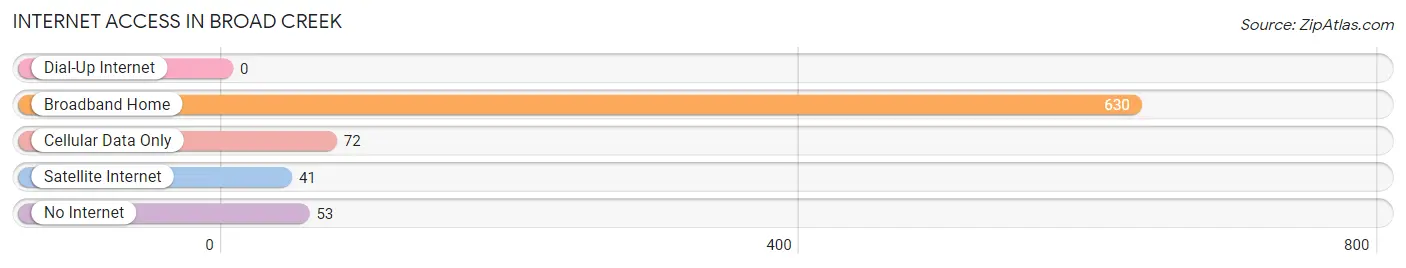
| Internet Type | # Households | % Households |
| Dial-Up Internet | 0 | 0.0% |
| Broadband Home | 630 | 79.1% |
| Cellular Data Only | 72 | 9.0% |
| Satellite Internet | 41 | 5.1% |
| No Internet | 53 | 6.7% |
| Total | 796 | 100.0% |
Broad Creek Summary
Creek, NC is a small town located in Carteret County, North Carolina. It is situated on the banks of Broad Creek, a tributary of the Neuse River. The town was founded in 1790 and has a population of approximately 1,000 people.
History
The area that is now Broad Creek was originally inhabited by the Coree Indians. The Coree were a small tribe of Native Americans who lived in the area for centuries before the arrival of Europeans. The first Europeans to settle in the area were English settlers who arrived in the late 17th century. The town of Broad Creek was officially established in 1790 and was named after the creek that runs through it.
The town was originally a small farming community, but it soon became a popular destination for tourists. The town was known for its beautiful scenery and its abundance of wildlife. In the late 19th century, the town became a popular destination for wealthy vacationers from the North.
Geography
Broad Creek is located in Carteret County, North Carolina. It is situated on the banks of Broad Creek, a tributary of the Neuse River. The town is located approximately 30 miles from the Atlantic Ocean and is surrounded by the Croatan National Forest. The town is located in a humid subtropical climate zone and experiences mild winters and hot, humid summers.
Economy
The economy of Broad Creek is largely based on tourism. The town is a popular destination for vacationers from the North and is known for its beautiful scenery and abundance of wildlife. The town also has a number of small businesses, including restaurants, shops, and lodging.
Demographics
As of the 2010 census, the population of Broad Creek was 1,000. The racial makeup of the town was 95.2% White, 2.2% African American, 0.2% Native American, 0.2% Asian, 0.2% from other races, and 1.9% from two or more races. The median household income was $37,500 and the median family income was $45,000.
Conclusion
Broad Creek, NC is a small town located in Carteret County, North Carolina. It was founded in 1790 and has a population of approximately 1,000 people. The town is known for its beautiful scenery and abundance of wildlife and is a popular destination for vacationers from the North. The economy of Broad Creek is largely based on tourism and the town has a number of small businesses. The racial makeup of the town is 95.2% White, 2.2% African American, 0.2% Native American, 0.2% Asian, 0.2% from other races, and 1.9% from two or more races. The median household income was $37,500 and the median family income was $45,000.
Common Questions
What is the Total Population of Broad Creek?
Total Population of Broad Creek is 2,013.
What is the Total Male Population of Broad Creek?
Total Male Population of Broad Creek is 963.
What is the Total Female Population of Broad Creek?
Total Female Population of Broad Creek is 1,050.
What is the Ratio of Males per 100 Females in Broad Creek?
There are 91.71 Males per 100 Females in Broad Creek.
What is the Ratio of Females per 100 Males in Broad Creek?
There are 109.03 Females per 100 Males in Broad Creek.
What is the Median Population Age in Broad Creek?
Median Population Age in Broad Creek is 50.2 Years.
What is the Average Family Size in Broad Creek
Average Family Size in Broad Creek is 2.9 People.
What is the Average Household Size in Broad Creek
Average Household Size in Broad Creek is 2.5 People.
What is Per Capita Income in Broad Creek?
Per Capita income in Broad Creek is $30,177.
What is the Median Family Income in Broad Creek?
Median Family Income in Broad Creek is $72,153.
What is the Median Household income in Broad Creek?
Median Household Income in Broad Creek is $59,500.
What is Income or Wage Gap in Broad Creek?
Income or Wage Gap in Broad Creek is 19.0%.
Women in Broad Creek earn 81.0 cents for every dollar earned by a man.
What is Inequality or Gini Index in Broad Creek?
Inequality or Gini Index in Broad Creek is 0.41.
How Large is the Labor Force in Broad Creek?
There are 895 People in the Labor Forcein in Broad Creek.
What is the Percentage of People in the Labor Force in Broad Creek?
53.4% of People are in the Labor Force in Broad Creek.
What is the Unemployment Rate in Broad Creek?
Unemployment Rate in Broad Creek is 3.9%.