Boiling Spring Lakes, NC
Boiling Spring Lakes Map
Boiling Spring Lakes Overview
6,032
TOTAL POPULATION
3,140
MALE POPULATION
2,892
FEMALE POPULATION
108.58
MALES / 100 FEMALES
92.10
FEMALES / 100 MALES
47.5
MEDIAN AGE
3.0
AVG FAMILY SIZE
2.2
AVG HOUSEHOLD SIZE
$33,068
PER CAPITA INCOME
$80,942
AVG FAMILY INCOME
$57,969
AVG HOUSEHOLD INCOME
57.6%
WAGE / INCOME GAP [ % ]
42.4¢/ $1
WAGE / INCOME GAP [ $ ]
0.43
INEQUALITY / GINI INDEX
2,921
LABOR FORCE [ PEOPLE ]
56.8%
PERCENT IN LABOR FORCE
6.2%
UNEMPLOYMENT RATE
Boiling Spring Lakes Area Codes
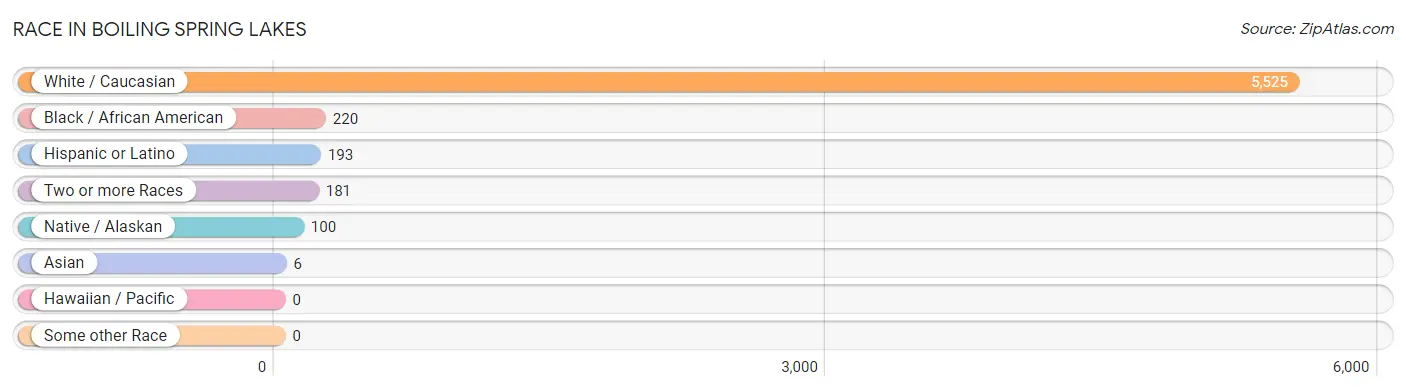
Race in Boiling Spring Lakes
The most populous races in Boiling Spring Lakes are White / Caucasian (5,525 | 91.6%), Black / African American (220 | 3.6%), and Hispanic or Latino (193 | 3.2%).
| Race | # Population | % Population |
| Asian | 6 | 0.1% |
| Black / African American | 220 | 3.6% |
| Hawaiian / Pacific | 0 | 0.0% |
| Hispanic or Latino | 193 | 3.2% |
| Native / Alaskan | 100 | 1.7% |
| White / Caucasian | 5,525 | 91.6% |
| Two or more Races | 181 | 3.0% |
| Some other Race | 0 | 0.0% |
| Total | 6,032 | 100.0% |
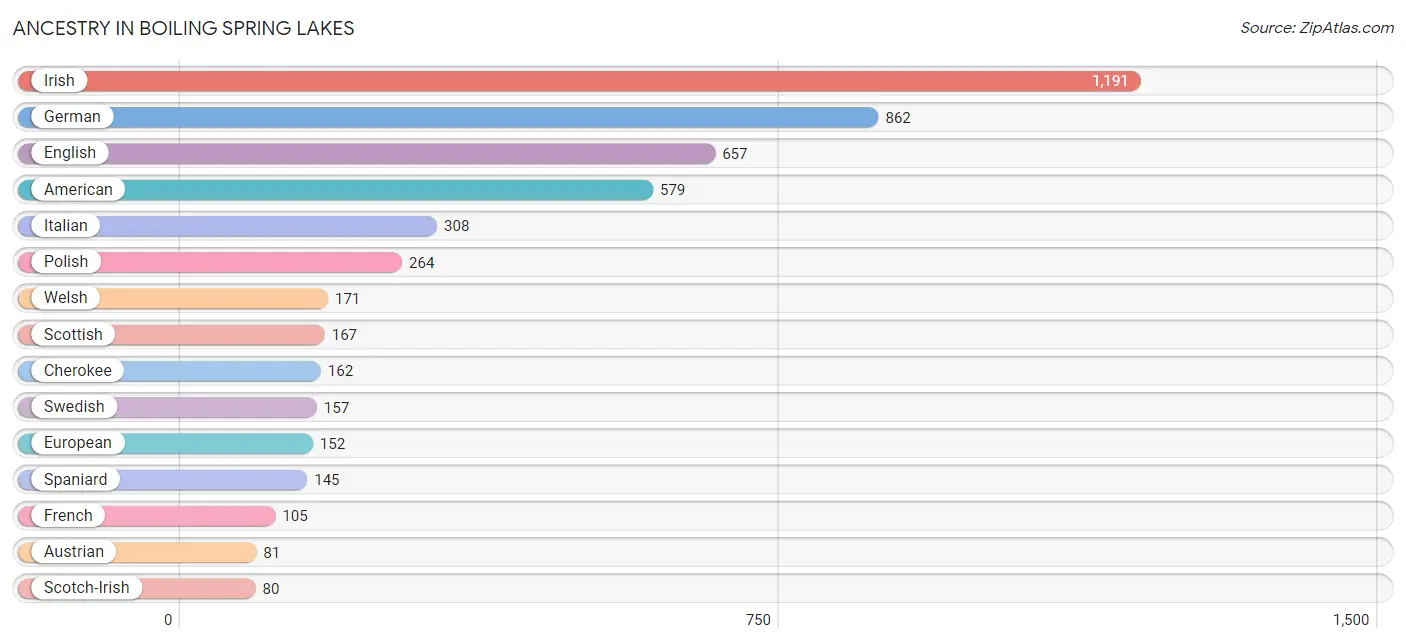
Ancestry in Boiling Spring Lakes
The most populous ancestries reported in Boiling Spring Lakes are Irish (1,191 | 19.7%), German (862 | 14.3%), English (657 | 10.9%), American (579 | 9.6%), and Italian (308 | 5.1%), together accounting for 59.6% of all Boiling Spring Lakes residents.
| Ancestry | # Population | % Population |
| African | 1 | 0.0% |
| American | 579 | 9.6% |
| Austrian | 81 | 1.3% |
| Bhutanese | 4 | 0.1% |
| British | 28 | 0.5% |
| Canadian | 23 | 0.4% |
| Cherokee | 162 | 2.7% |
| Chickasaw | 25 | 0.4% |
| Choctaw | 25 | 0.4% |
| Cuban | 15 | 0.3% |
| Danish | 51 | 0.9% |
| Dutch | 57 | 0.9% |
| Eastern European | 8 | 0.1% |
| English | 657 | 10.9% |
| European | 152 | 2.5% |
| French | 105 | 1.7% |
| French Canadian | 14 | 0.2% |
| German | 862 | 14.3% |
| Greek | 22 | 0.4% |
| Hungarian | 70 | 1.2% |
| Irish | 1,191 | 19.7% |
| Italian | 308 | 5.1% |
| Korean | 15 | 0.3% |
| Lithuanian | 18 | 0.3% |
| Norwegian | 55 | 0.9% |
| Polish | 264 | 4.4% |
| Puerto Rican | 33 | 0.5% |
| Russian | 22 | 0.4% |
| Scotch-Irish | 80 | 1.3% |
| Scottish | 167 | 2.8% |
| Spaniard | 145 | 2.4% |
| Subsaharan African | 1 | 0.0% |
| Swedish | 157 | 2.6% |
| Turkish | 14 | 0.2% |
| Welsh | 171 | 2.8% | View All 35 Rows |
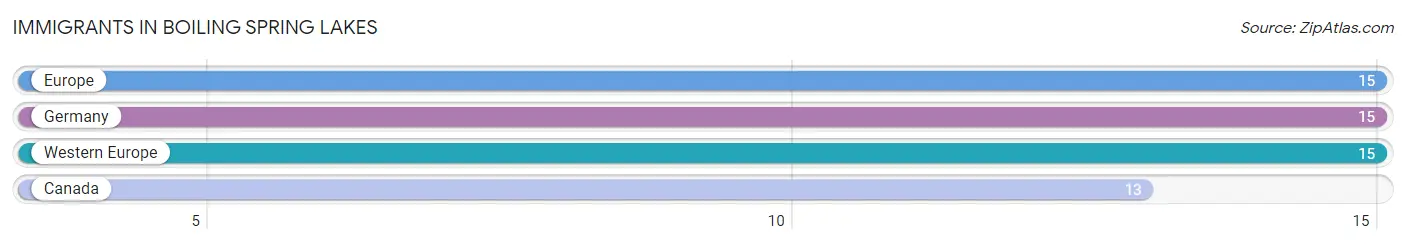
Immigrants in Boiling Spring Lakes
The most numerous immigrant groups reported in Boiling Spring Lakes came from Europe (15 | 0.3%), Germany (15 | 0.3%), Western Europe (15 | 0.3%), and Canada (13 | 0.2%), together accounting for 1.0% of all Boiling Spring Lakes residents.
| Immigration Origin | # Population | % Population |
| Canada | 13 | 0.2% |
| Europe | 15 | 0.3% |
| Germany | 15 | 0.3% |
| Western Europe | 15 | 0.3% | View All 4 Rows |
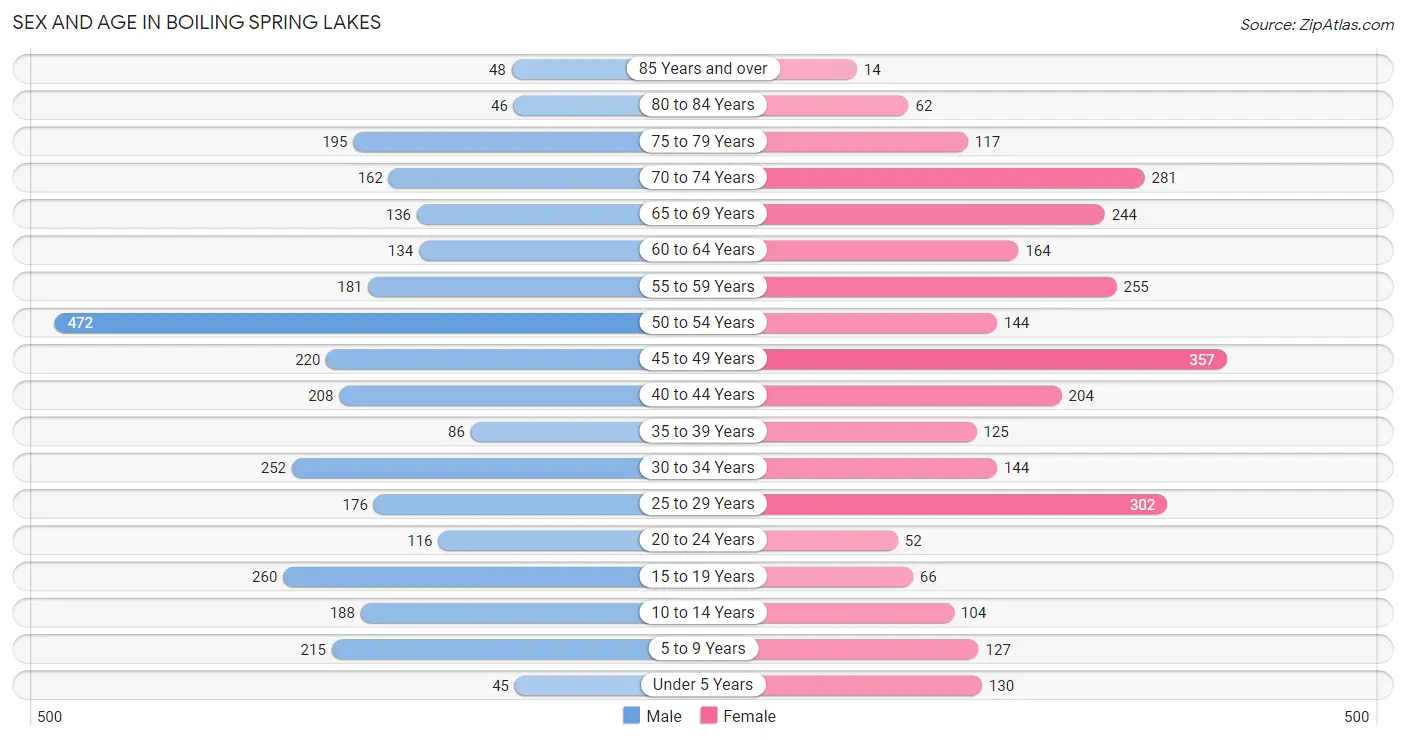
Sex and Age in Boiling Spring Lakes
Sex and Age in Boiling Spring Lakes
The most populous age groups in Boiling Spring Lakes are 50 to 54 Years (472 | 15.0%) for men and 45 to 49 Years (357 | 12.3%) for women.
| Age Bracket | Male | Female |
| Under 5 Years | 45 (1.4%) | 130 (4.5%) |
| 5 to 9 Years | 215 (6.9%) | 127 (4.4%) |
| 10 to 14 Years | 188 (6.0%) | 104 (3.6%) |
| 15 to 19 Years | 260 (8.3%) | 66 (2.3%) |
| 20 to 24 Years | 116 (3.7%) | 52 (1.8%) |
| 25 to 29 Years | 176 (5.6%) | 302 (10.4%) |
| 30 to 34 Years | 252 (8.0%) | 144 (5.0%) |
| 35 to 39 Years | 86 (2.7%) | 125 (4.3%) |
| 40 to 44 Years | 208 (6.6%) | 204 (7.0%) |
| 45 to 49 Years | 220 (7.0%) | 357 (12.3%) |
| 50 to 54 Years | 472 (15.0%) | 144 (5.0%) |
| 55 to 59 Years | 181 (5.8%) | 255 (8.8%) |
| 60 to 64 Years | 134 (4.3%) | 164 (5.7%) |
| 65 to 69 Years | 136 (4.3%) | 244 (8.4%) |
| 70 to 74 Years | 162 (5.2%) | 281 (9.7%) |
| 75 to 79 Years | 195 (6.2%) | 117 (4.1%) |
| 80 to 84 Years | 46 (1.5%) | 62 (2.1%) |
| 85 Years and over | 48 (1.5%) | 14 (0.5%) |
| Total | 3,140 (100.0%) | 2,892 (100.0%) |
Families and Households in Boiling Spring Lakes
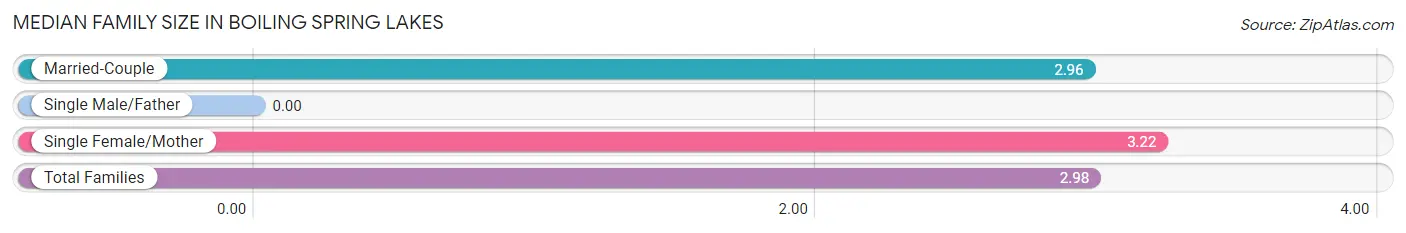
Median Family Size in Boiling Spring Lakes
| Family Type | # Families | Family Size |
| Married-Couple | 1,427 (91.9%) | 2.96 |
| Single Male/Father | 0 (0.0%) | - |
| Single Female/Mother | 126 (8.1%) | 3.22 |
| Total Families | 1,553 (100.0%) | 2.98 |
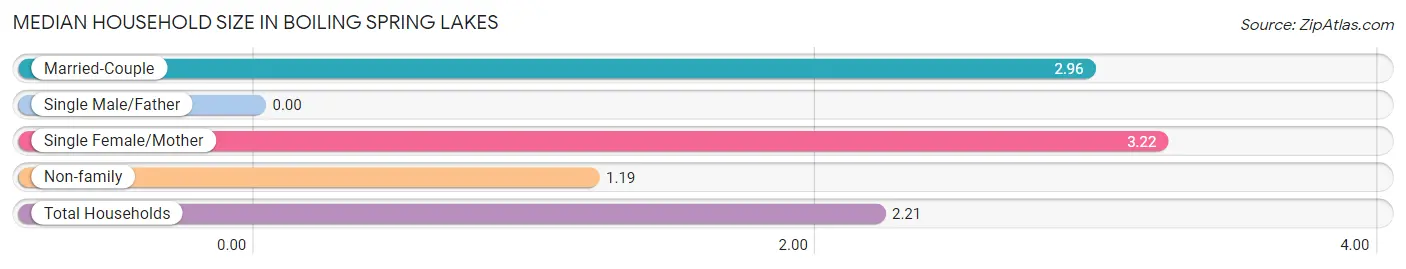
Median Household Size in Boiling Spring Lakes
| Household Type | # Households | Household Size |
| Married-Couple | 1,427 (52.4%) | 2.96 |
| Single Male/Father | 0 (0.0%) | - |
| Single Female/Mother | 126 (4.6%) | 3.22 |
| Non-family | 1,171 (43.0%) | 1.19 |
| Total Households | 2,724 (100.0%) | 2.21 |
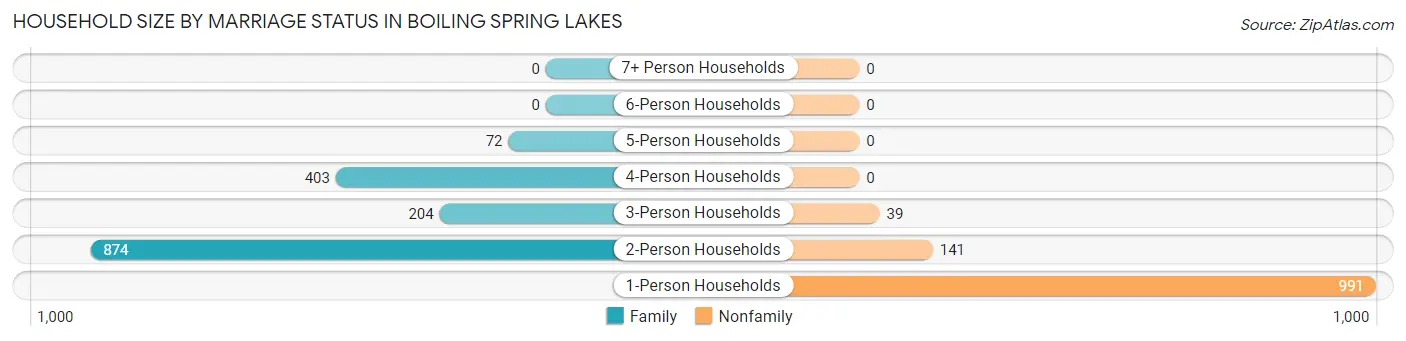
Household Size by Marriage Status in Boiling Spring Lakes
Out of a total of 2,724 households in Boiling Spring Lakes, 1,553 (57.0%) are family households, while 1,171 (43.0%) are nonfamily households. The most numerous type of family households are 2-person households, comprising 874, and the most common type of nonfamily households are 1-person households, comprising 991.
| Household Size | Family Households | Nonfamily Households |
| 1-Person Households | - | 991 (36.4%) |
| 2-Person Households | 874 (32.1%) | 141 (5.2%) |
| 3-Person Households | 204 (7.5%) | 39 (1.4%) |
| 4-Person Households | 403 (14.8%) | 0 (0.0%) |
| 5-Person Households | 72 (2.6%) | 0 (0.0%) |
| 6-Person Households | 0 (0.0%) | 0 (0.0%) |
| 7+ Person Households | 0 (0.0%) | 0 (0.0%) |
| Total | 1,553 (57.0%) | 1,171 (43.0%) |
Female Fertility in Boiling Spring Lakes
Fertility by Age in Boiling Spring Lakes
Average fertility rate in Boiling Spring Lakes is 48.0 births per 1,000 women. Women in the age bracket of 20 to 34 years have the highest fertility rate with 54.0 births per 1,000 women. Women in the age bracket of 35 to 50 years acount for 55.0% of all women with births.
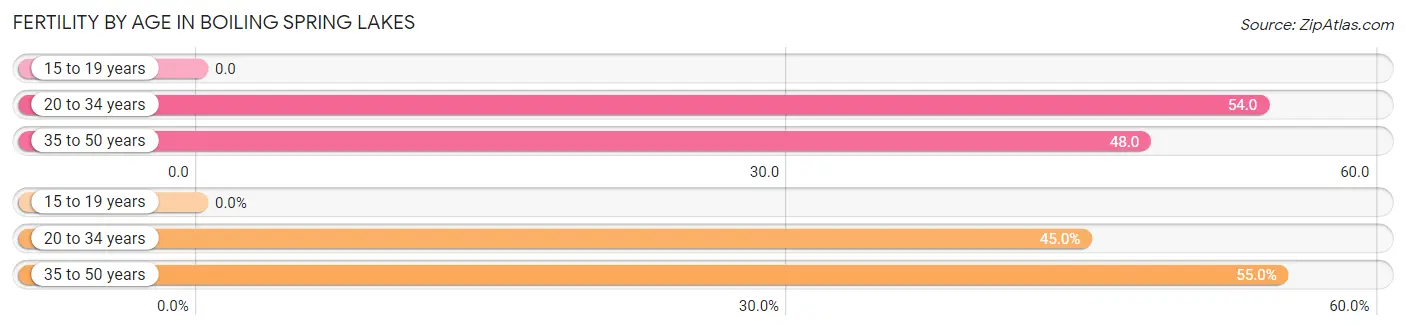
| Age Bracket | Women with Births | Births / 1,000 Women |
| 15 to 19 years | 0 (0.0%) | 0.0 |
| 20 to 34 years | 27 (45.0%) | 54.0 |
| 35 to 50 years | 33 (55.0%) | 48.0 |
| Total | 60 (100.0%) | 48.0 |
Fertility by Age by Marriage Status in Boiling Spring Lakes
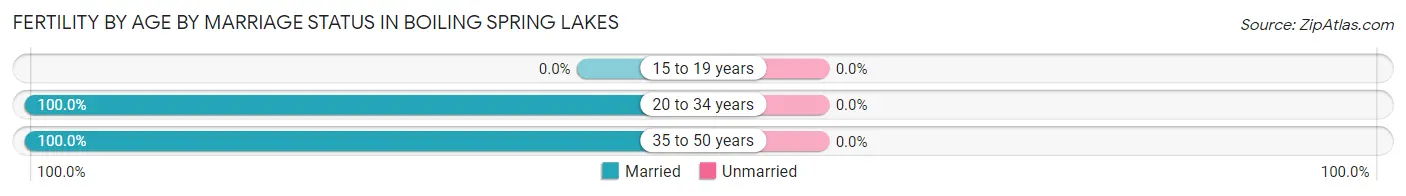
| Age Bracket | Married | Unmarried |
| 15 to 19 years | 0 (0.0%) | 0 (0.0%) |
| 20 to 34 years | 27 (100.0%) | 0 (0.0%) |
| 35 to 50 years | 33 (100.0%) | 0 (0.0%) |
| Total | 60 (100.0%) | 0 (0.0%) |
Fertility by Education in Boiling Spring Lakes
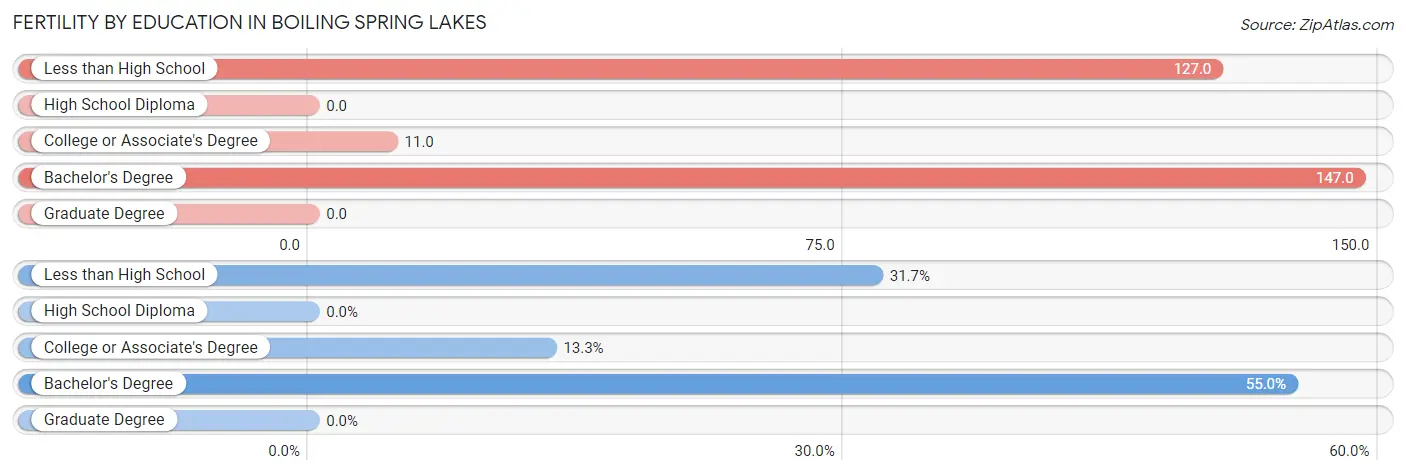
| Educational Attainment | Women with Births | Births / 1,000 Women |
| Less than High School | 19 (31.7%) | 127.0 |
| High School Diploma | 0 (0.0%) | 0.0 |
| College or Associate's Degree | 8 (13.3%) | 11.0 |
| Bachelor's Degree | 33 (55.0%) | 147.0 |
| Graduate Degree | 0 (0.0%) | 0.0 |
| Total | 60 (100.0%) | 48.0 |
Fertility by Education by Marriage Status in Boiling Spring Lakes
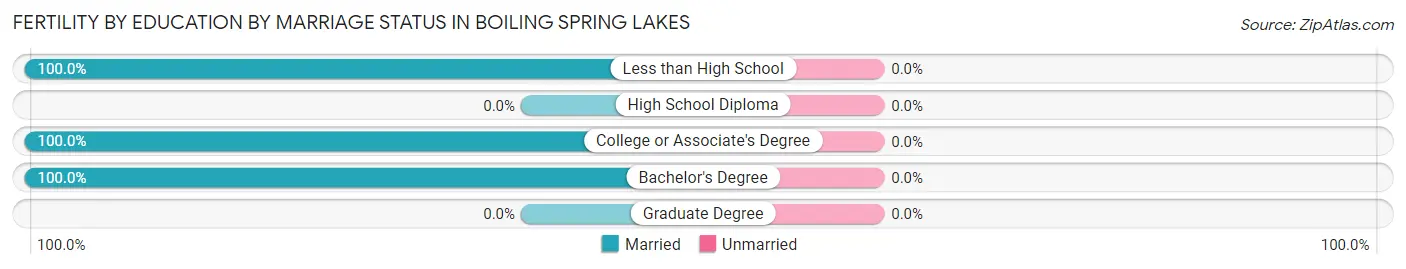
| Educational Attainment | Married | Unmarried |
| Less than High School | 19 (100.0%) | 0 (0.0%) |
| High School Diploma | 0 (0.0%) | 0 (0.0%) |
| College or Associate's Degree | 8 (100.0%) | 0 (0.0%) |
| Bachelor's Degree | 33 (100.0%) | 0 (0.0%) |
| Graduate Degree | 0 (0.0%) | 0 (0.0%) |
| Total | 60 (100.0%) | 0 (0.0%) |
Income in Boiling Spring Lakes
Income Overview in Boiling Spring Lakes
Per Capita Income in Boiling Spring Lakes is $33,068, while median incomes of families and households are $80,942 and $57,969 respectively.
| Characteristic | Number | Measure |
| Per Capita Income | 6,032 | $33,068 |
| Median Family Income | 1,553 | $80,942 |
| Mean Family Income | 1,553 | $93,700 |
| Median Household Income | 2,724 | $57,969 |
| Mean Household Income | 2,724 | $68,754 |
| Income Deficit | 1,553 | $0 |
| Wage / Income Gap (%) | 6,032 | 57.61% |
| Wage / Income Gap ($) | 6,032 | 42.39¢ per $1 |
| Gini / Inequality Index | 6,032 | 0.43 |
Earnings by Sex in Boiling Spring Lakes
Average Earnings in Boiling Spring Lakes are $44,239, $58,463 for men and $24,785 for women, a difference of 57.6%.
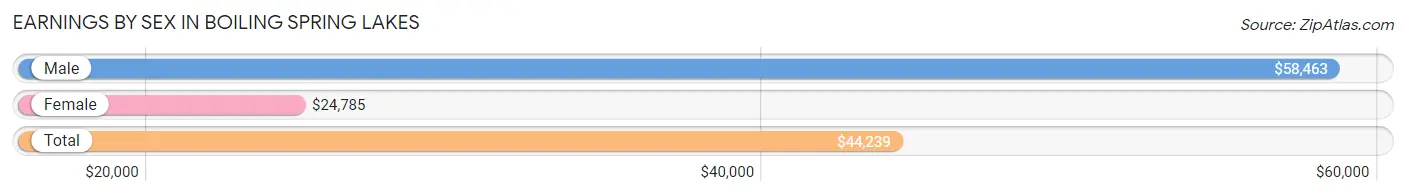
| Sex | Number | Average Earnings |
| Male | 1,633 (52.3%) | $58,463 |
| Female | 1,491 (47.7%) | $24,785 |
| Total | 3,124 (100.0%) | $44,239 |
Earnings by Sex by Income Bracket in Boiling Spring Lakes
The most common earnings brackets in Boiling Spring Lakes are $55,000 to $64,999 for men (277 | 17.0%) and $22,500 to $24,999 for women (157 | 10.5%).
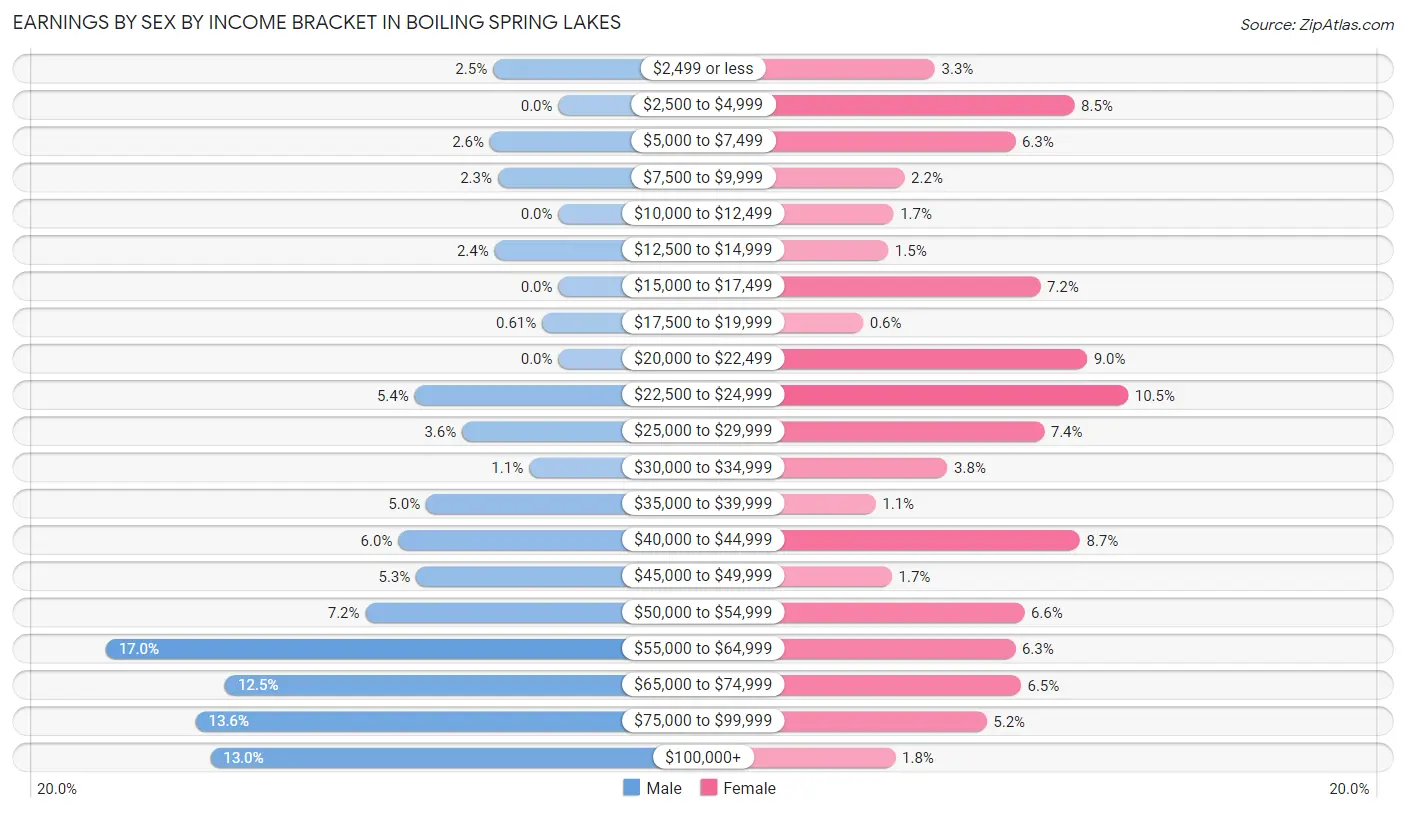
| Income | Male | Female |
| $2,499 or less | 40 (2.5%) | 49 (3.3%) |
| $2,500 to $4,999 | 0 (0.0%) | 127 (8.5%) |
| $5,000 to $7,499 | 42 (2.6%) | 94 (6.3%) |
| $7,500 to $9,999 | 37 (2.3%) | 32 (2.1%) |
| $10,000 to $12,499 | 0 (0.0%) | 26 (1.7%) |
| $12,500 to $14,999 | 39 (2.4%) | 23 (1.5%) |
| $15,000 to $17,499 | 0 (0.0%) | 108 (7.2%) |
| $17,500 to $19,999 | 10 (0.6%) | 9 (0.6%) |
| $20,000 to $22,499 | 0 (0.0%) | 134 (9.0%) |
| $22,500 to $24,999 | 88 (5.4%) | 157 (10.5%) |
| $25,000 to $29,999 | 59 (3.6%) | 110 (7.4%) |
| $30,000 to $34,999 | 18 (1.1%) | 56 (3.8%) |
| $35,000 to $39,999 | 81 (5.0%) | 16 (1.1%) |
| $40,000 to $44,999 | 98 (6.0%) | 130 (8.7%) |
| $45,000 to $49,999 | 87 (5.3%) | 25 (1.7%) |
| $50,000 to $54,999 | 118 (7.2%) | 99 (6.6%) |
| $55,000 to $64,999 | 277 (17.0%) | 94 (6.3%) |
| $65,000 to $74,999 | 204 (12.5%) | 97 (6.5%) |
| $75,000 to $99,999 | 222 (13.6%) | 78 (5.2%) |
| $100,000+ | 213 (13.0%) | 27 (1.8%) |
| Total | 1,633 (100.0%) | 1,491 (100.0%) |
Earnings by Sex by Educational Attainment in Boiling Spring Lakes
Average earnings in Boiling Spring Lakes are $60,404 for men and $25,585 for women, a difference of 57.6%. Men with an educational attainment of bachelor's degree enjoy the highest average annual earnings of $99,107, while those with college or associate's degree education earn the least with $59,125. Women with an educational attainment of high school diploma earn the most with the average annual earnings of $54,688, while those with college or associate's degree education have the smallest earnings of $23,545.
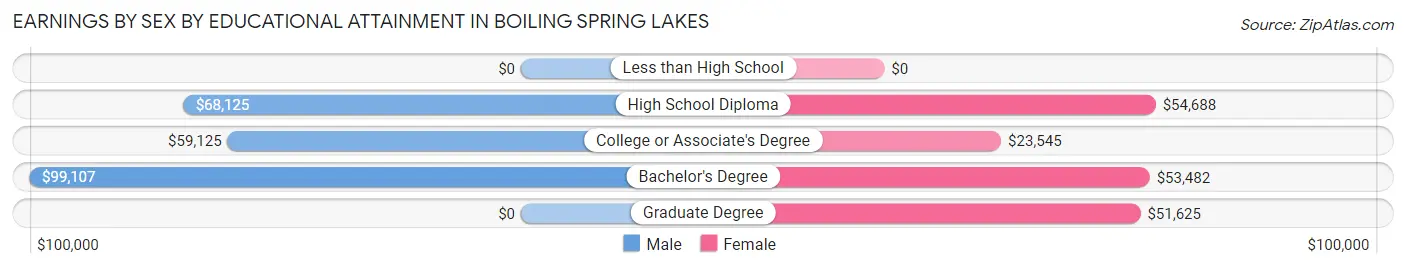
| Educational Attainment | Male Income | Female Income |
| Less than High School | - | - |
| High School Diploma | $68,125 | $54,688 |
| College or Associate's Degree | $59,125 | $23,545 |
| Bachelor's Degree | $99,107 | $53,482 |
| Graduate Degree | - | - |
| Total | $60,404 | $25,585 |
Family Income in Boiling Spring Lakes
Family Income Brackets in Boiling Spring Lakes
According to the Boiling Spring Lakes family income data, there are 388 families falling into the $100,000 to $149,999 income range, which is the most common income bracket and makes up 25.0% of all families.
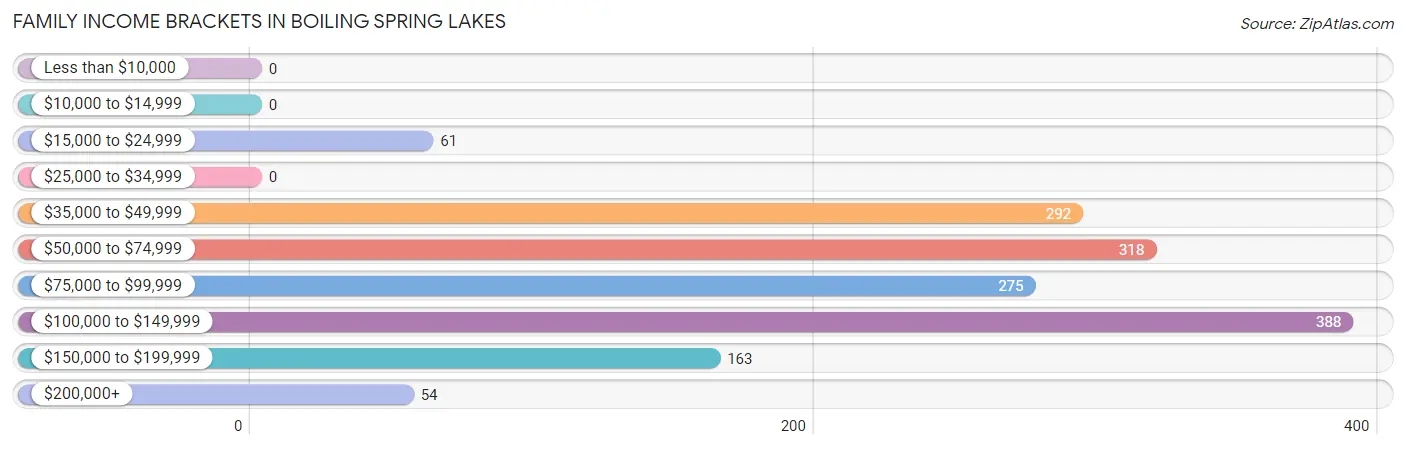
| Income Bracket | # Families | % Families |
| Less than $10,000 | 0 | 0.0% |
| $10,000 to $14,999 | 0 | 0.0% |
| $15,000 to $24,999 | 61 | 3.9% |
| $25,000 to $34,999 | 0 | 0.0% |
| $35,000 to $49,999 | 292 | 18.8% |
| $50,000 to $74,999 | 318 | 20.5% |
| $75,000 to $99,999 | 275 | 17.7% |
| $100,000 to $149,999 | 388 | 25.0% |
| $150,000 to $199,999 | 163 | 10.5% |
| $200,000+ | 54 | 3.5% |
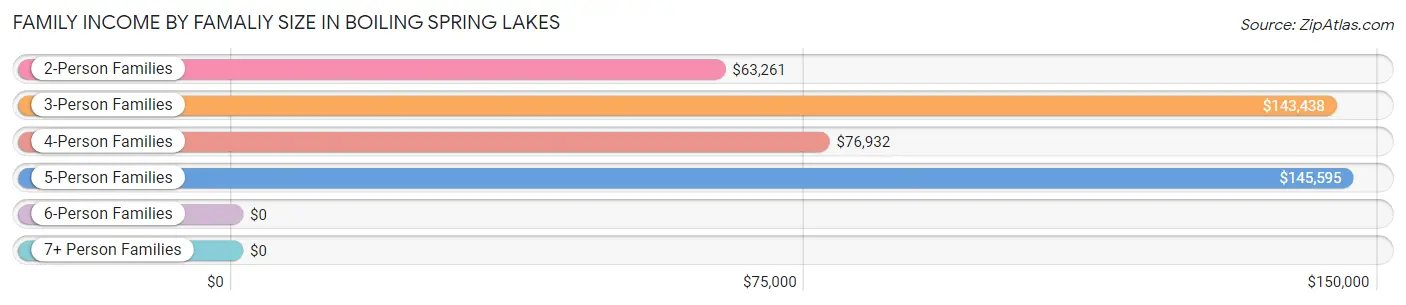
Family Income by Famaliy Size in Boiling Spring Lakes
5-person families (72 | 4.6%) account for the highest median family income in Boiling Spring Lakes with $145,595 per family, while 3-person families (204 | 13.1%) have the highest median income of $47,813 per family member.
| Income Bracket | # Families | Median Income |
| 2-Person Families | 874 (56.3%) | $63,261 |
| 3-Person Families | 204 (13.1%) | $143,438 |
| 4-Person Families | 403 (26.0%) | $76,932 |
| 5-Person Families | 72 (4.6%) | $145,595 |
| 6-Person Families | 0 (0.0%) | $0 |
| 7+ Person Families | 0 (0.0%) | $0 |
| Total | 1,553 (100.0%) | $80,942 |
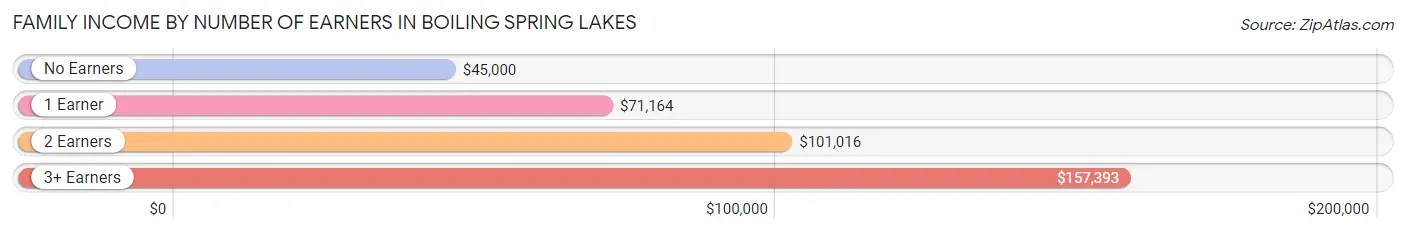
Family Income by Number of Earners in Boiling Spring Lakes
The median family income in Boiling Spring Lakes is $80,942, with families comprising 3+ earners (157) having the highest median family income of $157,393, while families with no earners (334) have the lowest median family income of $45,000, accounting for 10.1% and 21.5% of families, respectively.
| Number of Earners | # Families | Median Income |
| No Earners | 334 (21.5%) | $45,000 |
| 1 Earner | 468 (30.1%) | $71,164 |
| 2 Earners | 594 (38.3%) | $101,016 |
| 3+ Earners | 157 (10.1%) | $157,393 |
| Total | 1,553 (100.0%) | $80,942 |
Household Income in Boiling Spring Lakes
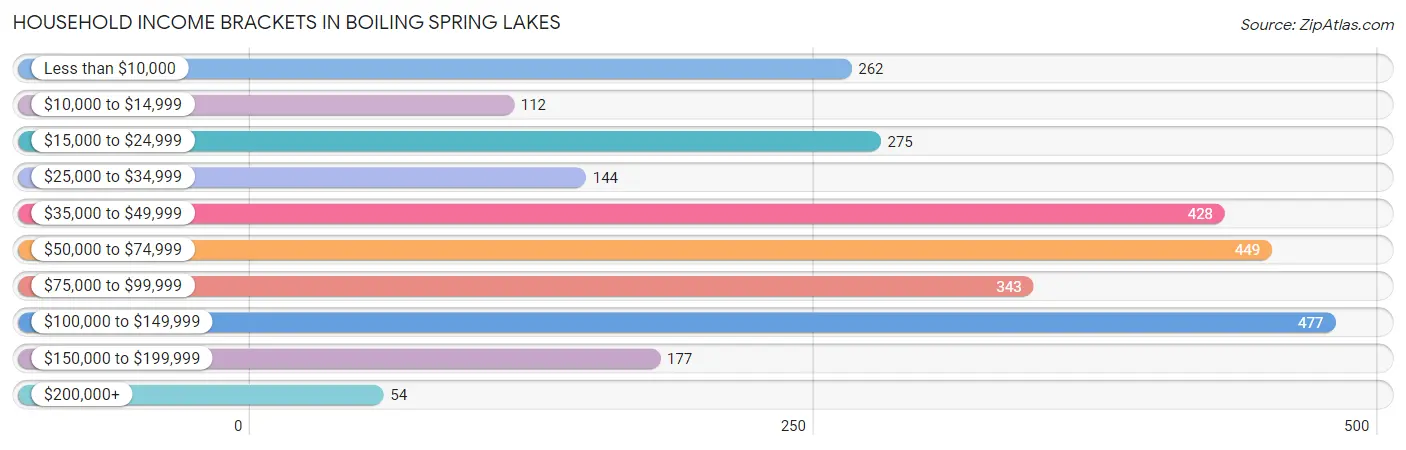
Household Income Brackets in Boiling Spring Lakes
With 477 households falling in the category, the $100,000 to $149,999 income range is the most frequent in Boiling Spring Lakes, accounting for 17.5% of all households. In contrast, only 54 households (2.0%) fall into the $200,000+ income bracket, making it the least populous group.
| Income Bracket | # Households | % Households |
| Less than $10,000 | 262 | 9.6% |
| $10,000 to $14,999 | 112 | 4.1% |
| $15,000 to $24,999 | 275 | 10.1% |
| $25,000 to $34,999 | 144 | 5.3% |
| $35,000 to $49,999 | 428 | 15.7% |
| $50,000 to $74,999 | 449 | 16.5% |
| $75,000 to $99,999 | 343 | 12.6% |
| $100,000 to $149,999 | 477 | 17.5% |
| $150,000 to $199,999 | 177 | 6.5% |
| $200,000+ | 54 | 2.0% |
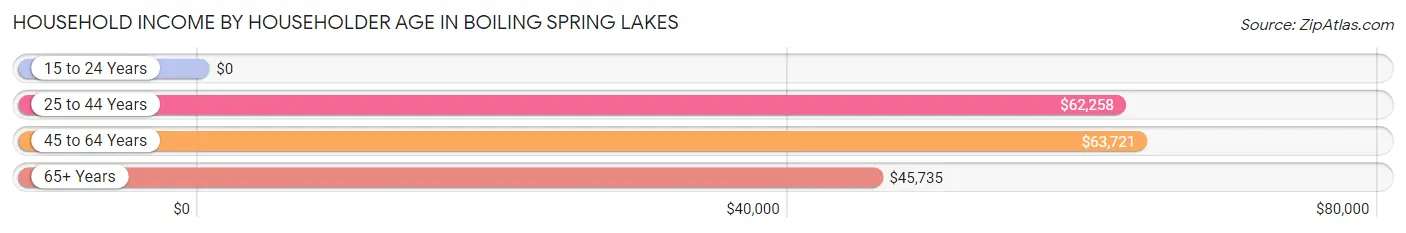
Household Income by Householder Age in Boiling Spring Lakes
The median household income in Boiling Spring Lakes is $57,969, with the highest median household income of $63,721 found in the 45 to 64 years age bracket for the primary householder. A total of 1,172 households (43.0%) fall into this category. Meanwhile, the 15 to 24 years age bracket for the primary householder has the lowest median household income of $0, with 24 households (0.9%) in this group.
| Income Bracket | # Households | Median Income |
| 15 to 24 Years | 24 (0.9%) | $0 |
| 25 to 44 Years | 726 (26.7%) | $62,258 |
| 45 to 64 Years | 1,172 (43.0%) | $63,721 |
| 65+ Years | 802 (29.4%) | $45,735 |
| Total | 2,724 (100.0%) | $57,969 |
Poverty in Boiling Spring Lakes
Income Below Poverty by Sex and Age in Boiling Spring Lakes
With 9.5% poverty level for males and 6.5% for females among the residents of Boiling Spring Lakes, 45 to 54 year old males and 55 to 64 year old females are the most vulnerable to poverty, with 226 males (32.7%) and 100 females (23.9%) in their respective age groups living below the poverty level.
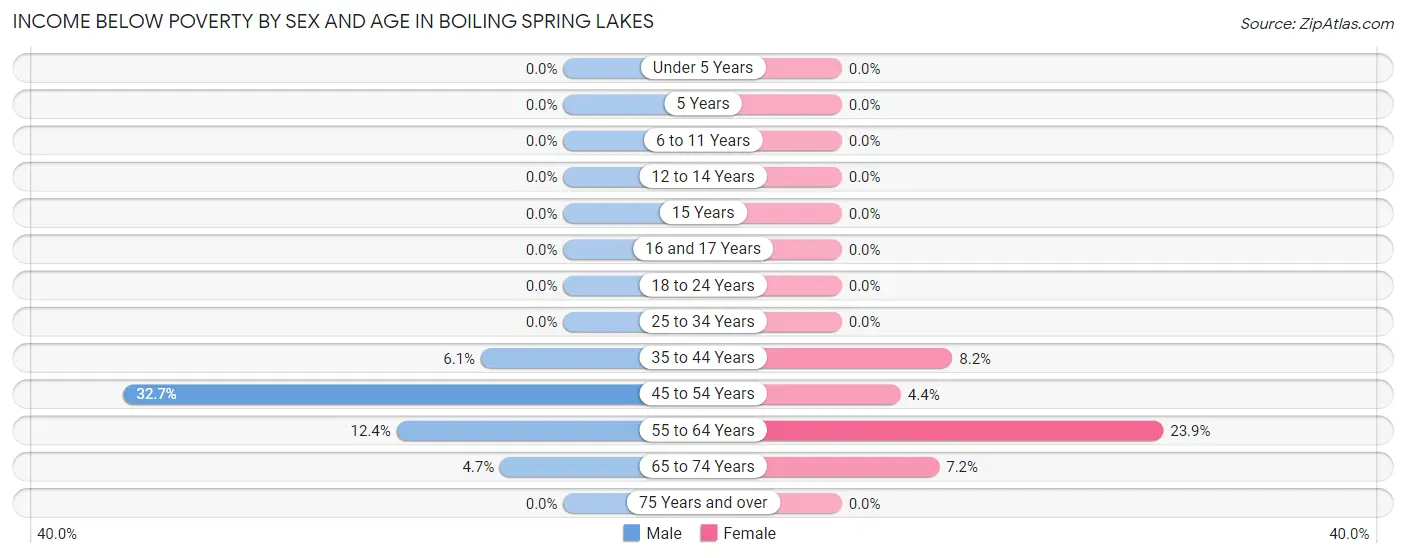
| Age Bracket | Male | Female |
| Under 5 Years | 0 (0.0%) | 0 (0.0%) |
| 5 Years | 0 (0.0%) | 0 (0.0%) |
| 6 to 11 Years | 0 (0.0%) | 0 (0.0%) |
| 12 to 14 Years | 0 (0.0%) | 0 (0.0%) |
| 15 Years | 0 (0.0%) | 0 (0.0%) |
| 16 and 17 Years | 0 (0.0%) | 0 (0.0%) |
| 18 to 24 Years | 0 (0.0%) | 0 (0.0%) |
| 25 to 34 Years | 0 (0.0%) | 0 (0.0%) |
| 35 to 44 Years | 18 (6.1%) | 27 (8.2%) |
| 45 to 54 Years | 226 (32.7%) | 22 (4.4%) |
| 55 to 64 Years | 39 (12.4%) | 100 (23.9%) |
| 65 to 74 Years | 14 (4.7%) | 38 (7.2%) |
| 75 Years and over | 0 (0.0%) | 0 (0.0%) |
| Total | 297 (9.5%) | 187 (6.5%) |
Income Above Poverty by Sex and Age in Boiling Spring Lakes
According to the poverty statistics in Boiling Spring Lakes, males aged under 5 years and females aged under 5 years are the age groups that are most secure financially, with 100.0% of males and 100.0% of females in these age groups living above the poverty line.
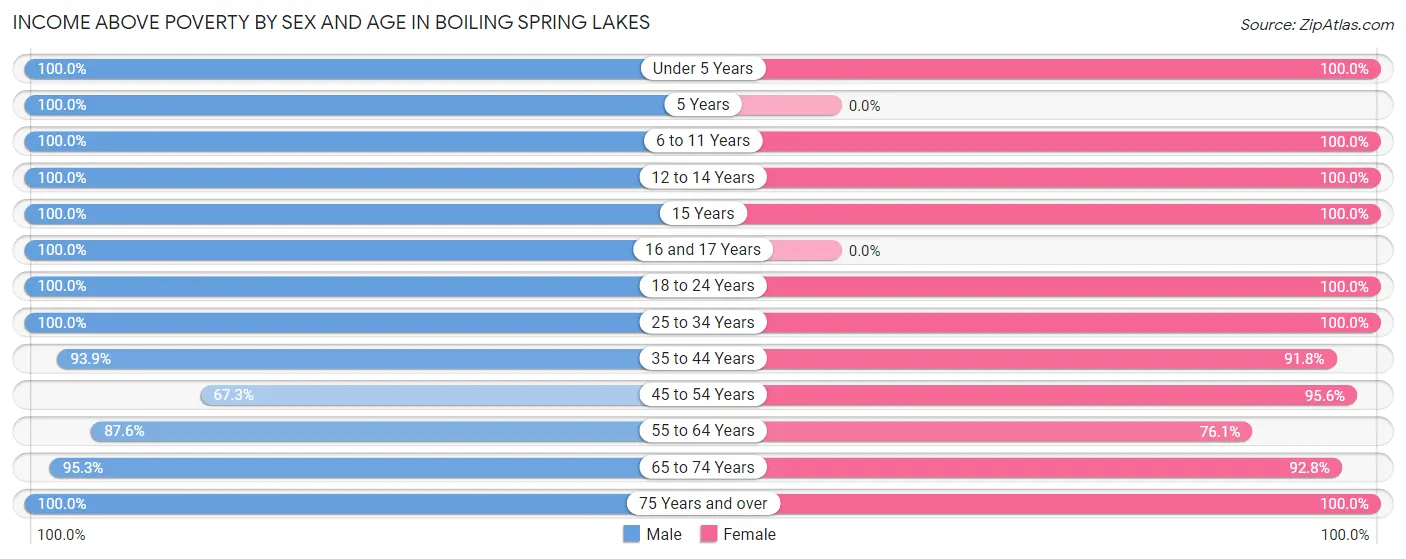
| Age Bracket | Male | Female |
| Under 5 Years | 45 (100.0%) | 130 (100.0%) |
| 5 Years | 39 (100.0%) | 0 (0.0%) |
| 6 to 11 Years | 174 (100.0%) | 150 (100.0%) |
| 12 to 14 Years | 166 (100.0%) | 68 (100.0%) |
| 15 Years | 37 (100.0%) | 43 (100.0%) |
| 16 and 17 Years | 136 (100.0%) | 0 (0.0%) |
| 18 to 24 Years | 202 (100.0%) | 75 (100.0%) |
| 25 to 34 Years | 428 (100.0%) | 446 (100.0%) |
| 35 to 44 Years | 276 (93.9%) | 302 (91.8%) |
| 45 to 54 Years | 466 (67.3%) | 479 (95.6%) |
| 55 to 64 Years | 276 (87.6%) | 319 (76.1%) |
| 65 to 74 Years | 284 (95.3%) | 487 (92.8%) |
| 75 Years and over | 289 (100.0%) | 193 (100.0%) |
| Total | 2,818 (90.5%) | 2,692 (93.5%) |
Income Below Poverty Among Married-Couple Families in Boiling Spring Lakes
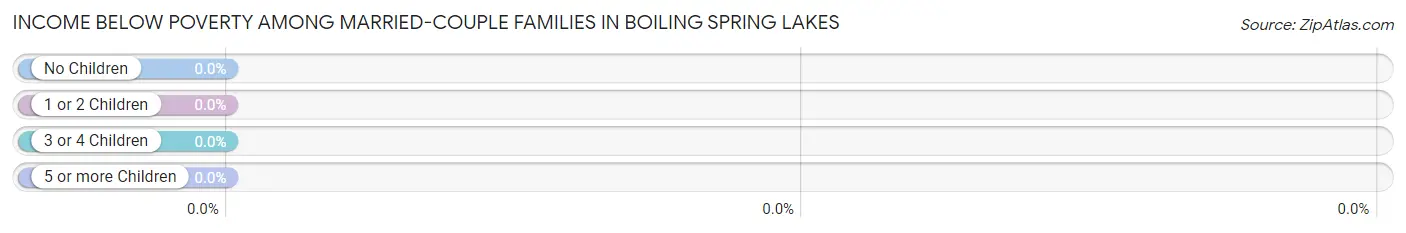
| Children | Above Poverty | Below Poverty |
| No Children | 933 (100.0%) | 0 (0.0%) |
| 1 or 2 Children | 452 (100.0%) | 0 (0.0%) |
| 3 or 4 Children | 42 (100.0%) | 0 (0.0%) |
| 5 or more Children | 0 (0.0%) | 0 (0.0%) |
| Total | 1,427 (100.0%) | 0 (0.0%) |
Income Below Poverty Among Single-Parent Households in Boiling Spring Lakes
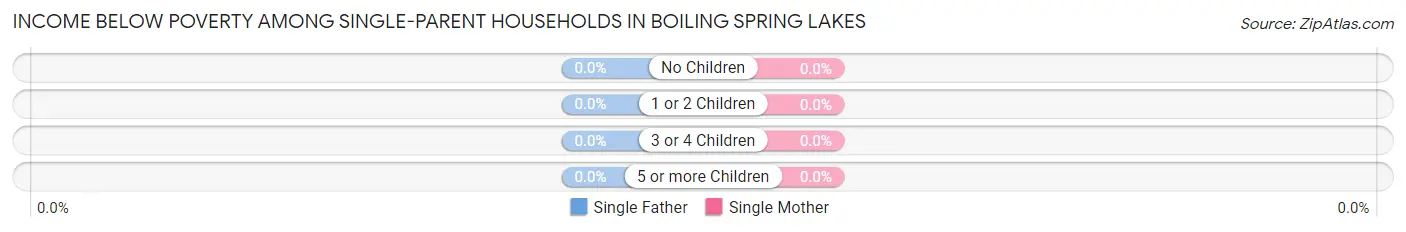
| Children | Single Father | Single Mother |
| No Children | 0 (0.0%) | 0 (0.0%) |
| 1 or 2 Children | 0 (0.0%) | 0 (0.0%) |
| 3 or 4 Children | 0 (0.0%) | 0 (0.0%) |
| 5 or more Children | 0 (0.0%) | 0 (0.0%) |
| Total | 0 (0.0%) | 0 (0.0%) |
Income Below Poverty Among Married-Couple vs Single-Parent Households in Boiling Spring Lakes
| Children | Married-Couple Families | Single-Parent Households |
| No Children | 0 (0.0%) | 0 (0.0%) |
| 1 or 2 Children | 0 (0.0%) | 0 (0.0%) |
| 3 or 4 Children | 0 (0.0%) | 0 (0.0%) |
| 5 or more Children | 0 (0.0%) | 0 (0.0%) |
| Total | 0 (0.0%) | 0 (0.0%) |
Employment Characteristics in Boiling Spring Lakes
Employment by Class of Employer in Boiling Spring Lakes
Among the 2,718 employed individuals in Boiling Spring Lakes, private company employees (1,984 | 73.0%), self-employed (not incorporated) (263 | 9.7%), and local government employees (175 | 6.4%) make up the most common classes of employment.
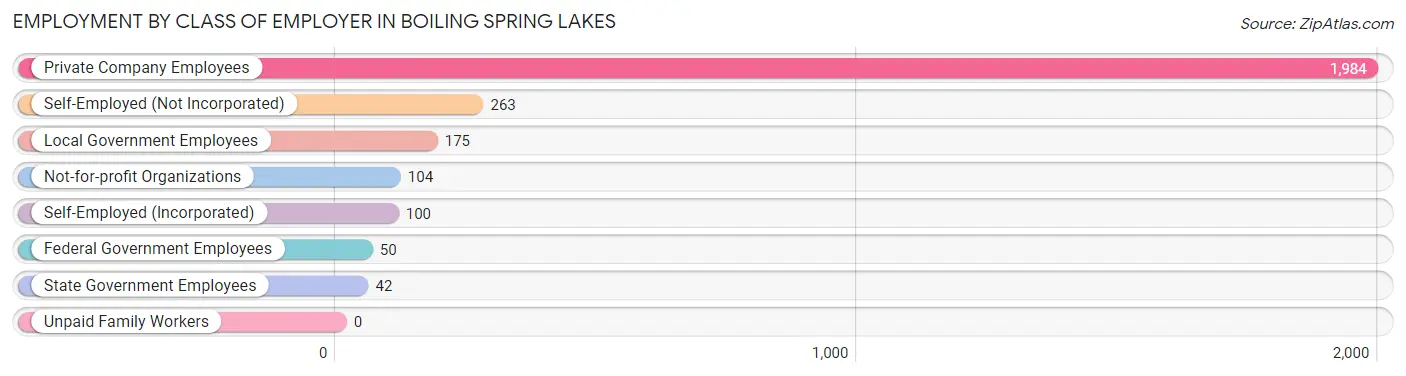
| Employer Class | # Employees | % Employees |
| Private Company Employees | 1,984 | 73.0% |
| Self-Employed (Incorporated) | 100 | 3.7% |
| Self-Employed (Not Incorporated) | 263 | 9.7% |
| Not-for-profit Organizations | 104 | 3.8% |
| Local Government Employees | 175 | 6.4% |
| State Government Employees | 42 | 1.5% |
| Federal Government Employees | 50 | 1.8% |
| Unpaid Family Workers | 0 | 0.0% |
| Total | 2,718 | 100.0% |
Employment Status by Age in Boiling Spring Lakes
According to the labor force statistics for Boiling Spring Lakes, out of the total population over 16 years of age (5,143), 56.8% or 2,921 individuals are in the labor force, with 6.2% or 181 of them unemployed. The age group with the highest labor force participation rate is 25 to 29 years, with 95.6% or 457 individuals in the labor force. Within the labor force, the 45 to 54 years age range has the highest percentage of unemployed individuals, with 13.5% or 121 of them being unemployed.
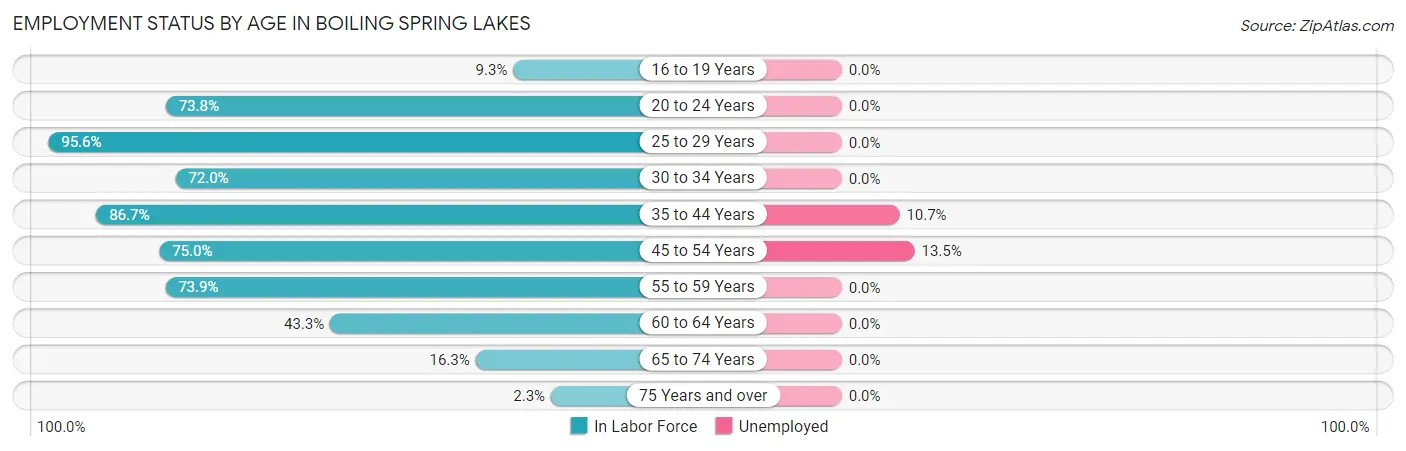
| Age Bracket | In Labor Force | Unemployed |
| 16 to 19 Years | 23 (9.3%) | 0 (0.0%) |
| 20 to 24 Years | 124 (73.8%) | 0 (0.0%) |
| 25 to 29 Years | 457 (95.6%) | 0 (0.0%) |
| 30 to 34 Years | 285 (72.0%) | 0 (0.0%) |
| 35 to 44 Years | 540 (86.7%) | 58 (10.7%) |
| 45 to 54 Years | 895 (75.0%) | 121 (13.5%) |
| 55 to 59 Years | 322 (73.9%) | 0 (0.0%) |
| 60 to 64 Years | 129 (43.3%) | 0 (0.0%) |
| 65 to 74 Years | 134 (16.3%) | 0 (0.0%) |
| 75 Years and over | 11 (2.3%) | 0 (0.0%) |
| Total | 2,921 (56.8%) | 181 (6.2%) |
Employment Status by Educational Attainment in Boiling Spring Lakes
According to labor force statistics for Boiling Spring Lakes, 76.8% of individuals (2,630) out of the total population between 25 and 64 years of age (3,424) are in the labor force, with 6.9% or 181 of them being unemployed. The group with the highest labor force participation rate are those with the educational attainment of bachelor's degree or higher, with 79.1% or 401 individuals in the labor force. Within the labor force, individuals with less than high school education have the highest percentage of unemployment, with 26.5% or 18 of them being unemployed.
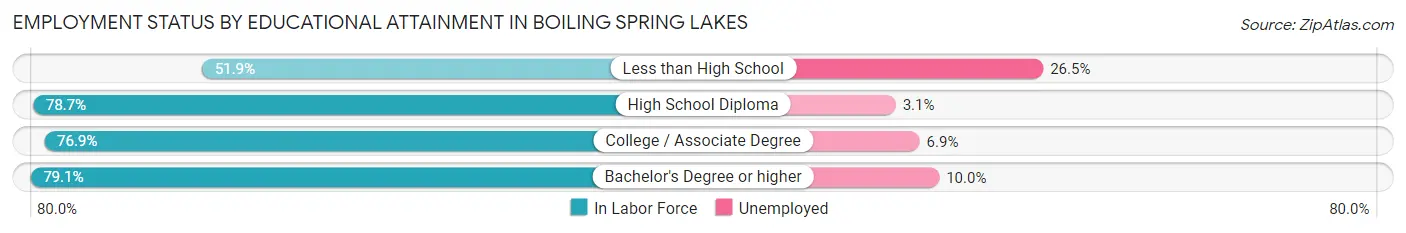
| Educational Attainment | In Labor Force | Unemployed |
| Less than High School | 68 (51.9%) | 35 (26.5%) |
| High School Diploma | 685 (78.7%) | 27 (3.1%) |
| College / Associate Degree | 1,473 (76.9%) | 132 (6.9%) |
| Bachelor's Degree or higher | 401 (79.1%) | 51 (10.0%) |
| Total | 2,630 (76.8%) | 236 (6.9%) |
Employment Occupations by Sex in Boiling Spring Lakes
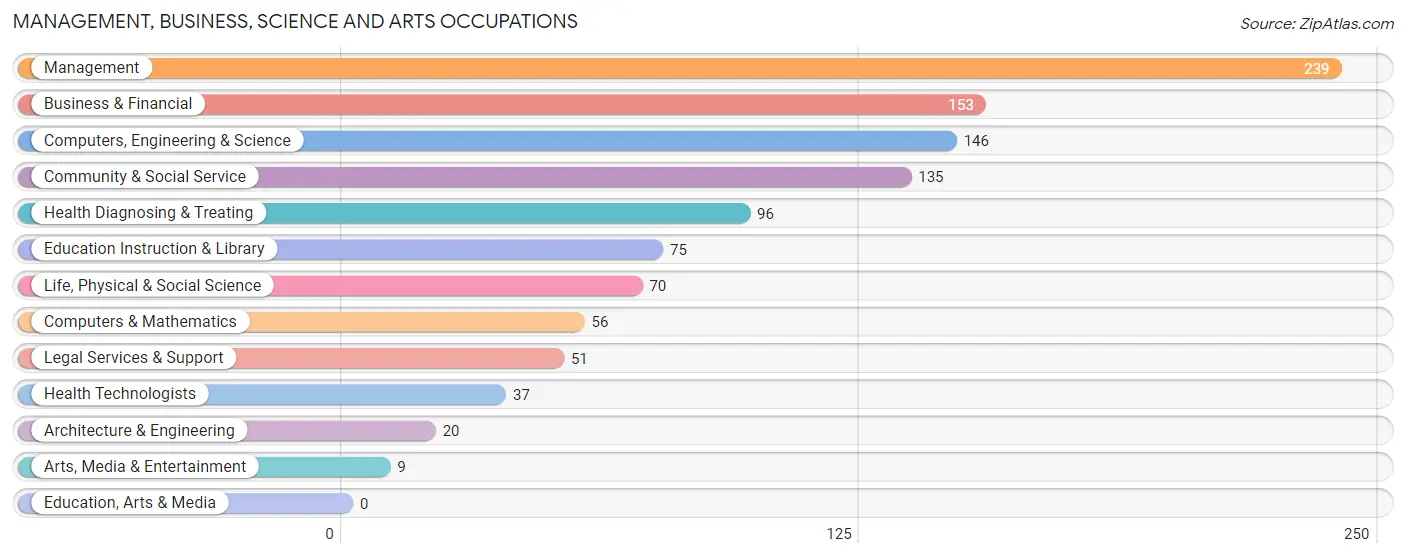
Management, Business, Science and Arts Occupations
The most common Management, Business, Science and Arts occupations in Boiling Spring Lakes are Management (239 | 8.8%), Business & Financial (153 | 5.6%), Computers, Engineering & Science (146 | 5.4%), Community & Social Service (135 | 5.0%), and Health Diagnosing & Treating (96 | 3.5%).
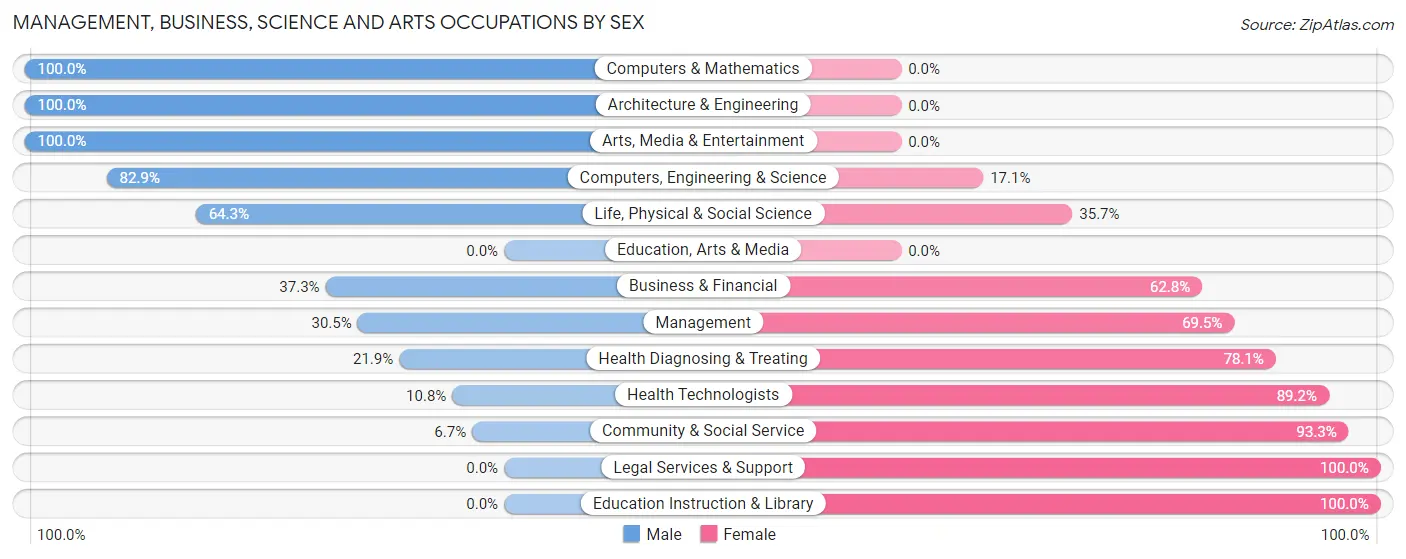
Management, Business, Science and Arts Occupations by Sex
Within the Management, Business, Science and Arts occupations in Boiling Spring Lakes, the most male-oriented occupations are Computers & Mathematics (100.0%), Architecture & Engineering (100.0%), and Arts, Media & Entertainment (100.0%), while the most female-oriented occupations are Legal Services & Support (100.0%), Education Instruction & Library (100.0%), and Community & Social Service (93.3%).
| Occupation | Male | Female |
| Management | 73 (30.5%) | 166 (69.5%) |
| Business & Financial | 57 (37.2%) | 96 (62.7%) |
| Computers, Engineering & Science | 121 (82.9%) | 25 (17.1%) |
| Computers & Mathematics | 56 (100.0%) | 0 (0.0%) |
| Architecture & Engineering | 20 (100.0%) | 0 (0.0%) |
| Life, Physical & Social Science | 45 (64.3%) | 25 (35.7%) |
| Community & Social Service | 9 (6.7%) | 126 (93.3%) |
| Education, Arts & Media | 0 (0.0%) | 0 (0.0%) |
| Legal Services & Support | 0 (0.0%) | 51 (100.0%) |
| Education Instruction & Library | 0 (0.0%) | 75 (100.0%) |
| Arts, Media & Entertainment | 9 (100.0%) | 0 (0.0%) |
| Health Diagnosing & Treating | 21 (21.9%) | 75 (78.1%) |
| Health Technologists | 4 (10.8%) | 33 (89.2%) |
| Total (Category) | 281 (36.5%) | 488 (63.5%) |
| Total (Overall) | 1,502 (55.4%) | 1,209 (44.6%) |
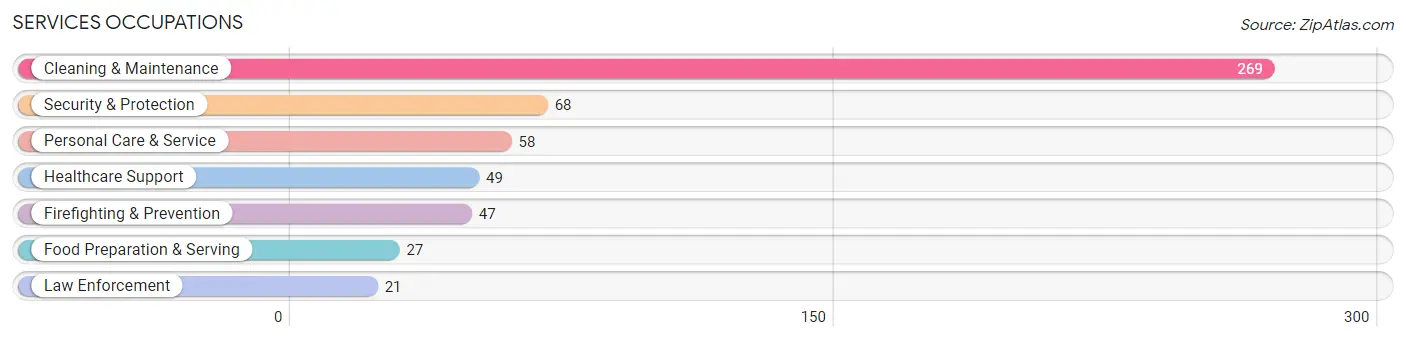
Services Occupations
The most common Services occupations in Boiling Spring Lakes are Cleaning & Maintenance (269 | 9.9%), Security & Protection (68 | 2.5%), Personal Care & Service (58 | 2.1%), Healthcare Support (49 | 1.8%), and Firefighting & Prevention (47 | 1.7%).
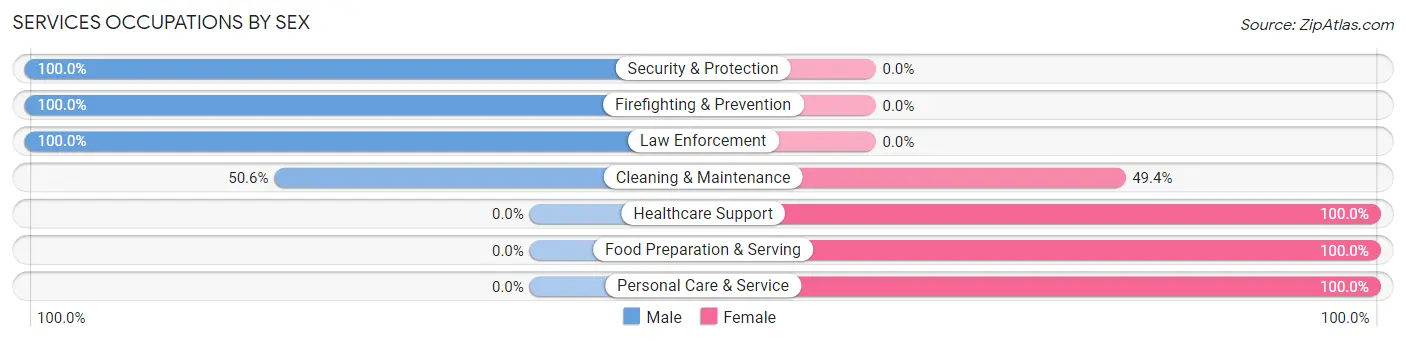
Services Occupations by Sex
Within the Services occupations in Boiling Spring Lakes, the most male-oriented occupations are Security & Protection (100.0%), Firefighting & Prevention (100.0%), and Law Enforcement (100.0%), while the most female-oriented occupations are Healthcare Support (100.0%), Food Preparation & Serving (100.0%), and Personal Care & Service (100.0%).
| Occupation | Male | Female |
| Healthcare Support | 0 (0.0%) | 49 (100.0%) |
| Security & Protection | 68 (100.0%) | 0 (0.0%) |
| Firefighting & Prevention | 47 (100.0%) | 0 (0.0%) |
| Law Enforcement | 21 (100.0%) | 0 (0.0%) |
| Food Preparation & Serving | 0 (0.0%) | 27 (100.0%) |
| Cleaning & Maintenance | 136 (50.6%) | 133 (49.4%) |
| Personal Care & Service | 0 (0.0%) | 58 (100.0%) |
| Total (Category) | 204 (43.3%) | 267 (56.7%) |
| Total (Overall) | 1,502 (55.4%) | 1,209 (44.6%) |
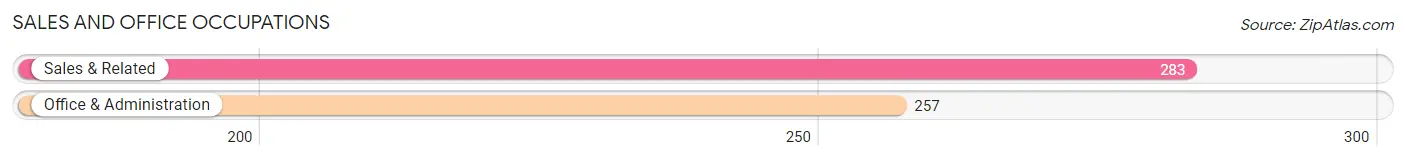
Sales and Office Occupations
The most common Sales and Office occupations in Boiling Spring Lakes are Sales & Related (283 | 10.4%), and Office & Administration (257 | 9.5%).
Sales and Office Occupations by Sex
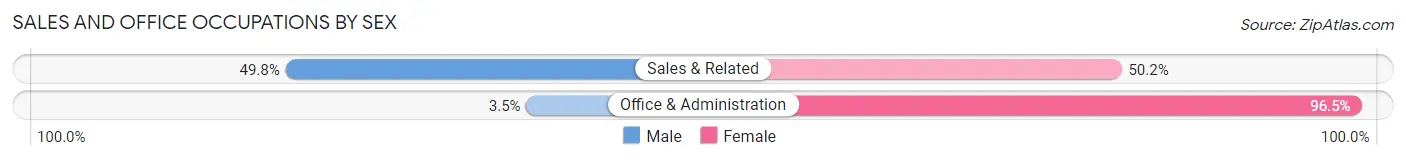
| Occupation | Male | Female |
| Sales & Related | 141 (49.8%) | 142 (50.2%) |
| Office & Administration | 9 (3.5%) | 248 (96.5%) |
| Total (Category) | 150 (27.8%) | 390 (72.2%) |
| Total (Overall) | 1,502 (55.4%) | 1,209 (44.6%) |
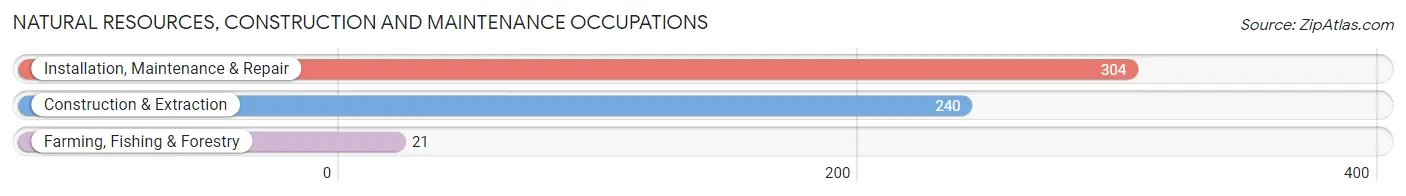
Natural Resources, Construction and Maintenance Occupations
The most common Natural Resources, Construction and Maintenance occupations in Boiling Spring Lakes are Installation, Maintenance & Repair (304 | 11.2%), Construction & Extraction (240 | 8.8%), and Farming, Fishing & Forestry (21 | 0.8%).
Natural Resources, Construction and Maintenance Occupations by Sex
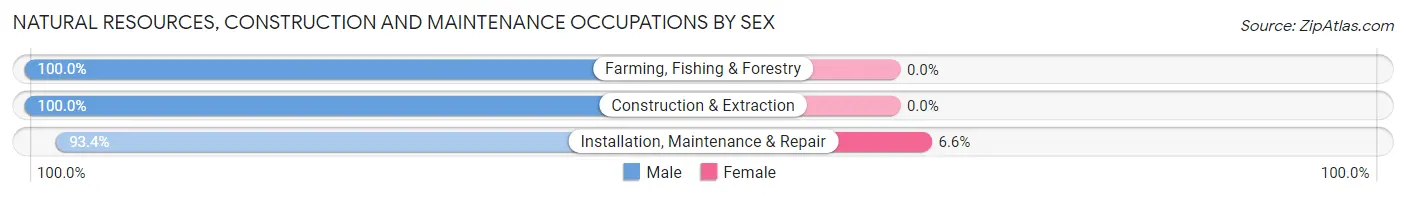
| Occupation | Male | Female |
| Farming, Fishing & Forestry | 21 (100.0%) | 0 (0.0%) |
| Construction & Extraction | 240 (100.0%) | 0 (0.0%) |
| Installation, Maintenance & Repair | 284 (93.4%) | 20 (6.6%) |
| Total (Category) | 545 (96.5%) | 20 (3.5%) |
| Total (Overall) | 1,502 (55.4%) | 1,209 (44.6%) |
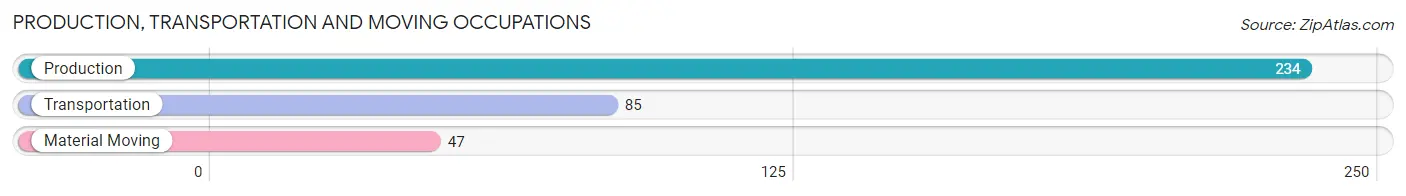
Production, Transportation and Moving Occupations
The most common Production, Transportation and Moving occupations in Boiling Spring Lakes are Production (234 | 8.6%), Transportation (85 | 3.1%), and Material Moving (47 | 1.7%).
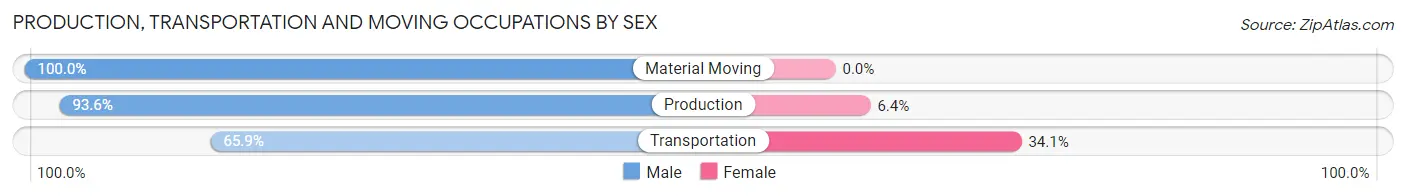
Production, Transportation and Moving Occupations by Sex
| Occupation | Male | Female |
| Production | 219 (93.6%) | 15 (6.4%) |
| Transportation | 56 (65.9%) | 29 (34.1%) |
| Material Moving | 47 (100.0%) | 0 (0.0%) |
| Total (Category) | 322 (88.0%) | 44 (12.0%) |
| Total (Overall) | 1,502 (55.4%) | 1,209 (44.6%) |
Employment Industries by Sex in Boiling Spring Lakes
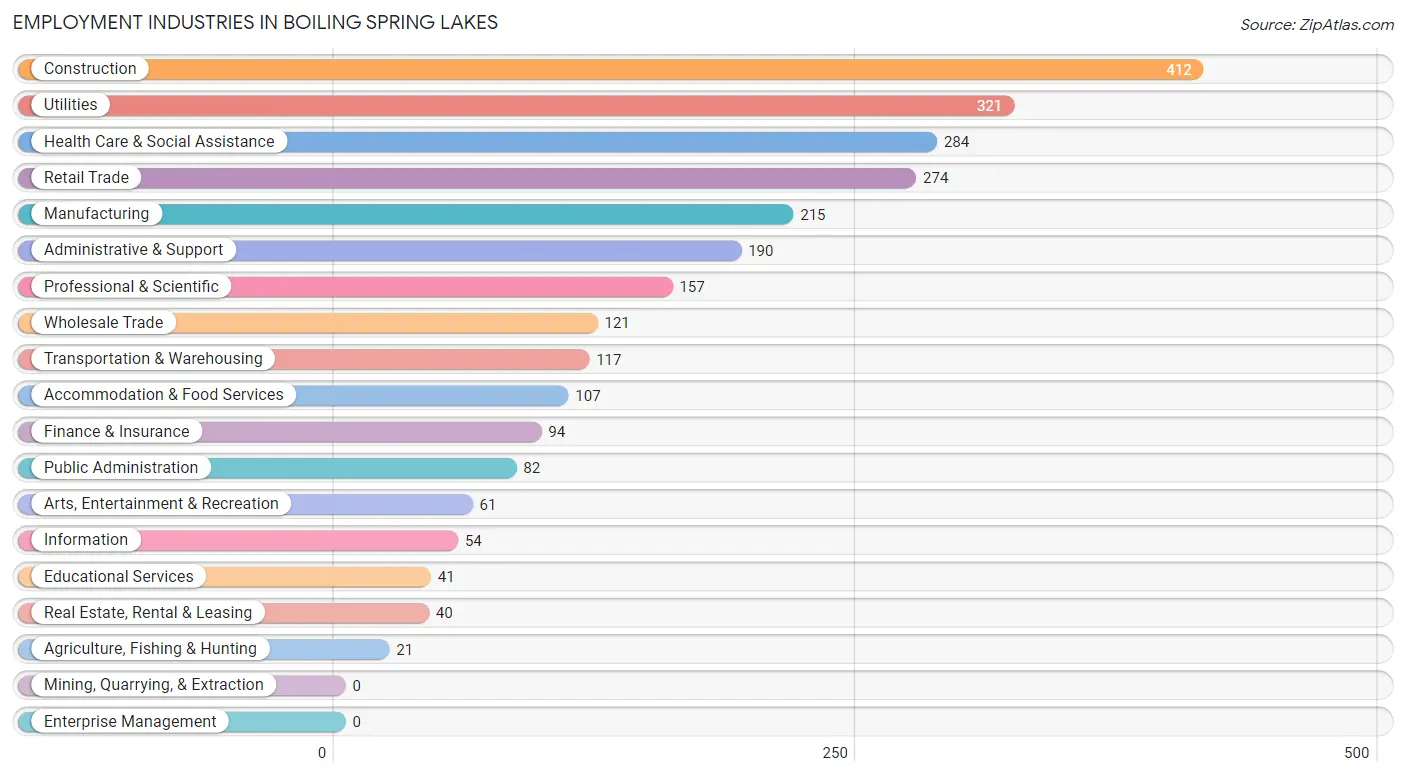
Employment Industries in Boiling Spring Lakes
The major employment industries in Boiling Spring Lakes include Construction (412 | 15.2%), Utilities (321 | 11.8%), Health Care & Social Assistance (284 | 10.5%), Retail Trade (274 | 10.1%), and Manufacturing (215 | 7.9%).
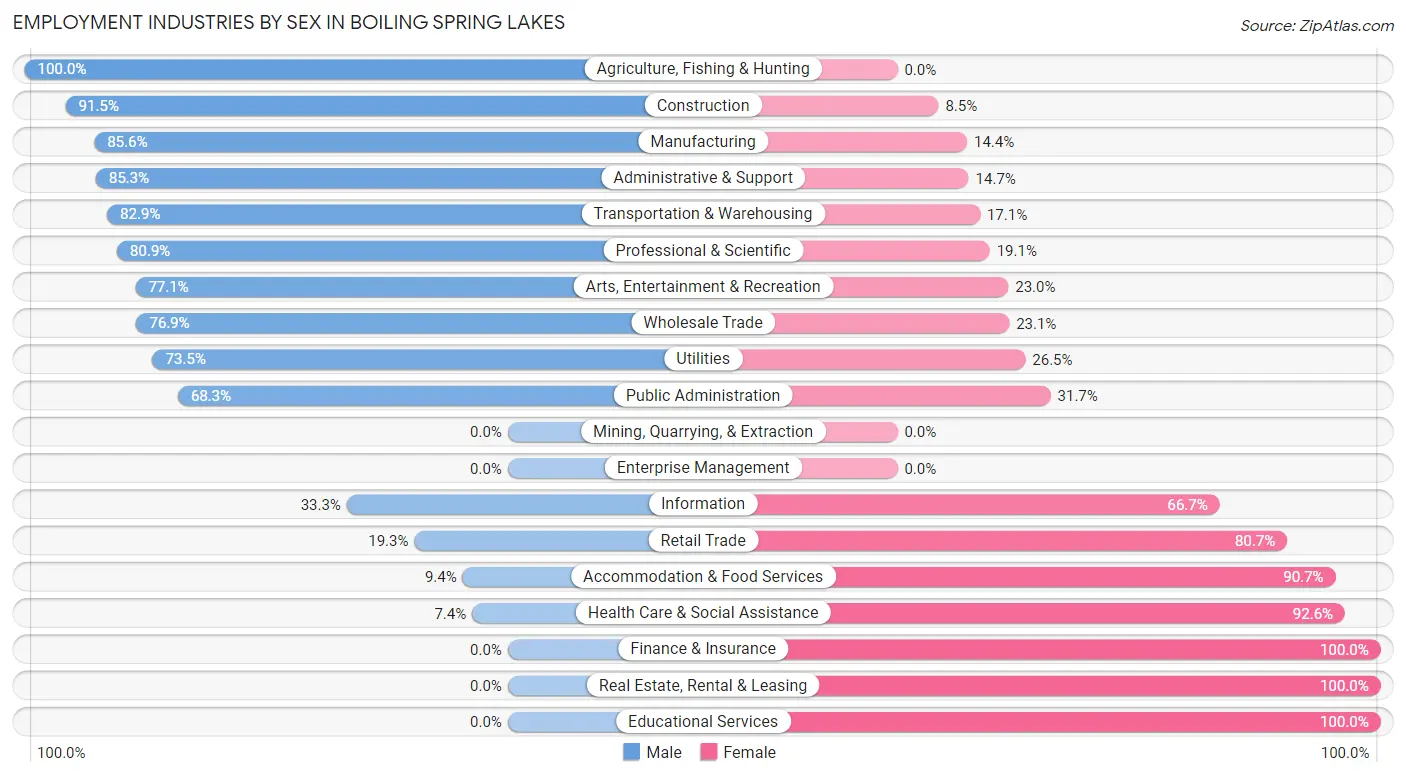
Employment Industries by Sex in Boiling Spring Lakes
The Boiling Spring Lakes industries that see more men than women are Agriculture, Fishing & Hunting (100.0%), Construction (91.5%), and Manufacturing (85.6%), whereas the industries that tend to have a higher number of women are Finance & Insurance (100.0%), Real Estate, Rental & Leasing (100.0%), and Educational Services (100.0%).
| Industry | Male | Female |
| Agriculture, Fishing & Hunting | 21 (100.0%) | 0 (0.0%) |
| Mining, Quarrying, & Extraction | 0 (0.0%) | 0 (0.0%) |
| Construction | 377 (91.5%) | 35 (8.5%) |
| Manufacturing | 184 (85.6%) | 31 (14.4%) |
| Wholesale Trade | 93 (76.9%) | 28 (23.1%) |
| Retail Trade | 53 (19.3%) | 221 (80.7%) |
| Transportation & Warehousing | 97 (82.9%) | 20 (17.1%) |
| Utilities | 236 (73.5%) | 85 (26.5%) |
| Information | 18 (33.3%) | 36 (66.7%) |
| Finance & Insurance | 0 (0.0%) | 94 (100.0%) |
| Real Estate, Rental & Leasing | 0 (0.0%) | 40 (100.0%) |
| Professional & Scientific | 127 (80.9%) | 30 (19.1%) |
| Enterprise Management | 0 (0.0%) | 0 (0.0%) |
| Administrative & Support | 162 (85.3%) | 28 (14.7%) |
| Educational Services | 0 (0.0%) | 41 (100.0%) |
| Health Care & Social Assistance | 21 (7.4%) | 263 (92.6%) |
| Arts, Entertainment & Recreation | 47 (77.0%) | 14 (23.0%) |
| Accommodation & Food Services | 10 (9.3%) | 97 (90.6%) |
| Public Administration | 56 (68.3%) | 26 (31.7%) |
| Total | 1,502 (55.4%) | 1,209 (44.6%) |
Education in Boiling Spring Lakes
School Enrollment in Boiling Spring Lakes
The most common levels of schooling among the 1,134 students in Boiling Spring Lakes are middle school (292 | 25.8%), college / undergraduate (259 | 22.8%), and elementary school (244 | 21.5%).
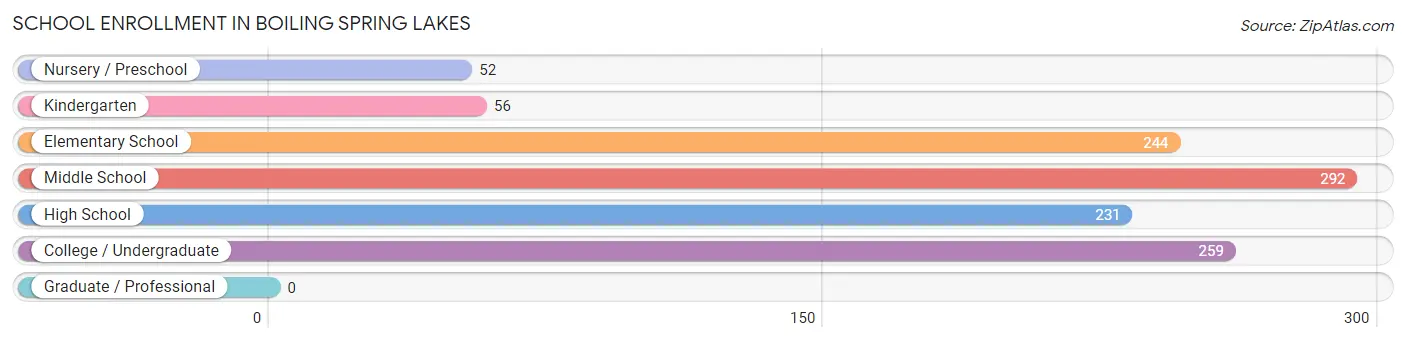
| School Level | # Students | % Students |
| Nursery / Preschool | 52 | 4.6% |
| Kindergarten | 56 | 4.9% |
| Elementary School | 244 | 21.5% |
| Middle School | 292 | 25.8% |
| High School | 231 | 20.4% |
| College / Undergraduate | 259 | 22.8% |
| Graduate / Professional | 0 | 0.0% |
| Total | 1,134 | 100.0% |
School Enrollment by Age by Funding Source in Boiling Spring Lakes
Out of a total of 1,134 students who are enrolled in schools in Boiling Spring Lakes, 98 (8.6%) attend a private institution, while the remaining 1,036 (91.4%) are enrolled in public schools. The age group of 25 to 34 year olds has the highest likelihood of being enrolled in private schools, with 62 (75.6% in the age bracket) enrolled. Conversely, the age group of 3 to 4 year olds has the lowest likelihood of being enrolled in a private school, with 33 (100.0% in the age bracket) attending a public institution.
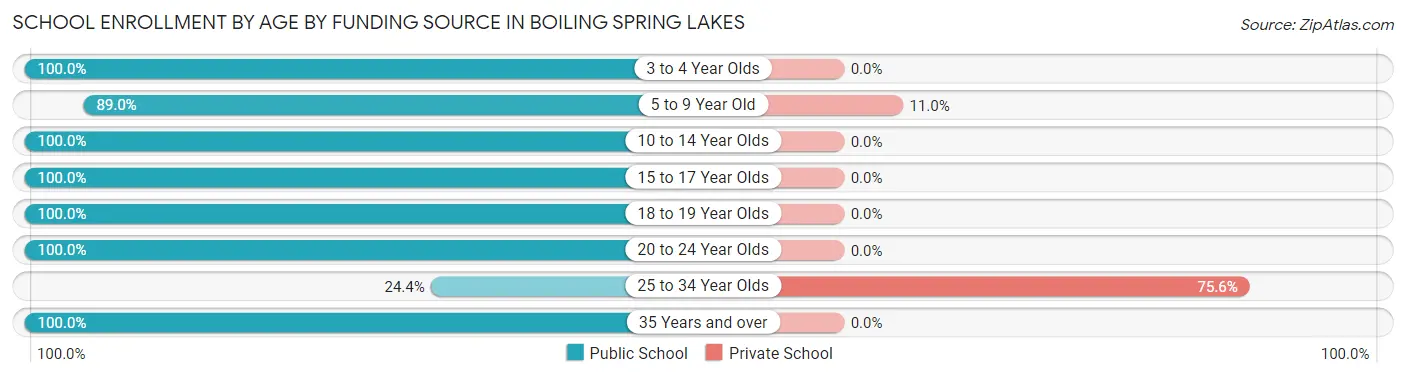
| Age Bracket | Public School | Private School |
| 3 to 4 Year Olds | 33 (100.0%) | 0 (0.0%) |
| 5 to 9 Year Old | 284 (89.0%) | 35 (11.0%) |
| 10 to 14 Year Olds | 292 (100.0%) | 0 (0.0%) |
| 15 to 17 Year Olds | 217 (100.0%) | 0 (0.0%) |
| 18 to 19 Year Olds | 109 (100.0%) | 0 (0.0%) |
| 20 to 24 Year Olds | 54 (100.0%) | 0 (0.0%) |
| 25 to 34 Year Olds | 20 (24.4%) | 62 (75.6%) |
| 35 Years and over | 28 (100.0%) | 0 (0.0%) |
| Total | 1,036 (91.4%) | 98 (8.6%) |
Educational Attainment by Field of Study in Boiling Spring Lakes
Education (168 | 23.0%), science & technology (115 | 15.7%), social sciences (111 | 15.2%), business (75 | 10.3%), and bio, nature & agricultural (46 | 6.3%) are the most common fields of study among 731 individuals in Boiling Spring Lakes who have obtained a bachelor's degree or higher.
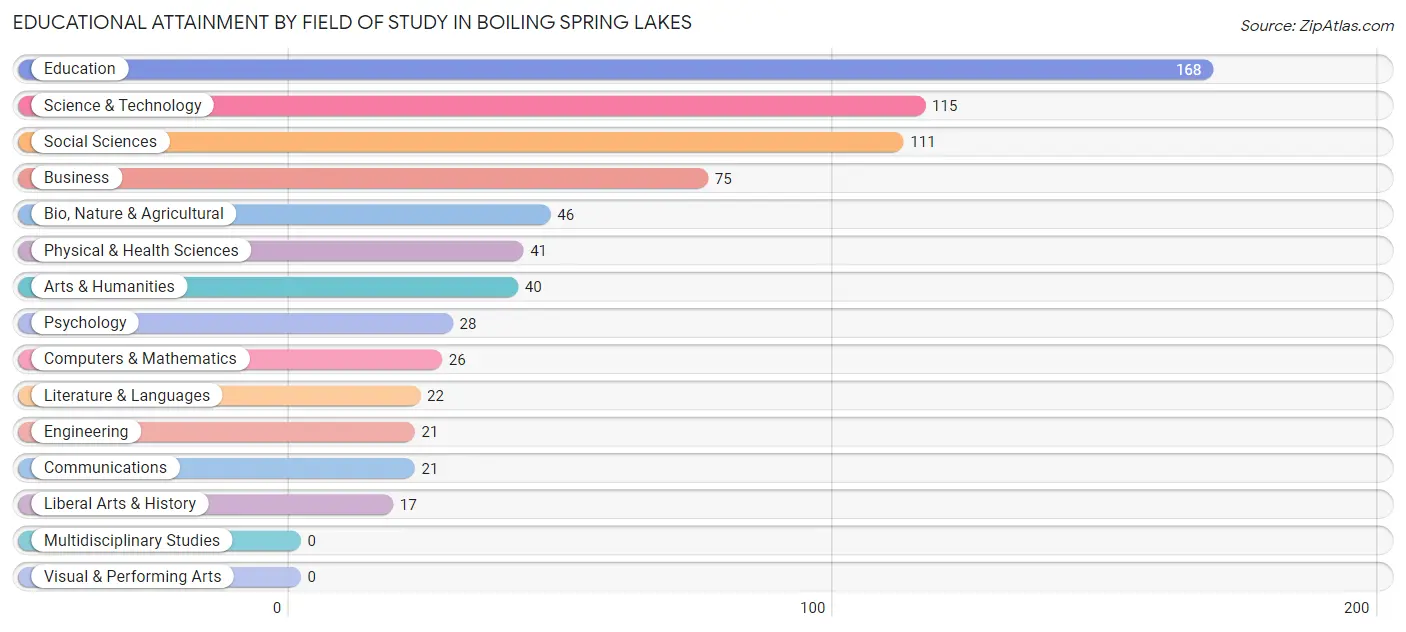
| Field of Study | # Graduates | % Graduates |
| Computers & Mathematics | 26 | 3.6% |
| Bio, Nature & Agricultural | 46 | 6.3% |
| Physical & Health Sciences | 41 | 5.6% |
| Psychology | 28 | 3.8% |
| Social Sciences | 111 | 15.2% |
| Engineering | 21 | 2.9% |
| Multidisciplinary Studies | 0 | 0.0% |
| Science & Technology | 115 | 15.7% |
| Business | 75 | 10.3% |
| Education | 168 | 23.0% |
| Literature & Languages | 22 | 3.0% |
| Liberal Arts & History | 17 | 2.3% |
| Visual & Performing Arts | 0 | 0.0% |
| Communications | 21 | 2.9% |
| Arts & Humanities | 40 | 5.5% |
| Total | 731 | 100.0% |
Transportation & Commute in Boiling Spring Lakes
Vehicle Availability by Sex in Boiling Spring Lakes
The most prevalent vehicle ownership categories in Boiling Spring Lakes are males with 2 vehicles (547, accounting for 36.3%) and females with 2 vehicles (391, making up 45.3%).
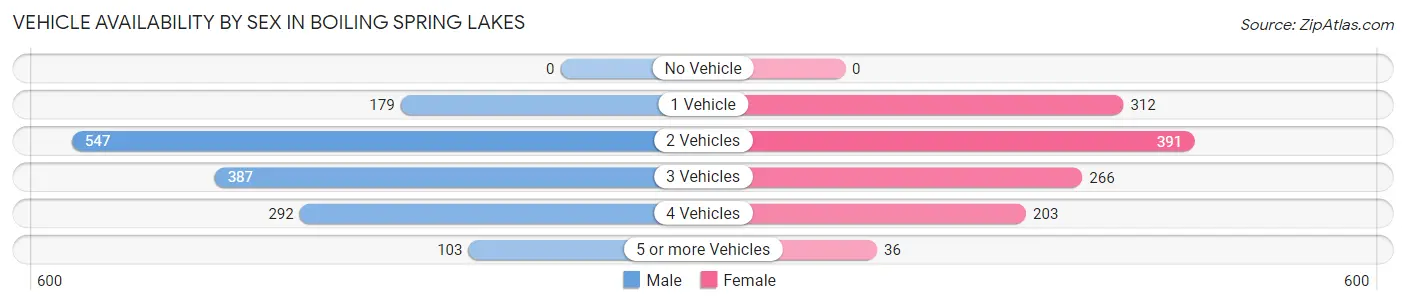
| Vehicles Available | Male | Female |
| No Vehicle | 0 (0.0%) | 0 (0.0%) |
| 1 Vehicle | 179 (11.9%) | 312 (25.8%) |
| 2 Vehicles | 547 (36.3%) | 391 (32.4%) |
| 3 Vehicles | 387 (25.7%) | 266 (22.0%) |
| 4 Vehicles | 292 (19.4%) | 203 (16.8%) |
| 5 or more Vehicles | 103 (6.8%) | 36 (3.0%) |
| Total | 1,508 (100.0%) | 1,208 (100.0%) |
Commute Time in Boiling Spring Lakes
The most frequently occuring commute durations in Boiling Spring Lakes are 20 to 24 minutes (460 commuters, 18.9%), 15 to 19 minutes (425 commuters, 17.5%), and 10 to 14 minutes (280 commuters, 11.5%).
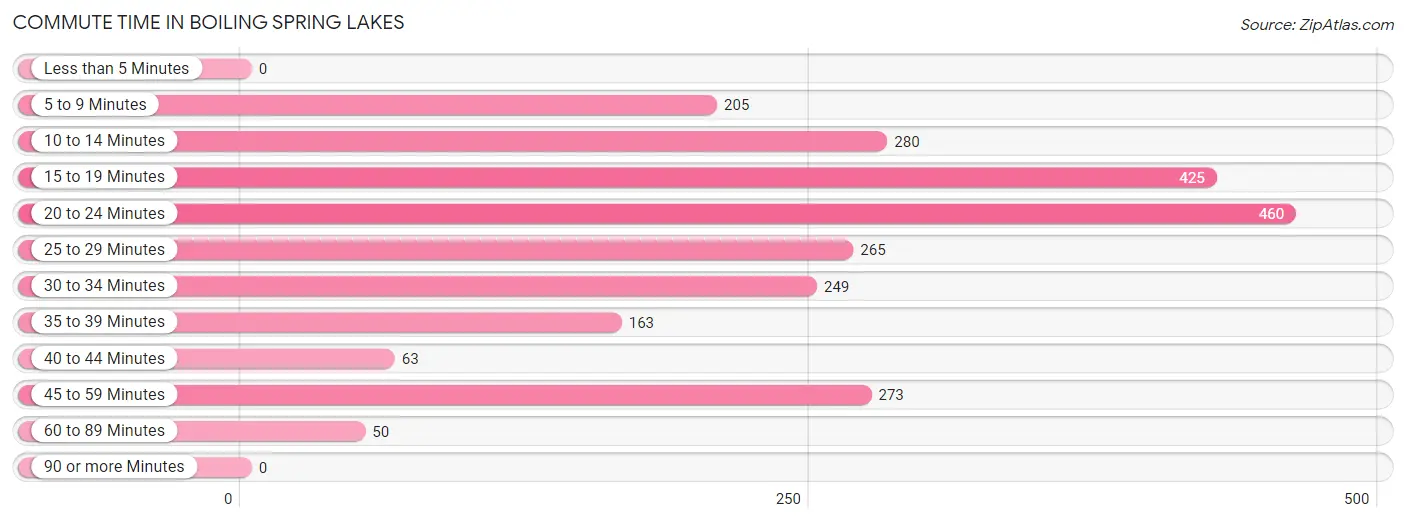
| Commute Time | # Commuters | % Commuters |
| Less than 5 Minutes | 0 | 0.0% |
| 5 to 9 Minutes | 205 | 8.4% |
| 10 to 14 Minutes | 280 | 11.5% |
| 15 to 19 Minutes | 425 | 17.5% |
| 20 to 24 Minutes | 460 | 18.9% |
| 25 to 29 Minutes | 265 | 10.9% |
| 30 to 34 Minutes | 249 | 10.2% |
| 35 to 39 Minutes | 163 | 6.7% |
| 40 to 44 Minutes | 63 | 2.6% |
| 45 to 59 Minutes | 273 | 11.2% |
| 60 to 89 Minutes | 50 | 2.1% |
| 90 or more Minutes | 0 | 0.0% |
Commute Time by Sex in Boiling Spring Lakes
The most common commute times in Boiling Spring Lakes are 15 to 19 minutes (262 commuters, 19.6%) for males and 20 to 24 minutes (296 commuters, 27.0%) for females.
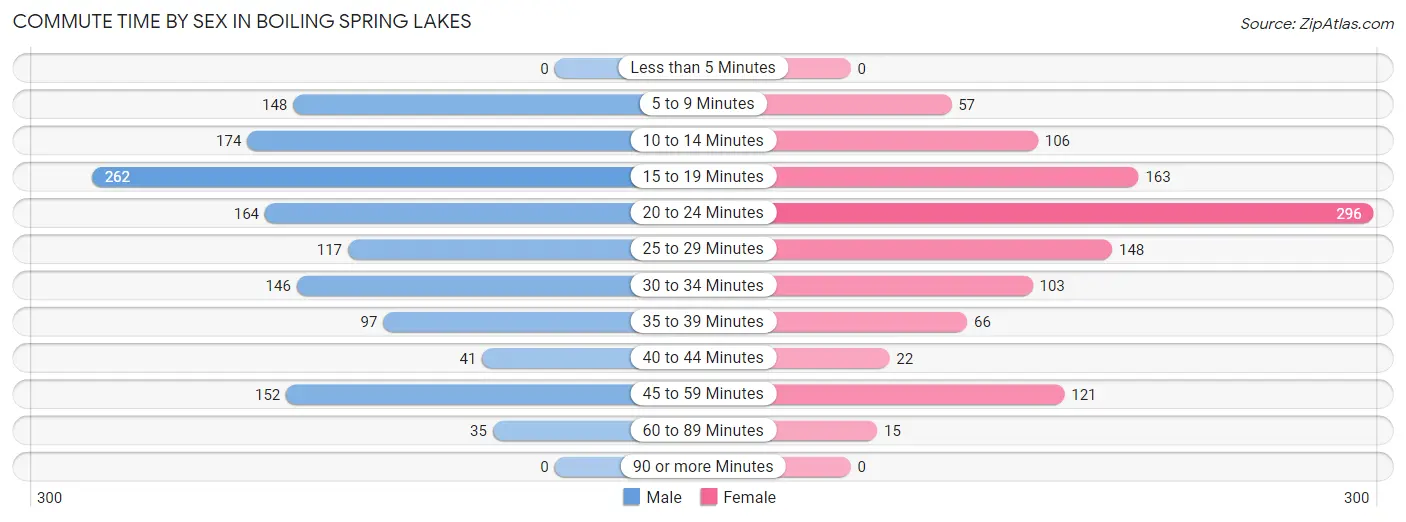
| Commute Time | Male | Female |
| Less than 5 Minutes | 0 (0.0%) | 0 (0.0%) |
| 5 to 9 Minutes | 148 (11.1%) | 57 (5.2%) |
| 10 to 14 Minutes | 174 (13.0%) | 106 (9.7%) |
| 15 to 19 Minutes | 262 (19.6%) | 163 (14.9%) |
| 20 to 24 Minutes | 164 (12.3%) | 296 (27.0%) |
| 25 to 29 Minutes | 117 (8.8%) | 148 (13.5%) |
| 30 to 34 Minutes | 146 (10.9%) | 103 (9.4%) |
| 35 to 39 Minutes | 97 (7.3%) | 66 (6.0%) |
| 40 to 44 Minutes | 41 (3.1%) | 22 (2.0%) |
| 45 to 59 Minutes | 152 (11.4%) | 121 (11.0%) |
| 60 to 89 Minutes | 35 (2.6%) | 15 (1.4%) |
| 90 or more Minutes | 0 (0.0%) | 0 (0.0%) |
Time of Departure to Work by Sex in Boiling Spring Lakes
The most frequent times of departure to work in Boiling Spring Lakes are 6:30 AM to 6:59 AM (250, 18.7%) for males and 7:00 AM to 7:29 AM (233, 21.2%) for females.
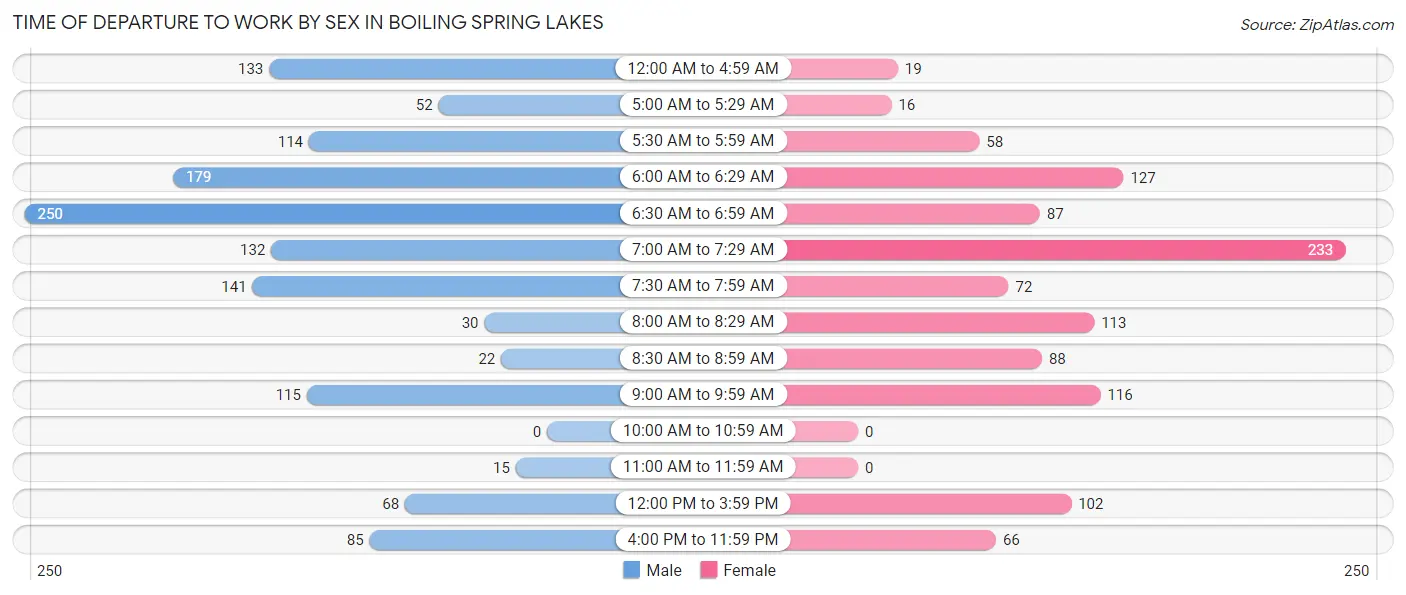
| Time of Departure | Male | Female |
| 12:00 AM to 4:59 AM | 133 (10.0%) | 19 (1.7%) |
| 5:00 AM to 5:29 AM | 52 (3.9%) | 16 (1.5%) |
| 5:30 AM to 5:59 AM | 114 (8.5%) | 58 (5.3%) |
| 6:00 AM to 6:29 AM | 179 (13.4%) | 127 (11.6%) |
| 6:30 AM to 6:59 AM | 250 (18.7%) | 87 (7.9%) |
| 7:00 AM to 7:29 AM | 132 (9.9%) | 233 (21.2%) |
| 7:30 AM to 7:59 AM | 141 (10.5%) | 72 (6.6%) |
| 8:00 AM to 8:29 AM | 30 (2.2%) | 113 (10.3%) |
| 8:30 AM to 8:59 AM | 22 (1.7%) | 88 (8.0%) |
| 9:00 AM to 9:59 AM | 115 (8.6%) | 116 (10.6%) |
| 10:00 AM to 10:59 AM | 0 (0.0%) | 0 (0.0%) |
| 11:00 AM to 11:59 AM | 15 (1.1%) | 0 (0.0%) |
| 12:00 PM to 3:59 PM | 68 (5.1%) | 102 (9.3%) |
| 4:00 PM to 11:59 PM | 85 (6.4%) | 66 (6.0%) |
| Total | 1,336 (100.0%) | 1,097 (100.0%) |
Housing Occupancy in Boiling Spring Lakes
Occupancy by Ownership in Boiling Spring Lakes
Of the total 2,724 dwellings in Boiling Spring Lakes, owner-occupied units account for 2,103 (77.2%), while renter-occupied units make up 621 (22.8%).
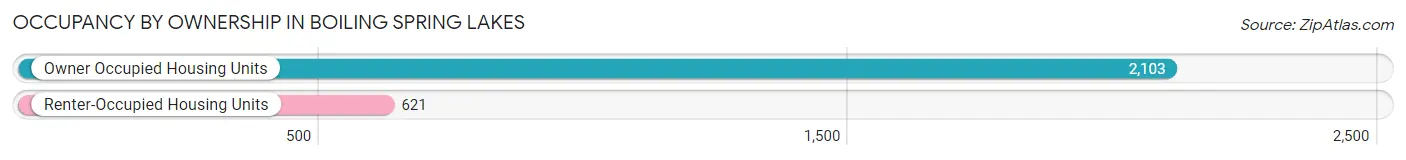
| Occupancy | # Housing Units | % Housing Units |
| Owner Occupied Housing Units | 2,103 | 77.2% |
| Renter-Occupied Housing Units | 621 | 22.8% |
| Total Occupied Housing Units | 2,724 | 100.0% |
Occupancy by Household Size in Boiling Spring Lakes
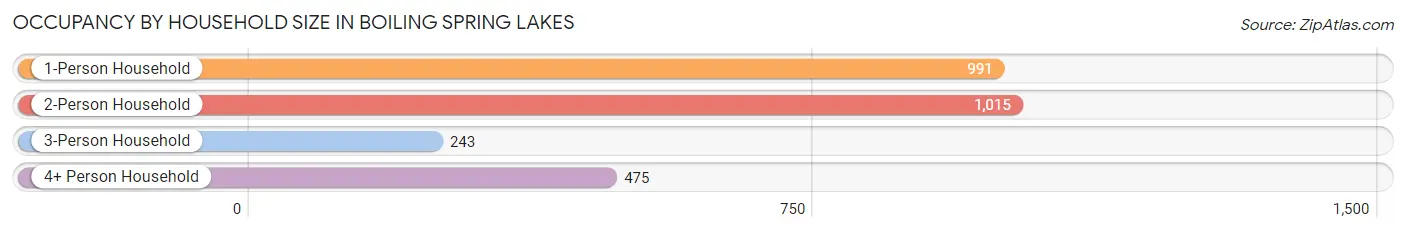
| Household Size | # Housing Units | % Housing Units |
| 1-Person Household | 991 | 36.4% |
| 2-Person Household | 1,015 | 37.3% |
| 3-Person Household | 243 | 8.9% |
| 4+ Person Household | 475 | 17.4% |
| Total Housing Units | 2,724 | 100.0% |
Occupancy by Ownership by Household Size in Boiling Spring Lakes
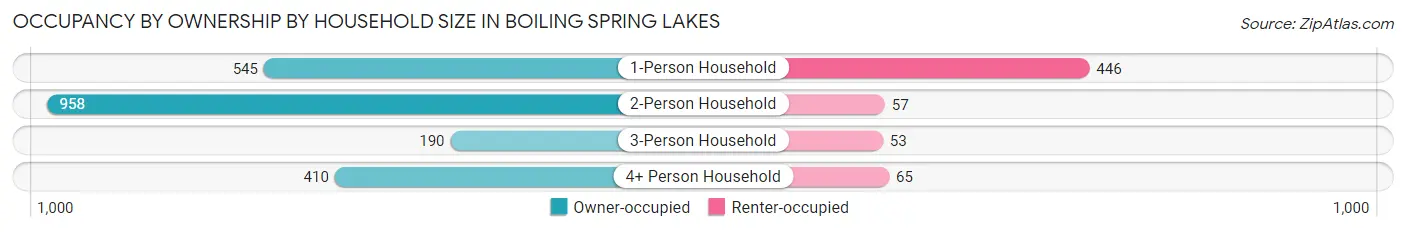
| Household Size | Owner-occupied | Renter-occupied |
| 1-Person Household | 545 (55.0%) | 446 (45.0%) |
| 2-Person Household | 958 (94.4%) | 57 (5.6%) |
| 3-Person Household | 190 (78.2%) | 53 (21.8%) |
| 4+ Person Household | 410 (86.3%) | 65 (13.7%) |
| Total Housing Units | 2,103 (77.2%) | 621 (22.8%) |
Occupancy by Educational Attainment in Boiling Spring Lakes
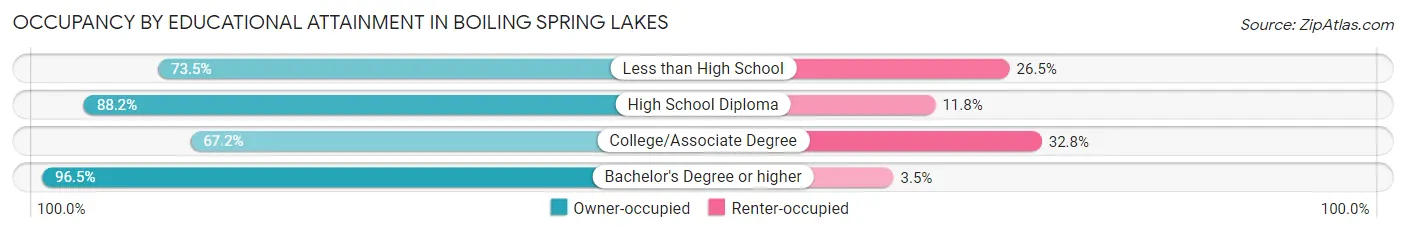
| Household Size | Owner-occupied | Renter-occupied |
| Less than High School | 50 (73.5%) | 18 (26.5%) |
| High School Diploma | 593 (88.2%) | 79 (11.8%) |
| College/Associate Degree | 1,041 (67.2%) | 509 (32.8%) |
| Bachelor's Degree or higher | 419 (96.5%) | 15 (3.5%) |
Occupancy by Age of Householder in Boiling Spring Lakes
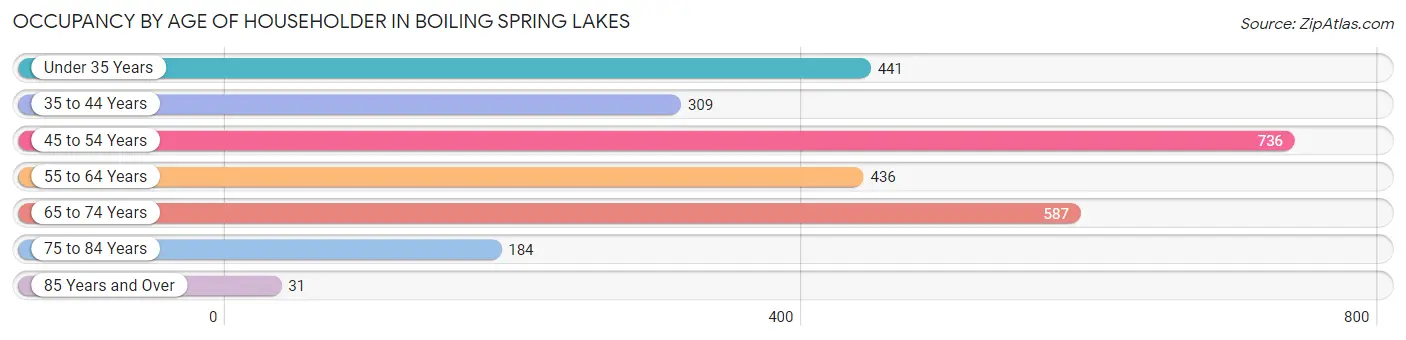
| Age Bracket | # Households | % Households |
| Under 35 Years | 441 | 16.2% |
| 35 to 44 Years | 309 | 11.3% |
| 45 to 54 Years | 736 | 27.0% |
| 55 to 64 Years | 436 | 16.0% |
| 65 to 74 Years | 587 | 21.5% |
| 75 to 84 Years | 184 | 6.8% |
| 85 Years and Over | 31 | 1.1% |
| Total | 2,724 | 100.0% |
Housing Finances in Boiling Spring Lakes
Median Income by Occupancy in Boiling Spring Lakes
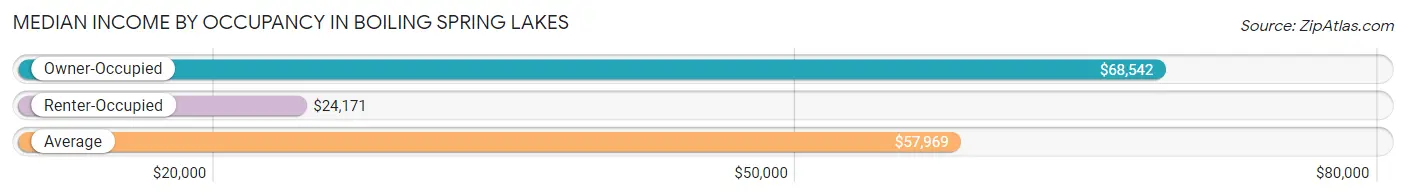
| Occupancy Type | # Households | Median Income |
| Owner-Occupied | 2,103 (77.2%) | $68,542 |
| Renter-Occupied | 621 (22.8%) | $24,171 |
| Average | 2,724 (100.0%) | $57,969 |
Occupancy by Householder Income Bracket in Boiling Spring Lakes
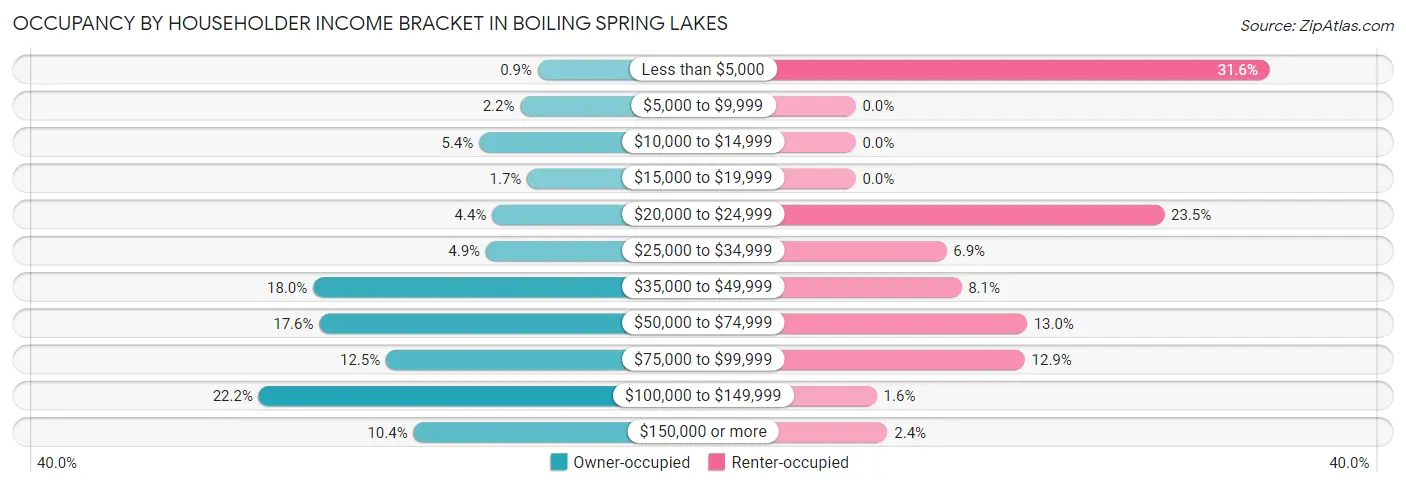
| Income Bracket | Owner-occupied | Renter-occupied |
| Less than $5,000 | 19 (0.9%) | 196 (31.6%) |
| $5,000 to $9,999 | 47 (2.2%) | 0 (0.0%) |
| $10,000 to $14,999 | 113 (5.4%) | 0 (0.0%) |
| $15,000 to $19,999 | 36 (1.7%) | 0 (0.0%) |
| $20,000 to $24,999 | 92 (4.4%) | 146 (23.5%) |
| $25,000 to $34,999 | 102 (4.9%) | 43 (6.9%) |
| $35,000 to $49,999 | 379 (18.0%) | 50 (8.1%) |
| $50,000 to $74,999 | 369 (17.5%) | 81 (13.0%) |
| $75,000 to $99,999 | 262 (12.5%) | 80 (12.9%) |
| $100,000 to $149,999 | 466 (22.2%) | 10 (1.6%) |
| $150,000 or more | 218 (10.4%) | 15 (2.4%) |
| Total | 2,103 (100.0%) | 621 (100.0%) |
Monthly Housing Cost Tiers in Boiling Spring Lakes
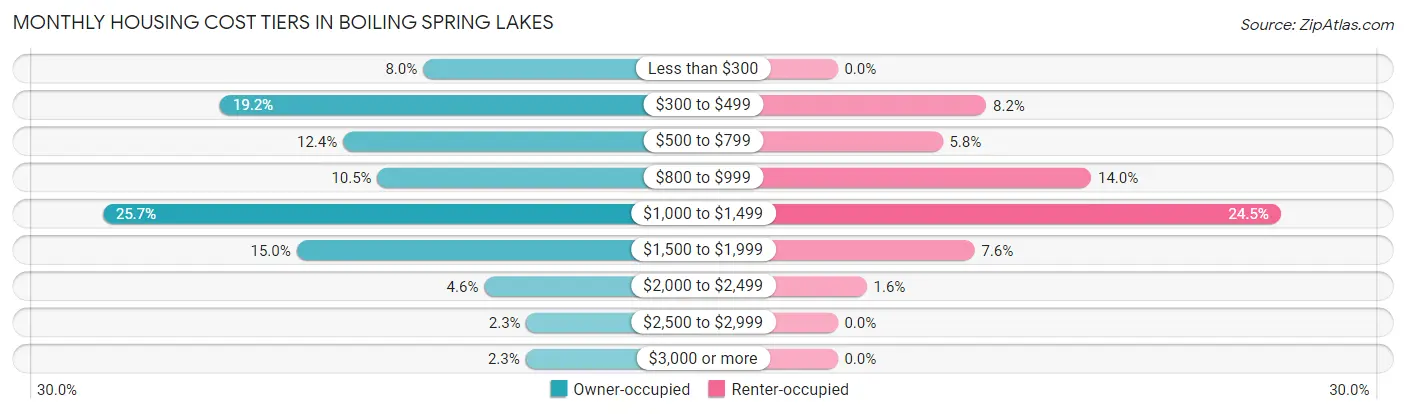
| Monthly Cost | Owner-occupied | Renter-occupied |
| Less than $300 | 168 (8.0%) | 0 (0.0%) |
| $300 to $499 | 404 (19.2%) | 51 (8.2%) |
| $500 to $799 | 261 (12.4%) | 36 (5.8%) |
| $800 to $999 | 221 (10.5%) | 87 (14.0%) |
| $1,000 to $1,499 | 540 (25.7%) | 152 (24.5%) |
| $1,500 to $1,999 | 315 (15.0%) | 47 (7.6%) |
| $2,000 to $2,499 | 97 (4.6%) | 10 (1.6%) |
| $2,500 to $2,999 | 48 (2.3%) | 0 (0.0%) |
| $3,000 or more | 49 (2.3%) | 0 (0.0%) |
| Total | 2,103 (100.0%) | 621 (100.0%) |
Physical Housing Characteristics in Boiling Spring Lakes
Housing Structures in Boiling Spring Lakes
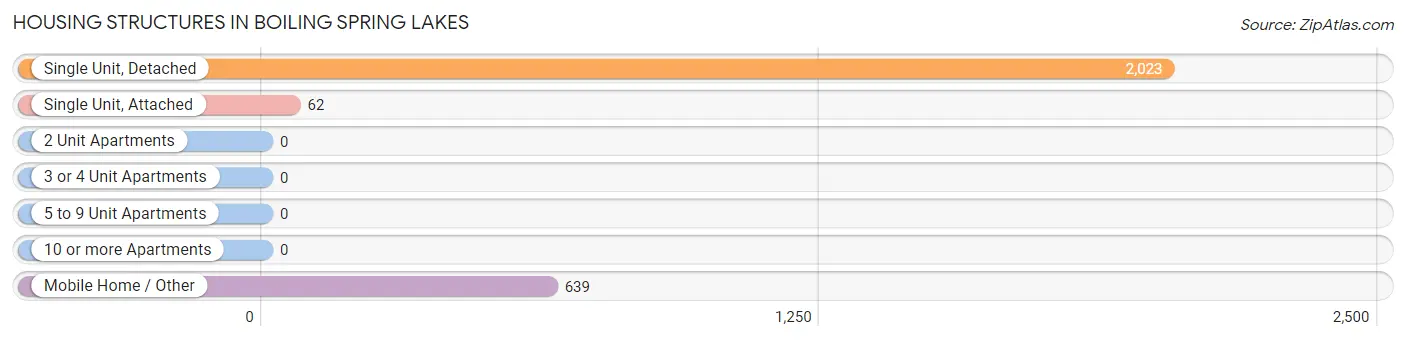
| Structure Type | # Housing Units | % Housing Units |
| Single Unit, Detached | 2,023 | 74.3% |
| Single Unit, Attached | 62 | 2.3% |
| 2 Unit Apartments | 0 | 0.0% |
| 3 or 4 Unit Apartments | 0 | 0.0% |
| 5 to 9 Unit Apartments | 0 | 0.0% |
| 10 or more Apartments | 0 | 0.0% |
| Mobile Home / Other | 639 | 23.5% |
| Total | 2,724 | 100.0% |
Housing Structures by Occupancy in Boiling Spring Lakes
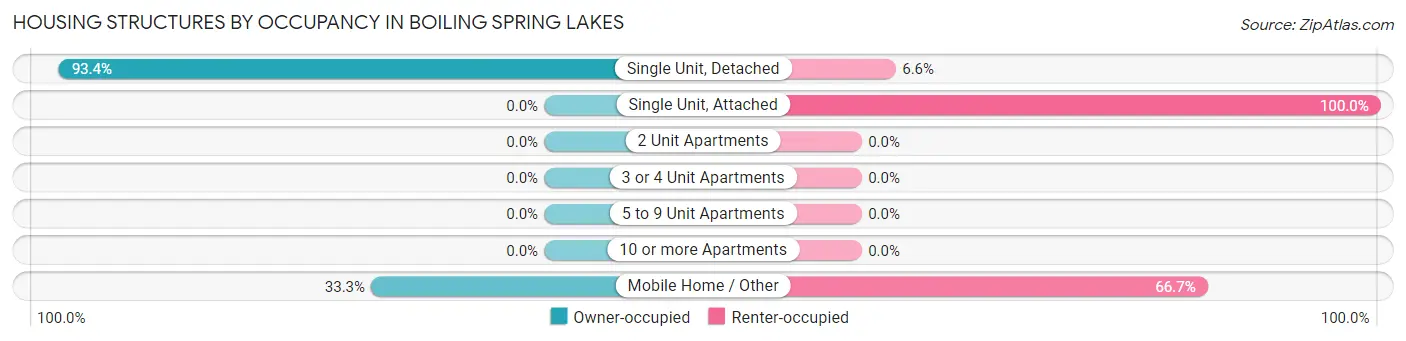
| Structure Type | Owner-occupied | Renter-occupied |
| Single Unit, Detached | 1,890 (93.4%) | 133 (6.6%) |
| Single Unit, Attached | 0 (0.0%) | 62 (100.0%) |
| 2 Unit Apartments | 0 (0.0%) | 0 (0.0%) |
| 3 or 4 Unit Apartments | 0 (0.0%) | 0 (0.0%) |
| 5 to 9 Unit Apartments | 0 (0.0%) | 0 (0.0%) |
| 10 or more Apartments | 0 (0.0%) | 0 (0.0%) |
| Mobile Home / Other | 213 (33.3%) | 426 (66.7%) |
| Total | 2,103 (77.2%) | 621 (22.8%) |
Housing Structures by Number of Rooms in Boiling Spring Lakes
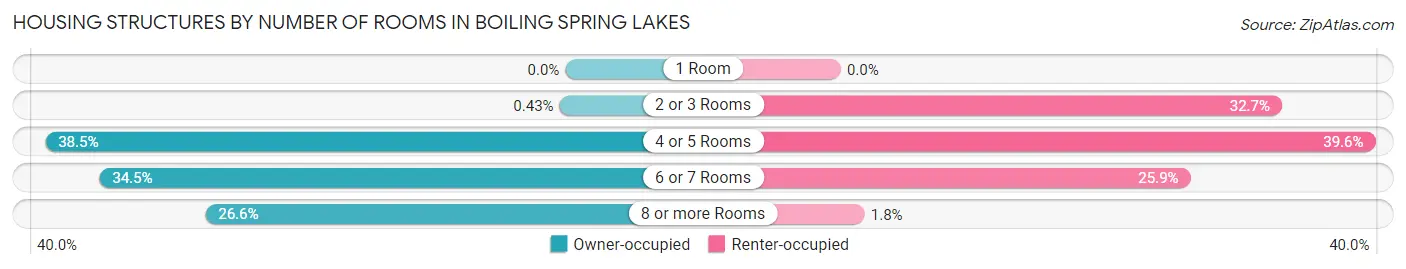
| Number of Rooms | Owner-occupied | Renter-occupied |
| 1 Room | 0 (0.0%) | 0 (0.0%) |
| 2 or 3 Rooms | 9 (0.4%) | 203 (32.7%) |
| 4 or 5 Rooms | 809 (38.5%) | 246 (39.6%) |
| 6 or 7 Rooms | 725 (34.5%) | 161 (25.9%) |
| 8 or more Rooms | 560 (26.6%) | 11 (1.8%) |
| Total | 2,103 (100.0%) | 621 (100.0%) |
Housing Structure by Heating Type in Boiling Spring Lakes
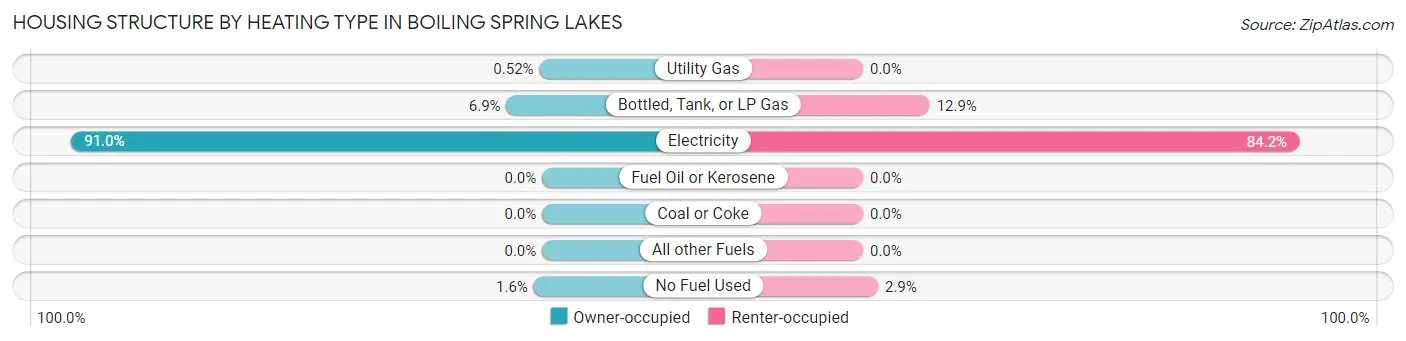
| Heating Type | Owner-occupied | Renter-occupied |
| Utility Gas | 11 (0.5%) | 0 (0.0%) |
| Bottled, Tank, or LP Gas | 145 (6.9%) | 80 (12.9%) |
| Electricity | 1,913 (91.0%) | 523 (84.2%) |
| Fuel Oil or Kerosene | 0 (0.0%) | 0 (0.0%) |
| Coal or Coke | 0 (0.0%) | 0 (0.0%) |
| All other Fuels | 0 (0.0%) | 0 (0.0%) |
| No Fuel Used | 34 (1.6%) | 18 (2.9%) |
| Total | 2,103 (100.0%) | 621 (100.0%) |
Household Vehicle Usage in Boiling Spring Lakes
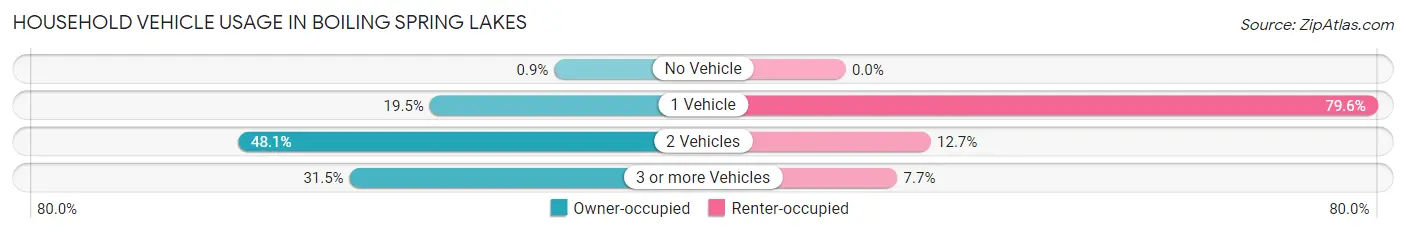
| Vehicles per Household | Owner-occupied | Renter-occupied |
| No Vehicle | 19 (0.9%) | 0 (0.0%) |
| 1 Vehicle | 410 (19.5%) | 494 (79.5%) |
| 2 Vehicles | 1,012 (48.1%) | 79 (12.7%) |
| 3 or more Vehicles | 662 (31.5%) | 48 (7.7%) |
| Total | 2,103 (100.0%) | 621 (100.0%) |
Real Estate & Mortgages in Boiling Spring Lakes
Real Estate and Mortgage Overview in Boiling Spring Lakes
| Characteristic | Without Mortgage | With Mortgage |
| Housing Units | 759 | 1,344 |
| Median Property Value | $231,400 | $224,600 |
| Median Household Income | $46,385 | $168 |
| Monthly Housing Costs | $437 | $49 |
| Real Estate Taxes | $1,496 | $11 |
Property Value by Mortgage Status in Boiling Spring Lakes
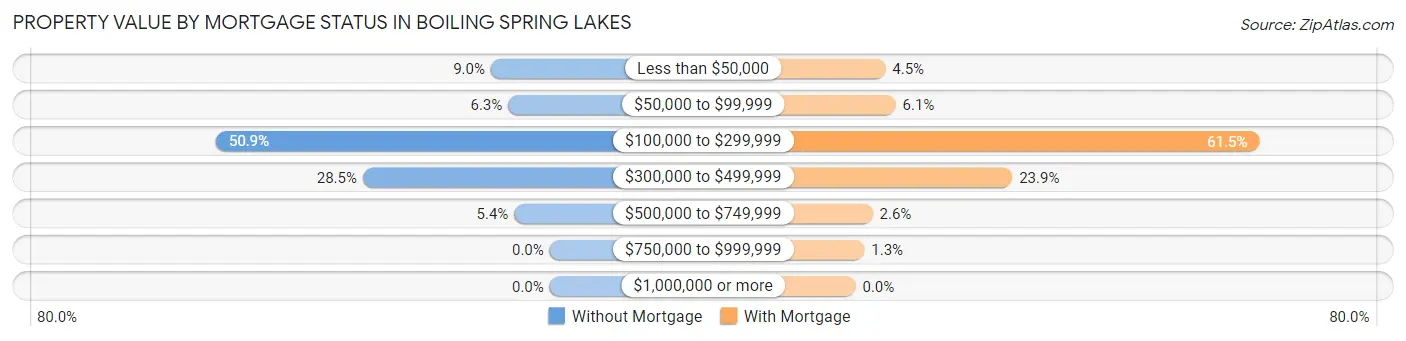
| Property Value | Without Mortgage | With Mortgage |
| Less than $50,000 | 68 (9.0%) | 61 (4.5%) |
| $50,000 to $99,999 | 48 (6.3%) | 82 (6.1%) |
| $100,000 to $299,999 | 386 (50.9%) | 827 (61.5%) |
| $300,000 to $499,999 | 216 (28.5%) | 321 (23.9%) |
| $500,000 to $749,999 | 41 (5.4%) | 35 (2.6%) |
| $750,000 to $999,999 | 0 (0.0%) | 18 (1.3%) |
| $1,000,000 or more | 0 (0.0%) | 0 (0.0%) |
| Total | 759 (100.0%) | 1,344 (100.0%) |
Household Income by Mortgage Status in Boiling Spring Lakes
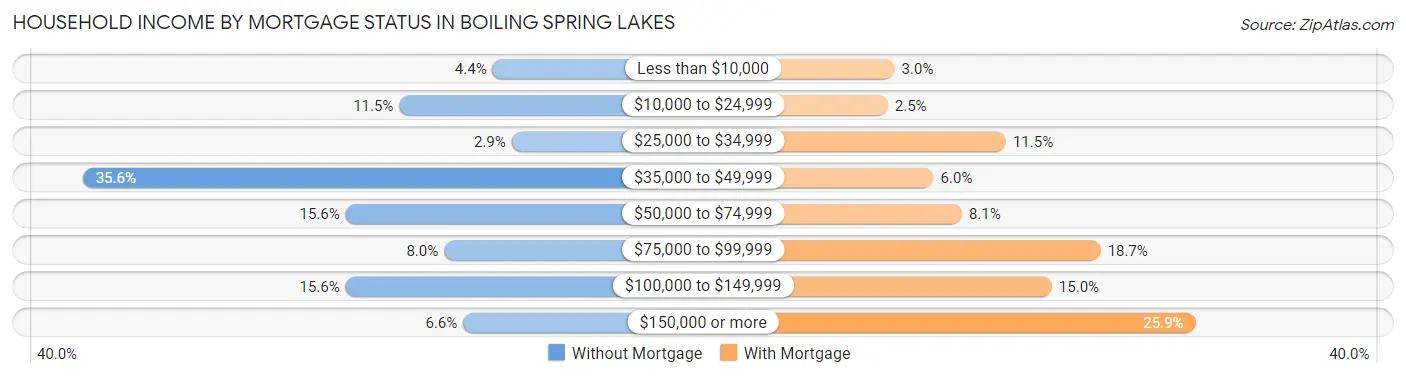
| Household Income | Without Mortgage | With Mortgage |
| Less than $10,000 | 33 (4.3%) | 40 (3.0%) |
| $10,000 to $24,999 | 87 (11.5%) | 33 (2.5%) |
| $25,000 to $34,999 | 22 (2.9%) | 154 (11.5%) |
| $35,000 to $49,999 | 270 (35.6%) | 80 (5.9%) |
| $50,000 to $74,999 | 118 (15.5%) | 109 (8.1%) |
| $75,000 to $99,999 | 61 (8.0%) | 251 (18.7%) |
| $100,000 to $149,999 | 118 (15.5%) | 201 (15.0%) |
| $150,000 or more | 50 (6.6%) | 348 (25.9%) |
| Total | 759 (100.0%) | 1,344 (100.0%) |
Property Value to Household Income Ratio in Boiling Spring Lakes
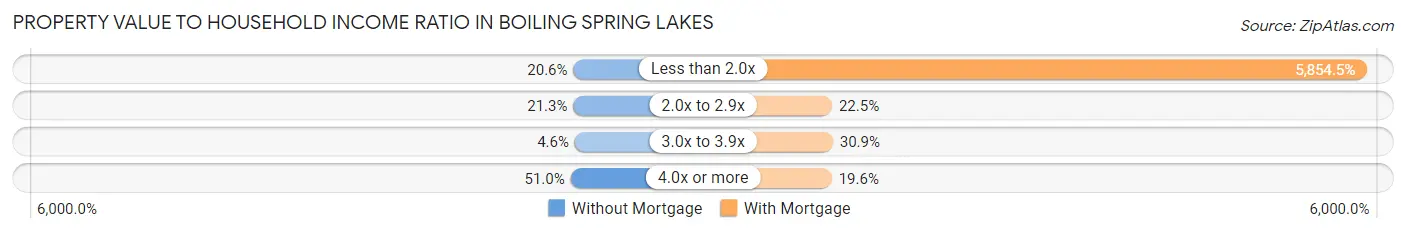
| Value-to-Income Ratio | Without Mortgage | With Mortgage |
| Less than 2.0x | 156 (20.5%) | 78,684 (5,854.5%) |
| 2.0x to 2.9x | 162 (21.3%) | 303 (22.5%) |
| 3.0x to 3.9x | 35 (4.6%) | 415 (30.9%) |
| 4.0x or more | 387 (51.0%) | 264 (19.6%) |
| Total | 759 (100.0%) | 1,344 (100.0%) |
Real Estate Taxes by Mortgage Status in Boiling Spring Lakes
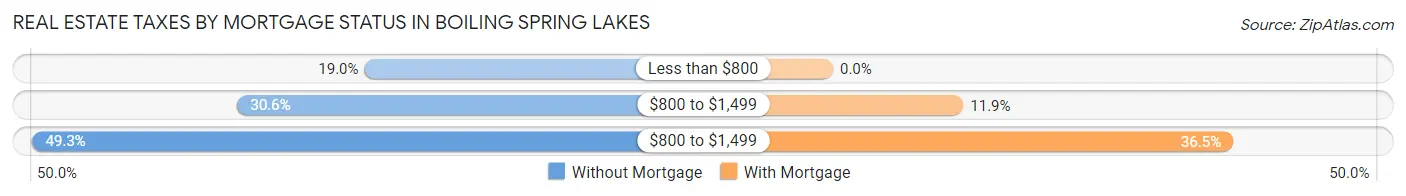
| Property Taxes | Without Mortgage | With Mortgage |
| Less than $800 | 144 (19.0%) | 0 (0.0%) |
| $800 to $1,499 | 232 (30.6%) | 160 (11.9%) |
| $800 to $1,499 | 374 (49.3%) | 491 (36.5%) |
| Total | 759 (100.0%) | 1,344 (100.0%) |
Health & Disability in Boiling Spring Lakes
Health Insurance Coverage by Age in Boiling Spring Lakes
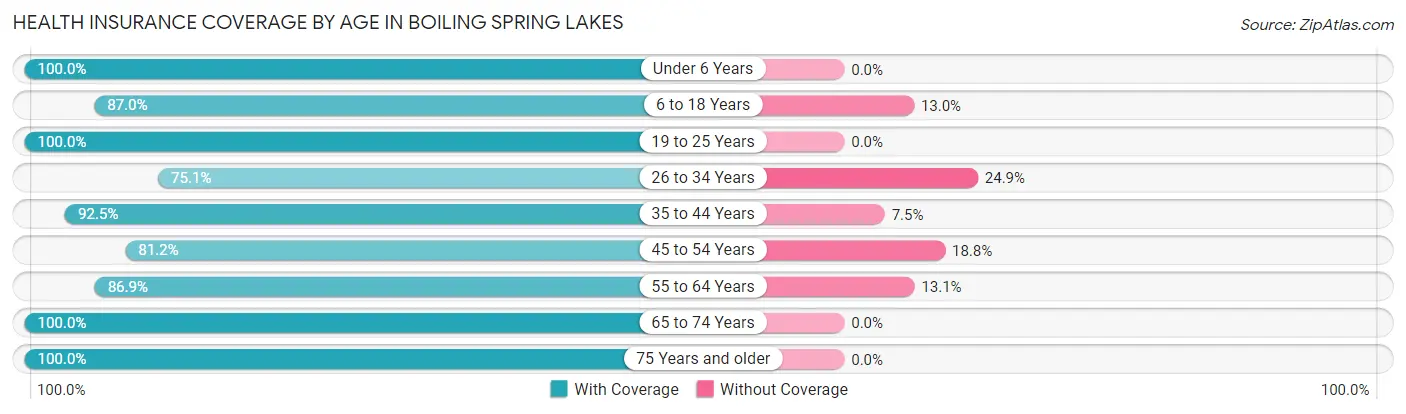
| Age Bracket | With Coverage | Without Coverage |
| Under 6 Years | 214 (100.0%) | 0 (0.0%) |
| 6 to 18 Years | 717 (87.0%) | 107 (13.0%) |
| 19 to 25 Years | 292 (100.0%) | 0 (0.0%) |
| 26 to 34 Years | 612 (75.1%) | 203 (24.9%) |
| 35 to 44 Years | 576 (92.5%) | 47 (7.5%) |
| 45 to 54 Years | 969 (81.2%) | 224 (18.8%) |
| 55 to 64 Years | 638 (86.9%) | 96 (13.1%) |
| 65 to 74 Years | 823 (100.0%) | 0 (0.0%) |
| 75 Years and older | 482 (100.0%) | 0 (0.0%) |
| Total | 5,323 (88.7%) | 677 (11.3%) |
Health Insurance Coverage by Citizenship Status in Boiling Spring Lakes
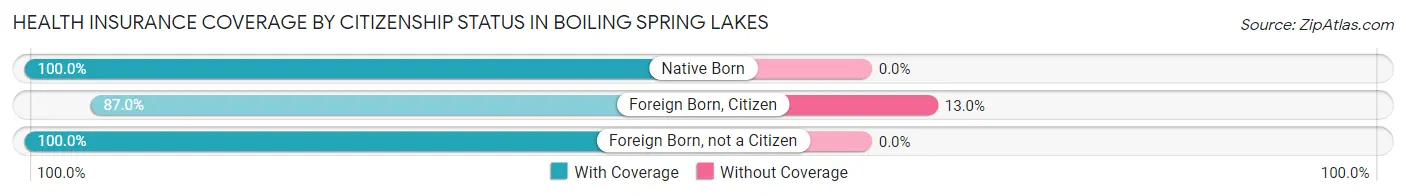
| Citizenship Status | With Coverage | Without Coverage |
| Native Born | 214 (100.0%) | 0 (0.0%) |
| Foreign Born, Citizen | 717 (87.0%) | 107 (13.0%) |
| Foreign Born, not a Citizen | 292 (100.0%) | 0 (0.0%) |
Health Insurance Coverage by Household Income in Boiling Spring Lakes
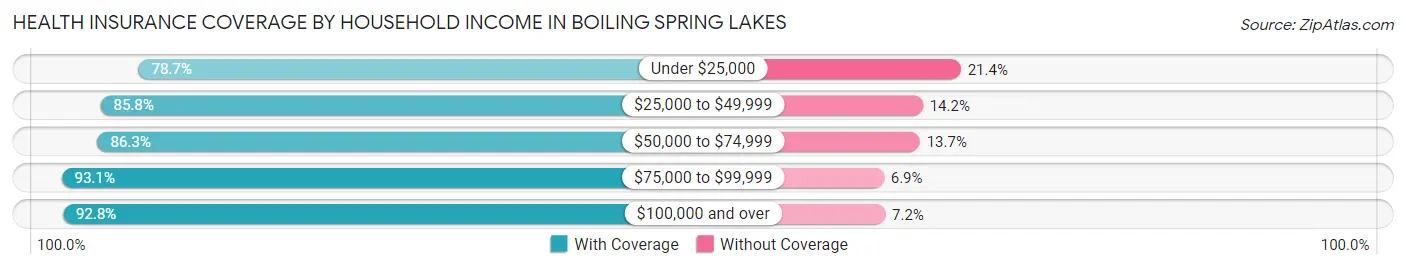
| Household Income | With Coverage | Without Coverage |
| Under $25,000 | 608 (78.6%) | 165 (21.3%) |
| $25,000 to $49,999 | 880 (85.8%) | 146 (14.2%) |
| $50,000 to $74,999 | 891 (86.3%) | 141 (13.7%) |
| $75,000 to $99,999 | 913 (93.1%) | 68 (6.9%) |
| $100,000 and over | 2,029 (92.8%) | 157 (7.2%) |
Public vs Private Health Insurance Coverage by Age in Boiling Spring Lakes
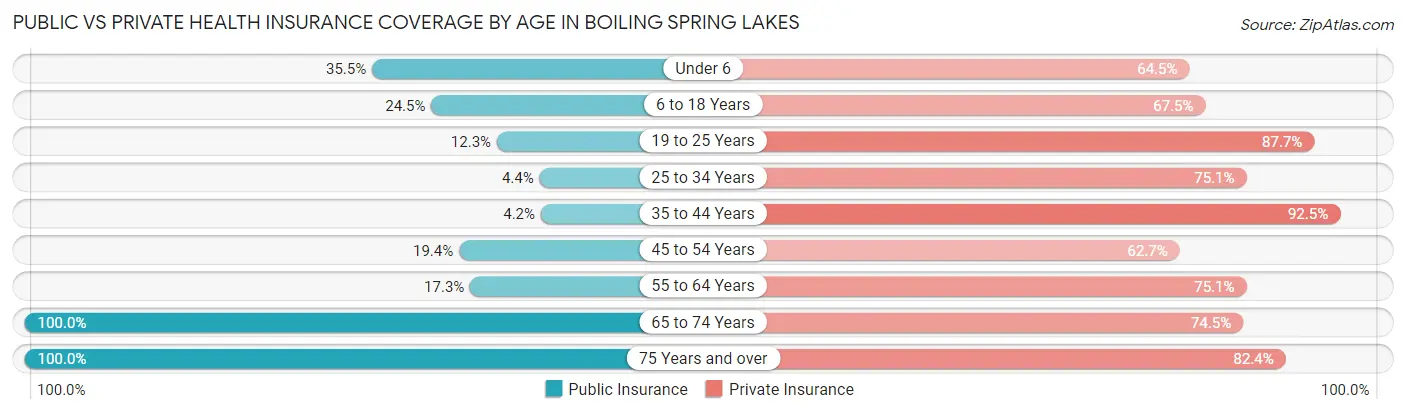
| Age Bracket | Public Insurance | Private Insurance |
| Under 6 | 76 (35.5%) | 138 (64.5%) |
| 6 to 18 Years | 202 (24.5%) | 556 (67.5%) |
| 19 to 25 Years | 36 (12.3%) | 256 (87.7%) |
| 25 to 34 Years | 36 (4.4%) | 612 (75.1%) |
| 35 to 44 Years | 26 (4.2%) | 576 (92.5%) |
| 45 to 54 Years | 231 (19.4%) | 748 (62.7%) |
| 55 to 64 Years | 127 (17.3%) | 551 (75.1%) |
| 65 to 74 Years | 823 (100.0%) | 613 (74.5%) |
| 75 Years and over | 482 (100.0%) | 397 (82.4%) |
| Total | 2,039 (34.0%) | 4,447 (74.1%) |
Disability Status by Sex by Age in Boiling Spring Lakes
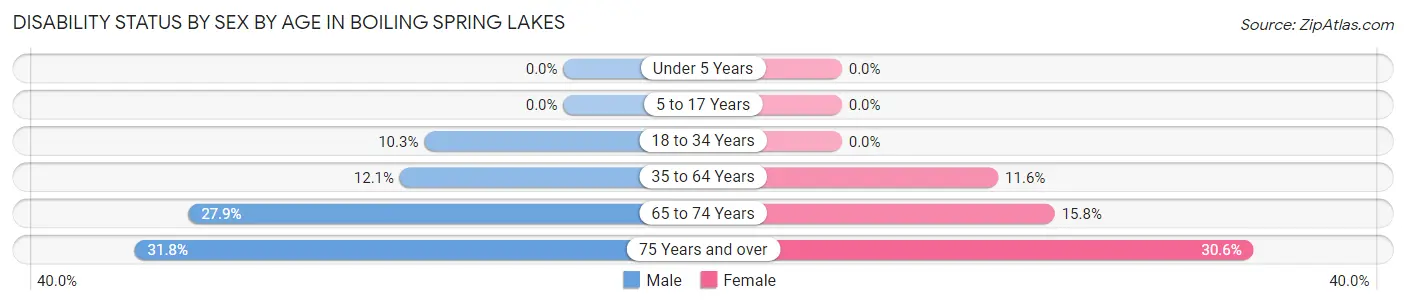
| Age Bracket | Male | Female |
| Under 5 Years | 0 (0.0%) | 0 (0.0%) |
| 5 to 17 Years | 0 (0.0%) | 0 (0.0%) |
| 18 to 34 Years | 62 (10.3%) | 0 (0.0%) |
| 35 to 64 Years | 158 (12.1%) | 145 (11.6%) |
| 65 to 74 Years | 83 (27.9%) | 83 (15.8%) |
| 75 Years and over | 92 (31.8%) | 59 (30.6%) |
Disability Class by Sex by Age in Boiling Spring Lakes
Disability Class: Hearing Difficulty
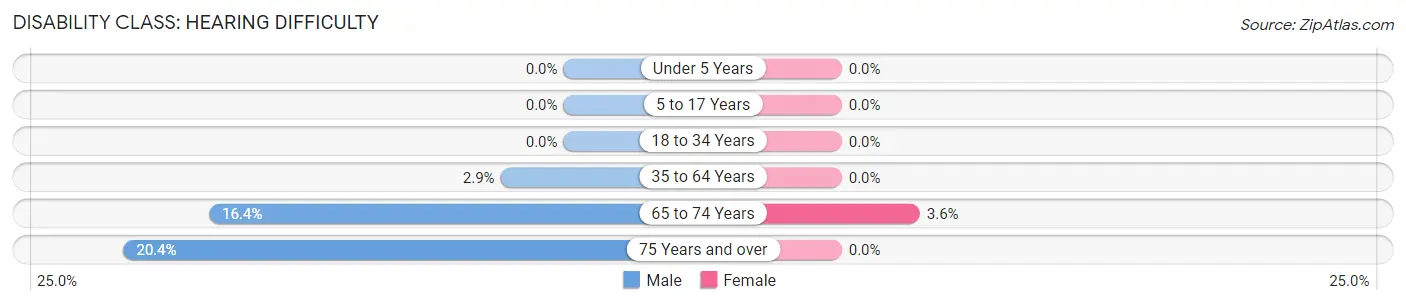
| Age Bracket | Male | Female |
| Under 5 Years | 0 (0.0%) | 0 (0.0%) |
| 5 to 17 Years | 0 (0.0%) | 0 (0.0%) |
| 18 to 34 Years | 0 (0.0%) | 0 (0.0%) |
| 35 to 64 Years | 38 (2.9%) | 0 (0.0%) |
| 65 to 74 Years | 49 (16.4%) | 19 (3.6%) |
| 75 Years and over | 59 (20.4%) | 0 (0.0%) |
Disability Class: Vision Difficulty
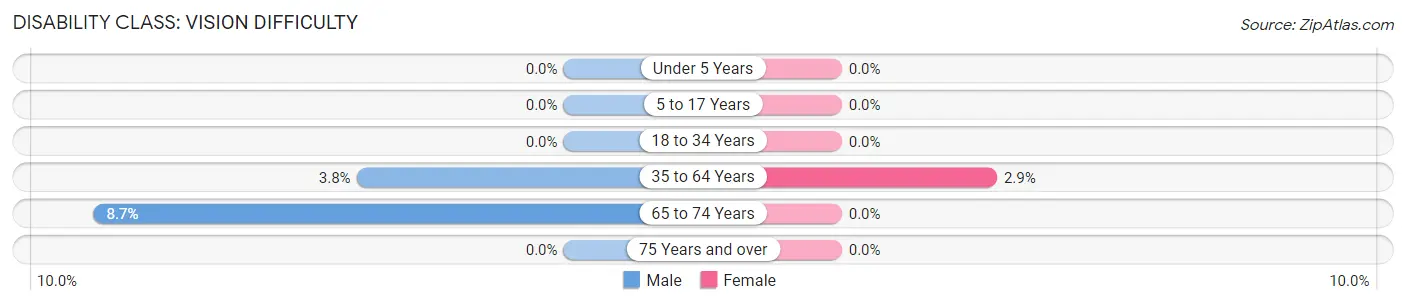
| Age Bracket | Male | Female |
| Under 5 Years | 0 (0.0%) | 0 (0.0%) |
| 5 to 17 Years | 0 (0.0%) | 0 (0.0%) |
| 18 to 34 Years | 0 (0.0%) | 0 (0.0%) |
| 35 to 64 Years | 50 (3.8%) | 36 (2.9%) |
| 65 to 74 Years | 26 (8.7%) | 0 (0.0%) |
| 75 Years and over | 0 (0.0%) | 0 (0.0%) |
Disability Class: Cognitive Difficulty
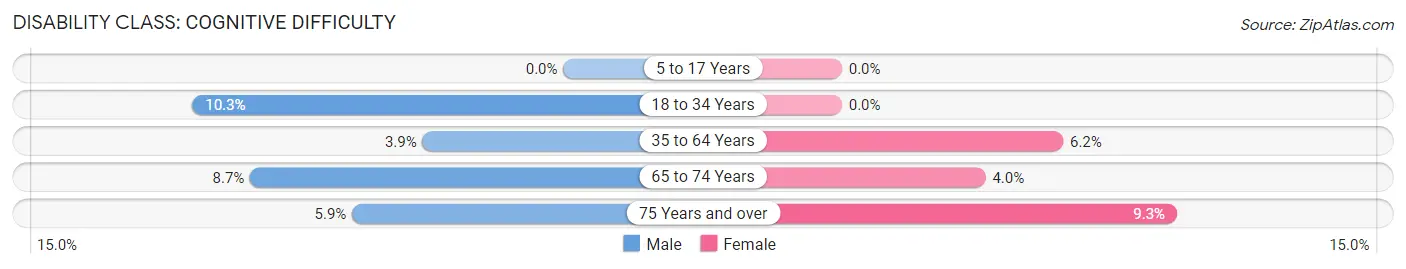
| Age Bracket | Male | Female |
| 5 to 17 Years | 0 (0.0%) | 0 (0.0%) |
| 18 to 34 Years | 62 (10.3%) | 0 (0.0%) |
| 35 to 64 Years | 51 (3.9%) | 77 (6.2%) |
| 65 to 74 Years | 26 (8.7%) | 21 (4.0%) |
| 75 Years and over | 17 (5.9%) | 18 (9.3%) |
Disability Class: Ambulatory Difficulty
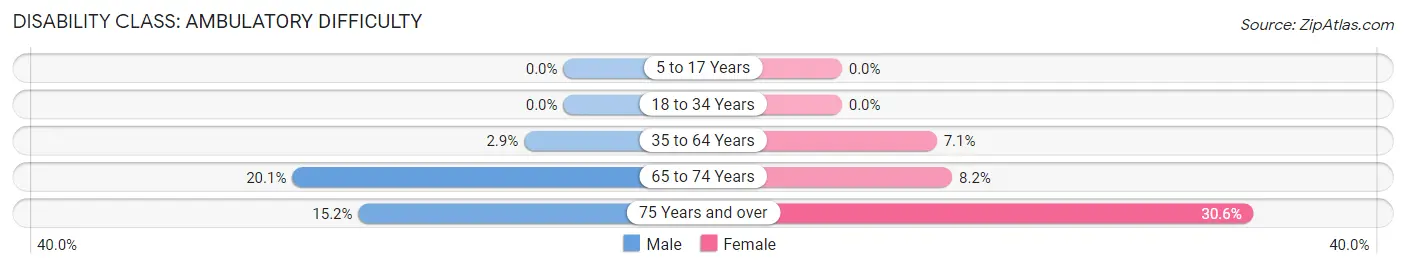
| Age Bracket | Male | Female |
| 5 to 17 Years | 0 (0.0%) | 0 (0.0%) |
| 18 to 34 Years | 0 (0.0%) | 0 (0.0%) |
| 35 to 64 Years | 38 (2.9%) | 88 (7.0%) |
| 65 to 74 Years | 60 (20.1%) | 43 (8.2%) |
| 75 Years and over | 44 (15.2%) | 59 (30.6%) |
Disability Class: Self-Care Difficulty
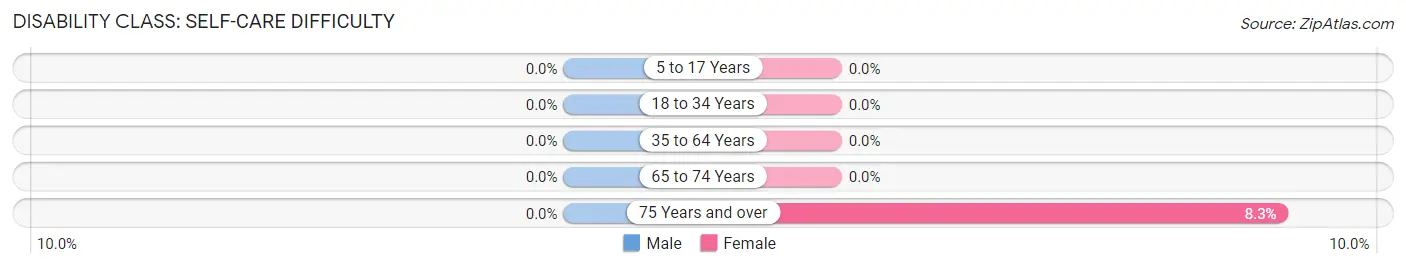
| Age Bracket | Male | Female |
| 5 to 17 Years | 0 (0.0%) | 0 (0.0%) |
| 18 to 34 Years | 0 (0.0%) | 0 (0.0%) |
| 35 to 64 Years | 0 (0.0%) | 0 (0.0%) |
| 65 to 74 Years | 0 (0.0%) | 0 (0.0%) |
| 75 Years and over | 0 (0.0%) | 16 (8.3%) |
Technology Access in Boiling Spring Lakes
Computing Device Access in Boiling Spring Lakes
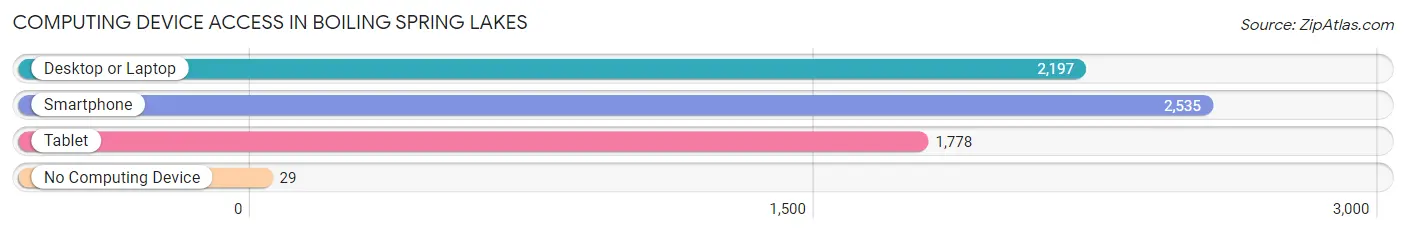
| Device Type | # Households | % Households |
| Desktop or Laptop | 2,197 | 80.6% |
| Smartphone | 2,535 | 93.1% |
| Tablet | 1,778 | 65.3% |
| No Computing Device | 29 | 1.1% |
| Total | 2,724 | 100.0% |
Internet Access in Boiling Spring Lakes
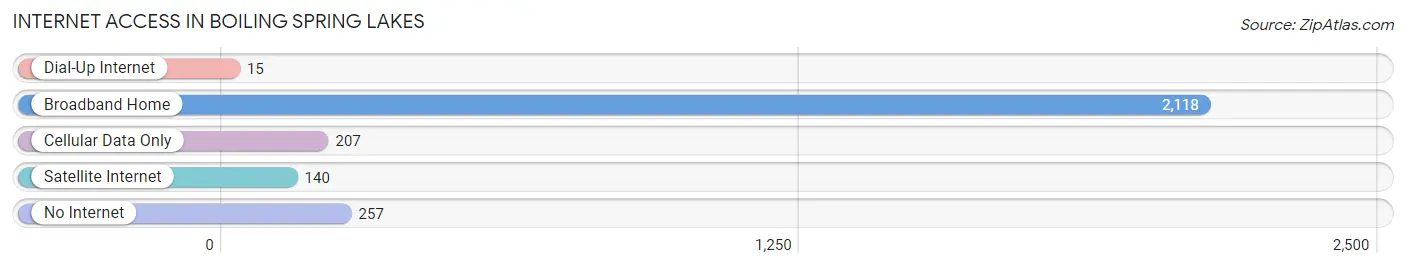
| Internet Type | # Households | % Households |
| Dial-Up Internet | 15 | 0.5% |
| Broadband Home | 2,118 | 77.7% |
| Cellular Data Only | 207 | 7.6% |
| Satellite Internet | 140 | 5.1% |
| No Internet | 257 | 9.4% |
| Total | 2,724 | 100.0% |
Boiling Spring Lakes Summary
Boiling Spring Lakes is a small city located in Brunswick County, North Carolina. It is situated on the banks of the Cape Fear River, approximately 20 miles north of Wilmington. The city was incorporated in 1965 and has a population of approximately 3,000 people.
Geography
Boiling Spring Lakes is located in the southeastern corner of Brunswick County, North Carolina. It is situated on the banks of the Cape Fear River, approximately 20 miles north of Wilmington. The city is bordered by the towns of Southport, Bolivia, and Leland. The city is located in the Coastal Plain region of North Carolina and is characterized by flat terrain and sandy soils. The climate is humid subtropical, with hot, humid summers and mild winters.
Economy
The economy of Boiling Spring Lakes is largely based on tourism and agriculture. The city is home to several tourist attractions, including the Boiling Spring Lakes Nature Preserve, which offers hiking, biking, and bird watching opportunities. The city also has several golf courses, a marina, and a public beach. Agriculture is also an important part of the local economy, with the city being home to several farms and nurseries.
Demographics
As of the 2010 census, Boiling Spring Lakes had a population of 3,068. The racial makeup of the city was 79.3% White, 14.2% African American, 0.5% Native American, 0.7% Asian, 0.1% Pacific Islander, and 4.2% from other races. Hispanic or Latino of any race were 4.2% of the population. The median household income was $41,944, and the median family income was $50,938.
The city is served by the Brunswick County School District, which includes Boiling Spring Lakes Elementary School, South Brunswick Middle School, and South Brunswick High School. The city is also home to several churches, including Boiling Spring Lakes Baptist Church, Boiling Spring Lakes United Methodist Church, and Boiling Spring Lakes Presbyterian Church.
Conclusion
Boiling Spring Lakes is a small city located in Brunswick County, North Carolina. It is situated on the banks of the Cape Fear River, approximately 20 miles north of Wilmington. The city was incorporated in 1965 and has a population of approximately 3,000 people. The economy of Boiling Spring Lakes is largely based on tourism and agriculture, and the city is home to several tourist attractions, golf courses, a marina, and a public beach. The racial makeup of the city is 79.3% White, 14.2% African American, 0.5% Native American, 0.7% Asian, 0.1% Pacific Islander, and 4.2% from other races. The median household income was $41,944, and the median family income was $50,938. Boiling Spring Lakes is served by the Brunswick County School District and is home to several churches.
Common Questions
What is the Total Population of Boiling Spring Lakes?
Total Population of Boiling Spring Lakes is 6,032.
What is the Total Male Population of Boiling Spring Lakes?
Total Male Population of Boiling Spring Lakes is 3,140.
What is the Total Female Population of Boiling Spring Lakes?
Total Female Population of Boiling Spring Lakes is 2,892.
What is the Ratio of Males per 100 Females in Boiling Spring Lakes?
There are 108.58 Males per 100 Females in Boiling Spring Lakes.
What is the Ratio of Females per 100 Males in Boiling Spring Lakes?
There are 92.10 Females per 100 Males in Boiling Spring Lakes.
What is the Median Population Age in Boiling Spring Lakes?
Median Population Age in Boiling Spring Lakes is 47.5 Years.
What is the Average Family Size in Boiling Spring Lakes
Average Family Size in Boiling Spring Lakes is 3.0 People.
What is the Average Household Size in Boiling Spring Lakes
Average Household Size in Boiling Spring Lakes is 2.2 People.
What is Per Capita Income in Boiling Spring Lakes?
Per Capita income in Boiling Spring Lakes is $33,068.
What is the Median Family Income in Boiling Spring Lakes?
Median Family Income in Boiling Spring Lakes is $80,942.
What is the Median Household income in Boiling Spring Lakes?
Median Household Income in Boiling Spring Lakes is $57,969.
What is Income or Wage Gap in Boiling Spring Lakes?
Income or Wage Gap in Boiling Spring Lakes is 57.6%.
Women in Boiling Spring Lakes earn 42.4 cents for every dollar earned by a man.
What is Inequality or Gini Index in Boiling Spring Lakes?
Inequality or Gini Index in Boiling Spring Lakes is 0.43.
How Large is the Labor Force in Boiling Spring Lakes?
There are 2,921 People in the Labor Forcein in Boiling Spring Lakes.
What is the Percentage of People in the Labor Force in Boiling Spring Lakes?
56.8% of People are in the Labor Force in Boiling Spring Lakes.
What is the Unemployment Rate in Boiling Spring Lakes?
Unemployment Rate in Boiling Spring Lakes is 6.2%.