Boardman, NC
Boardman Map
Boardman Overview
238
TOTAL POPULATION
115
MALE POPULATION
123
FEMALE POPULATION
93.50
MALES / 100 FEMALES
106.96
FEMALES / 100 MALES
46.5
MEDIAN AGE
2.9
AVG FAMILY SIZE
2.6
AVG HOUSEHOLD SIZE
$22,883
PER CAPITA INCOME
$56,111
AVG FAMILY INCOME
$55,764
AVG HOUSEHOLD INCOME
13.8%
WAGE / INCOME GAP [ % ]
86.2¢/ $1
WAGE / INCOME GAP [ $ ]
0.23
INEQUALITY / GINI INDEX
140
LABOR FORCE [ PEOPLE ]
63.6%
PERCENT IN LABOR FORCE
7.1%
UNEMPLOYMENT RATE
Boardman Area Codes
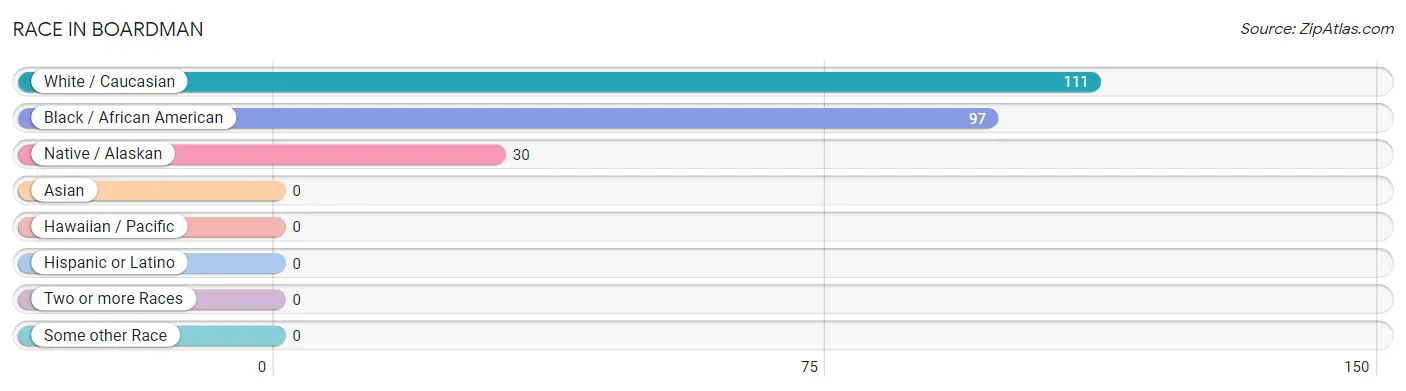
Race in Boardman
The most populous races in Boardman are White / Caucasian (111 | 46.6%), Black / African American (97 | 40.8%), and Native / Alaskan (30 | 12.6%).
| Race | # Population | % Population |
| Asian | 0 | 0.0% |
| Black / African American | 97 | 40.8% |
| Hawaiian / Pacific | 0 | 0.0% |
| Hispanic or Latino | 0 | 0.0% |
| Native / Alaskan | 30 | 12.6% |
| White / Caucasian | 111 | 46.6% |
| Two or more Races | 0 | 0.0% |
| Some other Race | 0 | 0.0% |
| Total | 238 | 100.0% |
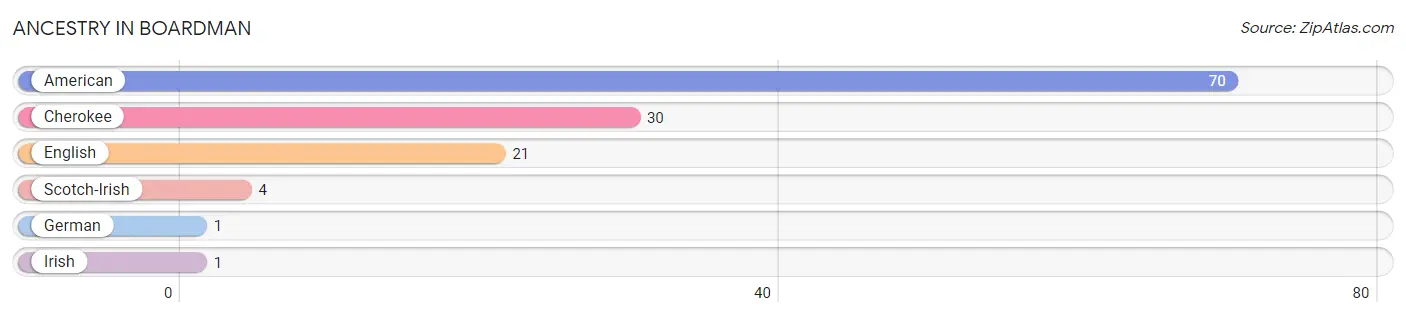
Ancestry in Boardman
The most populous ancestries reported in Boardman are American (70 | 29.4%), Cherokee (30 | 12.6%), English (21 | 8.8%), Scotch-Irish (4 | 1.7%), and German (1 | 0.4%), together accounting for 52.9% of all Boardman residents.
| Ancestry | # Population | % Population |
| American | 70 | 29.4% |
| Cherokee | 30 | 12.6% |
| English | 21 | 8.8% |
| German | 1 | 0.4% |
| Irish | 1 | 0.4% |
| Scotch-Irish | 4 | 1.7% | View All 6 Rows |
Immigrants in Boardman

| Immigration Origin | # Population | % Population | View All 0 Rows |
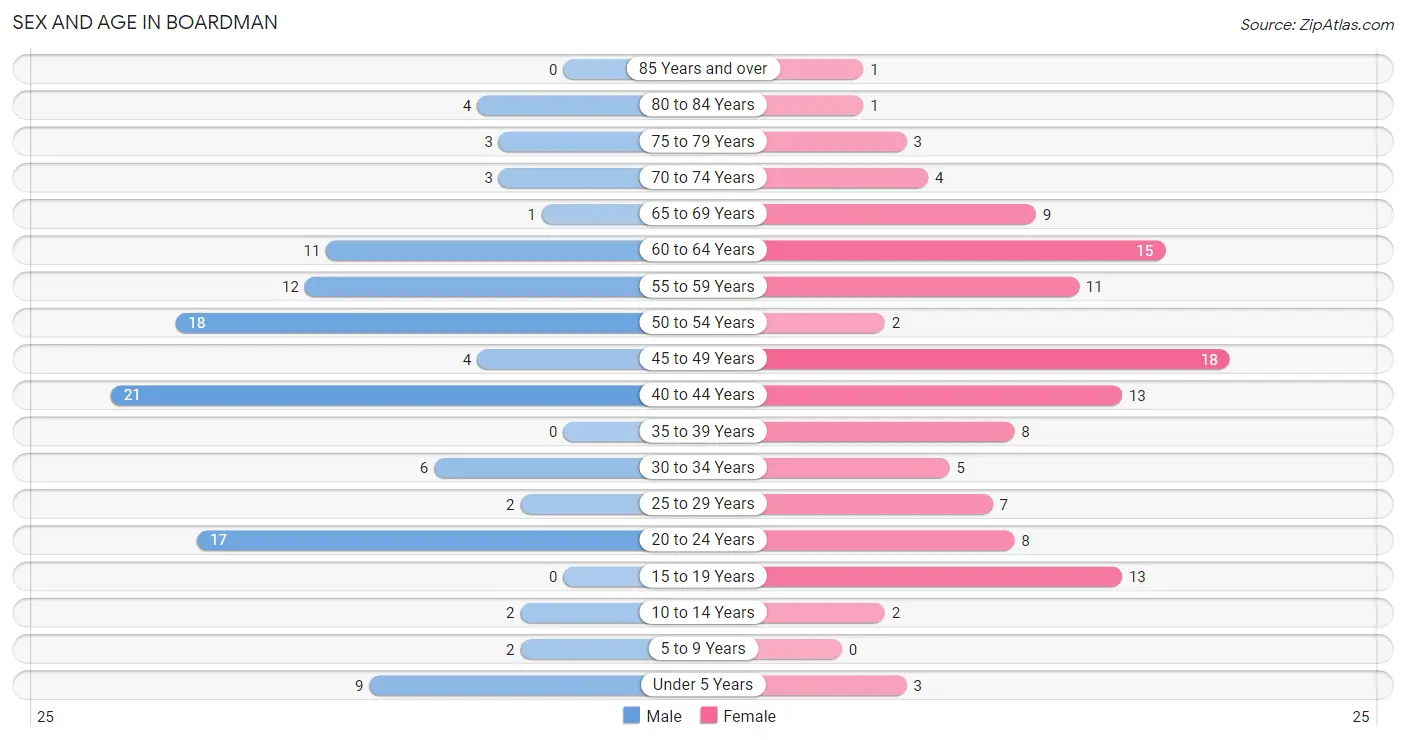
Sex and Age in Boardman
Sex and Age in Boardman
The most populous age groups in Boardman are 40 to 44 Years (21 | 18.3%) for men and 45 to 49 Years (18 | 14.6%) for women.
| Age Bracket | Male | Female |
| Under 5 Years | 9 (7.8%) | 3 (2.4%) |
| 5 to 9 Years | 2 (1.7%) | 0 (0.0%) |
| 10 to 14 Years | 2 (1.7%) | 2 (1.6%) |
| 15 to 19 Years | 0 (0.0%) | 13 (10.6%) |
| 20 to 24 Years | 17 (14.8%) | 8 (6.5%) |
| 25 to 29 Years | 2 (1.7%) | 7 (5.7%) |
| 30 to 34 Years | 6 (5.2%) | 5 (4.1%) |
| 35 to 39 Years | 0 (0.0%) | 8 (6.5%) |
| 40 to 44 Years | 21 (18.3%) | 13 (10.6%) |
| 45 to 49 Years | 4 (3.5%) | 18 (14.6%) |
| 50 to 54 Years | 18 (15.7%) | 2 (1.6%) |
| 55 to 59 Years | 12 (10.4%) | 11 (8.9%) |
| 60 to 64 Years | 11 (9.6%) | 15 (12.2%) |
| 65 to 69 Years | 1 (0.9%) | 9 (7.3%) |
| 70 to 74 Years | 3 (2.6%) | 4 (3.3%) |
| 75 to 79 Years | 3 (2.6%) | 3 (2.4%) |
| 80 to 84 Years | 4 (3.5%) | 1 (0.8%) |
| 85 Years and over | 0 (0.0%) | 1 (0.8%) |
| Total | 115 (100.0%) | 123 (100.0%) |
Families and Households in Boardman
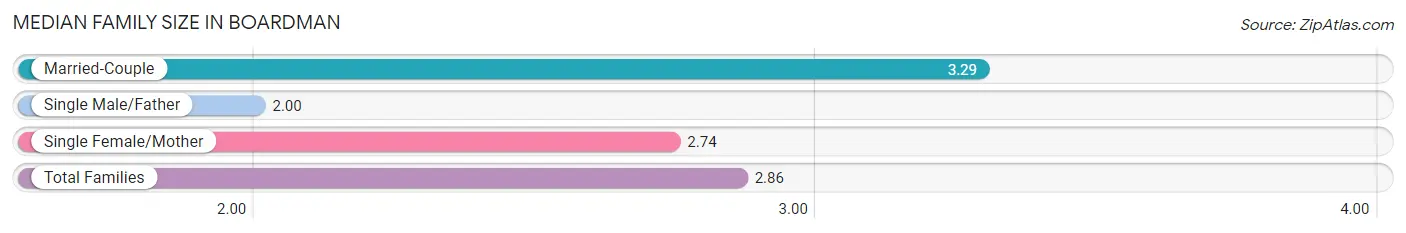
Median Family Size in Boardman
The median family size in Boardman is 2.86 persons per family, with married-couple families (41 | 52.6%) accounting for the largest median family size of 3.29 persons per family. On the other hand, single male/father families (18 | 23.1%) represent the smallest median family size with 2.00 persons per family.
| Family Type | # Families | Family Size |
| Married-Couple | 41 (52.6%) | 3.29 |
| Single Male/Father | 18 (23.1%) | 2.00 |
| Single Female/Mother | 19 (24.4%) | 2.74 |
| Total Families | 78 (100.0%) | 2.86 |
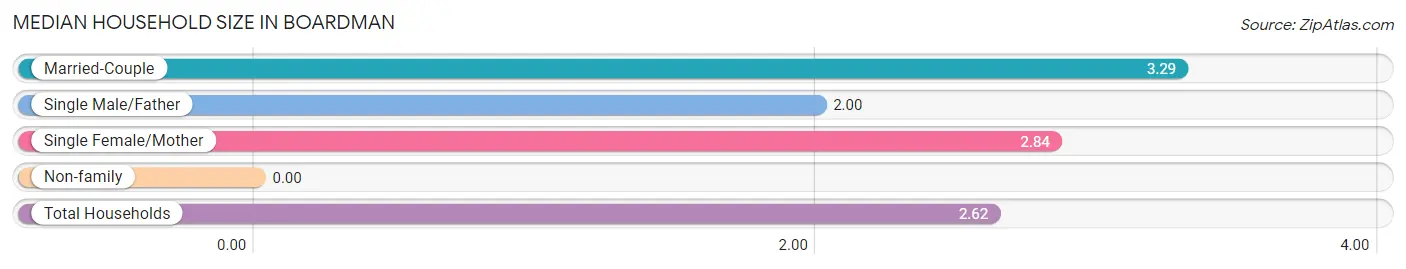
Median Household Size in Boardman
| Household Type | # Households | Household Size |
| Married-Couple | 41 (45.1%) | 3.29 |
| Single Male/Father | 18 (19.8%) | 2.00 |
| Single Female/Mother | 19 (20.9%) | 2.84 |
| Non-family | 13 (14.3%) | - |
| Total Households | 91 (100.0%) | 2.62 |
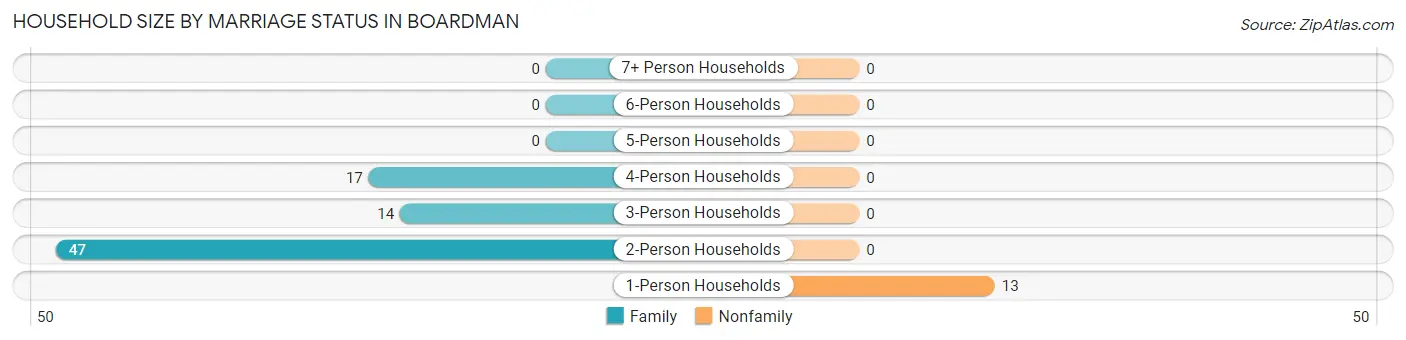
Household Size by Marriage Status in Boardman
Out of a total of 91 households in Boardman, 78 (85.7%) are family households, while 13 (14.3%) are nonfamily households. The most numerous type of family households are 2-person households, comprising 47, and the most common type of nonfamily households are 1-person households, comprising 13.
| Household Size | Family Households | Nonfamily Households |
| 1-Person Households | - | 13 (14.3%) |
| 2-Person Households | 47 (51.6%) | 0 (0.0%) |
| 3-Person Households | 14 (15.4%) | 0 (0.0%) |
| 4-Person Households | 17 (18.7%) | 0 (0.0%) |
| 5-Person Households | 0 (0.0%) | 0 (0.0%) |
| 6-Person Households | 0 (0.0%) | 0 (0.0%) |
| 7+ Person Households | 0 (0.0%) | 0 (0.0%) |
| Total | 78 (85.7%) | 13 (14.3%) |
Female Fertility in Boardman
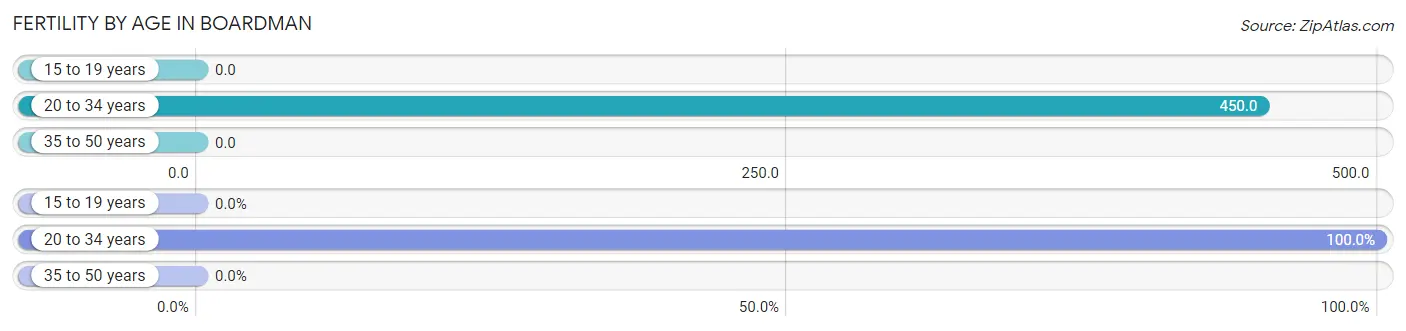
Fertility by Age in Boardman
Average fertility rate in Boardman is 125.0 births per 1,000 women. Women in the age bracket of 20 to 34 years have the highest fertility rate with 450.0 births per 1,000 women. Women in the age bracket of 20 to 34 years acount for 100.0% of all women with births.
| Age Bracket | Women with Births | Births / 1,000 Women |
| 15 to 19 years | 0 (0.0%) | 0.0 |
| 20 to 34 years | 9 (100.0%) | 450.0 |
| 35 to 50 years | 0 (0.0%) | 0.0 |
| Total | 9 (100.0%) | 125.0 |
Fertility by Age by Marriage Status in Boardman
22.2% of women with births (9) in Boardman are married. The highest percentage of unmarried women with births falls into 20 to 34 years age bracket with 77.8% of them unmarried at the time of birth, while the lowest percentage of unmarried women with births belong to 20 to 34 years age bracket with 77.8% of them unmarried.
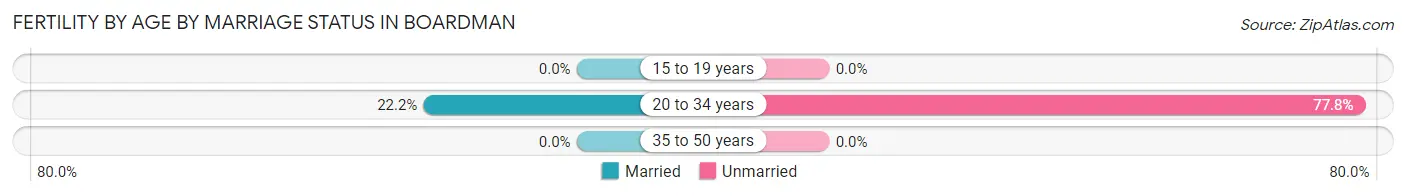
| Age Bracket | Married | Unmarried |
| 15 to 19 years | 0 (0.0%) | 0 (0.0%) |
| 20 to 34 years | 2 (22.2%) | 7 (77.8%) |
| 35 to 50 years | 0 (0.0%) | 0 (0.0%) |
| Total | 2 (22.2%) | 7 (77.8%) |
Fertility by Education in Boardman
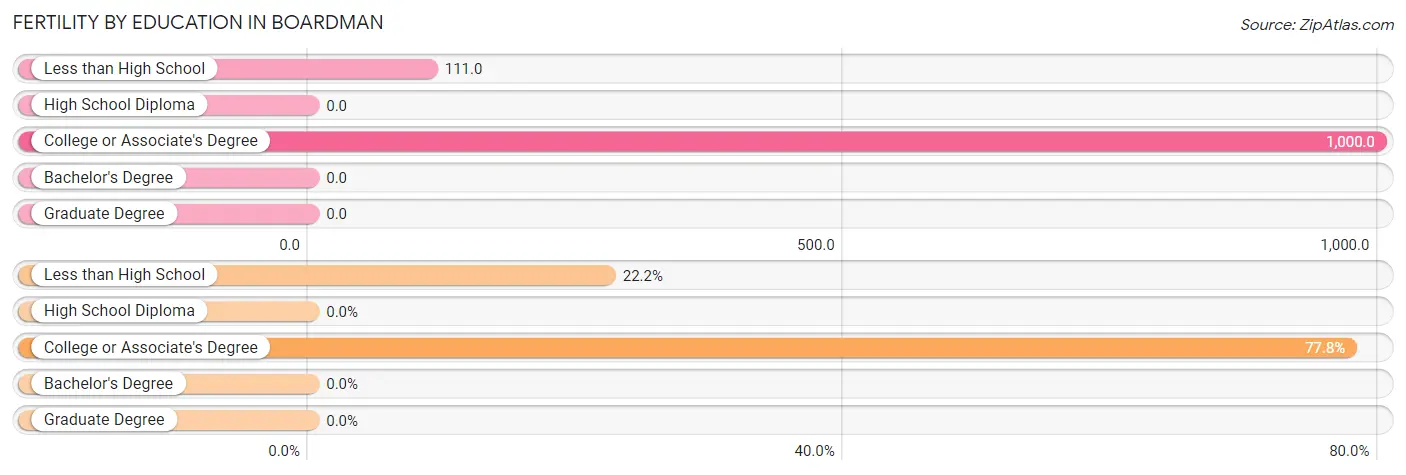
| Educational Attainment | Women with Births | Births / 1,000 Women |
| Less than High School | 2 (22.2%) | 111.0 |
| High School Diploma | 0 (0.0%) | 0.0 |
| College or Associate's Degree | 7 (77.8%) | 1,000.0 |
| Bachelor's Degree | 0 (0.0%) | 0.0 |
| Graduate Degree | 0 (0.0%) | 0.0 |
| Total | 9 (100.0%) | 125.0 |
Fertility by Education by Marriage Status in Boardman
77.8% of women with births in Boardman are unmarried. Women with the educational attainment of less than high school are most likely to be married with 100.0% of them married at childbirth, while women with the educational attainment of college or associate's degree are least likely to be married with 100.0% of them unmarried at childbirth.
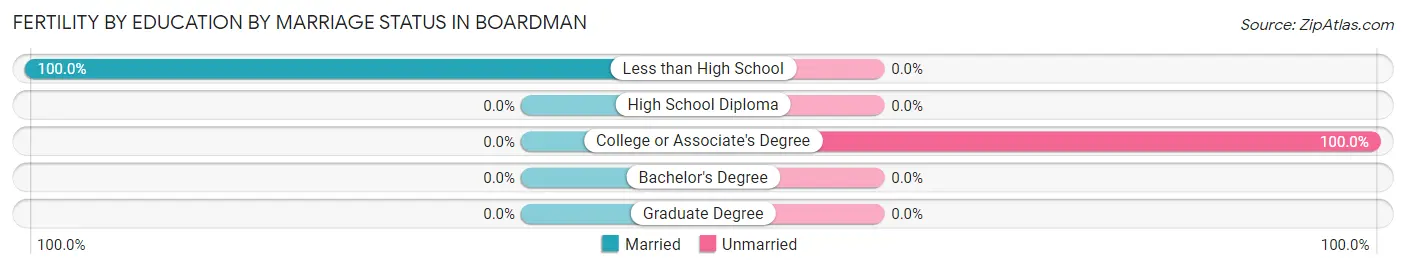
| Educational Attainment | Married | Unmarried |
| Less than High School | 2 (100.0%) | 0 (0.0%) |
| High School Diploma | 0 (0.0%) | 0 (0.0%) |
| College or Associate's Degree | 0 (0.0%) | 7 (100.0%) |
| Bachelor's Degree | 0 (0.0%) | 0 (0.0%) |
| Graduate Degree | 0 (0.0%) | 0 (0.0%) |
| Total | 2 (22.2%) | 7 (77.8%) |
Income in Boardman
Income Overview in Boardman
Per Capita Income in Boardman is $22,883, while median incomes of families and households are $56,111 and $55,764 respectively.
| Characteristic | Number | Measure |
| Per Capita Income | 238 | $22,883 |
| Median Family Income | 78 | $56,111 |
| Mean Family Income | 78 | $55,224 |
| Median Household Income | 91 | $55,764 |
| Mean Household Income | 91 | $55,166 |
| Income Deficit | 78 | $0 |
| Wage / Income Gap (%) | 238 | 13.85% |
| Wage / Income Gap ($) | 238 | 86.15¢ per $1 |
| Gini / Inequality Index | 238 | 0.23 |
Earnings by Sex in Boardman
Average Earnings in Boardman are $25,595, $26,786 for men and $23,077 for women, a difference of 13.9%.
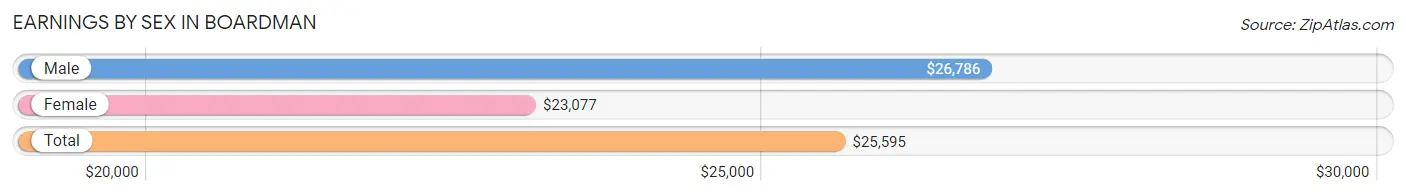
| Sex | Number | Average Earnings |
| Male | 80 (61.5%) | $26,786 |
| Female | 50 (38.5%) | $23,077 |
| Total | 130 (100.0%) | $25,595 |
Earnings by Sex by Income Bracket in Boardman
The most common earnings brackets in Boardman are $25,000 to $29,999 for men (21 | 26.3%) and $22,500 to $24,999 for women (13 | 26.0%).
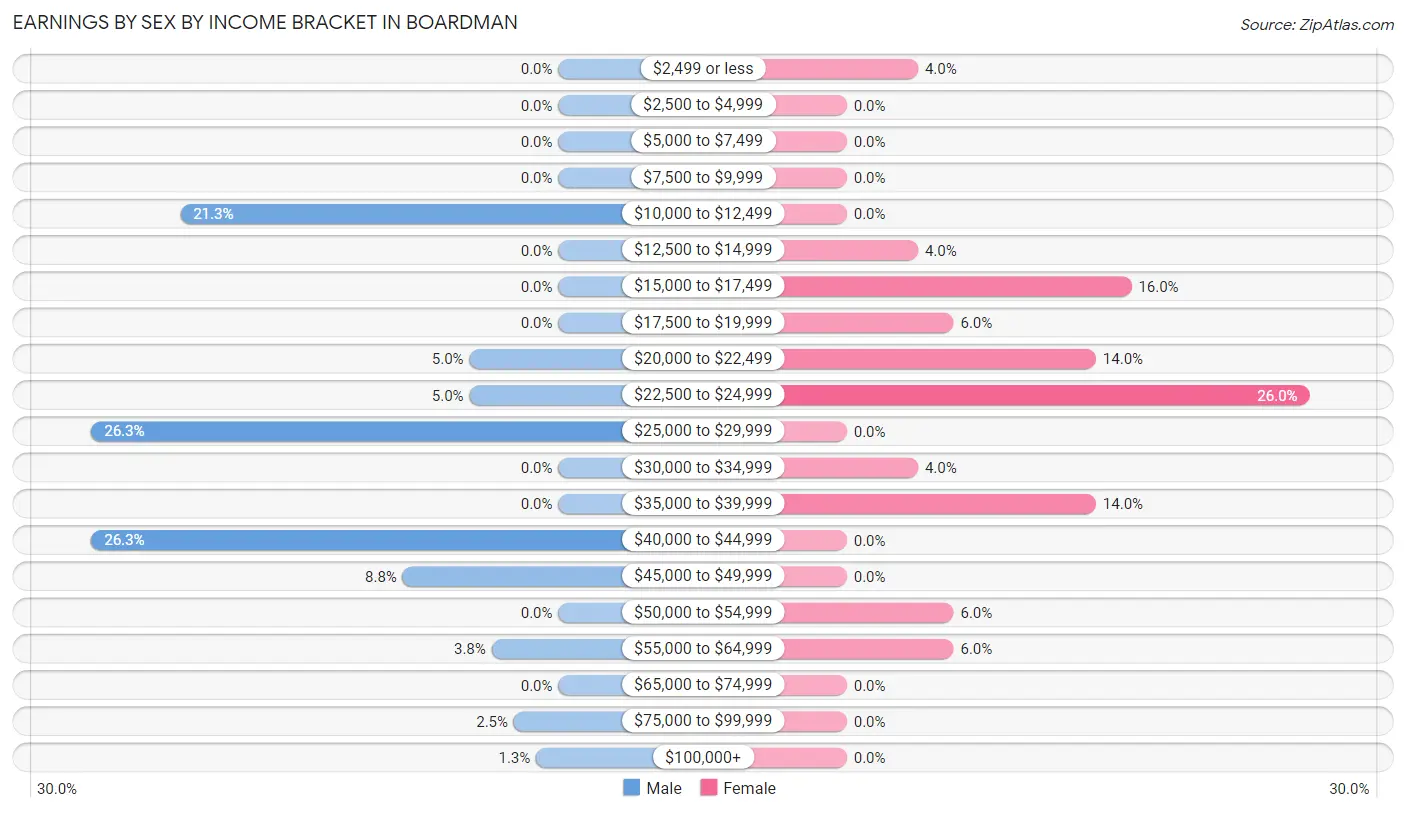
| Income | Male | Female |
| $2,499 or less | 0 (0.0%) | 2 (4.0%) |
| $2,500 to $4,999 | 0 (0.0%) | 0 (0.0%) |
| $5,000 to $7,499 | 0 (0.0%) | 0 (0.0%) |
| $7,500 to $9,999 | 0 (0.0%) | 0 (0.0%) |
| $10,000 to $12,499 | 17 (21.2%) | 0 (0.0%) |
| $12,500 to $14,999 | 0 (0.0%) | 2 (4.0%) |
| $15,000 to $17,499 | 0 (0.0%) | 8 (16.0%) |
| $17,500 to $19,999 | 0 (0.0%) | 3 (6.0%) |
| $20,000 to $22,499 | 4 (5.0%) | 7 (14.0%) |
| $22,500 to $24,999 | 4 (5.0%) | 13 (26.0%) |
| $25,000 to $29,999 | 21 (26.3%) | 0 (0.0%) |
| $30,000 to $34,999 | 0 (0.0%) | 2 (4.0%) |
| $35,000 to $39,999 | 0 (0.0%) | 7 (14.0%) |
| $40,000 to $44,999 | 21 (26.3%) | 0 (0.0%) |
| $45,000 to $49,999 | 7 (8.7%) | 0 (0.0%) |
| $50,000 to $54,999 | 0 (0.0%) | 3 (6.0%) |
| $55,000 to $64,999 | 3 (3.7%) | 3 (6.0%) |
| $65,000 to $74,999 | 0 (0.0%) | 0 (0.0%) |
| $75,000 to $99,999 | 2 (2.5%) | 0 (0.0%) |
| $100,000+ | 1 (1.3%) | 0 (0.0%) |
| Total | 80 (100.0%) | 50 (100.0%) |
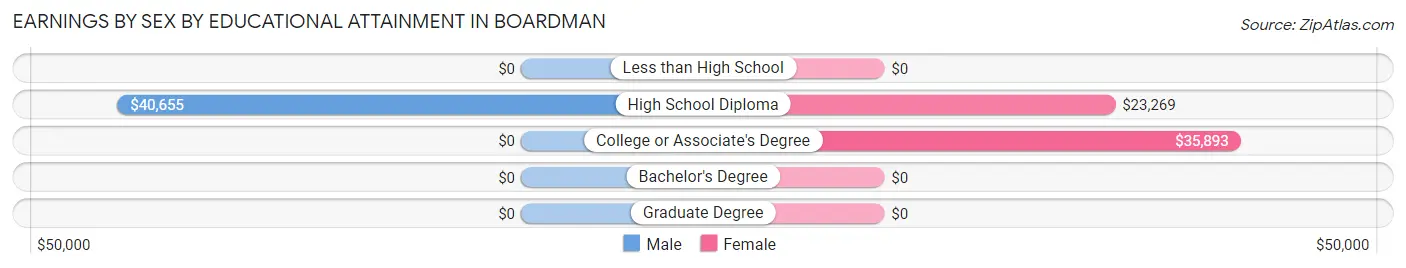
Earnings by Sex by Educational Attainment in Boardman
Average earnings in Boardman are $40,298 for men and $24,038 for women, a difference of 40.4%. Men with an educational attainment of high school diploma enjoy the highest average annual earnings of $40,655, while those with high school diploma education earn the least with $40,655. Women with an educational attainment of college or associate's degree earn the most with the average annual earnings of $35,893, while those with high school diploma education have the smallest earnings of $23,269.
| Educational Attainment | Male Income | Female Income |
| Less than High School | - | - |
| High School Diploma | $40,655 | $23,269 |
| College or Associate's Degree | - | - |
| Bachelor's Degree | - | - |
| Graduate Degree | - | - |
| Total | $40,298 | $24,038 |
Family Income in Boardman
Family Income Brackets in Boardman
According to the Boardman family income data, there are 44 families falling into the $50,000 to $74,999 income range, which is the most common income bracket and makes up 56.4% of all families.
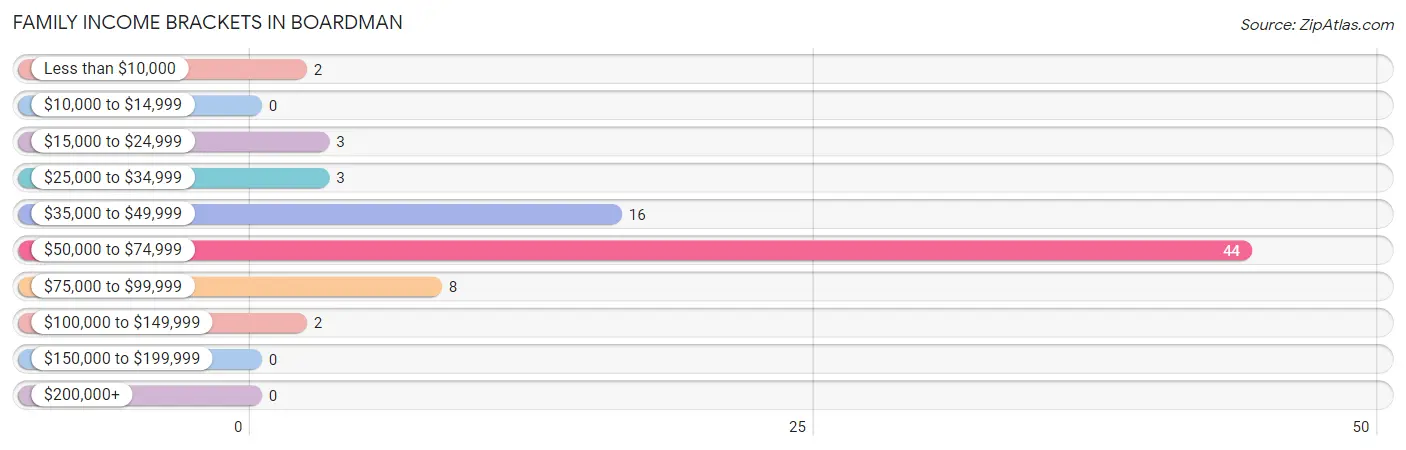
| Income Bracket | # Families | % Families |
| Less than $10,000 | 2 | 2.6% |
| $10,000 to $14,999 | 0 | 0.0% |
| $15,000 to $24,999 | 3 | 3.8% |
| $25,000 to $34,999 | 3 | 3.8% |
| $35,000 to $49,999 | 16 | 20.5% |
| $50,000 to $74,999 | 44 | 56.4% |
| $75,000 to $99,999 | 8 | 10.3% |
| $100,000 to $149,999 | 2 | 2.6% |
| $150,000 to $199,999 | 0 | 0.0% |
| $200,000+ | 0 | 0.0% |
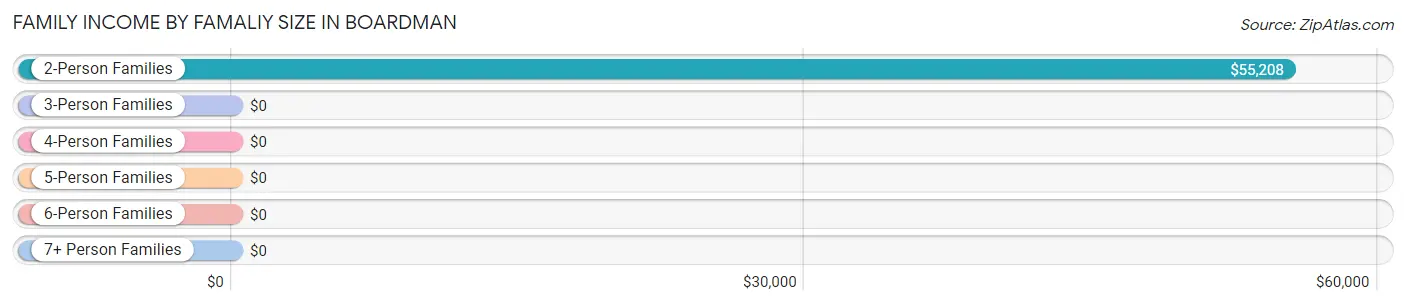
Family Income by Famaliy Size in Boardman
2-person families (47 | 60.3%) account for the highest median family income in Boardman with $55,208 per family, while 2-person families (47 | 60.3%) have the highest median income of $27,604 per family member.
| Income Bracket | # Families | Median Income |
| 2-Person Families | 47 (60.3%) | $55,208 |
| 3-Person Families | 17 (21.8%) | $0 |
| 4-Person Families | 14 (17.9%) | $0 |
| 5-Person Families | 0 (0.0%) | $0 |
| 6-Person Families | 0 (0.0%) | $0 |
| 7+ Person Families | 0 (0.0%) | $0 |
| Total | 78 (100.0%) | $56,111 |
Family Income by Number of Earners in Boardman
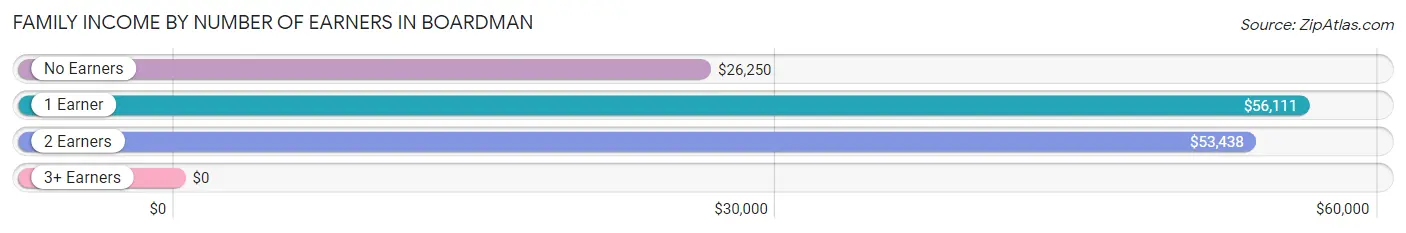
| Number of Earners | # Families | Median Income |
| No Earners | 10 (12.8%) | $26,250 |
| 1 Earner | 48 (61.5%) | $56,111 |
| 2 Earners | 7 (9.0%) | $53,438 |
| 3+ Earners | 13 (16.7%) | $0 |
| Total | 78 (100.0%) | $56,111 |
Household Income in Boardman
Household Income Brackets in Boardman
With 47 households falling in the category, the $50,000 to $74,999 income range is the most frequent in Boardman, accounting for 51.6% of all households.
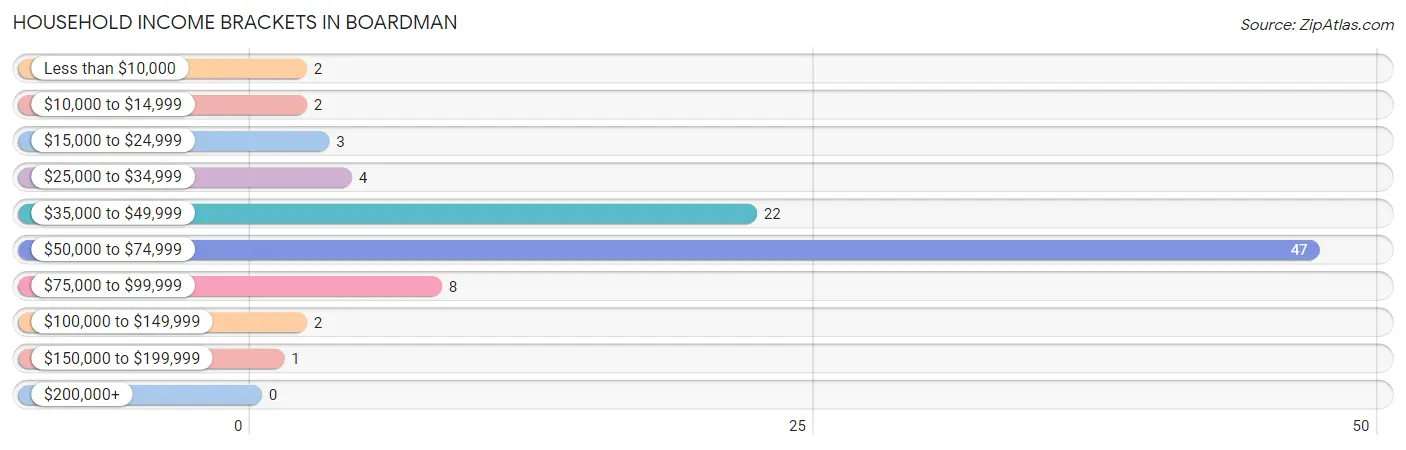
| Income Bracket | # Households | % Households |
| Less than $10,000 | 2 | 2.2% |
| $10,000 to $14,999 | 2 | 2.2% |
| $15,000 to $24,999 | 3 | 3.3% |
| $25,000 to $34,999 | 4 | 4.4% |
| $35,000 to $49,999 | 22 | 24.2% |
| $50,000 to $74,999 | 47 | 51.6% |
| $75,000 to $99,999 | 8 | 8.8% |
| $100,000 to $149,999 | 2 | 2.2% |
| $150,000 to $199,999 | 1 | 1.1% |
| $200,000+ | 0 | 0.0% |
Household Income by Householder Age in Boardman
The median household income in Boardman is $55,764, with the highest median household income of $60,481 found in the 25 to 44 years age bracket for the primary householder. A total of 25 households (27.5%) fall into this category.
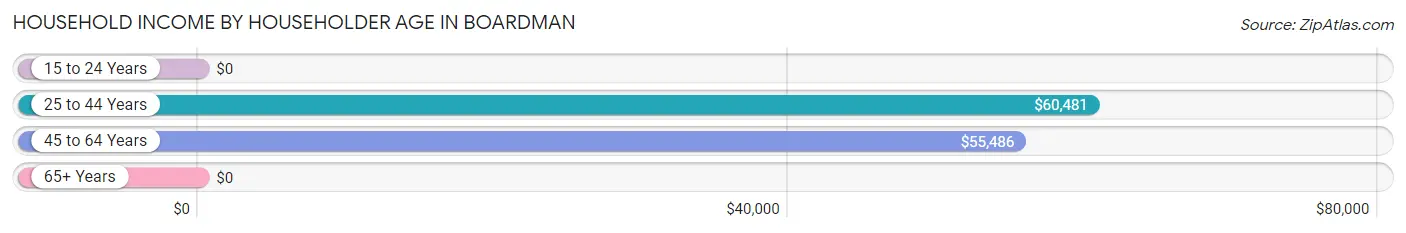
| Income Bracket | # Households | Median Income |
| 15 to 24 Years | 0 (0.0%) | $0 |
| 25 to 44 Years | 25 (27.5%) | $60,481 |
| 45 to 64 Years | 49 (53.8%) | $55,486 |
| 65+ Years | 17 (18.7%) | $0 |
| Total | 91 (100.0%) | $55,764 |
Poverty in Boardman
Income Below Poverty by Sex and Age in Boardman
With 3.5% poverty level for males and 6.5% for females among the residents of Boardman, 6 to 11 year old males and 55 to 64 year old females are the most vulnerable to poverty, with 2 males (100.0%) and 6 females (23.1%) in their respective age groups living below the poverty level.
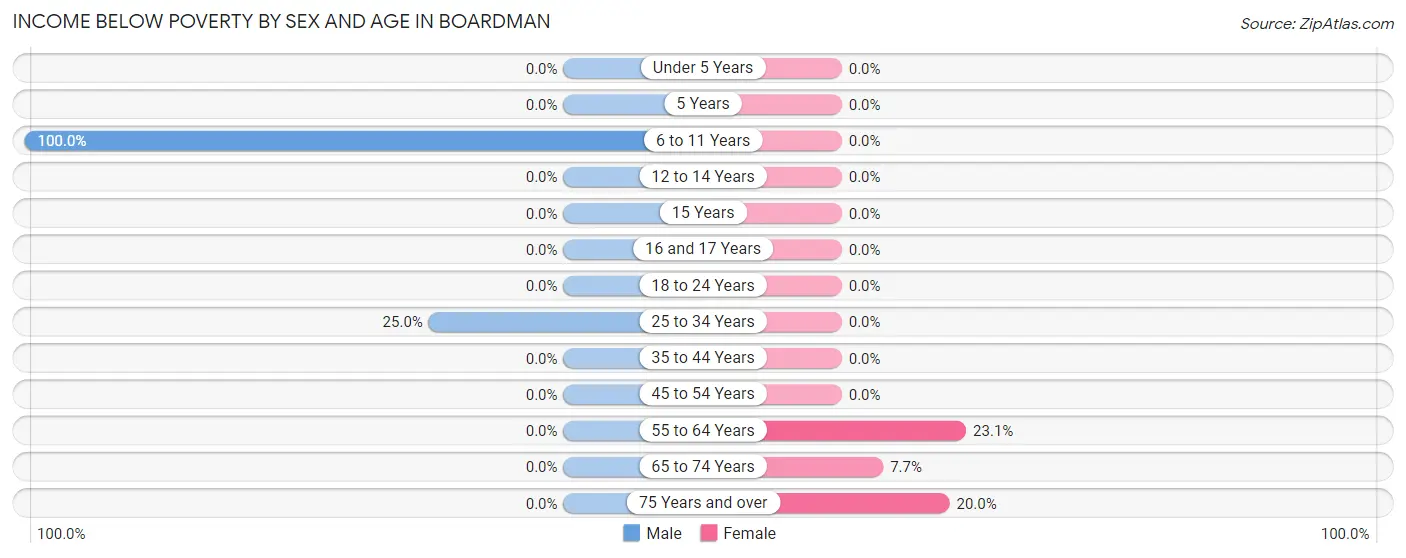
| Age Bracket | Male | Female |
| Under 5 Years | 0 (0.0%) | 0 (0.0%) |
| 5 Years | 0 (0.0%) | 0 (0.0%) |
| 6 to 11 Years | 2 (100.0%) | 0 (0.0%) |
| 12 to 14 Years | 0 (0.0%) | 0 (0.0%) |
| 15 Years | 0 (0.0%) | 0 (0.0%) |
| 16 and 17 Years | 0 (0.0%) | 0 (0.0%) |
| 18 to 24 Years | 0 (0.0%) | 0 (0.0%) |
| 25 to 34 Years | 2 (25.0%) | 0 (0.0%) |
| 35 to 44 Years | 0 (0.0%) | 0 (0.0%) |
| 45 to 54 Years | 0 (0.0%) | 0 (0.0%) |
| 55 to 64 Years | 0 (0.0%) | 6 (23.1%) |
| 65 to 74 Years | 0 (0.0%) | 1 (7.7%) |
| 75 Years and over | 0 (0.0%) | 1 (20.0%) |
| Total | 4 (3.5%) | 8 (6.5%) |
Income Above Poverty by Sex and Age in Boardman
According to the poverty statistics in Boardman, males aged under 5 years and females aged under 5 years are the age groups that are most secure financially, with 100.0% of males and 100.0% of females in these age groups living above the poverty line.
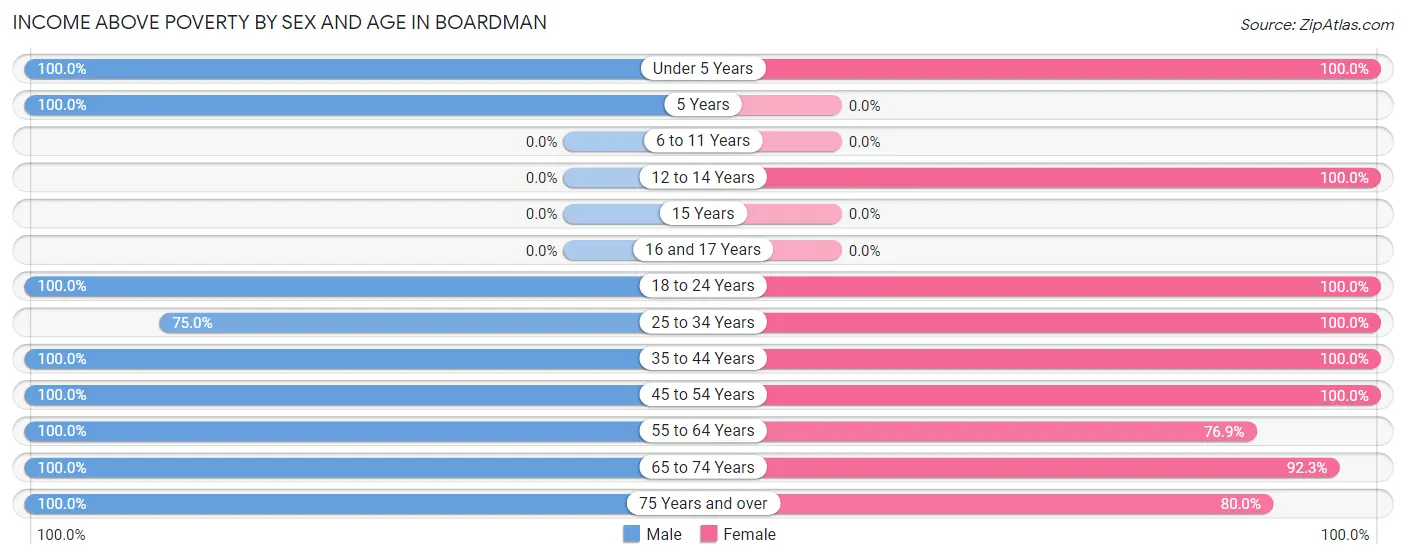
| Age Bracket | Male | Female |
| Under 5 Years | 9 (100.0%) | 3 (100.0%) |
| 5 Years | 2 (100.0%) | 0 (0.0%) |
| 6 to 11 Years | 0 (0.0%) | 0 (0.0%) |
| 12 to 14 Years | 0 (0.0%) | 2 (100.0%) |
| 15 Years | 0 (0.0%) | 0 (0.0%) |
| 16 and 17 Years | 0 (0.0%) | 0 (0.0%) |
| 18 to 24 Years | 17 (100.0%) | 21 (100.0%) |
| 25 to 34 Years | 6 (75.0%) | 12 (100.0%) |
| 35 to 44 Years | 21 (100.0%) | 21 (100.0%) |
| 45 to 54 Years | 22 (100.0%) | 20 (100.0%) |
| 55 to 64 Years | 23 (100.0%) | 20 (76.9%) |
| 65 to 74 Years | 4 (100.0%) | 12 (92.3%) |
| 75 Years and over | 7 (100.0%) | 4 (80.0%) |
| Total | 111 (96.5%) | 115 (93.5%) |
Income Below Poverty Among Married-Couple Families in Boardman
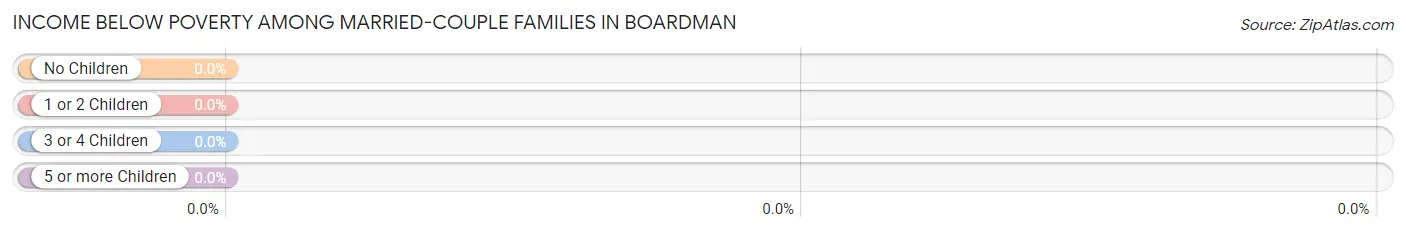
| Children | Above Poverty | Below Poverty |
| No Children | 39 (100.0%) | 0 (0.0%) |
| 1 or 2 Children | 2 (100.0%) | 0 (0.0%) |
| 3 or 4 Children | 0 (0.0%) | 0 (0.0%) |
| 5 or more Children | 0 (0.0%) | 0 (0.0%) |
| Total | 41 (100.0%) | 0 (0.0%) |
Income Below Poverty Among Single-Parent Households in Boardman
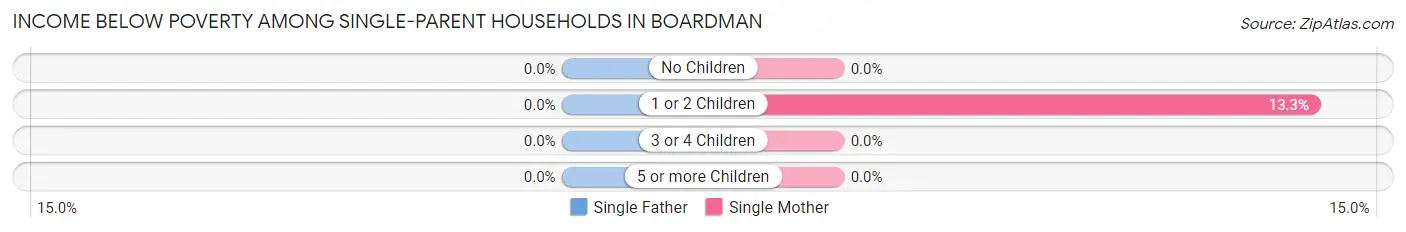
| Children | Single Father | Single Mother |
| No Children | 0 (0.0%) | 0 (0.0%) |
| 1 or 2 Children | 0 (0.0%) | 2 (13.3%) |
| 3 or 4 Children | 0 (0.0%) | 0 (0.0%) |
| 5 or more Children | 0 (0.0%) | 0 (0.0%) |
| Total | 0 (0.0%) | 2 (10.5%) |
Income Below Poverty Among Married-Couple vs Single-Parent Households in Boardman
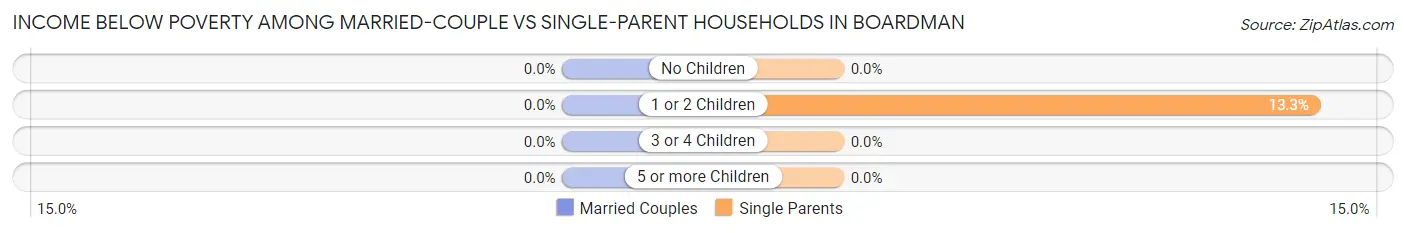
| Children | Married-Couple Families | Single-Parent Households |
| No Children | 0 (0.0%) | 0 (0.0%) |
| 1 or 2 Children | 0 (0.0%) | 2 (13.3%) |
| 3 or 4 Children | 0 (0.0%) | 0 (0.0%) |
| 5 or more Children | 0 (0.0%) | 0 (0.0%) |
| Total | 0 (0.0%) | 2 (5.4%) |
Employment Characteristics in Boardman
Employment by Class of Employer in Boardman
Among the 130 employed individuals in Boardman, private company employees (115 | 88.5%), local government employees (6 | 4.6%), and not-for-profit organizations (5 | 3.8%) make up the most common classes of employment.
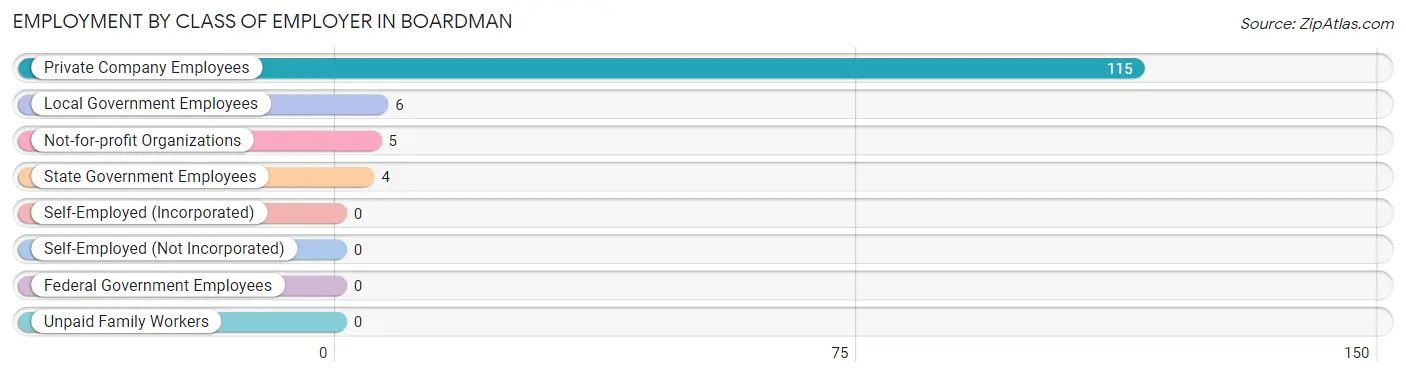
| Employer Class | # Employees | % Employees |
| Private Company Employees | 115 | 88.5% |
| Self-Employed (Incorporated) | 0 | 0.0% |
| Self-Employed (Not Incorporated) | 0 | 0.0% |
| Not-for-profit Organizations | 5 | 3.8% |
| Local Government Employees | 6 | 4.6% |
| State Government Employees | 4 | 3.1% |
| Federal Government Employees | 0 | 0.0% |
| Unpaid Family Workers | 0 | 0.0% |
| Total | 130 | 100.0% |
Employment Status by Age in Boardman
According to the labor force statistics for Boardman, out of the total population over 16 years of age (220), 63.6% or 140 individuals are in the labor force, with 7.1% or 10 of them unemployed. The age group with the highest labor force participation rate is 20 to 24 years, with 100.0% or 25 individuals in the labor force. Within the labor force, the 60 to 64 years age range has the highest percentage of unemployed individuals, with 23.5% or 4 of them being unemployed.
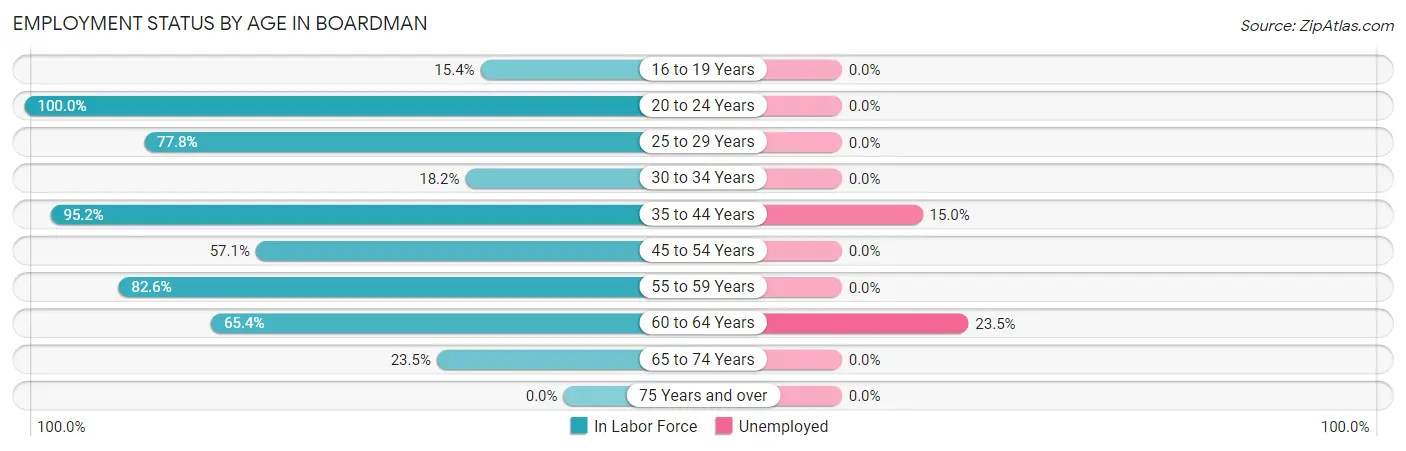
| Age Bracket | In Labor Force | Unemployed |
| 16 to 19 Years | 2 (15.4%) | 0 (0.0%) |
| 20 to 24 Years | 25 (100.0%) | 0 (0.0%) |
| 25 to 29 Years | 7 (77.8%) | 0 (0.0%) |
| 30 to 34 Years | 2 (18.2%) | 0 (0.0%) |
| 35 to 44 Years | 40 (95.2%) | 6 (15.0%) |
| 45 to 54 Years | 24 (57.1%) | 0 (0.0%) |
| 55 to 59 Years | 19 (82.6%) | 0 (0.0%) |
| 60 to 64 Years | 17 (65.4%) | 4 (23.5%) |
| 65 to 74 Years | 4 (23.5%) | 0 (0.0%) |
| 75 Years and over | 0 (0.0%) | 0 (0.0%) |
| Total | 140 (63.6%) | 10 (7.1%) |
Employment Status by Educational Attainment in Boardman
According to labor force statistics for Boardman, 71.2% of individuals (109) out of the total population between 25 and 64 years of age (153) are in the labor force, with 9.2% or 10 of them being unemployed. The group with the highest labor force participation rate are those with the educational attainment of college / associate degree, with 95.8% or 23 individuals in the labor force. Within the labor force, individuals with bachelor's degree or higher education have the highest percentage of unemployment, with 66.7% or 6 of them being unemployed.
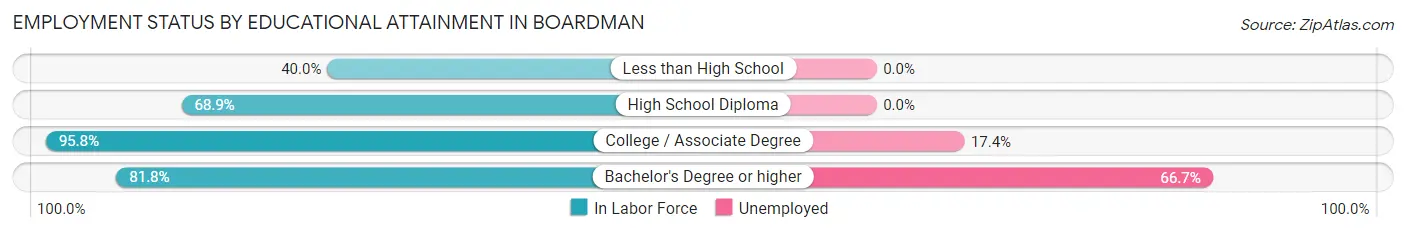
| Educational Attainment | In Labor Force | Unemployed |
| Less than High School | 6 (40.0%) | 0 (0.0%) |
| High School Diploma | 71 (68.9%) | 0 (0.0%) |
| College / Associate Degree | 23 (95.8%) | 4 (17.4%) |
| Bachelor's Degree or higher | 9 (81.8%) | 7 (66.7%) |
| Total | 109 (71.2%) | 14 (9.2%) |
Employment Occupations by Sex in Boardman
Management, Business, Science and Arts Occupations
The most common Management, Business, Science and Arts occupations in Boardman are Management (6 | 4.6%), Community & Social Service (6 | 4.6%), Education, Arts & Media (3 | 2.3%), and Legal Services & Support (3 | 2.3%).
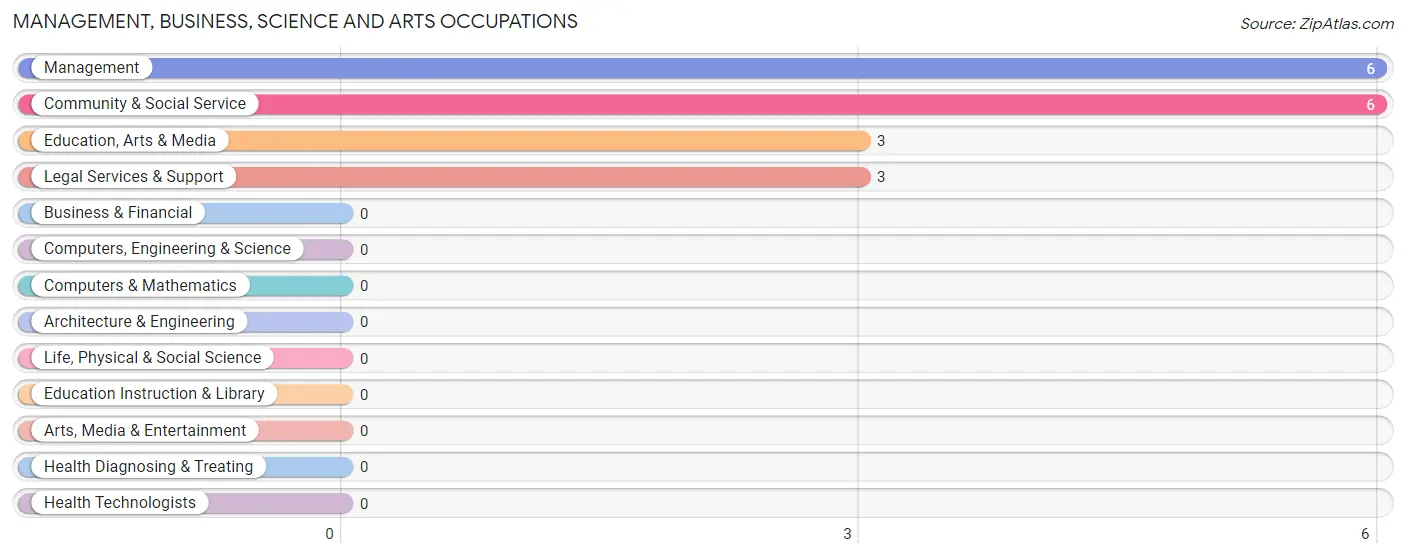
Management, Business, Science and Arts Occupations by Sex
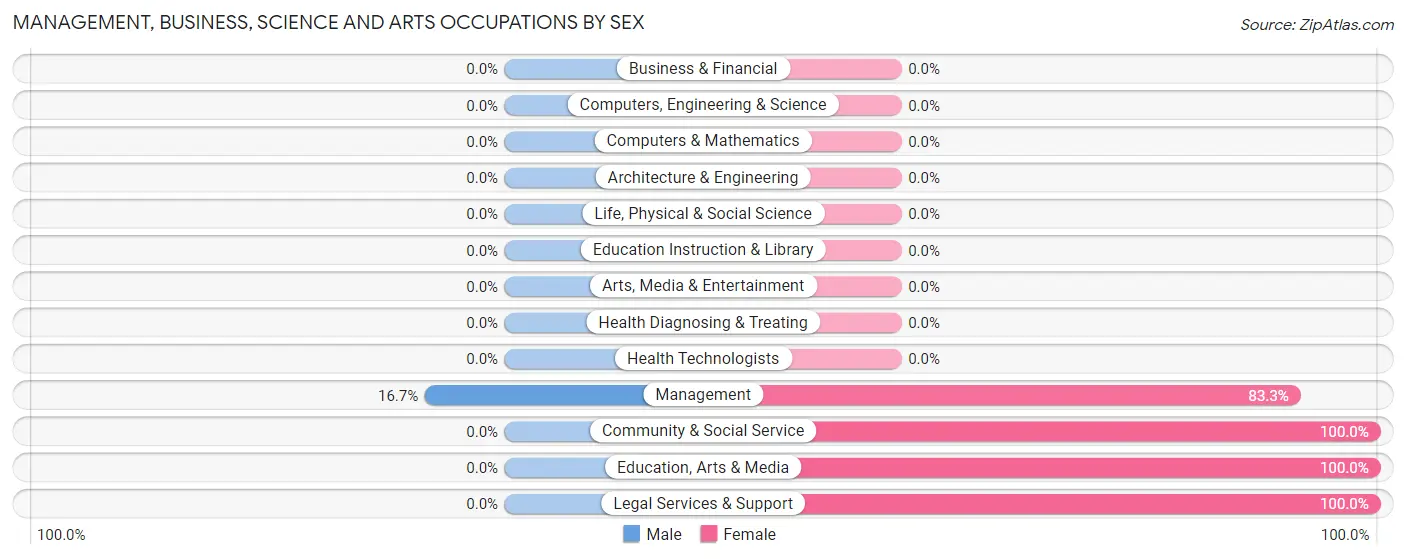
| Occupation | Male | Female |
| Management | 1 (16.7%) | 5 (83.3%) |
| Business & Financial | 0 (0.0%) | 0 (0.0%) |
| Computers, Engineering & Science | 0 (0.0%) | 0 (0.0%) |
| Computers & Mathematics | 0 (0.0%) | 0 (0.0%) |
| Architecture & Engineering | 0 (0.0%) | 0 (0.0%) |
| Life, Physical & Social Science | 0 (0.0%) | 0 (0.0%) |
| Community & Social Service | 0 (0.0%) | 6 (100.0%) |
| Education, Arts & Media | 0 (0.0%) | 3 (100.0%) |
| Legal Services & Support | 0 (0.0%) | 3 (100.0%) |
| Education Instruction & Library | 0 (0.0%) | 0 (0.0%) |
| Arts, Media & Entertainment | 0 (0.0%) | 0 (0.0%) |
| Health Diagnosing & Treating | 0 (0.0%) | 0 (0.0%) |
| Health Technologists | 0 (0.0%) | 0 (0.0%) |
| Total (Category) | 1 (8.3%) | 11 (91.7%) |
| Total (Overall) | 80 (61.5%) | 50 (38.5%) |
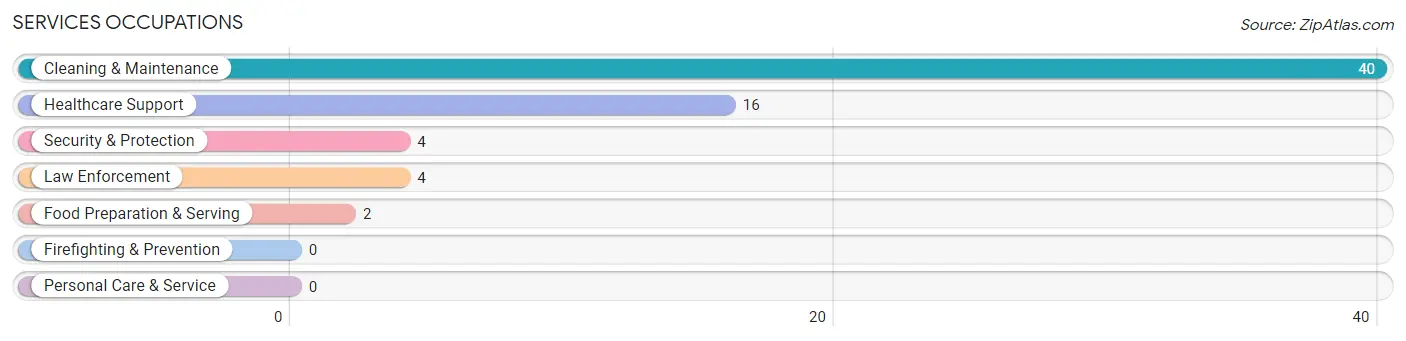
Services Occupations
The most common Services occupations in Boardman are Cleaning & Maintenance (40 | 30.8%), Healthcare Support (16 | 12.3%), Security & Protection (4 | 3.1%), Law Enforcement (4 | 3.1%), and Food Preparation & Serving (2 | 1.5%).
Services Occupations by Sex
Within the Services occupations in Boardman, the most male-oriented occupations are Security & Protection (100.0%), Law Enforcement (100.0%), and Cleaning & Maintenance (95.0%), while the most female-oriented occupations are Food Preparation & Serving (100.0%), Healthcare Support (75.0%), and Cleaning & Maintenance (5.0%).
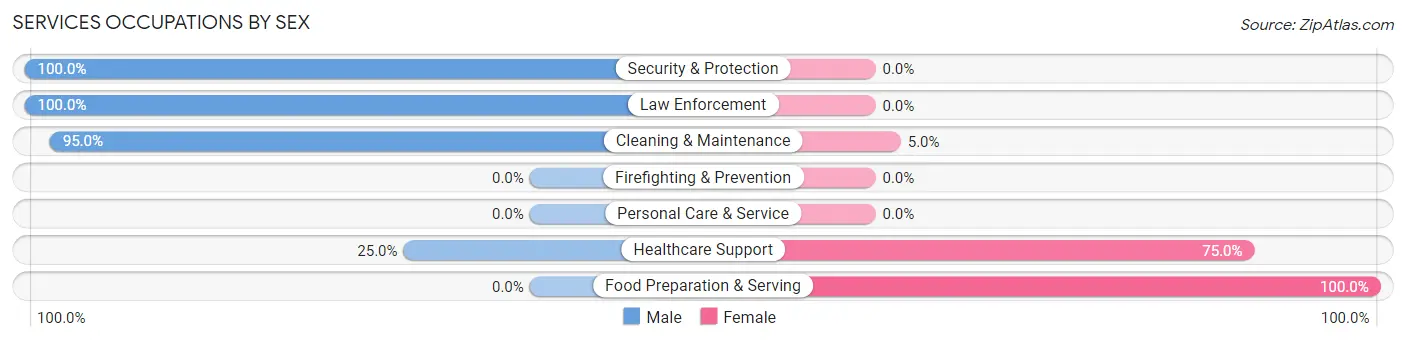
| Occupation | Male | Female |
| Healthcare Support | 4 (25.0%) | 12 (75.0%) |
| Security & Protection | 4 (100.0%) | 0 (0.0%) |
| Firefighting & Prevention | 0 (0.0%) | 0 (0.0%) |
| Law Enforcement | 4 (100.0%) | 0 (0.0%) |
| Food Preparation & Serving | 0 (0.0%) | 2 (100.0%) |
| Cleaning & Maintenance | 38 (95.0%) | 2 (5.0%) |
| Personal Care & Service | 0 (0.0%) | 0 (0.0%) |
| Total (Category) | 46 (74.2%) | 16 (25.8%) |
| Total (Overall) | 80 (61.5%) | 50 (38.5%) |
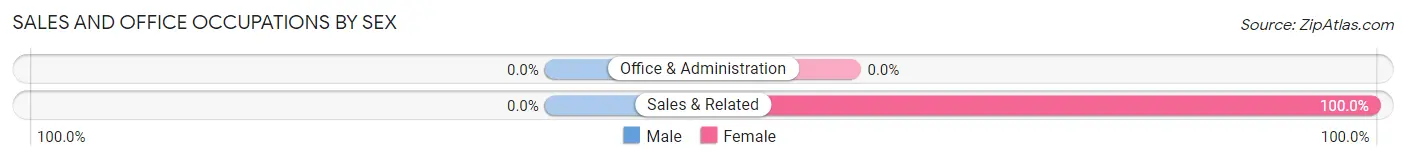
Sales and Office Occupations
The most common Sales and Office occupations in Boardman are , and Sales & Related (2 | 1.5%).
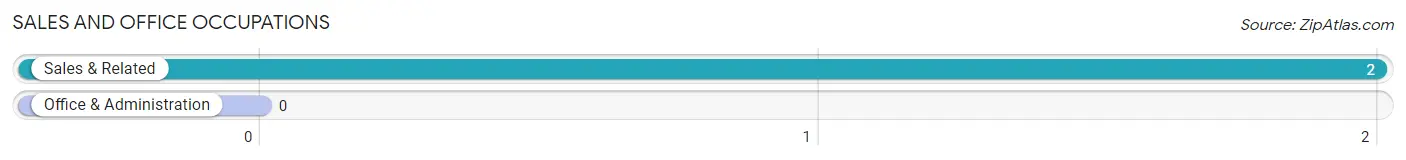
Sales and Office Occupations by Sex
| Occupation | Male | Female |
| Sales & Related | 0 (0.0%) | 2 (100.0%) |
| Office & Administration | 0 (0.0%) | 0 (0.0%) |
| Total (Category) | 0 (0.0%) | 2 (100.0%) |
| Total (Overall) | 80 (61.5%) | 50 (38.5%) |
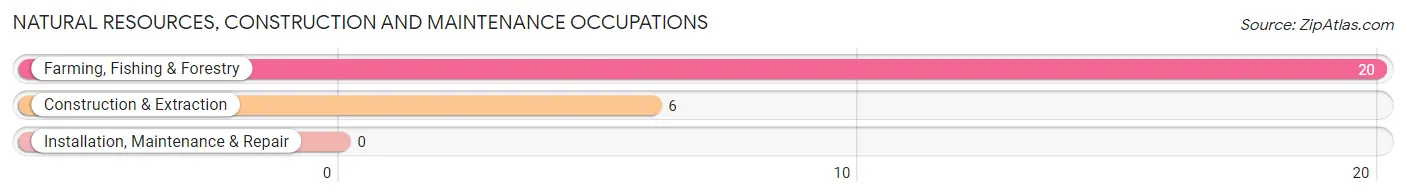
Natural Resources, Construction and Maintenance Occupations
The most common Natural Resources, Construction and Maintenance occupations in Boardman are Farming, Fishing & Forestry (20 | 15.4%), and Construction & Extraction (6 | 4.6%).
Natural Resources, Construction and Maintenance Occupations by Sex
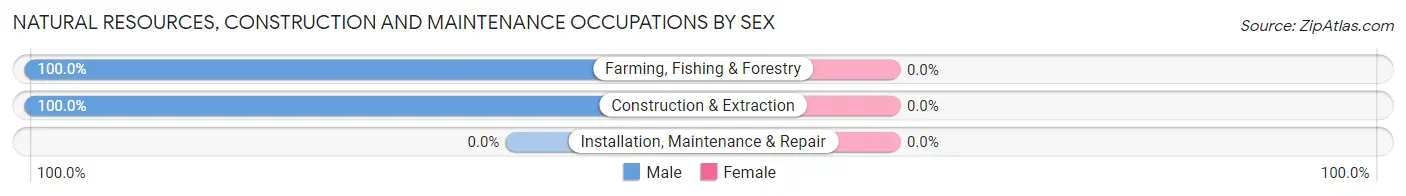
| Occupation | Male | Female |
| Farming, Fishing & Forestry | 20 (100.0%) | 0 (0.0%) |
| Construction & Extraction | 6 (100.0%) | 0 (0.0%) |
| Installation, Maintenance & Repair | 0 (0.0%) | 0 (0.0%) |
| Total (Category) | 26 (100.0%) | 0 (0.0%) |
| Total (Overall) | 80 (61.5%) | 50 (38.5%) |
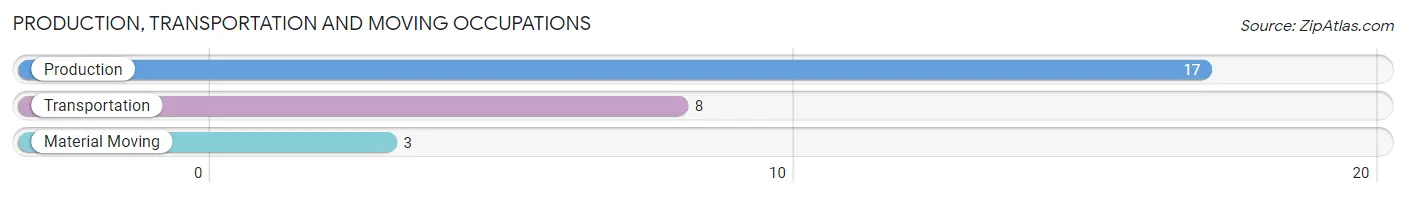
Production, Transportation and Moving Occupations
The most common Production, Transportation and Moving occupations in Boardman are Production (17 | 13.1%), Transportation (8 | 6.1%), and Material Moving (3 | 2.3%).
Production, Transportation and Moving Occupations by Sex
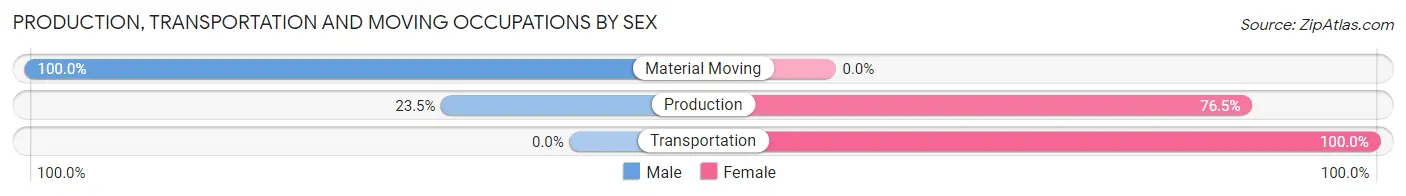
| Occupation | Male | Female |
| Production | 4 (23.5%) | 13 (76.5%) |
| Transportation | 0 (0.0%) | 8 (100.0%) |
| Material Moving | 3 (100.0%) | 0 (0.0%) |
| Total (Category) | 7 (25.0%) | 21 (75.0%) |
| Total (Overall) | 80 (61.5%) | 50 (38.5%) |
Employment Industries by Sex in Boardman
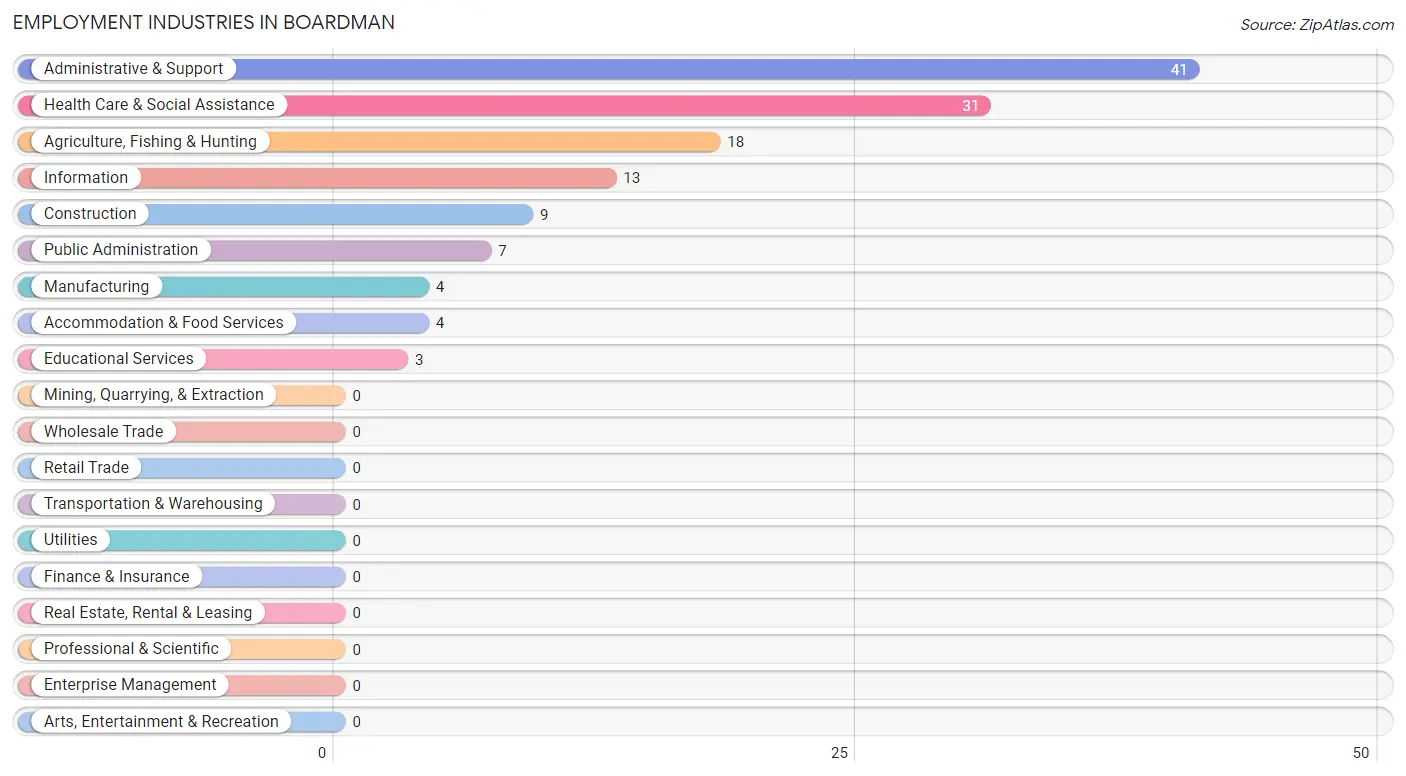
Employment Industries in Boardman
The major employment industries in Boardman include Administrative & Support (41 | 31.5%), Health Care & Social Assistance (31 | 23.8%), Agriculture, Fishing & Hunting (18 | 13.9%), Information (13 | 10.0%), and Construction (9 | 6.9%).
Employment Industries by Sex in Boardman
The Boardman industries that see more men than women are Agriculture, Fishing & Hunting (100.0%), Construction (100.0%), and Manufacturing (100.0%), whereas the industries that tend to have a higher number of women are Information (100.0%), Educational Services (100.0%), and Accommodation & Food Services (100.0%).
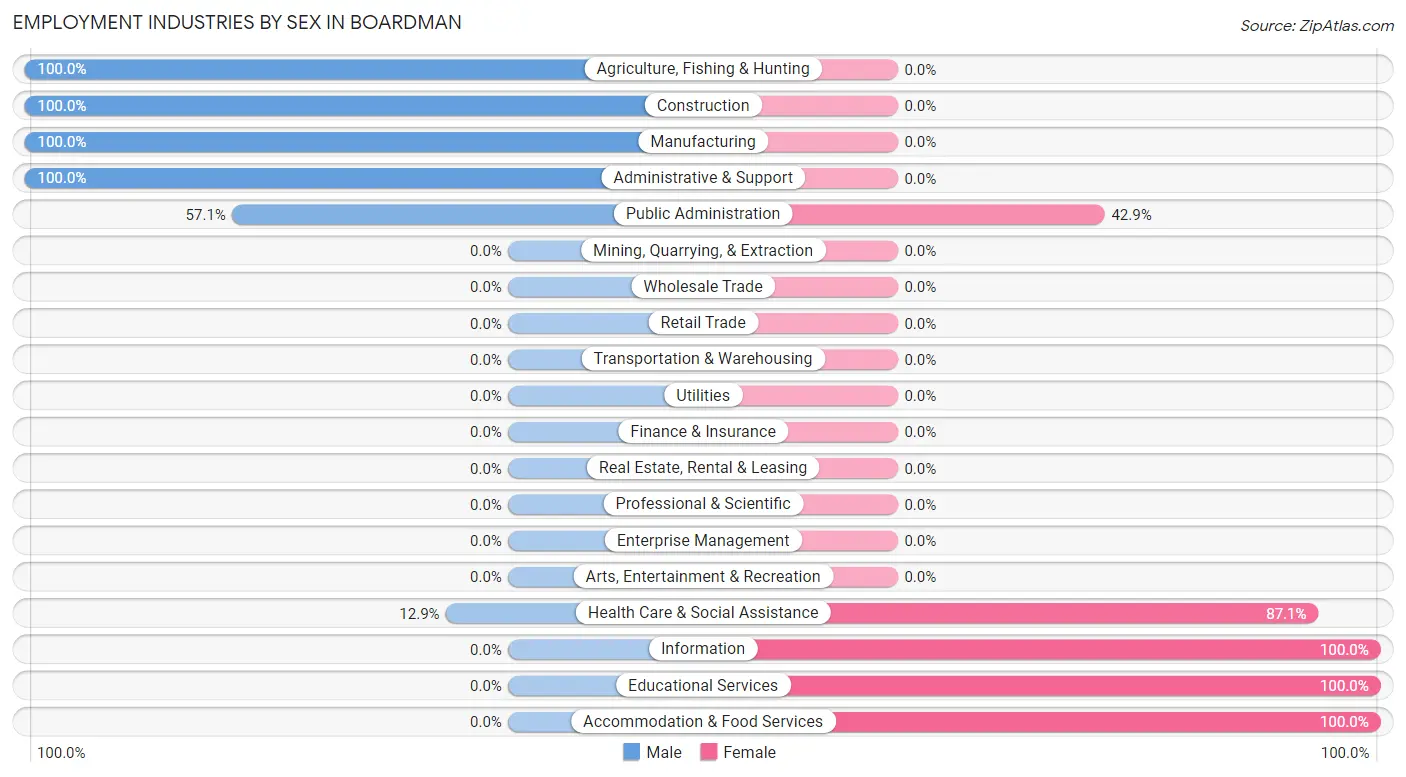
| Industry | Male | Female |
| Agriculture, Fishing & Hunting | 18 (100.0%) | 0 (0.0%) |
| Mining, Quarrying, & Extraction | 0 (0.0%) | 0 (0.0%) |
| Construction | 9 (100.0%) | 0 (0.0%) |
| Manufacturing | 4 (100.0%) | 0 (0.0%) |
| Wholesale Trade | 0 (0.0%) | 0 (0.0%) |
| Retail Trade | 0 (0.0%) | 0 (0.0%) |
| Transportation & Warehousing | 0 (0.0%) | 0 (0.0%) |
| Utilities | 0 (0.0%) | 0 (0.0%) |
| Information | 0 (0.0%) | 13 (100.0%) |
| Finance & Insurance | 0 (0.0%) | 0 (0.0%) |
| Real Estate, Rental & Leasing | 0 (0.0%) | 0 (0.0%) |
| Professional & Scientific | 0 (0.0%) | 0 (0.0%) |
| Enterprise Management | 0 (0.0%) | 0 (0.0%) |
| Administrative & Support | 41 (100.0%) | 0 (0.0%) |
| Educational Services | 0 (0.0%) | 3 (100.0%) |
| Health Care & Social Assistance | 4 (12.9%) | 27 (87.1%) |
| Arts, Entertainment & Recreation | 0 (0.0%) | 0 (0.0%) |
| Accommodation & Food Services | 0 (0.0%) | 4 (100.0%) |
| Public Administration | 4 (57.1%) | 3 (42.9%) |
| Total | 80 (61.5%) | 50 (38.5%) |
Education in Boardman
School Enrollment in Boardman
The most common levels of schooling among the 19 students in Boardman are high school (15 | 78.9%), kindergarten (2 | 10.5%), and middle school (2 | 10.5%).
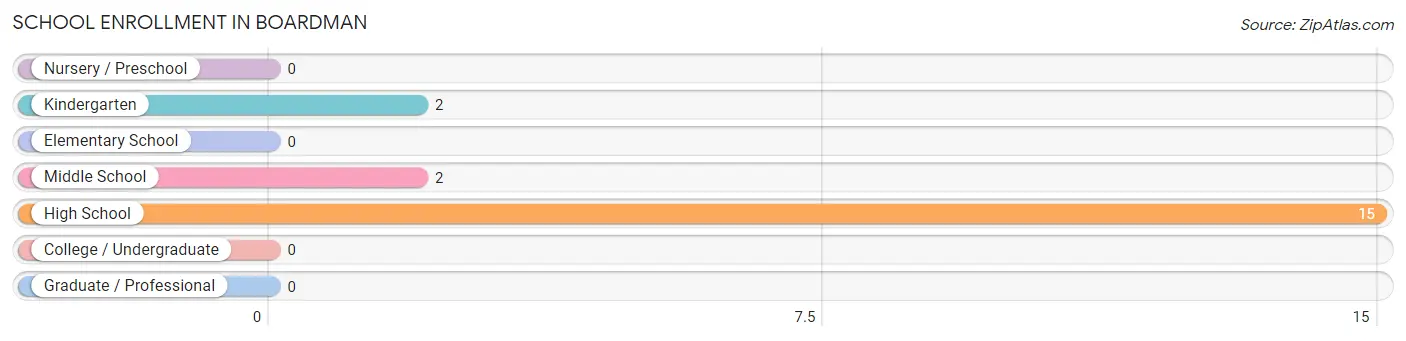
| School Level | # Students | % Students |
| Nursery / Preschool | 0 | 0.0% |
| Kindergarten | 2 | 10.5% |
| Elementary School | 0 | 0.0% |
| Middle School | 2 | 10.5% |
| High School | 15 | 78.9% |
| College / Undergraduate | 0 | 0.0% |
| Graduate / Professional | 0 | 0.0% |
| Total | 19 | 100.0% |
School Enrollment by Age by Funding Source in Boardman
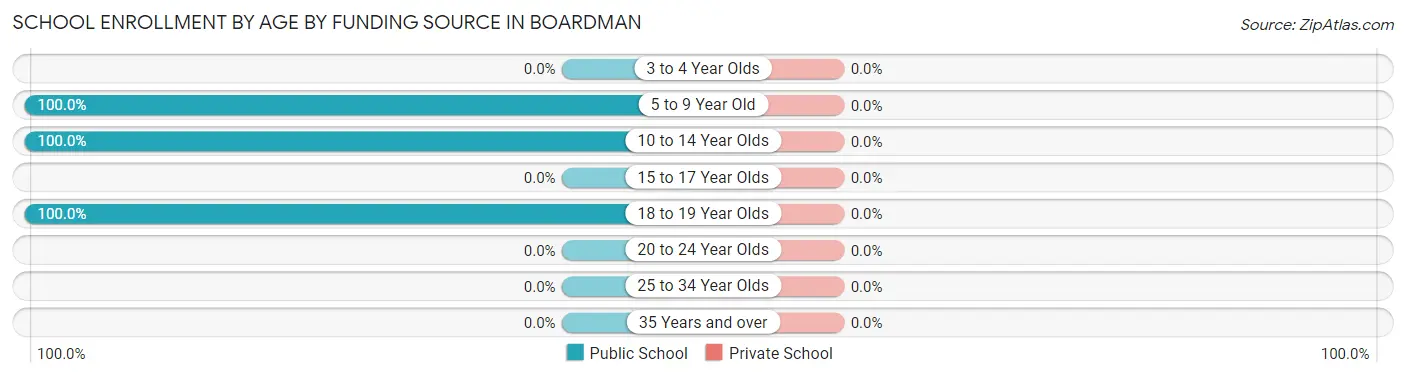
| Age Bracket | Public School | Private School |
| 3 to 4 Year Olds | 0 (0.0%) | 0 (0.0%) |
| 5 to 9 Year Old | 2 (100.0%) | 0 (0.0%) |
| 10 to 14 Year Olds | 4 (100.0%) | 0 (0.0%) |
| 15 to 17 Year Olds | 0 (0.0%) | 0 (0.0%) |
| 18 to 19 Year Olds | 13 (100.0%) | 0 (0.0%) |
| 20 to 24 Year Olds | 0 (0.0%) | 0 (0.0%) |
| 25 to 34 Year Olds | 0 (0.0%) | 0 (0.0%) |
| 35 Years and over | 0 (0.0%) | 0 (0.0%) |
| Total | 19 (100.0%) | 0 (0.0%) |
Educational Attainment by Field of Study in Boardman
Physical & health sciences (8 | 72.7%), and education (3 | 27.3%) are the most common fields of study among 11 individuals in Boardman who have obtained a bachelor's degree or higher.
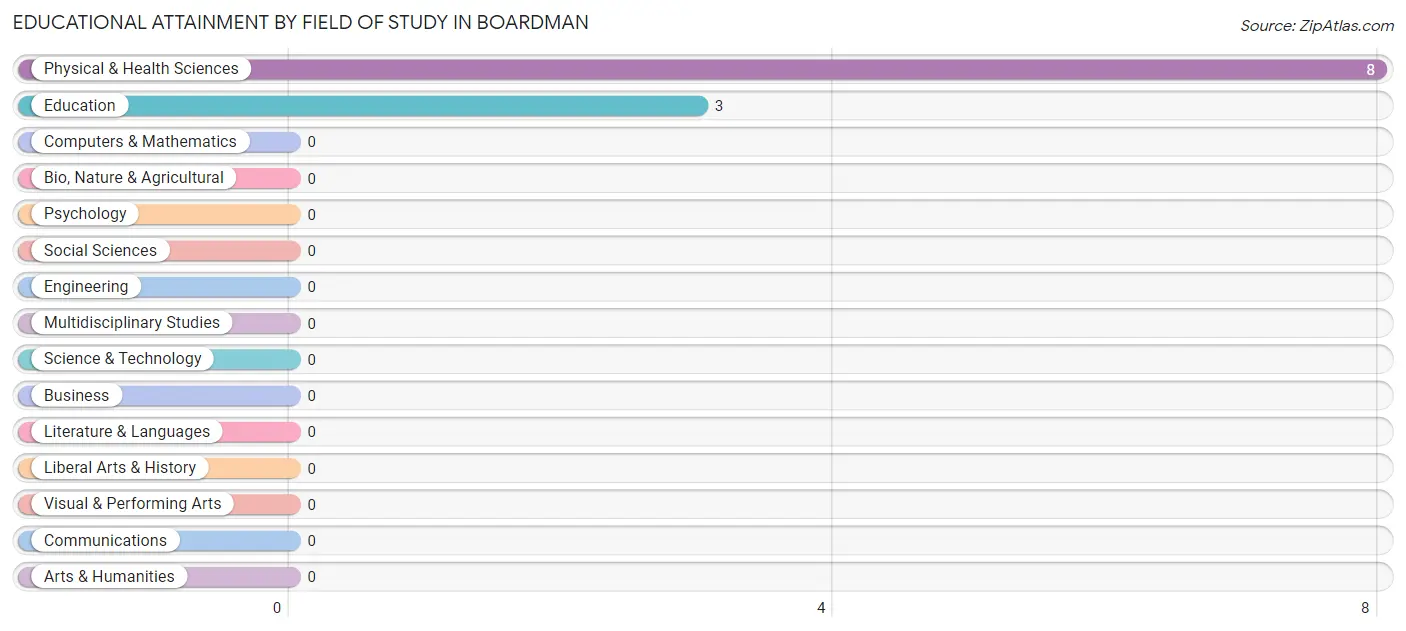
| Field of Study | # Graduates | % Graduates |
| Computers & Mathematics | 0 | 0.0% |
| Bio, Nature & Agricultural | 0 | 0.0% |
| Physical & Health Sciences | 8 | 72.7% |
| Psychology | 0 | 0.0% |
| Social Sciences | 0 | 0.0% |
| Engineering | 0 | 0.0% |
| Multidisciplinary Studies | 0 | 0.0% |
| Science & Technology | 0 | 0.0% |
| Business | 0 | 0.0% |
| Education | 3 | 27.3% |
| Literature & Languages | 0 | 0.0% |
| Liberal Arts & History | 0 | 0.0% |
| Visual & Performing Arts | 0 | 0.0% |
| Communications | 0 | 0.0% |
| Arts & Humanities | 0 | 0.0% |
| Total | 11 | 100.0% |
Transportation & Commute in Boardman
Vehicle Availability by Sex in Boardman
The most prevalent vehicle ownership categories in Boardman are males with 3 vehicles (40, accounting for 50.0%) and females with 3 vehicles (20, making up 80.0%).
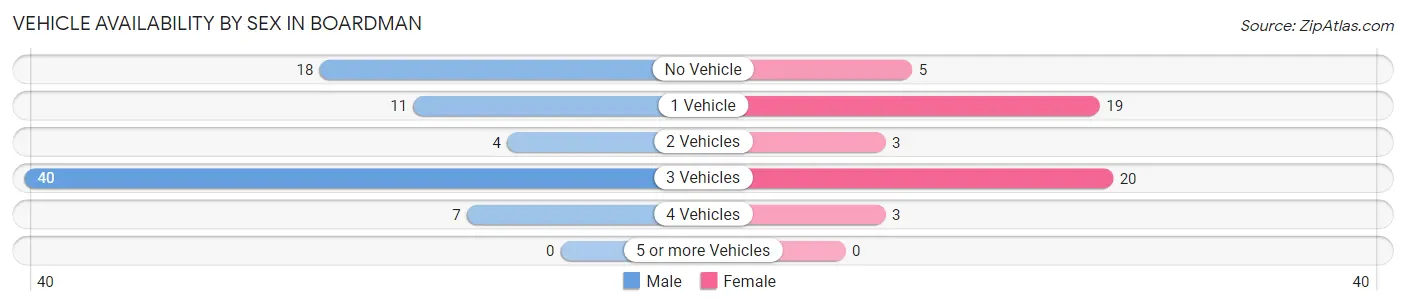
| Vehicles Available | Male | Female |
| No Vehicle | 18 (22.5%) | 5 (10.0%) |
| 1 Vehicle | 11 (13.8%) | 19 (38.0%) |
| 2 Vehicles | 4 (5.0%) | 3 (6.0%) |
| 3 Vehicles | 40 (50.0%) | 20 (40.0%) |
| 4 Vehicles | 7 (8.7%) | 3 (6.0%) |
| 5 or more Vehicles | 0 (0.0%) | 0 (0.0%) |
| Total | 80 (100.0%) | 50 (100.0%) |
Commute Time in Boardman
The most frequently occuring commute durations in Boardman are 35 to 39 minutes (29 commuters, 22.3%), 30 to 34 minutes (26 commuters, 20.0%), and 20 to 24 minutes (21 commuters, 16.2%).
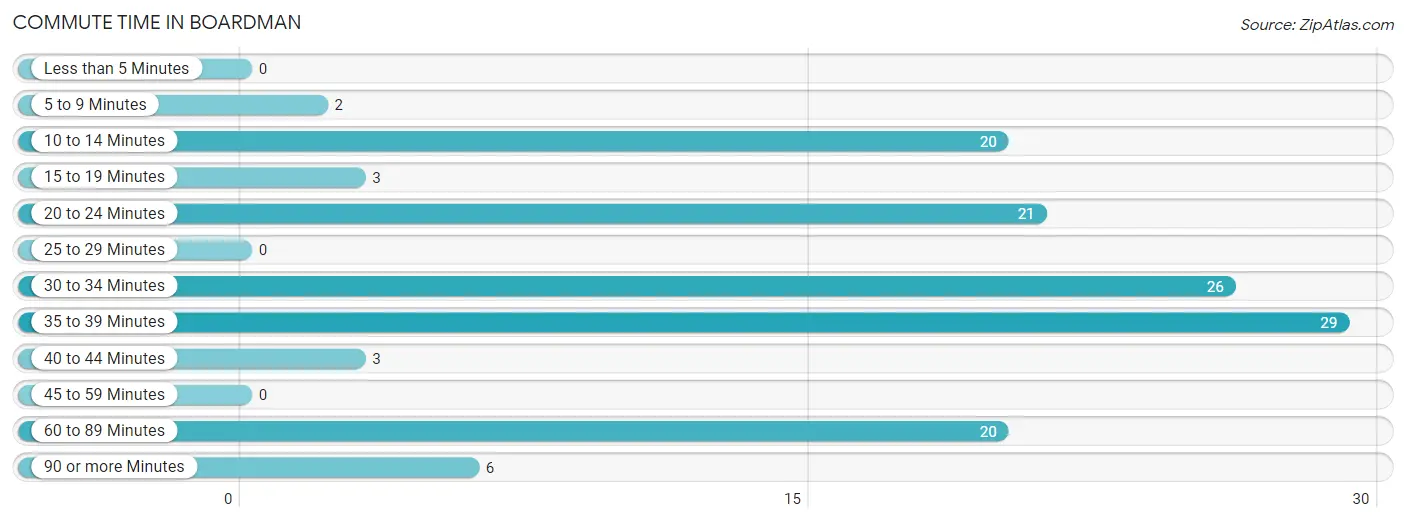
| Commute Time | # Commuters | % Commuters |
| Less than 5 Minutes | 0 | 0.0% |
| 5 to 9 Minutes | 2 | 1.5% |
| 10 to 14 Minutes | 20 | 15.4% |
| 15 to 19 Minutes | 3 | 2.3% |
| 20 to 24 Minutes | 21 | 16.2% |
| 25 to 29 Minutes | 0 | 0.0% |
| 30 to 34 Minutes | 26 | 20.0% |
| 35 to 39 Minutes | 29 | 22.3% |
| 40 to 44 Minutes | 3 | 2.3% |
| 45 to 59 Minutes | 0 | 0.0% |
| 60 to 89 Minutes | 20 | 15.4% |
| 90 or more Minutes | 6 | 4.6% |
Commute Time by Sex in Boardman
The most common commute times in Boardman are 35 to 39 minutes (21 commuters, 26.3%) for males and 30 to 34 minutes (17 commuters, 34.0%) for females.
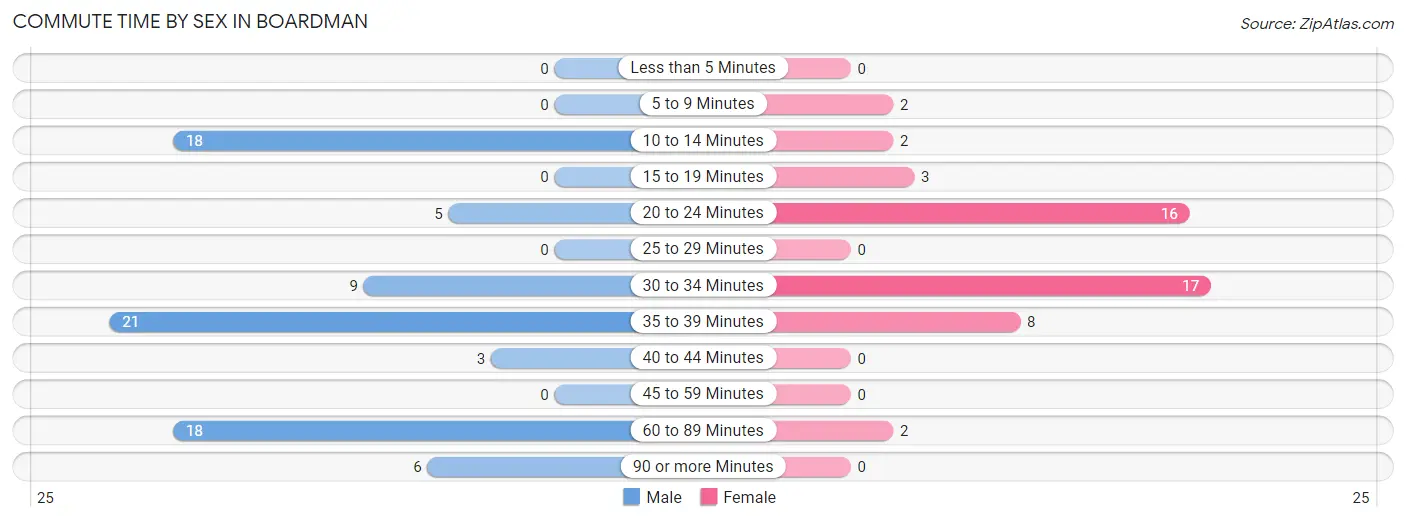
| Commute Time | Male | Female |
| Less than 5 Minutes | 0 (0.0%) | 0 (0.0%) |
| 5 to 9 Minutes | 0 (0.0%) | 2 (4.0%) |
| 10 to 14 Minutes | 18 (22.5%) | 2 (4.0%) |
| 15 to 19 Minutes | 0 (0.0%) | 3 (6.0%) |
| 20 to 24 Minutes | 5 (6.2%) | 16 (32.0%) |
| 25 to 29 Minutes | 0 (0.0%) | 0 (0.0%) |
| 30 to 34 Minutes | 9 (11.3%) | 17 (34.0%) |
| 35 to 39 Minutes | 21 (26.3%) | 8 (16.0%) |
| 40 to 44 Minutes | 3 (3.7%) | 0 (0.0%) |
| 45 to 59 Minutes | 0 (0.0%) | 0 (0.0%) |
| 60 to 89 Minutes | 18 (22.5%) | 2 (4.0%) |
| 90 or more Minutes | 6 (7.5%) | 0 (0.0%) |
Time of Departure to Work by Sex in Boardman
The most frequent times of departure to work in Boardman are 12:00 PM to 3:59 PM (21, 26.3%) for males and 4:00 PM to 11:59 PM (13, 26.0%) for females.
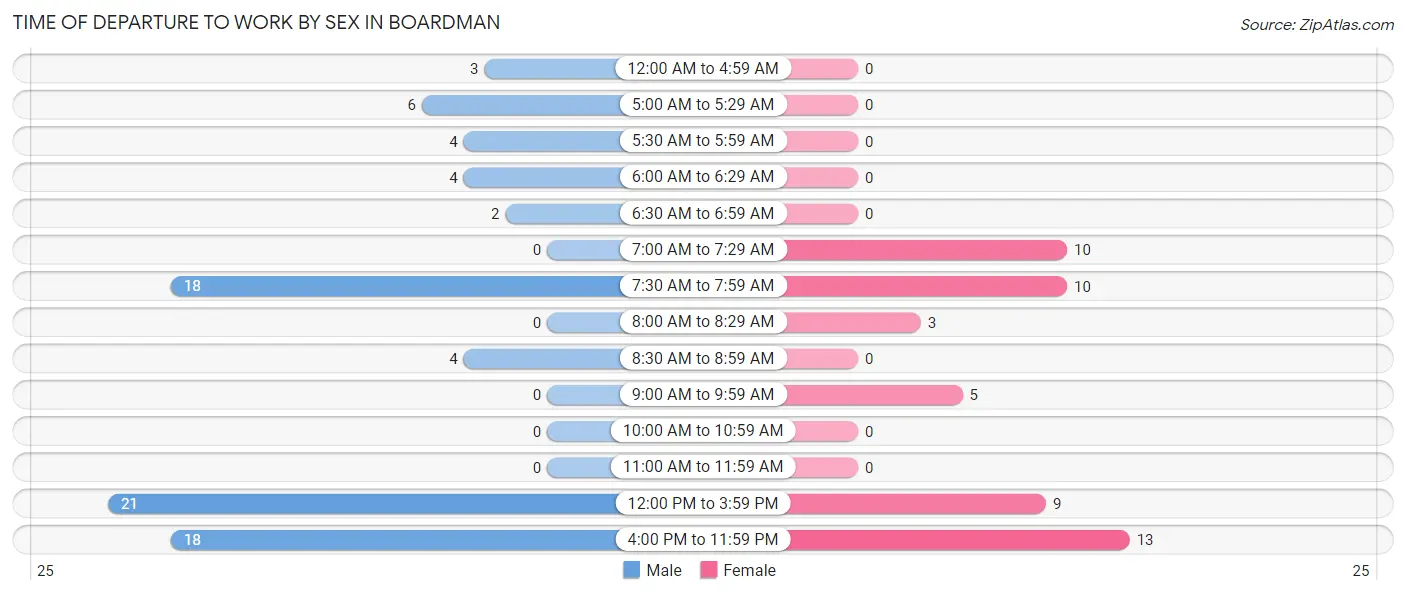
| Time of Departure | Male | Female |
| 12:00 AM to 4:59 AM | 3 (3.7%) | 0 (0.0%) |
| 5:00 AM to 5:29 AM | 6 (7.5%) | 0 (0.0%) |
| 5:30 AM to 5:59 AM | 4 (5.0%) | 0 (0.0%) |
| 6:00 AM to 6:29 AM | 4 (5.0%) | 0 (0.0%) |
| 6:30 AM to 6:59 AM | 2 (2.5%) | 0 (0.0%) |
| 7:00 AM to 7:29 AM | 0 (0.0%) | 10 (20.0%) |
| 7:30 AM to 7:59 AM | 18 (22.5%) | 10 (20.0%) |
| 8:00 AM to 8:29 AM | 0 (0.0%) | 3 (6.0%) |
| 8:30 AM to 8:59 AM | 4 (5.0%) | 0 (0.0%) |
| 9:00 AM to 9:59 AM | 0 (0.0%) | 5 (10.0%) |
| 10:00 AM to 10:59 AM | 0 (0.0%) | 0 (0.0%) |
| 11:00 AM to 11:59 AM | 0 (0.0%) | 0 (0.0%) |
| 12:00 PM to 3:59 PM | 21 (26.3%) | 9 (18.0%) |
| 4:00 PM to 11:59 PM | 18 (22.5%) | 13 (26.0%) |
| Total | 80 (100.0%) | 50 (100.0%) |
Housing Occupancy in Boardman
Occupancy by Ownership in Boardman
Of the total 91 dwellings in Boardman, owner-occupied units account for 47 (51.6%), while renter-occupied units make up 44 (48.3%).
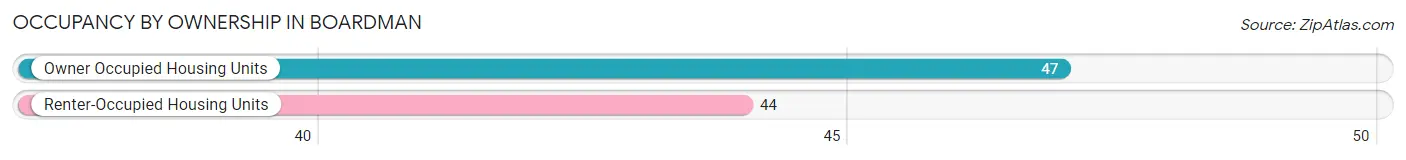
| Occupancy | # Housing Units | % Housing Units |
| Owner Occupied Housing Units | 47 | 51.6% |
| Renter-Occupied Housing Units | 44 | 48.3% |
| Total Occupied Housing Units | 91 | 100.0% |
Occupancy by Household Size in Boardman
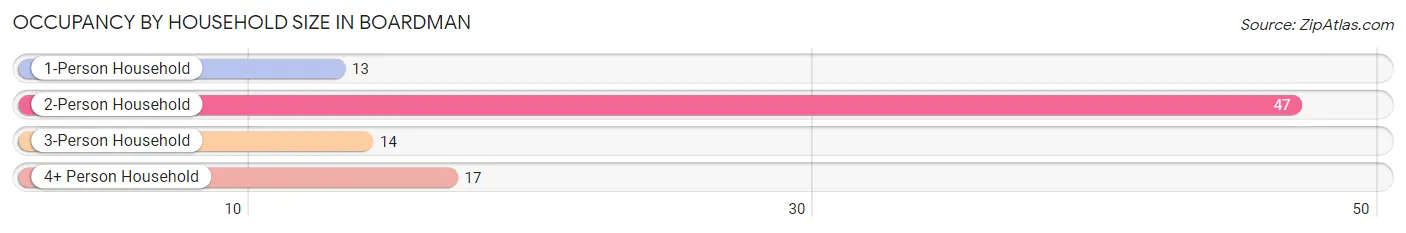
| Household Size | # Housing Units | % Housing Units |
| 1-Person Household | 13 | 14.3% |
| 2-Person Household | 47 | 51.6% |
| 3-Person Household | 14 | 15.4% |
| 4+ Person Household | 17 | 18.7% |
| Total Housing Units | 91 | 100.0% |
Occupancy by Ownership by Household Size in Boardman
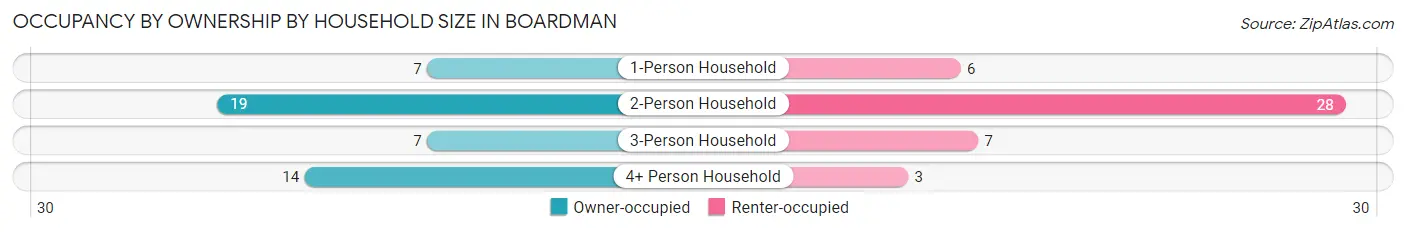
| Household Size | Owner-occupied | Renter-occupied |
| 1-Person Household | 7 (53.8%) | 6 (46.2%) |
| 2-Person Household | 19 (40.4%) | 28 (59.6%) |
| 3-Person Household | 7 (50.0%) | 7 (50.0%) |
| 4+ Person Household | 14 (82.4%) | 3 (17.6%) |
| Total Housing Units | 47 (51.6%) | 44 (48.3%) |
Occupancy by Educational Attainment in Boardman
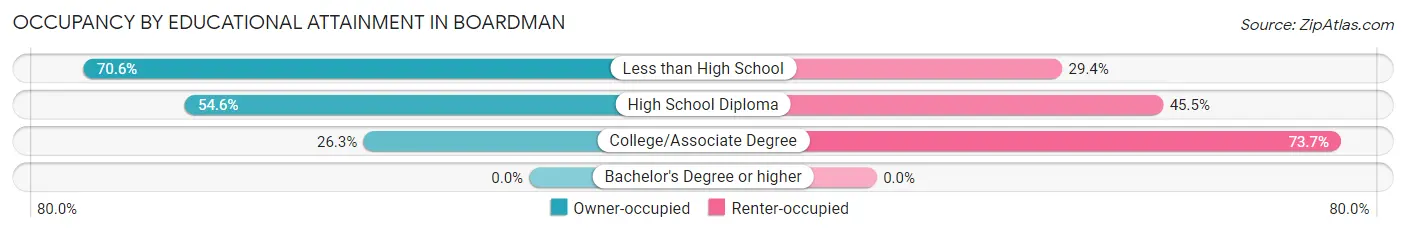
| Household Size | Owner-occupied | Renter-occupied |
| Less than High School | 12 (70.6%) | 5 (29.4%) |
| High School Diploma | 30 (54.5%) | 25 (45.5%) |
| College/Associate Degree | 5 (26.3%) | 14 (73.7%) |
| Bachelor's Degree or higher | 0 (0.0%) | 0 (0.0%) |
Occupancy by Age of Householder in Boardman
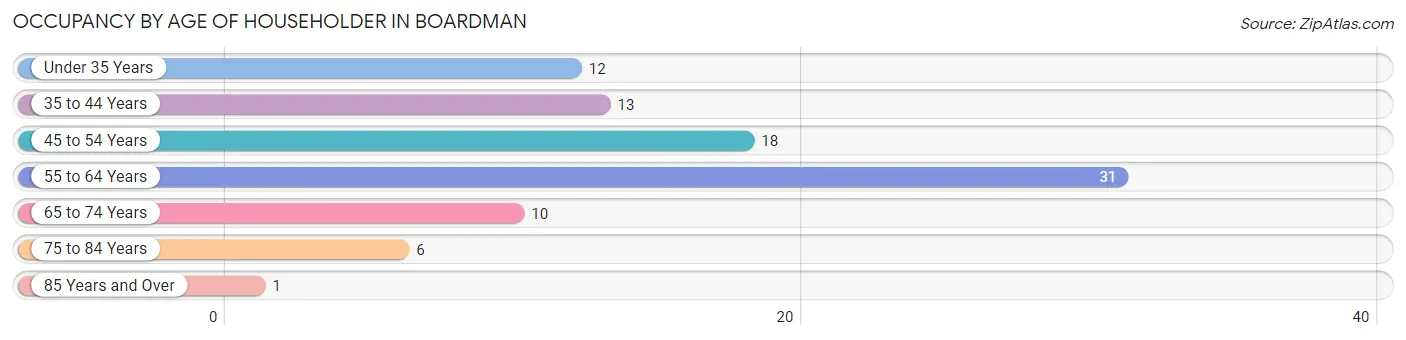
| Age Bracket | # Households | % Households |
| Under 35 Years | 12 | 13.2% |
| 35 to 44 Years | 13 | 14.3% |
| 45 to 54 Years | 18 | 19.8% |
| 55 to 64 Years | 31 | 34.1% |
| 65 to 74 Years | 10 | 11.0% |
| 75 to 84 Years | 6 | 6.6% |
| 85 Years and Over | 1 | 1.1% |
| Total | 91 | 100.0% |
Housing Finances in Boardman
Median Income by Occupancy in Boardman
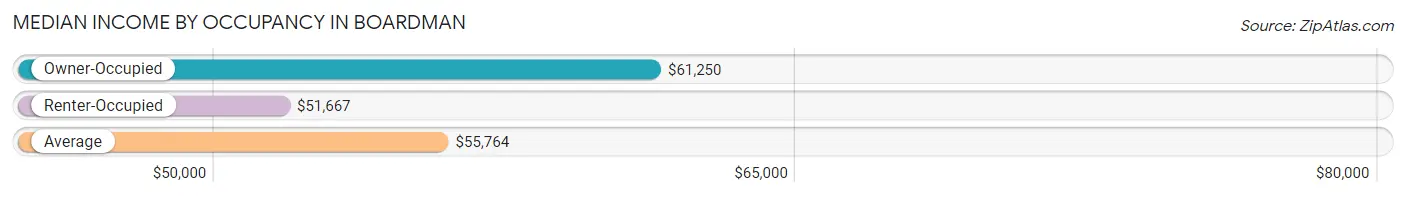
| Occupancy Type | # Households | Median Income |
| Owner-Occupied | 47 (51.6%) | $61,250 |
| Renter-Occupied | 44 (48.3%) | $51,667 |
| Average | 91 (100.0%) | $55,764 |
Occupancy by Householder Income Bracket in Boardman
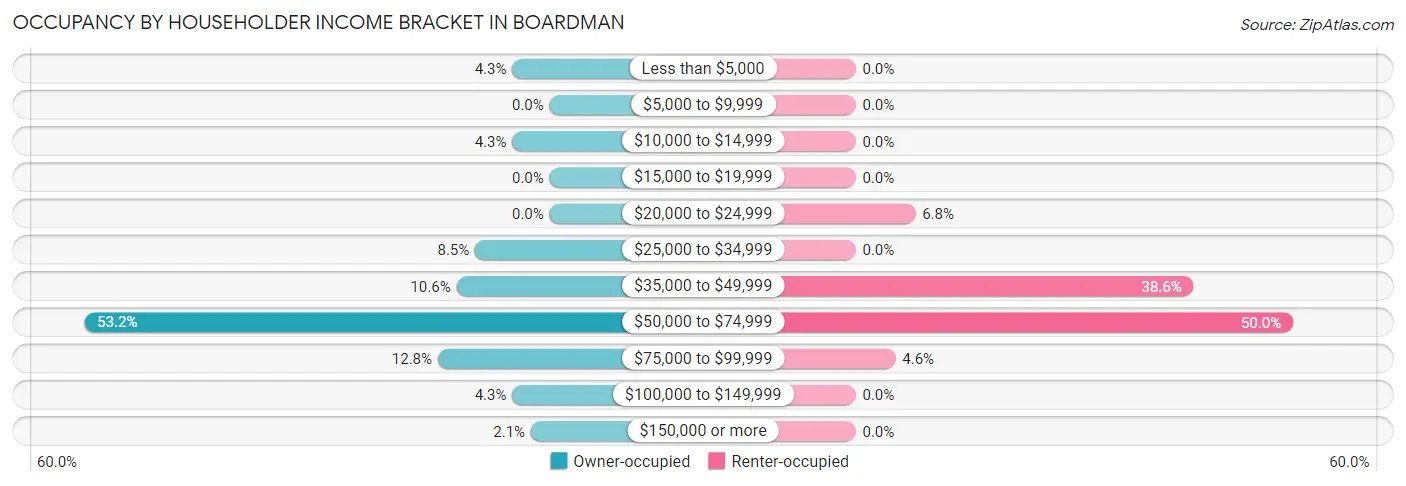
| Income Bracket | Owner-occupied | Renter-occupied |
| Less than $5,000 | 2 (4.3%) | 0 (0.0%) |
| $5,000 to $9,999 | 0 (0.0%) | 0 (0.0%) |
| $10,000 to $14,999 | 2 (4.3%) | 0 (0.0%) |
| $15,000 to $19,999 | 0 (0.0%) | 0 (0.0%) |
| $20,000 to $24,999 | 0 (0.0%) | 3 (6.8%) |
| $25,000 to $34,999 | 4 (8.5%) | 0 (0.0%) |
| $35,000 to $49,999 | 5 (10.6%) | 17 (38.6%) |
| $50,000 to $74,999 | 25 (53.2%) | 22 (50.0%) |
| $75,000 to $99,999 | 6 (12.8%) | 2 (4.5%) |
| $100,000 to $149,999 | 2 (4.3%) | 0 (0.0%) |
| $150,000 or more | 1 (2.1%) | 0 (0.0%) |
| Total | 47 (100.0%) | 44 (100.0%) |
Monthly Housing Cost Tiers in Boardman
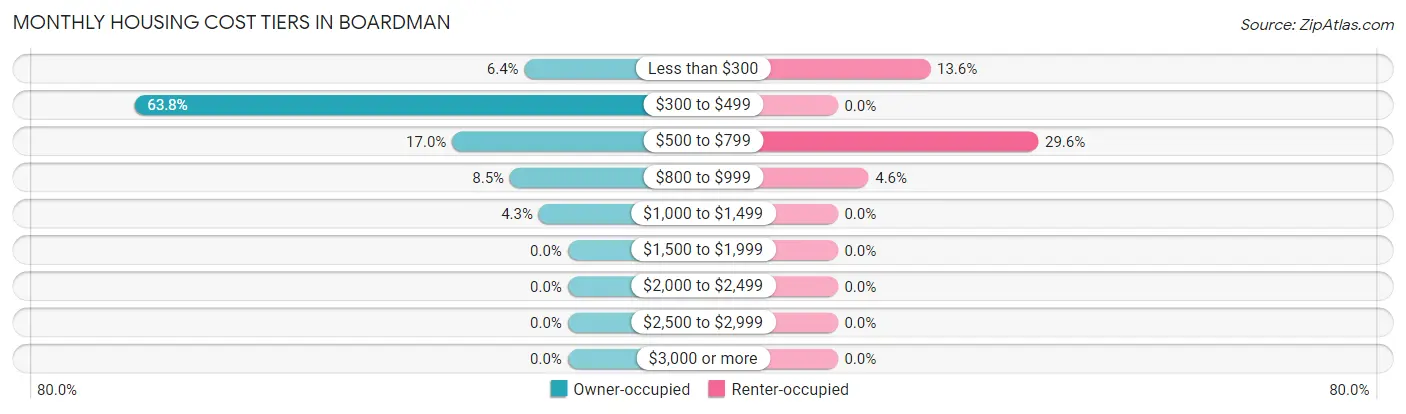
| Monthly Cost | Owner-occupied | Renter-occupied |
| Less than $300 | 3 (6.4%) | 6 (13.6%) |
| $300 to $499 | 30 (63.8%) | 0 (0.0%) |
| $500 to $799 | 8 (17.0%) | 13 (29.5%) |
| $800 to $999 | 4 (8.5%) | 2 (4.5%) |
| $1,000 to $1,499 | 2 (4.3%) | 0 (0.0%) |
| $1,500 to $1,999 | 0 (0.0%) | 0 (0.0%) |
| $2,000 to $2,499 | 0 (0.0%) | 0 (0.0%) |
| $2,500 to $2,999 | 0 (0.0%) | 0 (0.0%) |
| $3,000 or more | 0 (0.0%) | 0 (0.0%) |
| Total | 47 (100.0%) | 44 (100.0%) |
Physical Housing Characteristics in Boardman
Housing Structures in Boardman
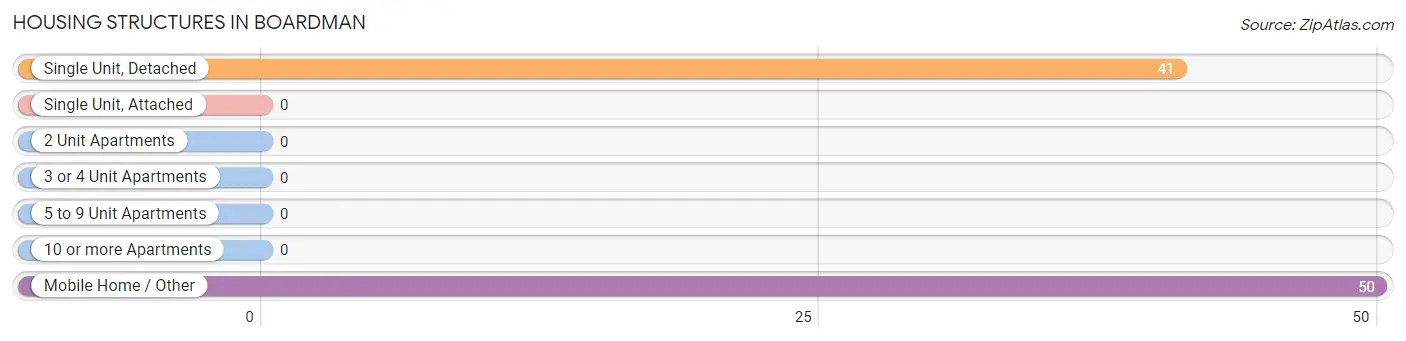
| Structure Type | # Housing Units | % Housing Units |
| Single Unit, Detached | 41 | 45.1% |
| Single Unit, Attached | 0 | 0.0% |
| 2 Unit Apartments | 0 | 0.0% |
| 3 or 4 Unit Apartments | 0 | 0.0% |
| 5 to 9 Unit Apartments | 0 | 0.0% |
| 10 or more Apartments | 0 | 0.0% |
| Mobile Home / Other | 50 | 54.9% |
| Total | 91 | 100.0% |
Housing Structures by Occupancy in Boardman
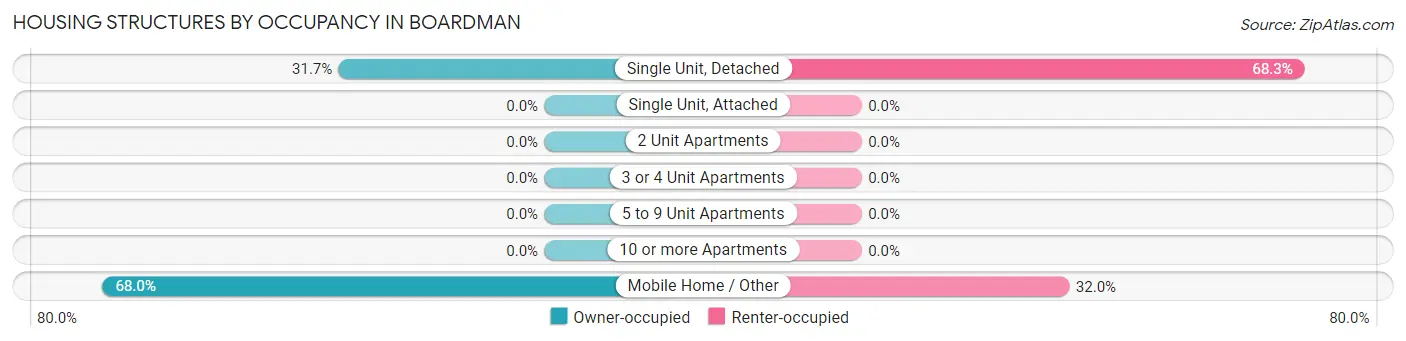
| Structure Type | Owner-occupied | Renter-occupied |
| Single Unit, Detached | 13 (31.7%) | 28 (68.3%) |
| Single Unit, Attached | 0 (0.0%) | 0 (0.0%) |
| 2 Unit Apartments | 0 (0.0%) | 0 (0.0%) |
| 3 or 4 Unit Apartments | 0 (0.0%) | 0 (0.0%) |
| 5 to 9 Unit Apartments | 0 (0.0%) | 0 (0.0%) |
| 10 or more Apartments | 0 (0.0%) | 0 (0.0%) |
| Mobile Home / Other | 34 (68.0%) | 16 (32.0%) |
| Total | 47 (51.6%) | 44 (48.3%) |
Housing Structures by Number of Rooms in Boardman
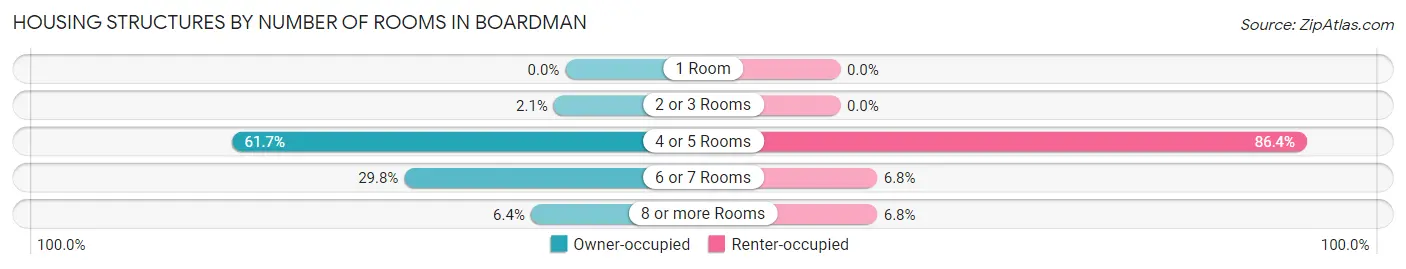
| Number of Rooms | Owner-occupied | Renter-occupied |
| 1 Room | 0 (0.0%) | 0 (0.0%) |
| 2 or 3 Rooms | 1 (2.1%) | 0 (0.0%) |
| 4 or 5 Rooms | 29 (61.7%) | 38 (86.4%) |
| 6 or 7 Rooms | 14 (29.8%) | 3 (6.8%) |
| 8 or more Rooms | 3 (6.4%) | 3 (6.8%) |
| Total | 47 (100.0%) | 44 (100.0%) |
Housing Structure by Heating Type in Boardman
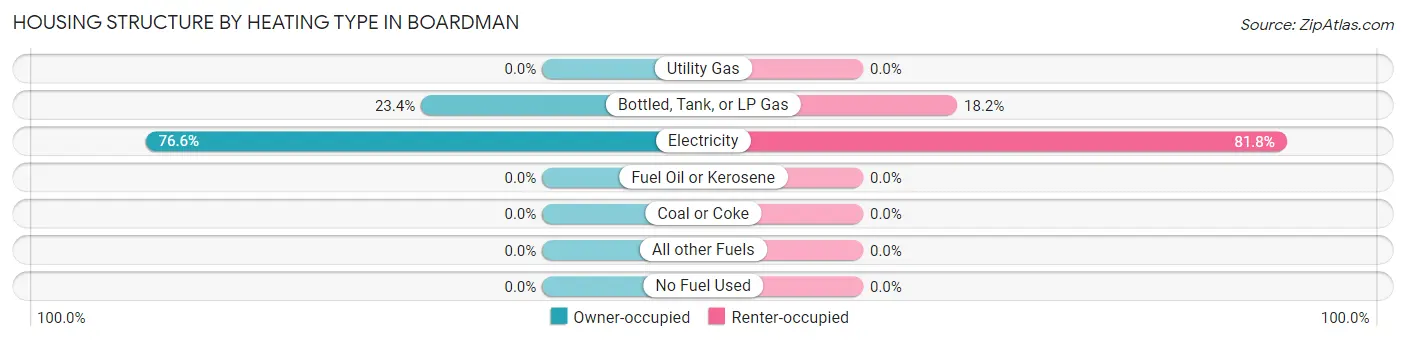
| Heating Type | Owner-occupied | Renter-occupied |
| Utility Gas | 0 (0.0%) | 0 (0.0%) |
| Bottled, Tank, or LP Gas | 11 (23.4%) | 8 (18.2%) |
| Electricity | 36 (76.6%) | 36 (81.8%) |
| Fuel Oil or Kerosene | 0 (0.0%) | 0 (0.0%) |
| Coal or Coke | 0 (0.0%) | 0 (0.0%) |
| All other Fuels | 0 (0.0%) | 0 (0.0%) |
| No Fuel Used | 0 (0.0%) | 0 (0.0%) |
| Total | 47 (100.0%) | 44 (100.0%) |
Household Vehicle Usage in Boardman
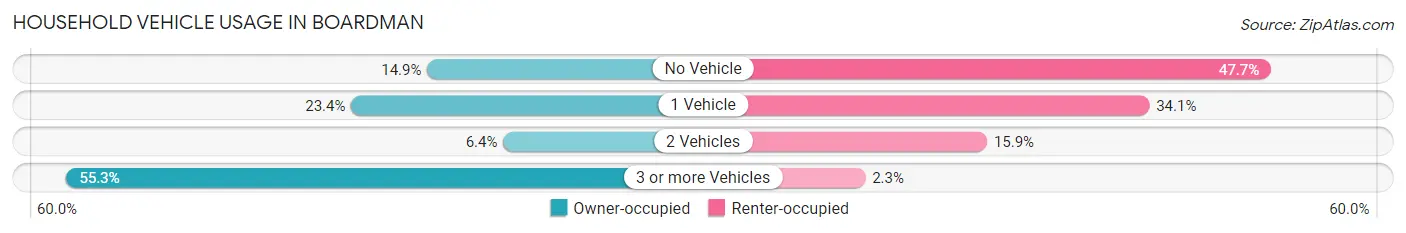
| Vehicles per Household | Owner-occupied | Renter-occupied |
| No Vehicle | 7 (14.9%) | 21 (47.7%) |
| 1 Vehicle | 11 (23.4%) | 15 (34.1%) |
| 2 Vehicles | 3 (6.4%) | 7 (15.9%) |
| 3 or more Vehicles | 26 (55.3%) | 1 (2.3%) |
| Total | 47 (100.0%) | 44 (100.0%) |
Real Estate & Mortgages in Boardman
Real Estate and Mortgage Overview in Boardman
| Characteristic | Without Mortgage | With Mortgage |
| Housing Units | 38 | 9 |
| Median Property Value | $50,000 | $112,500 |
| Median Household Income | $61,538 | $0 |
| Monthly Housing Costs | $441 | $0 |
| Real Estate Taxes | - | - |
Property Value by Mortgage Status in Boardman
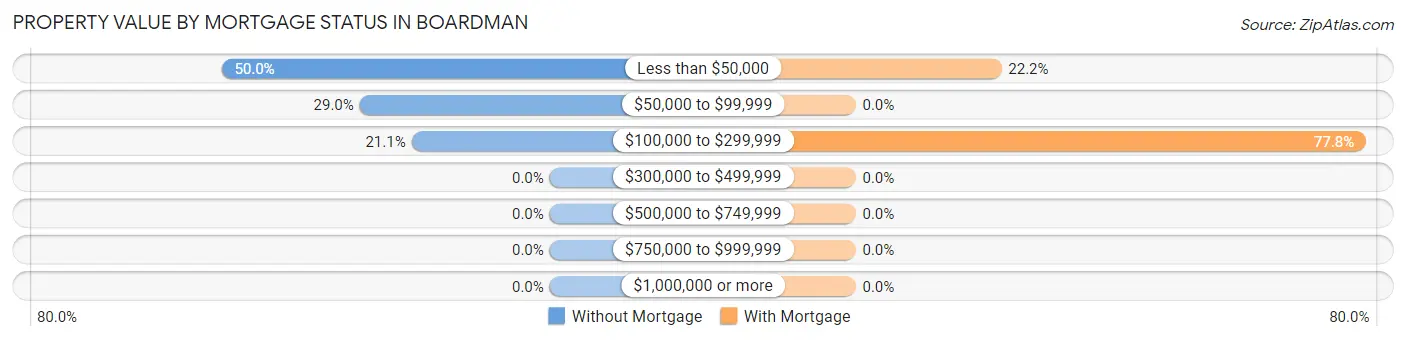
| Property Value | Without Mortgage | With Mortgage |
| Less than $50,000 | 19 (50.0%) | 2 (22.2%) |
| $50,000 to $99,999 | 11 (28.9%) | 0 (0.0%) |
| $100,000 to $299,999 | 8 (21.0%) | 7 (77.8%) |
| $300,000 to $499,999 | 0 (0.0%) | 0 (0.0%) |
| $500,000 to $749,999 | 0 (0.0%) | 0 (0.0%) |
| $750,000 to $999,999 | 0 (0.0%) | 0 (0.0%) |
| $1,000,000 or more | 0 (0.0%) | 0 (0.0%) |
| Total | 38 (100.0%) | 9 (100.0%) |
Household Income by Mortgage Status in Boardman
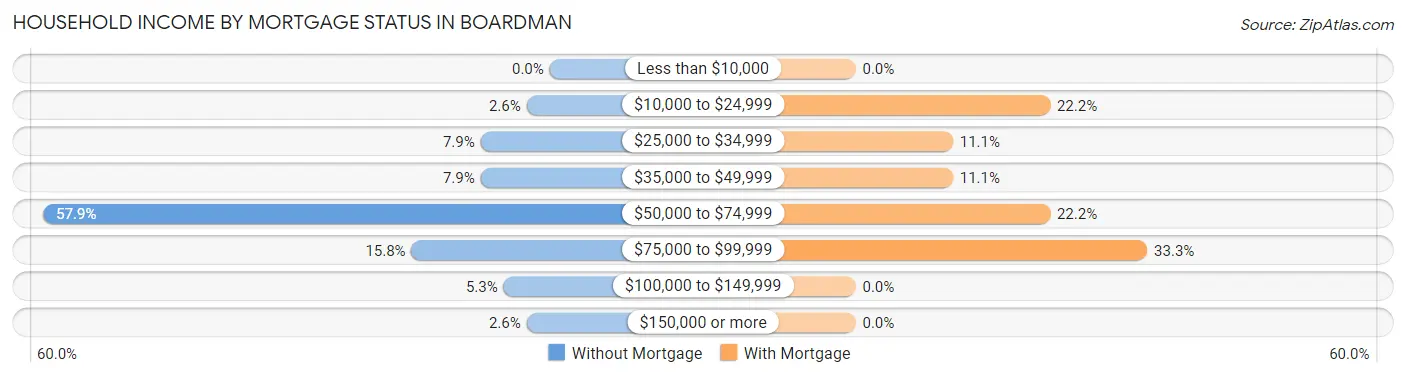
| Household Income | Without Mortgage | With Mortgage |
| Less than $10,000 | 0 (0.0%) | 0 (0.0%) |
| $10,000 to $24,999 | 1 (2.6%) | 2 (22.2%) |
| $25,000 to $34,999 | 3 (7.9%) | 1 (11.1%) |
| $35,000 to $49,999 | 3 (7.9%) | 1 (11.1%) |
| $50,000 to $74,999 | 22 (57.9%) | 2 (22.2%) |
| $75,000 to $99,999 | 6 (15.8%) | 3 (33.3%) |
| $100,000 to $149,999 | 2 (5.3%) | 0 (0.0%) |
| $150,000 or more | 1 (2.6%) | 0 (0.0%) |
| Total | 38 (100.0%) | 9 (100.0%) |
Property Value to Household Income Ratio in Boardman
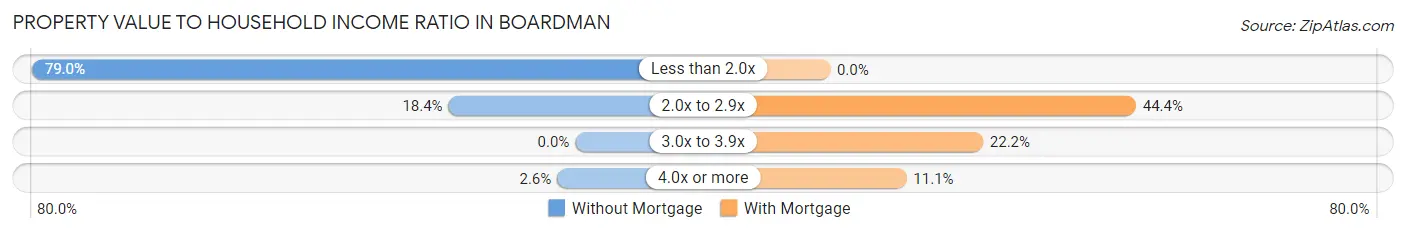
| Value-to-Income Ratio | Without Mortgage | With Mortgage |
| Less than 2.0x | 30 (78.9%) | 0 (0.0%) |
| 2.0x to 2.9x | 7 (18.4%) | 4 (44.4%) |
| 3.0x to 3.9x | 0 (0.0%) | 2 (22.2%) |
| 4.0x or more | 1 (2.6%) | 1 (11.1%) |
| Total | 38 (100.0%) | 9 (100.0%) |
Real Estate Taxes by Mortgage Status in Boardman
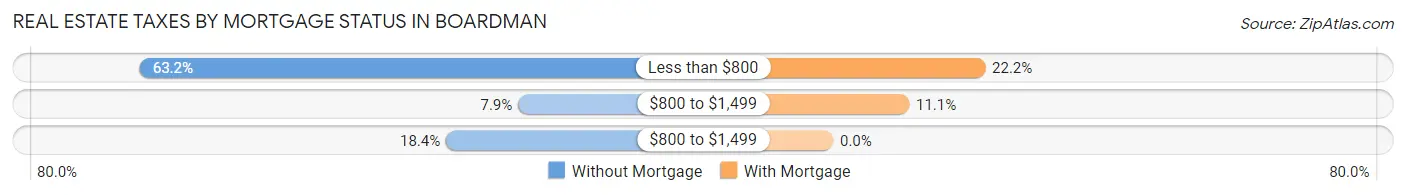
| Property Taxes | Without Mortgage | With Mortgage |
| Less than $800 | 24 (63.2%) | 2 (22.2%) |
| $800 to $1,499 | 3 (7.9%) | 1 (11.1%) |
| $800 to $1,499 | 7 (18.4%) | 0 (0.0%) |
| Total | 38 (100.0%) | 9 (100.0%) |
Health & Disability in Boardman
Health Insurance Coverage by Age in Boardman
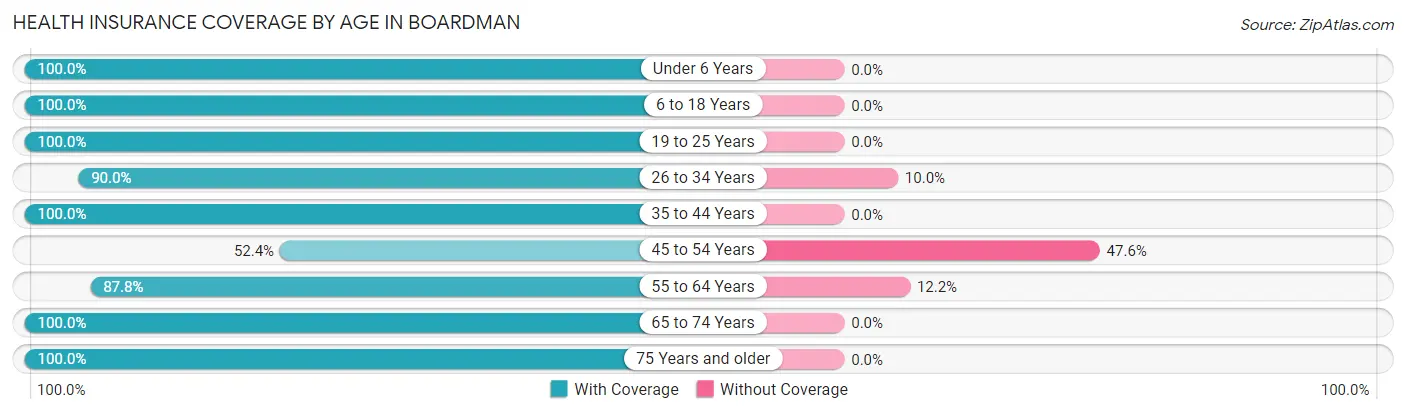
| Age Bracket | With Coverage | Without Coverage |
| Under 6 Years | 14 (100.0%) | 0 (0.0%) |
| 6 to 18 Years | 6 (100.0%) | 0 (0.0%) |
| 19 to 25 Years | 36 (100.0%) | 0 (0.0%) |
| 26 to 34 Years | 18 (90.0%) | 2 (10.0%) |
| 35 to 44 Years | 42 (100.0%) | 0 (0.0%) |
| 45 to 54 Years | 22 (52.4%) | 20 (47.6%) |
| 55 to 64 Years | 43 (87.8%) | 6 (12.2%) |
| 65 to 74 Years | 17 (100.0%) | 0 (0.0%) |
| 75 Years and older | 12 (100.0%) | 0 (0.0%) |
| Total | 210 (88.2%) | 28 (11.8%) |
Health Insurance Coverage by Citizenship Status in Boardman
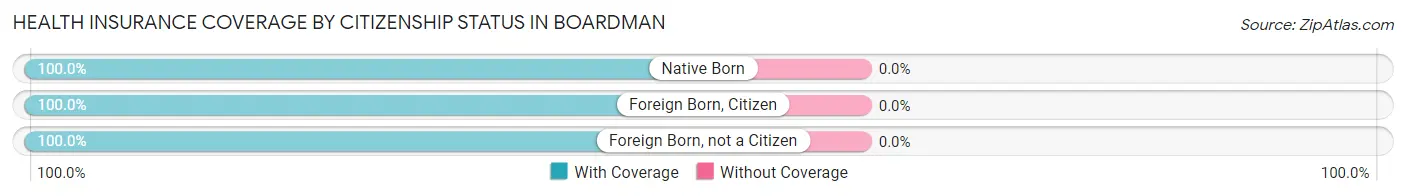
| Citizenship Status | With Coverage | Without Coverage |
| Native Born | 14 (100.0%) | 0 (0.0%) |
| Foreign Born, Citizen | 6 (100.0%) | 0 (0.0%) |
| Foreign Born, not a Citizen | 36 (100.0%) | 0 (0.0%) |
Health Insurance Coverage by Household Income in Boardman
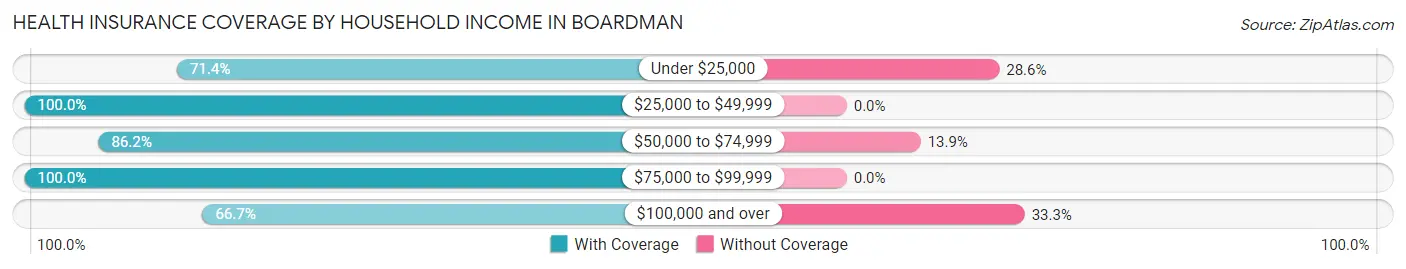
| Household Income | With Coverage | Without Coverage |
| Under $25,000 | 15 (71.4%) | 6 (28.6%) |
| $25,000 to $49,999 | 57 (100.0%) | 0 (0.0%) |
| $50,000 to $74,999 | 112 (86.2%) | 18 (13.9%) |
| $75,000 to $99,999 | 18 (100.0%) | 0 (0.0%) |
| $100,000 and over | 8 (66.7%) | 4 (33.3%) |
Public vs Private Health Insurance Coverage by Age in Boardman
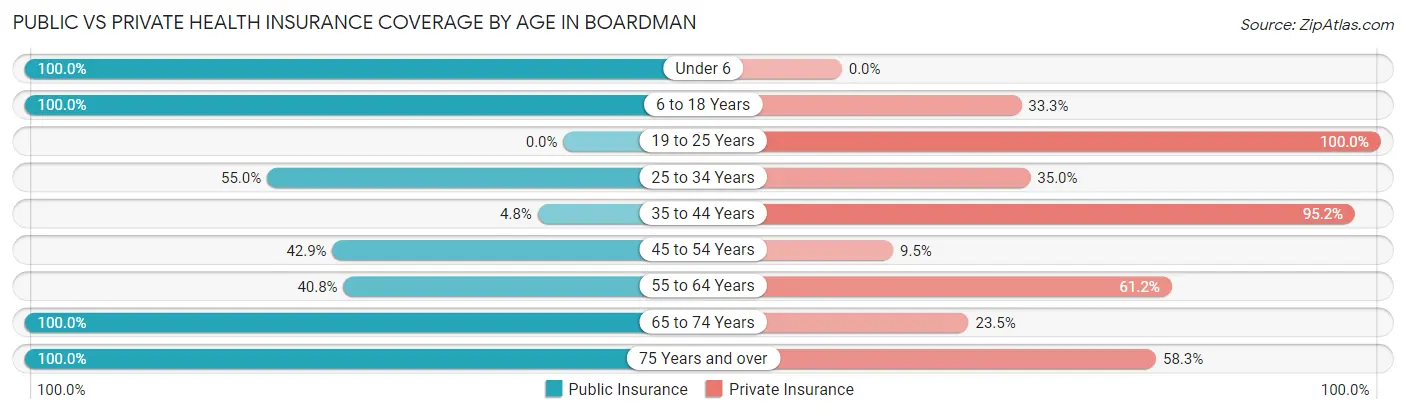
| Age Bracket | Public Insurance | Private Insurance |
| Under 6 | 14 (100.0%) | 0 (0.0%) |
| 6 to 18 Years | 6 (100.0%) | 2 (33.3%) |
| 19 to 25 Years | 0 (0.0%) | 36 (100.0%) |
| 25 to 34 Years | 11 (55.0%) | 7 (35.0%) |
| 35 to 44 Years | 2 (4.8%) | 40 (95.2%) |
| 45 to 54 Years | 18 (42.9%) | 4 (9.5%) |
| 55 to 64 Years | 20 (40.8%) | 30 (61.2%) |
| 65 to 74 Years | 17 (100.0%) | 4 (23.5%) |
| 75 Years and over | 12 (100.0%) | 7 (58.3%) |
| Total | 100 (42.0%) | 130 (54.6%) |
Disability Status by Sex by Age in Boardman
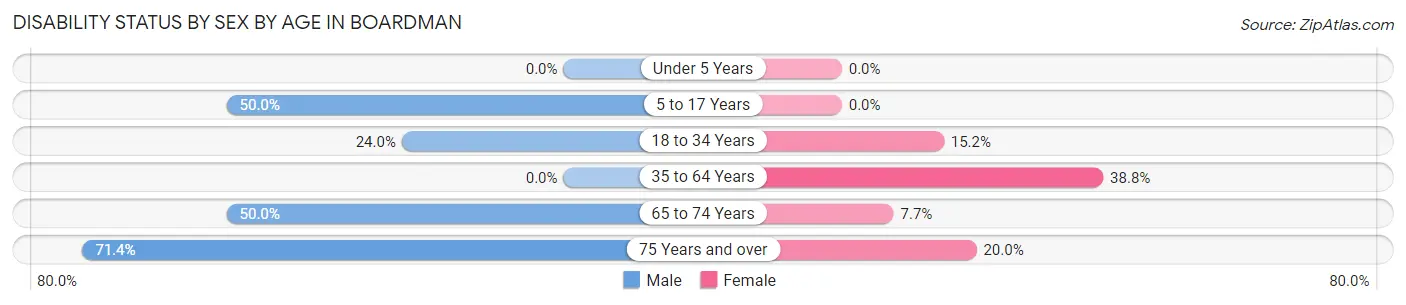
| Age Bracket | Male | Female |
| Under 5 Years | 0 (0.0%) | 0 (0.0%) |
| 5 to 17 Years | 2 (50.0%) | 0 (0.0%) |
| 18 to 34 Years | 6 (24.0%) | 5 (15.1%) |
| 35 to 64 Years | 0 (0.0%) | 26 (38.8%) |
| 65 to 74 Years | 2 (50.0%) | 1 (7.7%) |
| 75 Years and over | 5 (71.4%) | 1 (20.0%) |
Disability Class by Sex by Age in Boardman
Disability Class: Hearing Difficulty
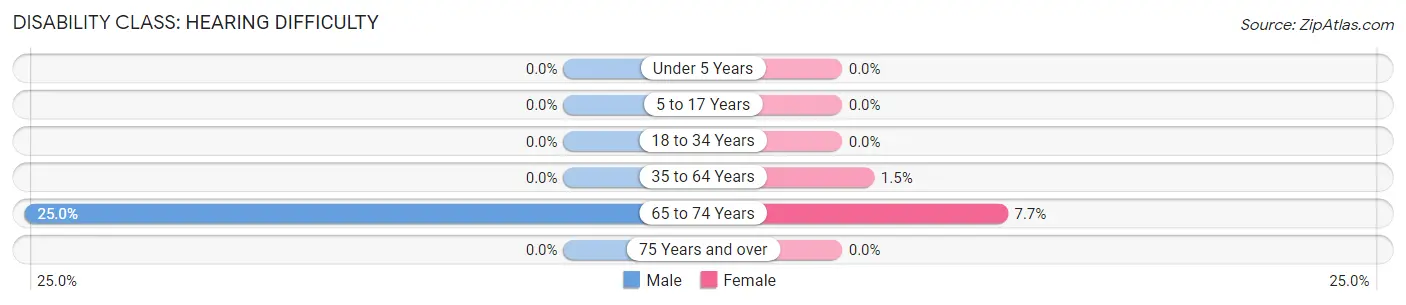
| Age Bracket | Male | Female |
| Under 5 Years | 0 (0.0%) | 0 (0.0%) |
| 5 to 17 Years | 0 (0.0%) | 0 (0.0%) |
| 18 to 34 Years | 0 (0.0%) | 0 (0.0%) |
| 35 to 64 Years | 0 (0.0%) | 1 (1.5%) |
| 65 to 74 Years | 1 (25.0%) | 1 (7.7%) |
| 75 Years and over | 0 (0.0%) | 0 (0.0%) |
Disability Class: Vision Difficulty
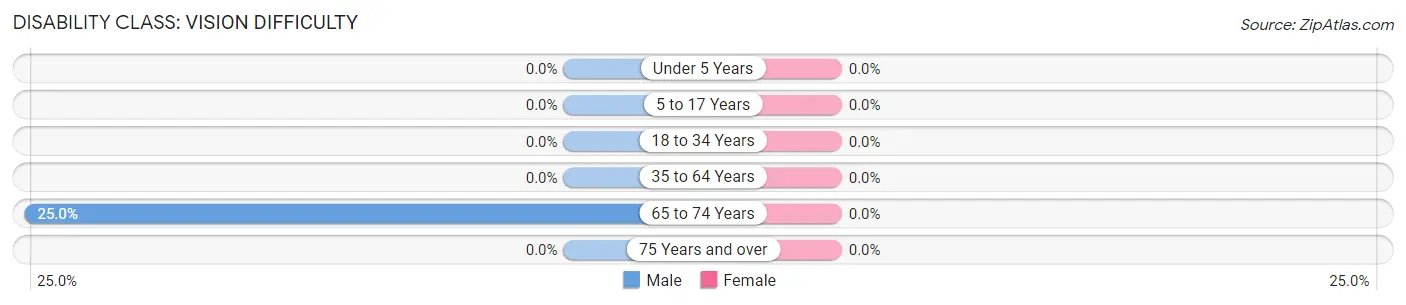
| Age Bracket | Male | Female |
| Under 5 Years | 0 (0.0%) | 0 (0.0%) |
| 5 to 17 Years | 0 (0.0%) | 0 (0.0%) |
| 18 to 34 Years | 0 (0.0%) | 0 (0.0%) |
| 35 to 64 Years | 0 (0.0%) | 0 (0.0%) |
| 65 to 74 Years | 1 (25.0%) | 0 (0.0%) |
| 75 Years and over | 0 (0.0%) | 0 (0.0%) |
Disability Class: Cognitive Difficulty
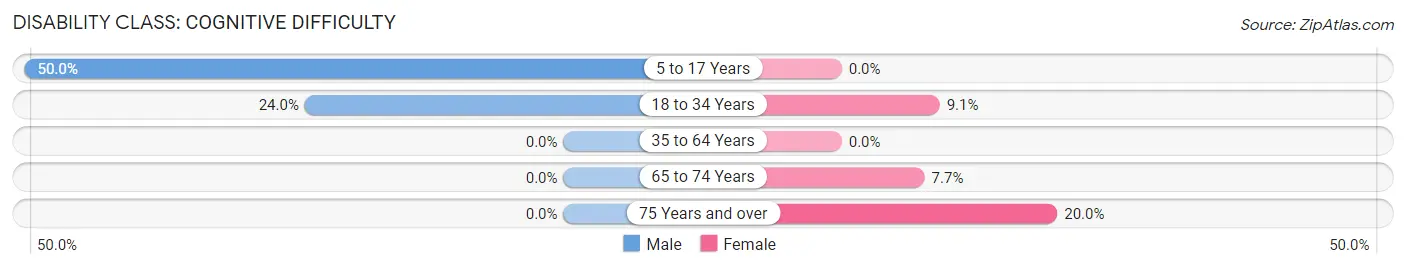
| Age Bracket | Male | Female |
| 5 to 17 Years | 2 (50.0%) | 0 (0.0%) |
| 18 to 34 Years | 6 (24.0%) | 3 (9.1%) |
| 35 to 64 Years | 0 (0.0%) | 0 (0.0%) |
| 65 to 74 Years | 0 (0.0%) | 1 (7.7%) |
| 75 Years and over | 0 (0.0%) | 1 (20.0%) |
Disability Class: Ambulatory Difficulty
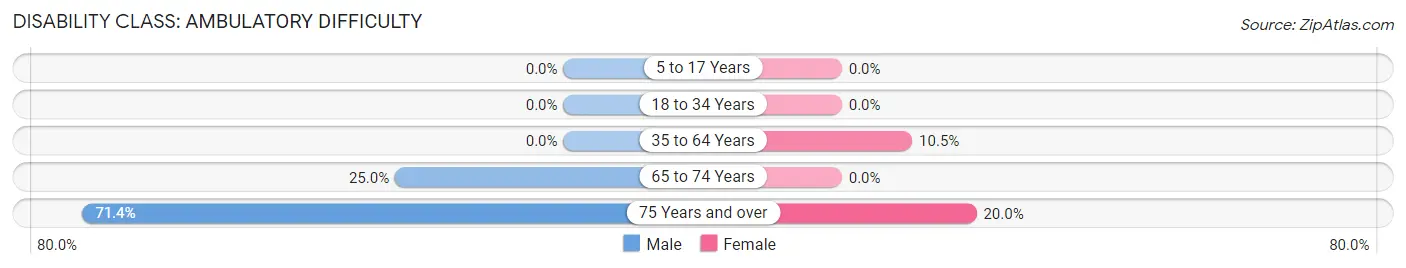
| Age Bracket | Male | Female |
| 5 to 17 Years | 0 (0.0%) | 0 (0.0%) |
| 18 to 34 Years | 0 (0.0%) | 0 (0.0%) |
| 35 to 64 Years | 0 (0.0%) | 7 (10.4%) |
| 65 to 74 Years | 1 (25.0%) | 0 (0.0%) |
| 75 Years and over | 5 (71.4%) | 1 (20.0%) |
Disability Class: Self-Care Difficulty
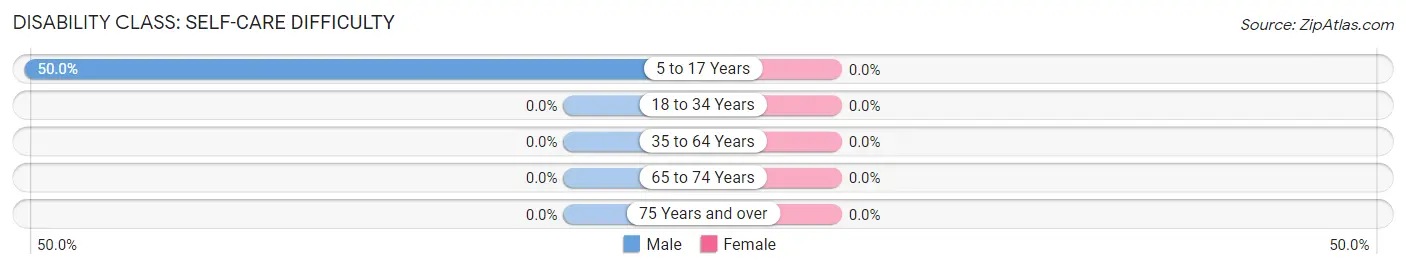
| Age Bracket | Male | Female |
| 5 to 17 Years | 2 (50.0%) | 0 (0.0%) |
| 18 to 34 Years | 0 (0.0%) | 0 (0.0%) |
| 35 to 64 Years | 0 (0.0%) | 0 (0.0%) |
| 65 to 74 Years | 0 (0.0%) | 0 (0.0%) |
| 75 Years and over | 0 (0.0%) | 0 (0.0%) |
Technology Access in Boardman
Computing Device Access in Boardman
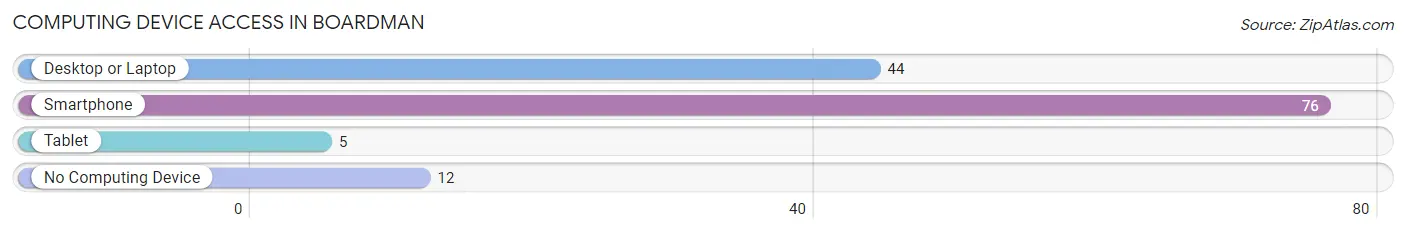
| Device Type | # Households | % Households |
| Desktop or Laptop | 44 | 48.3% |
| Smartphone | 76 | 83.5% |
| Tablet | 5 | 5.5% |
| No Computing Device | 12 | 13.2% |
| Total | 91 | 100.0% |
Internet Access in Boardman
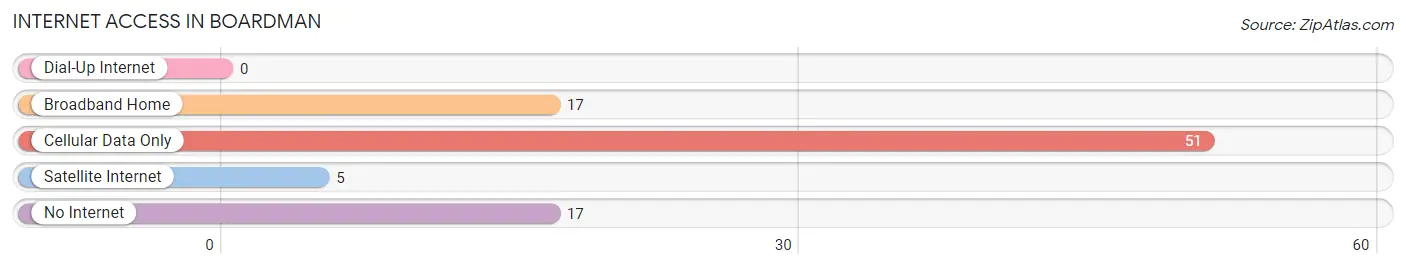
| Internet Type | # Households | % Households |
| Dial-Up Internet | 0 | 0.0% |
| Broadband Home | 17 | 18.7% |
| Cellular Data Only | 51 | 56.0% |
| Satellite Internet | 5 | 5.5% |
| No Internet | 17 | 18.7% |
| Total | 91 | 100.0% |
Boardman Summary
Boardman is a small unincorporated community located in the western part of North Carolina, in the foothills of the Appalachian Mountains. It is situated in the county of McDowell, and is part of the Marion Micropolitan Statistical Area. The population of Boardman was estimated to be around 1,000 in 2020.
History
Boardman was first settled in the late 1700s by a group of settlers from the nearby town of Marion. The town was named after a local landowner, William Boardman, who owned a large tract of land in the area. The town was officially incorporated in 1891.
Boardman was a small farming community for much of its history, with the main crops being corn, wheat, and tobacco. The town also had a few small businesses, such as a general store, a blacksmith shop, and a sawmill.
In the early 1900s, the town began to grow as a result of the railroad. The railroad brought new people to the area, and the town began to expand. The town also became a popular tourist destination, as it was close to the Blue Ridge Mountains.
Geography
Boardman is located in the western part of North Carolina, in the foothills of the Appalachian Mountains. The town is situated in the county of McDowell, and is part of the Marion Micropolitan Statistical Area. The town is located at an elevation of 1,400 feet above sea level.
The town is surrounded by the Catawba River to the north, the Broad River to the east, and the French Broad River to the south. The town is also located near the Pisgah National Forest, which is a popular destination for outdoor activities such as hiking, camping, and fishing.
Economy
The economy of Boardman is largely based on agriculture and tourism. The town is home to several farms, which produce a variety of crops such as corn, wheat, and tobacco. The town is also home to several small businesses, such as a general store, a blacksmith shop, and a sawmill.
The town is also a popular tourist destination, as it is close to the Blue Ridge Mountains. The town is home to several bed and breakfasts, as well as a few restaurants and shops. The town also hosts several festivals throughout the year, such as the Boardman Bluegrass Festival and the Boardman Apple Festival.
Demographics
The population of Boardman was estimated to be around 1,000 in 2020. The town is predominantly white, with around 95% of the population being white. The town also has a small Hispanic population, with around 4% of the population being Hispanic. The median household income in Boardman is around $35,000, and the median home value is around $100,000.
Common Questions
What is the Total Population of Boardman?
Total Population of Boardman is 238.
What is the Total Male Population of Boardman?
Total Male Population of Boardman is 115.
What is the Total Female Population of Boardman?
Total Female Population of Boardman is 123.
What is the Ratio of Males per 100 Females in Boardman?
There are 93.50 Males per 100 Females in Boardman.
What is the Ratio of Females per 100 Males in Boardman?
There are 106.96 Females per 100 Males in Boardman.
What is the Median Population Age in Boardman?
Median Population Age in Boardman is 46.5 Years.
What is the Average Family Size in Boardman
Average Family Size in Boardman is 2.9 People.
What is the Average Household Size in Boardman
Average Household Size in Boardman is 2.6 People.
What is Per Capita Income in Boardman?
Per Capita income in Boardman is $22,883.
What is the Median Family Income in Boardman?
Median Family Income in Boardman is $56,111.
What is the Median Household income in Boardman?
Median Household Income in Boardman is $55,764.
What is Income or Wage Gap in Boardman?
Income or Wage Gap in Boardman is 13.8%.
Women in Boardman earn 86.2 cents for every dollar earned by a man.
What is Inequality or Gini Index in Boardman?
Inequality or Gini Index in Boardman is 0.23.
How Large is the Labor Force in Boardman?
There are 140 People in the Labor Forcein in Boardman.
What is the Percentage of People in the Labor Force in Boardman?
63.6% of People are in the Labor Force in Boardman.
What is the Unemployment Rate in Boardman?
Unemployment Rate in Boardman is 7.1%.