Aulander, NC
Aulander Map
Aulander Overview
704
TOTAL POPULATION
329
MALE POPULATION
375
FEMALE POPULATION
87.73
MALES / 100 FEMALES
113.98
FEMALES / 100 MALES
42.4
MEDIAN AGE
3.0
AVG FAMILY SIZE
2.0
AVG HOUSEHOLD SIZE
$24,522
PER CAPITA INCOME
$58,654
AVG FAMILY INCOME
$33,250
AVG HOUSEHOLD INCOME
18.8%
WAGE / INCOME GAP [ % ]
81.2¢/ $1
WAGE / INCOME GAP [ $ ]
0.45
INEQUALITY / GINI INDEX
277
LABOR FORCE [ PEOPLE ]
50.6%
PERCENT IN LABOR FORCE
12.6%
UNEMPLOYMENT RATE
Aulander Zip Codes
Aulander Area Codes
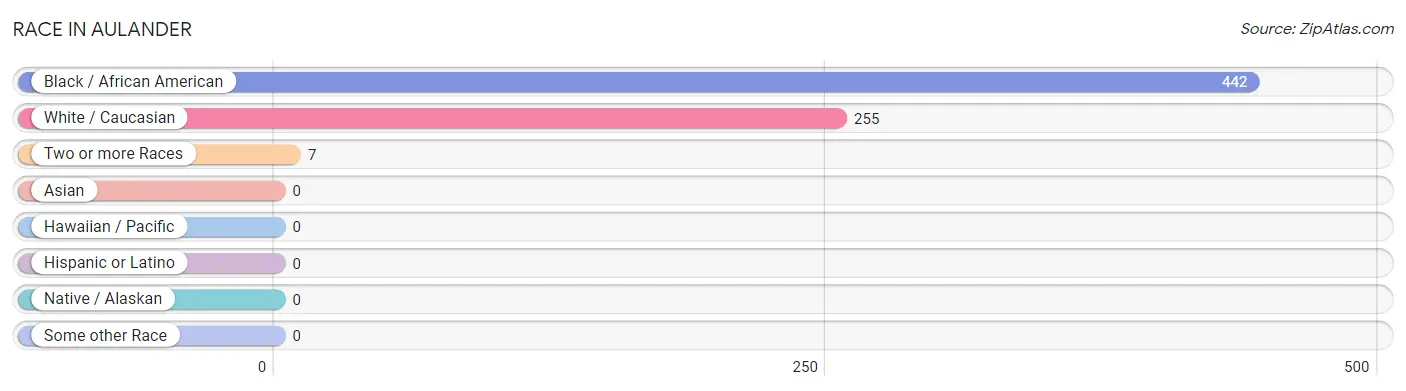
Race in Aulander
The most populous races in Aulander are Black / African American (442 | 62.8%), White / Caucasian (255 | 36.2%), and Two or more Races (7 | 1.0%).
| Race | # Population | % Population |
| Asian | 0 | 0.0% |
| Black / African American | 442 | 62.8% |
| Hawaiian / Pacific | 0 | 0.0% |
| Hispanic or Latino | 0 | 0.0% |
| Native / Alaskan | 0 | 0.0% |
| White / Caucasian | 255 | 36.2% |
| Two or more Races | 7 | 1.0% |
| Some other Race | 0 | 0.0% |
| Total | 704 | 100.0% |
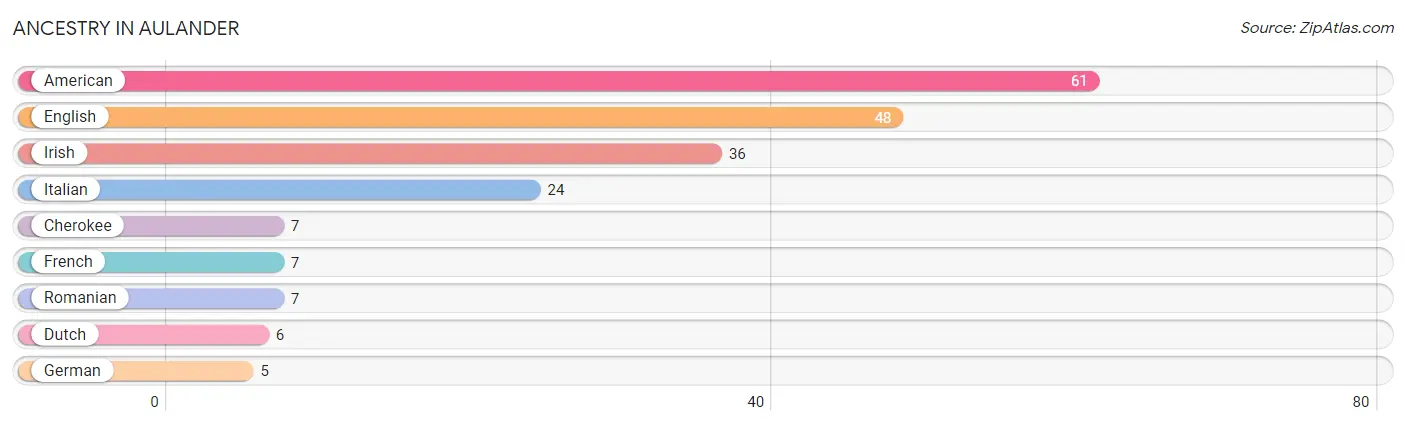
Ancestry in Aulander
The most populous ancestries reported in Aulander are American (61 | 8.7%), English (48 | 6.8%), Irish (36 | 5.1%), Italian (24 | 3.4%), and Cherokee (7 | 1.0%), together accounting for 25.0% of all Aulander residents.
| Ancestry | # Population | % Population |
| American | 61 | 8.7% |
| Cherokee | 7 | 1.0% |
| Dutch | 6 | 0.9% |
| English | 48 | 6.8% |
| French | 7 | 1.0% |
| German | 5 | 0.7% |
| Irish | 36 | 5.1% |
| Italian | 24 | 3.4% |
| Romanian | 7 | 1.0% | View All 9 Rows |
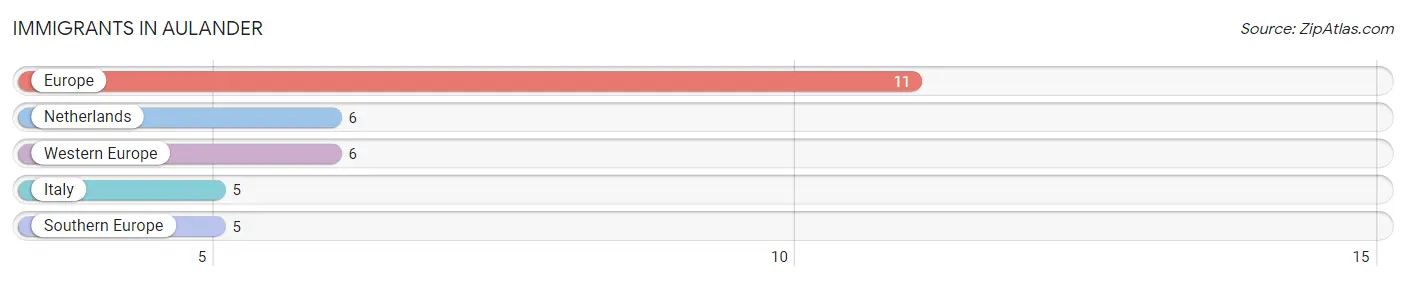
Immigrants in Aulander
The most numerous immigrant groups reported in Aulander came from Europe (11 | 1.6%), Netherlands (6 | 0.9%), Western Europe (6 | 0.9%), Italy (5 | 0.7%), and Southern Europe (5 | 0.7%), together accounting for 4.7% of all Aulander residents.
| Immigration Origin | # Population | % Population |
| Europe | 11 | 1.6% |
| Italy | 5 | 0.7% |
| Netherlands | 6 | 0.9% |
| Southern Europe | 5 | 0.7% |
| Western Europe | 6 | 0.9% | View All 5 Rows |
Sex and Age in Aulander
Sex and Age in Aulander
The most populous age groups in Aulander are 75 to 79 Years (51 | 15.5%) for men and Under 5 Years (89 | 23.7%) for women.
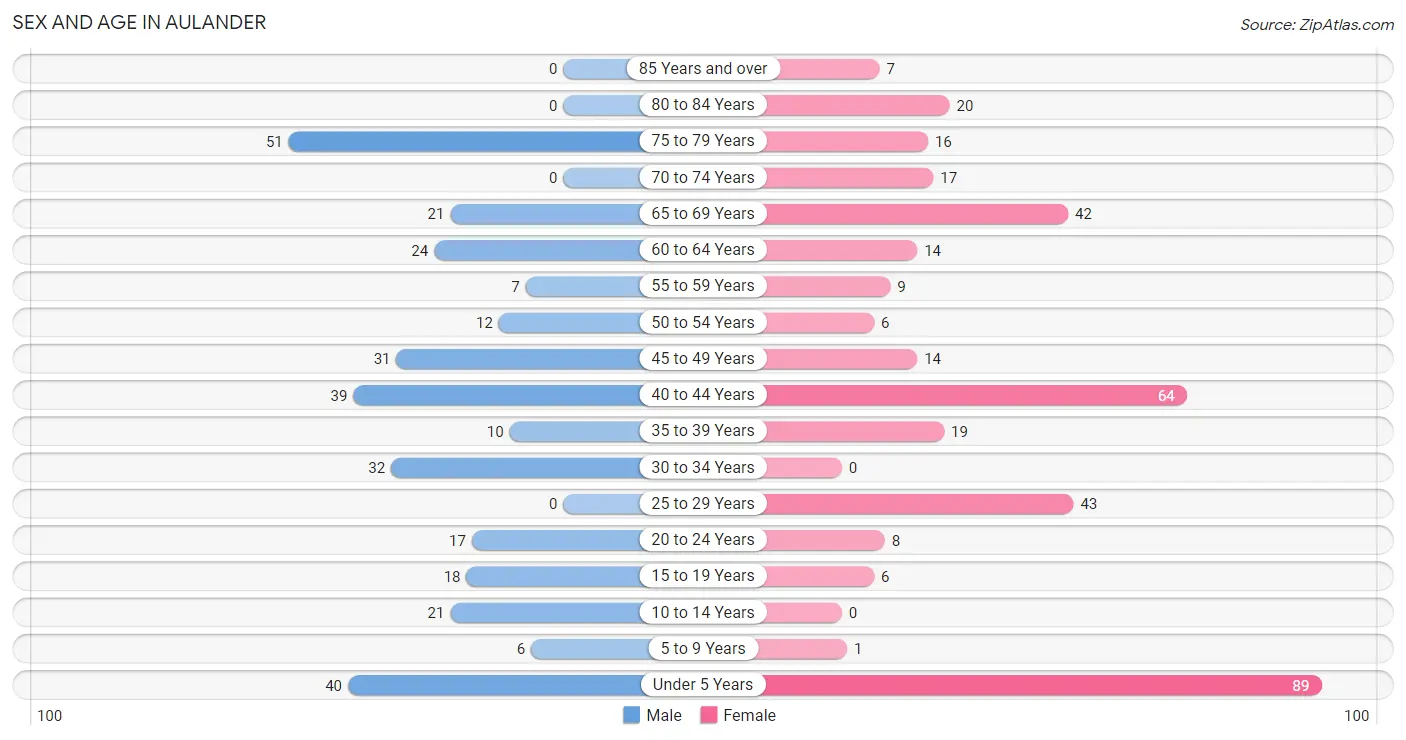
| Age Bracket | Male | Female |
| Under 5 Years | 40 (12.2%) | 89 (23.7%) |
| 5 to 9 Years | 6 (1.8%) | 1 (0.3%) |
| 10 to 14 Years | 21 (6.4%) | 0 (0.0%) |
| 15 to 19 Years | 18 (5.5%) | 6 (1.6%) |
| 20 to 24 Years | 17 (5.2%) | 8 (2.1%) |
| 25 to 29 Years | 0 (0.0%) | 43 (11.5%) |
| 30 to 34 Years | 32 (9.7%) | 0 (0.0%) |
| 35 to 39 Years | 10 (3.0%) | 19 (5.1%) |
| 40 to 44 Years | 39 (11.8%) | 64 (17.1%) |
| 45 to 49 Years | 31 (9.4%) | 14 (3.7%) |
| 50 to 54 Years | 12 (3.6%) | 6 (1.6%) |
| 55 to 59 Years | 7 (2.1%) | 9 (2.4%) |
| 60 to 64 Years | 24 (7.3%) | 14 (3.7%) |
| 65 to 69 Years | 21 (6.4%) | 42 (11.2%) |
| 70 to 74 Years | 0 (0.0%) | 17 (4.5%) |
| 75 to 79 Years | 51 (15.5%) | 16 (4.3%) |
| 80 to 84 Years | 0 (0.0%) | 20 (5.3%) |
| 85 Years and over | 0 (0.0%) | 7 (1.9%) |
| Total | 329 (100.0%) | 375 (100.0%) |
Families and Households in Aulander
Median Family Size in Aulander
The median family size in Aulander is 2.96 persons per family, with single female/mother families (96 | 55.8%) accounting for the largest median family size of 3.16 persons per family. On the other hand, single male/father families (3 | 1.7%) represent the smallest median family size with 2.33 persons per family.
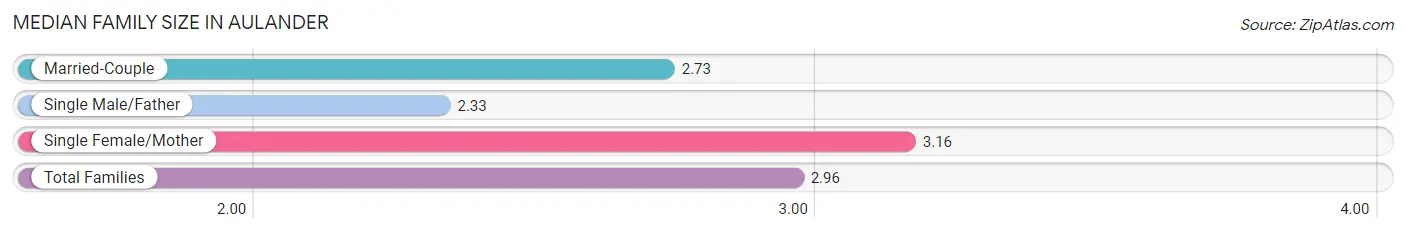
| Family Type | # Families | Family Size |
| Married-Couple | 73 (42.4%) | 2.73 |
| Single Male/Father | 3 (1.7%) | 2.33 |
| Single Female/Mother | 96 (55.8%) | 3.16 |
| Total Families | 172 (100.0%) | 2.96 |
Median Household Size in Aulander
The median household size in Aulander is 2.03 persons per household, with single female/mother households (96 | 27.8%) accounting for the largest median household size of 3.16 persons per household. non-family households (174 | 50.3%) represent the smallest median household size with 1.10 persons per household.
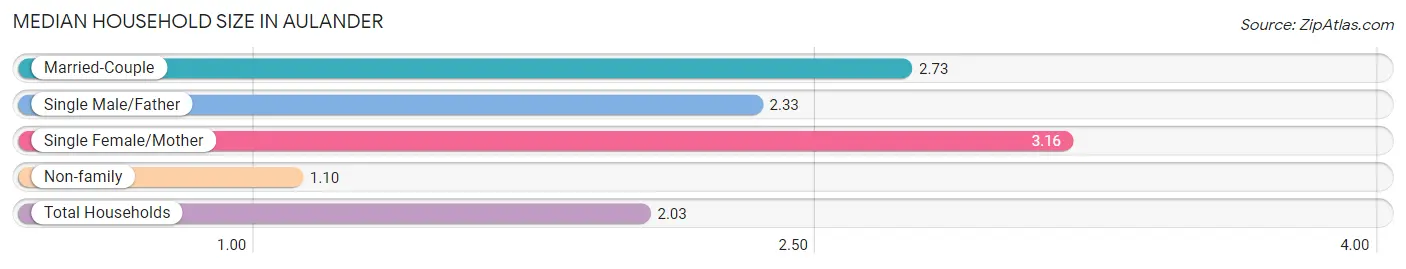
| Household Type | # Households | Household Size |
| Married-Couple | 73 (21.1%) | 2.73 |
| Single Male/Father | 3 (0.9%) | 2.33 |
| Single Female/Mother | 96 (27.8%) | 3.16 |
| Non-family | 174 (50.3%) | 1.10 |
| Total Households | 346 (100.0%) | 2.03 |
Household Size by Marriage Status in Aulander
Out of a total of 346 households in Aulander, 172 (49.7%) are family households, while 174 (50.3%) are nonfamily households. The most numerous type of family households are 2-person households, comprising 87, and the most common type of nonfamily households are 1-person households, comprising 161.
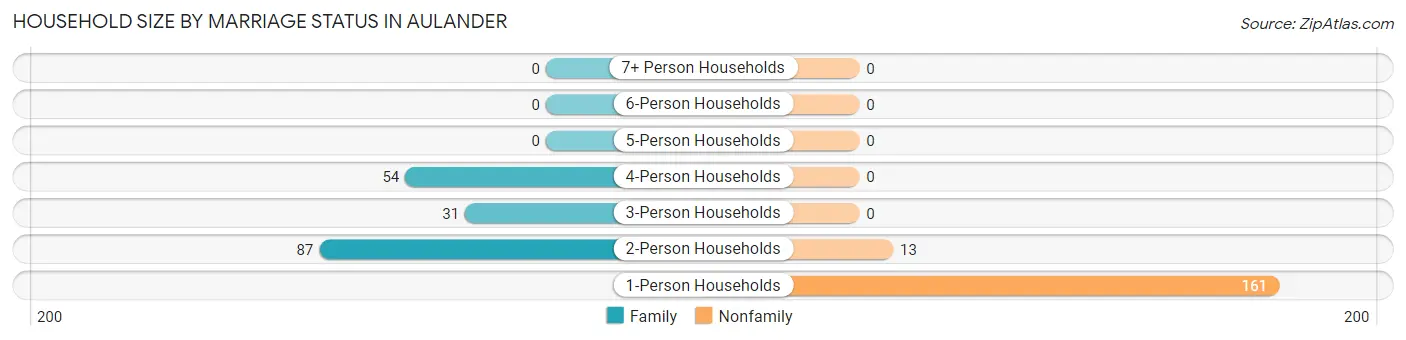
| Household Size | Family Households | Nonfamily Households |
| 1-Person Households | - | 161 (46.5%) |
| 2-Person Households | 87 (25.1%) | 13 (3.8%) |
| 3-Person Households | 31 (9.0%) | 0 (0.0%) |
| 4-Person Households | 54 (15.6%) | 0 (0.0%) |
| 5-Person Households | 0 (0.0%) | 0 (0.0%) |
| 6-Person Households | 0 (0.0%) | 0 (0.0%) |
| 7+ Person Households | 0 (0.0%) | 0 (0.0%) |
| Total | 172 (49.7%) | 174 (50.3%) |
Female Fertility in Aulander
Fertility by Age in Aulander
Average fertility rate in Aulander is 225.0 births per 1,000 women. Women in the age bracket of 20 to 34 years have the highest fertility rate with 588.0 births per 1,000 women. Women in the age bracket of 20 to 34 years acount for 83.3% of all women with births.
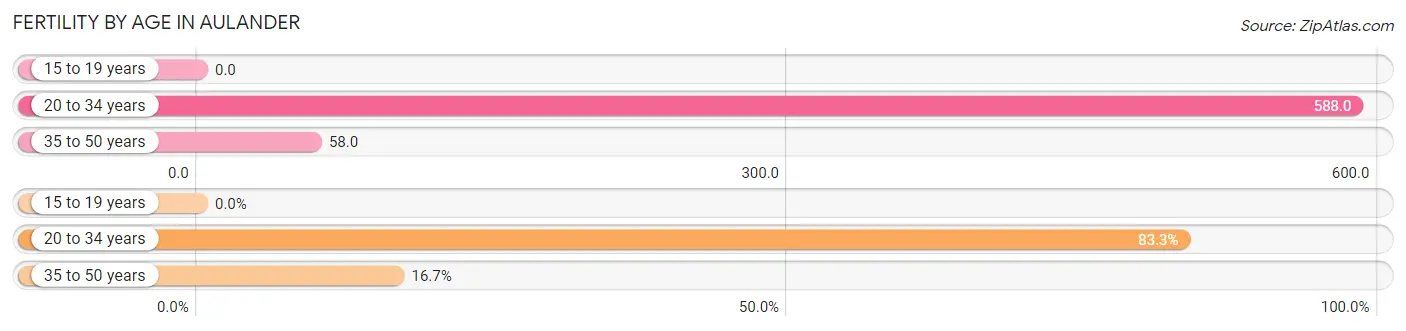
| Age Bracket | Women with Births | Births / 1,000 Women |
| 15 to 19 years | 0 (0.0%) | 0.0 |
| 20 to 34 years | 30 (83.3%) | 588.0 |
| 35 to 50 years | 6 (16.7%) | 58.0 |
| Total | 36 (100.0%) | 225.0 |
Fertility by Age by Marriage Status in Aulander
16.7% of women with births (36) in Aulander are married. The highest percentage of unmarried women with births falls into 20 to 34 years age bracket with 100.0% of them unmarried at the time of birth, while the lowest percentage of unmarried women with births belong to 35 to 50 years age bracket with 0.0% of them unmarried.
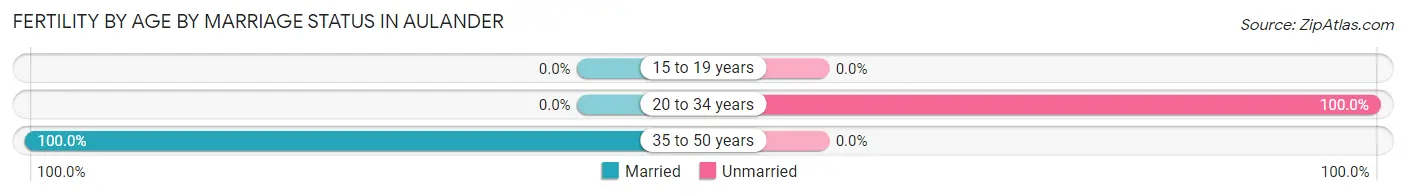
| Age Bracket | Married | Unmarried |
| 15 to 19 years | 0 (0.0%) | 0 (0.0%) |
| 20 to 34 years | 0 (0.0%) | 30 (100.0%) |
| 35 to 50 years | 6 (100.0%) | 0 (0.0%) |
| Total | 6 (16.7%) | 30 (83.3%) |
Fertility by Education in Aulander
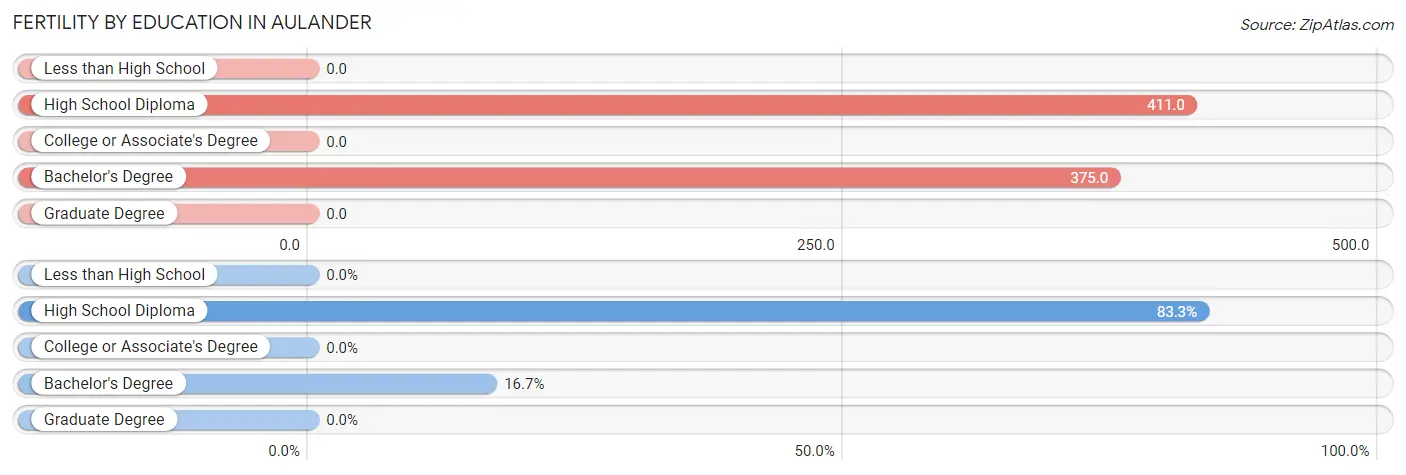
| Educational Attainment | Women with Births | Births / 1,000 Women |
| Less than High School | 0 (0.0%) | 0.0 |
| High School Diploma | 30 (83.3%) | 411.0 |
| College or Associate's Degree | 0 (0.0%) | 0.0 |
| Bachelor's Degree | 6 (16.7%) | 375.0 |
| Graduate Degree | 0 (0.0%) | 0.0 |
| Total | 36 (100.0%) | 225.0 |
Fertility by Education by Marriage Status in Aulander
83.3% of women with births in Aulander are unmarried. Women with the educational attainment of bachelor's degree are most likely to be married with 100.0% of them married at childbirth, while women with the educational attainment of high school diploma are least likely to be married with 100.0% of them unmarried at childbirth.
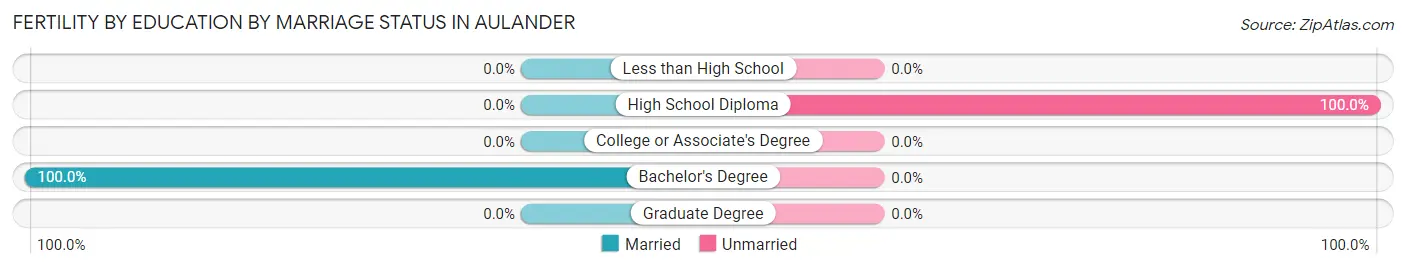
| Educational Attainment | Married | Unmarried |
| Less than High School | 0 (0.0%) | 0 (0.0%) |
| High School Diploma | 0 (0.0%) | 30 (100.0%) |
| College or Associate's Degree | 0 (0.0%) | 0 (0.0%) |
| Bachelor's Degree | 6 (100.0%) | 0 (0.0%) |
| Graduate Degree | 0 (0.0%) | 0 (0.0%) |
| Total | 6 (16.7%) | 30 (83.3%) |
Income in Aulander
Income Overview in Aulander
Per Capita Income in Aulander is $24,522, while median incomes of families and households are $58,654 and $33,250 respectively.
| Characteristic | Number | Measure |
| Per Capita Income | 704 | $24,522 |
| Median Family Income | 172 | $58,654 |
| Mean Family Income | 172 | $71,435 |
| Median Household Income | 346 | $33,250 |
| Mean Household Income | 346 | $48,188 |
| Income Deficit | 172 | $0 |
| Wage / Income Gap (%) | 704 | 18.81% |
| Wage / Income Gap ($) | 704 | 81.19¢ per $1 |
| Gini / Inequality Index | 704 | 0.45 |
Earnings by Sex in Aulander
Average Earnings in Aulander are $46,953, $47,422 for men and $38,500 for women, a difference of 18.8%.
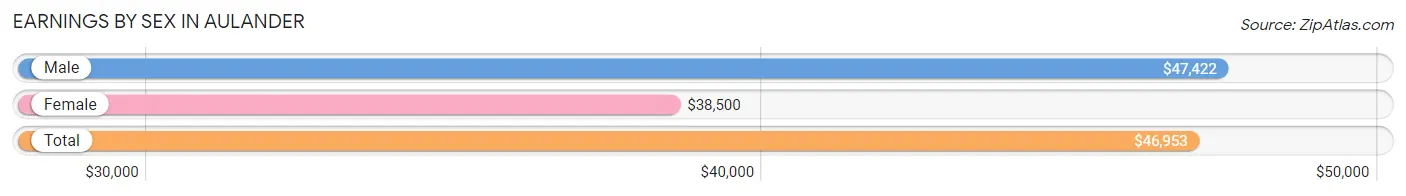
| Sex | Number | Average Earnings |
| Male | 99 (36.5%) | $47,422 |
| Female | 172 (63.5%) | $38,500 |
| Total | 271 (100.0%) | $46,953 |
Earnings by Sex by Income Bracket in Aulander
The most common earnings brackets in Aulander are $45,000 to $49,999 for men (23 | 23.2%) and $55,000 to $64,999 for women (60 | 34.9%).
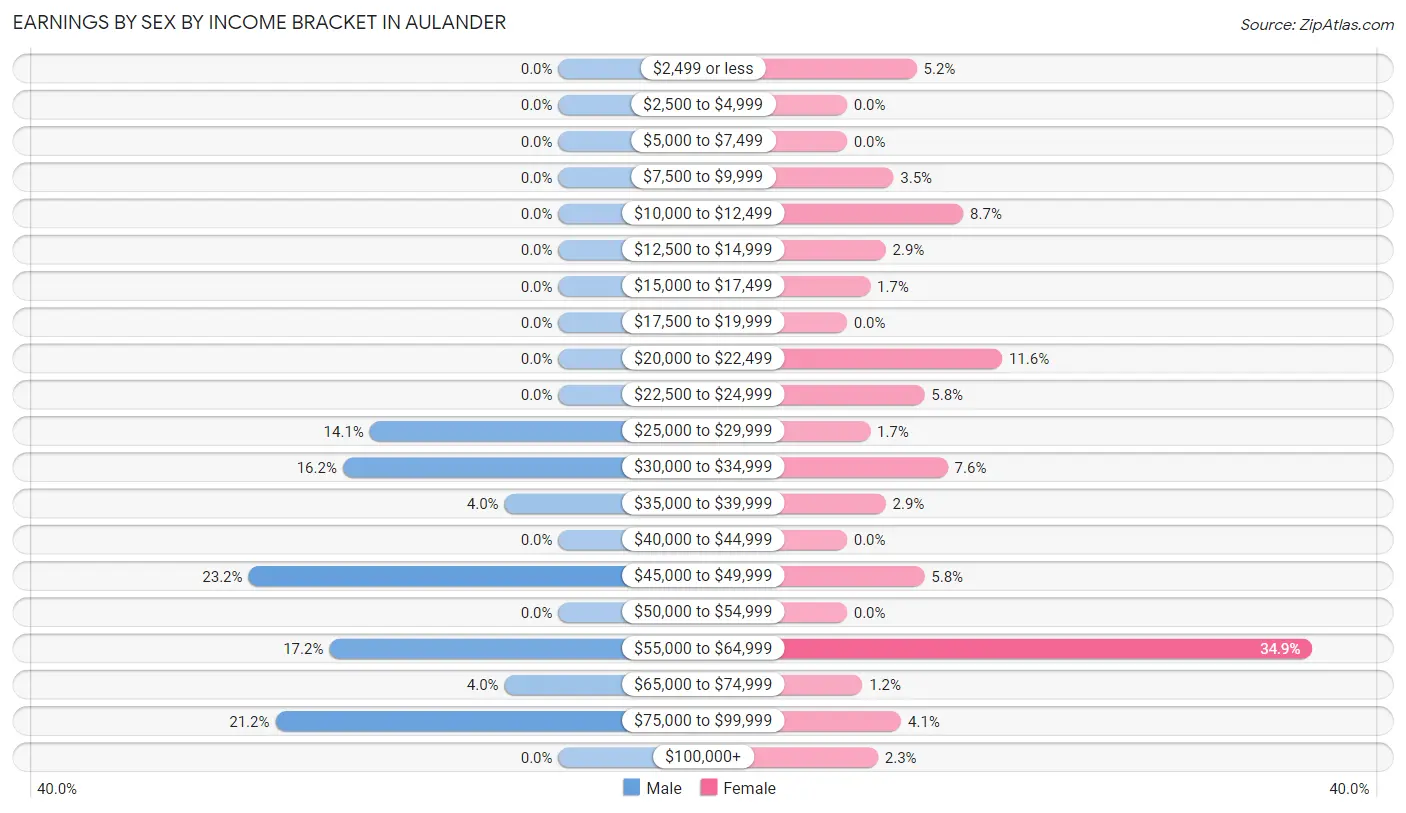
| Income | Male | Female |
| $2,499 or less | 0 (0.0%) | 9 (5.2%) |
| $2,500 to $4,999 | 0 (0.0%) | 0 (0.0%) |
| $5,000 to $7,499 | 0 (0.0%) | 0 (0.0%) |
| $7,500 to $9,999 | 0 (0.0%) | 6 (3.5%) |
| $10,000 to $12,499 | 0 (0.0%) | 15 (8.7%) |
| $12,500 to $14,999 | 0 (0.0%) | 5 (2.9%) |
| $15,000 to $17,499 | 0 (0.0%) | 3 (1.7%) |
| $17,500 to $19,999 | 0 (0.0%) | 0 (0.0%) |
| $20,000 to $22,499 | 0 (0.0%) | 20 (11.6%) |
| $22,500 to $24,999 | 0 (0.0%) | 10 (5.8%) |
| $25,000 to $29,999 | 14 (14.1%) | 3 (1.7%) |
| $30,000 to $34,999 | 16 (16.2%) | 13 (7.6%) |
| $35,000 to $39,999 | 4 (4.0%) | 5 (2.9%) |
| $40,000 to $44,999 | 0 (0.0%) | 0 (0.0%) |
| $45,000 to $49,999 | 23 (23.2%) | 10 (5.8%) |
| $50,000 to $54,999 | 0 (0.0%) | 0 (0.0%) |
| $55,000 to $64,999 | 17 (17.2%) | 60 (34.9%) |
| $65,000 to $74,999 | 4 (4.0%) | 2 (1.2%) |
| $75,000 to $99,999 | 21 (21.2%) | 7 (4.1%) |
| $100,000+ | 0 (0.0%) | 4 (2.3%) |
| Total | 99 (100.0%) | 172 (100.0%) |
Earnings by Sex by Educational Attainment in Aulander
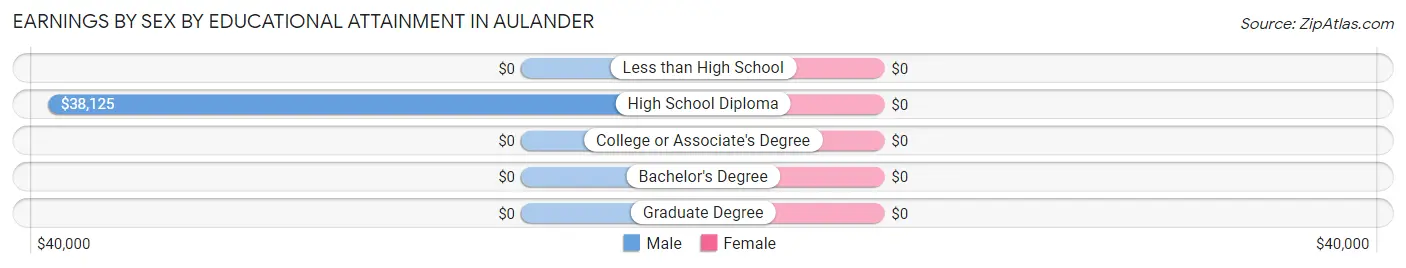
| Educational Attainment | Male Income | Female Income |
| Less than High School | - | - |
| High School Diploma | $38,125 | $0 |
| College or Associate's Degree | - | - |
| Bachelor's Degree | - | - |
| Graduate Degree | - | - |
| Total | $46,094 | $38,000 |
Family Income in Aulander
Family Income Brackets in Aulander
According to the Aulander family income data, there are 60 families falling into the $75,000 to $99,999 income range, which is the most common income bracket and makes up 34.9% of all families.
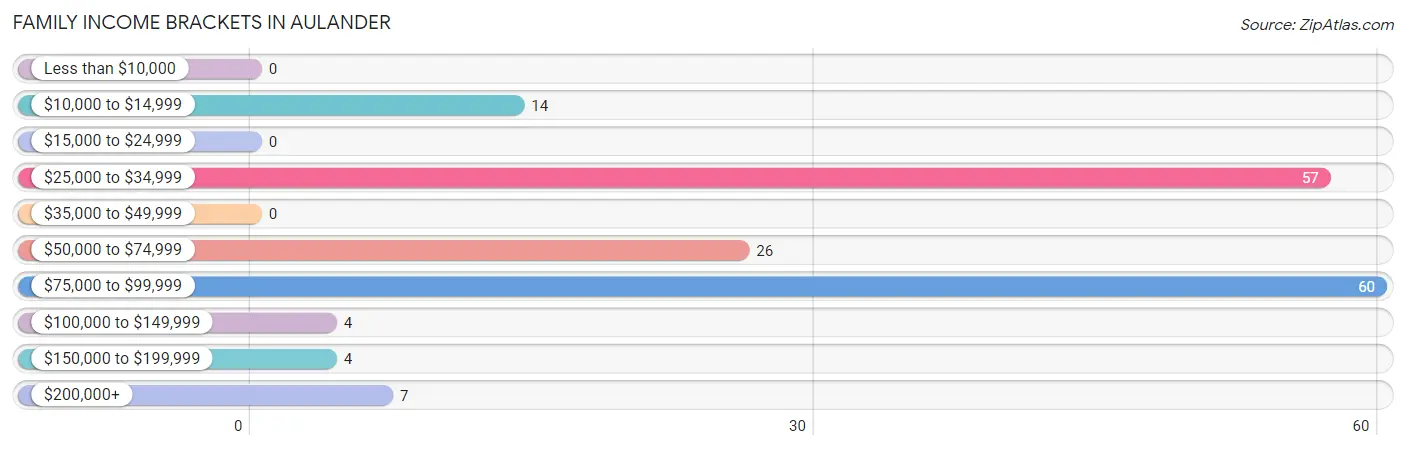
| Income Bracket | # Families | % Families |
| Less than $10,000 | 0 | 0.0% |
| $10,000 to $14,999 | 14 | 8.1% |
| $15,000 to $24,999 | 0 | 0.0% |
| $25,000 to $34,999 | 57 | 33.1% |
| $35,000 to $49,999 | 0 | 0.0% |
| $50,000 to $74,999 | 26 | 15.1% |
| $75,000 to $99,999 | 60 | 34.9% |
| $100,000 to $149,999 | 4 | 2.3% |
| $150,000 to $199,999 | 4 | 2.3% |
| $200,000+ | 7 | 4.1% |
Family Income by Famaliy Size in Aulander
4-person families (54 | 31.4%) account for the highest median family income in Aulander with $91,570 per family, while 4-person families (54 | 31.4%) have the highest median income of $22,892 per family member.
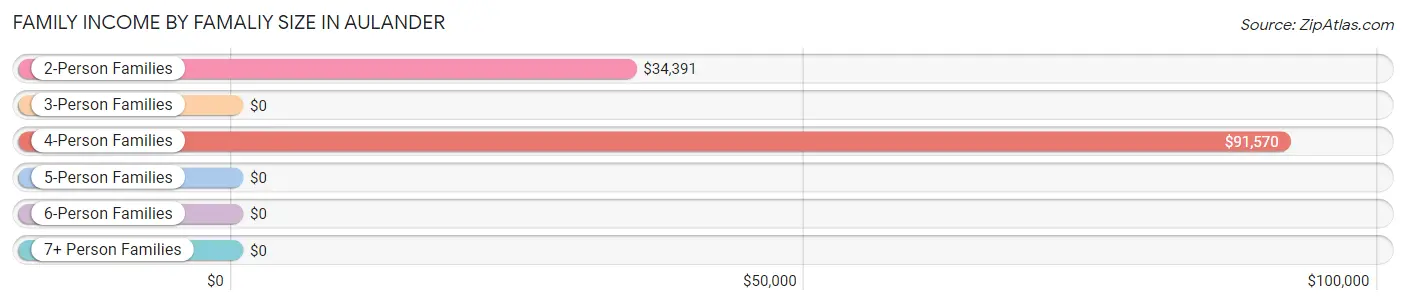
| Income Bracket | # Families | Median Income |
| 2-Person Families | 87 (50.6%) | $34,391 |
| 3-Person Families | 31 (18.0%) | $0 |
| 4-Person Families | 54 (31.4%) | $91,570 |
| 5-Person Families | 0 (0.0%) | $0 |
| 6-Person Families | 0 (0.0%) | $0 |
| 7+ Person Families | 0 (0.0%) | $0 |
| Total | 172 (100.0%) | $58,654 |
Family Income by Number of Earners in Aulander
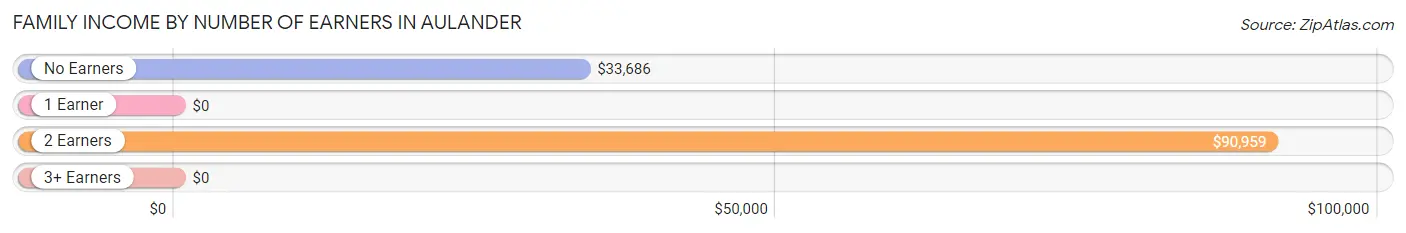
| Number of Earners | # Families | Median Income |
| No Earners | 53 (30.8%) | $33,686 |
| 1 Earner | 29 (16.9%) | $0 |
| 2 Earners | 79 (45.9%) | $90,959 |
| 3+ Earners | 11 (6.4%) | $0 |
| Total | 172 (100.0%) | $58,654 |
Household Income in Aulander
Household Income Brackets in Aulander
With 88 households falling in the category, the $15,000 to $24,999 income range is the most frequent in Aulander, accounting for 25.4% of all households. In contrast, only 4 households (1.2%) fall into the $100,000 to $149,999 income bracket, making it the least populous group.
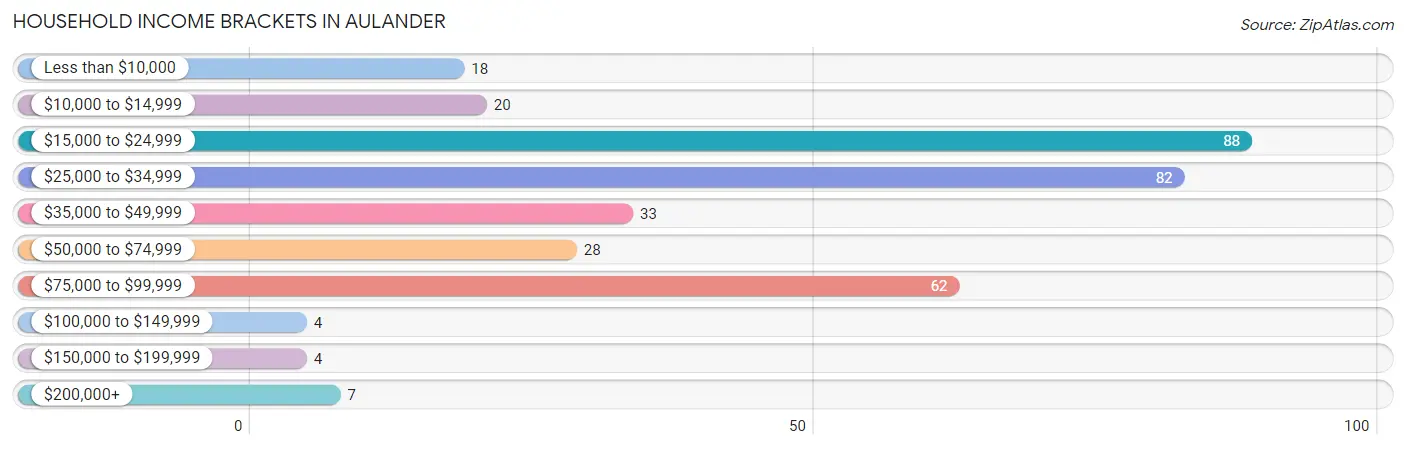
| Income Bracket | # Households | % Households |
| Less than $10,000 | 18 | 5.2% |
| $10,000 to $14,999 | 20 | 5.8% |
| $15,000 to $24,999 | 88 | 25.4% |
| $25,000 to $34,999 | 82 | 23.7% |
| $35,000 to $49,999 | 33 | 9.5% |
| $50,000 to $74,999 | 28 | 8.1% |
| $75,000 to $99,999 | 62 | 17.9% |
| $100,000 to $149,999 | 4 | 1.2% |
| $150,000 to $199,999 | 4 | 1.2% |
| $200,000+ | 7 | 2.0% |
Household Income by Householder Age in Aulander
The median household income in Aulander is $33,250, with the highest median household income of $27,250 found in the 65+ years age bracket for the primary householder. A total of 125 households (36.1%) fall into this category.
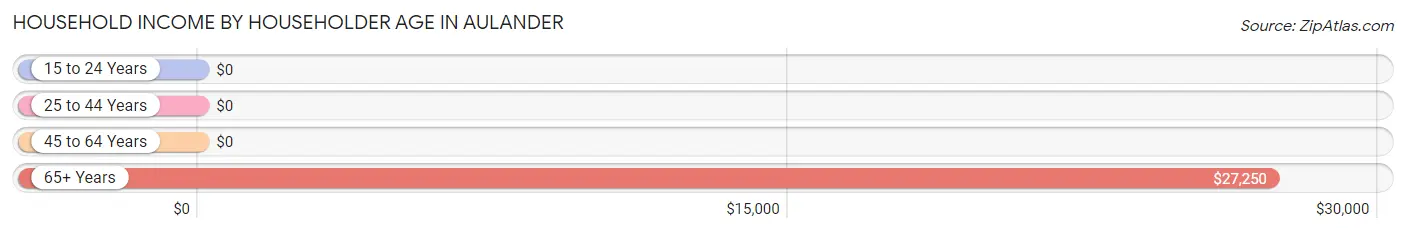
| Income Bracket | # Households | Median Income |
| 15 to 24 Years | 0 (0.0%) | $0 |
| 25 to 44 Years | 129 (37.3%) | $0 |
| 45 to 64 Years | 92 (26.6%) | $0 |
| 65+ Years | 125 (36.1%) | $27,250 |
| Total | 346 (100.0%) | $33,250 |
Poverty in Aulander
Income Below Poverty by Sex and Age in Aulander
With 14.0% poverty level for males and 11.5% for females among the residents of Aulander, 25 to 34 year old males and 45 to 54 year old females are the most vulnerable to poverty, with 23 males (71.9%) and 9 females (45.0%) in their respective age groups living below the poverty level.
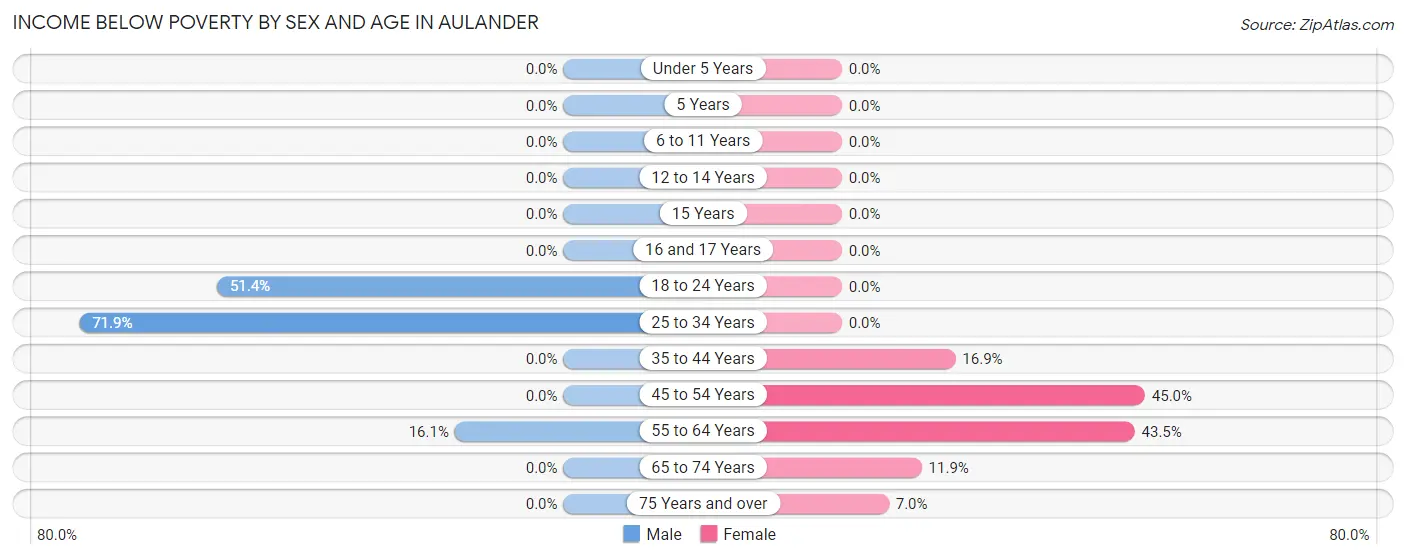
| Age Bracket | Male | Female |
| Under 5 Years | 0 (0.0%) | 0 (0.0%) |
| 5 Years | 0 (0.0%) | 0 (0.0%) |
| 6 to 11 Years | 0 (0.0%) | 0 (0.0%) |
| 12 to 14 Years | 0 (0.0%) | 0 (0.0%) |
| 15 Years | 0 (0.0%) | 0 (0.0%) |
| 16 and 17 Years | 0 (0.0%) | 0 (0.0%) |
| 18 to 24 Years | 18 (51.4%) | 0 (0.0%) |
| 25 to 34 Years | 23 (71.9%) | 0 (0.0%) |
| 35 to 44 Years | 0 (0.0%) | 14 (16.9%) |
| 45 to 54 Years | 0 (0.0%) | 9 (45.0%) |
| 55 to 64 Years | 5 (16.1%) | 10 (43.5%) |
| 65 to 74 Years | 0 (0.0%) | 7 (11.9%) |
| 75 Years and over | 0 (0.0%) | 3 (7.0%) |
| Total | 46 (14.0%) | 43 (11.5%) |
Income Above Poverty by Sex and Age in Aulander
According to the poverty statistics in Aulander, males aged under 5 years and females aged under 5 years are the age groups that are most secure financially, with 100.0% of males and 100.0% of females in these age groups living above the poverty line.
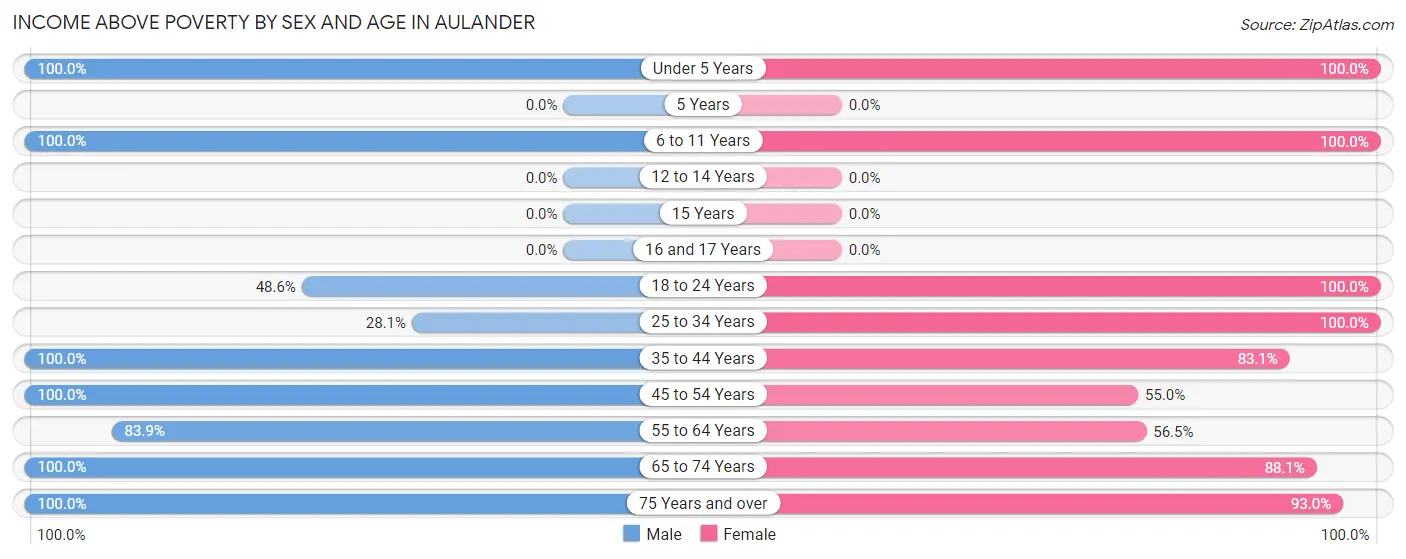
| Age Bracket | Male | Female |
| Under 5 Years | 40 (100.0%) | 89 (100.0%) |
| 5 Years | 0 (0.0%) | 0 (0.0%) |
| 6 to 11 Years | 27 (100.0%) | 1 (100.0%) |
| 12 to 14 Years | 0 (0.0%) | 0 (0.0%) |
| 15 Years | 0 (0.0%) | 0 (0.0%) |
| 16 and 17 Years | 0 (0.0%) | 0 (0.0%) |
| 18 to 24 Years | 17 (48.6%) | 14 (100.0%) |
| 25 to 34 Years | 9 (28.1%) | 43 (100.0%) |
| 35 to 44 Years | 49 (100.0%) | 69 (83.1%) |
| 45 to 54 Years | 43 (100.0%) | 11 (55.0%) |
| 55 to 64 Years | 26 (83.9%) | 13 (56.5%) |
| 65 to 74 Years | 21 (100.0%) | 52 (88.1%) |
| 75 Years and over | 51 (100.0%) | 40 (93.0%) |
| Total | 283 (86.0%) | 332 (88.5%) |
Income Below Poverty Among Married-Couple Families in Aulander
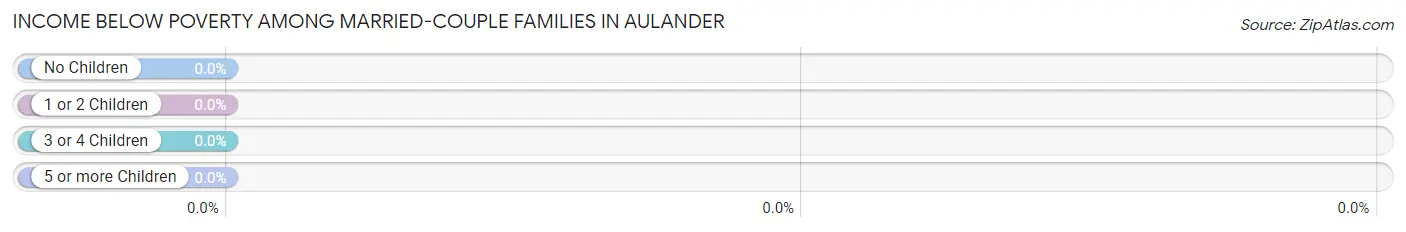
| Children | Above Poverty | Below Poverty |
| No Children | 63 (100.0%) | 0 (0.0%) |
| 1 or 2 Children | 10 (100.0%) | 0 (0.0%) |
| 3 or 4 Children | 0 (0.0%) | 0 (0.0%) |
| 5 or more Children | 0 (0.0%) | 0 (0.0%) |
| Total | 73 (100.0%) | 0 (0.0%) |
Income Below Poverty Among Single-Parent Households in Aulander
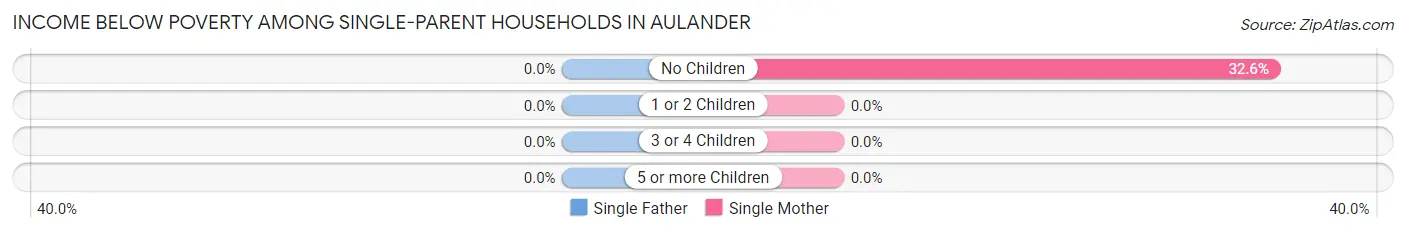
| Children | Single Father | Single Mother |
| No Children | 0 (0.0%) | 14 (32.6%) |
| 1 or 2 Children | 0 (0.0%) | 0 (0.0%) |
| 3 or 4 Children | 0 (0.0%) | 0 (0.0%) |
| 5 or more Children | 0 (0.0%) | 0 (0.0%) |
| Total | 0 (0.0%) | 14 (14.6%) |
Income Below Poverty Among Married-Couple vs Single-Parent Households in Aulander
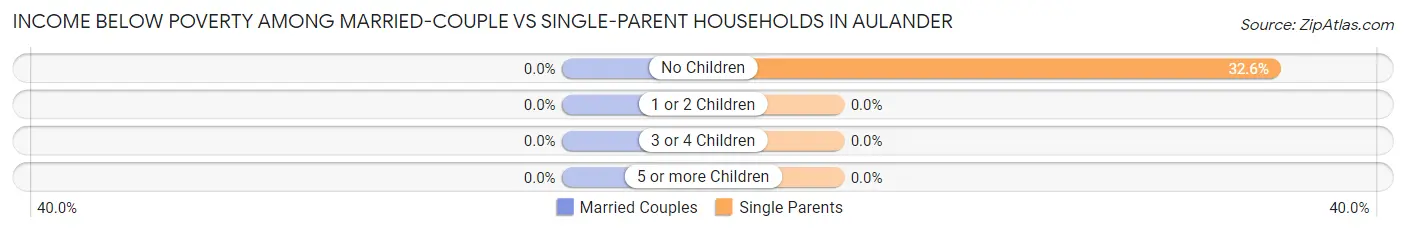
| Children | Married-Couple Families | Single-Parent Households |
| No Children | 0 (0.0%) | 14 (32.6%) |
| 1 or 2 Children | 0 (0.0%) | 0 (0.0%) |
| 3 or 4 Children | 0 (0.0%) | 0 (0.0%) |
| 5 or more Children | 0 (0.0%) | 0 (0.0%) |
| Total | 0 (0.0%) | 14 (14.1%) |
Employment Characteristics in Aulander
Employment by Class of Employer in Aulander
Among the 242 employed individuals in Aulander, private company employees (167 | 69.0%), state government employees (48 | 19.8%), and local government employees (15 | 6.2%) make up the most common classes of employment.
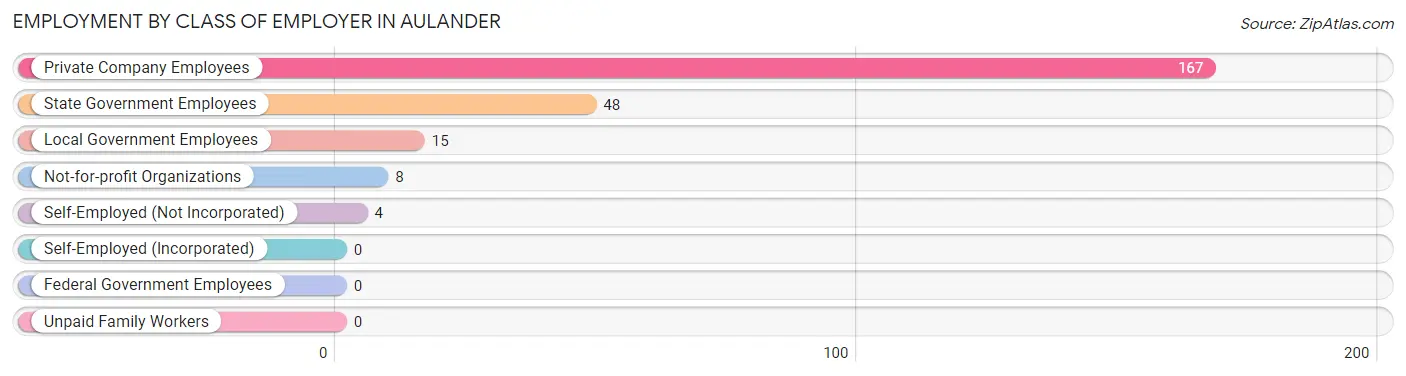
| Employer Class | # Employees | % Employees |
| Private Company Employees | 167 | 69.0% |
| Self-Employed (Incorporated) | 0 | 0.0% |
| Self-Employed (Not Incorporated) | 4 | 1.7% |
| Not-for-profit Organizations | 8 | 3.3% |
| Local Government Employees | 15 | 6.2% |
| State Government Employees | 48 | 19.8% |
| Federal Government Employees | 0 | 0.0% |
| Unpaid Family Workers | 0 | 0.0% |
| Total | 242 | 100.0% |
Employment Status by Age in Aulander
According to the labor force statistics for Aulander, out of the total population over 16 years of age (547), 50.6% or 277 individuals are in the labor force, with 12.6% or 35 of them unemployed. The age group with the highest labor force participation rate is 20 to 24 years, with 100.0% or 25 individuals in the labor force. Within the labor force, the 30 to 34 years age range has the highest percentage of unemployed individuals, with 62.5% or 15 of them being unemployed.
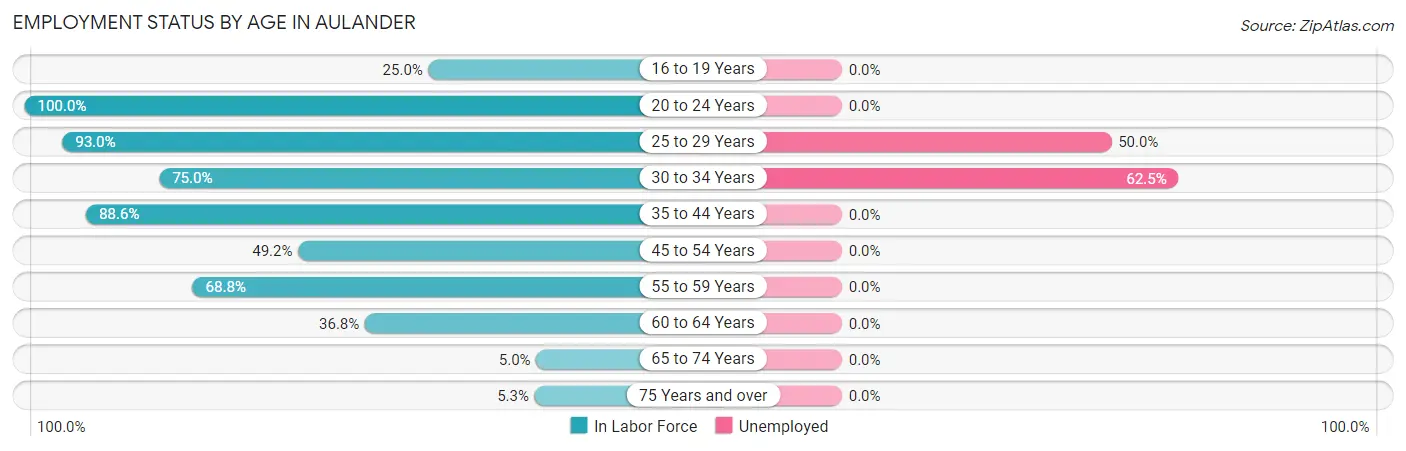
| Age Bracket | In Labor Force | Unemployed |
| 16 to 19 Years | 6 (25.0%) | 0 (0.0%) |
| 20 to 24 Years | 25 (100.0%) | 0 (0.0%) |
| 25 to 29 Years | 40 (93.0%) | 20 (50.0%) |
| 30 to 34 Years | 24 (75.0%) | 15 (62.5%) |
| 35 to 44 Years | 117 (88.6%) | 0 (0.0%) |
| 45 to 54 Years | 31 (49.2%) | 0 (0.0%) |
| 55 to 59 Years | 11 (68.8%) | 0 (0.0%) |
| 60 to 64 Years | 14 (36.8%) | 0 (0.0%) |
| 65 to 74 Years | 4 (5.0%) | 0 (0.0%) |
| 75 Years and over | 5 (5.3%) | 0 (0.0%) |
| Total | 277 (50.6%) | 35 (12.6%) |
Employment Status by Educational Attainment in Aulander
According to labor force statistics for Aulander, 73.1% of individuals (237) out of the total population between 25 and 64 years of age (324) are in the labor force, with 14.8% or 35 of them being unemployed. The group with the highest labor force participation rate are those with the educational attainment of college / associate degree, with 83.9% or 94 individuals in the labor force. Within the labor force, individuals with high school diploma education have the highest percentage of unemployment, with 21.5% or 20 of them being unemployed.
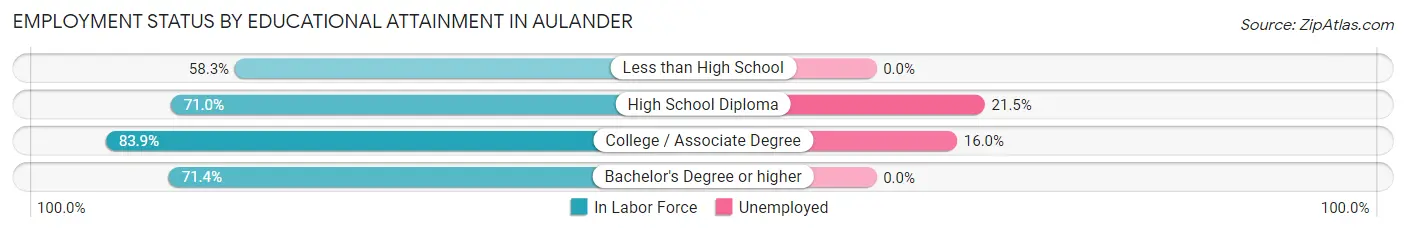
| Educational Attainment | In Labor Force | Unemployed |
| Less than High School | 35 (58.3%) | 0 (0.0%) |
| High School Diploma | 93 (71.0%) | 28 (21.5%) |
| College / Associate Degree | 94 (83.9%) | 18 (16.0%) |
| Bachelor's Degree or higher | 15 (71.4%) | 0 (0.0%) |
| Total | 237 (73.1%) | 48 (14.8%) |
Employment Occupations by Sex in Aulander
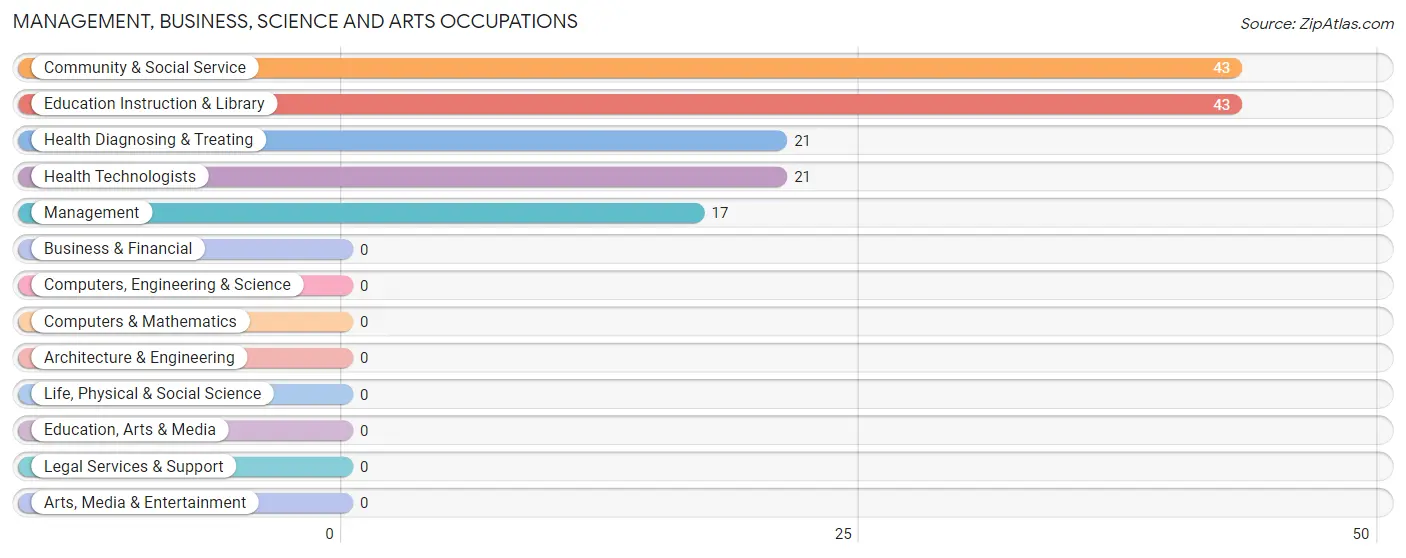
Management, Business, Science and Arts Occupations
The most common Management, Business, Science and Arts occupations in Aulander are Community & Social Service (43 | 17.8%), Education Instruction & Library (43 | 17.8%), Health Diagnosing & Treating (21 | 8.7%), Health Technologists (21 | 8.7%), and Management (17 | 7.0%).
Management, Business, Science and Arts Occupations by Sex
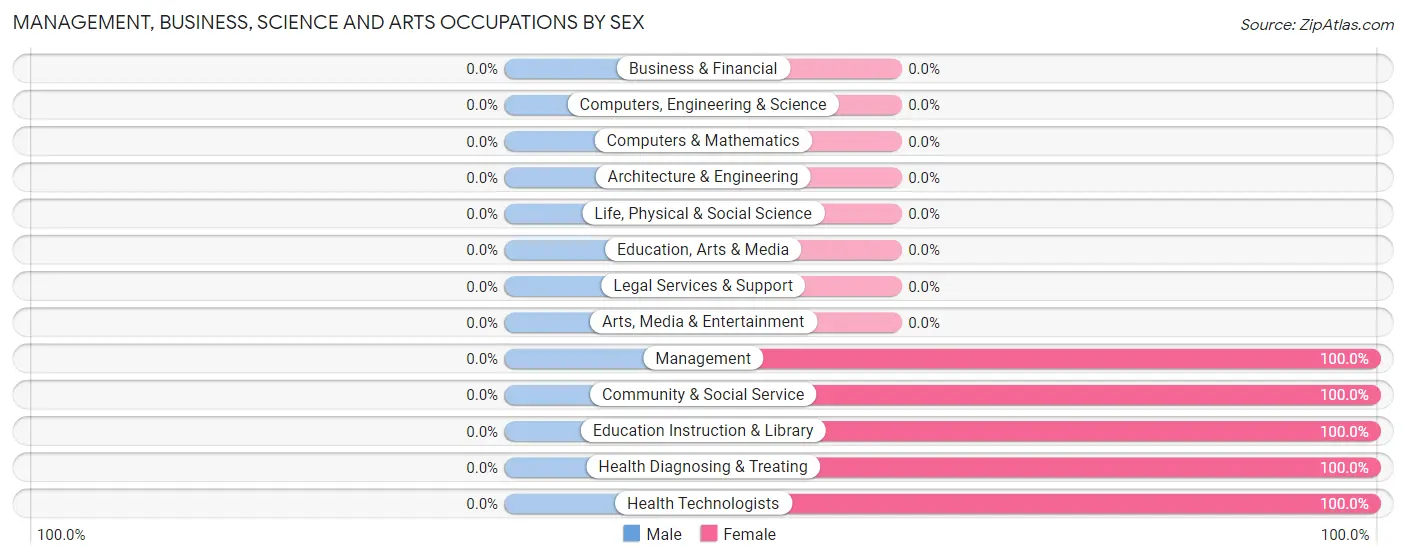
| Occupation | Male | Female |
| Management | 0 (0.0%) | 17 (100.0%) |
| Business & Financial | 0 (0.0%) | 0 (0.0%) |
| Computers, Engineering & Science | 0 (0.0%) | 0 (0.0%) |
| Computers & Mathematics | 0 (0.0%) | 0 (0.0%) |
| Architecture & Engineering | 0 (0.0%) | 0 (0.0%) |
| Life, Physical & Social Science | 0 (0.0%) | 0 (0.0%) |
| Community & Social Service | 0 (0.0%) | 43 (100.0%) |
| Education, Arts & Media | 0 (0.0%) | 0 (0.0%) |
| Legal Services & Support | 0 (0.0%) | 0 (0.0%) |
| Education Instruction & Library | 0 (0.0%) | 43 (100.0%) |
| Arts, Media & Entertainment | 0 (0.0%) | 0 (0.0%) |
| Health Diagnosing & Treating | 0 (0.0%) | 21 (100.0%) |
| Health Technologists | 0 (0.0%) | 21 (100.0%) |
| Total (Category) | 0 (0.0%) | 81 (100.0%) |
| Total (Overall) | 99 (40.9%) | 143 (59.1%) |
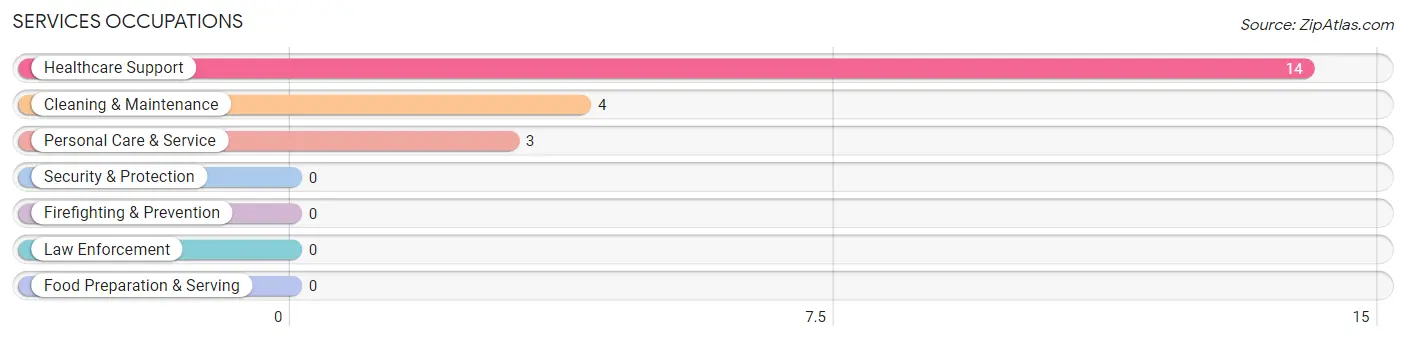
Services Occupations
The most common Services occupations in Aulander are Healthcare Support (14 | 5.8%), Cleaning & Maintenance (4 | 1.7%), and Personal Care & Service (3 | 1.2%).
Services Occupations by Sex
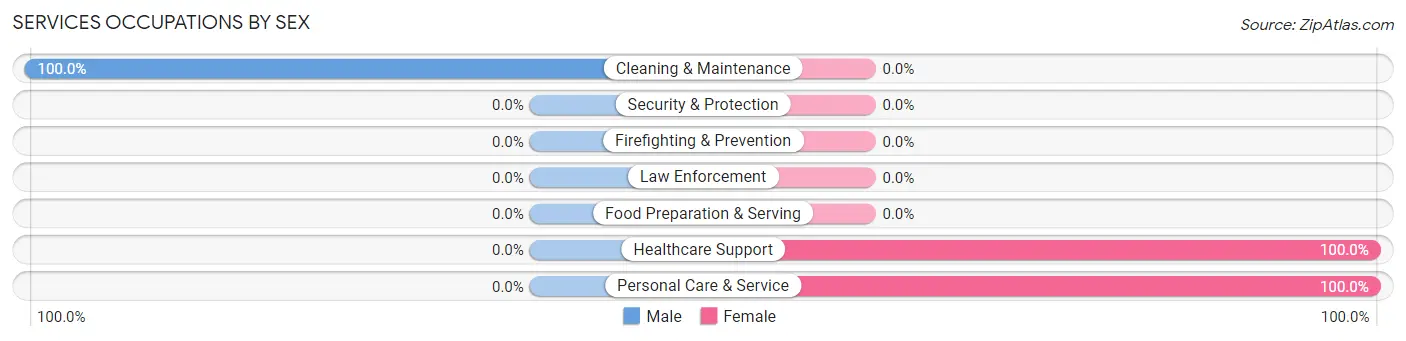
| Occupation | Male | Female |
| Healthcare Support | 0 (0.0%) | 14 (100.0%) |
| Security & Protection | 0 (0.0%) | 0 (0.0%) |
| Firefighting & Prevention | 0 (0.0%) | 0 (0.0%) |
| Law Enforcement | 0 (0.0%) | 0 (0.0%) |
| Food Preparation & Serving | 0 (0.0%) | 0 (0.0%) |
| Cleaning & Maintenance | 4 (100.0%) | 0 (0.0%) |
| Personal Care & Service | 0 (0.0%) | 3 (100.0%) |
| Total (Category) | 4 (19.1%) | 17 (80.9%) |
| Total (Overall) | 99 (40.9%) | 143 (59.1%) |
Sales and Office Occupations
The most common Sales and Office occupations in Aulander are Office & Administration (19 | 7.9%), and Sales & Related (2 | 0.8%).
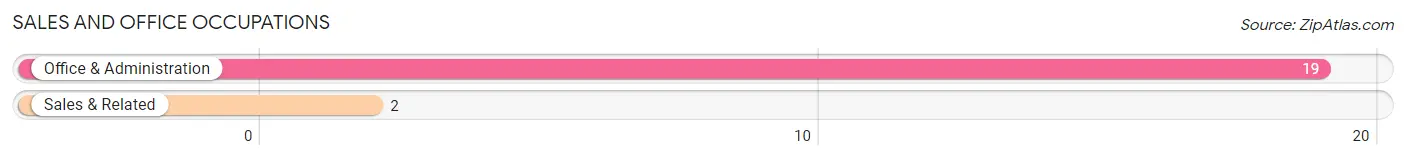
Sales and Office Occupations by Sex
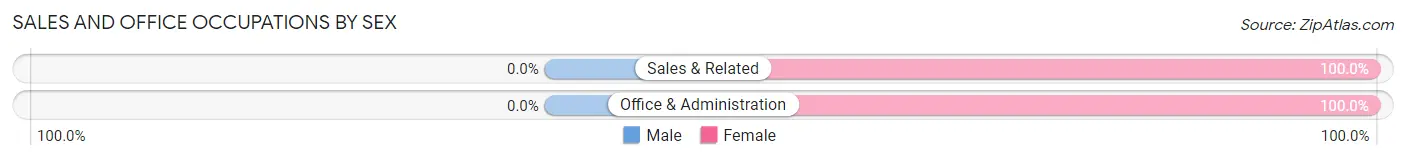
| Occupation | Male | Female |
| Sales & Related | 0 (0.0%) | 2 (100.0%) |
| Office & Administration | 0 (0.0%) | 19 (100.0%) |
| Total (Category) | 0 (0.0%) | 21 (100.0%) |
| Total (Overall) | 99 (40.9%) | 143 (59.1%) |
Natural Resources, Construction and Maintenance Occupations
The most common Natural Resources, Construction and Maintenance occupations in Aulander are Installation, Maintenance & Repair (40 | 16.5%), and Construction & Extraction (5 | 2.1%).
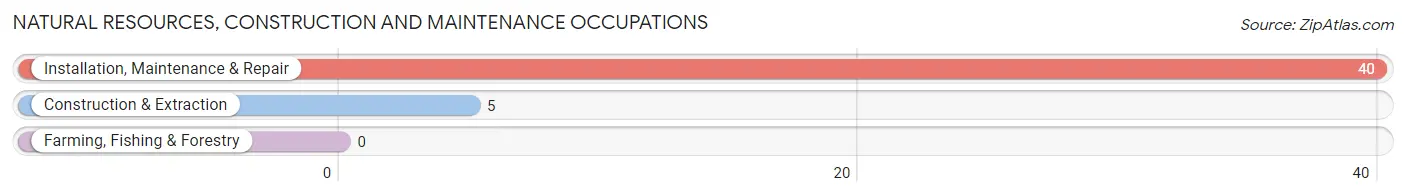
Natural Resources, Construction and Maintenance Occupations by Sex
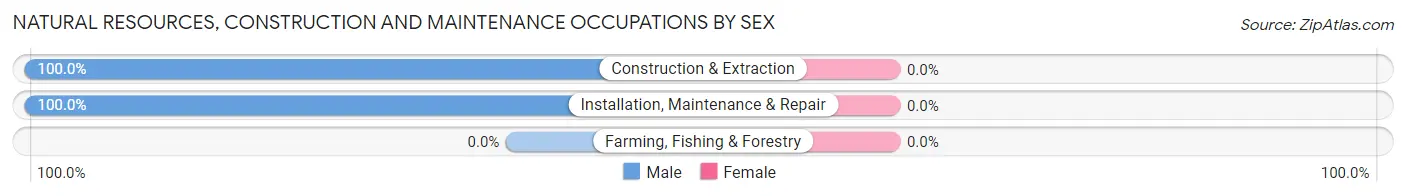
| Occupation | Male | Female |
| Farming, Fishing & Forestry | 0 (0.0%) | 0 (0.0%) |
| Construction & Extraction | 5 (100.0%) | 0 (0.0%) |
| Installation, Maintenance & Repair | 40 (100.0%) | 0 (0.0%) |
| Total (Category) | 45 (100.0%) | 0 (0.0%) |
| Total (Overall) | 99 (40.9%) | 143 (59.1%) |
Production, Transportation and Moving Occupations
The most common Production, Transportation and Moving occupations in Aulander are Transportation (35 | 14.5%), Material Moving (29 | 12.0%), and Production (10 | 4.1%).
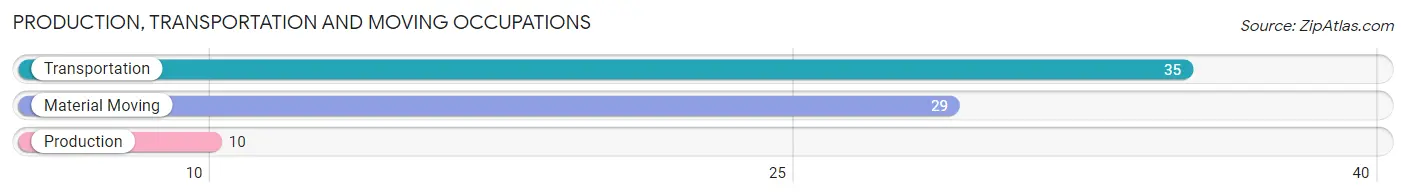
Production, Transportation and Moving Occupations by Sex
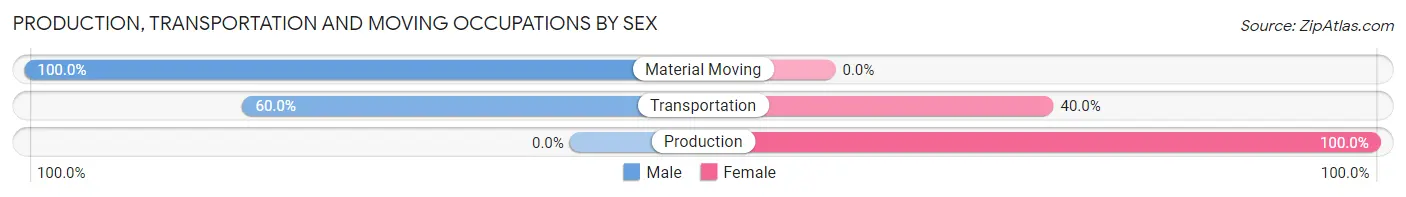
| Occupation | Male | Female |
| Production | 0 (0.0%) | 10 (100.0%) |
| Transportation | 21 (60.0%) | 14 (40.0%) |
| Material Moving | 29 (100.0%) | 0 (0.0%) |
| Total (Category) | 50 (67.6%) | 24 (32.4%) |
| Total (Overall) | 99 (40.9%) | 143 (59.1%) |
Employment Industries by Sex in Aulander
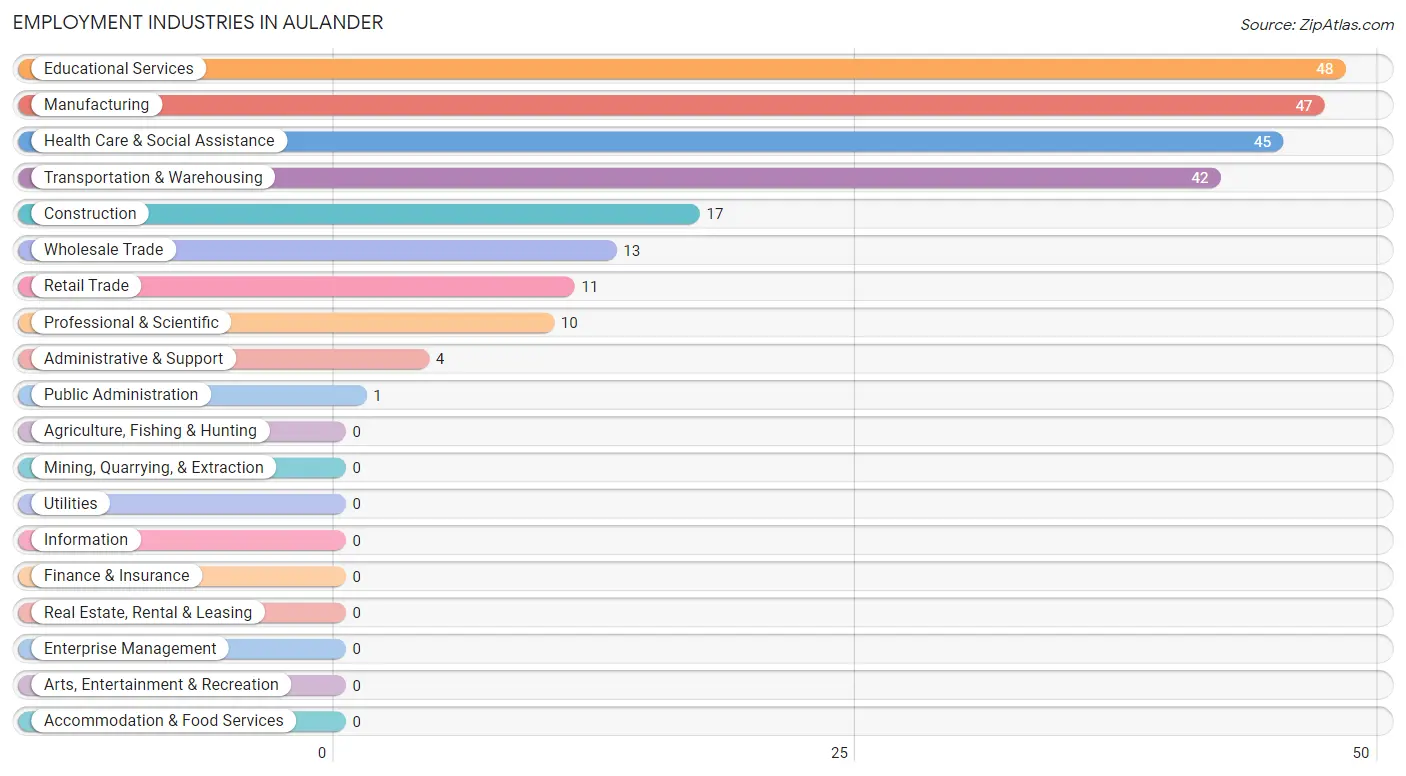
Employment Industries in Aulander
The major employment industries in Aulander include Educational Services (48 | 19.8%), Manufacturing (47 | 19.4%), Health Care & Social Assistance (45 | 18.6%), Transportation & Warehousing (42 | 17.4%), and Construction (17 | 7.0%).
Employment Industries by Sex in Aulander
The Aulander industries that see more men than women are Construction (100.0%), Administrative & Support (100.0%), and Retail Trade (81.8%), whereas the industries that tend to have a higher number of women are Wholesale Trade (100.0%), Professional & Scientific (100.0%), and Educational Services (100.0%).
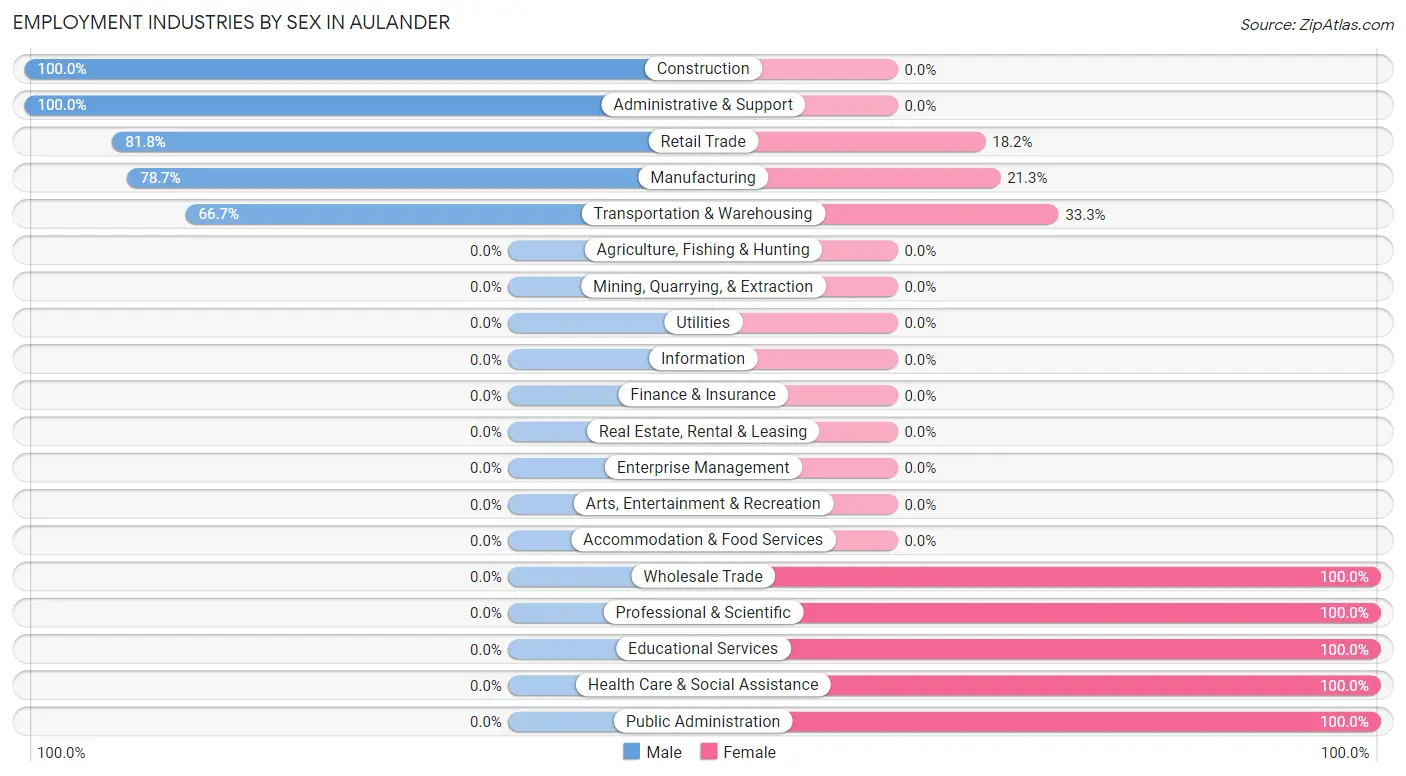
| Industry | Male | Female |
| Agriculture, Fishing & Hunting | 0 (0.0%) | 0 (0.0%) |
| Mining, Quarrying, & Extraction | 0 (0.0%) | 0 (0.0%) |
| Construction | 17 (100.0%) | 0 (0.0%) |
| Manufacturing | 37 (78.7%) | 10 (21.3%) |
| Wholesale Trade | 0 (0.0%) | 13 (100.0%) |
| Retail Trade | 9 (81.8%) | 2 (18.2%) |
| Transportation & Warehousing | 28 (66.7%) | 14 (33.3%) |
| Utilities | 0 (0.0%) | 0 (0.0%) |
| Information | 0 (0.0%) | 0 (0.0%) |
| Finance & Insurance | 0 (0.0%) | 0 (0.0%) |
| Real Estate, Rental & Leasing | 0 (0.0%) | 0 (0.0%) |
| Professional & Scientific | 0 (0.0%) | 10 (100.0%) |
| Enterprise Management | 0 (0.0%) | 0 (0.0%) |
| Administrative & Support | 4 (100.0%) | 0 (0.0%) |
| Educational Services | 0 (0.0%) | 48 (100.0%) |
| Health Care & Social Assistance | 0 (0.0%) | 45 (100.0%) |
| Arts, Entertainment & Recreation | 0 (0.0%) | 0 (0.0%) |
| Accommodation & Food Services | 0 (0.0%) | 0 (0.0%) |
| Public Administration | 0 (0.0%) | 1 (100.0%) |
| Total | 99 (40.9%) | 143 (59.1%) |
Education in Aulander
School Enrollment in Aulander
The most common levels of schooling among the 158 students in Aulander are nursery / preschool (64 | 40.5%), college / undergraduate (43 | 27.2%), and high school (23 | 14.6%).
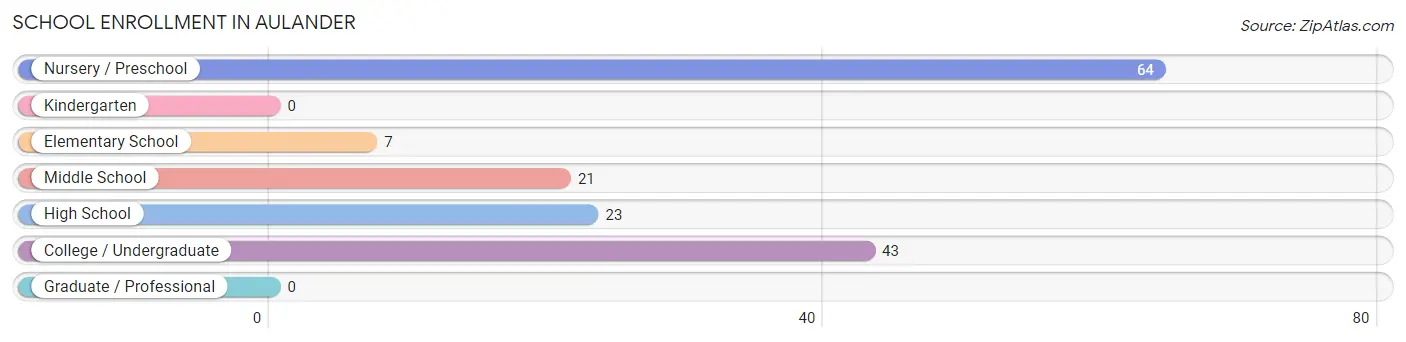
| School Level | # Students | % Students |
| Nursery / Preschool | 64 | 40.5% |
| Kindergarten | 0 | 0.0% |
| Elementary School | 7 | 4.4% |
| Middle School | 21 | 13.3% |
| High School | 23 | 14.6% |
| College / Undergraduate | 43 | 27.2% |
| Graduate / Professional | 0 | 0.0% |
| Total | 158 | 100.0% |
School Enrollment by Age by Funding Source in Aulander
Out of a total of 158 students who are enrolled in schools in Aulander, 13 (8.2%) attend a private institution, while the remaining 145 (91.8%) are enrolled in public schools. The age group of 5 to 9 year old has the highest likelihood of being enrolled in private schools, with 6 (85.7% in the age bracket) enrolled. Conversely, the age group of 3 to 4 year olds has the lowest likelihood of being enrolled in a private school, with 64 (100.0% in the age bracket) attending a public institution.
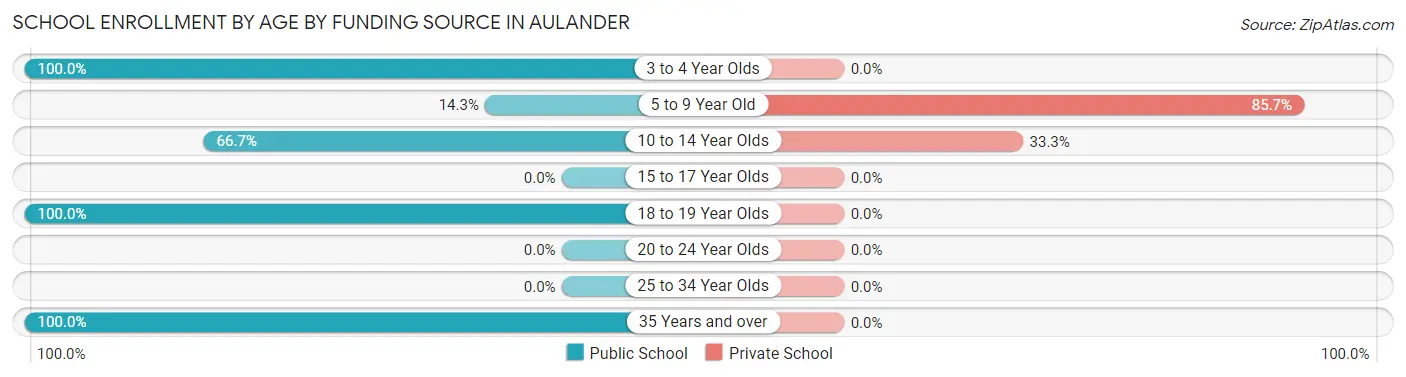
| Age Bracket | Public School | Private School |
| 3 to 4 Year Olds | 64 (100.0%) | 0 (0.0%) |
| 5 to 9 Year Old | 1 (14.3%) | 6 (85.7%) |
| 10 to 14 Year Olds | 14 (66.7%) | 7 (33.3%) |
| 15 to 17 Year Olds | 0 (0.0%) | 0 (0.0%) |
| 18 to 19 Year Olds | 18 (100.0%) | 0 (0.0%) |
| 20 to 24 Year Olds | 0 (0.0%) | 0 (0.0%) |
| 25 to 34 Year Olds | 0 (0.0%) | 0 (0.0%) |
| 35 Years and over | 48 (100.0%) | 0 (0.0%) |
| Total | 145 (91.8%) | 13 (8.2%) |
Educational Attainment by Field of Study in Aulander
Business (15 | 71.4%), and social sciences (6 | 28.6%) are the most common fields of study among 21 individuals in Aulander who have obtained a bachelor's degree or higher.
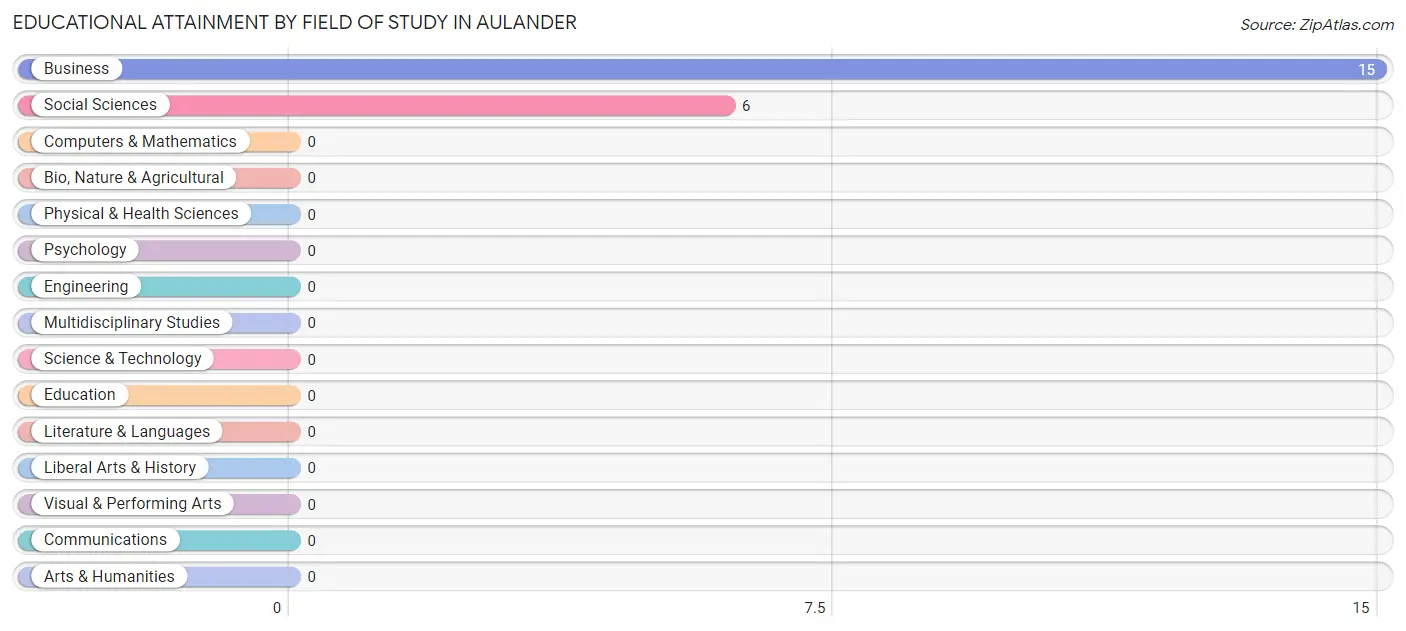
| Field of Study | # Graduates | % Graduates |
| Computers & Mathematics | 0 | 0.0% |
| Bio, Nature & Agricultural | 0 | 0.0% |
| Physical & Health Sciences | 0 | 0.0% |
| Psychology | 0 | 0.0% |
| Social Sciences | 6 | 28.6% |
| Engineering | 0 | 0.0% |
| Multidisciplinary Studies | 0 | 0.0% |
| Science & Technology | 0 | 0.0% |
| Business | 15 | 71.4% |
| Education | 0 | 0.0% |
| Literature & Languages | 0 | 0.0% |
| Liberal Arts & History | 0 | 0.0% |
| Visual & Performing Arts | 0 | 0.0% |
| Communications | 0 | 0.0% |
| Arts & Humanities | 0 | 0.0% |
| Total | 21 | 100.0% |
Transportation & Commute in Aulander
Vehicle Availability by Sex in Aulander
The most prevalent vehicle ownership categories in Aulander are males with 5 or more vehicles (35, accounting for 35.3%) and females with 5 or more vehicles (20, making up 24.5%).
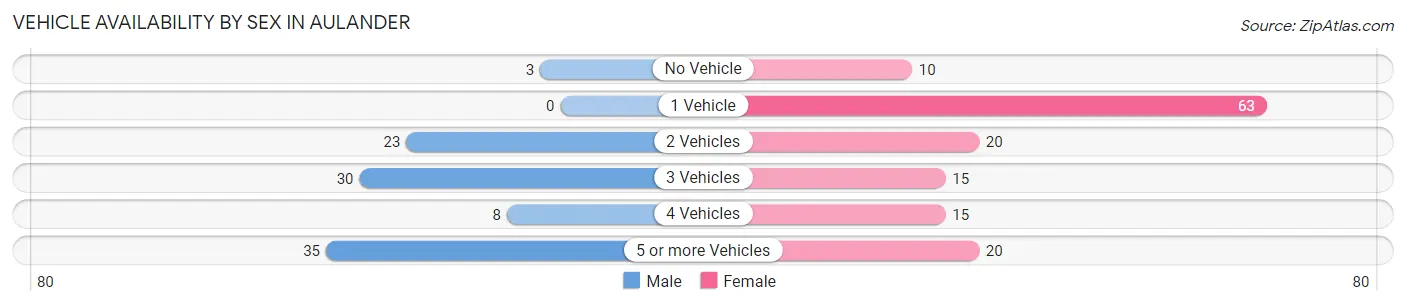
| Vehicles Available | Male | Female |
| No Vehicle | 3 (3.0%) | 10 (7.0%) |
| 1 Vehicle | 0 (0.0%) | 63 (44.1%) |
| 2 Vehicles | 23 (23.2%) | 20 (14.0%) |
| 3 Vehicles | 30 (30.3%) | 15 (10.5%) |
| 4 Vehicles | 8 (8.1%) | 15 (10.5%) |
| 5 or more Vehicles | 35 (35.3%) | 20 (14.0%) |
| Total | 99 (100.0%) | 143 (100.0%) |
Commute Time in Aulander
The most frequently occuring commute durations in Aulander are 10 to 14 minutes (71 commuters, 29.3%), 15 to 19 minutes (35 commuters, 14.5%), and 60 to 89 minutes (34 commuters, 14.1%).
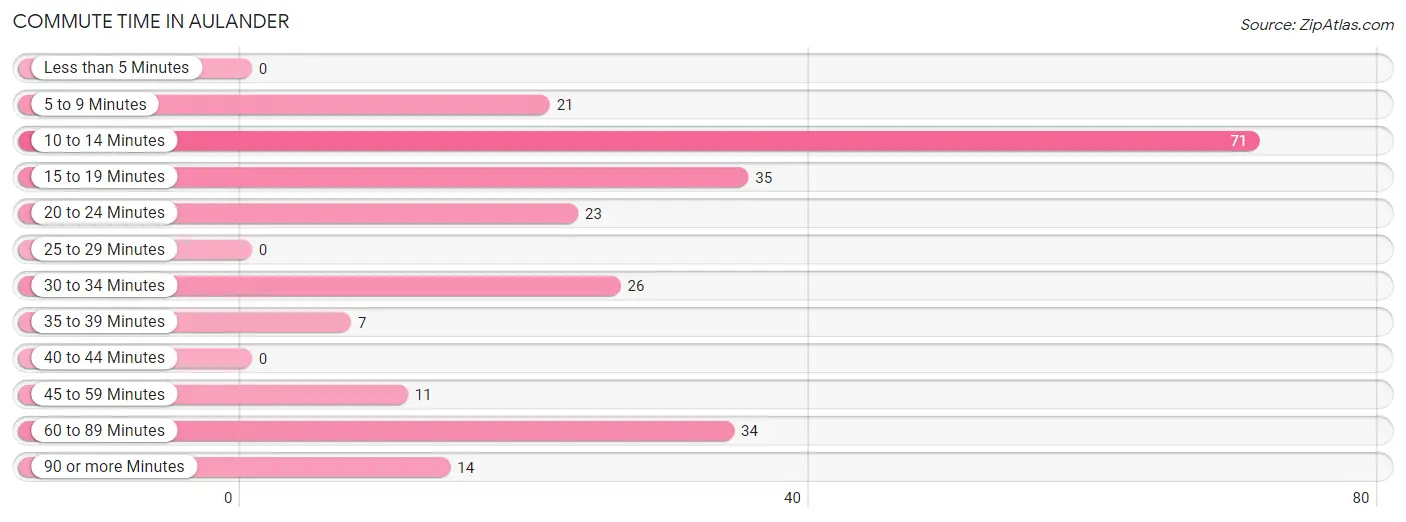
| Commute Time | # Commuters | % Commuters |
| Less than 5 Minutes | 0 | 0.0% |
| 5 to 9 Minutes | 21 | 8.7% |
| 10 to 14 Minutes | 71 | 29.3% |
| 15 to 19 Minutes | 35 | 14.5% |
| 20 to 24 Minutes | 23 | 9.5% |
| 25 to 29 Minutes | 0 | 0.0% |
| 30 to 34 Minutes | 26 | 10.7% |
| 35 to 39 Minutes | 7 | 2.9% |
| 40 to 44 Minutes | 0 | 0.0% |
| 45 to 59 Minutes | 11 | 4.5% |
| 60 to 89 Minutes | 34 | 14.1% |
| 90 or more Minutes | 14 | 5.8% |
Commute Time by Sex in Aulander
The most common commute times in Aulander are 60 to 89 minutes (34 commuters, 34.3%) for males and 10 to 14 minutes (59 commuters, 41.3%) for females.
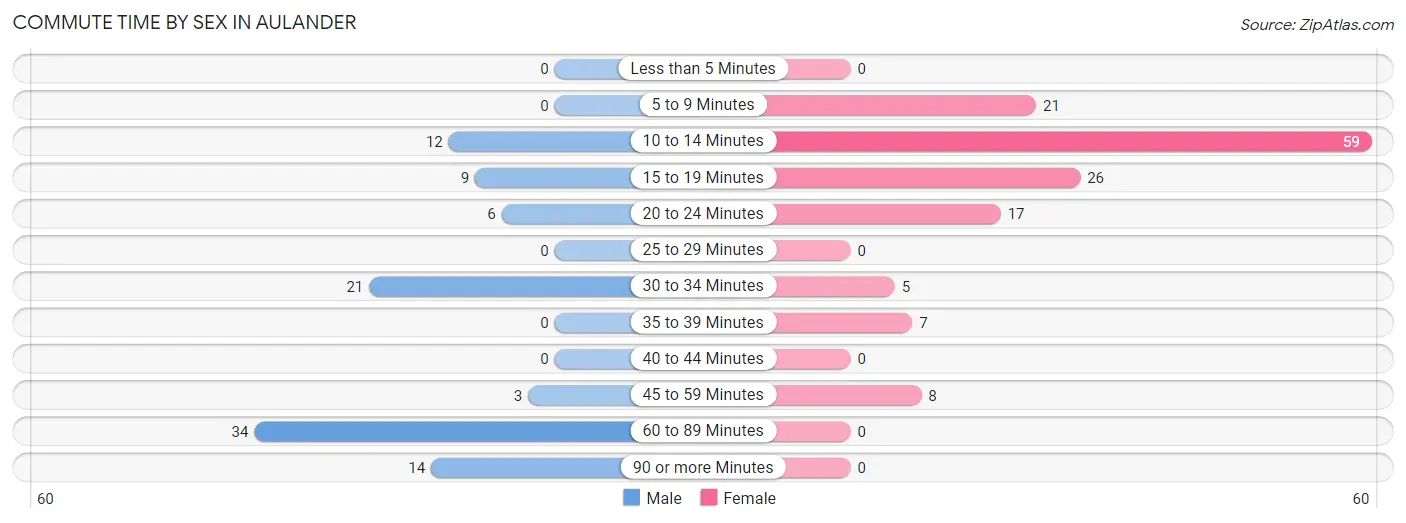
| Commute Time | Male | Female |
| Less than 5 Minutes | 0 (0.0%) | 0 (0.0%) |
| 5 to 9 Minutes | 0 (0.0%) | 21 (14.7%) |
| 10 to 14 Minutes | 12 (12.1%) | 59 (41.3%) |
| 15 to 19 Minutes | 9 (9.1%) | 26 (18.2%) |
| 20 to 24 Minutes | 6 (6.1%) | 17 (11.9%) |
| 25 to 29 Minutes | 0 (0.0%) | 0 (0.0%) |
| 30 to 34 Minutes | 21 (21.2%) | 5 (3.5%) |
| 35 to 39 Minutes | 0 (0.0%) | 7 (4.9%) |
| 40 to 44 Minutes | 0 (0.0%) | 0 (0.0%) |
| 45 to 59 Minutes | 3 (3.0%) | 8 (5.6%) |
| 60 to 89 Minutes | 34 (34.3%) | 0 (0.0%) |
| 90 or more Minutes | 14 (14.1%) | 0 (0.0%) |
Time of Departure to Work by Sex in Aulander
The most frequent times of departure to work in Aulander are 5:00 AM to 5:29 AM (37, 37.4%) for males and 8:00 AM to 8:29 AM (43, 30.1%) for females.
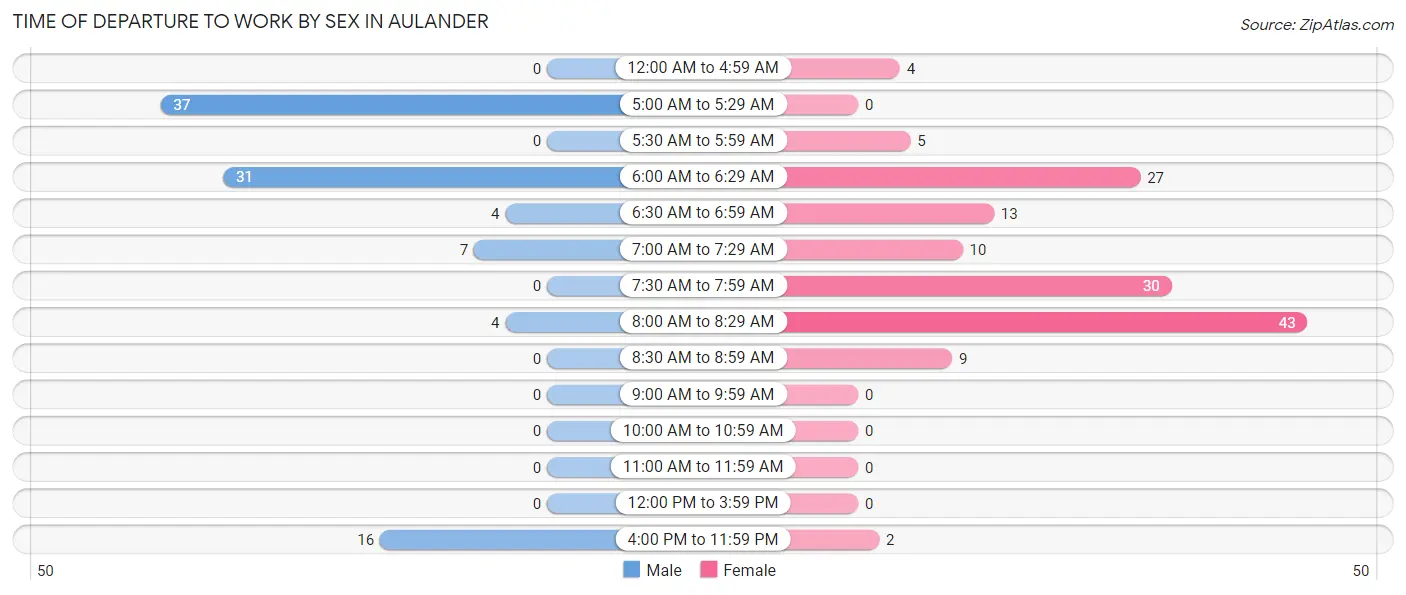
| Time of Departure | Male | Female |
| 12:00 AM to 4:59 AM | 0 (0.0%) | 4 (2.8%) |
| 5:00 AM to 5:29 AM | 37 (37.4%) | 0 (0.0%) |
| 5:30 AM to 5:59 AM | 0 (0.0%) | 5 (3.5%) |
| 6:00 AM to 6:29 AM | 31 (31.3%) | 27 (18.9%) |
| 6:30 AM to 6:59 AM | 4 (4.0%) | 13 (9.1%) |
| 7:00 AM to 7:29 AM | 7 (7.1%) | 10 (7.0%) |
| 7:30 AM to 7:59 AM | 0 (0.0%) | 30 (21.0%) |
| 8:00 AM to 8:29 AM | 4 (4.0%) | 43 (30.1%) |
| 8:30 AM to 8:59 AM | 0 (0.0%) | 9 (6.3%) |
| 9:00 AM to 9:59 AM | 0 (0.0%) | 0 (0.0%) |
| 10:00 AM to 10:59 AM | 0 (0.0%) | 0 (0.0%) |
| 11:00 AM to 11:59 AM | 0 (0.0%) | 0 (0.0%) |
| 12:00 PM to 3:59 PM | 0 (0.0%) | 0 (0.0%) |
| 4:00 PM to 11:59 PM | 16 (16.2%) | 2 (1.4%) |
| Total | 99 (100.0%) | 143 (100.0%) |
Housing Occupancy in Aulander
Occupancy by Ownership in Aulander
Of the total 346 dwellings in Aulander, owner-occupied units account for 231 (66.8%), while renter-occupied units make up 115 (33.2%).
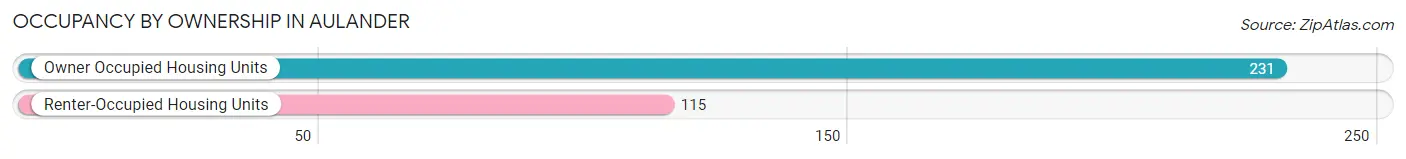
| Occupancy | # Housing Units | % Housing Units |
| Owner Occupied Housing Units | 231 | 66.8% |
| Renter-Occupied Housing Units | 115 | 33.2% |
| Total Occupied Housing Units | 346 | 100.0% |
Occupancy by Household Size in Aulander
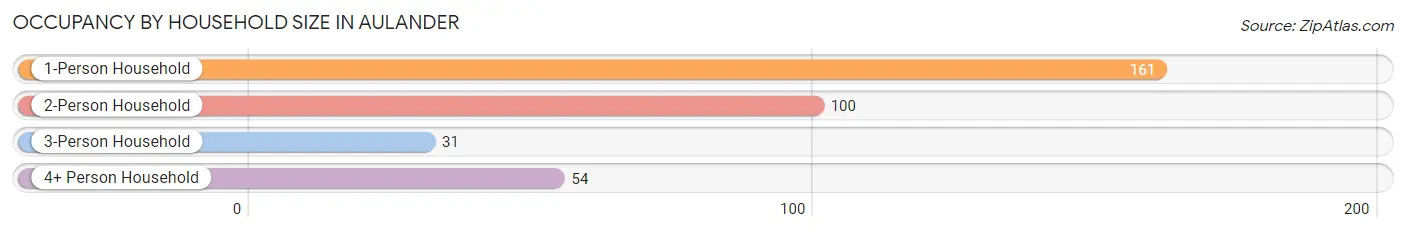
| Household Size | # Housing Units | % Housing Units |
| 1-Person Household | 161 | 46.5% |
| 2-Person Household | 100 | 28.9% |
| 3-Person Household | 31 | 9.0% |
| 4+ Person Household | 54 | 15.6% |
| Total Housing Units | 346 | 100.0% |
Occupancy by Ownership by Household Size in Aulander
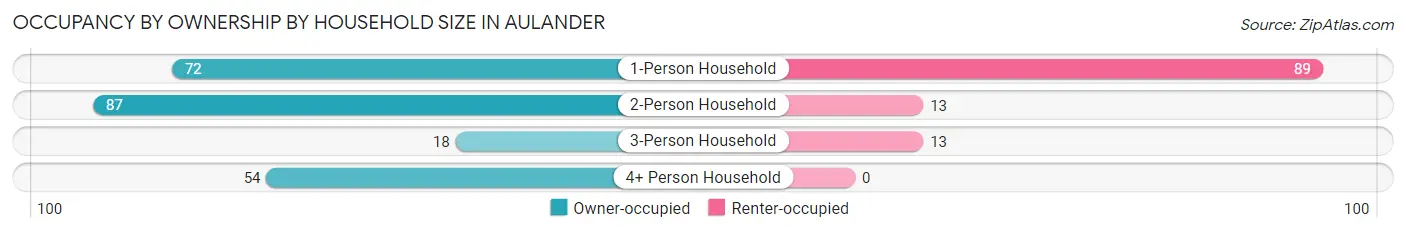
| Household Size | Owner-occupied | Renter-occupied |
| 1-Person Household | 72 (44.7%) | 89 (55.3%) |
| 2-Person Household | 87 (87.0%) | 13 (13.0%) |
| 3-Person Household | 18 (58.1%) | 13 (41.9%) |
| 4+ Person Household | 54 (100.0%) | 0 (0.0%) |
| Total Housing Units | 231 (66.8%) | 115 (33.2%) |
Occupancy by Educational Attainment in Aulander
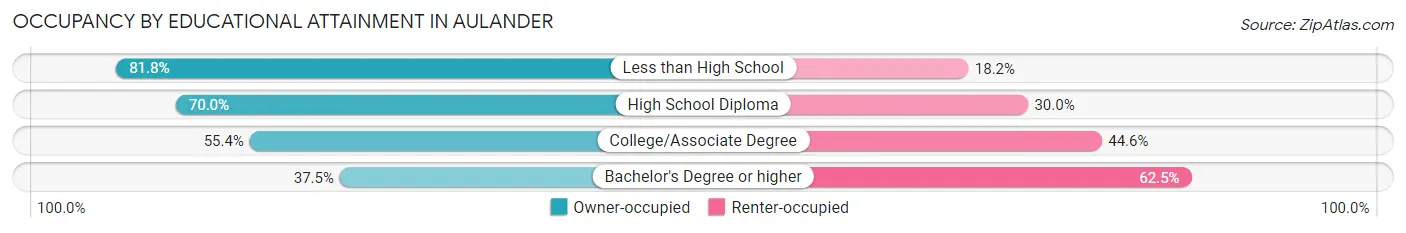
| Household Size | Owner-occupied | Renter-occupied |
| Less than High School | 81 (81.8%) | 18 (18.2%) |
| High School Diploma | 77 (70.0%) | 33 (30.0%) |
| College/Associate Degree | 67 (55.4%) | 54 (44.6%) |
| Bachelor's Degree or higher | 6 (37.5%) | 10 (62.5%) |
Occupancy by Age of Householder in Aulander
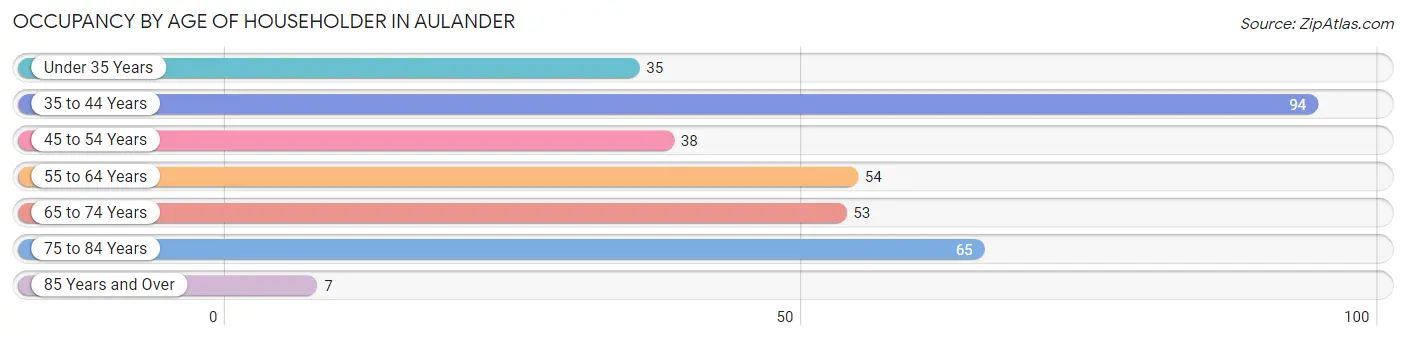
| Age Bracket | # Households | % Households |
| Under 35 Years | 35 | 10.1% |
| 35 to 44 Years | 94 | 27.2% |
| 45 to 54 Years | 38 | 11.0% |
| 55 to 64 Years | 54 | 15.6% |
| 65 to 74 Years | 53 | 15.3% |
| 75 to 84 Years | 65 | 18.8% |
| 85 Years and Over | 7 | 2.0% |
| Total | 346 | 100.0% |
Housing Finances in Aulander
Median Income by Occupancy in Aulander
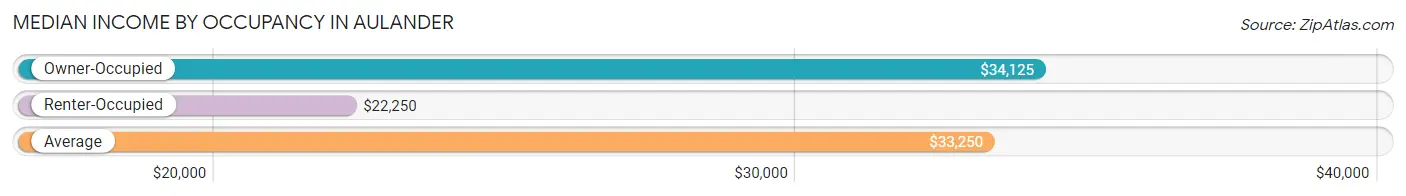
| Occupancy Type | # Households | Median Income |
| Owner-Occupied | 231 (66.8%) | $34,125 |
| Renter-Occupied | 115 (33.2%) | $22,250 |
| Average | 346 (100.0%) | $33,250 |
Occupancy by Householder Income Bracket in Aulander
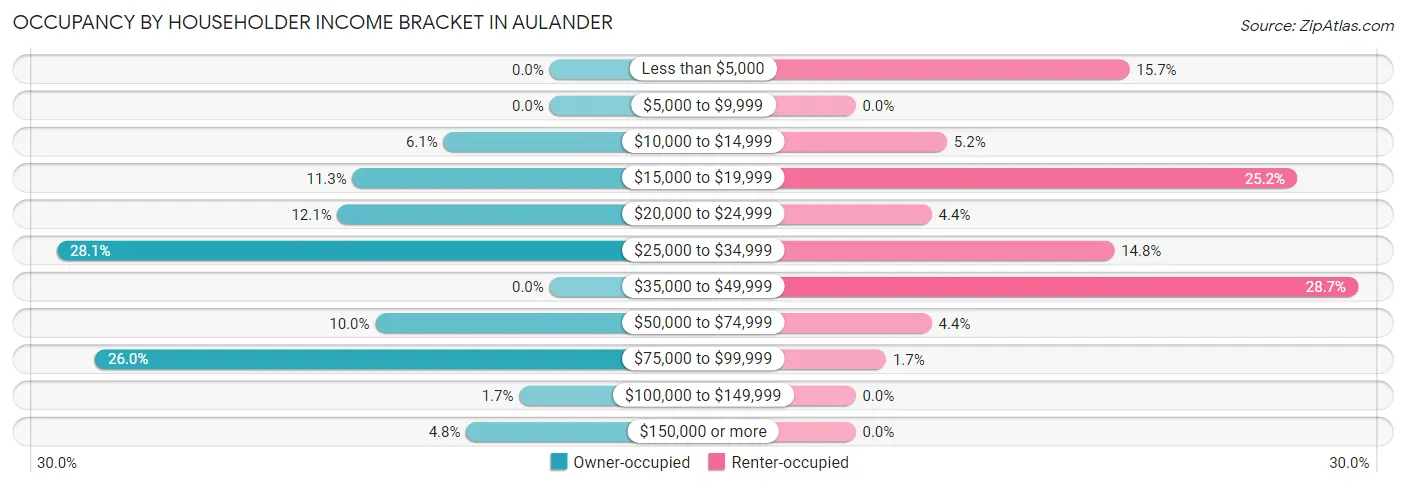
| Income Bracket | Owner-occupied | Renter-occupied |
| Less than $5,000 | 0 (0.0%) | 18 (15.7%) |
| $5,000 to $9,999 | 0 (0.0%) | 0 (0.0%) |
| $10,000 to $14,999 | 14 (6.1%) | 6 (5.2%) |
| $15,000 to $19,999 | 26 (11.3%) | 29 (25.2%) |
| $20,000 to $24,999 | 28 (12.1%) | 5 (4.3%) |
| $25,000 to $34,999 | 65 (28.1%) | 17 (14.8%) |
| $35,000 to $49,999 | 0 (0.0%) | 33 (28.7%) |
| $50,000 to $74,999 | 23 (10.0%) | 5 (4.3%) |
| $75,000 to $99,999 | 60 (26.0%) | 2 (1.7%) |
| $100,000 to $149,999 | 4 (1.7%) | 0 (0.0%) |
| $150,000 or more | 11 (4.8%) | 0 (0.0%) |
| Total | 231 (100.0%) | 115 (100.0%) |
Monthly Housing Cost Tiers in Aulander
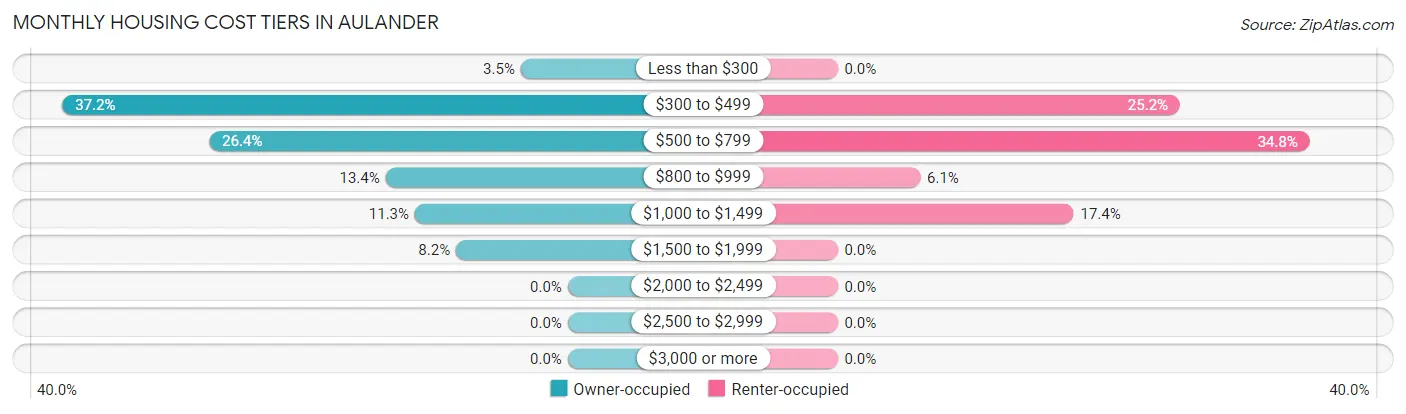
| Monthly Cost | Owner-occupied | Renter-occupied |
| Less than $300 | 8 (3.5%) | 0 (0.0%) |
| $300 to $499 | 86 (37.2%) | 29 (25.2%) |
| $500 to $799 | 61 (26.4%) | 40 (34.8%) |
| $800 to $999 | 31 (13.4%) | 7 (6.1%) |
| $1,000 to $1,499 | 26 (11.3%) | 20 (17.4%) |
| $1,500 to $1,999 | 19 (8.2%) | 0 (0.0%) |
| $2,000 to $2,499 | 0 (0.0%) | 0 (0.0%) |
| $2,500 to $2,999 | 0 (0.0%) | 0 (0.0%) |
| $3,000 or more | 0 (0.0%) | 0 (0.0%) |
| Total | 231 (100.0%) | 115 (100.0%) |
Physical Housing Characteristics in Aulander
Housing Structures in Aulander
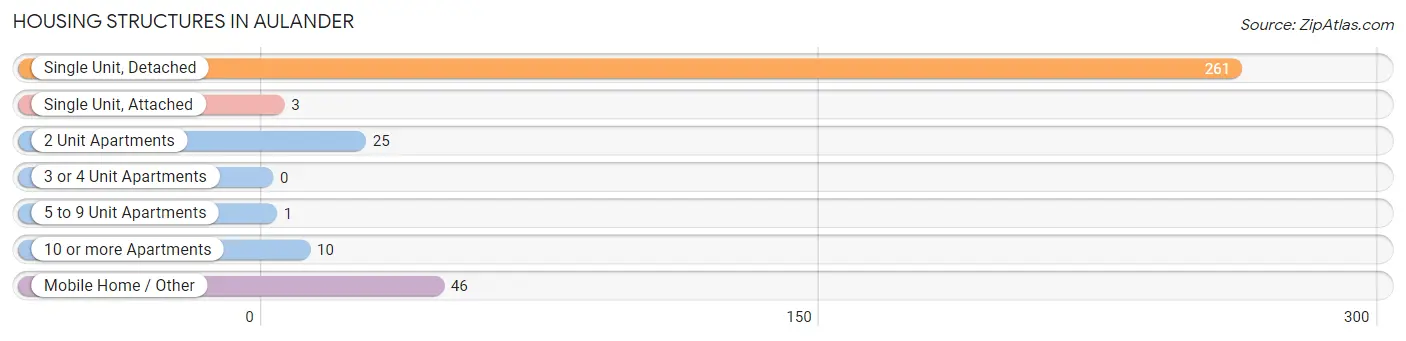
| Structure Type | # Housing Units | % Housing Units |
| Single Unit, Detached | 261 | 75.4% |
| Single Unit, Attached | 3 | 0.9% |
| 2 Unit Apartments | 25 | 7.2% |
| 3 or 4 Unit Apartments | 0 | 0.0% |
| 5 to 9 Unit Apartments | 1 | 0.3% |
| 10 or more Apartments | 10 | 2.9% |
| Mobile Home / Other | 46 | 13.3% |
| Total | 346 | 100.0% |
Housing Structures by Occupancy in Aulander
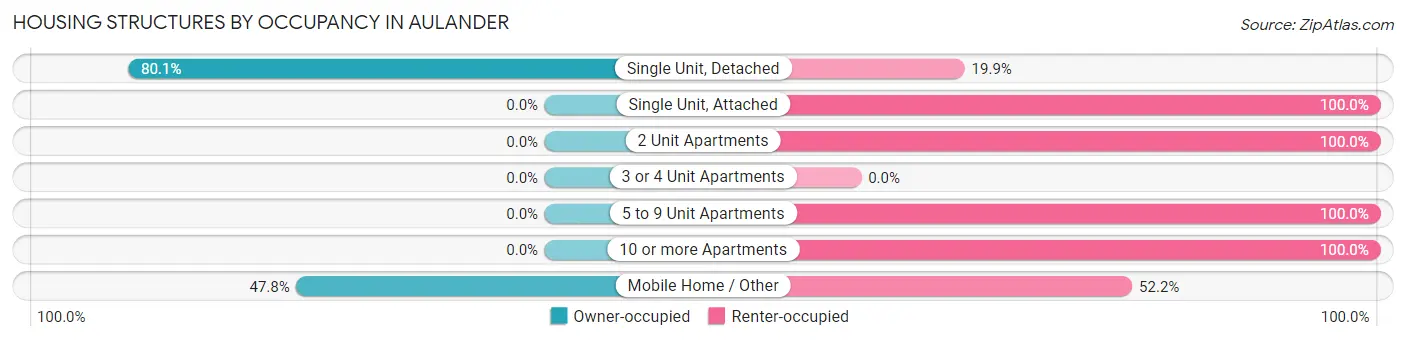
| Structure Type | Owner-occupied | Renter-occupied |
| Single Unit, Detached | 209 (80.1%) | 52 (19.9%) |
| Single Unit, Attached | 0 (0.0%) | 3 (100.0%) |
| 2 Unit Apartments | 0 (0.0%) | 25 (100.0%) |
| 3 or 4 Unit Apartments | 0 (0.0%) | 0 (0.0%) |
| 5 to 9 Unit Apartments | 0 (0.0%) | 1 (100.0%) |
| 10 or more Apartments | 0 (0.0%) | 10 (100.0%) |
| Mobile Home / Other | 22 (47.8%) | 24 (52.2%) |
| Total | 231 (66.8%) | 115 (33.2%) |
Housing Structures by Number of Rooms in Aulander
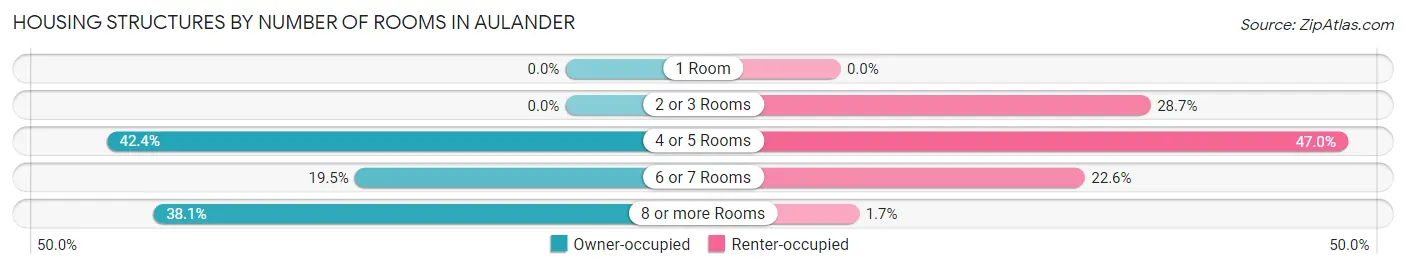
| Number of Rooms | Owner-occupied | Renter-occupied |
| 1 Room | 0 (0.0%) | 0 (0.0%) |
| 2 or 3 Rooms | 0 (0.0%) | 33 (28.7%) |
| 4 or 5 Rooms | 98 (42.4%) | 54 (47.0%) |
| 6 or 7 Rooms | 45 (19.5%) | 26 (22.6%) |
| 8 or more Rooms | 88 (38.1%) | 2 (1.7%) |
| Total | 231 (100.0%) | 115 (100.0%) |
Housing Structure by Heating Type in Aulander
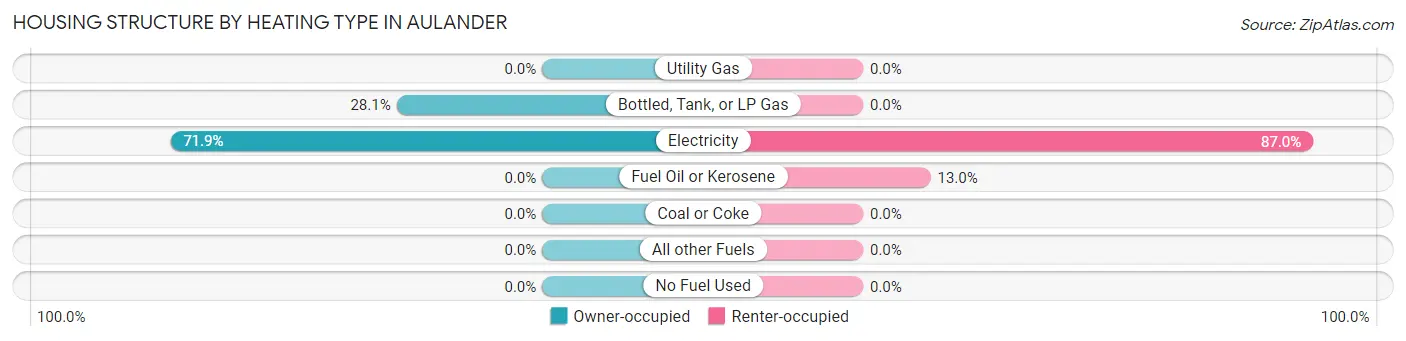
| Heating Type | Owner-occupied | Renter-occupied |
| Utility Gas | 0 (0.0%) | 0 (0.0%) |
| Bottled, Tank, or LP Gas | 65 (28.1%) | 0 (0.0%) |
| Electricity | 166 (71.9%) | 100 (87.0%) |
| Fuel Oil or Kerosene | 0 (0.0%) | 15 (13.0%) |
| Coal or Coke | 0 (0.0%) | 0 (0.0%) |
| All other Fuels | 0 (0.0%) | 0 (0.0%) |
| No Fuel Used | 0 (0.0%) | 0 (0.0%) |
| Total | 231 (100.0%) | 115 (100.0%) |
Household Vehicle Usage in Aulander
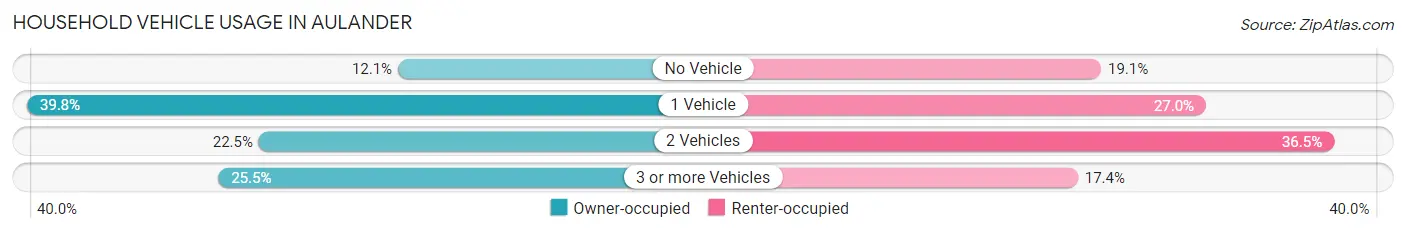
| Vehicles per Household | Owner-occupied | Renter-occupied |
| No Vehicle | 28 (12.1%) | 22 (19.1%) |
| 1 Vehicle | 92 (39.8%) | 31 (27.0%) |
| 2 Vehicles | 52 (22.5%) | 42 (36.5%) |
| 3 or more Vehicles | 59 (25.5%) | 20 (17.4%) |
| Total | 231 (100.0%) | 115 (100.0%) |
Real Estate & Mortgages in Aulander
Real Estate and Mortgage Overview in Aulander
| Characteristic | Without Mortgage | With Mortgage |
| Housing Units | 153 | 78 |
| Median Property Value | $59,900 | $125,800 |
| Median Household Income | - | - |
| Monthly Housing Costs | $473 | $0 |
| Real Estate Taxes | $199 | $0 |
Property Value by Mortgage Status in Aulander
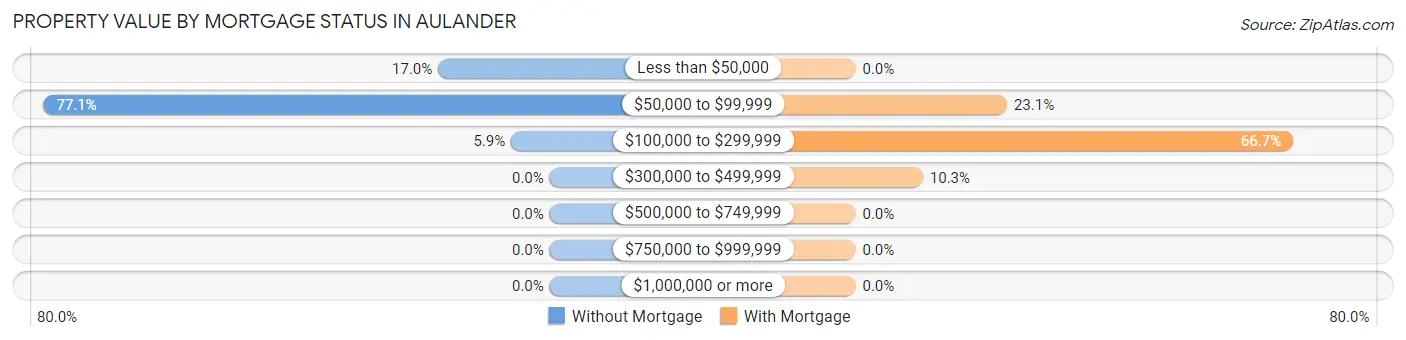
| Property Value | Without Mortgage | With Mortgage |
| Less than $50,000 | 26 (17.0%) | 0 (0.0%) |
| $50,000 to $99,999 | 118 (77.1%) | 18 (23.1%) |
| $100,000 to $299,999 | 9 (5.9%) | 52 (66.7%) |
| $300,000 to $499,999 | 0 (0.0%) | 8 (10.3%) |
| $500,000 to $749,999 | 0 (0.0%) | 0 (0.0%) |
| $750,000 to $999,999 | 0 (0.0%) | 0 (0.0%) |
| $1,000,000 or more | 0 (0.0%) | 0 (0.0%) |
| Total | 153 (100.0%) | 78 (100.0%) |
Household Income by Mortgage Status in Aulander
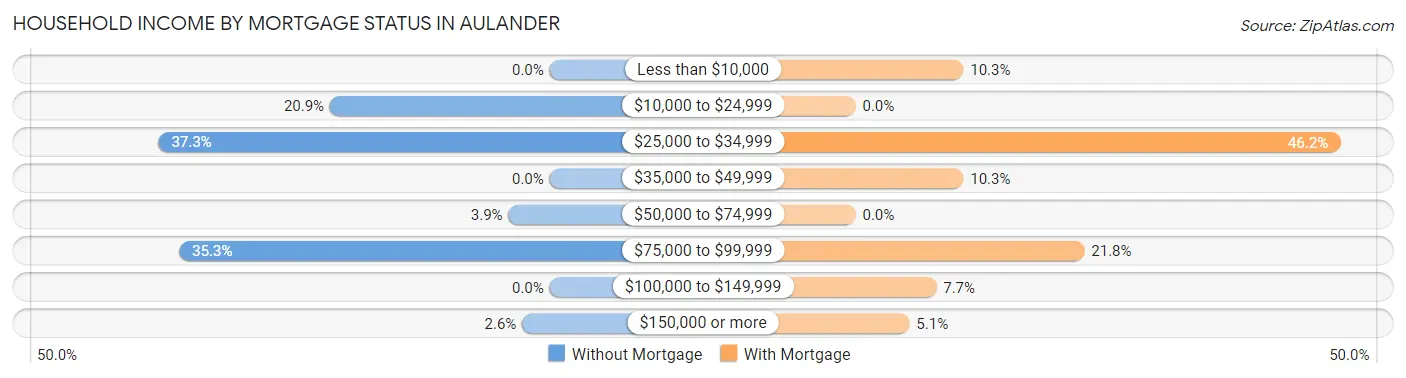
| Household Income | Without Mortgage | With Mortgage |
| Less than $10,000 | 0 (0.0%) | 8 (10.3%) |
| $10,000 to $24,999 | 32 (20.9%) | 0 (0.0%) |
| $25,000 to $34,999 | 57 (37.2%) | 36 (46.2%) |
| $35,000 to $49,999 | 0 (0.0%) | 8 (10.3%) |
| $50,000 to $74,999 | 6 (3.9%) | 0 (0.0%) |
| $75,000 to $99,999 | 54 (35.3%) | 17 (21.8%) |
| $100,000 to $149,999 | 0 (0.0%) | 6 (7.7%) |
| $150,000 or more | 4 (2.6%) | 4 (5.1%) |
| Total | 153 (100.0%) | 78 (100.0%) |
Property Value to Household Income Ratio in Aulander
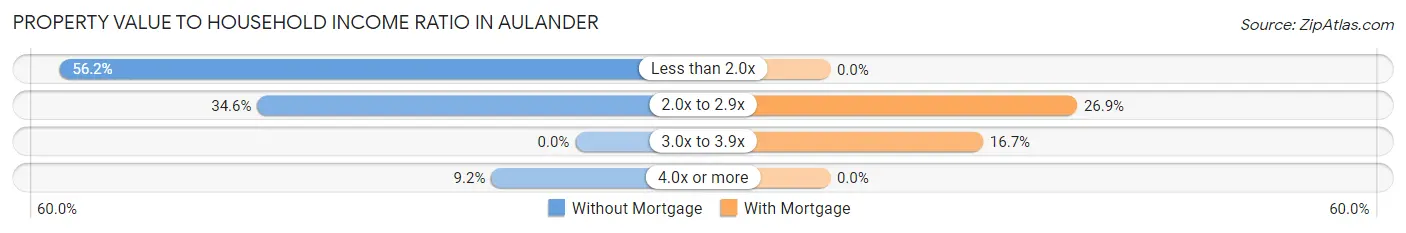
| Value-to-Income Ratio | Without Mortgage | With Mortgage |
| Less than 2.0x | 86 (56.2%) | 0 (0.0%) |
| 2.0x to 2.9x | 53 (34.6%) | 21 (26.9%) |
| 3.0x to 3.9x | 0 (0.0%) | 13 (16.7%) |
| 4.0x or more | 14 (9.1%) | 0 (0.0%) |
| Total | 153 (100.0%) | 78 (100.0%) |
Real Estate Taxes by Mortgage Status in Aulander
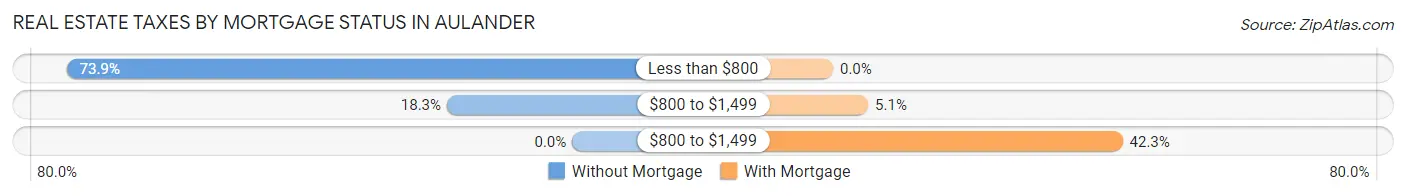
| Property Taxes | Without Mortgage | With Mortgage |
| Less than $800 | 113 (73.9%) | 0 (0.0%) |
| $800 to $1,499 | 28 (18.3%) | 4 (5.1%) |
| $800 to $1,499 | 0 (0.0%) | 33 (42.3%) |
| Total | 153 (100.0%) | 78 (100.0%) |
Health & Disability in Aulander
Health Insurance Coverage by Age in Aulander
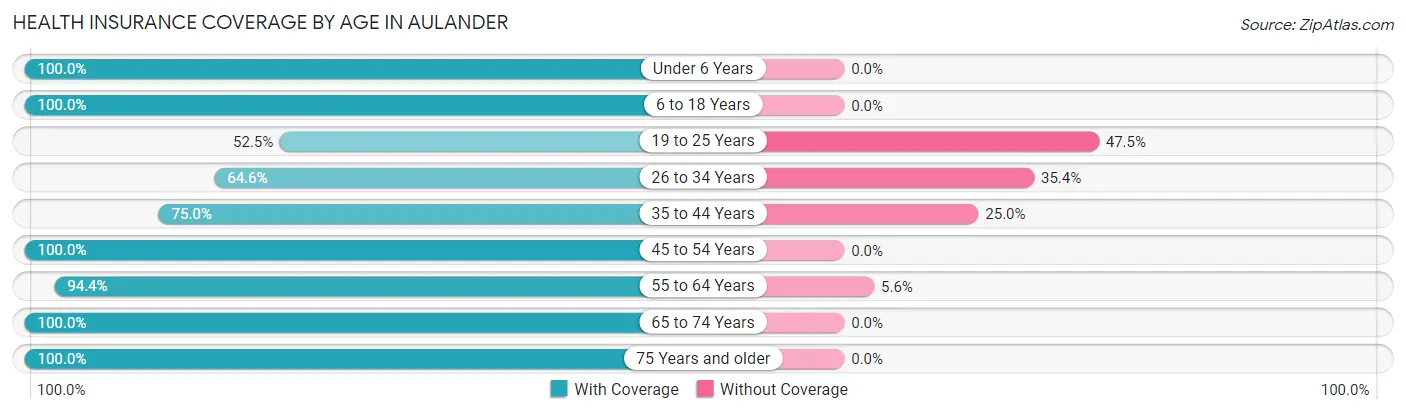
| Age Bracket | With Coverage | Without Coverage |
| Under 6 Years | 129 (100.0%) | 0 (0.0%) |
| 6 to 18 Years | 28 (100.0%) | 0 (0.0%) |
| 19 to 25 Years | 31 (52.5%) | 28 (47.5%) |
| 26 to 34 Years | 42 (64.6%) | 23 (35.4%) |
| 35 to 44 Years | 99 (75.0%) | 33 (25.0%) |
| 45 to 54 Years | 63 (100.0%) | 0 (0.0%) |
| 55 to 64 Years | 51 (94.4%) | 3 (5.6%) |
| 65 to 74 Years | 80 (100.0%) | 0 (0.0%) |
| 75 Years and older | 94 (100.0%) | 0 (0.0%) |
| Total | 617 (87.6%) | 87 (12.4%) |
Health Insurance Coverage by Citizenship Status in Aulander
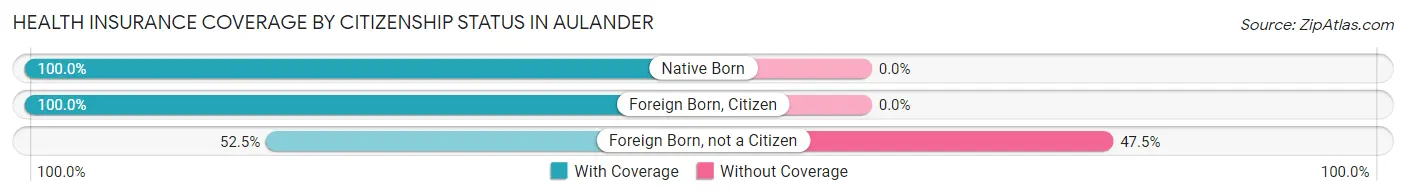
| Citizenship Status | With Coverage | Without Coverage |
| Native Born | 129 (100.0%) | 0 (0.0%) |
| Foreign Born, Citizen | 28 (100.0%) | 0 (0.0%) |
| Foreign Born, not a Citizen | 31 (52.5%) | 28 (47.5%) |
Health Insurance Coverage by Household Income in Aulander
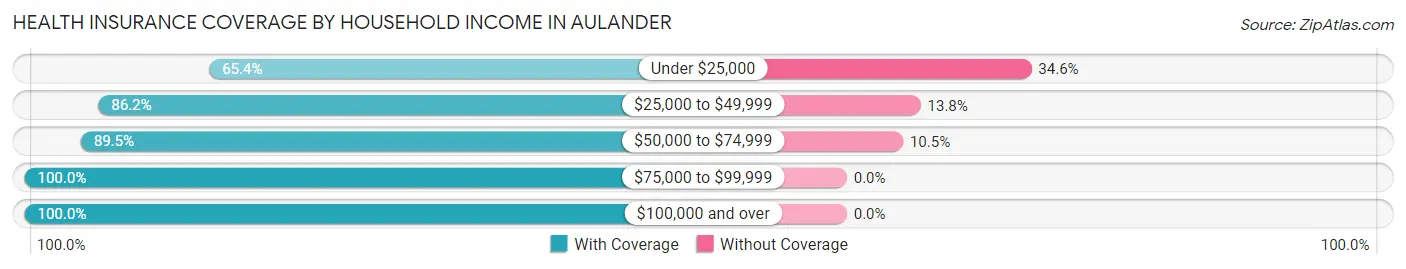
| Household Income | With Coverage | Without Coverage |
| Under $25,000 | 104 (65.4%) | 55 (34.6%) |
| $25,000 to $49,999 | 162 (86.2%) | 26 (13.8%) |
| $50,000 to $74,999 | 51 (89.5%) | 6 (10.5%) |
| $75,000 to $99,999 | 217 (100.0%) | 0 (0.0%) |
| $100,000 and over | 80 (100.0%) | 0 (0.0%) |
Public vs Private Health Insurance Coverage by Age in Aulander
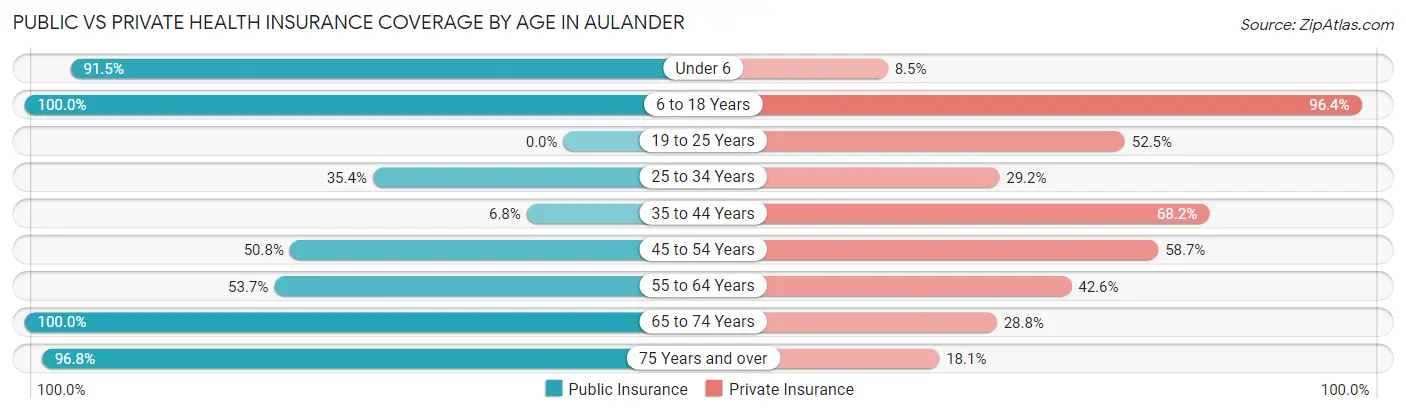
| Age Bracket | Public Insurance | Private Insurance |
| Under 6 | 118 (91.5%) | 11 (8.5%) |
| 6 to 18 Years | 28 (100.0%) | 27 (96.4%) |
| 19 to 25 Years | 0 (0.0%) | 31 (52.5%) |
| 25 to 34 Years | 23 (35.4%) | 19 (29.2%) |
| 35 to 44 Years | 9 (6.8%) | 90 (68.2%) |
| 45 to 54 Years | 32 (50.8%) | 37 (58.7%) |
| 55 to 64 Years | 29 (53.7%) | 23 (42.6%) |
| 65 to 74 Years | 80 (100.0%) | 23 (28.7%) |
| 75 Years and over | 91 (96.8%) | 17 (18.1%) |
| Total | 410 (58.2%) | 278 (39.5%) |
Disability Status by Sex by Age in Aulander
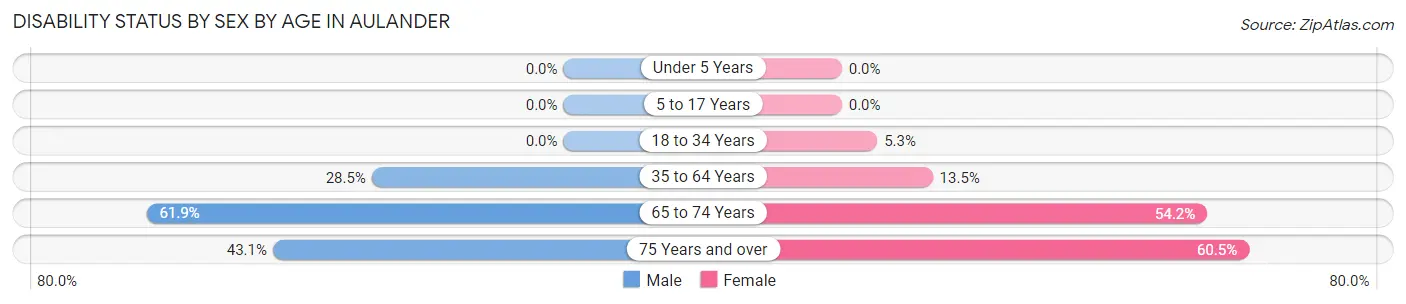
| Age Bracket | Male | Female |
| Under 5 Years | 0 (0.0%) | 0 (0.0%) |
| 5 to 17 Years | 0 (0.0%) | 0 (0.0%) |
| 18 to 34 Years | 0 (0.0%) | 3 (5.3%) |
| 35 to 64 Years | 35 (28.5%) | 17 (13.5%) |
| 65 to 74 Years | 13 (61.9%) | 32 (54.2%) |
| 75 Years and over | 22 (43.1%) | 26 (60.5%) |
Disability Class by Sex by Age in Aulander
Disability Class: Hearing Difficulty
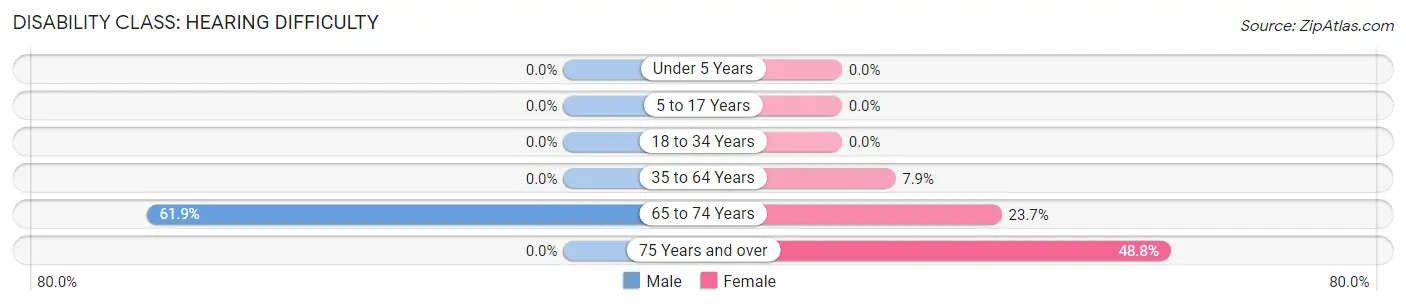
| Age Bracket | Male | Female |
| Under 5 Years | 0 (0.0%) | 0 (0.0%) |
| 5 to 17 Years | 0 (0.0%) | 0 (0.0%) |
| 18 to 34 Years | 0 (0.0%) | 0 (0.0%) |
| 35 to 64 Years | 0 (0.0%) | 10 (7.9%) |
| 65 to 74 Years | 13 (61.9%) | 14 (23.7%) |
| 75 Years and over | 0 (0.0%) | 21 (48.8%) |
Disability Class: Vision Difficulty
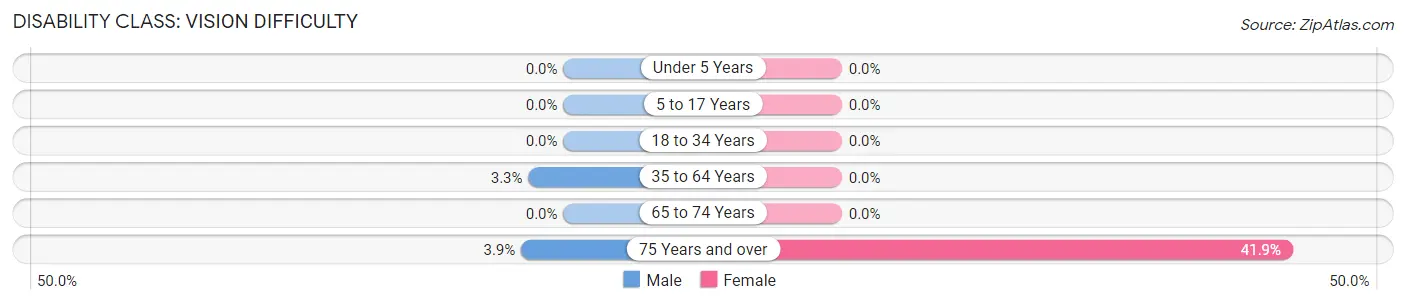
| Age Bracket | Male | Female |
| Under 5 Years | 0 (0.0%) | 0 (0.0%) |
| 5 to 17 Years | 0 (0.0%) | 0 (0.0%) |
| 18 to 34 Years | 0 (0.0%) | 0 (0.0%) |
| 35 to 64 Years | 4 (3.3%) | 0 (0.0%) |
| 65 to 74 Years | 0 (0.0%) | 0 (0.0%) |
| 75 Years and over | 2 (3.9%) | 18 (41.9%) |
Disability Class: Cognitive Difficulty
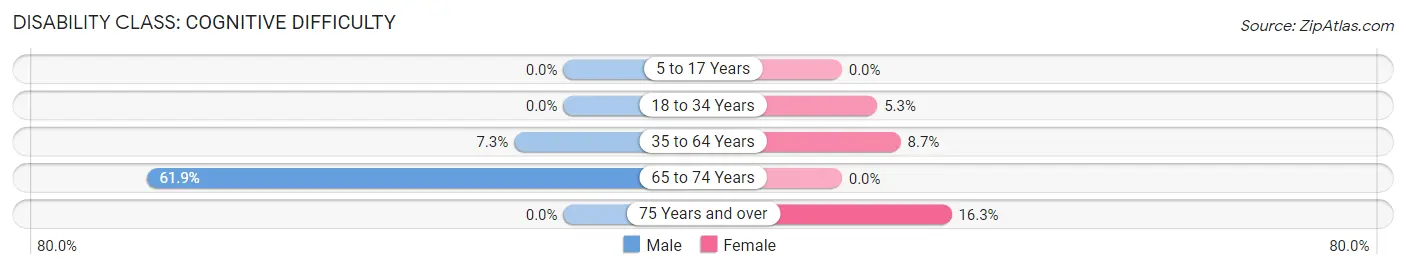
| Age Bracket | Male | Female |
| 5 to 17 Years | 0 (0.0%) | 0 (0.0%) |
| 18 to 34 Years | 0 (0.0%) | 3 (5.3%) |
| 35 to 64 Years | 9 (7.3%) | 11 (8.7%) |
| 65 to 74 Years | 13 (61.9%) | 0 (0.0%) |
| 75 Years and over | 0 (0.0%) | 7 (16.3%) |
Disability Class: Ambulatory Difficulty
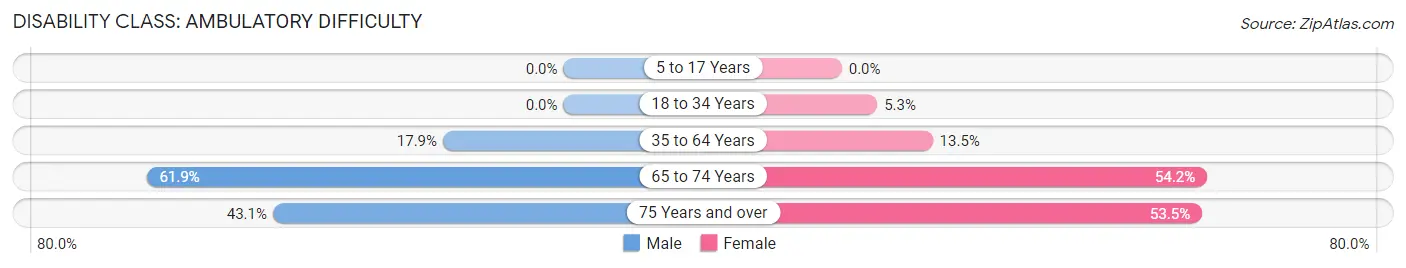
| Age Bracket | Male | Female |
| 5 to 17 Years | 0 (0.0%) | 0 (0.0%) |
| 18 to 34 Years | 0 (0.0%) | 3 (5.3%) |
| 35 to 64 Years | 22 (17.9%) | 17 (13.5%) |
| 65 to 74 Years | 13 (61.9%) | 32 (54.2%) |
| 75 Years and over | 22 (43.1%) | 23 (53.5%) |
Disability Class: Self-Care Difficulty
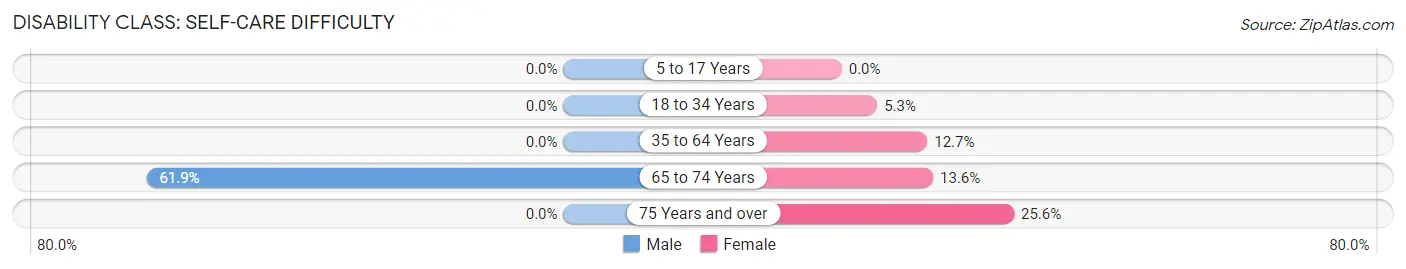
| Age Bracket | Male | Female |
| 5 to 17 Years | 0 (0.0%) | 0 (0.0%) |
| 18 to 34 Years | 0 (0.0%) | 3 (5.3%) |
| 35 to 64 Years | 0 (0.0%) | 16 (12.7%) |
| 65 to 74 Years | 13 (61.9%) | 8 (13.6%) |
| 75 Years and over | 0 (0.0%) | 11 (25.6%) |
Technology Access in Aulander
Computing Device Access in Aulander
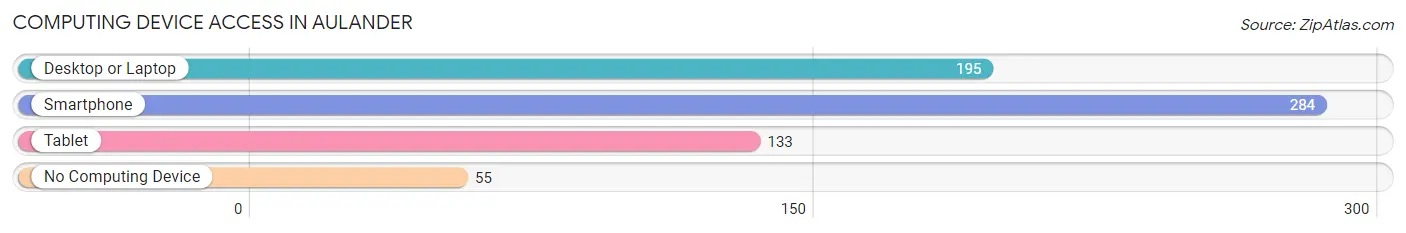
| Device Type | # Households | % Households |
| Desktop or Laptop | 195 | 56.4% |
| Smartphone | 284 | 82.1% |
| Tablet | 133 | 38.4% |
| No Computing Device | 55 | 15.9% |
| Total | 346 | 100.0% |
Internet Access in Aulander
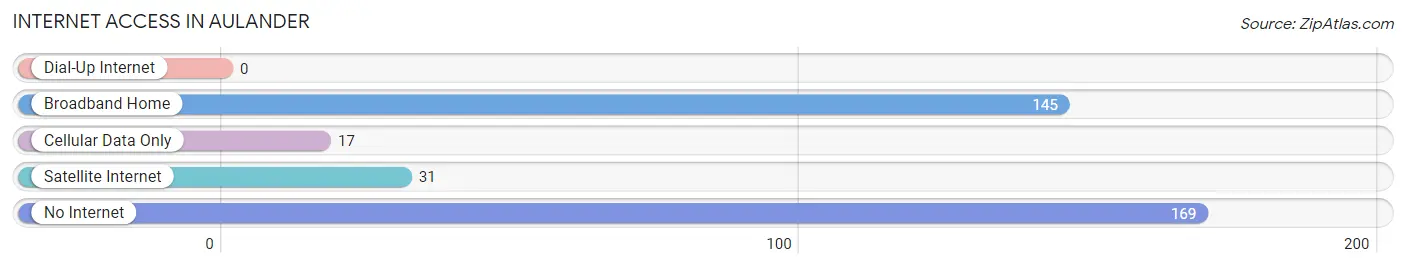
| Internet Type | # Households | % Households |
| Dial-Up Internet | 0 | 0.0% |
| Broadband Home | 145 | 41.9% |
| Cellular Data Only | 17 | 4.9% |
| Satellite Internet | 31 | 9.0% |
| No Internet | 169 | 48.8% |
| Total | 346 | 100.0% |
Aulander Summary
Aulander is a small town located in Bertie County, North Carolina. It is situated in the northeastern part of the state, about 40 miles from the Virginia border. The town was founded in 1887 and has a population of approximately 1,000 people.
Geography
Aulander is located in the northeastern part of North Carolina, in the coastal plain region. The town is situated on the banks of the Cashie River, which flows through the town and provides a source of recreation for the locals. The town is surrounded by farmland and is located near the Albemarle Sound. The climate in Aulander is humid subtropical, with hot summers and mild winters.
Economy
The economy of Aulander is largely based on agriculture. The town is home to several farms, which produce a variety of crops, including corn, soybeans, cotton, and tobacco. The town also has a few small businesses, including a grocery store, a hardware store, and a few restaurants.
Demographics
As of the 2010 census, the population of Aulander was 1,000 people. The racial makeup of the town was 79.2% White, 17.2% African American, 0.7% Native American, 0.3% Asian, and 2.6% from other races. The median household income was $30,000, and the median age was 39.
History
Aulander was founded in 1887 by a group of settlers from Virginia. The town was named after the Aulander family, who were among the first settlers. The town grew slowly over the years, and by the early 1900s, it had become a thriving agricultural community. The town was home to several churches, a school, and a post office.
In the 1950s, the town began to decline as many of the residents moved away in search of better economic opportunities. The town was hit hard by the Great Depression and the decline continued until the late 1970s. In the 1980s, the town began to experience a resurgence as new businesses opened and the population began to grow again.
Today, Aulander is a small, rural town with a population of about 1,000 people. The town is home to several churches, a post office, a grocery store, and a few restaurants. The town is also home to a few small businesses, including a hardware store and a few other shops. The town is a popular destination for tourists, who come to enjoy the rural atmosphere and the nearby Cashie River.
Common Questions
What is the Total Population of Aulander?
Total Population of Aulander is 704.
What is the Total Male Population of Aulander?
Total Male Population of Aulander is 329.
What is the Total Female Population of Aulander?
Total Female Population of Aulander is 375.
What is the Ratio of Males per 100 Females in Aulander?
There are 87.73 Males per 100 Females in Aulander.
What is the Ratio of Females per 100 Males in Aulander?
There are 113.98 Females per 100 Males in Aulander.
What is the Median Population Age in Aulander?
Median Population Age in Aulander is 42.4 Years.
What is the Average Family Size in Aulander
Average Family Size in Aulander is 3.0 People.
What is the Average Household Size in Aulander
Average Household Size in Aulander is 2.0 People.
What is Per Capita Income in Aulander?
Per Capita income in Aulander is $24,522.
What is the Median Family Income in Aulander?
Median Family Income in Aulander is $58,654.
What is the Median Household income in Aulander?
Median Household Income in Aulander is $33,250.
What is Income or Wage Gap in Aulander?
Income or Wage Gap in Aulander is 18.8%.
Women in Aulander earn 81.2 cents for every dollar earned by a man.
What is Inequality or Gini Index in Aulander?
Inequality or Gini Index in Aulander is 0.45.
How Large is the Labor Force in Aulander?
There are 277 People in the Labor Forcein in Aulander.
What is the Percentage of People in the Labor Force in Aulander?
50.6% of People are in the Labor Force in Aulander.
What is the Unemployment Rate in Aulander?
Unemployment Rate in Aulander is 12.6%.