Rineyville, KY
Rineyville Map
Rineyville Overview
3,006
TOTAL POPULATION
1,606
MALE POPULATION
1,400
FEMALE POPULATION
114.71
MALES / 100 FEMALES
87.17
FEMALES / 100 MALES
29.6
MEDIAN AGE
3.8
AVG FAMILY SIZE
3.5
AVG HOUSEHOLD SIZE
$33,756
PER CAPITA INCOME
$133,333
AVG FAMILY INCOME
$91,394
AVG HOUSEHOLD INCOME
66.6%
WAGE / INCOME GAP [ % ]
33.4¢/ $1
WAGE / INCOME GAP [ $ ]
0.34
INEQUALITY / GINI INDEX
1,339
LABOR FORCE [ PEOPLE ]
67.7%
PERCENT IN LABOR FORCE
7.4%
UNEMPLOYMENT RATE
Rineyville Zip Codes
Rineyville Area Codes
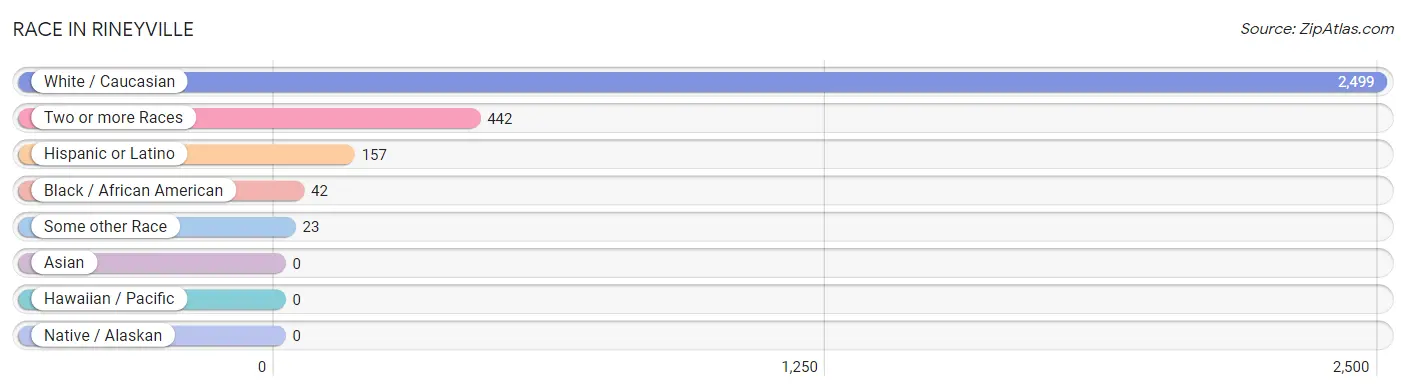
Race in Rineyville
The most populous races in Rineyville are White / Caucasian (2,499 | 83.1%), Two or more Races (442 | 14.7%), and Hispanic or Latino (157 | 5.2%).
| Race | # Population | % Population |
| Asian | 0 | 0.0% |
| Black / African American | 42 | 1.4% |
| Hawaiian / Pacific | 0 | 0.0% |
| Hispanic or Latino | 157 | 5.2% |
| Native / Alaskan | 0 | 0.0% |
| White / Caucasian | 2,499 | 83.1% |
| Two or more Races | 442 | 14.7% |
| Some other Race | 23 | 0.8% |
| Total | 3,006 | 100.0% |
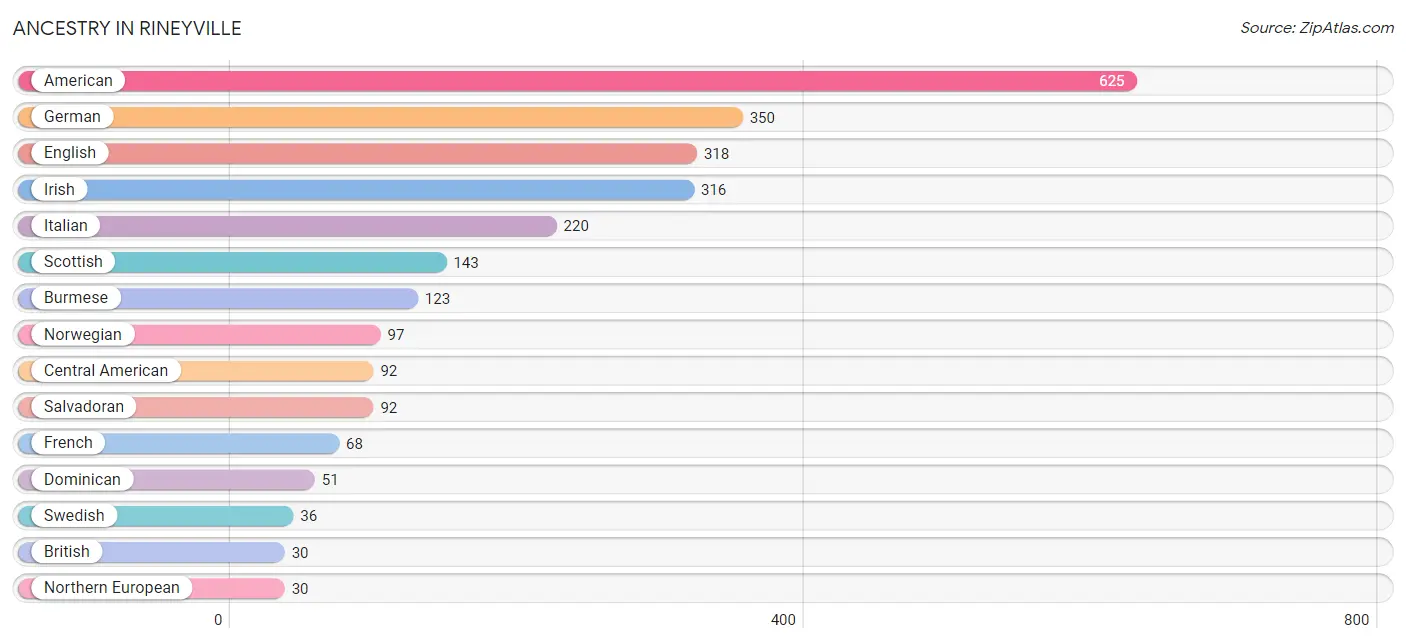
Ancestry in Rineyville
The most populous ancestries reported in Rineyville are American (625 | 20.8%), German (350 | 11.6%), English (318 | 10.6%), Irish (316 | 10.5%), and Italian (220 | 7.3%), together accounting for 60.8% of all Rineyville residents.
| Ancestry | # Population | % Population |
| American | 625 | 20.8% |
| Belgian | 22 | 0.7% |
| British | 30 | 1.0% |
| Burmese | 123 | 4.1% |
| Central American | 92 | 3.1% |
| Cherokee | 17 | 0.6% |
| Dominican | 51 | 1.7% |
| English | 318 | 10.6% |
| French | 68 | 2.3% |
| French Canadian | 25 | 0.8% |
| German | 350 | 11.6% |
| Indian (Asian) | 13 | 0.4% |
| Irish | 316 | 10.5% |
| Italian | 220 | 7.3% |
| Northern European | 30 | 1.0% |
| Norwegian | 97 | 3.2% |
| Salvadoran | 92 | 3.1% |
| Scottish | 143 | 4.8% |
| Spanish | 14 | 0.5% |
| Swedish | 36 | 1.2% | View All 20 Rows |
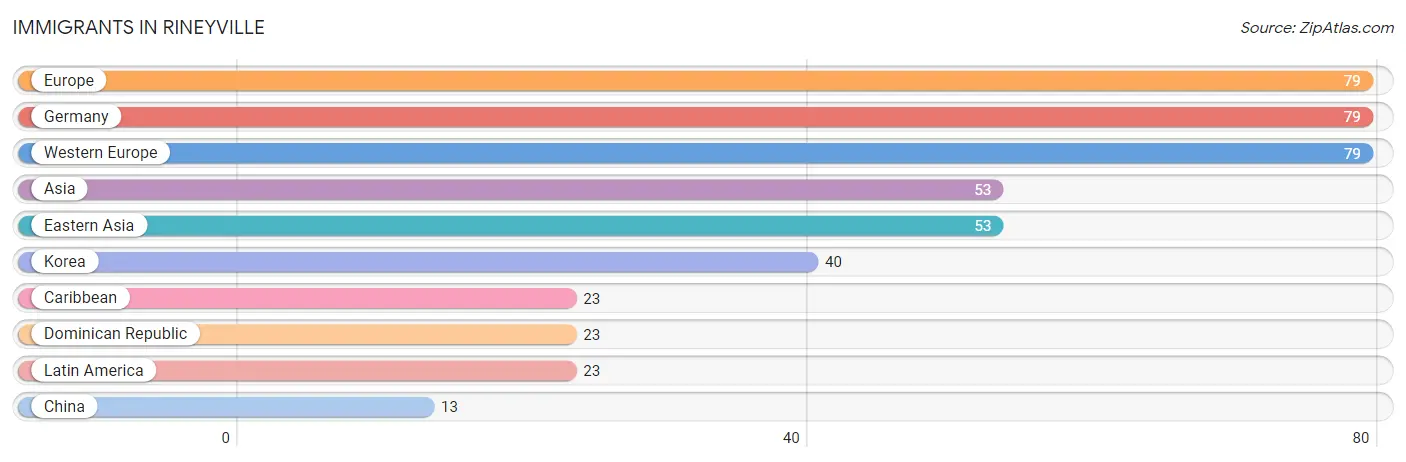
Immigrants in Rineyville
The most numerous immigrant groups reported in Rineyville came from Europe (79 | 2.6%), Germany (79 | 2.6%), Western Europe (79 | 2.6%), Asia (53 | 1.8%), and Eastern Asia (53 | 1.8%), together accounting for 11.4% of all Rineyville residents.
| Immigration Origin | # Population | % Population |
| Asia | 53 | 1.8% |
| Caribbean | 23 | 0.8% |
| China | 13 | 0.4% |
| Dominican Republic | 23 | 0.8% |
| Eastern Asia | 53 | 1.8% |
| Europe | 79 | 2.6% |
| Germany | 79 | 2.6% |
| Korea | 40 | 1.3% |
| Latin America | 23 | 0.8% |
| Western Europe | 79 | 2.6% | View All 10 Rows |
Sex and Age in Rineyville
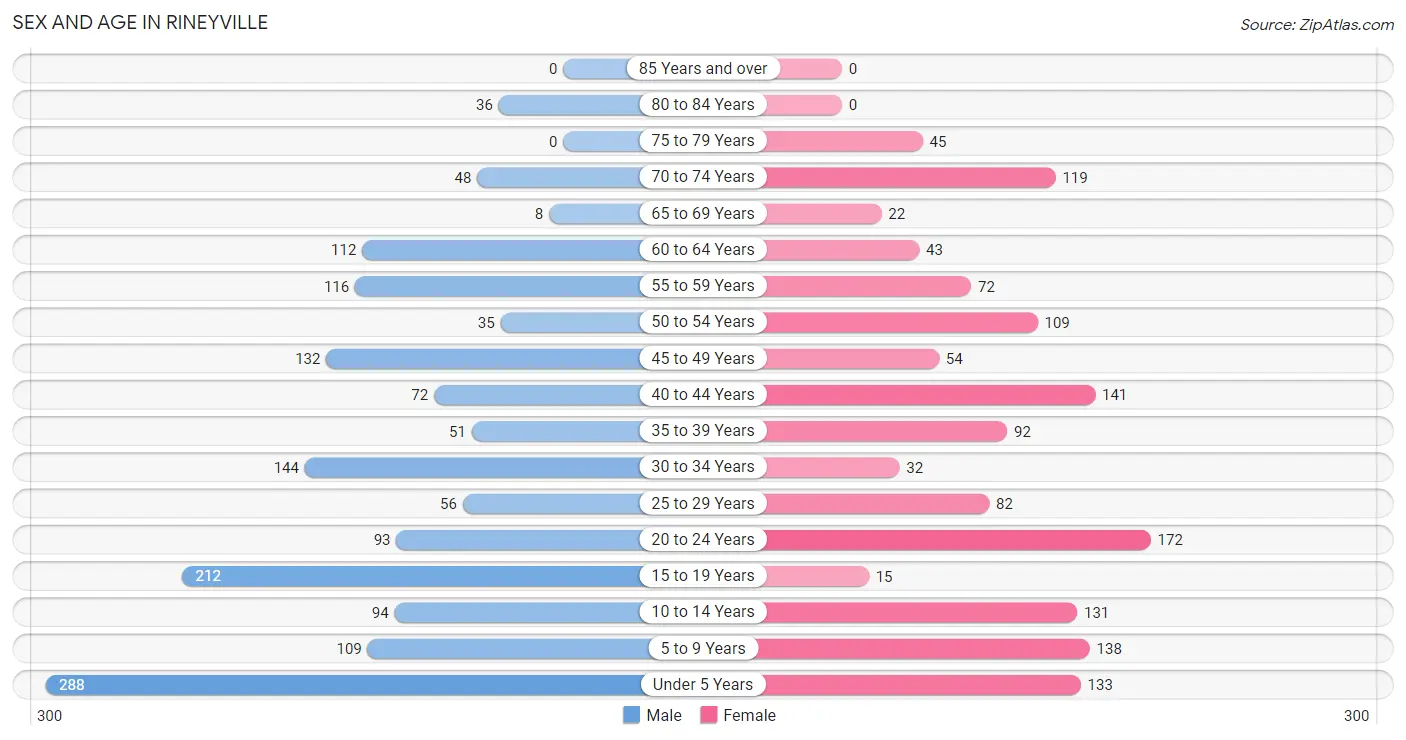
Sex and Age in Rineyville
The most populous age groups in Rineyville are Under 5 Years (288 | 17.9%) for men and 20 to 24 Years (172 | 12.3%) for women.
| Age Bracket | Male | Female |
| Under 5 Years | 288 (17.9%) | 133 (9.5%) |
| 5 to 9 Years | 109 (6.8%) | 138 (9.9%) |
| 10 to 14 Years | 94 (5.9%) | 131 (9.4%) |
| 15 to 19 Years | 212 (13.2%) | 15 (1.1%) |
| 20 to 24 Years | 93 (5.8%) | 172 (12.3%) |
| 25 to 29 Years | 56 (3.5%) | 82 (5.9%) |
| 30 to 34 Years | 144 (9.0%) | 32 (2.3%) |
| 35 to 39 Years | 51 (3.2%) | 92 (6.6%) |
| 40 to 44 Years | 72 (4.5%) | 141 (10.1%) |
| 45 to 49 Years | 132 (8.2%) | 54 (3.9%) |
| 50 to 54 Years | 35 (2.2%) | 109 (7.8%) |
| 55 to 59 Years | 116 (7.2%) | 72 (5.1%) |
| 60 to 64 Years | 112 (7.0%) | 43 (3.1%) |
| 65 to 69 Years | 8 (0.5%) | 22 (1.6%) |
| 70 to 74 Years | 48 (3.0%) | 119 (8.5%) |
| 75 to 79 Years | 0 (0.0%) | 45 (3.2%) |
| 80 to 84 Years | 36 (2.2%) | 0 (0.0%) |
| 85 Years and over | 0 (0.0%) | 0 (0.0%) |
| Total | 1,606 (100.0%) | 1,400 (100.0%) |
Families and Households in Rineyville
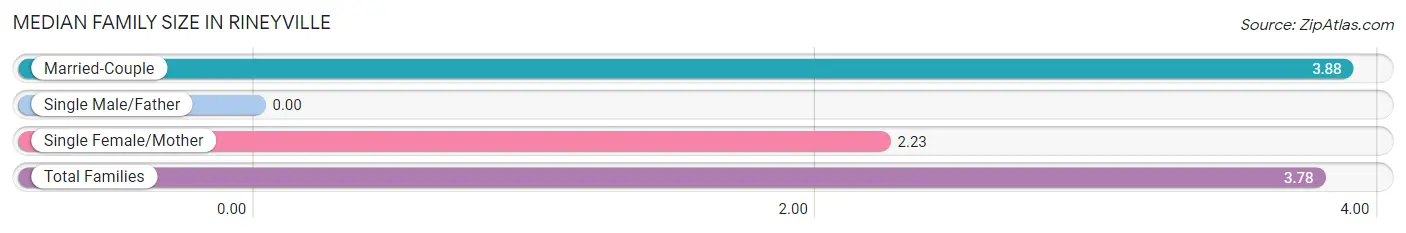
Median Family Size in Rineyville
| Family Type | # Families | Family Size |
| Married-Couple | 653 (94.4%) | 3.88 |
| Single Male/Father | 0 (0.0%) | - |
| Single Female/Mother | 39 (5.6%) | 2.23 |
| Total Families | 692 (100.0%) | 3.78 |
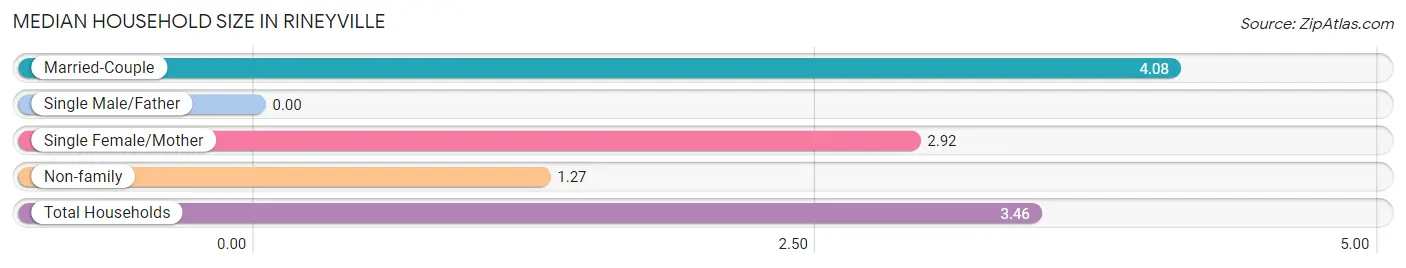
Median Household Size in Rineyville
| Household Type | # Households | Household Size |
| Married-Couple | 653 (75.1%) | 4.08 |
| Single Male/Father | 0 (0.0%) | - |
| Single Female/Mother | 39 (4.5%) | 2.92 |
| Non-family | 178 (20.5%) | 1.27 |
| Total Households | 870 (100.0%) | 3.46 |
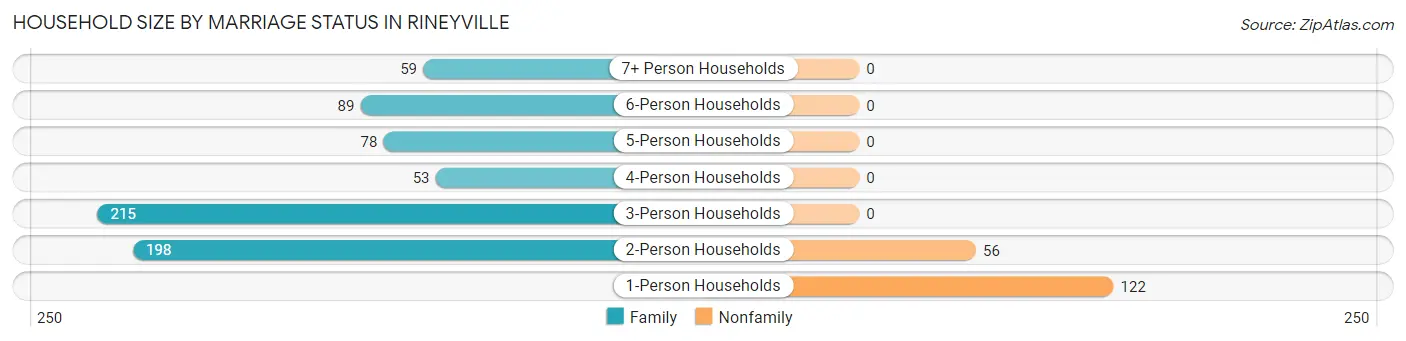
Household Size by Marriage Status in Rineyville
Out of a total of 870 households in Rineyville, 692 (79.5%) are family households, while 178 (20.5%) are nonfamily households. The most numerous type of family households are 3-person households, comprising 215, and the most common type of nonfamily households are 1-person households, comprising 122.
| Household Size | Family Households | Nonfamily Households |
| 1-Person Households | - | 122 (14.0%) |
| 2-Person Households | 198 (22.8%) | 56 (6.4%) |
| 3-Person Households | 215 (24.7%) | 0 (0.0%) |
| 4-Person Households | 53 (6.1%) | 0 (0.0%) |
| 5-Person Households | 78 (9.0%) | 0 (0.0%) |
| 6-Person Households | 89 (10.2%) | 0 (0.0%) |
| 7+ Person Households | 59 (6.8%) | 0 (0.0%) |
| Total | 692 (79.5%) | 178 (20.5%) |
Female Fertility in Rineyville
Fertility by Age in Rineyville
Average fertility rate in Rineyville is 64.0 births per 1,000 women. Women in the age bracket of 20 to 34 years have the highest fertility rate with 140.0 births per 1,000 women. Women in the age bracket of 20 to 34 years acount for 100.0% of all women with births.
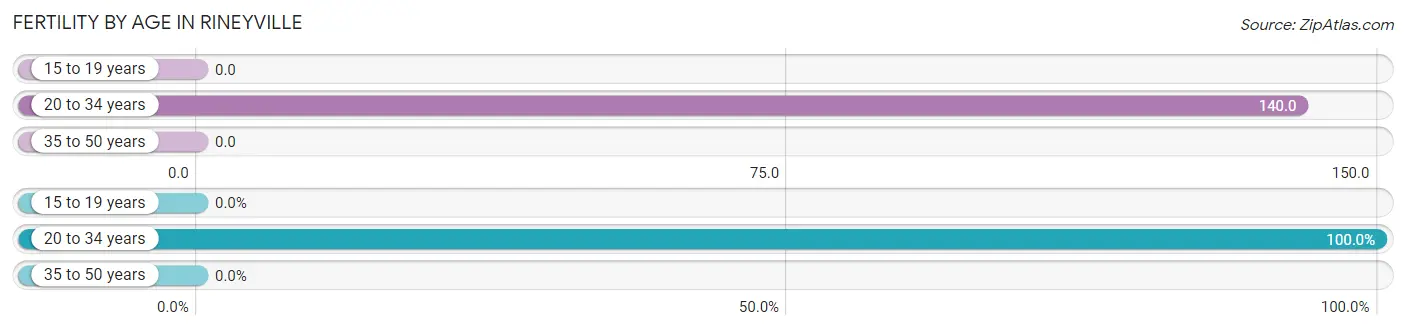
| Age Bracket | Women with Births | Births / 1,000 Women |
| 15 to 19 years | 0 (0.0%) | 0.0 |
| 20 to 34 years | 40 (100.0%) | 140.0 |
| 35 to 50 years | 0 (0.0%) | 0.0 |
| Total | 40 (100.0%) | 64.0 |
Fertility by Age by Marriage Status in Rineyville
35.0% of women with births (40) in Rineyville are married. The highest percentage of unmarried women with births falls into 20 to 34 years age bracket with 65.0% of them unmarried at the time of birth, while the lowest percentage of unmarried women with births belong to 20 to 34 years age bracket with 65.0% of them unmarried.
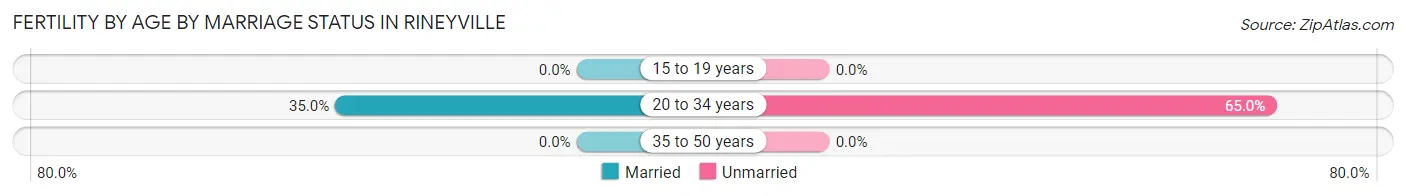
| Age Bracket | Married | Unmarried |
| 15 to 19 years | 0 (0.0%) | 0 (0.0%) |
| 20 to 34 years | 14 (35.0%) | 26 (65.0%) |
| 35 to 50 years | 0 (0.0%) | 0 (0.0%) |
| Total | 14 (35.0%) | 26 (65.0%) |
Fertility by Education in Rineyville
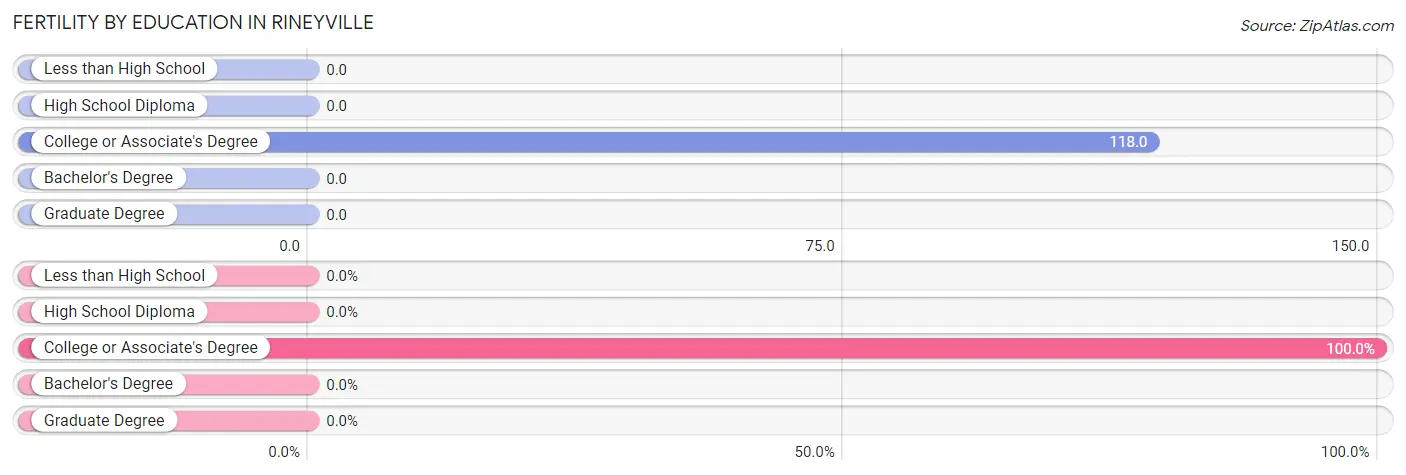
| Educational Attainment | Women with Births | Births / 1,000 Women |
| Less than High School | 0 (0.0%) | 0.0 |
| High School Diploma | 0 (0.0%) | 0.0 |
| College or Associate's Degree | 40 (100.0%) | 118.0 |
| Bachelor's Degree | 0 (0.0%) | 0.0 |
| Graduate Degree | 0 (0.0%) | 0.0 |
| Total | 40 (100.0%) | 64.0 |
Fertility by Education by Marriage Status in Rineyville
65.0% of women with births in Rineyville are unmarried. Women with the educational attainment of college or associate's degree are most likely to be married with 35.0% of them married at childbirth, while women with the educational attainment of college or associate's degree are least likely to be married with 65.0% of them unmarried at childbirth.
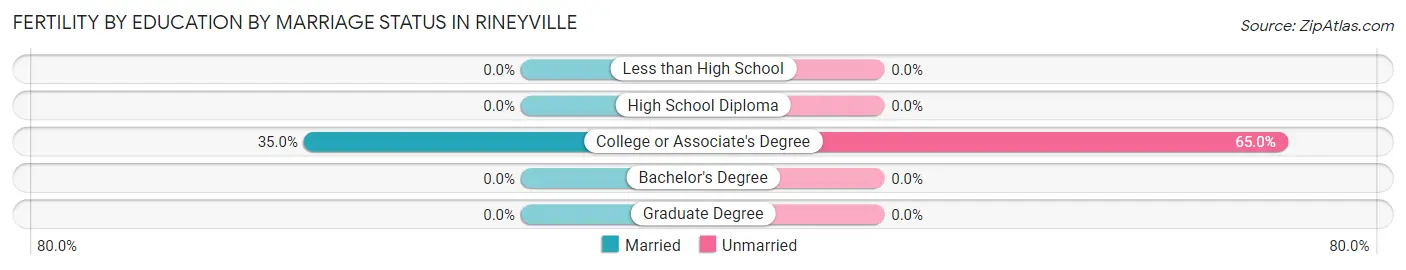
| Educational Attainment | Married | Unmarried |
| Less than High School | 0 (0.0%) | 0 (0.0%) |
| High School Diploma | 0 (0.0%) | 0 (0.0%) |
| College or Associate's Degree | 14 (35.0%) | 26 (65.0%) |
| Bachelor's Degree | 0 (0.0%) | 0 (0.0%) |
| Graduate Degree | 0 (0.0%) | 0 (0.0%) |
| Total | 14 (35.0%) | 26 (65.0%) |
Income in Rineyville
Income Overview in Rineyville
Per Capita Income in Rineyville is $33,756, while median incomes of families and households are $133,333 and $91,394 respectively.
| Characteristic | Number | Measure |
| Per Capita Income | 3,006 | $33,756 |
| Median Family Income | 692 | $133,333 |
| Mean Family Income | 692 | $130,264 |
| Median Household Income | 870 | $91,394 |
| Mean Household Income | 870 | $115,654 |
| Income Deficit | 692 | $0 |
| Wage / Income Gap (%) | 3,006 | 66.56% |
| Wage / Income Gap ($) | 3,006 | 33.44¢ per $1 |
| Gini / Inequality Index | 3,006 | 0.34 |
Earnings by Sex in Rineyville
Average Earnings in Rineyville are $57,409, $78,326 for men and $26,192 for women, a difference of 66.6%.
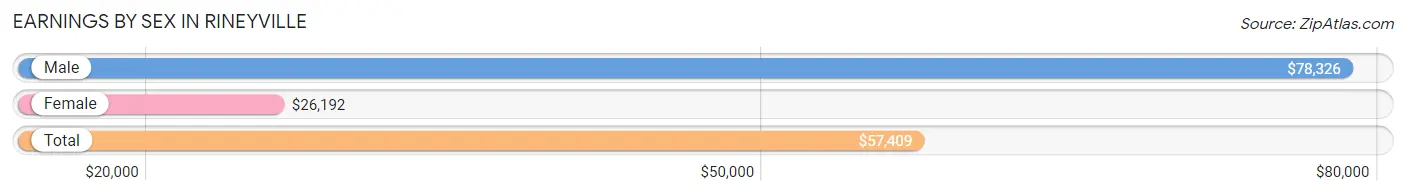
| Sex | Number | Average Earnings |
| Male | 653 (49.8%) | $78,326 |
| Female | 658 (50.2%) | $26,192 |
| Total | 1,311 (100.0%) | $57,409 |
Earnings by Sex by Income Bracket in Rineyville
The most common earnings brackets in Rineyville are $100,000+ for men (174 | 26.7%) and $25,000 to $29,999 for women (86 | 13.1%).
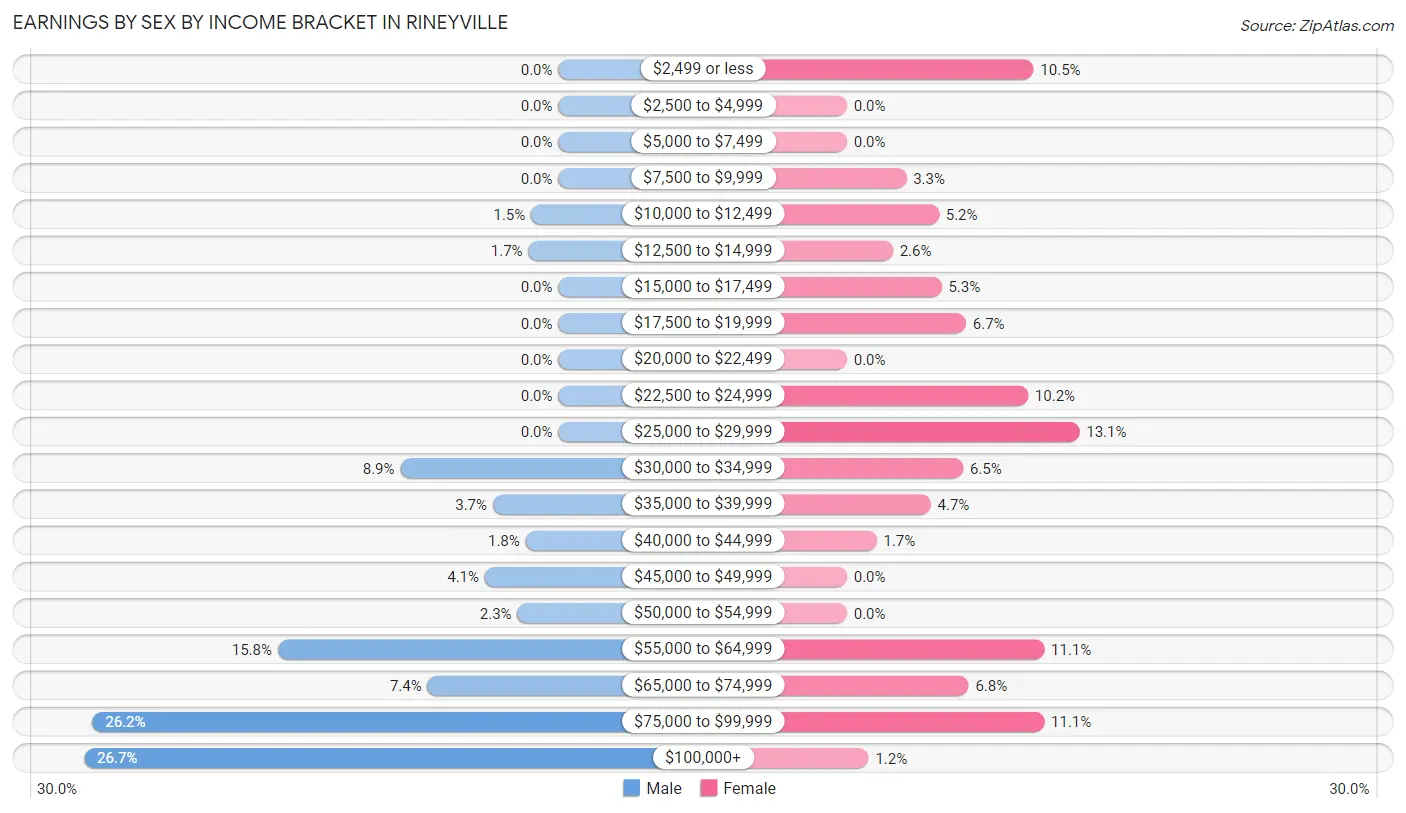
| Income | Male | Female |
| $2,499 or less | 0 (0.0%) | 69 (10.5%) |
| $2,500 to $4,999 | 0 (0.0%) | 0 (0.0%) |
| $5,000 to $7,499 | 0 (0.0%) | 0 (0.0%) |
| $7,500 to $9,999 | 0 (0.0%) | 22 (3.3%) |
| $10,000 to $12,499 | 10 (1.5%) | 34 (5.2%) |
| $12,500 to $14,999 | 11 (1.7%) | 17 (2.6%) |
| $15,000 to $17,499 | 0 (0.0%) | 35 (5.3%) |
| $17,500 to $19,999 | 0 (0.0%) | 44 (6.7%) |
| $20,000 to $22,499 | 0 (0.0%) | 0 (0.0%) |
| $22,500 to $24,999 | 0 (0.0%) | 67 (10.2%) |
| $25,000 to $29,999 | 0 (0.0%) | 86 (13.1%) |
| $30,000 to $34,999 | 58 (8.9%) | 43 (6.5%) |
| $35,000 to $39,999 | 24 (3.7%) | 31 (4.7%) |
| $40,000 to $44,999 | 12 (1.8%) | 11 (1.7%) |
| $45,000 to $49,999 | 27 (4.1%) | 0 (0.0%) |
| $50,000 to $54,999 | 15 (2.3%) | 0 (0.0%) |
| $55,000 to $64,999 | 103 (15.8%) | 73 (11.1%) |
| $65,000 to $74,999 | 48 (7.3%) | 45 (6.8%) |
| $75,000 to $99,999 | 171 (26.2%) | 73 (11.1%) |
| $100,000+ | 174 (26.7%) | 8 (1.2%) |
| Total | 653 (100.0%) | 658 (100.0%) |
Earnings by Sex by Educational Attainment in Rineyville
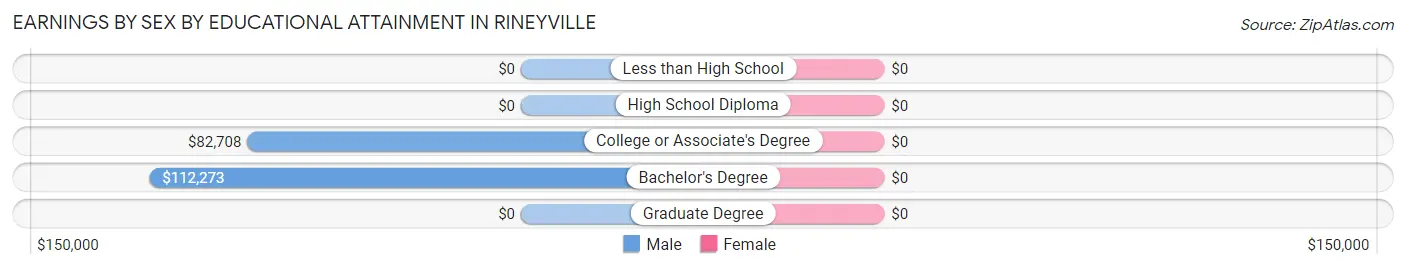
| Educational Attainment | Male Income | Female Income |
| Less than High School | - | - |
| High School Diploma | - | - |
| College or Associate's Degree | $82,708 | $0 |
| Bachelor's Degree | $112,273 | $0 |
| Graduate Degree | - | - |
| Total | $81,607 | $32,733 |
Family Income in Rineyville
Family Income Brackets in Rineyville
According to the Rineyville family income data, there are 200 families falling into the $150,000 to $199,999 income range, which is the most common income bracket and makes up 28.9% of all families.
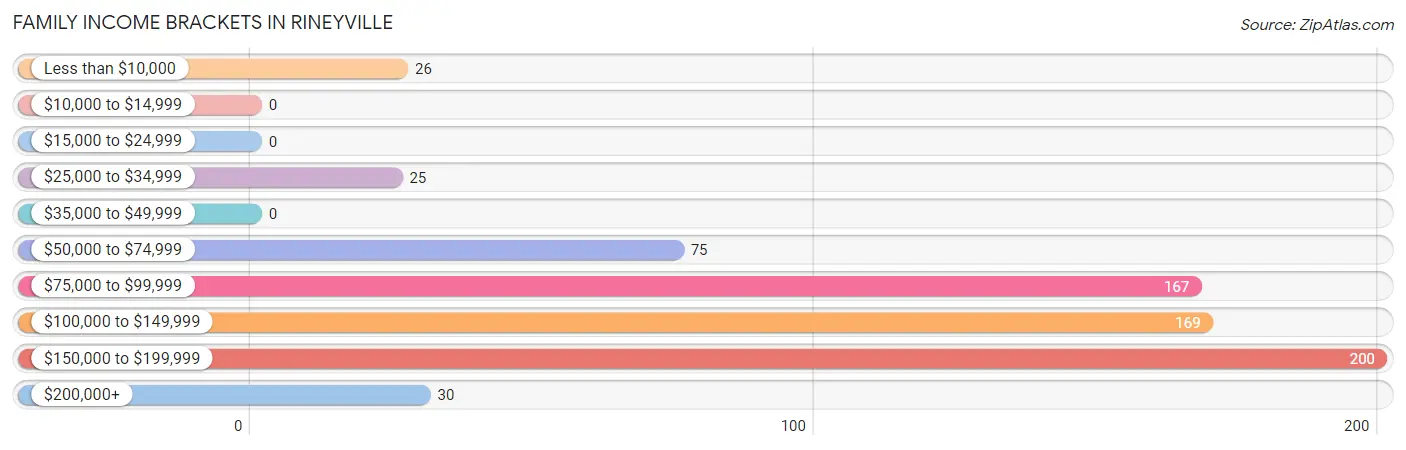
| Income Bracket | # Families | % Families |
| Less than $10,000 | 26 | 3.8% |
| $10,000 to $14,999 | 0 | 0.0% |
| $15,000 to $24,999 | 0 | 0.0% |
| $25,000 to $34,999 | 25 | 3.6% |
| $35,000 to $49,999 | 0 | 0.0% |
| $50,000 to $74,999 | 75 | 10.8% |
| $75,000 to $99,999 | 167 | 24.1% |
| $100,000 to $149,999 | 169 | 24.4% |
| $150,000 to $199,999 | 200 | 28.9% |
| $200,000+ | 30 | 4.3% |
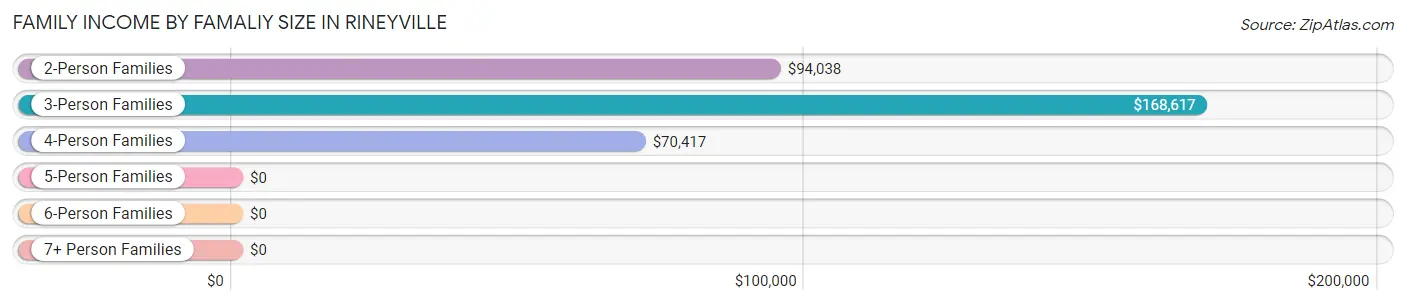
Family Income by Famaliy Size in Rineyville
3-person families (189 | 27.3%) account for the highest median family income in Rineyville with $168,617 per family, while 3-person families (189 | 27.3%) have the highest median income of $56,206 per family member.
| Income Bracket | # Families | Median Income |
| 2-Person Families | 224 (32.4%) | $94,038 |
| 3-Person Families | 189 (27.3%) | $168,617 |
| 4-Person Families | 53 (7.7%) | $70,417 |
| 5-Person Families | 78 (11.3%) | $0 |
| 6-Person Families | 89 (12.9%) | $0 |
| 7+ Person Families | 59 (8.5%) | $0 |
| Total | 692 (100.0%) | $133,333 |
Family Income by Number of Earners in Rineyville
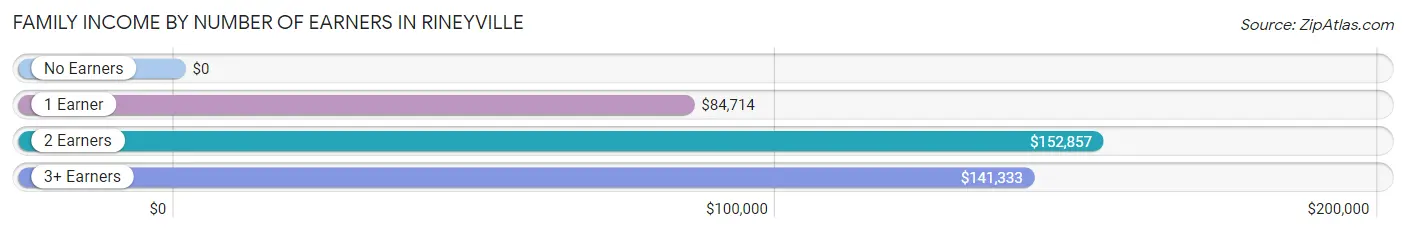
| Number of Earners | # Families | Median Income |
| No Earners | 89 (12.9%) | $0 |
| 1 Earner | 165 (23.8%) | $84,714 |
| 2 Earners | 342 (49.4%) | $152,857 |
| 3+ Earners | 96 (13.9%) | $141,333 |
| Total | 692 (100.0%) | $133,333 |
Household Income in Rineyville
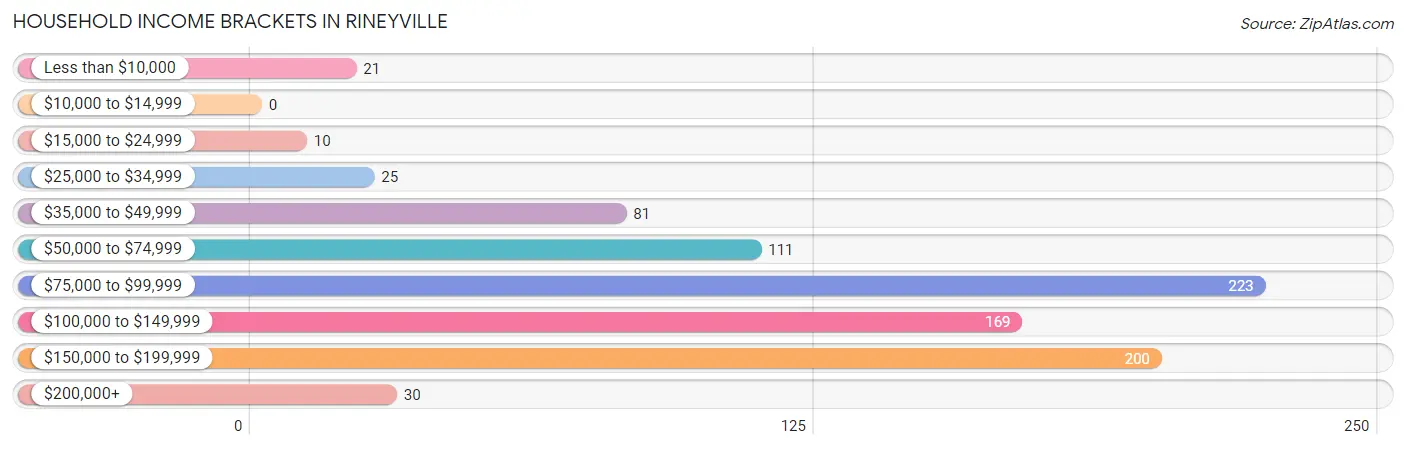
Household Income Brackets in Rineyville
With 223 households falling in the category, the $75,000 to $99,999 income range is the most frequent in Rineyville, accounting for 25.6% of all households.
| Income Bracket | # Households | % Households |
| Less than $10,000 | 21 | 2.4% |
| $10,000 to $14,999 | 0 | 0.0% |
| $15,000 to $24,999 | 10 | 1.1% |
| $25,000 to $34,999 | 25 | 2.9% |
| $35,000 to $49,999 | 81 | 9.3% |
| $50,000 to $74,999 | 111 | 12.8% |
| $75,000 to $99,999 | 223 | 25.6% |
| $100,000 to $149,999 | 169 | 19.4% |
| $150,000 to $199,999 | 200 | 23.0% |
| $200,000+ | 30 | 3.4% |
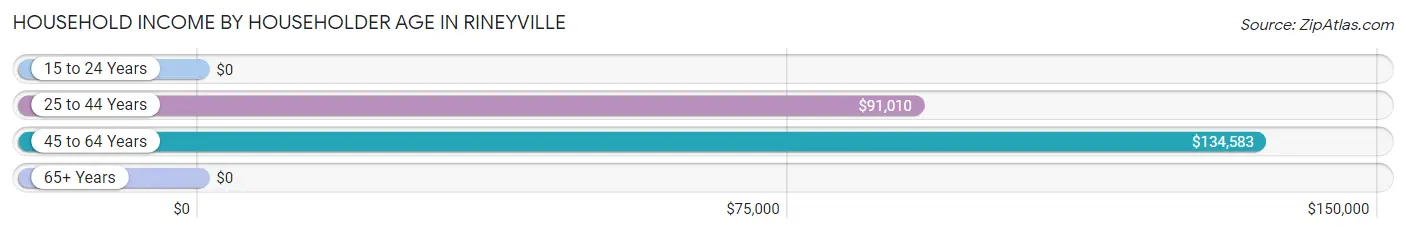
Household Income by Householder Age in Rineyville
The median household income in Rineyville is $91,394, with the highest median household income of $134,583 found in the 45 to 64 years age bracket for the primary householder. A total of 402 households (46.2%) fall into this category. Meanwhile, the 15 to 24 years age bracket for the primary householder has the lowest median household income of $0, with 26 households (3.0%) in this group.
| Income Bracket | # Households | Median Income |
| 15 to 24 Years | 26 (3.0%) | $0 |
| 25 to 44 Years | 284 (32.6%) | $91,010 |
| 45 to 64 Years | 402 (46.2%) | $134,583 |
| 65+ Years | 158 (18.2%) | $0 |
| Total | 870 (100.0%) | $91,394 |
Poverty in Rineyville
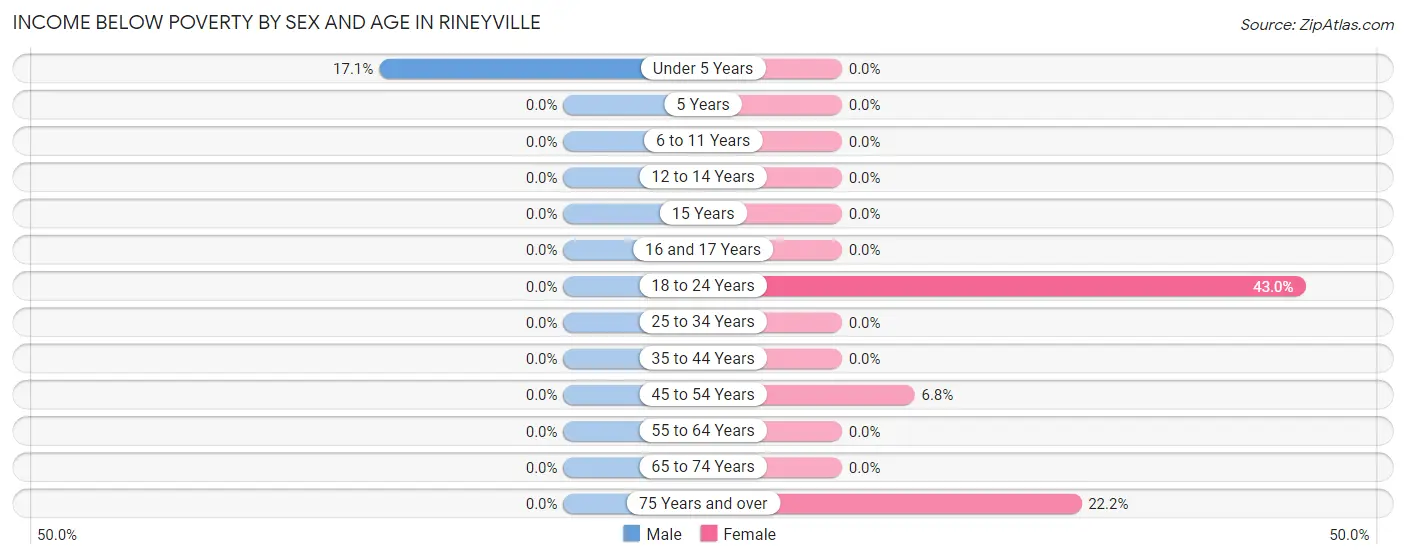
Income Below Poverty by Sex and Age in Rineyville
With 2.2% poverty level for males and 7.0% for females among the residents of Rineyville, under 5 year old males and 18 to 24 year old females are the most vulnerable to poverty, with 33 males (17.1%) and 74 females (43.0%) in their respective age groups living below the poverty level.
| Age Bracket | Male | Female |
| Under 5 Years | 33 (17.1%) | 0 (0.0%) |
| 5 Years | 0 (0.0%) | 0 (0.0%) |
| 6 to 11 Years | 0 (0.0%) | 0 (0.0%) |
| 12 to 14 Years | 0 (0.0%) | 0 (0.0%) |
| 15 Years | 0 (0.0%) | 0 (0.0%) |
| 16 and 17 Years | 0 (0.0%) | 0 (0.0%) |
| 18 to 24 Years | 0 (0.0%) | 74 (43.0%) |
| 25 to 34 Years | 0 (0.0%) | 0 (0.0%) |
| 35 to 44 Years | 0 (0.0%) | 0 (0.0%) |
| 45 to 54 Years | 0 (0.0%) | 11 (6.8%) |
| 55 to 64 Years | 0 (0.0%) | 0 (0.0%) |
| 65 to 74 Years | 0 (0.0%) | 0 (0.0%) |
| 75 Years and over | 0 (0.0%) | 10 (22.2%) |
| Total | 33 (2.2%) | 95 (7.0%) |
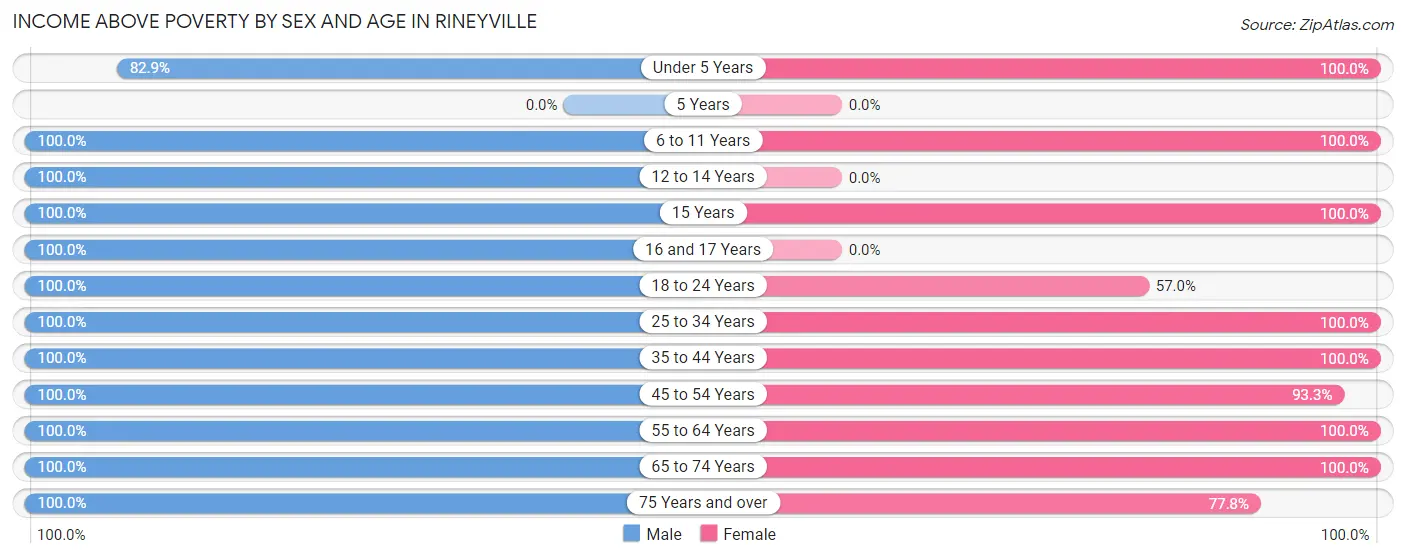
Income Above Poverty by Sex and Age in Rineyville
According to the poverty statistics in Rineyville, males aged 6 to 11 years and females aged under 5 years are the age groups that are most secure financially, with 100.0% of males and 100.0% of females in these age groups living above the poverty line.
| Age Bracket | Male | Female |
| Under 5 Years | 160 (82.9%) | 93 (100.0%) |
| 5 Years | 0 (0.0%) | 0 (0.0%) |
| 6 to 11 Years | 158 (100.0%) | 269 (100.0%) |
| 12 to 14 Years | 45 (100.0%) | 0 (0.0%) |
| 15 Years | 120 (100.0%) | 15 (100.0%) |
| 16 and 17 Years | 92 (100.0%) | 0 (0.0%) |
| 18 to 24 Years | 93 (100.0%) | 98 (57.0%) |
| 25 to 34 Years | 200 (100.0%) | 114 (100.0%) |
| 35 to 44 Years | 123 (100.0%) | 233 (100.0%) |
| 45 to 54 Years | 167 (100.0%) | 152 (93.2%) |
| 55 to 64 Years | 228 (100.0%) | 115 (100.0%) |
| 65 to 74 Years | 56 (100.0%) | 141 (100.0%) |
| 75 Years and over | 36 (100.0%) | 35 (77.8%) |
| Total | 1,478 (97.8%) | 1,265 (93.0%) |
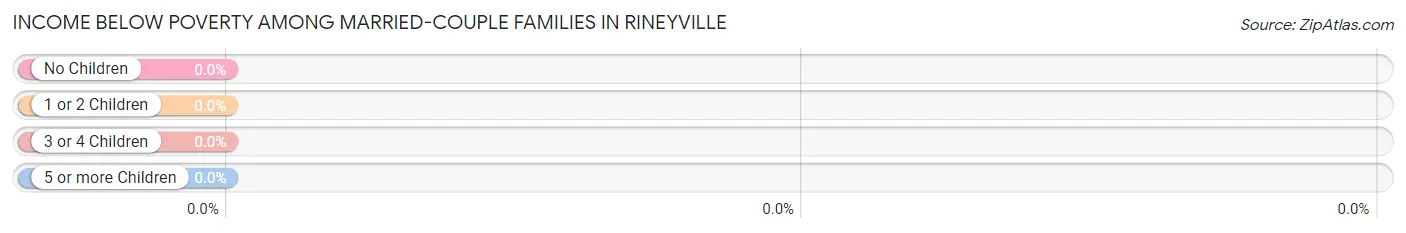
Income Below Poverty Among Married-Couple Families in Rineyville
| Children | Above Poverty | Below Poverty |
| No Children | 266 (100.0%) | 0 (0.0%) |
| 1 or 2 Children | 212 (100.0%) | 0 (0.0%) |
| 3 or 4 Children | 175 (100.0%) | 0 (0.0%) |
| 5 or more Children | 0 (0.0%) | 0 (0.0%) |
| Total | 653 (100.0%) | 0 (0.0%) |
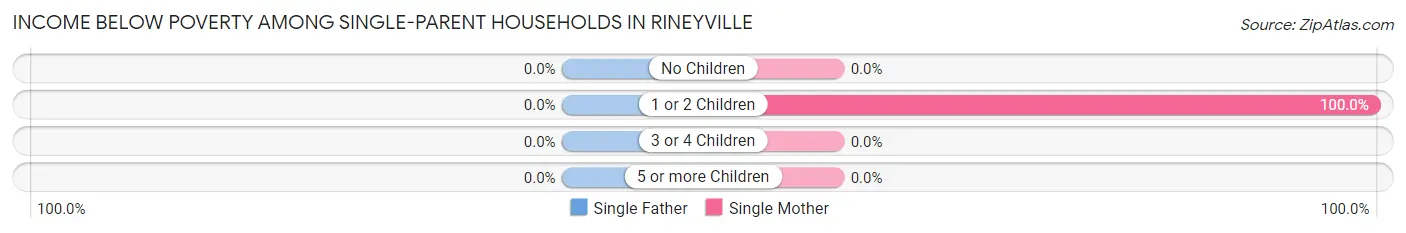
Income Below Poverty Among Single-Parent Households in Rineyville
| Children | Single Father | Single Mother |
| No Children | 0 (0.0%) | 0 (0.0%) |
| 1 or 2 Children | 0 (0.0%) | 26 (100.0%) |
| 3 or 4 Children | 0 (0.0%) | 0 (0.0%) |
| 5 or more Children | 0 (0.0%) | 0 (0.0%) |
| Total | 0 (0.0%) | 26 (66.7%) |
Income Below Poverty Among Married-Couple vs Single-Parent Households in Rineyville
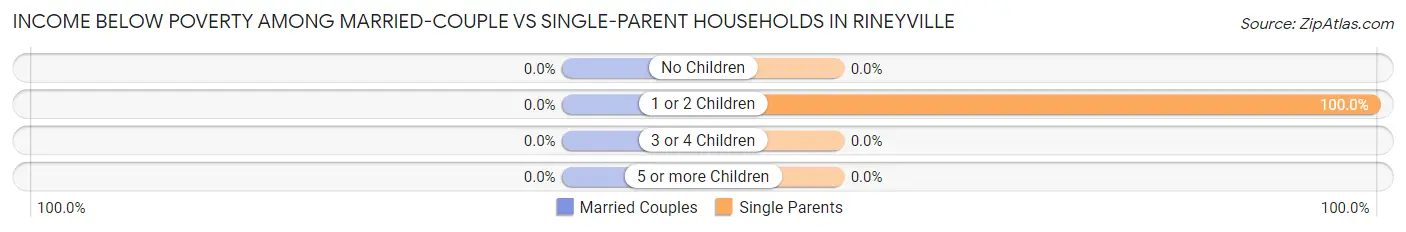
| Children | Married-Couple Families | Single-Parent Households |
| No Children | 0 (0.0%) | 0 (0.0%) |
| 1 or 2 Children | 0 (0.0%) | 26 (100.0%) |
| 3 or 4 Children | 0 (0.0%) | 0 (0.0%) |
| 5 or more Children | 0 (0.0%) | 0 (0.0%) |
| Total | 0 (0.0%) | 26 (66.7%) |
Employment Characteristics in Rineyville
Employment by Class of Employer in Rineyville
Among the 1,216 employed individuals in Rineyville, private company employees (945 | 77.7%), federal government employees (139 | 11.4%), and local government employees (85 | 7.0%) make up the most common classes of employment.
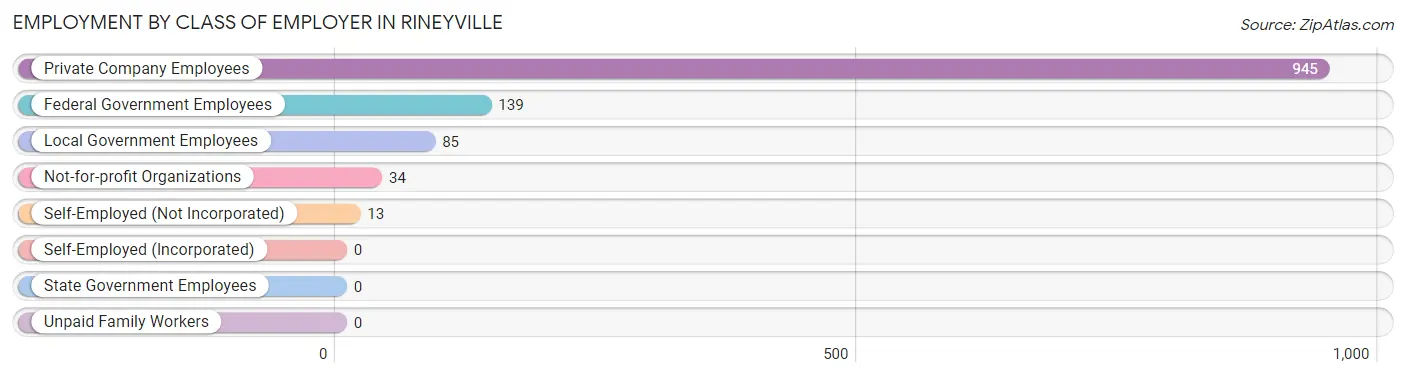
| Employer Class | # Employees | % Employees |
| Private Company Employees | 945 | 77.7% |
| Self-Employed (Incorporated) | 0 | 0.0% |
| Self-Employed (Not Incorporated) | 13 | 1.1% |
| Not-for-profit Organizations | 34 | 2.8% |
| Local Government Employees | 85 | 7.0% |
| State Government Employees | 0 | 0.0% |
| Federal Government Employees | 139 | 11.4% |
| Unpaid Family Workers | 0 | 0.0% |
| Total | 1,216 | 100.0% |
Employment Status by Age in Rineyville
According to the labor force statistics for Rineyville, out of the total population over 16 years of age (1,978), 67.7% or 1,339 individuals are in the labor force, with 7.4% or 99 of them unemployed. The age group with the highest labor force participation rate is 25 to 29 years, with 100.0% or 138 individuals in the labor force. Within the labor force, the 55 to 59 years age range has the highest percentage of unemployed individuals, with 28.9% or 37 of them being unemployed.
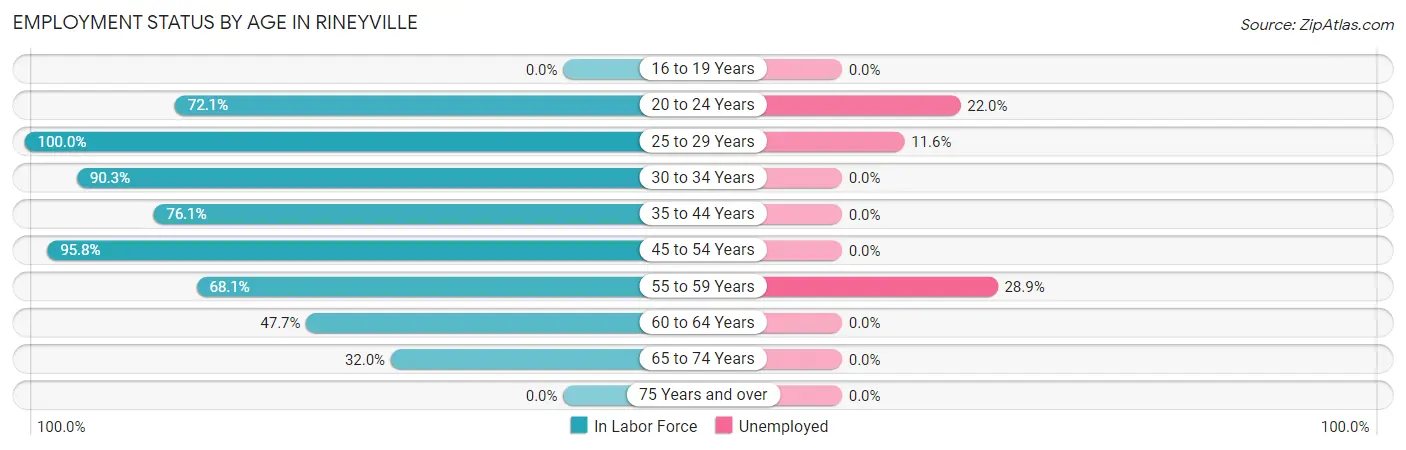
| Age Bracket | In Labor Force | Unemployed |
| 16 to 19 Years | 0 (0.0%) | 0 (0.0%) |
| 20 to 24 Years | 191 (72.1%) | 42 (22.0%) |
| 25 to 29 Years | 138 (100.0%) | 16 (11.6%) |
| 30 to 34 Years | 159 (90.3%) | 0 (0.0%) |
| 35 to 44 Years | 271 (76.1%) | 0 (0.0%) |
| 45 to 54 Years | 316 (95.8%) | 0 (0.0%) |
| 55 to 59 Years | 128 (68.1%) | 37 (28.9%) |
| 60 to 64 Years | 74 (47.7%) | 0 (0.0%) |
| 65 to 74 Years | 63 (32.0%) | 0 (0.0%) |
| 75 Years and over | 0 (0.0%) | 0 (0.0%) |
| Total | 1,339 (67.7%) | 99 (7.4%) |
Employment Status by Educational Attainment in Rineyville
According to labor force statistics for Rineyville, 80.9% of individuals (1,086) out of the total population between 25 and 64 years of age (1,343) are in the labor force, with 5.2% or 56 of them being unemployed. The group with the highest labor force participation rate are those with the educational attainment of less than high school, with 100.0% or 69 individuals in the labor force. Within the labor force, individuals with high school diploma education have the highest percentage of unemployment, with 13.8% or 53 of them being unemployed.
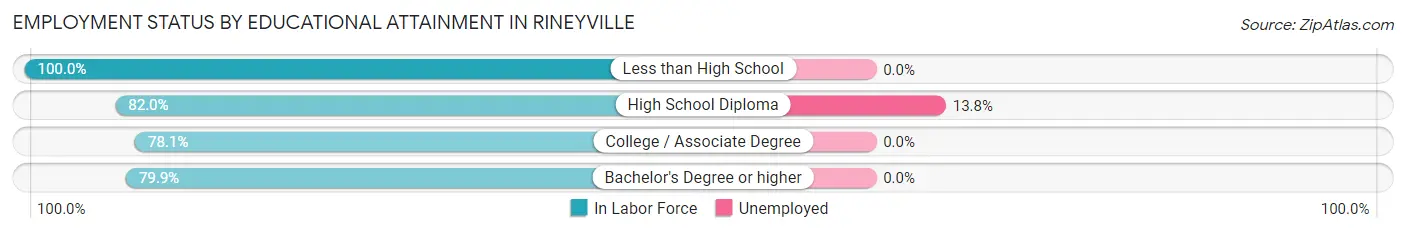
| Educational Attainment | In Labor Force | Unemployed |
| Less than High School | 69 (100.0%) | 0 (0.0%) |
| High School Diploma | 383 (82.0%) | 64 (13.8%) |
| College / Associate Degree | 463 (78.1%) | 0 (0.0%) |
| Bachelor's Degree or higher | 171 (79.9%) | 0 (0.0%) |
| Total | 1,086 (80.9%) | 70 (5.2%) |
Employment Occupations by Sex in Rineyville
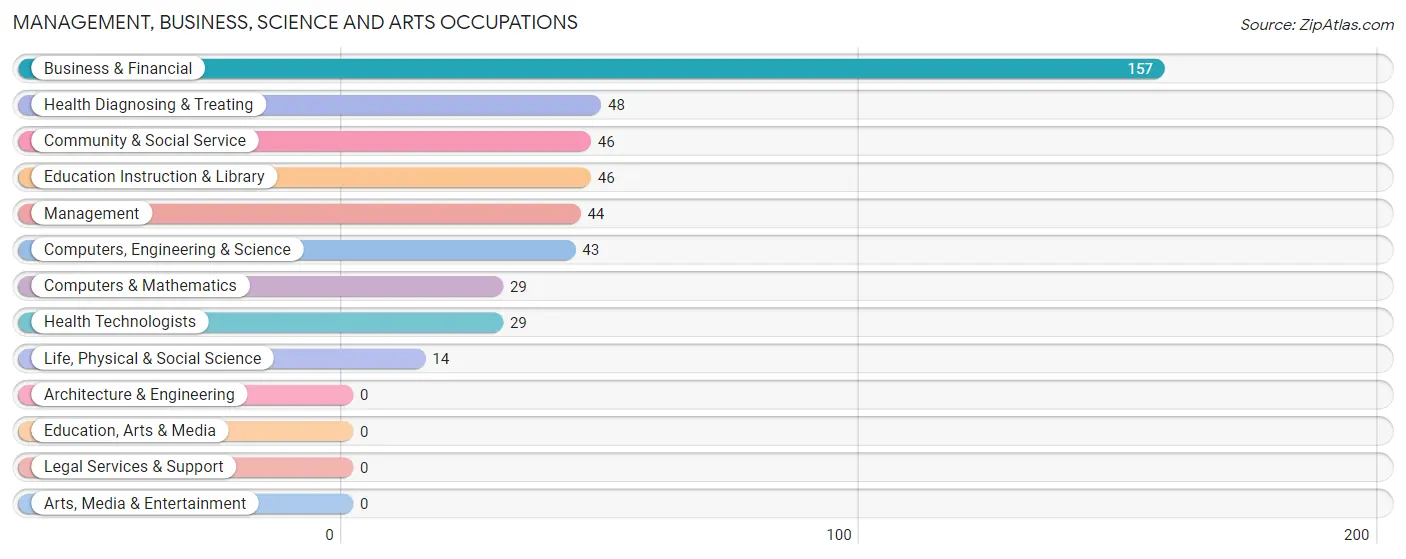
Management, Business, Science and Arts Occupations
The most common Management, Business, Science and Arts occupations in Rineyville are Business & Financial (157 | 13.3%), Health Diagnosing & Treating (48 | 4.1%), Community & Social Service (46 | 3.9%), Education Instruction & Library (46 | 3.9%), and Management (44 | 3.7%).
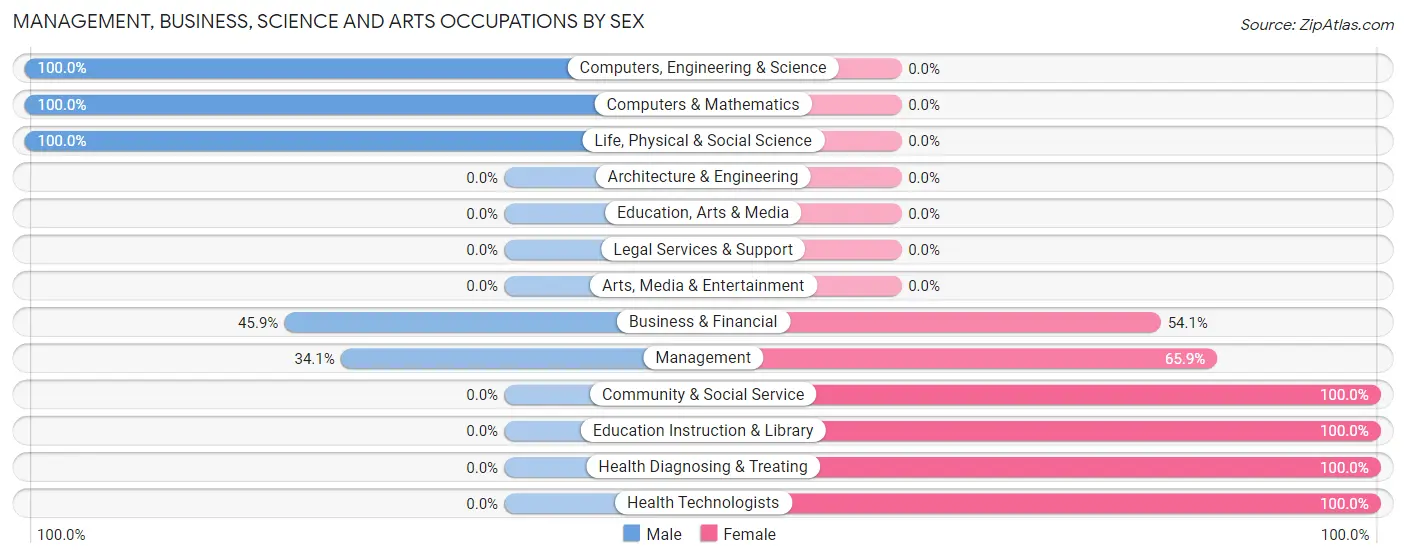
Management, Business, Science and Arts Occupations by Sex
Within the Management, Business, Science and Arts occupations in Rineyville, the most male-oriented occupations are Computers, Engineering & Science (100.0%), Computers & Mathematics (100.0%), and Life, Physical & Social Science (100.0%), while the most female-oriented occupations are Community & Social Service (100.0%), Education Instruction & Library (100.0%), and Health Diagnosing & Treating (100.0%).
| Occupation | Male | Female |
| Management | 15 (34.1%) | 29 (65.9%) |
| Business & Financial | 72 (45.9%) | 85 (54.1%) |
| Computers, Engineering & Science | 43 (100.0%) | 0 (0.0%) |
| Computers & Mathematics | 29 (100.0%) | 0 (0.0%) |
| Architecture & Engineering | 0 (0.0%) | 0 (0.0%) |
| Life, Physical & Social Science | 14 (100.0%) | 0 (0.0%) |
| Community & Social Service | 0 (0.0%) | 46 (100.0%) |
| Education, Arts & Media | 0 (0.0%) | 0 (0.0%) |
| Legal Services & Support | 0 (0.0%) | 0 (0.0%) |
| Education Instruction & Library | 0 (0.0%) | 46 (100.0%) |
| Arts, Media & Entertainment | 0 (0.0%) | 0 (0.0%) |
| Health Diagnosing & Treating | 0 (0.0%) | 48 (100.0%) |
| Health Technologists | 0 (0.0%) | 29 (100.0%) |
| Total (Category) | 130 (38.5%) | 208 (61.5%) |
| Total (Overall) | 612 (51.8%) | 569 (48.2%) |
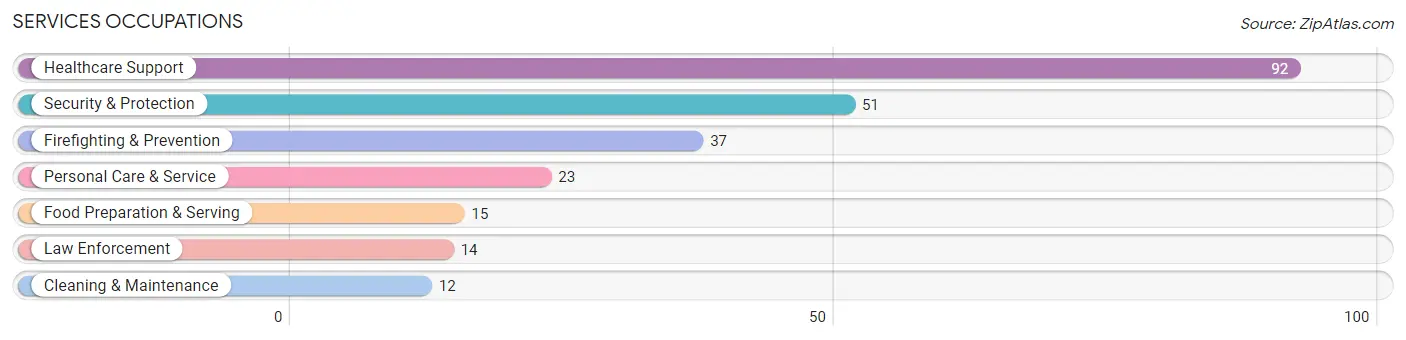
Services Occupations
The most common Services occupations in Rineyville are Healthcare Support (92 | 7.8%), Security & Protection (51 | 4.3%), Firefighting & Prevention (37 | 3.1%), Personal Care & Service (23 | 1.9%), and Food Preparation & Serving (15 | 1.3%).
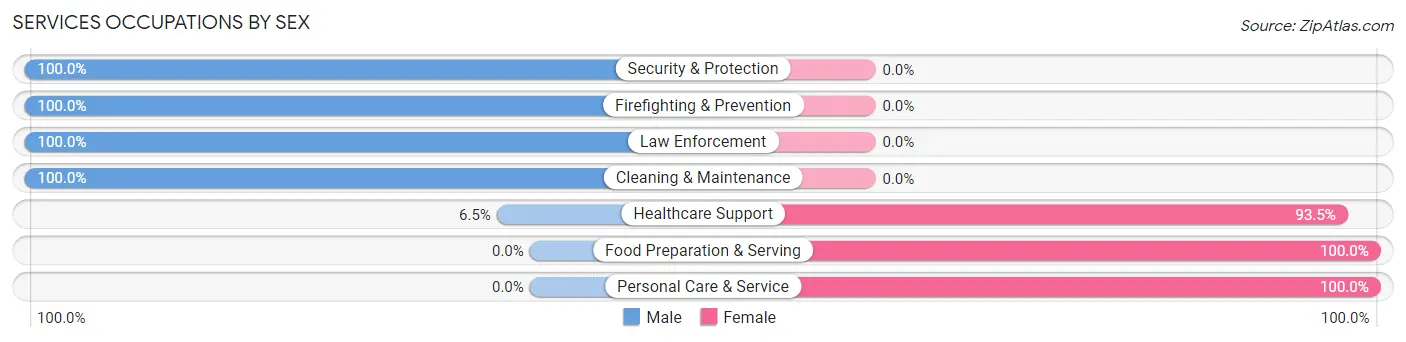
Services Occupations by Sex
Within the Services occupations in Rineyville, the most male-oriented occupations are Security & Protection (100.0%), Firefighting & Prevention (100.0%), and Law Enforcement (100.0%), while the most female-oriented occupations are Food Preparation & Serving (100.0%), Personal Care & Service (100.0%), and Healthcare Support (93.5%).
| Occupation | Male | Female |
| Healthcare Support | 6 (6.5%) | 86 (93.5%) |
| Security & Protection | 51 (100.0%) | 0 (0.0%) |
| Firefighting & Prevention | 37 (100.0%) | 0 (0.0%) |
| Law Enforcement | 14 (100.0%) | 0 (0.0%) |
| Food Preparation & Serving | 0 (0.0%) | 15 (100.0%) |
| Cleaning & Maintenance | 12 (100.0%) | 0 (0.0%) |
| Personal Care & Service | 0 (0.0%) | 23 (100.0%) |
| Total (Category) | 69 (35.7%) | 124 (64.2%) |
| Total (Overall) | 612 (51.8%) | 569 (48.2%) |
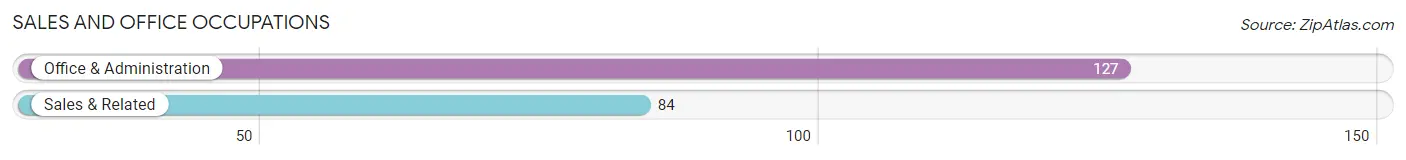
Sales and Office Occupations
The most common Sales and Office occupations in Rineyville are Office & Administration (127 | 10.7%), and Sales & Related (84 | 7.1%).
Sales and Office Occupations by Sex
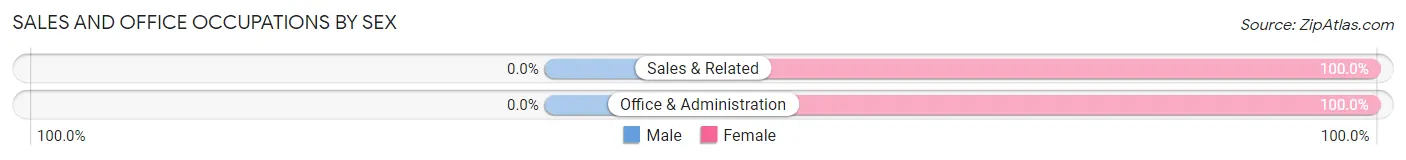
| Occupation | Male | Female |
| Sales & Related | 0 (0.0%) | 84 (100.0%) |
| Office & Administration | 0 (0.0%) | 127 (100.0%) |
| Total (Category) | 0 (0.0%) | 211 (100.0%) |
| Total (Overall) | 612 (51.8%) | 569 (48.2%) |
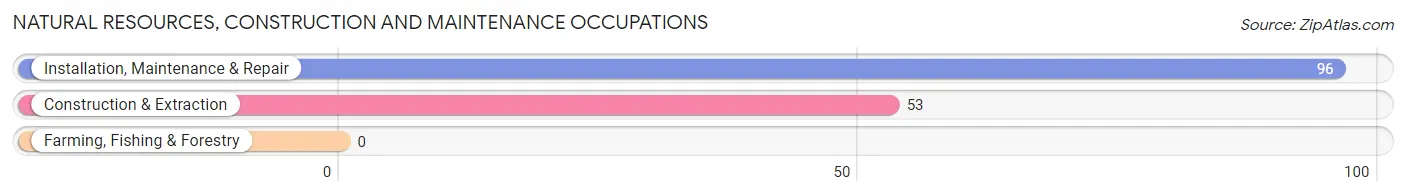
Natural Resources, Construction and Maintenance Occupations
The most common Natural Resources, Construction and Maintenance occupations in Rineyville are Installation, Maintenance & Repair (96 | 8.1%), and Construction & Extraction (53 | 4.5%).
Natural Resources, Construction and Maintenance Occupations by Sex
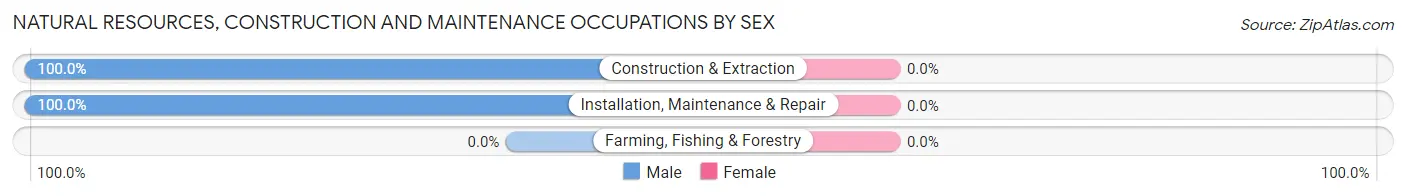
| Occupation | Male | Female |
| Farming, Fishing & Forestry | 0 (0.0%) | 0 (0.0%) |
| Construction & Extraction | 53 (100.0%) | 0 (0.0%) |
| Installation, Maintenance & Repair | 96 (100.0%) | 0 (0.0%) |
| Total (Category) | 149 (100.0%) | 0 (0.0%) |
| Total (Overall) | 612 (51.8%) | 569 (48.2%) |
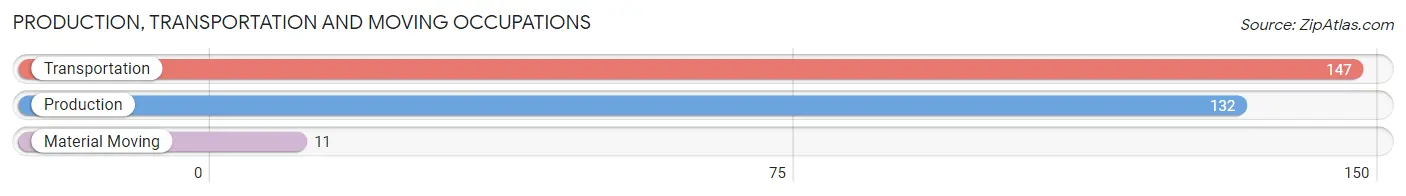
Production, Transportation and Moving Occupations
The most common Production, Transportation and Moving occupations in Rineyville are Transportation (147 | 12.4%), Production (132 | 11.2%), and Material Moving (11 | 0.9%).
Production, Transportation and Moving Occupations by Sex
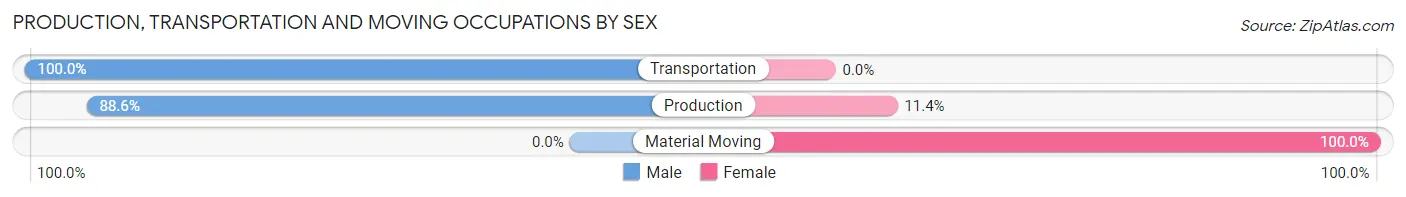
| Occupation | Male | Female |
| Production | 117 (88.6%) | 15 (11.4%) |
| Transportation | 147 (100.0%) | 0 (0.0%) |
| Material Moving | 0 (0.0%) | 11 (100.0%) |
| Total (Category) | 264 (91.0%) | 26 (9.0%) |
| Total (Overall) | 612 (51.8%) | 569 (48.2%) |
Employment Industries by Sex in Rineyville
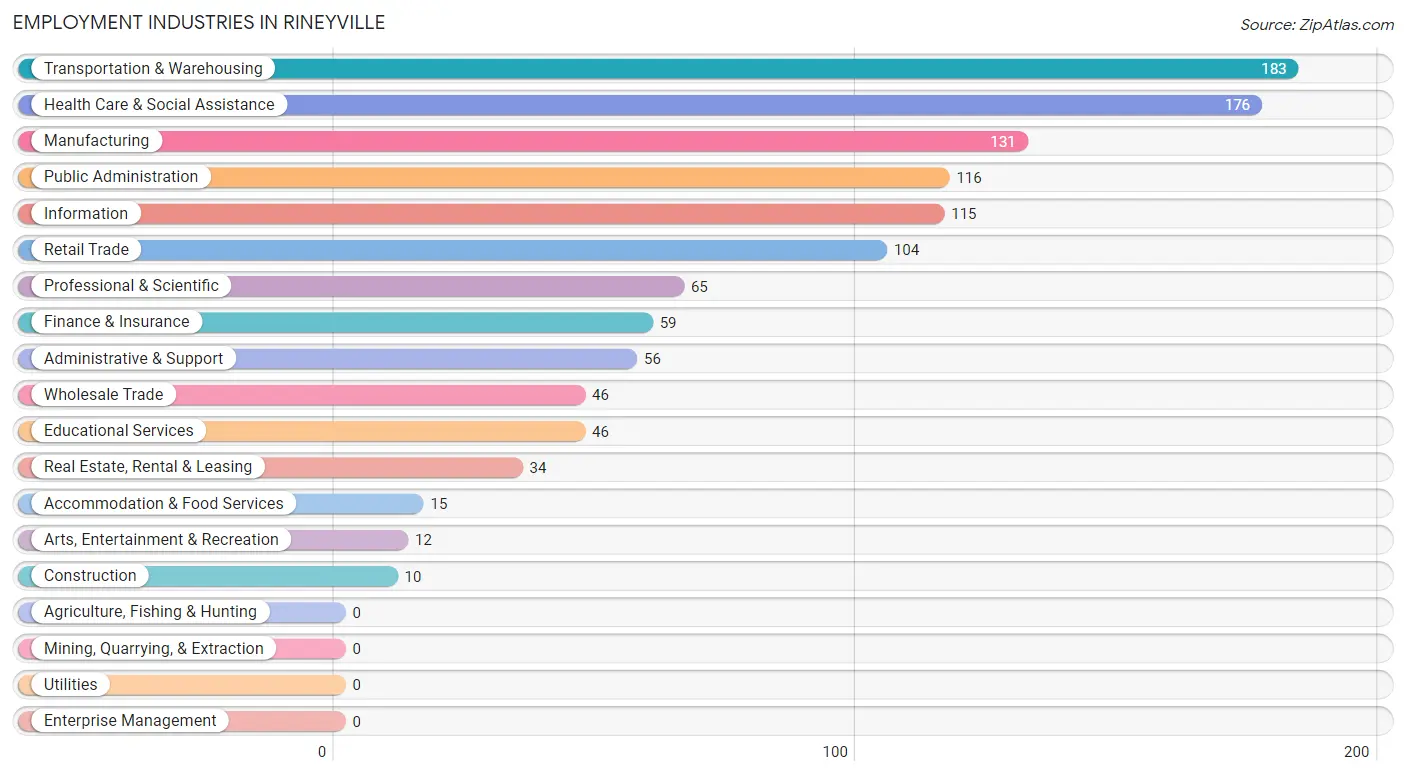
Employment Industries in Rineyville
The major employment industries in Rineyville include Transportation & Warehousing (183 | 15.5%), Health Care & Social Assistance (176 | 14.9%), Manufacturing (131 | 11.1%), Public Administration (116 | 9.8%), and Information (115 | 9.7%).
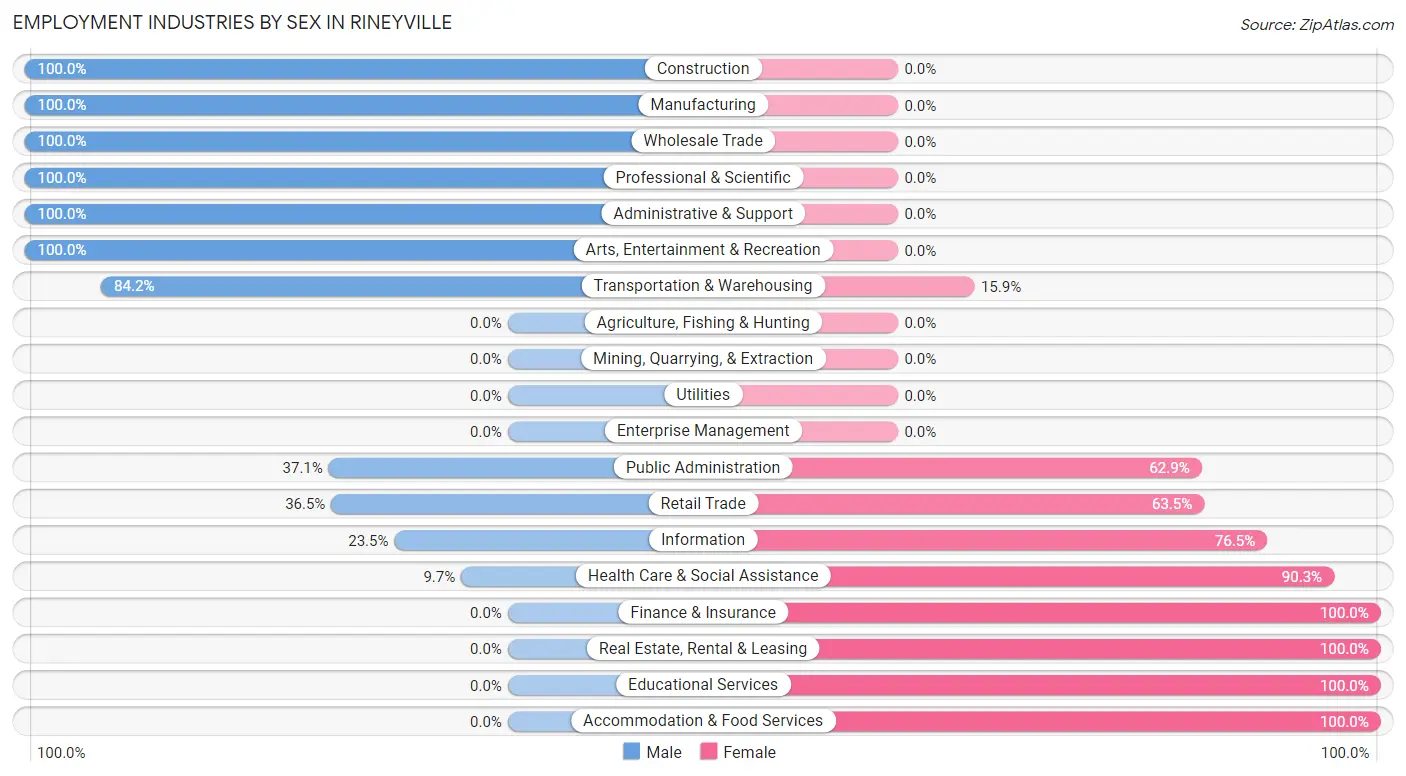
Employment Industries by Sex in Rineyville
The Rineyville industries that see more men than women are Construction (100.0%), Manufacturing (100.0%), and Wholesale Trade (100.0%), whereas the industries that tend to have a higher number of women are Finance & Insurance (100.0%), Real Estate, Rental & Leasing (100.0%), and Educational Services (100.0%).
| Industry | Male | Female |
| Agriculture, Fishing & Hunting | 0 (0.0%) | 0 (0.0%) |
| Mining, Quarrying, & Extraction | 0 (0.0%) | 0 (0.0%) |
| Construction | 10 (100.0%) | 0 (0.0%) |
| Manufacturing | 131 (100.0%) | 0 (0.0%) |
| Wholesale Trade | 46 (100.0%) | 0 (0.0%) |
| Retail Trade | 38 (36.5%) | 66 (63.5%) |
| Transportation & Warehousing | 154 (84.2%) | 29 (15.9%) |
| Utilities | 0 (0.0%) | 0 (0.0%) |
| Information | 27 (23.5%) | 88 (76.5%) |
| Finance & Insurance | 0 (0.0%) | 59 (100.0%) |
| Real Estate, Rental & Leasing | 0 (0.0%) | 34 (100.0%) |
| Professional & Scientific | 65 (100.0%) | 0 (0.0%) |
| Enterprise Management | 0 (0.0%) | 0 (0.0%) |
| Administrative & Support | 56 (100.0%) | 0 (0.0%) |
| Educational Services | 0 (0.0%) | 46 (100.0%) |
| Health Care & Social Assistance | 17 (9.7%) | 159 (90.3%) |
| Arts, Entertainment & Recreation | 12 (100.0%) | 0 (0.0%) |
| Accommodation & Food Services | 0 (0.0%) | 15 (100.0%) |
| Public Administration | 43 (37.1%) | 73 (62.9%) |
| Total | 612 (51.8%) | 569 (48.2%) |
Education in Rineyville
School Enrollment in Rineyville
The most common levels of schooling among the 874 students in Rineyville are elementary school (214 | 24.5%), high school (212 | 24.3%), and middle school (159 | 18.2%).
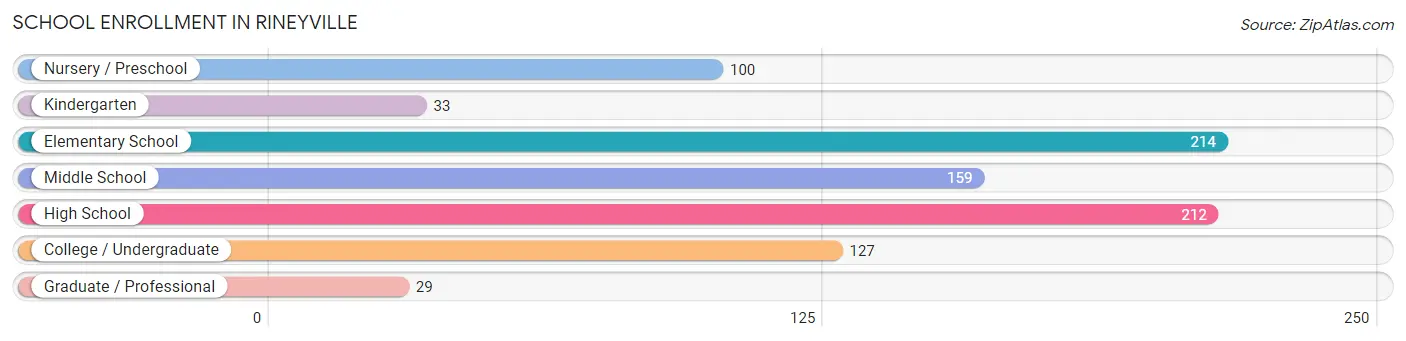
| School Level | # Students | % Students |
| Nursery / Preschool | 100 | 11.4% |
| Kindergarten | 33 | 3.8% |
| Elementary School | 214 | 24.5% |
| Middle School | 159 | 18.2% |
| High School | 212 | 24.3% |
| College / Undergraduate | 127 | 14.5% |
| Graduate / Professional | 29 | 3.3% |
| Total | 874 | 100.0% |
School Enrollment by Age by Funding Source in Rineyville
Out of a total of 874 students who are enrolled in schools in Rineyville, 117 (13.4%) attend a private institution, while the remaining 757 (86.6%) are enrolled in public schools. The age group of 10 to 14 year olds has the highest likelihood of being enrolled in private schools, with 50 (34.7% in the age bracket) enrolled. Conversely, the age group of 3 to 4 year olds has the lowest likelihood of being enrolled in a private school, with 100 (100.0% in the age bracket) attending a public institution.
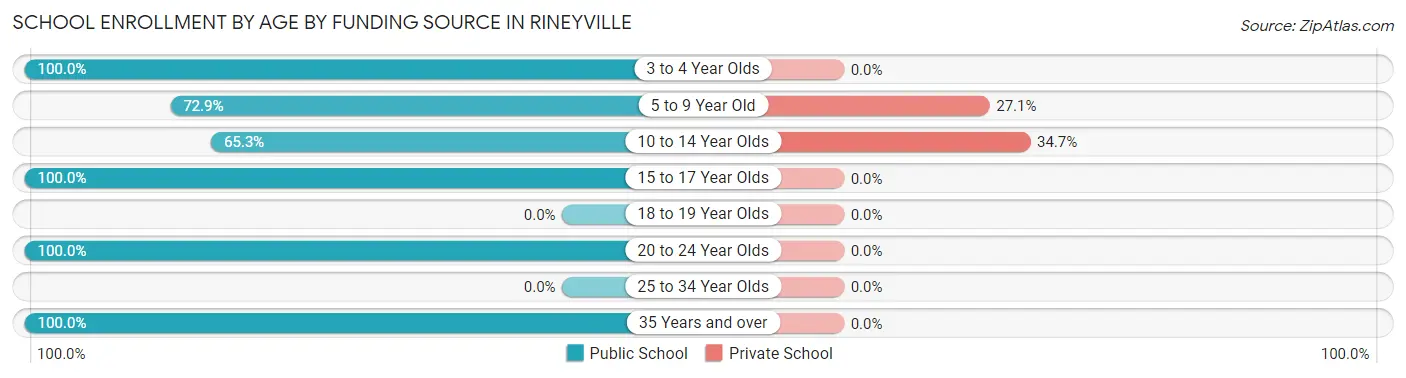
| Age Bracket | Public School | Private School |
| 3 to 4 Year Olds | 100 (100.0%) | 0 (0.0%) |
| 5 to 9 Year Old | 180 (72.9%) | 67 (27.1%) |
| 10 to 14 Year Olds | 94 (65.3%) | 50 (34.7%) |
| 15 to 17 Year Olds | 227 (100.0%) | 0 (0.0%) |
| 18 to 19 Year Olds | 0 (0.0%) | 0 (0.0%) |
| 20 to 24 Year Olds | 104 (100.0%) | 0 (0.0%) |
| 25 to 34 Year Olds | 0 (0.0%) | 0 (0.0%) |
| 35 Years and over | 52 (100.0%) | 0 (0.0%) |
| Total | 757 (86.6%) | 117 (13.4%) |
Educational Attainment by Field of Study in Rineyville
Business (88 | 28.6%), arts & humanities (64 | 20.8%), social sciences (43 | 14.0%), engineering (36 | 11.7%), and education (34 | 11.0%) are the most common fields of study among 308 individuals in Rineyville who have obtained a bachelor's degree or higher.
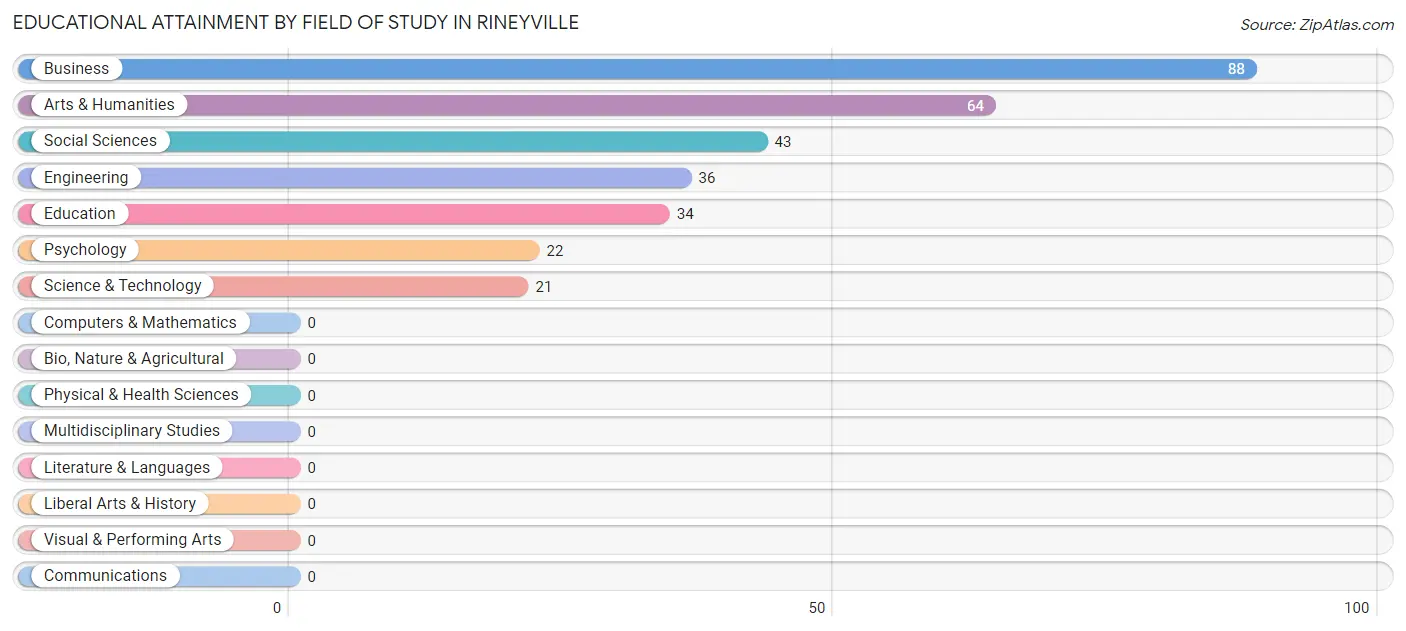
| Field of Study | # Graduates | % Graduates |
| Computers & Mathematics | 0 | 0.0% |
| Bio, Nature & Agricultural | 0 | 0.0% |
| Physical & Health Sciences | 0 | 0.0% |
| Psychology | 22 | 7.1% |
| Social Sciences | 43 | 14.0% |
| Engineering | 36 | 11.7% |
| Multidisciplinary Studies | 0 | 0.0% |
| Science & Technology | 21 | 6.8% |
| Business | 88 | 28.6% |
| Education | 34 | 11.0% |
| Literature & Languages | 0 | 0.0% |
| Liberal Arts & History | 0 | 0.0% |
| Visual & Performing Arts | 0 | 0.0% |
| Communications | 0 | 0.0% |
| Arts & Humanities | 64 | 20.8% |
| Total | 308 | 100.0% |
Transportation & Commute in Rineyville
Vehicle Availability by Sex in Rineyville
The most prevalent vehicle ownership categories in Rineyville are males with 2 vehicles (354, accounting for 54.2%) and females with 2 vehicles (337, making up 62.9%).
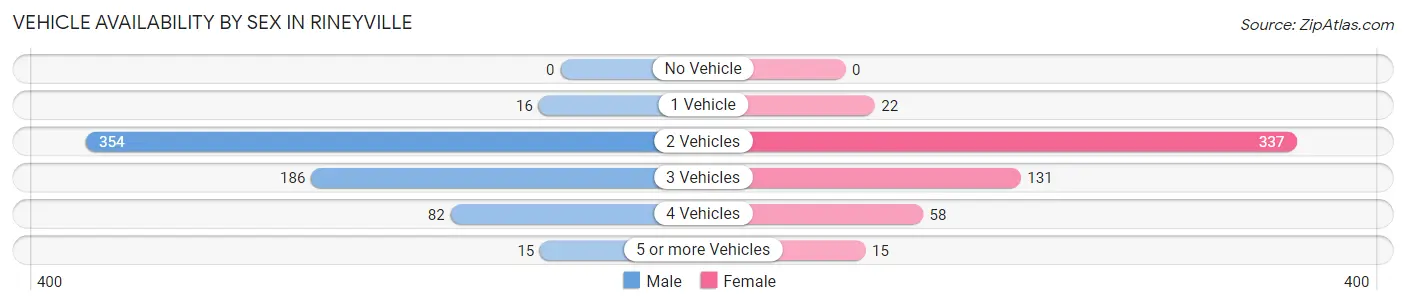
| Vehicles Available | Male | Female |
| No Vehicle | 0 (0.0%) | 0 (0.0%) |
| 1 Vehicle | 16 (2.5%) | 22 (3.9%) |
| 2 Vehicles | 354 (54.2%) | 337 (59.9%) |
| 3 Vehicles | 186 (28.5%) | 131 (23.3%) |
| 4 Vehicles | 82 (12.6%) | 58 (10.3%) |
| 5 or more Vehicles | 15 (2.3%) | 15 (2.7%) |
| Total | 653 (100.0%) | 563 (100.0%) |
Commute Time in Rineyville
The most frequently occuring commute durations in Rineyville are 20 to 24 minutes (223 commuters, 21.8%), 60 to 89 minutes (187 commuters, 18.3%), and 10 to 14 minutes (141 commuters, 13.8%).
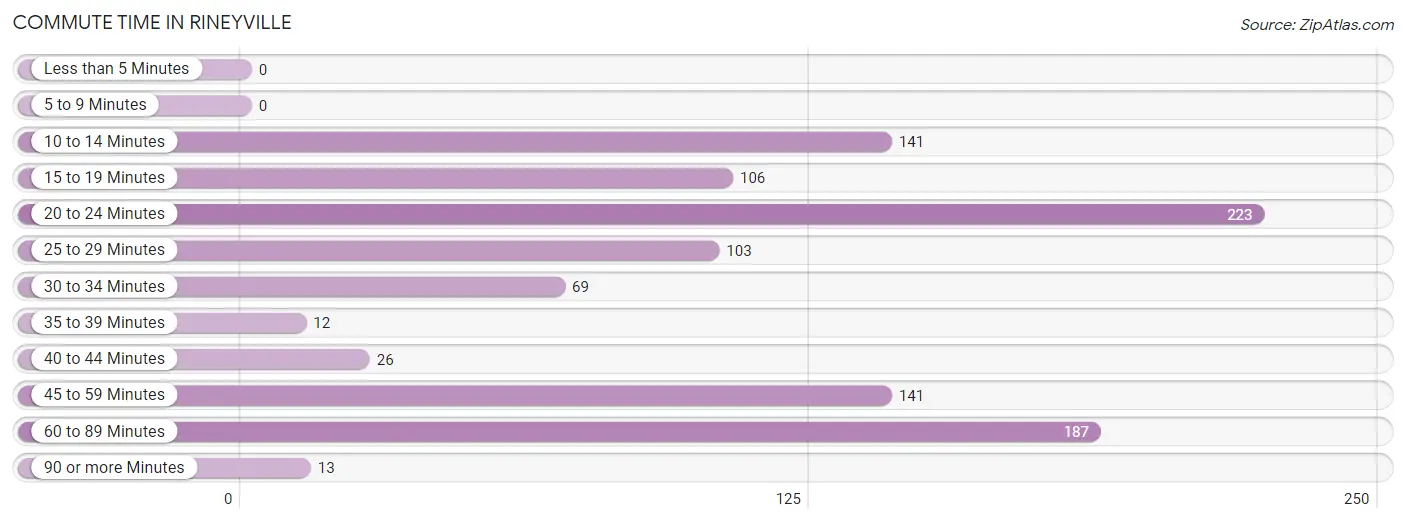
| Commute Time | # Commuters | % Commuters |
| Less than 5 Minutes | 0 | 0.0% |
| 5 to 9 Minutes | 0 | 0.0% |
| 10 to 14 Minutes | 141 | 13.8% |
| 15 to 19 Minutes | 106 | 10.4% |
| 20 to 24 Minutes | 223 | 21.8% |
| 25 to 29 Minutes | 103 | 10.1% |
| 30 to 34 Minutes | 69 | 6.8% |
| 35 to 39 Minutes | 12 | 1.2% |
| 40 to 44 Minutes | 26 | 2.5% |
| 45 to 59 Minutes | 141 | 13.8% |
| 60 to 89 Minutes | 187 | 18.3% |
| 90 or more Minutes | 13 | 1.3% |
Commute Time by Sex in Rineyville
The most common commute times in Rineyville are 60 to 89 minutes (187 commuters, 31.3%) for males and 15 to 19 minutes (94 commuters, 22.2%) for females.
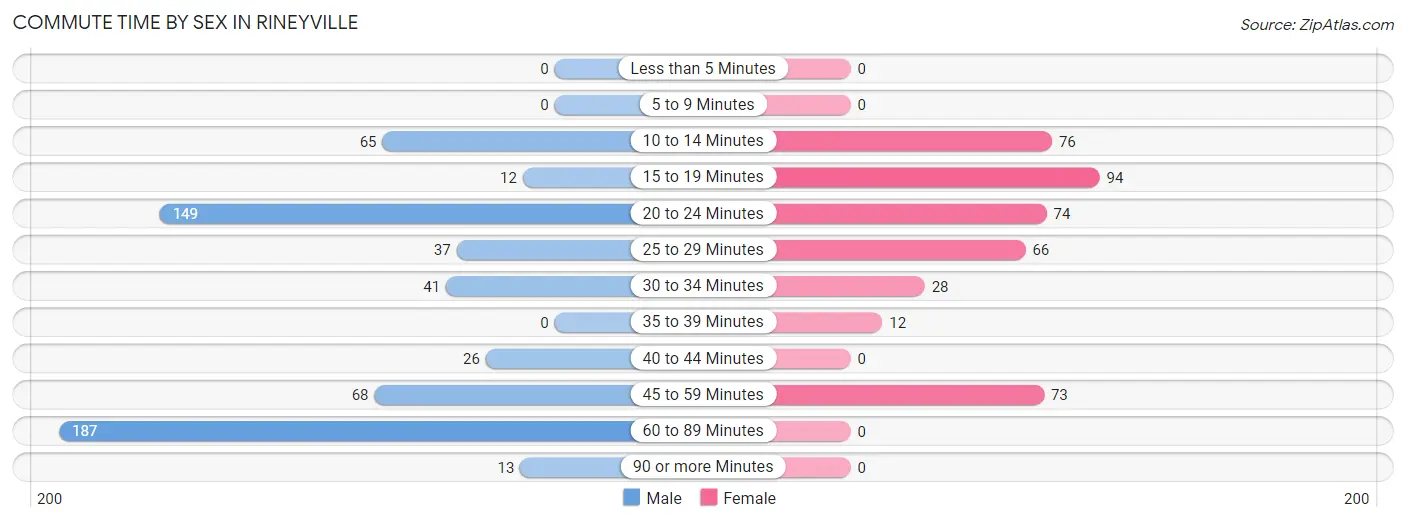
| Commute Time | Male | Female |
| Less than 5 Minutes | 0 (0.0%) | 0 (0.0%) |
| 5 to 9 Minutes | 0 (0.0%) | 0 (0.0%) |
| 10 to 14 Minutes | 65 (10.9%) | 76 (18.0%) |
| 15 to 19 Minutes | 12 (2.0%) | 94 (22.2%) |
| 20 to 24 Minutes | 149 (24.9%) | 74 (17.5%) |
| 25 to 29 Minutes | 37 (6.2%) | 66 (15.6%) |
| 30 to 34 Minutes | 41 (6.9%) | 28 (6.6%) |
| 35 to 39 Minutes | 0 (0.0%) | 12 (2.8%) |
| 40 to 44 Minutes | 26 (4.3%) | 0 (0.0%) |
| 45 to 59 Minutes | 68 (11.4%) | 73 (17.3%) |
| 60 to 89 Minutes | 187 (31.3%) | 0 (0.0%) |
| 90 or more Minutes | 13 (2.2%) | 0 (0.0%) |
Time of Departure to Work by Sex in Rineyville
The most frequent times of departure to work in Rineyville are 4:00 PM to 11:59 PM (153, 25.6%) for males and 7:00 AM to 7:29 AM (125, 29.5%) for females.
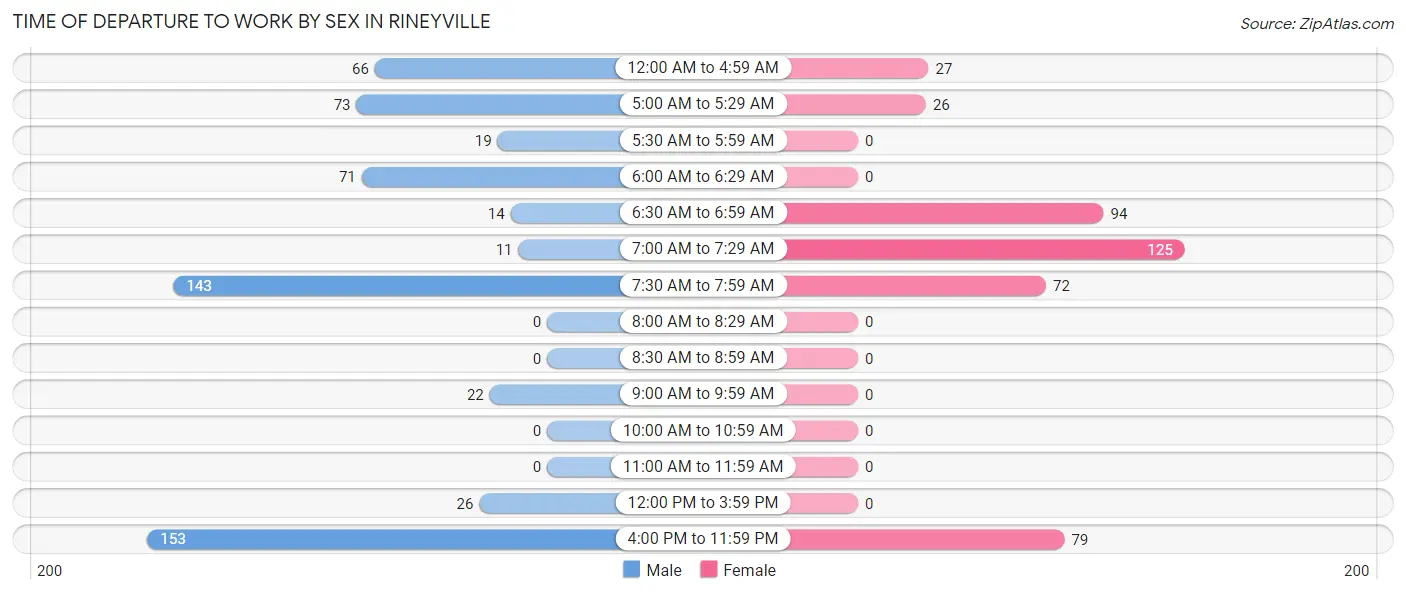
| Time of Departure | Male | Female |
| 12:00 AM to 4:59 AM | 66 (11.0%) | 27 (6.4%) |
| 5:00 AM to 5:29 AM | 73 (12.2%) | 26 (6.1%) |
| 5:30 AM to 5:59 AM | 19 (3.2%) | 0 (0.0%) |
| 6:00 AM to 6:29 AM | 71 (11.9%) | 0 (0.0%) |
| 6:30 AM to 6:59 AM | 14 (2.3%) | 94 (22.2%) |
| 7:00 AM to 7:29 AM | 11 (1.8%) | 125 (29.5%) |
| 7:30 AM to 7:59 AM | 143 (23.9%) | 72 (17.0%) |
| 8:00 AM to 8:29 AM | 0 (0.0%) | 0 (0.0%) |
| 8:30 AM to 8:59 AM | 0 (0.0%) | 0 (0.0%) |
| 9:00 AM to 9:59 AM | 22 (3.7%) | 0 (0.0%) |
| 10:00 AM to 10:59 AM | 0 (0.0%) | 0 (0.0%) |
| 11:00 AM to 11:59 AM | 0 (0.0%) | 0 (0.0%) |
| 12:00 PM to 3:59 PM | 26 (4.3%) | 0 (0.0%) |
| 4:00 PM to 11:59 PM | 153 (25.6%) | 79 (18.7%) |
| Total | 598 (100.0%) | 423 (100.0%) |
Housing Occupancy in Rineyville
Occupancy by Ownership in Rineyville
Of the total 870 dwellings in Rineyville, owner-occupied units account for 846 (97.2%), while renter-occupied units make up 24 (2.8%).
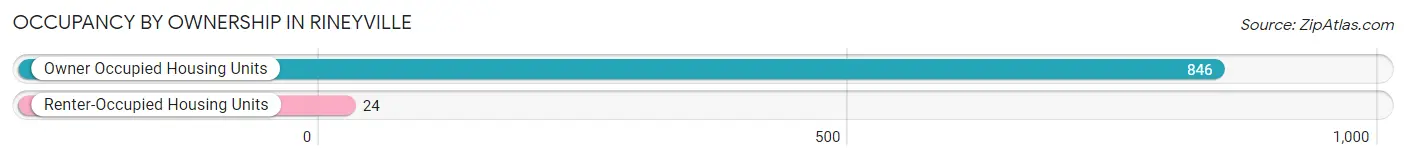
| Occupancy | # Housing Units | % Housing Units |
| Owner Occupied Housing Units | 846 | 97.2% |
| Renter-Occupied Housing Units | 24 | 2.8% |
| Total Occupied Housing Units | 870 | 100.0% |
Occupancy by Household Size in Rineyville
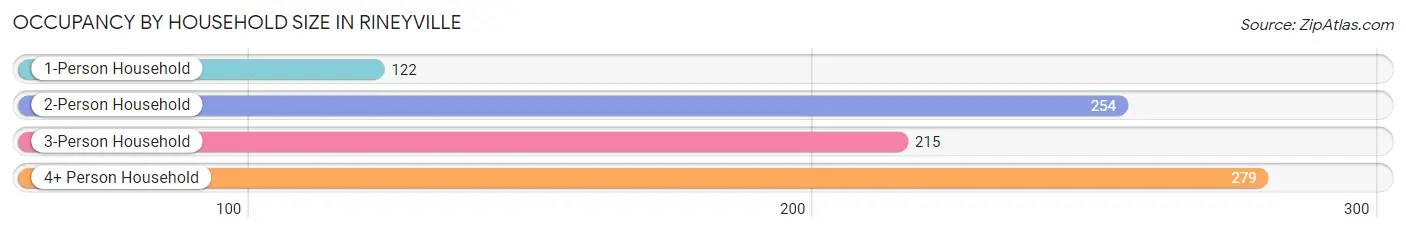
| Household Size | # Housing Units | % Housing Units |
| 1-Person Household | 122 | 14.0% |
| 2-Person Household | 254 | 29.2% |
| 3-Person Household | 215 | 24.7% |
| 4+ Person Household | 279 | 32.1% |
| Total Housing Units | 870 | 100.0% |
Occupancy by Ownership by Household Size in Rineyville
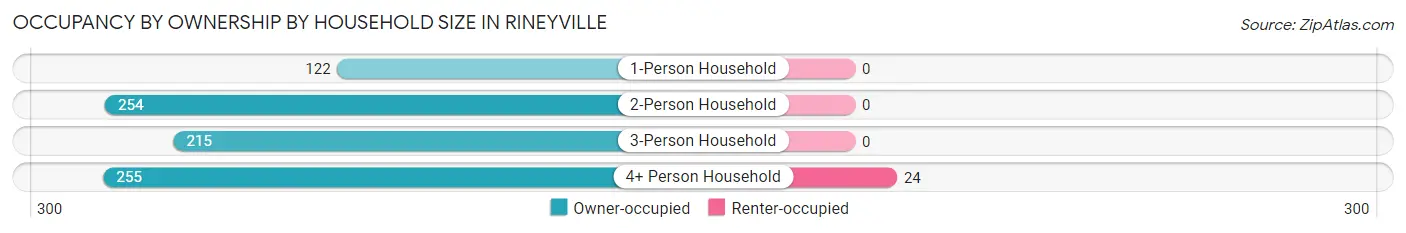
| Household Size | Owner-occupied | Renter-occupied |
| 1-Person Household | 122 (100.0%) | 0 (0.0%) |
| 2-Person Household | 254 (100.0%) | 0 (0.0%) |
| 3-Person Household | 215 (100.0%) | 0 (0.0%) |
| 4+ Person Household | 255 (91.4%) | 24 (8.6%) |
| Total Housing Units | 846 (97.2%) | 24 (2.8%) |
Occupancy by Educational Attainment in Rineyville
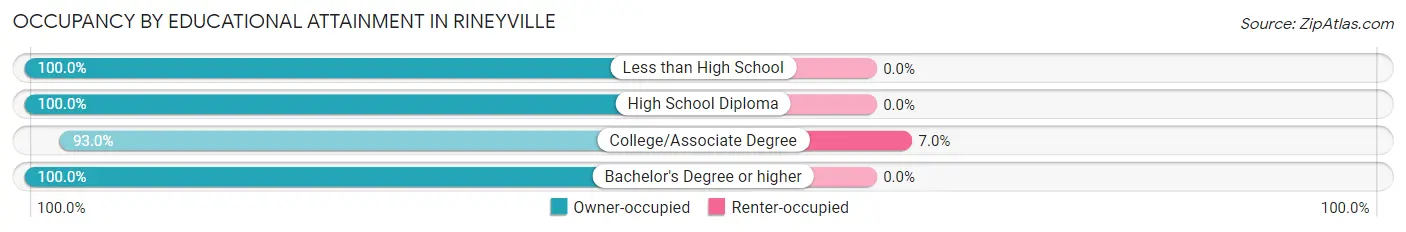
| Household Size | Owner-occupied | Renter-occupied |
| Less than High School | 69 (100.0%) | 0 (0.0%) |
| High School Diploma | 303 (100.0%) | 0 (0.0%) |
| College/Associate Degree | 318 (93.0%) | 24 (7.0%) |
| Bachelor's Degree or higher | 156 (100.0%) | 0 (0.0%) |
Occupancy by Age of Householder in Rineyville
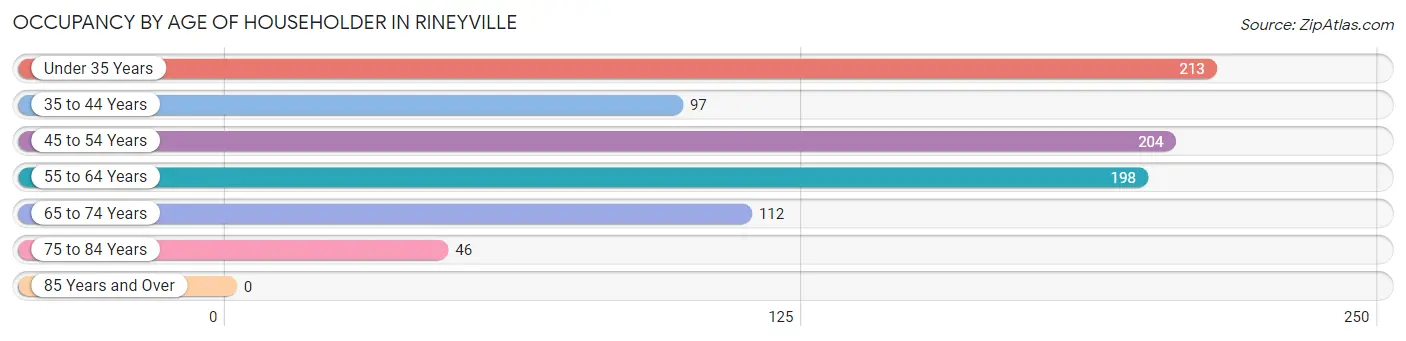
| Age Bracket | # Households | % Households |
| Under 35 Years | 213 | 24.5% |
| 35 to 44 Years | 97 | 11.2% |
| 45 to 54 Years | 204 | 23.4% |
| 55 to 64 Years | 198 | 22.8% |
| 65 to 74 Years | 112 | 12.9% |
| 75 to 84 Years | 46 | 5.3% |
| 85 Years and Over | 0 | 0.0% |
| Total | 870 | 100.0% |
Housing Finances in Rineyville
Median Income by Occupancy in Rineyville
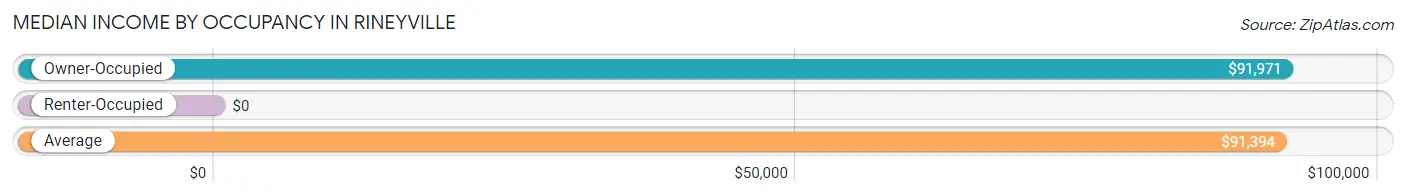
| Occupancy Type | # Households | Median Income |
| Owner-Occupied | 846 (97.2%) | $91,971 |
| Renter-Occupied | 24 (2.8%) | $0 |
| Average | 870 (100.0%) | $91,394 |
Occupancy by Householder Income Bracket in Rineyville
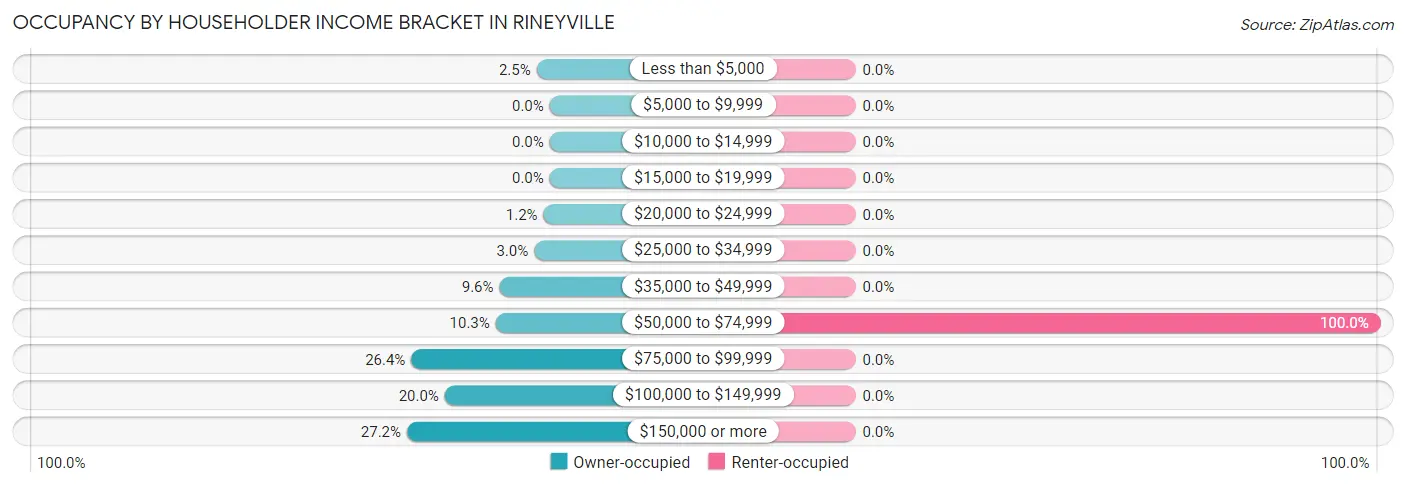
| Income Bracket | Owner-occupied | Renter-occupied |
| Less than $5,000 | 21 (2.5%) | 0 (0.0%) |
| $5,000 to $9,999 | 0 (0.0%) | 0 (0.0%) |
| $10,000 to $14,999 | 0 (0.0%) | 0 (0.0%) |
| $15,000 to $19,999 | 0 (0.0%) | 0 (0.0%) |
| $20,000 to $24,999 | 10 (1.2%) | 0 (0.0%) |
| $25,000 to $34,999 | 25 (3.0%) | 0 (0.0%) |
| $35,000 to $49,999 | 81 (9.6%) | 0 (0.0%) |
| $50,000 to $74,999 | 87 (10.3%) | 24 (100.0%) |
| $75,000 to $99,999 | 223 (26.4%) | 0 (0.0%) |
| $100,000 to $149,999 | 169 (20.0%) | 0 (0.0%) |
| $150,000 or more | 230 (27.2%) | 0 (0.0%) |
| Total | 846 (100.0%) | 24 (100.0%) |
Monthly Housing Cost Tiers in Rineyville
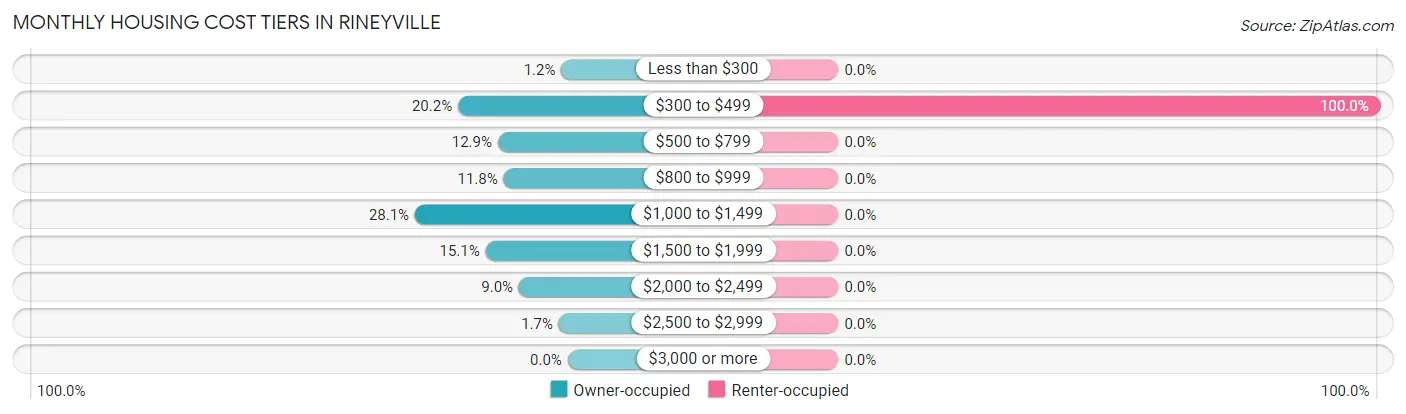
| Monthly Cost | Owner-occupied | Renter-occupied |
| Less than $300 | 10 (1.2%) | 0 (0.0%) |
| $300 to $499 | 171 (20.2%) | 24 (100.0%) |
| $500 to $799 | 109 (12.9%) | 0 (0.0%) |
| $800 to $999 | 100 (11.8%) | 0 (0.0%) |
| $1,000 to $1,499 | 238 (28.1%) | 0 (0.0%) |
| $1,500 to $1,999 | 128 (15.1%) | 0 (0.0%) |
| $2,000 to $2,499 | 76 (9.0%) | 0 (0.0%) |
| $2,500 to $2,999 | 14 (1.7%) | 0 (0.0%) |
| $3,000 or more | 0 (0.0%) | 0 (0.0%) |
| Total | 846 (100.0%) | 24 (100.0%) |
Physical Housing Characteristics in Rineyville
Housing Structures in Rineyville
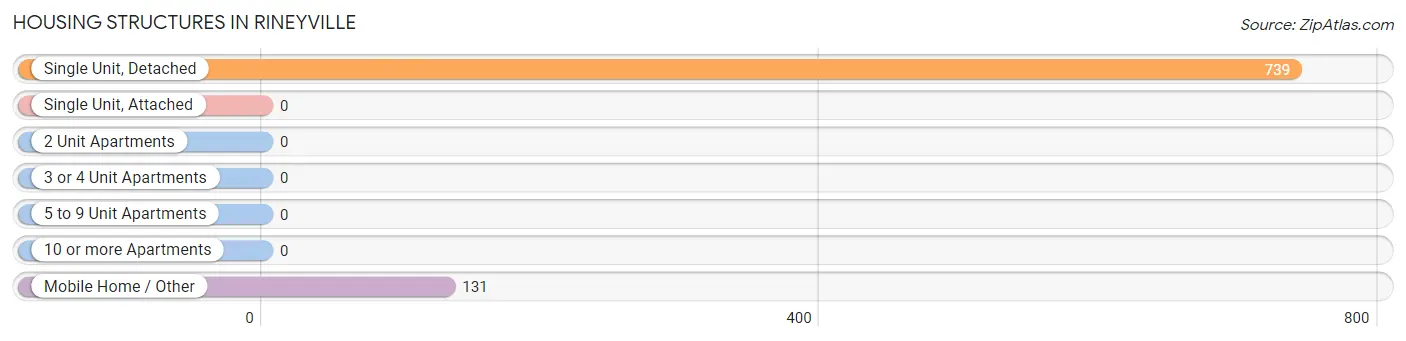
| Structure Type | # Housing Units | % Housing Units |
| Single Unit, Detached | 739 | 84.9% |
| Single Unit, Attached | 0 | 0.0% |
| 2 Unit Apartments | 0 | 0.0% |
| 3 or 4 Unit Apartments | 0 | 0.0% |
| 5 to 9 Unit Apartments | 0 | 0.0% |
| 10 or more Apartments | 0 | 0.0% |
| Mobile Home / Other | 131 | 15.1% |
| Total | 870 | 100.0% |
Housing Structures by Occupancy in Rineyville
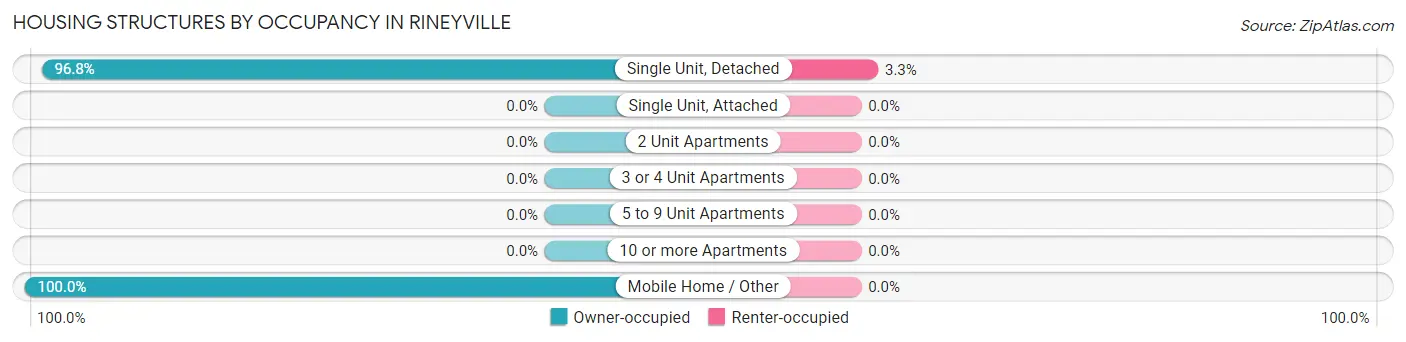
| Structure Type | Owner-occupied | Renter-occupied |
| Single Unit, Detached | 715 (96.8%) | 24 (3.3%) |
| Single Unit, Attached | 0 (0.0%) | 0 (0.0%) |
| 2 Unit Apartments | 0 (0.0%) | 0 (0.0%) |
| 3 or 4 Unit Apartments | 0 (0.0%) | 0 (0.0%) |
| 5 to 9 Unit Apartments | 0 (0.0%) | 0 (0.0%) |
| 10 or more Apartments | 0 (0.0%) | 0 (0.0%) |
| Mobile Home / Other | 131 (100.0%) | 0 (0.0%) |
| Total | 846 (97.2%) | 24 (2.8%) |
Housing Structures by Number of Rooms in Rineyville
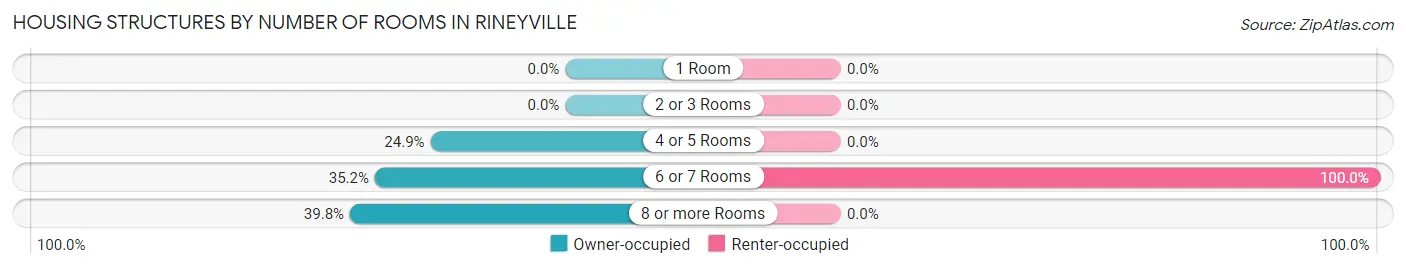
| Number of Rooms | Owner-occupied | Renter-occupied |
| 1 Room | 0 (0.0%) | 0 (0.0%) |
| 2 or 3 Rooms | 0 (0.0%) | 0 (0.0%) |
| 4 or 5 Rooms | 211 (24.9%) | 0 (0.0%) |
| 6 or 7 Rooms | 298 (35.2%) | 24 (100.0%) |
| 8 or more Rooms | 337 (39.8%) | 0 (0.0%) |
| Total | 846 (100.0%) | 24 (100.0%) |
Housing Structure by Heating Type in Rineyville
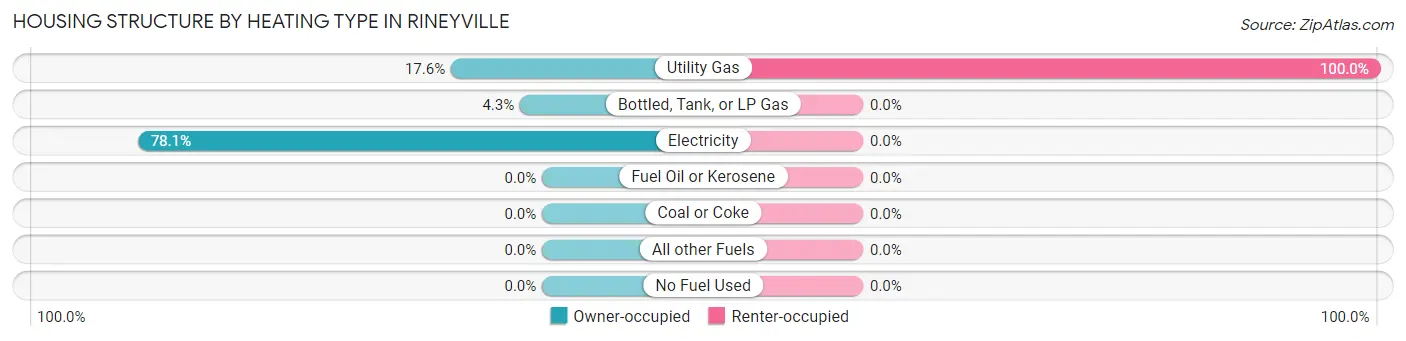
| Heating Type | Owner-occupied | Renter-occupied |
| Utility Gas | 149 (17.6%) | 24 (100.0%) |
| Bottled, Tank, or LP Gas | 36 (4.3%) | 0 (0.0%) |
| Electricity | 661 (78.1%) | 0 (0.0%) |
| Fuel Oil or Kerosene | 0 (0.0%) | 0 (0.0%) |
| Coal or Coke | 0 (0.0%) | 0 (0.0%) |
| All other Fuels | 0 (0.0%) | 0 (0.0%) |
| No Fuel Used | 0 (0.0%) | 0 (0.0%) |
| Total | 846 (100.0%) | 24 (100.0%) |
Household Vehicle Usage in Rineyville
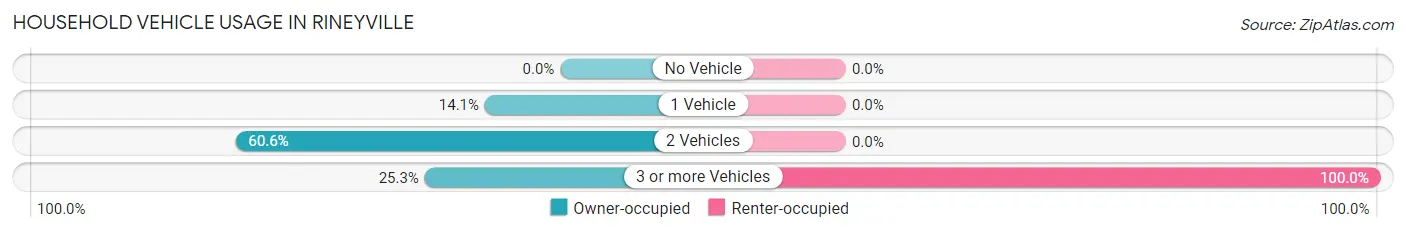
| Vehicles per Household | Owner-occupied | Renter-occupied |
| No Vehicle | 0 (0.0%) | 0 (0.0%) |
| 1 Vehicle | 119 (14.1%) | 0 (0.0%) |
| 2 Vehicles | 513 (60.6%) | 0 (0.0%) |
| 3 or more Vehicles | 214 (25.3%) | 24 (100.0%) |
| Total | 846 (100.0%) | 24 (100.0%) |
Real Estate & Mortgages in Rineyville
Real Estate and Mortgage Overview in Rineyville
| Characteristic | Without Mortgage | With Mortgage |
| Housing Units | 197 | 649 |
| Median Property Value | $202,100 | $220,600 |
| Median Household Income | - | - |
| Monthly Housing Costs | $390 | $0 |
| Real Estate Taxes | $1,228 | $0 |
Property Value by Mortgage Status in Rineyville
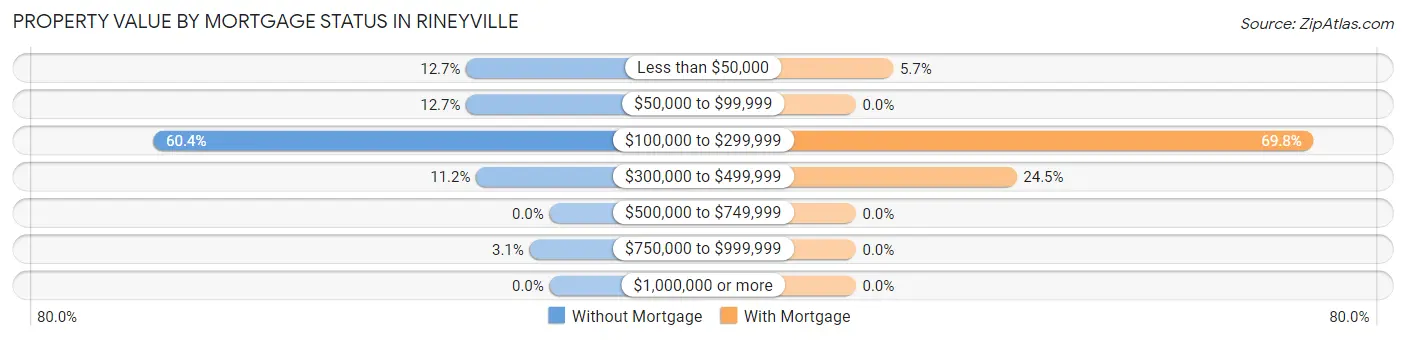
| Property Value | Without Mortgage | With Mortgage |
| Less than $50,000 | 25 (12.7%) | 37 (5.7%) |
| $50,000 to $99,999 | 25 (12.7%) | 0 (0.0%) |
| $100,000 to $299,999 | 119 (60.4%) | 453 (69.8%) |
| $300,000 to $499,999 | 22 (11.2%) | 159 (24.5%) |
| $500,000 to $749,999 | 0 (0.0%) | 0 (0.0%) |
| $750,000 to $999,999 | 6 (3.0%) | 0 (0.0%) |
| $1,000,000 or more | 0 (0.0%) | 0 (0.0%) |
| Total | 197 (100.0%) | 649 (100.0%) |
Household Income by Mortgage Status in Rineyville
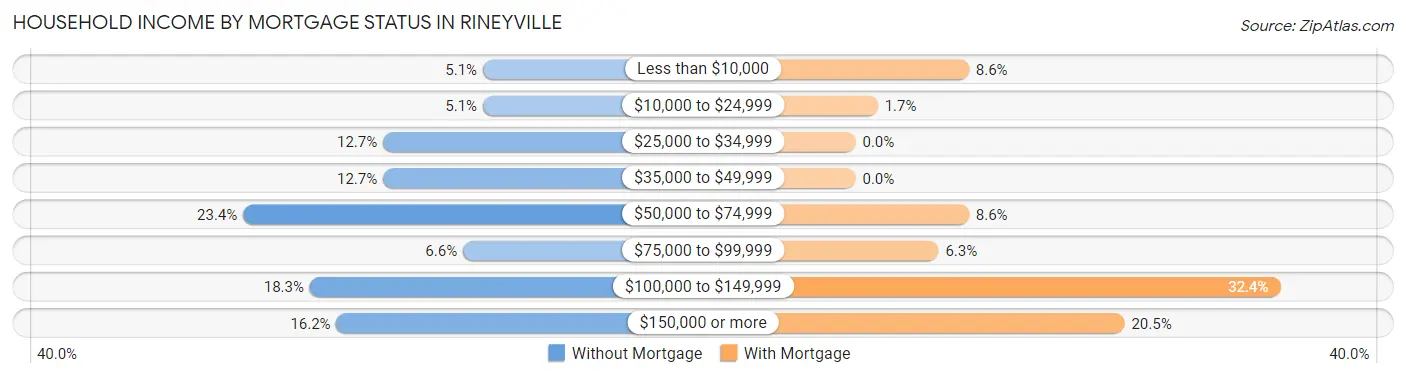
| Household Income | Without Mortgage | With Mortgage |
| Less than $10,000 | 10 (5.1%) | 56 (8.6%) |
| $10,000 to $24,999 | 10 (5.1%) | 11 (1.7%) |
| $25,000 to $34,999 | 25 (12.7%) | 0 (0.0%) |
| $35,000 to $49,999 | 25 (12.7%) | 0 (0.0%) |
| $50,000 to $74,999 | 46 (23.4%) | 56 (8.6%) |
| $75,000 to $99,999 | 13 (6.6%) | 41 (6.3%) |
| $100,000 to $149,999 | 36 (18.3%) | 210 (32.4%) |
| $150,000 or more | 32 (16.2%) | 133 (20.5%) |
| Total | 197 (100.0%) | 649 (100.0%) |
Property Value to Household Income Ratio in Rineyville
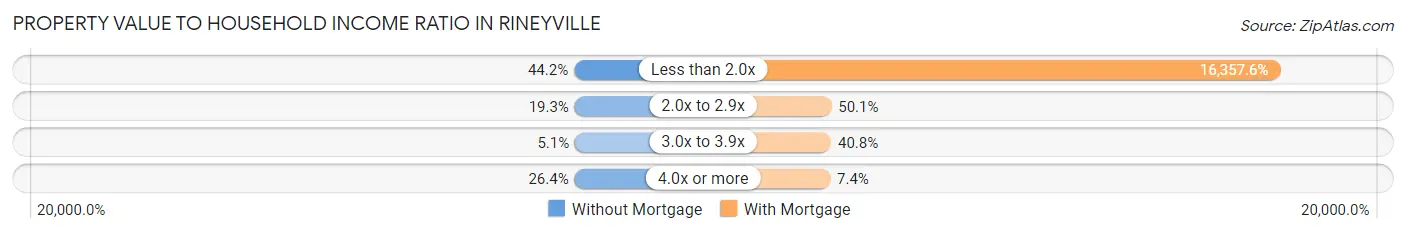
| Value-to-Income Ratio | Without Mortgage | With Mortgage |
| Less than 2.0x | 87 (44.2%) | 106,161 (16,357.6%) |
| 2.0x to 2.9x | 38 (19.3%) | 325 (50.1%) |
| 3.0x to 3.9x | 10 (5.1%) | 265 (40.8%) |
| 4.0x or more | 52 (26.4%) | 48 (7.4%) |
| Total | 197 (100.0%) | 649 (100.0%) |
Real Estate Taxes by Mortgage Status in Rineyville
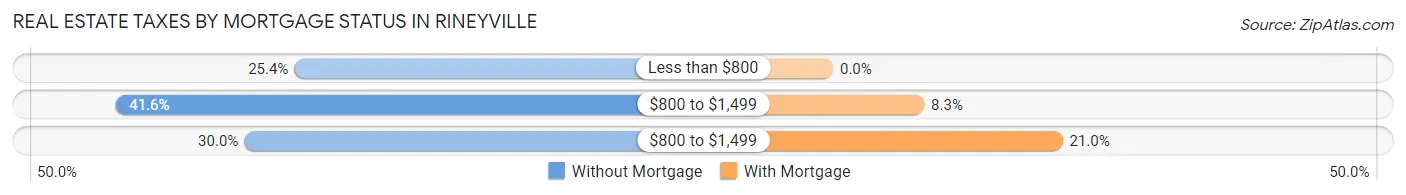
| Property Taxes | Without Mortgage | With Mortgage |
| Less than $800 | 50 (25.4%) | 0 (0.0%) |
| $800 to $1,499 | 82 (41.6%) | 54 (8.3%) |
| $800 to $1,499 | 59 (29.9%) | 136 (21.0%) |
| Total | 197 (100.0%) | 649 (100.0%) |
Health & Disability in Rineyville
Health Insurance Coverage by Age in Rineyville
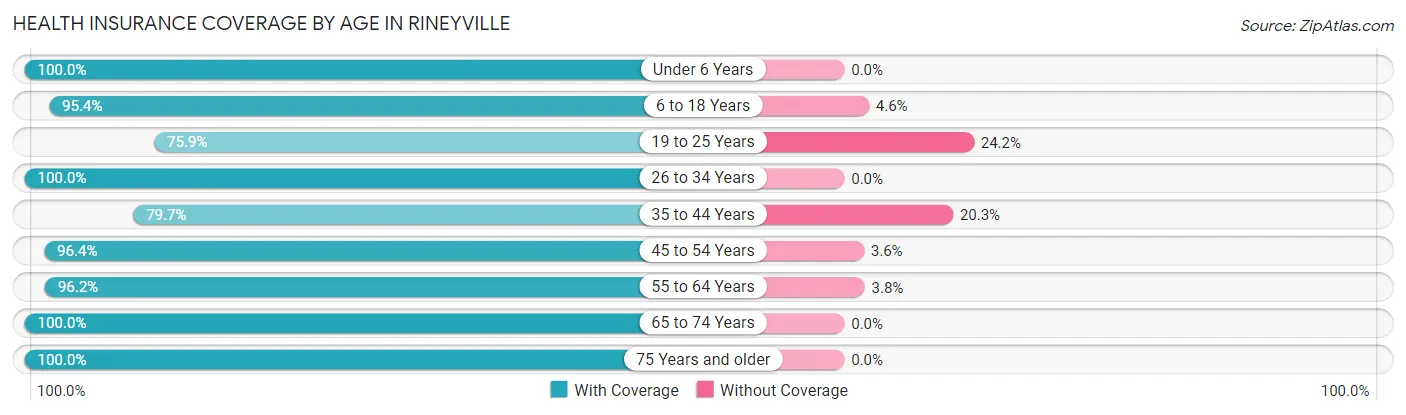
| Age Bracket | With Coverage | Without Coverage |
| Under 6 Years | 421 (100.0%) | 0 (0.0%) |
| 6 to 18 Years | 667 (95.4%) | 32 (4.6%) |
| 19 to 25 Years | 201 (75.8%) | 64 (24.1%) |
| 26 to 34 Years | 295 (100.0%) | 0 (0.0%) |
| 35 to 44 Years | 248 (79.7%) | 63 (20.3%) |
| 45 to 54 Years | 318 (96.4%) | 12 (3.6%) |
| 55 to 64 Years | 330 (96.2%) | 13 (3.8%) |
| 65 to 74 Years | 197 (100.0%) | 0 (0.0%) |
| 75 Years and older | 81 (100.0%) | 0 (0.0%) |
| Total | 2,758 (93.8%) | 184 (6.2%) |
Health Insurance Coverage by Citizenship Status in Rineyville
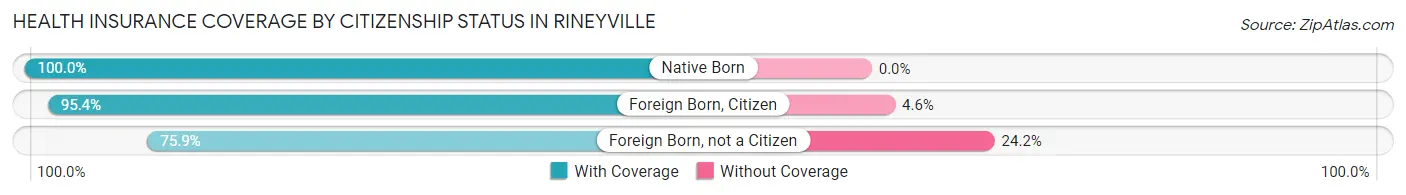
| Citizenship Status | With Coverage | Without Coverage |
| Native Born | 421 (100.0%) | 0 (0.0%) |
| Foreign Born, Citizen | 667 (95.4%) | 32 (4.6%) |
| Foreign Born, not a Citizen | 201 (75.8%) | 64 (24.1%) |
Health Insurance Coverage by Household Income in Rineyville
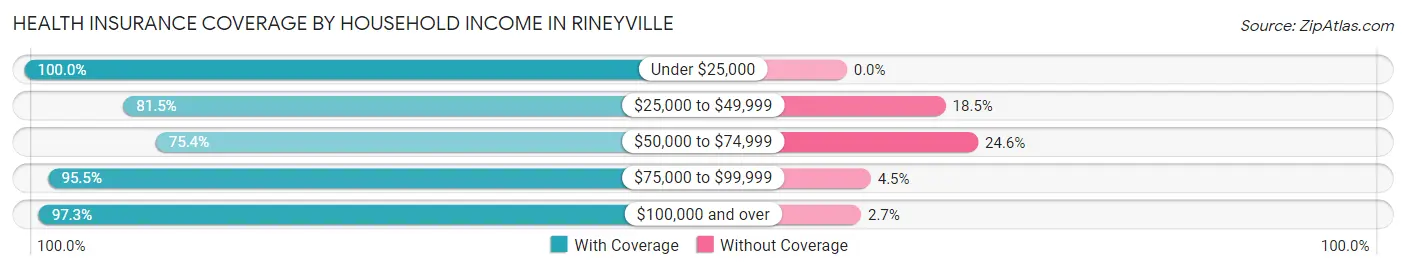
| Household Income | With Coverage | Without Coverage |
| Under $25,000 | 31 (100.0%) | 0 (0.0%) |
| $25,000 to $49,999 | 110 (81.5%) | 25 (18.5%) |
| $50,000 to $74,999 | 236 (75.4%) | 77 (24.6%) |
| $75,000 to $99,999 | 851 (95.5%) | 40 (4.5%) |
| $100,000 and over | 1,530 (97.3%) | 42 (2.7%) |
Public vs Private Health Insurance Coverage by Age in Rineyville
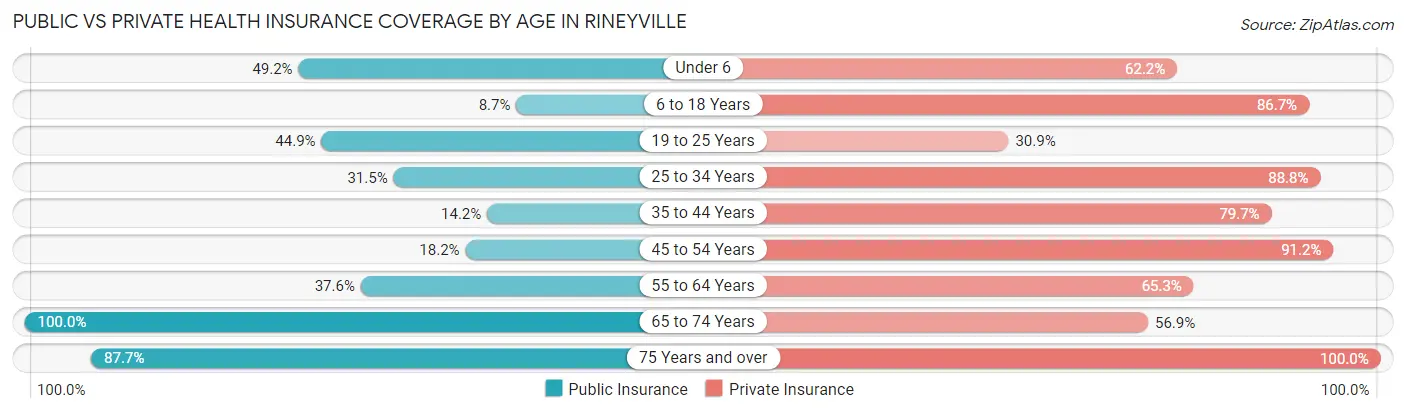
| Age Bracket | Public Insurance | Private Insurance |
| Under 6 | 207 (49.2%) | 262 (62.2%) |
| 6 to 18 Years | 61 (8.7%) | 606 (86.7%) |
| 19 to 25 Years | 119 (44.9%) | 82 (30.9%) |
| 25 to 34 Years | 93 (31.5%) | 262 (88.8%) |
| 35 to 44 Years | 44 (14.1%) | 248 (79.7%) |
| 45 to 54 Years | 60 (18.2%) | 301 (91.2%) |
| 55 to 64 Years | 129 (37.6%) | 224 (65.3%) |
| 65 to 74 Years | 197 (100.0%) | 112 (56.9%) |
| 75 Years and over | 71 (87.6%) | 81 (100.0%) |
| Total | 981 (33.3%) | 2,178 (74.0%) |
Disability Status by Sex by Age in Rineyville
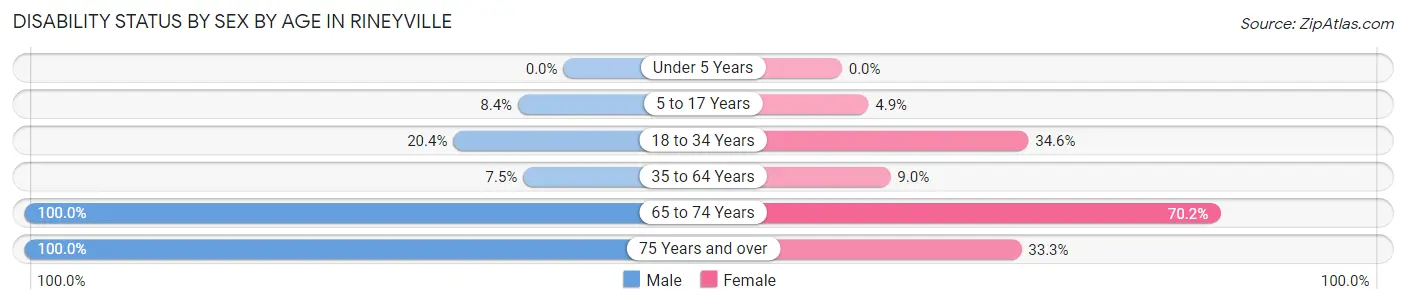
| Age Bracket | Male | Female |
| Under 5 Years | 0 (0.0%) | 0 (0.0%) |
| 5 to 17 Years | 35 (8.4%) | 14 (4.9%) |
| 18 to 34 Years | 56 (20.4%) | 99 (34.6%) |
| 35 to 64 Years | 37 (7.5%) | 44 (9.0%) |
| 65 to 74 Years | 56 (100.0%) | 99 (70.2%) |
| 75 Years and over | 36 (100.0%) | 15 (33.3%) |
Disability Class by Sex by Age in Rineyville
Disability Class: Hearing Difficulty
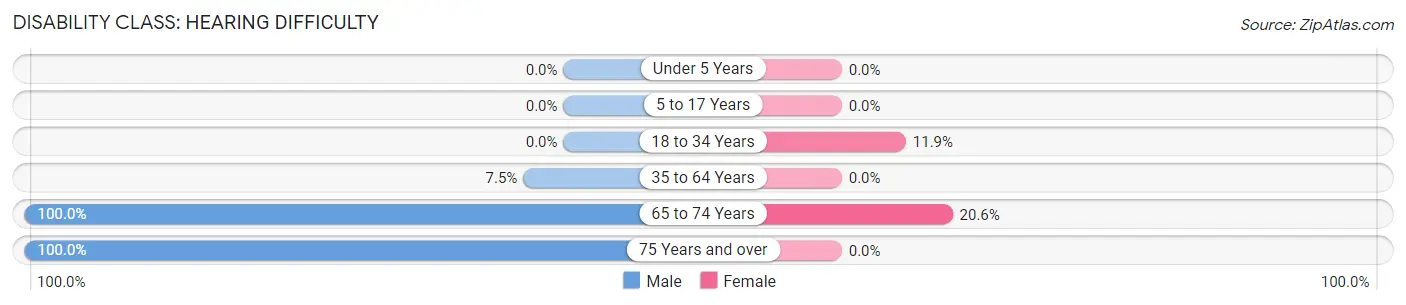
| Age Bracket | Male | Female |
| Under 5 Years | 0 (0.0%) | 0 (0.0%) |
| 5 to 17 Years | 0 (0.0%) | 0 (0.0%) |
| 18 to 34 Years | 0 (0.0%) | 34 (11.9%) |
| 35 to 64 Years | 37 (7.5%) | 0 (0.0%) |
| 65 to 74 Years | 56 (100.0%) | 29 (20.6%) |
| 75 Years and over | 36 (100.0%) | 0 (0.0%) |
Disability Class: Vision Difficulty
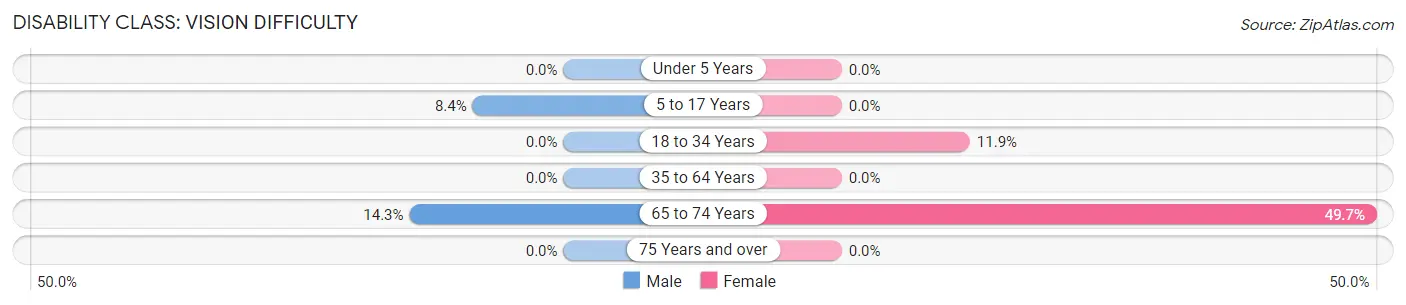
| Age Bracket | Male | Female |
| Under 5 Years | 0 (0.0%) | 0 (0.0%) |
| 5 to 17 Years | 35 (8.4%) | 0 (0.0%) |
| 18 to 34 Years | 0 (0.0%) | 34 (11.9%) |
| 35 to 64 Years | 0 (0.0%) | 0 (0.0%) |
| 65 to 74 Years | 8 (14.3%) | 70 (49.6%) |
| 75 Years and over | 0 (0.0%) | 0 (0.0%) |
Disability Class: Cognitive Difficulty
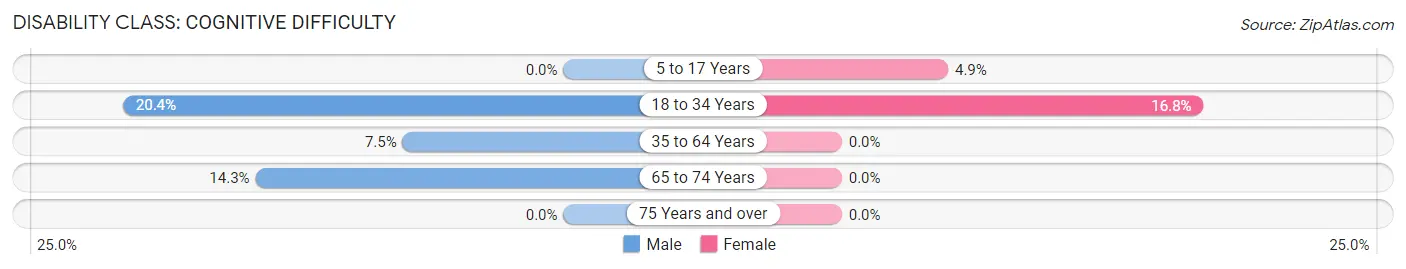
| Age Bracket | Male | Female |
| 5 to 17 Years | 0 (0.0%) | 14 (4.9%) |
| 18 to 34 Years | 56 (20.4%) | 48 (16.8%) |
| 35 to 64 Years | 37 (7.5%) | 0 (0.0%) |
| 65 to 74 Years | 8 (14.3%) | 0 (0.0%) |
| 75 Years and over | 0 (0.0%) | 0 (0.0%) |
Disability Class: Ambulatory Difficulty
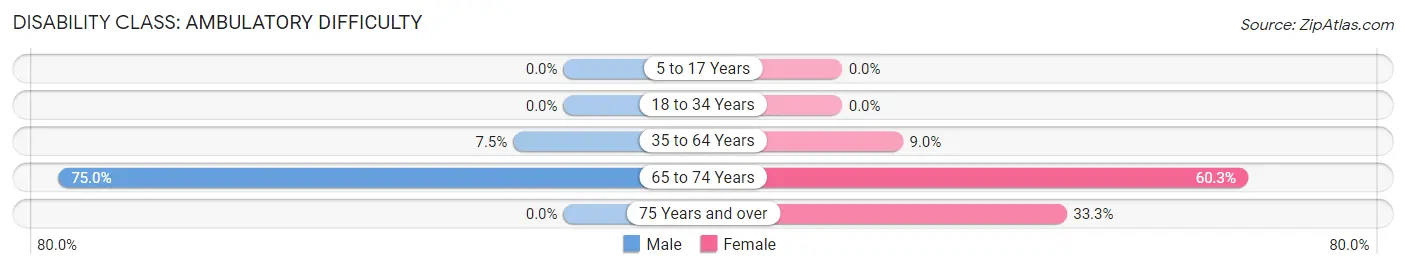
| Age Bracket | Male | Female |
| 5 to 17 Years | 0 (0.0%) | 0 (0.0%) |
| 18 to 34 Years | 0 (0.0%) | 0 (0.0%) |
| 35 to 64 Years | 37 (7.5%) | 44 (9.0%) |
| 65 to 74 Years | 42 (75.0%) | 85 (60.3%) |
| 75 Years and over | 0 (0.0%) | 15 (33.3%) |
Disability Class: Self-Care Difficulty
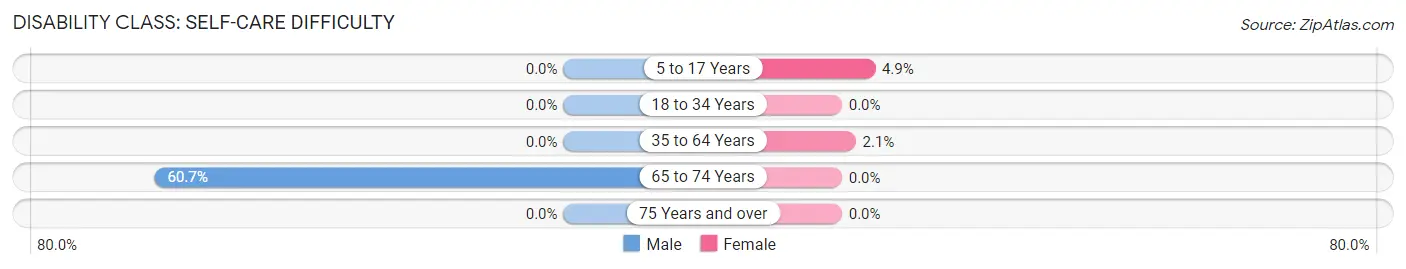
| Age Bracket | Male | Female |
| 5 to 17 Years | 0 (0.0%) | 14 (4.9%) |
| 18 to 34 Years | 0 (0.0%) | 0 (0.0%) |
| 35 to 64 Years | 0 (0.0%) | 10 (2.1%) |
| 65 to 74 Years | 34 (60.7%) | 0 (0.0%) |
| 75 Years and over | 0 (0.0%) | 0 (0.0%) |
Technology Access in Rineyville
Computing Device Access in Rineyville
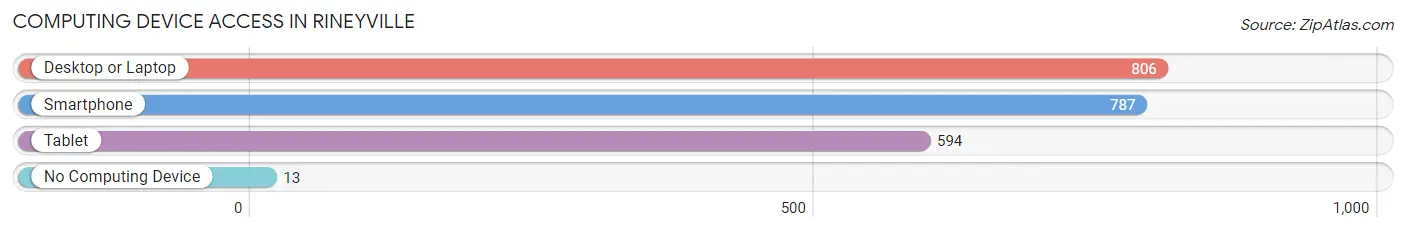
| Device Type | # Households | % Households |
| Desktop or Laptop | 806 | 92.6% |
| Smartphone | 787 | 90.5% |
| Tablet | 594 | 68.3% |
| No Computing Device | 13 | 1.5% |
| Total | 870 | 100.0% |
Internet Access in Rineyville
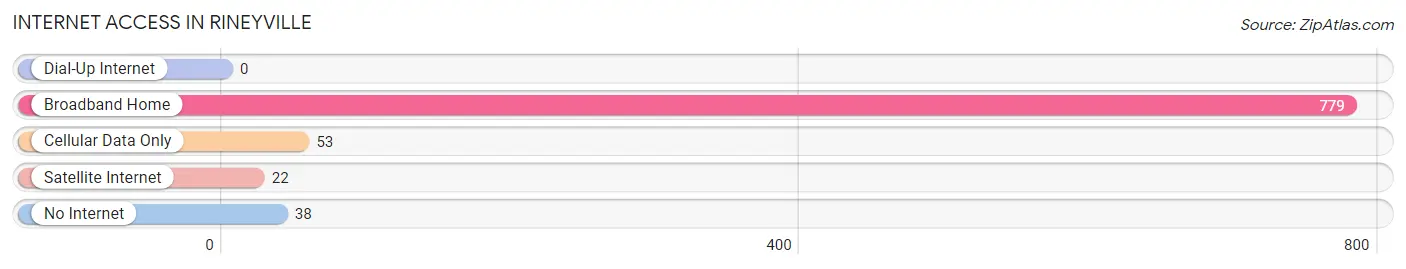
| Internet Type | # Households | % Households |
| Dial-Up Internet | 0 | 0.0% |
| Broadband Home | 779 | 89.5% |
| Cellular Data Only | 53 | 6.1% |
| Satellite Internet | 22 | 2.5% |
| No Internet | 38 | 4.4% |
| Total | 870 | 100.0% |
Rineyville Summary
Rineyville is an unincorporated community located in Hardin County, Kentucky, United States. It is situated along the western edge of the county, approximately 10 miles (16 km) northeast of Elizabethtown. The population of Rineyville was estimated to be 2,845 in 2019.
History
Rineyville was founded in 1820 by William Riney, a Revolutionary War veteran who had moved to the area from Virginia. The town was originally known as Rineyville Station, as it was located along the Louisville and Nashville Railroad. The town was officially incorporated in 1872.
Rineyville was a thriving community in the late 19th and early 20th centuries, with a variety of businesses, including a hotel, a general store, a blacksmith shop, a sawmill, and a gristmill. The town also had a post office, a school, and several churches.
Geography
Rineyville is located in Hardin County, Kentucky, approximately 10 miles (16 km) northeast of Elizabethtown. The town is situated along the western edge of the county, near the border with Meade County. The town is located at an elevation of 590 feet (180 m).
The climate in Rineyville is humid subtropical, with hot, humid summers and mild winters. The average annual temperature is 61°F (16°C), and the average annual precipitation is 45 inches (114 cm).
Economy
Rineyville is primarily a residential community, with most of its residents commuting to nearby cities for work. The town does have a few small businesses, including a gas station, a convenience store, and a few restaurants.
The largest employers in the area are Fort Knox, a U.S. Army post located approximately 10 miles (16 km) south of Rineyville, and the Elizabethtown Regional Airport, located approximately 10 miles (16 km) west of Rineyville.
Demographics
As of the 2010 census, the population of Rineyville was 2,845. The racial makeup of the town was 94.3% White, 2.7% African American, 0.7% Native American, 0.3% Asian, 0.1% Pacific Islander, 0.7% from other races, and 1.2% from two or more races. Hispanic or Latino of any race were 2.2% of the population.
The median household income in Rineyville was $45,938, and the median family income was $51,938. The per capita income was $20,938. About 8.3% of families and 10.2% of the population were below the poverty line, including 14.2% of those under age 18 and 8.3% of those age 65 or over.
Common Questions
What is the Total Population of Rineyville?
Total Population of Rineyville is 3,006.
What is the Total Male Population of Rineyville?
Total Male Population of Rineyville is 1,606.
What is the Total Female Population of Rineyville?
Total Female Population of Rineyville is 1,400.
What is the Ratio of Males per 100 Females in Rineyville?
There are 114.71 Males per 100 Females in Rineyville.
What is the Ratio of Females per 100 Males in Rineyville?
There are 87.17 Females per 100 Males in Rineyville.
What is the Median Population Age in Rineyville?
Median Population Age in Rineyville is 29.6 Years.
What is the Average Family Size in Rineyville
Average Family Size in Rineyville is 3.8 People.
What is the Average Household Size in Rineyville
Average Household Size in Rineyville is 3.5 People.
What is Per Capita Income in Rineyville?
Per Capita income in Rineyville is $33,756.
What is the Median Family Income in Rineyville?
Median Family Income in Rineyville is $133,333.
What is the Median Household income in Rineyville?
Median Household Income in Rineyville is $91,394.
What is Income or Wage Gap in Rineyville?
Income or Wage Gap in Rineyville is 66.6%.
Women in Rineyville earn 33.4 cents for every dollar earned by a man.
What is Inequality or Gini Index in Rineyville?
Inequality or Gini Index in Rineyville is 0.34.
How Large is the Labor Force in Rineyville?
There are 1,339 People in the Labor Forcein in Rineyville.
What is the Percentage of People in the Labor Force in Rineyville?
67.7% of People are in the Labor Force in Rineyville.
What is the Unemployment Rate in Rineyville?
Unemployment Rate in Rineyville is 7.4%.