Goodland, KS
Goodland Map
Goodland Overview
3,813
TOTAL POPULATION
2,018
MALE POPULATION
1,795
FEMALE POPULATION
112.42
MALES / 100 FEMALES
88.95
FEMALES / 100 MALES
37.6
MEDIAN AGE
3.0
AVG FAMILY SIZE
2.2
AVG HOUSEHOLD SIZE
$38,614
PER CAPITA INCOME
$64,404
AVG FAMILY INCOME
$54,228
AVG HOUSEHOLD INCOME
51.8%
WAGE / INCOME GAP [ % ]
48.2¢/ $1
WAGE / INCOME GAP [ $ ]
0.53
INEQUALITY / GINI INDEX
2,092
LABOR FORCE [ PEOPLE ]
67.0%
PERCENT IN LABOR FORCE
3.4%
UNEMPLOYMENT RATE
Goodland Zip Codes
Goodland Area Codes
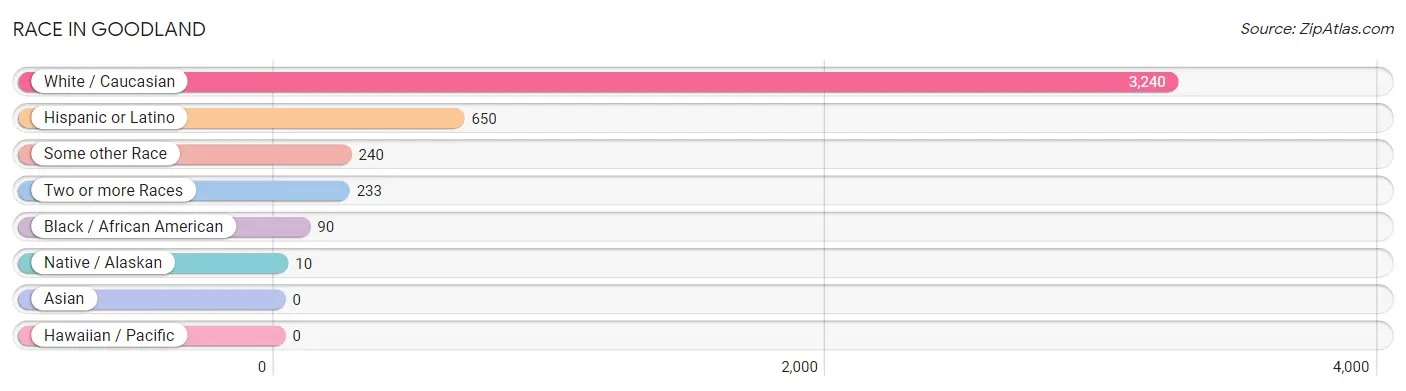
Race in Goodland
The most populous races in Goodland are White / Caucasian (3,240 | 85.0%), Hispanic or Latino (650 | 17.1%), and Some other Race (240 | 6.3%).
| Race | # Population | % Population |
| Asian | 0 | 0.0% |
| Black / African American | 90 | 2.4% |
| Hawaiian / Pacific | 0 | 0.0% |
| Hispanic or Latino | 650 | 17.1% |
| Native / Alaskan | 10 | 0.3% |
| White / Caucasian | 3,240 | 85.0% |
| Two or more Races | 233 | 6.1% |
| Some other Race | 240 | 6.3% |
| Total | 3,813 | 100.0% |
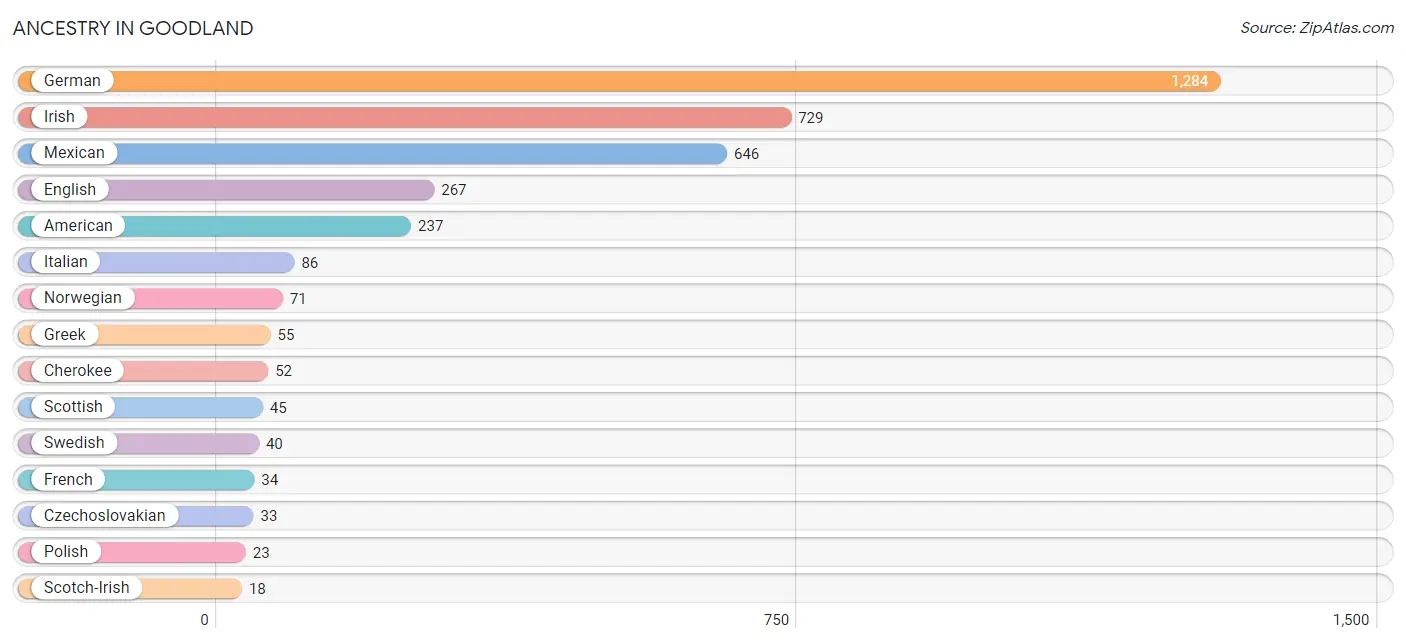
Ancestry in Goodland
The most populous ancestries reported in Goodland are German (1,284 | 33.7%), Irish (729 | 19.1%), Mexican (646 | 16.9%), English (267 | 7.0%), and American (237 | 6.2%), together accounting for 83.0% of all Goodland residents.
| Ancestry | # Population | % Population |
| American | 237 | 6.2% |
| Arab | 3 | 0.1% |
| Belgian | 3 | 0.1% |
| Burmese | 11 | 0.3% |
| Cherokee | 52 | 1.4% |
| Czechoslovakian | 33 | 0.9% |
| English | 267 | 7.0% |
| European | 15 | 0.4% |
| French | 34 | 0.9% |
| French Canadian | 12 | 0.3% |
| German | 1,284 | 33.7% |
| Greek | 55 | 1.4% |
| Irish | 729 | 19.1% |
| Italian | 86 | 2.3% |
| Lebanese | 3 | 0.1% |
| Mexican | 646 | 16.9% |
| Norwegian | 71 | 1.9% |
| Polish | 23 | 0.6% |
| Potawatomi | 12 | 0.3% |
| Russian | 14 | 0.4% |
| Scotch-Irish | 18 | 0.5% |
| Scottish | 45 | 1.2% |
| Swedish | 40 | 1.1% |
| Ukrainian | 10 | 0.3% | View All 24 Rows |
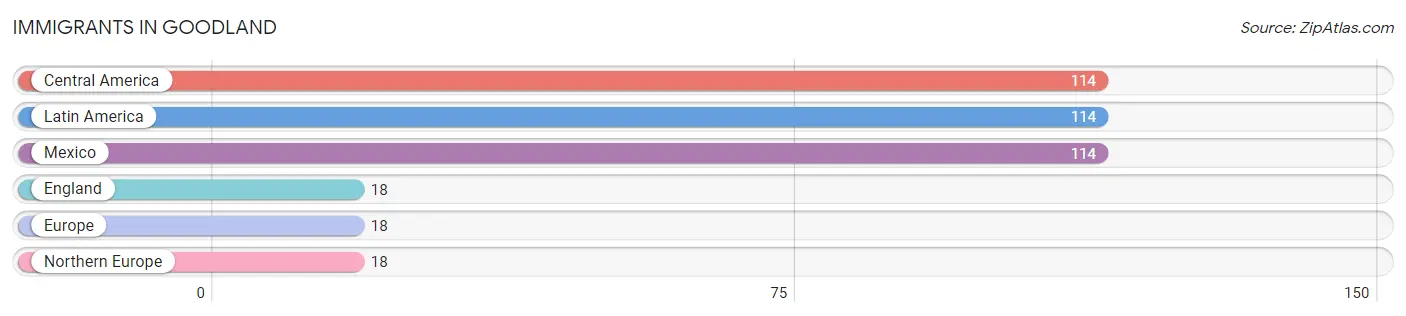
Immigrants in Goodland
The most numerous immigrant groups reported in Goodland came from Central America (114 | 3.0%), Latin America (114 | 3.0%), Mexico (114 | 3.0%), England (18 | 0.5%), and Europe (18 | 0.5%), together accounting for 9.9% of all Goodland residents.
| Immigration Origin | # Population | % Population |
| Central America | 114 | 3.0% |
| England | 18 | 0.5% |
| Europe | 18 | 0.5% |
| Latin America | 114 | 3.0% |
| Mexico | 114 | 3.0% |
| Northern Europe | 18 | 0.5% | View All 6 Rows |
Sex and Age in Goodland
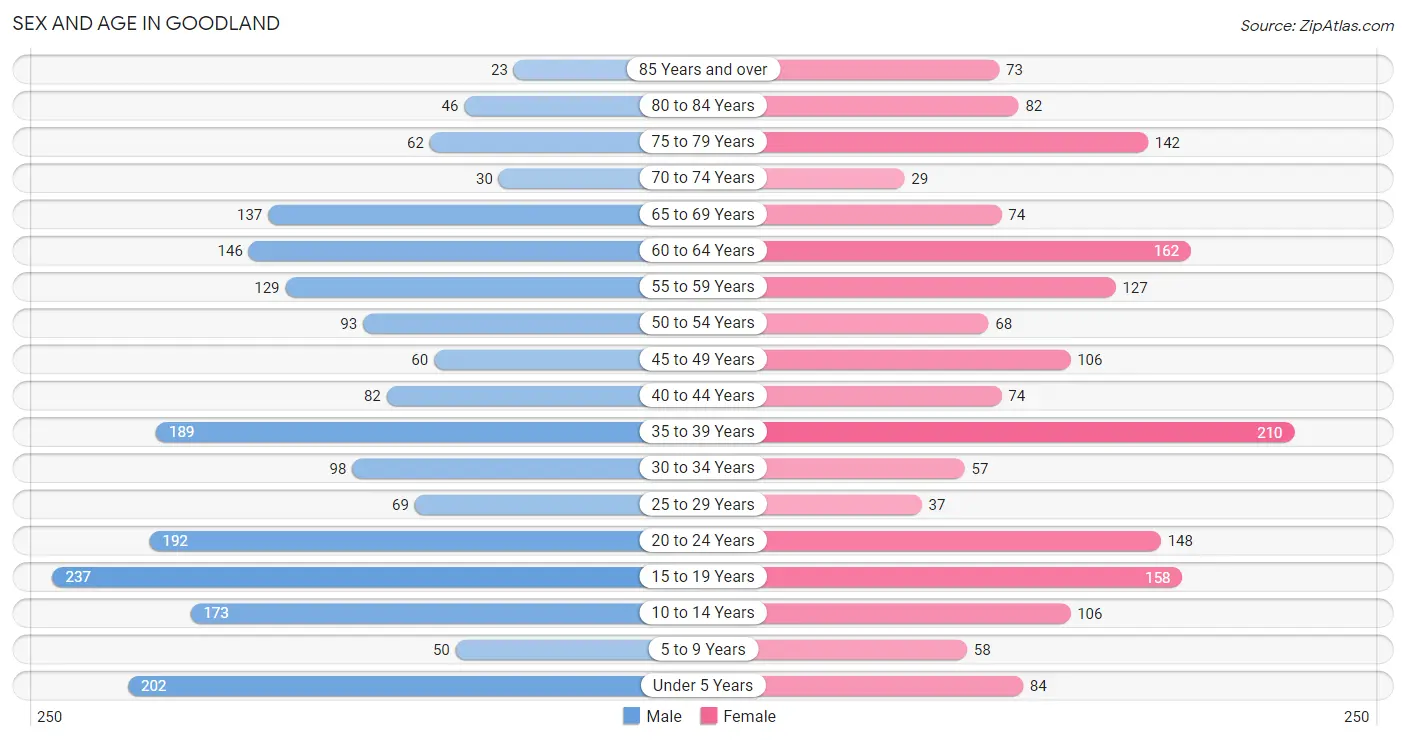
Sex and Age in Goodland
The most populous age groups in Goodland are 15 to 19 Years (237 | 11.7%) for men and 35 to 39 Years (210 | 11.7%) for women.
| Age Bracket | Male | Female |
| Under 5 Years | 202 (10.0%) | 84 (4.7%) |
| 5 to 9 Years | 50 (2.5%) | 58 (3.2%) |
| 10 to 14 Years | 173 (8.6%) | 106 (5.9%) |
| 15 to 19 Years | 237 (11.7%) | 158 (8.8%) |
| 20 to 24 Years | 192 (9.5%) | 148 (8.3%) |
| 25 to 29 Years | 69 (3.4%) | 37 (2.1%) |
| 30 to 34 Years | 98 (4.9%) | 57 (3.2%) |
| 35 to 39 Years | 189 (9.4%) | 210 (11.7%) |
| 40 to 44 Years | 82 (4.1%) | 74 (4.1%) |
| 45 to 49 Years | 60 (3.0%) | 106 (5.9%) |
| 50 to 54 Years | 93 (4.6%) | 68 (3.8%) |
| 55 to 59 Years | 129 (6.4%) | 127 (7.1%) |
| 60 to 64 Years | 146 (7.2%) | 162 (9.0%) |
| 65 to 69 Years | 137 (6.8%) | 74 (4.1%) |
| 70 to 74 Years | 30 (1.5%) | 29 (1.6%) |
| 75 to 79 Years | 62 (3.1%) | 142 (7.9%) |
| 80 to 84 Years | 46 (2.3%) | 82 (4.6%) |
| 85 Years and over | 23 (1.1%) | 73 (4.1%) |
| Total | 2,018 (100.0%) | 1,795 (100.0%) |
Families and Households in Goodland
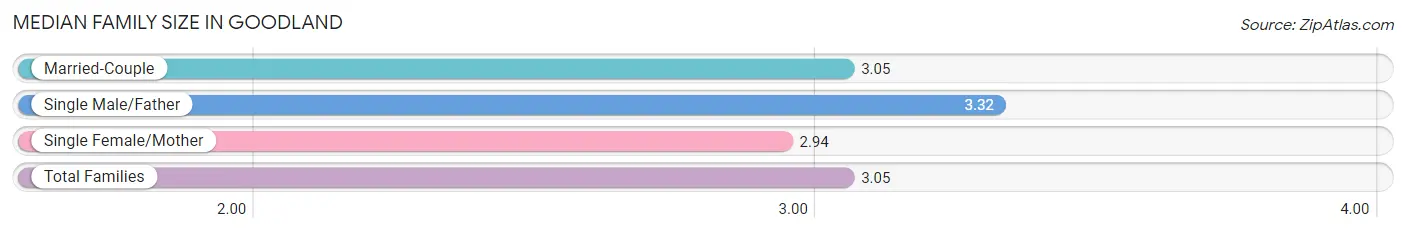
Median Family Size in Goodland
The median family size in Goodland is 3.05 persons per family, with single male/father families (100 | 10.9%) accounting for the largest median family size of 3.32 persons per family. On the other hand, single female/mother families (215 | 23.5%) represent the smallest median family size with 2.94 persons per family.
| Family Type | # Families | Family Size |
| Married-Couple | 600 (65.6%) | 3.05 |
| Single Male/Father | 100 (10.9%) | 3.32 |
| Single Female/Mother | 215 (23.5%) | 2.94 |
| Total Families | 915 (100.0%) | 3.05 |
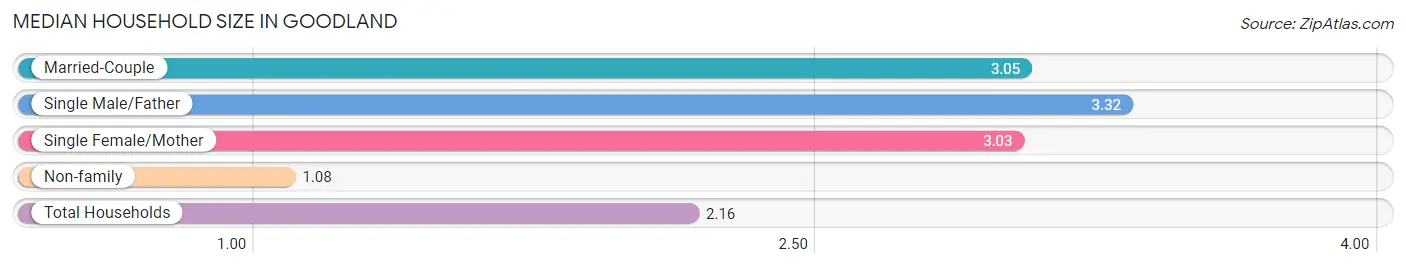
Median Household Size in Goodland
The median household size in Goodland is 2.16 persons per household, with single male/father households (100 | 6.0%) accounting for the largest median household size of 3.32 persons per household. non-family households (762 | 45.4%) represent the smallest median household size with 1.08 persons per household.
| Household Type | # Households | Household Size |
| Married-Couple | 600 (35.8%) | 3.05 |
| Single Male/Father | 100 (6.0%) | 3.32 |
| Single Female/Mother | 215 (12.8%) | 3.03 |
| Non-family | 762 (45.4%) | 1.08 |
| Total Households | 1,677 (100.0%) | 2.16 |
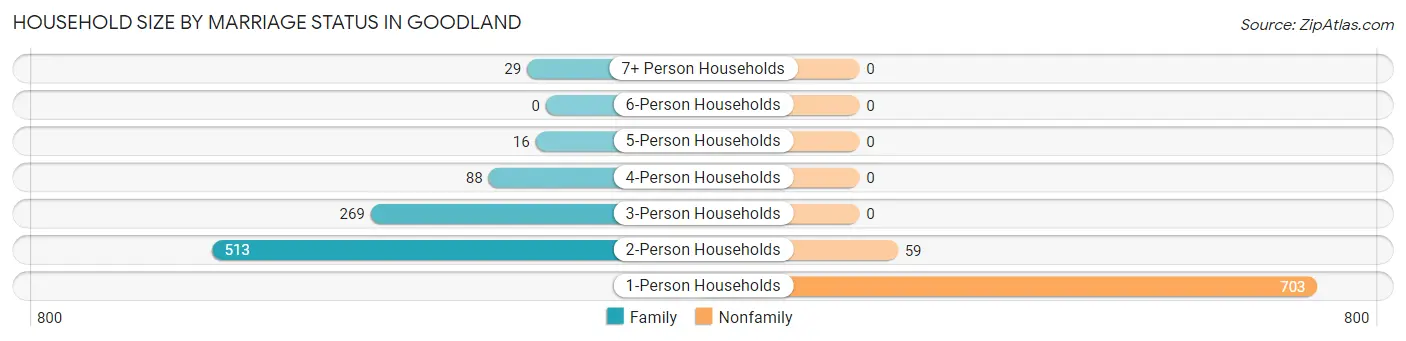
Household Size by Marriage Status in Goodland
Out of a total of 1,677 households in Goodland, 915 (54.6%) are family households, while 762 (45.4%) are nonfamily households. The most numerous type of family households are 2-person households, comprising 513, and the most common type of nonfamily households are 1-person households, comprising 703.
| Household Size | Family Households | Nonfamily Households |
| 1-Person Households | - | 703 (41.9%) |
| 2-Person Households | 513 (30.6%) | 59 (3.5%) |
| 3-Person Households | 269 (16.0%) | 0 (0.0%) |
| 4-Person Households | 88 (5.2%) | 0 (0.0%) |
| 5-Person Households | 16 (0.9%) | 0 (0.0%) |
| 6-Person Households | 0 (0.0%) | 0 (0.0%) |
| 7+ Person Households | 29 (1.7%) | 0 (0.0%) |
| Total | 915 (54.6%) | 762 (45.4%) |
Female Fertility in Goodland
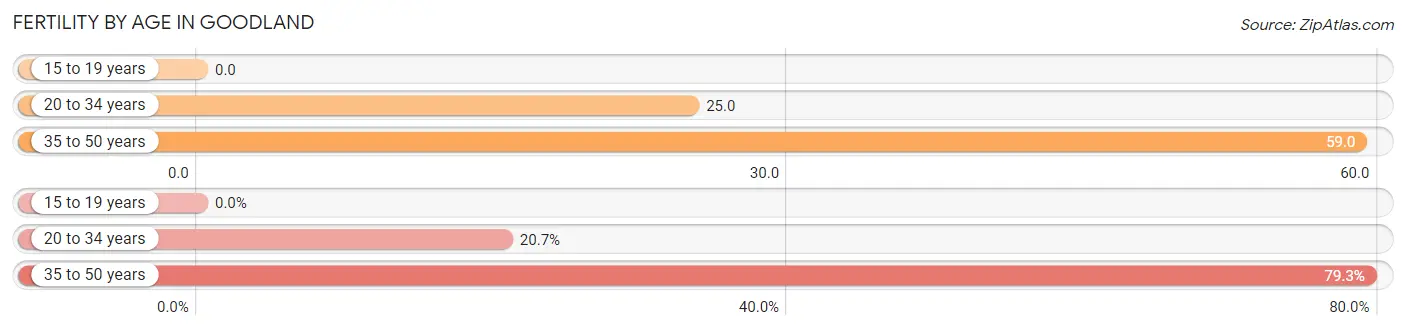
Fertility by Age in Goodland
Average fertility rate in Goodland is 37.0 births per 1,000 women. Women in the age bracket of 35 to 50 years have the highest fertility rate with 59.0 births per 1,000 women. Women in the age bracket of 35 to 50 years acount for 79.3% of all women with births.
| Age Bracket | Women with Births | Births / 1,000 Women |
| 15 to 19 years | 0 (0.0%) | 0.0 |
| 20 to 34 years | 6 (20.7%) | 25.0 |
| 35 to 50 years | 23 (79.3%) | 59.0 |
| Total | 29 (100.0%) | 37.0 |
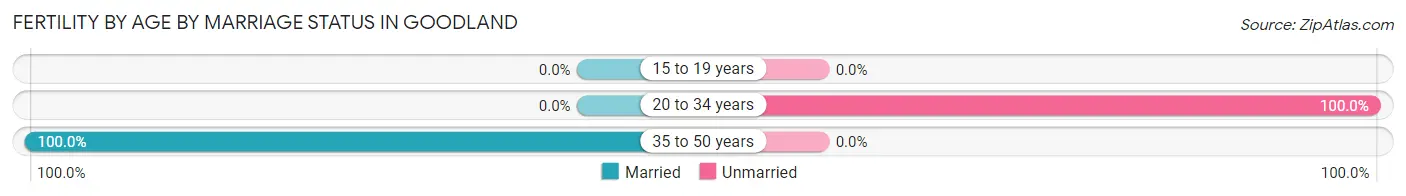
Fertility by Age by Marriage Status in Goodland
79.3% of women with births (29) in Goodland are married. The highest percentage of unmarried women with births falls into 20 to 34 years age bracket with 100.0% of them unmarried at the time of birth, while the lowest percentage of unmarried women with births belong to 35 to 50 years age bracket with 0.0% of them unmarried.
| Age Bracket | Married | Unmarried |
| 15 to 19 years | 0 (0.0%) | 0 (0.0%) |
| 20 to 34 years | 0 (0.0%) | 6 (100.0%) |
| 35 to 50 years | 23 (100.0%) | 0 (0.0%) |
| Total | 23 (79.3%) | 6 (20.7%) |
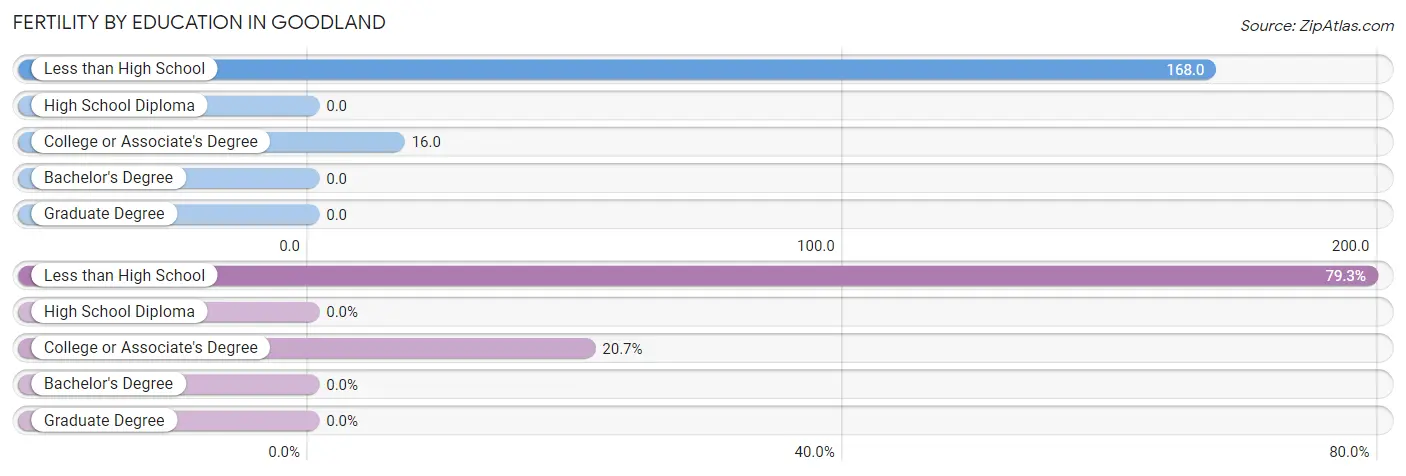
Fertility by Education in Goodland
| Educational Attainment | Women with Births | Births / 1,000 Women |
| Less than High School | 23 (79.3%) | 168.0 |
| High School Diploma | 0 (0.0%) | 0.0 |
| College or Associate's Degree | 6 (20.7%) | 16.0 |
| Bachelor's Degree | 0 (0.0%) | 0.0 |
| Graduate Degree | 0 (0.0%) | 0.0 |
| Total | 29 (100.0%) | 37.0 |
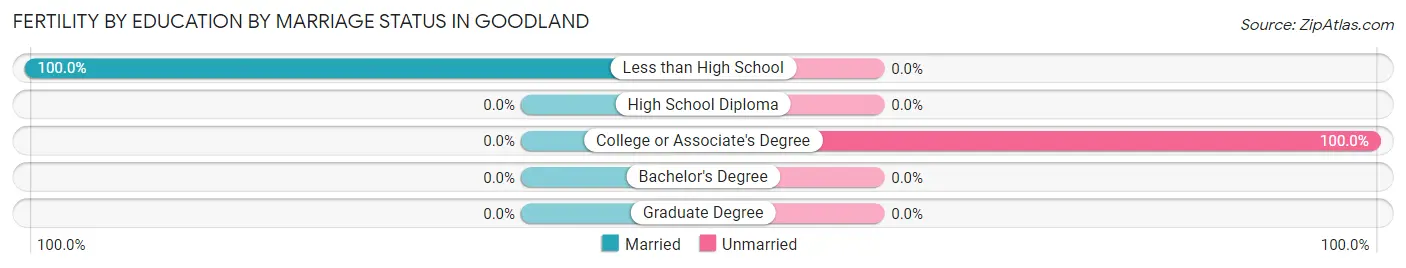
Fertility by Education by Marriage Status in Goodland
20.7% of women with births in Goodland are unmarried. Women with the educational attainment of less than high school are most likely to be married with 100.0% of them married at childbirth, while women with the educational attainment of college or associate's degree are least likely to be married with 100.0% of them unmarried at childbirth.
| Educational Attainment | Married | Unmarried |
| Less than High School | 23 (100.0%) | 0 (0.0%) |
| High School Diploma | 0 (0.0%) | 0 (0.0%) |
| College or Associate's Degree | 0 (0.0%) | 6 (100.0%) |
| Bachelor's Degree | 0 (0.0%) | 0 (0.0%) |
| Graduate Degree | 0 (0.0%) | 0 (0.0%) |
| Total | 23 (79.3%) | 6 (20.7%) |
Income in Goodland
Income Overview in Goodland
Per Capita Income in Goodland is $38,614, while median incomes of families and households are $64,404 and $54,228 respectively.
| Characteristic | Number | Measure |
| Per Capita Income | 3,813 | $38,614 |
| Median Family Income | 915 | $64,404 |
| Mean Family Income | 915 | $90,543 |
| Median Household Income | 1,677 | $54,228 |
| Mean Household Income | 1,677 | $82,756 |
| Income Deficit | 915 | $0 |
| Wage / Income Gap (%) | 3,813 | 51.81% |
| Wage / Income Gap ($) | 3,813 | 48.19¢ per $1 |
| Gini / Inequality Index | 3,813 | 0.53 |
Earnings by Sex in Goodland
Average Earnings in Goodland are $31,823, $41,600 for men and $20,045 for women, a difference of 51.8%.
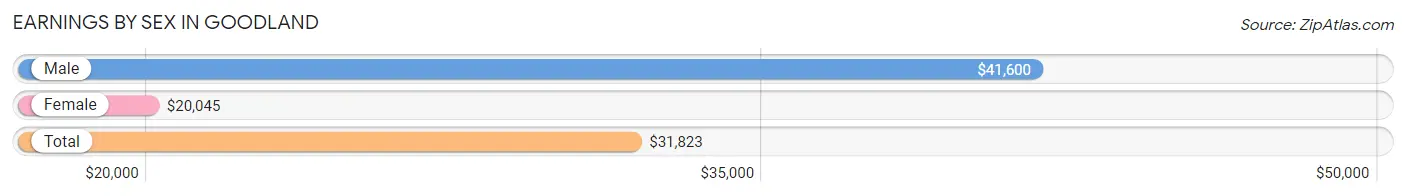
| Sex | Number | Average Earnings |
| Male | 1,140 (51.4%) | $41,600 |
| Female | 1,077 (48.6%) | $20,045 |
| Total | 2,217 (100.0%) | $31,823 |
Earnings by Sex by Income Bracket in Goodland
The most common earnings brackets in Goodland are $75,000 to $99,999 for men (184 | 16.1%) and $65,000 to $74,999 for women (168 | 15.6%).
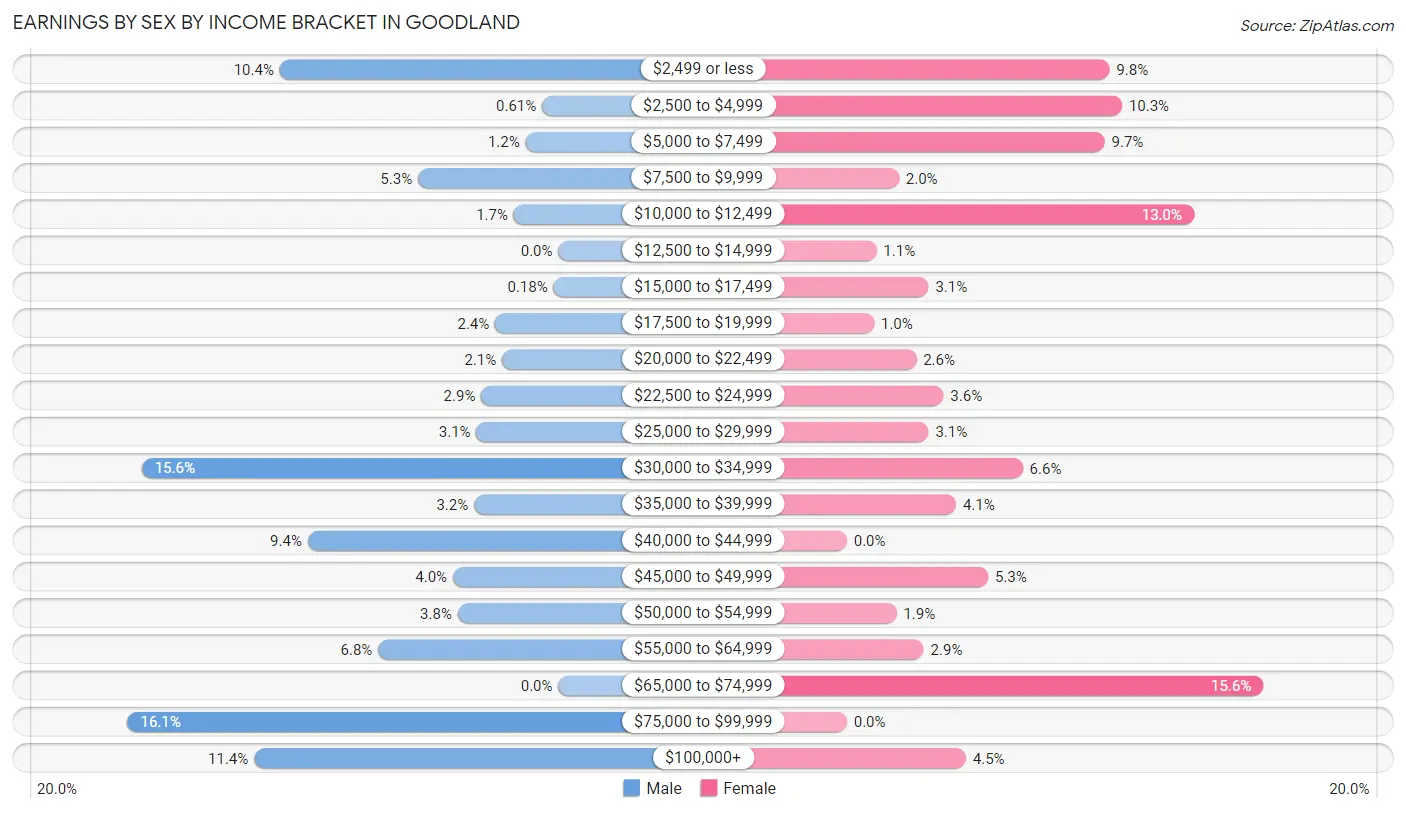
| Income | Male | Female |
| $2,499 or less | 119 (10.4%) | 106 (9.8%) |
| $2,500 to $4,999 | 7 (0.6%) | 111 (10.3%) |
| $5,000 to $7,499 | 14 (1.2%) | 104 (9.7%) |
| $7,500 to $9,999 | 60 (5.3%) | 21 (1.9%) |
| $10,000 to $12,499 | 19 (1.7%) | 140 (13.0%) |
| $12,500 to $14,999 | 0 (0.0%) | 12 (1.1%) |
| $15,000 to $17,499 | 2 (0.2%) | 33 (3.1%) |
| $17,500 to $19,999 | 27 (2.4%) | 11 (1.0%) |
| $20,000 to $22,499 | 24 (2.1%) | 28 (2.6%) |
| $22,500 to $24,999 | 33 (2.9%) | 39 (3.6%) |
| $25,000 to $29,999 | 35 (3.1%) | 33 (3.1%) |
| $30,000 to $34,999 | 178 (15.6%) | 71 (6.6%) |
| $35,000 to $39,999 | 36 (3.2%) | 44 (4.1%) |
| $40,000 to $44,999 | 107 (9.4%) | 0 (0.0%) |
| $45,000 to $49,999 | 45 (4.0%) | 57 (5.3%) |
| $50,000 to $54,999 | 43 (3.8%) | 20 (1.9%) |
| $55,000 to $64,999 | 77 (6.8%) | 31 (2.9%) |
| $65,000 to $74,999 | 0 (0.0%) | 168 (15.6%) |
| $75,000 to $99,999 | 184 (16.1%) | 0 (0.0%) |
| $100,000+ | 130 (11.4%) | 48 (4.5%) |
| Total | 1,140 (100.0%) | 1,077 (100.0%) |
Earnings by Sex by Educational Attainment in Goodland
Average earnings in Goodland are $49,778 for men and $23,301 for women, a difference of 53.2%. Men with an educational attainment of graduate degree enjoy the highest average annual earnings of $77,375, while those with less than high school education earn the least with $44,063. Women with an educational attainment of less than high school earn the most with the average annual earnings of $11,439, while those with less than high school education have the smallest earnings of $11,439.
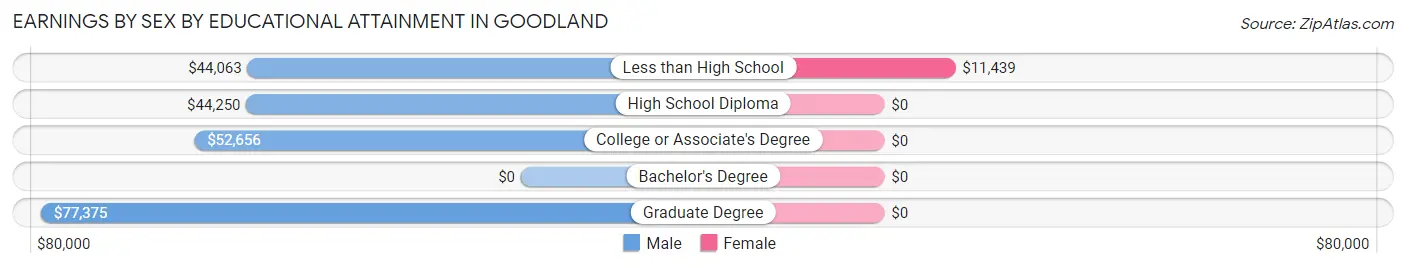
| Educational Attainment | Male Income | Female Income |
| Less than High School | $44,063 | $11,439 |
| High School Diploma | $44,250 | $0 |
| College or Associate's Degree | $52,656 | $0 |
| Bachelor's Degree | - | - |
| Graduate Degree | $77,375 | $0 |
| Total | $49,778 | $23,301 |
Family Income in Goodland
Family Income Brackets in Goodland
According to the Goodland family income data, there are 234 families falling into the $50,000 to $74,999 income range, which is the most common income bracket and makes up 25.6% of all families. Conversely, the $15,000 to $24,999 income bracket is the least frequent group with only 16 families (1.8%) belonging to this category.
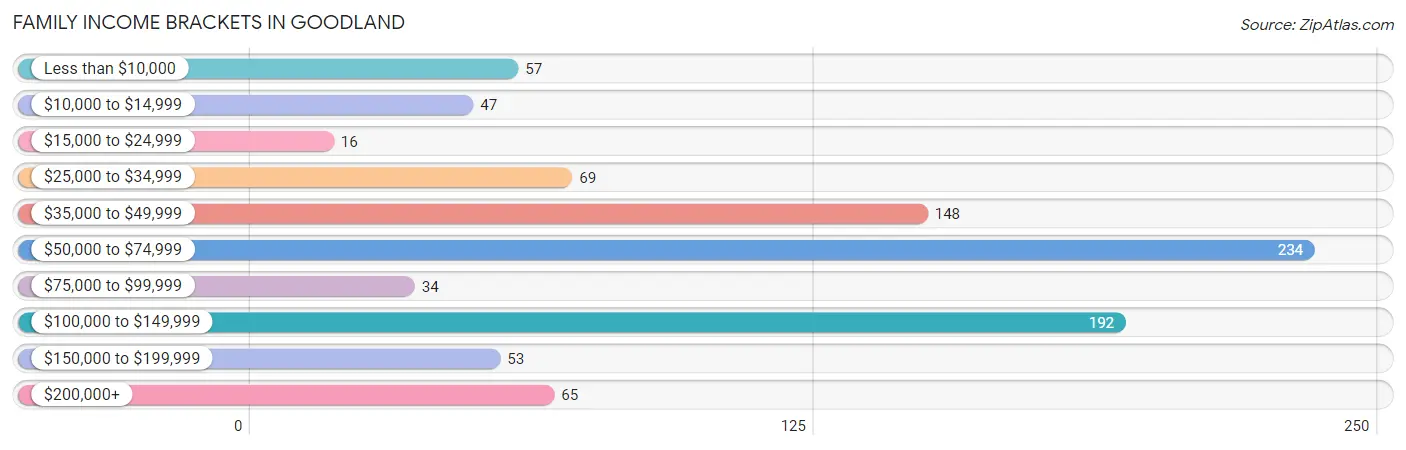
| Income Bracket | # Families | % Families |
| Less than $10,000 | 57 | 6.2% |
| $10,000 to $14,999 | 47 | 5.1% |
| $15,000 to $24,999 | 16 | 1.7% |
| $25,000 to $34,999 | 69 | 7.5% |
| $35,000 to $49,999 | 148 | 16.2% |
| $50,000 to $74,999 | 234 | 25.6% |
| $75,000 to $99,999 | 34 | 3.7% |
| $100,000 to $149,999 | 192 | 21.0% |
| $150,000 to $199,999 | 53 | 5.8% |
| $200,000+ | 65 | 7.1% |
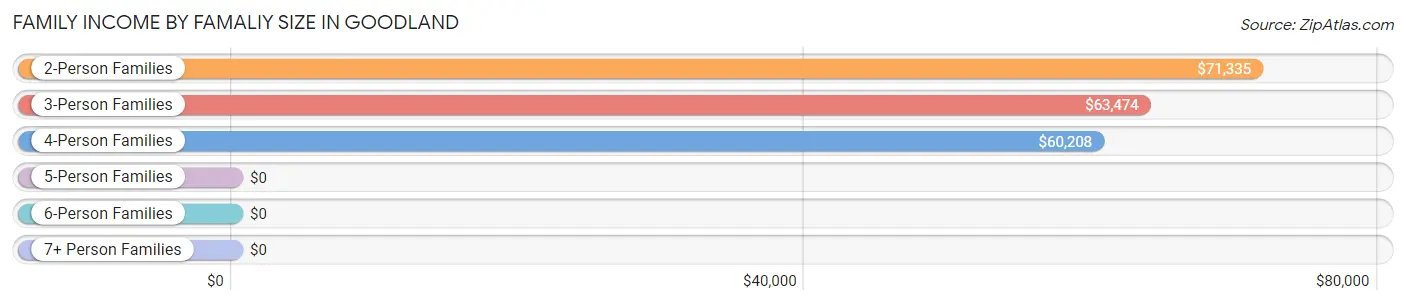
Family Income by Famaliy Size in Goodland
2-person families (519 | 56.7%) account for the highest median family income in Goodland with $71,335 per family, while 2-person families (519 | 56.7%) have the highest median income of $35,668 per family member.
| Income Bracket | # Families | Median Income |
| 2-Person Families | 519 (56.7%) | $71,335 |
| 3-Person Families | 273 (29.8%) | $63,474 |
| 4-Person Families | 78 (8.5%) | $60,208 |
| 5-Person Families | 16 (1.8%) | $0 |
| 6-Person Families | 0 (0.0%) | $0 |
| 7+ Person Families | 29 (3.2%) | $0 |
| Total | 915 (100.0%) | $64,404 |
Family Income by Number of Earners in Goodland
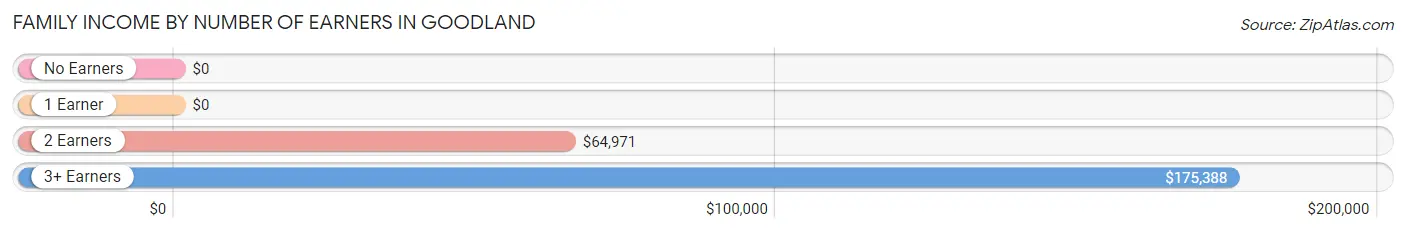
| Number of Earners | # Families | Median Income |
| No Earners | 133 (14.5%) | $0 |
| 1 Earner | 265 (29.0%) | $0 |
| 2 Earners | 436 (47.6%) | $64,971 |
| 3+ Earners | 81 (8.8%) | $175,388 |
| Total | 915 (100.0%) | $64,404 |
Household Income in Goodland
Household Income Brackets in Goodland
With 366 households falling in the category, the $50,000 to $74,999 income range is the most frequent in Goodland, accounting for 21.8% of all households. In contrast, only 54 households (3.2%) fall into the $150,000 to $199,999 income bracket, making it the least populous group.
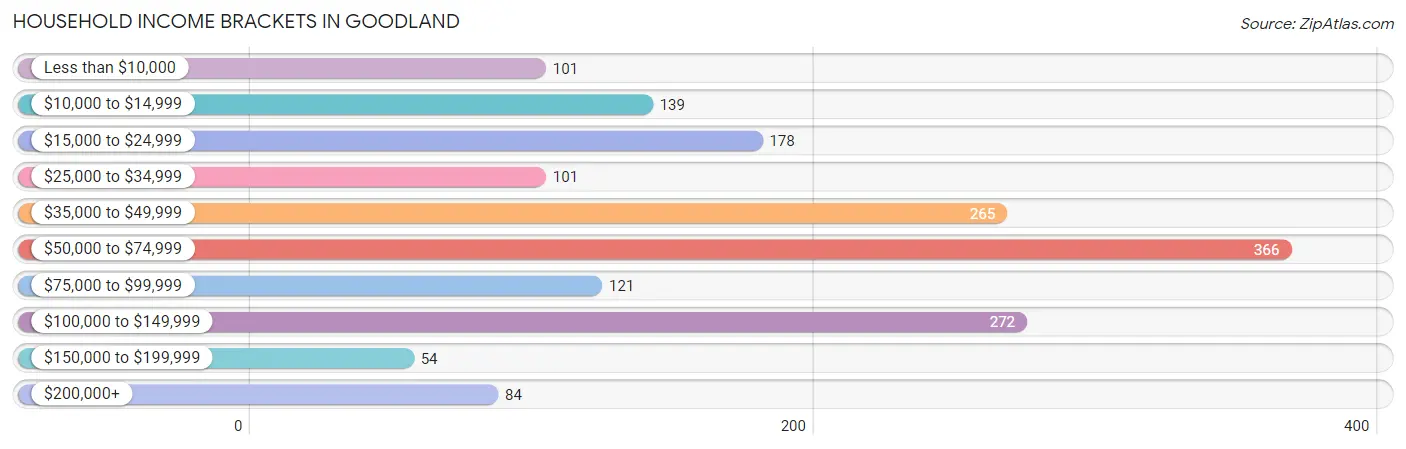
| Income Bracket | # Households | % Households |
| Less than $10,000 | 101 | 6.0% |
| $10,000 to $14,999 | 139 | 8.3% |
| $15,000 to $24,999 | 178 | 10.6% |
| $25,000 to $34,999 | 101 | 6.0% |
| $35,000 to $49,999 | 265 | 15.8% |
| $50,000 to $74,999 | 366 | 21.8% |
| $75,000 to $99,999 | 121 | 7.2% |
| $100,000 to $149,999 | 272 | 16.2% |
| $150,000 to $199,999 | 54 | 3.2% |
| $200,000+ | 84 | 5.0% |
Household Income by Householder Age in Goodland
The median household income in Goodland is $54,228, with the highest median household income of $62,645 found in the 65+ years age bracket for the primary householder. A total of 448 households (26.7%) fall into this category. Meanwhile, the 15 to 24 years age bracket for the primary householder has the lowest median household income of $30,341, with 109 households (6.5%) in this group.
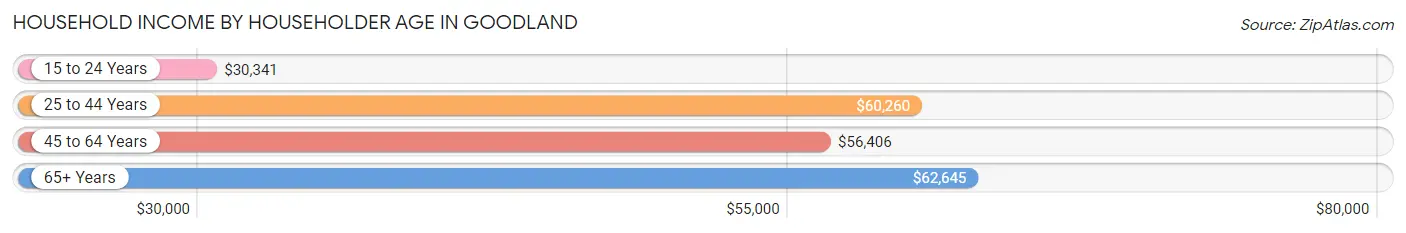
| Income Bracket | # Households | Median Income |
| 15 to 24 Years | 109 (6.5%) | $30,341 |
| 25 to 44 Years | 493 (29.4%) | $60,260 |
| 45 to 64 Years | 627 (37.4%) | $56,406 |
| 65+ Years | 448 (26.7%) | $62,645 |
| Total | 1,677 (100.0%) | $54,228 |
Poverty in Goodland
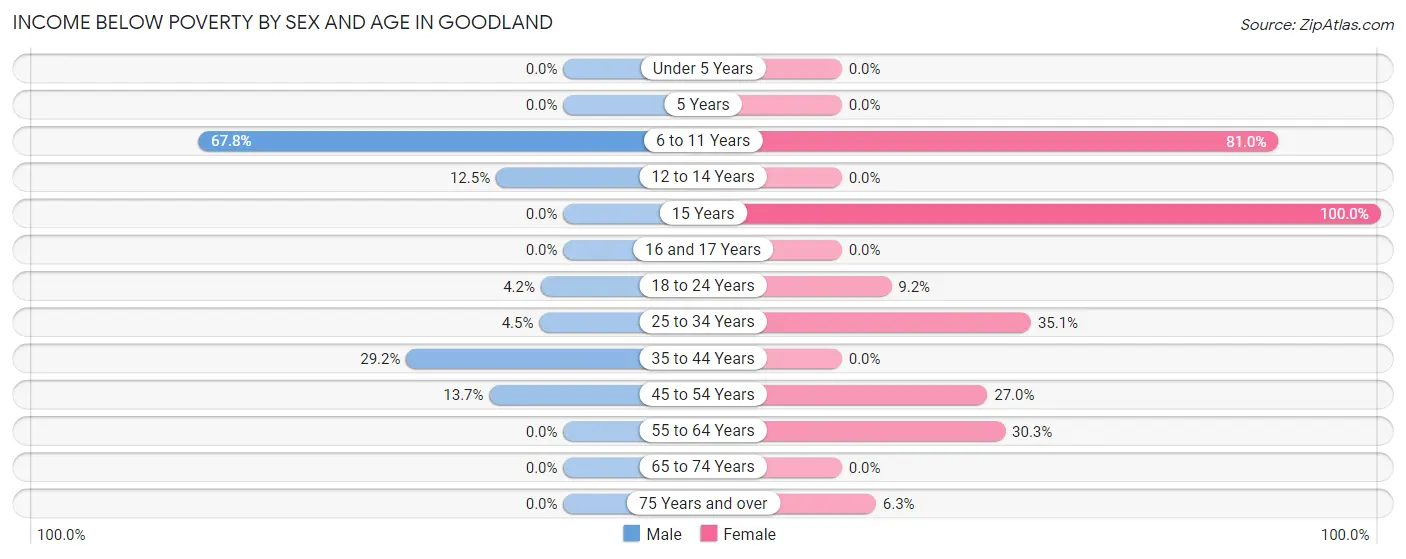
Income Below Poverty by Sex and Age in Goodland
With 10.0% poverty level for males and 16.6% for females among the residents of Goodland, 6 to 11 year old males and 15 year old females are the most vulnerable to poverty, with 61 males (67.8%) and 18 females (100.0%) in their respective age groups living below the poverty level.
| Age Bracket | Male | Female |
| Under 5 Years | 0 (0.0%) | 0 (0.0%) |
| 5 Years | 0 (0.0%) | 0 (0.0%) |
| 6 to 11 Years | 61 (67.8%) | 64 (81.0%) |
| 12 to 14 Years | 14 (12.5%) | 0 (0.0%) |
| 15 Years | 0 (0.0%) | 18 (100.0%) |
| 16 and 17 Years | 0 (0.0%) | 0 (0.0%) |
| 18 to 24 Years | 11 (4.2%) | 15 (9.2%) |
| 25 to 34 Years | 7 (4.5%) | 33 (35.1%) |
| 35 to 44 Years | 79 (29.1%) | 0 (0.0%) |
| 45 to 54 Years | 21 (13.7%) | 47 (27.0%) |
| 55 to 64 Years | 0 (0.0%) | 87 (30.3%) |
| 65 to 74 Years | 0 (0.0%) | 0 (0.0%) |
| 75 Years and over | 0 (0.0%) | 17 (6.3%) |
| Total | 193 (10.0%) | 281 (16.6%) |
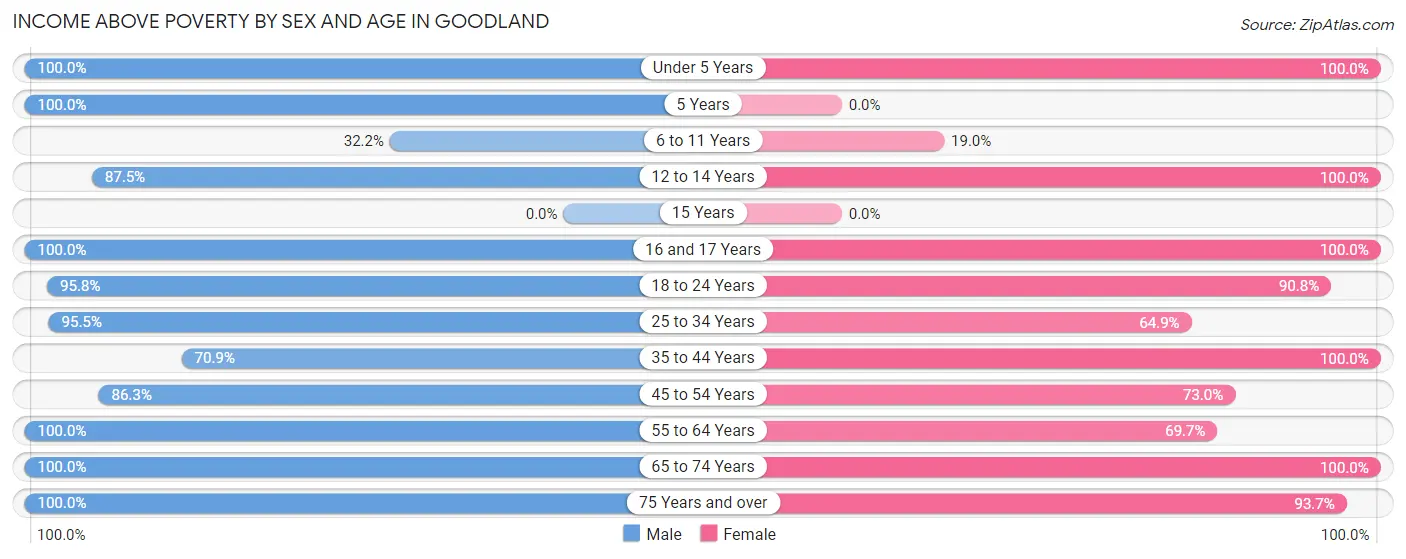
Income Above Poverty by Sex and Age in Goodland
According to the poverty statistics in Goodland, males aged under 5 years and females aged under 5 years are the age groups that are most secure financially, with 100.0% of males and 100.0% of females in these age groups living above the poverty line.
| Age Bracket | Male | Female |
| Under 5 Years | 202 (100.0%) | 84 (100.0%) |
| 5 Years | 21 (100.0%) | 0 (0.0%) |
| 6 to 11 Years | 29 (32.2%) | 15 (19.0%) |
| 12 to 14 Years | 98 (87.5%) | 85 (100.0%) |
| 15 Years | 0 (0.0%) | 0 (0.0%) |
| 16 and 17 Years | 113 (100.0%) | 73 (100.0%) |
| 18 to 24 Years | 252 (95.8%) | 148 (90.8%) |
| 25 to 34 Years | 150 (95.5%) | 61 (64.9%) |
| 35 to 44 Years | 192 (70.9%) | 272 (100.0%) |
| 45 to 54 Years | 132 (86.3%) | 127 (73.0%) |
| 55 to 64 Years | 275 (100.0%) | 200 (69.7%) |
| 65 to 74 Years | 164 (100.0%) | 96 (100.0%) |
| 75 Years and over | 115 (100.0%) | 252 (93.7%) |
| Total | 1,743 (90.0%) | 1,413 (83.4%) |
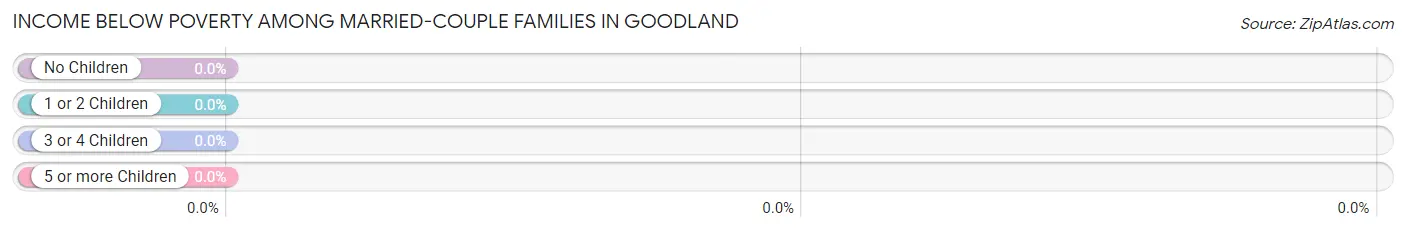
Income Below Poverty Among Married-Couple Families in Goodland
| Children | Above Poverty | Below Poverty |
| No Children | 453 (100.0%) | 0 (0.0%) |
| 1 or 2 Children | 118 (100.0%) | 0 (0.0%) |
| 3 or 4 Children | 29 (100.0%) | 0 (0.0%) |
| 5 or more Children | 0 (0.0%) | 0 (0.0%) |
| Total | 600 (100.0%) | 0 (0.0%) |
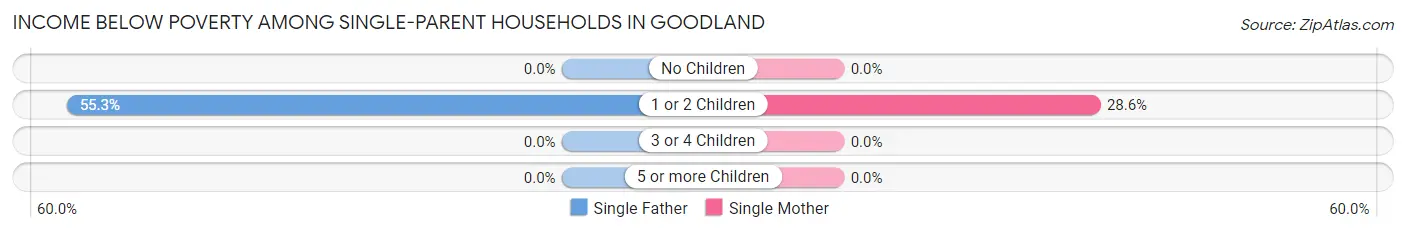
Income Below Poverty Among Single-Parent Households in Goodland
According to the poverty data in Goodland, 47.0% or 47 single-father households and 26.5% or 57 single-mother households are living below the poverty line. Among single-father households, those with 1 or 2 children have the highest poverty rate, with 47 households (55.3%) experiencing poverty. Likewise, among single-mother households, those with 1 or 2 children have the highest poverty rate, with 57 households (28.6%) falling below the poverty line.
| Children | Single Father | Single Mother |
| No Children | 0 (0.0%) | 0 (0.0%) |
| 1 or 2 Children | 47 (55.3%) | 57 (28.6%) |
| 3 or 4 Children | 0 (0.0%) | 0 (0.0%) |
| 5 or more Children | 0 (0.0%) | 0 (0.0%) |
| Total | 47 (47.0%) | 57 (26.5%) |
Income Below Poverty Among Married-Couple vs Single-Parent Households in Goodland
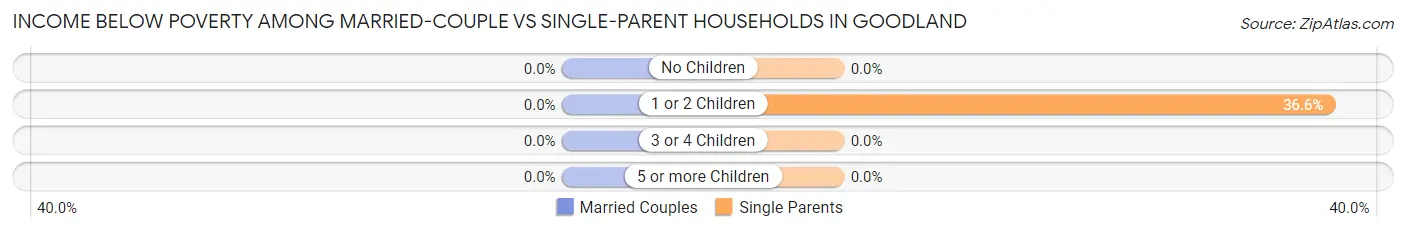
| Children | Married-Couple Families | Single-Parent Households |
| No Children | 0 (0.0%) | 0 (0.0%) |
| 1 or 2 Children | 0 (0.0%) | 104 (36.6%) |
| 3 or 4 Children | 0 (0.0%) | 0 (0.0%) |
| 5 or more Children | 0 (0.0%) | 0 (0.0%) |
| Total | 0 (0.0%) | 104 (33.0%) |
Employment Characteristics in Goodland
Employment by Class of Employer in Goodland
Among the 2,003 employed individuals in Goodland, private company employees (1,260 | 62.9%), local government employees (265 | 13.2%), and state government employees (185 | 9.2%) make up the most common classes of employment.
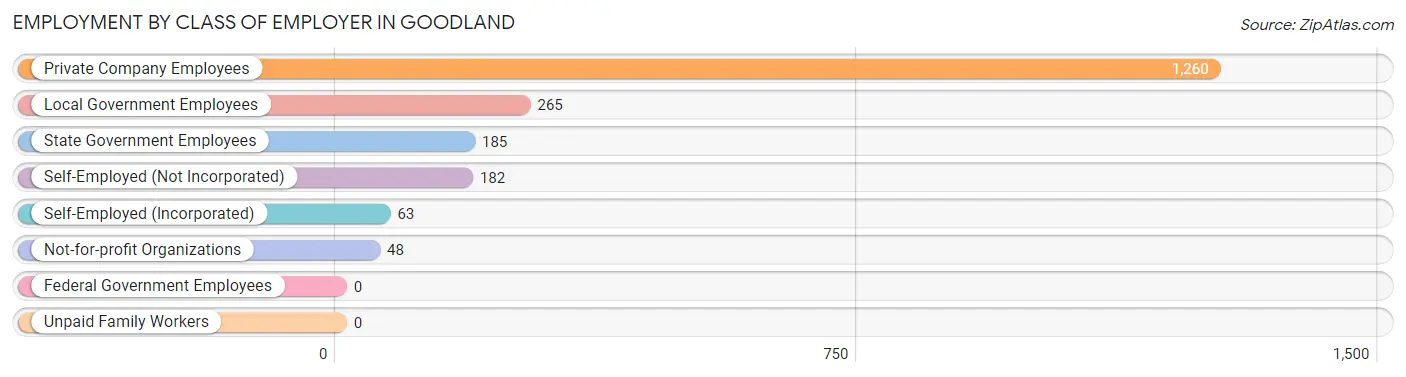
| Employer Class | # Employees | % Employees |
| Private Company Employees | 1,260 | 62.9% |
| Self-Employed (Incorporated) | 63 | 3.2% |
| Self-Employed (Not Incorporated) | 182 | 9.1% |
| Not-for-profit Organizations | 48 | 2.4% |
| Local Government Employees | 265 | 13.2% |
| State Government Employees | 185 | 9.2% |
| Federal Government Employees | 0 | 0.0% |
| Unpaid Family Workers | 0 | 0.0% |
| Total | 2,003 | 100.0% |
Employment Status by Age in Goodland
According to the labor force statistics for Goodland, out of the total population over 16 years of age (3,122), 67.0% or 2,092 individuals are in the labor force, with 3.4% or 71 of them unemployed. The age group with the highest labor force participation rate is 30 to 34 years, with 100.0% or 155 individuals in the labor force. Within the labor force, the 20 to 24 years age range has the highest percentage of unemployed individuals, with 14.8% or 42 of them being unemployed.
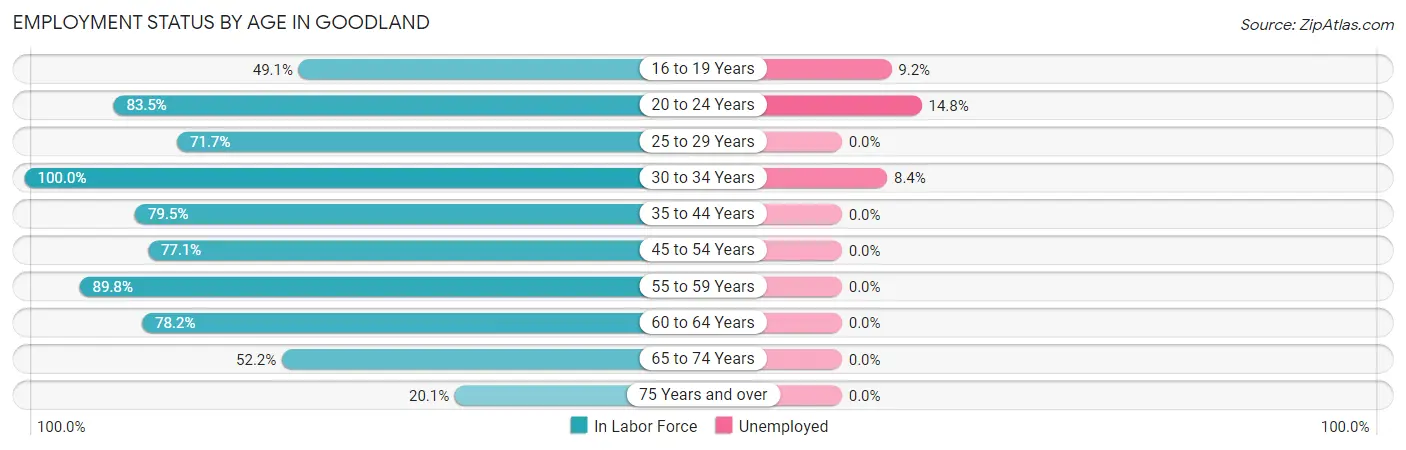
| Age Bracket | In Labor Force | Unemployed |
| 16 to 19 Years | 185 (49.1%) | 17 (9.2%) |
| 20 to 24 Years | 284 (83.5%) | 42 (14.8%) |
| 25 to 29 Years | 76 (71.7%) | 0 (0.0%) |
| 30 to 34 Years | 155 (100.0%) | 13 (8.4%) |
| 35 to 44 Years | 441 (79.5%) | 0 (0.0%) |
| 45 to 54 Years | 252 (77.1%) | 0 (0.0%) |
| 55 to 59 Years | 230 (89.8%) | 0 (0.0%) |
| 60 to 64 Years | 241 (78.2%) | 0 (0.0%) |
| 65 to 74 Years | 141 (52.2%) | 0 (0.0%) |
| 75 Years and over | 86 (20.1%) | 0 (0.0%) |
| Total | 2,092 (67.0%) | 71 (3.4%) |
Employment Status by Educational Attainment in Goodland
According to labor force statistics for Goodland, 81.7% of individuals (1,395) out of the total population between 25 and 64 years of age (1,707) are in the labor force, with 0.9% or 13 of them being unemployed. The group with the highest labor force participation rate are those with the educational attainment of bachelor's degree or higher, with 92.3% or 398 individuals in the labor force. Within the labor force, individuals with less than high school education have the highest percentage of unemployment, with 11.8% or 13 of them being unemployed.
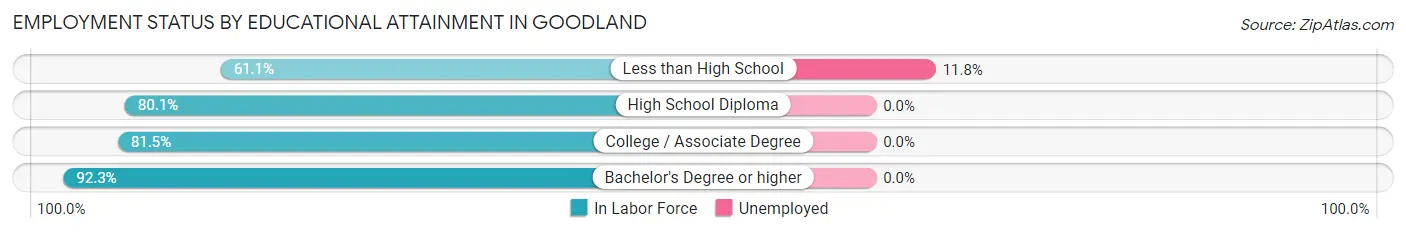
| Educational Attainment | In Labor Force | Unemployed |
| Less than High School | 110 (61.1%) | 21 (11.8%) |
| High School Diploma | 342 (80.1%) | 0 (0.0%) |
| College / Associate Degree | 545 (81.5%) | 0 (0.0%) |
| Bachelor's Degree or higher | 398 (92.3%) | 0 (0.0%) |
| Total | 1,395 (81.7%) | 15 (0.9%) |
Employment Occupations by Sex in Goodland
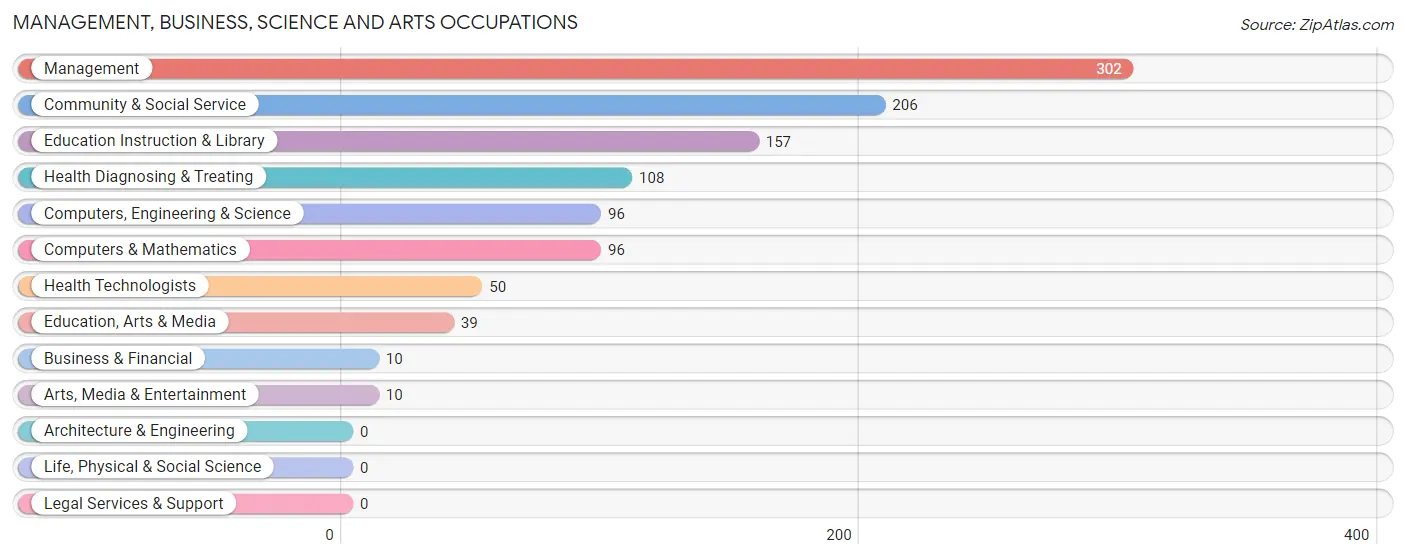
Management, Business, Science and Arts Occupations
The most common Management, Business, Science and Arts occupations in Goodland are Management (302 | 15.0%), Community & Social Service (206 | 10.2%), Education Instruction & Library (157 | 7.8%), Health Diagnosing & Treating (108 | 5.3%), and Computers, Engineering & Science (96 | 4.8%).
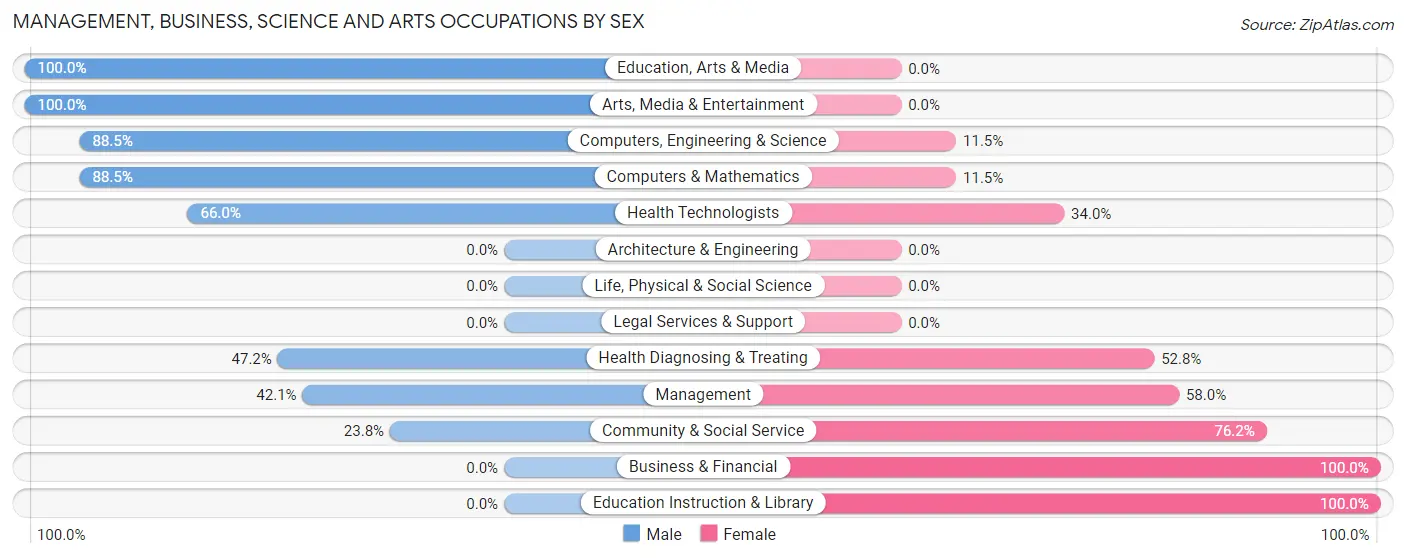
Management, Business, Science and Arts Occupations by Sex
Within the Management, Business, Science and Arts occupations in Goodland, the most male-oriented occupations are Education, Arts & Media (100.0%), Arts, Media & Entertainment (100.0%), and Computers, Engineering & Science (88.5%), while the most female-oriented occupations are Business & Financial (100.0%), Education Instruction & Library (100.0%), and Community & Social Service (76.2%).
| Occupation | Male | Female |
| Management | 127 (42.0%) | 175 (58.0%) |
| Business & Financial | 0 (0.0%) | 10 (100.0%) |
| Computers, Engineering & Science | 85 (88.5%) | 11 (11.5%) |
| Computers & Mathematics | 85 (88.5%) | 11 (11.5%) |
| Architecture & Engineering | 0 (0.0%) | 0 (0.0%) |
| Life, Physical & Social Science | 0 (0.0%) | 0 (0.0%) |
| Community & Social Service | 49 (23.8%) | 157 (76.2%) |
| Education, Arts & Media | 39 (100.0%) | 0 (0.0%) |
| Legal Services & Support | 0 (0.0%) | 0 (0.0%) |
| Education Instruction & Library | 0 (0.0%) | 157 (100.0%) |
| Arts, Media & Entertainment | 10 (100.0%) | 0 (0.0%) |
| Health Diagnosing & Treating | 51 (47.2%) | 57 (52.8%) |
| Health Technologists | 33 (66.0%) | 17 (34.0%) |
| Total (Category) | 312 (43.2%) | 410 (56.8%) |
| Total (Overall) | 1,034 (51.2%) | 985 (48.8%) |
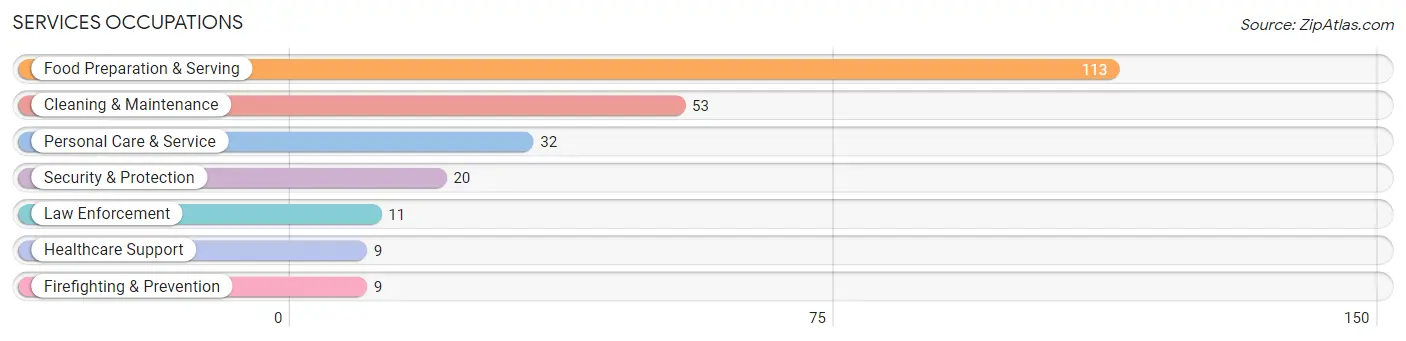
Services Occupations
The most common Services occupations in Goodland are Food Preparation & Serving (113 | 5.6%), Cleaning & Maintenance (53 | 2.6%), Personal Care & Service (32 | 1.6%), Security & Protection (20 | 1.0%), and Law Enforcement (11 | 0.5%).
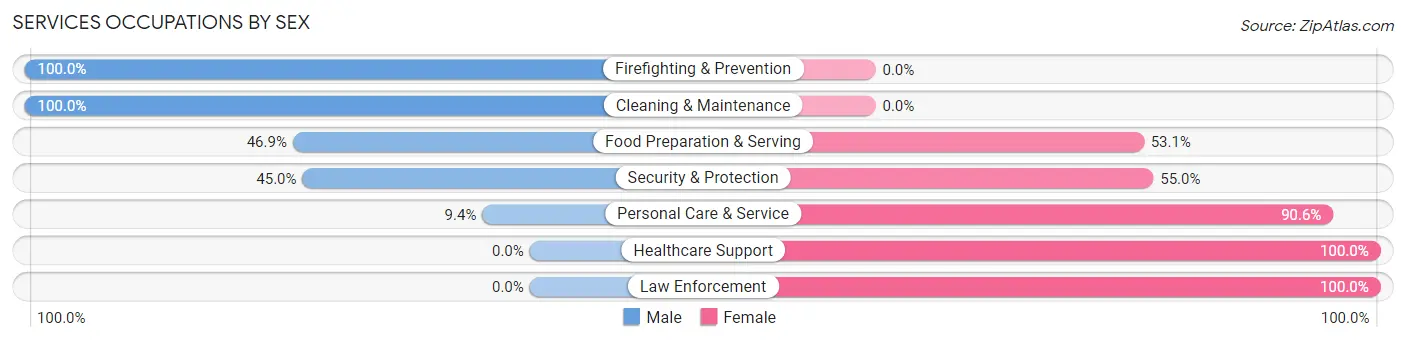
Services Occupations by Sex
Within the Services occupations in Goodland, the most male-oriented occupations are Firefighting & Prevention (100.0%), Cleaning & Maintenance (100.0%), and Food Preparation & Serving (46.9%), while the most female-oriented occupations are Healthcare Support (100.0%), Law Enforcement (100.0%), and Personal Care & Service (90.6%).
| Occupation | Male | Female |
| Healthcare Support | 0 (0.0%) | 9 (100.0%) |
| Security & Protection | 9 (45.0%) | 11 (55.0%) |
| Firefighting & Prevention | 9 (100.0%) | 0 (0.0%) |
| Law Enforcement | 0 (0.0%) | 11 (100.0%) |
| Food Preparation & Serving | 53 (46.9%) | 60 (53.1%) |
| Cleaning & Maintenance | 53 (100.0%) | 0 (0.0%) |
| Personal Care & Service | 3 (9.4%) | 29 (90.6%) |
| Total (Category) | 118 (52.0%) | 109 (48.0%) |
| Total (Overall) | 1,034 (51.2%) | 985 (48.8%) |
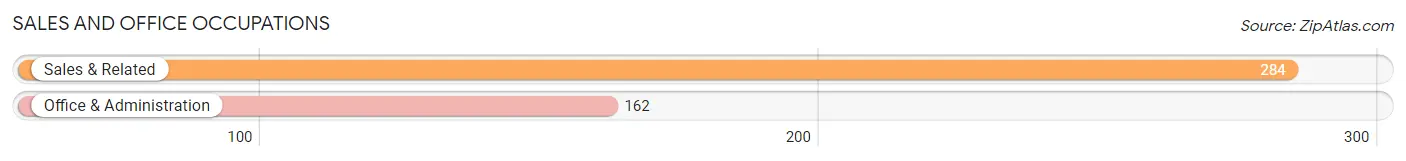
Sales and Office Occupations
The most common Sales and Office occupations in Goodland are Sales & Related (284 | 14.1%), and Office & Administration (162 | 8.0%).
Sales and Office Occupations by Sex
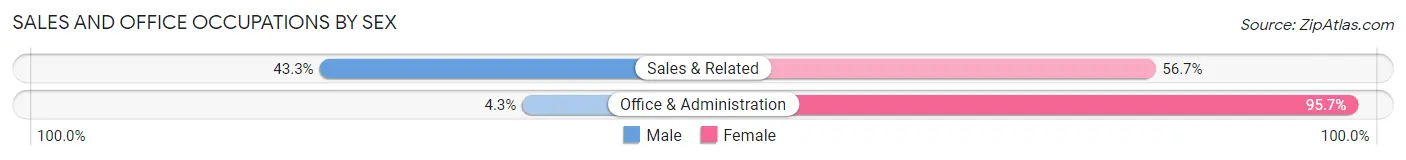
| Occupation | Male | Female |
| Sales & Related | 123 (43.3%) | 161 (56.7%) |
| Office & Administration | 7 (4.3%) | 155 (95.7%) |
| Total (Category) | 130 (29.1%) | 316 (70.9%) |
| Total (Overall) | 1,034 (51.2%) | 985 (48.8%) |
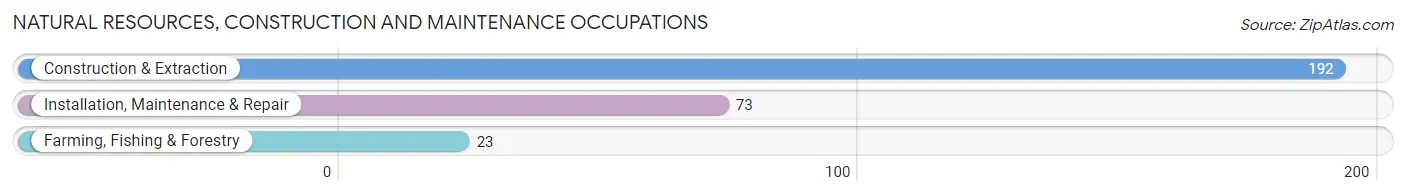
Natural Resources, Construction and Maintenance Occupations
The most common Natural Resources, Construction and Maintenance occupations in Goodland are Construction & Extraction (192 | 9.5%), Installation, Maintenance & Repair (73 | 3.6%), and Farming, Fishing & Forestry (23 | 1.1%).
Natural Resources, Construction and Maintenance Occupations by Sex
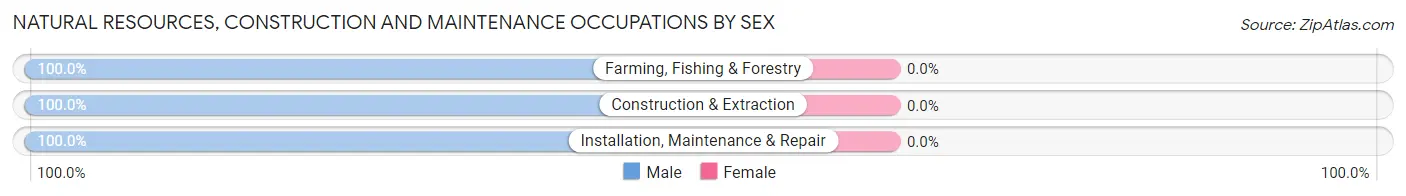
| Occupation | Male | Female |
| Farming, Fishing & Forestry | 23 (100.0%) | 0 (0.0%) |
| Construction & Extraction | 192 (100.0%) | 0 (0.0%) |
| Installation, Maintenance & Repair | 73 (100.0%) | 0 (0.0%) |
| Total (Category) | 288 (100.0%) | 0 (0.0%) |
| Total (Overall) | 1,034 (51.2%) | 985 (48.8%) |
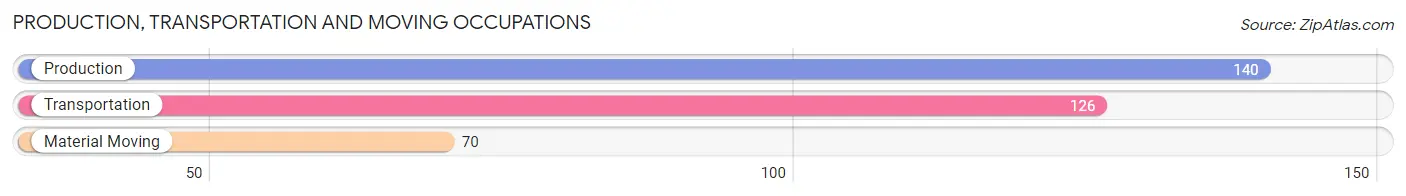
Production, Transportation and Moving Occupations
The most common Production, Transportation and Moving occupations in Goodland are Production (140 | 6.9%), Transportation (126 | 6.2%), and Material Moving (70 | 3.5%).
Production, Transportation and Moving Occupations by Sex
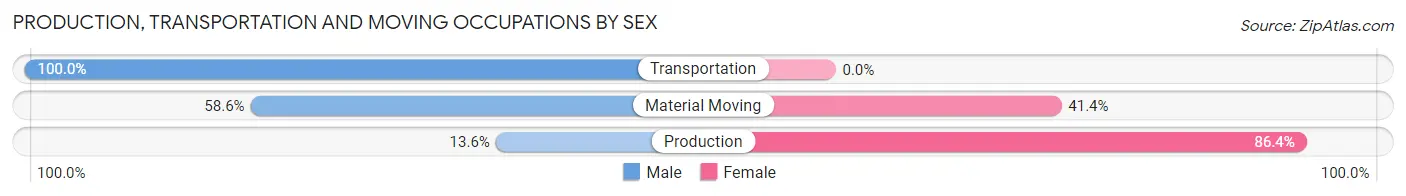
| Occupation | Male | Female |
| Production | 19 (13.6%) | 121 (86.4%) |
| Transportation | 126 (100.0%) | 0 (0.0%) |
| Material Moving | 41 (58.6%) | 29 (41.4%) |
| Total (Category) | 186 (55.4%) | 150 (44.6%) |
| Total (Overall) | 1,034 (51.2%) | 985 (48.8%) |
Employment Industries by Sex in Goodland
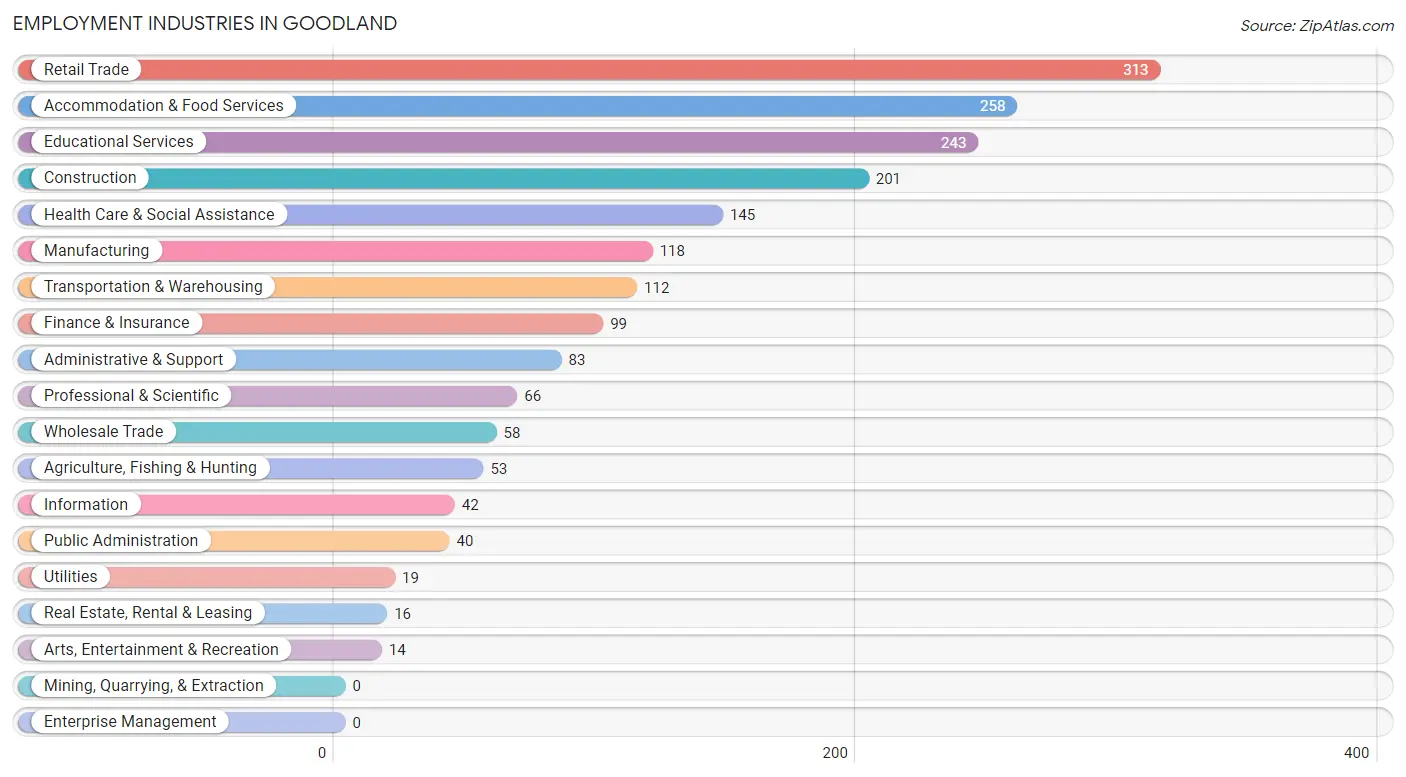
Employment Industries in Goodland
The major employment industries in Goodland include Retail Trade (313 | 15.5%), Accommodation & Food Services (258 | 12.8%), Educational Services (243 | 12.0%), Construction (201 | 10.0%), and Health Care & Social Assistance (145 | 7.2%).
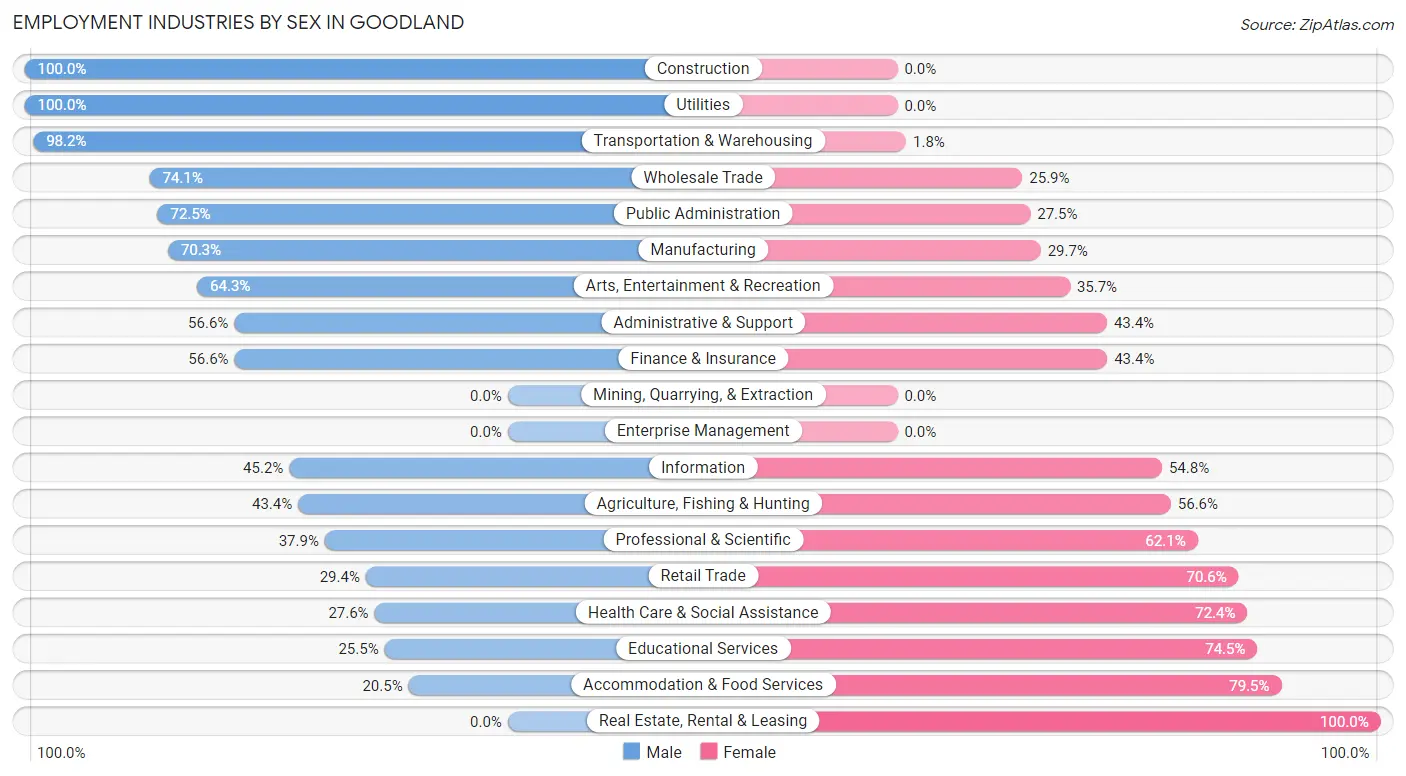
Employment Industries by Sex in Goodland
The Goodland industries that see more men than women are Construction (100.0%), Utilities (100.0%), and Transportation & Warehousing (98.2%), whereas the industries that tend to have a higher number of women are Real Estate, Rental & Leasing (100.0%), Accommodation & Food Services (79.5%), and Educational Services (74.5%).
| Industry | Male | Female |
| Agriculture, Fishing & Hunting | 23 (43.4%) | 30 (56.6%) |
| Mining, Quarrying, & Extraction | 0 (0.0%) | 0 (0.0%) |
| Construction | 201 (100.0%) | 0 (0.0%) |
| Manufacturing | 83 (70.3%) | 35 (29.7%) |
| Wholesale Trade | 43 (74.1%) | 15 (25.9%) |
| Retail Trade | 92 (29.4%) | 221 (70.6%) |
| Transportation & Warehousing | 110 (98.2%) | 2 (1.8%) |
| Utilities | 19 (100.0%) | 0 (0.0%) |
| Information | 19 (45.2%) | 23 (54.8%) |
| Finance & Insurance | 56 (56.6%) | 43 (43.4%) |
| Real Estate, Rental & Leasing | 0 (0.0%) | 16 (100.0%) |
| Professional & Scientific | 25 (37.9%) | 41 (62.1%) |
| Enterprise Management | 0 (0.0%) | 0 (0.0%) |
| Administrative & Support | 47 (56.6%) | 36 (43.4%) |
| Educational Services | 62 (25.5%) | 181 (74.5%) |
| Health Care & Social Assistance | 40 (27.6%) | 105 (72.4%) |
| Arts, Entertainment & Recreation | 9 (64.3%) | 5 (35.7%) |
| Accommodation & Food Services | 53 (20.5%) | 205 (79.5%) |
| Public Administration | 29 (72.5%) | 11 (27.5%) |
| Total | 1,034 (51.2%) | 985 (48.8%) |
Education in Goodland
School Enrollment in Goodland
The most common levels of schooling among the 1,041 students in Goodland are high school (346 | 33.2%), middle school (258 | 24.8%), and college / undergraduate (234 | 22.5%).
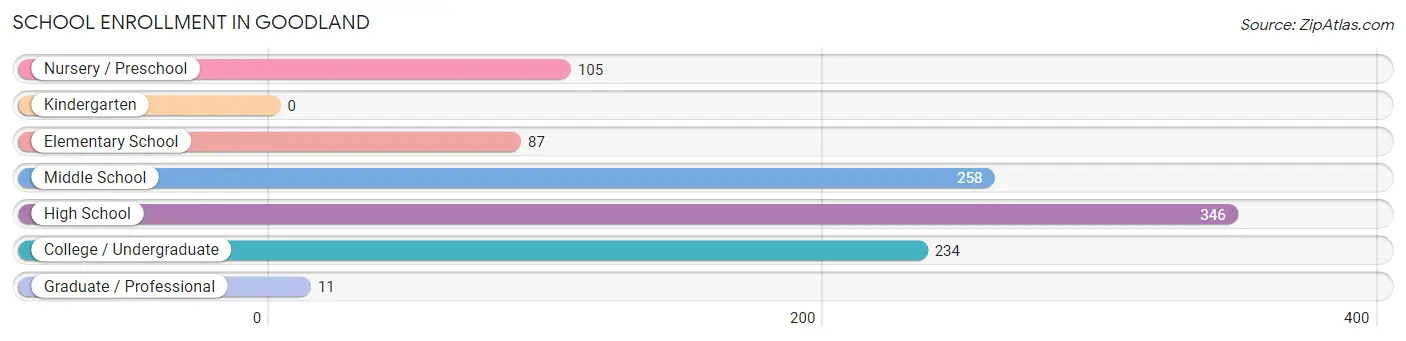
| School Level | # Students | % Students |
| Nursery / Preschool | 105 | 10.1% |
| Kindergarten | 0 | 0.0% |
| Elementary School | 87 | 8.4% |
| Middle School | 258 | 24.8% |
| High School | 346 | 33.2% |
| College / Undergraduate | 234 | 22.5% |
| Graduate / Professional | 11 | 1.1% |
| Total | 1,041 | 100.0% |
School Enrollment by Age by Funding Source in Goodland
Out of a total of 1,041 students who are enrolled in schools in Goodland, 98 (9.4%) attend a private institution, while the remaining 943 (90.6%) are enrolled in public schools. The age group of 20 to 24 year olds has the highest likelihood of being enrolled in private schools, with 57 (51.3% in the age bracket) enrolled. Conversely, the age group of 3 to 4 year olds has the lowest likelihood of being enrolled in a private school, with 84 (100.0% in the age bracket) attending a public institution.
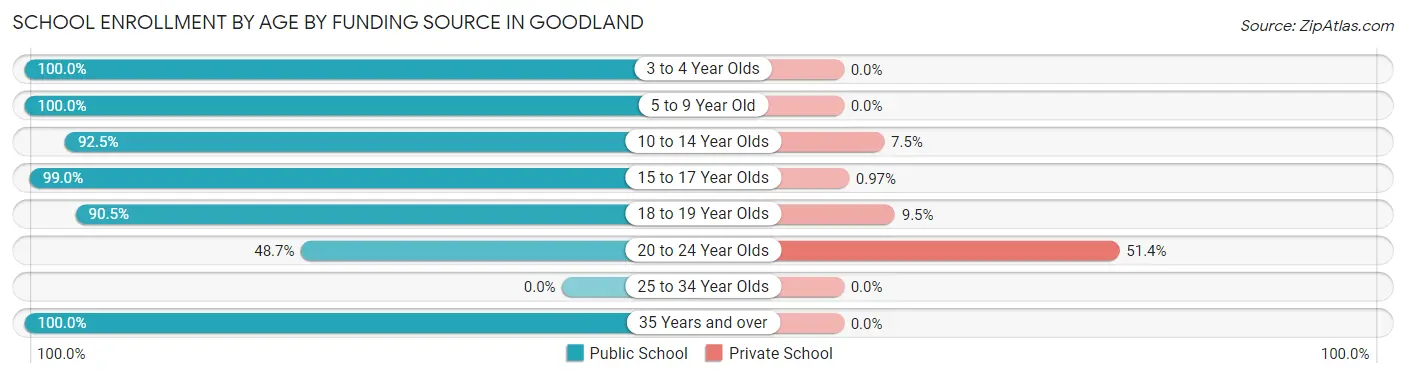
| Age Bracket | Public School | Private School |
| 3 to 4 Year Olds | 84 (100.0%) | 0 (0.0%) |
| 5 to 9 Year Old | 108 (100.0%) | 0 (0.0%) |
| 10 to 14 Year Olds | 258 (92.5%) | 21 (7.5%) |
| 15 to 17 Year Olds | 204 (99.0%) | 2 (1.0%) |
| 18 to 19 Year Olds | 171 (90.5%) | 18 (9.5%) |
| 20 to 24 Year Olds | 54 (48.6%) | 57 (51.3%) |
| 25 to 34 Year Olds | 0 (0.0%) | 0 (0.0%) |
| 35 Years and over | 64 (100.0%) | 0 (0.0%) |
| Total | 943 (90.6%) | 98 (9.4%) |
Educational Attainment by Field of Study in Goodland
Education (199 | 34.8%), bio, nature & agricultural (118 | 20.6%), business (85 | 14.9%), social sciences (61 | 10.7%), and arts & humanities (37 | 6.5%) are the most common fields of study among 572 individuals in Goodland who have obtained a bachelor's degree or higher.
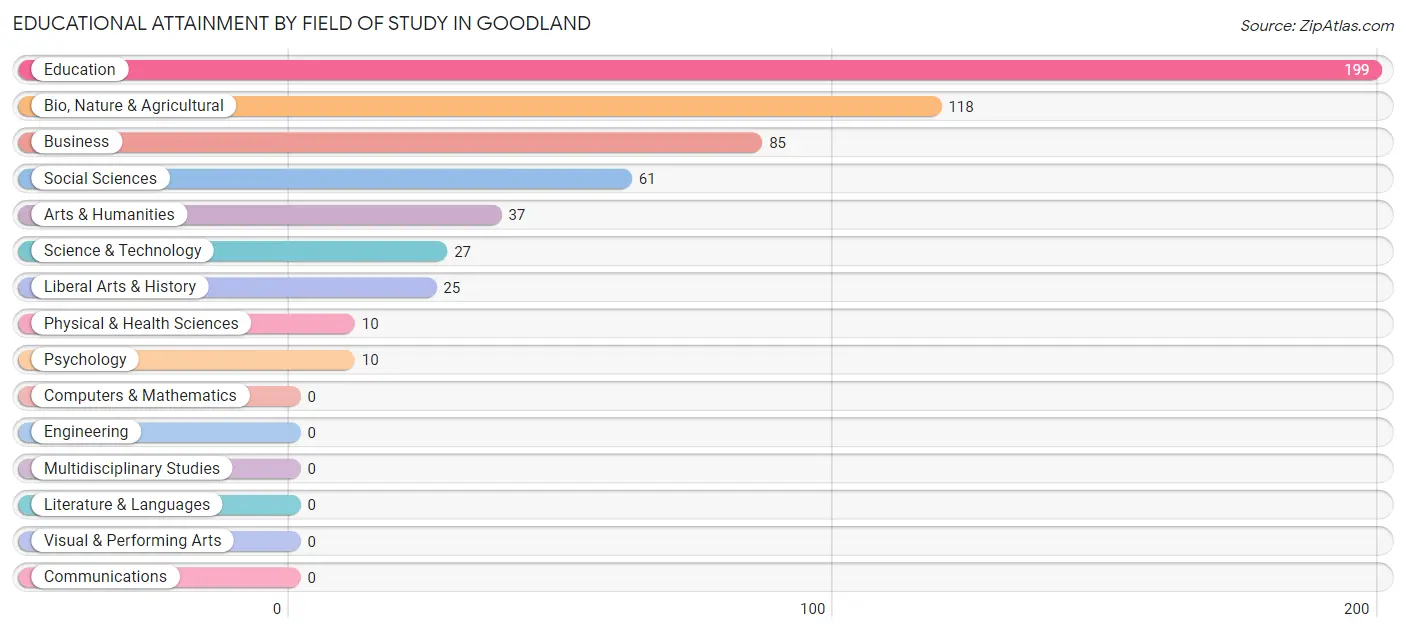
| Field of Study | # Graduates | % Graduates |
| Computers & Mathematics | 0 | 0.0% |
| Bio, Nature & Agricultural | 118 | 20.6% |
| Physical & Health Sciences | 10 | 1.8% |
| Psychology | 10 | 1.8% |
| Social Sciences | 61 | 10.7% |
| Engineering | 0 | 0.0% |
| Multidisciplinary Studies | 0 | 0.0% |
| Science & Technology | 27 | 4.7% |
| Business | 85 | 14.9% |
| Education | 199 | 34.8% |
| Literature & Languages | 0 | 0.0% |
| Liberal Arts & History | 25 | 4.4% |
| Visual & Performing Arts | 0 | 0.0% |
| Communications | 0 | 0.0% |
| Arts & Humanities | 37 | 6.5% |
| Total | 572 | 100.0% |
Transportation & Commute in Goodland
Vehicle Availability by Sex in Goodland
The most prevalent vehicle ownership categories in Goodland are males with 2 vehicles (479, accounting for 47.8%) and females with 2 vehicles (345, making up 51.4%).
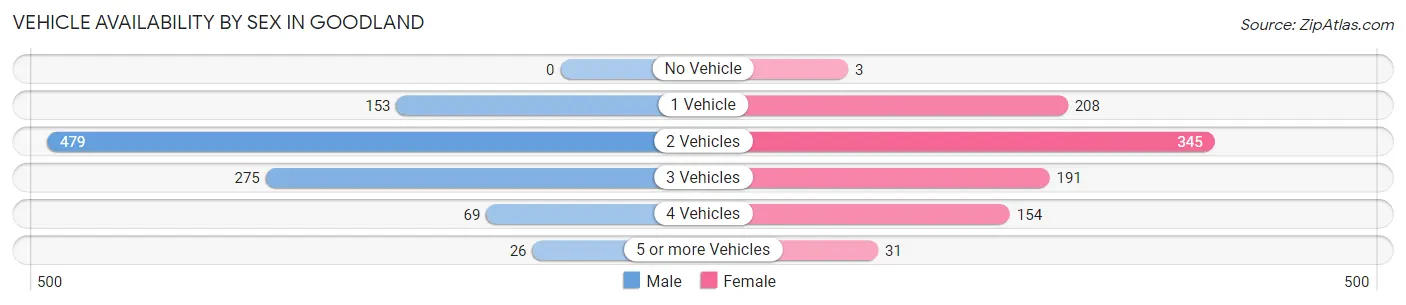
| Vehicles Available | Male | Female |
| No Vehicle | 0 (0.0%) | 3 (0.3%) |
| 1 Vehicle | 153 (15.3%) | 208 (22.3%) |
| 2 Vehicles | 479 (47.8%) | 345 (37.0%) |
| 3 Vehicles | 275 (27.5%) | 191 (20.5%) |
| 4 Vehicles | 69 (6.9%) | 154 (16.5%) |
| 5 or more Vehicles | 26 (2.6%) | 31 (3.3%) |
| Total | 1,002 (100.0%) | 932 (100.0%) |
Commute Time in Goodland
The most frequently occuring commute durations in Goodland are 5 to 9 minutes (710 commuters, 41.1%), less than 5 minutes (460 commuters, 26.6%), and 10 to 14 minutes (333 commuters, 19.3%).
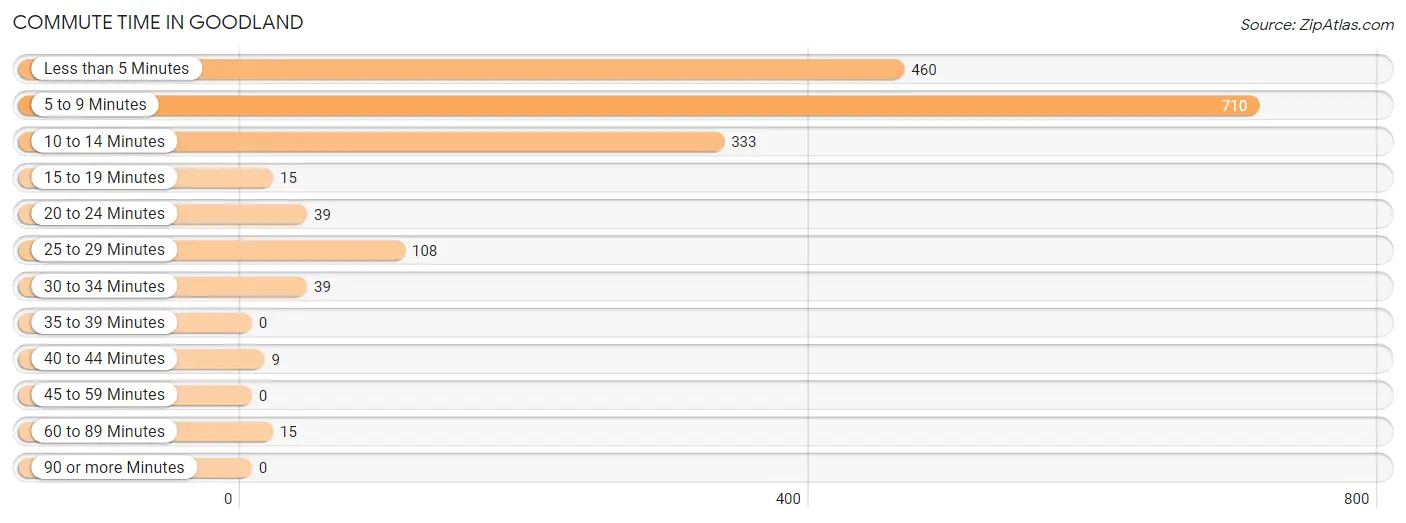
| Commute Time | # Commuters | % Commuters |
| Less than 5 Minutes | 460 | 26.6% |
| 5 to 9 Minutes | 710 | 41.1% |
| 10 to 14 Minutes | 333 | 19.3% |
| 15 to 19 Minutes | 15 | 0.9% |
| 20 to 24 Minutes | 39 | 2.3% |
| 25 to 29 Minutes | 108 | 6.2% |
| 30 to 34 Minutes | 39 | 2.3% |
| 35 to 39 Minutes | 0 | 0.0% |
| 40 to 44 Minutes | 9 | 0.5% |
| 45 to 59 Minutes | 0 | 0.0% |
| 60 to 89 Minutes | 15 | 0.9% |
| 90 or more Minutes | 0 | 0.0% |
Commute Time by Sex in Goodland
The most common commute times in Goodland are 5 to 9 minutes (434 commuters, 52.0%) for males and less than 5 minutes (347 commuters, 38.8%) for females.
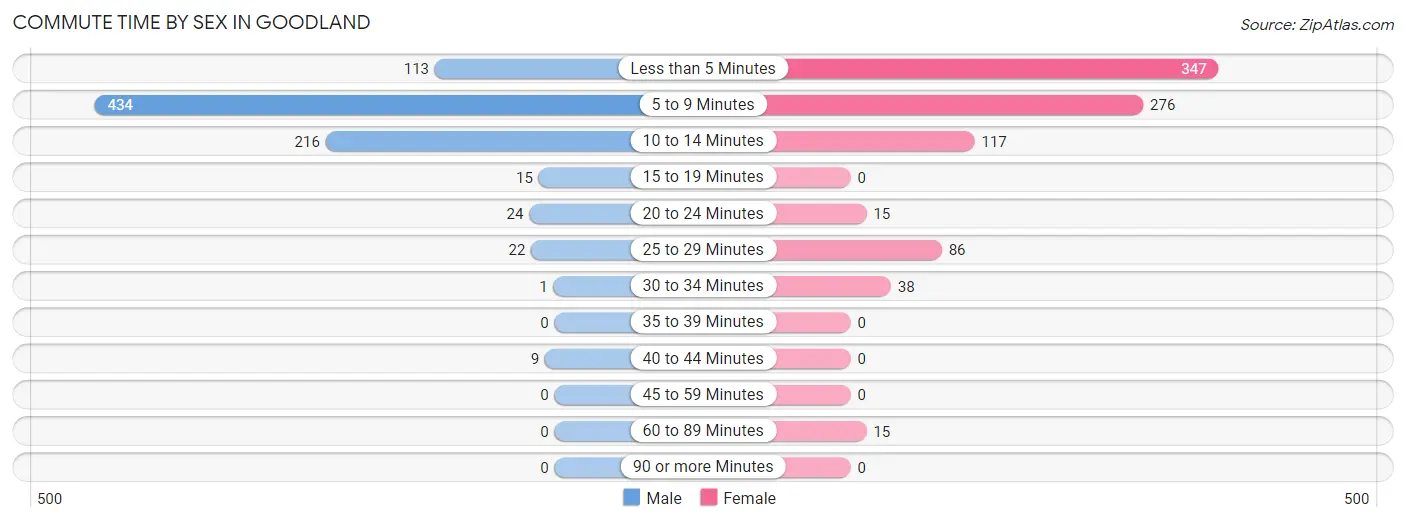
| Commute Time | Male | Female |
| Less than 5 Minutes | 113 (13.6%) | 347 (38.8%) |
| 5 to 9 Minutes | 434 (52.0%) | 276 (30.9%) |
| 10 to 14 Minutes | 216 (25.9%) | 117 (13.1%) |
| 15 to 19 Minutes | 15 (1.8%) | 0 (0.0%) |
| 20 to 24 Minutes | 24 (2.9%) | 15 (1.7%) |
| 25 to 29 Minutes | 22 (2.6%) | 86 (9.6%) |
| 30 to 34 Minutes | 1 (0.1%) | 38 (4.3%) |
| 35 to 39 Minutes | 0 (0.0%) | 0 (0.0%) |
| 40 to 44 Minutes | 9 (1.1%) | 0 (0.0%) |
| 45 to 59 Minutes | 0 (0.0%) | 0 (0.0%) |
| 60 to 89 Minutes | 0 (0.0%) | 15 (1.7%) |
| 90 or more Minutes | 0 (0.0%) | 0 (0.0%) |
Time of Departure to Work by Sex in Goodland
The most frequent times of departure to work in Goodland are 6:30 AM to 6:59 AM (214, 25.7%) for males and 4:00 PM to 11:59 PM (138, 15.4%) for females.
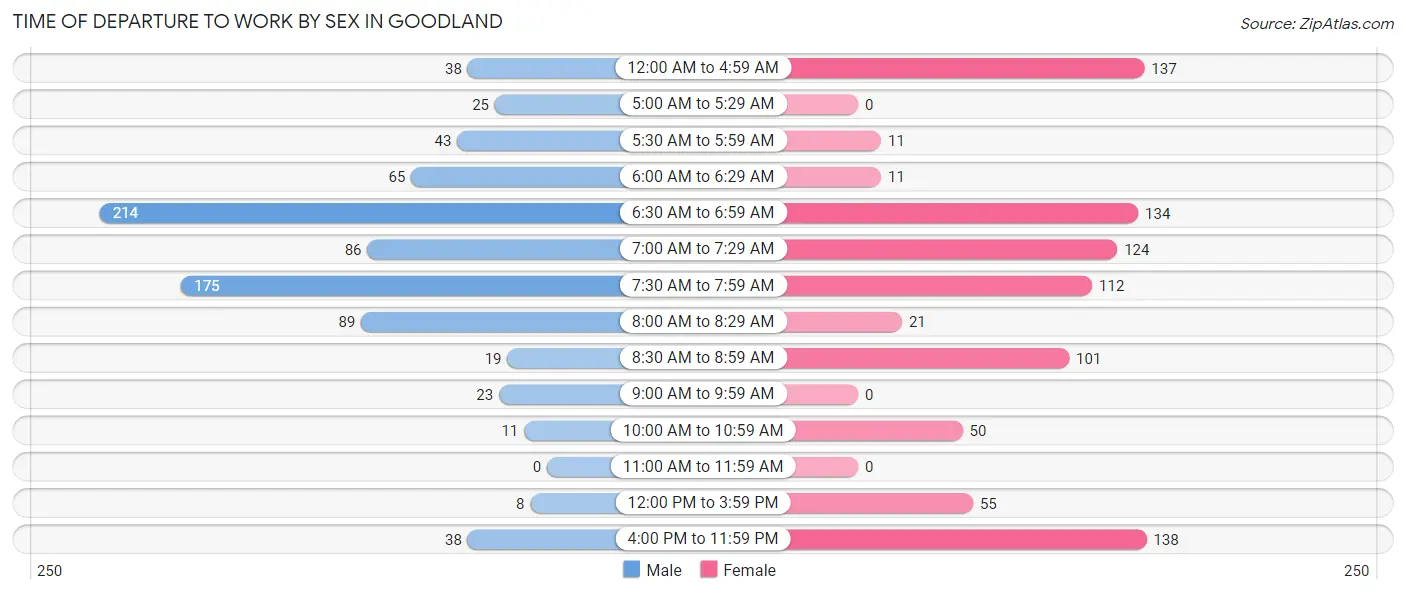
| Time of Departure | Male | Female |
| 12:00 AM to 4:59 AM | 38 (4.6%) | 137 (15.3%) |
| 5:00 AM to 5:29 AM | 25 (3.0%) | 0 (0.0%) |
| 5:30 AM to 5:59 AM | 43 (5.2%) | 11 (1.2%) |
| 6:00 AM to 6:29 AM | 65 (7.8%) | 11 (1.2%) |
| 6:30 AM to 6:59 AM | 214 (25.7%) | 134 (15.0%) |
| 7:00 AM to 7:29 AM | 86 (10.3%) | 124 (13.9%) |
| 7:30 AM to 7:59 AM | 175 (21.0%) | 112 (12.5%) |
| 8:00 AM to 8:29 AM | 89 (10.7%) | 21 (2.4%) |
| 8:30 AM to 8:59 AM | 19 (2.3%) | 101 (11.3%) |
| 9:00 AM to 9:59 AM | 23 (2.8%) | 0 (0.0%) |
| 10:00 AM to 10:59 AM | 11 (1.3%) | 50 (5.6%) |
| 11:00 AM to 11:59 AM | 0 (0.0%) | 0 (0.0%) |
| 12:00 PM to 3:59 PM | 8 (1.0%) | 55 (6.1%) |
| 4:00 PM to 11:59 PM | 38 (4.6%) | 138 (15.4%) |
| Total | 834 (100.0%) | 894 (100.0%) |
Housing Occupancy in Goodland
Occupancy by Ownership in Goodland
Of the total 1,677 dwellings in Goodland, owner-occupied units account for 931 (55.5%), while renter-occupied units make up 746 (44.5%).
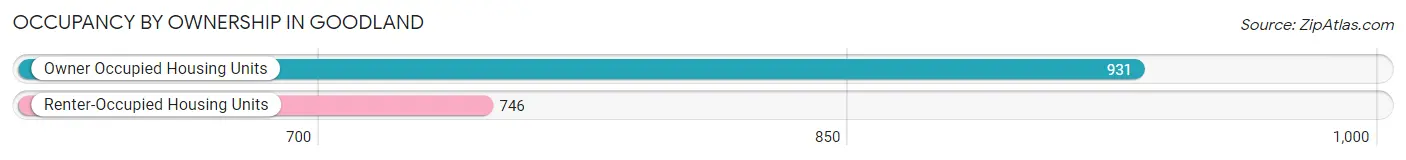
| Occupancy | # Housing Units | % Housing Units |
| Owner Occupied Housing Units | 931 | 55.5% |
| Renter-Occupied Housing Units | 746 | 44.5% |
| Total Occupied Housing Units | 1,677 | 100.0% |
Occupancy by Household Size in Goodland
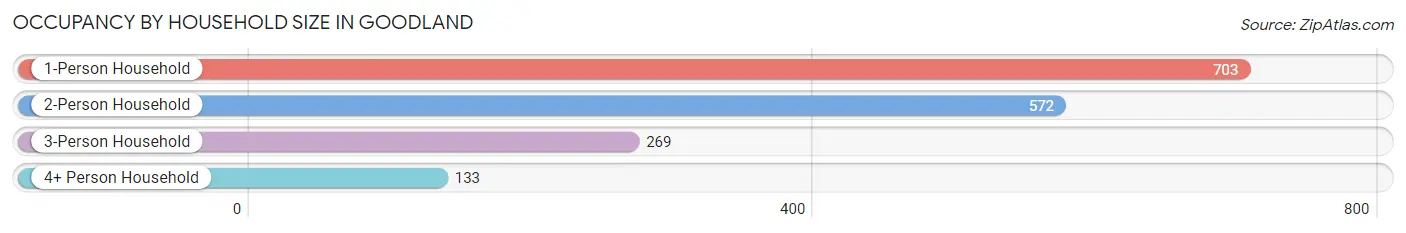
| Household Size | # Housing Units | % Housing Units |
| 1-Person Household | 703 | 41.9% |
| 2-Person Household | 572 | 34.1% |
| 3-Person Household | 269 | 16.0% |
| 4+ Person Household | 133 | 7.9% |
| Total Housing Units | 1,677 | 100.0% |
Occupancy by Ownership by Household Size in Goodland
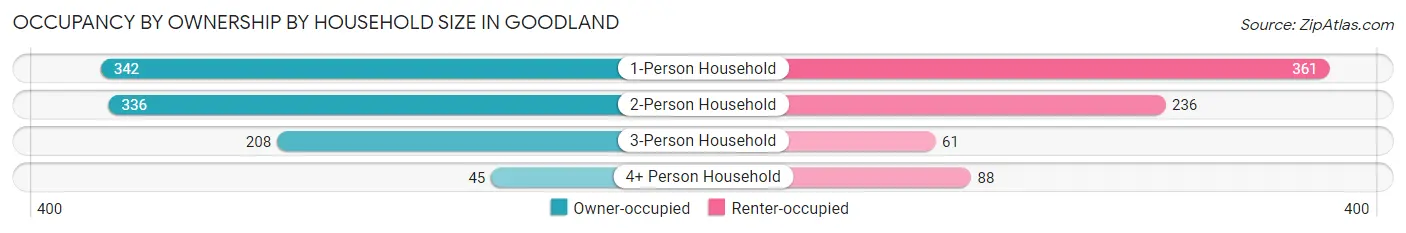
| Household Size | Owner-occupied | Renter-occupied |
| 1-Person Household | 342 (48.6%) | 361 (51.3%) |
| 2-Person Household | 336 (58.7%) | 236 (41.3%) |
| 3-Person Household | 208 (77.3%) | 61 (22.7%) |
| 4+ Person Household | 45 (33.8%) | 88 (66.2%) |
| Total Housing Units | 931 (55.5%) | 746 (44.5%) |
Occupancy by Educational Attainment in Goodland
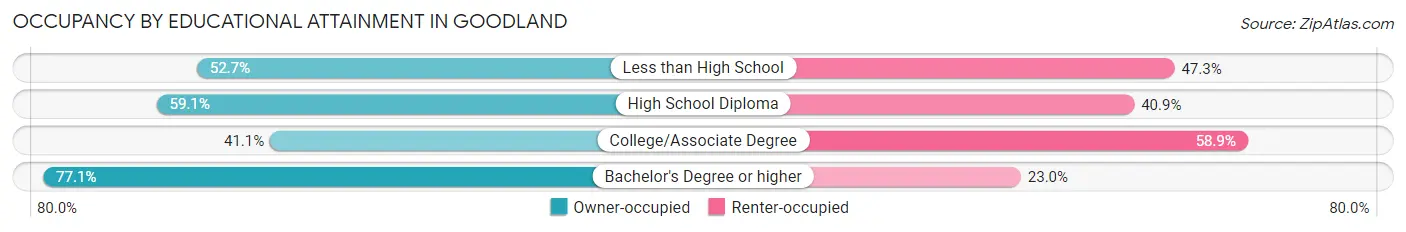
| Household Size | Owner-occupied | Renter-occupied |
| Less than High School | 108 (52.7%) | 97 (47.3%) |
| High School Diploma | 228 (59.1%) | 158 (40.9%) |
| College/Associate Degree | 276 (41.1%) | 396 (58.9%) |
| Bachelor's Degree or higher | 319 (77.0%) | 95 (23.0%) |
Occupancy by Age of Householder in Goodland
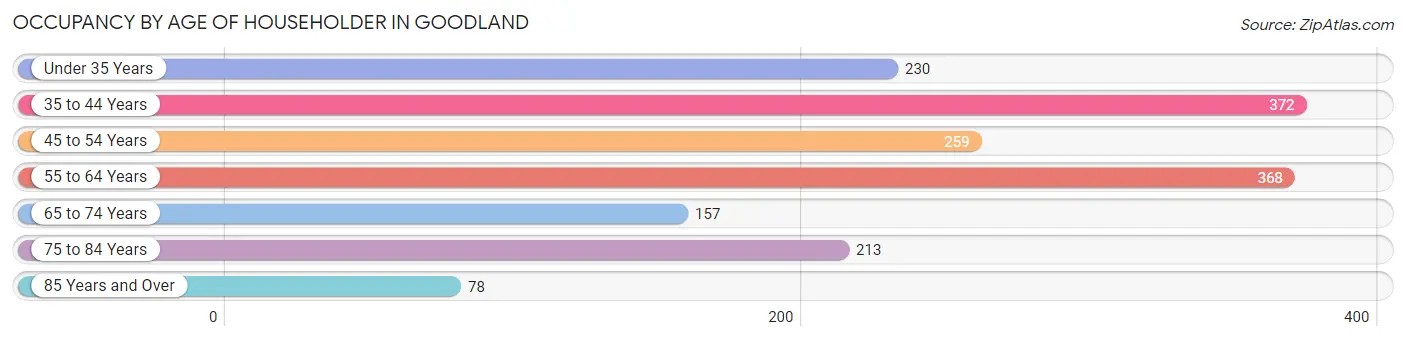
| Age Bracket | # Households | % Households |
| Under 35 Years | 230 | 13.7% |
| 35 to 44 Years | 372 | 22.2% |
| 45 to 54 Years | 259 | 15.4% |
| 55 to 64 Years | 368 | 21.9% |
| 65 to 74 Years | 157 | 9.4% |
| 75 to 84 Years | 213 | 12.7% |
| 85 Years and Over | 78 | 4.6% |
| Total | 1,677 | 100.0% |
Housing Finances in Goodland
Median Income by Occupancy in Goodland
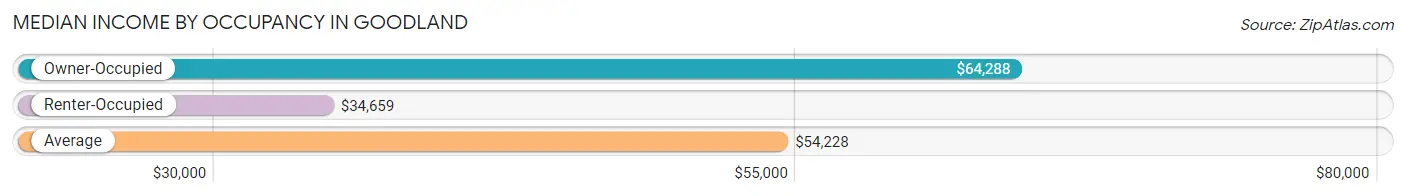
| Occupancy Type | # Households | Median Income |
| Owner-Occupied | 931 (55.5%) | $64,288 |
| Renter-Occupied | 746 (44.5%) | $34,659 |
| Average | 1,677 (100.0%) | $54,228 |
Occupancy by Householder Income Bracket in Goodland
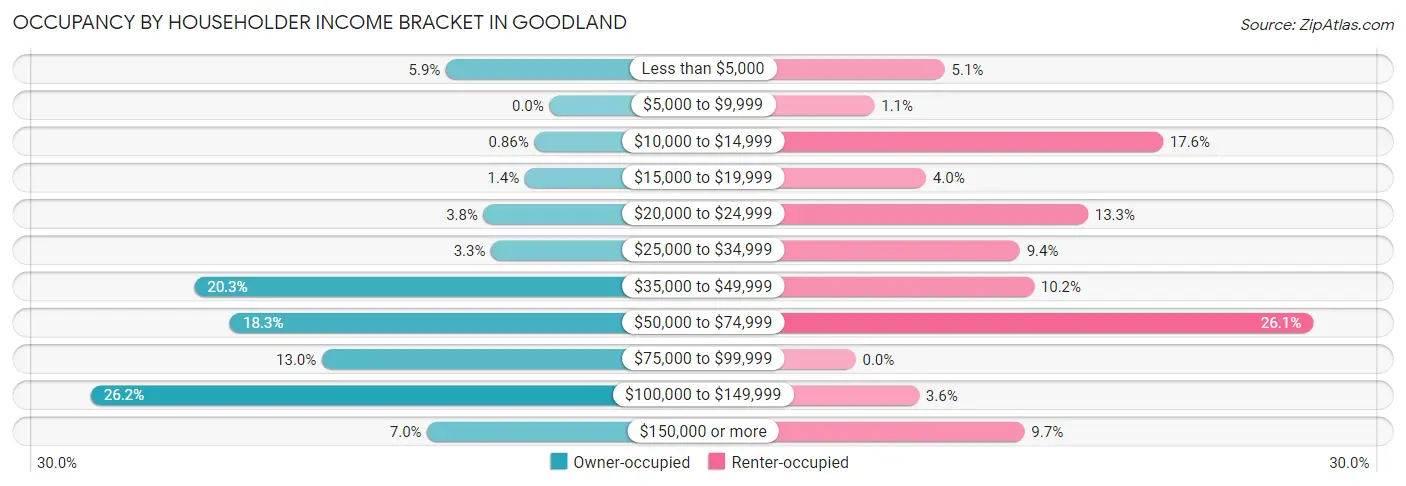
| Income Bracket | Owner-occupied | Renter-occupied |
| Less than $5,000 | 55 (5.9%) | 38 (5.1%) |
| $5,000 to $9,999 | 0 (0.0%) | 8 (1.1%) |
| $10,000 to $14,999 | 8 (0.9%) | 131 (17.6%) |
| $15,000 to $19,999 | 13 (1.4%) | 30 (4.0%) |
| $20,000 to $24,999 | 35 (3.8%) | 99 (13.3%) |
| $25,000 to $34,999 | 31 (3.3%) | 70 (9.4%) |
| $35,000 to $49,999 | 189 (20.3%) | 76 (10.2%) |
| $50,000 to $74,999 | 170 (18.3%) | 195 (26.1%) |
| $75,000 to $99,999 | 121 (13.0%) | 0 (0.0%) |
| $100,000 to $149,999 | 244 (26.2%) | 27 (3.6%) |
| $150,000 or more | 65 (7.0%) | 72 (9.7%) |
| Total | 931 (100.0%) | 746 (100.0%) |
Monthly Housing Cost Tiers in Goodland
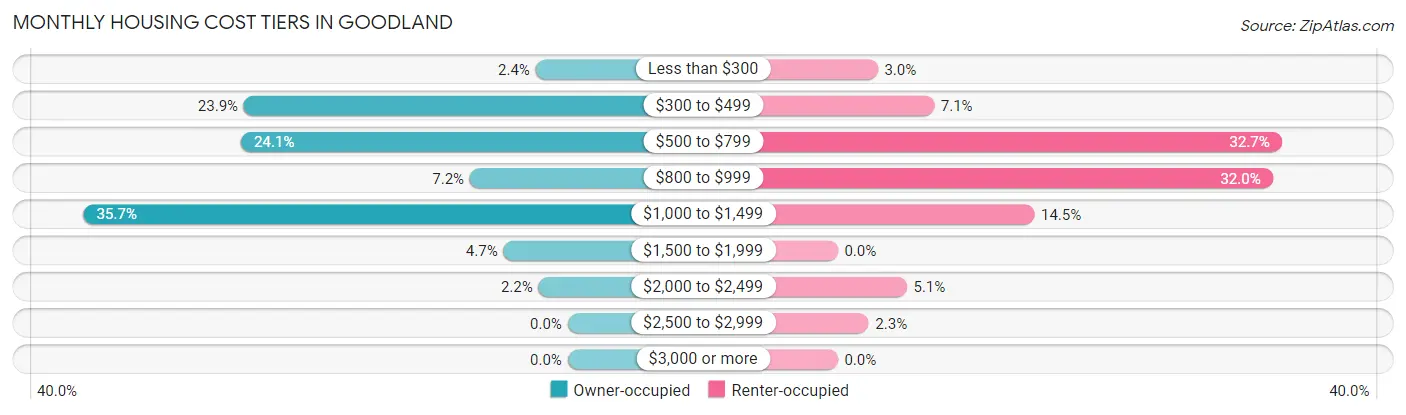
| Monthly Cost | Owner-occupied | Renter-occupied |
| Less than $300 | 22 (2.4%) | 22 (2.9%) |
| $300 to $499 | 222 (23.8%) | 53 (7.1%) |
| $500 to $799 | 224 (24.1%) | 244 (32.7%) |
| $800 to $999 | 67 (7.2%) | 239 (32.0%) |
| $1,000 to $1,499 | 332 (35.7%) | 108 (14.5%) |
| $1,500 to $1,999 | 44 (4.7%) | 0 (0.0%) |
| $2,000 to $2,499 | 20 (2.1%) | 38 (5.1%) |
| $2,500 to $2,999 | 0 (0.0%) | 17 (2.3%) |
| $3,000 or more | 0 (0.0%) | 0 (0.0%) |
| Total | 931 (100.0%) | 746 (100.0%) |
Physical Housing Characteristics in Goodland
Housing Structures in Goodland
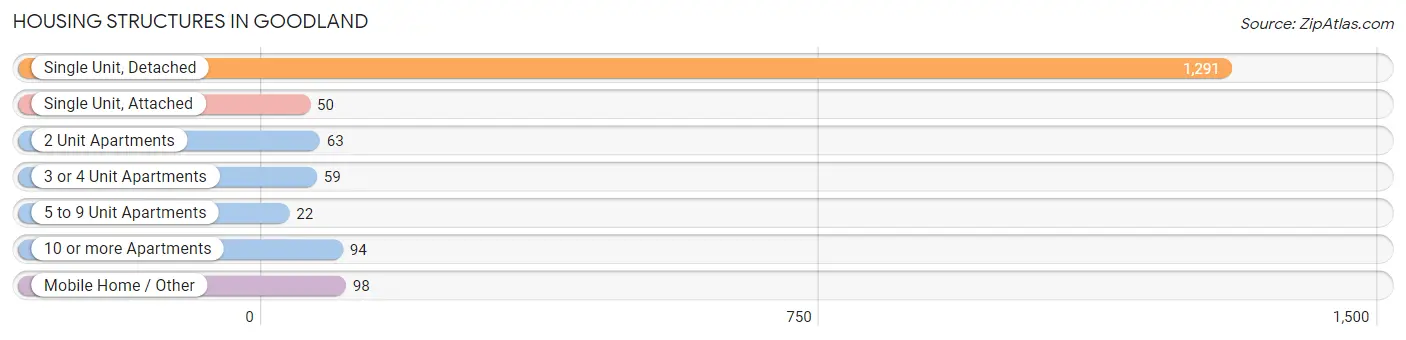
| Structure Type | # Housing Units | % Housing Units |
| Single Unit, Detached | 1,291 | 77.0% |
| Single Unit, Attached | 50 | 3.0% |
| 2 Unit Apartments | 63 | 3.8% |
| 3 or 4 Unit Apartments | 59 | 3.5% |
| 5 to 9 Unit Apartments | 22 | 1.3% |
| 10 or more Apartments | 94 | 5.6% |
| Mobile Home / Other | 98 | 5.8% |
| Total | 1,677 | 100.0% |
Housing Structures by Occupancy in Goodland
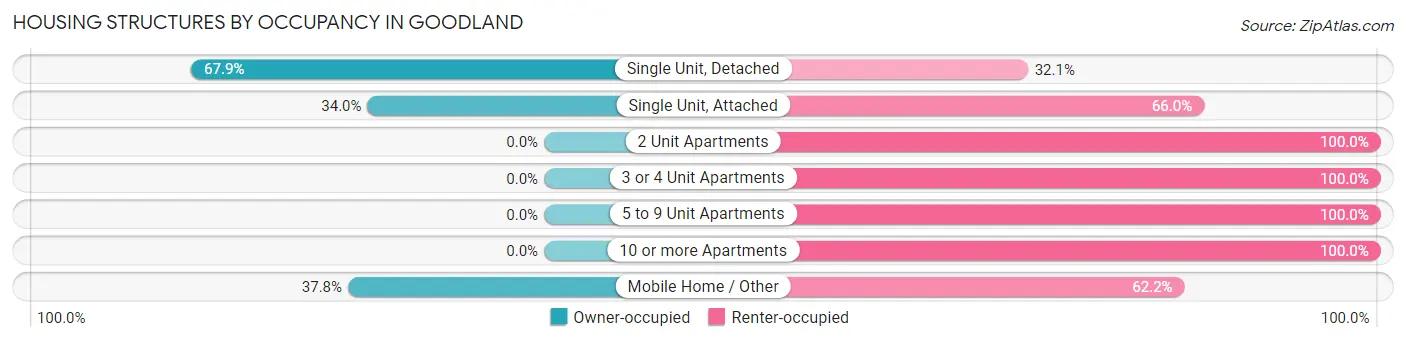
| Structure Type | Owner-occupied | Renter-occupied |
| Single Unit, Detached | 877 (67.9%) | 414 (32.1%) |
| Single Unit, Attached | 17 (34.0%) | 33 (66.0%) |
| 2 Unit Apartments | 0 (0.0%) | 63 (100.0%) |
| 3 or 4 Unit Apartments | 0 (0.0%) | 59 (100.0%) |
| 5 to 9 Unit Apartments | 0 (0.0%) | 22 (100.0%) |
| 10 or more Apartments | 0 (0.0%) | 94 (100.0%) |
| Mobile Home / Other | 37 (37.8%) | 61 (62.2%) |
| Total | 931 (55.5%) | 746 (44.5%) |
Housing Structures by Number of Rooms in Goodland
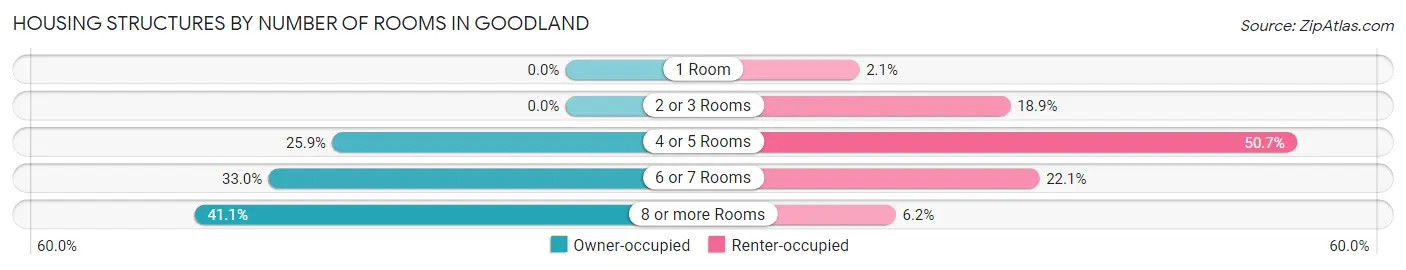
| Number of Rooms | Owner-occupied | Renter-occupied |
| 1 Room | 0 (0.0%) | 16 (2.1%) |
| 2 or 3 Rooms | 0 (0.0%) | 141 (18.9%) |
| 4 or 5 Rooms | 241 (25.9%) | 378 (50.7%) |
| 6 or 7 Rooms | 307 (33.0%) | 165 (22.1%) |
| 8 or more Rooms | 383 (41.1%) | 46 (6.2%) |
| Total | 931 (100.0%) | 746 (100.0%) |
Housing Structure by Heating Type in Goodland
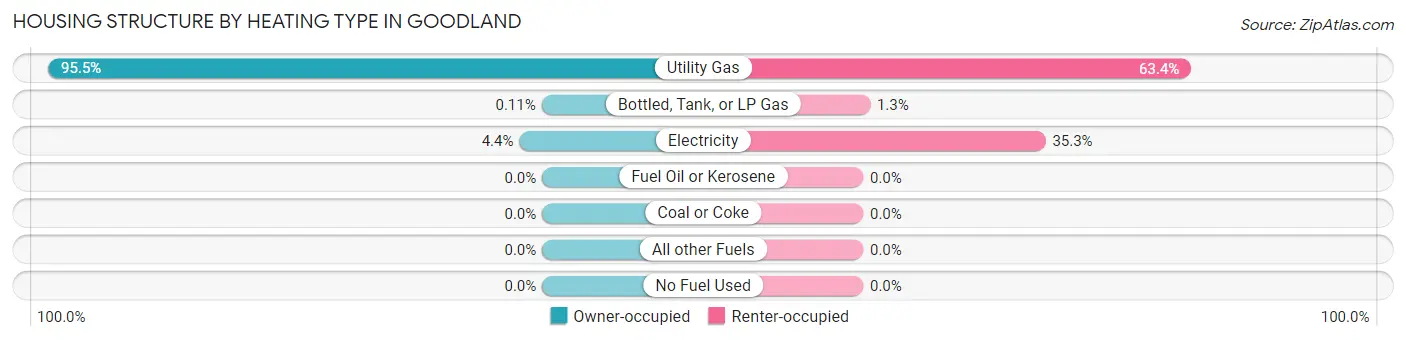
| Heating Type | Owner-occupied | Renter-occupied |
| Utility Gas | 889 (95.5%) | 473 (63.4%) |
| Bottled, Tank, or LP Gas | 1 (0.1%) | 10 (1.3%) |
| Electricity | 41 (4.4%) | 263 (35.2%) |
| Fuel Oil or Kerosene | 0 (0.0%) | 0 (0.0%) |
| Coal or Coke | 0 (0.0%) | 0 (0.0%) |
| All other Fuels | 0 (0.0%) | 0 (0.0%) |
| No Fuel Used | 0 (0.0%) | 0 (0.0%) |
| Total | 931 (100.0%) | 746 (100.0%) |
Household Vehicle Usage in Goodland
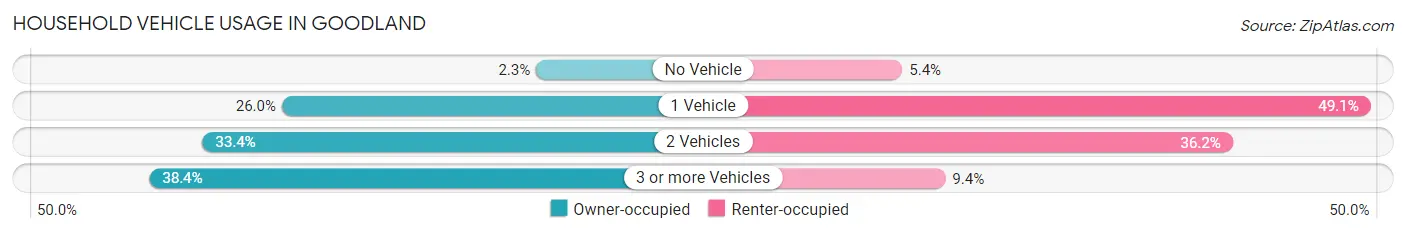
| Vehicles per Household | Owner-occupied | Renter-occupied |
| No Vehicle | 21 (2.3%) | 40 (5.4%) |
| 1 Vehicle | 242 (26.0%) | 366 (49.1%) |
| 2 Vehicles | 311 (33.4%) | 270 (36.2%) |
| 3 or more Vehicles | 357 (38.4%) | 70 (9.4%) |
| Total | 931 (100.0%) | 746 (100.0%) |
Real Estate & Mortgages in Goodland
Real Estate and Mortgage Overview in Goodland
| Characteristic | Without Mortgage | With Mortgage |
| Housing Units | 409 | 522 |
| Median Property Value | $89,700 | $133,200 |
| Median Household Income | $63,852 | $36 |
| Monthly Housing Costs | $470 | $0 |
| Real Estate Taxes | $1,363 | $8 |
Property Value by Mortgage Status in Goodland
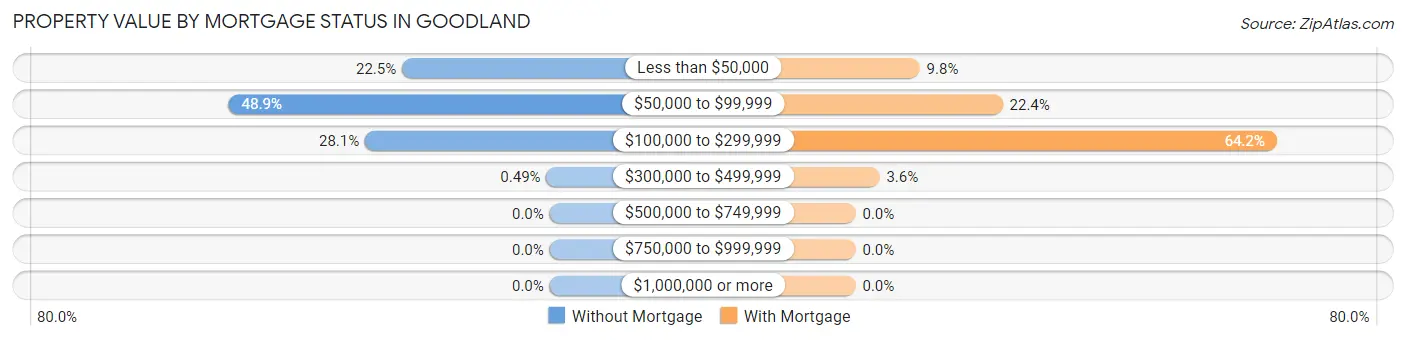
| Property Value | Without Mortgage | With Mortgage |
| Less than $50,000 | 92 (22.5%) | 51 (9.8%) |
| $50,000 to $99,999 | 200 (48.9%) | 117 (22.4%) |
| $100,000 to $299,999 | 115 (28.1%) | 335 (64.2%) |
| $300,000 to $499,999 | 2 (0.5%) | 19 (3.6%) |
| $500,000 to $749,999 | 0 (0.0%) | 0 (0.0%) |
| $750,000 to $999,999 | 0 (0.0%) | 0 (0.0%) |
| $1,000,000 or more | 0 (0.0%) | 0 (0.0%) |
| Total | 409 (100.0%) | 522 (100.0%) |
Household Income by Mortgage Status in Goodland
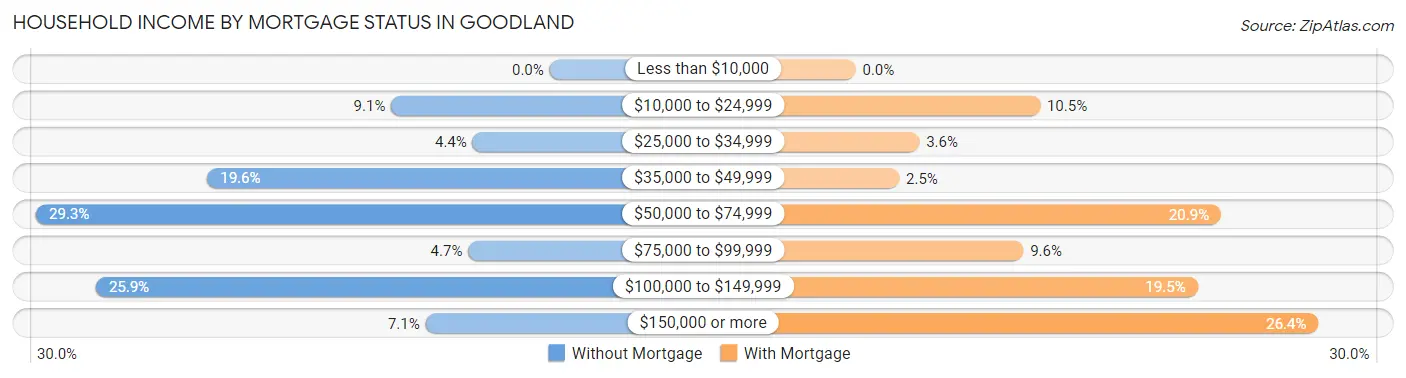
| Household Income | Without Mortgage | With Mortgage |
| Less than $10,000 | 0 (0.0%) | 0 (0.0%) |
| $10,000 to $24,999 | 37 (9.0%) | 55 (10.5%) |
| $25,000 to $34,999 | 18 (4.4%) | 19 (3.6%) |
| $35,000 to $49,999 | 80 (19.6%) | 13 (2.5%) |
| $50,000 to $74,999 | 120 (29.3%) | 109 (20.9%) |
| $75,000 to $99,999 | 19 (4.6%) | 50 (9.6%) |
| $100,000 to $149,999 | 106 (25.9%) | 102 (19.5%) |
| $150,000 or more | 29 (7.1%) | 138 (26.4%) |
| Total | 409 (100.0%) | 522 (100.0%) |
Property Value to Household Income Ratio in Goodland
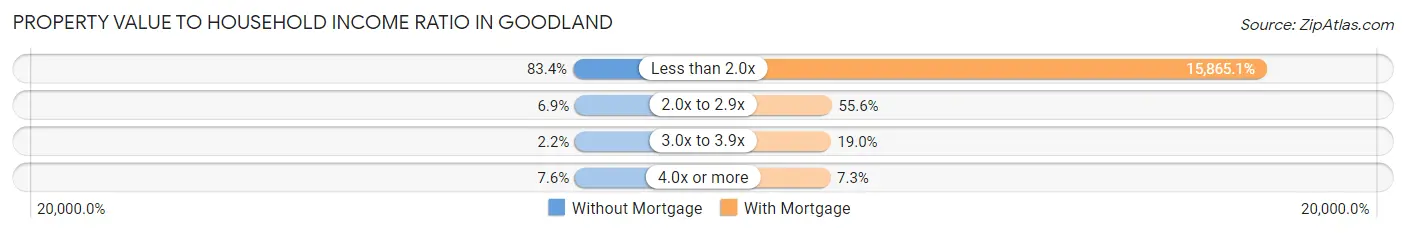
| Value-to-Income Ratio | Without Mortgage | With Mortgage |
| Less than 2.0x | 341 (83.4%) | 82,816 (15,865.1%) |
| 2.0x to 2.9x | 28 (6.9%) | 290 (55.6%) |
| 3.0x to 3.9x | 9 (2.2%) | 99 (19.0%) |
| 4.0x or more | 31 (7.6%) | 38 (7.3%) |
| Total | 409 (100.0%) | 522 (100.0%) |
Real Estate Taxes by Mortgage Status in Goodland
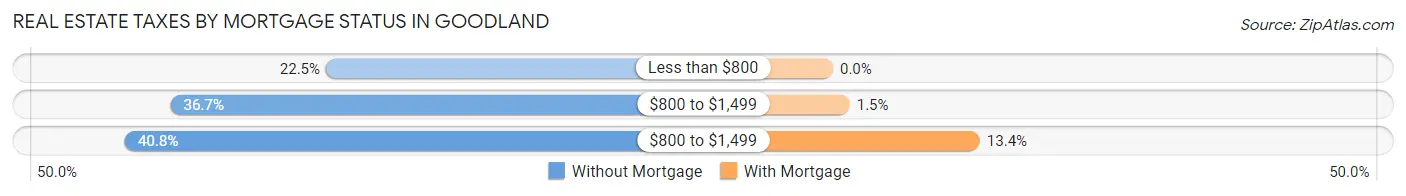
| Property Taxes | Without Mortgage | With Mortgage |
| Less than $800 | 92 (22.5%) | 0 (0.0%) |
| $800 to $1,499 | 150 (36.7%) | 8 (1.5%) |
| $800 to $1,499 | 167 (40.8%) | 70 (13.4%) |
| Total | 409 (100.0%) | 522 (100.0%) |
Health & Disability in Goodland
Health Insurance Coverage by Age in Goodland
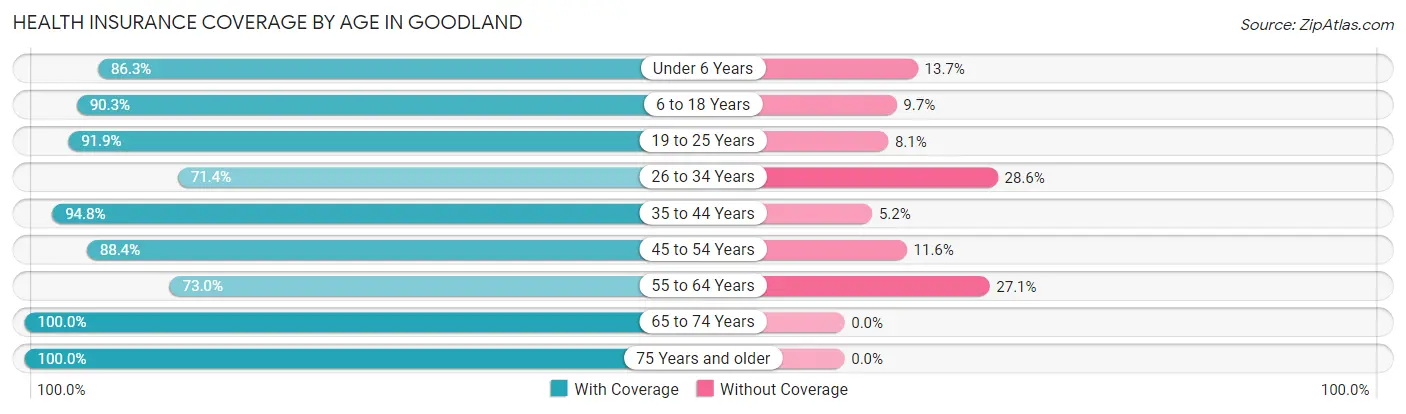
| Age Bracket | With Coverage | Without Coverage |
| Under 6 Years | 265 (86.3%) | 42 (13.7%) |
| 6 to 18 Years | 622 (90.3%) | 67 (9.7%) |
| 19 to 25 Years | 406 (91.9%) | 36 (8.1%) |
| 26 to 34 Years | 165 (71.4%) | 66 (28.6%) |
| 35 to 44 Years | 515 (94.8%) | 28 (5.2%) |
| 45 to 54 Years | 289 (88.4%) | 38 (11.6%) |
| 55 to 64 Years | 410 (73.0%) | 152 (27.1%) |
| 65 to 74 Years | 260 (100.0%) | 0 (0.0%) |
| 75 Years and older | 384 (100.0%) | 0 (0.0%) |
| Total | 3,316 (88.5%) | 429 (11.5%) |
Health Insurance Coverage by Citizenship Status in Goodland
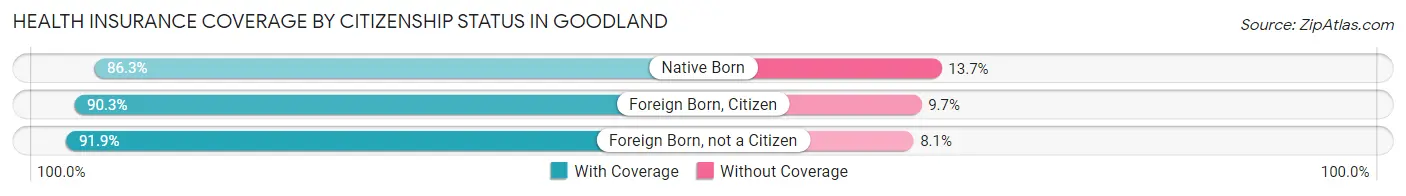
| Citizenship Status | With Coverage | Without Coverage |
| Native Born | 265 (86.3%) | 42 (13.7%) |
| Foreign Born, Citizen | 622 (90.3%) | 67 (9.7%) |
| Foreign Born, not a Citizen | 406 (91.9%) | 36 (8.1%) |
Health Insurance Coverage by Household Income in Goodland
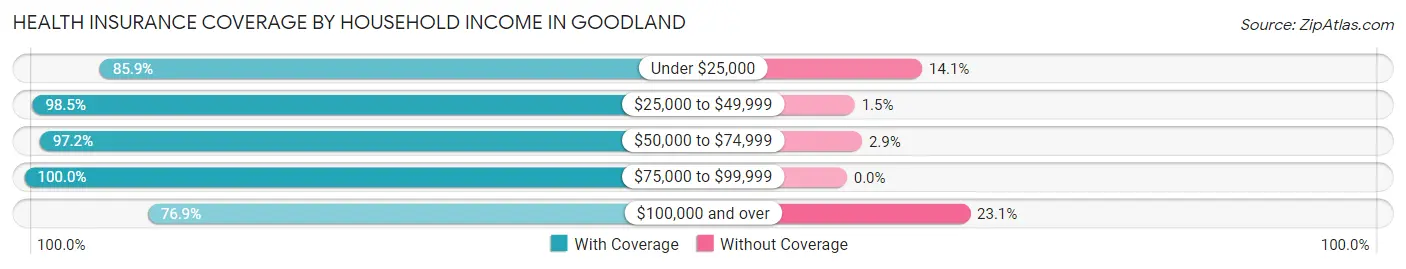
| Household Income | With Coverage | Without Coverage |
| Under $25,000 | 511 (85.9%) | 84 (14.1%) |
| $25,000 to $49,999 | 799 (98.5%) | 12 (1.5%) |
| $50,000 to $74,999 | 819 (97.2%) | 24 (2.9%) |
| $75,000 to $99,999 | 169 (100.0%) | 0 (0.0%) |
| $100,000 and over | 932 (76.9%) | 280 (23.1%) |
Public vs Private Health Insurance Coverage by Age in Goodland
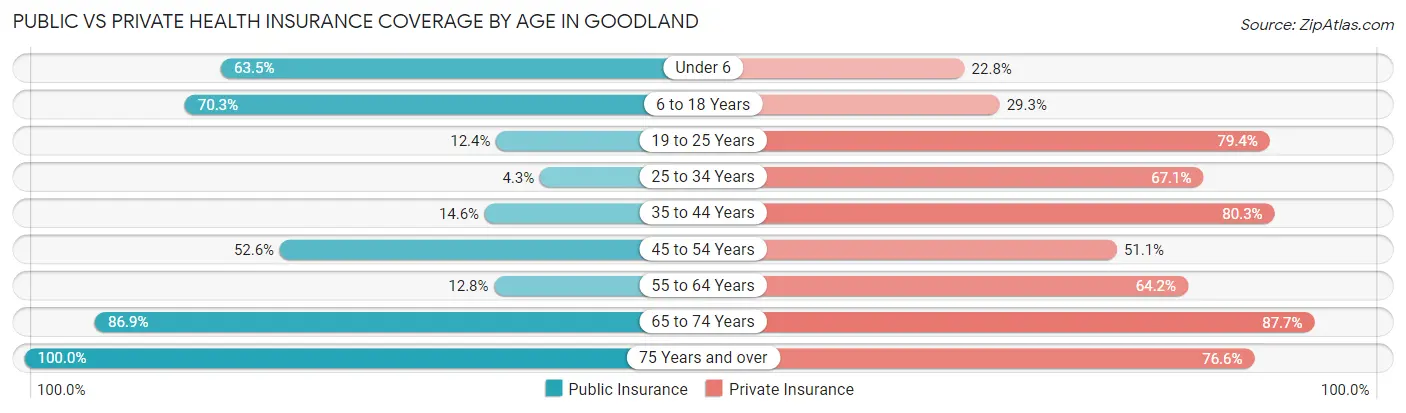
| Age Bracket | Public Insurance | Private Insurance |
| Under 6 | 195 (63.5%) | 70 (22.8%) |
| 6 to 18 Years | 484 (70.3%) | 202 (29.3%) |
| 19 to 25 Years | 55 (12.4%) | 351 (79.4%) |
| 25 to 34 Years | 10 (4.3%) | 155 (67.1%) |
| 35 to 44 Years | 79 (14.5%) | 436 (80.3%) |
| 45 to 54 Years | 172 (52.6%) | 167 (51.1%) |
| 55 to 64 Years | 72 (12.8%) | 361 (64.2%) |
| 65 to 74 Years | 226 (86.9%) | 228 (87.7%) |
| 75 Years and over | 384 (100.0%) | 294 (76.6%) |
| Total | 1,677 (44.8%) | 2,264 (60.5%) |
Disability Status by Sex by Age in Goodland
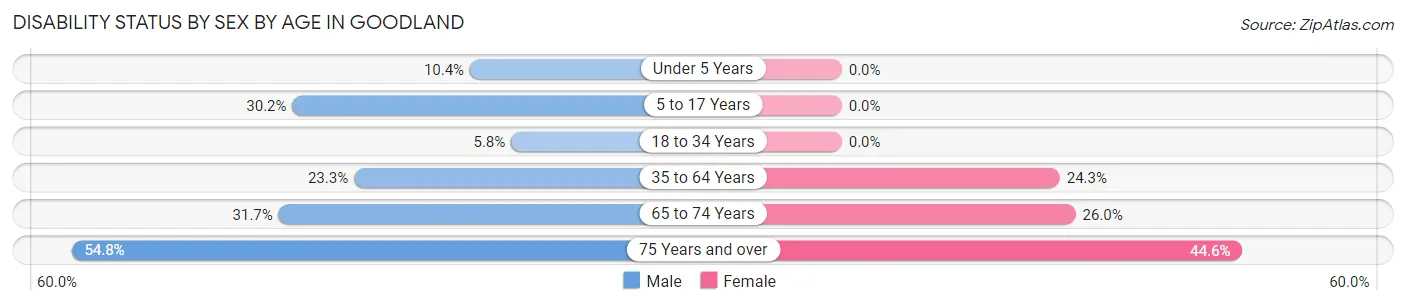
| Age Bracket | Male | Female |
| Under 5 Years | 21 (10.4%) | 0 (0.0%) |
| 5 to 17 Years | 102 (30.2%) | 0 (0.0%) |
| 18 to 34 Years | 28 (5.8%) | 0 (0.0%) |
| 35 to 64 Years | 163 (23.3%) | 178 (24.3%) |
| 65 to 74 Years | 52 (31.7%) | 25 (26.0%) |
| 75 Years and over | 63 (54.8%) | 120 (44.6%) |
Disability Class by Sex by Age in Goodland
Disability Class: Hearing Difficulty
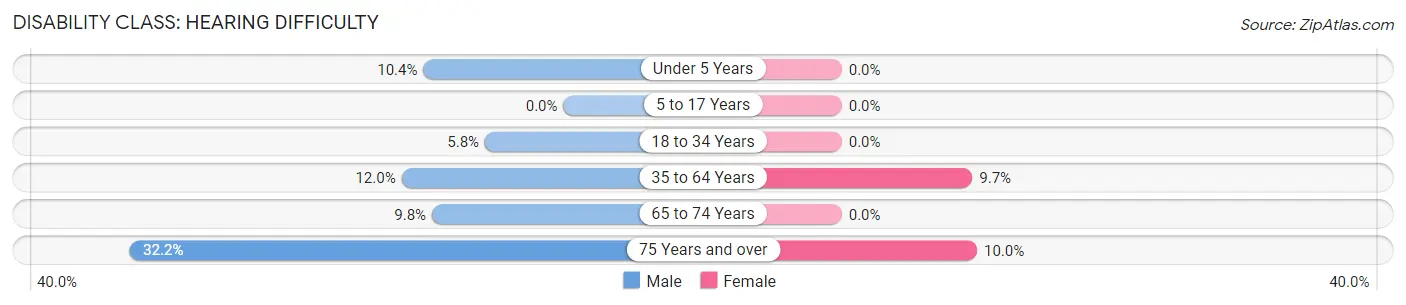
| Age Bracket | Male | Female |
| Under 5 Years | 21 (10.4%) | 0 (0.0%) |
| 5 to 17 Years | 0 (0.0%) | 0 (0.0%) |
| 18 to 34 Years | 28 (5.8%) | 0 (0.0%) |
| 35 to 64 Years | 84 (12.0%) | 71 (9.7%) |
| 65 to 74 Years | 16 (9.8%) | 0 (0.0%) |
| 75 Years and over | 37 (32.2%) | 27 (10.0%) |
Disability Class: Vision Difficulty
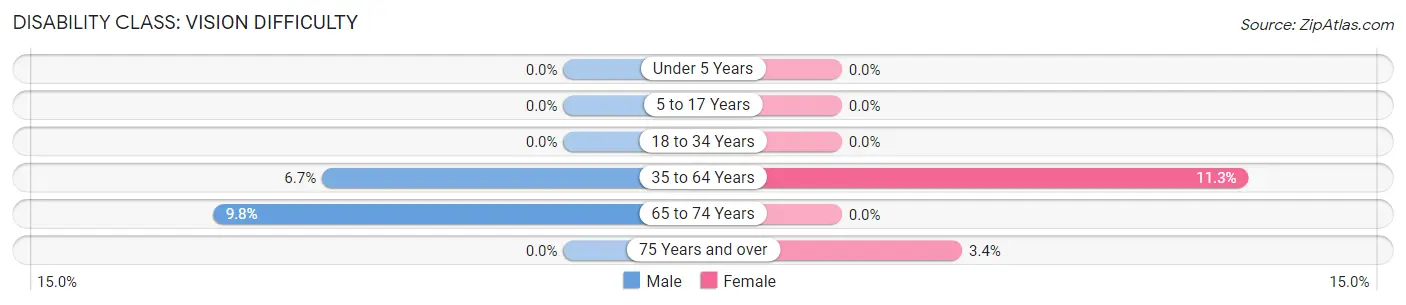
| Age Bracket | Male | Female |
| Under 5 Years | 0 (0.0%) | 0 (0.0%) |
| 5 to 17 Years | 0 (0.0%) | 0 (0.0%) |
| 18 to 34 Years | 0 (0.0%) | 0 (0.0%) |
| 35 to 64 Years | 47 (6.7%) | 83 (11.3%) |
| 65 to 74 Years | 16 (9.8%) | 0 (0.0%) |
| 75 Years and over | 0 (0.0%) | 9 (3.4%) |
Disability Class: Cognitive Difficulty
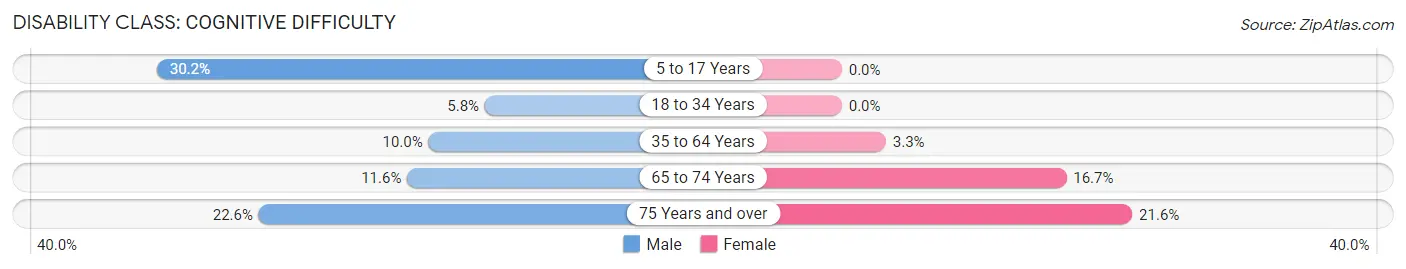
| Age Bracket | Male | Female |
| 5 to 17 Years | 102 (30.2%) | 0 (0.0%) |
| 18 to 34 Years | 28 (5.8%) | 0 (0.0%) |
| 35 to 64 Years | 70 (10.0%) | 24 (3.3%) |
| 65 to 74 Years | 19 (11.6%) | 16 (16.7%) |
| 75 Years and over | 26 (22.6%) | 58 (21.6%) |
Disability Class: Ambulatory Difficulty
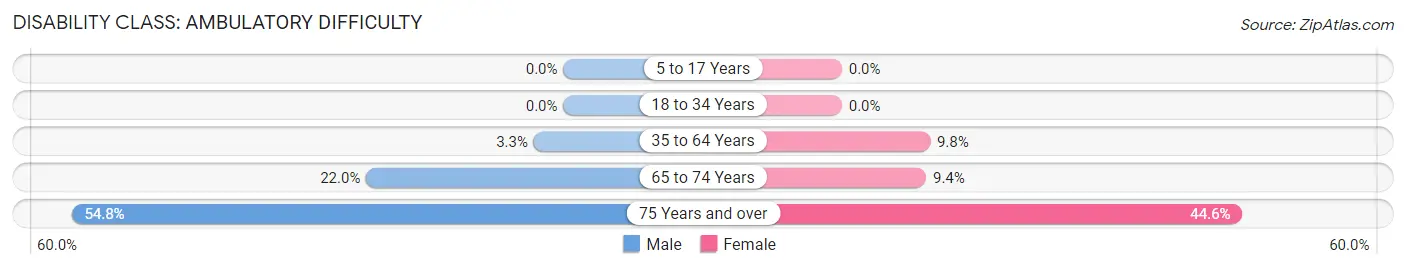
| Age Bracket | Male | Female |
| 5 to 17 Years | 0 (0.0%) | 0 (0.0%) |
| 18 to 34 Years | 0 (0.0%) | 0 (0.0%) |
| 35 to 64 Years | 23 (3.3%) | 72 (9.8%) |
| 65 to 74 Years | 36 (22.0%) | 9 (9.4%) |
| 75 Years and over | 63 (54.8%) | 120 (44.6%) |
Disability Class: Self-Care Difficulty
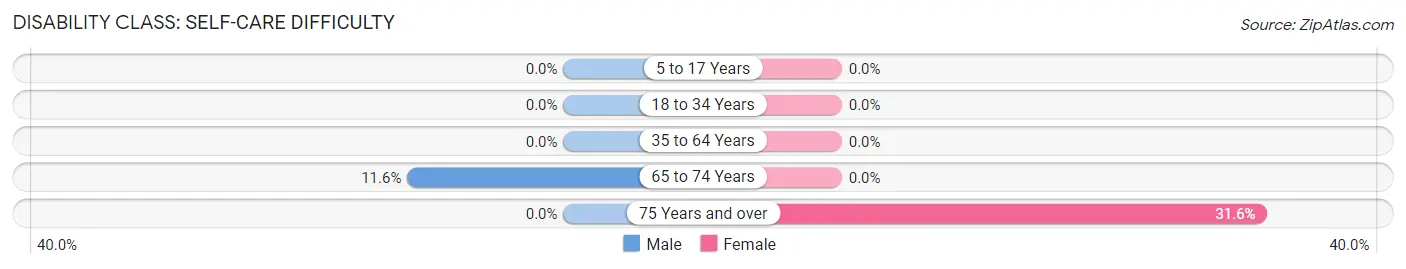
| Age Bracket | Male | Female |
| 5 to 17 Years | 0 (0.0%) | 0 (0.0%) |
| 18 to 34 Years | 0 (0.0%) | 0 (0.0%) |
| 35 to 64 Years | 0 (0.0%) | 0 (0.0%) |
| 65 to 74 Years | 19 (11.6%) | 0 (0.0%) |
| 75 Years and over | 0 (0.0%) | 85 (31.6%) |
Technology Access in Goodland
Computing Device Access in Goodland
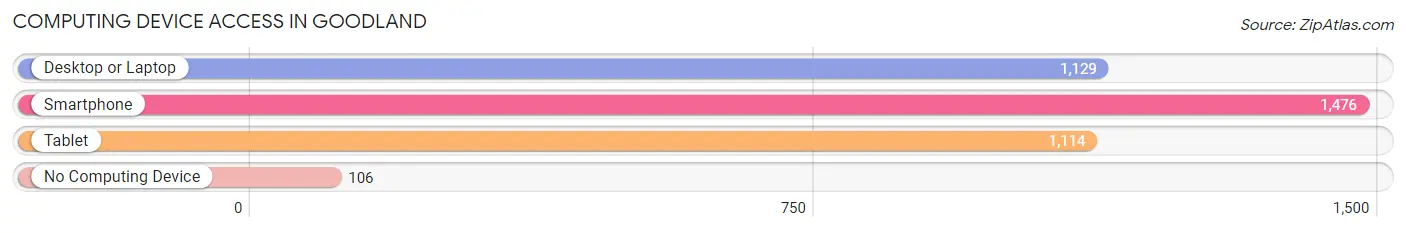
| Device Type | # Households | % Households |
| Desktop or Laptop | 1,129 | 67.3% |
| Smartphone | 1,476 | 88.0% |
| Tablet | 1,114 | 66.4% |
| No Computing Device | 106 | 6.3% |
| Total | 1,677 | 100.0% |
Internet Access in Goodland
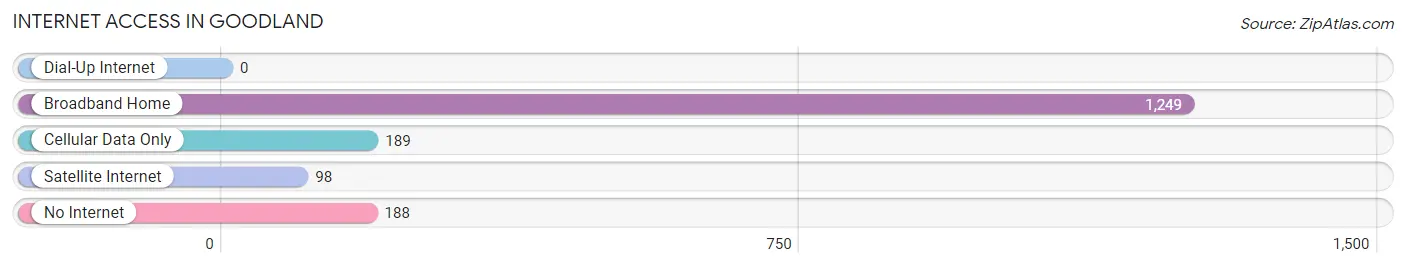
| Internet Type | # Households | % Households |
| Dial-Up Internet | 0 | 0.0% |
| Broadband Home | 1,249 | 74.5% |
| Cellular Data Only | 189 | 11.3% |
| Satellite Internet | 98 | 5.8% |
| No Internet | 188 | 11.2% |
| Total | 1,677 | 100.0% |
Goodland Summary
Goodland, Kansas is a small city located in the northwest corner of the state, near the Colorado border. It is the county seat of Sherman County and has a population of 4,521 as of the 2010 census. The city is known for its agricultural roots, as well as its proximity to the High Plains.
Geography
Goodland is located in the northwest corner of Kansas, near the Colorado border. It is situated in the High Plains region of the Great Plains, and is part of the Great Plains region of the United States. The city is located at the intersection of U.S. Route 24 and U.S. Route 27. The city is located at an elevation of 3,093 feet above sea level. The city is located in Sherman County, and is the county seat.
The city is located in an area of rolling hills and plains. The area is known for its dry climate, with an average annual precipitation of only 16.5 inches. The area is also known for its strong winds, which can reach up to 50 miles per hour.
History
Goodland was founded in 1885 by the Union Pacific Railroad. The city was named after the nearby Goodland Creek. The city was originally a stop on the Union Pacific Railroad, and was used as a supply point for the railroad. The city was incorporated in 1887.
The city grew rapidly in the late 19th and early 20th centuries, due to its location on the railroad. The city was a major shipping point for cattle, wheat, and other agricultural products. The city was also a major stop on the Santa Fe Trail.
The city experienced a period of decline in the mid-20th century, as the railroad industry declined and the city's population decreased. The city has since experienced a resurgence, due to its proximity to the High Plains and its agricultural roots.
Economy
Goodland's economy is largely based on agriculture. The city is located in an area known for its wheat production, and is a major shipping point for wheat and other agricultural products. The city is also home to several manufacturing companies, including a plastics manufacturer and a food processing plant.
The city is also home to several retail stores, restaurants, and other businesses. The city is home to a hospital, a community college, and a public library.
Demographics
As of the 2010 census, Goodland had a population of 4,521. The racial makeup of the city was 92.3% White, 0.3% African American, 0.7% Native American, 0.3% Asian, 0.1% Pacific Islander, 4.2% from other races, and 2.3% from two or more races. Hispanic or Latino of any race were 8.3% of the population.
The median income for a household in the city was $37,917, and the median income for a family was $45,938. The per capita income for the city was $18,945. About 11.2% of families and 14.2% of the population were below the poverty line, including 19.2% of those under age 18 and 8.2% of those age 65 or over.
Goodland is a small city with a rich history and a strong agricultural economy. The city is located in an area known for its wheat production, and is a major shipping point for wheat and other agricultural products. The city is also home to several manufacturing companies, retail stores, restaurants, and other businesses. The city has a diverse population, with a median income that is slightly below the national average.
Common Questions
What is the Total Population of Goodland?
Total Population of Goodland is 3,813.
What is the Total Male Population of Goodland?
Total Male Population of Goodland is 2,018.
What is the Total Female Population of Goodland?
Total Female Population of Goodland is 1,795.
What is the Ratio of Males per 100 Females in Goodland?
There are 112.42 Males per 100 Females in Goodland.
What is the Ratio of Females per 100 Males in Goodland?
There are 88.95 Females per 100 Males in Goodland.
What is the Median Population Age in Goodland?
Median Population Age in Goodland is 37.6 Years.
What is the Average Family Size in Goodland
Average Family Size in Goodland is 3.0 People.
What is the Average Household Size in Goodland
Average Household Size in Goodland is 2.2 People.
What is Per Capita Income in Goodland?
Per Capita income in Goodland is $38,614.
What is the Median Family Income in Goodland?
Median Family Income in Goodland is $64,404.
What is the Median Household income in Goodland?
Median Household Income in Goodland is $54,228.
What is Income or Wage Gap in Goodland?
Income or Wage Gap in Goodland is 51.8%.
Women in Goodland earn 48.2 cents for every dollar earned by a man.
What is Inequality or Gini Index in Goodland?
Inequality or Gini Index in Goodland is 0.53.
How Large is the Labor Force in Goodland?
There are 2,092 People in the Labor Forcein in Goodland.
What is the Percentage of People in the Labor Force in Goodland?
67.0% of People are in the Labor Force in Goodland.
What is the Unemployment Rate in Goodland?
Unemployment Rate in Goodland is 3.4%.