Johnson City, KS
Johnson City Map
Johnson City Overview
1,318
TOTAL POPULATION
722
MALE POPULATION
596
FEMALE POPULATION
121.14
MALES / 100 FEMALES
82.55
FEMALES / 100 MALES
41.9
MEDIAN AGE
2.6
AVG FAMILY SIZE
2.1
AVG HOUSEHOLD SIZE
$43,623
PER CAPITA INCOME
$67,031
AVG FAMILY INCOME
$65,308
AVG HOUSEHOLD INCOME
4.8%
WAGE / INCOME GAP [ % ]
95.2¢/ $1
WAGE / INCOME GAP [ $ ]
0.45
INEQUALITY / GINI INDEX
766
LABOR FORCE [ PEOPLE ]
68.0%
PERCENT IN LABOR FORCE
3.4%
UNEMPLOYMENT RATE
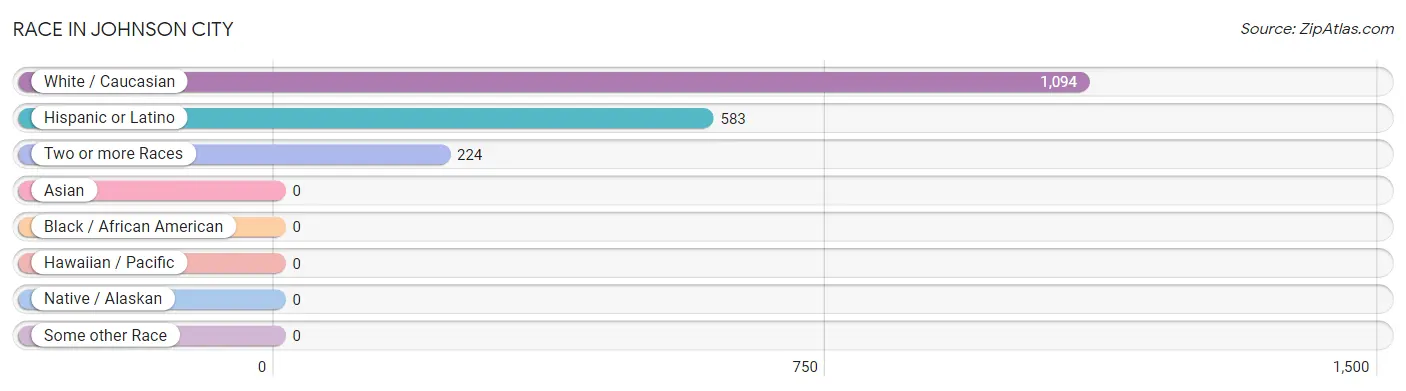
Race in Johnson City
The most populous races in Johnson City are White / Caucasian (1,094 | 83.0%), Hispanic or Latino (583 | 44.2%), and Two or more Races (224 | 17.0%).
| Race | # Population | % Population |
| Asian | 0 | 0.0% |
| Black / African American | 0 | 0.0% |
| Hawaiian / Pacific | 0 | 0.0% |
| Hispanic or Latino | 583 | 44.2% |
| Native / Alaskan | 0 | 0.0% |
| White / Caucasian | 1,094 | 83.0% |
| Two or more Races | 224 | 17.0% |
| Some other Race | 0 | 0.0% |
| Total | 1,318 | 100.0% |
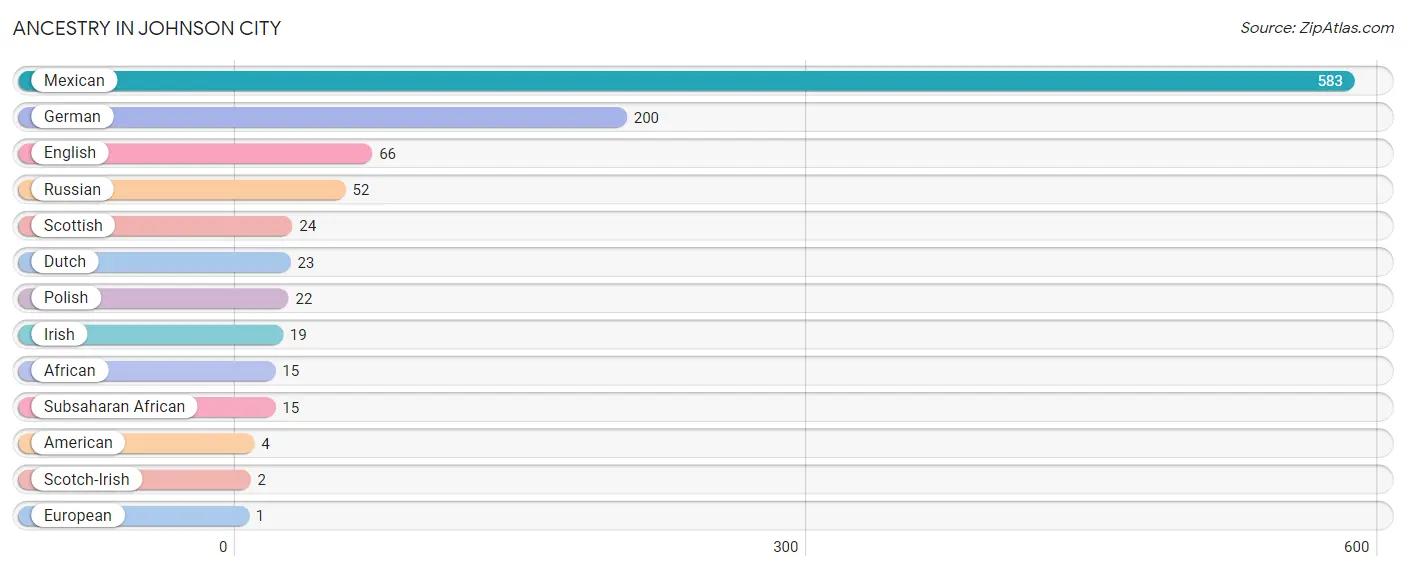
Ancestry in Johnson City
The most populous ancestries reported in Johnson City are Mexican (583 | 44.2%), German (200 | 15.2%), English (66 | 5.0%), Russian (52 | 4.0%), and Scottish (24 | 1.8%), together accounting for 70.2% of all Johnson City residents.
| Ancestry | # Population | % Population |
| African | 15 | 1.1% |
| American | 4 | 0.3% |
| Dutch | 23 | 1.8% |
| English | 66 | 5.0% |
| European | 1 | 0.1% |
| German | 200 | 15.2% |
| Irish | 19 | 1.4% |
| Mexican | 583 | 44.2% |
| Polish | 22 | 1.7% |
| Russian | 52 | 4.0% |
| Scotch-Irish | 2 | 0.2% |
| Scottish | 24 | 1.8% |
| Subsaharan African | 15 | 1.1% | View All 13 Rows |
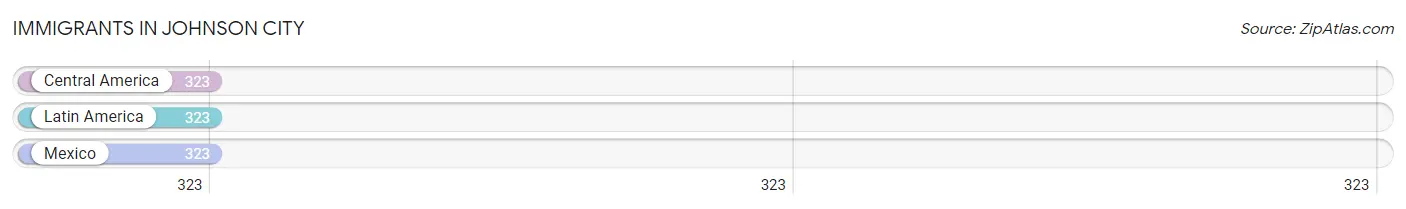
Immigrants in Johnson City
The most numerous immigrant groups reported in Johnson City came from Central America (323 | 24.5%), Latin America (323 | 24.5%), and Mexico (323 | 24.5%), together accounting for 73.5% of all Johnson City residents.
| Immigration Origin | # Population | % Population |
| Central America | 323 | 24.5% |
| Latin America | 323 | 24.5% |
| Mexico | 323 | 24.5% | View All 3 Rows |
Sex and Age in Johnson City
Sex and Age in Johnson City
The most populous age groups in Johnson City are 60 to 64 Years (137 | 19.0%) for men and 60 to 64 Years (76 | 12.8%) for women.

| Age Bracket | Male | Female |
| Under 5 Years | 0 (0.0%) | 58 (9.7%) |
| 5 to 9 Years | 69 (9.6%) | 19 (3.2%) |
| 10 to 14 Years | 34 (4.7%) | 11 (1.8%) |
| 15 to 19 Years | 23 (3.2%) | 47 (7.9%) |
| 20 to 24 Years | 40 (5.5%) | 61 (10.2%) |
| 25 to 29 Years | 130 (18.0%) | 24 (4.0%) |
| 30 to 34 Years | 37 (5.1%) | 13 (2.2%) |
| 35 to 39 Years | 16 (2.2%) | 59 (9.9%) |
| 40 to 44 Years | 39 (5.4%) | 56 (9.4%) |
| 45 to 49 Years | 17 (2.4%) | 27 (4.5%) |
| 50 to 54 Years | 40 (5.5%) | 50 (8.4%) |
| 55 to 59 Years | 54 (7.5%) | 27 (4.5%) |
| 60 to 64 Years | 137 (19.0%) | 76 (12.8%) |
| 65 to 69 Years | 18 (2.5%) | 10 (1.7%) |
| 70 to 74 Years | 46 (6.4%) | 17 (2.9%) |
| 75 to 79 Years | 12 (1.7%) | 17 (2.9%) |
| 80 to 84 Years | 2 (0.3%) | 9 (1.5%) |
| 85 Years and over | 8 (1.1%) | 15 (2.5%) |
| Total | 722 (100.0%) | 596 (100.0%) |
Families and Households in Johnson City
Median Family Size in Johnson City
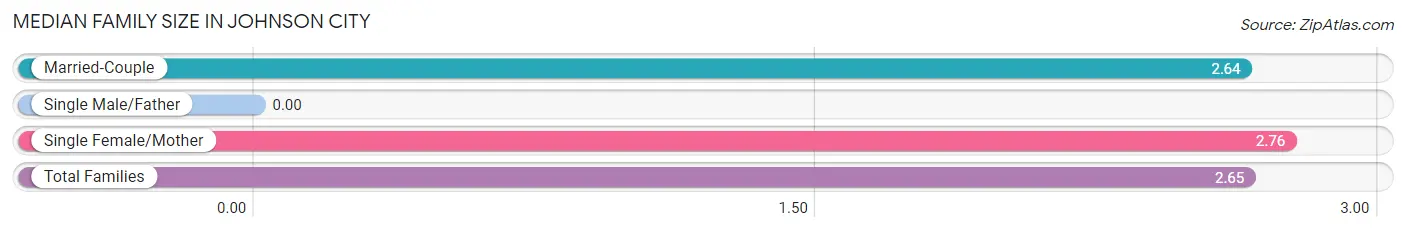
| Family Type | # Families | Family Size |
| Married-Couple | 313 (88.2%) | 2.64 |
| Single Male/Father | 0 (0.0%) | - |
| Single Female/Mother | 42 (11.8%) | 2.76 |
| Total Families | 355 (100.0%) | 2.65 |
Median Household Size in Johnson City
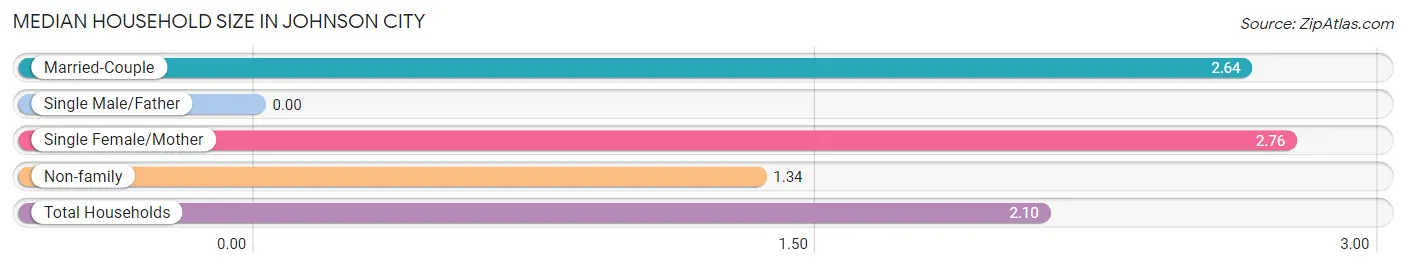
| Household Type | # Households | Household Size |
| Married-Couple | 313 (51.0%) | 2.64 |
| Single Male/Father | 0 (0.0%) | - |
| Single Female/Mother | 42 (6.8%) | 2.76 |
| Non-family | 259 (42.2%) | 1.34 |
| Total Households | 614 (100.0%) | 2.10 |
Household Size by Marriage Status in Johnson City
Out of a total of 614 households in Johnson City, 355 (57.8%) are family households, while 259 (42.2%) are nonfamily households. The most numerous type of family households are 2-person households, comprising 255, and the most common type of nonfamily households are 1-person households, comprising 201.

| Household Size | Family Households | Nonfamily Households |
| 1-Person Households | - | 201 (32.7%) |
| 2-Person Households | 255 (41.5%) | 58 (9.5%) |
| 3-Person Households | 37 (6.0%) | 0 (0.0%) |
| 4-Person Households | 58 (9.5%) | 0 (0.0%) |
| 5-Person Households | 0 (0.0%) | 0 (0.0%) |
| 6-Person Households | 5 (0.8%) | 0 (0.0%) |
| 7+ Person Households | 0 (0.0%) | 0 (0.0%) |
| Total | 355 (57.8%) | 259 (42.2%) |
Female Fertility in Johnson City
Fertility by Age in Johnson City
| Age Bracket | Women with Births | Births / 1,000 Women |
| 15 to 19 years | 0 (0.0%) | 0.0 |
| 20 to 34 years | 0 (0.0%) | 0.0 |
| 35 to 50 years | 0 (0.0%) | 0.0 |
| Total | 0 (0.0%) | 0.0 |
Fertility by Age by Marriage Status in Johnson City
| Age Bracket | Married | Unmarried |
| 15 to 19 years | 0 (0.0%) | 0 (0.0%) |
| 20 to 34 years | 0 (0.0%) | 0 (0.0%) |
| 35 to 50 years | 0 (0.0%) | 0 (0.0%) |
| Total | 0 (0.0%) | 0 (0.0%) |
Fertility by Education in Johnson City
| Educational Attainment | Women with Births | Births / 1,000 Women |
| Less than High School | 0 (0.0%) | 0.0 |
| High School Diploma | 0 (0.0%) | 0.0 |
| College or Associate's Degree | 0 (0.0%) | 0.0 |
| Bachelor's Degree | 0 (0.0%) | 0.0 |
| Graduate Degree | 0 (0.0%) | 0.0 |
| Total | 0 (0.0%) | 0.0 |
Fertility by Education by Marriage Status in Johnson City
| Educational Attainment | Married | Unmarried |
| Less than High School | 0 (0.0%) | 0 (0.0%) |
| High School Diploma | 0 (0.0%) | 0 (0.0%) |
| College or Associate's Degree | 0 (0.0%) | 0 (0.0%) |
| Bachelor's Degree | 0 (0.0%) | 0 (0.0%) |
| Graduate Degree | 0 (0.0%) | 0 (0.0%) |
| Total | 0 (0.0%) | 0 (0.0%) |
Income in Johnson City
Income Overview in Johnson City
Per Capita Income in Johnson City is $43,623, while median incomes of families and households are $67,031 and $65,308 respectively.
| Characteristic | Number | Measure |
| Per Capita Income | 1,318 | $43,623 |
| Median Family Income | 355 | $67,031 |
| Mean Family Income | 355 | $81,467 |
| Median Household Income | 614 | $65,308 |
| Mean Household Income | 614 | $90,449 |
| Income Deficit | 355 | $0 |
| Wage / Income Gap (%) | 1,318 | 4.85% |
| Wage / Income Gap ($) | 1,318 | 95.15¢ per $1 |
| Gini / Inequality Index | 1,318 | 0.45 |
Earnings by Sex in Johnson City
Average Earnings in Johnson City are $36,766, $37,377 for men and $35,565 for women, a difference of 4.9%.
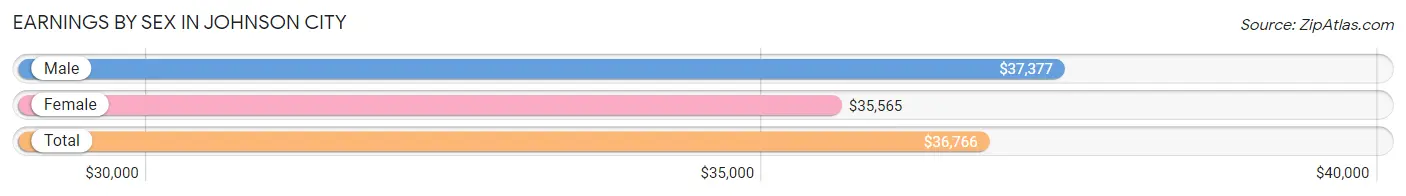
| Sex | Number | Average Earnings |
| Male | 446 (57.8%) | $37,377 |
| Female | 326 (42.2%) | $35,565 |
| Total | 772 (100.0%) | $36,766 |
Earnings by Sex by Income Bracket in Johnson City
The most common earnings brackets in Johnson City are $30,000 to $34,999 for men (112 | 25.1%) and $50,000 to $54,999 for women (41 | 12.6%).
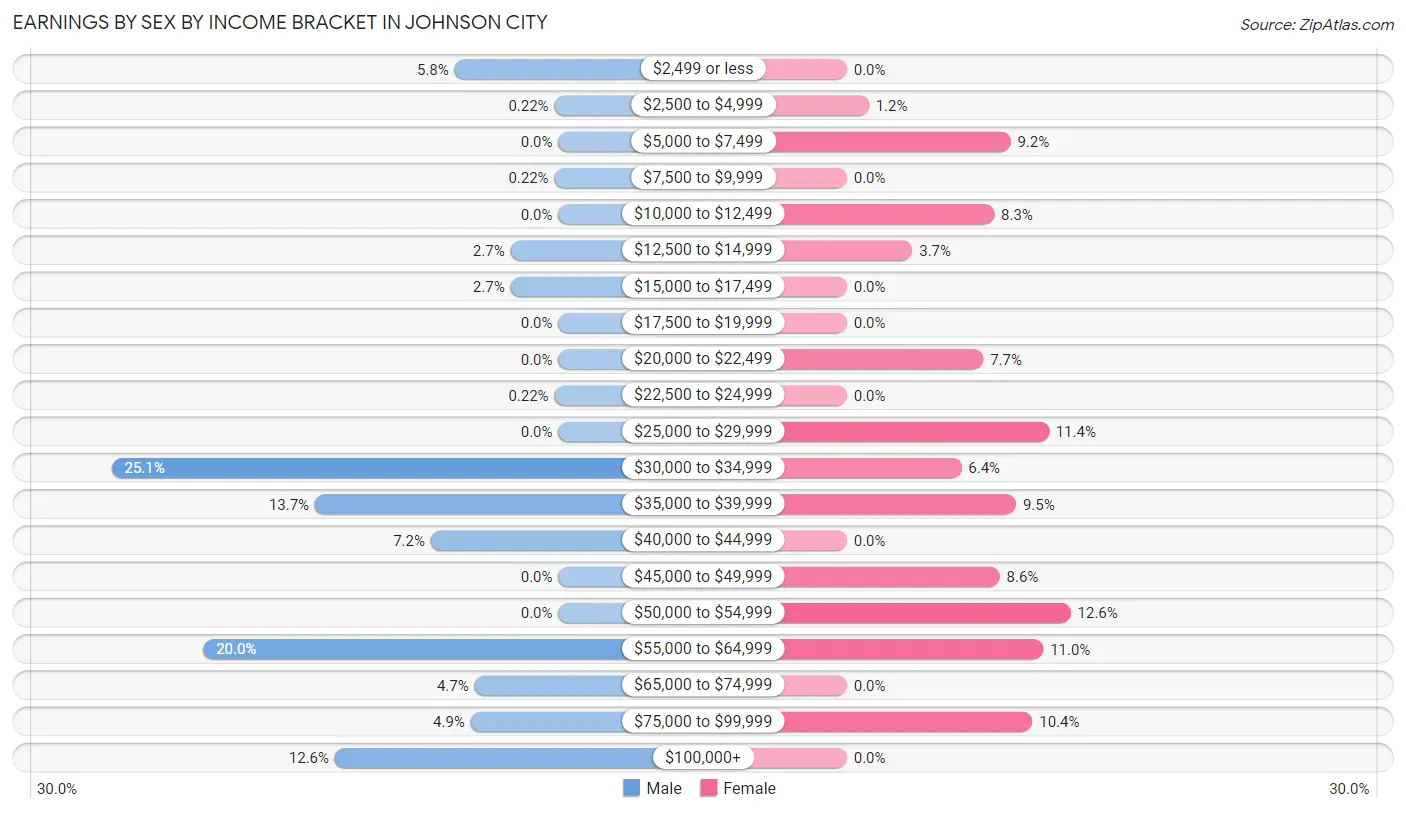
| Income | Male | Female |
| $2,499 or less | 26 (5.8%) | 0 (0.0%) |
| $2,500 to $4,999 | 1 (0.2%) | 4 (1.2%) |
| $5,000 to $7,499 | 0 (0.0%) | 30 (9.2%) |
| $7,500 to $9,999 | 1 (0.2%) | 0 (0.0%) |
| $10,000 to $12,499 | 0 (0.0%) | 27 (8.3%) |
| $12,500 to $14,999 | 12 (2.7%) | 12 (3.7%) |
| $15,000 to $17,499 | 12 (2.7%) | 0 (0.0%) |
| $17,500 to $19,999 | 0 (0.0%) | 0 (0.0%) |
| $20,000 to $22,499 | 0 (0.0%) | 25 (7.7%) |
| $22,500 to $24,999 | 1 (0.2%) | 0 (0.0%) |
| $25,000 to $29,999 | 0 (0.0%) | 37 (11.4%) |
| $30,000 to $34,999 | 112 (25.1%) | 21 (6.4%) |
| $35,000 to $39,999 | 61 (13.7%) | 31 (9.5%) |
| $40,000 to $44,999 | 32 (7.2%) | 0 (0.0%) |
| $45,000 to $49,999 | 0 (0.0%) | 28 (8.6%) |
| $50,000 to $54,999 | 0 (0.0%) | 41 (12.6%) |
| $55,000 to $64,999 | 89 (20.0%) | 36 (11.0%) |
| $65,000 to $74,999 | 21 (4.7%) | 0 (0.0%) |
| $75,000 to $99,999 | 22 (4.9%) | 34 (10.4%) |
| $100,000+ | 56 (12.6%) | 0 (0.0%) |
| Total | 446 (100.0%) | 326 (100.0%) |
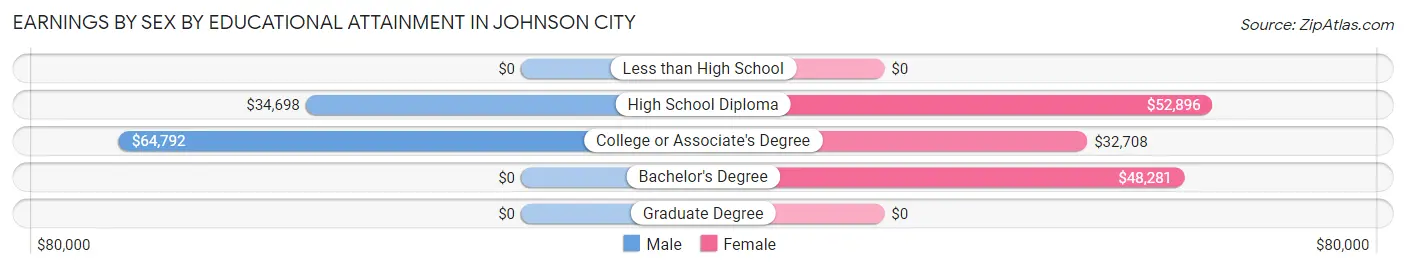
Earnings by Sex by Educational Attainment in Johnson City
Average earnings in Johnson City are $41,750 for men and $48,080 for women, a difference of 13.2%. Men with an educational attainment of college or associate's degree enjoy the highest average annual earnings of $64,792, while those with high school diploma education earn the least with $34,698. Women with an educational attainment of high school diploma earn the most with the average annual earnings of $52,896, while those with college or associate's degree education have the smallest earnings of $32,708.
| Educational Attainment | Male Income | Female Income |
| Less than High School | - | - |
| High School Diploma | $34,698 | $52,896 |
| College or Associate's Degree | $64,792 | $32,708 |
| Bachelor's Degree | - | - |
| Graduate Degree | - | - |
| Total | $41,750 | $48,080 |
Family Income in Johnson City
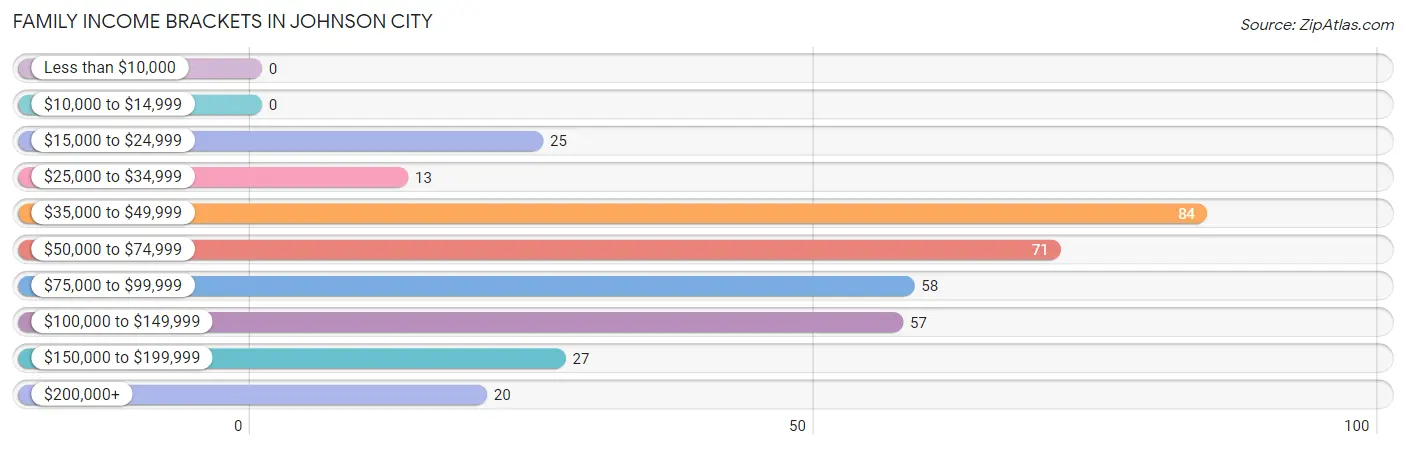
Family Income Brackets in Johnson City
According to the Johnson City family income data, there are 84 families falling into the $35,000 to $49,999 income range, which is the most common income bracket and makes up 23.7% of all families.
| Income Bracket | # Families | % Families |
| Less than $10,000 | 0 | 0.0% |
| $10,000 to $14,999 | 0 | 0.0% |
| $15,000 to $24,999 | 25 | 7.0% |
| $25,000 to $34,999 | 13 | 3.7% |
| $35,000 to $49,999 | 84 | 23.7% |
| $50,000 to $74,999 | 71 | 20.0% |
| $75,000 to $99,999 | 58 | 16.3% |
| $100,000 to $149,999 | 57 | 16.1% |
| $150,000 to $199,999 | 27 | 7.6% |
| $200,000+ | 20 | 5.6% |
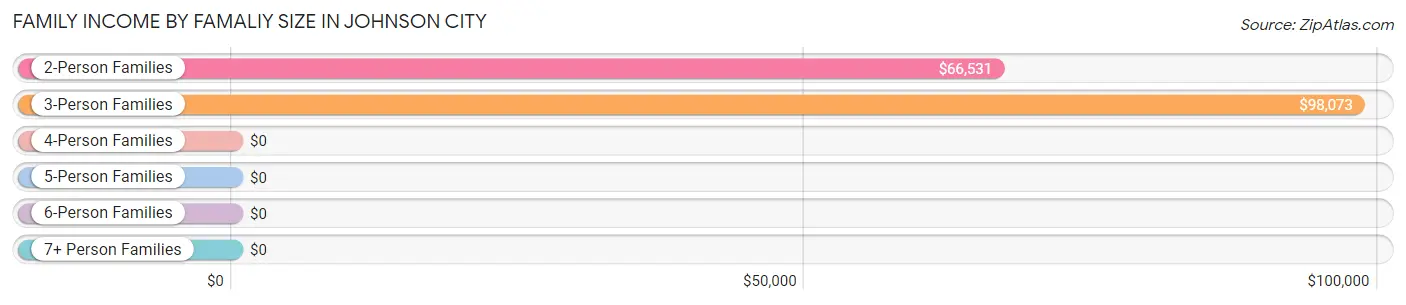
Family Income by Famaliy Size in Johnson City
3-person families (37 | 10.4%) account for the highest median family income in Johnson City with $98,073 per family, while 2-person families (255 | 71.8%) have the highest median income of $33,266 per family member.
| Income Bracket | # Families | Median Income |
| 2-Person Families | 255 (71.8%) | $66,531 |
| 3-Person Families | 37 (10.4%) | $98,073 |
| 4-Person Families | 58 (16.3%) | $0 |
| 5-Person Families | 0 (0.0%) | $0 |
| 6-Person Families | 5 (1.4%) | $0 |
| 7+ Person Families | 0 (0.0%) | $0 |
| Total | 355 (100.0%) | $67,031 |
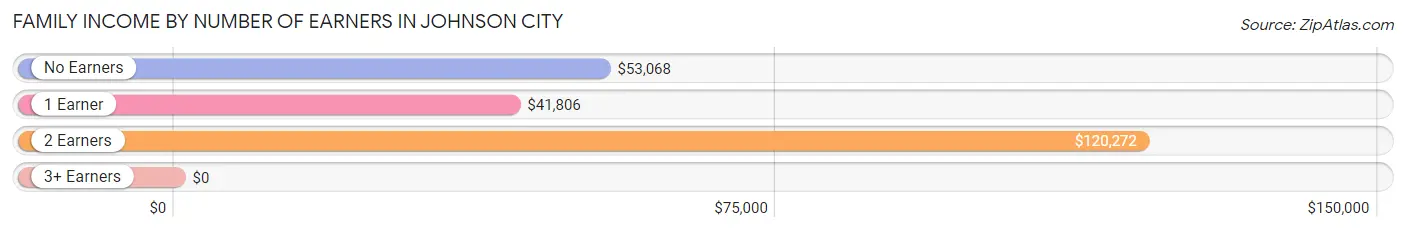
Family Income by Number of Earners in Johnson City
| Number of Earners | # Families | Median Income |
| No Earners | 121 (34.1%) | $53,068 |
| 1 Earner | 95 (26.8%) | $41,806 |
| 2 Earners | 111 (31.3%) | $120,272 |
| 3+ Earners | 28 (7.9%) | $0 |
| Total | 355 (100.0%) | $67,031 |
Household Income in Johnson City
Household Income Brackets in Johnson City
With 175 households falling in the category, the $50,000 to $74,999 income range is the most frequent in Johnson City, accounting for 28.5% of all households.
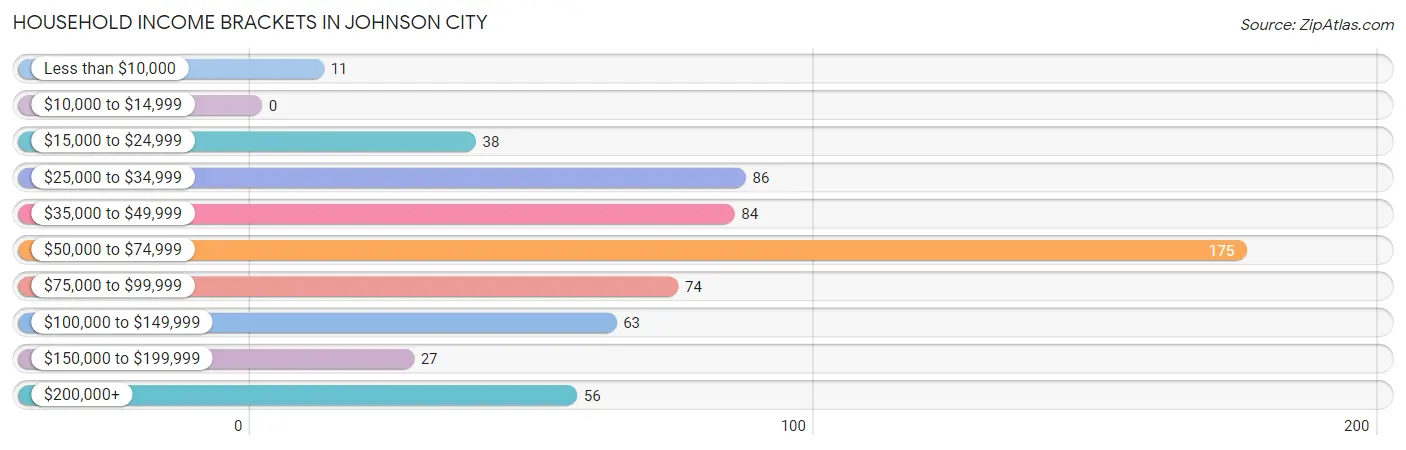
| Income Bracket | # Households | % Households |
| Less than $10,000 | 11 | 1.8% |
| $10,000 to $14,999 | 0 | 0.0% |
| $15,000 to $24,999 | 38 | 6.2% |
| $25,000 to $34,999 | 86 | 14.0% |
| $35,000 to $49,999 | 84 | 13.7% |
| $50,000 to $74,999 | 175 | 28.5% |
| $75,000 to $99,999 | 74 | 12.1% |
| $100,000 to $149,999 | 63 | 10.3% |
| $150,000 to $199,999 | 27 | 4.4% |
| $200,000+ | 56 | 9.1% |
Household Income by Householder Age in Johnson City
The median household income in Johnson City is $65,308, with the highest median household income of $67,400 found in the 25 to 44 years age bracket for the primary householder. A total of 180 households (29.3%) fall into this category. Meanwhile, the 15 to 24 years age bracket for the primary householder has the lowest median household income of $36,484, with 39 households (6.4%) in this group.
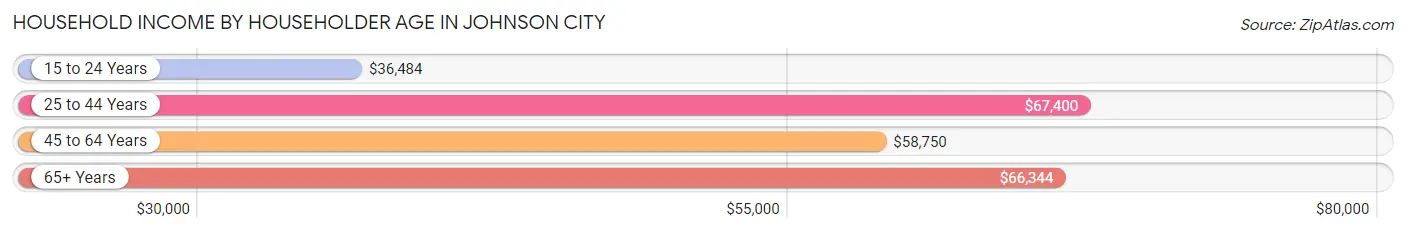
| Income Bracket | # Households | Median Income |
| 15 to 24 Years | 39 (6.4%) | $36,484 |
| 25 to 44 Years | 180 (29.3%) | $67,400 |
| 45 to 64 Years | 280 (45.6%) | $58,750 |
| 65+ Years | 115 (18.7%) | $66,344 |
| Total | 614 (100.0%) | $65,308 |
Poverty in Johnson City
Income Below Poverty by Sex and Age in Johnson City
With 1.1% poverty level for males and 0.5% for females among the residents of Johnson City, 45 to 54 year old males and 75 year old and over females are the most vulnerable to poverty, with 8 males (14.0%) and 3 females (12.5%) in their respective age groups living below the poverty level.

| Age Bracket | Male | Female |
| Under 5 Years | 0 (0.0%) | 0 (0.0%) |
| 5 Years | 0 (0.0%) | 0 (0.0%) |
| 6 to 11 Years | 0 (0.0%) | 0 (0.0%) |
| 12 to 14 Years | 0 (0.0%) | 0 (0.0%) |
| 15 Years | 0 (0.0%) | 0 (0.0%) |
| 16 and 17 Years | 0 (0.0%) | 0 (0.0%) |
| 18 to 24 Years | 0 (0.0%) | 0 (0.0%) |
| 25 to 34 Years | 0 (0.0%) | 0 (0.0%) |
| 35 to 44 Years | 0 (0.0%) | 0 (0.0%) |
| 45 to 54 Years | 8 (14.0%) | 0 (0.0%) |
| 55 to 64 Years | 0 (0.0%) | 0 (0.0%) |
| 65 to 74 Years | 0 (0.0%) | 0 (0.0%) |
| 75 Years and over | 0 (0.0%) | 3 (12.5%) |
| Total | 8 (1.1%) | 3 (0.5%) |
Income Above Poverty by Sex and Age in Johnson City
According to the poverty statistics in Johnson City, males aged 5 years and females aged under 5 years are the age groups that are most secure financially, with 100.0% of males and 100.0% of females in these age groups living above the poverty line.
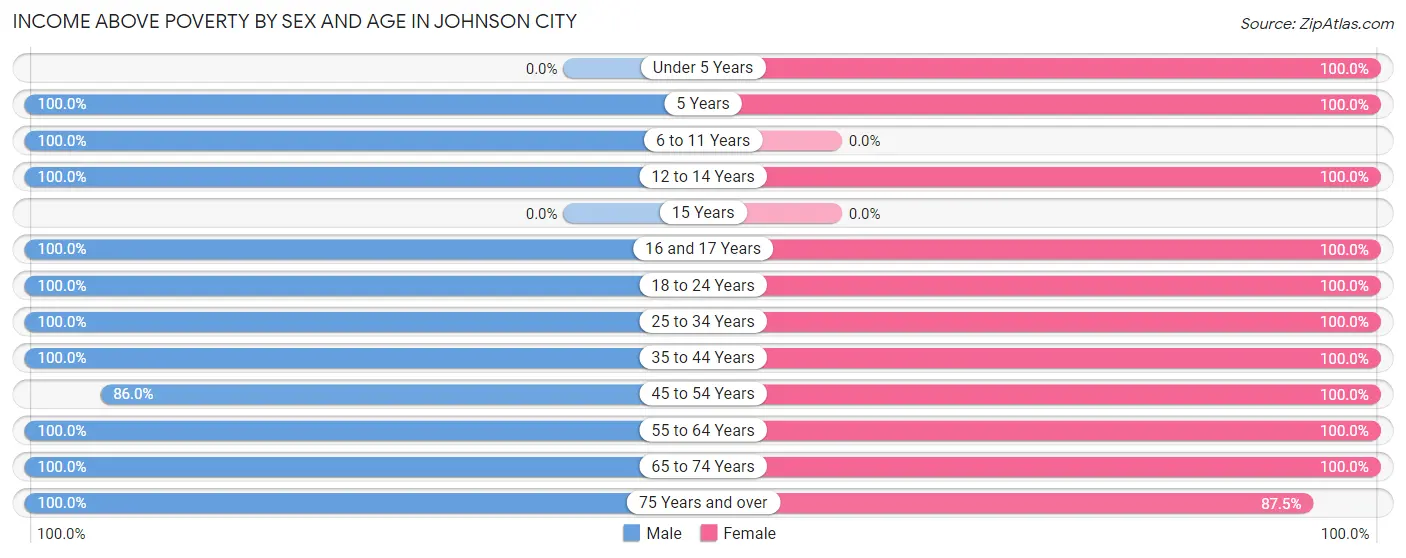
| Age Bracket | Male | Female |
| Under 5 Years | 0 (0.0%) | 58 (100.0%) |
| 5 Years | 10 (100.0%) | 19 (100.0%) |
| 6 to 11 Years | 59 (100.0%) | 0 (0.0%) |
| 12 to 14 Years | 34 (100.0%) | 11 (100.0%) |
| 15 Years | 0 (0.0%) | 0 (0.0%) |
| 16 and 17 Years | 23 (100.0%) | 20 (100.0%) |
| 18 to 24 Years | 39 (100.0%) | 88 (100.0%) |
| 25 to 34 Years | 167 (100.0%) | 37 (100.0%) |
| 35 to 44 Years | 52 (100.0%) | 115 (100.0%) |
| 45 to 54 Years | 49 (86.0%) | 77 (100.0%) |
| 55 to 64 Years | 190 (100.0%) | 103 (100.0%) |
| 65 to 74 Years | 62 (100.0%) | 27 (100.0%) |
| 75 Years and over | 16 (100.0%) | 21 (87.5%) |
| Total | 701 (98.9%) | 576 (99.5%) |
Income Below Poverty Among Married-Couple Families in Johnson City
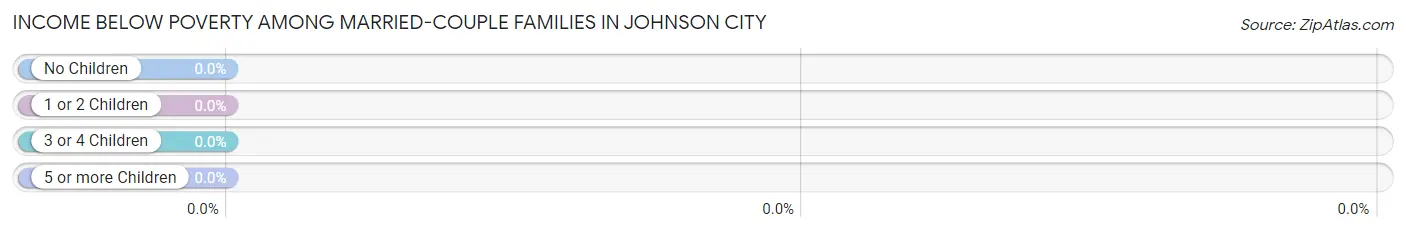
| Children | Above Poverty | Below Poverty |
| No Children | 250 (100.0%) | 0 (0.0%) |
| 1 or 2 Children | 58 (100.0%) | 0 (0.0%) |
| 3 or 4 Children | 5 (100.0%) | 0 (0.0%) |
| 5 or more Children | 0 (0.0%) | 0 (0.0%) |
| Total | 313 (100.0%) | 0 (0.0%) |
Income Below Poverty Among Single-Parent Households in Johnson City
| Children | Single Father | Single Mother |
| No Children | 0 (0.0%) | 0 (0.0%) |
| 1 or 2 Children | 0 (0.0%) | 0 (0.0%) |
| 3 or 4 Children | 0 (0.0%) | 0 (0.0%) |
| 5 or more Children | 0 (0.0%) | 0 (0.0%) |
| Total | 0 (0.0%) | 0 (0.0%) |
Income Below Poverty Among Married-Couple vs Single-Parent Households in Johnson City
| Children | Married-Couple Families | Single-Parent Households |
| No Children | 0 (0.0%) | 0 (0.0%) |
| 1 or 2 Children | 0 (0.0%) | 0 (0.0%) |
| 3 or 4 Children | 0 (0.0%) | 0 (0.0%) |
| 5 or more Children | 0 (0.0%) | 0 (0.0%) |
| Total | 0 (0.0%) | 0 (0.0%) |
Employment Characteristics in Johnson City
Employment by Class of Employer in Johnson City
Among the 724 employed individuals in Johnson City, private company employees (495 | 68.4%), local government employees (95 | 13.1%), and self-employed (not incorporated) (84 | 11.6%) make up the most common classes of employment.
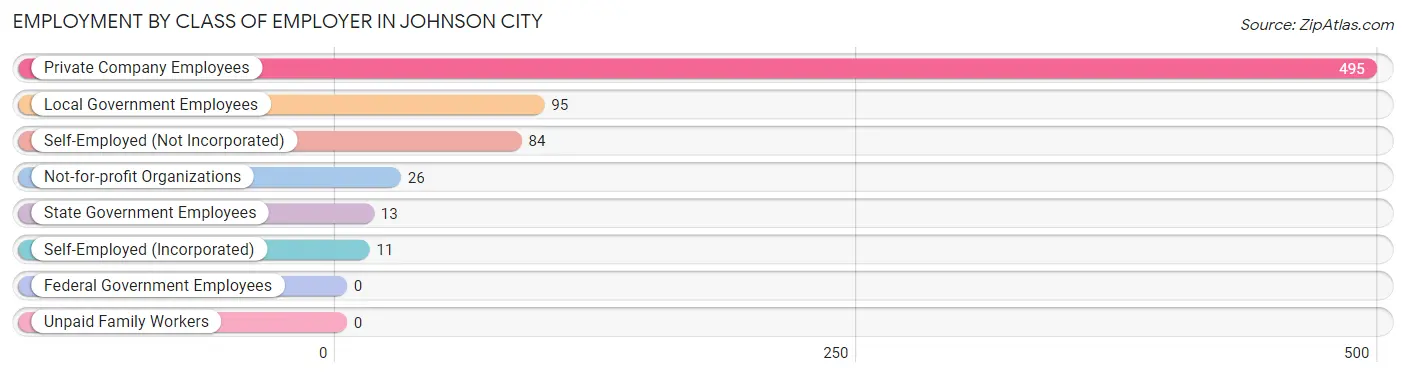
| Employer Class | # Employees | % Employees |
| Private Company Employees | 495 | 68.4% |
| Self-Employed (Incorporated) | 11 | 1.5% |
| Self-Employed (Not Incorporated) | 84 | 11.6% |
| Not-for-profit Organizations | 26 | 3.6% |
| Local Government Employees | 95 | 13.1% |
| State Government Employees | 13 | 1.8% |
| Federal Government Employees | 0 | 0.0% |
| Unpaid Family Workers | 0 | 0.0% |
| Total | 724 | 100.0% |
Employment Status by Age in Johnson City
According to the labor force statistics for Johnson City, out of the total population over 16 years of age (1,127), 68.0% or 766 individuals are in the labor force, with 3.4% or 26 of them unemployed. The age group with the highest labor force participation rate is 30 to 34 years, with 100.0% or 50 individuals in the labor force. Within the labor force, the 25 to 29 years age range has the highest percentage of unemployed individuals, with 18.3% or 26 of them being unemployed.
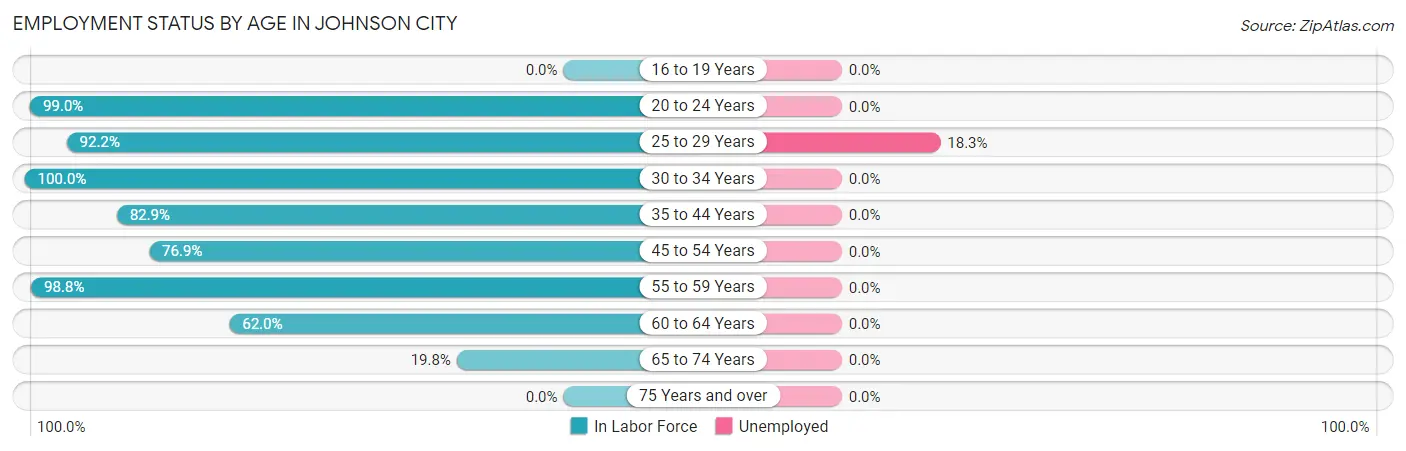
| Age Bracket | In Labor Force | Unemployed |
| 16 to 19 Years | 0 (0.0%) | 0 (0.0%) |
| 20 to 24 Years | 100 (99.0%) | 0 (0.0%) |
| 25 to 29 Years | 142 (92.2%) | 26 (18.3%) |
| 30 to 34 Years | 50 (100.0%) | 0 (0.0%) |
| 35 to 44 Years | 141 (82.9%) | 0 (0.0%) |
| 45 to 54 Years | 103 (76.9%) | 0 (0.0%) |
| 55 to 59 Years | 80 (98.8%) | 0 (0.0%) |
| 60 to 64 Years | 132 (62.0%) | 0 (0.0%) |
| 65 to 74 Years | 18 (19.8%) | 0 (0.0%) |
| 75 Years and over | 0 (0.0%) | 0 (0.0%) |
| Total | 766 (68.0%) | 26 (3.4%) |
Employment Status by Educational Attainment in Johnson City
According to labor force statistics for Johnson City, 80.8% of individuals (648) out of the total population between 25 and 64 years of age (802) are in the labor force, with 4.0% or 26 of them being unemployed. The group with the highest labor force participation rate are those with the educational attainment of bachelor's degree or higher, with 100.0% or 93 individuals in the labor force. Within the labor force, individuals with high school diploma education have the highest percentage of unemployment, with 8.6% or 26 of them being unemployed.
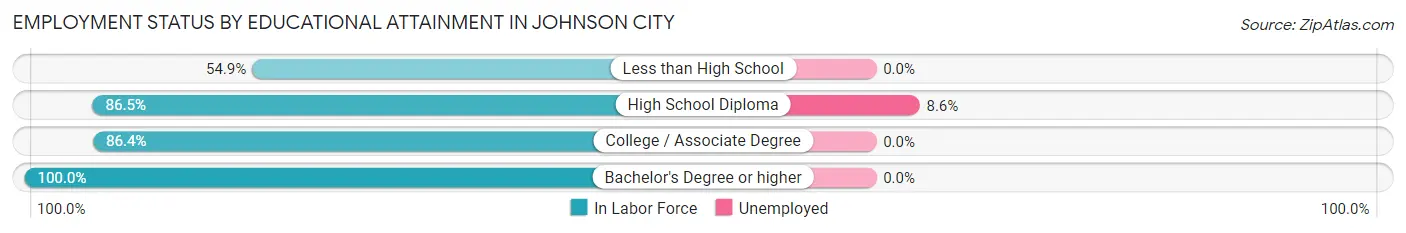
| Educational Attainment | In Labor Force | Unemployed |
| Less than High School | 101 (54.9%) | 0 (0.0%) |
| High School Diploma | 301 (86.5%) | 30 (8.6%) |
| College / Associate Degree | 153 (86.4%) | 0 (0.0%) |
| Bachelor's Degree or higher | 93 (100.0%) | 0 (0.0%) |
| Total | 648 (80.8%) | 32 (4.0%) |
Employment Occupations by Sex in Johnson City
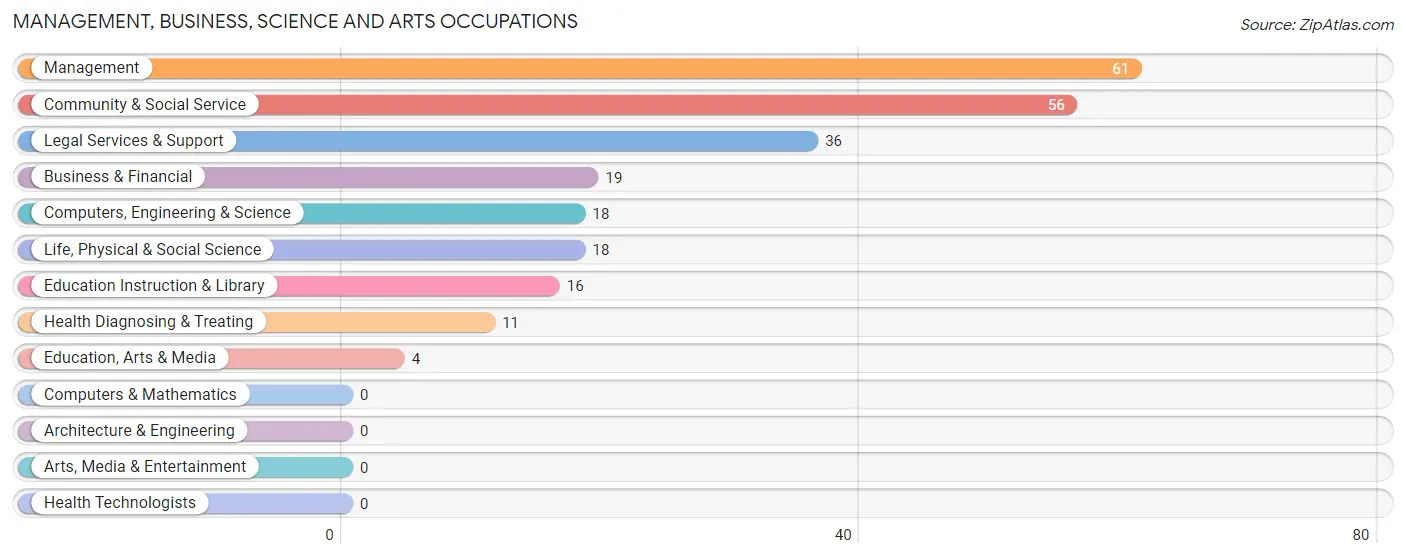
Management, Business, Science and Arts Occupations
The most common Management, Business, Science and Arts occupations in Johnson City are Management (61 | 8.2%), Community & Social Service (56 | 7.6%), Legal Services & Support (36 | 4.9%), Business & Financial (19 | 2.6%), and Computers, Engineering & Science (18 | 2.4%).
Management, Business, Science and Arts Occupations by Sex
Within the Management, Business, Science and Arts occupations in Johnson City, the most male-oriented occupations are Computers, Engineering & Science (100.0%), Life, Physical & Social Science (100.0%), and Legal Services & Support (100.0%), while the most female-oriented occupations are Education, Arts & Media (100.0%), Education Instruction & Library (100.0%), and Health Diagnosing & Treating (100.0%).
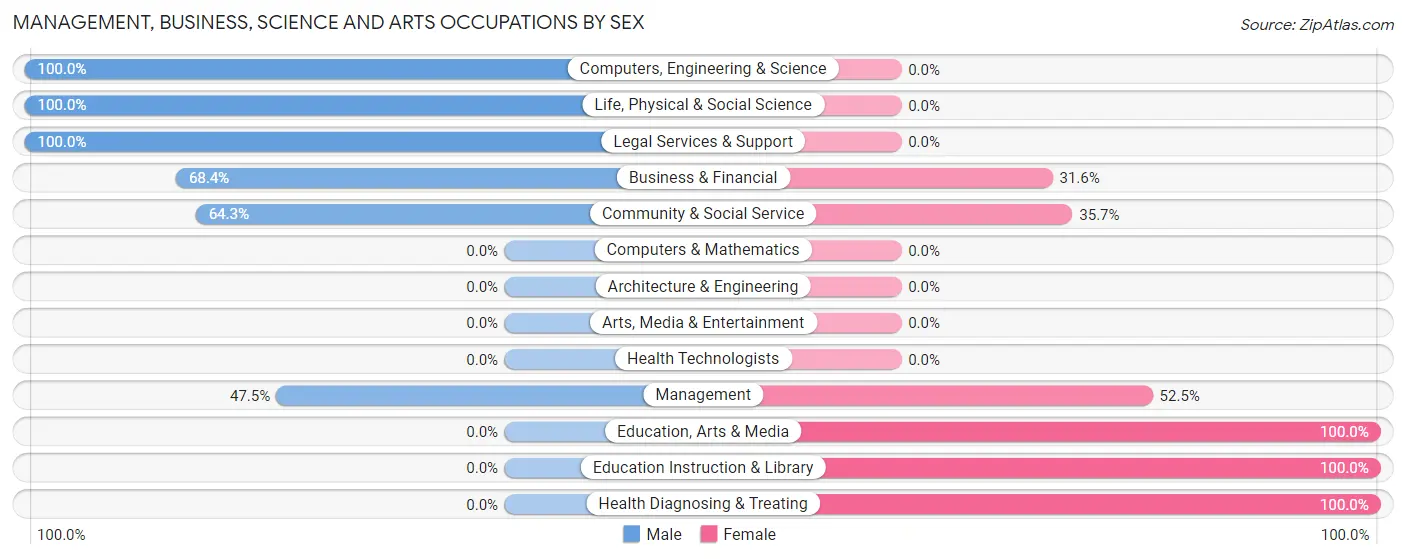
| Occupation | Male | Female |
| Management | 29 (47.5%) | 32 (52.5%) |
| Business & Financial | 13 (68.4%) | 6 (31.6%) |
| Computers, Engineering & Science | 18 (100.0%) | 0 (0.0%) |
| Computers & Mathematics | 0 (0.0%) | 0 (0.0%) |
| Architecture & Engineering | 0 (0.0%) | 0 (0.0%) |
| Life, Physical & Social Science | 18 (100.0%) | 0 (0.0%) |
| Community & Social Service | 36 (64.3%) | 20 (35.7%) |
| Education, Arts & Media | 0 (0.0%) | 4 (100.0%) |
| Legal Services & Support | 36 (100.0%) | 0 (0.0%) |
| Education Instruction & Library | 0 (0.0%) | 16 (100.0%) |
| Arts, Media & Entertainment | 0 (0.0%) | 0 (0.0%) |
| Health Diagnosing & Treating | 0 (0.0%) | 11 (100.0%) |
| Health Technologists | 0 (0.0%) | 0 (0.0%) |
| Total (Category) | 96 (58.2%) | 69 (41.8%) |
| Total (Overall) | 417 (56.4%) | 323 (43.6%) |
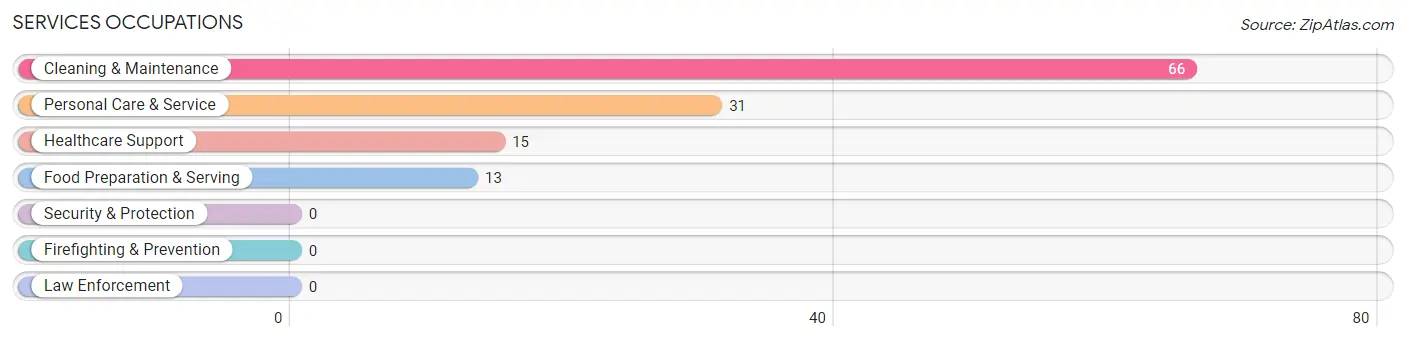
Services Occupations
The most common Services occupations in Johnson City are Cleaning & Maintenance (66 | 8.9%), Personal Care & Service (31 | 4.2%), Healthcare Support (15 | 2.0%), and Food Preparation & Serving (13 | 1.8%).
Services Occupations by Sex
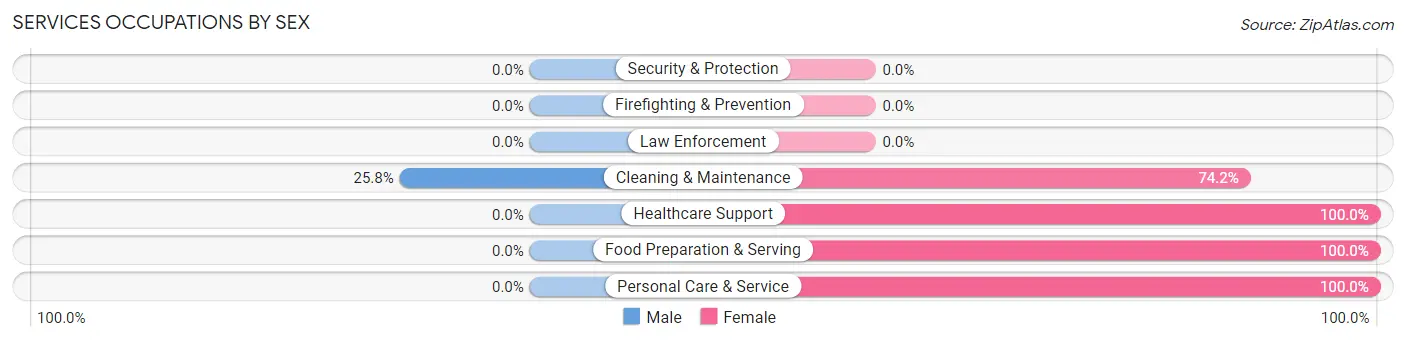
| Occupation | Male | Female |
| Healthcare Support | 0 (0.0%) | 15 (100.0%) |
| Security & Protection | 0 (0.0%) | 0 (0.0%) |
| Firefighting & Prevention | 0 (0.0%) | 0 (0.0%) |
| Law Enforcement | 0 (0.0%) | 0 (0.0%) |
| Food Preparation & Serving | 0 (0.0%) | 13 (100.0%) |
| Cleaning & Maintenance | 17 (25.8%) | 49 (74.2%) |
| Personal Care & Service | 0 (0.0%) | 31 (100.0%) |
| Total (Category) | 17 (13.6%) | 108 (86.4%) |
| Total (Overall) | 417 (56.4%) | 323 (43.6%) |
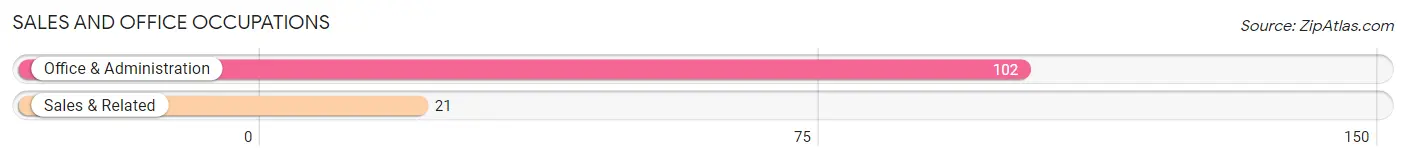
Sales and Office Occupations
The most common Sales and Office occupations in Johnson City are Office & Administration (102 | 13.8%), and Sales & Related (21 | 2.8%).
Sales and Office Occupations by Sex
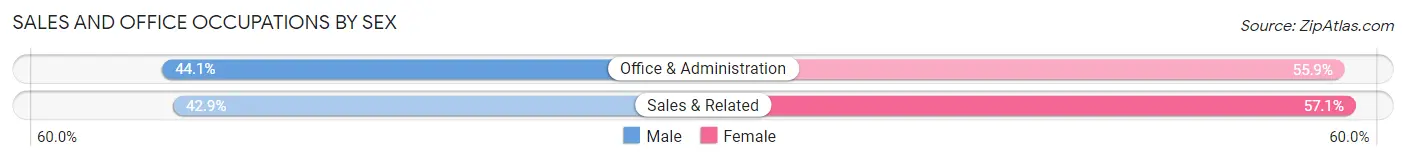
| Occupation | Male | Female |
| Sales & Related | 9 (42.9%) | 12 (57.1%) |
| Office & Administration | 45 (44.1%) | 57 (55.9%) |
| Total (Category) | 54 (43.9%) | 69 (56.1%) |
| Total (Overall) | 417 (56.4%) | 323 (43.6%) |
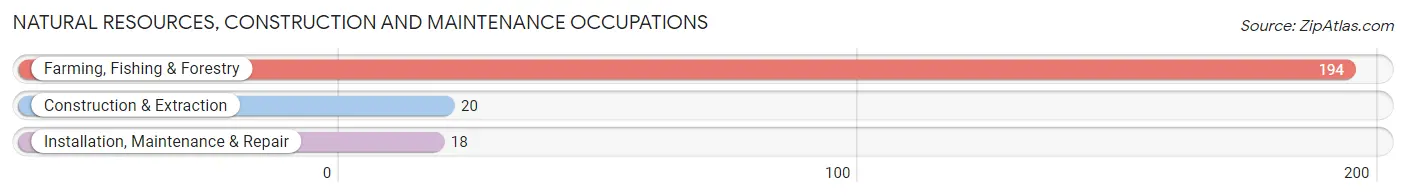
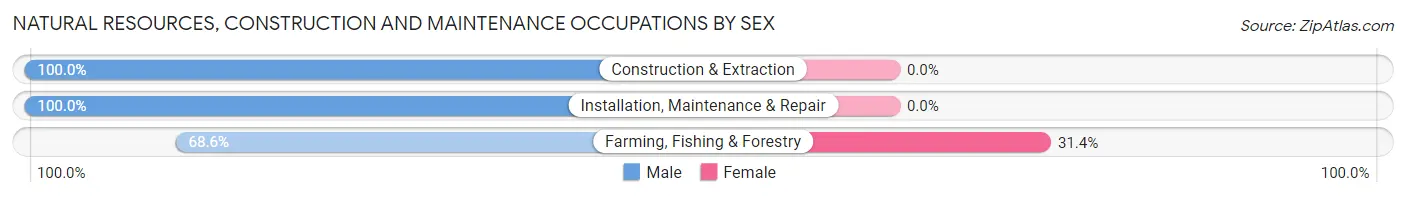
Natural Resources, Construction and Maintenance Occupations
The most common Natural Resources, Construction and Maintenance occupations in Johnson City are Farming, Fishing & Forestry (194 | 26.2%), Construction & Extraction (20 | 2.7%), and Installation, Maintenance & Repair (18 | 2.4%).
Natural Resources, Construction and Maintenance Occupations by Sex
| Occupation | Male | Female |
| Farming, Fishing & Forestry | 133 (68.6%) | 61 (31.4%) |
| Construction & Extraction | 20 (100.0%) | 0 (0.0%) |
| Installation, Maintenance & Repair | 18 (100.0%) | 0 (0.0%) |
| Total (Category) | 171 (73.7%) | 61 (26.3%) |
| Total (Overall) | 417 (56.4%) | 323 (43.6%) |
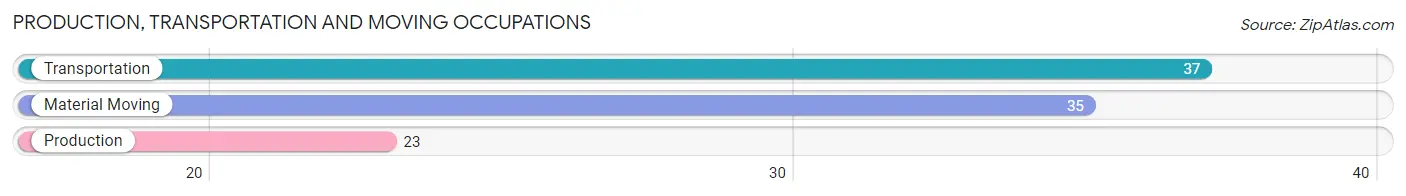
Production, Transportation and Moving Occupations
The most common Production, Transportation and Moving occupations in Johnson City are Transportation (37 | 5.0%), Material Moving (35 | 4.7%), and Production (23 | 3.1%).
Production, Transportation and Moving Occupations by Sex
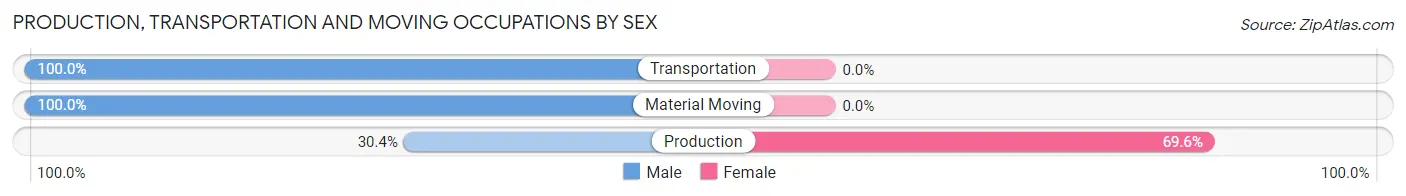
| Occupation | Male | Female |
| Production | 7 (30.4%) | 16 (69.6%) |
| Transportation | 37 (100.0%) | 0 (0.0%) |
| Material Moving | 35 (100.0%) | 0 (0.0%) |
| Total (Category) | 79 (83.2%) | 16 (16.8%) |
| Total (Overall) | 417 (56.4%) | 323 (43.6%) |
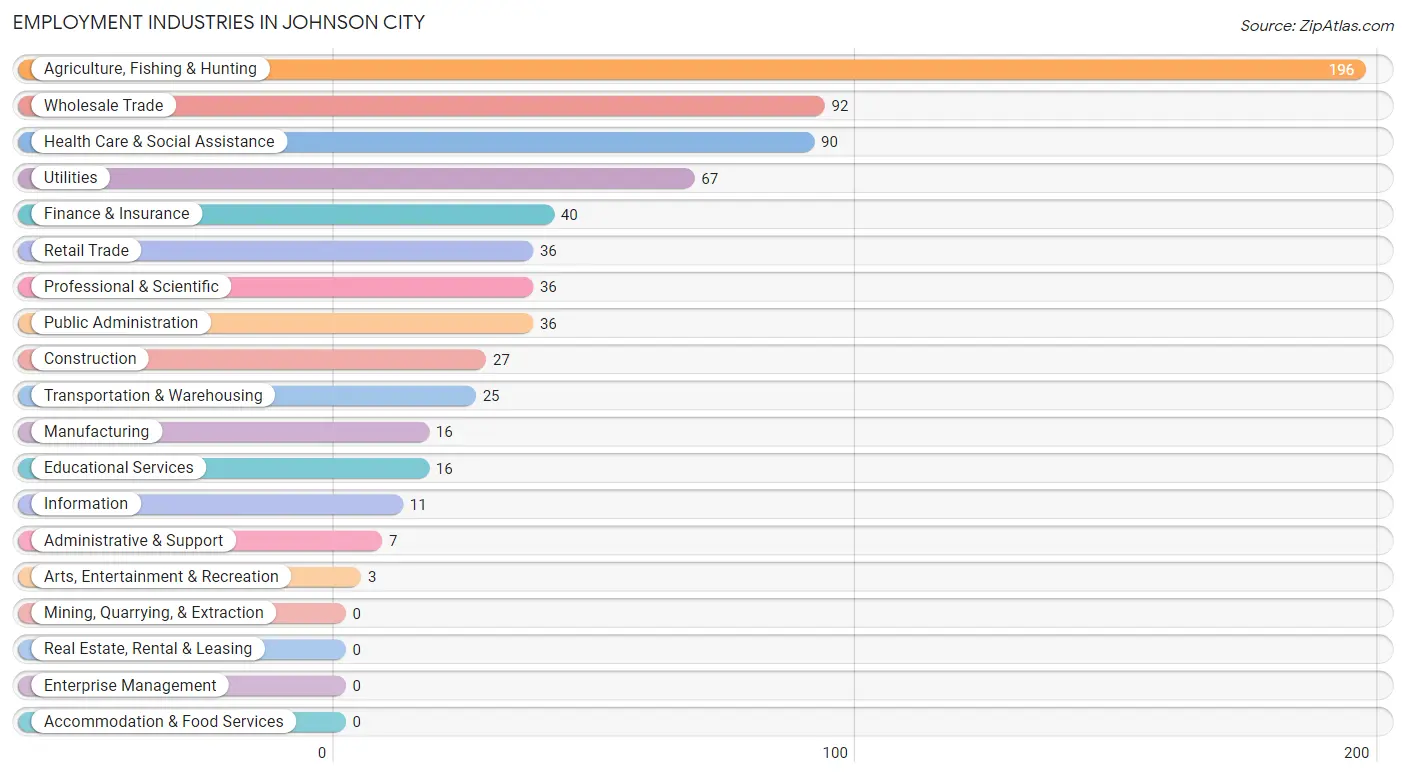
Employment Industries by Sex in Johnson City
Employment Industries in Johnson City
The major employment industries in Johnson City include Agriculture, Fishing & Hunting (196 | 26.5%), Wholesale Trade (92 | 12.4%), Health Care & Social Assistance (90 | 12.2%), Utilities (67 | 9.0%), and Finance & Insurance (40 | 5.4%).
Employment Industries by Sex in Johnson City
The Johnson City industries that see more men than women are Construction (100.0%), Transportation & Warehousing (100.0%), and Utilities (100.0%), whereas the industries that tend to have a higher number of women are Manufacturing (100.0%), Retail Trade (100.0%), and Information (100.0%).
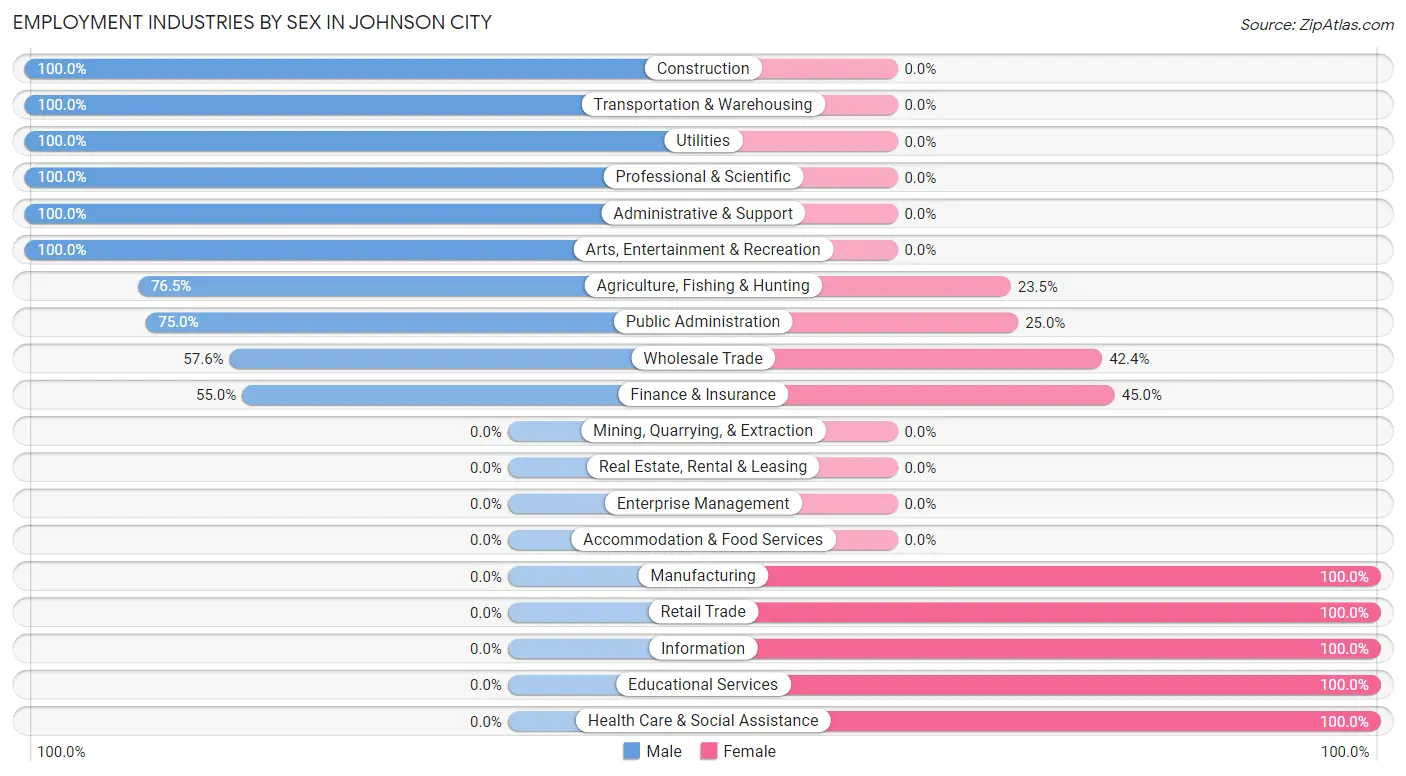
| Industry | Male | Female |
| Agriculture, Fishing & Hunting | 150 (76.5%) | 46 (23.5%) |
| Mining, Quarrying, & Extraction | 0 (0.0%) | 0 (0.0%) |
| Construction | 27 (100.0%) | 0 (0.0%) |
| Manufacturing | 0 (0.0%) | 16 (100.0%) |
| Wholesale Trade | 53 (57.6%) | 39 (42.4%) |
| Retail Trade | 0 (0.0%) | 36 (100.0%) |
| Transportation & Warehousing | 25 (100.0%) | 0 (0.0%) |
| Utilities | 67 (100.0%) | 0 (0.0%) |
| Information | 0 (0.0%) | 11 (100.0%) |
| Finance & Insurance | 22 (55.0%) | 18 (45.0%) |
| Real Estate, Rental & Leasing | 0 (0.0%) | 0 (0.0%) |
| Professional & Scientific | 36 (100.0%) | 0 (0.0%) |
| Enterprise Management | 0 (0.0%) | 0 (0.0%) |
| Administrative & Support | 7 (100.0%) | 0 (0.0%) |
| Educational Services | 0 (0.0%) | 16 (100.0%) |
| Health Care & Social Assistance | 0 (0.0%) | 90 (100.0%) |
| Arts, Entertainment & Recreation | 3 (100.0%) | 0 (0.0%) |
| Accommodation & Food Services | 0 (0.0%) | 0 (0.0%) |
| Public Administration | 27 (75.0%) | 9 (25.0%) |
| Total | 417 (56.4%) | 323 (43.6%) |
Education in Johnson City
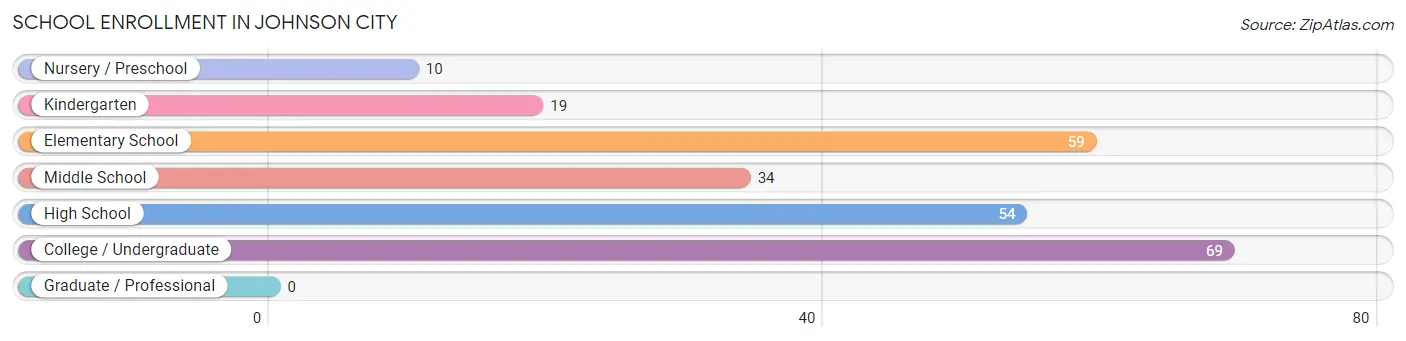
School Enrollment in Johnson City
The most common levels of schooling among the 245 students in Johnson City are college / undergraduate (69 | 28.2%), elementary school (59 | 24.1%), and high school (54 | 22.0%).
| School Level | # Students | % Students |
| Nursery / Preschool | 10 | 4.1% |
| Kindergarten | 19 | 7.8% |
| Elementary School | 59 | 24.1% |
| Middle School | 34 | 13.9% |
| High School | 54 | 22.0% |
| College / Undergraduate | 69 | 28.2% |
| Graduate / Professional | 0 | 0.0% |
| Total | 245 | 100.0% |
School Enrollment by Age by Funding Source in Johnson City
Out of a total of 245 students who are enrolled in schools in Johnson City, 42 (17.1%) attend a private institution, while the remaining 203 (82.9%) are enrolled in public schools. The age group of 20 to 24 year olds has the highest likelihood of being enrolled in private schools, with 30 (100.0% in the age bracket) enrolled. Conversely, the age group of 5 to 9 year old has the lowest likelihood of being enrolled in a private school, with 88 (100.0% in the age bracket) attending a public institution.
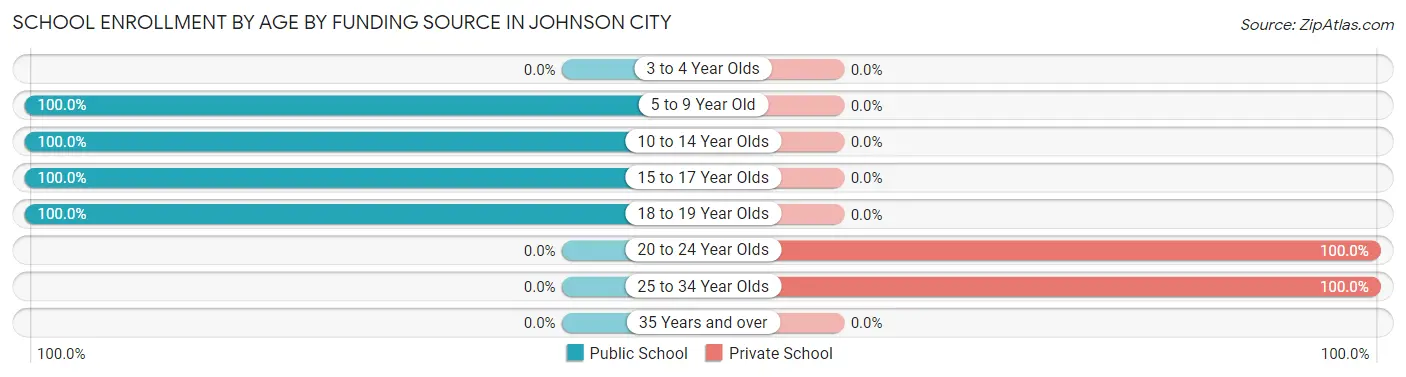
| Age Bracket | Public School | Private School |
| 3 to 4 Year Olds | 0 (0.0%) | 0 (0.0%) |
| 5 to 9 Year Old | 88 (100.0%) | 0 (0.0%) |
| 10 to 14 Year Olds | 45 (100.0%) | 0 (0.0%) |
| 15 to 17 Year Olds | 43 (100.0%) | 0 (0.0%) |
| 18 to 19 Year Olds | 27 (100.0%) | 0 (0.0%) |
| 20 to 24 Year Olds | 0 (0.0%) | 30 (100.0%) |
| 25 to 34 Year Olds | 0 (0.0%) | 12 (100.0%) |
| 35 Years and over | 0 (0.0%) | 0 (0.0%) |
| Total | 203 (82.9%) | 42 (17.1%) |
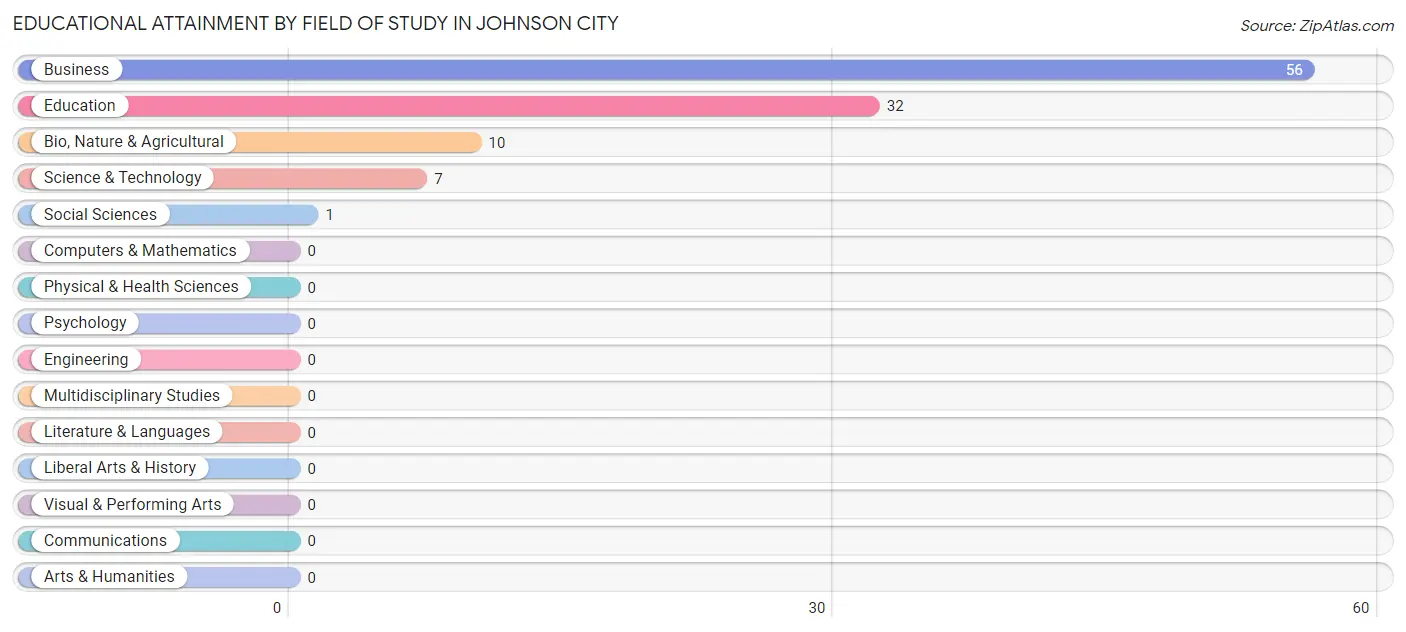
Educational Attainment by Field of Study in Johnson City
Business (56 | 52.8%), education (32 | 30.2%), bio, nature & agricultural (10 | 9.4%), science & technology (7 | 6.6%), and social sciences (1 | 0.9%) are the most common fields of study among 106 individuals in Johnson City who have obtained a bachelor's degree or higher.
| Field of Study | # Graduates | % Graduates |
| Computers & Mathematics | 0 | 0.0% |
| Bio, Nature & Agricultural | 10 | 9.4% |
| Physical & Health Sciences | 0 | 0.0% |
| Psychology | 0 | 0.0% |
| Social Sciences | 1 | 0.9% |
| Engineering | 0 | 0.0% |
| Multidisciplinary Studies | 0 | 0.0% |
| Science & Technology | 7 | 6.6% |
| Business | 56 | 52.8% |
| Education | 32 | 30.2% |
| Literature & Languages | 0 | 0.0% |
| Liberal Arts & History | 0 | 0.0% |
| Visual & Performing Arts | 0 | 0.0% |
| Communications | 0 | 0.0% |
| Arts & Humanities | 0 | 0.0% |
| Total | 106 | 100.0% |
Transportation & Commute in Johnson City
Vehicle Availability by Sex in Johnson City
The most prevalent vehicle ownership categories in Johnson City are males with 2 vehicles (181, accounting for 44.7%) and females with 2 vehicles (80, making up 56.7%).
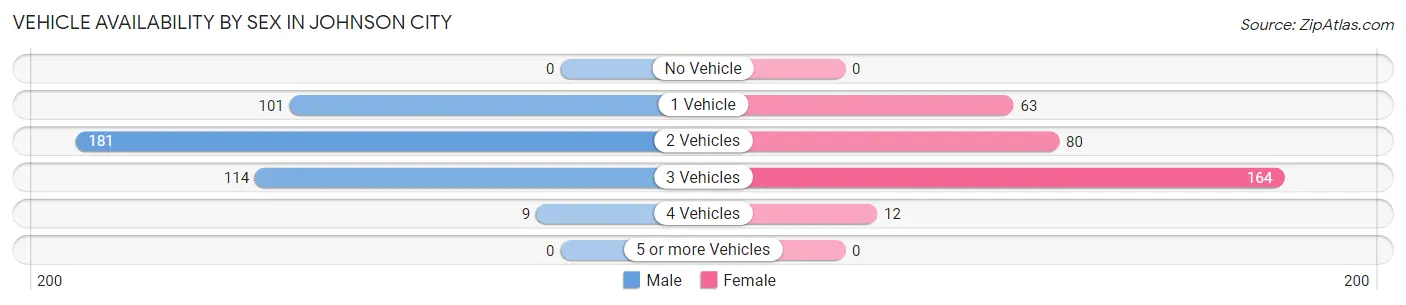
| Vehicles Available | Male | Female |
| No Vehicle | 0 (0.0%) | 0 (0.0%) |
| 1 Vehicle | 101 (24.9%) | 63 (19.8%) |
| 2 Vehicles | 181 (44.7%) | 80 (25.1%) |
| 3 Vehicles | 114 (28.1%) | 164 (51.4%) |
| 4 Vehicles | 9 (2.2%) | 12 (3.8%) |
| 5 or more Vehicles | 0 (0.0%) | 0 (0.0%) |
| Total | 405 (100.0%) | 319 (100.0%) |
Commute Time in Johnson City
The most frequently occuring commute durations in Johnson City are less than 5 minutes (321 commuters, 49.5%), 5 to 9 minutes (92 commuters, 14.2%), and 30 to 34 minutes (88 commuters, 13.6%).
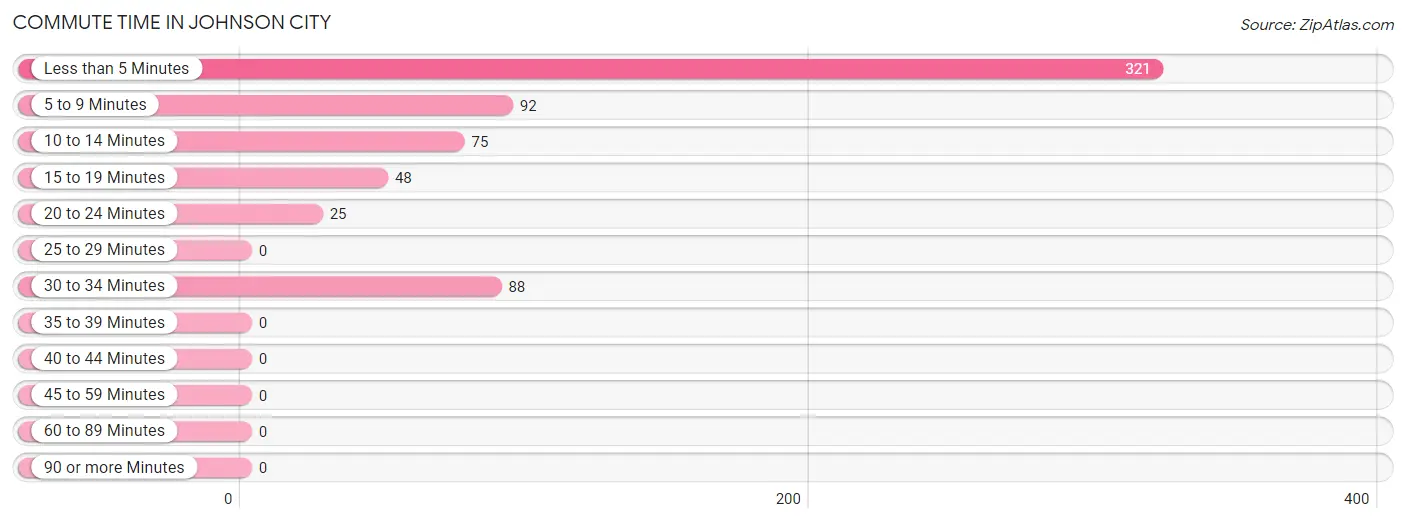
| Commute Time | # Commuters | % Commuters |
| Less than 5 Minutes | 321 | 49.5% |
| 5 to 9 Minutes | 92 | 14.2% |
| 10 to 14 Minutes | 75 | 11.6% |
| 15 to 19 Minutes | 48 | 7.4% |
| 20 to 24 Minutes | 25 | 3.8% |
| 25 to 29 Minutes | 0 | 0.0% |
| 30 to 34 Minutes | 88 | 13.6% |
| 35 to 39 Minutes | 0 | 0.0% |
| 40 to 44 Minutes | 0 | 0.0% |
| 45 to 59 Minutes | 0 | 0.0% |
| 60 to 89 Minutes | 0 | 0.0% |
| 90 or more Minutes | 0 | 0.0% |
Commute Time by Sex in Johnson City
The most common commute times in Johnson City are less than 5 minutes (191 commuters, 50.0%) for males and less than 5 minutes (130 commuters, 48.7%) for females.
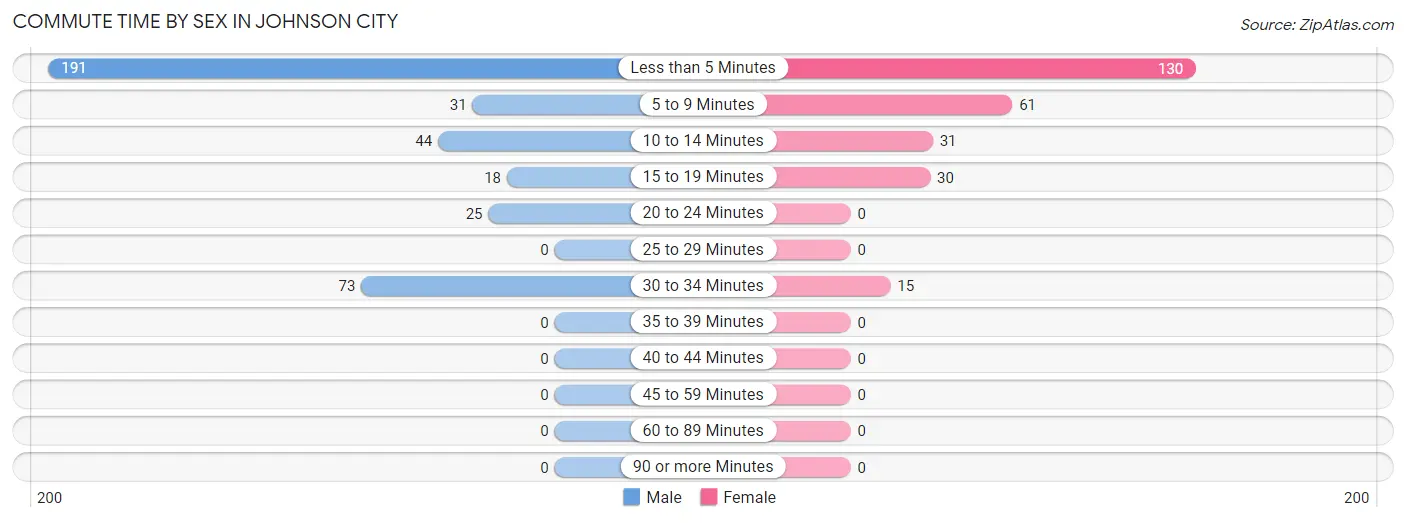
| Commute Time | Male | Female |
| Less than 5 Minutes | 191 (50.0%) | 130 (48.7%) |
| 5 to 9 Minutes | 31 (8.1%) | 61 (22.9%) |
| 10 to 14 Minutes | 44 (11.5%) | 31 (11.6%) |
| 15 to 19 Minutes | 18 (4.7%) | 30 (11.2%) |
| 20 to 24 Minutes | 25 (6.5%) | 0 (0.0%) |
| 25 to 29 Minutes | 0 (0.0%) | 0 (0.0%) |
| 30 to 34 Minutes | 73 (19.1%) | 15 (5.6%) |
| 35 to 39 Minutes | 0 (0.0%) | 0 (0.0%) |
| 40 to 44 Minutes | 0 (0.0%) | 0 (0.0%) |
| 45 to 59 Minutes | 0 (0.0%) | 0 (0.0%) |
| 60 to 89 Minutes | 0 (0.0%) | 0 (0.0%) |
| 90 or more Minutes | 0 (0.0%) | 0 (0.0%) |
Time of Departure to Work by Sex in Johnson City
The most frequent times of departure to work in Johnson City are 7:00 AM to 7:29 AM (140, 36.6%) for males and 8:00 AM to 8:29 AM (85, 31.8%) for females.
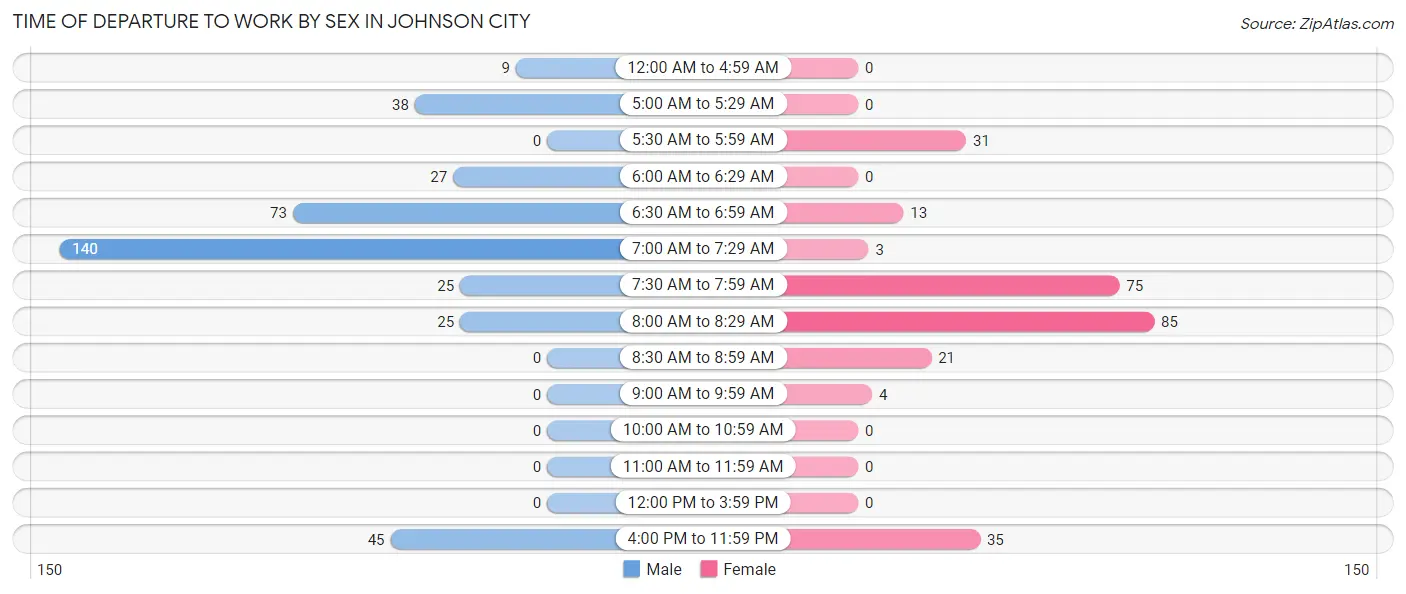
| Time of Departure | Male | Female |
| 12:00 AM to 4:59 AM | 9 (2.4%) | 0 (0.0%) |
| 5:00 AM to 5:29 AM | 38 (10.0%) | 0 (0.0%) |
| 5:30 AM to 5:59 AM | 0 (0.0%) | 31 (11.6%) |
| 6:00 AM to 6:29 AM | 27 (7.1%) | 0 (0.0%) |
| 6:30 AM to 6:59 AM | 73 (19.1%) | 13 (4.9%) |
| 7:00 AM to 7:29 AM | 140 (36.6%) | 3 (1.1%) |
| 7:30 AM to 7:59 AM | 25 (6.5%) | 75 (28.1%) |
| 8:00 AM to 8:29 AM | 25 (6.5%) | 85 (31.8%) |
| 8:30 AM to 8:59 AM | 0 (0.0%) | 21 (7.9%) |
| 9:00 AM to 9:59 AM | 0 (0.0%) | 4 (1.5%) |
| 10:00 AM to 10:59 AM | 0 (0.0%) | 0 (0.0%) |
| 11:00 AM to 11:59 AM | 0 (0.0%) | 0 (0.0%) |
| 12:00 PM to 3:59 PM | 0 (0.0%) | 0 (0.0%) |
| 4:00 PM to 11:59 PM | 45 (11.8%) | 35 (13.1%) |
| Total | 382 (100.0%) | 267 (100.0%) |
Housing Occupancy in Johnson City
Occupancy by Ownership in Johnson City
Of the total 614 dwellings in Johnson City, owner-occupied units account for 508 (82.7%), while renter-occupied units make up 106 (17.3%).
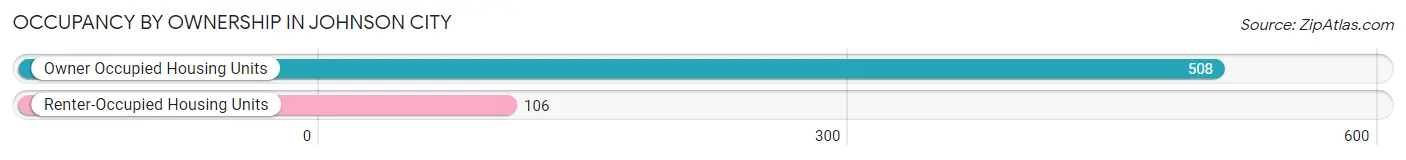
| Occupancy | # Housing Units | % Housing Units |
| Owner Occupied Housing Units | 508 | 82.7% |
| Renter-Occupied Housing Units | 106 | 17.3% |
| Total Occupied Housing Units | 614 | 100.0% |
Occupancy by Household Size in Johnson City
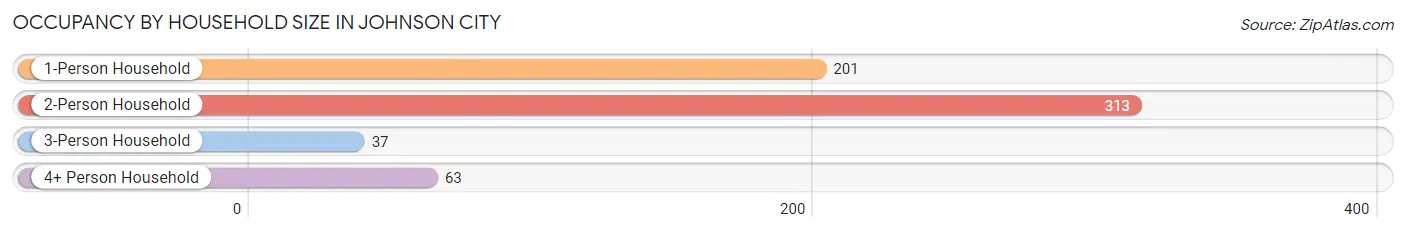
| Household Size | # Housing Units | % Housing Units |
| 1-Person Household | 201 | 32.7% |
| 2-Person Household | 313 | 51.0% |
| 3-Person Household | 37 | 6.0% |
| 4+ Person Household | 63 | 10.3% |
| Total Housing Units | 614 | 100.0% |
Occupancy by Ownership by Household Size in Johnson City
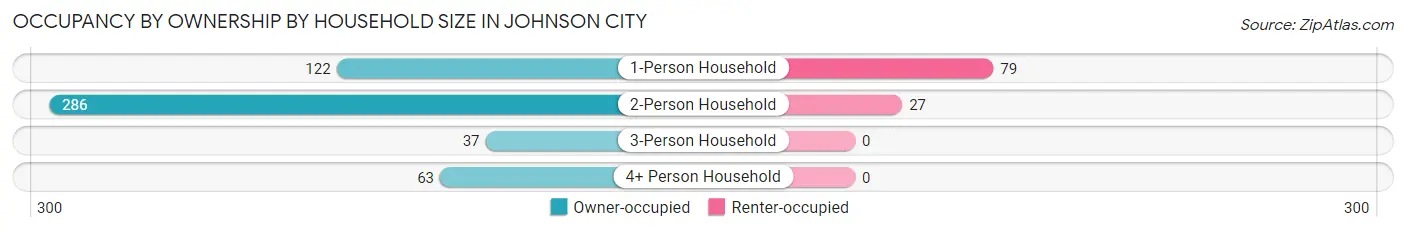
| Household Size | Owner-occupied | Renter-occupied |
| 1-Person Household | 122 (60.7%) | 79 (39.3%) |
| 2-Person Household | 286 (91.4%) | 27 (8.6%) |
| 3-Person Household | 37 (100.0%) | 0 (0.0%) |
| 4+ Person Household | 63 (100.0%) | 0 (0.0%) |
| Total Housing Units | 508 (82.7%) | 106 (17.3%) |
Occupancy by Educational Attainment in Johnson City
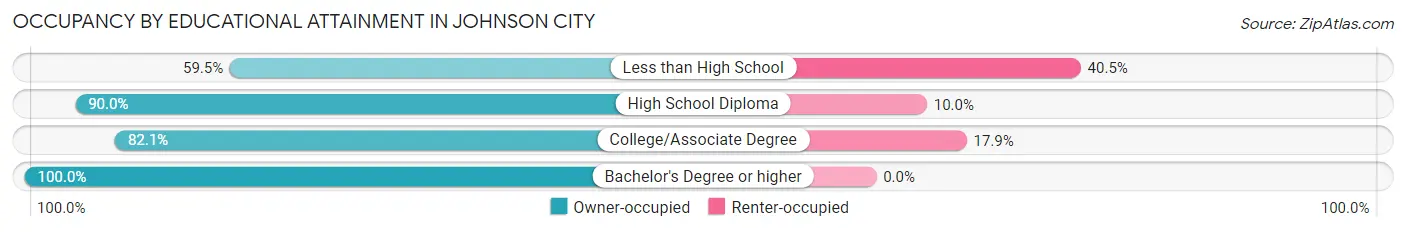
| Household Size | Owner-occupied | Renter-occupied |
| Less than High School | 88 (59.5%) | 60 (40.5%) |
| High School Diploma | 242 (90.0%) | 27 (10.0%) |
| College/Associate Degree | 87 (82.1%) | 19 (17.9%) |
| Bachelor's Degree or higher | 91 (100.0%) | 0 (0.0%) |
Occupancy by Age of Householder in Johnson City
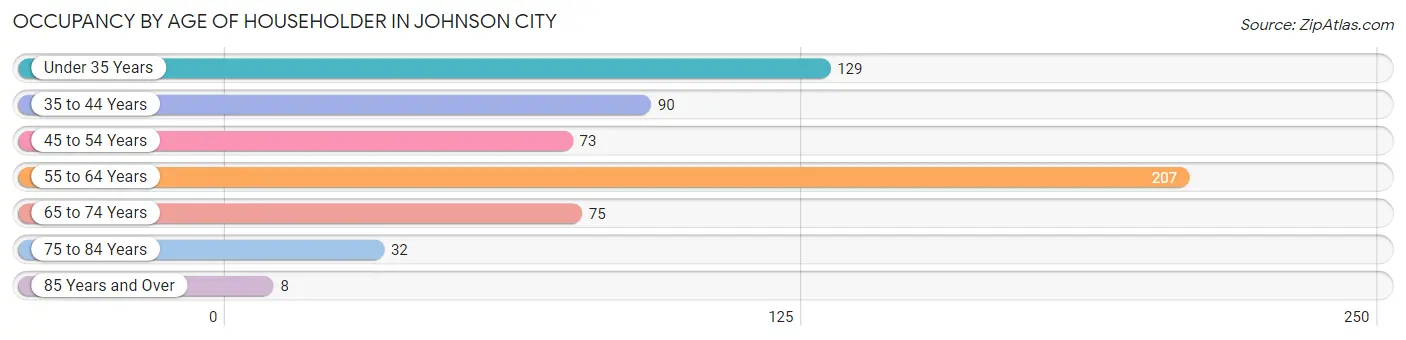
| Age Bracket | # Households | % Households |
| Under 35 Years | 129 | 21.0% |
| 35 to 44 Years | 90 | 14.7% |
| 45 to 54 Years | 73 | 11.9% |
| 55 to 64 Years | 207 | 33.7% |
| 65 to 74 Years | 75 | 12.2% |
| 75 to 84 Years | 32 | 5.2% |
| 85 Years and Over | 8 | 1.3% |
| Total | 614 | 100.0% |
Housing Finances in Johnson City
Median Income by Occupancy in Johnson City
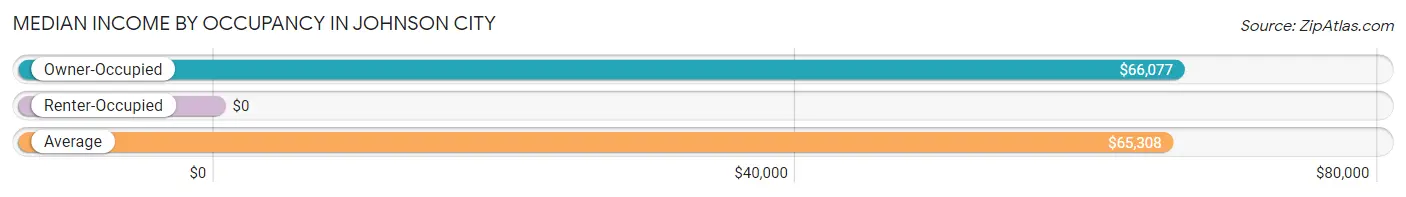
| Occupancy Type | # Households | Median Income |
| Owner-Occupied | 508 (82.7%) | $66,077 |
| Renter-Occupied | 106 (17.3%) | $0 |
| Average | 614 (100.0%) | $65,308 |
Occupancy by Householder Income Bracket in Johnson City
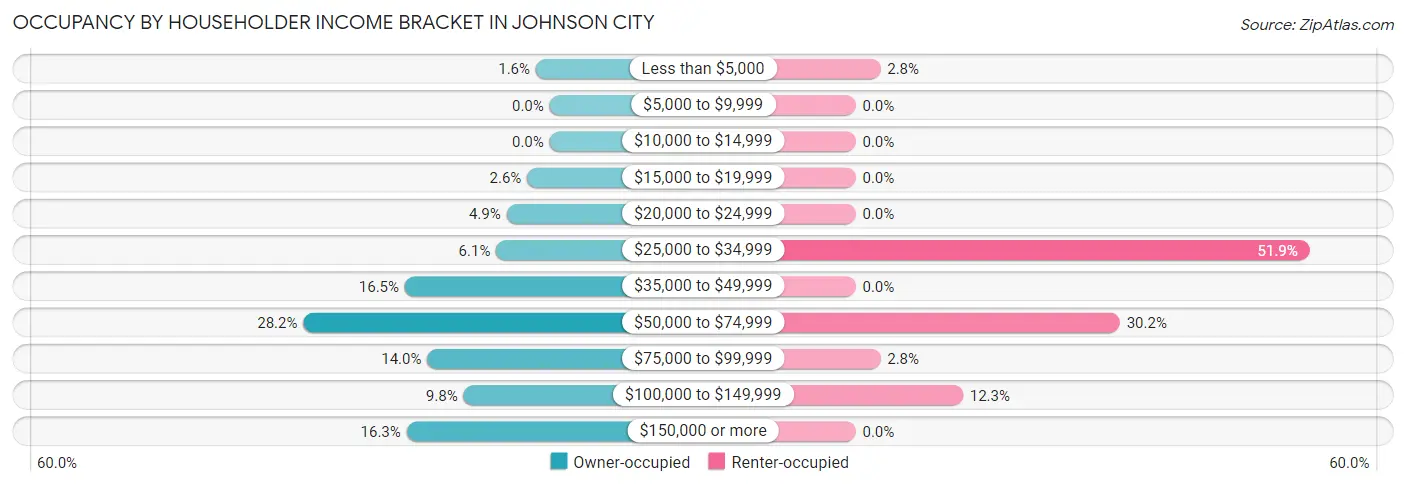
| Income Bracket | Owner-occupied | Renter-occupied |
| Less than $5,000 | 8 (1.6%) | 3 (2.8%) |
| $5,000 to $9,999 | 0 (0.0%) | 0 (0.0%) |
| $10,000 to $14,999 | 0 (0.0%) | 0 (0.0%) |
| $15,000 to $19,999 | 13 (2.6%) | 0 (0.0%) |
| $20,000 to $24,999 | 25 (4.9%) | 0 (0.0%) |
| $25,000 to $34,999 | 31 (6.1%) | 55 (51.9%) |
| $35,000 to $49,999 | 84 (16.5%) | 0 (0.0%) |
| $50,000 to $74,999 | 143 (28.1%) | 32 (30.2%) |
| $75,000 to $99,999 | 71 (14.0%) | 3 (2.8%) |
| $100,000 to $149,999 | 50 (9.8%) | 13 (12.3%) |
| $150,000 or more | 83 (16.3%) | 0 (0.0%) |
| Total | 508 (100.0%) | 106 (100.0%) |
Monthly Housing Cost Tiers in Johnson City
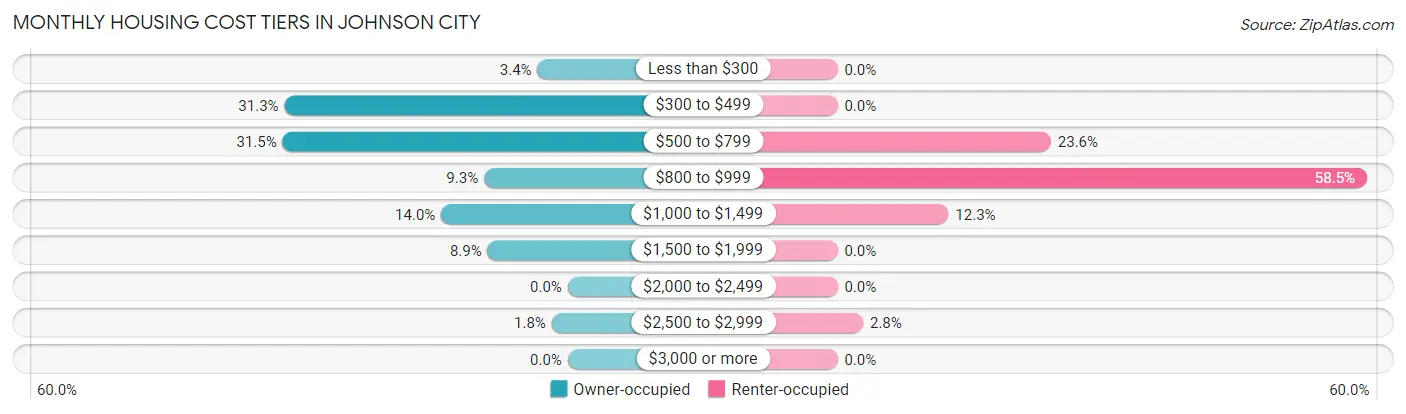
| Monthly Cost | Owner-occupied | Renter-occupied |
| Less than $300 | 17 (3.4%) | 0 (0.0%) |
| $300 to $499 | 159 (31.3%) | 0 (0.0%) |
| $500 to $799 | 160 (31.5%) | 25 (23.6%) |
| $800 to $999 | 47 (9.2%) | 62 (58.5%) |
| $1,000 to $1,499 | 71 (14.0%) | 13 (12.3%) |
| $1,500 to $1,999 | 45 (8.9%) | 0 (0.0%) |
| $2,000 to $2,499 | 0 (0.0%) | 0 (0.0%) |
| $2,500 to $2,999 | 9 (1.8%) | 3 (2.8%) |
| $3,000 or more | 0 (0.0%) | 0 (0.0%) |
| Total | 508 (100.0%) | 106 (100.0%) |
Physical Housing Characteristics in Johnson City
Housing Structures in Johnson City
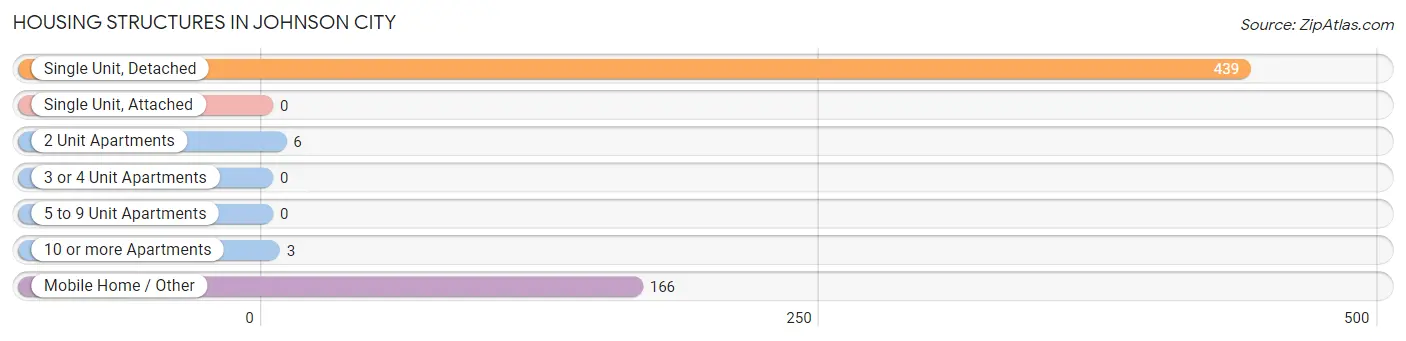
| Structure Type | # Housing Units | % Housing Units |
| Single Unit, Detached | 439 | 71.5% |
| Single Unit, Attached | 0 | 0.0% |
| 2 Unit Apartments | 6 | 1.0% |
| 3 or 4 Unit Apartments | 0 | 0.0% |
| 5 to 9 Unit Apartments | 0 | 0.0% |
| 10 or more Apartments | 3 | 0.5% |
| Mobile Home / Other | 166 | 27.0% |
| Total | 614 | 100.0% |
Housing Structures by Occupancy in Johnson City
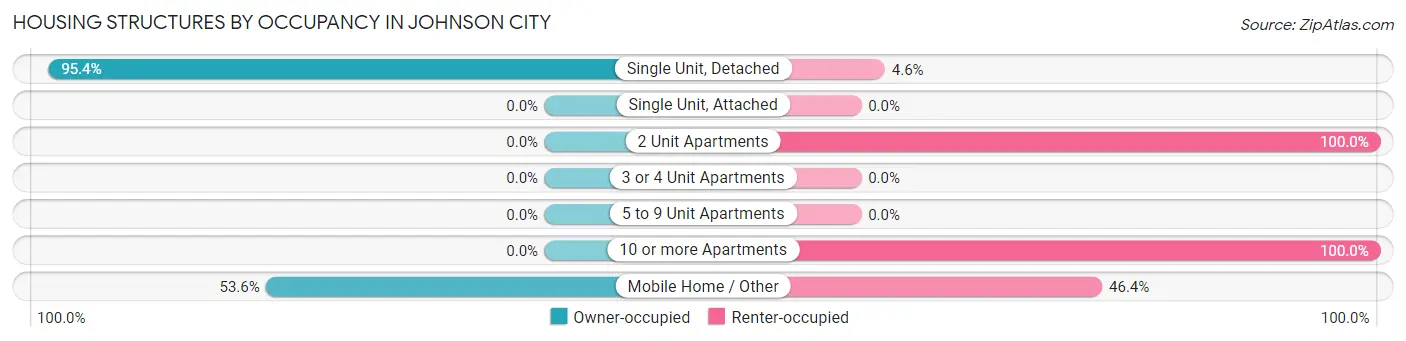
| Structure Type | Owner-occupied | Renter-occupied |
| Single Unit, Detached | 419 (95.4%) | 20 (4.6%) |
| Single Unit, Attached | 0 (0.0%) | 0 (0.0%) |
| 2 Unit Apartments | 0 (0.0%) | 6 (100.0%) |
| 3 or 4 Unit Apartments | 0 (0.0%) | 0 (0.0%) |
| 5 to 9 Unit Apartments | 0 (0.0%) | 0 (0.0%) |
| 10 or more Apartments | 0 (0.0%) | 3 (100.0%) |
| Mobile Home / Other | 89 (53.6%) | 77 (46.4%) |
| Total | 508 (82.7%) | 106 (17.3%) |
Housing Structures by Number of Rooms in Johnson City
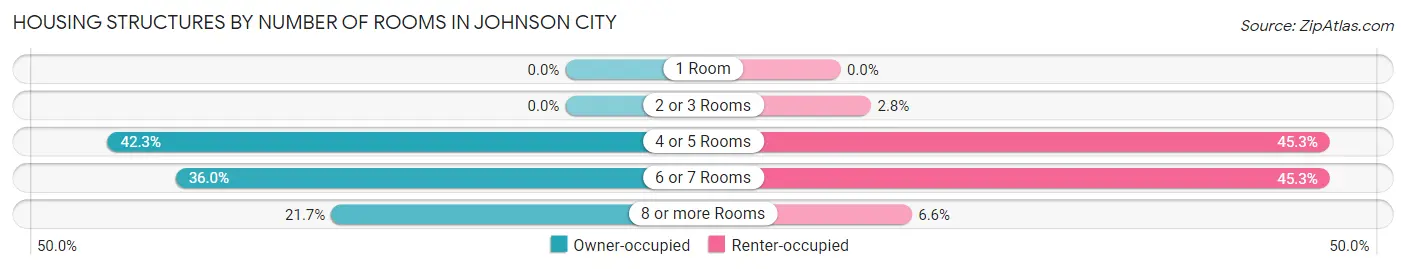
| Number of Rooms | Owner-occupied | Renter-occupied |
| 1 Room | 0 (0.0%) | 0 (0.0%) |
| 2 or 3 Rooms | 0 (0.0%) | 3 (2.8%) |
| 4 or 5 Rooms | 215 (42.3%) | 48 (45.3%) |
| 6 or 7 Rooms | 183 (36.0%) | 48 (45.3%) |
| 8 or more Rooms | 110 (21.6%) | 7 (6.6%) |
| Total | 508 (100.0%) | 106 (100.0%) |
Housing Structure by Heating Type in Johnson City
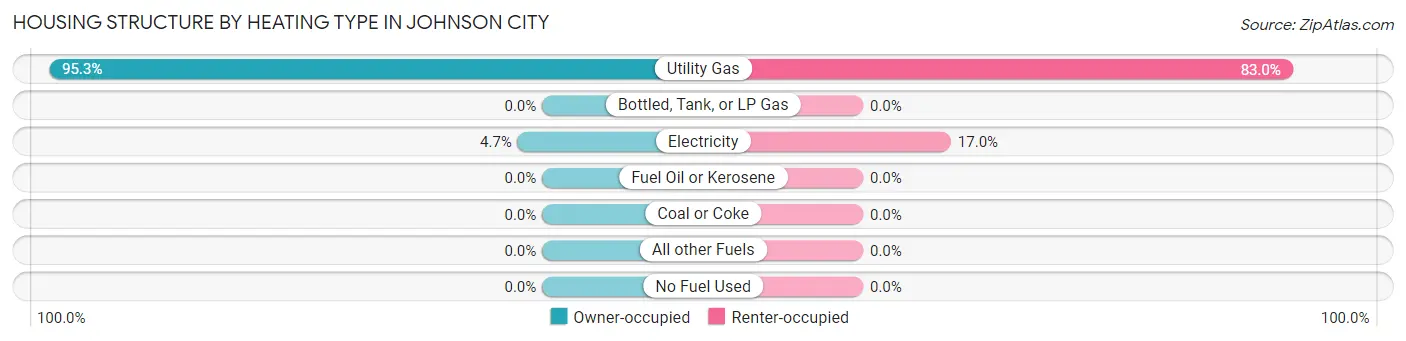
| Heating Type | Owner-occupied | Renter-occupied |
| Utility Gas | 484 (95.3%) | 88 (83.0%) |
| Bottled, Tank, or LP Gas | 0 (0.0%) | 0 (0.0%) |
| Electricity | 24 (4.7%) | 18 (17.0%) |
| Fuel Oil or Kerosene | 0 (0.0%) | 0 (0.0%) |
| Coal or Coke | 0 (0.0%) | 0 (0.0%) |
| All other Fuels | 0 (0.0%) | 0 (0.0%) |
| No Fuel Used | 0 (0.0%) | 0 (0.0%) |
| Total | 508 (100.0%) | 106 (100.0%) |
Household Vehicle Usage in Johnson City
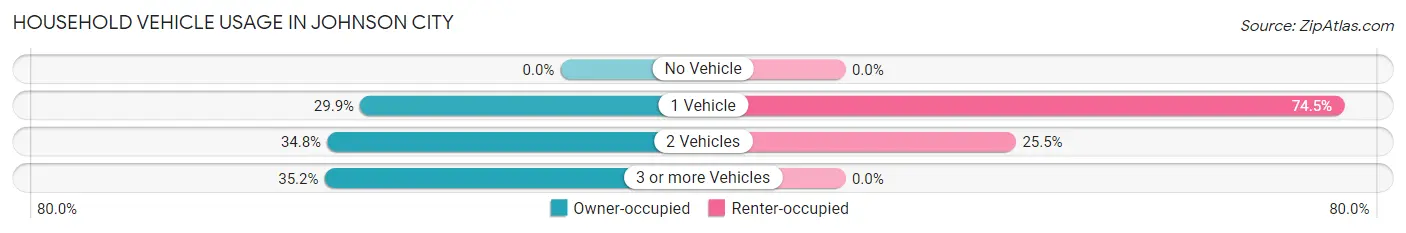
| Vehicles per Household | Owner-occupied | Renter-occupied |
| No Vehicle | 0 (0.0%) | 0 (0.0%) |
| 1 Vehicle | 152 (29.9%) | 79 (74.5%) |
| 2 Vehicles | 177 (34.8%) | 27 (25.5%) |
| 3 or more Vehicles | 179 (35.2%) | 0 (0.0%) |
| Total | 508 (100.0%) | 106 (100.0%) |
Real Estate & Mortgages in Johnson City
Real Estate and Mortgage Overview in Johnson City
| Characteristic | Without Mortgage | With Mortgage |
| Housing Units | 326 | 182 |
| Median Property Value | $60,000 | $81,900 |
| Median Household Income | $53,750 | $24 |
| Monthly Housing Costs | $489 | $0 |
| Real Estate Taxes | $1,479 | $0 |
Property Value by Mortgage Status in Johnson City
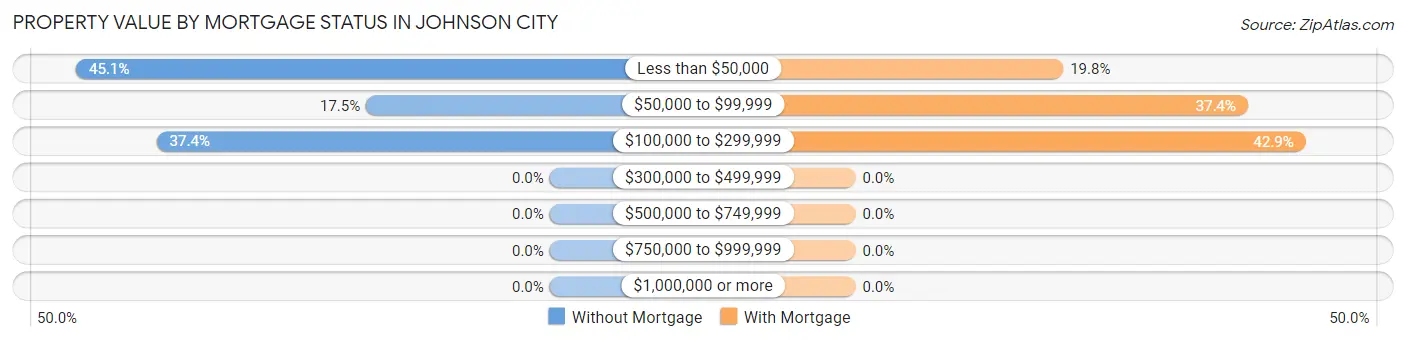
| Property Value | Without Mortgage | With Mortgage |
| Less than $50,000 | 147 (45.1%) | 36 (19.8%) |
| $50,000 to $99,999 | 57 (17.5%) | 68 (37.4%) |
| $100,000 to $299,999 | 122 (37.4%) | 78 (42.9%) |
| $300,000 to $499,999 | 0 (0.0%) | 0 (0.0%) |
| $500,000 to $749,999 | 0 (0.0%) | 0 (0.0%) |
| $750,000 to $999,999 | 0 (0.0%) | 0 (0.0%) |
| $1,000,000 or more | 0 (0.0%) | 0 (0.0%) |
| Total | 326 (100.0%) | 182 (100.0%) |
Household Income by Mortgage Status in Johnson City
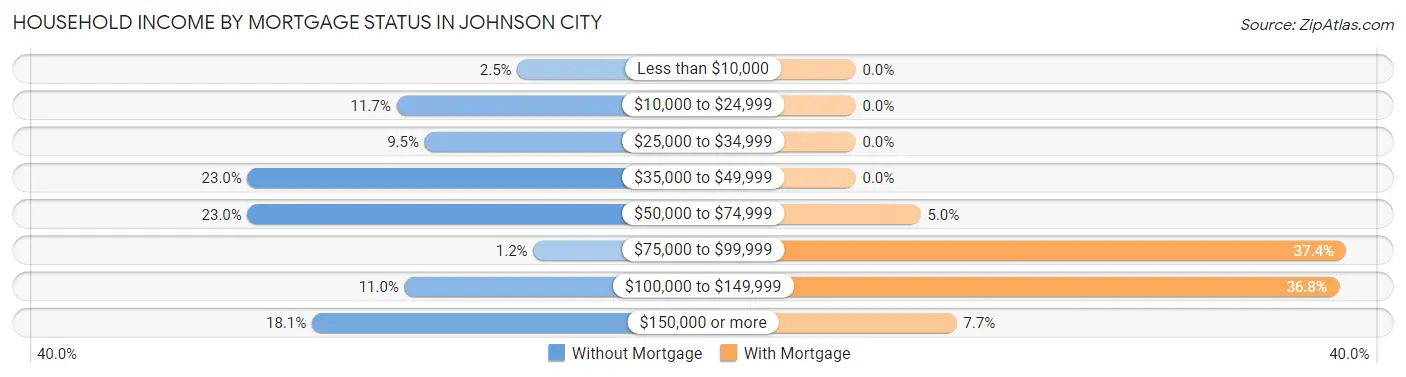
| Household Income | Without Mortgage | With Mortgage |
| Less than $10,000 | 8 (2.5%) | 0 (0.0%) |
| $10,000 to $24,999 | 38 (11.7%) | 0 (0.0%) |
| $25,000 to $34,999 | 31 (9.5%) | 0 (0.0%) |
| $35,000 to $49,999 | 75 (23.0%) | 0 (0.0%) |
| $50,000 to $74,999 | 75 (23.0%) | 9 (5.0%) |
| $75,000 to $99,999 | 4 (1.2%) | 68 (37.4%) |
| $100,000 to $149,999 | 36 (11.0%) | 67 (36.8%) |
| $150,000 or more | 59 (18.1%) | 14 (7.7%) |
| Total | 326 (100.0%) | 182 (100.0%) |
Property Value to Household Income Ratio in Johnson City
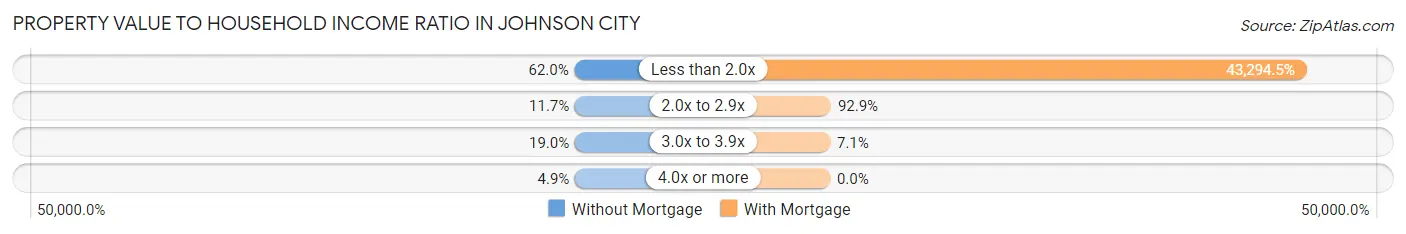
| Value-to-Income Ratio | Without Mortgage | With Mortgage |
| Less than 2.0x | 202 (62.0%) | 78,796 (43,294.5%) |
| 2.0x to 2.9x | 38 (11.7%) | 169 (92.9%) |
| 3.0x to 3.9x | 62 (19.0%) | 13 (7.1%) |
| 4.0x or more | 16 (4.9%) | 0 (0.0%) |
| Total | 326 (100.0%) | 182 (100.0%) |
Real Estate Taxes by Mortgage Status in Johnson City
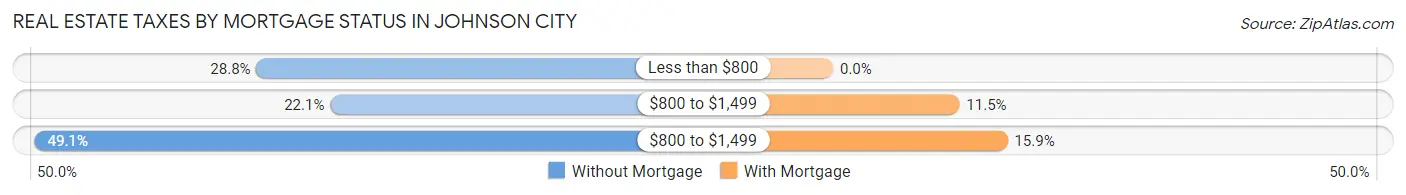
| Property Taxes | Without Mortgage | With Mortgage |
| Less than $800 | 94 (28.8%) | 0 (0.0%) |
| $800 to $1,499 | 72 (22.1%) | 21 (11.5%) |
| $800 to $1,499 | 160 (49.1%) | 29 (15.9%) |
| Total | 326 (100.0%) | 182 (100.0%) |
Health & Disability in Johnson City
Health Insurance Coverage by Age in Johnson City
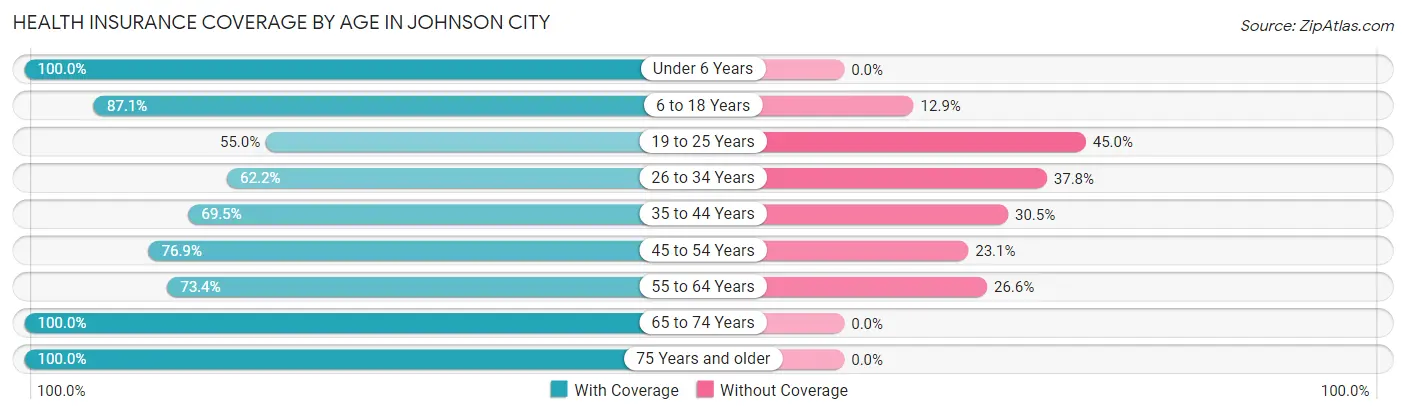
| Age Bracket | With Coverage | Without Coverage |
| Under 6 Years | 87 (100.0%) | 0 (0.0%) |
| 6 to 18 Years | 128 (87.1%) | 19 (12.9%) |
| 19 to 25 Years | 83 (55.0%) | 68 (45.0%) |
| 26 to 34 Years | 112 (62.2%) | 68 (37.8%) |
| 35 to 44 Years | 116 (69.5%) | 51 (30.5%) |
| 45 to 54 Years | 103 (76.9%) | 31 (23.1%) |
| 55 to 64 Years | 215 (73.4%) | 78 (26.6%) |
| 65 to 74 Years | 89 (100.0%) | 0 (0.0%) |
| 75 Years and older | 40 (100.0%) | 0 (0.0%) |
| Total | 973 (75.5%) | 315 (24.5%) |
Health Insurance Coverage by Citizenship Status in Johnson City
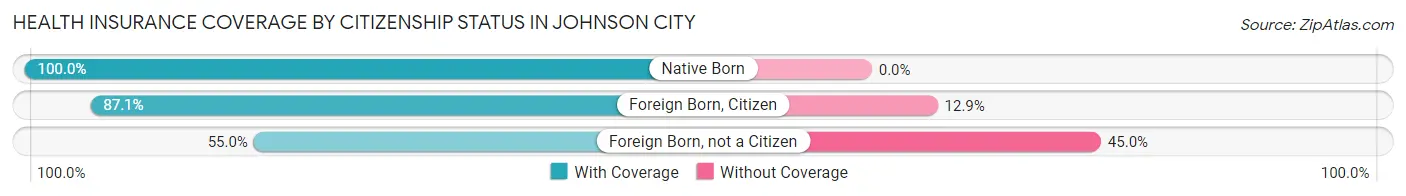
| Citizenship Status | With Coverage | Without Coverage |
| Native Born | 87 (100.0%) | 0 (0.0%) |
| Foreign Born, Citizen | 128 (87.1%) | 19 (12.9%) |
| Foreign Born, not a Citizen | 83 (55.0%) | 68 (45.0%) |
Health Insurance Coverage by Household Income in Johnson City
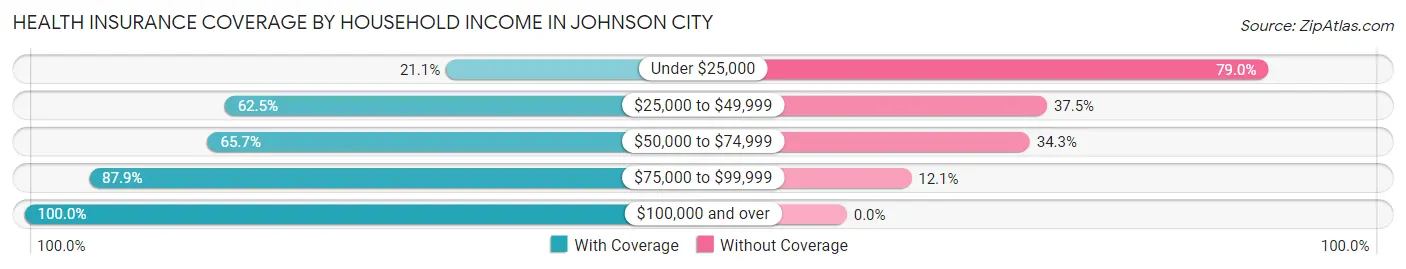
| Household Income | With Coverage | Without Coverage |
| Under $25,000 | 16 (21.0%) | 60 (78.9%) |
| $25,000 to $49,999 | 220 (62.5%) | 132 (37.5%) |
| $50,000 to $74,999 | 186 (65.7%) | 97 (34.3%) |
| $75,000 to $99,999 | 189 (87.9%) | 26 (12.1%) |
| $100,000 and over | 362 (100.0%) | 0 (0.0%) |
Public vs Private Health Insurance Coverage by Age in Johnson City
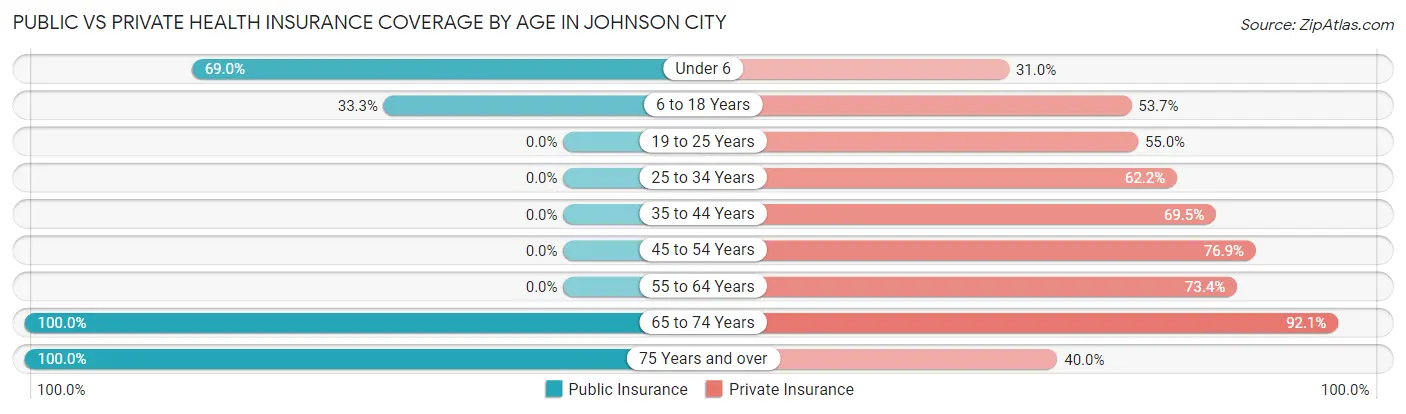
| Age Bracket | Public Insurance | Private Insurance |
| Under 6 | 60 (69.0%) | 27 (31.0%) |
| 6 to 18 Years | 49 (33.3%) | 79 (53.7%) |
| 19 to 25 Years | 0 (0.0%) | 83 (55.0%) |
| 25 to 34 Years | 0 (0.0%) | 112 (62.2%) |
| 35 to 44 Years | 0 (0.0%) | 116 (69.5%) |
| 45 to 54 Years | 0 (0.0%) | 103 (76.9%) |
| 55 to 64 Years | 0 (0.0%) | 215 (73.4%) |
| 65 to 74 Years | 89 (100.0%) | 82 (92.1%) |
| 75 Years and over | 40 (100.0%) | 16 (40.0%) |
| Total | 238 (18.5%) | 833 (64.7%) |
Disability Status by Sex by Age in Johnson City
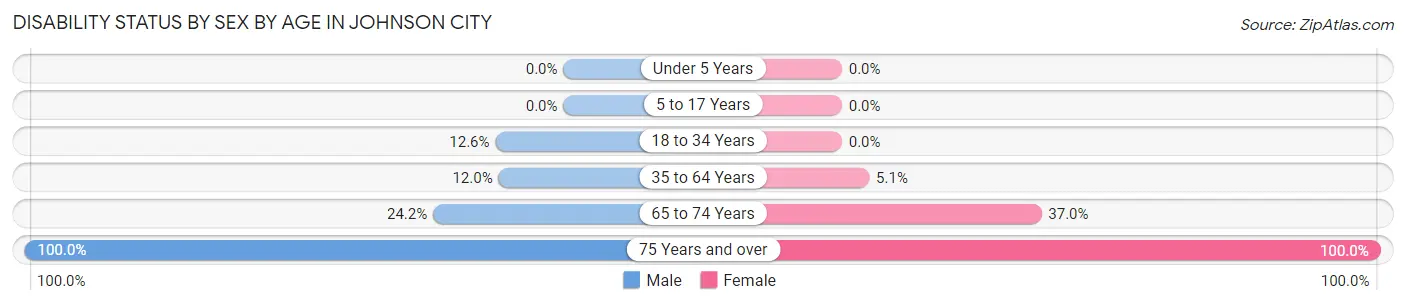
| Age Bracket | Male | Female |
| Under 5 Years | 0 (0.0%) | 0 (0.0%) |
| 5 to 17 Years | 0 (0.0%) | 0 (0.0%) |
| 18 to 34 Years | 26 (12.6%) | 0 (0.0%) |
| 35 to 64 Years | 36 (12.0%) | 15 (5.1%) |
| 65 to 74 Years | 15 (24.2%) | 10 (37.0%) |
| 75 Years and over | 16 (100.0%) | 24 (100.0%) |
Disability Class by Sex by Age in Johnson City
Disability Class: Hearing Difficulty
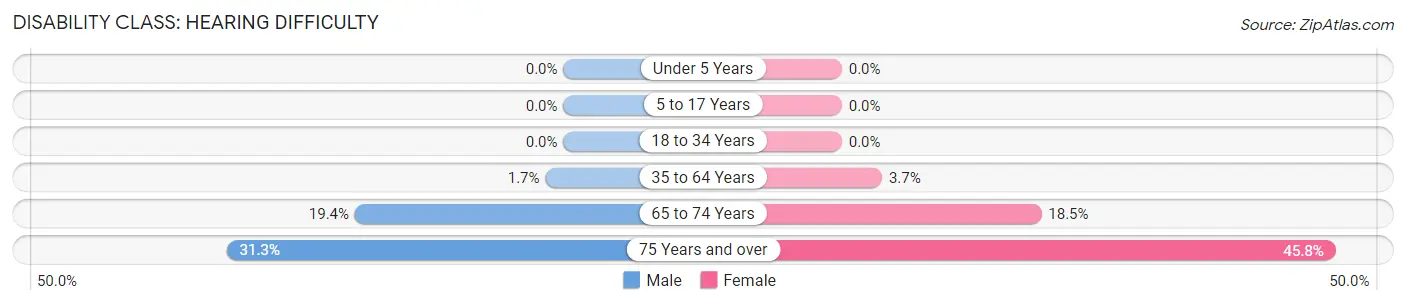
| Age Bracket | Male | Female |
| Under 5 Years | 0 (0.0%) | 0 (0.0%) |
| 5 to 17 Years | 0 (0.0%) | 0 (0.0%) |
| 18 to 34 Years | 0 (0.0%) | 0 (0.0%) |
| 35 to 64 Years | 5 (1.7%) | 11 (3.7%) |
| 65 to 74 Years | 12 (19.4%) | 5 (18.5%) |
| 75 Years and over | 5 (31.2%) | 11 (45.8%) |
Disability Class: Vision Difficulty
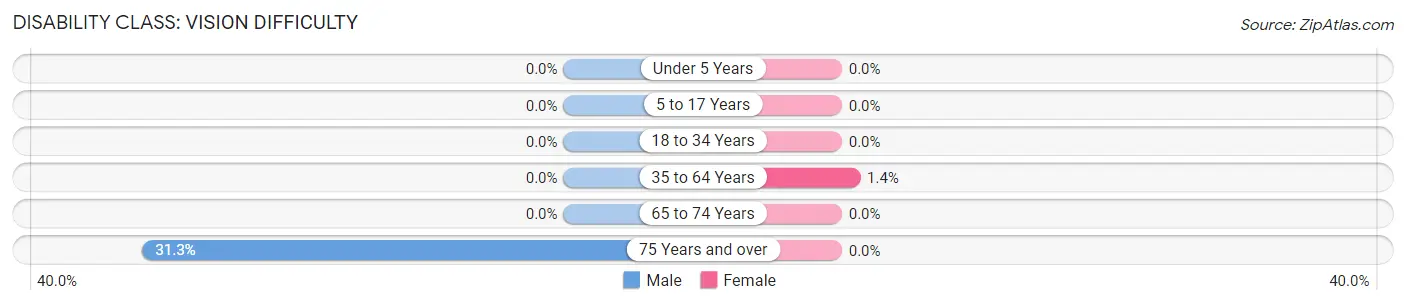
| Age Bracket | Male | Female |
| Under 5 Years | 0 (0.0%) | 0 (0.0%) |
| 5 to 17 Years | 0 (0.0%) | 0 (0.0%) |
| 18 to 34 Years | 0 (0.0%) | 0 (0.0%) |
| 35 to 64 Years | 0 (0.0%) | 4 (1.4%) |
| 65 to 74 Years | 0 (0.0%) | 0 (0.0%) |
| 75 Years and over | 5 (31.2%) | 0 (0.0%) |
Disability Class: Cognitive Difficulty
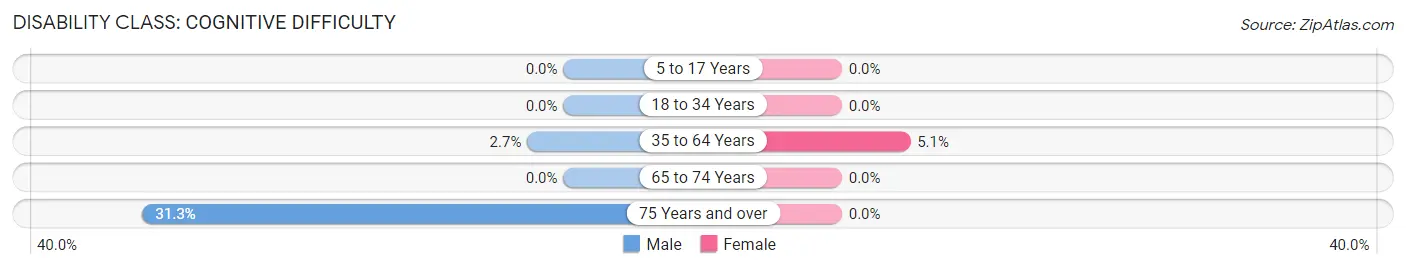
| Age Bracket | Male | Female |
| 5 to 17 Years | 0 (0.0%) | 0 (0.0%) |
| 18 to 34 Years | 0 (0.0%) | 0 (0.0%) |
| 35 to 64 Years | 8 (2.7%) | 15 (5.1%) |
| 65 to 74 Years | 0 (0.0%) | 0 (0.0%) |
| 75 Years and over | 5 (31.2%) | 0 (0.0%) |
Disability Class: Ambulatory Difficulty
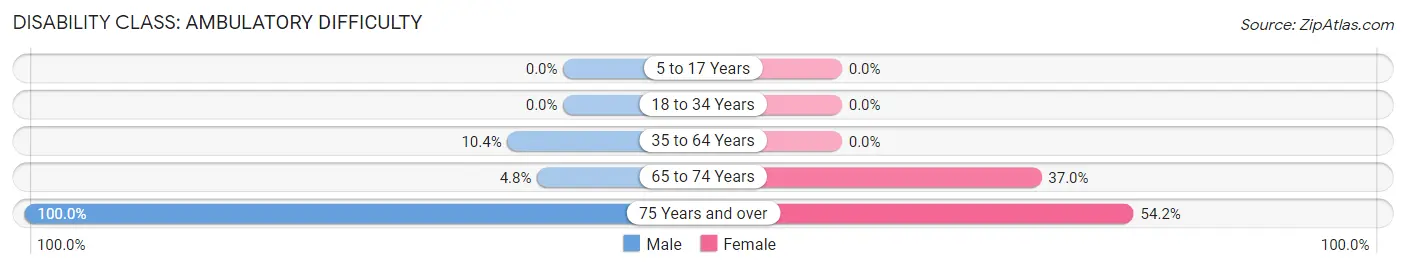
| Age Bracket | Male | Female |
| 5 to 17 Years | 0 (0.0%) | 0 (0.0%) |
| 18 to 34 Years | 0 (0.0%) | 0 (0.0%) |
| 35 to 64 Years | 31 (10.4%) | 0 (0.0%) |
| 65 to 74 Years | 3 (4.8%) | 10 (37.0%) |
| 75 Years and over | 16 (100.0%) | 13 (54.2%) |
Disability Class: Self-Care Difficulty
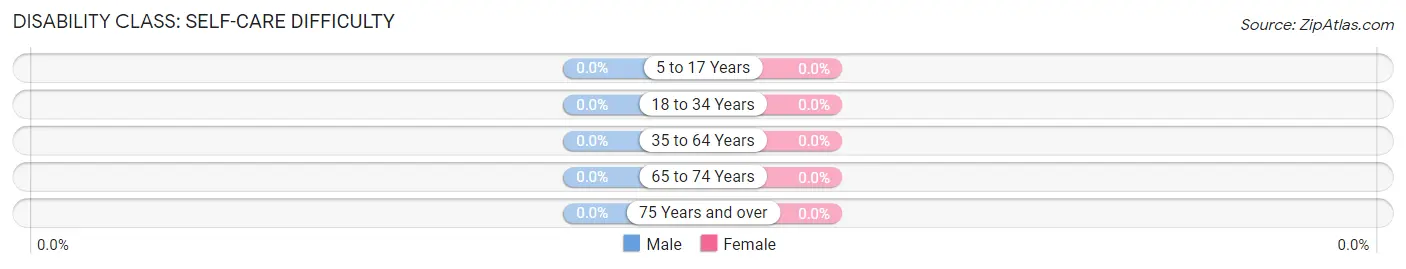
| Age Bracket | Male | Female |
| 5 to 17 Years | 0 (0.0%) | 0 (0.0%) |
| 18 to 34 Years | 0 (0.0%) | 0 (0.0%) |
| 35 to 64 Years | 0 (0.0%) | 0 (0.0%) |
| 65 to 74 Years | 0 (0.0%) | 0 (0.0%) |
| 75 Years and over | 0 (0.0%) | 0 (0.0%) |
Technology Access in Johnson City
Computing Device Access in Johnson City

| Device Type | # Households | % Households |
| Desktop or Laptop | 424 | 69.1% |
| Smartphone | 540 | 87.9% |
| Tablet | 330 | 53.7% |
| No Computing Device | 71 | 11.6% |
| Total | 614 | 100.0% |
Internet Access in Johnson City
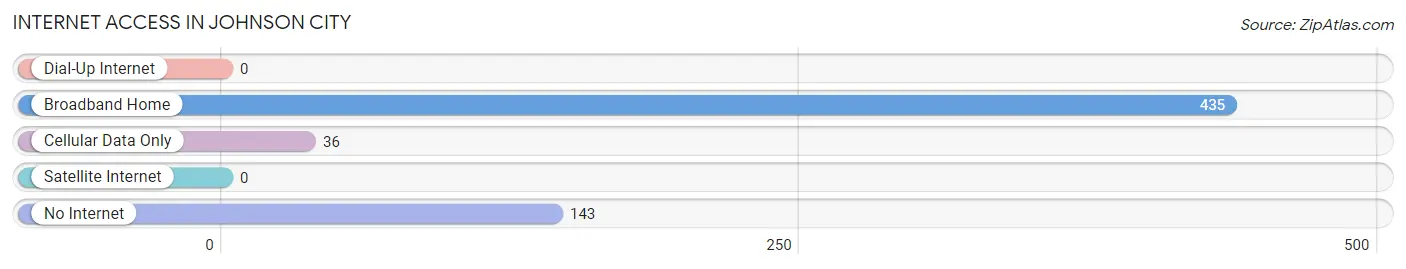
| Internet Type | # Households | % Households |
| Dial-Up Internet | 0 | 0.0% |
| Broadband Home | 435 | 70.9% |
| Cellular Data Only | 36 | 5.9% |
| Satellite Internet | 0 | 0.0% |
| No Internet | 143 | 23.3% |
| Total | 614 | 100.0% |
Johnson City Summary
Johnson City is a small city located in the state of Kansas. It is located in the southwestern part of the state, in Finney County. The city is situated on the Arkansas River, and is part of the Garden City metropolitan area. As of the 2010 census, the population of Johnson City was 1,845.
History
Johnson City was founded in 1885 by William Johnson, a rancher and farmer from Missouri. He named the city after himself, and it was incorporated in 1887. The city was originally a farming community, and the main crops grown were wheat, corn, and sorghum. In the early 1900s, the city began to grow and develop, and by the 1920s, it had become a major center for the oil industry. The city was also home to several large grain elevators, and the railroad was a major factor in the city's growth.
In the 1950s, Johnson City began to experience a decline in population, as many of the oil and grain businesses moved away. However, the city was able to remain stable, and in the 1970s, it began to experience a resurgence in population. This was due in part to the city's proximity to Garden City, which had become a major center for agricultural and industrial development.
Geography
Johnson City is located in southwestern Kansas, in Finney County. It is situated on the Arkansas River, and is part of the Garden City metropolitan area. The city has a total area of 1.2 square miles, all of which is land. The city is located at an elevation of 2,845 feet above sea level.
The climate in Johnson City is semi-arid, with hot summers and cold winters. The average temperature in the summer is around 90 degrees Fahrenheit, and the average temperature in the winter is around 30 degrees Fahrenheit. The city receives an average of 16 inches of precipitation per year.
Economy
The economy of Johnson City is largely based on agriculture and oil production. The city is home to several large grain elevators, and the railroad is a major factor in the city's economy. The city is also home to several oil and gas companies, and the oil industry is a major employer in the area.
In addition to agriculture and oil production, Johnson City is also home to several manufacturing companies. The city is home to several food processing plants, as well as a number of other manufacturing companies. The city is also home to several retail stores, and the city's downtown area is home to several restaurants and shops.
Demographics
As of the 2010 census, the population of Johnson City was 1,845. The racial makeup of the city was 79.3% White, 0.2% African American, 0.7% Native American, 0.2% Asian, 0.1% Pacific Islander, 17.2% from other races, and 2.5% from two or more races. Hispanic or Latino of any race were 25.2% of the population.
The median income for a household in Johnson City was $31,250, and the median income for a family was $37,500. The per capita income for the city was $15,945. About 17.2% of families and 20.3% of the population were below the poverty line, including 28.3% of those under age 18 and 10.2% of those age 65 or over.
Common Questions
What is the Total Population of Johnson City?
Total Population of Johnson City is 1,318.
What is the Total Male Population of Johnson City?
Total Male Population of Johnson City is 722.
What is the Total Female Population of Johnson City?
Total Female Population of Johnson City is 596.
What is the Ratio of Males per 100 Females in Johnson City?
There are 121.14 Males per 100 Females in Johnson City.
What is the Ratio of Females per 100 Males in Johnson City?
There are 82.55 Females per 100 Males in Johnson City.
What is the Median Population Age in Johnson City?
Median Population Age in Johnson City is 41.9 Years.
What is the Average Family Size in Johnson City
Average Family Size in Johnson City is 2.6 People.
What is the Average Household Size in Johnson City
Average Household Size in Johnson City is 2.1 People.
What is Per Capita Income in Johnson City?
Per Capita income in Johnson City is $43,623.
What is the Median Family Income in Johnson City?
Median Family Income in Johnson City is $67,031.
What is the Median Household income in Johnson City?
Median Household Income in Johnson City is $65,308.
What is Income or Wage Gap in Johnson City?
Income or Wage Gap in Johnson City is 4.8%.
Women in Johnson City earn 95.2 cents for every dollar earned by a man.
What is Inequality or Gini Index in Johnson City?
Inequality or Gini Index in Johnson City is 0.45.
How Large is the Labor Force in Johnson City?
There are 766 People in the Labor Forcein in Johnson City.
What is the Percentage of People in the Labor Force in Johnson City?
68.0% of People are in the Labor Force in Johnson City.
What is the Unemployment Rate in Johnson City?
Unemployment Rate in Johnson City is 3.4%.