George, IA
George Map
George Overview
1,149
TOTAL POPULATION
560
MALE POPULATION
589
FEMALE POPULATION
95.08
MALES / 100 FEMALES
105.18
FEMALES / 100 MALES
46.5
MEDIAN AGE
2.8
AVG FAMILY SIZE
2.2
AVG HOUSEHOLD SIZE
$28,231
PER CAPITA INCOME
$80,417
AVG FAMILY INCOME
$61,302
AVG HOUSEHOLD INCOME
26.9%
WAGE / INCOME GAP [ % ]
73.1¢/ $1
WAGE / INCOME GAP [ $ ]
0.39
INEQUALITY / GINI INDEX
541
LABOR FORCE [ PEOPLE ]
58.2%
PERCENT IN LABOR FORCE
4.6%
UNEMPLOYMENT RATE
George Zip Codes
George Area Codes
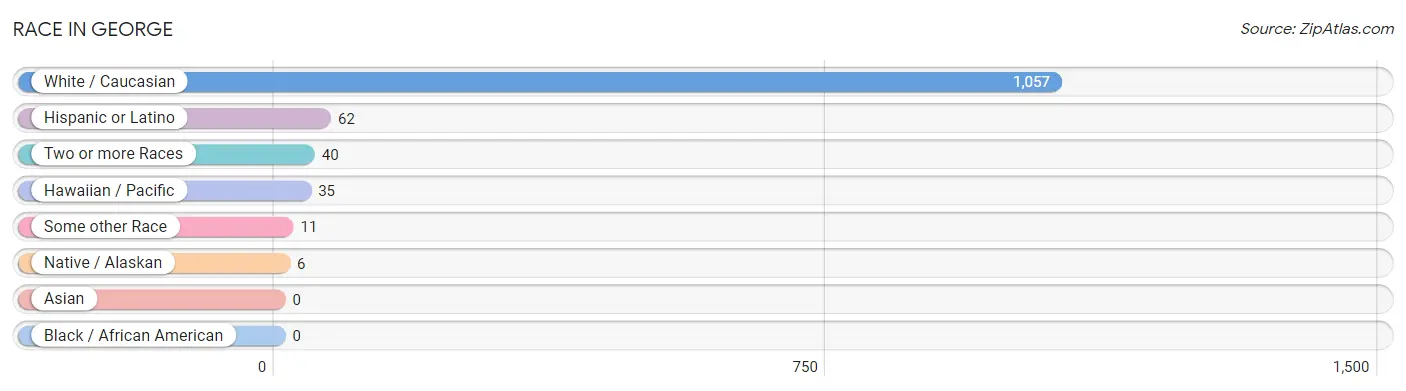
Race in George
The most populous races in George are White / Caucasian (1,057 | 92.0%), Hispanic or Latino (62 | 5.4%), and Two or more Races (40 | 3.5%).
| Race | # Population | % Population |
| Asian | 0 | 0.0% |
| Black / African American | 0 | 0.0% |
| Hawaiian / Pacific | 35 | 3.0% |
| Hispanic or Latino | 62 | 5.4% |
| Native / Alaskan | 6 | 0.5% |
| White / Caucasian | 1,057 | 92.0% |
| Two or more Races | 40 | 3.5% |
| Some other Race | 11 | 1.0% |
| Total | 1,149 | 100.0% |
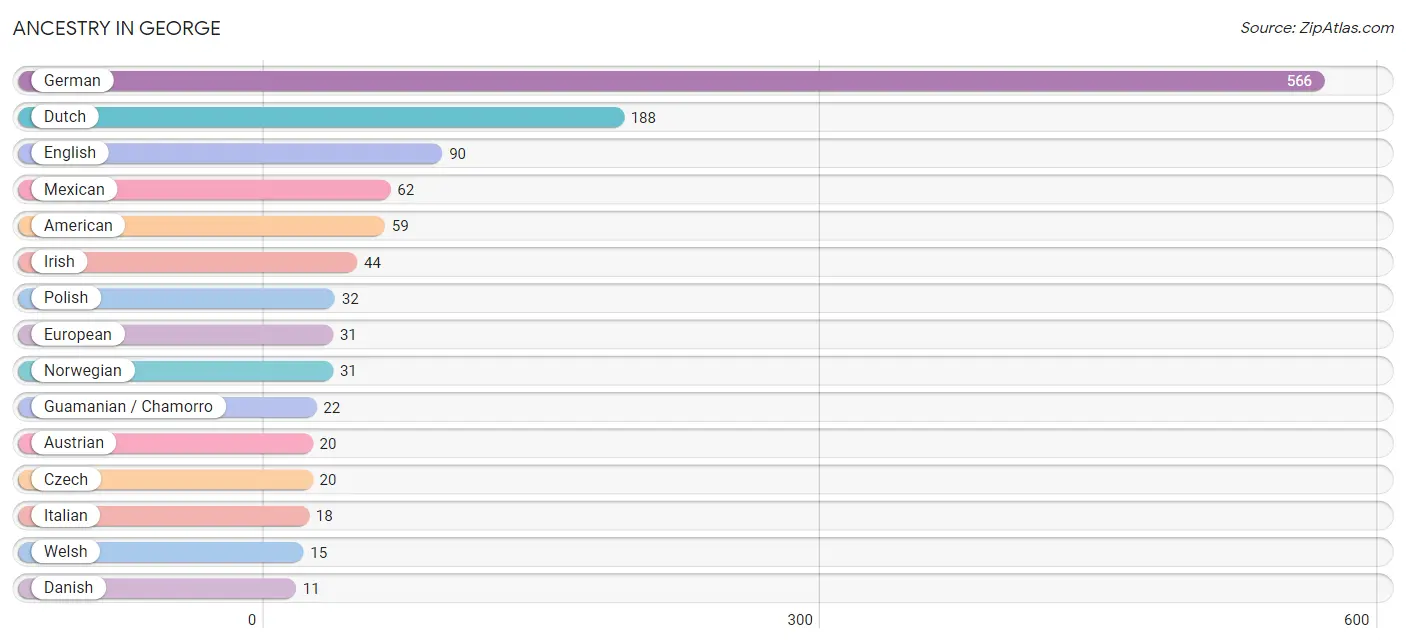
Ancestry in George
The most populous ancestries reported in George are German (566 | 49.3%), Dutch (188 | 16.4%), English (90 | 7.8%), Mexican (62 | 5.4%), and American (59 | 5.1%), together accounting for 84.0% of all George residents.
| Ancestry | # Population | % Population |
| American | 59 | 5.1% |
| Austrian | 20 | 1.7% |
| Brazilian | 4 | 0.4% |
| Chippewa | 6 | 0.5% |
| Czech | 20 | 1.7% |
| Danish | 11 | 1.0% |
| Dutch | 188 | 16.4% |
| English | 90 | 7.8% |
| European | 31 | 2.7% |
| French | 11 | 1.0% |
| German | 566 | 49.3% |
| Guamanian / Chamorro | 22 | 1.9% |
| Hungarian | 3 | 0.3% |
| Irish | 44 | 3.8% |
| Italian | 18 | 1.6% |
| Mexican | 62 | 5.4% |
| Norwegian | 31 | 2.7% |
| Polish | 32 | 2.8% |
| Welsh | 15 | 1.3% | View All 19 Rows |
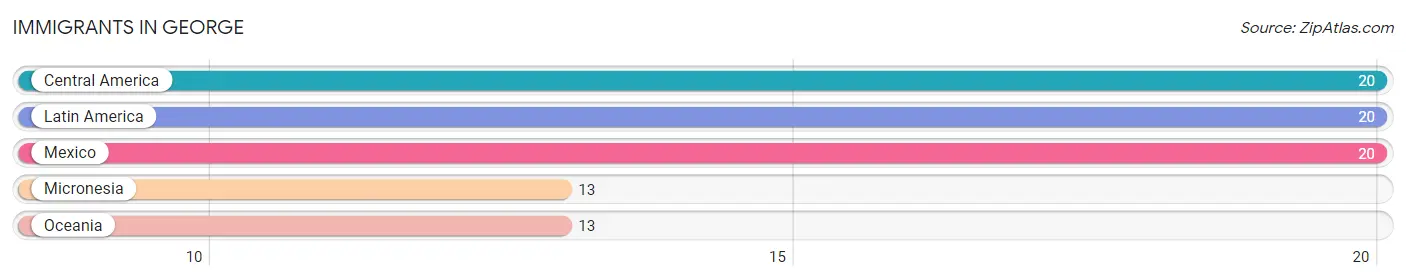
Immigrants in George
The most numerous immigrant groups reported in George came from Central America (20 | 1.7%), Latin America (20 | 1.7%), Mexico (20 | 1.7%), Micronesia (13 | 1.1%), and Oceania (13 | 1.1%), together accounting for 7.5% of all George residents.
| Immigration Origin | # Population | % Population |
| Central America | 20 | 1.7% |
| Latin America | 20 | 1.7% |
| Mexico | 20 | 1.7% |
| Micronesia | 13 | 1.1% |
| Oceania | 13 | 1.1% | View All 5 Rows |
Sex and Age in George
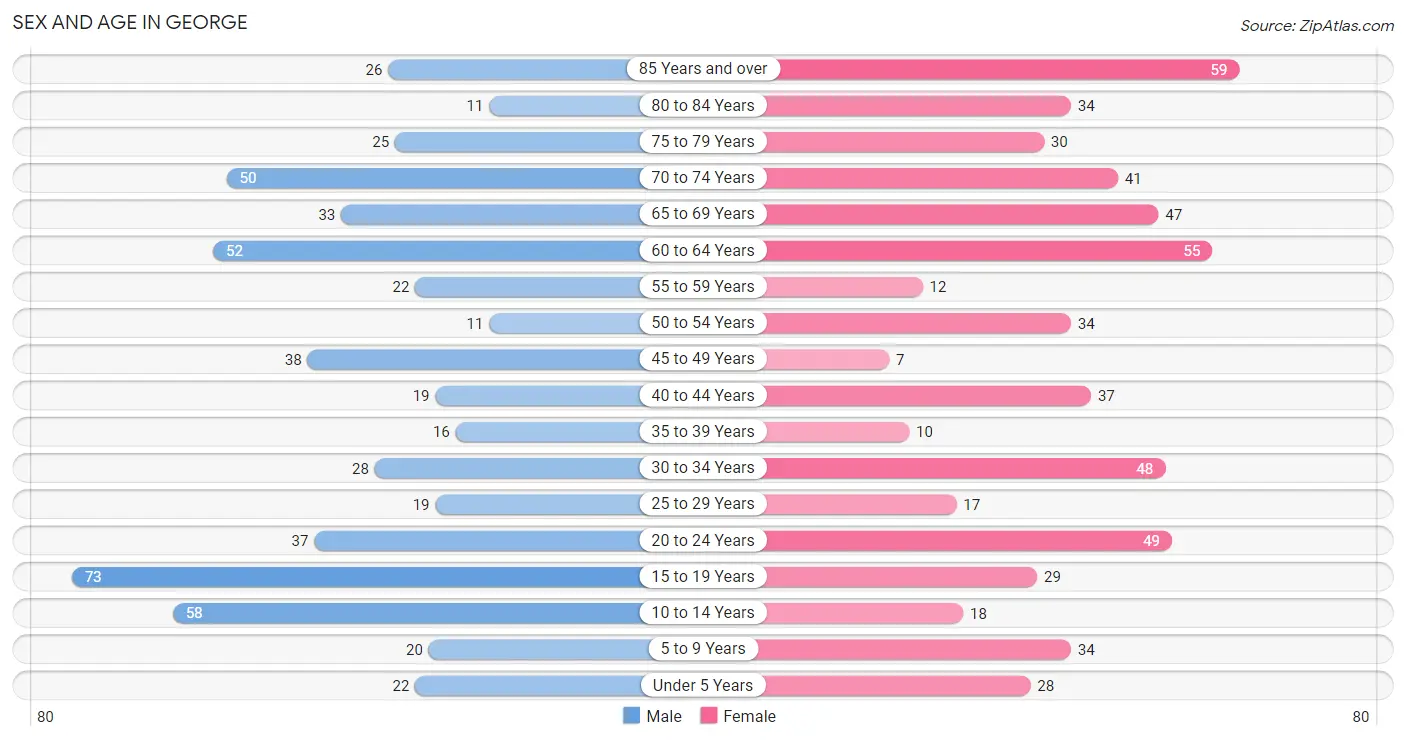
Sex and Age in George
The most populous age groups in George are 15 to 19 Years (73 | 13.0%) for men and 85 Years and over (59 | 10.0%) for women.
| Age Bracket | Male | Female |
| Under 5 Years | 22 (3.9%) | 28 (4.8%) |
| 5 to 9 Years | 20 (3.6%) | 34 (5.8%) |
| 10 to 14 Years | 58 (10.4%) | 18 (3.1%) |
| 15 to 19 Years | 73 (13.0%) | 29 (4.9%) |
| 20 to 24 Years | 37 (6.6%) | 49 (8.3%) |
| 25 to 29 Years | 19 (3.4%) | 17 (2.9%) |
| 30 to 34 Years | 28 (5.0%) | 48 (8.2%) |
| 35 to 39 Years | 16 (2.9%) | 10 (1.7%) |
| 40 to 44 Years | 19 (3.4%) | 37 (6.3%) |
| 45 to 49 Years | 38 (6.8%) | 7 (1.2%) |
| 50 to 54 Years | 11 (2.0%) | 34 (5.8%) |
| 55 to 59 Years | 22 (3.9%) | 12 (2.0%) |
| 60 to 64 Years | 52 (9.3%) | 55 (9.3%) |
| 65 to 69 Years | 33 (5.9%) | 47 (8.0%) |
| 70 to 74 Years | 50 (8.9%) | 41 (7.0%) |
| 75 to 79 Years | 25 (4.5%) | 30 (5.1%) |
| 80 to 84 Years | 11 (2.0%) | 34 (5.8%) |
| 85 Years and over | 26 (4.6%) | 59 (10.0%) |
| Total | 560 (100.0%) | 589 (100.0%) |
Families and Households in George
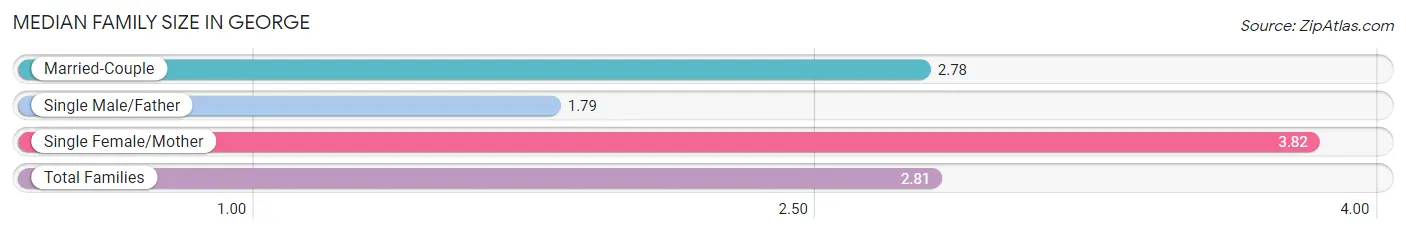
Median Family Size in George
The median family size in George is 2.81 persons per family, with single female/mother families (28 | 8.7%) accounting for the largest median family size of 3.82 persons per family. On the other hand, single male/father families (19 | 5.9%) represent the smallest median family size with 1.79 persons per family.
| Family Type | # Families | Family Size |
| Married-Couple | 274 (85.4%) | 2.78 |
| Single Male/Father | 19 (5.9%) | 1.79 |
| Single Female/Mother | 28 (8.7%) | 3.82 |
| Total Families | 321 (100.0%) | 2.81 |
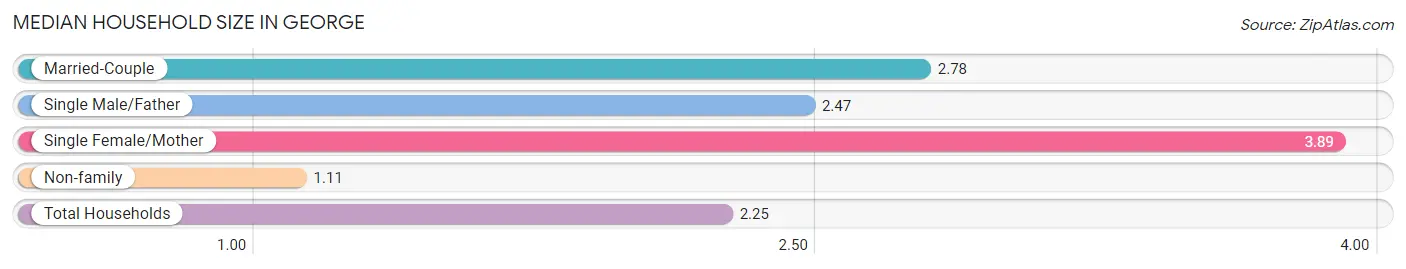
Median Household Size in George
The median household size in George is 2.25 persons per household, with single female/mother households (28 | 5.7%) accounting for the largest median household size of 3.89 persons per household. non-family households (174 | 35.1%) represent the smallest median household size with 1.11 persons per household.
| Household Type | # Households | Household Size |
| Married-Couple | 274 (55.3%) | 2.78 |
| Single Male/Father | 19 (3.8%) | 2.47 |
| Single Female/Mother | 28 (5.7%) | 3.89 |
| Non-family | 174 (35.1%) | 1.11 |
| Total Households | 495 (100.0%) | 2.25 |
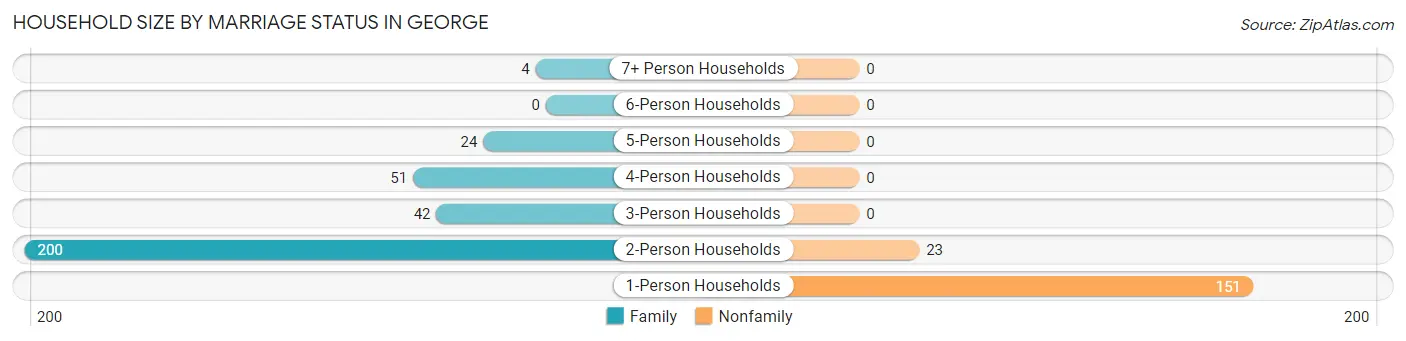
Household Size by Marriage Status in George
Out of a total of 495 households in George, 321 (64.8%) are family households, while 174 (35.1%) are nonfamily households. The most numerous type of family households are 2-person households, comprising 200, and the most common type of nonfamily households are 1-person households, comprising 151.
| Household Size | Family Households | Nonfamily Households |
| 1-Person Households | - | 151 (30.5%) |
| 2-Person Households | 200 (40.4%) | 23 (4.6%) |
| 3-Person Households | 42 (8.5%) | 0 (0.0%) |
| 4-Person Households | 51 (10.3%) | 0 (0.0%) |
| 5-Person Households | 24 (4.9%) | 0 (0.0%) |
| 6-Person Households | 0 (0.0%) | 0 (0.0%) |
| 7+ Person Households | 4 (0.8%) | 0 (0.0%) |
| Total | 321 (64.8%) | 174 (35.1%) |
Female Fertility in George
Fertility by Age in George
Average fertility rate in George is 126.0 births per 1,000 women. Women in the age bracket of 20 to 34 years have the highest fertility rate with 219.0 births per 1,000 women. Women in the age bracket of 20 to 34 years acount for 100.0% of all women with births.
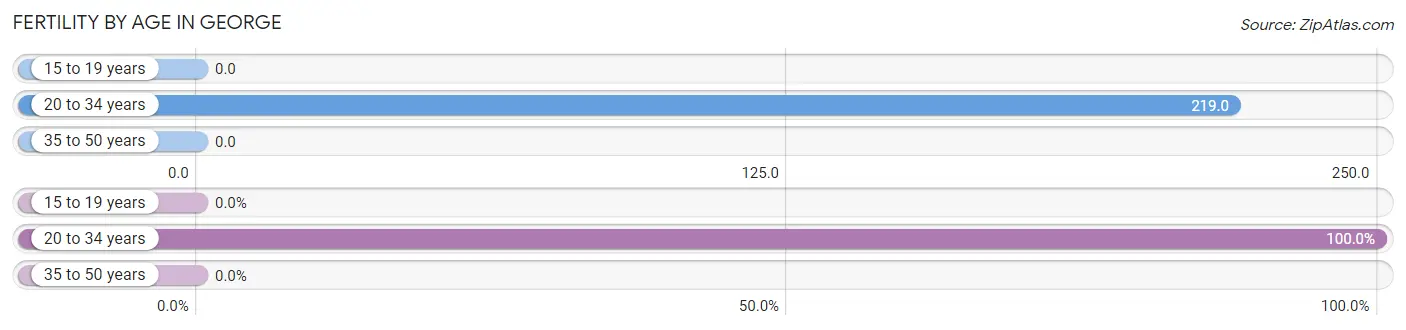
| Age Bracket | Women with Births | Births / 1,000 Women |
| 15 to 19 years | 0 (0.0%) | 0.0 |
| 20 to 34 years | 25 (100.0%) | 219.0 |
| 35 to 50 years | 0 (0.0%) | 0.0 |
| Total | 25 (100.0%) | 126.0 |
Fertility by Age by Marriage Status in George
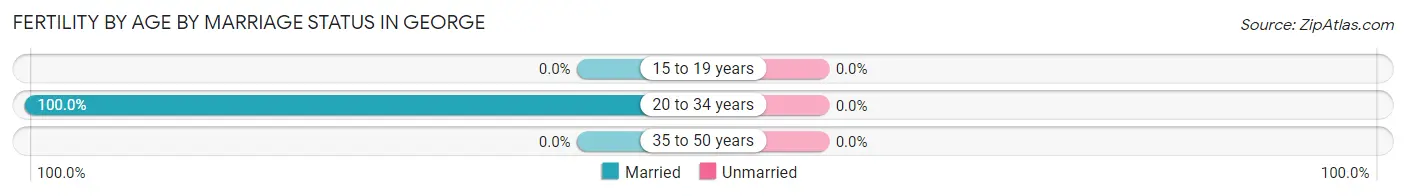
| Age Bracket | Married | Unmarried |
| 15 to 19 years | 0 (0.0%) | 0 (0.0%) |
| 20 to 34 years | 25 (100.0%) | 0 (0.0%) |
| 35 to 50 years | 0 (0.0%) | 0 (0.0%) |
| Total | 25 (100.0%) | 0 (0.0%) |
Fertility by Education in George
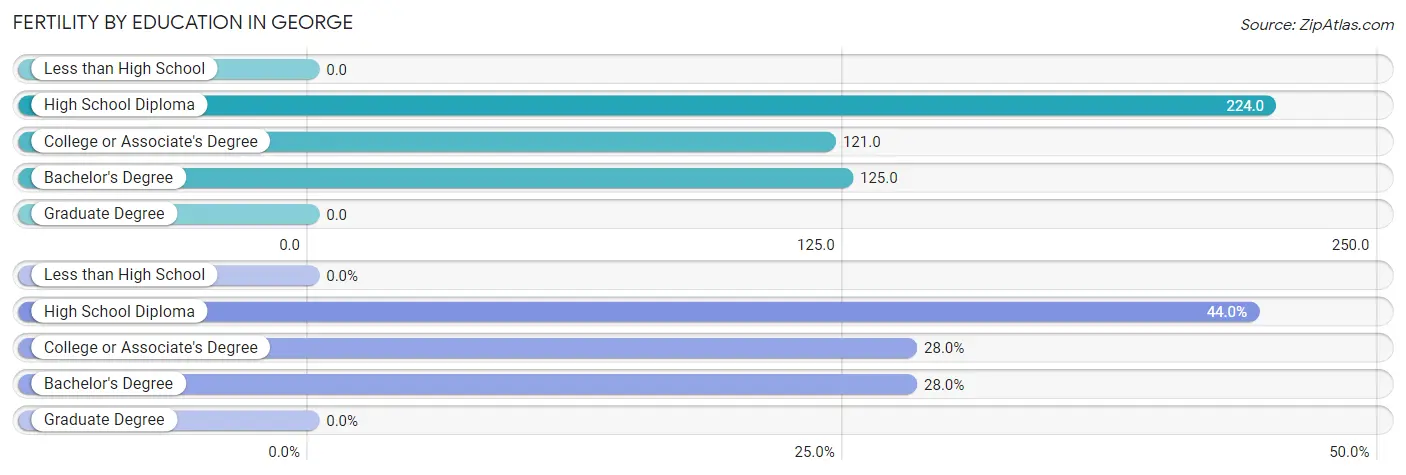
| Educational Attainment | Women with Births | Births / 1,000 Women |
| Less than High School | 0 (0.0%) | 0.0 |
| High School Diploma | 11 (44.0%) | 224.0 |
| College or Associate's Degree | 7 (28.0%) | 121.0 |
| Bachelor's Degree | 7 (28.0%) | 125.0 |
| Graduate Degree | 0 (0.0%) | 0.0 |
| Total | 25 (100.0%) | 126.0 |
Fertility by Education by Marriage Status in George
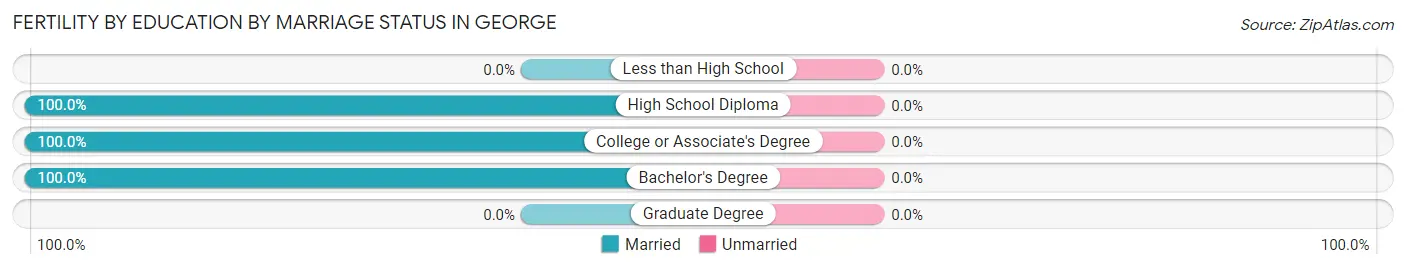
| Educational Attainment | Married | Unmarried |
| Less than High School | 0 (0.0%) | 0 (0.0%) |
| High School Diploma | 11 (100.0%) | 0 (0.0%) |
| College or Associate's Degree | 7 (100.0%) | 0 (0.0%) |
| Bachelor's Degree | 7 (100.0%) | 0 (0.0%) |
| Graduate Degree | 0 (0.0%) | 0 (0.0%) |
| Total | 25 (100.0%) | 0 (0.0%) |
Income in George
Income Overview in George
Per Capita Income in George is $28,231, while median incomes of families and households are $80,417 and $61,302 respectively.
| Characteristic | Number | Measure |
| Per Capita Income | 1,149 | $28,231 |
| Median Family Income | 321 | $80,417 |
| Mean Family Income | 321 | $80,097 |
| Median Household Income | 495 | $61,302 |
| Mean Household Income | 495 | $63,393 |
| Income Deficit | 321 | $0 |
| Wage / Income Gap (%) | 1,149 | 26.91% |
| Wage / Income Gap ($) | 1,149 | 73.09¢ per $1 |
| Gini / Inequality Index | 1,149 | 0.39 |
Earnings by Sex in George
Average Earnings in George are $39,375, $46,176 for men and $33,750 for women, a difference of 26.9%.
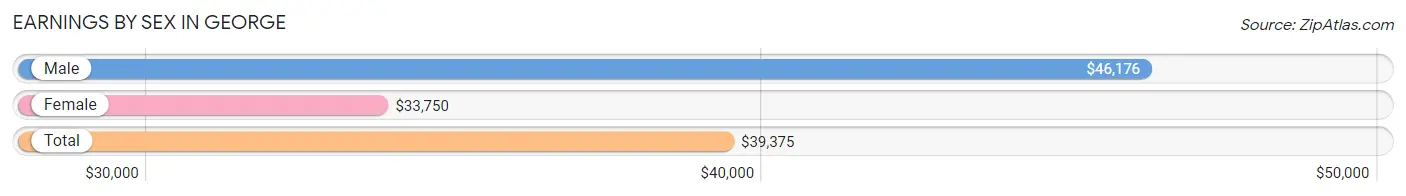
| Sex | Number | Average Earnings |
| Male | 280 (49.0%) | $46,176 |
| Female | 291 (51.0%) | $33,750 |
| Total | 571 (100.0%) | $39,375 |
Earnings by Sex by Income Bracket in George
The most common earnings brackets in George are $75,000 to $99,999 for men (53 | 18.9%) and $40,000 to $44,999 for women (51 | 17.5%).
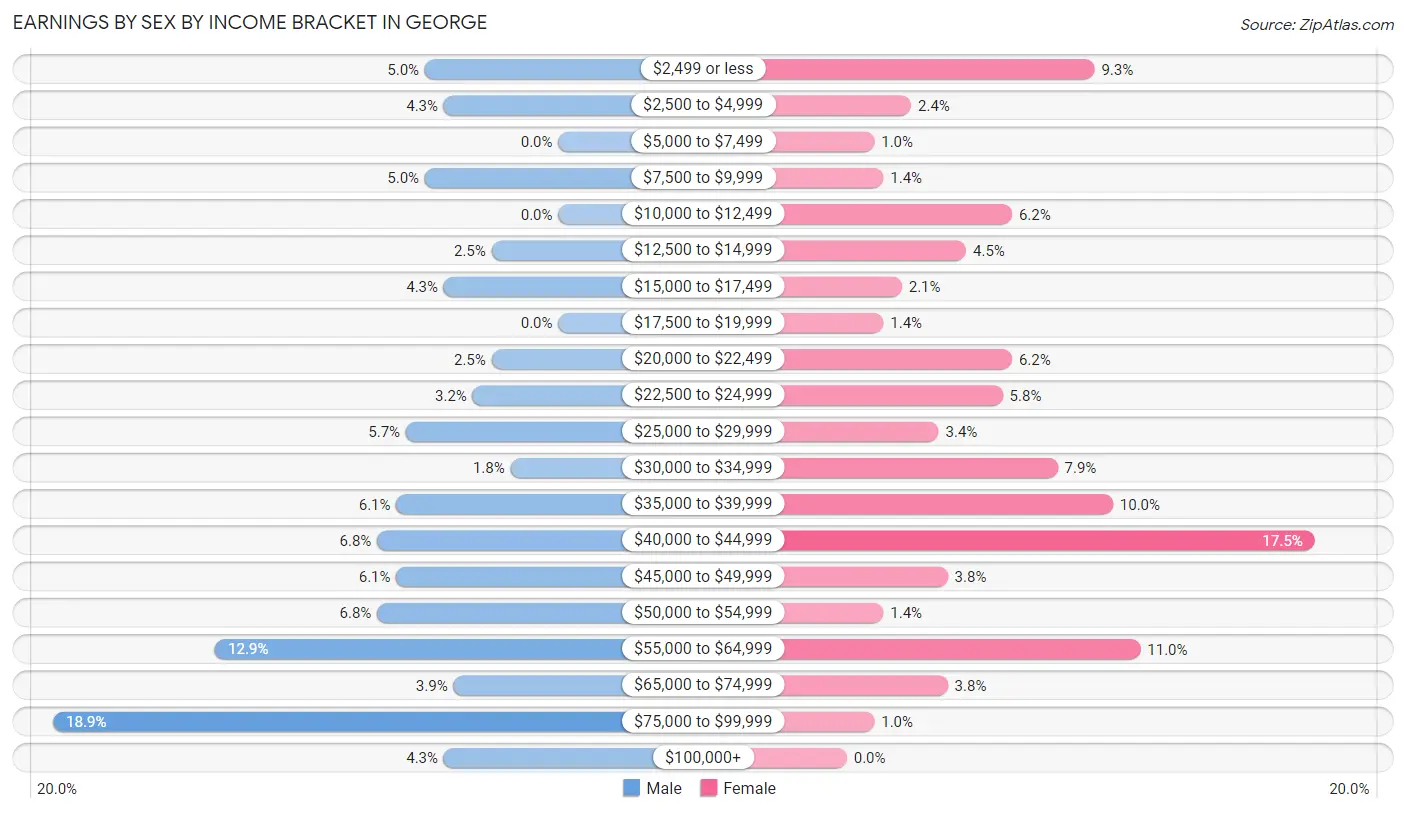
| Income | Male | Female |
| $2,499 or less | 14 (5.0%) | 27 (9.3%) |
| $2,500 to $4,999 | 12 (4.3%) | 7 (2.4%) |
| $5,000 to $7,499 | 0 (0.0%) | 3 (1.0%) |
| $7,500 to $9,999 | 14 (5.0%) | 4 (1.4%) |
| $10,000 to $12,499 | 0 (0.0%) | 18 (6.2%) |
| $12,500 to $14,999 | 7 (2.5%) | 13 (4.5%) |
| $15,000 to $17,499 | 12 (4.3%) | 6 (2.1%) |
| $17,500 to $19,999 | 0 (0.0%) | 4 (1.4%) |
| $20,000 to $22,499 | 7 (2.5%) | 18 (6.2%) |
| $22,500 to $24,999 | 9 (3.2%) | 17 (5.8%) |
| $25,000 to $29,999 | 16 (5.7%) | 10 (3.4%) |
| $30,000 to $34,999 | 5 (1.8%) | 23 (7.9%) |
| $35,000 to $39,999 | 17 (6.1%) | 29 (10.0%) |
| $40,000 to $44,999 | 19 (6.8%) | 51 (17.5%) |
| $45,000 to $49,999 | 17 (6.1%) | 11 (3.8%) |
| $50,000 to $54,999 | 19 (6.8%) | 4 (1.4%) |
| $55,000 to $64,999 | 36 (12.9%) | 32 (11.0%) |
| $65,000 to $74,999 | 11 (3.9%) | 11 (3.8%) |
| $75,000 to $99,999 | 53 (18.9%) | 3 (1.0%) |
| $100,000+ | 12 (4.3%) | 0 (0.0%) |
| Total | 280 (100.0%) | 291 (100.0%) |
Earnings by Sex by Educational Attainment in George
Average earnings in George are $53,839 for men and $36,250 for women, a difference of 32.7%. Men with an educational attainment of graduate degree enjoy the highest average annual earnings of $81,250, while those with college or associate's degree education earn the least with $48,750. Women with an educational attainment of bachelor's degree earn the most with the average annual earnings of $47,500, while those with high school diploma education have the smallest earnings of $24,219.
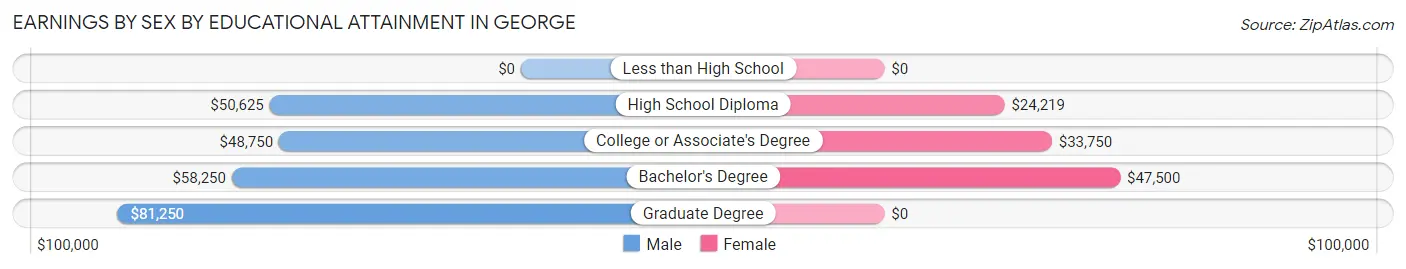
| Educational Attainment | Male Income | Female Income |
| Less than High School | - | - |
| High School Diploma | $50,625 | $24,219 |
| College or Associate's Degree | $48,750 | $33,750 |
| Bachelor's Degree | $58,250 | $47,500 |
| Graduate Degree | $81,250 | $0 |
| Total | $53,839 | $36,250 |
Family Income in George
Family Income Brackets in George
According to the George family income data, there are 91 families falling into the $75,000 to $99,999 income range, which is the most common income bracket and makes up 28.3% of all families. Conversely, the less than $10,000 income bracket is the least frequent group with only 3 families (0.9%) belonging to this category.
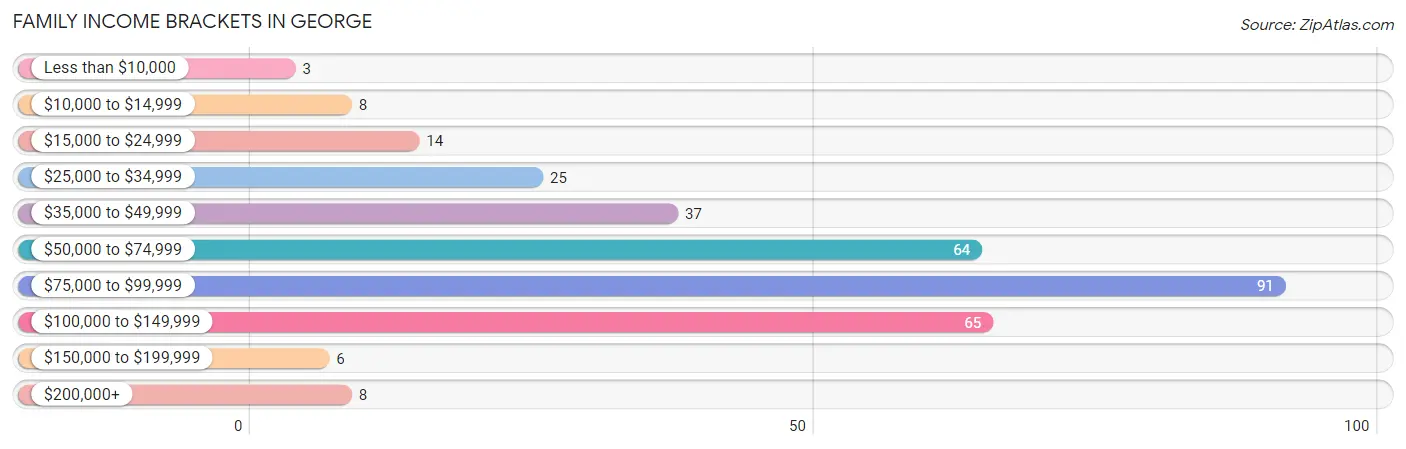
| Income Bracket | # Families | % Families |
| Less than $10,000 | 3 | 0.9% |
| $10,000 to $14,999 | 8 | 2.5% |
| $15,000 to $24,999 | 14 | 4.4% |
| $25,000 to $34,999 | 25 | 7.8% |
| $35,000 to $49,999 | 37 | 11.5% |
| $50,000 to $74,999 | 64 | 19.9% |
| $75,000 to $99,999 | 91 | 28.3% |
| $100,000 to $149,999 | 65 | 20.2% |
| $150,000 to $199,999 | 6 | 1.9% |
| $200,000+ | 8 | 2.5% |
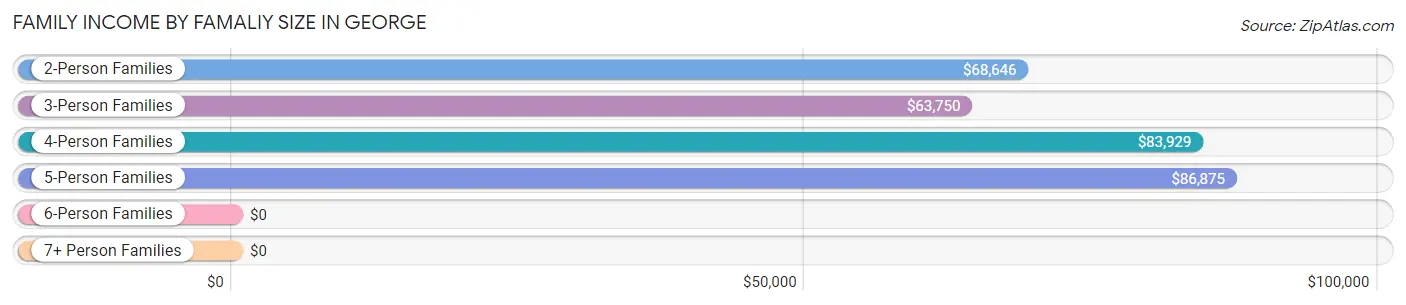
Family Income by Famaliy Size in George
5-person families (24 | 7.5%) account for the highest median family income in George with $86,875 per family, while 2-person families (217 | 67.6%) have the highest median income of $34,323 per family member.
| Income Bracket | # Families | Median Income |
| 2-Person Families | 217 (67.6%) | $68,646 |
| 3-Person Families | 26 (8.1%) | $63,750 |
| 4-Person Families | 50 (15.6%) | $83,929 |
| 5-Person Families | 24 (7.5%) | $86,875 |
| 6-Person Families | 0 (0.0%) | $0 |
| 7+ Person Families | 4 (1.3%) | $0 |
| Total | 321 (100.0%) | $80,417 |
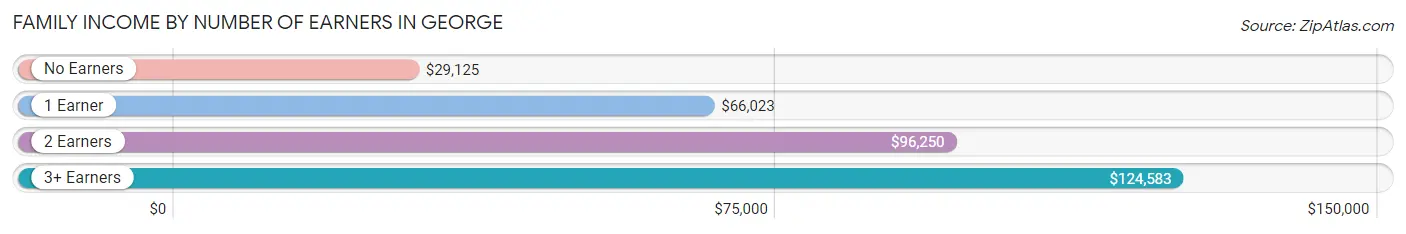
Family Income by Number of Earners in George
The median family income in George is $80,417, with families comprising 3+ earners (13) having the highest median family income of $124,583, while families with no earners (49) have the lowest median family income of $29,125, accounting for 4.1% and 15.3% of families, respectively.
| Number of Earners | # Families | Median Income |
| No Earners | 49 (15.3%) | $29,125 |
| 1 Earner | 113 (35.2%) | $66,023 |
| 2 Earners | 146 (45.5%) | $96,250 |
| 3+ Earners | 13 (4.1%) | $124,583 |
| Total | 321 (100.0%) | $80,417 |
Household Income in George
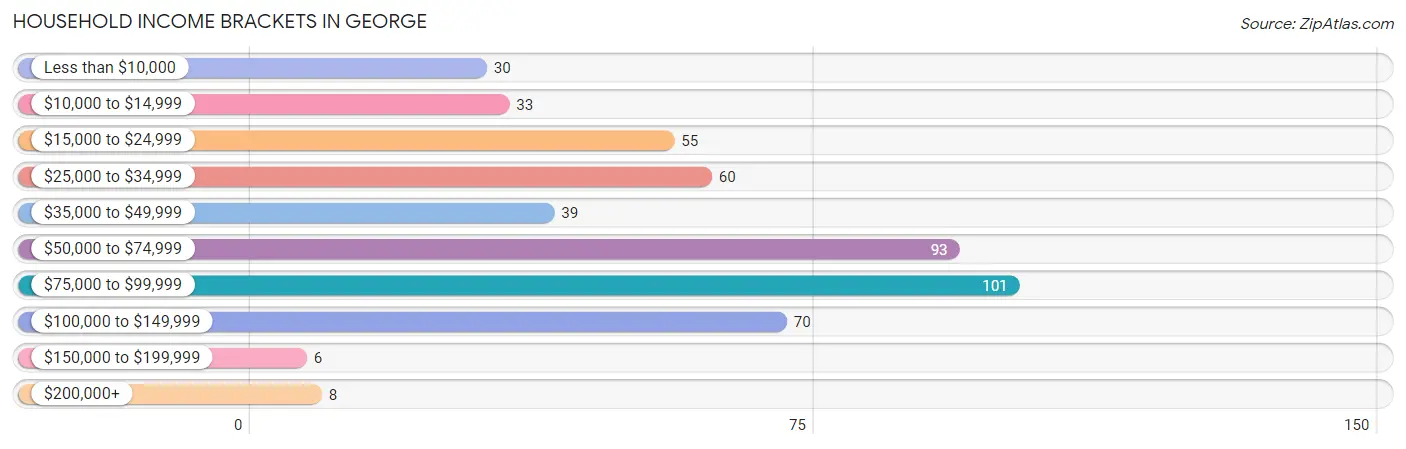
Household Income Brackets in George
With 101 households falling in the category, the $75,000 to $99,999 income range is the most frequent in George, accounting for 20.4% of all households. In contrast, only 6 households (1.2%) fall into the $150,000 to $199,999 income bracket, making it the least populous group.
| Income Bracket | # Households | % Households |
| Less than $10,000 | 30 | 6.1% |
| $10,000 to $14,999 | 33 | 6.7% |
| $15,000 to $24,999 | 55 | 11.1% |
| $25,000 to $34,999 | 60 | 12.1% |
| $35,000 to $49,999 | 39 | 7.9% |
| $50,000 to $74,999 | 93 | 18.8% |
| $75,000 to $99,999 | 101 | 20.4% |
| $100,000 to $149,999 | 70 | 14.1% |
| $150,000 to $199,999 | 6 | 1.2% |
| $200,000+ | 8 | 1.6% |
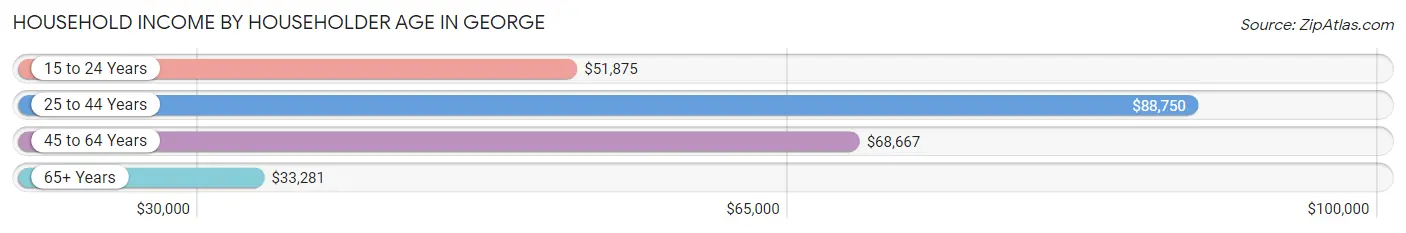
Household Income by Householder Age in George
The median household income in George is $61,302, with the highest median household income of $88,750 found in the 25 to 44 years age bracket for the primary householder. A total of 92 households (18.6%) fall into this category. Meanwhile, the 65+ years age bracket for the primary householder has the lowest median household income of $33,281, with 203 households (41.0%) in this group.
| Income Bracket | # Households | Median Income |
| 15 to 24 Years | 48 (9.7%) | $51,875 |
| 25 to 44 Years | 92 (18.6%) | $88,750 |
| 45 to 64 Years | 152 (30.7%) | $68,667 |
| 65+ Years | 203 (41.0%) | $33,281 |
| Total | 495 (100.0%) | $61,302 |
Poverty in George
Income Below Poverty by Sex and Age in George
With 9.3% poverty level for males and 11.6% for females among the residents of George, 18 to 24 year old males and 75 year old and over females are the most vulnerable to poverty, with 28 males (34.6%) and 36 females (36.7%) in their respective age groups living below the poverty level.
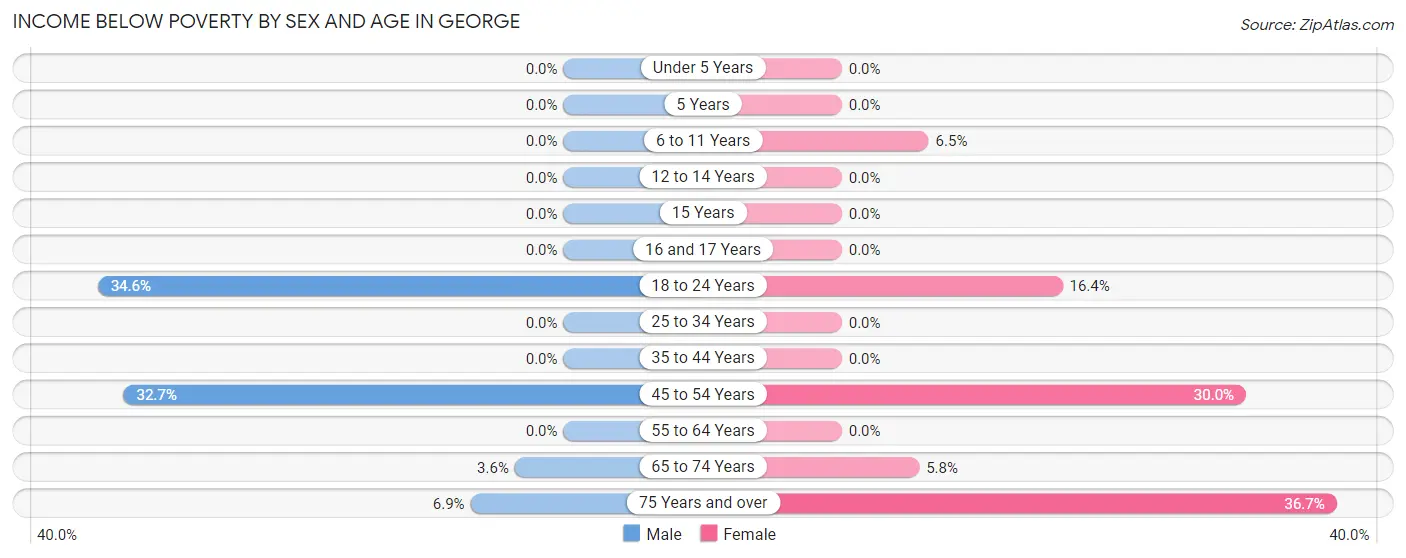
| Age Bracket | Male | Female |
| Under 5 Years | 0 (0.0%) | 0 (0.0%) |
| 5 Years | 0 (0.0%) | 0 (0.0%) |
| 6 to 11 Years | 0 (0.0%) | 2 (6.5%) |
| 12 to 14 Years | 0 (0.0%) | 0 (0.0%) |
| 15 Years | 0 (0.0%) | 0 (0.0%) |
| 16 and 17 Years | 0 (0.0%) | 0 (0.0%) |
| 18 to 24 Years | 28 (34.6%) | 10 (16.4%) |
| 25 to 34 Years | 0 (0.0%) | 0 (0.0%) |
| 35 to 44 Years | 0 (0.0%) | 0 (0.0%) |
| 45 to 54 Years | 16 (32.7%) | 12 (30.0%) |
| 55 to 64 Years | 0 (0.0%) | 0 (0.0%) |
| 65 to 74 Years | 3 (3.6%) | 5 (5.8%) |
| 75 Years and over | 4 (6.9%) | 36 (36.7%) |
| Total | 51 (9.3%) | 65 (11.6%) |
Income Above Poverty by Sex and Age in George
According to the poverty statistics in George, males aged under 5 years and females aged under 5 years are the age groups that are most secure financially, with 100.0% of males and 100.0% of females in these age groups living above the poverty line.
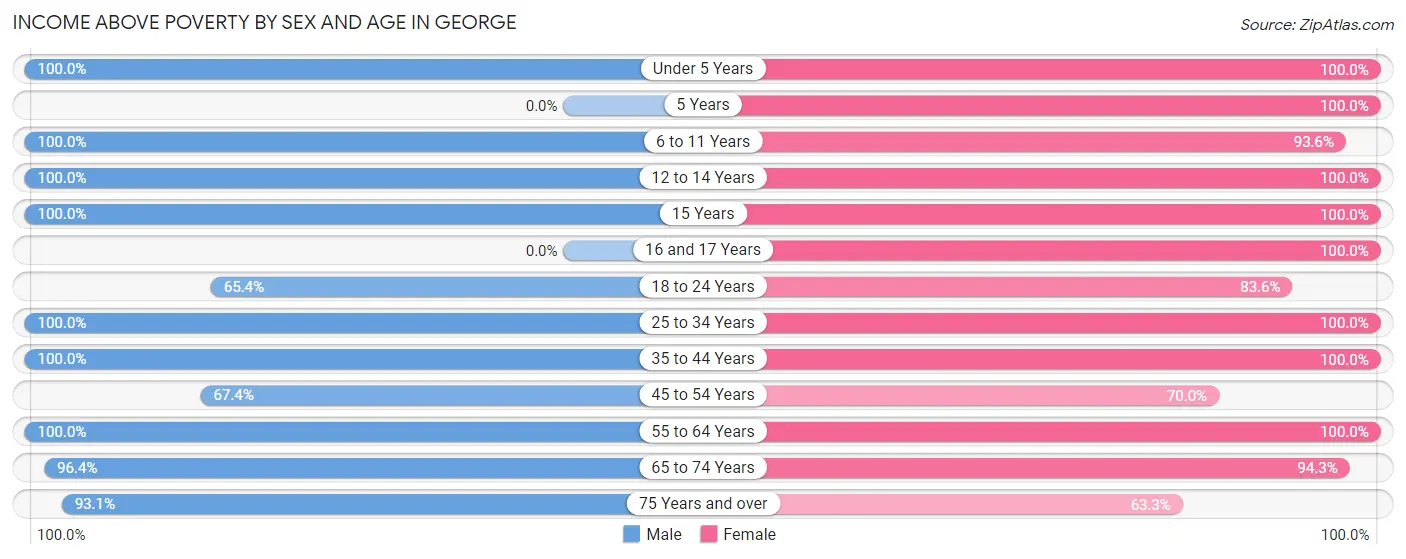
| Age Bracket | Male | Female |
| Under 5 Years | 22 (100.0%) | 28 (100.0%) |
| 5 Years | 0 (0.0%) | 6 (100.0%) |
| 6 to 11 Years | 41 (100.0%) | 29 (93.5%) |
| 12 to 14 Years | 37 (100.0%) | 15 (100.0%) |
| 15 Years | 29 (100.0%) | 11 (100.0%) |
| 16 and 17 Years | 0 (0.0%) | 6 (100.0%) |
| 18 to 24 Years | 53 (65.4%) | 51 (83.6%) |
| 25 to 34 Years | 46 (100.0%) | 65 (100.0%) |
| 35 to 44 Years | 35 (100.0%) | 47 (100.0%) |
| 45 to 54 Years | 33 (67.3%) | 28 (70.0%) |
| 55 to 64 Years | 70 (100.0%) | 67 (100.0%) |
| 65 to 74 Years | 80 (96.4%) | 82 (94.3%) |
| 75 Years and over | 54 (93.1%) | 62 (63.3%) |
| Total | 500 (90.7%) | 497 (88.4%) |
Income Below Poverty Among Married-Couple Families in George
The poverty statistics for married-couple families in George show that 2.5% or 7 of the total 274 families live below the poverty line. Families with no children have the highest poverty rate of 3.6%, comprising of 7 families. On the other hand, families with 1 or 2 children have the lowest poverty rate of 0.0%, which includes 0 families.
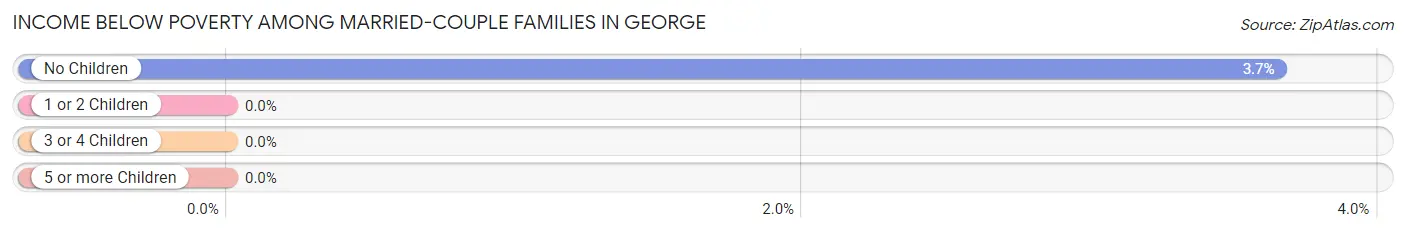
| Children | Above Poverty | Below Poverty |
| No Children | 185 (96.4%) | 7 (3.6%) |
| 1 or 2 Children | 58 (100.0%) | 0 (0.0%) |
| 3 or 4 Children | 20 (100.0%) | 0 (0.0%) |
| 5 or more Children | 4 (100.0%) | 0 (0.0%) |
| Total | 267 (97.5%) | 7 (2.5%) |
Income Below Poverty Among Single-Parent Households in George
According to the poverty data in George, 15.8% or 3 single-father households and 28.6% or 8 single-mother households are living below the poverty line. Among single-father households, those with 1 or 2 children have the highest poverty rate, with 3 households (17.6%) experiencing poverty. Likewise, among single-mother households, those with no children have the highest poverty rate, with 8 households (80.0%) falling below the poverty line.
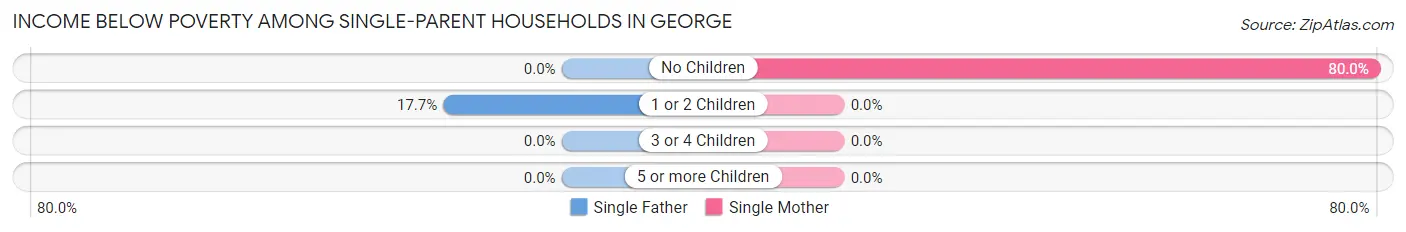
| Children | Single Father | Single Mother |
| No Children | 0 (0.0%) | 8 (80.0%) |
| 1 or 2 Children | 3 (17.6%) | 0 (0.0%) |
| 3 or 4 Children | 0 (0.0%) | 0 (0.0%) |
| 5 or more Children | 0 (0.0%) | 0 (0.0%) |
| Total | 3 (15.8%) | 8 (28.6%) |
Income Below Poverty Among Married-Couple vs Single-Parent Households in George
The poverty data for George shows that 7 of the married-couple family households (2.5%) and 11 of the single-parent households (23.4%) are living below the poverty level. Within the married-couple family households, those with no children have the highest poverty rate, with 7 households (3.6%) falling below the poverty line. Among the single-parent households, those with no children have the highest poverty rate, with 8 household (66.7%) living below poverty.
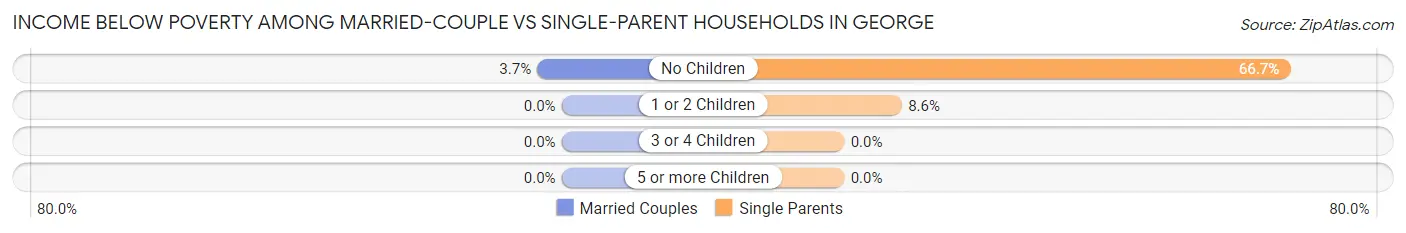
| Children | Married-Couple Families | Single-Parent Households |
| No Children | 7 (3.6%) | 8 (66.7%) |
| 1 or 2 Children | 0 (0.0%) | 3 (8.6%) |
| 3 or 4 Children | 0 (0.0%) | 0 (0.0%) |
| 5 or more Children | 0 (0.0%) | 0 (0.0%) |
| Total | 7 (2.5%) | 11 (23.4%) |
Employment Characteristics in George
Employment by Class of Employer in George
Among the 516 employed individuals in George, private company employees (281 | 54.5%), local government employees (67 | 13.0%), and self-employed (not incorporated) (62 | 12.0%) make up the most common classes of employment.
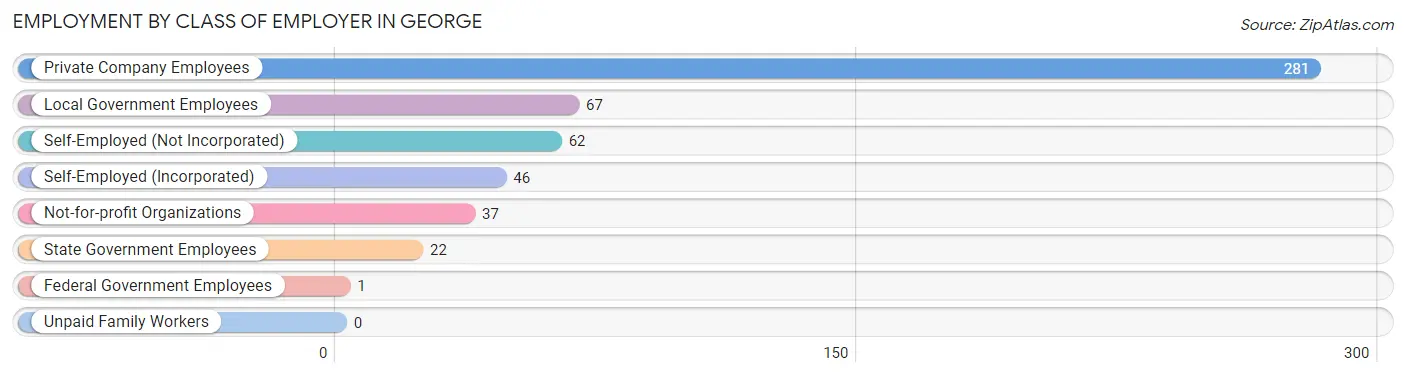
| Employer Class | # Employees | % Employees |
| Private Company Employees | 281 | 54.5% |
| Self-Employed (Incorporated) | 46 | 8.9% |
| Self-Employed (Not Incorporated) | 62 | 12.0% |
| Not-for-profit Organizations | 37 | 7.2% |
| Local Government Employees | 67 | 13.0% |
| State Government Employees | 22 | 4.3% |
| Federal Government Employees | 1 | 0.2% |
| Unpaid Family Workers | 0 | 0.0% |
| Total | 516 | 100.0% |
Employment Status by Age in George
According to the labor force statistics for George, out of the total population over 16 years of age (929), 58.2% or 541 individuals are in the labor force, with 4.6% or 25 of them unemployed. The age group with the highest labor force participation rate is 20 to 24 years, with 94.2% or 81 individuals in the labor force. Within the labor force, the 16 to 19 years age range has the highest percentage of unemployed individuals, with 32.4% or 11 of them being unemployed.
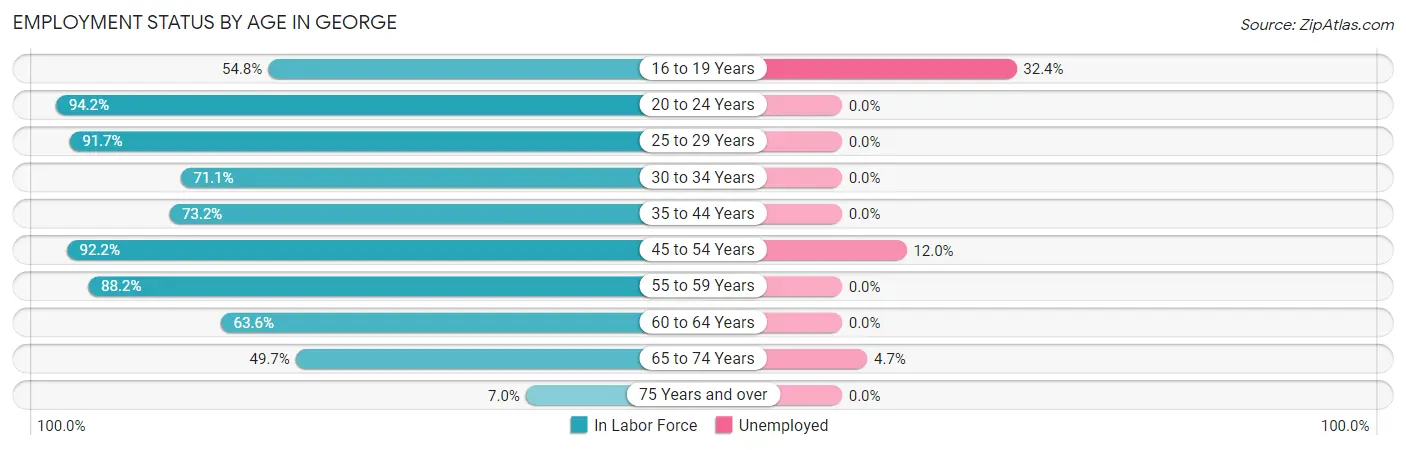
| Age Bracket | In Labor Force | Unemployed |
| 16 to 19 Years | 34 (54.8%) | 11 (32.4%) |
| 20 to 24 Years | 81 (94.2%) | 0 (0.0%) |
| 25 to 29 Years | 33 (91.7%) | 0 (0.0%) |
| 30 to 34 Years | 54 (71.1%) | 0 (0.0%) |
| 35 to 44 Years | 60 (73.2%) | 0 (0.0%) |
| 45 to 54 Years | 83 (92.2%) | 10 (12.0%) |
| 55 to 59 Years | 30 (88.2%) | 0 (0.0%) |
| 60 to 64 Years | 68 (63.6%) | 0 (0.0%) |
| 65 to 74 Years | 85 (49.7%) | 4 (4.7%) |
| 75 Years and over | 13 (7.0%) | 0 (0.0%) |
| Total | 541 (58.2%) | 25 (4.6%) |
Employment Status by Educational Attainment in George
According to labor force statistics for George, 77.2% of individuals (328) out of the total population between 25 and 64 years of age (425) are in the labor force, with 3.0% or 10 of them being unemployed. The group with the highest labor force participation rate are those with the educational attainment of bachelor's degree or higher, with 99.1% or 110 individuals in the labor force. Within the labor force, individuals with college / associate degree education have the highest percentage of unemployment, with 7.6% or 10 of them being unemployed.
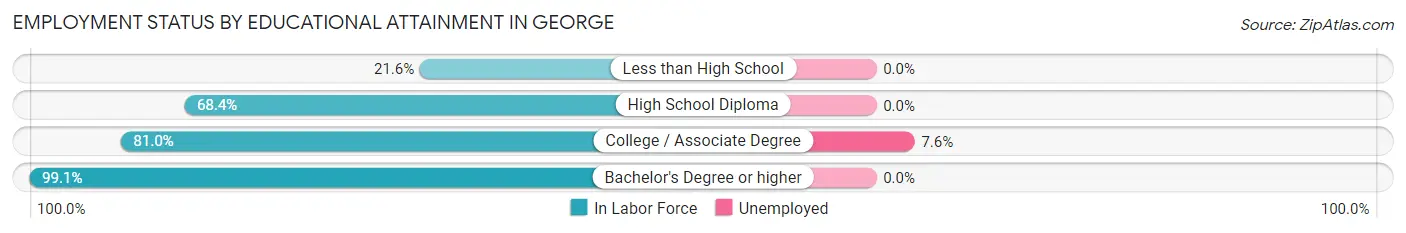
| Educational Attainment | In Labor Force | Unemployed |
| Less than High School | 8 (21.6%) | 0 (0.0%) |
| High School Diploma | 78 (68.4%) | 0 (0.0%) |
| College / Associate Degree | 132 (81.0%) | 12 (7.6%) |
| Bachelor's Degree or higher | 110 (99.1%) | 0 (0.0%) |
| Total | 328 (77.2%) | 13 (3.0%) |
Employment Occupations by Sex in George
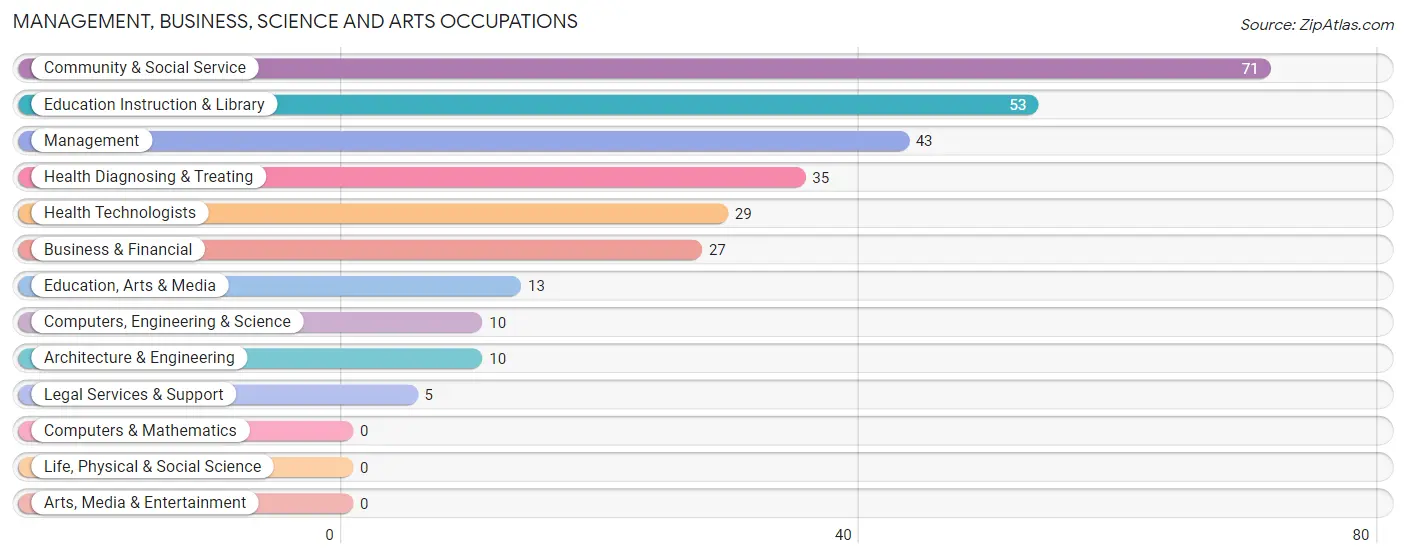
Management, Business, Science and Arts Occupations
The most common Management, Business, Science and Arts occupations in George are Community & Social Service (71 | 13.8%), Education Instruction & Library (53 | 10.3%), Management (43 | 8.3%), Health Diagnosing & Treating (35 | 6.8%), and Health Technologists (29 | 5.6%).
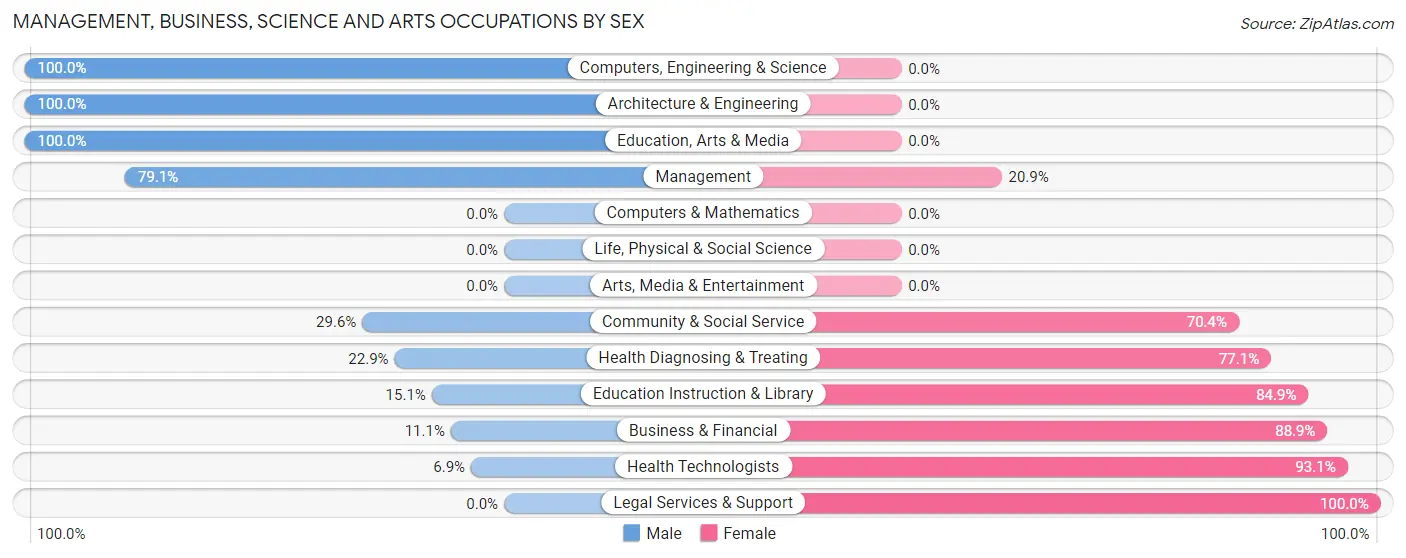
Management, Business, Science and Arts Occupations by Sex
Within the Management, Business, Science and Arts occupations in George, the most male-oriented occupations are Computers, Engineering & Science (100.0%), Architecture & Engineering (100.0%), and Education, Arts & Media (100.0%), while the most female-oriented occupations are Legal Services & Support (100.0%), Health Technologists (93.1%), and Business & Financial (88.9%).
| Occupation | Male | Female |
| Management | 34 (79.1%) | 9 (20.9%) |
| Business & Financial | 3 (11.1%) | 24 (88.9%) |
| Computers, Engineering & Science | 10 (100.0%) | 0 (0.0%) |
| Computers & Mathematics | 0 (0.0%) | 0 (0.0%) |
| Architecture & Engineering | 10 (100.0%) | 0 (0.0%) |
| Life, Physical & Social Science | 0 (0.0%) | 0 (0.0%) |
| Community & Social Service | 21 (29.6%) | 50 (70.4%) |
| Education, Arts & Media | 13 (100.0%) | 0 (0.0%) |
| Legal Services & Support | 0 (0.0%) | 5 (100.0%) |
| Education Instruction & Library | 8 (15.1%) | 45 (84.9%) |
| Arts, Media & Entertainment | 0 (0.0%) | 0 (0.0%) |
| Health Diagnosing & Treating | 8 (22.9%) | 27 (77.1%) |
| Health Technologists | 2 (6.9%) | 27 (93.1%) |
| Total (Category) | 76 (40.9%) | 110 (59.1%) |
| Total (Overall) | 251 (48.6%) | 265 (51.4%) |
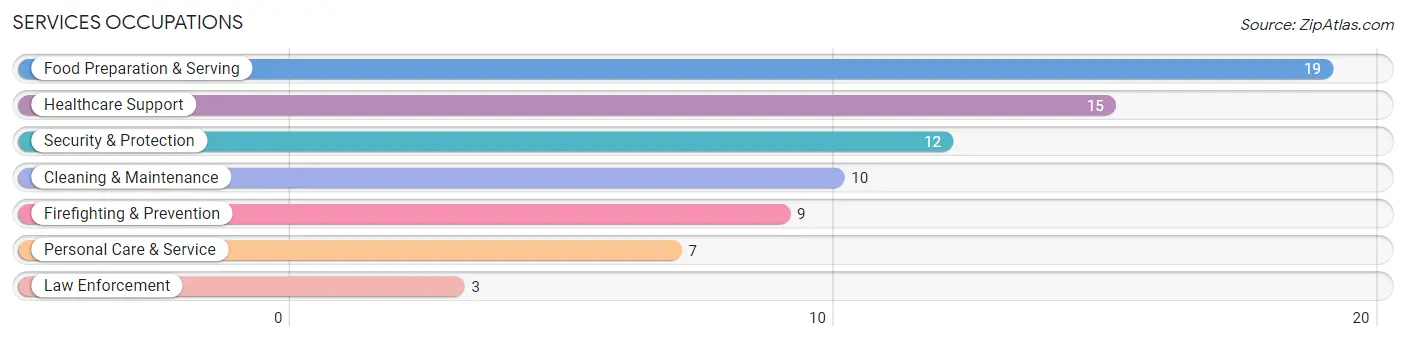
Services Occupations
The most common Services occupations in George are Food Preparation & Serving (19 | 3.7%), Healthcare Support (15 | 2.9%), Security & Protection (12 | 2.3%), Cleaning & Maintenance (10 | 1.9%), and Firefighting & Prevention (9 | 1.7%).
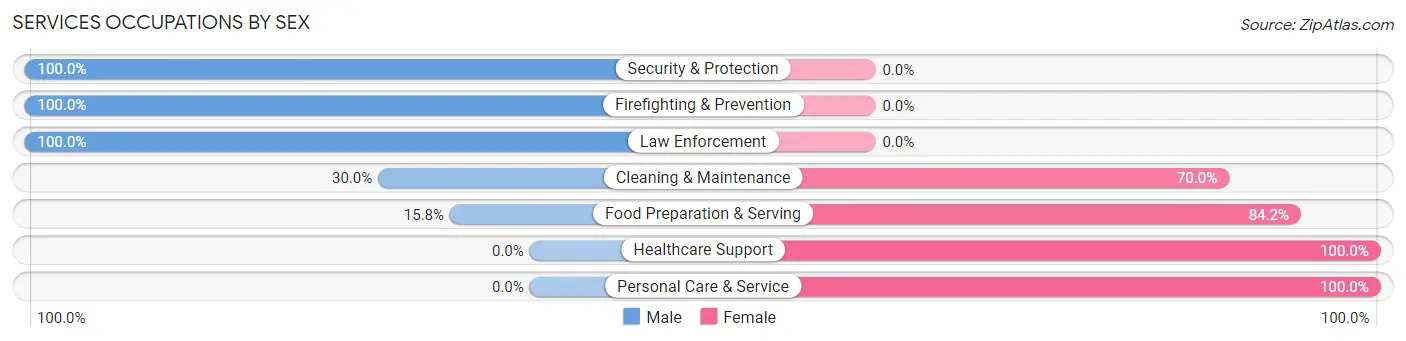
Services Occupations by Sex
Within the Services occupations in George, the most male-oriented occupations are Security & Protection (100.0%), Firefighting & Prevention (100.0%), and Law Enforcement (100.0%), while the most female-oriented occupations are Healthcare Support (100.0%), Personal Care & Service (100.0%), and Food Preparation & Serving (84.2%).
| Occupation | Male | Female |
| Healthcare Support | 0 (0.0%) | 15 (100.0%) |
| Security & Protection | 12 (100.0%) | 0 (0.0%) |
| Firefighting & Prevention | 9 (100.0%) | 0 (0.0%) |
| Law Enforcement | 3 (100.0%) | 0 (0.0%) |
| Food Preparation & Serving | 3 (15.8%) | 16 (84.2%) |
| Cleaning & Maintenance | 3 (30.0%) | 7 (70.0%) |
| Personal Care & Service | 0 (0.0%) | 7 (100.0%) |
| Total (Category) | 18 (28.6%) | 45 (71.4%) |
| Total (Overall) | 251 (48.6%) | 265 (51.4%) |
Sales and Office Occupations
The most common Sales and Office occupations in George are Office & Administration (62 | 12.0%), and Sales & Related (31 | 6.0%).

Sales and Office Occupations by Sex

| Occupation | Male | Female |
| Sales & Related | 15 (48.4%) | 16 (51.6%) |
| Office & Administration | 10 (16.1%) | 52 (83.9%) |
| Total (Category) | 25 (26.9%) | 68 (73.1%) |
| Total (Overall) | 251 (48.6%) | 265 (51.4%) |
Natural Resources, Construction and Maintenance Occupations
The most common Natural Resources, Construction and Maintenance occupations in George are Construction & Extraction (10 | 1.9%), Installation, Maintenance & Repair (10 | 1.9%), and Farming, Fishing & Forestry (4 | 0.8%).
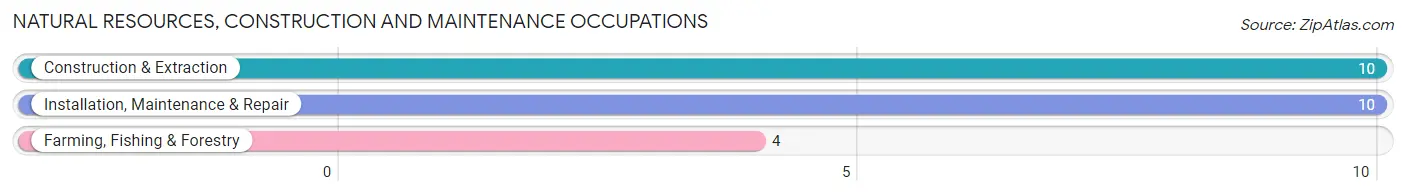
Natural Resources, Construction and Maintenance Occupations by Sex

| Occupation | Male | Female |
| Farming, Fishing & Forestry | 4 (100.0%) | 0 (0.0%) |
| Construction & Extraction | 10 (100.0%) | 0 (0.0%) |
| Installation, Maintenance & Repair | 10 (100.0%) | 0 (0.0%) |
| Total (Category) | 24 (100.0%) | 0 (0.0%) |
| Total (Overall) | 251 (48.6%) | 265 (51.4%) |
Production, Transportation and Moving Occupations
The most common Production, Transportation and Moving occupations in George are Production (96 | 18.6%), Transportation (37 | 7.2%), and Material Moving (17 | 3.3%).
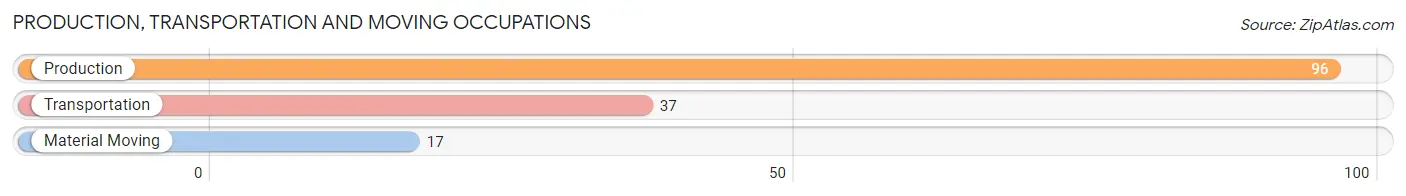
Production, Transportation and Moving Occupations by Sex
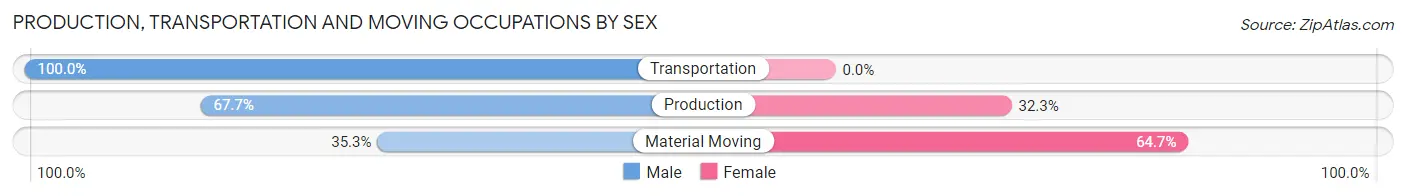
| Occupation | Male | Female |
| Production | 65 (67.7%) | 31 (32.3%) |
| Transportation | 37 (100.0%) | 0 (0.0%) |
| Material Moving | 6 (35.3%) | 11 (64.7%) |
| Total (Category) | 108 (72.0%) | 42 (28.0%) |
| Total (Overall) | 251 (48.6%) | 265 (51.4%) |
Employment Industries by Sex in George
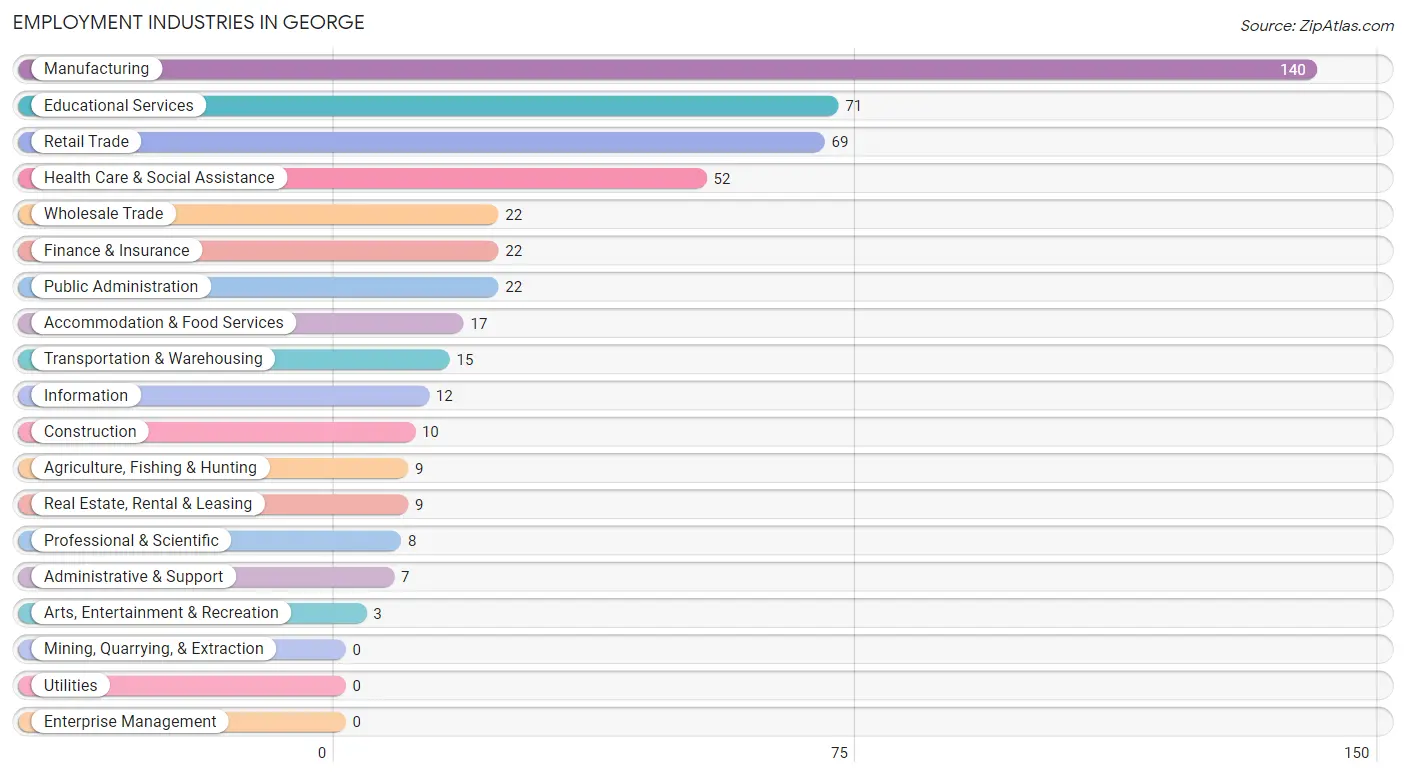
Employment Industries in George
The major employment industries in George include Manufacturing (140 | 27.1%), Educational Services (71 | 13.8%), Retail Trade (69 | 13.4%), Health Care & Social Assistance (52 | 10.1%), and Wholesale Trade (22 | 4.3%).
Employment Industries by Sex in George
The George industries that see more men than women are Agriculture, Fishing & Hunting (100.0%), Construction (100.0%), and Transportation & Warehousing (100.0%), whereas the industries that tend to have a higher number of women are Health Care & Social Assistance (84.6%), Educational Services (84.5%), and Accommodation & Food Services (82.4%).
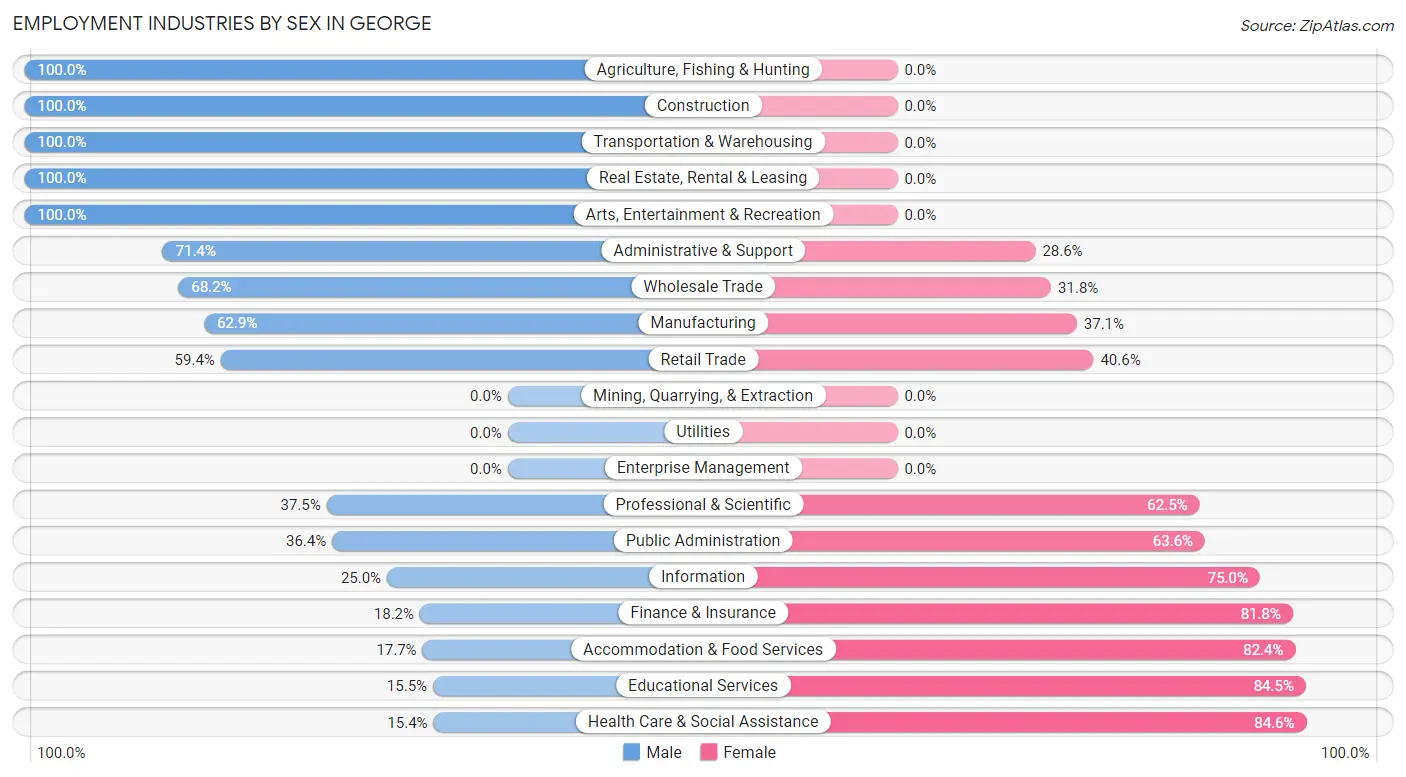
| Industry | Male | Female |
| Agriculture, Fishing & Hunting | 9 (100.0%) | 0 (0.0%) |
| Mining, Quarrying, & Extraction | 0 (0.0%) | 0 (0.0%) |
| Construction | 10 (100.0%) | 0 (0.0%) |
| Manufacturing | 88 (62.9%) | 52 (37.1%) |
| Wholesale Trade | 15 (68.2%) | 7 (31.8%) |
| Retail Trade | 41 (59.4%) | 28 (40.6%) |
| Transportation & Warehousing | 15 (100.0%) | 0 (0.0%) |
| Utilities | 0 (0.0%) | 0 (0.0%) |
| Information | 3 (25.0%) | 9 (75.0%) |
| Finance & Insurance | 4 (18.2%) | 18 (81.8%) |
| Real Estate, Rental & Leasing | 9 (100.0%) | 0 (0.0%) |
| Professional & Scientific | 3 (37.5%) | 5 (62.5%) |
| Enterprise Management | 0 (0.0%) | 0 (0.0%) |
| Administrative & Support | 5 (71.4%) | 2 (28.6%) |
| Educational Services | 11 (15.5%) | 60 (84.5%) |
| Health Care & Social Assistance | 8 (15.4%) | 44 (84.6%) |
| Arts, Entertainment & Recreation | 3 (100.0%) | 0 (0.0%) |
| Accommodation & Food Services | 3 (17.6%) | 14 (82.4%) |
| Public Administration | 8 (36.4%) | 14 (63.6%) |
| Total | 251 (48.6%) | 265 (51.4%) |
Education in George
School Enrollment in George
The most common levels of schooling among the 267 students in George are high school (98 | 36.7%), middle school (71 | 26.6%), and elementary school (44 | 16.5%).
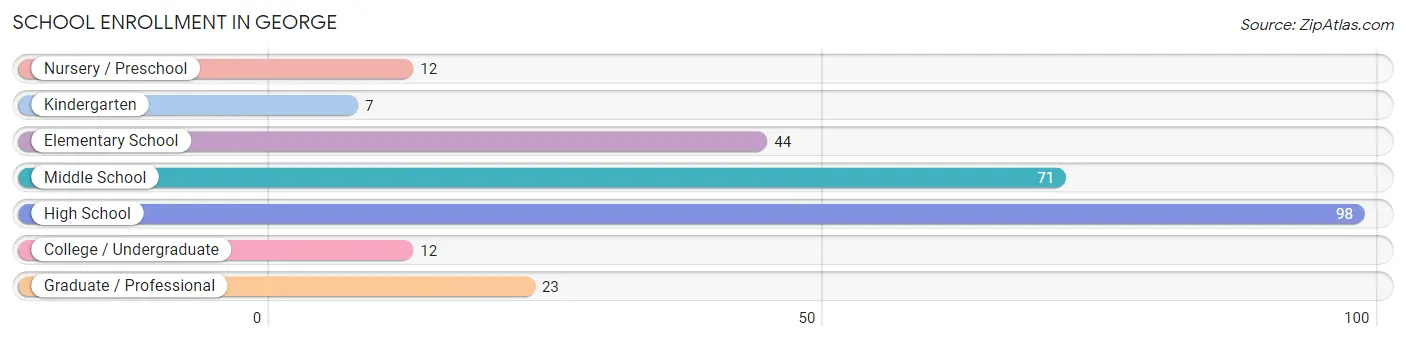
| School Level | # Students | % Students |
| Nursery / Preschool | 12 | 4.5% |
| Kindergarten | 7 | 2.6% |
| Elementary School | 44 | 16.5% |
| Middle School | 71 | 26.6% |
| High School | 98 | 36.7% |
| College / Undergraduate | 12 | 4.5% |
| Graduate / Professional | 23 | 8.6% |
| Total | 267 | 100.0% |
School Enrollment by Age by Funding Source in George
Out of a total of 267 students who are enrolled in schools in George, 14 (5.2%) attend a private institution, while the remaining 253 (94.8%) are enrolled in public schools. The age group of 20 to 24 year olds has the highest likelihood of being enrolled in private schools, with 7 (53.8% in the age bracket) enrolled. Conversely, the age group of 3 to 4 year olds has the lowest likelihood of being enrolled in a private school, with 6 (100.0% in the age bracket) attending a public institution.
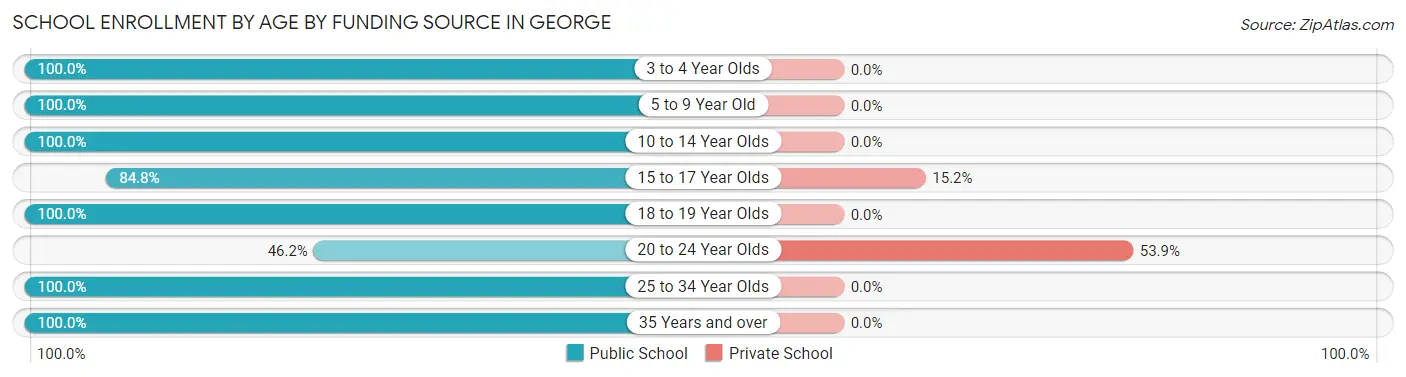
| Age Bracket | Public School | Private School |
| 3 to 4 Year Olds | 6 (100.0%) | 0 (0.0%) |
| 5 to 9 Year Old | 54 (100.0%) | 0 (0.0%) |
| 10 to 14 Year Olds | 76 (100.0%) | 0 (0.0%) |
| 15 to 17 Year Olds | 39 (84.8%) | 7 (15.2%) |
| 18 to 19 Year Olds | 50 (100.0%) | 0 (0.0%) |
| 20 to 24 Year Olds | 6 (46.2%) | 7 (53.8%) |
| 25 to 34 Year Olds | 1 (100.0%) | 0 (0.0%) |
| 35 Years and over | 21 (100.0%) | 0 (0.0%) |
| Total | 253 (94.8%) | 14 (5.2%) |
Educational Attainment by Field of Study in George
Education (60 | 35.5%), science & technology (37 | 21.9%), business (15 | 8.9%), bio, nature & agricultural (14 | 8.3%), and arts & humanities (9 | 5.3%) are the most common fields of study among 169 individuals in George who have obtained a bachelor's degree or higher.
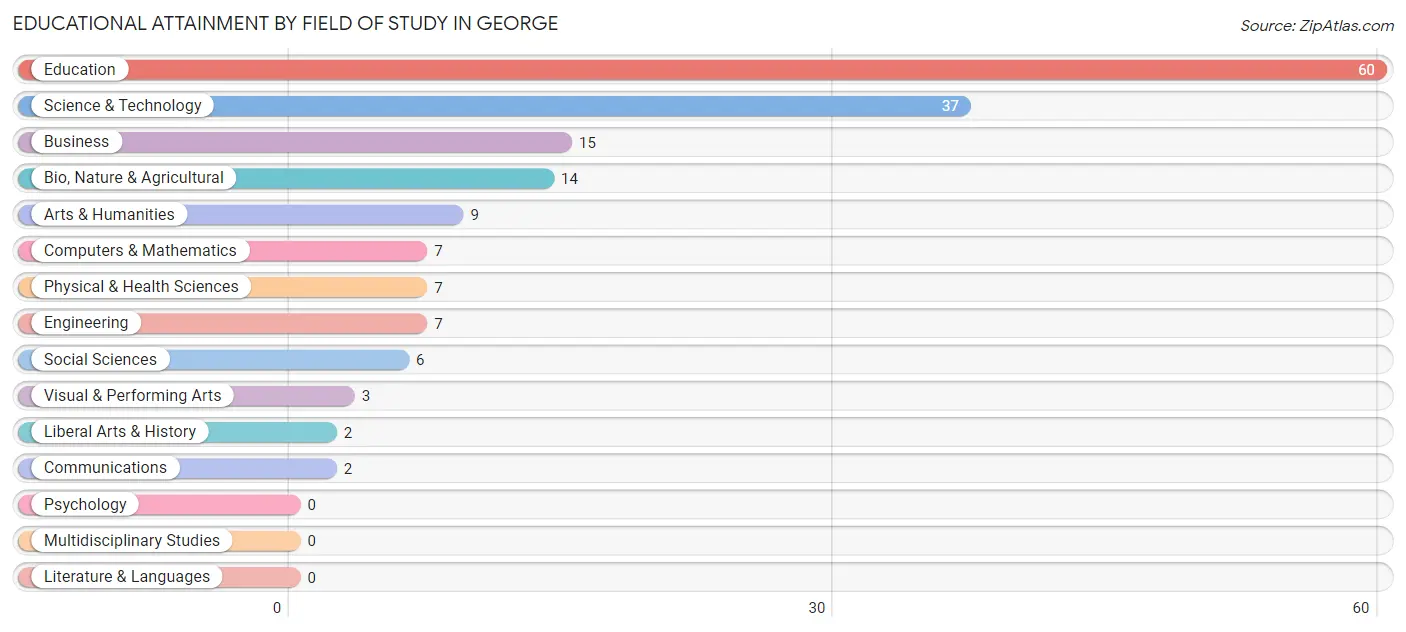
| Field of Study | # Graduates | % Graduates |
| Computers & Mathematics | 7 | 4.1% |
| Bio, Nature & Agricultural | 14 | 8.3% |
| Physical & Health Sciences | 7 | 4.1% |
| Psychology | 0 | 0.0% |
| Social Sciences | 6 | 3.5% |
| Engineering | 7 | 4.1% |
| Multidisciplinary Studies | 0 | 0.0% |
| Science & Technology | 37 | 21.9% |
| Business | 15 | 8.9% |
| Education | 60 | 35.5% |
| Literature & Languages | 0 | 0.0% |
| Liberal Arts & History | 2 | 1.2% |
| Visual & Performing Arts | 3 | 1.8% |
| Communications | 2 | 1.2% |
| Arts & Humanities | 9 | 5.3% |
| Total | 169 | 100.0% |
Transportation & Commute in George
Vehicle Availability by Sex in George
The most prevalent vehicle ownership categories in George are males with 3 vehicles (96, accounting for 38.3%) and females with 3 vehicles (91, making up 36.2%).
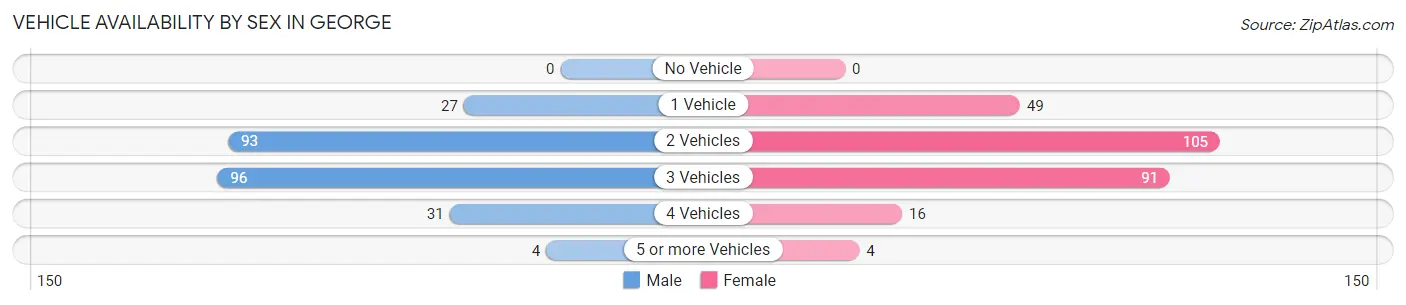
| Vehicles Available | Male | Female |
| No Vehicle | 0 (0.0%) | 0 (0.0%) |
| 1 Vehicle | 27 (10.8%) | 49 (18.5%) |
| 2 Vehicles | 93 (37.0%) | 105 (39.6%) |
| 3 Vehicles | 96 (38.3%) | 91 (34.3%) |
| 4 Vehicles | 31 (12.3%) | 16 (6.0%) |
| 5 or more Vehicles | 4 (1.6%) | 4 (1.5%) |
| Total | 251 (100.0%) | 265 (100.0%) |
Commute Time in George
The most frequently occuring commute durations in George are 5 to 9 minutes (95 commuters, 19.4%), less than 5 minutes (66 commuters, 13.5%), and 20 to 24 minutes (63 commuters, 12.9%).
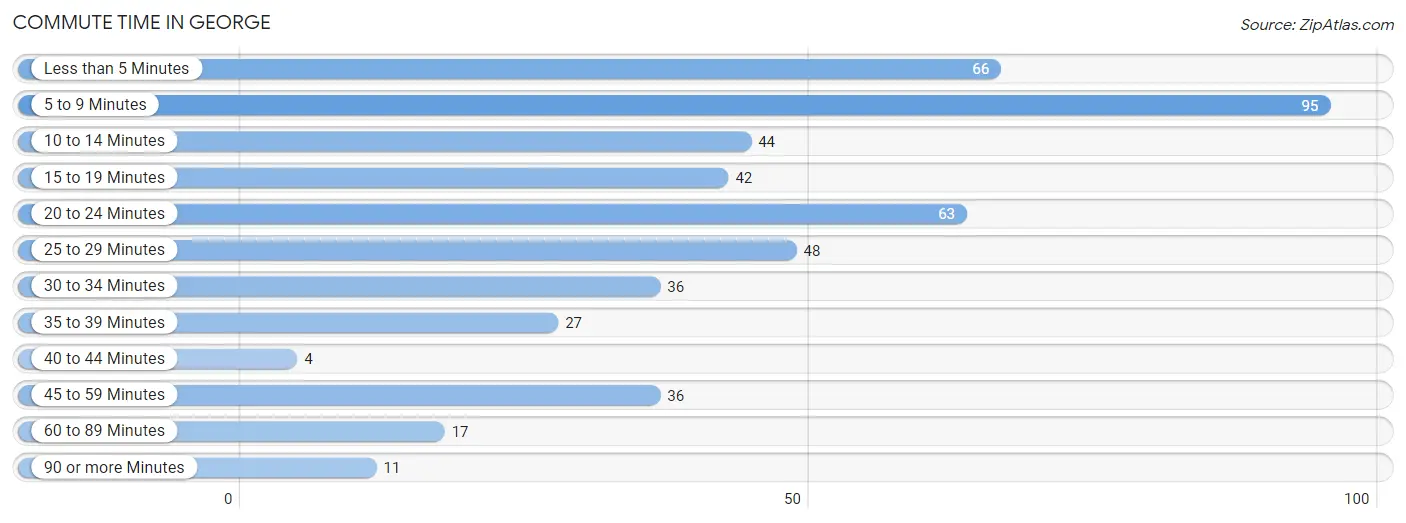
| Commute Time | # Commuters | % Commuters |
| Less than 5 Minutes | 66 | 13.5% |
| 5 to 9 Minutes | 95 | 19.4% |
| 10 to 14 Minutes | 44 | 9.0% |
| 15 to 19 Minutes | 42 | 8.6% |
| 20 to 24 Minutes | 63 | 12.9% |
| 25 to 29 Minutes | 48 | 9.8% |
| 30 to 34 Minutes | 36 | 7.4% |
| 35 to 39 Minutes | 27 | 5.5% |
| 40 to 44 Minutes | 4 | 0.8% |
| 45 to 59 Minutes | 36 | 7.4% |
| 60 to 89 Minutes | 17 | 3.5% |
| 90 or more Minutes | 11 | 2.2% |
Commute Time by Sex in George
The most common commute times in George are 5 to 9 minutes (48 commuters, 19.4%) for males and 5 to 9 minutes (47 commuters, 19.5%) for females.
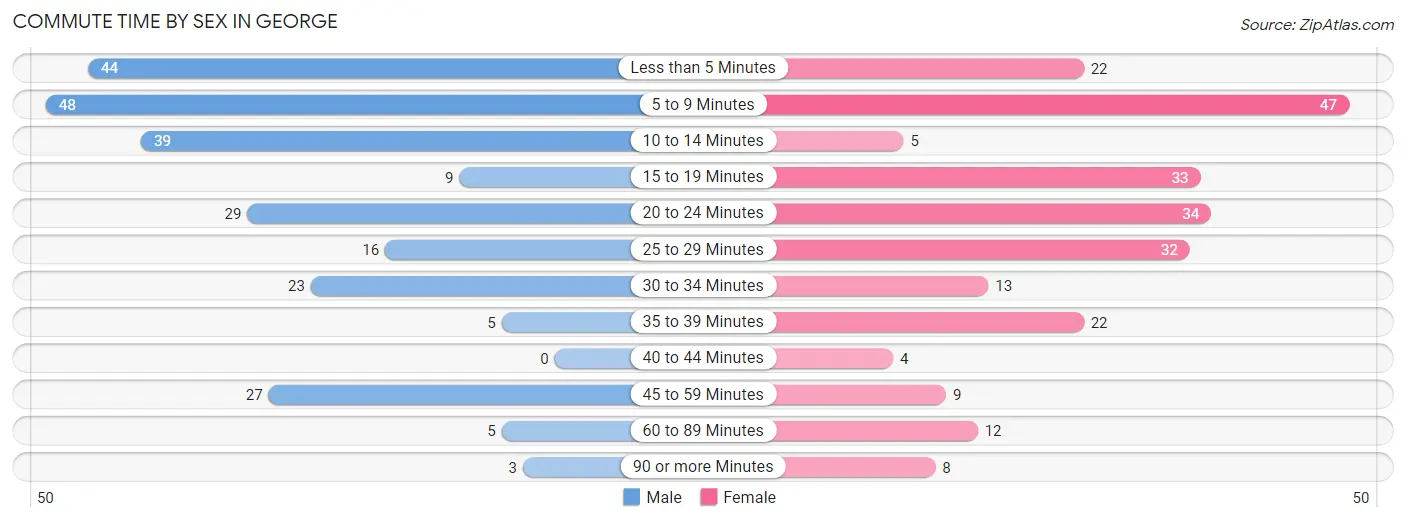
| Commute Time | Male | Female |
| Less than 5 Minutes | 44 (17.7%) | 22 (9.1%) |
| 5 to 9 Minutes | 48 (19.4%) | 47 (19.5%) |
| 10 to 14 Minutes | 39 (15.7%) | 5 (2.1%) |
| 15 to 19 Minutes | 9 (3.6%) | 33 (13.7%) |
| 20 to 24 Minutes | 29 (11.7%) | 34 (14.1%) |
| 25 to 29 Minutes | 16 (6.5%) | 32 (13.3%) |
| 30 to 34 Minutes | 23 (9.3%) | 13 (5.4%) |
| 35 to 39 Minutes | 5 (2.0%) | 22 (9.1%) |
| 40 to 44 Minutes | 0 (0.0%) | 4 (1.7%) |
| 45 to 59 Minutes | 27 (10.9%) | 9 (3.7%) |
| 60 to 89 Minutes | 5 (2.0%) | 12 (5.0%) |
| 90 or more Minutes | 3 (1.2%) | 8 (3.3%) |
Time of Departure to Work by Sex in George
The most frequent times of departure to work in George are 5:30 AM to 5:59 AM (52, 21.0%) for males and 7:00 AM to 7:29 AM (57, 23.6%) for females.
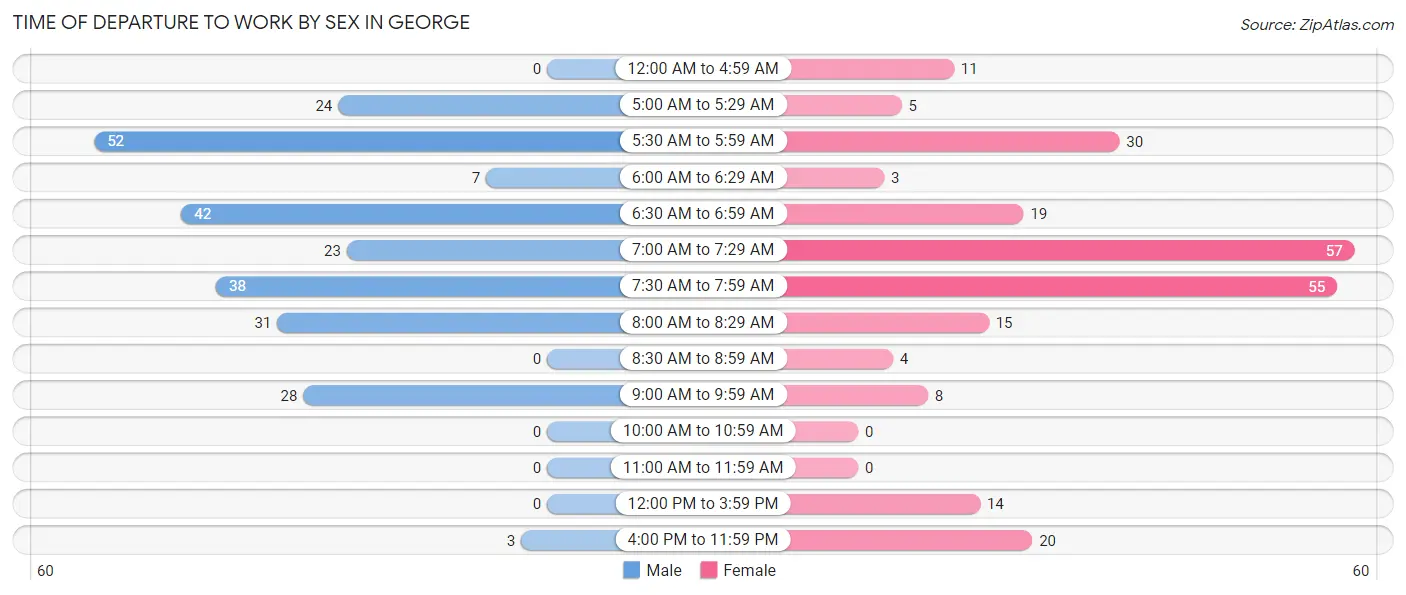
| Time of Departure | Male | Female |
| 12:00 AM to 4:59 AM | 0 (0.0%) | 11 (4.6%) |
| 5:00 AM to 5:29 AM | 24 (9.7%) | 5 (2.1%) |
| 5:30 AM to 5:59 AM | 52 (21.0%) | 30 (12.4%) |
| 6:00 AM to 6:29 AM | 7 (2.8%) | 3 (1.2%) |
| 6:30 AM to 6:59 AM | 42 (16.9%) | 19 (7.9%) |
| 7:00 AM to 7:29 AM | 23 (9.3%) | 57 (23.6%) |
| 7:30 AM to 7:59 AM | 38 (15.3%) | 55 (22.8%) |
| 8:00 AM to 8:29 AM | 31 (12.5%) | 15 (6.2%) |
| 8:30 AM to 8:59 AM | 0 (0.0%) | 4 (1.7%) |
| 9:00 AM to 9:59 AM | 28 (11.3%) | 8 (3.3%) |
| 10:00 AM to 10:59 AM | 0 (0.0%) | 0 (0.0%) |
| 11:00 AM to 11:59 AM | 0 (0.0%) | 0 (0.0%) |
| 12:00 PM to 3:59 PM | 0 (0.0%) | 14 (5.8%) |
| 4:00 PM to 11:59 PM | 3 (1.2%) | 20 (8.3%) |
| Total | 248 (100.0%) | 241 (100.0%) |
Housing Occupancy in George
Occupancy by Ownership in George
Of the total 495 dwellings in George, owner-occupied units account for 388 (78.4%), while renter-occupied units make up 107 (21.6%).
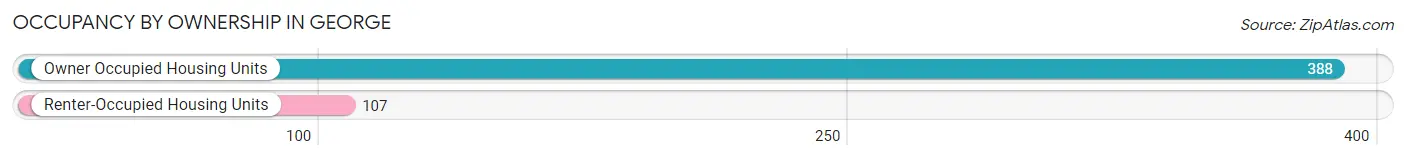
| Occupancy | # Housing Units | % Housing Units |
| Owner Occupied Housing Units | 388 | 78.4% |
| Renter-Occupied Housing Units | 107 | 21.6% |
| Total Occupied Housing Units | 495 | 100.0% |
Occupancy by Household Size in George
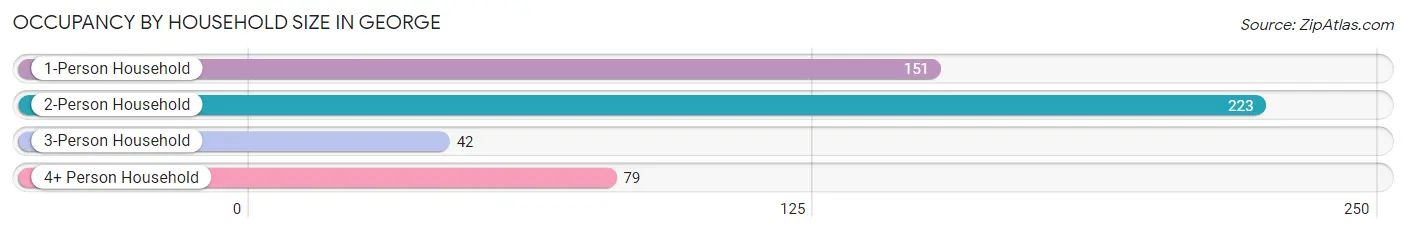
| Household Size | # Housing Units | % Housing Units |
| 1-Person Household | 151 | 30.5% |
| 2-Person Household | 223 | 45.1% |
| 3-Person Household | 42 | 8.5% |
| 4+ Person Household | 79 | 16.0% |
| Total Housing Units | 495 | 100.0% |
Occupancy by Ownership by Household Size in George
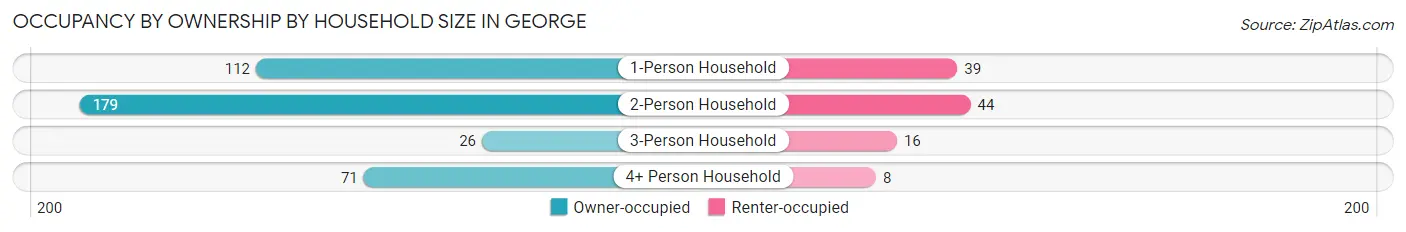
| Household Size | Owner-occupied | Renter-occupied |
| 1-Person Household | 112 (74.2%) | 39 (25.8%) |
| 2-Person Household | 179 (80.3%) | 44 (19.7%) |
| 3-Person Household | 26 (61.9%) | 16 (38.1%) |
| 4+ Person Household | 71 (89.9%) | 8 (10.1%) |
| Total Housing Units | 388 (78.4%) | 107 (21.6%) |
Occupancy by Educational Attainment in George
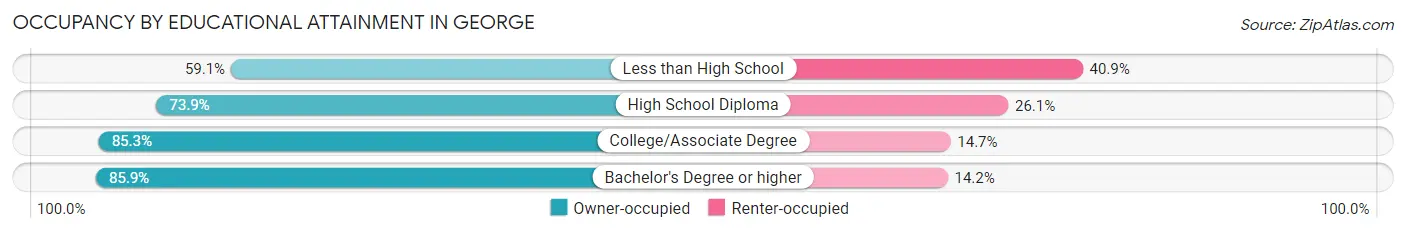
| Household Size | Owner-occupied | Renter-occupied |
| Less than High School | 39 (59.1%) | 27 (40.9%) |
| High School Diploma | 113 (73.9%) | 40 (26.1%) |
| College/Associate Degree | 145 (85.3%) | 25 (14.7%) |
| Bachelor's Degree or higher | 91 (85.9%) | 15 (14.1%) |
Occupancy by Age of Householder in George
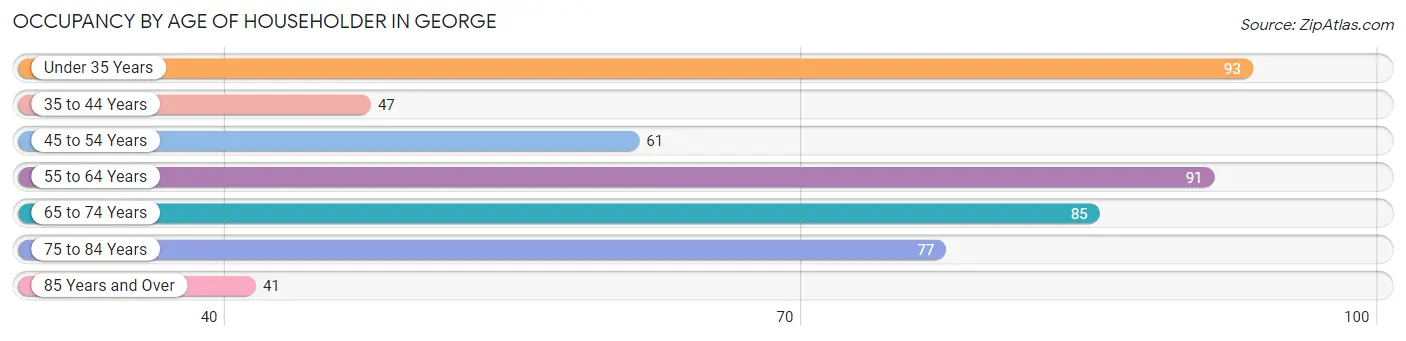
| Age Bracket | # Households | % Households |
| Under 35 Years | 93 | 18.8% |
| 35 to 44 Years | 47 | 9.5% |
| 45 to 54 Years | 61 | 12.3% |
| 55 to 64 Years | 91 | 18.4% |
| 65 to 74 Years | 85 | 17.2% |
| 75 to 84 Years | 77 | 15.6% |
| 85 Years and Over | 41 | 8.3% |
| Total | 495 | 100.0% |
Housing Finances in George
Median Income by Occupancy in George
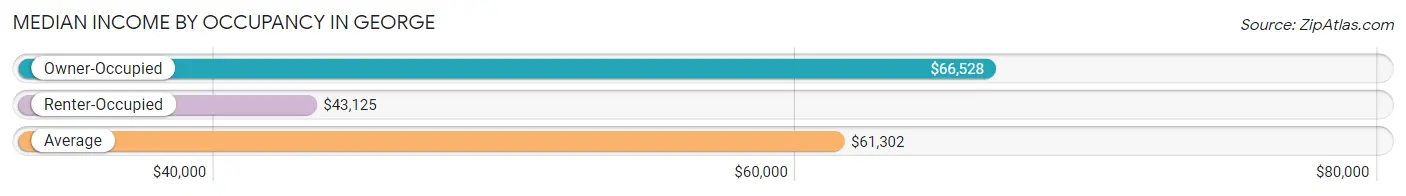
| Occupancy Type | # Households | Median Income |
| Owner-Occupied | 388 (78.4%) | $66,528 |
| Renter-Occupied | 107 (21.6%) | $43,125 |
| Average | 495 (100.0%) | $61,302 |
Occupancy by Householder Income Bracket in George
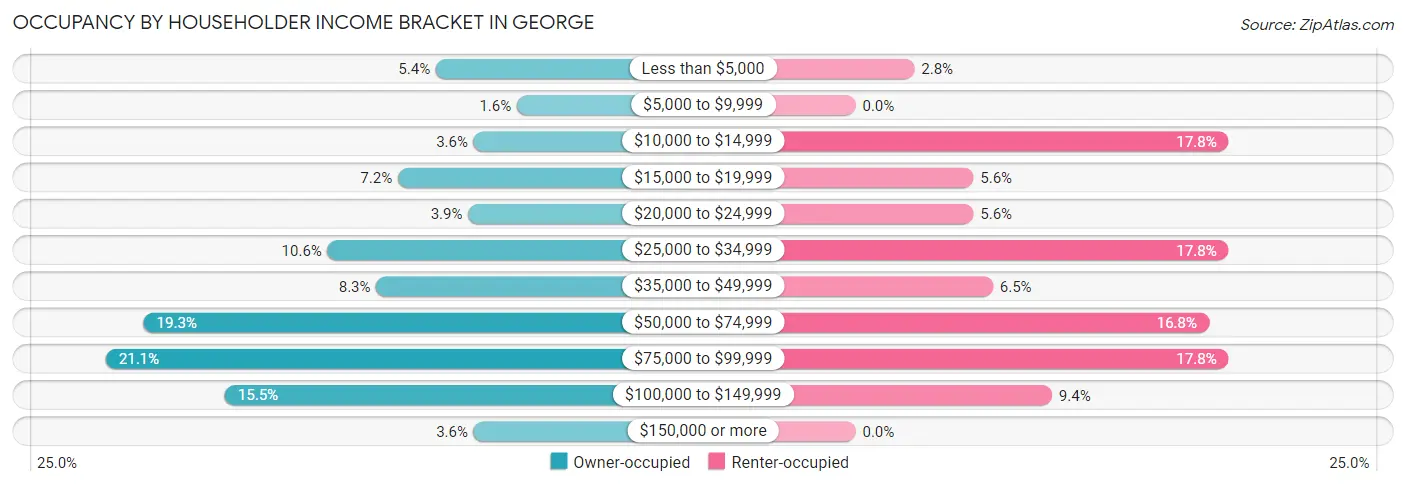
| Income Bracket | Owner-occupied | Renter-occupied |
| Less than $5,000 | 21 (5.4%) | 3 (2.8%) |
| $5,000 to $9,999 | 6 (1.5%) | 0 (0.0%) |
| $10,000 to $14,999 | 14 (3.6%) | 19 (17.8%) |
| $15,000 to $19,999 | 28 (7.2%) | 6 (5.6%) |
| $20,000 to $24,999 | 15 (3.9%) | 6 (5.6%) |
| $25,000 to $34,999 | 41 (10.6%) | 19 (17.8%) |
| $35,000 to $49,999 | 32 (8.3%) | 7 (6.5%) |
| $50,000 to $74,999 | 75 (19.3%) | 18 (16.8%) |
| $75,000 to $99,999 | 82 (21.1%) | 19 (17.8%) |
| $100,000 to $149,999 | 60 (15.5%) | 10 (9.3%) |
| $150,000 or more | 14 (3.6%) | 0 (0.0%) |
| Total | 388 (100.0%) | 107 (100.0%) |
Monthly Housing Cost Tiers in George
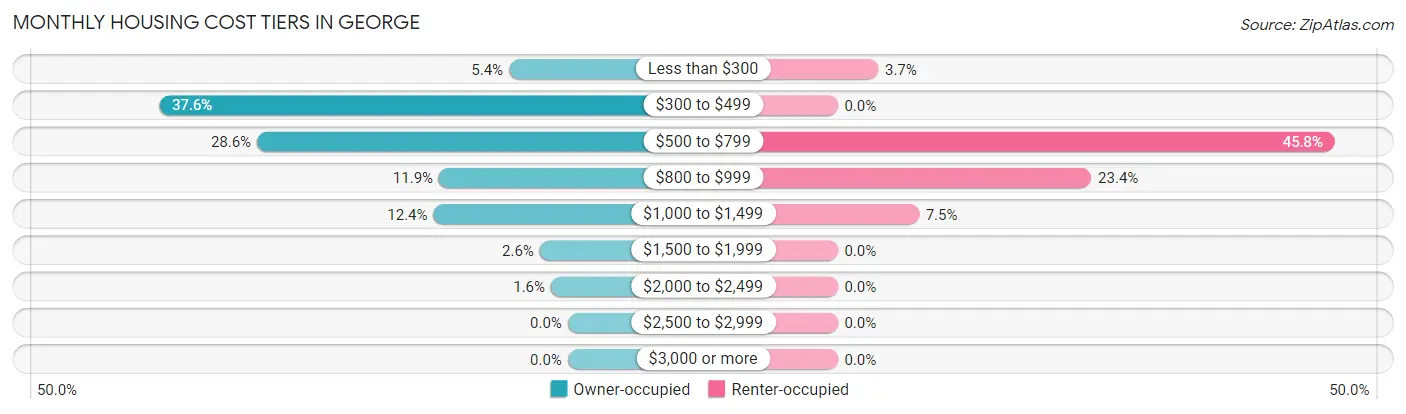
| Monthly Cost | Owner-occupied | Renter-occupied |
| Less than $300 | 21 (5.4%) | 4 (3.7%) |
| $300 to $499 | 146 (37.6%) | 0 (0.0%) |
| $500 to $799 | 111 (28.6%) | 49 (45.8%) |
| $800 to $999 | 46 (11.9%) | 25 (23.4%) |
| $1,000 to $1,499 | 48 (12.4%) | 8 (7.5%) |
| $1,500 to $1,999 | 10 (2.6%) | 0 (0.0%) |
| $2,000 to $2,499 | 6 (1.5%) | 0 (0.0%) |
| $2,500 to $2,999 | 0 (0.0%) | 0 (0.0%) |
| $3,000 or more | 0 (0.0%) | 0 (0.0%) |
| Total | 388 (100.0%) | 107 (100.0%) |
Physical Housing Characteristics in George
Housing Structures in George
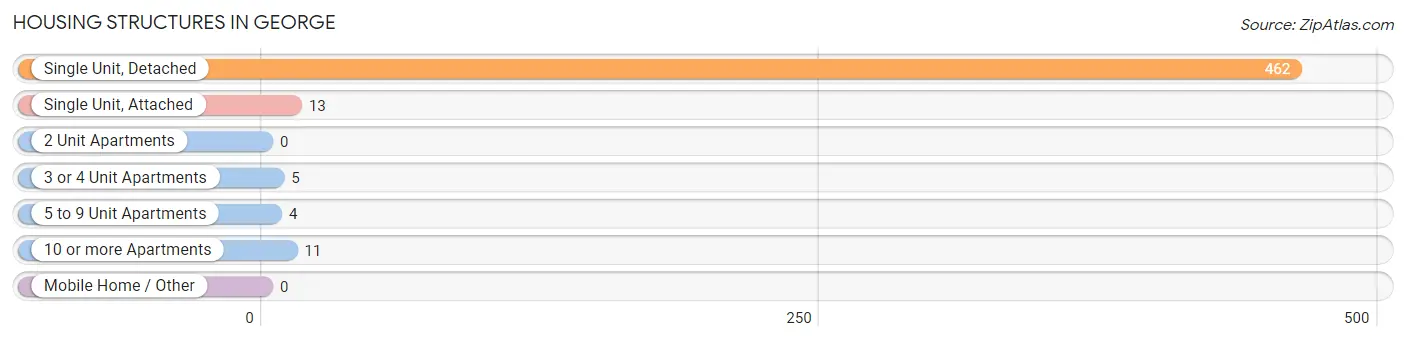
| Structure Type | # Housing Units | % Housing Units |
| Single Unit, Detached | 462 | 93.3% |
| Single Unit, Attached | 13 | 2.6% |
| 2 Unit Apartments | 0 | 0.0% |
| 3 or 4 Unit Apartments | 5 | 1.0% |
| 5 to 9 Unit Apartments | 4 | 0.8% |
| 10 or more Apartments | 11 | 2.2% |
| Mobile Home / Other | 0 | 0.0% |
| Total | 495 | 100.0% |
Housing Structures by Occupancy in George
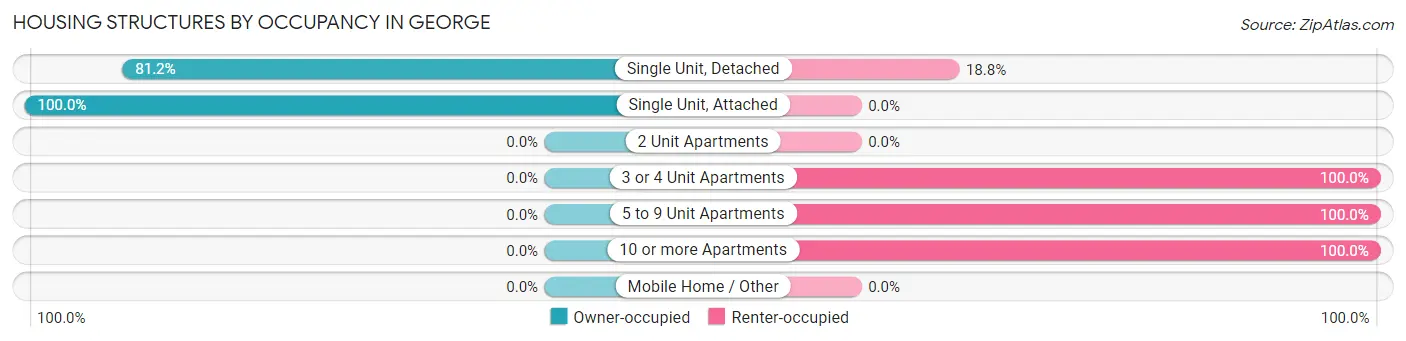
| Structure Type | Owner-occupied | Renter-occupied |
| Single Unit, Detached | 375 (81.2%) | 87 (18.8%) |
| Single Unit, Attached | 13 (100.0%) | 0 (0.0%) |
| 2 Unit Apartments | 0 (0.0%) | 0 (0.0%) |
| 3 or 4 Unit Apartments | 0 (0.0%) | 5 (100.0%) |
| 5 to 9 Unit Apartments | 0 (0.0%) | 4 (100.0%) |
| 10 or more Apartments | 0 (0.0%) | 11 (100.0%) |
| Mobile Home / Other | 0 (0.0%) | 0 (0.0%) |
| Total | 388 (78.4%) | 107 (21.6%) |
Housing Structures by Number of Rooms in George
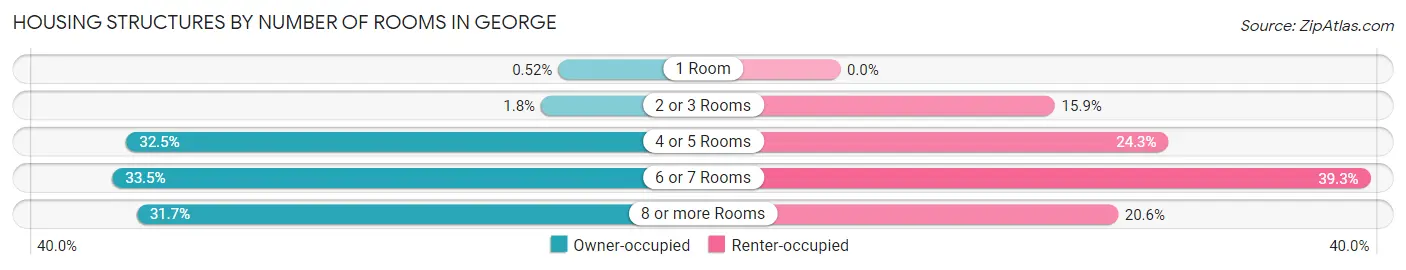
| Number of Rooms | Owner-occupied | Renter-occupied |
| 1 Room | 2 (0.5%) | 0 (0.0%) |
| 2 or 3 Rooms | 7 (1.8%) | 17 (15.9%) |
| 4 or 5 Rooms | 126 (32.5%) | 26 (24.3%) |
| 6 or 7 Rooms | 130 (33.5%) | 42 (39.3%) |
| 8 or more Rooms | 123 (31.7%) | 22 (20.6%) |
| Total | 388 (100.0%) | 107 (100.0%) |
Housing Structure by Heating Type in George
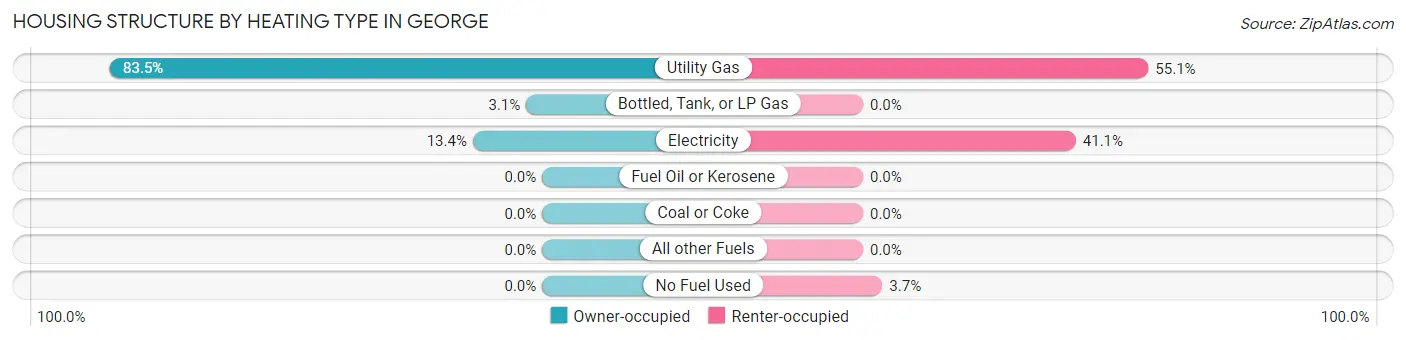
| Heating Type | Owner-occupied | Renter-occupied |
| Utility Gas | 324 (83.5%) | 59 (55.1%) |
| Bottled, Tank, or LP Gas | 12 (3.1%) | 0 (0.0%) |
| Electricity | 52 (13.4%) | 44 (41.1%) |
| Fuel Oil or Kerosene | 0 (0.0%) | 0 (0.0%) |
| Coal or Coke | 0 (0.0%) | 0 (0.0%) |
| All other Fuels | 0 (0.0%) | 0 (0.0%) |
| No Fuel Used | 0 (0.0%) | 4 (3.7%) |
| Total | 388 (100.0%) | 107 (100.0%) |
Household Vehicle Usage in George
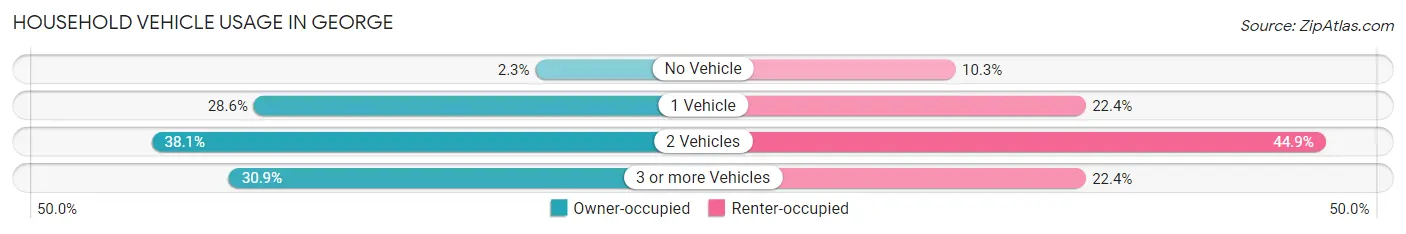
| Vehicles per Household | Owner-occupied | Renter-occupied |
| No Vehicle | 9 (2.3%) | 11 (10.3%) |
| 1 Vehicle | 111 (28.6%) | 24 (22.4%) |
| 2 Vehicles | 148 (38.1%) | 48 (44.9%) |
| 3 or more Vehicles | 120 (30.9%) | 24 (22.4%) |
| Total | 388 (100.0%) | 107 (100.0%) |
Real Estate & Mortgages in George
Real Estate and Mortgage Overview in George
| Characteristic | Without Mortgage | With Mortgage |
| Housing Units | 242 | 146 |
| Median Property Value | $115,100 | $84,400 |
| Median Household Income | $45,625 | $9 |
| Monthly Housing Costs | $452 | $0 |
| Real Estate Taxes | $1,611 | $9 |
Property Value by Mortgage Status in George
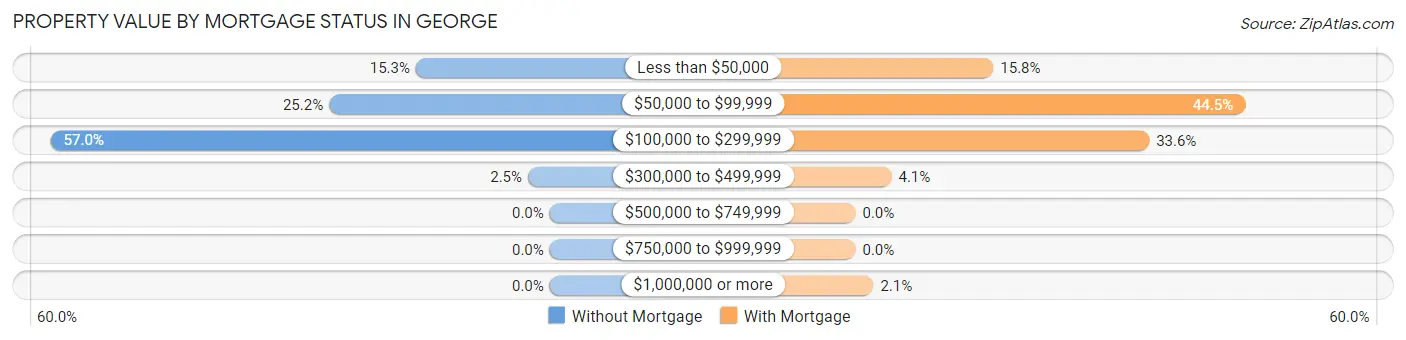
| Property Value | Without Mortgage | With Mortgage |
| Less than $50,000 | 37 (15.3%) | 23 (15.8%) |
| $50,000 to $99,999 | 61 (25.2%) | 65 (44.5%) |
| $100,000 to $299,999 | 138 (57.0%) | 49 (33.6%) |
| $300,000 to $499,999 | 6 (2.5%) | 6 (4.1%) |
| $500,000 to $749,999 | 0 (0.0%) | 0 (0.0%) |
| $750,000 to $999,999 | 0 (0.0%) | 0 (0.0%) |
| $1,000,000 or more | 0 (0.0%) | 3 (2.1%) |
| Total | 242 (100.0%) | 146 (100.0%) |
Household Income by Mortgage Status in George
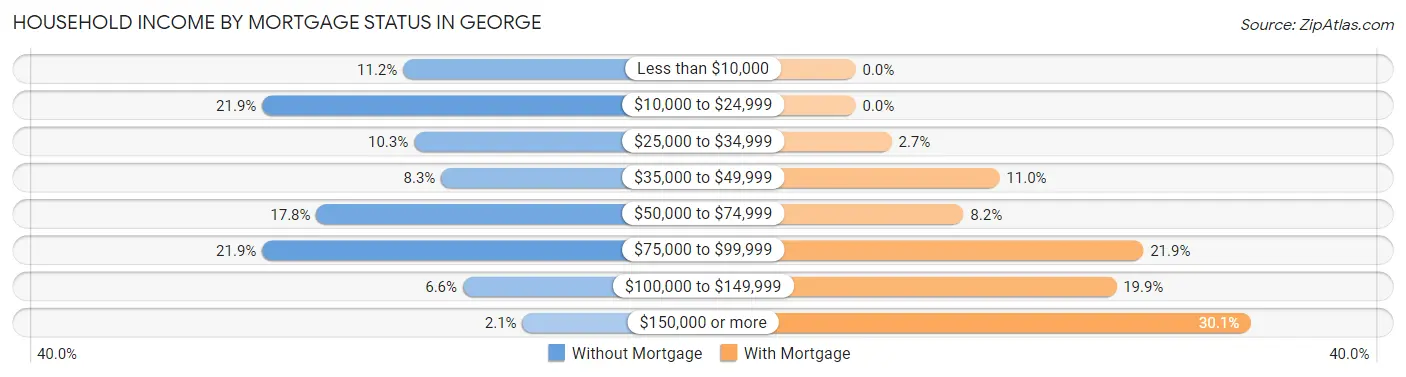
| Household Income | Without Mortgage | With Mortgage |
| Less than $10,000 | 27 (11.2%) | 0 (0.0%) |
| $10,000 to $24,999 | 53 (21.9%) | 0 (0.0%) |
| $25,000 to $34,999 | 25 (10.3%) | 4 (2.7%) |
| $35,000 to $49,999 | 20 (8.3%) | 16 (11.0%) |
| $50,000 to $74,999 | 43 (17.8%) | 12 (8.2%) |
| $75,000 to $99,999 | 53 (21.9%) | 32 (21.9%) |
| $100,000 to $149,999 | 16 (6.6%) | 29 (19.9%) |
| $150,000 or more | 5 (2.1%) | 44 (30.1%) |
| Total | 242 (100.0%) | 146 (100.0%) |
Property Value to Household Income Ratio in George
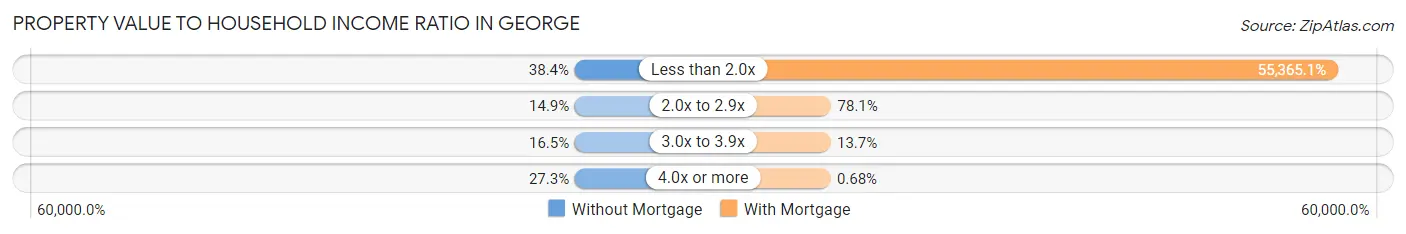
| Value-to-Income Ratio | Without Mortgage | With Mortgage |
| Less than 2.0x | 93 (38.4%) | 80,833 (55,365.1%) |
| 2.0x to 2.9x | 36 (14.9%) | 114 (78.1%) |
| 3.0x to 3.9x | 40 (16.5%) | 20 (13.7%) |
| 4.0x or more | 66 (27.3%) | 1 (0.7%) |
| Total | 242 (100.0%) | 146 (100.0%) |
Real Estate Taxes by Mortgage Status in George
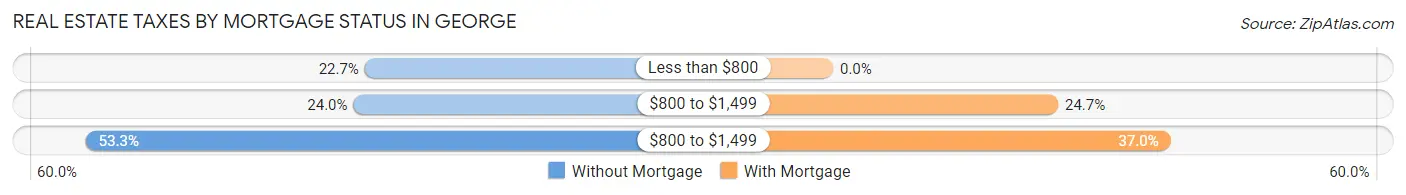
| Property Taxes | Without Mortgage | With Mortgage |
| Less than $800 | 55 (22.7%) | 0 (0.0%) |
| $800 to $1,499 | 58 (24.0%) | 36 (24.7%) |
| $800 to $1,499 | 129 (53.3%) | 54 (37.0%) |
| Total | 242 (100.0%) | 146 (100.0%) |
Health & Disability in George
Health Insurance Coverage by Age in George
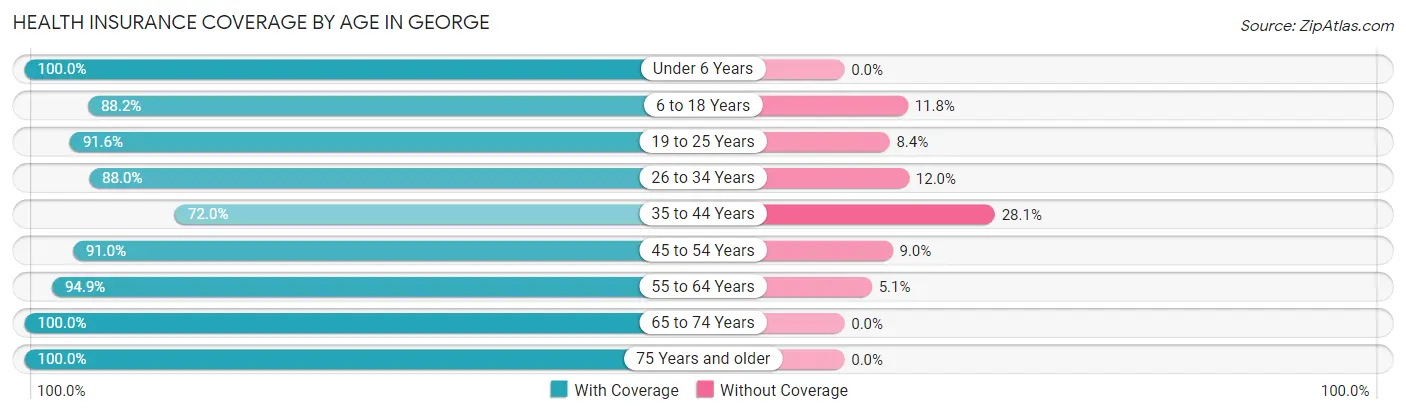
| Age Bracket | With Coverage | Without Coverage |
| Under 6 Years | 56 (100.0%) | 0 (0.0%) |
| 6 to 18 Years | 194 (88.2%) | 26 (11.8%) |
| 19 to 25 Years | 87 (91.6%) | 8 (8.4%) |
| 26 to 34 Years | 95 (88.0%) | 13 (12.0%) |
| 35 to 44 Years | 59 (72.0%) | 23 (28.1%) |
| 45 to 54 Years | 81 (91.0%) | 8 (9.0%) |
| 55 to 64 Years | 130 (94.9%) | 7 (5.1%) |
| 65 to 74 Years | 170 (100.0%) | 0 (0.0%) |
| 75 Years and older | 156 (100.0%) | 0 (0.0%) |
| Total | 1,028 (92.4%) | 85 (7.6%) |
Health Insurance Coverage by Citizenship Status in George
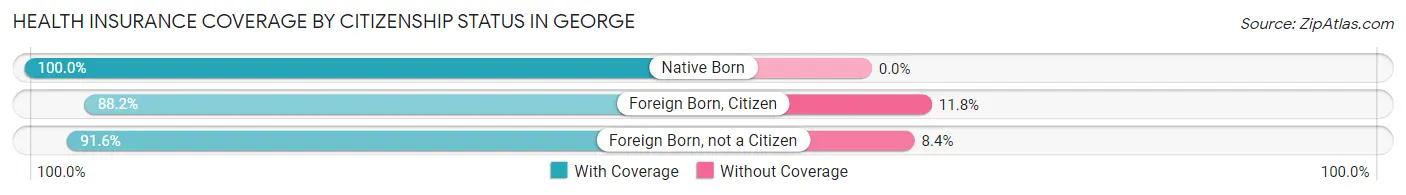
| Citizenship Status | With Coverage | Without Coverage |
| Native Born | 56 (100.0%) | 0 (0.0%) |
| Foreign Born, Citizen | 194 (88.2%) | 26 (11.8%) |
| Foreign Born, not a Citizen | 87 (91.6%) | 8 (8.4%) |
Health Insurance Coverage by Household Income in George
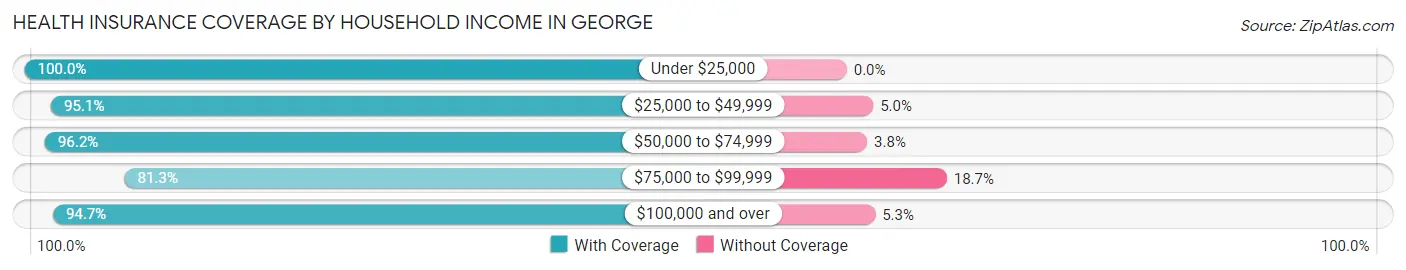
| Household Income | With Coverage | Without Coverage |
| Under $25,000 | 154 (100.0%) | 0 (0.0%) |
| $25,000 to $49,999 | 192 (95.1%) | 10 (5.0%) |
| $50,000 to $74,999 | 202 (96.2%) | 8 (3.8%) |
| $75,000 to $99,999 | 230 (81.3%) | 53 (18.7%) |
| $100,000 and over | 249 (94.7%) | 14 (5.3%) |
Public vs Private Health Insurance Coverage by Age in George
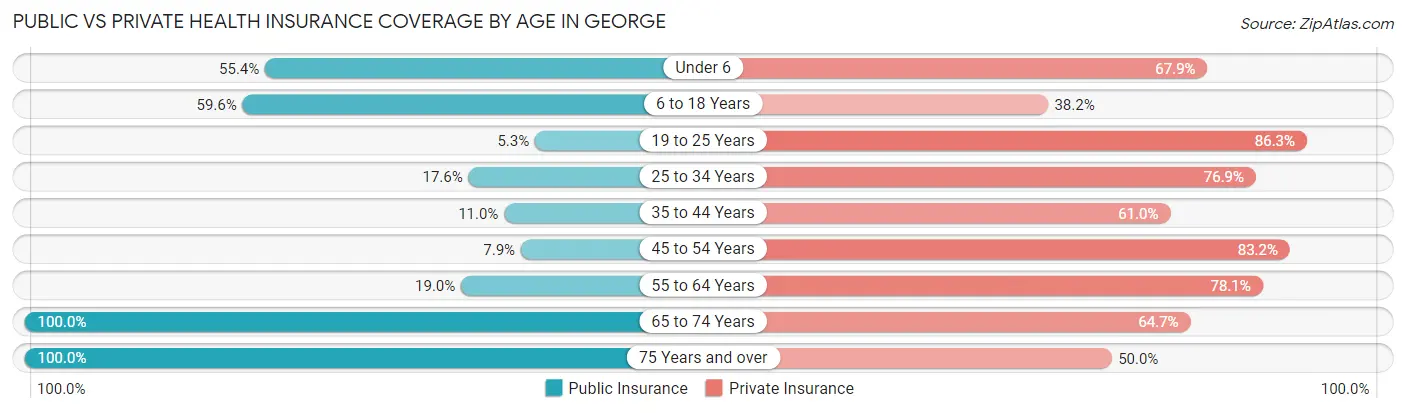
| Age Bracket | Public Insurance | Private Insurance |
| Under 6 | 31 (55.4%) | 38 (67.9%) |
| 6 to 18 Years | 131 (59.6%) | 84 (38.2%) |
| 19 to 25 Years | 5 (5.3%) | 82 (86.3%) |
| 25 to 34 Years | 19 (17.6%) | 83 (76.8%) |
| 35 to 44 Years | 9 (11.0%) | 50 (61.0%) |
| 45 to 54 Years | 7 (7.9%) | 74 (83.2%) |
| 55 to 64 Years | 26 (19.0%) | 107 (78.1%) |
| 65 to 74 Years | 170 (100.0%) | 110 (64.7%) |
| 75 Years and over | 156 (100.0%) | 78 (50.0%) |
| Total | 554 (49.8%) | 706 (63.4%) |
Disability Status by Sex by Age in George
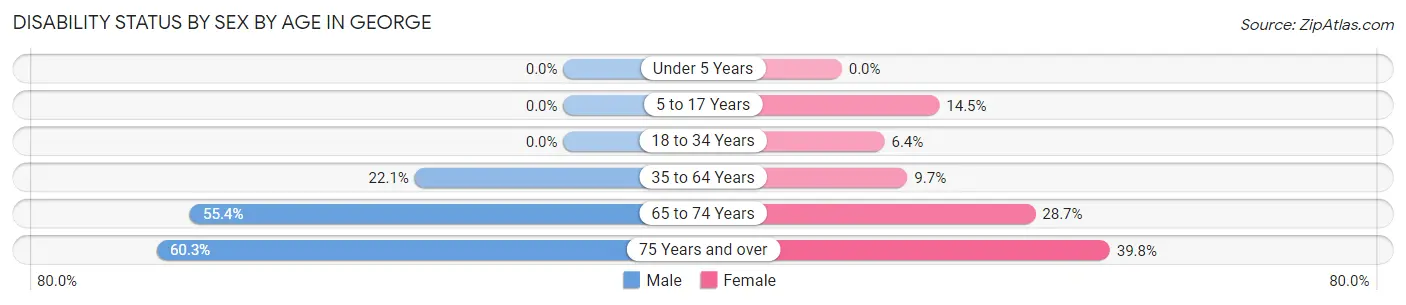
| Age Bracket | Male | Female |
| Under 5 Years | 0 (0.0%) | 0 (0.0%) |
| 5 to 17 Years | 0 (0.0%) | 10 (14.5%) |
| 18 to 34 Years | 0 (0.0%) | 8 (6.4%) |
| 35 to 64 Years | 34 (22.1%) | 15 (9.7%) |
| 65 to 74 Years | 46 (55.4%) | 25 (28.7%) |
| 75 Years and over | 35 (60.3%) | 39 (39.8%) |
Disability Class by Sex by Age in George
Disability Class: Hearing Difficulty
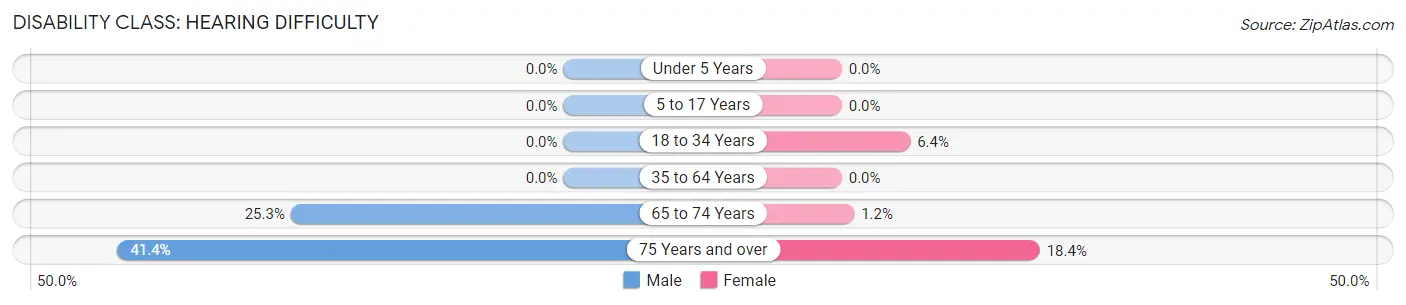
| Age Bracket | Male | Female |
| Under 5 Years | 0 (0.0%) | 0 (0.0%) |
| 5 to 17 Years | 0 (0.0%) | 0 (0.0%) |
| 18 to 34 Years | 0 (0.0%) | 8 (6.4%) |
| 35 to 64 Years | 0 (0.0%) | 0 (0.0%) |
| 65 to 74 Years | 21 (25.3%) | 1 (1.1%) |
| 75 Years and over | 24 (41.4%) | 18 (18.4%) |
Disability Class: Vision Difficulty
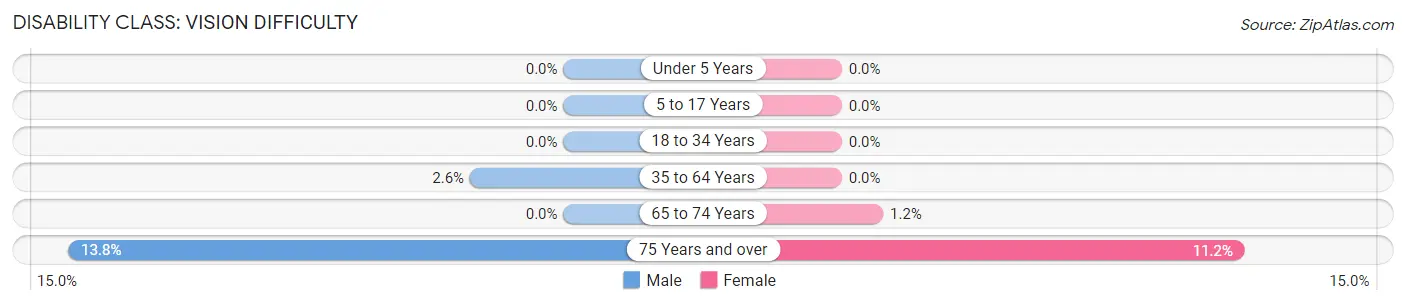
| Age Bracket | Male | Female |
| Under 5 Years | 0 (0.0%) | 0 (0.0%) |
| 5 to 17 Years | 0 (0.0%) | 0 (0.0%) |
| 18 to 34 Years | 0 (0.0%) | 0 (0.0%) |
| 35 to 64 Years | 4 (2.6%) | 0 (0.0%) |
| 65 to 74 Years | 0 (0.0%) | 1 (1.1%) |
| 75 Years and over | 8 (13.8%) | 11 (11.2%) |
Disability Class: Cognitive Difficulty
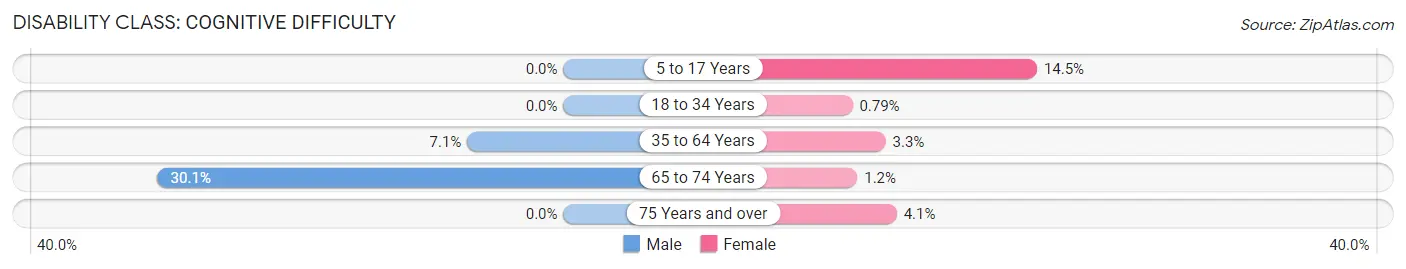
| Age Bracket | Male | Female |
| 5 to 17 Years | 0 (0.0%) | 10 (14.5%) |
| 18 to 34 Years | 0 (0.0%) | 1 (0.8%) |
| 35 to 64 Years | 11 (7.1%) | 5 (3.3%) |
| 65 to 74 Years | 25 (30.1%) | 1 (1.1%) |
| 75 Years and over | 0 (0.0%) | 4 (4.1%) |
Disability Class: Ambulatory Difficulty
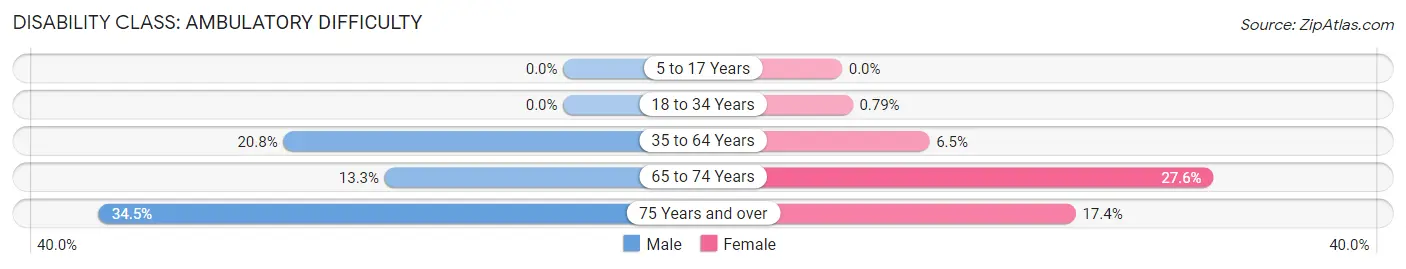
| Age Bracket | Male | Female |
| 5 to 17 Years | 0 (0.0%) | 0 (0.0%) |
| 18 to 34 Years | 0 (0.0%) | 1 (0.8%) |
| 35 to 64 Years | 32 (20.8%) | 10 (6.5%) |
| 65 to 74 Years | 11 (13.3%) | 24 (27.6%) |
| 75 Years and over | 20 (34.5%) | 17 (17.3%) |
Disability Class: Self-Care Difficulty
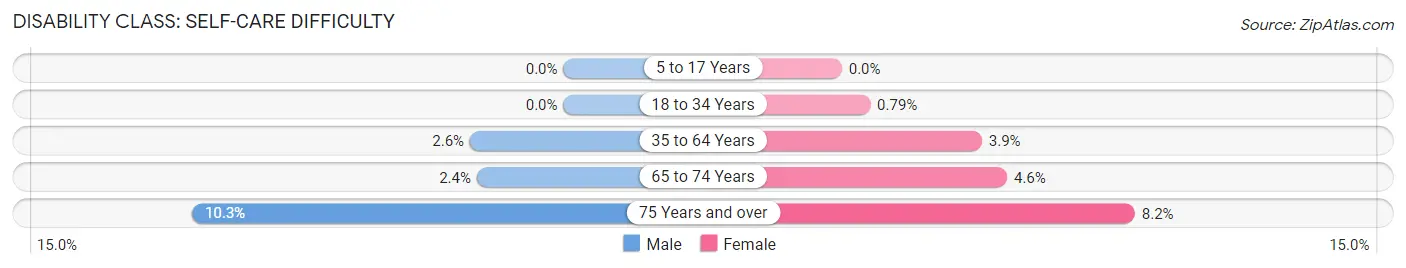
| Age Bracket | Male | Female |
| 5 to 17 Years | 0 (0.0%) | 0 (0.0%) |
| 18 to 34 Years | 0 (0.0%) | 1 (0.8%) |
| 35 to 64 Years | 4 (2.6%) | 6 (3.9%) |
| 65 to 74 Years | 2 (2.4%) | 4 (4.6%) |
| 75 Years and over | 6 (10.3%) | 8 (8.2%) |
Technology Access in George
Computing Device Access in George
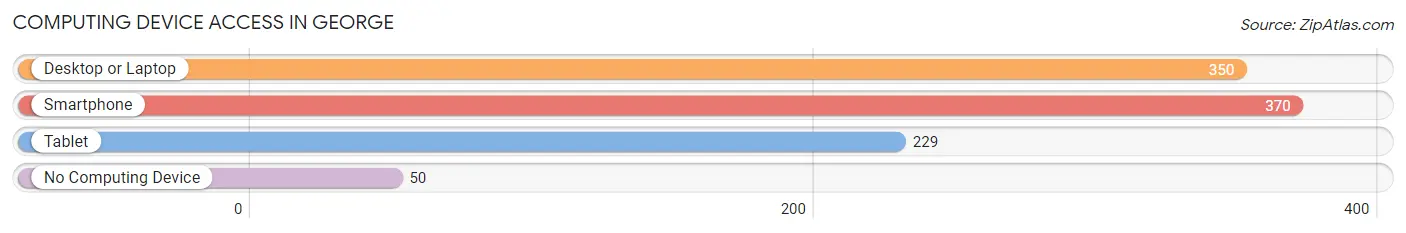
| Device Type | # Households | % Households |
| Desktop or Laptop | 350 | 70.7% |
| Smartphone | 370 | 74.8% |
| Tablet | 229 | 46.3% |
| No Computing Device | 50 | 10.1% |
| Total | 495 | 100.0% |
Internet Access in George
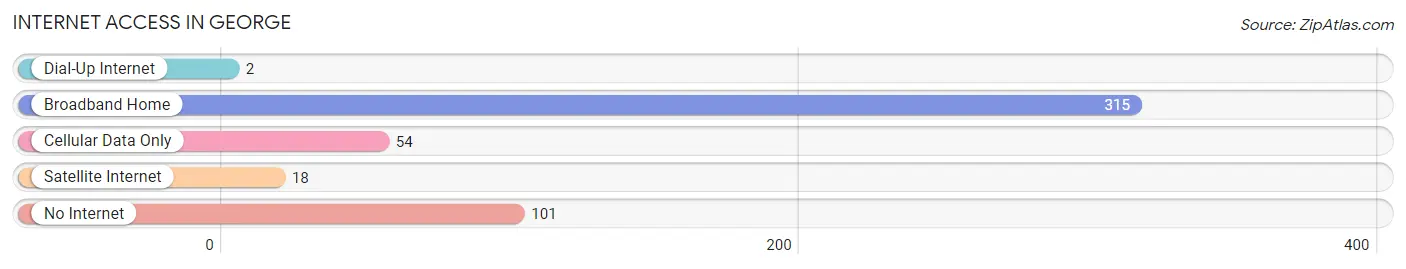
| Internet Type | # Households | % Households |
| Dial-Up Internet | 2 | 0.4% |
| Broadband Home | 315 | 63.6% |
| Cellular Data Only | 54 | 10.9% |
| Satellite Internet | 18 | 3.6% |
| No Internet | 101 | 20.4% |
| Total | 495 | 100.0% |
George Summary
George, Iowa is a small city located in the northwest corner of the state, in the heart of Lyon County. It is situated on the banks of the Little Rock River, and is surrounded by rolling hills and farmland. The city has a population of 1,945 people, according to the 2010 census, and is the county seat of Lyon County.
History
The area that is now George was first settled in 1856 by a group of Dutch immigrants. The town was originally named “Holland”, but was later changed to “George” in honor of George Washington. The town was officially incorporated in 1881.
In the early years, George was a thriving agricultural community, with many of the residents working in the nearby fields and farms. The town was also home to a number of businesses, including a flour mill, a creamery, a lumber yard, and a blacksmith shop.
In the late 19th century, George began to experience a period of growth and prosperity. The town was connected to the rest of the state by the Chicago, Milwaukee, St. Paul and Pacific Railroad, and the population began to grow. By the turn of the century, George had become a bustling small town, with a population of over 1,000 people.
Geography
George is located in the northwest corner of Iowa, in the heart of Lyon County. The city is situated on the banks of the Little Rock River, and is surrounded by rolling hills and farmland. The city has a total area of 1.3 square miles, all of which is land.
The climate in George is typical of the Midwest, with hot summers and cold winters. The average temperature in the summer is around 75 degrees Fahrenheit, and the average temperature in the winter is around 25 degrees Fahrenheit.
Economy
The economy of George is largely based on agriculture. The city is home to a number of farms and ranches, and the surrounding area is known for its production of corn, soybeans, and other crops.
In addition to agriculture, George is also home to a number of small businesses, including restaurants, retail stores, and service providers. The city is also home to a number of manufacturing companies, including a furniture factory and a plastics factory.
Demographics
According to the 2010 census, the population of George was 1,945 people. The racial makeup of the city was 97.2% White, 0.7% African American, 0.3% Native American, 0.2% Asian, 0.1% Pacific Islander, 0.5% from other races, and 1.0% from two or more races. Hispanic or Latino of any race were 1.3% of the population.
The median household income in George was $41,250, and the median family income was $50,000. The per capita income for the city was $20,845. About 8.2% of families and 10.2% of the population were below the poverty line, including 14.2% of those under age 18 and 8.3% of those age 65 or over.
Common Questions
What is the Total Population of George?
Total Population of George is 1,149.
What is the Total Male Population of George?
Total Male Population of George is 560.
What is the Total Female Population of George?
Total Female Population of George is 589.
What is the Ratio of Males per 100 Females in George?
There are 95.08 Males per 100 Females in George.
What is the Ratio of Females per 100 Males in George?
There are 105.18 Females per 100 Males in George.
What is the Median Population Age in George?
Median Population Age in George is 46.5 Years.
What is the Average Family Size in George
Average Family Size in George is 2.8 People.
What is the Average Household Size in George
Average Household Size in George is 2.2 People.
What is Per Capita Income in George?
Per Capita income in George is $28,231.
What is the Median Family Income in George?
Median Family Income in George is $80,417.
What is the Median Household income in George?
Median Household Income in George is $61,302.
What is Income or Wage Gap in George?
Income or Wage Gap in George is 26.9%.
Women in George earn 73.1 cents for every dollar earned by a man.
What is Inequality or Gini Index in George?
Inequality or Gini Index in George is 0.39.
How Large is the Labor Force in George?
There are 541 People in the Labor Forcein in George.
What is the Percentage of People in the Labor Force in George?
58.2% of People are in the Labor Force in George.
What is the Unemployment Rate in George?
Unemployment Rate in George is 4.6%.