Belleair, FL
Belleair Map
Belleair Overview
4,295
TOTAL POPULATION
1,996
MALE POPULATION
2,299
FEMALE POPULATION
86.82
MALES / 100 FEMALES
115.18
FEMALES / 100 MALES
56.1
MEDIAN AGE
2.5
AVG FAMILY SIZE
2.2
AVG HOUSEHOLD SIZE
$100,479
PER CAPITA INCOME
$142,568
AVG FAMILY INCOME
$114,556
AVG HOUSEHOLD INCOME
10.8%
WAGE / INCOME GAP [ % ]
89.2¢/ $1
WAGE / INCOME GAP [ $ ]
0.57
INEQUALITY / GINI INDEX
1,983
LABOR FORCE [ PEOPLE ]
52.4%
PERCENT IN LABOR FORCE
3.2%
UNEMPLOYMENT RATE
Belleair Area Codes
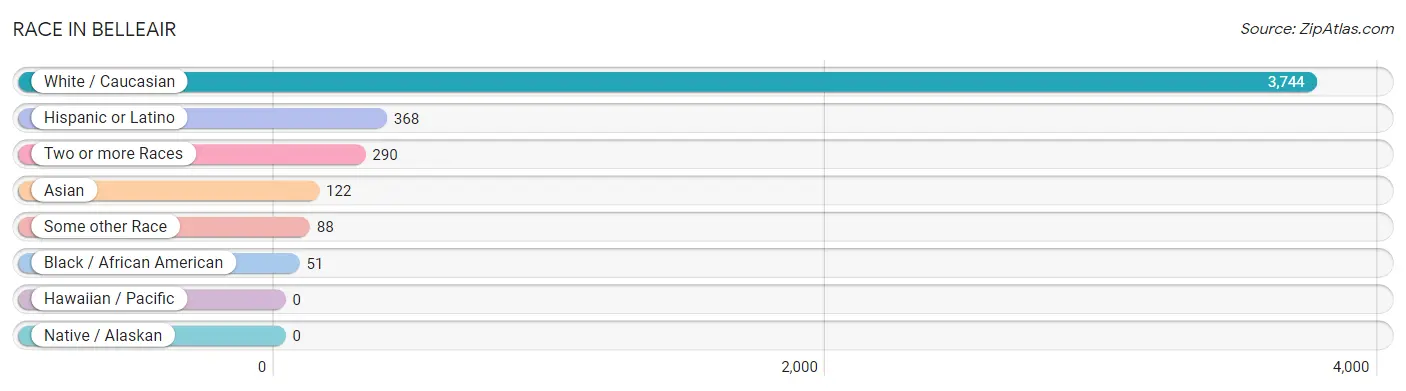
Race in Belleair
The most populous races in Belleair are White / Caucasian (3,744 | 87.2%), Hispanic or Latino (368 | 8.6%), and Two or more Races (290 | 6.8%).
| Race | # Population | % Population |
| Asian | 122 | 2.8% |
| Black / African American | 51 | 1.2% |
| Hawaiian / Pacific | 0 | 0.0% |
| Hispanic or Latino | 368 | 8.6% |
| Native / Alaskan | 0 | 0.0% |
| White / Caucasian | 3,744 | 87.2% |
| Two or more Races | 290 | 6.8% |
| Some other Race | 88 | 2.1% |
| Total | 4,295 | 100.0% |
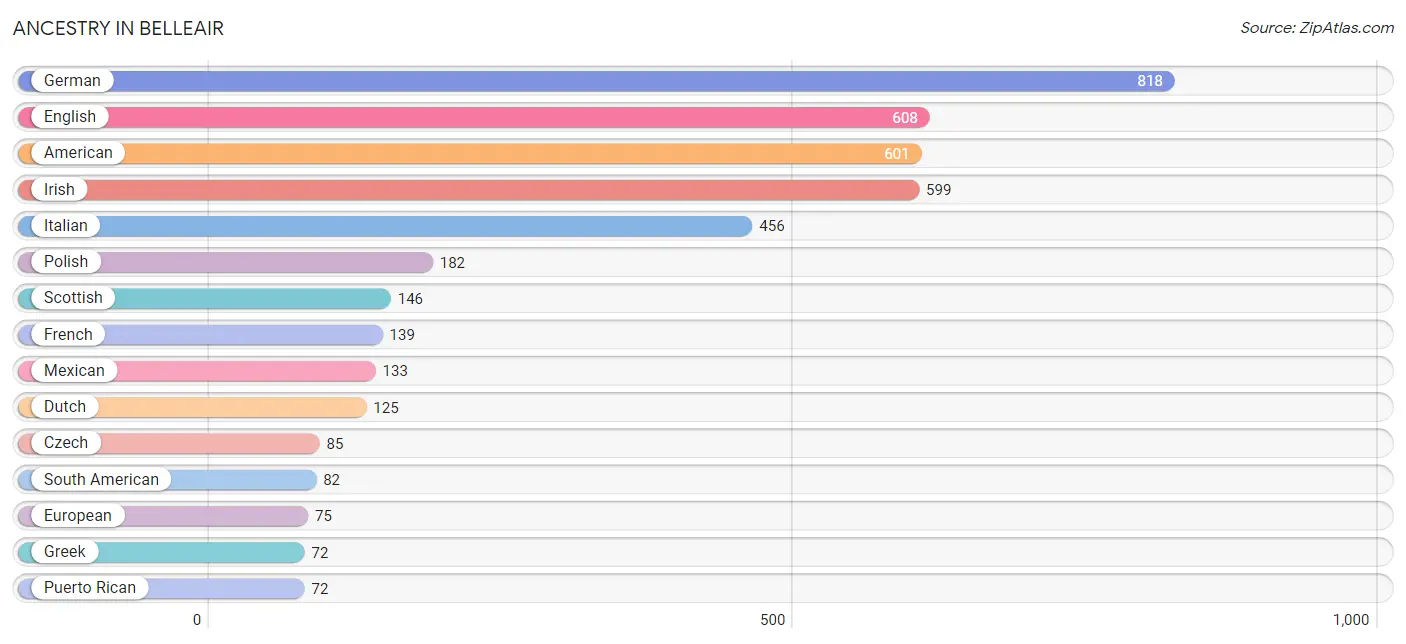
Ancestry in Belleair
The most populous ancestries reported in Belleair are German (818 | 19.1%), English (608 | 14.2%), American (601 | 14.0%), Irish (599 | 14.0%), and Italian (456 | 10.6%), together accounting for 71.8% of all Belleair residents.
| Ancestry | # Population | % Population |
| American | 601 | 14.0% |
| Arab | 56 | 1.3% |
| Austrian | 18 | 0.4% |
| Belgian | 18 | 0.4% |
| British | 58 | 1.3% |
| Burmese | 43 | 1.0% |
| Canadian | 7 | 0.2% |
| Central American | 52 | 1.2% |
| Cherokee | 20 | 0.5% |
| Croatian | 8 | 0.2% |
| Cuban | 29 | 0.7% |
| Czech | 85 | 2.0% |
| Czechoslovakian | 8 | 0.2% |
| Danish | 4 | 0.1% |
| Dutch | 125 | 2.9% |
| Eastern European | 10 | 0.2% |
| English | 608 | 14.2% |
| European | 75 | 1.8% |
| French | 139 | 3.2% |
| French Canadian | 53 | 1.2% |
| German | 818 | 19.1% |
| Greek | 72 | 1.7% |
| Guatemalan | 21 | 0.5% |
| Hungarian | 8 | 0.2% |
| Indian (Asian) | 6 | 0.1% |
| Irish | 599 | 14.0% |
| Italian | 456 | 10.6% |
| Korean | 24 | 0.6% |
| Lebanese | 44 | 1.0% |
| Mexican | 133 | 3.1% |
| Nicaraguan | 31 | 0.7% |
| Norwegian | 23 | 0.5% |
| Pennsylvania German | 8 | 0.2% |
| Peruvian | 33 | 0.8% |
| Polish | 182 | 4.2% |
| Portuguese | 26 | 0.6% |
| Puerto Rican | 72 | 1.7% |
| Romanian | 9 | 0.2% |
| Russian | 16 | 0.4% |
| Scandinavian | 10 | 0.2% |
| Scotch-Irish | 43 | 1.0% |
| Scottish | 146 | 3.4% |
| South American | 82 | 1.9% |
| South American Indian | 10 | 0.2% |
| Sri Lankan | 35 | 0.8% |
| Swedish | 29 | 0.7% |
| Syrian | 12 | 0.3% |
| Thai | 22 | 0.5% |
| Venezuelan | 49 | 1.1% |
| Welsh | 66 | 1.5% | View All 50 Rows |
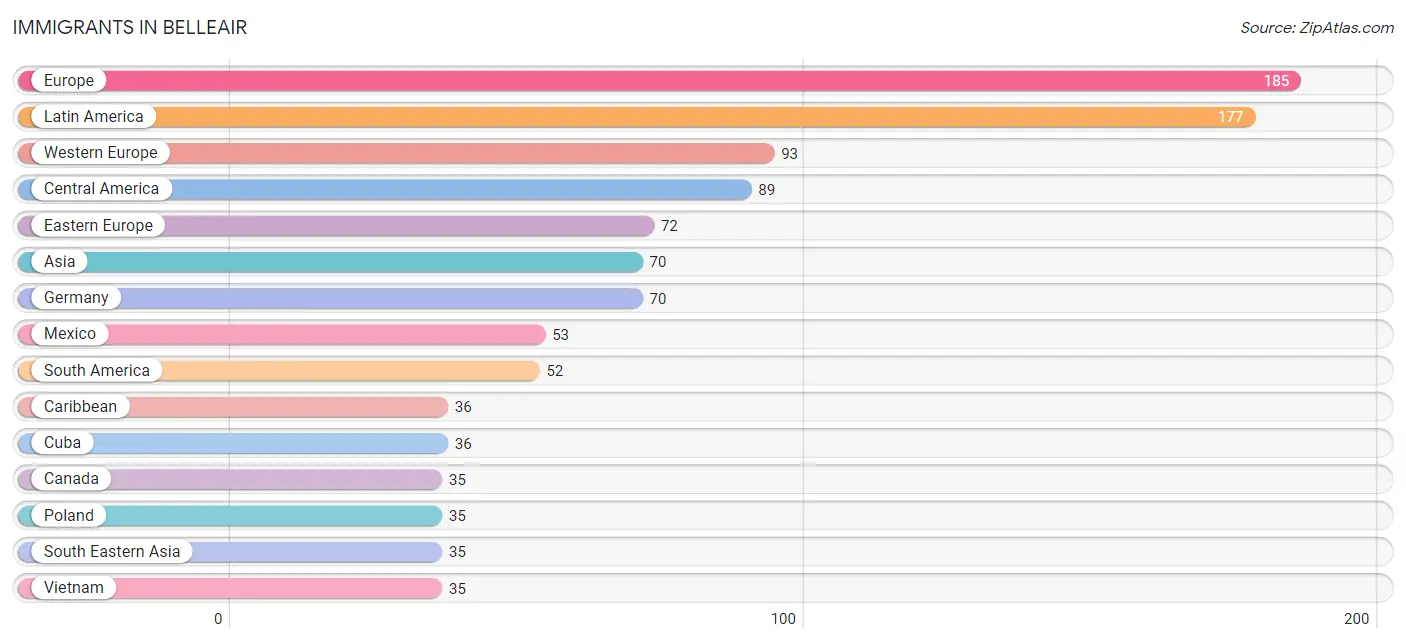
Immigrants in Belleair
The most numerous immigrant groups reported in Belleair came from Europe (185 | 4.3%), Latin America (177 | 4.1%), Western Europe (93 | 2.2%), Central America (89 | 2.1%), and Eastern Europe (72 | 1.7%), together accounting for 14.4% of all Belleair residents.
| Immigration Origin | # Population | % Population |
| Asia | 70 | 1.6% |
| Belgium | 8 | 0.2% |
| Canada | 35 | 0.8% |
| Caribbean | 36 | 0.8% |
| Central America | 89 | 2.1% |
| China | 6 | 0.1% |
| Colombia | 11 | 0.3% |
| Cuba | 36 | 0.8% |
| Czechoslovakia | 9 | 0.2% |
| Eastern Asia | 6 | 0.1% |
| Eastern Europe | 72 | 1.7% |
| El Salvador | 21 | 0.5% |
| England | 11 | 0.3% |
| Europe | 185 | 4.3% |
| France | 7 | 0.2% |
| Germany | 70 | 1.6% |
| India | 5 | 0.1% |
| Latin America | 177 | 4.1% |
| Lebanon | 24 | 0.6% |
| Mexico | 53 | 1.2% |
| Netherlands | 8 | 0.2% |
| Nicaragua | 15 | 0.4% |
| Northern Europe | 11 | 0.3% |
| Peru | 13 | 0.3% |
| Poland | 35 | 0.8% |
| Portugal | 9 | 0.2% |
| Russia | 28 | 0.6% |
| South America | 52 | 1.2% |
| South Central Asia | 5 | 0.1% |
| South Eastern Asia | 35 | 0.8% |
| Southern Europe | 9 | 0.2% |
| Venezuela | 28 | 0.6% |
| Vietnam | 35 | 0.8% |
| Western Asia | 24 | 0.6% |
| Western Europe | 93 | 2.2% | View All 35 Rows |
Sex and Age in Belleair
Sex and Age in Belleair
The most populous age groups in Belleair are 70 to 74 Years (253 | 12.7%) for men and 45 to 49 Years (230 | 10.0%) for women.

| Age Bracket | Male | Female |
| Under 5 Years | 99 (5.0%) | 143 (6.2%) |
| 5 to 9 Years | 42 (2.1%) | 53 (2.3%) |
| 10 to 14 Years | 96 (4.8%) | 68 (3.0%) |
| 15 to 19 Years | 39 (1.9%) | 81 (3.5%) |
| 20 to 24 Years | 34 (1.7%) | 47 (2.0%) |
| 25 to 29 Years | 75 (3.8%) | 152 (6.6%) |
| 30 to 34 Years | 187 (9.4%) | 95 (4.1%) |
| 35 to 39 Years | 85 (4.3%) | 128 (5.6%) |
| 40 to 44 Years | 86 (4.3%) | 75 (3.3%) |
| 45 to 49 Years | 98 (4.9%) | 230 (10.0%) |
| 50 to 54 Years | 66 (3.3%) | 97 (4.2%) |
| 55 to 59 Years | 124 (6.2%) | 137 (6.0%) |
| 60 to 64 Years | 239 (12.0%) | 210 (9.1%) |
| 65 to 69 Years | 140 (7.0%) | 225 (9.8%) |
| 70 to 74 Years | 253 (12.7%) | 211 (9.2%) |
| 75 to 79 Years | 182 (9.1%) | 125 (5.4%) |
| 80 to 84 Years | 106 (5.3%) | 175 (7.6%) |
| 85 Years and over | 45 (2.2%) | 47 (2.0%) |
| Total | 1,996 (100.0%) | 2,299 (100.0%) |
Families and Households in Belleair
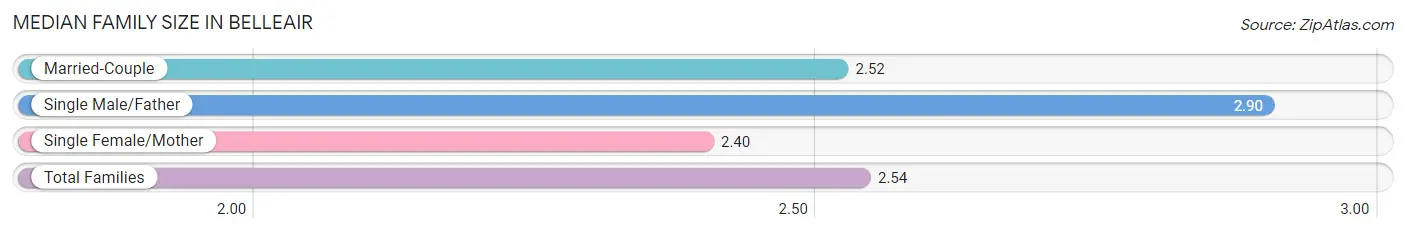
Median Family Size in Belleair
The median family size in Belleair is 2.54 persons per family, with single male/father families (97 | 7.1%) accounting for the largest median family size of 2.9 persons per family. On the other hand, single female/mother families (98 | 7.2%) represent the smallest median family size with 2.40 persons per family.
| Family Type | # Families | Family Size |
| Married-Couple | 1,161 (85.6%) | 2.52 |
| Single Male/Father | 97 (7.1%) | 2.90 |
| Single Female/Mother | 98 (7.2%) | 2.40 |
| Total Families | 1,356 (100.0%) | 2.54 |
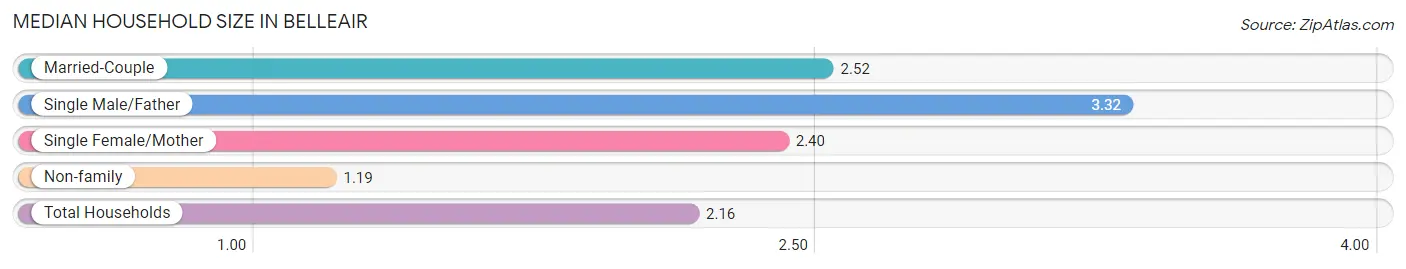
Median Household Size in Belleair
The median household size in Belleair is 2.16 persons per household, with single male/father households (97 | 5.0%) accounting for the largest median household size of 3.32 persons per household. non-family households (575 | 29.8%) represent the smallest median household size with 1.19 persons per household.
| Household Type | # Households | Household Size |
| Married-Couple | 1,161 (60.1%) | 2.52 |
| Single Male/Father | 97 (5.0%) | 3.32 |
| Single Female/Mother | 98 (5.1%) | 2.40 |
| Non-family | 575 (29.8%) | 1.19 |
| Total Households | 1,931 (100.0%) | 2.16 |
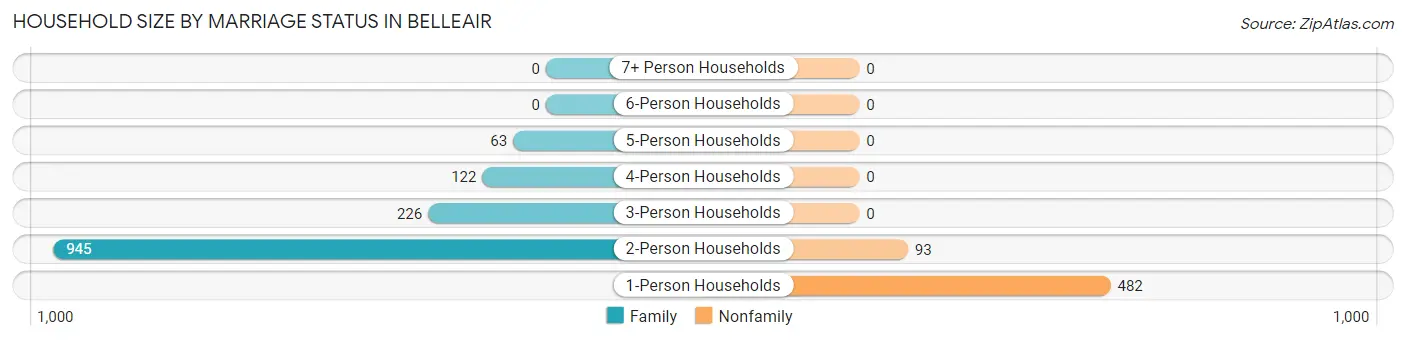
Household Size by Marriage Status in Belleair
Out of a total of 1,931 households in Belleair, 1,356 (70.2%) are family households, while 575 (29.8%) are nonfamily households. The most numerous type of family households are 2-person households, comprising 945, and the most common type of nonfamily households are 1-person households, comprising 482.
| Household Size | Family Households | Nonfamily Households |
| 1-Person Households | - | 482 (25.0%) |
| 2-Person Households | 945 (48.9%) | 93 (4.8%) |
| 3-Person Households | 226 (11.7%) | 0 (0.0%) |
| 4-Person Households | 122 (6.3%) | 0 (0.0%) |
| 5-Person Households | 63 (3.3%) | 0 (0.0%) |
| 6-Person Households | 0 (0.0%) | 0 (0.0%) |
| 7+ Person Households | 0 (0.0%) | 0 (0.0%) |
| Total | 1,356 (70.2%) | 575 (29.8%) |
Female Fertility in Belleair
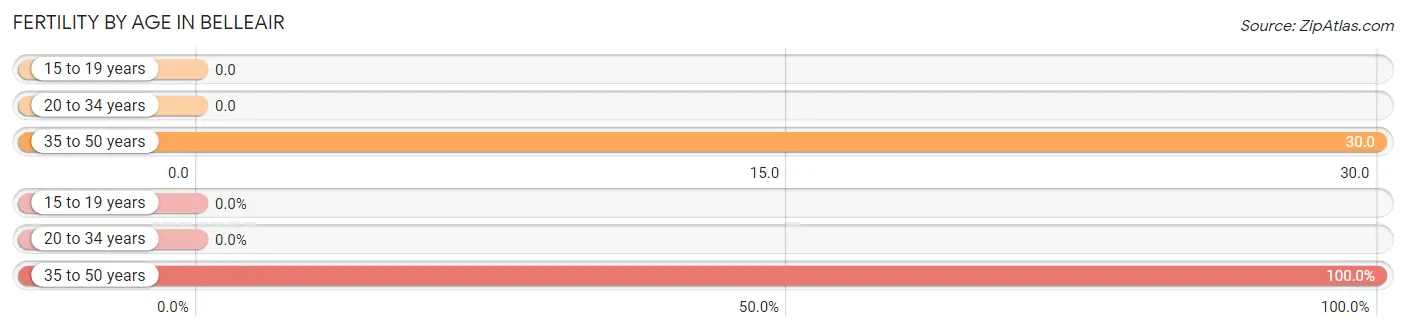
Fertility by Age in Belleair
Average fertility rate in Belleair is 17.0 births per 1,000 women. Women in the age bracket of 35 to 50 years have the highest fertility rate with 30.0 births per 1,000 women. Women in the age bracket of 35 to 50 years acount for 100.0% of all women with births.
| Age Bracket | Women with Births | Births / 1,000 Women |
| 15 to 19 years | 0 (0.0%) | 0.0 |
| 20 to 34 years | 0 (0.0%) | 0.0 |
| 35 to 50 years | 14 (100.0%) | 30.0 |
| Total | 14 (100.0%) | 17.0 |
Fertility by Age by Marriage Status in Belleair
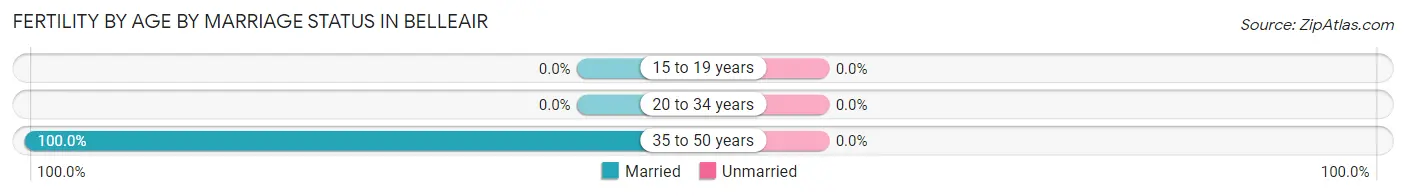
| Age Bracket | Married | Unmarried |
| 15 to 19 years | 0 (0.0%) | 0 (0.0%) |
| 20 to 34 years | 0 (0.0%) | 0 (0.0%) |
| 35 to 50 years | 14 (100.0%) | 0 (0.0%) |
| Total | 14 (100.0%) | 0 (0.0%) |
Fertility by Education in Belleair
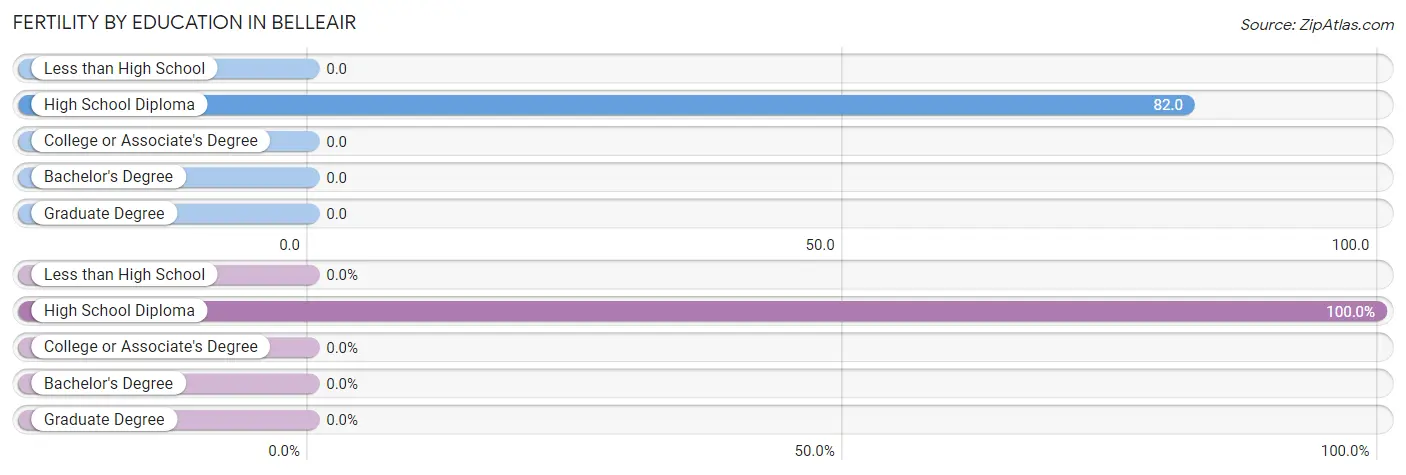
| Educational Attainment | Women with Births | Births / 1,000 Women |
| Less than High School | 0 (0.0%) | 0.0 |
| High School Diploma | 14 (100.0%) | 82.0 |
| College or Associate's Degree | 0 (0.0%) | 0.0 |
| Bachelor's Degree | 0 (0.0%) | 0.0 |
| Graduate Degree | 0 (0.0%) | 0.0 |
| Total | 14 (100.0%) | 17.0 |
Fertility by Education by Marriage Status in Belleair
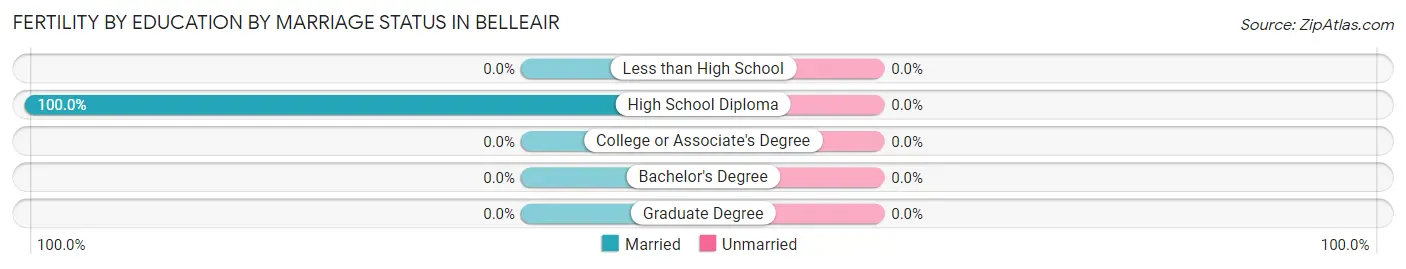
| Educational Attainment | Married | Unmarried |
| Less than High School | 0 (0.0%) | 0 (0.0%) |
| High School Diploma | 14 (100.0%) | 0 (0.0%) |
| College or Associate's Degree | 0 (0.0%) | 0 (0.0%) |
| Bachelor's Degree | 0 (0.0%) | 0 (0.0%) |
| Graduate Degree | 0 (0.0%) | 0 (0.0%) |
| Total | 14 (100.0%) | 0 (0.0%) |
Income in Belleair
Income Overview in Belleair
Per Capita Income in Belleair is $100,479, while median incomes of families and households are $142,568 and $114,556 respectively.
| Characteristic | Number | Measure |
| Per Capita Income | 4,295 | $100,479 |
| Median Family Income | 1,356 | $142,568 |
| Mean Family Income | 1,356 | $248,008 |
| Median Household Income | 1,931 | $114,556 |
| Mean Household Income | 1,931 | $220,947 |
| Income Deficit | 1,356 | $0 |
| Wage / Income Gap (%) | 4,295 | 10.79% |
| Wage / Income Gap ($) | 4,295 | 89.21¢ per $1 |
| Gini / Inequality Index | 4,295 | 0.57 |
Earnings by Sex in Belleair
Average Earnings in Belleair are $73,981, $74,904 for men and $66,824 for women, a difference of 10.8%.
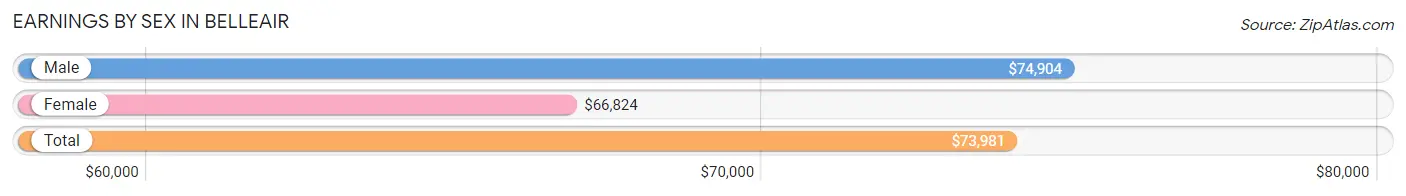
| Sex | Number | Average Earnings |
| Male | 1,126 (53.7%) | $74,904 |
| Female | 972 (46.3%) | $66,824 |
| Total | 2,098 (100.0%) | $73,981 |
Earnings by Sex by Income Bracket in Belleair
The most common earnings brackets in Belleair are $100,000+ for men (477 | 42.4%) and $100,000+ for women (330 | 34.0%).
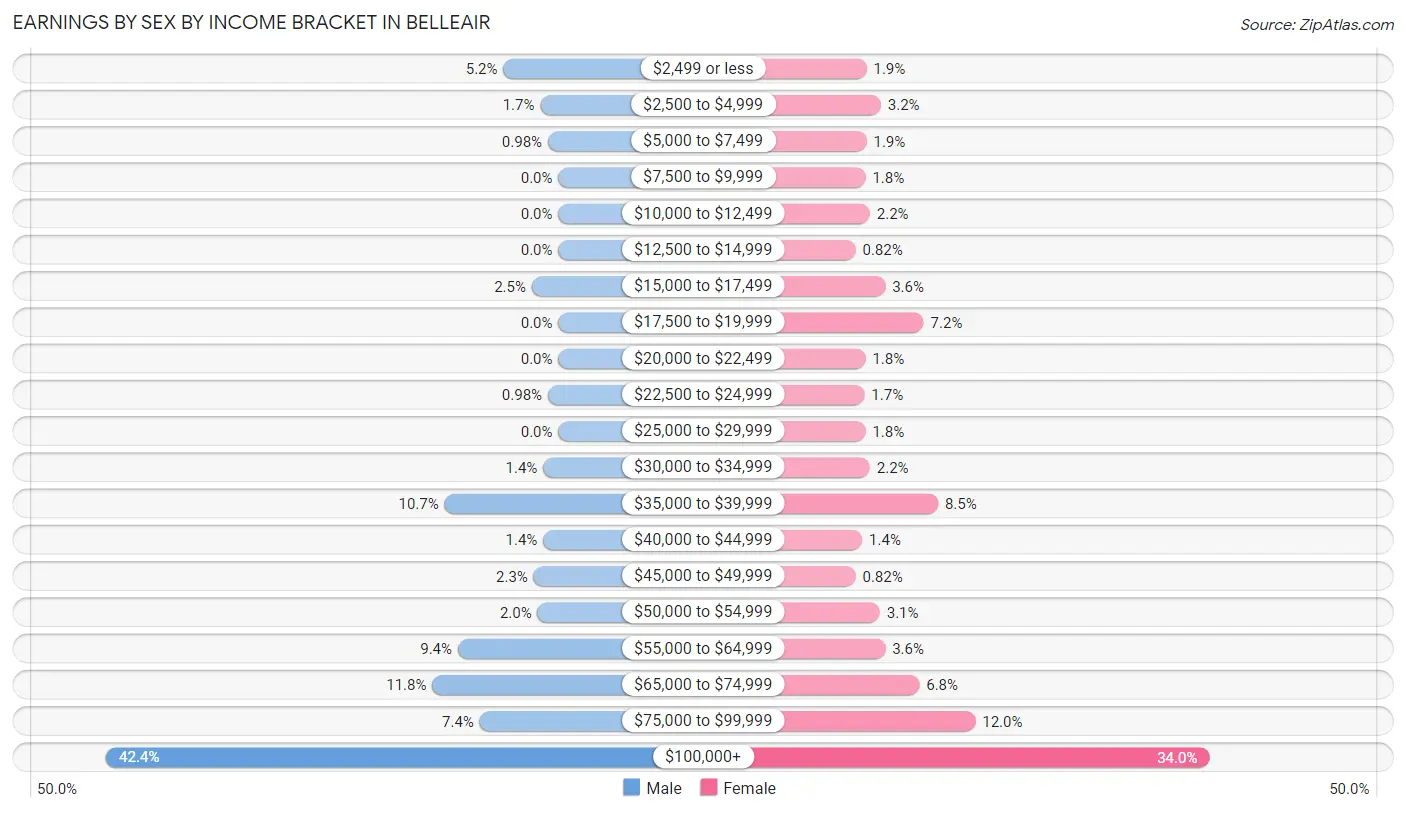
| Income | Male | Female |
| $2,499 or less | 58 (5.1%) | 18 (1.8%) |
| $2,500 to $4,999 | 19 (1.7%) | 31 (3.2%) |
| $5,000 to $7,499 | 11 (1.0%) | 18 (1.8%) |
| $7,500 to $9,999 | 0 (0.0%) | 17 (1.8%) |
| $10,000 to $12,499 | 0 (0.0%) | 21 (2.2%) |
| $12,500 to $14,999 | 0 (0.0%) | 8 (0.8%) |
| $15,000 to $17,499 | 28 (2.5%) | 35 (3.6%) |
| $17,500 to $19,999 | 0 (0.0%) | 70 (7.2%) |
| $20,000 to $22,499 | 0 (0.0%) | 17 (1.8%) |
| $22,500 to $24,999 | 11 (1.0%) | 16 (1.7%) |
| $25,000 to $29,999 | 0 (0.0%) | 17 (1.8%) |
| $30,000 to $34,999 | 16 (1.4%) | 21 (2.2%) |
| $35,000 to $39,999 | 120 (10.7%) | 83 (8.5%) |
| $40,000 to $44,999 | 16 (1.4%) | 14 (1.4%) |
| $45,000 to $49,999 | 26 (2.3%) | 8 (0.8%) |
| $50,000 to $54,999 | 22 (1.9%) | 30 (3.1%) |
| $55,000 to $64,999 | 106 (9.4%) | 35 (3.6%) |
| $65,000 to $74,999 | 133 (11.8%) | 66 (6.8%) |
| $75,000 to $99,999 | 83 (7.4%) | 117 (12.0%) |
| $100,000+ | 477 (42.4%) | 330 (34.0%) |
| Total | 1,126 (100.0%) | 972 (100.0%) |
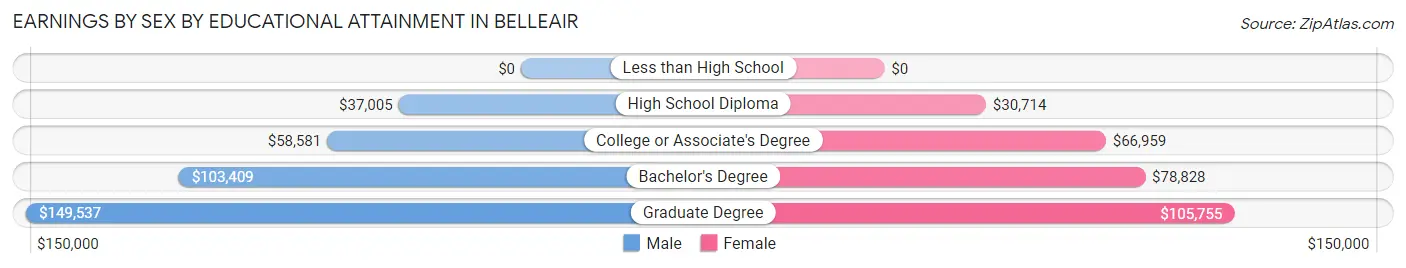
Earnings by Sex by Educational Attainment in Belleair
Average earnings in Belleair are $78,006 for men and $74,150 for women, a difference of 4.9%. Men with an educational attainment of graduate degree enjoy the highest average annual earnings of $149,537, while those with high school diploma education earn the least with $37,005. Women with an educational attainment of graduate degree earn the most with the average annual earnings of $105,755, while those with high school diploma education have the smallest earnings of $30,714.
| Educational Attainment | Male Income | Female Income |
| Less than High School | - | - |
| High School Diploma | $37,005 | $30,714 |
| College or Associate's Degree | $58,581 | $66,959 |
| Bachelor's Degree | $103,409 | $78,828 |
| Graduate Degree | $149,537 | $105,755 |
| Total | $78,006 | $74,150 |
Family Income in Belleair
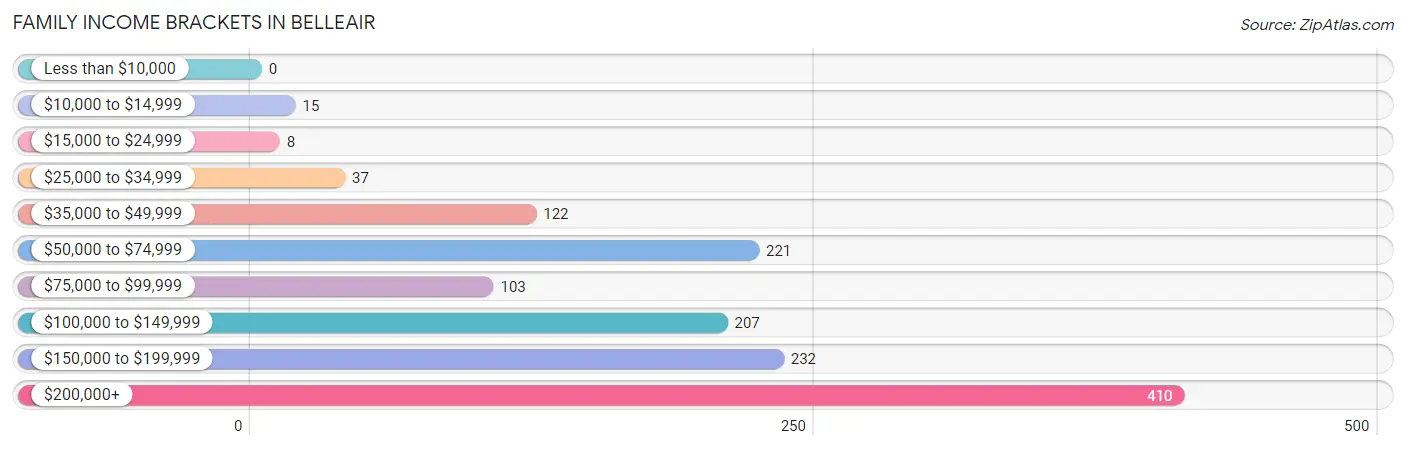
Family Income Brackets in Belleair
According to the Belleair family income data, there are 410 families falling into the $200,000+ income range, which is the most common income bracket and makes up 30.2% of all families.
| Income Bracket | # Families | % Families |
| Less than $10,000 | 0 | 0.0% |
| $10,000 to $14,999 | 15 | 1.1% |
| $15,000 to $24,999 | 8 | 0.6% |
| $25,000 to $34,999 | 37 | 2.7% |
| $35,000 to $49,999 | 122 | 9.0% |
| $50,000 to $74,999 | 221 | 16.3% |
| $75,000 to $99,999 | 103 | 7.6% |
| $100,000 to $149,999 | 207 | 15.3% |
| $150,000 to $199,999 | 232 | 17.1% |
| $200,000+ | 410 | 30.2% |
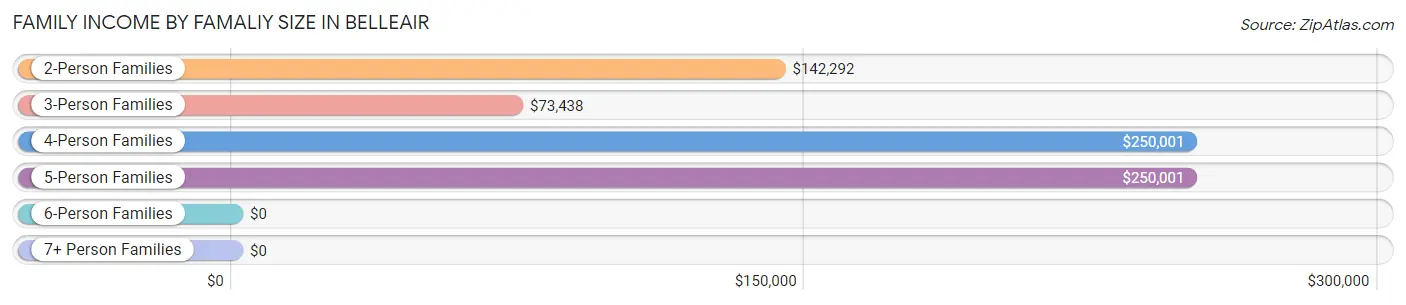
Family Income by Famaliy Size in Belleair
4-person families (85 | 6.3%) account for the highest median family income in Belleair with $250,001 per family, while 2-person families (945 | 69.7%) have the highest median income of $71,146 per family member.
| Income Bracket | # Families | Median Income |
| 2-Person Families | 945 (69.7%) | $142,292 |
| 3-Person Families | 263 (19.4%) | $73,438 |
| 4-Person Families | 85 (6.3%) | $250,001 |
| 5-Person Families | 63 (4.6%) | $250,001 |
| 6-Person Families | 0 (0.0%) | $0 |
| 7+ Person Families | 0 (0.0%) | $0 |
| Total | 1,356 (100.0%) | $142,568 |
Family Income by Number of Earners in Belleair
The median family income in Belleair is $142,568, with families comprising 1 earner (432) having the highest median family income of $185,189, while families with no earners (319) have the lowest median family income of $72,279, accounting for 31.9% and 23.5% of families, respectively.

| Number of Earners | # Families | Median Income |
| No Earners | 319 (23.5%) | $72,279 |
| 1 Earner | 432 (31.9%) | $185,189 |
| 2 Earners | 573 (42.3%) | $156,504 |
| 3+ Earners | 32 (2.4%) | $141,250 |
| Total | 1,356 (100.0%) | $142,568 |
Household Income in Belleair
Household Income Brackets in Belleair
With 514 households falling in the category, the $200,000+ income range is the most frequent in Belleair, accounting for 26.6% of all households. In contrast, only 29 households (1.5%) fall into the less than $10,000 income bracket, making it the least populous group.
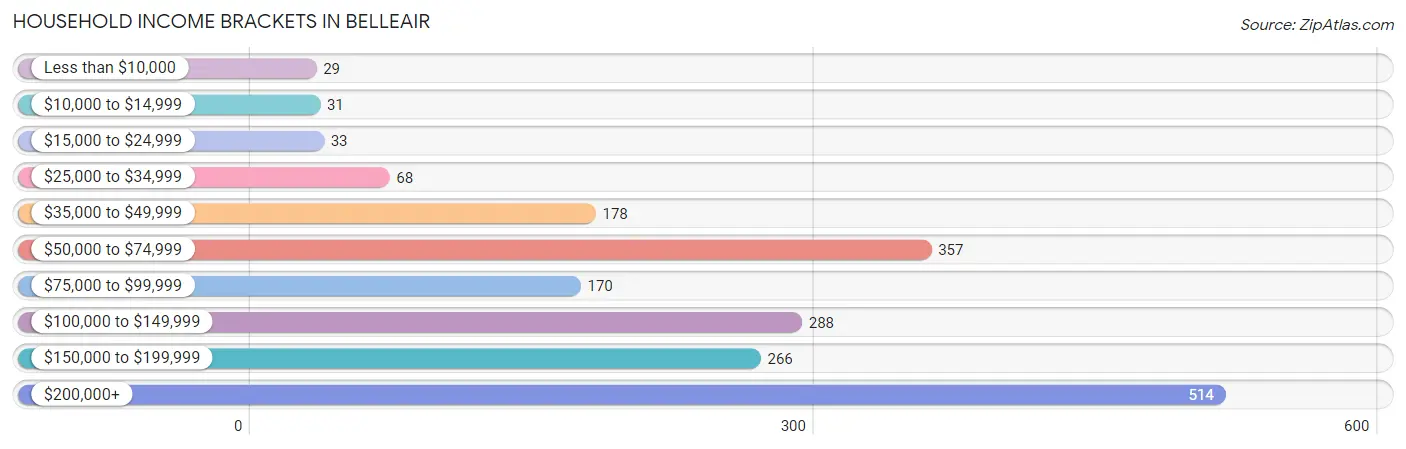
| Income Bracket | # Households | % Households |
| Less than $10,000 | 29 | 1.5% |
| $10,000 to $14,999 | 31 | 1.6% |
| $15,000 to $24,999 | 33 | 1.7% |
| $25,000 to $34,999 | 68 | 3.5% |
| $35,000 to $49,999 | 178 | 9.2% |
| $50,000 to $74,999 | 357 | 18.5% |
| $75,000 to $99,999 | 170 | 8.8% |
| $100,000 to $149,999 | 288 | 14.9% |
| $150,000 to $199,999 | 266 | 13.8% |
| $200,000+ | 514 | 26.6% |
Household Income by Householder Age in Belleair
The median household income in Belleair is $114,556, with the highest median household income of $155,372 found in the 45 to 64 years age bracket for the primary householder. A total of 658 households (34.1%) fall into this category. Meanwhile, the 15 to 24 years age bracket for the primary householder has the lowest median household income of $0, with 15 households (0.8%) in this group.
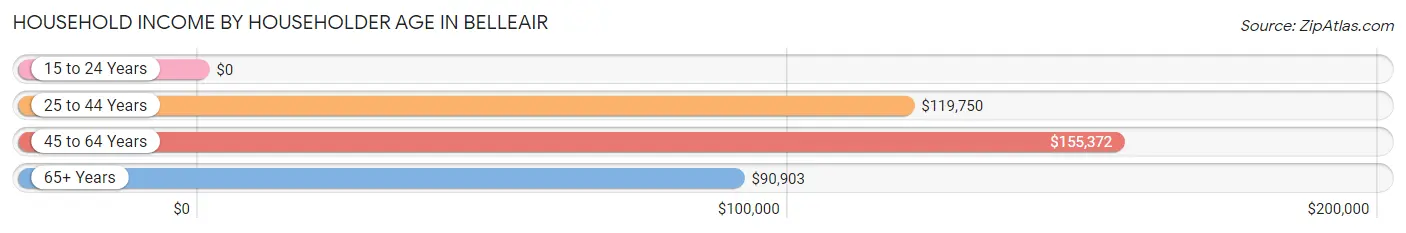
| Income Bracket | # Households | Median Income |
| 15 to 24 Years | 15 (0.8%) | $0 |
| 25 to 44 Years | 449 (23.3%) | $119,750 |
| 45 to 64 Years | 658 (34.1%) | $155,372 |
| 65+ Years | 809 (41.9%) | $90,903 |
| Total | 1,931 (100.0%) | $114,556 |
Poverty in Belleair
Income Below Poverty by Sex and Age in Belleair
With 3.5% poverty level for males and 6.3% for females among the residents of Belleair, 25 to 34 year old males and under 5 year old females are the most vulnerable to poverty, with 23 males (8.8%) and 30 females (21.0%) in their respective age groups living below the poverty level.
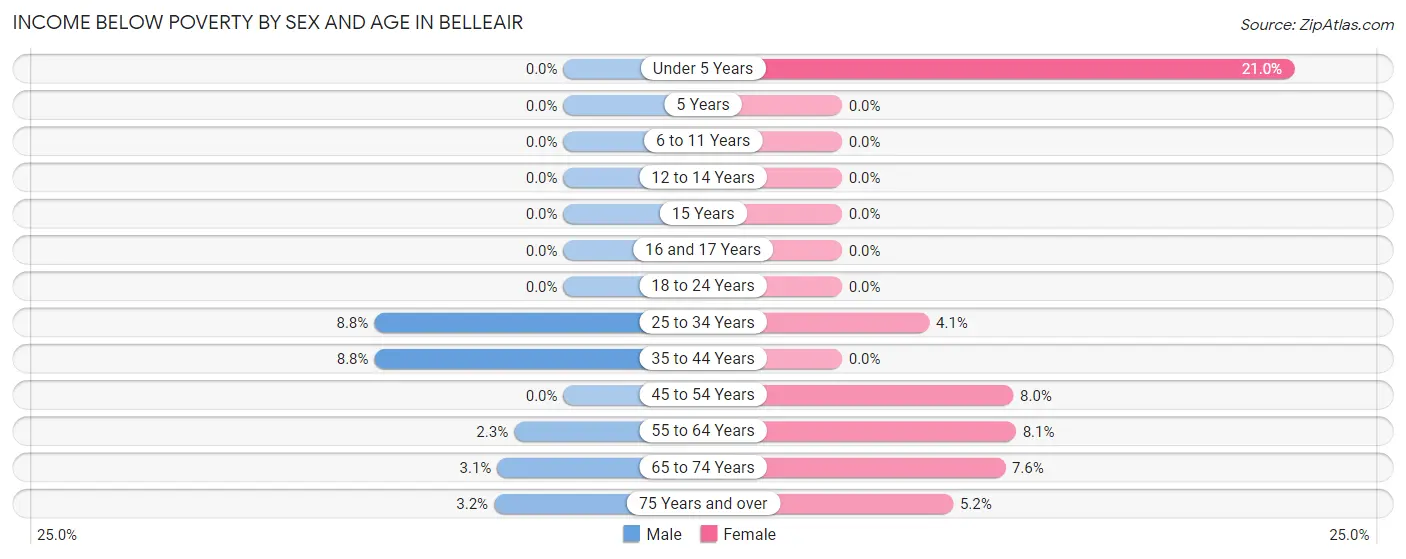
| Age Bracket | Male | Female |
| Under 5 Years | 0 (0.0%) | 30 (21.0%) |
| 5 Years | 0 (0.0%) | 0 (0.0%) |
| 6 to 11 Years | 0 (0.0%) | 0 (0.0%) |
| 12 to 14 Years | 0 (0.0%) | 0 (0.0%) |
| 15 Years | 0 (0.0%) | 0 (0.0%) |
| 16 and 17 Years | 0 (0.0%) | 0 (0.0%) |
| 18 to 24 Years | 0 (0.0%) | 0 (0.0%) |
| 25 to 34 Years | 23 (8.8%) | 10 (4.1%) |
| 35 to 44 Years | 15 (8.8%) | 0 (0.0%) |
| 45 to 54 Years | 0 (0.0%) | 26 (8.0%) |
| 55 to 64 Years | 8 (2.3%) | 28 (8.1%) |
| 65 to 74 Years | 11 (3.1%) | 32 (7.6%) |
| 75 Years and over | 10 (3.2%) | 16 (5.2%) |
| Total | 67 (3.5%) | 142 (6.3%) |
Income Above Poverty by Sex and Age in Belleair
According to the poverty statistics in Belleair, males aged under 5 years and females aged 5 years are the age groups that are most secure financially, with 100.0% of males and 100.0% of females in these age groups living above the poverty line.
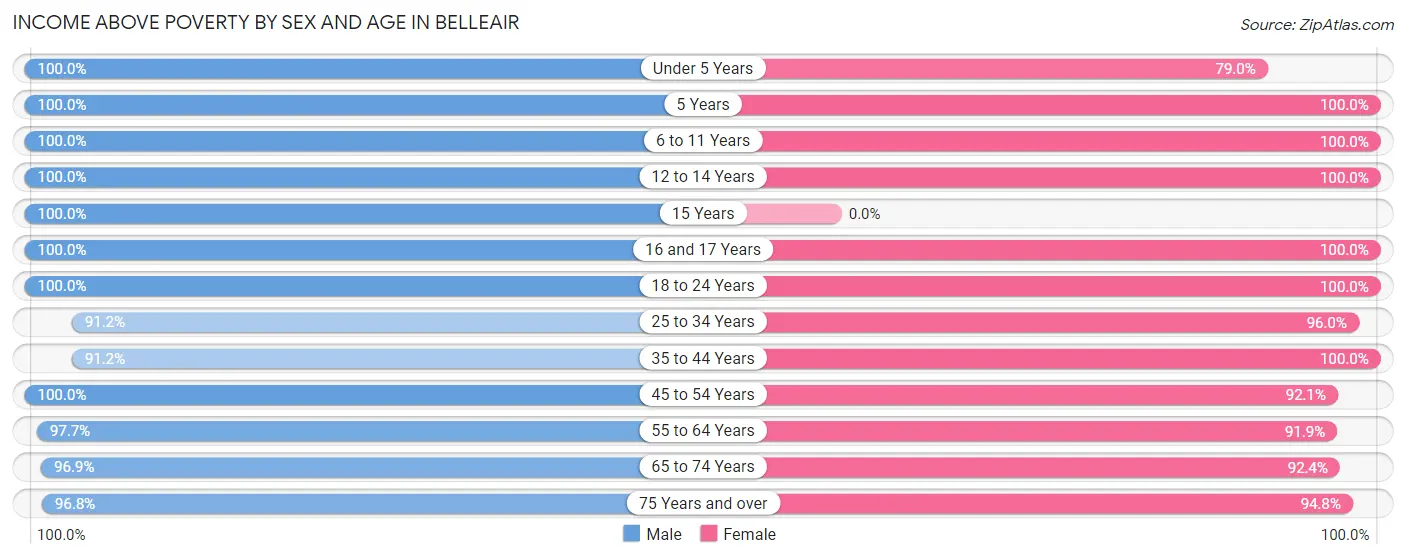
| Age Bracket | Male | Female |
| Under 5 Years | 99 (100.0%) | 113 (79.0%) |
| 5 Years | 12 (100.0%) | 3 (100.0%) |
| 6 to 11 Years | 59 (100.0%) | 77 (100.0%) |
| 12 to 14 Years | 67 (100.0%) | 41 (100.0%) |
| 15 Years | 10 (100.0%) | 0 (0.0%) |
| 16 and 17 Years | 19 (100.0%) | 73 (100.0%) |
| 18 to 24 Years | 44 (100.0%) | 55 (100.0%) |
| 25 to 34 Years | 239 (91.2%) | 237 (96.0%) |
| 35 to 44 Years | 156 (91.2%) | 203 (100.0%) |
| 45 to 54 Years | 156 (100.0%) | 301 (92.0%) |
| 55 to 64 Years | 341 (97.7%) | 319 (91.9%) |
| 65 to 74 Years | 347 (96.9%) | 391 (92.4%) |
| 75 Years and over | 301 (96.8%) | 294 (94.8%) |
| Total | 1,850 (96.5%) | 2,107 (93.7%) |
Income Below Poverty Among Married-Couple Families in Belleair
The poverty statistics for married-couple families in Belleair show that 1.5% or 18 of the total 1,161 families live below the poverty line. Families with 3 or 4 children have the highest poverty rate of 19.2%, comprising of 10 families. On the other hand, families with 1 or 2 children have the lowest poverty rate of 0.0%, which includes 0 families.
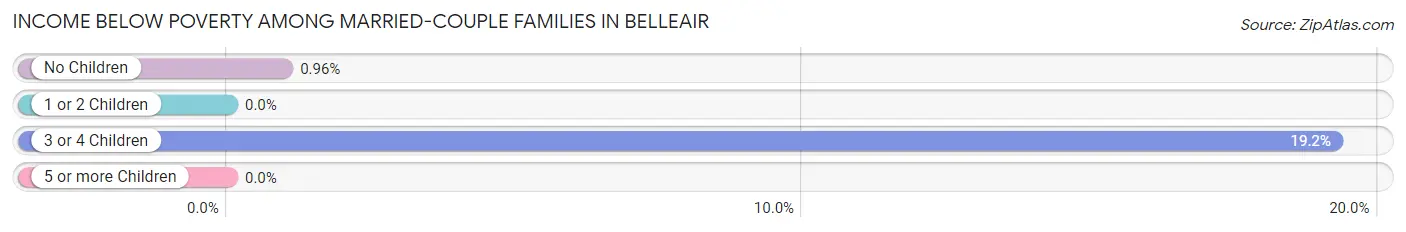
| Children | Above Poverty | Below Poverty |
| No Children | 823 (99.0%) | 8 (1.0%) |
| 1 or 2 Children | 278 (100.0%) | 0 (0.0%) |
| 3 or 4 Children | 42 (80.8%) | 10 (19.2%) |
| 5 or more Children | 0 (0.0%) | 0 (0.0%) |
| Total | 1,143 (98.5%) | 18 (1.5%) |
Income Below Poverty Among Single-Parent Households in Belleair
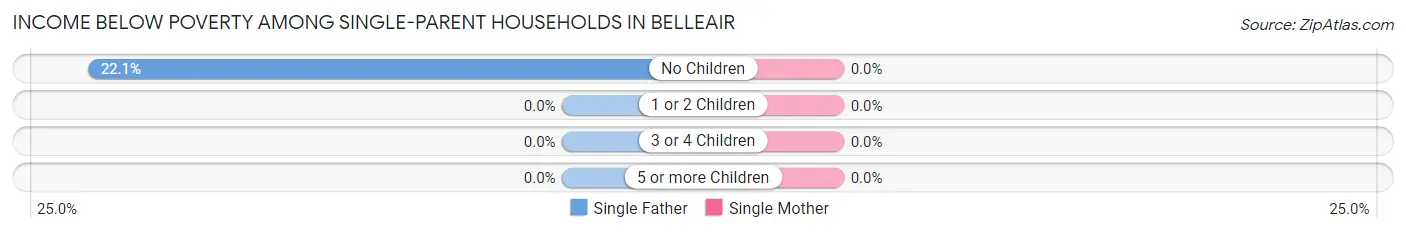
| Children | Single Father | Single Mother |
| No Children | 15 (22.1%) | 0 (0.0%) |
| 1 or 2 Children | 0 (0.0%) | 0 (0.0%) |
| 3 or 4 Children | 0 (0.0%) | 0 (0.0%) |
| 5 or more Children | 0 (0.0%) | 0 (0.0%) |
| Total | 15 (15.5%) | 0 (0.0%) |
Income Below Poverty Among Married-Couple vs Single-Parent Households in Belleair
The poverty data for Belleair shows that 18 of the married-couple family households (1.5%) and 15 of the single-parent households (7.7%) are living below the poverty level. Within the married-couple family households, those with 3 or 4 children have the highest poverty rate, with 10 households (19.2%) falling below the poverty line. Among the single-parent households, those with no children have the highest poverty rate, with 15 household (10.7%) living below poverty.
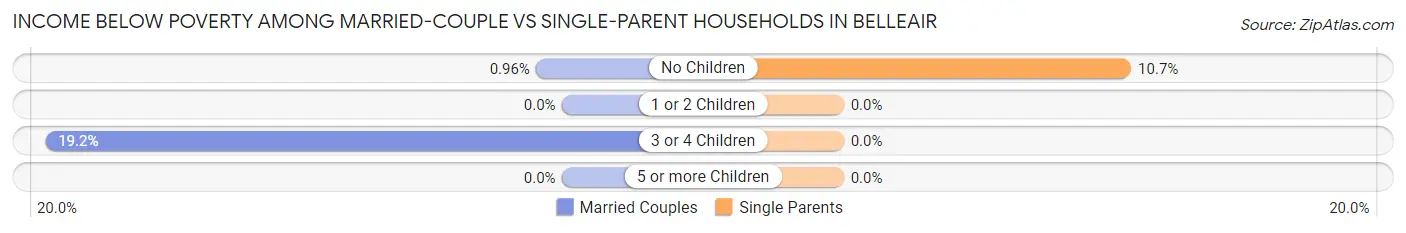
| Children | Married-Couple Families | Single-Parent Households |
| No Children | 8 (1.0%) | 15 (10.7%) |
| 1 or 2 Children | 0 (0.0%) | 0 (0.0%) |
| 3 or 4 Children | 10 (19.2%) | 0 (0.0%) |
| 5 or more Children | 0 (0.0%) | 0 (0.0%) |
| Total | 18 (1.5%) | 15 (7.7%) |
Employment Characteristics in Belleair
Employment by Class of Employer in Belleair
Among the 1,903 employed individuals in Belleair, private company employees (1,115 | 58.6%), local government employees (222 | 11.7%), and self-employed (incorporated) (195 | 10.2%) make up the most common classes of employment.
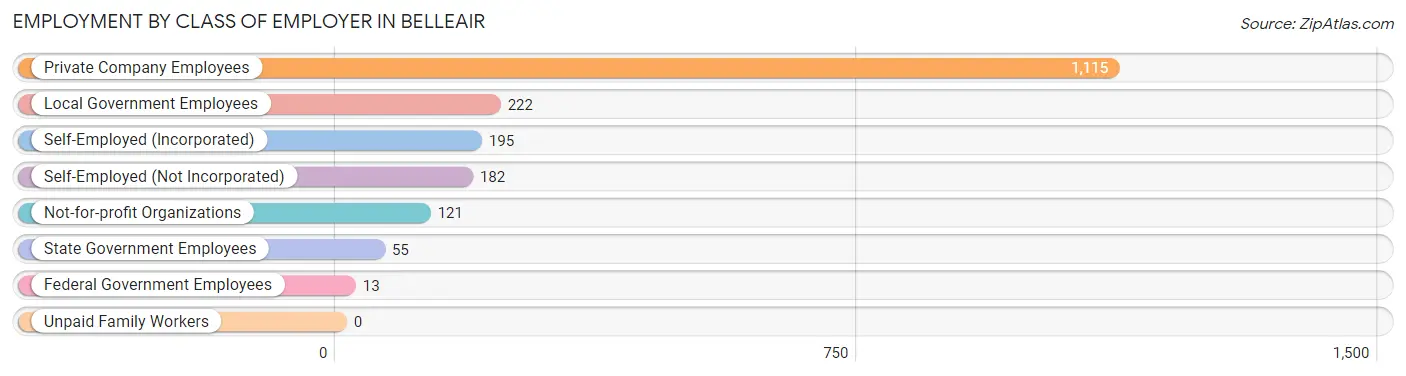
| Employer Class | # Employees | % Employees |
| Private Company Employees | 1,115 | 58.6% |
| Self-Employed (Incorporated) | 195 | 10.2% |
| Self-Employed (Not Incorporated) | 182 | 9.6% |
| Not-for-profit Organizations | 121 | 6.4% |
| Local Government Employees | 222 | 11.7% |
| State Government Employees | 55 | 2.9% |
| Federal Government Employees | 13 | 0.7% |
| Unpaid Family Workers | 0 | 0.0% |
| Total | 1,903 | 100.0% |
Employment Status by Age in Belleair
According to the labor force statistics for Belleair, out of the total population over 16 years of age (3,784), 52.4% or 1,983 individuals are in the labor force, with 3.2% or 63 of them unemployed. The age group with the highest labor force participation rate is 30 to 34 years, with 100.0% or 282 individuals in the labor force. Within the labor force, the 65 to 74 years age range has the highest percentage of unemployed individuals, with 7.6% or 17 of them being unemployed.
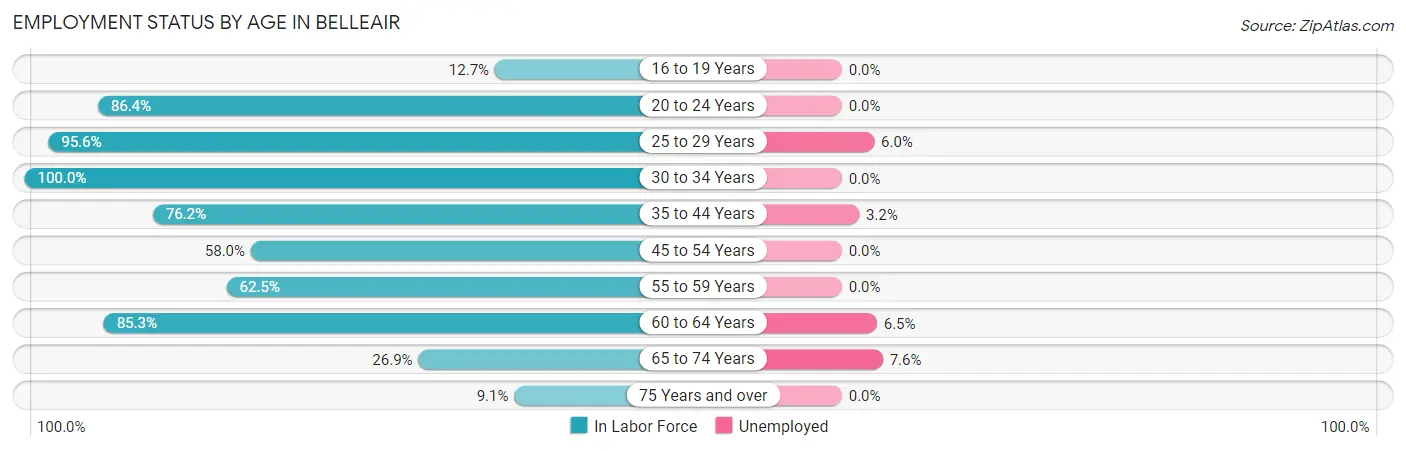
| Age Bracket | In Labor Force | Unemployed |
| 16 to 19 Years | 14 (12.7%) | 0 (0.0%) |
| 20 to 24 Years | 70 (86.4%) | 0 (0.0%) |
| 25 to 29 Years | 217 (95.6%) | 13 (6.0%) |
| 30 to 34 Years | 282 (100.0%) | 0 (0.0%) |
| 35 to 44 Years | 285 (76.2%) | 9 (3.2%) |
| 45 to 54 Years | 285 (58.0%) | 0 (0.0%) |
| 55 to 59 Years | 163 (62.5%) | 0 (0.0%) |
| 60 to 64 Years | 383 (85.3%) | 25 (6.5%) |
| 65 to 74 Years | 223 (26.9%) | 17 (7.6%) |
| 75 Years and over | 62 (9.1%) | 0 (0.0%) |
| Total | 1,983 (52.4%) | 63 (3.2%) |
Employment Status by Educational Attainment in Belleair
According to labor force statistics for Belleair, 77.5% of individuals (1,615) out of the total population between 25 and 64 years of age (2,084) are in the labor force, with 2.9% or 47 of them being unemployed. The group with the highest labor force participation rate are those with the educational attainment of bachelor's degree or higher, with 86.1% or 926 individuals in the labor force. Within the labor force, individuals with bachelor's degree or higher education have the highest percentage of unemployment, with 3.7% or 34 of them being unemployed.
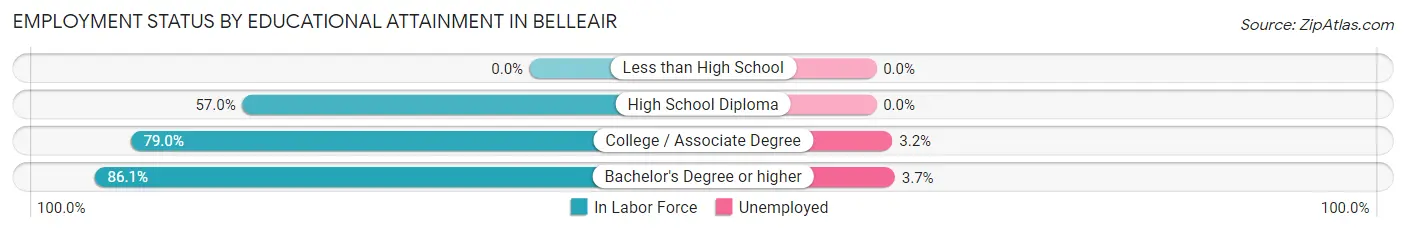
| Educational Attainment | In Labor Force | Unemployed |
| Less than High School | 0 (0.0%) | 0 (0.0%) |
| High School Diploma | 278 (57.0%) | 0 (0.0%) |
| College / Associate Degree | 411 (79.0%) | 17 (3.2%) |
| Bachelor's Degree or higher | 926 (86.1%) | 40 (3.7%) |
| Total | 1,615 (77.5%) | 60 (2.9%) |
Employment Occupations by Sex in Belleair
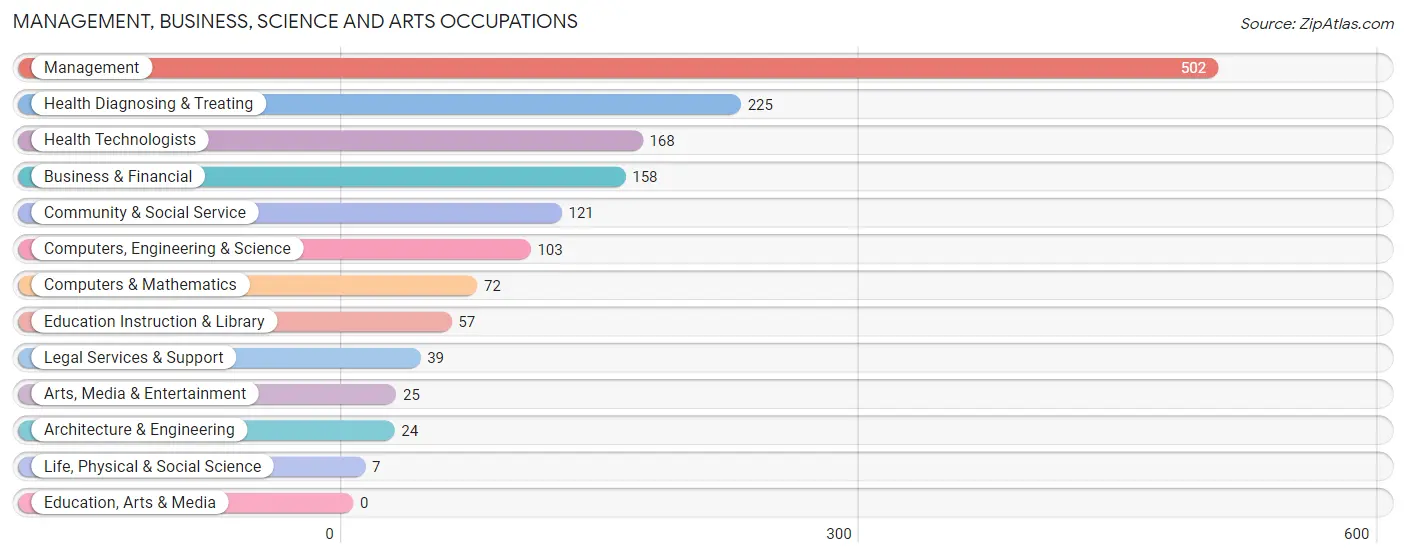
Management, Business, Science and Arts Occupations
The most common Management, Business, Science and Arts occupations in Belleair are Management (502 | 26.2%), Health Diagnosing & Treating (225 | 11.7%), Health Technologists (168 | 8.7%), Business & Financial (158 | 8.2%), and Community & Social Service (121 | 6.3%).
Management, Business, Science and Arts Occupations by Sex
Within the Management, Business, Science and Arts occupations in Belleair, the most male-oriented occupations are Architecture & Engineering (100.0%), Education Instruction & Library (77.2%), and Computers, Engineering & Science (66.0%), while the most female-oriented occupations are Life, Physical & Social Science (100.0%), Legal Services & Support (100.0%), and Arts, Media & Entertainment (100.0%).
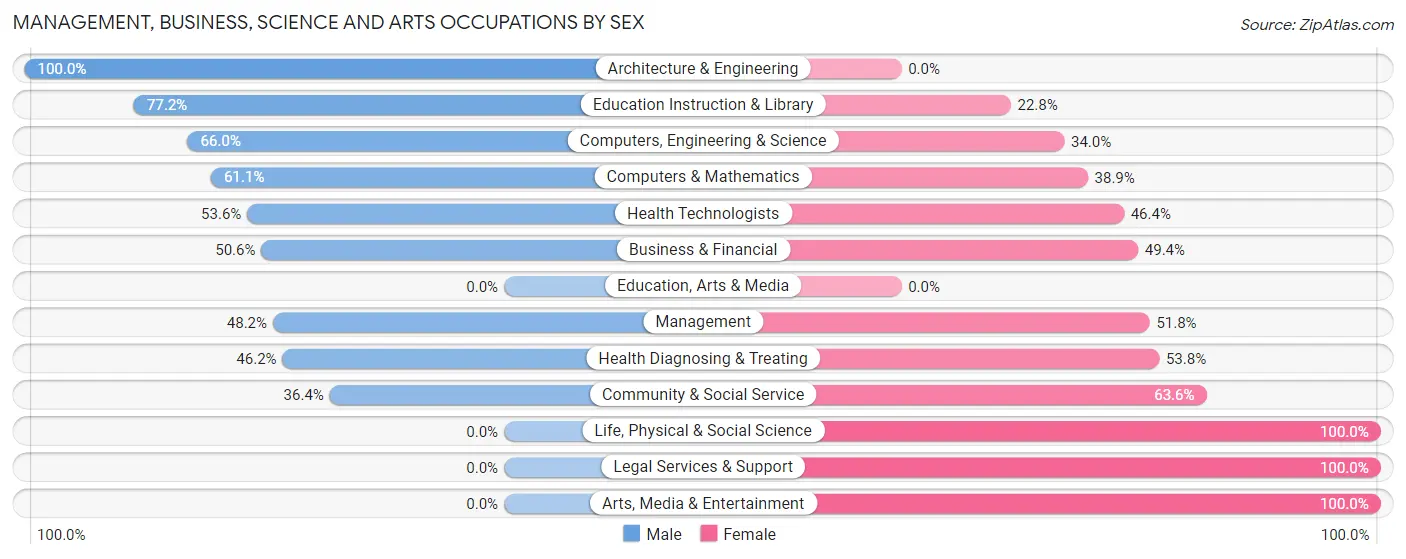
| Occupation | Male | Female |
| Management | 242 (48.2%) | 260 (51.8%) |
| Business & Financial | 80 (50.6%) | 78 (49.4%) |
| Computers, Engineering & Science | 68 (66.0%) | 35 (34.0%) |
| Computers & Mathematics | 44 (61.1%) | 28 (38.9%) |
| Architecture & Engineering | 24 (100.0%) | 0 (0.0%) |
| Life, Physical & Social Science | 0 (0.0%) | 7 (100.0%) |
| Community & Social Service | 44 (36.4%) | 77 (63.6%) |
| Education, Arts & Media | 0 (0.0%) | 0 (0.0%) |
| Legal Services & Support | 0 (0.0%) | 39 (100.0%) |
| Education Instruction & Library | 44 (77.2%) | 13 (22.8%) |
| Arts, Media & Entertainment | 0 (0.0%) | 25 (100.0%) |
| Health Diagnosing & Treating | 104 (46.2%) | 121 (53.8%) |
| Health Technologists | 90 (53.6%) | 78 (46.4%) |
| Total (Category) | 538 (48.5%) | 571 (51.5%) |
| Total (Overall) | 981 (51.1%) | 939 (48.9%) |
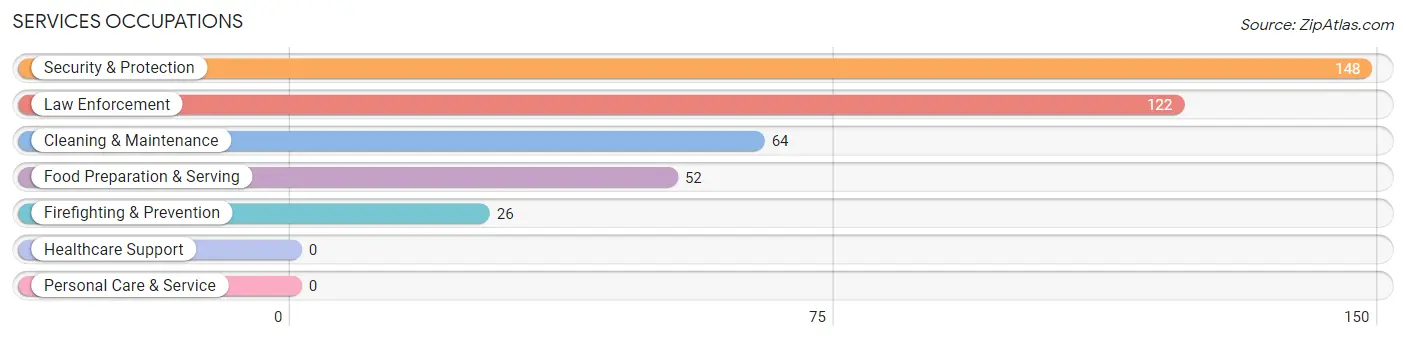
Services Occupations
The most common Services occupations in Belleair are Security & Protection (148 | 7.7%), Law Enforcement (122 | 6.4%), Cleaning & Maintenance (64 | 3.3%), Food Preparation & Serving (52 | 2.7%), and Firefighting & Prevention (26 | 1.3%).
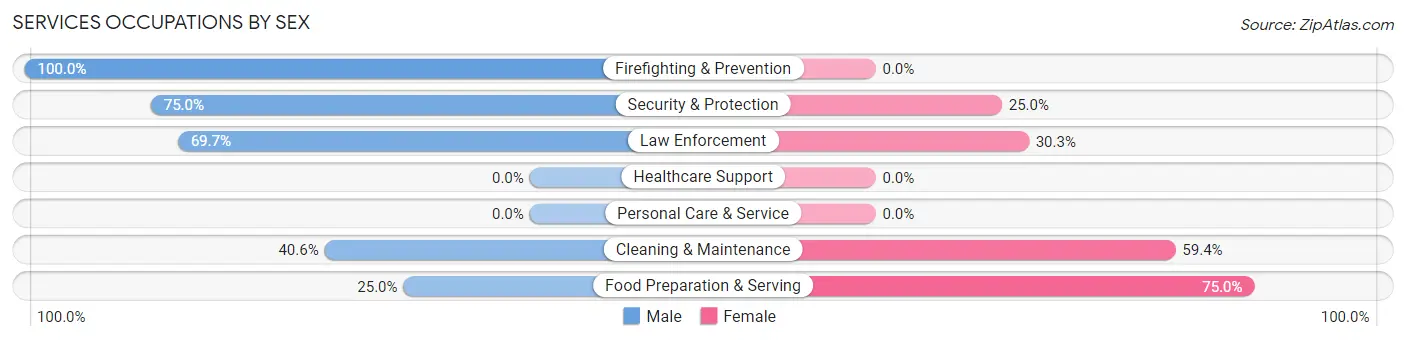
Services Occupations by Sex
Within the Services occupations in Belleair, the most male-oriented occupations are Firefighting & Prevention (100.0%), Security & Protection (75.0%), and Law Enforcement (69.7%), while the most female-oriented occupations are Food Preparation & Serving (75.0%), Cleaning & Maintenance (59.4%), and Law Enforcement (30.3%).
| Occupation | Male | Female |
| Healthcare Support | 0 (0.0%) | 0 (0.0%) |
| Security & Protection | 111 (75.0%) | 37 (25.0%) |
| Firefighting & Prevention | 26 (100.0%) | 0 (0.0%) |
| Law Enforcement | 85 (69.7%) | 37 (30.3%) |
| Food Preparation & Serving | 13 (25.0%) | 39 (75.0%) |
| Cleaning & Maintenance | 26 (40.6%) | 38 (59.4%) |
| Personal Care & Service | 0 (0.0%) | 0 (0.0%) |
| Total (Category) | 150 (56.8%) | 114 (43.2%) |
| Total (Overall) | 981 (51.1%) | 939 (48.9%) |
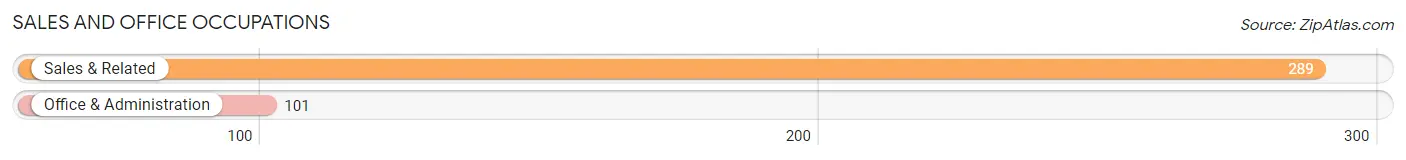
Sales and Office Occupations
The most common Sales and Office occupations in Belleair are Sales & Related (289 | 15.0%), and Office & Administration (101 | 5.3%).
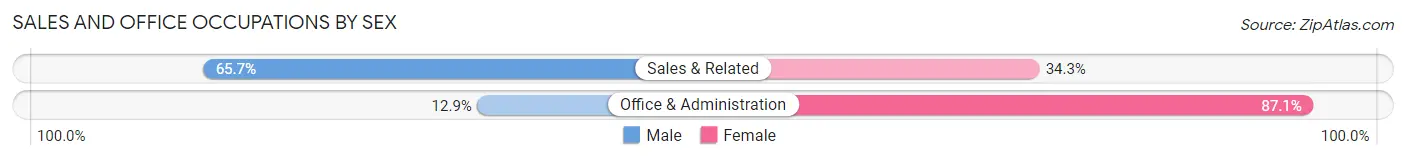
Sales and Office Occupations by Sex
| Occupation | Male | Female |
| Sales & Related | 190 (65.7%) | 99 (34.3%) |
| Office & Administration | 13 (12.9%) | 88 (87.1%) |
| Total (Category) | 203 (52.0%) | 187 (47.9%) |
| Total (Overall) | 981 (51.1%) | 939 (48.9%) |
Natural Resources, Construction and Maintenance Occupations
The most common Natural Resources, Construction and Maintenance occupations in Belleair are Construction & Extraction (53 | 2.8%), and Installation, Maintenance & Repair (26 | 1.3%).
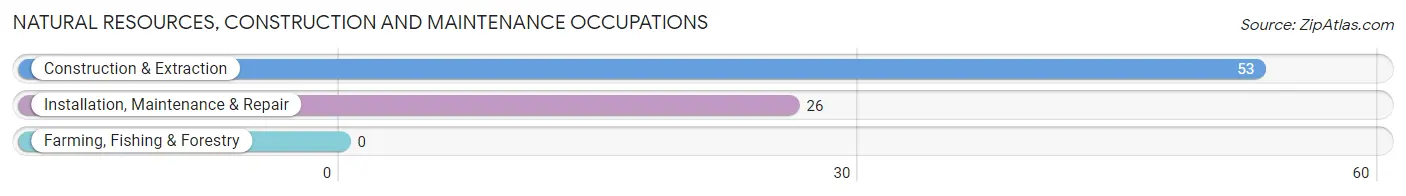
Natural Resources, Construction and Maintenance Occupations by Sex
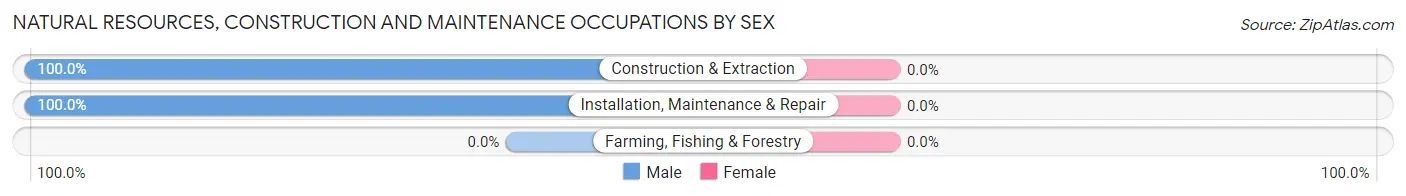
| Occupation | Male | Female |
| Farming, Fishing & Forestry | 0 (0.0%) | 0 (0.0%) |
| Construction & Extraction | 53 (100.0%) | 0 (0.0%) |
| Installation, Maintenance & Repair | 26 (100.0%) | 0 (0.0%) |
| Total (Category) | 79 (100.0%) | 0 (0.0%) |
| Total (Overall) | 981 (51.1%) | 939 (48.9%) |
Production, Transportation and Moving Occupations
The most common Production, Transportation and Moving occupations in Belleair are Transportation (52 | 2.7%), Material Moving (17 | 0.9%), and Production (9 | 0.5%).
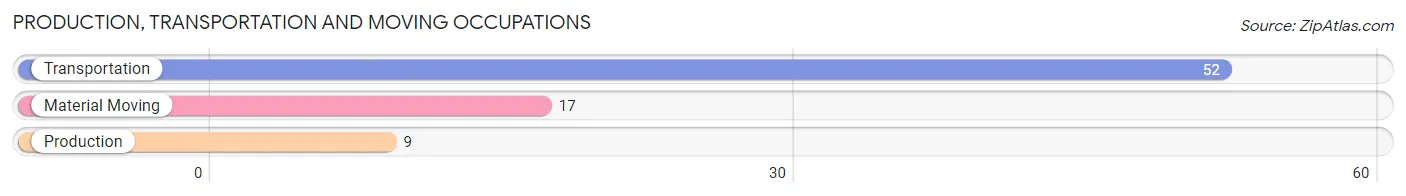
Production, Transportation and Moving Occupations by Sex
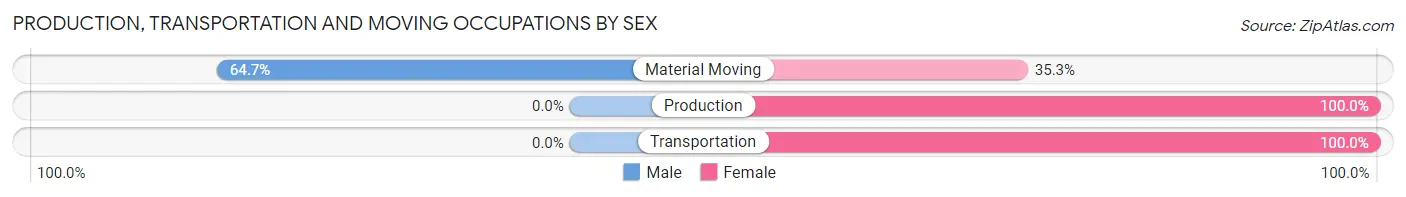
| Occupation | Male | Female |
| Production | 0 (0.0%) | 9 (100.0%) |
| Transportation | 0 (0.0%) | 52 (100.0%) |
| Material Moving | 11 (64.7%) | 6 (35.3%) |
| Total (Category) | 11 (14.1%) | 67 (85.9%) |
| Total (Overall) | 981 (51.1%) | 939 (48.9%) |
Employment Industries by Sex in Belleair
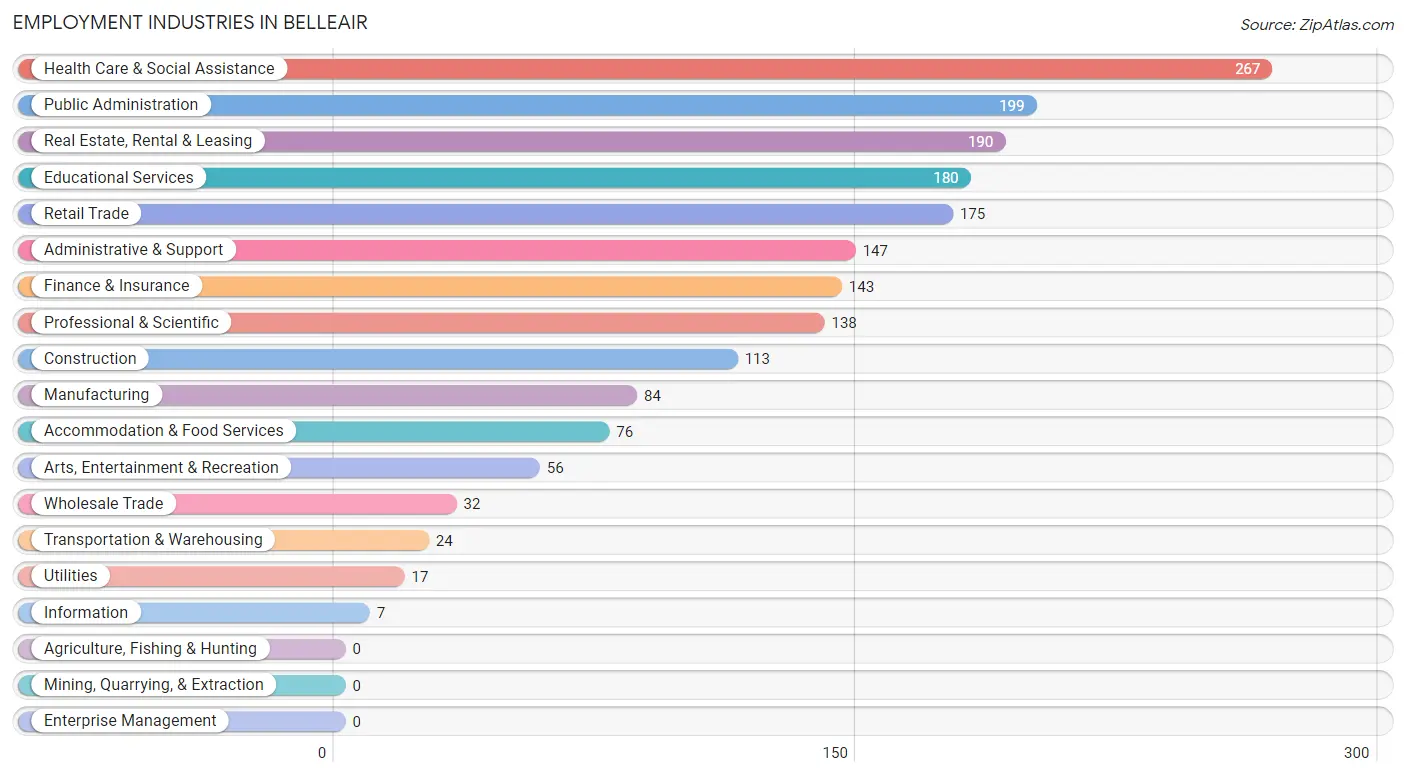
Employment Industries in Belleair
The major employment industries in Belleair include Health Care & Social Assistance (267 | 13.9%), Public Administration (199 | 10.4%), Real Estate, Rental & Leasing (190 | 9.9%), Educational Services (180 | 9.4%), and Retail Trade (175 | 9.1%).
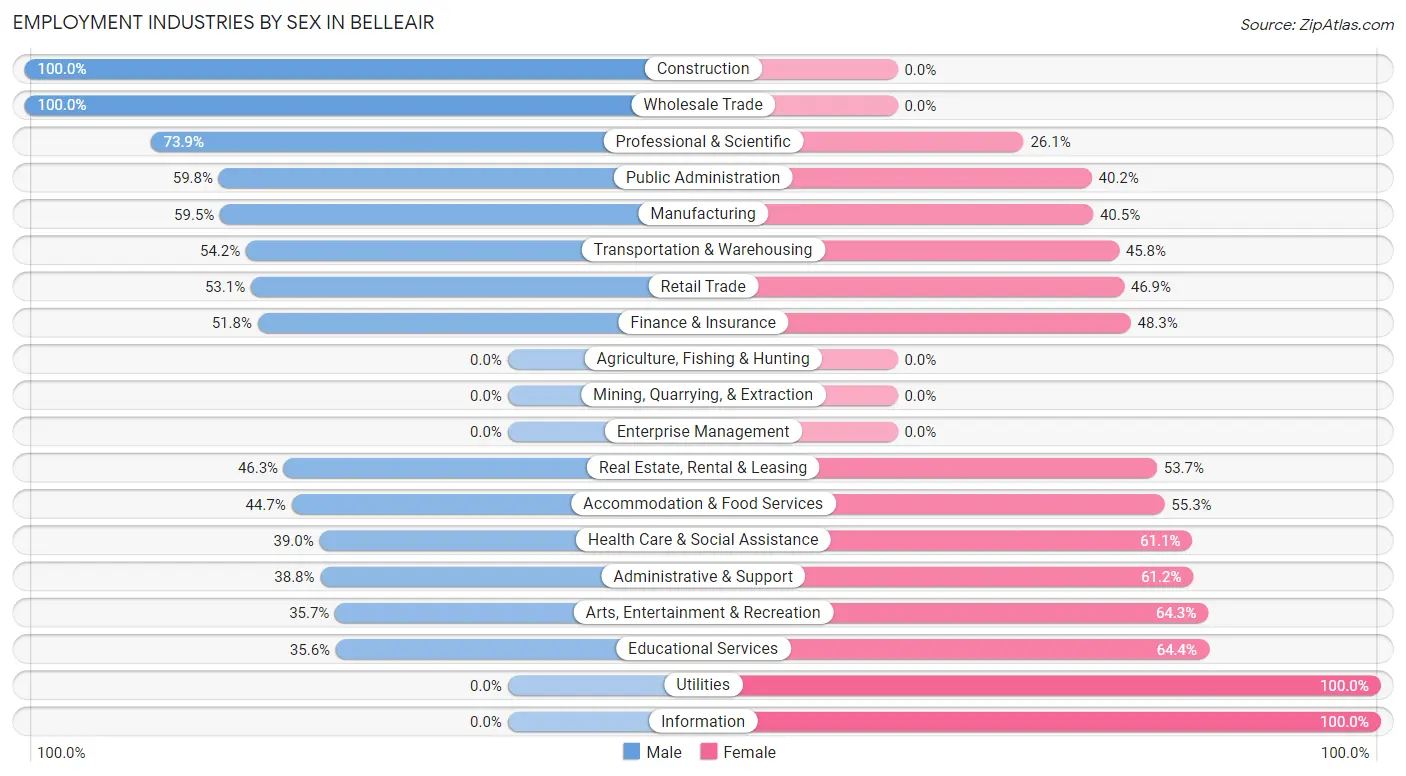
Employment Industries by Sex in Belleair
The Belleair industries that see more men than women are Construction (100.0%), Wholesale Trade (100.0%), and Professional & Scientific (73.9%), whereas the industries that tend to have a higher number of women are Utilities (100.0%), Information (100.0%), and Educational Services (64.4%).
| Industry | Male | Female |
| Agriculture, Fishing & Hunting | 0 (0.0%) | 0 (0.0%) |
| Mining, Quarrying, & Extraction | 0 (0.0%) | 0 (0.0%) |
| Construction | 113 (100.0%) | 0 (0.0%) |
| Manufacturing | 50 (59.5%) | 34 (40.5%) |
| Wholesale Trade | 32 (100.0%) | 0 (0.0%) |
| Retail Trade | 93 (53.1%) | 82 (46.9%) |
| Transportation & Warehousing | 13 (54.2%) | 11 (45.8%) |
| Utilities | 0 (0.0%) | 17 (100.0%) |
| Information | 0 (0.0%) | 7 (100.0%) |
| Finance & Insurance | 74 (51.7%) | 69 (48.2%) |
| Real Estate, Rental & Leasing | 88 (46.3%) | 102 (53.7%) |
| Professional & Scientific | 102 (73.9%) | 36 (26.1%) |
| Enterprise Management | 0 (0.0%) | 0 (0.0%) |
| Administrative & Support | 57 (38.8%) | 90 (61.2%) |
| Educational Services | 64 (35.6%) | 116 (64.4%) |
| Health Care & Social Assistance | 104 (39.0%) | 163 (61.1%) |
| Arts, Entertainment & Recreation | 20 (35.7%) | 36 (64.3%) |
| Accommodation & Food Services | 34 (44.7%) | 42 (55.3%) |
| Public Administration | 119 (59.8%) | 80 (40.2%) |
| Total | 981 (51.1%) | 939 (48.9%) |
Education in Belleair
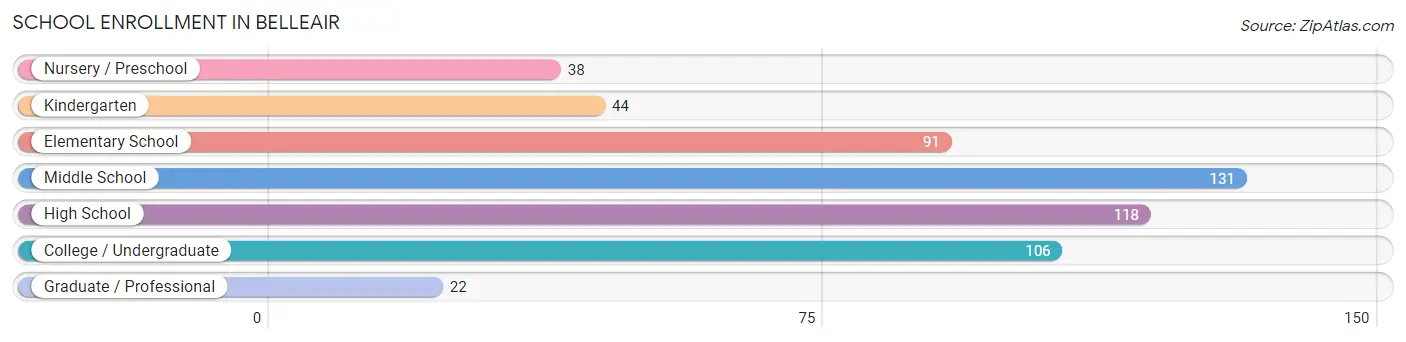
School Enrollment in Belleair
The most common levels of schooling among the 550 students in Belleair are middle school (131 | 23.8%), high school (118 | 21.4%), and college / undergraduate (106 | 19.3%).
| School Level | # Students | % Students |
| Nursery / Preschool | 38 | 6.9% |
| Kindergarten | 44 | 8.0% |
| Elementary School | 91 | 16.6% |
| Middle School | 131 | 23.8% |
| High School | 118 | 21.4% |
| College / Undergraduate | 106 | 19.3% |
| Graduate / Professional | 22 | 4.0% |
| Total | 550 | 100.0% |
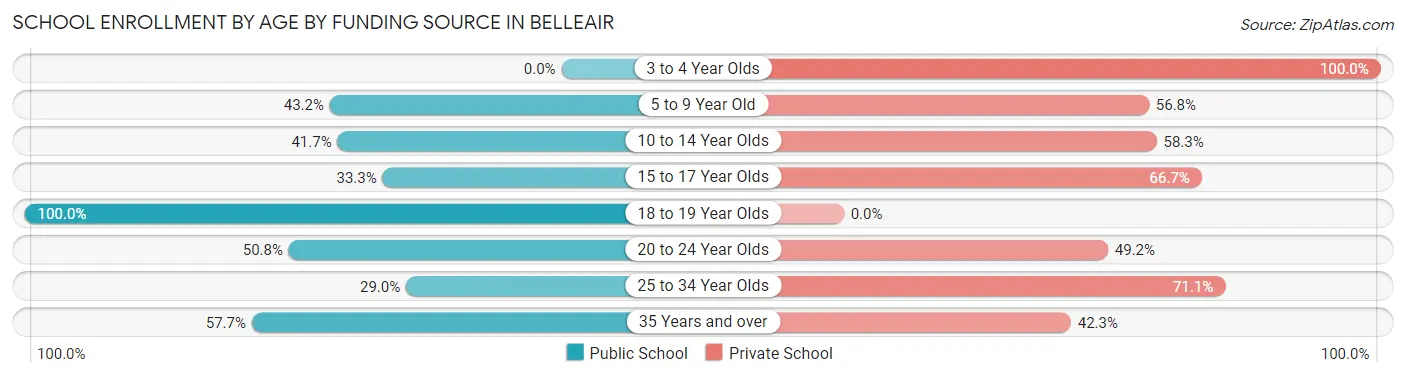
School Enrollment by Age by Funding Source in Belleair
Out of a total of 550 students who are enrolled in schools in Belleair, 346 (62.9%) attend a private institution, while the remaining 204 (37.1%) are enrolled in public schools. The age group of 3 to 4 year olds has the highest likelihood of being enrolled in private schools, with 67 (100.0% in the age bracket) enrolled. Conversely, the age group of 18 to 19 year olds has the lowest likelihood of being enrolled in a private school, with 8 (100.0% in the age bracket) attending a public institution.
| Age Bracket | Public School | Private School |
| 3 to 4 Year Olds | 0 (0.0%) | 67 (100.0%) |
| 5 to 9 Year Old | 41 (43.2%) | 54 (56.8%) |
| 10 to 14 Year Olds | 63 (41.7%) | 88 (58.3%) |
| 15 to 17 Year Olds | 34 (33.3%) | 68 (66.7%) |
| 18 to 19 Year Olds | 8 (100.0%) | 0 (0.0%) |
| 20 to 24 Year Olds | 32 (50.8%) | 31 (49.2%) |
| 25 to 34 Year Olds | 11 (28.9%) | 27 (71.1%) |
| 35 Years and over | 15 (57.7%) | 11 (42.3%) |
| Total | 204 (37.1%) | 346 (62.9%) |
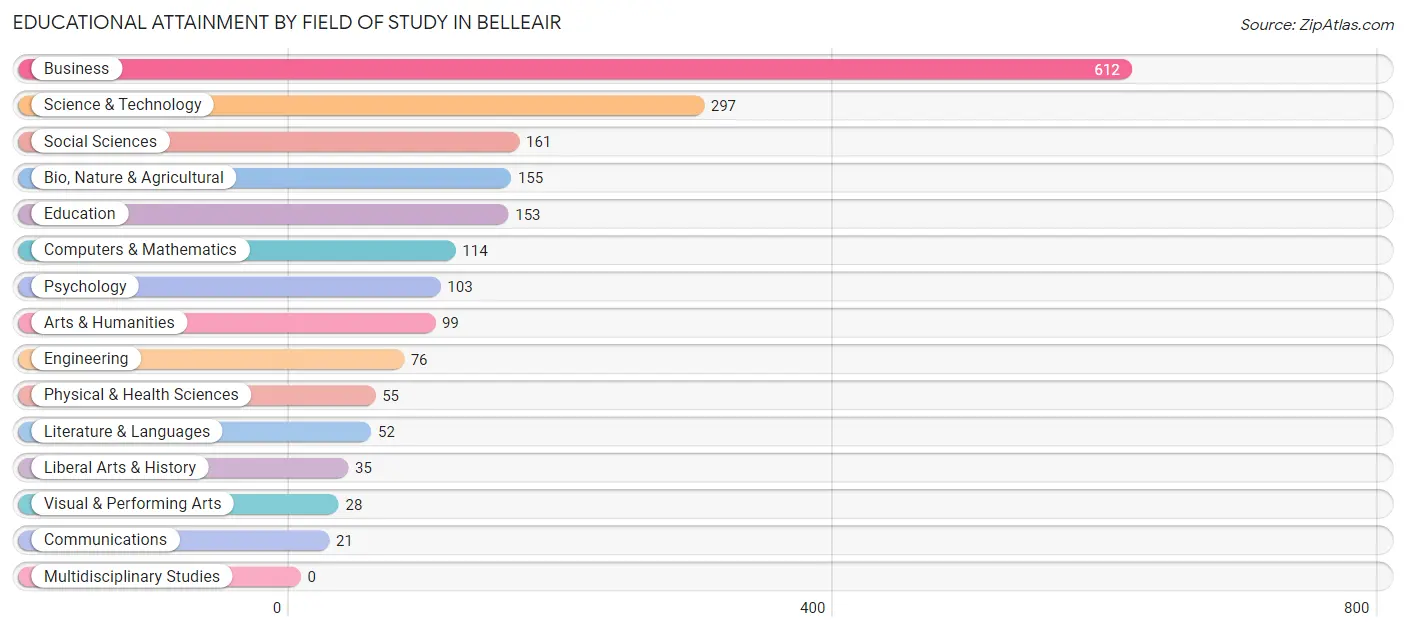
Educational Attainment by Field of Study in Belleair
Business (612 | 31.2%), science & technology (297 | 15.1%), social sciences (161 | 8.2%), bio, nature & agricultural (155 | 7.9%), and education (153 | 7.8%) are the most common fields of study among 1,961 individuals in Belleair who have obtained a bachelor's degree or higher.
| Field of Study | # Graduates | % Graduates |
| Computers & Mathematics | 114 | 5.8% |
| Bio, Nature & Agricultural | 155 | 7.9% |
| Physical & Health Sciences | 55 | 2.8% |
| Psychology | 103 | 5.2% |
| Social Sciences | 161 | 8.2% |
| Engineering | 76 | 3.9% |
| Multidisciplinary Studies | 0 | 0.0% |
| Science & Technology | 297 | 15.1% |
| Business | 612 | 31.2% |
| Education | 153 | 7.8% |
| Literature & Languages | 52 | 2.6% |
| Liberal Arts & History | 35 | 1.8% |
| Visual & Performing Arts | 28 | 1.4% |
| Communications | 21 | 1.1% |
| Arts & Humanities | 99 | 5.1% |
| Total | 1,961 | 100.0% |
Transportation & Commute in Belleair
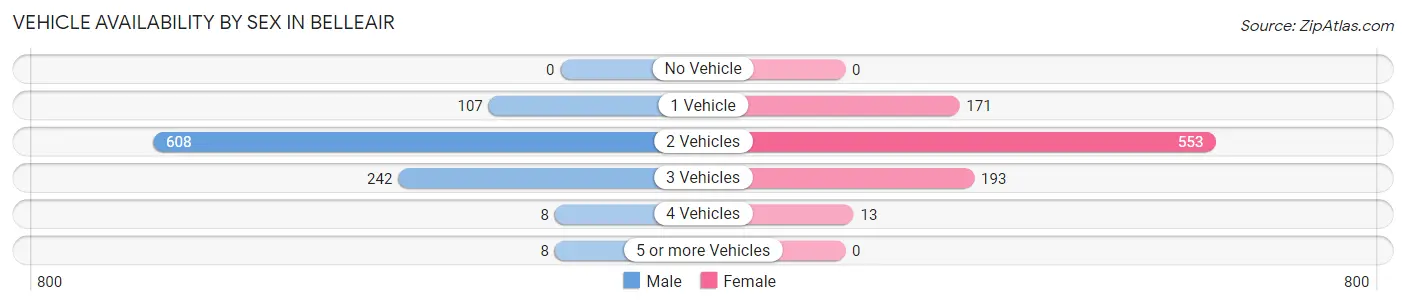
Vehicle Availability by Sex in Belleair
The most prevalent vehicle ownership categories in Belleair are males with 2 vehicles (608, accounting for 62.5%) and females with 2 vehicles (553, making up 65.4%).
| Vehicles Available | Male | Female |
| No Vehicle | 0 (0.0%) | 0 (0.0%) |
| 1 Vehicle | 107 (11.0%) | 171 (18.4%) |
| 2 Vehicles | 608 (62.5%) | 553 (59.5%) |
| 3 Vehicles | 242 (24.9%) | 193 (20.7%) |
| 4 Vehicles | 8 (0.8%) | 13 (1.4%) |
| 5 or more Vehicles | 8 (0.8%) | 0 (0.0%) |
| Total | 973 (100.0%) | 930 (100.0%) |
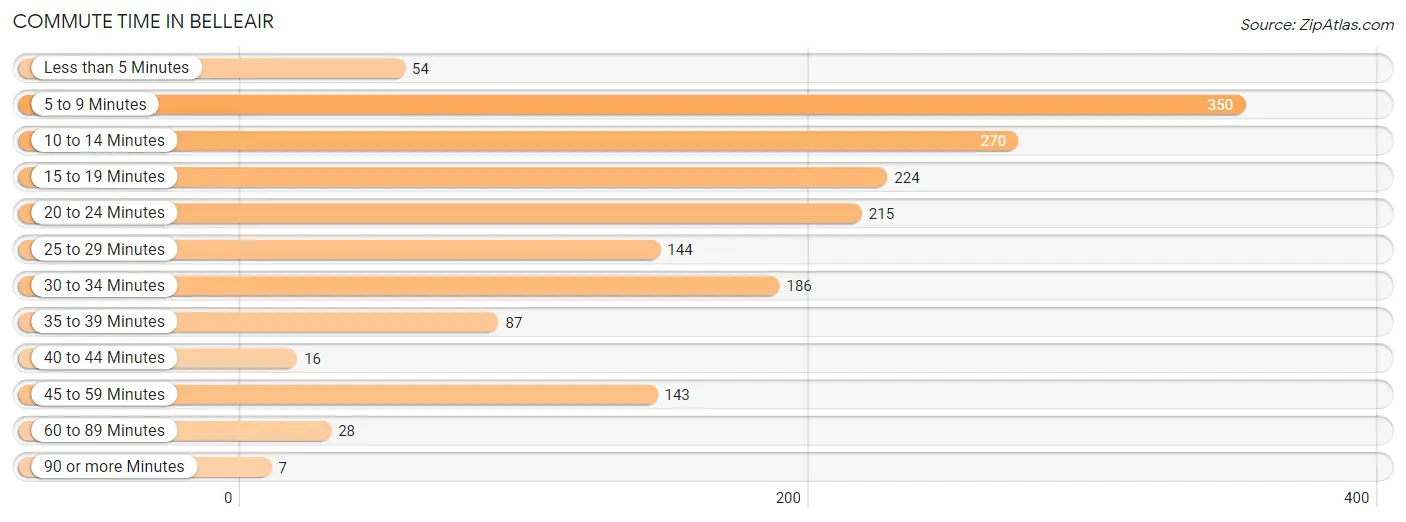
Commute Time in Belleair
The most frequently occuring commute durations in Belleair are 5 to 9 minutes (350 commuters, 20.3%), 10 to 14 minutes (270 commuters, 15.7%), and 15 to 19 minutes (224 commuters, 13.0%).
| Commute Time | # Commuters | % Commuters |
| Less than 5 Minutes | 54 | 3.1% |
| 5 to 9 Minutes | 350 | 20.3% |
| 10 to 14 Minutes | 270 | 15.7% |
| 15 to 19 Minutes | 224 | 13.0% |
| 20 to 24 Minutes | 215 | 12.5% |
| 25 to 29 Minutes | 144 | 8.4% |
| 30 to 34 Minutes | 186 | 10.8% |
| 35 to 39 Minutes | 87 | 5.1% |
| 40 to 44 Minutes | 16 | 0.9% |
| 45 to 59 Minutes | 143 | 8.3% |
| 60 to 89 Minutes | 28 | 1.6% |
| 90 or more Minutes | 7 | 0.4% |
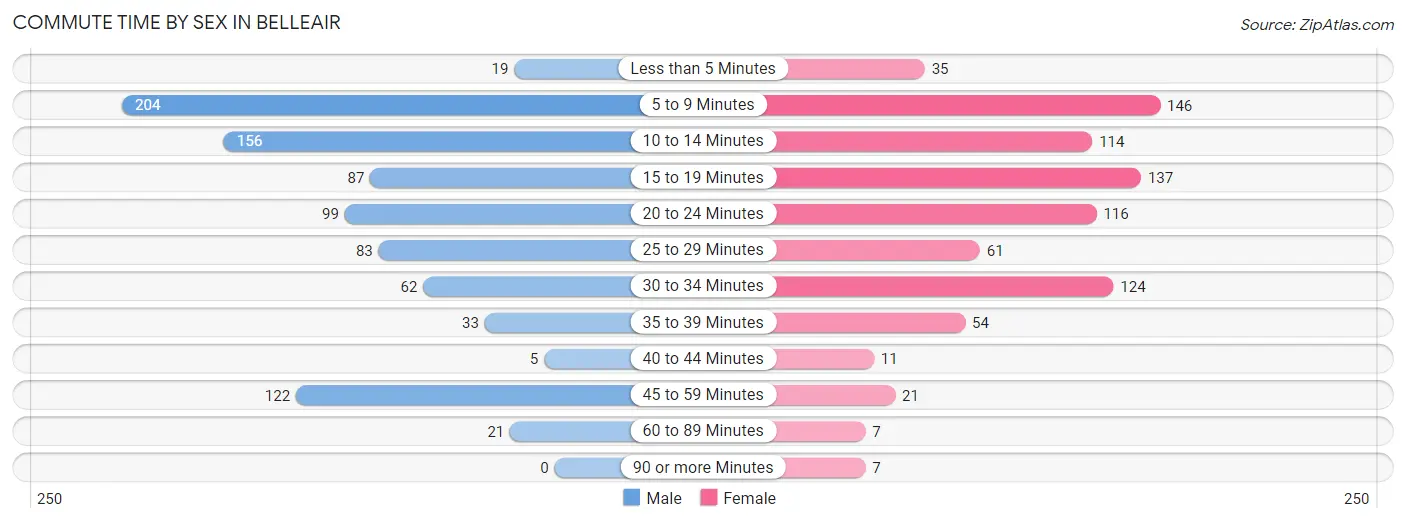
Commute Time by Sex in Belleair
The most common commute times in Belleair are 5 to 9 minutes (204 commuters, 22.9%) for males and 5 to 9 minutes (146 commuters, 17.5%) for females.
| Commute Time | Male | Female |
| Less than 5 Minutes | 19 (2.1%) | 35 (4.2%) |
| 5 to 9 Minutes | 204 (22.9%) | 146 (17.5%) |
| 10 to 14 Minutes | 156 (17.5%) | 114 (13.7%) |
| 15 to 19 Minutes | 87 (9.8%) | 137 (16.5%) |
| 20 to 24 Minutes | 99 (11.1%) | 116 (13.9%) |
| 25 to 29 Minutes | 83 (9.3%) | 61 (7.3%) |
| 30 to 34 Minutes | 62 (7.0%) | 124 (14.9%) |
| 35 to 39 Minutes | 33 (3.7%) | 54 (6.5%) |
| 40 to 44 Minutes | 5 (0.6%) | 11 (1.3%) |
| 45 to 59 Minutes | 122 (13.7%) | 21 (2.5%) |
| 60 to 89 Minutes | 21 (2.4%) | 7 (0.8%) |
| 90 or more Minutes | 0 (0.0%) | 7 (0.8%) |
Time of Departure to Work by Sex in Belleair
The most frequent times of departure to work in Belleair are 7:00 AM to 7:29 AM (167, 18.7%) for males and 7:30 AM to 7:59 AM (200, 24.0%) for females.
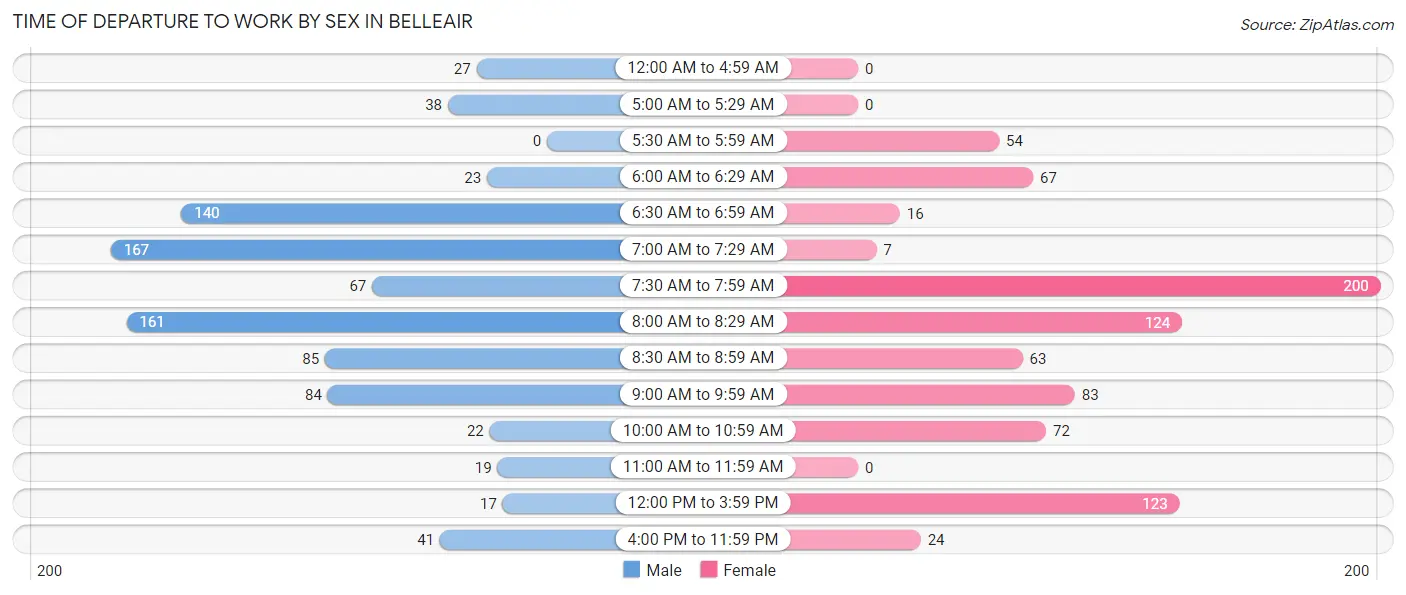
| Time of Departure | Male | Female |
| 12:00 AM to 4:59 AM | 27 (3.0%) | 0 (0.0%) |
| 5:00 AM to 5:29 AM | 38 (4.3%) | 0 (0.0%) |
| 5:30 AM to 5:59 AM | 0 (0.0%) | 54 (6.5%) |
| 6:00 AM to 6:29 AM | 23 (2.6%) | 67 (8.0%) |
| 6:30 AM to 6:59 AM | 140 (15.7%) | 16 (1.9%) |
| 7:00 AM to 7:29 AM | 167 (18.7%) | 7 (0.8%) |
| 7:30 AM to 7:59 AM | 67 (7.5%) | 200 (24.0%) |
| 8:00 AM to 8:29 AM | 161 (18.1%) | 124 (14.9%) |
| 8:30 AM to 8:59 AM | 85 (9.5%) | 63 (7.6%) |
| 9:00 AM to 9:59 AM | 84 (9.4%) | 83 (10.0%) |
| 10:00 AM to 10:59 AM | 22 (2.5%) | 72 (8.6%) |
| 11:00 AM to 11:59 AM | 19 (2.1%) | 0 (0.0%) |
| 12:00 PM to 3:59 PM | 17 (1.9%) | 123 (14.8%) |
| 4:00 PM to 11:59 PM | 41 (4.6%) | 24 (2.9%) |
| Total | 891 (100.0%) | 833 (100.0%) |
Housing Occupancy in Belleair
Occupancy by Ownership in Belleair
Of the total 1,931 dwellings in Belleair, owner-occupied units account for 1,743 (90.3%), while renter-occupied units make up 188 (9.7%).
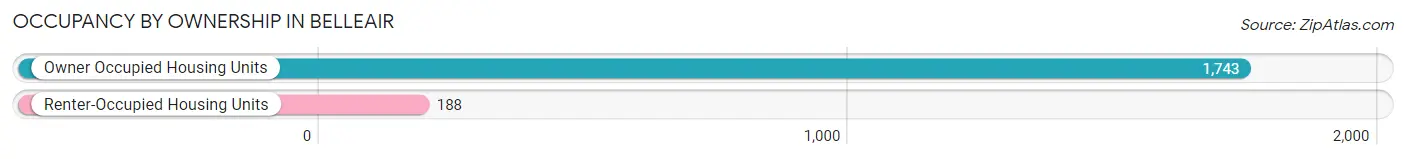
| Occupancy | # Housing Units | % Housing Units |
| Owner Occupied Housing Units | 1,743 | 90.3% |
| Renter-Occupied Housing Units | 188 | 9.7% |
| Total Occupied Housing Units | 1,931 | 100.0% |
Occupancy by Household Size in Belleair

| Household Size | # Housing Units | % Housing Units |
| 1-Person Household | 482 | 25.0% |
| 2-Person Household | 1,038 | 53.7% |
| 3-Person Household | 226 | 11.7% |
| 4+ Person Household | 185 | 9.6% |
| Total Housing Units | 1,931 | 100.0% |
Occupancy by Ownership by Household Size in Belleair
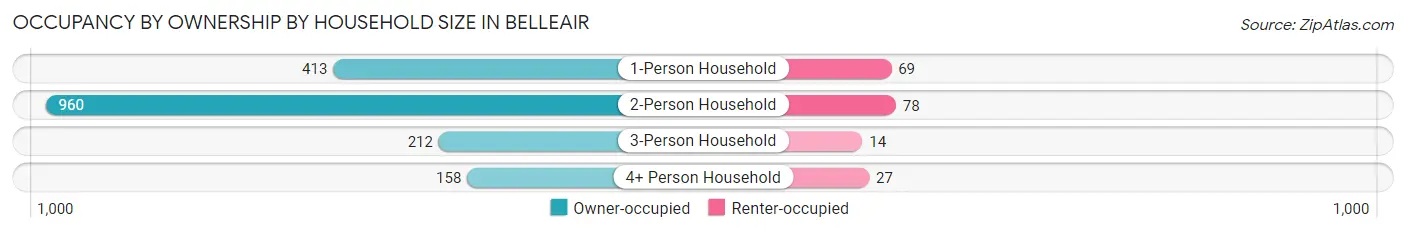
| Household Size | Owner-occupied | Renter-occupied |
| 1-Person Household | 413 (85.7%) | 69 (14.3%) |
| 2-Person Household | 960 (92.5%) | 78 (7.5%) |
| 3-Person Household | 212 (93.8%) | 14 (6.2%) |
| 4+ Person Household | 158 (85.4%) | 27 (14.6%) |
| Total Housing Units | 1,743 (90.3%) | 188 (9.7%) |
Occupancy by Educational Attainment in Belleair
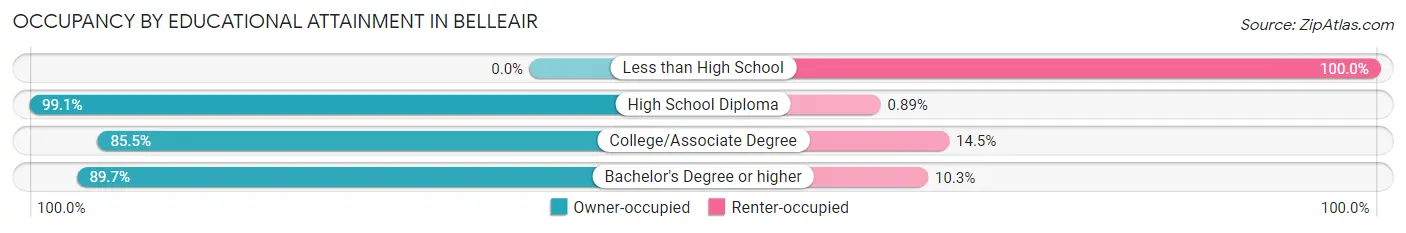
| Household Size | Owner-occupied | Renter-occupied |
| Less than High School | 0 (0.0%) | 8 (100.0%) |
| High School Diploma | 334 (99.1%) | 3 (0.9%) |
| College/Associate Degree | 284 (85.5%) | 48 (14.5%) |
| Bachelor's Degree or higher | 1,125 (89.7%) | 129 (10.3%) |
Occupancy by Age of Householder in Belleair

| Age Bracket | # Households | % Households |
| Under 35 Years | 295 | 15.3% |
| 35 to 44 Years | 169 | 8.7% |
| 45 to 54 Years | 236 | 12.2% |
| 55 to 64 Years | 422 | 21.8% |
| 65 to 74 Years | 363 | 18.8% |
| 75 to 84 Years | 414 | 21.4% |
| 85 Years and Over | 32 | 1.7% |
| Total | 1,931 | 100.0% |
Housing Finances in Belleair
Median Income by Occupancy in Belleair
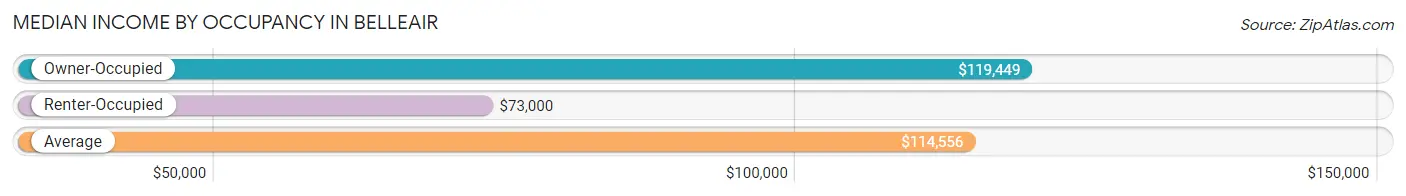
| Occupancy Type | # Households | Median Income |
| Owner-Occupied | 1,743 (90.3%) | $119,449 |
| Renter-Occupied | 188 (9.7%) | $73,000 |
| Average | 1,931 (100.0%) | $114,556 |
Occupancy by Householder Income Bracket in Belleair
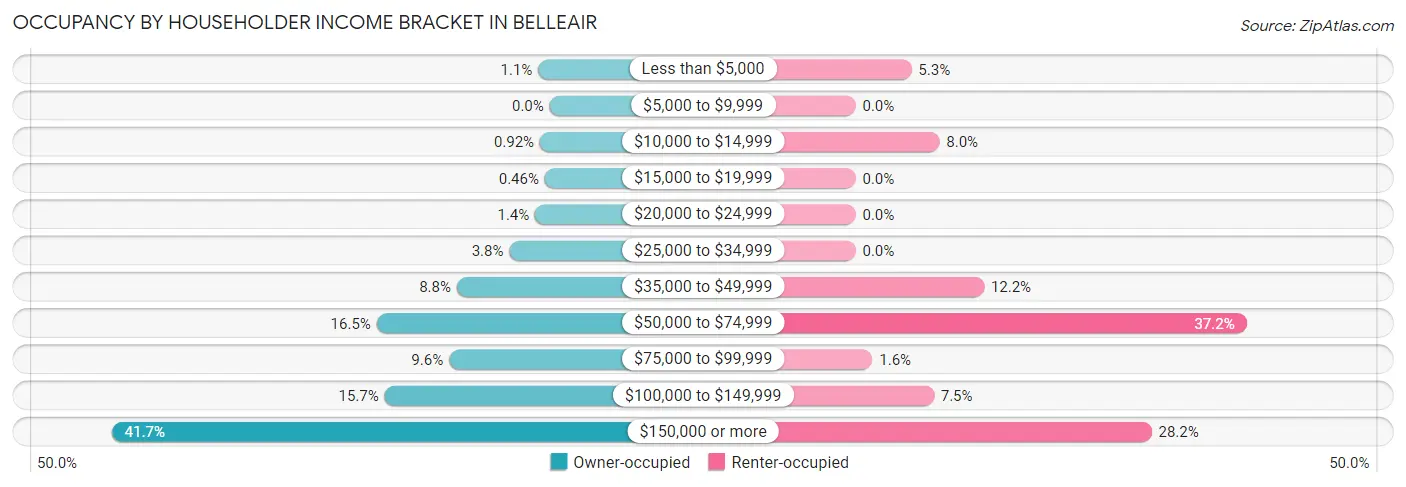
| Income Bracket | Owner-occupied | Renter-occupied |
| Less than $5,000 | 19 (1.1%) | 10 (5.3%) |
| $5,000 to $9,999 | 0 (0.0%) | 0 (0.0%) |
| $10,000 to $14,999 | 16 (0.9%) | 15 (8.0%) |
| $15,000 to $19,999 | 8 (0.5%) | 0 (0.0%) |
| $20,000 to $24,999 | 24 (1.4%) | 0 (0.0%) |
| $25,000 to $34,999 | 67 (3.8%) | 0 (0.0%) |
| $35,000 to $49,999 | 154 (8.8%) | 23 (12.2%) |
| $50,000 to $74,999 | 287 (16.5%) | 70 (37.2%) |
| $75,000 to $99,999 | 167 (9.6%) | 3 (1.6%) |
| $100,000 to $149,999 | 274 (15.7%) | 14 (7.4%) |
| $150,000 or more | 727 (41.7%) | 53 (28.2%) |
| Total | 1,743 (100.0%) | 188 (100.0%) |
Monthly Housing Cost Tiers in Belleair
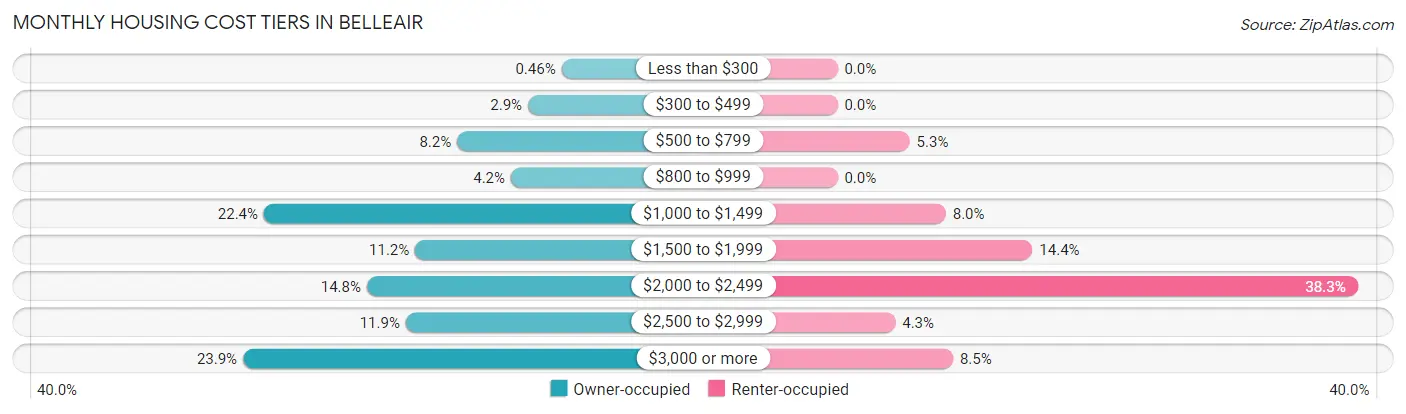
| Monthly Cost | Owner-occupied | Renter-occupied |
| Less than $300 | 8 (0.5%) | 0 (0.0%) |
| $300 to $499 | 51 (2.9%) | 0 (0.0%) |
| $500 to $799 | 142 (8.2%) | 10 (5.3%) |
| $800 to $999 | 73 (4.2%) | 0 (0.0%) |
| $1,000 to $1,499 | 390 (22.4%) | 15 (8.0%) |
| $1,500 to $1,999 | 196 (11.2%) | 27 (14.4%) |
| $2,000 to $2,499 | 258 (14.8%) | 72 (38.3%) |
| $2,500 to $2,999 | 208 (11.9%) | 8 (4.3%) |
| $3,000 or more | 417 (23.9%) | 16 (8.5%) |
| Total | 1,743 (100.0%) | 188 (100.0%) |
Physical Housing Characteristics in Belleair
Housing Structures in Belleair
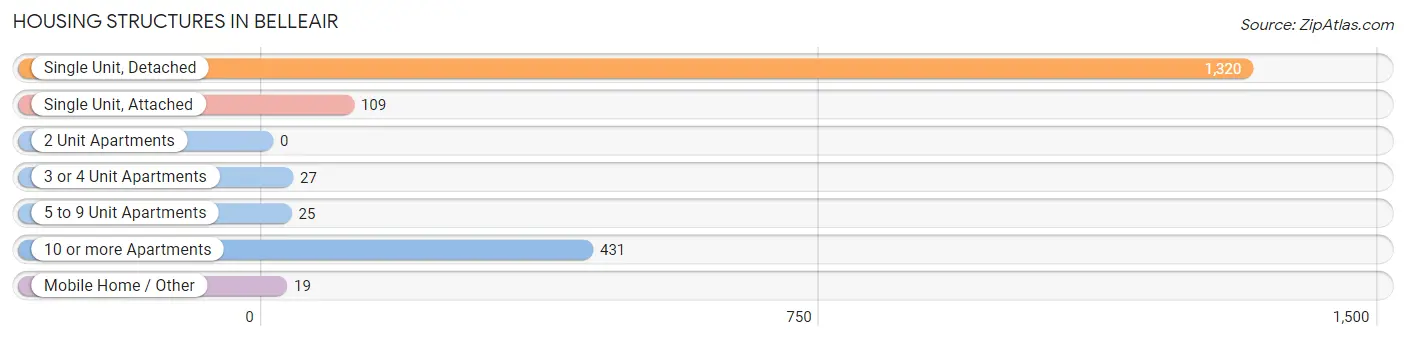
| Structure Type | # Housing Units | % Housing Units |
| Single Unit, Detached | 1,320 | 68.4% |
| Single Unit, Attached | 109 | 5.6% |
| 2 Unit Apartments | 0 | 0.0% |
| 3 or 4 Unit Apartments | 27 | 1.4% |
| 5 to 9 Unit Apartments | 25 | 1.3% |
| 10 or more Apartments | 431 | 22.3% |
| Mobile Home / Other | 19 | 1.0% |
| Total | 1,931 | 100.0% |
Housing Structures by Occupancy in Belleair
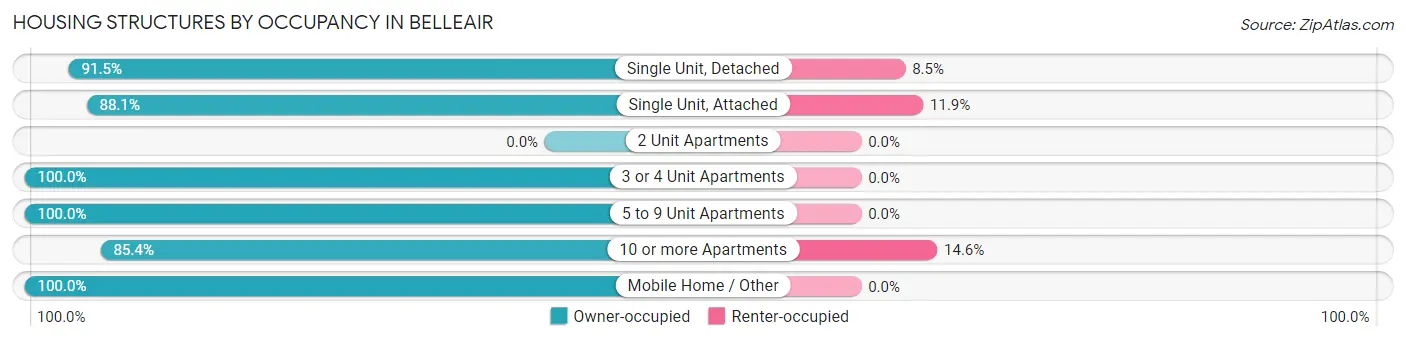
| Structure Type | Owner-occupied | Renter-occupied |
| Single Unit, Detached | 1,208 (91.5%) | 112 (8.5%) |
| Single Unit, Attached | 96 (88.1%) | 13 (11.9%) |
| 2 Unit Apartments | 0 (0.0%) | 0 (0.0%) |
| 3 or 4 Unit Apartments | 27 (100.0%) | 0 (0.0%) |
| 5 to 9 Unit Apartments | 25 (100.0%) | 0 (0.0%) |
| 10 or more Apartments | 368 (85.4%) | 63 (14.6%) |
| Mobile Home / Other | 19 (100.0%) | 0 (0.0%) |
| Total | 1,743 (90.3%) | 188 (9.7%) |
Housing Structures by Number of Rooms in Belleair
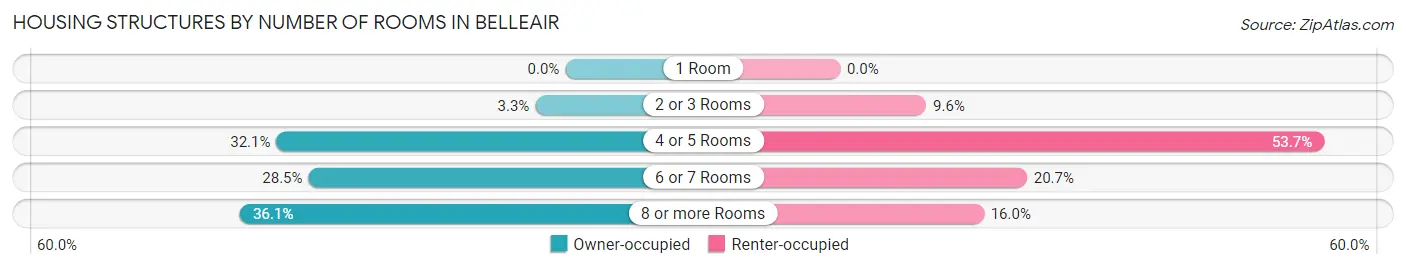
| Number of Rooms | Owner-occupied | Renter-occupied |
| 1 Room | 0 (0.0%) | 0 (0.0%) |
| 2 or 3 Rooms | 58 (3.3%) | 18 (9.6%) |
| 4 or 5 Rooms | 559 (32.1%) | 101 (53.7%) |
| 6 or 7 Rooms | 497 (28.5%) | 39 (20.7%) |
| 8 or more Rooms | 629 (36.1%) | 30 (16.0%) |
| Total | 1,743 (100.0%) | 188 (100.0%) |
Housing Structure by Heating Type in Belleair
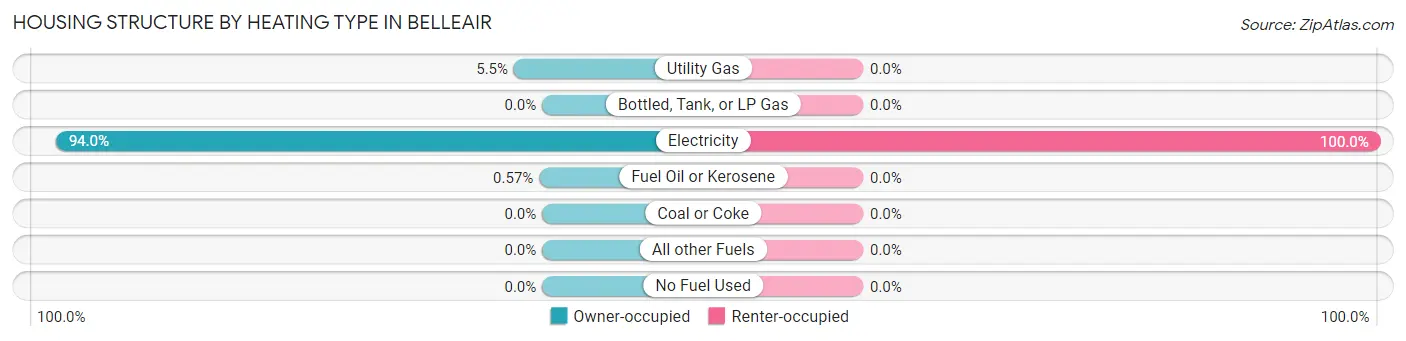
| Heating Type | Owner-occupied | Renter-occupied |
| Utility Gas | 95 (5.4%) | 0 (0.0%) |
| Bottled, Tank, or LP Gas | 0 (0.0%) | 0 (0.0%) |
| Electricity | 1,638 (94.0%) | 188 (100.0%) |
| Fuel Oil or Kerosene | 10 (0.6%) | 0 (0.0%) |
| Coal or Coke | 0 (0.0%) | 0 (0.0%) |
| All other Fuels | 0 (0.0%) | 0 (0.0%) |
| No Fuel Used | 0 (0.0%) | 0 (0.0%) |
| Total | 1,743 (100.0%) | 188 (100.0%) |
Household Vehicle Usage in Belleair
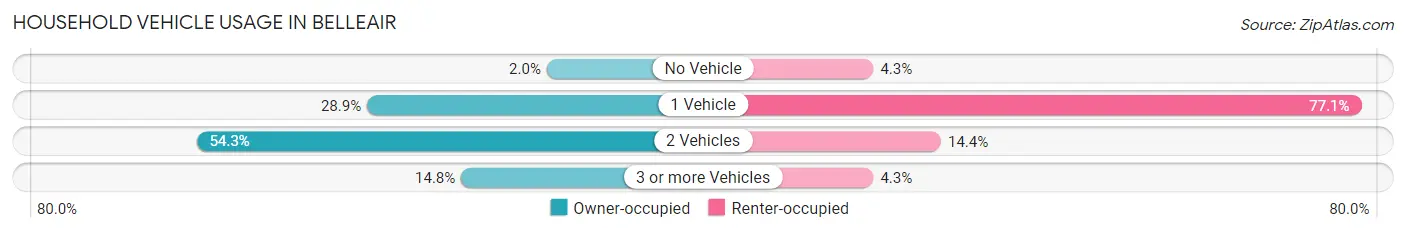
| Vehicles per Household | Owner-occupied | Renter-occupied |
| No Vehicle | 35 (2.0%) | 8 (4.3%) |
| 1 Vehicle | 503 (28.9%) | 145 (77.1%) |
| 2 Vehicles | 947 (54.3%) | 27 (14.4%) |
| 3 or more Vehicles | 258 (14.8%) | 8 (4.3%) |
| Total | 1,743 (100.0%) | 188 (100.0%) |
Real Estate & Mortgages in Belleair
Real Estate and Mortgage Overview in Belleair
| Characteristic | Without Mortgage | With Mortgage |
| Housing Units | 810 | 933 |
| Median Property Value | $521,100 | $577,500 |
| Median Household Income | $97,750 | $454 |
| Monthly Housing Costs | $1,179 | $362 |
| Real Estate Taxes | $5,380 | $9 |
Property Value by Mortgage Status in Belleair
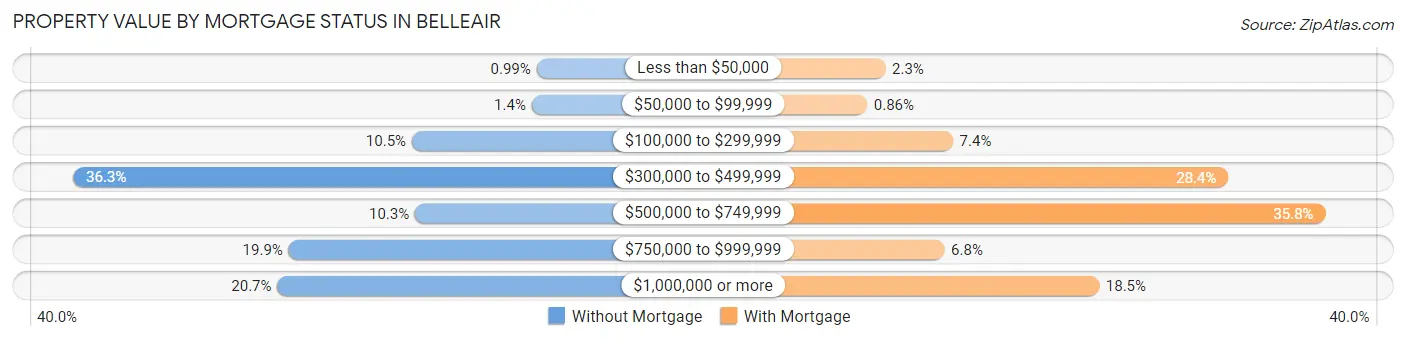
| Property Value | Without Mortgage | With Mortgage |
| Less than $50,000 | 8 (1.0%) | 21 (2.2%) |
| $50,000 to $99,999 | 11 (1.4%) | 8 (0.9%) |
| $100,000 to $299,999 | 85 (10.5%) | 69 (7.4%) |
| $300,000 to $499,999 | 294 (36.3%) | 265 (28.4%) |
| $500,000 to $749,999 | 83 (10.2%) | 334 (35.8%) |
| $750,000 to $999,999 | 161 (19.9%) | 63 (6.8%) |
| $1,000,000 or more | 168 (20.7%) | 173 (18.5%) |
| Total | 810 (100.0%) | 933 (100.0%) |
Household Income by Mortgage Status in Belleair
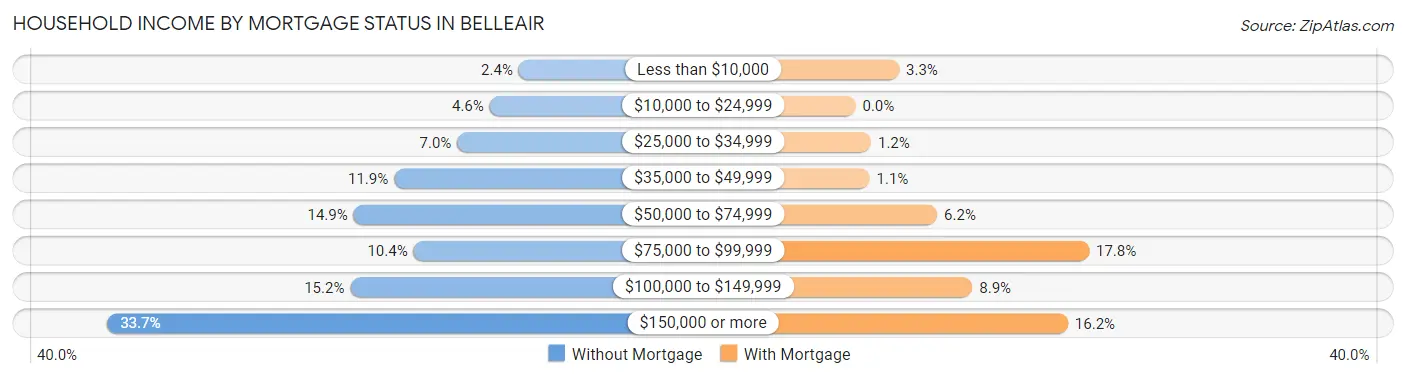
| Household Income | Without Mortgage | With Mortgage |
| Less than $10,000 | 19 (2.4%) | 31 (3.3%) |
| $10,000 to $24,999 | 37 (4.6%) | 0 (0.0%) |
| $25,000 to $34,999 | 57 (7.0%) | 11 (1.2%) |
| $35,000 to $49,999 | 96 (11.8%) | 10 (1.1%) |
| $50,000 to $74,999 | 121 (14.9%) | 58 (6.2%) |
| $75,000 to $99,999 | 84 (10.4%) | 166 (17.8%) |
| $100,000 to $149,999 | 123 (15.2%) | 83 (8.9%) |
| $150,000 or more | 273 (33.7%) | 151 (16.2%) |
| Total | 810 (100.0%) | 933 (100.0%) |
Property Value to Household Income Ratio in Belleair
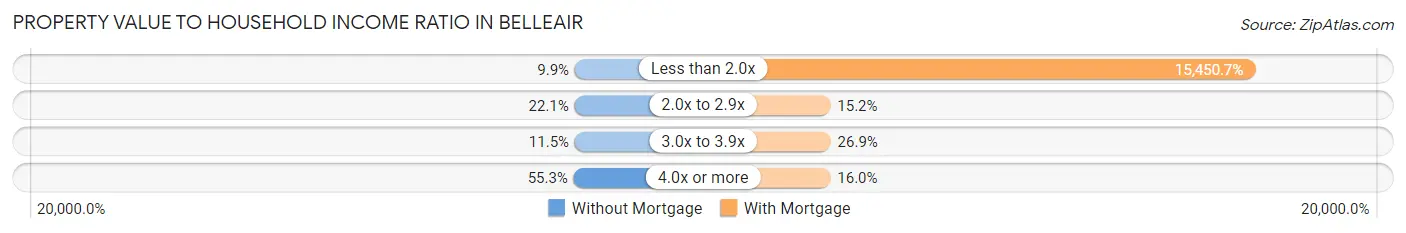
| Value-to-Income Ratio | Without Mortgage | With Mortgage |
| Less than 2.0x | 80 (9.9%) | 144,155 (15,450.7%) |
| 2.0x to 2.9x | 179 (22.1%) | 142 (15.2%) |
| 3.0x to 3.9x | 93 (11.5%) | 251 (26.9%) |
| 4.0x or more | 448 (55.3%) | 149 (16.0%) |
| Total | 810 (100.0%) | 933 (100.0%) |
Real Estate Taxes by Mortgage Status in Belleair
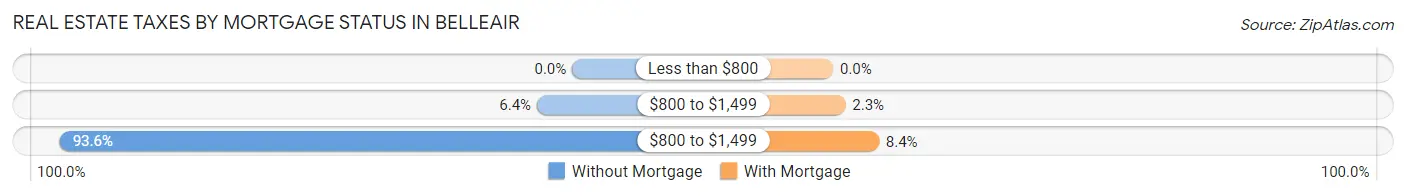
| Property Taxes | Without Mortgage | With Mortgage |
| Less than $800 | 0 (0.0%) | 0 (0.0%) |
| $800 to $1,499 | 52 (6.4%) | 21 (2.2%) |
| $800 to $1,499 | 758 (93.6%) | 78 (8.4%) |
| Total | 810 (100.0%) | 933 (100.0%) |
Health & Disability in Belleair
Health Insurance Coverage by Age in Belleair
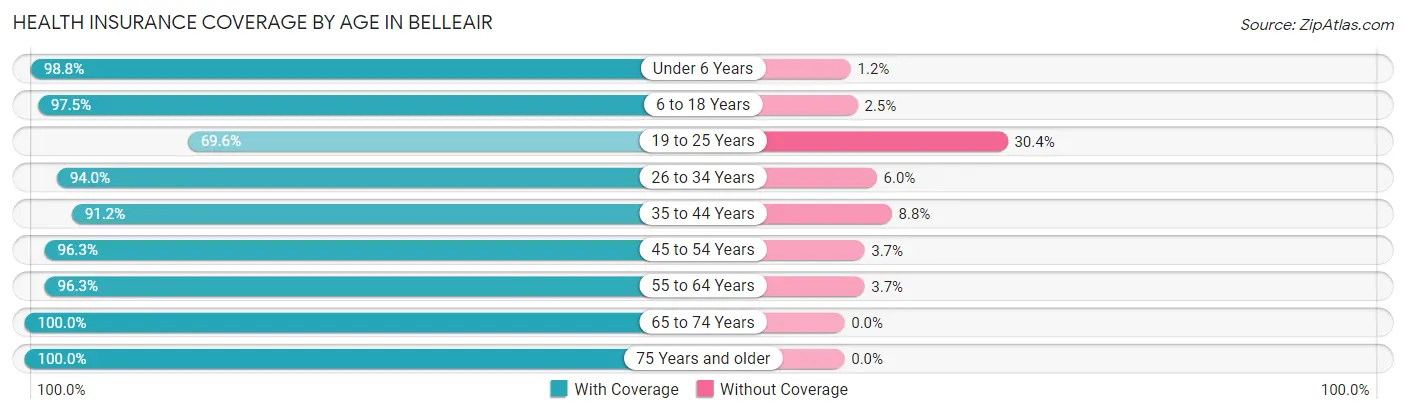
| Age Bracket | With Coverage | Without Coverage |
| Under 6 Years | 254 (98.8%) | 3 (1.2%) |
| 6 to 18 Years | 355 (97.5%) | 9 (2.5%) |
| 19 to 25 Years | 64 (69.6%) | 28 (30.4%) |
| 26 to 34 Years | 468 (94.0%) | 30 (6.0%) |
| 35 to 44 Years | 341 (91.2%) | 33 (8.8%) |
| 45 to 54 Years | 465 (96.3%) | 18 (3.7%) |
| 55 to 64 Years | 670 (96.3%) | 26 (3.7%) |
| 65 to 74 Years | 781 (100.0%) | 0 (0.0%) |
| 75 Years and older | 621 (100.0%) | 0 (0.0%) |
| Total | 4,019 (96.5%) | 147 (3.5%) |
Health Insurance Coverage by Citizenship Status in Belleair
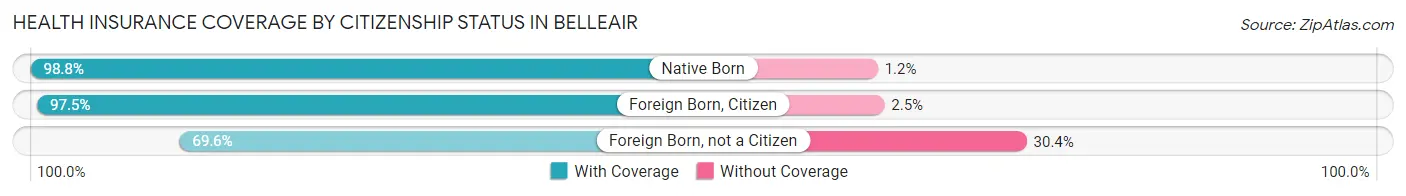
| Citizenship Status | With Coverage | Without Coverage |
| Native Born | 254 (98.8%) | 3 (1.2%) |
| Foreign Born, Citizen | 355 (97.5%) | 9 (2.5%) |
| Foreign Born, not a Citizen | 64 (69.6%) | 28 (30.4%) |
Health Insurance Coverage by Household Income in Belleair
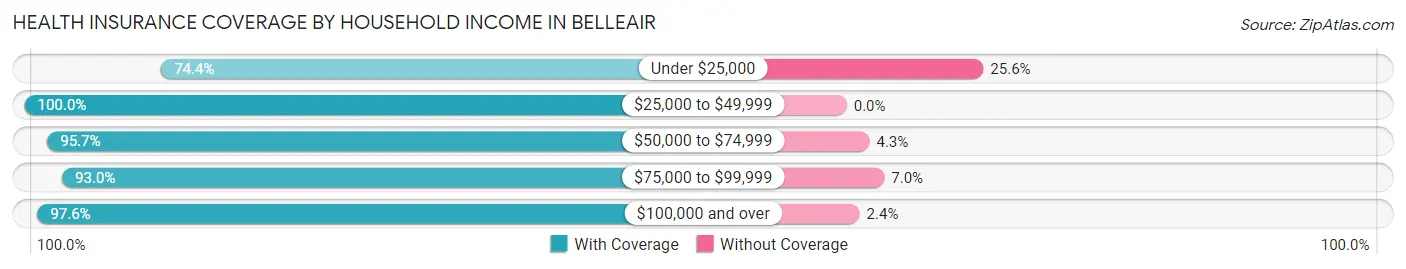
| Household Income | With Coverage | Without Coverage |
| Under $25,000 | 93 (74.4%) | 32 (25.6%) |
| $25,000 to $49,999 | 470 (100.0%) | 0 (0.0%) |
| $50,000 to $74,999 | 674 (95.7%) | 30 (4.3%) |
| $75,000 to $99,999 | 317 (93.0%) | 24 (7.0%) |
| $100,000 and over | 2,465 (97.6%) | 61 (2.4%) |
Public vs Private Health Insurance Coverage by Age in Belleair
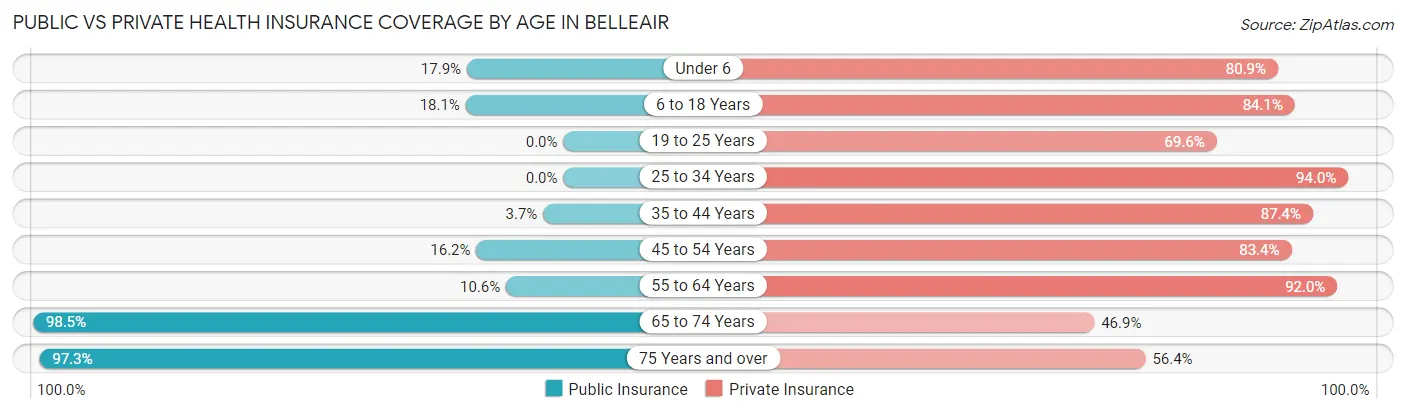
| Age Bracket | Public Insurance | Private Insurance |
| Under 6 | 46 (17.9%) | 208 (80.9%) |
| 6 to 18 Years | 66 (18.1%) | 306 (84.1%) |
| 19 to 25 Years | 0 (0.0%) | 64 (69.6%) |
| 25 to 34 Years | 0 (0.0%) | 468 (94.0%) |
| 35 to 44 Years | 14 (3.7%) | 327 (87.4%) |
| 45 to 54 Years | 78 (16.2%) | 403 (83.4%) |
| 55 to 64 Years | 74 (10.6%) | 640 (91.9%) |
| 65 to 74 Years | 769 (98.5%) | 366 (46.9%) |
| 75 Years and over | 604 (97.3%) | 350 (56.4%) |
| Total | 1,651 (39.6%) | 3,132 (75.2%) |
Disability Status by Sex by Age in Belleair
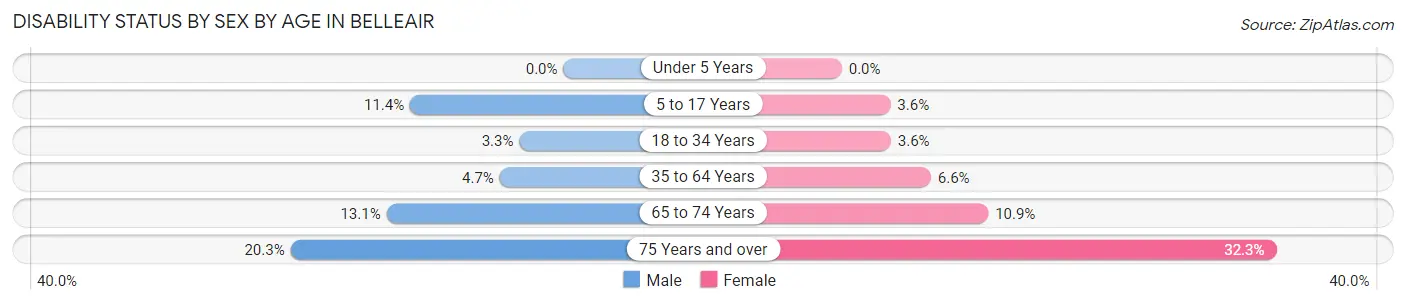
| Age Bracket | Male | Female |
| Under 5 Years | 0 (0.0%) | 0 (0.0%) |
| 5 to 17 Years | 19 (11.4%) | 7 (3.6%) |
| 18 to 34 Years | 10 (3.3%) | 11 (3.6%) |
| 35 to 64 Years | 32 (4.7%) | 58 (6.6%) |
| 65 to 74 Years | 47 (13.1%) | 46 (10.9%) |
| 75 Years and over | 63 (20.3%) | 100 (32.3%) |
Disability Class by Sex by Age in Belleair
Disability Class: Hearing Difficulty
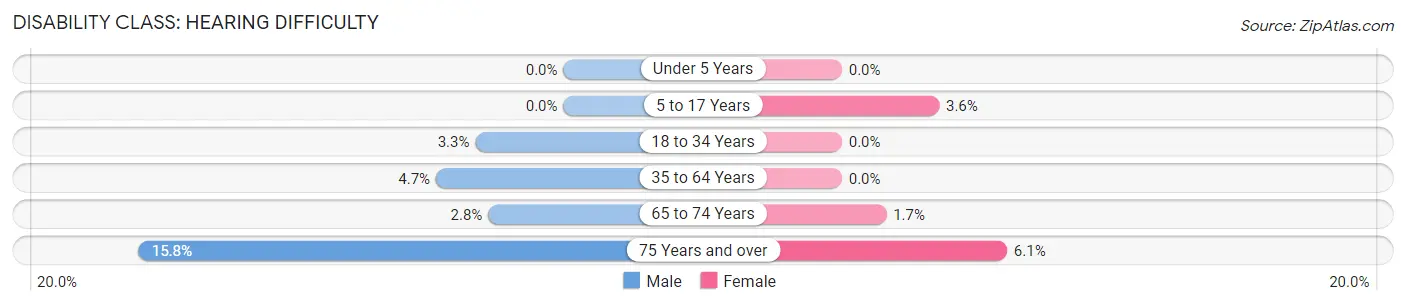
| Age Bracket | Male | Female |
| Under 5 Years | 0 (0.0%) | 0 (0.0%) |
| 5 to 17 Years | 0 (0.0%) | 7 (3.6%) |
| 18 to 34 Years | 10 (3.3%) | 0 (0.0%) |
| 35 to 64 Years | 32 (4.7%) | 0 (0.0%) |
| 65 to 74 Years | 10 (2.8%) | 7 (1.7%) |
| 75 Years and over | 49 (15.8%) | 19 (6.1%) |
Disability Class: Vision Difficulty
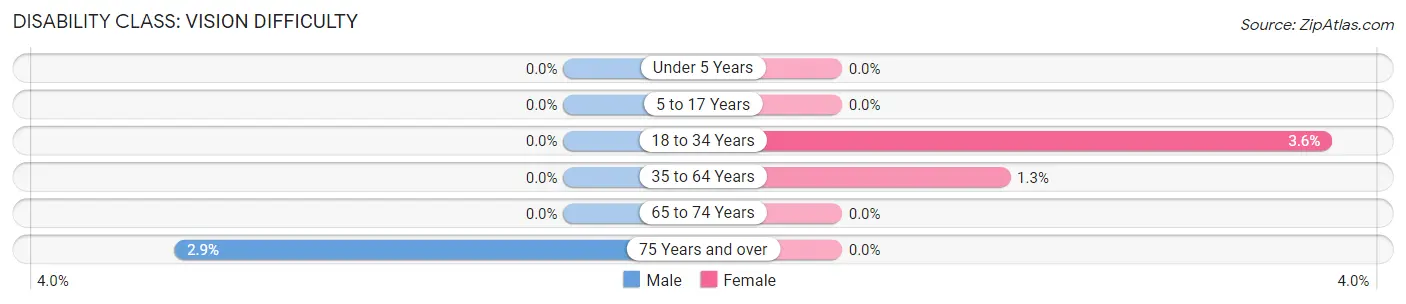
| Age Bracket | Male | Female |
| Under 5 Years | 0 (0.0%) | 0 (0.0%) |
| 5 to 17 Years | 0 (0.0%) | 0 (0.0%) |
| 18 to 34 Years | 0 (0.0%) | 11 (3.6%) |
| 35 to 64 Years | 0 (0.0%) | 11 (1.3%) |
| 65 to 74 Years | 0 (0.0%) | 0 (0.0%) |
| 75 Years and over | 9 (2.9%) | 0 (0.0%) |
Disability Class: Cognitive Difficulty
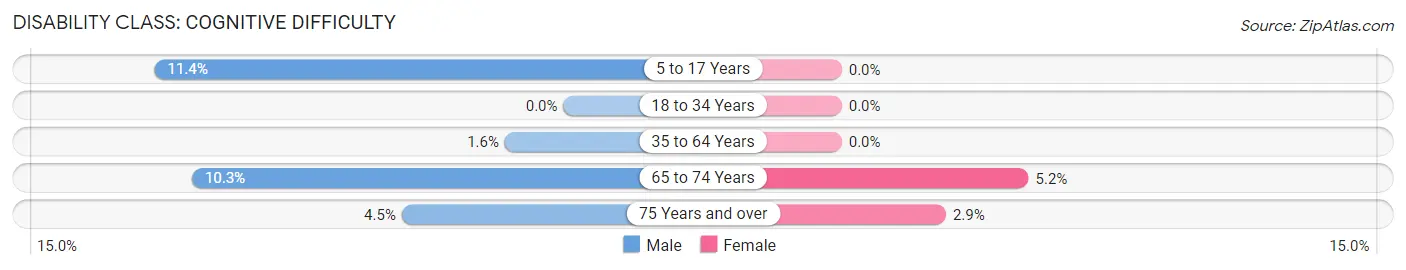
| Age Bracket | Male | Female |
| 5 to 17 Years | 19 (11.4%) | 0 (0.0%) |
| 18 to 34 Years | 0 (0.0%) | 0 (0.0%) |
| 35 to 64 Years | 11 (1.6%) | 0 (0.0%) |
| 65 to 74 Years | 37 (10.3%) | 22 (5.2%) |
| 75 Years and over | 14 (4.5%) | 9 (2.9%) |
Disability Class: Ambulatory Difficulty
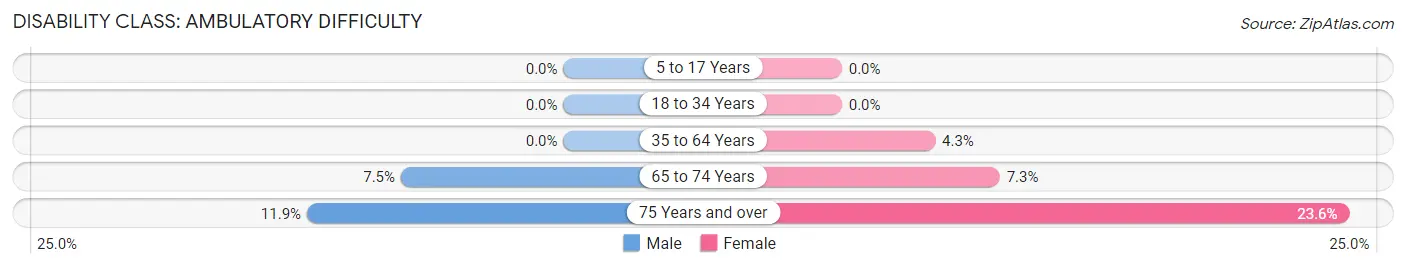
| Age Bracket | Male | Female |
| 5 to 17 Years | 0 (0.0%) | 0 (0.0%) |
| 18 to 34 Years | 0 (0.0%) | 0 (0.0%) |
| 35 to 64 Years | 0 (0.0%) | 38 (4.3%) |
| 65 to 74 Years | 27 (7.5%) | 31 (7.3%) |
| 75 Years and over | 37 (11.9%) | 73 (23.5%) |
Disability Class: Self-Care Difficulty
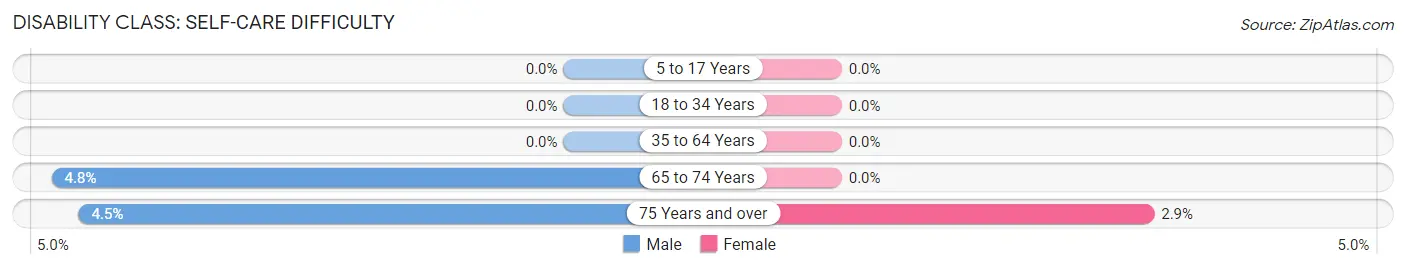
| Age Bracket | Male | Female |
| 5 to 17 Years | 0 (0.0%) | 0 (0.0%) |
| 18 to 34 Years | 0 (0.0%) | 0 (0.0%) |
| 35 to 64 Years | 0 (0.0%) | 0 (0.0%) |
| 65 to 74 Years | 17 (4.8%) | 0 (0.0%) |
| 75 Years and over | 14 (4.5%) | 9 (2.9%) |
Technology Access in Belleair
Computing Device Access in Belleair
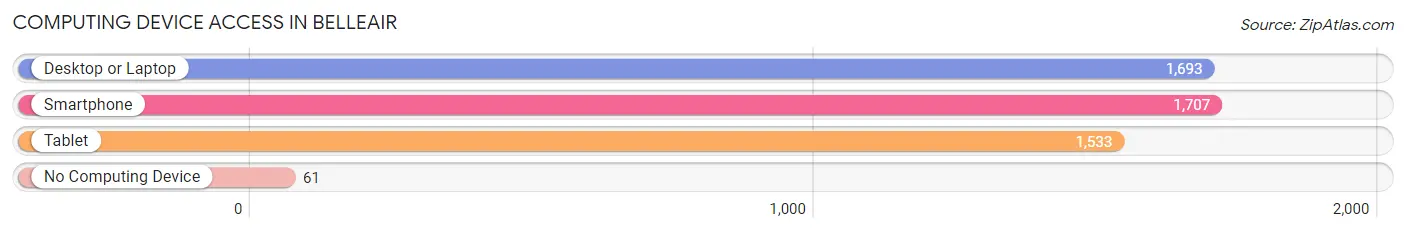
| Device Type | # Households | % Households |
| Desktop or Laptop | 1,693 | 87.7% |
| Smartphone | 1,707 | 88.4% |
| Tablet | 1,533 | 79.4% |
| No Computing Device | 61 | 3.2% |
| Total | 1,931 | 100.0% |
Internet Access in Belleair
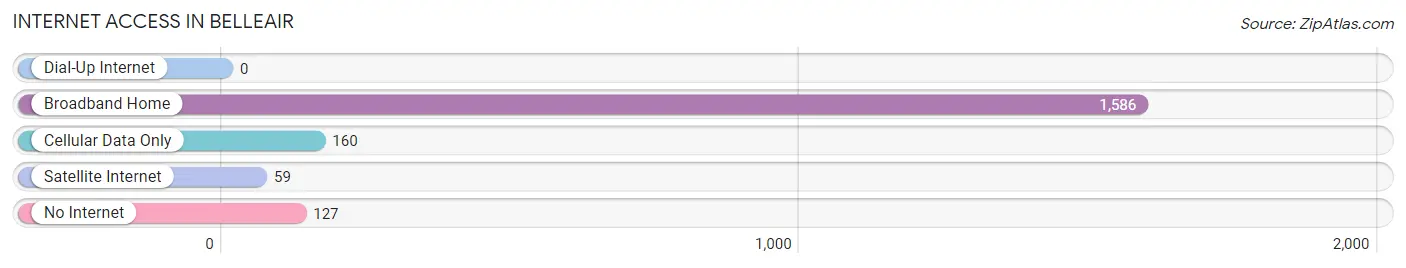
| Internet Type | # Households | % Households |
| Dial-Up Internet | 0 | 0.0% |
| Broadband Home | 1,586 | 82.1% |
| Cellular Data Only | 160 | 8.3% |
| Satellite Internet | 59 | 3.1% |
| No Internet | 127 | 6.6% |
| Total | 1,931 | 100.0% |
Belleair Summary
Belleair is a town located in Pinellas County, Florida, United States. It is situated on the Gulf of Mexico, just south of Clearwater and north of Indian Rocks Beach. The population was 2,988 at the 2010 census.
Geography
Belleair is located at 27°54'45" North, 82°48'45" West (27.912500, -82.812500). According to the United States Census Bureau, the town has a total area of 1.2 square miles (3.1 km2), all land.
History
Belleair was founded in 1883 by railroad magnate Henry B. Plant. The town was named after Plant's daughter, Belle, and the French word for air, "air". Plant built a hotel in Belleair, the Belleview Biltmore Hotel, which opened in 1897 and is still in operation today.
In the early 1900s, Belleair was a popular winter resort for wealthy Northerners. The town was incorporated in 1925 and has since become a residential community.
Economy
Belleair's economy is largely based on tourism and real estate. The town is home to the Belleview Biltmore Hotel, which is a popular destination for tourists. The hotel is also a popular venue for weddings and other special events.
The town is also home to several golf courses, including the Belleair Country Club, which is one of the oldest golf courses in the state. The town also has several marinas, which provide access to the Gulf of Mexico.
Demographics
As of the census of 2010, there were 2,988 people, 1,521 households, and 890 families residing in the town. The population density was 2,521.7 people per square mile (973.2/km2). There were 1,845 housing units at an average density of 1,541.7 per square mile (595.2/km2). The racial makeup of the town was 94.2% White, 1.2% African American, 0.2% Native American, 1.7% Asian, 0.1% Pacific Islander, 1.2% from other races, and 1.6% from two or more races. Hispanic or Latino of any race were 4.2% of the population.
There were 1,521 households, out of which 11.7% had children under the age of 18 living with them, 51.2% were married couples living together, 6.2% had a female householder with no husband present, and 39.7% were non-families. 33.2% of all households were made up of individuals, and 18.2% had someone living alone who was 65 years of age or older. The average household size was 1.97 and the average family size was 2.45.
In the town, the population was spread out, with 11.2% under the age of 18, 3.2% from 18 to 24, 17.2% from 25 to 44, 33.2% from 45 to 64, and 35.2% who were 65 years of age or older. The median age was 59 years. For every 100 females, there were 87.2 males. For every 100 females age 18 and over, there were 84.7 males.
The median income for a household in the town was $60,938, and the median income for a family was $76,917. Males had a median income of $50,000 versus $37,500 for females. The per capita income for the town was $41,945. About 2.2% of families and 4.2% of the population were below the poverty line, including none of those under age 18 and 4.2% of those age 65 or over.
Common Questions
What is the Total Population of Belleair?
Total Population of Belleair is 4,295.
What is the Total Male Population of Belleair?
Total Male Population of Belleair is 1,996.
What is the Total Female Population of Belleair?
Total Female Population of Belleair is 2,299.
What is the Ratio of Males per 100 Females in Belleair?
There are 86.82 Males per 100 Females in Belleair.
What is the Ratio of Females per 100 Males in Belleair?
There are 115.18 Females per 100 Males in Belleair.
What is the Median Population Age in Belleair?
Median Population Age in Belleair is 56.1 Years.
What is the Average Family Size in Belleair
Average Family Size in Belleair is 2.5 People.
What is the Average Household Size in Belleair
Average Household Size in Belleair is 2.2 People.
What is Per Capita Income in Belleair?
Per Capita income in Belleair is $100,479.
What is the Median Family Income in Belleair?
Median Family Income in Belleair is $142,568.
What is the Median Household income in Belleair?
Median Household Income in Belleair is $114,556.
What is Income or Wage Gap in Belleair?
Income or Wage Gap in Belleair is 10.8%.
Women in Belleair earn 89.2 cents for every dollar earned by a man.
What is Inequality or Gini Index in Belleair?
Inequality or Gini Index in Belleair is 0.57.
How Large is the Labor Force in Belleair?
There are 1,983 People in the Labor Forcein in Belleair.
What is the Percentage of People in the Labor Force in Belleair?
52.4% of People are in the Labor Force in Belleair.
What is the Unemployment Rate in Belleair?
Unemployment Rate in Belleair is 3.2%.