Zip Codes with the Highest Percentage of Population Employed in Legal Services & Support in Georgetown, TX
RELATED REPORTS & OPTIONS
Legal Services & Support
Georgetown
Compare Zip Codes
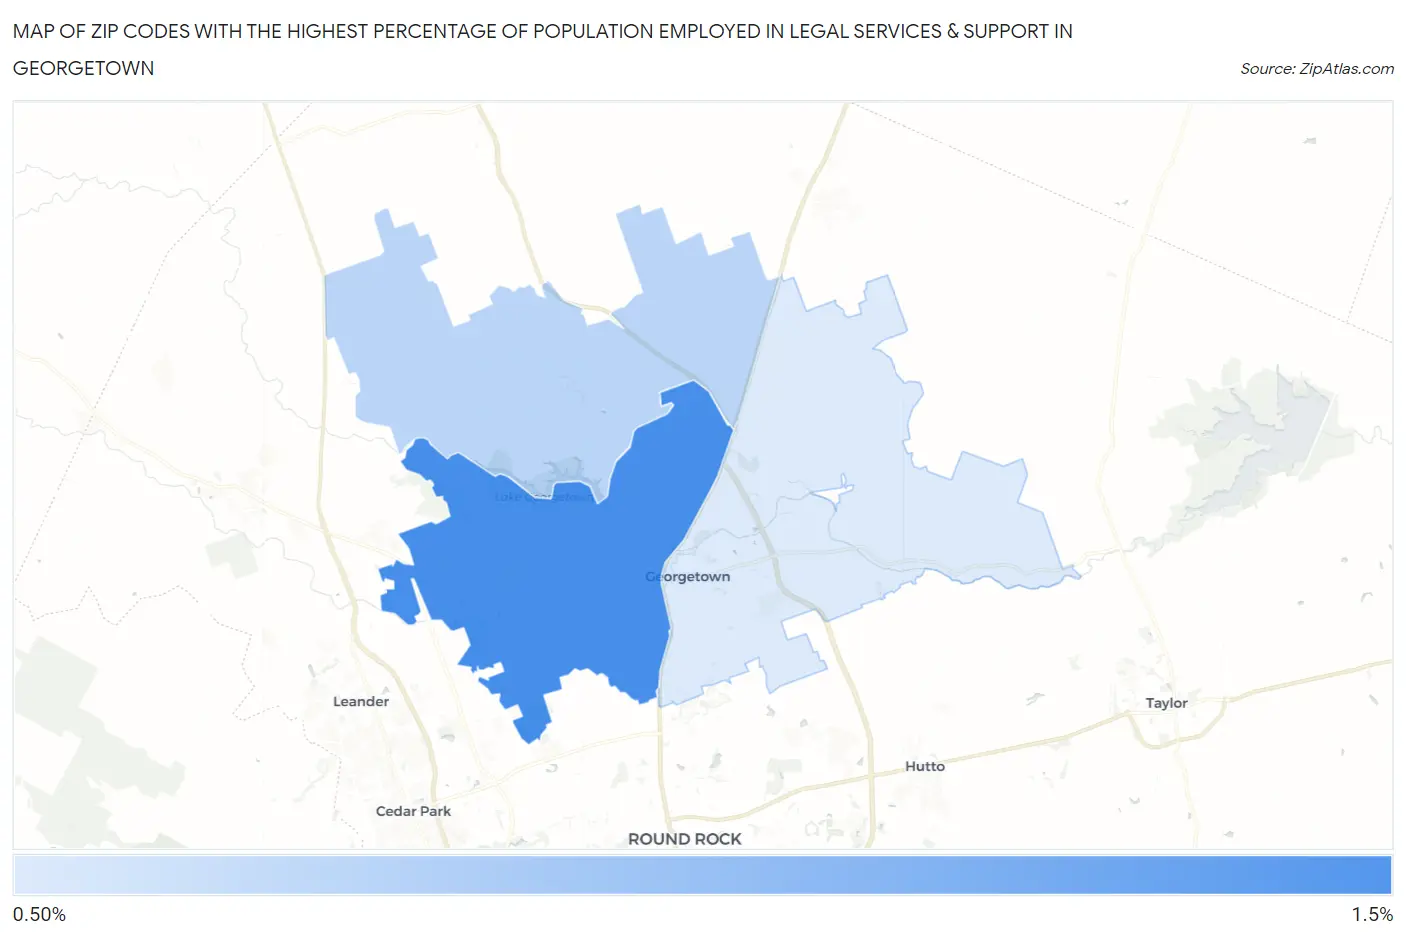
Map of Zip Codes with the Highest Percentage of Population Employed in Legal Services & Support in Georgetown
0.0%
1.5%
Zip Codes with the Highest Percentage of Population Employed in Legal Services & Support in Georgetown, TX
| Zip Code | % Employed | vs State | vs National | |
| 1. | 78628 | 1.5% | 1.0%(+0.460)#274 | 1.2%(+0.284)#5,181 |
| 2. | 78633 | 0.76% | 1.0%(-0.253)#555 | 1.2%(-0.428)#9,868 |
| 3. | 78626 | 0.54% | 1.0%(-0.465)#714 | 1.2%(-0.641)#12,128 |
1
Common Questions
What are the Top Zip Codes with the Highest Percentage of Population Employed in Legal Services & Support in Georgetown, TX?
Top Zip Codes with the Highest Percentage of Population Employed in Legal Services & Support in Georgetown, TX are:
What zip code has the Highest Percentage of Population Employed in Legal Services & Support in Georgetown, TX?
78628 has the Highest Percentage of Population Employed in Legal Services & Support in Georgetown, TX with 1.5%.
What is the Percentage of Population Employed in Legal Services & Support in Georgetown, TX?
Percentage of Population Employed in Legal Services & Support in Georgetown is 1.1%.
What is the Percentage of Population Employed in Legal Services & Support in Texas?
Percentage of Population Employed in Legal Services & Support in Texas is 1.0%.
What is the Percentage of Population Employed in Legal Services & Support in the United States?
Percentage of Population Employed in Legal Services & Support in the United States is 1.2%.