Zip Codes with the Highest Percentage of Population Employed in Office & Administration in Georgetown, TX
RELATED REPORTS & OPTIONS
Office & Administration
Georgetown
Compare Zip Codes
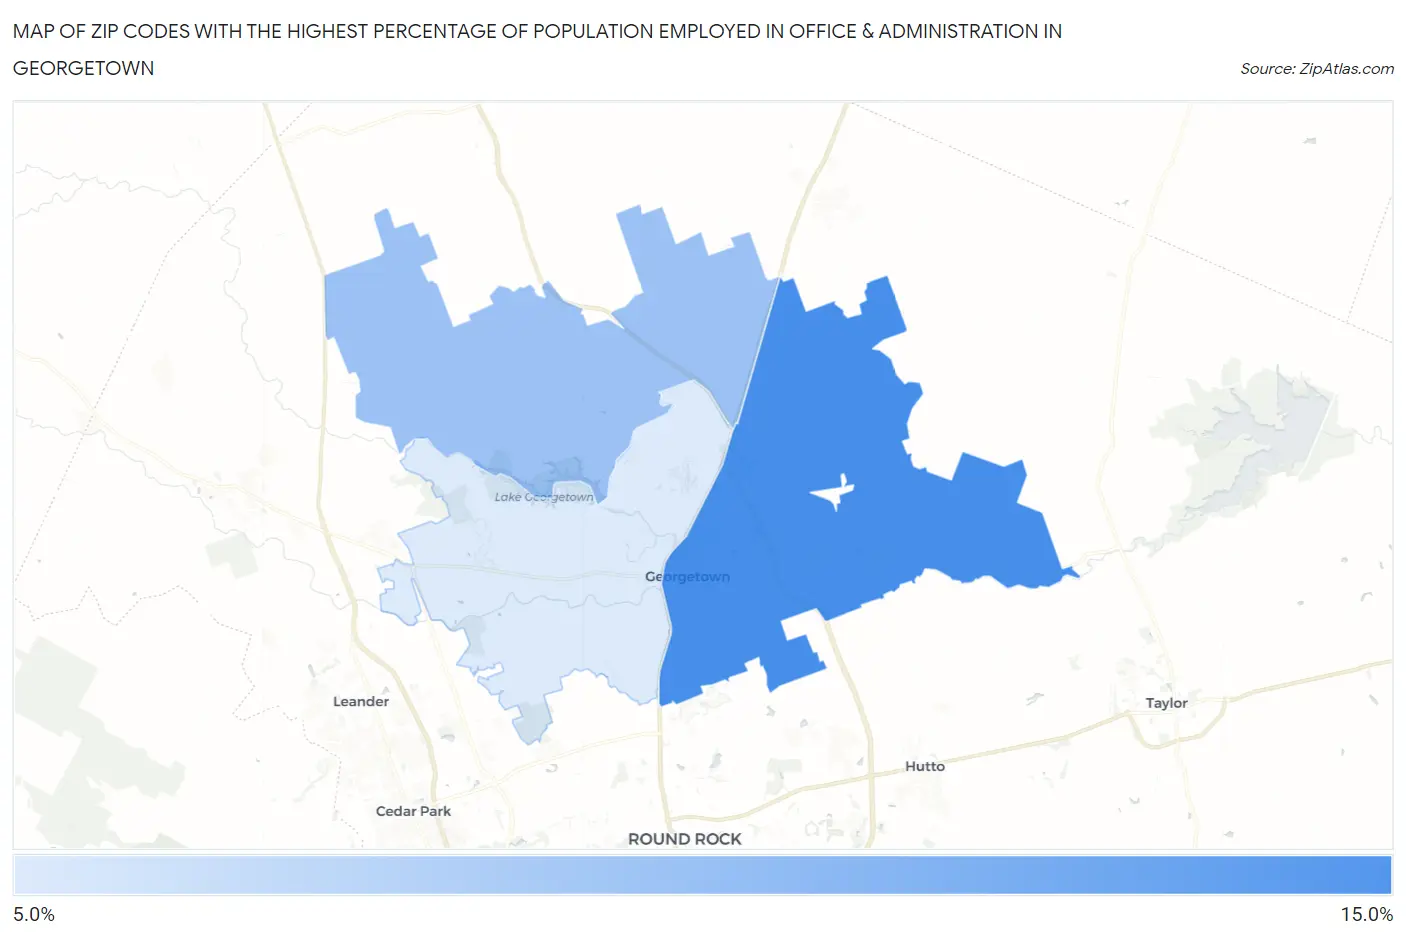
Map of Zip Codes with the Highest Percentage of Population Employed in Office & Administration in Georgetown
0.0%
15.0%
Zip Codes with the Highest Percentage of Population Employed in Office & Administration in Georgetown, TX
| Zip Code | % Employed | vs State | vs National | |
| 1. | 78626 | 12.9% | 11.0%(+1.97)#511 | 10.9%(+2.08)#8,205 |
| 2. | 78633 | 10.9% | 11.0%(-0.068)#847 | 10.9%(+0.048)#14,164 |
| 3. | 78628 | 9.3% | 11.0%(-1.69)#1,181 | 10.9%(-1.58)#19,441 |
1
Common Questions
What are the Top Zip Codes with the Highest Percentage of Population Employed in Office & Administration in Georgetown, TX?
Top Zip Codes with the Highest Percentage of Population Employed in Office & Administration in Georgetown, TX are:
What zip code has the Highest Percentage of Population Employed in Office & Administration in Georgetown, TX?
78626 has the Highest Percentage of Population Employed in Office & Administration in Georgetown, TX with 12.9%.
What is the Percentage of Population Employed in Office & Administration in Georgetown, TX?
Percentage of Population Employed in Office & Administration in Georgetown is 12.6%.
What is the Percentage of Population Employed in Office & Administration in Texas?
Percentage of Population Employed in Office & Administration in Texas is 11.0%.
What is the Percentage of Population Employed in Office & Administration in the United States?
Percentage of Population Employed in Office & Administration in the United States is 10.9%.