Zip Codes with the Highest Percentage of Population Employed in Architecture & Engineering in Georgetown, TX
RELATED REPORTS & OPTIONS
Architecture & Engineering
Georgetown
Compare Zip Codes
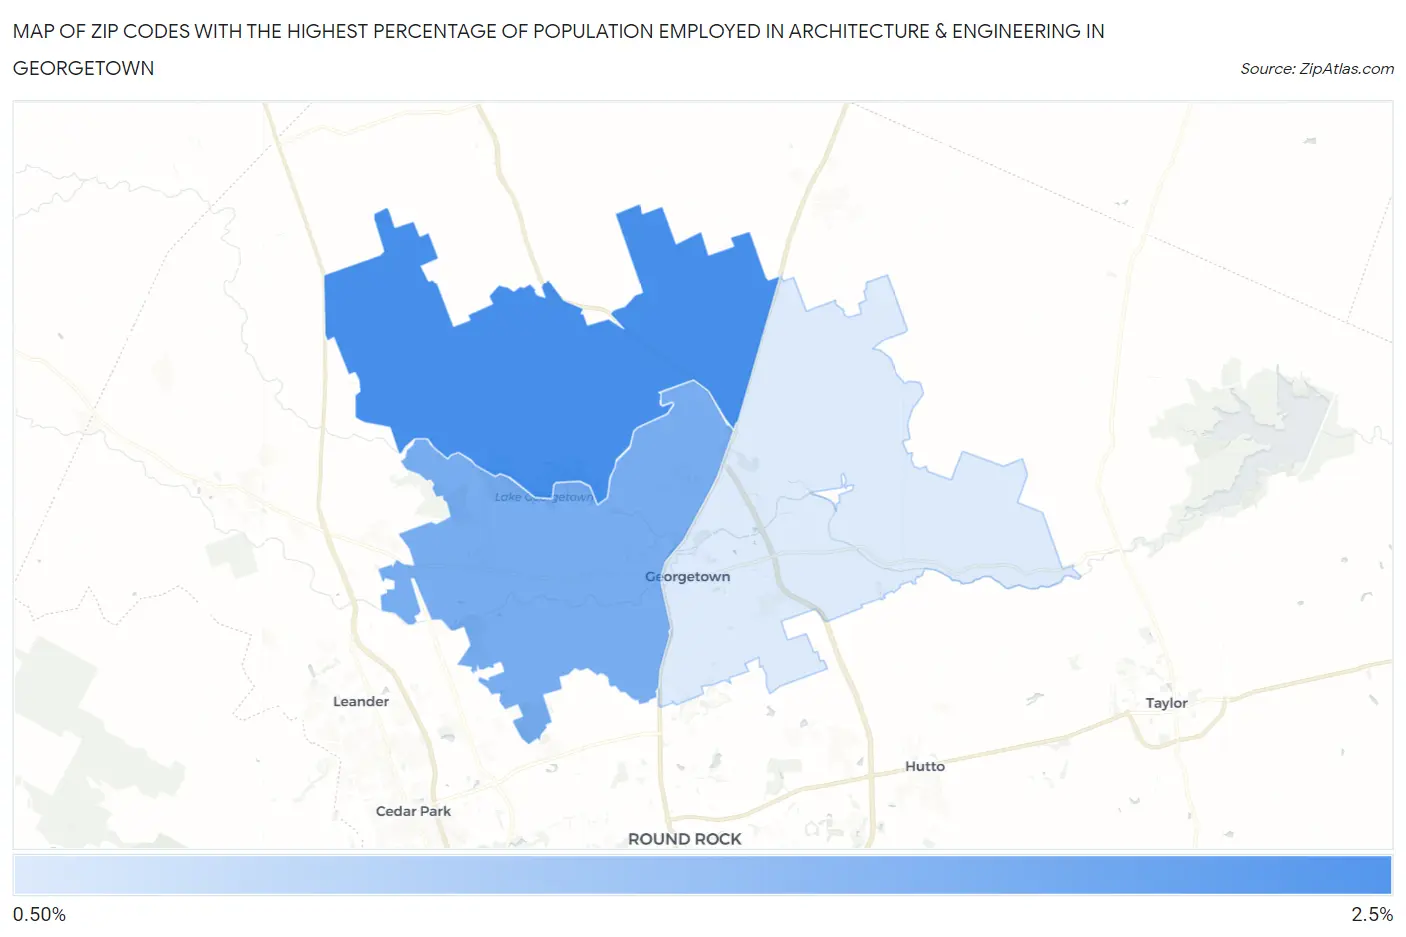
Map of Zip Codes with the Highest Percentage of Population Employed in Architecture & Engineering in Georgetown
0.0%
2.5%
Zip Codes with the Highest Percentage of Population Employed in Architecture & Engineering in Georgetown, TX
| Zip Code | % Employed | vs State | vs National | |
| 1. | 78633 | 2.3% | 2.2%(+0.044)#445 | 2.1%(+0.117)#8,118 |
| 2. | 78628 | 2.0% | 2.2%(-0.205)#518 | 2.1%(-0.132)#9,500 |
| 3. | 78626 | 1.5% | 2.2%(-0.742)#714 | 2.1%(-0.669)#13,021 |
1
Common Questions
What are the Top Zip Codes with the Highest Percentage of Population Employed in Architecture & Engineering in Georgetown, TX?
Top Zip Codes with the Highest Percentage of Population Employed in Architecture & Engineering in Georgetown, TX are:
What zip code has the Highest Percentage of Population Employed in Architecture & Engineering in Georgetown, TX?
78633 has the Highest Percentage of Population Employed in Architecture & Engineering in Georgetown, TX with 2.3%.
What is the Percentage of Population Employed in Architecture & Engineering in Georgetown, TX?
Percentage of Population Employed in Architecture & Engineering in Georgetown is 1.5%.
What is the Percentage of Population Employed in Architecture & Engineering in Texas?
Percentage of Population Employed in Architecture & Engineering in Texas is 2.2%.
What is the Percentage of Population Employed in Architecture & Engineering in the United States?
Percentage of Population Employed in Architecture & Engineering in the United States is 2.1%.